UNITED STATES
SECURITIES AND EXCHANGE COMMISSION
WASHINGTON, D.C. 20549
FORM N-CSR
CERTIFIED SHAREHOLDER REPORT OF REGISTERED
MANAGEMENT INVESTMENT COMPANIES
Investment Company Act file number: 811-02383
AB BOND FUND, INC.
(Exact name of registrant as specified in charter)
1345 Avenue of the Americas, New York, New York 10105
(Address of principal executive offices) (Zip code)
Joseph J. Mantineo
AllianceBernstein L.P.
1345 Avenue of the Americas
New York, New York 10105
(Name and address of agent for service)
Registrant’s telephone number, including area code: (800) 221-5672
Date of fiscal year end: October 31, 2017
Date of reporting period: October 31, 2017
| ITEM 1. | REPORTS TO STOCKHOLDERS. |
OCT 10.31.17

ANNUAL REPORT
AB ALL MARKET REAL RETURN PORTFOLIO


| Investment Products Offered | • Are Not FDIC Insured • May Lose Value • Are Not Bank Guaranteed | |
Investors should consider the investment objectives, risks, charges and expenses of the Fund carefully before investing. For copies of our prospectus or summary prospectus, which contain this and other information, visit us online at www.abfunds.com or contact your AB representative. Please read the prospectus and/or summary prospectus carefully before investing.
This shareholder report must be preceded or accompanied by the Fund’s prospectus for individuals who are not current shareholders of the Fund.
You may obtain a description of the Fund’s proxy voting policies and procedures, and information regarding how the Fund voted proxies relating to portfolio securities during the most recent 12-month period ended June 30, without charge. Simply visit AB’s website at www.abfunds.com, or go to the Securities and Exchange Commission’s (the “Commission”) website at www.sec.gov, or call AB at (800) 227 4618.
The Fund files its complete schedule of portfolio holdings with the Commission for the first and third quarters of each fiscal year on Form N-Q. The Fund’s Forms N-Q are available on the Commission’s website at www.sec.gov. The Fund’s Forms N-Q may also be reviewed and copied at the Commission’s Public Reference Room in Washington, DC; information on the operation of the Public Reference Room may be obtained by calling (800) SEC 0330. AB publishes full portfolio holdings for the Fund monthly at www.abfunds.com.
AllianceBernstein Investments, Inc. (ABI) is the distributor of the AB family of mutual funds. ABI is a member of FINRA and is an affiliate of AllianceBernstein L.P., the Adviser of the funds.
The [A/B] logo is a registered service mark of AllianceBernstein and AllianceBernstein® is a registered service mark used by permission of the owner, AllianceBernstein L.P.
| FROM THE PRESIDENT |  |
Dear Shareholder,
We are pleased to provide this report for AB All Market Real Return Portfolio (the “Fund”). Please review the discussion of Fund performance, the market conditions during the reporting period and the Fund’s investment strategy.
As always, AB strives to keep clients ahead of what’s next by:
| + | Transforming uncommon insights into uncommon knowledge with a global research scope |
| + | Navigating markets with seasoned investment experience and sophisticated solutions |
| + | Providing thoughtful investment insights and actionable ideas |
Whether you’re an individual investor or a multi-billion-dollar institution, we put knowledge and experience to work for you.
AB’s global research organization connects and collaborates across platforms and teams to deliver impactful insights and innovative products. Better insights lead to better opportunities—anywhere in the world.
For additional information about AB’s range of products and shareholder resources, please log on to www.abfunds.com.
Thank you for your investment in the AB Mutual Funds.
Sincerely,

Robert M. Keith
President and Chief Executive Officer, AB Mutual Funds
| abfunds.com | AB ALL MARKET REAL RETURN PORTFOLIO | 1 |
ANNUAL REPORT
December 15, 2017
This report provides management’s discussion of fund performance for AB All Market Real Return Portfolio for the annual reporting period ended October 31, 2017.
The Fund’s investment objective is to maximize real return over inflation.
NAV RETURNS AS OF OCTOBER 31, 2017 (unaudited)
| 6 Months | 12 Months | |||||||
| AB ALL MARKET REAL RETURN PORTFOLIO | ||||||||
| Class 1 Shares1 | 5.42% | 10.69% | ||||||
| Class 2 Shares1 | 5.54% | 10.96% | ||||||
| Class A Shares | 5.33% | 10.45% | ||||||
| Class C Shares | 4.87% | 9.73% | ||||||
| Advisor Class Shares2 | 5.58% | 10.87% | ||||||
| Class R Shares2 | 5.27% | 10.29% | ||||||
| Class K Shares2 | 5.39% | 10.48% | ||||||
| Class I Shares2 | 5.62% | 10.98% | ||||||
| Class Z Shares2 | 5.62% | 10.98% | ||||||
| MSCI AC World Commodity Producers Index (net) | 10.26% | 14.93% | ||||||
| 1 | Class 1 shares are only available to Bernstein Global Wealth Management private client accounts. Class 2 shares are only available to the Adviser’s institutional clients or through other limited arrangements. |
| 2 | Please note that these share classes are for investors purchasing shares through accounts established under certain fee-based programs sponsored and maintained by certain broker-dealers and financial intermediaries, institutional pension plans and/or investment advisory clients of, and certain other persons associated with, the Adviser and its affiliates or the Fund. |
INVESTMENT RESULTS
The table above shows the Fund’s performance compared to its benchmark, the Morgan Stanley Capital International All Country (“MSCI AC”) World Commodity Producers Index (net), for the six- and 12-month periods ended October 31, 2017.
All share classes of the Fund underperformed the benchmark for both periods, before sales charges. Relative to the benchmark, strategic exposures to commodity futures and global real estate, which strongly underperformed the benchmark, detracted the most from performance. The Fund’s strategic allocation to diversified inflation equities contributed during both periods. Allocations to industrial metals and emerging-market real estate also contributed, while overlay positions such as inflation swaps detracted from returns; energy exposure detracted over both periods as well.
| 2 | AB ALL MARKET REAL RETURN PORTFOLIO | abfunds.com |
Derivatives were used for both periods in the form of futures, forwards, interest rate swaps, inflation swaps, total return swaps, purchased options and written options, for hedging and investment purposes. Futures, interest rate swaps and inflation swaps detracted for both periods; forwards detracted for the six-month period and added for the 12-month period; total return swaps added for both periods; purchased options had no material impact for the six-month period and detracted for the 12-month period; written options had no material impact for the six-month period, and added for the 12-month period, in absolute terms.
MARKET REVIEW AND INVESTMENT STRATEGY
The beginning of the 12-month period ended October 31, 2017 was characterized by the US presidential election. Markets rallied after the election of President Donald Trump in response to anticipated expansionary fiscal policies and pro-business regulatory policies. Market expectations for US inflation rose at the end of 2016 as investors priced in the reflationary impact of potential stimulus by the new administration president. This hurt defensive assets and yield plays, such as bonds, gold and real estate as Treasury yields rose on the prospect of the re-rating of expectations on interest rate hikes by the US Federal Reserve (the “Fed”) in 2017 and beyond.
The market rally continued throughout the reporting period as risk assets experienced robust growth in an extremely low-volatility environment characterized by accommodative monetary policies and strong corporate balance sheets. While energy assets experienced a sell-off in the first quarter due to rising inventories, and commodity prices as a whole fell during the second quarter, they recovered during the third quarter as the US dollar weakened and the Chinese economy stabilized. Real estate posted positive absolute performance over the 12-month period but underperformed global equities as central bank hawkishness weighed on the rate-sensitive sector. Diversified inflation equities advanced as the market rewarded companies that successfully maintained margins against a backdrop of poor pricing power while wage inflation rose modestly. Despite several geopolitical events throughout the year, such as the French election and escalating tensions between the US and North Korea, market downturns have been short-lived. Near the end of the reporting period, several macroeconomic issues surfaced, which included the aftermath of several hurricanes, the release of the White House’s tax reform plan and the Fed’s guidance on interest-rate trajectory.
INVESTMENT POLICIES
The Fund seeks to maximize real return. Real return is the rate of return after adjusting for inflation. The Fund pursues an aggressive investment strategy involving a variety of asset classes. The Fund
(continued on next page)
| abfunds.com | AB ALL MARKET REAL RETURN PORTFOLIO | 3 |
invests primarily in instruments that the Adviser expects to outperform broad equity indices during periods of rising inflation. Under normal circumstances, the Fund expects to invest its assets principally in the following instruments that, in the judgment of the Adviser, are affected directly or indirectly by the level and change in rate of inflation: inflation-indexed fixed-income securities, such as Treasury inflation-protected securities (“TIPS”) and similar bonds issued by governments outside of the United States; commodities; commodity-related equity securities; real estate equity securities; inflation-sensitive equity securities, which the Fund defines as equity securities of companies that the Adviser believes have the ability to pass along increasing costs to consumers and maintain or grow margins in rising inflation environments, including equity securities of utilities and infrastructure-related companies (“inflation-sensitive equities”); securities and derivatives linked to the price of other assets (such as commodities, stock indices and real estate); and currencies. The Fund expects its investments in fixed-income securities to have a broad range of maturities and quality levels.
The Fund will seek inflation protection from investments around the globe, both in developed- and emerging-market countries. In selecting securities for purchase and sale, the Adviser will utilize its qualitative and quantitative resources to determine overall inflation sensitivity, asset allocation and security selection. The Adviser assesses the securities’ risks and inflation sensitivity as well as the securities’ impact on the overall risks and inflation sensitivity of the Fund. When its analysis indicates that changes are necessary, the Adviser intends to implement them through a combination of changes to underlying positions and the use of inflation swaps and other types of derivatives, such as interest rate swaps.
The Fund anticipates that its targeted investment mix, other than its investments in inflation-indexed fixed-income securities, will focus on commodity-related equity securities, commodities and commodity derivatives, real estate equity securities and inflation-sensitive equities to provide a balance between expected return and inflation protection. The Fund may vary its investment allocations among these asset classes, at times significantly. Its commodities investments will include significant exposure to energy commodities, but will also include agricultural products, and industrial and precious metals, such as gold. The Fund’s investments in real estate equity securities will include REITs and other real estate-related securities.
The Fund will invest in both US and non-US dollar-denominated equity or fixed-income securities. The Fund may invest in currencies for hedging or investment purposes, both in the spot market and through
(continued on next page)
| 4 | AB ALL MARKET REAL RETURN PORTFOLIO | abfunds.com |
long or short positions in currency-related derivatives. The Fund does not ordinarily expect to hedge its foreign currency exposure because it will be balanced by investments in US dollar-denominated securities, although it may hedge the exposure under certain circumstances.
The Fund may invest significantly to the extent permitted by applicable law in derivatives, such as options, futures contracts, forwards, swaps or structured notes. The Fund intends to use leverage for investment purposes through the use of cash made available by derivatives transactions to make other investments in accordance with its investment policies. In determining when and to what extent to employ leverage or enter into derivatives transactions, the Adviser will consider factors such as the relative risks and returns expected of potential investments and the cost of such transactions. The Adviser will consider the impact of derivatives in making its assessments of the Fund’s risks. The resulting exposures to markets, sectors, issuers or specific securities will be continuously monitored by the Adviser.
The Fund may seek to gain exposure to physical commodities traded in the commodities markets through investments in a variety of derivative instruments, including investments in commodity index-linked notes. The Adviser expects that the Fund will seek to gain exposure to commodities and commodity-related instruments and derivatives primarily through investments in AllianceBernstein Cayman Inflation Strategy, Ltd., a wholly-owned subsidiary of the Fund organized under the laws of the Cayman Islands (the “Subsidiary”). The Subsidiary is advised by the Adviser and has the same investment objective and substantially similar investment policies and restrictions as the Fund except that the Subsidiary, unlike the Fund, may invest, without limitation, in commodities and commodity-related instruments. The Fund will be subject to the risks associated with the commodities, derivatives and other instruments in which the Subsidiary invests, to the extent of its investment in the Subsidiary. The Fund limits its investment in the Subsidiary to no more than 25% of its net assets. Investment in the Subsidiary is expected to provide the Fund with commodity exposure within the limitations of federal tax requirements that apply to the Fund.
The Fund is “non-diversified”, which means that it may concentrate its assets in a smaller number of issuers than a diversified fund.
| abfunds.com | AB ALL MARKET REAL RETURN PORTFOLIO | 5 |
DISCLOSURES AND RISKS
Benchmark Disclosure
The MSCI AC World Commodity Producers Index is unmanaged and does not reflect fees and expenses associated with the active management of a mutual fund portfolio. The MSCI AC World Commodity Producers Index is a free float-adjusted, market capitalization index designed to track the performance of global listed commodity producers, including emerging markets. Commodities sectors include: energy, grains, industrial metals, petroleum, precious metals and softs. MSCI makes no express or implied warranties or representations, and shall have no liability whatsoever with respect to any MSCI data contained herein. The MSCI data may not be further redistributed or used as a basis for other indices, any securities or financial products. This report is not approved, reviewed or produced by MSCI. Net returns include the reinvestment of dividends after deduction of non-US withholding tax. An investor cannot invest directly in an index, and its results are not indicative of the performance for any specific investment, including the Fund.
A Word About Risk
Market Risk: The value of the Fund’s assets will fluctuate as the stock, commodity and bond markets fluctuate. The value of the Fund’s investments may decline, sometimes rapidly and unpredictably, simply because of economic changes or other events that affect large portions of the market.
Credit Risk: An issuer or guarantor of a fixed-income security, or the counterparty to a derivatives or other contract, may be unable or unwilling to make timely payments of interest or principal, or to otherwise honor its obligations. The issuer or guarantor may default, causing a loss of the full principal amount of a security. The degree of risk for a particular security may be reflected in its credit rating. There is the possibility that the credit rating of a fixed-income security may be downgraded after purchase, which may adversely affect the value of the security. Investments in fixed-income securities with lower ratings tend to have a higher probability that an issuer will default or fail to meet its payment obligations.
Interest Rate Risk: Changes in interest rates will affect the value of investments in fixed-income securities. When interest rates rise, the value of existing investments in fixed-income securities tends to fall and this decrease in value may not be offset by higher income from new investments. The Fund may be subject to heightened interest rate risk due to rising rates as the current period of historically low rates may be ending. Interest rate risk is generally greater for fixed-income securities with longer maturities or durations.
Commodity Risk: Investing in commodities and commodity-linked derivative instruments, either directly or through the Subsidiary, may subject the Fund to greater volatility than investments in traditional securities.
| 6 | AB ALL MARKET REAL RETURN PORTFOLIO | abfunds.com |
DISCLOSURES AND RISKS (continued)
The value of commodity-linked derivative instruments may be affected by changes in overall market movements, commodity index volatility, changes in interest rates, or factors affecting a particular industry or commodity, such as drought, floods, weather, livestock disease, embargoes, tariffs and international economic, political and regulatory developments.
Derivatives Risk: Derivatives may be illiquid, difficult to price, and leveraged so that small changes may produce disproportionate losses for the Fund, and may be subject to counterparty risk to a greater degree than more traditional investments.
Leverage Risk: To the extent the Fund uses leveraging techniques, its net asset value (“NAV”) may be more volatile because leverage tends to exaggerate the effect of changes in interest rates and any increase or decrease in the value of the Fund’s investments.
Liquidity Risk: Liquidity risk occurs when certain investments become difficult to purchase or sell. Difficulty in selling less liquid securities may result in sales at disadvantageous prices affecting the value of your investment in the Fund. Causes of liquidity risk may include low trading volumes and large positions. Foreign fixed-income securities may have more liquidity risk because secondary trading markets for these securities may be smaller and less well-developed and the securities may trade less frequently. Liquidity risk may be higher in a rising interest rate environment, when the value and liquidity of fixed-income securities generally go down.
Foreign (Non-US) Risk: Investments in securities of non-US issuers may involve more risk than those of US issuers. These securities may fluctuate more widely in price and may be less liquid due to adverse market, economic, political, regulatory or other factors.
Currency Risk: Fluctuations in currency exchange rates may negatively affect the value of the Fund’s investments or reduce its returns.
Subsidiary Risk: By investing in the Subsidiary, the Fund is indirectly exposed to the risks associated with the Subsidiary’s investments. The derivatives and other investments held by the Subsidiary are generally similar to those that are permitted to be held by the Fund and are subject to the same risks that apply to similar investments if held directly by the Fund. The Subsidiary is not registered under the Investment Company Act of 1940, as amended (the “1940 Act”), and, unless otherwise noted in the Fund’s prospectus, is not subject to all of the investor protections of the 1940 Act. However, the Fund wholly owns and controls the Subsidiary, and the Fund and the Subsidiary are managed by the Adviser, making it unlikely the Subsidiary will take actions contrary to the interests of the Fund or its shareholders.
| abfunds.com | AB ALL MARKET REAL RETURN PORTFOLIO | 7 |
DISCLOSURES AND RISKS (continued)
Real Estate Risk: The Fund’s investments in real estate securities have many of the same risks as direct ownership of real estate, including the risk that the value of real estate could decline due to a variety of factors that affect the real estate market generally. Investments in REITs may have additional risks. REITs are dependent on the capability of their managers, may have limited diversification, and could be significantly affected by changes in taxes.
Non-Diversification Risk: The Fund may have more risk because it is “non-diversified”, meaning that it can invest more of its assets in a smaller number of issuers. Accordingly, changes in the value of a single security may have a more significant effect, either negative or positive, on the Fund’s NAV.
Management Risk: The Fund is subject to management risk because it is an actively managed investment fund. The Adviser will apply its investment techniques and risk analyses in making investment decisions, but there is no guarantee that its techniques will produce the intended results.
These risks are fully discussed in the Fund’s prospectus. As with all investments, you may lose money by investing in the Fund.
An Important Note About Historical Performance
The investment return and principal value of an investment in the Fund will fluctuate, so that shares, when redeemed, may be worth more or less than their original cost. Performance shown in this report represents past performance and does not guarantee future results. Current performance may be lower or higher than the performance information shown. You may obtain performance information current to the most recent month-end by visiting www.abfunds.com. For Class 1 shares, go to www.bernstein.com and click on “Investments”, then “Mutual Fund Information—Mutual Fund Performance at a Glance”.
Investors should consider the investment objectives, risks, charges and expenses of the Fund carefully before investing. For copies of our prospectus or summary prospectus, which contain this and other information, visit us online at www.abfunds.com. For Class 1 shares, go to www.bernstein.com, click on “Investments”, then “Mutual Fund Information—Prospectuses, SAIs, and Shareholder Reports”. Please read the prospectus and/or summary prospectus carefully before investing.
All fees and expenses related to the operation of the Fund have been deducted. NAV returns do not reflect sales charges; if sales charges were reflected, the Fund’s quoted performance would be
| 8 | AB ALL MARKET REAL RETURN PORTFOLIO | abfunds.com |
DISCLOSURES AND RISKS (continued)
lower. SEC returns reflect the applicable sales charges for each share class: a 4.25% maximum front-end sales charge for Class A shares and a 1% 1-year contingent deferred sales charge for Class C shares. Returns for the different share classes will vary due to different expenses associated with each class. Performance assumes reinvestment of distributions and does not account for taxes.
| abfunds.com | AB ALL MARKET REAL RETURN PORTFOLIO | 9 |
HISTORICAL PERFORMANCE
GROWTH OF A $10,000 INVESTMENT IN THE FUND (unaudited)
3/8/20101 TO 10/31/2017
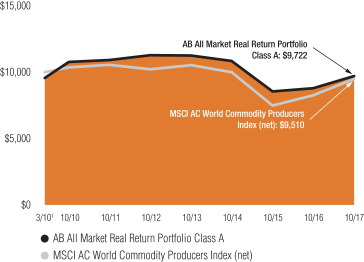
This chart illustrates the total value of an assumed $10,000 investment in AB All Market Real Return Portfolio Class A shares (from 3/8/20101 to 10/31/2017) as compared to the performance of its benchmark. The chart reflects the deduction of the maximum 4.25% sales charge from the initial $10,000 investment in the Fund and assumes the reinvestment of dividends and capital gains distributions.
| 1 | Inception date: 3/8/2010. |
| 10 | AB ALL MARKET REAL RETURN PORTFOLIO | abfunds.com |
HISTORICAL PERFORMANCE (continued)
AVERAGE ANNUAL RETURNS AS OF OCTOBER 31, 2017 (unaudited)
| NAV Returns | SEC Returns (reflects applicable sales charges) | |||||||
| CLASS 1 SHARES1 | ||||||||
| 1 Year | 10.69% | 10.69% | ||||||
| 5 Years | -2.81% | -2.81% | ||||||
| Since Inception2 | 0.28% | 0.28% | ||||||
| CLASS 2 SHARES1 | ||||||||
| 1 Year | 10.96% | 10.96% | ||||||
| 5 Years | -2.56% | -2.56% | ||||||
| Since Inception2 | 0.54% | 0.54% | ||||||
| CLASS A SHARES | ||||||||
| 1 Year | 10.45% | 5.70% | ||||||
| 5 Years | -2.94% | -3.77% | ||||||
| Since Inception2 | 0.19% | -0.37% | ||||||
| CLASS C SHARES | ||||||||
| 1 Year | 9.73% | 8.73% | ||||||
| 5 Years | -3.62% | -3.62% | ||||||
| Since Inception2 | -0.53% | -0.53% | ||||||
| ADVISOR CLASS SHARES3 | ||||||||
| 1 Year | 10.87% | 10.87% | ||||||
| 5 Years | -2.64% | -2.64% | ||||||
| Since Inception2 | 0.48% | 0.48% | ||||||
| CLASS R SHARES3 | ||||||||
| 1 Year | 10.29% | 10.29% | ||||||
| 5 Years | -3.14% | -3.14% | ||||||
| Since Inception2 | -0.02% | -0.02% | ||||||
| CLASS K SHARES3 | ||||||||
| 1 Year | 10.48% | 10.48% | ||||||
| 5 Years | -2.90% | -2.90% | ||||||
| Since Inception2 | 0.23% | 0.23% | ||||||
| CLASS I SHARES3 | ||||||||
| 1 Year | 10.98% | 10.98% | ||||||
| 5 Years | -2.59% | -2.59% | ||||||
| Since Inception2 | 0.52% | 0.52% | ||||||
| CLASS Z SHARES3 | ||||||||
| 1 Year | 10.98% | 10.98% | ||||||
| Since Inception2 | -2.59% | -2.59% | ||||||
(footnotes continued on next page)
| abfunds.com | AB ALL MARKET REAL RETURN PORTFOLIO | 11 |
HISTORICAL PERFORMANCE (continued)
The Fund’s prospectus fee table shows the Fund’s total annual operating expense ratios as 1.18%, 0.92%, 1.38%, 2.13%, 1.12%, 1.68%, 1.37%, 0.94% and 0.94% for Class 1, Class 2, Class A, Class C, Advisor Class, Class R, Class K, Class I and Class Z shares, respectively, gross of any fee waivers or expense reimbursements. Contractual fee waivers and/or expense reimbursements limited the Fund’s annual operating expense ratios to 1.17%, 0.92%, 1.32%, 2.07%, 1.07%, 1.57%, 1.32%, 0.93% and 0.94% for Class 1, Class 2, Class A, Class C, Advisor Class, Class R, Class K, Class I and Class Z shares, respectively. These waivers/reimbursements may not be terminated before January 31, 2018 and may be extended by the Adviser for additional one-year terms. Absent reimbursements or waivers, performance would have been lower. The Financial Highlights section of this report sets forth expense ratio data for the current reporting period; the expense ratios shown above may differ from the expense ratios in the Financial Highlights sections since they are based on different time periods.
| 1 | Class 1 shares are only available to Bernstein Global Wealth Management private client accounts. Class 2 shares are only available to the Adviser’s institutional clients or through other limited arrangements. |
| 2 | Inception date for Class 1, Class 2, Class A, Class C, Class R, Class K, Class I and Advisor Class Shares is 3/8/2010; the inception date for Class Z Shares is 1/31/2014. |
| 3 | These share classes are offered at NAV to eligible investors and their SEC returns are the same as their NAV returns. Please note that these share classes are for investors purchasing shares through accounts established under certain fee-based programs sponsored and maintained by certain broker-dealers and financial intermediaries, institutional pension plans and/or investment advisory clients of, and certain other persons associated with, the Adviser and its affiliates or the Fund. |
| 12 | AB ALL MARKET REAL RETURN PORTFOLIO | abfunds.com |
HISTORICAL PERFORMANCE (continued)
SEC AVERAGE ANNUAL RETURNS
AS OF THE MOST RECENT CALENDAR QUARTER-END
SEPTEMBER 30, 2017 (unaudited)
| SEC Returns (reflects applicable sales charges) | ||||
| CLASS 1 SHARES1 | ||||
| 1 Year | 7.57% | |||
| 5 Years | -3.22% | |||
| Since Inception2 | 0.13% | |||
| CLASS 2 SHARES1 | ||||
| 1 Year | 7.90% | |||
| 5 Years | -2.97% | |||
| Since Inception2 | 0.39% | |||
| CLASS A SHARES | ||||
| 1 Year | 2.73% | |||
| 5 Years | -4.18% | |||
| Since Inception2 | -0.52% | |||
| CLASS C SHARES | ||||
| 1 Year | 5.52% | |||
| 5 Years | -4.02% | |||
| Since Inception2 | -0.67% | |||
| ADVISOR CLASS SHARES3 | ||||
| 1 Year | 7.53% | |||
| 5 Years | -3.07% | |||
| Since Inception2 | 0.32% | |||
| CLASS R SHARES3 | ||||
| 1 Year | 7.06% | |||
| 5 Years | -3.55% | |||
| Since Inception2 | -0.17% | |||
| CLASS K SHARES3 | ||||
| 1 Year | 7.25% | |||
| 5 Years | -3.31% | |||
| Since Inception2 | 0.08% | |||
| CLASS I SHARES3 | ||||
| 1 Year | 7.75% | |||
| 5 Years | -3.00% | |||
| Since Inception2 | 0.38% | |||
| CLASS Z SHARES3 | ||||
| 1 Year | 7.75% | |||
| Since Inception2 | -2.95% | |||
(footnotes continued on next page)
| abfunds.com | AB ALL MARKET REAL RETURN PORTFOLIO | 13 |
HISTORICAL PERFORMANCE (continued)
| 1 | Class 1 shares are only available to Bernstein Global Wealth Management private client accounts. Class 2 shares are only available to the Adviser’s institutional clients or through other limited arrangements. |
| 2 | Inception date for Class 1, Class 2, Class A, Class C, Class R, Class K, Class I and Advisor Class Shares is 3/8/2010; the inception date for Class Z Shares is 1/31/2014. |
| 3 | Please note that these share classes are for investors purchasing shares through accounts established under certain fee-based programs sponsored and maintained by certain broker-dealers and financial intermediaries, institutional pension plans and/or investment advisory clients of, and certain other persons associated with, the Adviser and its affiliates or the Fund. |
| 14 | AB ALL MARKET REAL RETURN PORTFOLIO | abfunds.com |
EXPENSE EXAMPLE
(unaudited)
As a shareholder of a mutual fund, you may incur two types of costs: (1) transaction costs, including sales charges (loads) on purchase payments, contingent deferred sales charges on redemptions and (2) ongoing costs, including management fees; distribution (12b-1) fees; and other fund expenses. This example is intended to help you understand your ongoing costs (in dollars) of investing in the Fund and to compare these costs with the ongoing costs of investing in other mutual funds.
The Example is based on an investment of $1,000 invested at the beginning of the period and held for the entire period as indicated below.
Actual Expenses
The table below provides information about actual account values and actual expenses. You may use the information in this line, together with the amount you invested, to estimate the expenses that you paid over the period. Simply divide your account value by $1,000 (for example, an $8,600 account value divided by $1,000 = 8.6), then multiply the result by the number in the first line under the heading entitled “Expenses Paid During Period” to estimate the expenses you paid on your account during this period.
Hypothetical Example for Comparison Purposes
The table below provides information about hypothetical account values and hypothetical expenses based on the Fund’s actual expense ratio and an assumed annual rate of return of 5% before expenses, which is not the Fund’s actual return. The hypothetical account values and expenses may not be used to estimate the actual ending account balance or expenses you paid for the period. You may use this information to compare the ongoing costs of investing in the Fund and other funds by comparing this 5% hypothetical example with the 5% hypothetical examples that appear in the shareholder reports of other funds.
Please note that the expenses shown in the table are meant to highlight your ongoing costs only and do not reflect any transactional costs, such as sales charges (loads), or contingent deferred sales charges on redemptions. Therefore, the hypothetical example is useful in comparing ongoing costs only, and will not help you determine the relative total costs of owning different funds. In addition, if these transactional costs were included, your costs would have been higher.
| abfunds.com | AB ALL MARKET REAL RETURN PORTFOLIO | 15 |
EXPENSE EXAMPLE (continued)
| Beginning Account Value May 1, 2017 | Ending Account Value October 31, 2017 | Expenses Paid During Period* | Annualized Expense Ratio* | Total Expenses Paid During Period+ | Total Annualized Expense Ratio+ | |||||||||||||||||||
| Class A | ||||||||||||||||||||||||
Actual | $ | 1,000 | $ | 1,053.30 | $ | 6.57 | 1.27 | % | $ | 6.73 | 1.30 | % | ||||||||||||
Hypothetical** | $ | 1,000 | $ | 1,018.80 | $ | 6.46 | 1.27 | % | $ | 6.62 | 1.30 | % | ||||||||||||
| Class C | ||||||||||||||||||||||||
Actual | $ | 1,000 | $ | 1,048.70 | $ | 10.43 | 2.02 | % | $ | 10.64 | 2.06 | % | ||||||||||||
Hypothetical** | $ | 1,000 | $ | 1,015.02 | $ | 10.26 | 2.02 | % | $ | 10.46 | 2.06 | % | ||||||||||||
| Advisor Class | ||||||||||||||||||||||||
Actual | $ | 1,000 | $ | 1,055.80 | $ | 5.29 | 1.02 | % | $ | 5.44 | 1.05 | % | ||||||||||||
Hypothetical** | $ | 1,000 | $ | 1,020.06 | $ | 5.19 | 1.02 | % | $ | 5.35 | 1.05 | % | ||||||||||||
Class R | ||||||||||||||||||||||||
Actual | $ | 1,000 | $ | 1,052.70 | $ | 7.97 | 1.54 | % | $ | 8.17 | 1.58 | % | ||||||||||||
Hypothetical** | $ | 1,000 | $ | 1,017.44 | $ | 7.83 | 1.54 | % | $ | 8.03 | 1.58 | % | ||||||||||||
| Class K | ||||||||||||||||||||||||
Actual | $ | 1,000 | $ | 1,053.90 | $ | 6.57 | 1.27 | % | $ | 6.78 | 1.31 | % | ||||||||||||
Hypothetical** | $ | 1,000 | $ | 1,018.80 | $ | 6.46 | 1.27 | % | $ | 6.67 | 1.31 | % | ||||||||||||
| Class I | ||||||||||||||||||||||||
Actual | $ | 1,000 | $ | 1,056.20 | $ | 4.25 | 0.82 | % | $ | 4.46 | 0.86 | % | ||||||||||||
Hypothetical** | $ | 1,000 | $ | 1,021.07 | $ | 4.18 | 0.82 | % | $ | 4.38 | 0.86 | % | ||||||||||||
| Class 1 | ||||||||||||||||||||||||
Actual | $ | 1,000 | $ | 1,054.20 | $ | 5.54 | 1.07 | % | $ | 5.70 | 1.10 | % | ||||||||||||
Hypothetical** | $ | 1,000 | $ | 1,019.81 | $ | 5.45 | 1.07 | % | $ | 5.60 | 1.10 | % | ||||||||||||
| Class 2 | ||||||||||||||||||||||||
Actual | $ | 1,000 | $ | 1,055.40 | $ | 4.20 | 0.81 | % | $ | 4.46 | 0.86 | % | ||||||||||||
Hypothetical** | $ | 1,000 | $ | 1,021.12 | $ | 4.13 | 0.81 | % | $ | 4.38 | 0.86 | % | ||||||||||||
| Class Z | ||||||||||||||||||||||||
Actual | $ | 1,000 | $ | 1,056.20 | $ | 4.25 | 0.82 | % | $ | 4.46 | 0.86 | % | ||||||||||||
Hypothetical** | $ | 1,000 | $ | 1,021.07 | $ | 4.18 | 0.82 | % | $ | 4.38 | 0.86 | % | ||||||||||||
| * | Expenses are equal to the Portfolio’s annualized expense ratio, multiplied by the average account value over the period, multiplied by 184/365 (to reflect the one-half year period). |
| ** | Assumes 5% annual return before expenses. |
| + | In connection with the Portfolio’s investments in affiliated/unaffiliated underlying portfolios, the Portfolio incurs no direct expenses, but bears proportionate shares of the fees and expenses (i.e., operating, administrative and investment advisory fees) of the affiliated/unaffiliated underlying portfolios. The Adviser has contractually agreed to waive its fees from the Portfolio in an amount equal to the Portfolio’s pro rata share of certain acquired fund fees and expenses of the affiliated underlying portfolios. The Portfolio’s total expenses are equal to the classes’ annualized expense ratio plus the Portfolio’s pro rata share of the weighted average expense ratio of the affiliated/unaffiliated underlying portfolios in which it invests, multiplied by the average account value over the period, multiplied by 184/365 (to reflect the one-half year period). |
| 16 | AB ALL MARKET REAL RETURN PORTFOLIO | abfunds.com |
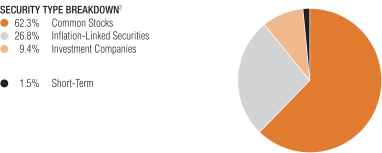
PORTFOLIO SUMMARY
October 31, 2017 (unaudited)
PORTFOLIO STATISTICS
Net Assets ($mil): $1,402.9
PORTFOLIO BREAKDOWN1
| Commodity Related Derivatives | 46.0 | % | ||
| Real Estate Stocks | 22.4 | % | ||
| Commodity Related Stocks | 19.5 | % | ||
| Inflation Sensitive | 12.1 | % |
| 1 | All data are as of October 31, 2017. The portfolio breakdown is expressed as an approximate percentage of the Fund’s net assets inclusive of derivative exposure, based on the Adviser’s internal classification guidelines. |
| 2 | The Fund’s security type breakdown is expressed as a percentage of total investments and may vary over time. The Fund also enters into derivative transactions, which may be used for hedging or investment purposes (see “Portfolio of Investments” section of the report for additional details). |
| abfunds.com | AB ALL MARKET REAL RETURN PORTFOLIO | 17 |
PORTFOLIO SUMMARY
October 31, 2017 (unaudited)
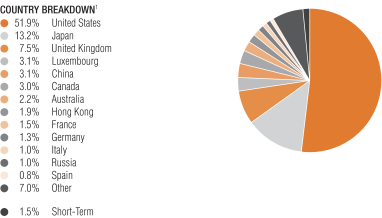
| 1 | All data are as of October 31, 2017. The Fund’s country breakdown is expressed as a percentage of total investments and may vary over time. The Fund also enters into derivative transactions, which may be used for hedging or investment purposes (see “Portfolio of Investments” section of the report for additional details). “Other” country weightings represent 0.8% or less in the following countries: Argentina, Austria, Brazil, Chile, Czech Republic, Denmark, Finland, Indonesia, Ireland, Israel, Malaysia, Mexico, Netherlands, New Zealand, Norway, Philippines, Portugal, Singapore, South Africa, Sweden, Switzerland, Thailand and Turkey. |
| 18 | AB ALL MARKET REAL RETURN PORTFOLIO | abfunds.com |
TEN LARGEST HOLDINGS1
October 31, 2017 (unaudited)
| Security | U.S. $ Value | Percent of Net Assets | ||||||
| Japanese Government CPI Linked Bond Series 21 | $ | 124,153,893 | 8.8 | % | ||||
| Royal Dutch Shell PLC – Class A & Class B | 47,743,283 | 3.4 | ||||||
| Vanguard Global ex-U.S. Real Estate ETF | 29,010,928 | 2.1 | ||||||
| iShares MSCI Europe Financials ETF | 27,434,278 | 2.0 | ||||||
| Chevron Corp. | 26,787,974 | 1.9 | ||||||
| Exxon Mobil Corp. | 23,008,267 | 1.6 | ||||||
| iShares MSCI Global Metals & Mining Producers ETF | 19,990,428 | 1.4 | ||||||
| BP PLC | 18,752,135 | 1.3 | ||||||
| SPDR S&P Dividend ETF | 14,203,448 | 1.0 | ||||||
| iShares Global Financials ETF | 14,159,905 | 1.0 | ||||||
| $ | 345,244,539 | 24.5 | % | |||||
| 1 | Long-term investments. |
| abfunds.com | AB ALL MARKET REAL RETURN PORTFOLIO | 19 |
CONSOLIDATED PORTFOLIO OF INVESTMENTS
October 31, 2017
| Company | Shares | U.S. $ Value | ||||||
| ||||||||
COMMON STOCKS – 62.0% | ||||||||
Real Estate – 23.2% | ||||||||
Diversified Real Estate Activities – 1.7% | ||||||||
Ayala Land, Inc. | 1,737,660 | $ | 1,455,395 | |||||
City Developments Ltd. | 351,900 | 3,341,950 | ||||||
Kerry Properties Ltd. | 485,000 | 2,182,645 | ||||||
Leopalace21 Corp. | 222,600 | 1,662,207 | ||||||
Mitsubishi Estate Co., Ltd. | 100,100 | 1,815,266 | ||||||
Mitsui Fudosan Co., Ltd. | 305,500 | 7,130,667 | ||||||
Pakuwon Jati Tbk PT | 2,687,500 | 124,807 | ||||||
Shenzhen Investment Ltd. | 348,000 | 155,248 | ||||||
Sumitomo Realty & Development Co., Ltd. | 41,000 | 1,373,180 | ||||||
Sun Hung Kai Properties Ltd. | 62,000 | 1,014,282 | ||||||
Tokyo Tatemono Co., Ltd. | 127,300 | 1,785,807 | ||||||
Wharf Holdings Ltd. (The) | 273,000 | 2,486,524 | ||||||
|
| |||||||
| 24,527,978 | ||||||||
|
| |||||||
Diversified REITs – 3.0% | ||||||||
Activia Properties, Inc. | 383 | 1,498,923 | ||||||
Armada Hoffler Properties, Inc. | 230,640 | 3,291,233 | ||||||
Empire State Realty Trust, Inc. – Class A | 202,790 | 4,065,939 | ||||||
Fibra Uno Administracion SA de CV | 304,899 | 478,379 | ||||||
GPT Group (The) | 970,021 | 3,787,758 | ||||||
Gramercy Property Trust | 135,522 | 4,025,003 | ||||||
Growthpoint Properties Ltd. | 1,371,365 | 2,378,791 | ||||||
H&R Real Estate Investment Trust | 123,050 | 2,043,044 | ||||||
Hispania Activos Inmobiliarios SOCIMI SA | 107,650 | 1,856,488 | ||||||
Hulic Reit, Inc. | 1,133 | 1,580,899 | ||||||
ICADE | 28,560 | 2,495,108 | ||||||
KLCCP Stapled Group | 51,300 | 97,009 | ||||||
Liberty Property Trust | 86,410 | 3,705,261 | ||||||
Mapletree Greater China Commercial Trust(a) | 215,400 | 185,692 | ||||||
Merlin Properties Socimi SA | 169,009 | 2,231,613 | ||||||
Mirvac Group | 2,326,490 | 4,300,162 | ||||||
Redefine Properties Ltd. | 567,048 | 425,524 | ||||||
SA Corporate Real Estate Ltd. | 1,499,301 | 507,941 | ||||||
Washington Real Estate Investment Trust | 114,370 | 3,681,570 | ||||||
|
| |||||||
| 42,636,337 | ||||||||
|
| |||||||
Health Care REITs – 1.2% |
| |||||||
Healthcare Realty Trust, Inc. | 82,430 | 2,657,543 | ||||||
Medical Properties Trust, Inc. | 241,080 | 3,189,488 | ||||||
Sabra Health Care REIT, Inc. | 141,930 | 2,827,246 | ||||||
Welltower, Inc. | 119,480 | 8,000,381 | ||||||
|
| |||||||
| 16,674,658 | ||||||||
|
| |||||||
| 20 | AB ALL MARKET REAL RETURN PORTFOLIO | abfunds.com |
CONSOLIDATED PORTFOLIO OF INVESTMENTS (continued)
| Company | Shares | U.S. $ Value | ||||||
| ||||||||
Hotel & Resort REITs – 0.9% |
| |||||||
MGM Growth Properties LLC – Class A | 113,400 | $ | 3,346,434 | |||||
Park Hotels & Resorts, Inc. | 104,350 | 3,004,237 | ||||||
RLJ Lodging Trust | 183,090 | 3,965,729 | ||||||
Summit Hotel Properties, Inc. | 126,569 | 2,001,056 | ||||||
|
| |||||||
| 12,317,456 | ||||||||
|
| |||||||
Industrial REITs – 1.7% |
| |||||||
Goodman Group | 241,282 | 1,547,039 | ||||||
LaSalle Logiport REIT | 1,677 | 1,577,846 | ||||||
Macquarie Mexico Real Estate Management SA de CV(b) | 91,367 | 110,326 | ||||||
Mapletree Logistics Trust | 2,661,450 | 2,480,211 | ||||||
PLA Administradora Industrial S de RL de CV(b) | 1,810,150 | 2,773,988 | ||||||
Prologis, Inc. | 20,870 | 1,347,785 | ||||||
Pure Industrial Real Estate Trust | 320,990 | 1,657,076 | ||||||
Rexford Industrial Realty, Inc. | 114,120 | 3,388,223 | ||||||
Segro PLC | 372,682 | 2,690,429 | ||||||
STAG Industrial, Inc. | 162,500 | 4,436,250 | ||||||
Tritax Big Box REIT PLC | 825,580 | 1,615,136 | ||||||
|
| |||||||
| 23,624,309 | ||||||||
|
| |||||||
Office REITs – 3.2% |
| |||||||
Alexandria Real Estate Equities, Inc. | 38,082 | 4,720,645 | ||||||
Allied Properties Real Estate Investment Trust | 67,454 | 2,161,498 | ||||||
Axiare Patrimonio SOCIMI SA | 99,700 | 1,869,781 | ||||||
Beni Stabili SpA SIIQ | 2,102,800 | 1,861,579 | ||||||
Boston Properties, Inc. | 17,572 | 2,129,375 | ||||||
Brandywine Realty Trust | 123,220 | 2,155,118 | ||||||
Champion REIT | 2,328,000 | 1,680,116 | ||||||
Columbia Property Trust, Inc. | 121,534 | 2,683,471 | ||||||
Corporate Office Properties Trust | 75,200 | 2,401,136 | ||||||
Daiwa Office Investment Corp. | 344 | 1,670,006 | ||||||
Derwent London PLC | 87,470 | 3,108,906 | ||||||
Hibernia REIT PLC | 524,570 | 901,291 | ||||||
Hudson Pacific Properties, Inc. | 135,160 | 4,571,111 | ||||||
Investa Office Fund | 599,700 | 2,059,561 | ||||||
Japan Real Estate Investment Corp. | 375 | 1,758,055 | ||||||
Mack-Cali Realty Corp. | 86,950 | 1,979,851 | ||||||
MCUBS MidCity Investment Corp. | 516 | 1,708,579 | ||||||
SL Green Realty Corp. | 28,420 | 2,719,225 | ||||||
Workspace Group PLC | 235,740 | 2,770,918 | ||||||
|
| |||||||
| 44,910,222 | ||||||||
|
| |||||||
Real Estate Development – 2.3% |
| |||||||
AP Thailand PCL | 259,000 | 69,389 | ||||||
Bumi Serpong Damai Tbk PT | 854,100 | 108,404 | ||||||
| abfunds.com | AB ALL MARKET REAL RETURN PORTFOLIO | 21 |
CONSOLIDATED PORTFOLIO OF INVESTMENTS (continued)
| Company | Shares | U.S. $ Value | ||||||
| ||||||||
China Evergrande Group(b)(c) | 395,000 | $ | 1,523,655 | |||||
China Jinmao Holdings Group Ltd. | 556,000 | 249,868 | ||||||
China Overseas Land & Investment Ltd. | 2,508,790 | 8,146,081 | ||||||
China Resources Land Ltd. | 850,874 | 2,539,422 | ||||||
China Vanke Co., Ltd. – Class H | 156,700 | 557,811 | ||||||
CIFI Holdings Group Co., Ltd. | 4,810,000 | 2,681,626 | ||||||
Ciputra Development Tbk PT | 1,207,887 | 107,764 | ||||||
CK Asset Holdings Ltd. | 1,023,500 | 8,423,232 | ||||||
Country Garden Holdings Co., Ltd. | 860,000 | 1,363,279 | ||||||
Guangzhou R&F Properties Co., Ltd. – Class H | 107,600 | 229,437 | ||||||
IOI Properties Group Bhd | 203,100 | 95,469 | ||||||
Longfor Properties Co., Ltd. | 161,650 | 377,602 | ||||||
Mah Sing Group Bhd | 177,350 | 64,590 | ||||||
Quality Houses PCL | 757,666 | 67,054 | ||||||
Shimao Property Holdings Ltd. | 139,500 | 292,417 | ||||||
Sino-Ocean Group Holding Ltd. | 333,930 | 218,072 | ||||||
Summarecon Agung Tbk PT | 1,182,800 | 90,283 | ||||||
Sunac China Holdings Ltd.(c) | 204,000 | 1,039,355 | ||||||
Supalai PCL | 98,600 | 73,015 | ||||||
TAG Immobilien AG | 112,590 | 1,941,037 | ||||||
Times Property Holdings Ltd. | 1,582,000 | 1,634,177 | ||||||
UEM Sunrise Bhd(b) | 179,600 | 47,106 | ||||||
|
| |||||||
| 31,940,145 | ||||||||
|
| |||||||
Real Estate Operating Companies – 2.0% | ||||||||
Aroundtown SA | 357,890 | 2,513,834 | ||||||
Ascendas India Trust | 78,900 | 66,565 | ||||||
BR Malls Participacoes SA | 256,115 | 992,736 | ||||||
BUWOG AG(b) | 78,117 | 2,253,025 | ||||||
CA Immobilien Anlagen AG | 94,149 | 2,686,901 | ||||||
Central Pattana PCL | 290,351 | 694,850 | ||||||
Deutsche Wohnen SE | 71,590 | 3,064,075 | ||||||
Entra ASA(a) | 190,538 | 2,624,330 | ||||||
Fabege AB | 136,880 | 2,890,257 | ||||||
Hongkong Land Holdings Ltd. | 438,100 | 3,177,486 | ||||||
Iguatemi Empresa de Shopping Centers SA | 6,800 | 79,988 | ||||||
Multiplan Empreendimentos Imobiliarios SA | 9,180 | 200,645 | ||||||
Parque Arauco SA | 353,110 | 1,020,299 | ||||||
SM Prime Holdings, Inc. | 1,146,700 | 822,658 | ||||||
Vonovia SE | 119,603 | 5,283,278 | ||||||
|
| |||||||
| 28,370,927 | ||||||||
|
| |||||||
Residential REITs – 2.7% |
| |||||||
American Homes 4 Rent – Class A | 205,120 | 4,364,954 | ||||||
Camden Property Trust | 41,750 | 3,809,270 | ||||||
Education Realty Trust, Inc. | 62,664 | 2,186,974 | ||||||
Emlak Konut Gayrimenkul Yatirim Ortakligi AS(b) | 3,061,793 | 2,136,821 | ||||||
Essex Property Trust, Inc. | 24,600 | 6,455,778 | ||||||
| 22 | AB ALL MARKET REAL RETURN PORTFOLIO | abfunds.com |
CONSOLIDATED PORTFOLIO OF INVESTMENTS (continued)
| Company | Shares | U.S. $ Value | ||||||
| ||||||||
Independence Realty Trust, Inc. | 238,870 | $ | 2,424,530 | |||||
Japan Rental Housing Investments, Inc. | 2,717 | 1,878,160 | ||||||
Killam Apartment Real Estate Investment Trust | 165,450 | 1,694,128 | ||||||
Mid-America Apartment Communities, Inc. | 48,830 | 4,997,750 | ||||||
Sun Communities, Inc. | 50,727 | 4,578,619 | ||||||
UNITE Group PLC (The) | 293,355 | 2,739,025 | ||||||
|
| |||||||
| 37,266,009 | ||||||||
|
| |||||||
Retail REITs – 3.4% |
| |||||||
Brixmor Property Group, Inc. | 192,930 | 3,370,487 | ||||||
Eurocommercial Properties NV | 51,900 | 2,161,291 | ||||||
Frontier Real Estate Investment Corp. | 473 | 1,853,230 | ||||||
Fukuoka REIT Corp. | 1,388 | 1,968,993 | ||||||
Hyprop Investments Ltd. | 27,899 | 209,853 | ||||||
IGB Real Estate Investment Trust | 184,600 | 71,947 | ||||||
Kenedix Retail REIT Corp. | 845 | 1,667,583 | ||||||
Klepierre SA | 64,166 | 2,554,327 | ||||||
Link REIT | 801,901 | 6,741,825 | ||||||
Lippo Malls Indonesia Retail Trust | 222,100 | 70,878 | ||||||
National Retail Properties, Inc.(c) | 105,620 | 4,243,812 | ||||||
Realty Income Corp. | 104,840 | 5,626,763 | ||||||
Resilient REIT Ltd. | 30,118 | 300,014 | ||||||
Retail Opportunity Investments Corp. | 115,940 | 2,084,601 | ||||||
Simon Property Group, Inc. | 75,202 | 11,681,127 | ||||||
Urban Edge Properties | 126,950 | 2,978,247 | ||||||
|
| |||||||
| 47,584,978 | ||||||||
|
| |||||||
Specialized REITs – 1.1% |
| |||||||
Digital Realty Trust, Inc. | 51,650 | 6,117,426 | ||||||
Equinix, Inc. | 5,620 | 2,604,870 | ||||||
National Storage Affiliates Trust | 145,950 | 3,618,100 | ||||||
Public Storage | 12,430 | 2,576,118 | ||||||
|
| |||||||
| 14,916,514 | ||||||||
|
| |||||||
| 324,769,533 | ||||||||
|
| |||||||
Energy – 17.6% |
| |||||||
Integrated Oil & Gas – 11.6% |
| |||||||
BP PLC | 2,764,718 | 18,752,136 | ||||||
Chevron Corp. | 231,150 | 26,787,974 | ||||||
Eni SpA | 693,350 | 11,334,893 | ||||||
Exxon Mobil Corp. | 276,044 | 23,008,267 | ||||||
Galp Energia SGPS SA | 180,700 | 3,359,585 | ||||||
LUKOIL PJSC (Sponsored ADR) | 107,710 | 5,711,861 | ||||||
PetroChina Co., Ltd. – Class H | 8,906,000 | 5,821,837 | ||||||
Petroleo Brasileiro SA | 644,900 | 3,306,017 | ||||||
Repsol SA | 268,310 | 5,027,967 | ||||||
Royal Dutch Shell PLC – Class A | 78,214 | 2,462,783 | ||||||
| abfunds.com | AB ALL MARKET REAL RETURN PORTFOLIO | 23 |
CONSOLIDATED PORTFOLIO OF INVESTMENTS (continued)
| Company | Shares | U.S. $ Value | ||||||
| ||||||||
Royal Dutch Shell PLC – Class B | 1,406,346 | $ | 45,280,500 | |||||
TOTAL SA | 121,669 | 6,781,598 | ||||||
YPF SA (Sponsored ADR) | 216,840 | 5,325,590 | ||||||
|
| |||||||
| 162,961,008 | ||||||||
|
| |||||||
Oil & Gas Equipment & Services – 0.6% |
| |||||||
Aker Solutions ASA(a)(b) | 335,670 | 1,845,724 | ||||||
C&J Energy Services, Inc.(b) | 111,580 | 3,178,914 | ||||||
Petrofac Ltd. | 160,371 | 893,433 | ||||||
Petroleum Geo-Services ASA(b)(c) | 801,545 | 1,318,491 | ||||||
TMK PJSC (GDR)(a) | 145,743 | 801,586 | ||||||
|
| |||||||
| 8,038,148 | ||||||||
|
| |||||||
Oil & Gas Exploration & Production – 4.4% | ||||||||
Aker BP ASA | 151,141 | 3,481,797 | ||||||
Anadarko Petroleum Corp. | 153,328 | 7,569,803 | ||||||
Canadian Natural Resources Ltd. (Toronto) | 299,377 | 10,447,215 | ||||||
CNOOC Ltd. | 3,187,000 | 4,351,507 | ||||||
Concho Resources, Inc.(b) | 21,840 | 2,931,146 | ||||||
Continental Resources, Inc./OK(b) | 109,673 | 4,464,788 | ||||||
Devon Energy Corp. | 182,680 | 6,740,892 | ||||||
EOG Resources, Inc. | 134,613 | 13,443,800 | ||||||
Gran Tierra Energy, Inc.(b) | 777,310 | 1,693,079 | ||||||
Inpex Corp. | 207,500 | 2,221,741 | ||||||
SM Energy Co. | 218,232 | 4,654,889 | ||||||
|
| |||||||
| 62,000,657 | ||||||||
|
| |||||||
Oil & Gas Refining & Marketing – 1.0% |
| |||||||
Cosan SA Industria e Comercio | 132,000 | 1,509,125 | ||||||
HollyFrontier Corp. | 89,550 | 3,308,873 | ||||||
JXTG Holdings, Inc. | 983,600 | 5,079,110 | ||||||
Tupras Turkiye Petrol Rafinerileri AS | 93,230 | 3,359,028 | ||||||
|
| |||||||
| 13,256,136 | ||||||||
|
| |||||||
| 246,255,949 | ||||||||
|
| |||||||
Materials – 7.6% |
| |||||||
Aluminum – 0.7% |
| |||||||
Alcoa Corp.(b) | 153,280 | 7,323,719 | ||||||
Aluminum Corp. of China Ltd. – Class H(b) | 3,780,000 | 3,036,068 | ||||||
|
| |||||||
| 10,359,787 | ||||||||
|
| |||||||
Construction Materials – 0.6% | ||||||||
Anhui Conch Cement Co., Ltd. – Class H | 725,500 | 3,107,819 | ||||||
BBMG Corp. – Class H | 764,000 | 381,268 | ||||||
CRH PLC | 50,904 | 1,915,616 | ||||||
Fletcher Building Ltd. | 303,850 | 1,532,688 | ||||||
Grupo Cementos de Chihuahua SAB de CV | 407,947 | 1,936,773 | ||||||
|
| |||||||
| 8,874,164 | ||||||||
|
| |||||||
| 24 | AB ALL MARKET REAL RETURN PORTFOLIO | abfunds.com |
CONSOLIDATED PORTFOLIO OF INVESTMENTS (continued)
| Company | Shares | U.S. $ Value | ||||||
| ||||||||
Copper – 0.6% | ||||||||
Antofagasta PLC | 230,680 | $ | 2,923,550 | |||||
First Quantum Minerals Ltd. | 261,950 | 2,929,958 | ||||||
Lundin Mining Corp. | 202,160 | 1,541,938 | ||||||
OZ Minerals Ltd. | 256,170 | 1,581,867 | ||||||
|
| |||||||
| 8,977,313 | ||||||||
|
| |||||||
Diversified Chemicals – 0.1% | ||||||||
Huntsman Corp. | 37,763 | 1,209,171 | ||||||
|
| |||||||
Diversified Metals & Mining – 2.3% | ||||||||
Boliden AB | 151,980 | 5,318,048 | ||||||
Glencore PLC(b) | 2,349,886 | 11,333,968 | ||||||
MMC Norilsk Nickel PJSC (ADR) (London) | 278,980 | 5,148,901 | ||||||
Orocobre Ltd.(b)(c) | 251,940 | 937,570 | ||||||
Rio Tinto PLC | 82,780 | 3,912,233 | ||||||
Sumitomo Metal Mining Co., Ltd. | 69,400 | 2,737,940 | ||||||
Syrah Resources Ltd.(b)(c) | 566,249 | 1,465,015 | ||||||
Vedanta Resources PLC | 133,870 | 1,578,666 | ||||||
|
| |||||||
| 32,432,341 | ||||||||
|
| |||||||
Fertilizers & Agricultural Chemicals – 1.0% | ||||||||
Agrium, Inc. (Toronto) | 7,163 | 779,818 | ||||||
Monsanto Co. | 52,055 | 6,303,861 | ||||||
Mosaic Co. (The) | 168,704 | 3,768,847 | ||||||
Potash Corp. of Saskatchewan, Inc. | 45,786 | 891,161 | ||||||
Syngenta AG (REG) | 5,051 | 2,329,884 | ||||||
|
| |||||||
| 14,073,571 | ||||||||
|
| |||||||
Forest Products – 0.0% | ||||||||
West Fraser Timber Co., Ltd. | 3,582 | 217,874 | ||||||
|
| |||||||
Gold – 0.9% |
| |||||||
Agnico Eagle Mines Ltd. | 162,607 | 7,260,029 | ||||||
Detour Gold Corp.(b) | 141,570 | 1,508,866 | ||||||
Evolution Mining Ltd. | 1,358,430 | 2,440,283 | ||||||
Polyus PJSC (GDR)(a) | 39,920 | 1,643,446 | ||||||
Real Gold Mining Ltd.(b)(d)(e)(f) | 811,000 | – 0 | – | |||||
|
| |||||||
| 12,852,624 | ||||||||
|
| |||||||
Metal & Glass Containers – 0.1% | ||||||||
CCL Industries, Inc. – Class B | 28,500 | 1,373,638 | ||||||
|
| |||||||
Paper Packaging – 0.0% | ||||||||
Amcor Ltd./Australia | 49,271 | 597,977 | ||||||
|
| |||||||
Paper Products – 0.2% | ||||||||
Mondi PLC | 20,054 | 484,990 | ||||||
Oji Holdings Corp. | 44,000 | 257,884 | ||||||
| abfunds.com | AB ALL MARKET REAL RETURN PORTFOLIO | 25 |
CONSOLIDATED PORTFOLIO OF INVESTMENTS (continued)
| Company | Shares | U.S. $ Value | ||||||
| ||||||||
Stora Enso Oyj – Class R | 30,089 | $ | 470,237 | |||||
UPM-Kymmene Oyj | 29,133 | 874,930 | ||||||
|
| |||||||
| 2,088,041 | ||||||||
|
| |||||||
Precious Metals & Minerals – 0.1% | ||||||||
Industrias Penoles SAB de CV | 58,080 | 1,354,167 | ||||||
|
| |||||||
Specialty Chemicals – 0.6% | ||||||||
Ecolab, Inc. | 15,191 | 1,984,856 | ||||||
Johnson Matthey PLC | 54,369 | 2,440,934 | ||||||
PPG Industries, Inc. | 16,305 | 1,895,293 | ||||||
Sherwin-Williams Co. (The) | 1,615 | 638,167 | ||||||
Sika AG | 130 | 962,191 | ||||||
|
| |||||||
| 7,921,441 | ||||||||
|
| |||||||
Steel – 0.4% | ||||||||
APERAM SA | 30,550 | 1,642,753 | ||||||
Yamato Kogyo Co., Ltd. | 123,500 | 3,303,506 | ||||||
|
| |||||||
| 4,946,259 | ||||||||
|
| |||||||
| 107,278,368 | ||||||||
|
| |||||||
Software & Services – 1.3% | ||||||||
Application Software – 0.2% | ||||||||
ANSYS, Inc.(b) | 1,345 | 183,875 | ||||||
Dassault Systemes SE | 5,488 | 582,586 | ||||||
Intuit, Inc. | 13,757 | 2,077,582 | ||||||
|
| |||||||
| 2,844,043 | ||||||||
|
| |||||||
Data Processing & Outsourced Services – 0.2% | ||||||||
Automatic Data Processing, Inc. | 18,078 | 2,101,749 | ||||||
Wirecard AG | 8,013 | 796,092 | ||||||
|
| |||||||
| 2,897,841 | ||||||||
|
| |||||||
Internet Software & Services – 0.3% | ||||||||
Alphabet, Inc. – Class C(b) | 2,458 | 2,498,901 | ||||||
Facebook, Inc. – Class A(b) | 5,339 | 961,340 | ||||||
United Internet AG | 15,949 | 1,011,492 | ||||||
| �� |
|
| ||||||
| 4,471,733 | ||||||||
|
| |||||||
IT Consulting & Other Services – 0.2% | ||||||||
Capgemini SE | 4,761 | 578,385 | ||||||
Fujitsu Ltd. | 238,000 | 1,854,614 | ||||||
|
| |||||||
| 2,432,999 | ||||||||
|
| |||||||
Systems Software – 0.4% | ||||||||
Check Point Software Technologies Ltd.(b) | 10,652 | 1,253,847 | ||||||
Microsoft Corp. | 19,406 | 1,614,191 | ||||||
Red Hat, Inc.(b) | 11,486 | 1,387,853 | ||||||
Trend Micro, Inc./Japan | 35,800 | 1,919,726 | ||||||
|
| |||||||
| 6,175,617 | ||||||||
|
| |||||||
| 18,822,233 | ||||||||
|
| |||||||
| 26 | AB ALL MARKET REAL RETURN PORTFOLIO | abfunds.com |
CONSOLIDATED PORTFOLIO OF INVESTMENTS (continued)
| Company | Shares | U.S. $ Value | ||||||
| ||||||||
Pharmaceuticals & Biotechnology – 1.3% | ||||||||
Biotechnology – 0.4% | ||||||||
Actelion Ltd. (REG)(b) | 4,839 | $ | 1,352,191 | |||||
Alexion Pharmaceuticals, Inc.(b) | 14,155 | 1,693,787 | ||||||
Amgen, Inc. | 13,478 | 2,361,615 | ||||||
|
| |||||||
| 5,407,593 | ||||||||
|
| |||||||
Life Sciences Tools & Services – 0.0% | ||||||||
Agilent Technologies, Inc. | 2,680 | 182,320 | ||||||
|
| |||||||
Pharmaceuticals – 0.9% | ||||||||
Astellas Pharma, Inc. | 147,100 | 1,957,733 | ||||||
Ipsen SA | 1,252 | 151,376 | ||||||
Johnson & Johnson | 27,614 | 3,849,668 | ||||||
Mitsubishi Tanabe Pharma Corp. | 47,300 | 1,041,044 | ||||||
Novo Nordisk A/S – Class B | 47,430 | 2,361,484 | ||||||
Roche Holding AG | 7,109 | 1,643,110 | ||||||
Sino Biopharmaceutical Ltd. | 824,000 | 963,569 | ||||||
Sumitomo Dainippon Pharma Co., Ltd. | 55,400 | 790,684 | ||||||
Zoetis, Inc. | 4,242 | 270,724 | ||||||
|
| |||||||
| 13,029,392 | ||||||||
|
| |||||||
| 18,619,305 | ||||||||
|
| |||||||
Capital Goods – 1.3% | ||||||||
Aerospace & Defense – 0.3% | ||||||||
BAE Systems PLC | 142,167 | 1,119,897 | ||||||
United Technologies Corp. | 19,326 | 2,314,482 | ||||||
|
| |||||||
| 3,434,379 | ||||||||
|
| |||||||
Agricultural & Farm Machinery – 0.3% | ||||||||
Deere & Co. | 14,880 | 1,977,254 | ||||||
Toro Co. (The) | 27,023 | 1,698,396 | ||||||
|
| |||||||
| 3,675,650 | ||||||||
|
| |||||||
Construction & Engineering – 0.1% | ||||||||
China Railway Group Ltd. – Class H | 2,034,000 | 1,634,936 | ||||||
|
| |||||||
Electrical Components & Equipment – 0.1% | ||||||||
Legrand SA | 26,119 | 1,938,303 | ||||||
|
| |||||||
Industrial Conglomerates – 0.2% | ||||||||
3M Co. | 11,360 | 2,614,958 | ||||||
|
| |||||||
Industrial Machinery – 0.2% | ||||||||
Atlas Copco AB – Class A(c) | 16,589 | 727,452 | ||||||
Atlas Copco AB – Class B | 14,749 | 585,509 | ||||||
Graco, Inc. | 14,528 | 1,914,645 | ||||||
Sandvik AB | 9,919 | 181,056 | ||||||
|
| |||||||
| 3,408,662 | ||||||||
|
| |||||||
| abfunds.com | AB ALL MARKET REAL RETURN PORTFOLIO | 27 |
CONSOLIDATED PORTFOLIO OF INVESTMENTS (continued)
| Company | Shares | U.S. $ Value | ||||||
| ||||||||
Trading Companies & Distributors – 0.1% | ||||||||
Ferguson PLC | 12,356 | $ | 864,055 | |||||
|
| |||||||
| 17,570,943 | ||||||||
|
| |||||||
Food Beverage & Tobacco – 1.1% | ||||||||
Agricultural Products – 0.4% | ||||||||
Archer-Daniels-Midland Co. | 106,634 | 4,358,132 | ||||||
Bunge Ltd. | 7,615 | 523,759 | ||||||
Ingredion, Inc. | 3,942 | 494,130 | ||||||
|
| |||||||
| 5,376,021 | ||||||||
|
| |||||||
Brewers – 0.1% | ||||||||
Tsingtao Brewery Co., Ltd. – Class H | 256,000 | 1,072,048 | ||||||
|
| |||||||
Distillers & Vintners – 0.1% | ||||||||
Davide Campari-Milano SpA | 117,540 | 941,114 | ||||||
|
| |||||||
Packaged Foods & Meats – 0.3% | ||||||||
Danone SA | 2,181 | 178,255 | ||||||
Mondelez International, Inc. – Class A | 46,604 | 1,930,804 | ||||||
Nestle SA (REG) | 17,422 | 1,465,861 | ||||||
Tyson Foods, Inc. – Class A | 22,000 | 1,604,020 | ||||||
|
| |||||||
| 5,178,940 | ||||||||
|
| |||||||
Soft Drinks – 0.1% | ||||||||
PepsiCo, Inc. | 21,930 | 2,417,344 | ||||||
|
| |||||||
Tobacco – 0.1% | ||||||||
Altria Group, Inc. | 16,715 | 1,073,437 | ||||||
|
| |||||||
| 16,058,904 | ||||||||
|
| |||||||
Transportation – 1.1% | ||||||||
Air Freight & Logistics – 0.2% | ||||||||
FedEx Corp. | 2,906 | 656,204 | ||||||
Kuehne & Nagel International AG (REG) | 10,041 | 1,754,321 | ||||||
|
| |||||||
| 2,410,525 | ||||||||
|
| |||||||
Airlines – 0.0% | ||||||||
International Consolidated Airlines Group SA | 19,574 | 165,218 | ||||||
|
| |||||||
Airport Services – 0.1% | ||||||||
Sydney Airport | 400,260 | 2,180,729 | ||||||
|
| |||||||
Highways & Railtracks – 0.2% | ||||||||
Transurban Group | 271,900 | 2,527,533 | ||||||
|
| |||||||
Railroads – 0.5% | ||||||||
Canadian National Railway Co. (Toronto) | 13,140 | 1,057,331 | ||||||
CSX Corp. | 38,925 | 1,962,988 | ||||||
| 28 | AB ALL MARKET REAL RETURN PORTFOLIO | abfunds.com |
CONSOLIDATED PORTFOLIO OF INVESTMENTS (continued)
| Company | Shares | U.S. $ Value | ||||||
| ||||||||
East Japan Railway Co. | 20,900 | $ | 2,026,874 | |||||
Norfolk Southern Corp. | 11,178 | 1,469,013 | ||||||
|
| |||||||
| 6,516,206 | ||||||||
|
| |||||||
Trucking – 0.1% | ||||||||
Landstar System, Inc. | 16,580 | 1,637,275 | ||||||
|
| |||||||
| 15,437,486 | ||||||||
|
| |||||||
Diversified Financials – 1.0% | ||||||||
Asset Management & Custody Banks – 0.3% | ||||||||
Bank of New York Mellon Corp. (The) | 21,425 | 1,102,316 | ||||||
Intermediate Capital Group PLC | 100,931 | 1,303,257 | ||||||
State Street Corp. | 17,679 | 1,626,468 | ||||||
T. Rowe Price Group, Inc. | 3,099 | 287,897 | ||||||
|
| |||||||
| 4,319,938 | ||||||||
|
| |||||||
Consumer Finance – 0.1% | ||||||||
Discover Financial Services | 29,698 | 1,975,808 | ||||||
|
| |||||||
Diversified Capital Markets – 0.2% | ||||||||
Investec PLC | 115,109 | 787,647 | ||||||
Macquarie Group Ltd. | 17,751 | 1,339,133 | ||||||
|
| |||||||
| 2,126,780 | ||||||||
|
| |||||||
Financial Exchanges & Data – 0.1% | ||||||||
CME Group, Inc. – Class A | 14,975 | 2,054,121 | ||||||
|
| |||||||
Investment Banking & Brokerage – 0.3% | ||||||||
Charles Schwab Corp. (The) | 48,337 | 2,167,431 | ||||||
Goldman Sachs Group, Inc. (The) | 8,273 | 2,006,037 | ||||||
|
| |||||||
| 4,173,468 | ||||||||
|
| |||||||
| 14,650,115 | ||||||||
|
| |||||||
Banks – 1.0% | ||||||||
Diversified Banks – 0.5% | ||||||||
JPMorgan Chase & Co. | 36,845 | 3,706,975 | ||||||
Komercni banka as | 18,251 | 784,587 | ||||||
Swedbank AB – Class A | 70,203 | 1,742,280 | ||||||
Toronto-Dominion Bank (The) | 25,572 | 1,453,725 | ||||||
|
| |||||||
| 7,687,567 | ||||||||
|
| |||||||
Regional Banks – 0.3% | ||||||||
Cullen/Frost Bankers, Inc. | 6,681 | 658,079 | ||||||
First Republic Bank/CA | 18,088 | 1,761,771 | ||||||
SVB Financial Group(b) | 8,158 | 1,788,886 | ||||||
|
| |||||||
| 4,208,736 | ||||||||
|
| |||||||
| abfunds.com | AB ALL MARKET REAL RETURN PORTFOLIO | 29 |
CONSOLIDATED PORTFOLIO OF INVESTMENTS (continued)
| Company | Shares | U.S. $ Value | ||||||
| ||||||||
Thrifts & Mortgage Finance – 0.2% | ||||||||
Aareal Bank AG | 58,010 | $ | 2,411,904 | |||||
|
| |||||||
| 14,308,207 | ||||||||
|
| |||||||
Food & Staples Retailing – 0.8% | ||||||||
Food Distributors – 0.1% | ||||||||
Sysco Corp. | 27,651 | 1,537,949 | ||||||
|
| |||||||
Food Retail – 0.4% | ||||||||
Dairy Farm International Holdings Ltd.(c) | 149,700 | 1,224,350 | ||||||
Kesko Oyj – Class B | 31,958 | 1,632,052 | ||||||
Woolworths Ltd. | 92,511 | 1,833,999 | ||||||
|
| |||||||
| 4,690,401 | ||||||||
|
| |||||||
Hypermarkets & Super Centers – 0.3% | ||||||||
Costco Wholesale Corp. | 11,386 | 1,834,057 | ||||||
Wal-Mart Stores, Inc. | 29,244 | 2,553,293 | ||||||
|
| |||||||
| 4,387,350 | ||||||||
|
| |||||||
| 10,615,700 | ||||||||
|
| |||||||
Retailing – 0.7% |
| |||||||
Apparel Retail – 0.3% |
| |||||||
Ross Stores, Inc. | 30,008 | 1,905,208 | ||||||
Shimamura Co., Ltd. | 4,100 | 456,773 | ||||||
TJX Cos., Inc. (The) | 28,231 | 1,970,524 | ||||||
|
| |||||||
| 4,332,505 | ||||||||
|
| |||||||
Automotive Retail – 0.0% |
| |||||||
USS Co., Ltd. | 16,700 | 337,588 | ||||||
|
| |||||||
General Merchandise Stores – 0.1% |
| |||||||
Dollarama, Inc. | 14,292 | 1,590,942 | ||||||
|
| |||||||
Internet & Direct Marketing Retail – 0.3% |
| |||||||
Amazon.com, Inc.(b) | 1,037 | 1,146,175 | ||||||
Expedia, Inc. | 9,232 | 1,150,861 | ||||||
Liberty Interactive Corp. QVC Group – Class A(b) | 56,227 | 1,277,478 | ||||||
|
| |||||||
| 3,574,514 | ||||||||
|
| |||||||
Specialty Stores – 0.0% |
| |||||||
JD Sports Fashion PLC | 35,850 | 170,268 | ||||||
|
| |||||||
| 10,005,817 | ||||||||
|
| |||||||
Consumer Services – 0.6% |
| |||||||
Casinos & Gaming – 0.1% |
| |||||||
Aristocrat Leisure Ltd. | 104,917 | 1,896,717 | ||||||
|
| |||||||
Hotels, Resorts & Cruise Lines – 0.1% |
| |||||||
Wyndham Worldwide Corp. | 7,771 | 830,331 | ||||||
|
| |||||||
| 30 | AB ALL MARKET REAL RETURN PORTFOLIO | abfunds.com |
CONSOLIDATED PORTFOLIO OF INVESTMENTS (continued)
| Company | Shares | U.S. $ Value | ||||||
| ||||||||
Restaurants – 0.4% |
| |||||||
McDonald’s Corp. | 15,674 | $ | 2,616,147 | |||||
Sodexo SA | 4,558 | 579,882 | ||||||
SSP Group PLC | 251,165 | 1,950,567 | ||||||
|
| |||||||
| 5,146,596 | ||||||||
|
| |||||||
| 7,873,644 | ||||||||
|
| |||||||
Semiconductors & Semiconductor Equipment – 0.5% | ||||||||
Semiconductor Equipment – 0.3% |
| |||||||
Applied Materials, Inc. | 40,307 | 2,274,524 | ||||||
ASML Holding NV | 1,197 | 215,974 | ||||||
KLA-Tencor Corp. | 14,010 | 1,525,549 | ||||||
|
| |||||||
| 4,016,047 | ||||||||
|
| |||||||
Semiconductors – 0.2% |
| |||||||
Maxim Integrated Products, Inc. | 10,866 | 570,900 | ||||||
STMicroelectronics NV | 89,676 | 2,112,250 | ||||||
|
| |||||||
| 2,683,150 | ||||||||
|
| |||||||
| 6,699,197 | ||||||||
|
| |||||||
Health Care Equipment & Services – 0.4% | ||||||||
Health Care Equipment – 0.4% |
| |||||||
Cochlear Ltd. | 14,754 | 1,987,427 | ||||||
Stryker Corp. | 14,369 | 2,225,327 | ||||||
Varian Medical Systems, Inc.(b) | 18,134 | 1,889,382 | ||||||
|
| |||||||
| 6,102,136 | ||||||||
|
| |||||||
Household & Personal Products – 0.4% | ||||||||
Household Products – 0.3% |
| |||||||
Colgate-Palmolive Co. | 28,519 | 2,009,163 | ||||||
Henkel AG & Co. KGaA | 4,466 | 563,266 | ||||||
Procter & Gamble Co. (The) | 13,637 | 1,177,419 | ||||||
|
| |||||||
| 3,749,848 | ||||||||
|
| |||||||
Personal Products – 0.1% |
| |||||||
Hengan International Group Co., Ltd. | 28,500 | 281,049 | ||||||
L’Oreal SA | 1,694 | 377,023 | ||||||
Pola Orbis Holdings, Inc. | 32,500 | 1,035,921 | ||||||
|
| |||||||
| 1,693,993 | ||||||||
|
| |||||||
| 5,443,841 | ||||||||
|
| |||||||
Insurance – 0.4% |
| |||||||
Life & Health Insurance – 0.2% |
| |||||||
CNP Assurances | 61,097 | 1,421,269 | ||||||
Legal & General Group PLC | 149,831 | 531,236 | ||||||
|
| |||||||
| 1,952,505 | ||||||||
|
| |||||||
| abfunds.com | AB ALL MARKET REAL RETURN PORTFOLIO | 31 |
CONSOLIDATED PORTFOLIO OF INVESTMENTS (continued)
| Company | Shares | U.S. $ Value | ||||||
| ||||||||
Multi-line Insurance – 0.0% |
| |||||||
Topdanmark A/S(b) | 4,955 | $ | 203,694 | |||||
|
| |||||||
Property & Casualty Insurance – 0.2% |
| |||||||
Chubb Ltd. | 13,684 | 2,063,821 | ||||||
CNA Financial Corp. | 18,306 | 990,903 | ||||||
|
| |||||||
| 3,054,724 | ||||||||
|
| |||||||
| 5,210,923 | ||||||||
|
| |||||||
Consumer Durables & Apparel – 0.4% | ||||||||
Apparel, Accessories & Luxury Goods – 0.2% | ||||||||
adidas AG | 2,417 | 537,983 | ||||||
Ralph Lauren Corp. | 20,671 | 1,848,608 | ||||||
|
| |||||||
| 2,386,591 | ||||||||
|
| |||||||
Consumer Electronics – 0.0% |
| |||||||
Panasonic Corp. | 41,200 | 622,093 | ||||||
|
| |||||||
Footwear – 0.1% |
| |||||||
ANTA Sports Products Ltd. | 210,000 | 939,301 | ||||||
|
| |||||||
Home Furnishings – 0.0% |
| |||||||
Mohawk Industries, Inc.(b) | 659 | 172,500 | ||||||
|
| |||||||
Homebuilding – 0.1% |
| |||||||
Construtora Tenda SA(b) | 152,600 | 797,683 | ||||||
Corp. GEO SAB de CV Series B(b) | 1,321 | 102 | ||||||
Cyrela Brazil Realty SA Empreendimentos e Participacoes | 32,000 | 125,210 | ||||||
Desarrolladora Homex SAB de CV(b) | 1,590 | 65 | ||||||
MRV Engenharia e Participacoes SA | 32,450 | 125,483 | ||||||
Urbi Desarrollos Urbanos SAB de CV(b) | 172 | 64 | ||||||
|
| |||||||
| 1,048,607 | ||||||||
|
| |||||||
| 5,169,092 | ||||||||
|
| |||||||
Automobiles & Components – 0.4% | ||||||||
Auto Parts & Equipment – 0.2% | ||||||||
Magna International, Inc. (Toronto) – Class A | 35,478 | 1,935,464 | ||||||
|
| |||||||
Automobile Manufacturers – 0.2% |
| |||||||
Nissan Motor Co., Ltd. | 130,100 | 1,265,271 | ||||||
Suzuki Motor Corp. | 35,600 | 1,949,928 | ||||||
|
| |||||||
| 3,215,199 | ||||||||
|
| |||||||
| 5,150,663 | ||||||||
|
| |||||||
| 32 | AB ALL MARKET REAL RETURN PORTFOLIO | abfunds.com |
CONSOLIDATED PORTFOLIO OF INVESTMENTS (continued)
| Company | Shares | U.S. $ Value | ||||||
| ||||||||
Technology Hardware & Equipment – 0.3% | ||||||||
Communications Equipment – 0.2% |
| |||||||
Cisco Systems, Inc. | 79,781 | $ | 2,724,521 | |||||
|
| |||||||
Technology Distributors – 0.1% |
| |||||||
CDW Corp./DE | 27,317 | 1,912,190 | ||||||
|
| |||||||
| 4,636,711 | ||||||||
|
| |||||||
Information Technology – 0.2% | ||||||||
Technology Hardware, Storage & Peripherals – 0.2% | ||||||||
Apple, Inc. | 17,651 | 2,983,725 | ||||||
|
| |||||||
Media – 0.2% | ||||||||
Broadcasting – 0.0% | ||||||||
Nippon Television Holdings, Inc. | 10,000 | 180,506 | ||||||
|
| |||||||
Cable & Satellite – 0.1% |
| |||||||
Eutelsat Communications SA | 30,185 | 756,073 | ||||||
Quebecor, Inc. – Class B | 2,691 | 101,541 | ||||||
|
| |||||||
| 857,614 | ||||||||
|
| |||||||
Movies & Entertainment – 0.1% |
| |||||||
Regal Entertainment Group – Class A | 101,660 | 1,662,141 | ||||||
|
| |||||||
| 2,700,261 | ||||||||
|
| |||||||
Commercial & Professional Services – 0.1% | ||||||||
Diversified Support Services – 0.0% | ||||||||
Cintas Corp. | 1,510 | 225,050 | ||||||
|
| |||||||
Human Resource & Employment Services – 0.1% | ||||||||
Robert Half International, Inc. | 23,363 | 1,209,503 | ||||||
|
| |||||||
Security & Alarm Services – 0.0% | ||||||||
Prosegur Cia de Seguridad SA | 60,516 | 461,823 | ||||||
|
| |||||||
| 1,896,376 | ||||||||
|
| |||||||
Utilities – 0.1% |
| |||||||
Electric Utilities – 0.1% |
| |||||||
Xcel Energy, Inc. | 15,134 | 749,436 | ||||||
|
| |||||||
Gas Utilities – 0.0% |
| |||||||
China Gas Holdings Ltd. | 192,000 | 583,703 | ||||||
|
| |||||||
Multi-Utilities – 0.0% | ||||||||
Consolidated Edison, Inc. | 6,445 | 554,592 | ||||||
|
| |||||||
| 1,887,731 | ||||||||
|
| |||||||
Total Common Stocks | 870,146,860 | |||||||
|
| |||||||
| abfunds.com | AB ALL MARKET REAL RETURN PORTFOLIO | 33 |
CONSOLIDATED PORTFOLIO OF INVESTMENTS (continued)
| Principal Amount (000) | U.S. $ Value | |||||||||||
| ||||||||||||
INFLATION-LINKED SECURITIES – 26.7% | ||||||||||||
Japan – 8.9% |
| |||||||||||
Japanese Government CPI Linked Bond | JPY | 13,425,505 | $ | 124,153,894 | ||||||||
|
| |||||||||||
United States – 17.8% |
| |||||||||||
U.S. Treasury Inflation Index | $ | 63,915 | 63,957,423 | |||||||||
1.125%, 1/15/21 (TIPS)(g) | 60,208 | 62,437,851 | ||||||||||
1.375%, 7/15/18 (TIPS) | 24,064 | 24,432,351 | ||||||||||
1.625%, 1/15/18 (TIPS) | 49,448 | 49,664,586 | ||||||||||
1.875%, 7/15/19 (TIPS) | 19,340 | 20,104,652 | ||||||||||
2.125%, 1/15/19 (TIPS) | 28,663 | 29,469,451 | ||||||||||
|
| |||||||||||
| 250,066,314 | ||||||||||||
|
| |||||||||||
Total Inflation-Linked Securities | 374,220,208 | |||||||||||
|
| |||||||||||
| Shares | ||||||||||||
INVESTMENT COMPANIES – 9.4% | ||||||||||||
Funds and Investment Trusts – 9.4%(h) | ||||||||||||
BB Progressivo II FII | 18,657 | 878,299 | ||||||||||
iShares Global Financials ETF | 209,064 | 14,159,905 | ||||||||||
iShares MSCI Europe Financials ETF(c) | 1,185,066 | 27,434,278 | ||||||||||
iShares MSCI Global Gold Miners ETF | 39,330 | 705,580 | ||||||||||
iShares MSCI Global Metals & Mining Producers ETF(c) | 630,414 | 19,990,428 | ||||||||||
SPDR S&P Dividend ETF | 153,584 | 14,203,448 | ||||||||||
Vanguard Dividend Appreciation ETF(c) | 144,195 | 13,955,192 | ||||||||||
Vanguard Global ex-U.S. Real Estate ETF(c) | 486,271 | 29,010,928 | ||||||||||
Vanguard REIT ETF | 133,097 | 10,940,573 | ||||||||||
|
| |||||||||||
Total Investment Companies | 131,278,631 | |||||||||||
|
| |||||||||||
WARRANTS – 0.0% | ||||||||||||
Real Estate – 0.0% | ||||||||||||
Diversified Real Estate Activities – 0.0% | ||||||||||||
Eastern & Oriental Bhd, expiring 7/21/19(b) | 12,100 | 429 | ||||||||||
|
| |||||||||||
Real Estate Development – 0.0% | ||||||||||||
Supalai Public Co., | 19,325 | 11,983 | ||||||||||
|
| |||||||||||
Total Warrants | 12,412 | |||||||||||
|
| |||||||||||
| 34 | AB ALL MARKET REAL RETURN PORTFOLIO | abfunds.com |
CONSOLIDATED PORTFOLIO OF INVESTMENTS (continued)
| Company | Shares | U.S. $ Value | ||||||||||
|
|
| ||||||||||
SHORT-TERM INVESTMENTS – 1.5% | ||||||||||||
Investment Companies – 1.5% | ||||||||||||
AB Fixed Income Shares, Inc. – Government Money Market Portfolio – Class AB, | 20,771,907 | $ | 20,771,907 | |||||||||
|
| |||||||||||
Total Investments Before Security Lending Collateral for Securities Loaned – 99.6% | 1,396,430,018 | |||||||||||
|
| |||||||||||
INVESTMENTS OF CASH COLLATERAL | ||||||||||||
Investment Companies – 1.1% | ||||||||||||
AB Fixed Income Shares, Inc. – | 15,609,061 | 15,609,061 | ||||||||||
|
| |||||||||||
Total Investments – 100.7% | 1,412,039,079 | |||||||||||
Other assets less liabilities – (0.7)% | (9,167,206 | ) | ||||||||||
|
| |||||||||||
Net Assets – 100.0% | $ | 1,402,871,873 | ||||||||||
|
| |||||||||||
FUTURES (see Note D)
| Description | Number of Contracts | Expiration Month | Notional | Original Value | Value at October 31, 2017 | Unrealized Appreciation/ (Depreciation) | ||||||||||||||||||||||
Purchased Contracts |
| |||||||||||||||||||||||||||
Brent Crude Futures | 242 | January 2018 | USD | 242 | $ | 13,922,700 | $ | 14,747,480 | $ | 824,780 | ||||||||||||||||||
Coffee C Futures | 76 | December 2017 | USD | 2,850 | 3,545,511 | 3,565,349 | 19,838 | |||||||||||||||||||||
Copper Futures | 118 | December 2017 | USD | 2,950 | 9,406,948 | 9,147,950 | (258,998 | ) | ||||||||||||||||||||
Cotton No.2 Futures | 87 | December 2017 | USD | 4,350 | 3,001,127 | 2,974,530 | (26,597 | ) | ||||||||||||||||||||
Gold 100 OZ Futures | 128 | December 2017 | USD | 13 | 16,358,367 | 16,262,400 | (95,967 | ) | ||||||||||||||||||||
KC HRW Wheat Futures | 103 | December 2017 | USD | 515 | 2,228,632 | 2,144,975 | (83,657 | ) | ||||||||||||||||||||
| abfunds.com | AB ALL MARKET REAL RETURN PORTFOLIO | 35 |
CONSOLIDATED PORTFOLIO OF INVESTMENTS (continued)
| Description | Number of Contracts | Expiration Month | Notional | Original Value | Value at October 31, 2017 | Unrealized Appreciation/ (Depreciation) | ||||||||||||||||||||
LME Nickel Futures | 75 | December 2017 | USD | 1 | $ | 5,445,796 | $ | 5,524,875 | $ | 79,079 | ||||||||||||||||
LME Primary Aluminum Futures | 142 | December 2017 | USD | 4 | 7,431,334 | 7,641,375 | 210,041 | |||||||||||||||||||
Natural Gas Futures | 903 | November 2017 | USD | 9,030 | 27,908,344 | 26,150,880 | (1,757,464 | ) | ||||||||||||||||||
NY Harbor ULSD Futures | 173 | November 2017 | USD | 7,266 | 12,840,369 | 13,663,713 | 823,344 | |||||||||||||||||||
Platinum Futures | 176 | January 2018 | USD | 9 | 8,069,901 | 8,092,480 | 22,579 | |||||||||||||||||||
Soybean Futures | 27 | January 2018 | USD | 135 | 1,345,935 | 1,329,413 | (16,522 | ) | ||||||||||||||||||
Soybean Meal Futures | 243 | December 2017 | USD | 24 | 7,590,483 | 7,576,740 | (13,743 | ) | ||||||||||||||||||
Sugar 11 (World) Futures | 524 | February 2018 | USD | 58,688 | 8,578,305 | 8,650,611 | 72,306 | |||||||||||||||||||
Wheat (CBT) Futures | 65 | December 2017 | USD | 325 | 1,419,992 | 1,360,125 | (59,867 | ) | ||||||||||||||||||
Sold Contracts |
| |||||||||||||||||||||||||
10 Yr Japan Bond (OSE) Futures | 53 | December 2017 | JPY | 5,300,000 | 70,414,801 | 70,136,845 | 277,956 | |||||||||||||||||||
10 Yr Mini Japan Government Bond Futures | 144 | December 2017 | JPY | 1,440,000 | 19,130,198 | 19,058,581 | 71,617 | |||||||||||||||||||
Cattle Feeder Futures | 30 | November 2017 | USD | 1,500 | 2,332,053 | 2,391,375 | (59,322 | ) | ||||||||||||||||||
Gasoline RBOB Futures | 28 | November 2017 | USD | 1,176 | 1,942,285 | 2,037,420 | (95,135 | ) | ||||||||||||||||||
Lean Hogs Futures | 199 | December 2017 | USD | 7,960 | 4,990,776 | 5,412,800 | (422,024 | ) | ||||||||||||||||||
Live Cattle Futures | 49 | December 2017 | USD | 1,960 | 2,428,307 | 2,462,250 | (33,943 | ) | ||||||||||||||||||
LME Nickel Futures | 75 | December 2017 | USD | 1 | 4,977,215 | 5,524,875 | (547,660 | ) | ||||||||||||||||||
LME Primary Aluminum Futures | 142 | December 2017 | USD | 4 | 7,600,161 | 7,641,375 | (41,214 | ) | ||||||||||||||||||
| 36 | AB ALL MARKET REAL RETURN PORTFOLIO | abfunds.com |
CONSOLIDATED PORTFOLIO OF INVESTMENTS (continued)
| Description | Number of Contracts | Expiration Month | Notional | Original Value | Value at October 31, 2017 | Unrealized Appreciation/ (Depreciation) | ||||||||||||||||||||||
Palladium Futures | 36 | December 2017 | USD | 4 | $ | 3,416,904 | $ | 3,524,940 | $ | (108,036 | ) | |||||||||||||||||
Soybean Oil Futures | 215 | December 2017 | USD | 12,900 | 4,442,781 | 4,482,750 | (39,969 | ) | ||||||||||||||||||||
U.S. T-Note 5 Yr (CBT) Futures | 103 | December 2017 | USD | 10,300 | 12,173,275 | 12,070,312 | 102,963 | |||||||||||||||||||||
U.S. T-Note 5 Yr (CBT) Futures | 99 | December 2017 | USD | 9,900 | 11,700,516 | 11,601,563 | 98,953 | |||||||||||||||||||||
WTI Crude Futures | 141 | November 2017 | USD | 141 | 7,118,956 | 7,667,580 | (548,624 | ) | ||||||||||||||||||||
|
| |||||||||||||||||||||||||||
| $ | (1,605,286 | ) | ||||||||||||||||||||||||||
|
| |||||||||||||||||||||||||||
FORWARD CURRENCY EXCHANGE CONTRACTS (see Note D)
| Counterparty | Contracts to Deliver (000) | In Exchange For (000) | Settlement Date | Unrealized Appreciation/ (Depreciation) | ||||||||||||||||
Australia and New Zealand Banking Group Ltd. | AUD | 3,584 | USD | 2,788 | 12/18/17 | $ | 46,341 | |||||||||||||
Bank of America, NA | BRL | 61,619 | USD | 19,378 | 11/03/17 | 541,958 | ||||||||||||||
Bank of America, NA | USD | 18,804 | BRL | 61,619 | 11/03/17 | 32,190 | ||||||||||||||
Bank of America, NA | IDR | 1,049,128,165 | USD | 77,387 | 11/16/17 | 92,879 | ||||||||||||||
Bank of America, NA | USD | 34,396 | RUB | 1,986,294 | 11/22/17 | (485,933 | ) | |||||||||||||
Bank of America, NA | USD | 28,381 | TWD | 860,016 | 11/22/17 | 191,250 | ||||||||||||||
Bank of America, NA | BRL | 53,100 | USD | 17,001 | 12/04/17 | 834,846 | ||||||||||||||
Bank of America, NA | PHP | 1,029,557 | USD | 19,855 | 12/13/17 | 4,670 | ||||||||||||||
Bank of America, NA | CHF | 50,592 | USD | 53,456 | 12/18/17 | 2,584,366 | ||||||||||||||
Bank of America, NA | CLP | 3,845,681 | USD | 6,211 | 12/18/17 | 171,905 | ||||||||||||||
Bank of America, NA | CZK | 1,047,676 | USD | 48,514 | 12/18/17 | 819,821 | ||||||||||||||
Bank of America, NA | GBP | 36,383 | USD | 48,191 | 12/18/17 | (198,607 | ) | |||||||||||||
Bank of America, NA | HUF | 4,330,694 | USD | 17,026 | 12/18/17 | 791,549 | ||||||||||||||
Bank of America, NA | PLN | 295,765 | USD | 80,569 | 12/18/17 | (701,107 | ) | |||||||||||||
Bank of America, NA | SEK | 302,833 | USD | 38,416 | 12/18/17 | 2,140,880 | ||||||||||||||
Bank of America, NA | USD | 52,949 | JPY | 5,938,556 | 12/18/17 | (606,509 | ) | |||||||||||||
Bank of America, NA | USD | 30,278 | MXN | 552,486 | 12/18/17 | (1,685,263 | ) | |||||||||||||
Bank of America, NA | USD | 36,700 | NOK | 282,857 | 12/18/17 | (2,029,392 | ) | |||||||||||||
Bank of America, NA | USD | 59,211 | PLN | 209,876 | 12/18/17 | (1,541,272 | ) | |||||||||||||
Bank of America, NA | USD | 21,303 | RUB | 1,230,326 | 12/18/17 | (370,047 | ) | |||||||||||||
Bank of America, NA | USD | 23,915 | TRY | 87,211 | 12/18/17 | (1,239,641 | ) | |||||||||||||
Bank of America, NA | USD | 6,443 | ZAR | 88,908 | 12/18/17 | (204,415 | ) | |||||||||||||
Barclays Bank PLC | CNY | 38,816 | USD | 5,891 | 11/16/17 | 41,770 | ||||||||||||||
Barclays Bank PLC | USD | 40,466 | IDR | 534,148,221 | 11/16/17 | (1,112,853 | ) | |||||||||||||
Barclays Bank PLC | RUB | 934,369 | USD | 16,008 | 11/22/17 | 56,024 | ||||||||||||||
Barclays Bank PLC | TWD | 1,740,300 | USD | 58,316 | 11/22/17 | 499,153 | ||||||||||||||
Barclays Bank PLC | INR | 352,703 | USD | 5,366 | 11/29/17 | (70,143 | ) | |||||||||||||
Barclays Bank PLC | USD | 41,623 | INR | 2,681,913 | 11/29/17 | (284,858 | ) | |||||||||||||
Barclays Bank PLC | GBP | 4,640 | USD | 6,182 | 12/18/17 | 10,325 | ||||||||||||||
Barclays Bank PLC | INR | 24,153 | USD | 374 | 12/18/17 | 2,134 | ||||||||||||||
Barclays Bank PLC | JPY | 13,382,576 | USD | 123,409 | 12/18/17 | 5,454,484 | ||||||||||||||
| abfunds.com | AB ALL MARKET REAL RETURN PORTFOLIO | 37 |
CONSOLIDATED PORTFOLIO OF INVESTMENTS (continued)
| Counterparty | Contracts to Deliver (000) | In Exchange For (000) | Settlement Date | Unrealized Appreciation/ (Depreciation) | ||||||||||||||||
Barclays Bank PLC | MXN | 85,390 | USD | 4,710 | 12/18/17 | $ | 290,957 | |||||||||||||
Barclays Bank PLC | USD | 11,690 | CAD | 14,481 | 12/18/17 | (459,922 | ) | |||||||||||||
Barclays Bank PLC | USD | 4,988 | CNY | 32,960 | 12/18/17 | (35,021 | ) | |||||||||||||
Barclays Bank PLC | USD | 542 | IDR | 7,296,674 | 12/18/17 | (6,031 | ) | |||||||||||||
Barclays Bank PLC | USD | 1,101 | KRW | 1,241,217 | 12/18/17 | 9,378 | ||||||||||||||
Barclays Bank PLC | USD | 3,605 | ZAR | 47,265 | 12/18/17 | (288,804 | ) | |||||||||||||
Barclays Bank PLC | USD | 1,710 | KRW | 1,927,712 | 1/18/18 | 14,620 | ||||||||||||||
BNP Paribas SA | USD | 64,833 | PHP | 3,300,017 | 12/13/17 | (1,207,516 | ) | |||||||||||||
BNP Paribas SA | AUD | 102,030 | USD | 79,584 | 12/18/17 | 1,530,200 | ||||||||||||||
BNP Paribas SA | CAD | 8,529 | USD | 7,032 | 12/18/17 | 417,471 | ||||||||||||||
BNP Paribas SA | EUR | 4,267 | USD | 5,049 | 12/18/17 | 65,099 | ||||||||||||||
BNP Paribas SA | NZD | 88,357 | USD | 62,927 | 12/18/17 | 2,513,815 | ||||||||||||||
BNP Paribas SA | USD | 63,753 | AUD | 78,917 | 12/18/17 | (3,380,794 | ) | |||||||||||||
BNP Paribas SA | USD | 4,288 | HKD | 33,466 | 12/18/17 | 4,795 | ||||||||||||||
BNP Paribas SA | USD | 42,239 | NZD | 58,032 | 12/18/17 | (2,560,512 | ) | |||||||||||||
BNP Paribas SA | ZAR | 481,544 | USD | 36,738 | 12/18/17 | 2,947,457 | ||||||||||||||
Brown Brothers Harriman & Co. | JPY | 361,181 | USD | 3,231 | 12/18/17 | 47,635 | ||||||||||||||
Citibank, NA | USD | 4,096 | IDR | 54,342,934 | 11/16/17 | (92,428 | ) | |||||||||||||
Citibank, NA | USD | 19,599 | RUB | 1,134,197 | 11/22/17 | (236,230 | ) | |||||||||||||
Citibank, NA | ARS | 64,871 | USD | 3,584 | 12/18/17 | 9,318 | ||||||||||||||
Citibank, NA | CNY | 32,960 | USD | 5,015 | 12/18/17 | 61,962 | ||||||||||||||
Citibank, NA | KRW | 4,723,341 | USD | 4,166 | 12/18/17 | (58,786 | ) | |||||||||||||
Citibank, NA | SEK | 342,749 | USD | 43,102 | 12/18/17 | 2,045,417 | ||||||||||||||
Citibank, NA | USD | 49,132 | EUR | 41,418 | 12/18/17 | (759,807 | ) | |||||||||||||
Citibank, NA | USD | 8,616 | NOK | 66,910 | 12/18/17 | (414,598 | ) | |||||||||||||
Citibank, NA | USD | 18,722 | TRY | 65,393 | 12/18/17 | (1,719,034 | ) | |||||||||||||
Citibank, NA | USD | 748 | TWD | 22,320 | 12/18/17 | (5,049 | ) | |||||||||||||
Credit Suisse International | USD | 16,423 | BRL | 52,583 | 12/04/17 | (414,489 | ) | |||||||||||||
Credit Suisse International | PEN | 241,167 | USD | 74,085 | 12/07/17 | 6,258 | ||||||||||||||
Credit Suisse International | NOK | 282,857 | USD | 35,489 | 12/18/17 | 818,163 | ||||||||||||||
Credit Suisse International | USD | 31,295 | SEK | 253,143 | 12/18/17 | (971,381 | ) | |||||||||||||
Deutsche Bank AG | BRL | 61,619 | USD | 18,804 | 11/03/17 | (32,190 | ) | |||||||||||||
Deutsche Bank AG | USD | 18,678 | BRL | 61,619 | 11/03/17 | 158,158 | ||||||||||||||
Deutsche Bank AG | BRL | 61,619 | USD | 18,605 | 12/04/17 | (154,348 | ) | |||||||||||||
Deutsche Bank AG | CLP | 4,506,864 | USD | 7,246 | 12/07/17 | 166,977 | ||||||||||||||
Deutsche Bank AG | COP | 57,735,342 | USD | 19,550 | 12/07/17 | 632,269 | ||||||||||||||
Deutsche Bank AG | CAD | 12,380 | USD | 9,913 | 12/18/17 | 311,996 | ||||||||||||||
Deutsche Bank AG | RUB | 1,456,699 | USD | 25,182 | 12/18/17 | 397,802 | ||||||||||||||
Deutsche Bank AG | USD | 30,557 | CHF | 29,752 | 12/18/17 | (640,396 | ) | |||||||||||||
Goldman Sachs Bank USA | USD | 26,347 | CNY | 175,088 | 11/16/17 | 35,095 | ||||||||||||||
Goldman Sachs Bank USA | USD | 26,525 | CNY | 175,088 | 11/16/17 | (142,525 | ) | |||||||||||||
Goldman Sachs Bank USA | PHP | 2,769,718 | USD | 53,756 | 12/13/17 | 354,556 | ||||||||||||||
Goldman Sachs Bank USA | EUR | 13,461 | USD | 16,147 | 12/18/17 | 425,589 | ||||||||||||||
Goldman Sachs Bank USA | USD | 11,680 | CAD | 14,569 | 12/18/17 | (381,642 | ) | |||||||||||||
Goldman Sachs Bank USA | USD | 33,225 | CZK | 729,374 | 12/18/17 | (21,662 | ) | |||||||||||||
Goldman Sachs Bank USA | USD | 16,474 | JPY | 1,785,708 | 12/18/17 | (734,533 | ) | |||||||||||||
Goldman Sachs Bank USA | USD | 5,960 | NZD | 8,209 | 12/18/17 | (346,878 | ) | |||||||||||||
Goldman Sachs Bank USA | USD | 5,516 | PLN | 19,457 | 12/18/17 | (169,614 | ) | |||||||||||||
HSBC Bank USA | TRY | 10,523 | USD | 2,942 | 12/18/17 | 205,479 | ||||||||||||||
HSBC Bank USA | USD | 18,756 | MXN | 338,529 | 12/18/17 | (1,235,866 | ) | |||||||||||||
| 38 | AB ALL MARKET REAL RETURN PORTFOLIO | abfunds.com |
CONSOLIDATED PORTFOLIO OF INVESTMENTS (continued)
| Counterparty | Contracts to Deliver (000) | In Exchange For (000) | Settlement Date | Unrealized Appreciation/ (Depreciation) | ||||||||||||||||||||
JPMorgan Chase Bank, NA | CNY | 29,481 | USD | 4,475 | 11/16/17 | $ | 32,608 | |||||||||||||||||
JPMorgan Chase Bank, NA | NOK | 109,734 | USD | 13,766 | 12/18/17 | 316,141 | ||||||||||||||||||
JPMorgan Chase Bank, NA | USD | 198 | COP | 584,763 | 12/18/17 | (6,480 | ) | |||||||||||||||||
JPMorgan Chase Bank, NA | USD | 3,092 | KRW | 3,482,124 | 12/18/17 | 23,431 | ||||||||||||||||||
Royal Bank of Scotland PLC | CHF | 2,868 | USD | 2,949 | 12/18/17 | 65,552 | ||||||||||||||||||
Royal Bank of Scotland PLC | SEK | 21,712 | USD | 2,689 | 12/18/17 | 87,797 | ||||||||||||||||||
Royal Bank of Scotland PLC | USD | 697 | CHF | 662 | 12/18/17 | (31,029 | ) | |||||||||||||||||
Royal Bank of Scotland PLC | USD | 7,738 | SGD | 10,455 | 12/18/17 | (64,903 | ) | |||||||||||||||||
Standard Chartered Bank | USD | 8,773 | AUD | 11,023 | 12/18/17 | (340,444 | ) | |||||||||||||||||
State Street Bank & Trust Co. | DKK | 17,920 | USD | 2,892 | 12/18/17 | 79,368 | ||||||||||||||||||
State Street Bank & Trust Co. | GBP | 2,556 | USD | 3,478 | 12/18/17 | 78,434 | ||||||||||||||||||
State Street Bank & Trust Co. | GBP | 2,117 | USD | 2,803 | 12/18/17 | (12,760 | ) | |||||||||||||||||
State Street Bank & Trust Co. | JPY | 495,123 | USD | 4,362 | 12/18/17 | (2,508 | ) | |||||||||||||||||
State Street Bank & Trust Co. | NZD | 58 | USD | 42 | 12/18/17 | 2,103 | ||||||||||||||||||
State Street Bank & Trust Co. | SEK | 12,553 | USD | 1,585 | 12/18/17 | 81,635 | ||||||||||||||||||
State Street Bank & Trust Co. | THB | 1,927,923 | USD | 58,295 | 12/18/17 | 252,209 | ||||||||||||||||||
State Street Bank & Trust Co. | TRY | 5,127 | USD | 1,447 | 12/18/17 | 114,199 | ||||||||||||||||||
State Street Bank & Trust Co. | USD | 1,481 | CAD | 1,861 | 12/18/17 | (38,303 | ) | |||||||||||||||||
State Street Bank & Trust Co. | USD | 3,232 | EUR | 2,728 | 12/18/17 | (45,657 | ) | |||||||||||||||||
State Street Bank & Trust Co. | USD | 98,647 | THB | 3,285,288 | 12/18/17 | 261,070 | ||||||||||||||||||
State Street Bank & Trust Co. | USD | 1,501 | THB | 49,675 | 12/18/17 | (5,016 | ) | |||||||||||||||||
State Street Bank & Trust Co. | USD | 27,533 | KRW | 31,175,471 | 1/18/18 | 360,775 | ||||||||||||||||||
UBS AG | TWD | 203,855 | USD | 6,842 | 11/22/17 | 69,360 | ||||||||||||||||||
UBS AG | GBP | 14,288 | USD | 18,711 | 12/18/17 | (292,031 | ) | |||||||||||||||||
|
| |||||||||||||||||||||||
| $ | 1,772,466 | |||||||||||||||||||||||
|
| |||||||||||||||||||||||
INFLATION (CPI) SWAPS (see Note D)
| Rate Type | ||||||||||||||||||
Swap Counterparty & | Termination Date | Payments made by the Fund | Payments received by the Fund | Payment Frequency Paid/Received | Unrealized Appreciation/ (Depreciation) | |||||||||||||
Citibank, NA | ||||||||||||||||||
USD 57,600 | 10/16/20 | 1.780 | % | CPI | # | Maturity/Maturity | $ | 568,414 | ||||||||||
USD 8,000 | 3/08/21 | 2.200 | % | CPI | # | Maturity/Maturity | (48,975 | ) | ||||||||||
Deutsche Bank AG |
| |||||||||||||||||
USD 66,990 | 3/20/21 | 2.221 | % | CPI | # | Maturity/Maturity | (435,899 | ) | ||||||||||
USD 13,512 | 3/25/25 | 2.205 | % | CPI | # | Maturity/Maturity | (71,517 | ) | ||||||||||
USD 12,679 | 3/25/25 | 2.205 | % | CPI | # | Maturity/Maturity | (67,108 | ) | ||||||||||
USD 31,194 | 3/26/25 | 2.170 | % | CPI | # | Maturity/Maturity | (113,447 | ) | ||||||||||
USD 18,987 | 3/26/25 | 2.195 | % | CPI | # | Maturity/Maturity | (91,416 | ) | ||||||||||
USD 37,880 | 7/30/25 | 2.278 | % | CPI | # | Maturity/Maturity | (303,796 | ) | ||||||||||
JPMorgan Chase Bank, NA | ||||||||||||||||||
USD 76,719 | 3/30/25 | 2.170 | % | CPI | # | Maturity/Maturity | (270,487 | ) | ||||||||||
USD 76,719 | 4/01/25 | 2.170 | % | CPI | # | Maturity/Maturity | (275,942 | ) | ||||||||||
|
| |||||||||||||||||
| $ | (1,110,173 | ) | ||||||||||||||||
|
| |||||||||||||||||
| # | Variable interest rate based on the rate of inflation as determined by the Consumer Price Index (CPI). |
| abfunds.com | AB ALL MARKET REAL RETURN PORTFOLIO | 39 |
CONSOLIDATED PORTFOLIO OF INVESTMENTS (continued)
TOTAL RETURN SWAPS (see Note D)
| Counterparty & Referenced Obligation | # of Shares or Units | Rate Paid/ Received | Payment Frequency | Notional Amount (000) | Maturity Date | Unrealized Appreciation/ (Depreciation) | ||||||||||||||||||
Receive Total Return on Reference Obligation |
| |||||||||||||||||||||||
Barclays Bank PLC | ||||||||||||||||||||||||
Barclays Commodity Hedging Insights 2 Index | 237,123 | 0.02 | % | Quarterly | USD 48,822 | 9/17/18 | $ | (1,594,712 | ) | |||||||||||||||
Barclays Commodity Strategy 1673 | 36,009 | 0.30 | % | Quarterly | USD 18,950 | 9/17/18 | 928,605 | |||||||||||||||||
Credit Suisse International | ||||||||||||||||||||||||
Credit Suisse Custom 139 Excess Return Index | 131,382 | 0.41 | % | Quarterly | USD 35,503 | 9/17/18 | (486,248 | ) | ||||||||||||||||
Goldman Sachs International | ||||||||||||||||||||||||
Goldman Sachs Commodity Trend 10% Volatility Target Excess Return Strategy | 86,275 | 0.00 | % | Quarterly | USD 8,627 | 9/17/18 | 290,747 | |||||||||||||||||
Goldman Sachs Commodity Trend 10% Volatility Target Excess Return Strategy | 45,808 | 0.03 | % | Quarterly | USD 4,600 | 9/17/18 | 134,485 | |||||||||||||||||
JPMorgan Chase Bank, NA | ||||||||||||||||||||||||
Bloomberg Industrial Metals Subindex 3 Month Forward | 408,342 | 0.12 | % | Quarterly | USD 80,495 | 12/15/17 | 4,515,346 | |||||||||||||||||
Bloomberg Petroleum Subindex 3 Month Forward | 188,903 | 0.11 | % | Quarterly | USD 68,179 | 12/15/17 | 5,308,635 | |||||||||||||||||
Bloomberg Precious Metals Subindex 3 Month Forward | 278,075 | 0.11 | % | Quarterly | USD 51,974 | 12/15/17 | (2,361,176 | ) | ||||||||||||||||
Bloomberg Softs Subindex 3 Month Forward | 314,559 | 0.17 | % | Quarterly | USD 26,678 | 12/15/17 | (1,437,225 | ) | ||||||||||||||||
JPMorgan Cross Sectional Momentum R | 109,095 | 0.48 | % | Quarterly | USD 23,500 | 9/17/18 | 622,051 | |||||||||||||||||
JPMorgan Index | 27,571 | 0.60 | % | Quarterly | USD 47,000 | 9/17/18 | (276,050 | ) | ||||||||||||||||
JPMorgan RCI-24 Index | 60,308 | 0.50 | % | Quarterly | USD 16,100 | 9/17/18 | 693,713 | |||||||||||||||||
| 40 | AB ALL MARKET REAL RETURN PORTFOLIO | abfunds.com |
CONSOLIDATED PORTFOLIO OF INVESTMENTS (continued)
| Counterparty & Referenced Obligation | # of Shares or Units | Rate Paid/ Received | Payment Frequency | Notional Amount (000) | Maturity Date | Unrealized Appreciation/ (Depreciation) | ||||||||||||||||||
Morgan Stanley Capital Services LLC | ||||||||||||||||||||||||
Bloomberg Grains Subindex 3 Month Forward | 1,533,616 | 0.15 | % | Quarterly | USD 96,325 | 12/15/17 | $ | (2,375,211 | ) | |||||||||||||||
Bloomberg Livestock Subindex 3 Month Forward | 162,653 | 0.16 | % | Quarterly | USD 23,685 | 12/15/17 | 2,131,521 | |||||||||||||||||
|
| |||||||||||||||||||||||
| $ | 6,094,481 | |||||||||||||||||||||||
|
| |||||||||||||||||||||||
| (a) | Security is exempt from registration under Rule 144A of the Securities Act of 1933. These securities are considered restricted, but liquid and may be resold in transactions exempt from registration, normally to qualified institutional buyers. At October 31, 2017, the aggregate market value of these securities amounted to $7,100,778 or 0.5% of net assets. |
| (b) | Non-income producing security. |
| (c) | Represents entire or partial securities out on loan. See Note E for securities lending information. |
| (d) | Security in which significant unobservable inputs (Level 3) were used in determining fair value. |
| (e) | Fair valued by the Adviser. |
| (f) | Illiquid security. |
| (g) | Position, or a portion thereof, has been segregated to collateralize OTC derivatives outstanding. |
| (h) | To obtain a copy of the fund’s shareholder report, please go to the Securities and Exchange Commission’s website at www.sec.gov. Additionally, shareholder reports for AB funds can be obtained by calling AB at (800) 227-4618. |
| (i) | Affiliated investments. |
| (j) | The rate shown represents the 7-day yield as of period end. |
Currency Abbreviations:
ARS – Argentine Peso AUD – Australian Dollar BRL – Brazilian Real CAD – Canadian Dollar CHF – Swiss Franc CLP – Chilean Peso CNY – Chinese Yuan Renminbi COP – Colombian Peso CZK – Czech Koruna DKK – Danish Krone EUR – Euro GBP – Great British Pound HKD – Hong Kong Dollar HUF – Hungarian Forint IDR – Indonesian Rupiah INR – Indian Rupee | JPY – Japanese Yen KRW – South Korean Won MXN – Mexican Peso NOK – Norwegian Krone NZD – New Zealand Dollar PEN – Peruvian Sol PHP – Philippine Peso PLN – Polish Zloty RUB – Russian Ruble SEK – Swedish Krona SGD – Singapore Dollar THB – Thailand Baht TRY – Turkish Lira TWD – New Taiwan Dollar USD – United States Dollar ZAR – South African Rand |
| abfunds.com | AB ALL MARKET REAL RETURN PORTFOLIO | 41 |
CONSOLIDATED PORTFOLIO OF INVESTMENTS (continued)
Glossary:
ADR – American Depositary Receipt
CBT – Chicago Board of Trade
CPI – Consumer Price Index
ETF – Exchange Traded Fund
GDR – Global Depositary Receipt
KC HRW – Kansas City Hard Red Winter
LME – London Metal Exchange
MSCI – Morgan Stanley Capital International
OSE – Osaka Securities Exchange
PJSC – Public Joint Stock Company
RBOB – Reformulated Gasoline Blend-Stock for Oxygen Blending (Unleaded Gas)
REG – Registered Shares
REIT – Real Estate Investment Trust
SPDR – Standard & Poor’s Depository Receipt
TIPS – Treasury Inflation Protected Security
ULSD – Ultra-Low Sulfur Diesel
WTI – West Texas Intermediate
See notes to consolidated financial statements.
| 42 | AB ALL MARKET REAL RETURN PORTFOLIO | abfunds.com |
CONSOLIDATED STATEMENT OF ASSETS & LIABILITIES
October 31, 2017
| Assets | ||||
Investments in securities, at value | ||||
Unaffiliated issuers (cost $1,311,514,675) | $ | 1,375,658,111 | (a) | |
Affiliated issuers (cost $36,380,968 - including investment of cash collateral for securities loaned of $15,609,061) | 36,380,968 | |||
Cash collateral due from broker | 7,168,392 | |||
Foreign currencies, at value (cost $2,189,730) | 2,174,353 | |||
Unrealized appreciation on forward currency exchange contracts | 29,611,693 | |||
Unrealized appreciation on total return swaps | 14,625,103 | |||
Unaffiliated dividends and interest receivable | 2,049,129 | |||
Receivable for capital stock sold | 1,221,640 | |||
Unrealized appreciation on inflation swaps | 568,414 | |||
Affiliated dividends receivable | 16,475 | |||
Receivable for investment securities sold | 732 | |||
|
| |||
Total assets | 1,469,475,010 | |||
|
| |||
| Liabilities | ||||
Unrealized depreciation on forward currency exchange contracts | 27,839,227 | |||
Payable for collateral received on securities loaned | 15,609,061 | |||
Unrealized depreciation on total return swaps | 8,530,622 | |||
Payable for capital stock redeemed | 4,411,266 | |||
Payable for investment securities purchased and foreign currency transactions | 2,938,014 | |||
Cash collateral due to broker | 2,888,000 | |||
Payable for variation margin on futures | 1,234,164 | |||
Unrealized depreciation on inflation swaps | 1,678,587 | |||
Management fee payable | 848,240 | |||
Distribution fee payable | 138,512 | |||
Transfer Agent fee payable | 24,486 | |||
Administrative fee payable | 22,705 | |||
Directors’ fees payable | 2,433 | |||
Accrued expenses and other liabilities | 437,820 | |||
|
| |||
Total liabilities | 66,603,137 | |||
|
| |||
Net Assets | $ | 1,402,871,873 | ||
|
| |||
| Composition of Net Assets | ||||
Capital stock, at par | $ | 159,376 | ||
Additional paid-in capital | 1,389,348,047 | |||
Undistributed net investment income | 19,437,983 | |||
Accumulated net realized loss on investment and foreign currency transactions | (75,172,595 | ) | ||
Net unrealized appreciation on investments and foreign currency denominated assets and liabilities | 69,099,062 | |||
|
| |||
| $ | 1,402,871,873 | |||
|
|
| (a) | Includes securities on loan with a value of $15,214,109 (see Note E). |
See notes to consolidated financial statements.
| abfunds.com | AB ALL MARKET REAL RETURN PORTFOLIO | 43 |
CONSOLIDATED STATEMENT OF ASSETS & LIABILITIES (continued)
Net Asset Value Per Share—33 billion shares of capital stock authorized, $.001 par value
| Class | Net Assets | Shares Outstanding | Net Asset Value | |||||||||
| ||||||||||||
| A | $ | 11,819,011 | 1,327,254 | $ | 8.90 | * | ||||||
| ||||||||||||
| C | $ | 1,801,181 | 203,872 | $ | 8.83 | |||||||
| ||||||||||||
| Advisor | $ | 27,669,950 | 3,113,323 | $ | 8.89 | |||||||
| ||||||||||||
| R | $ | 239,397 | 27,240 | $ | 8.79 | |||||||
| ||||||||||||
| K | $ | 2,264,684 | 257,289 | $ | 8.80 | |||||||
| ||||||||||||
| I | $ | 16,753,020 | 1,896,360 | $ | 8.83 | |||||||
| ||||||||||||
| 1 | $ | 649,420,559 | 74,107,525 | $ | 8.76 | |||||||
| ||||||||||||
| 2 | $ | 8,962 | 1,000 | $ | 8.96 | |||||||
| ||||||||||||
| Z | $ | 692,895,109 | 78,441,950 | $ | 8.83 | |||||||
| ||||||||||||
| * | The maximum offering price per share for Class A shares was $9.30 which reflects a sales charge of 4.25%. |
See notes to consolidated financial statements.
| 44 | AB ALL MARKET REAL RETURN PORTFOLIO | abfunds.com |
CONSOLIDATED STATEMENT OF OPERATIONS
Year Ended October 31, 2017
| Investment Income | ||||||||
Dividends | ||||||||
Unaffiliated issuers (net of foreign taxes withheld of $1,130,210) | $ | 22,659,530 | ||||||
Affiliated issuers | 317,485 | |||||||
Interest (net of foreign taxes withheld of $10,440) | 2,976,719 | |||||||
Securities lending income | 131,519 | |||||||
Other income | 71 | $ | 26,085,324 | |||||
|
| |||||||
| Expenses | ||||||||
Management fee (see Note B) | 8,262,424 | |||||||
Distribution fee—Class A | 31,057 | |||||||
Distribution fee—Class C | 22,784 | |||||||
Distribution fee—Class R | 1,061 | |||||||
Distribution fee—Class K | 5,302 | |||||||
Distribution fee—Class 1 | 1,467,698 | |||||||
Transfer agency—Class A | 23,212 | |||||||
Transfer agency—Class C | 4,317 | |||||||
Transfer agency—Advisor Class | 51,558 | |||||||
Transfer agency—Class R | 553 | |||||||
Transfer agency—Class K | 4,266 | |||||||
Transfer agency—Class I | 3,460 | |||||||
Transfer agency—Class 1 | 81,618 | |||||||
Transfer agency—Class 2 | 1 | |||||||
Transfer agency—Class Z | 95,674 | |||||||
Custodian | 242,184 | |||||||
Registration fees | 147,527 | |||||||
Audit and tax | 131,152 | |||||||
Legal | 82,679 | |||||||
Printing | 70,053 | |||||||
Administrative | 64,763 | |||||||
Directors’ fees | 28,080 | |||||||
Miscellaneous | 72,177 | |||||||
|
| |||||||
Total expenses | 10,893,600 | |||||||
Less: expenses waived and reimbursed by the Adviser (see Notes B & E) | (93,317 | ) | ||||||
|
| |||||||
Net expenses | 10,800,283 | |||||||
|
| |||||||
Net investment income | 15,285,041 | |||||||
|
|
See notes to consolidated financial statements.
| abfunds.com | AB ALL MARKET REAL RETURN PORTFOLIO | 45 |
CONSOLIDATED STATEMENT OF OPERATIONS (continued)
| Realized and Unrealized Gain (Loss) on Investment and Foreign Currency Transactions | ||||||||
Net realized gain (loss) on: | ||||||||
Investment transactions | 17,125,244 | (a) | ||||||
Forward currency exchange contracts | 6,445,867 | |||||||
Futures | (4,011,497 | ) | ||||||
Options written | 832,953 | |||||||
Swaps | 872,142 | |||||||
Foreign currency transactions | (1,339,258 | ) | ||||||
Net change in unrealized appreciation/depreciation of: | ||||||||
Investments | 54,699,921 | (b) | ||||||
Forward currency exchange contracts | (420,263 | ) | ||||||
Futures | (1,319,413 | ) | ||||||
Options written | 38,443 | |||||||
Swaps | 10,277,474 | |||||||
Foreign currency denominated assets and liabilities | 3,476 | |||||||
|
| |||||||
Net gain on investment and foreign currency transactions | 83,205,089 | |||||||
|
| |||||||
Contributions from Affiliates (see Note B) | 8,946 | |||||||
|
| |||||||
Net Increase in Net Assets from Operations | $ | 98,499,076 | ||||||
|
|
| (a) | Net of foreign capital gains taxes of $85,653. |
| (b) | Net of increase in accrued foreign capital gains taxes of $3,373. |
See notes to consolidated financial statements.
| 46 | AB ALL MARKET REAL RETURN PORTFOLIO | abfunds.com |
CONSOLIDATED STATEMENT OF CHANGES IN NET ASSETS
| Year Ended October 31, 2017 | Year Ended October 31, 2016 | |||||||
| Increase (Decrease) in Net Assets from Operations | ||||||||
Net investment income | $ | 15,285,041 | $ | 7,482,380 | ||||
Net realized gain (loss) on investment and foreign currency transactions | 19,925,451 | (51,636,906 | ) | |||||
Net change in unrealized appreciation/depreciation of investments and foreign currency denominated assets and liabilities | 63,279,638 | 63,149,061 | ||||||
Contributions from Affiliates (see Note B) | 8,946 | 4,556 | ||||||
|
|
|
| |||||
Net increase in net assets from operations | 98,499,076 | 18,999,091 | ||||||
| Dividends to Shareholders from | ||||||||
Net investment income | ||||||||
Class A | (309,690 | ) | (174,718 | ) | ||||
Class C | (38,521 | ) | (11,593 | ) | ||||
Advisor Class | (632,286 | ) | (479,187 | ) | ||||
Class R | (4,502 | ) | (1,815 | ) | ||||
Class K | (47,782 | ) | (27,392 | ) | ||||
Class I | (435,380 | ) | (300,575 | ) | ||||
Class 1 | (12,411,895 | ) | (8,849,158 | ) | ||||
Class 2 | (227 | ) | (172 | ) | ||||
Class Z | (224,457 | ) | (162,962 | ) | ||||
| Capital Stock Transactions | ||||||||
Net increase | 745,154,738 | 18,834,778 | ||||||
|
|
|
| |||||
Total increase | 829,549,074 | 27,826,297 | ||||||
| Net Assets | ||||||||
Beginning of period | 573,322,799 | 545,496,502 | ||||||
|
|
|
| |||||
End of period (including undistributed net investment income of $19,437,983 and $7,325,715, respectively) | $ | 1,402,871,873 | $ | 573,322,799 | ||||
|
|
|
| |||||
See notes to consolidated financial statements.
| abfunds.com | AB ALL MARKET REAL RETURN PORTFOLIO | 47 |
NOTES TO CONSOLIDATED FINANCIAL STATEMENTS
October 31, 2017
NOTE A
Significant Accounting Policies
AB Bond Fund, Inc. (the “Company”) is registered under the Investment Company Act of 1940 as an open-end management investment company. The Company, which is a Maryland corporation, operates as a series company comprised of eleven portfolios currently in operation. Each portfolio is considered to be a separate entity for financial reporting and tax purposes. This report relates only to the AB All Market Real Return Portfolio (the “Portfolio”), a non-diversified portfolio. As part of the Portfolio’s investment strategy, the Portfolio seeks to gain exposure to commodities and commodities-related instruments and derivatives primarily through investments in AllianceBernstein Cayman Inflation Strategy, Ltd., a wholly-owned subsidiary of the Portfolio organized under the laws of the Cayman Islands (the “Subsidiary”). The Portfolio is the sole shareholder of the Subsidiary and it is intended that the Portfolio will remain the sole shareholder and will continue to control the Subsidiary. Under the Articles of Association of the Subsidiary, shares issued by the Subsidiary confer upon a shareholder the right to receive notice of, to attend and to vote at general meetings of the Subsidiary and shall confer upon the shareholder rights in a winding-up or repayment of capital and the right to participate in the profits or assets of the Subsidiary. As of October 31, 2017, consolidated net assets of the Portfolio were $1,402,871,873, of which $151,436,114, or 11%, represented the Portfolio’s ownership of all issued shares and voting rights of the Subsidiary. This report presents the consolidated financial statements of AB All Market Real Return Portfolio and the Subsidiary. All intercompany transactions and balances have been eliminated in consolidation. The Portfolio has authorized the issuance of Class A, Class B, Class C, Advisor Class, Class R, Class K, Class I, Class 1, Class 2, Class Z and Class T shares. Class B and Class T shares have not been issued. Class 1 shares are sold only to the private clients of Sanford C. Bernstein & Co. LLC by its registered representatives. As of October 31, 2017, AllianceBernstein L.P. (the “Adviser”), was the sole shareholder of Class 2 shares. Class A shares are sold with a front-end sales charge of up to 4.25% for purchases not exceeding $1,000,000. With respect to purchases of $1,000,000 or more, Class A shares redeemed within one year of purchase may be subject to a contingent deferred sales charge of 1%. Class C shares are subject to a contingent deferred sales charge of 1% on redemptions made within the first year after purchase and 0% after the first year of purchase. Effective April 10, 2017, Class C shares will automatically convert to Class A shares ten years after the end of the calendar month of purchase. Class R, Class K, Class 1, and Class Z shares are sold without an initial or contingent deferred sales charge. Advisor Class, Class I, and Class 2 shares are sold without an initial or contingent deferred sales charge and are not subject to ongoing distribution expenses. All eleven classes of shares have identical
| 48 | AB ALL MARKET REAL RETURN PORTFOLIO | abfunds.com |
NOTES TO CONSOLIDATED FINANCIAL STATEMENTS (continued)
voting, dividend, liquidation and other rights, except that the classes bear different distribution and transfer agency expenses. Each class has exclusive voting rights with respect to its distribution plan. The consolidated financial statements have been prepared in conformity with U.S. generally accepted accounting principles (“U.S. GAAP”) which require management to make certain estimates and assumptions that affect the reported amounts of assets and liabilities in the consolidated financial statements and amounts of income and expenses during the reporting period. Actual results could differ from those estimates. The Portfolio is an investment company under U.S. GAAP and follows the accounting and reporting guidance applicable to investment companies. The following is a summary of significant accounting policies followed by the Portfolio.
1. Security Valuation
Portfolio securities are valued at their current market value determined on the basis of market quotations or, if market quotations are not readily available or are deemed unreliable, at “fair value” as determined in accordance with procedures established by and under the general supervision of the Company’s Board of Directors (the “Board”).
In general, the market values of securities which are readily available and deemed reliable are determined as follows: securities listed on a national securities exchange (other than securities listed on the NASDAQ Stock Market, Inc. (“NASDAQ”)) or on a foreign securities exchange are valued at the last sale price at the close of the exchange or foreign securities exchange. If there has been no sale on such day, the securities are valued at the last traded price from the previous day. Securities listed on more than one exchange are valued by reference to the principal exchange on which the securities are traded; securities listed only on NASDAQ are valued in accordance with the NASDAQ Official Closing Price; listed or over the counter (“OTC”) market put or call options are valued at the mid level between the current bid and ask prices. If either a current bid or current ask price is unavailable, the Adviser will have discretion to determine the best valuation (e.g., last trade price in the case of listed options); open futures are valued using the closing settlement price or, in the absence of such a price, the most recent quoted bid price. If there are no quotations available for the day of valuation, the last available closing settlement price is used; U.S. Government securities and any other debt instruments having 60 days or less remaining until maturity are generally valued at market by an independent pricing vendor, if a market price is available. If a market price is not available, the securities are valued at amortized cost. This methodology is commonly used for short term securities that have an original maturity of 60 days or less, as well as short term securities that had an original term to maturity that exceeded 60 days. In instances when amortized cost is utilized, the Valuation Committee (the “Committee”) must
| abfunds.com | AB ALL MARKET REAL RETURN PORTFOLIO | 49 |
NOTES TO CONSOLIDATED FINANCIAL STATEMENTS (continued)
reasonably conclude that the utilization of amortized cost is approximately the same as the fair value of the security. Such factors the Committee will consider include, but are not limited to, an impairment of the creditworthiness of the issuer or material changes in interest rates. Fixed-income securities, including mortgage-backed and asset-backed securities, may be valued on the basis of prices provided by a pricing service or at a price obtained from one or more of the major broker-dealers. In cases where broker-dealer quotes are obtained, the Adviser may establish procedures whereby changes in market yields or spreads are used to adjust, on a daily basis, a recently obtained quoted price on a security. Swaps and other derivatives are valued daily, primarily using independent pricing services, independent pricing models using market inputs, as well as third party broker-dealers or counterparties. Open end mutual funds are valued at the closing net asset value per share, while exchange traded funds are valued at the closing market price per share.
Securities for which market quotations are not readily available (including restricted securities) or are deemed unreliable are valued at fair value as deemed appropriate by the Adviser. Factors considered in making this determination may include, but are not limited to, information obtained by contacting the issuer, analysts, analysis of the issuer’s financial statements or other available documents. In addition, the Portfolio may use fair value pricing for securities primarily traded in non-U.S. markets because most foreign markets close well before the Portfolio values its securities at 4:00 p.m., Eastern Time. The earlier close of these foreign markets gives rise to the possibility that significant events, including broad market moves, may have occurred in the interim and may materially affect the value of those securities. To account for this, the Portfolio generally values many of its foreign equity securities using fair value prices based on third party vendor modeling tools to the extent available.
2. Fair Value Measurements
In accordance with U.S. GAAP regarding fair value measurements, fair value is defined as the price that the Portfolio would receive to sell an asset or pay to transfer a liability in an orderly transaction between market participants at the measurement date. U.S. GAAP establishes a framework for measuring fair value, and a three-level hierarchy for fair value measurements based upon the transparency of inputs to the valuation of an asset or liability (including those valued based on their market values as described in Note A.1 above). Inputs may be observable or unobservable and refer broadly to the assumptions that market participants would use in pricing the asset or liability. Observable inputs reflect the assumptions market participants would use in pricing the asset or liability based on market data obtained from sources independent of the Portfolio. Unobservable inputs reflect the Portfolio’s own assumptions about the
| 50 | AB ALL MARKET REAL RETURN PORTFOLIO | abfunds.com |
NOTES TO CONSOLIDATED FINANCIAL STATEMENTS (continued)
assumptions that market participants would use in pricing the asset or liability based on the best information available in the circumstances. Each investment is assigned a level based upon the observability of the inputs which are significant to the overall valuation. The three-tier hierarchy of inputs is summarized below.
| • | Level 1—quoted prices in active markets for identical investments |
| • | Level 2—other significant observable inputs (including quoted prices for similar investments, interest rates, prepayment speeds, credit risk, etc.) |
| • | Level 3—significant unobservable inputs (including the Portfolio’s own assumptions in determining the fair value of investments) |
The fair value of debt instruments, such as bonds, and over-the-counter derivatives is generally based on market price quotations, recently executed market transactions (where observable) or industry recognized modeling techniques and are generally classified as Level 2. Pricing vendor inputs to Level 2 valuations may include quoted prices for similar investments in active markets, interest rate curves, coupon rates, currency rates, yield curves, option adjusted spreads, default rates, credit spreads and other unique security features in order to estimate the relevant cash flows which are then discounted to calculate fair values. If these inputs are unobservable and significant to the fair value, these investments will be classified as Level 3. In addition, non-agency rated investments are classified as Level 3.
Where readily available market prices or relevant bid prices are not available for certain equity investments, such investments may be valued based on similar publicly traded investments, movements in relevant indices since last available prices or based upon underlying company fundamentals and comparable company data (such as multiples to earnings or other multiples to equity). Where an investment is valued using an observable input, such as another publicly traded security, the investment will be classified as Level 2. If management determines that an adjustment is appropriate based on restrictions on resale, illiquidity or uncertainty, and such adjustment is a significant component of the valuation, the investment will be classified as Level 3. An investment will also be classified as Level 3 where management uses company fundamentals and other significant inputs to determine the valuation.
Options are valued using market-based inputs to models, broker or dealer quotations, or alternative pricing sources with reasonable levels of price transparency, where such inputs and models are available. Alternatively the values may be obtained through unobservable management determined inputs and/or management’s proprietary models. Where models are used, the selection of a particular model to value an option
| abfunds.com | AB ALL MARKET REAL RETURN PORTFOLIO | 51 |
NOTES TO CONSOLIDATED FINANCIAL STATEMENTS (continued)
depends upon the contractual terms of, and specific risks inherent in, the option as well as the availability of pricing information in the market. Valuation models require a variety of inputs, including contractual terms, market prices, measures of volatility and correlations of such inputs. Exchange traded options generally will be classified as Level 2. For options that do not trade on exchange but trade in liquid markets, inputs can generally be verified and model selection does not involve significant management judgment. Options are classified within Level 2 on the fair value hierarchy when all of the significant inputs can be corroborated to market evidence. Otherwise such instruments are classified as Level 3.
Other fixed income investments, including non-U.S. government and corporate debt, are generally valued using quoted market prices, if available, which are typically impacted by current interest rates, maturity dates and any perceived credit risk of the issuer. Additionally, in the absence of quoted market prices, these inputs are used by pricing vendors to derive a valuation based upon industry or proprietary models which incorporate issuer specific data with relevant yield/spread comparisons with more widely quoted bonds with similar key characteristics. Those investments for which there are observable inputs are classified as Level 2. Where the inputs are not observable, the investments are classified as Level 3.
The following table summarizes the valuation of the Portfolio’s investments by the above fair value hierarchy levels as of October 31, 2017:
Investments in Securities: | Level 1 | Level 2 | Level 3 | Total | ||||||||||||
Assets: | ||||||||||||||||
Common Stocks: | ||||||||||||||||
Real Estate | $ | 208,007,396 | $ | 116,762,137 | $ | – 0 | – | $ | 324,769,533 | |||||||
Energy | 124,883,819 | 121,372,130 | – 0 | – | 246,255,949 | |||||||||||
Materials | 49,632,274 | 57,646,094 | – 0 | –(a) | 107,278,368 | |||||||||||
Software & Services | 12,079,338 | 6,742,895 | – 0 | – | 18,822,233 | |||||||||||
Pharmaceuticals & Biotechnology | 8,358,114 | 10,261,191 | – 0 | – | 18,619,305 | |||||||||||
Capital Goods | 10,519,735 | 7,051,208 | – 0 | – | 17,570,943 | |||||||||||
Food Beverage & Tobacco | 12,401,626 | 3,657,278 | – 0 | – | 16,058,904 | |||||||||||
Transportation | 6,782,811 | 8,654,675 | – 0 | – | 15,437,486 | |||||||||||
Diversified Financials | 11,220,078 | 3,430,037 | – 0 | – | 14,650,115 | |||||||||||
Banks | 10,154,023 | 4,154,184 | – 0 | – | 14,308,207 | |||||||||||
Food & Staples Retailing | 5,925,299 | 4,690,401 | – 0 | – | 10,615,700 | |||||||||||
Retailing | 9,211,456 | 794,361 | – 0 | – | 10,005,817 | |||||||||||
Consumer Services | 3,446,478 | 4,427,166 | – 0 | – | 7,873,644 | |||||||||||
Semiconductors & Semiconductor Equipment | 4,370,973 | 2,328,224 | – 0 | – | 6,699,197 | |||||||||||
Health Care Equipment & Services | 4,114,709 | 1,987,427 | – 0 | – | 6,102,136 | |||||||||||
Household & Personal Products | 3,186,582 | 2,257,259 | – 0 | – | 5,443,841 | |||||||||||
| 52 | AB ALL MARKET REAL RETURN PORTFOLIO | abfunds.com |
NOTES TO CONSOLIDATED FINANCIAL STATEMENTS (continued)
Investments in Securities: | Level 1 | Level 2 | Level 3 | Total | ||||||||||||
Insurance | $ | 3,054,724 | $ | 2,156,199 | $ | – 0 | – | $ | 5,210,923 | |||||||
Consumer Durables & Apparel | 3,069,715 | 2,099,377 | – 0 | – | 5,169,092 | |||||||||||
Automobiles & Components | 1,935,464 | 3,215,199 | – 0 | – | 5,150,663 | |||||||||||
Technology Hardware & Equipment | 4,636,711 | – 0 | – | – 0 | – | 4,636,711 | ||||||||||
Information Technology | 2,983,725 | – 0 | – | – 0 | – | 2,983,725 | ||||||||||
Media | 1,763,682 | 936,579 | – 0 | – | 2,700,261 | |||||||||||
Commercial & Professional Services | 1,434,553 | 461,823 | – 0 | – | 1,896,376 | |||||||||||
Utilities | 1,304,028 | 583,703 | – 0 | – | 1,887,731 | |||||||||||
Inflation-Linked Securities | – 0 | – | 374,220,208 | – 0 | – | 374,220,208 | ||||||||||
Investment Companies | 131,278,631 | – 0 | – | – 0 | – | 131,278,631 | ||||||||||
Warrants | 429 | – 0 | – | 11,983 | 12,412 | |||||||||||
Short-Term Investments | 20,771,907 | – 0 | – | – 0 | – | 20,771,907 | ||||||||||
Investments of Cash Collateral for Securities Loaned in Affiliated Money Market Fund | 15,609,061 | – 0 | – | – 0 | – | 15,609,061 | ||||||||||
|
|
|
|
|
|
|
| |||||||||
Total Investments in Securities | 672,137,341 | 739,889,755 | 11,983 | 1,412,039,079 | ||||||||||||
Other Financial Instruments(b): | ||||||||||||||||
Assets: | ||||||||||||||||
Futures | 2,603,456 | – 0 | – | – 0 | – | 2,603,456 | (c) | |||||||||
Forward Currency Exchange Contracts | – 0 | – | 29,611,693 | – 0 | – | 29,611,693 | ||||||||||
Inflation (CPI) Swaps | – 0 | – | 568,414 | – 0 | – | 568,414 | ||||||||||
Total Return Swaps | – 0 | – | 14,625,103 | – 0 | – | 14,625,103 | ||||||||||
Liabilities: | ||||||||||||||||
Futures | (4,208,742 | ) | – 0 | – | – 0 | – | (4,208,742 | )(c) | ||||||||
Forward Currency Exchange Contracts | – 0 | – | (27,839,227 | ) | – 0 | – | (27,839,227 | ) | ||||||||
Inflation (CPI) Swaps | – 0 | – | (1,678,587 | ) | – 0 | – | (1,678,587 | ) | ||||||||
Total Return Swaps | – 0 | – | (8,530,622 | ) | – 0 | – | (8,530,622 | ) | ||||||||
|
|
|
|
|
|
|
| |||||||||
Total(d) | $ | 670,532,055 | $ | 746,646,529 | $ | 11,983 | $ | 1,417,190,567 | ||||||||
|
|
|
|
|
|
|
| |||||||||
| (a) | The Portfolio held securities with zero market value at period end. |
| (b) | Other financial instruments are derivative instruments, such as futures, forwards and swaps, which are valued at the unrealized appreciation/(depreciation) on the instrument. Other financial instruments may also include swaps with upfront premiums, options written and swaptions which are valued at market value |
| (c) | Only variation margin receivable/(payable) at period end is reported within the statement of assets and liabilities. This amount reflects cumulative unrealized appreciation/(depreciation) of exchange-traded derivatives as reported in the portfolio of investments. Exchange-traded swaps with upfront premiums are presented here as market value. |
| (d) | There were de minimis transfers under 1% of net assets between Level 1 and Level 2 during the reporting period. |
The Portfolio recognizes all transfers between levels of the fair value hierarchy assuming the financial instruments were transferred at the beginning of the reporting period.
| abfunds.com | AB ALL MARKET REAL RETURN PORTFOLIO | 53 |
NOTES TO CONSOLIDATED FINANCIAL STATEMENTS (continued)
The following is a reconciliation of investments in which significant unobservable inputs (Level 3) were used in determining fair value.
| Common Stocks - Real Estate | Common Stocks - Materials(a) | Warrants | ||||||||||
Balance as of 10/31/16 | $ | – 0 | – | $ | – 0 | – | $ | – 0 | – | |||
Accrued discounts/(premiums) | – 0 | – | – 0 | – | – 0 | – | ||||||
Realized gain (loss) | (29,321 | ) | – 0 | – | – 0 | – | ||||||
Change in unrealized appreciation/depreciation | 166,363 | – 0 | – | 2,499 | ||||||||
Purchases | 313,672 | – 0 | – | 9,484 | ||||||||
Sales | (597,067 | ) | – 0 | – | – 0 | – | ||||||
Reclassification | 146,353 | – 0 | – | – 0 | – | |||||||
Transfers in to Level 3 | – 0 | – | – 0 | – | – 0 | – | ||||||
Transfers out of Level 3 | – 0 | – | – 0 | – | – 0 | – | ||||||
|
|
|
|
|
| |||||||
Balance as of 10/31/17 | $ | – 0 | – | $ | – 0 | – | $ | 11,983 | ||||
|
|
|
|
|
| |||||||
Net change in unrealized appreciation/depreciation from investments held as of 10/31/17(b) | $ | – 0 | – | $ | – 0 | – | $ | 2,499 | ||||
|
|
|
|
|
| |||||||
| Common Stocks - Equity: Other | Total | |||||||||||
Balance as of 10/31/16 | $ | 146,353 | $ | 146,353 | ||||||||
Accrued discounts/(premiums) | – 0 | – | – 0 | – | ||||||||
Realized gain (loss) | – 0 | – | (29,321 | ) | ||||||||
Change in unrealized appreciation/depreciation | – 0 | – | 168,862 | |||||||||
Purchases | – 0 | – | 323,156 | |||||||||
Sales | – 0 | – | (597,067 | ) | ||||||||
Reclassification | (146,353 | ) | – 0 | – | ||||||||
Transfers in to Level 3 | – 0 | – | – 0 | – | ||||||||
Transfers out of Level 3 | – 0 | – | – 0 | – | ||||||||
|
|
|
| |||||||||
Balance as of 10/31/17 | $ | – 0 | – | $ | 11,983 | |||||||
|
|
|
| |||||||||
Net change in unrealized appreciation/depreciation from investments held as of 10/31/17(b) | $ | – 0 | – | $ | 2,499 | |||||||
|
|
|
| |||||||||
| (a) | The Portfolio held securities with zero market value at period end. |
| (b) | The unrealized appreciation/(depreciation) is included in net change in unrealized appreciation/(depreciation) on investments and other financial instruments in the accompanying statement of operations. |
The Adviser established the Committee to oversee the pricing and valuation of all securities held in the Portfolio. The Committee operates under pricing and valuation policies and procedures established by the Adviser and approved by the Board, including pricing policies which set forth the mechanisms and processes to be employed on a daily basis to implement these policies and procedures. In particular, the pricing policies describe how to determine market quotations for securities and other instruments.
| 54 | AB ALL MARKET REAL RETURN PORTFOLIO | abfunds.com |
NOTES TO CONSOLIDATED FINANCIAL STATEMENTS (continued)
The Committee’s responsibilities include: 1) fair value and liquidity determinations (and oversight of any third parties to whom any responsibility for fair value and liquidity determinations is delegated), and 2) regular monitoring of the Adviser’s pricing and valuation policies and procedures and modification or enhancement of these policies and procedures (or recommendation of the modification of these policies and procedures) as the Committee believes appropriate.
The Committee is also responsible for monitoring the implementation of the pricing policies by the Adviser’s Pricing Group (the “Pricing Group”) and any third party which performs certain pricing functions in accordance with the pricing policies. The Pricing Group is responsible for the oversight of the third party on a day-to-day basis. The Committee and the Pricing Group perform a series of activities to provide reasonable assurance of the accuracy of prices including: 1) periodic vendor due diligence meetings, review of methodologies, new developments and processes at vendors, 2) daily comparison of security valuation versus prior day for all securities that exceeded established thresholds, and 3) daily review of unpriced, stale, and variance reports with exceptions reviewed by senior management and the Committee.
In addition, several processes outside of the pricing process are used to monitor valuation issues including: 1) performance and performance attribution reports are monitored for anomalous impacts based upon benchmark performance, and 2) portfolio managers review all portfolios for performance and analytics (which are generated using the Adviser’s prices).
3. Currency Translation
Assets and liabilities denominated in foreign currencies and commitments under forward currency exchange contracts are translated into U.S. dollars at the mean of the quoted bid and ask prices of such currencies against the U.S. dollar. Purchases and sales of portfolio securities are translated into U.S. dollars at the rates of exchange prevailing when such securities were acquired or sold. Income and expenses are translated into U.S. dollars at rates of exchange prevailing when accrued.
Net realized gain or loss on foreign currency transactions represents foreign exchange gains and losses from sales and maturities of foreign fixed income investments, holding of foreign currencies, currency gains or losses realized between the trade and settlement dates on foreign investment transactions, and the difference between the amounts of dividends, interest and foreign withholding taxes recorded on the Portfolio’s books and the U.S. dollar equivalent amounts actually received or paid. Net unrealized currency gains and losses from valuing foreign currency denominated
| abfunds.com | AB ALL MARKET REAL RETURN PORTFOLIO | 55 |
NOTES TO CONSOLIDATED FINANCIAL STATEMENTS (continued)
assets and liabilities at period end exchange rates are reflected as a component of net unrealized appreciation or depreciation of foreign currency denominated assets and liabilities.
4. Taxes
It is the Portfolio’s policy to meet the requirements of the Internal Revenue Code applicable to regulated investment companies and to distribute all of its investment company taxable income and net realized gains, if any, to shareholders. Therefore, no provisions for federal income or excise taxes are required. The Portfolio may be subject to taxes imposed by countries in which it invests. Such taxes are generally based on income and/or capital gains earned or repatriated. Taxes are accrued and applied to net investment income, net realized gains and net unrealized appreciation/depreciation as such income and/or gains are earned.
If, during a taxable year, the Subsidiary’s taxable losses (and other deductible items) exceed its income and gains, the net loss will not pass through to the Portfolio as a deductible amount for Federal income tax purposes. Note that the loss from the Subsidiary’s contemplated activities also cannot be carried forward to reduce future Subsidiary’s income in subsequent years. However, if the Subsidiary’s taxable gains exceed its losses and other deductible items during a taxable year, the net gain will pass through to the Portfolio as income for Federal income tax purposes.
In accordance with U.S. GAAP requirements regarding accounting for uncertainties in income taxes, management has analyzed the Portfolio’s tax positions taken or expected to be taken on federal and state income tax returns for all open tax years (the current and the prior three tax years) and has concluded that no provision for income tax is required in the Portfolio’s consolidated financial statements.
5. Investment Income and Investment Transactions
Dividend income is recorded on the ex-dividend date or as soon as the Portfolio is informed of the dividend. Interest income is accrued daily. Investment transactions are accounted for on the date the securities are purchased or sold. Investment gains or losses are determined on the identified cost basis. The Portfolio amortizes premiums and accretes discounts as adjustments to interest income.
6. Class Allocations
All income earned and expenses incurred by the Portfolio are borne on a pro-rata basis by each outstanding class of shares, based on the proportionate interest in the Portfolio represented by the net assets of such class, except for class specific expenses which are allocated to the respective class. Expenses of the Company are charged proportionately to each portfolio or
| 56 | AB ALL MARKET REAL RETURN PORTFOLIO | abfunds.com |
NOTES TO CONSOLIDATED FINANCIAL STATEMENTS (continued)
based on other appropriate methods. Realized and unrealized gains and losses are allocated among the various share classes based on respective net assets.
7. Dividends and Distributions
Dividends and distributions to shareholders, if any, are recorded on the ex-dividend date. Income dividends and capital gains distributions are determined in accordance with federal tax regulations and may differ from those determined in accordance with U.S. GAAP. To the extent these differences are permanent, such amounts are reclassified within the capital accounts based on their federal tax basis treatment; temporary differences do not require such reclassification.
NOTE B
Management Fee and Other Transactions with Affiliates
Under the terms of the investment advisory agreement, the Portfolio pays the Adviser a management fee at an annual rate of .75% of the Portfolio’s average daily net assets. The Adviser agreed to waive its fees and bear certain expenses to the extent necessary to limit total operating expenses on an annual basis (the “Expense Caps”) to 1.30%, 2.05%, 1.05%, 1.55%, 1.30%, 1.05%, 1.30%, 1.05% and 1.05% of daily average net assets for Class A, Class C, Advisor Class, Class R, Class K, Class I, Class 1, Class 2 and Class Z shares, respectively. Effective January 29, 2016 the Expense Caps were increased from 2.00% to 2.05%, 1.00% to 1.05%, 1.50% to 1.55%, 1.25% to 1.30%, 1.00% to 1.05%, 1.25% to 1.30%, 1.00% to 1.05% and 1.00% to 1.05% of the daily average net assets for the Class C, Advisor Class, Class R, Class K, Class I, Class 1, Class 2 and Class Z shares, respectively. This fee waiver and/or expense reimbursement agreement will remain in effect until January 31, 2018. For the year ended October 31, 2017, such reimbursement amounted to $107.
The Subsidiary has entered into a separate agreement with the Adviser for the management of the Subsidiary’s portfolio. The Adviser receives no compensation from the Subsidiary for its services under the agreement.
During the year ended October 31, 2017 and the year October 31, 2016, the Adviser reimbursed the Portfolio $8,946 and $4,556, respectively, for trading losses incurred due to a trade entry error.
Pursuant to the investment advisory agreement, the Portfolio may reimburse the Adviser for certain legal and accounting services provided to the Portfolio by the Adviser. For the year ended October 31, 2017, the reimbursement for such services amounted to $64,763.
| abfunds.com | AB ALL MARKET REAL RETURN PORTFOLIO | 57 |
NOTES TO CONSOLIDATED FINANCIAL STATEMENTS (continued)
The Portfolio compensates AllianceBernstein Investor Services, Inc. (“ABIS”), a wholly-owned subsidiary of the Adviser, under a Transfer Agency Agreement for providing personnel and facilities to perform transfer agency services for the Portfolio. ABIS may make payments to intermediaries that provide omnibus account services, sub-accounting services and/or networking services. Such compensation retained by ABIS amounted to $191,363 for the year ended October 31, 2017.
AllianceBernstein Investments, Inc. (the “Distributor”), a wholly-owned subsidiary of the Adviser, serves as the distributor of the Portfolio’s shares. The Distributor has advised the Portfolio that it has retained front-end sales charges of $110 from the sale of Class A shares and received $0 and $74 in contingent deferred sales charges imposed upon redemptions by shareholders of Class A and Class C shares, respectively, for the year ended October 31, 2017.
The Portfolio may invest in AB Government Money Market Portfolio (the “Government Money Market Portfolio”) which has a contractual annual advisory fee rate of .20% of the portfolio’s average daily net assets and bears its own expenses. In connection with the investment by the Portfolio in the Government Money Market Portfolio, the Adviser has contractually agreed to waive its advisory fee from the Portfolio in an amount equal to the Portfolio’s pro rata share of the effective advisory fees of Government Money Market Portfolio, as borne indirectly by the Portfolio as an acquired fund fee and expense. For the year ended October 31, 2017, such waiver amounted to $77,693.
A summary of the Portfolio’s transactions in AB mutual funds for the year ended October 31, 2017 is as follows:
Fund | Market Value 10/31/16 (000) | Purchases at Cost (000) | Sales Proceeds (000) | Market Value 10/31/17 (000) | Dividend Income (000) | |||||||||||||||
Government Money Market Portfolio | $ | 26,406 | $ | 802,636 | $ | 808,270 | $ | 20,772 | $ | 233 | ||||||||||
Government Money Market Portfolio* | – 0 | – | 245,147 | 229,538 | 15,609 | 84 | ||||||||||||||
|
|
|
| |||||||||||||||||
Total | $ | 36,381 | $ | 317 | ||||||||||||||||
|
|
|
| |||||||||||||||||
| * | Investments of cash collateral for securities lending transactions (see Note E). |
Brokerage commissions paid on investment transactions for the year ended October 31, 2017 amounted to $1,136,979, of which $0 and $0, respectively, was paid to Sanford C. Bernstein & Co. LLC and Sanford C. Bernstein Limited, affiliates of the Adviser.
| 58 | AB ALL MARKET REAL RETURN PORTFOLIO | abfunds.com |
NOTES TO CONSOLIDATED FINANCIAL STATEMENTS (continued)
NOTE C
Distribution Services Agreement
The Portfolio has adopted a Distribution Services Agreement (the “Agreement”) pursuant to Rule 12b-1 under the Investment Company Act of 1940. Under the Agreement, the Portfolio pays distribution and servicing fees to AllianceBernstein Investments, Inc. (the “Distributor”) at an annual rate of up to .30% of the Portfolio’s average daily net assets attributable to Class A shares, 1% of the Portfolio’s average daily net assets attributable to Class C shares. .50% of the Portfolio’s average daily net assets attributable to Class R shares, .25% of the Portfolio’s average daily net assets attributable to Class K shares and .25% of the Portfolio’s average daily net assets attributable to Class 1 shares. There are no distribution and servicing fees on the Advisor Class, Class I, Class 2 and Class Z shares. Effective January 29, 2016, payments under the Plan were limited to .25% of Class A shares’ average daily net assets. The fees are accrued daily and paid monthly. The Agreement provides that the Distributor will use such payments in their entirety for distribution assistance and promotional activities. Since the commencement of the Portfolio’s operations, the Distributor has incurred expenses in excess of the distribution costs reimbursed by the Portfolio in the amounts of $156,577, $15,354, $18,718 and $1,650,688 for Class C, Class R, Class K and Class 1 shares, respectively. While such costs may be recovered from the Portfolio in future periods so long as the Agreement is in effect, the rate of the distribution and servicing fees payable under the Agreement may not be increased without a shareholder vote. In accordance with the Agreement, there is no provision for recovery of unreimbursed distribution costs incurred by the Distributor beyond the current fiscal year for Class A shares. The Agreement also provides that the Adviser may use its own resources to finance the distribution of the Portfolio’s shares.
NOTE D
Investment Transactions
Purchases and sales of investment securities (excluding short-term investments) for the year ended October 31, 2017 were as follows:
| Purchases | Sales | |||||||
Investment securities (excluding | $ | 1,800,700,043 | $ | 1,160,596,091 | ||||
U.S. government securities | 221,944,990 | 97,912,508 | ||||||
| abfunds.com | AB ALL MARKET REAL RETURN PORTFOLIO | 59 |
NOTES TO CONSOLIDATED FINANCIAL STATEMENTS (continued)
The cost of investments for federal income tax purposes, gross unrealized appreciation and unrealized depreciation are as follows:
Cost | $ | 1,509,608,794 | ||
|
| |||
Gross unrealized appreciation | $ | 80,788,331 | ||
Gross unrealized depreciation | (168,275,054 | ) | ||
|
| |||
Net unrealized depreciation | $ | (87,486,723 | ) | |
|
|
1. Derivative Financial Instruments
The Portfolio may use derivatives in an effort to earn income and enhance returns, to replace more traditional direct investments, to obtain exposure to otherwise inaccessible markets (collectively, “investment purposes”), or to hedge or adjust the risk profile of its portfolio.
The principal types of derivatives utilized by the Portfolio, as well as the methods in which they may be used are:
| • | Futures |
The Portfolio may buy or sell futures for investment purposes or for the purpose of hedging its portfolio against adverse effects of potential movements in the market. The Portfolio bears the market risk that arises from changes in the value of these instruments and the imperfect correlation between movements in the price of the futures and movements in the price of the assets, reference rates or indices which they are designed to track. Among other things, the Portfolio may purchase or sell futures for foreign currencies or options thereon for non-hedging purposes as a means of making direct investment in foreign currencies, as described below under “Currency Transactions”.
At the time the Portfolio enters into futures, the Portfolio deposits and maintains as collateral an initial margin with the broker, as required by the exchange on which the transaction is effected. Such amount is shown as cash collateral due from broker on the consolidated statement of assets and liabilities. Pursuant to the contract, the Portfolio agrees to receive from or pay to the broker an amount of cash equal to the daily fluctuation in the value of the contract. Such receipts or payments are known as variation margin and are recorded by the Portfolio as unrealized gains or losses. Risks may arise from the potential inability of a counterparty to meet the terms of the contract. The credit/counterparty risk for exchange-traded futures is generally less than privately negotiated futures, since the clearinghouse, which is the issuer or counterparty to each exchange-traded future, has robust risk mitigation standards, including the requirement to provide initial and variation margin. When the contract is closed, the Portfolio records a realized gain or loss equal to the difference between the value of the contract at the time it was opened and the time it was closed.
| 60 | AB ALL MARKET REAL RETURN PORTFOLIO | abfunds.com |
NOTES TO CONSOLIDATED FINANCIAL STATEMENTS (continued)
Use of long futures subjects the Portfolio to risk of loss in excess of the amounts shown on the consolidated statement of assets and liabilities, up to the notional value of the futures. Use of short futures subjects the Portfolio to unlimited risk of loss. Under some circumstances, futures exchanges may establish daily limits on the amount that the price of futures can vary from the previous day’s settlement price, which could effectively prevent liquidation of unfavorable positions.
During the year ended October 31, 2017, the Portfolio held futures for hedging and non-hedging purposes.
| • | Forward Currency Exchange Contracts |
The Portfolio may enter into forward currency exchange contracts in order to hedge its exposure to changes in foreign currency exchange rates on its foreign portfolio holdings, to hedge certain firm purchase and sale commitments denominated in foreign currencies and for non-hedging purposes as a means of making direct investments in foreign currencies, as described below under “Currency Transactions”.
A forward currency exchange contract is a commitment to purchase or sell a foreign currency at a future date at a negotiated forward rate. The gain or loss arising from the difference between the original contract and the closing of such contract would be included in net realized gain or loss on forward currency exchange contracts. Fluctuations in the value of open forward currency exchange contracts are recorded for financial reporting purposes as unrealized appreciation and/or depreciation by the Portfolio. Risks may arise from the potential inability of a counterparty to meet the terms of a contract and from unanticipated movements in the value of a foreign currency relative to the U.S. dollar.
During the year ended October 31, 2017, the Portfolio held forward currency exchange contracts for hedging and non-hedging purposes.
| • | Option Transactions |
For hedging and investment purposes, the Portfolio may purchase and write (sell) put and call options on U.S. and foreign securities, including government securities, and foreign currencies that are traded on U.S. and foreign securities exchanges and over-the-counter markets. Among other things, the Portfolio may use options transactions for non-hedging purposes as a means of making direct investments in foreign currencies, as described below under “Currency Transactions” and may use options strategies involving the purchase and/or writing of various combinations of call and/or put options, for hedging and investment purposes.
| abfunds.com | AB ALL MARKET REAL RETURN PORTFOLIO | 61 |
NOTES TO CONSOLIDATED FINANCIAL STATEMENTS (continued)
The risk associated with purchasing an option is that the Portfolio pays a premium whether or not the option is exercised. Additionally, the Portfolio bears the risk of loss of the premium and change in market value should the counterparty not perform under the contract. If a put or call option purchased by the Portfolio were permitted to expire without being sold or exercised, its premium would represent a loss to the Portfolio. Put and call options purchased are accounted for in the same manner as portfolio securities. The cost of securities acquired through the exercise of call options is increased by premiums paid. The proceeds from securities sold through the exercise of put options are decreased by the premiums paid.
When the Portfolio writes an option, the premium received by the Portfolio is recorded as a liability and is subsequently adjusted to the current market value of the option written. Premiums received from written options which expire unexercised are recorded by the Portfolio on the expiration date as realized gains from options written. The difference between the premium received and the amount paid on effecting a closing purchase transaction, including brokerage commissions, is also treated as a realized gain, or if the premium received is less than the amount paid for the closing purchase transaction, as a realized loss. If a call option is exercised, the premium received is added to the proceeds from the sale of the underlying security or currency in determining whether the Portfolio has realized a gain or loss. If a put option is exercised, the premium received reduces the cost basis of the security or currency purchased by the Portfolio. In writing an option, the Portfolio bears the market risk of an unfavorable change in the price of the security or currency underlying the written option. Exercise of an option written by the Portfolio could result in the Portfolio selling or buying a security or currency at a price different from the current market value.
During the year ended October 31, 2017, the Portfolio held purchased options for hedging and non-hedging purposes.
During the year ended October 31, 2017, the Portfolio held written options for hedging and non-hedging purposes.
| • | Swaps |
The Portfolio may enter into swaps to hedge its exposure to interest rates, credit risk, equity markets or currencies. The Portfolio may also enter into swaps for non-hedging purposes as a means of gaining market exposures, making direct investments in foreign currencies, as described below under “Currency Transactions” or in order to take a “long” or “short” position with respect to an underlying referenced asset described below under “Total Return Swaps”. A swap is an
| 62 | AB ALL MARKET REAL RETURN PORTFOLIO | abfunds.com |
NOTES TO CONSOLIDATED FINANCIAL STATEMENTS (continued)
agreement that obligates two parties to exchange a series of cash flows at specified intervals based upon or calculated by reference to changes in specified prices or rates for a specified amount of an underlying asset. The payment flows are usually netted against each other, with the difference being paid by one party to the other. In addition, collateral may be pledged or received by the Portfolio in accordance with the terms of the respective swaps to provide value and recourse to the Portfolio or its counterparties in the event of default, bankruptcy or insolvency by one of the parties to the swap.
Risks may arise as a result of the failure of the counterparty to the swap to comply with the terms of the swap. The loss incurred by the failure of a counterparty is generally limited to the net interim payment to be received by the Portfolio, and/or the termination value at the end of the contract. Therefore, the Portfolio considers the creditworthiness of each counterparty to a swap in evaluating potential counterparty risk. This risk is mitigated by having a netting arrangement between the Portfolio and the counterparty and by the posting of collateral by the counterparty to the Portfolio to cover the Portfolio’s exposure to the counterparty. Additionally, risks may arise from unanticipated movements in interest rates or in the value of the underlying securities. The Portfolio accrues for the interim payments on swaps on a daily basis, with the net amount recorded within unrealized appreciation/depreciation of swaps on the consolidated statement of assets and liabilities, where applicable. Once the interim payments are settled in cash, the net amount is recorded as realized gain/(loss) on swaps on the consolidated statement of operations, in addition to any realized gain/(loss) recorded upon the termination of swaps. Upfront premiums paid or received are recognized as cost or proceeds on the consolidated statement of assets and liabilities and are amortized on a straight line basis over the life of the contract. Amortized upfront premiums are included in net realized gain/(loss) from swaps on the consolidated statement of operations. Fluctuations in the value of swaps are recorded as a component of net change in unrealized appreciation/depreciation of swaps on the consolidated statement of operations.
Inflation (CPI) Swaps:
Inflation swap agreements are contracts in which one party agrees to pay the cumulative percentage increase in a price index (the Consumer Price Index with respect to CPI swaps) over the term of the swap (with some lag on the inflation index), and the other pays a compounded fixed rate. Inflation swaps may be used to protect the net asset value (“NAV”) of a Portfolio against an unexpected change in the rate of inflation measured by an inflation index since the value of these agreements is expected to increase if there are unexpected inflation increases.
| abfunds.com | AB ALL MARKET REAL RETURN PORTFOLIO | 63 |
NOTES TO CONSOLIDATED FINANCIAL STATEMENTS (continued)
During the year ended October 31, 2017, the Portfolio held inflation (CPI) swaps for hedging and non-hedging purposes.
Total Return Swaps:
The Portfolio may enter into total return swaps in order to take a “long” or “short” position with respect to an underlying referenced asset. The Portfolio is subject to market price volatility of the underlying referenced asset. A total return swap involves commitments to pay interest in exchange for a market linked return based on a notional amount. To the extent that the total return of the security, group of securities or index underlying the transaction exceeds or falls short of the offsetting interest obligation, the Portfolio will receive a payment from or make a payment to the counterparty.
During the year ended October 31, 2017, the Portfolio held total return swaps for hedging and non-hedging purposes.
The Portfolio typically enters into International Swaps and Derivatives Association, Inc. Master Agreements (“ISDA Master Agreement”) with its OTC derivative contract counterparties in order to, among other things, reduce its credit risk to OTC counterparties. ISDA Master Agreements include provisions for general obligations, representations, collateral and events of default or termination. Under an ISDA Master Agreement, the Portfolio typically may offset with the OTC counterparty certain derivative financial instruments’ payables and/or receivables with collateral held and/or posted and create one single net payment (close-out netting) in the event of default or termination. In the event of a default by an OTC counterparty, the return of collateral with market value in excess of the Portfolio’s net liability, held by the defaulting party, may be delayed or denied.
The Portfolio’s ISDA Master Agreements may contain provisions for early termination of OTC derivative transactions in the event the net assets of the Portfolio decline below specific levels (“net asset contingent features”). If these levels are triggered, the Portfolio’s OTC counterparty has the right to terminate such transaction and require the Portfolio to pay or receive a settlement amount in connection with the terminated transaction. For additional details, please refer to netting arrangements by the OTC counterparty tables below.
| 64 | AB ALL MARKET REAL RETURN PORTFOLIO | abfunds.com |
NOTES TO CONSOLIDATED FINANCIAL STATEMENTS (continued)
During the year ended October 31, 2017, the Portfolio had entered into the following derivatives:
| Asset Derivatives | Liability Derivatives | |||||||||||
Derivative Type | Consolidated Statement of Assets and Liabilities Location | Fair Value | Consolidated Statement of Assets and Liabilities Location | Fair Value | ||||||||
Interest rate contracts | Receivable/ Payable for variation margin on futures | $ | 551,489 | * | ||||||||
Commodity contracts | Receivable/ Payable for variation margin on futures | 2,051,967 | * | Receivable/ Payable for variation margin on futures | $ | 4,208,742 | * | |||||
Foreign exchange contracts | Unrealized |
| 29,611,693 |
| Unrealized |
| 27,839,227 |
| ||||
Interest rate contracts | Unrealized appreciation on inflation swaps | 568,414 | Unrealized depreciation on inflation swaps | 1,678,587 | ||||||||
Commodity contracts | Unrealized appreciation on total return swaps | 14,625,103 | Unrealized depreciation on total return swaps | 8,530,622 | ||||||||
|
|
|
| |||||||||
Total | $ | 47,408,666 | $ | 42,257,178 | ||||||||
|
|
|
| |||||||||
| * | Only variation margin receivable/payable at period end is reported within the consolidated statement of assets and liabilities. This amount reflects cumulative appreciation/(depreciation) of exchange-traded derivatives as reported in the consolidated portfolio of investments. |
| abfunds.com | AB ALL MARKET REAL RETURN PORTFOLIO | 65 |
NOTES TO CONSOLIDATED FINANCIAL STATEMENTS (continued)
Derivative Type | Location of | Realized Gain or (Loss) on Derivatives | Change in Unrealized Appreciation or (Depreciation) | |||||||
Interest rate contracts | Net realized gain (loss) on futures; Net change in unrealized appreciation/depreciation of futures | $ | (283,252 | ) | $ | 493,078 | ||||
Equity contracts | Net realized gain (loss) on futures; Net change in unrealized appreciation/depreciation of futures | (291,871 | ) | (47,497 | ) | |||||
Commodity contracts | Net realized gain (loss) on futures; Net change in unrealized appreciation/depreciation of futures | (3,436,374 | ) | (1,764,994 | ) | |||||
Foreign exchange contracts | Net realized gain (loss) on forward currency exchange contracts; Net change in unrealized appreciation/depreciation of forward currency exchange contracts | 6,445,867 | (420,263 | ) | ||||||
Equity contracts | Net realized gain (loss) on investment transactions; Net change in unrealized appreciation/depreciation of investments | (298,875 | ) | 250,320 | ||||||
Equity contracts | Net realized gain (loss) on options written; Net change in unrealized appreciation/depreciation of options written | 832,953 | 38,443 | |||||||
Interest rate contracts | Net realized gain (loss) on swaps; Net change in unrealized appreciation/depreciation of swaps | (2,286,587 | ) | 1,485,200 | ||||||
Commodity contracts | Net realized gain (loss) on swaps; Net change in unrealized appreciation/depreciation of swaps | 3,158,729 | 8,792,274 | |||||||
|
|
|
| |||||||
Total | $ | 3,840,590 | $ | 8,826,561 | ||||||
|
|
|
| |||||||
| 66 | AB ALL MARKET REAL RETURN PORTFOLIO | abfunds.com |
NOTES TO CONSOLIDATED FINANCIAL STATEMENTS (continued)
The following table represents the average monthly volume of the Portfolio’s derivative transactions during the year ended October 31, 2017:
Futures: | ||||
Average original value of buy contracts | $ | 137,982,543 | ||
Average original value of sale contracts | $ | 98,337,698 | ||
Forward Currency Exchange Contracts: | ||||
Average principal amount of buy contracts | $ | 734,032,585 | ||
Average principal amount of sale contracts | $ | 861,299,705 | ||
Purchased Options: | ||||
Average monthly cost | $ | 367,829 | (a) | |
Options Written: | ||||
Average notional amount | $ | 660,275 | (a) | |
Inflation Swaps: | ||||
Average notional amount | $ | 479,089,231 | ||
Total Return Swaps: | ||||
Average notional amount | $ | 345,828,748 |
| (a) | Positions were open for three months during the year. |
For financial reporting purposes, the Portfolio does not offset derivative assets and derivative liabilities that are subject to netting arrangements in the consolidated statement of assets and liabilities.
All OTC derivatives held at period end were subject to netting arrangements. The following table presents the Portfolio’s derivative assets and liabilities by OTC counterparty net of amounts available for offset under ISDA Master Agreements and net of the related collateral received/pledged by the Portfolio as of October 31, 2017. Exchange-traded derivatives are not subject to netting arrangements and as such are excluded from the table.
| abfunds.com | AB ALL MARKET REAL RETURN PORTFOLIO | 67 |
NOTES TO CONSOLIDATED FINANCIAL STATEMENTS (continued)
All Market Real Return Portfolio
Counterparty | Derivative Assets Subject to a MA | Derivative Available for Offset | Cash Collateral Received* | Security Collateral Received* | Net Amount of Derivatives Assets | |||||||||||||||
OTC Derivatives: | ||||||||||||||||||||
Australia and New Zealand Banking Group Ltd. | $ | 46,341 | $ | – 0 | – | $ | – 0 | – | $ | – 0 | – | $ | 46,341 | |||||||
Bank of America, NA | 8,206,314 | (8,206,314 | ) | – 0 | – | – 0 | – | – 0 | – | |||||||||||
Barclays Bank PLC | 6,378,845 | (2,257,632 | ) | – 0 | – | – 0 | – | 4,121,213 | ||||||||||||
BNP Paribas SA | 7,478,837 | (7,148,822 | ) | – 0 | – | – 0 | – | 330,015 | ||||||||||||
Brown Brothers Harriman & Co. | 47,635 | – 0 | – | – 0 | – | – 0 | – | 47,635 | ||||||||||||
Citibank, NA | 2,685,111 | (2,685,111 | ) | – 0 | – | – 0 | – | – 0 | – | |||||||||||
Credit Suisse International | 824,421 | (824,421 | ) | – 0 | – | – 0 | – | – 0 | – | |||||||||||
Deutsche Bank AG | 1,667,202 | (1,667,202 | ) | – 0 | – | – 0 | – | – 0 | – | |||||||||||
Goldman Sachs Bank USA | 815,240 | (815,240 | ) | – 0 | – | – 0 | – | – 0 | – | |||||||||||
HSBC Bank USA | 205,479 | (205,479 | ) | – 0 | – | – 0 | – | – 0 | – | |||||||||||
JPMorgan Chase Bank, NA | 372,180 | (372,180 | ) | – 0 | – | – 0 | – | – 0 | – | |||||||||||
Royal Bank of Scotland PLC | 153,349 | (95,932 | ) | – 0 | – | – 0 | – | 57,417 | ||||||||||||
State Street Bank & Trust Co. | 1,229,793 | (104,244 | ) | – 0 | – | – 0 | – | 1,125,549 | ||||||||||||
UBS AG | 69,360 | (69,360 | ) | – 0 | – | – 0 | – | – 0 | – | |||||||||||
|
|
|
|
|
|
|
|
|
| |||||||||||
Total | $ | 30,180,107 | $ | (24,451,937 | ) | $ | – 0 | – | $ | – 0 | – | $ | 5,728,170 | ^ | ||||||
|
|
|
|
|
|
|
|
|
| |||||||||||
Counterparty | Derivative Liabilities Subject to a MA | Derivative Available for Offset | Cash Collateral Pledged* | Security Collateral Pledged* | Net Amount of Derivatives Liabilities | |||||||||||||||
OTC Derivatives: |
| |||||||||||||||||||
Bank of America, NA | $ | 9,062,186 | $ | (8,206,314 | ) | $ | – 0 | – | $ | – 0 | – | $ | 855,872 | |||||||
Barclays Bank PLC | 2,257,632 | (2,257,632 | ) | – 0 | – | – 0 | – | – 0 | – | |||||||||||
BNP Paribas SA | 7,148,822 | (7,148,822 | ) | – 0 | – | – 0 | – | – 0 | – | |||||||||||
Citibank, NA | 3,334,907 | (2,685,111 | ) | – 0 | – | – 0 | – | 649,796 | ||||||||||||
Credit Suisse International | 1,385,870 | (824,421 | ) | – 0 | – | (499,642 | ) | 61,807 | ||||||||||||
Deutsche Bank AG | 1,910,117 | (1,667,202 | ) | – 0 | – | (144,977 | ) | 97,938 | ||||||||||||
Goldman Sachs Bank USA | 1,796,854 | (815,240 | ) | – 0 | – | – 0 | – | 981,614 | ||||||||||||
HSBC Bank USA | 1,235,866 | (205,479 | ) | – 0 | – | – 0 | – | 1,030,387 | ||||||||||||
JPMorgan Chase Bank, NA | 552,909 | (372,180 | ) | – 0 | – | (180,729 | ) | – 0 | – | |||||||||||
Royal Bank of Scotland PLC | 95,932 | (95,932 | ) | – 0 | – | – 0 | – | – 0 | – | |||||||||||
Standard Chartered Bank | 340,444 | – 0 | – | – 0 | – | – 0 | – | 340,444 | ||||||||||||
State Street Bank & Trust Co. | 104,244 | (104,244 | ) | – 0 | – | – 0 | – | – 0 | – | |||||||||||
UBS AG | 292,031 | (69,360 | ) | – 0 | – | – 0 | – | 222,671 | ||||||||||||
|
|
|
|
|
|
|
|
|
| |||||||||||
Total | $ | 29,517,814 | $ | (24,451,937 | ) | $ | – 0 | – | $ | (825,348 | ) | $ | 4,240,529 | ^ | ||||||
|
|
|
|
|
|
|
|
|
| |||||||||||
| 68 | AB ALL MARKET REAL RETURN PORTFOLIO | abfunds.com |
NOTES TO CONSOLIDATED FINANCIAL STATEMENTS (continued)
AllianceBernstein Cayman Inflation Strategy, Ltd.
Counterparty | Derivative Assets Subject to a MA | Derivative Available for Offset | Cash Collateral Received* | Security Collateral Received* | Net Amount of Derivatives Assets | |||||||||||||||
OTC Derivatives: | ||||||||||||||||||||
Barclays Bank PLC | $ | 928,605 | $ | (928,605 | ) | $ | – 0 | – | $ | – 0 | – | $ | – 0 | – | ||||||
Goldman Sachs International | 425,232 | – 0 | – | (368,000 | ) | – 0 | – | 57,232 | ||||||||||||
JPMorgan Chase Bank, NA | 11,139,745 | (4,074,451 | ) | – 0 | – | – 0 | – | 7,065,294 | ||||||||||||
Morgan Stanley Capital Services LLC | 2,131,521 | (2,131,521 | ) | – 0 | – | – 0 | – | – 0 | – | |||||||||||
|
|
|
|
|
|
|
|
|
| |||||||||||
Total | $ | 14,625,103 | $ | (7,134,577 | ) | $ | (368,000 | ) | $ | – 0 | – | $ | 7,122,526 | ^ | ||||||
|
|
|
|
|
|
|
|
|
| |||||||||||
Counterparty | Derivative Liabilities Subject to a MA | Derivative Available for Offset | Cash Collateral Pledged* | Security Collateral Pledged* | Net Amount of Derivatives Liabilities | |||||||||||||||
OTC Derivatives: |
| |||||||||||||||||||
Barclays Bank PLC | $ | 1,594,712 | $ | (928,605 | ) | $ | – 0 | – | $ | (300,634 | ) | $ | 365,473 | |||||||
Credit Suisse International | 486,248 | – 0 | – | – 0 | – | (486,248 | ) | – 0 | – | |||||||||||
JPMorgan Chase Bank, NA | 4,074,451 | (4,074,451 | ) | – 0 | – | – 0 | – | – 0 | – | |||||||||||
Morgan Stanley Capital Services LLC | 2,375,211 | (2,131,521 | ) | – 0 | – | – 0 | – | 243,690 | ||||||||||||
|
|
|
|
|
|
|
|
|
| |||||||||||
Total | $ | 8,530,622 | $ | (7,134,577 | ) | $ | – 0 | – | $ | (786,882 | ) | $ | 609,163 | ^ | ||||||
|
|
|
|
|
|
|
|
|
| |||||||||||
| * | The actual collateral received/pledged may be more than the amount reported due to over-collateralization. |
| ^ | Net amount represents the net receivable/payable that would be due from/to the counterparty in the event of default or termination. The net amount from OTC financial derivative instruments can only be netted across transactions governed under the same master agreement with the same counterparty. |
2. Currency Transactions
The Portfolio may invest in non-U.S. Dollar-denominated securities on a currency hedged or unhedged basis. The Portfolio may seek investment opportunities by taking long or short positions in currencies through the use of currency-related derivatives, including forward currency exchange contracts, futures and options on futures, swaps, and other options. The Portfolio may enter into transactions for investment opportunities when it anticipates that a foreign currency will appreciate or depreciate in value but securities denominated in that currency are not held by the Portfolio and do not present attractive investment opportunities. Such transactions may also be used when the Adviser believes that it may be more efficient than a direct investment in a foreign currency-denominated security. The Portfolio may also conduct currency exchange contracts on a spot basis (i.e., for cash at the spot rate prevailing in the currency exchange market for buying or selling currencies).
| abfunds.com | AB ALL MARKET REAL RETURN PORTFOLIO | 69 |
NOTES TO CONSOLIDATED FINANCIAL STATEMENTS (continued)
NOTE E
Securities Lending
The Portfolio may enter into securities lending transactions. Under the Portfolio’s securities lending program, all loans of securities will be collateralized continually by cash. The Portfolio will be compensated for the loan from a portion of the net return from the income earned on cash collateral after a rebate is paid to the borrower (in some cases, this rebate may be a “negative rebate” or fee paid by the borrower to the Portfolio in connection with the loan), and payments are made for fees of the securities lending agent and for certain other administrative expenses. It is the policy of the Portfolio to receive collateral consisting of cash in an amount exceeding the value of the securities loaned. The Portfolio will have the right to call a loan and obtain the securities loaned at any time on notice to the borrower within the normal and customary settlement time for the securities. While the securities are on loan, the borrower is obligated to pay the Portfolio amounts equal to any income or other distributions from the securities. The Portfolio will not be able to exercise voting rights with respect to any securities during the existence of a loan, but will have the right to regain ownership of loaned securities in order to exercise voting or other ownership rights. The lending agent has agreed to indemnify the Portfolio in the case of default of any securities borrower. Collateral received and securities loaned are marked to market daily to ensure that the securities loaned are secured by collateral. The lending agent currently invests the cash collateral received in Government Money Market Portfolio, an eligible money market vehicle, in accordance with the investment restrictions of the Portfolio, and as approved by the Board. The collateral received on securities loaned is recorded as an asset as well as a corresponding liability in the consolidated statement of assets and liabilities. When the Portfolio lends securities, its investment performance will continue to reflect changes in the value of the securities loaned. At October 31, 2017, the Portfolio had securities on loan with a value of $15,214,109 and had received cash collateral which has been invested into Government Money Market Portfolio of $15,609,061. The cash collateral will be adjusted on the next business day to maintain the required collateral amount. The Portfolio earned securities lending income of $131,519 and $83,550 from the borrowers and Government Money Market Portfolio, respectively, for the year ended October 31, 2017; these amounts are reflected in the consolidated statement of operations. In connection with the cash collateral investment by the Portfolio in the Government Money Market Portfolio, the Adviser has agreed to waive a portion of the Portfolio’s share of the advisory fees of Government Money Market Portfolio, as borne indirectly by the Portfolio as an acquired fund fee and expense. For the year ended October 31, 2017, such waiver amounted to $15,517. A principal risk of lending portfolio securities is that the borrower may fail to return the loaned securities upon termination of the loan and that the collateral will not be sufficient to replace the loaned securities.
| 70 | AB ALL MARKET REAL RETURN PORTFOLIO | abfunds.com |
NOTES TO CONSOLIDATED FINANCIAL STATEMENTS (continued)
NOTE F
Capital Stock
Each class consists of 3,000,000,000 authorized shares. Transactions in capital shares for each class were as follows:
| Shares | Amount | |||||||||||||||||||||||
| Year Ended October 31, 2017 | Year Ended October 31, 2016 | Year Ended October 31, 2017 | Year Ended 2016 | |||||||||||||||||||||
|
| |||||||||||||||||||||||
| Class A | ||||||||||||||||||||||||
Shares sold | 171,006 | 245,481 | $ | 1,442,288 | $ | 1,819,266 | ||||||||||||||||||
| ||||||||||||||||||||||||
Shares issued in reinvestment of dividends | 31,975 | 20,294 | 271,464 | 151,390 | ||||||||||||||||||||
| ||||||||||||||||||||||||
Shares converted from Class C | 12,155 | – 0 | – | 101,981 | – 0 | – | ||||||||||||||||||
| ||||||||||||||||||||||||
Shares redeemed | (548,796 | ) | (648,018 | ) | (4,608,625 | ) | (5,137,204 | ) | ||||||||||||||||
| ||||||||||||||||||||||||
Net decrease | (333,660 | ) | (382,243 | ) | $ | (2,792,892 | ) | $ | (3,166,548 | ) | ||||||||||||||
| ||||||||||||||||||||||||
| Class C | ||||||||||||||||||||||||
Shares sold | 9,618 | 15,344 | $ | 81,032 | $ | 113,580 | ||||||||||||||||||
| ||||||||||||||||||||||||
Shares issued in reinvestment of dividends | 4,093 | 1,376 | 34,707 | 10,241 | ||||||||||||||||||||
| ||||||||||||||||||||||||
Shares converted to Class A | (12,213 | ) | – 0 | – | (101,981 | ) | – 0 | – | ||||||||||||||||
| ||||||||||||||||||||||||
Shares redeemed | (142,206 | ) | (195,134 | ) | (1,197,112 | ) | (1,449,254 | ) | ||||||||||||||||
| ||||||||||||||||||||||||
Net decrease | (140,708 | ) | (178,414 | ) | $ | (1,183,354 | ) | $ | (1,325,433 | ) | ||||||||||||||
| ||||||||||||||||||||||||
| Advisor Class | ||||||||||||||||||||||||
Shares sold | 993,203 | 577,788 | $ | 8,359,654 | $ | 4,275,690 | ||||||||||||||||||
| ||||||||||||||||||||||||
Shares issued in reinvestment of dividends | 56,670 | 51,230 | 478,860 | 380,640 | ||||||||||||||||||||
| ||||||||||||||||||||||||
Shares redeemed | (1,014,816 | ) | (1,306,062 | ) | (8,538,361 | ) | (10,069,125 | ) | ||||||||||||||||
| ||||||||||||||||||||||||
Net increase (decrease) | 35,057 | (677,044 | ) | $ | 300,153 | $ | (5,412,795 | ) | ||||||||||||||||
| ||||||||||||||||||||||||
| Class R | ||||||||||||||||||||||||
Shares sold | 6,261 | 9,576 | $ | 52,776 | $ | 75,433 | ||||||||||||||||||
| ||||||||||||||||||||||||
Shares issued in reinvestment of dividends | 536 | 246 | 4,501 | 1,815 | ||||||||||||||||||||
| ||||||||||||||||||||||||
Shares redeemed | (4,225 | ) | (5,298 | ) | (35,553 | ) | (42,319 | ) | ||||||||||||||||
| ||||||||||||||||||||||||
Net increase | 2,572 | 4,524 | $ | 21,724 | $ | 34,929 | ||||||||||||||||||
| ||||||||||||||||||||||||
| abfunds.com | AB ALL MARKET REAL RETURN PORTFOLIO | 71 |
NOTES TO CONSOLIDATED FINANCIAL STATEMENTS (continued)
| Shares | Amount | |||||||||||||||||||||||
| Year Ended October 31, 2017 | Year Ended October 31, 2016 | Year Ended October 31, 2017 | Year Ended 2016 | |||||||||||||||||||||
|
| |||||||||||||||||||||||
| Class K | ||||||||||||||||||||||||
Shares sold | 71,290 | 67,241 | $ | 595,688 | $ | 523,121 | ||||||||||||||||||
| ||||||||||||||||||||||||
Shares issued in reinvestment of dividends | 5,695 | 3,711 | 47,782 | 27,392 | ||||||||||||||||||||
| ||||||||||||||||||||||||
Shares redeemed | (51,419 | ) | (45,730 | ) | (430,763 | ) | (346,047 | ) | ||||||||||||||||
| ||||||||||||||||||||||||
Net increase | 25,566 | 25,222 | $ | 212,707 | $ | 204,466 | ||||||||||||||||||
| ||||||||||||||||||||||||
| Class I | ||||||||||||||||||||||||
Shares sold | 173,303 | 155,919 | $ | 1,455,308 | $ | 1,213,236 | ||||||||||||||||||
| ||||||||||||||||||||||||
Shares issued in reinvestment of dividends | 51,893 | 40,784 | 435,380 | 300,575 | ||||||||||||||||||||
| ||||||||||||||||||||||||
Shares redeemed | (243,462 | ) | (72,018 | ) | (2,034,442 | ) | (561,598 | ) | ||||||||||||||||
| ||||||||||||||||||||||||
Net increase (decrease) | (18,266 | ) | 124,685 | $ | (143,754 | ) | $ | 952,213 | ||||||||||||||||
| ||||||||||||||||||||||||
| Class 1 | ||||||||||||||||||||||||
Shares sold | 26,258,027 | 15,020,515 | $ | 218,420,428 | $ | 111,631,381 | ||||||||||||||||||
| ||||||||||||||||||||||||
Shares issued in reinvestment of dividends | 1,153,504 | 1,068,928 | 9,620,222 | 7,835,240 | ||||||||||||||||||||
| ||||||||||||||||||||||||
Shares redeemed | (15,599,644 | ) | (12,789,170 | ) | (129,652,987 | ) | (97,126,550 | ) | ||||||||||||||||
| ||||||||||||||||||||||||
Net increase | 11,811,887 | 3,300,273 | $ | 98,387,663 | $ | 22,340,071 | ||||||||||||||||||
| ||||||||||||||||||||||||
| Class Z | ||||||||||||||||||||||||
Shares sold | 98,160,962 | 790,016 | $ | 824,387,060 | $ | 6,161,358 | ||||||||||||||||||
| ||||||||||||||||||||||||
Shares issued in reinvestment of dividends | 26,752 | 22,111 | 224,457 | 162,962 | ||||||||||||||||||||
| ||||||||||||||||||||||||
Shares redeemed | (20,802,361 | ) | (145,833 | ) | (174,259,026 | ) | (1,116,445 | ) | ||||||||||||||||
| ||||||||||||||||||||||||
Net increase | 77,385,353 | 666,294 | $ | 650,352,491 | $ | 5,207,875 | ||||||||||||||||||
| ||||||||||||||||||||||||
There were no transactions in capital shares for Class 2 for the years ended October 31, 2017 and October 31, 2016.
On March 17, 2017, the Portfolio received subscriptions-in-kind in the amount of $647,230,029 from an AB mutual fund.
At October 31, 2017, certain AB Mutual Funds owned 41%, in aggregate of the Portfolio’s outstanding shares. Significant transactions by such shareholder, if any, may impact the Portfolio’s performance.
| 72 | AB ALL MARKET REAL RETURN PORTFOLIO | abfunds.com |
NOTES TO CONSOLIDATED FINANCIAL STATEMENTS (continued)
NOTE G
Risks Involved in Investing in the Portfolio
Interest Rate Risk and Credit Risk—Interest rate risk is the risk that changes in interest rates will affect the value of the Portfolio’s investments in fixed-income debt securities such as bonds or notes. Increases in interest rates may cause the value of the Portfolio’s investments to decline. Credit risk is the risk that the issuer or guarantor of a debt security, or the counterparty to a derivative contract, will be unable or unwilling to make timely principal and/or interest payments, or to otherwise honor its obligations. The degree of risk for a particular security may be reflected in its credit rating. Credit risk is greater for medium quality and lower-rated securities. Lower-rated debt securities and similar unrated securities (commonly known as “junk bonds”) have speculative elements or are predominantly speculative risks.
Commodity Risk—Investing in commodities and commodity-linked derivative instruments, either directly or through the Subsidiary, may subject the Portfolio to greater volatility than investments in traditional securities. The value of commodity-linked derivative instruments may be affected by changes in overall market movements, commodity index volatility, changes in interest rates, or factors affecting a particular industry or commodity, such as drought, floods, weather, livestock disease, embargoes, tariffs and international economic, political and regulatory developments.
Derivatives Risk—The Portfolio may enter into derivative transactions such as forwards, options, futures and swaps. Derivatives may be illiquid, difficult to price, and leveraged so that small changes may produce disproportionate losses for the Portfolio, and subject to counterparty risk to a greater degree than more traditional investments. Derivatives may result in significant losses, including losses that are far greater than the value of the derivatives reflected on the consolidated statement of assets and liabilities.
Leverage Risk—When the Portfolio borrows money or otherwise leverages its investments, its performance may be volatile because leverage tends to exaggerate the effect of any increase or decrease in the value of the Portfolio’s investments. The Portfolio may create leverage through the use of reverse repurchase arrangements, forward currency exchange contracts, forward commitments, dollar rolls or futures or by borrowing money. The use of other types of derivative instruments by the Portfolio, such as options and swaps, may also result in a form of leverage. Leverage may result in higher returns to the Portfolio than if the Portfolio were not leveraged, but may also adversely affect returns, particularly if the market is declining.
| abfunds.com | AB ALL MARKET REAL RETURN PORTFOLIO | 73 |
NOTES TO CONSOLIDATED FINANCIAL STATEMENTS (continued)
Liquidity Risk—Liquidity risk occurs when certain investments are difficult to purchase or sell. Difficulty in selling less liquid securities may result in sales at disadvantageous prices affecting the value of your investment in the Portfolio. Causes of liquidity risk may include low trading volumes and large positions. Foreign fixed-income securities may have more liquidity risk because secondary trading markets for these securities may be smaller and less well-developed and the securities may trade less frequently. Liquidity risk may be higher in a rising interest rate environment, when the value and liquidity of fixed-income securities generally go down.
Foreign (Non-U.S.) Risk—Investments in securities of non-U.S. issuers may involve more risk than those of U.S. issuers. These securities may fluctuate more widely in price and may be less liquid due to adverse market, economic, political, regulatory or other factors.
Currency Risk—Fluctuations in currency exchange rates may negatively affect the value of the Portfolio’s investments or reduce its returns.
Subsidiary Risk—By investing in the Subsidiary, the Portfolio is indirectly exposed to the risks associated with the Subsidiary’s investments. The derivatives and other investments held by the Subsidiary are generally similar to those that are permitted to be held by the Portfolio and are subject to the same risks that apply to similar investments if held directly by the Portfolio. The Subsidiary is not registered under the Investment Company Act of 1940, as amended (the “1940 Act”), and, unless otherwise noted in the Portfolio’s Prospectus, is not subject to all of the investor protections of the 1940 Act. However, the Portfolio wholly owns and controls the Subsidiary, and the Portfolio and the Subsidiary are managed by the Adviser, making it unlikely the Subsidiary will take actions contrary to the interests of the Portfolio or its shareholders.
Real Estate Risk—The Portfolio’s investments in the real estate securities have many of the same risks as direct ownership of real estate, including the risk that the value of real estate could decline due to a variety of factors that affect the real estate market generally. Investments in real estate investment trusts, or “REITs”, may have additional risks. REITs are dependent on the capability of their managers, may have limited diversification, and could be significantly affected by changes in taxes.
Non-Diversification Risk—The Portfolio may have more risk because it is “non-diversified”, meaning that it can invest more of its assets in a smaller number of issuers. Accordingly, changes in the value of a single security may have a more significant effect, either negative or positive, on the Portfolio’s NAV.
| 74 | AB ALL MARKET REAL RETURN PORTFOLIO | abfunds.com |
NOTES TO CONSOLIDATED FINANCIAL STATEMENTS (continued)
Indemnification Risk—In the ordinary course of business, the Portfolio enters into contracts that contain a variety of indemnifications. The Portfolio’s maximum exposure under these arrangements is unknown. However, the Portfolio has not had prior claims or losses pursuant to these indemnification provisions and expects the risk of loss thereunder to be remote. Therefore, the Portfolio has not accrued any liability in connection with these indemnification provisions.
NOTE H
Joint Credit Facility
A number of open-end mutual funds managed by the Adviser, including the Portfolio, participate in a $280 million revolving credit facility (the “Facility”) intended to provide short-term financing, if necessary, subject to certain restrictions in connection with abnormal redemption activity. Commitment fees related to the Facility are paid by the participating funds and are included in miscellaneous expenses in the consolidated statement of operations. The Portfolio did not utilize the Facility during the year ended October 31, 2017.
NOTE I
Distributions to Shareholders
The tax character of distributions paid during the fiscal years ended October 31, 2017 and October 31, 2016 were as follows:
| 2017 | 2016 | |||||||
Distributions paid from: | ||||||||
Ordinary income | $ | 14,104,740 | $ | 10,007,572 | ||||
|
|
|
| |||||
Total distributions paid | $ | 14,104,740 | $ | 10,007,572 | ||||
|
|
|
| |||||
As of October 31, 2017, the components of accumulated earnings/(deficit) on a tax basis were as follows:
Undistributed ordinary income | $ | 36,028,379 | ||
Accumulated capital and other losses | (63,370,121 | )(a) | ||
Unrealized appreciation/(depreciation) | (87,869,055 | )(b) | ||
|
| |||
Total accumulated earnings/(deficit) | $ | (115,210,797 | ) | |
|
|
| (a) | As of October 31, 2017, the Portfolio had a net capital loss carryforward of $63,370,121. |
| (b) | The differences between book-basis and tax-basis unrealized appreciation/(depreciation) are attributable primarily to the tax deferral of losses on wash sales, the tax treatment of passive foreign investment companies (PFICs), the tax treatment of Treasury inflation-protected securities, the recognition for tax purposes of unrealized gains/losses on certain derivative instruments, and the tax treatment of earnings from the Subsidiary. |
For tax purposes, net realized capital losses may be carried over to offset future capital gains, if any. Funds are permitted to carry forward capital losses incurred in taxable years beginning after December 22, 2010 for an indefinite period. These post-December 22, 2010 capital losses must be
| abfunds.com | AB ALL MARKET REAL RETURN PORTFOLIO | 75 |
NOTES TO CONSOLIDATED FINANCIAL STATEMENTS (continued)
utilized prior to the earlier capital losses, which are subject to expiration. Post-December 22, 2010 capital loss carryforwards will retain their character as either short-term or long-term capital losses rather than being considered short-term as under previous regulation.
As of October 31, 2017, the Portfolio had a net capital loss carryforward of $63,370,121 which will expire as follows:
Short-Term | Long-Term | Expiration | ||
| $ 6,012,702 | n/a | 2019 | ||
| 26,084,216 | $ 31,273,203 | No Expiration |
During the current fiscal year, permanent differences primarily due to the tax treatment of passive foreign investment companies (PFICs), the tax treatment of Treasury inflation-protected securities, the tax treatment of partnership investments, foreign currency reclassifications, reclassifications of foreign capital gains tax, contributions from the Affiliates, book/tax differences associated with the treatment of earnings from the Subsidiary, and the tax treatment of a corporate restructuring, resulted in a net increase in undistributed net investment income, a net increase in accumulated net realized loss on investment and foreign currency transactions, and a net decrease in additional paid-in capital. These reclassifications had no effect on net assets.
NOTE J
Recent Accounting Pronouncements
In March 2017, the Financial Accounting Standards Board issued an Accounting Standards Update, ASU 2017-08, Receivables—Nonrefundable Fees and Other Costs (Subtopic 310-20), Premium Amortization on Purchased Callable Debt Securities (the “ASU”) which amends the amortization period for certain purchased callable debt securities held at a premium, shortening such period to the earliest call date. The ASU does not require any accounting change for debt securities held at a discount; the discount continues to be amortized to maturity. The ASU is effective for fiscal years, and interim periods within those fiscal years, beginning after December 15, 2018. At this time, management is evaluating the implications of these changes on the consolidated financial statements.
NOTE K
Subsequent Events
Management has evaluated subsequent events for possible recognition or disclosure in the consolidated financial statements through the date the consolidated financial statements are issued. Management has determined that there are no material events that would require disclosure in the Portfolio’s consolidated financial statements through this date.
| 76 | AB ALL MARKET REAL RETURN PORTFOLIO | abfunds.com |
CONSOLIDATED FINANCIAL HIGHLIGHTS
Selected Data For A Share Of Capital Stock Outstanding Throughout Each Period
| Class A | ||||||||||||||||||||
| Year Ended October 31, | ||||||||||||||||||||
| 2017 | 2016 | 2015 | 2014 | 2013 | ||||||||||||||||
|
| |||||||||||||||||||
Net asset value, beginning of period | $ 8.24 | $ 8.13 | $ 10.52 | $ 11.04 | $ 11.33 | |||||||||||||||
|
| |||||||||||||||||||
Income From Investment Operations | ||||||||||||||||||||
Net investment income(a)(b) | .09 | .10 | .06 | .12 | .10 | |||||||||||||||
Net realized and unrealized gain (loss) on investment and foreign currency transactions | .76 | .11 | (2.26 | ) | (.50 | ) | (.13 | ) | ||||||||||||
Contributions from Affiliates | .00 | (c) | .00 | (c) | .00 | (c) | .00 | (c) | – 0 | – | ||||||||||
|
| |||||||||||||||||||
Net increase (decrease) in net asset value from operations | .85 | .21 | (2.20 | ) | (.38 | ) | (.03 | ) | ||||||||||||
|
| |||||||||||||||||||
Less: Dividends | ||||||||||||||||||||
Dividends from net investment income | (.19 | ) | (.10 | ) | (.19 | ) | (.14 | ) | (.26 | ) | ||||||||||
|
| |||||||||||||||||||
Net asset value, end of period | $ 8.90 | $ 8.24 | $ 8.13 | $ 10.52 | $ 11.04 | |||||||||||||||
|
| |||||||||||||||||||
Total Return | ||||||||||||||||||||
Total investment return based on net asset value(d) | 10.45 | % | 2.75 | % | (21.16 | )% | (3.45 | )% | (.27 | )% | ||||||||||
Ratios/Supplemental Data | ||||||||||||||||||||
Net assets, end of period (000’s omitted) | $11,819 | $13,682 | $16,611 | $28,434 | $64,800 | |||||||||||||||
Ratio to average net assets of: | ||||||||||||||||||||
Expenses, net of waivers/reimbursements(e) | 1.27 | % | 1.30 | % | 1.30 | % | 1.23 | % | 1.05 | % | ||||||||||
Expenses, before waivers/reimbursements(e) | 1.28 | % | 1.36 | % | 1.47 | % | 1.30 | % | 1.34 | % | ||||||||||
Net investment income(b) | 1.05 | % | 1.23 | % | .62 | % | 1.03 | % | .86 | % | ||||||||||
Portfolio turnover rate | 123 | % | 119 | % | 53 | % | 73 | % | 54 | % | ||||||||||
See footnote summary on page 86.
| abfunds.com | AB ALL MARKET REAL RETURN PORTFOLIO | 77 |
CONSOLIDATED FINANCIAL HIGHLIGHTS (continued)
Selected Data For A Share Of Capital Stock Outstanding Throughout Each Period
| Class C | ||||||||||||||||||||
| Year Ended October 31, | ||||||||||||||||||||
| 2017 | 2016 | 2015 | 2014 | 2013 | ||||||||||||||||
|
| |||||||||||||||||||
Net asset value, beginning of period | $ 8.17 | $ 8.03 | $ 10.40 | $ 10.90 | $ 11.18 | |||||||||||||||
|
| |||||||||||||||||||
Income From Investment Operations | ||||||||||||||||||||
Net investment income (loss)(a)(b) | .02 | .04 | (.01 | ) | .04 | .02 | ||||||||||||||
Net realized and unrealized gain (loss) on investment and foreign currency transactions | .76 | .12 | (2.23 | ) | (.49 | ) | (.12 | ) | ||||||||||||
Contributions from Affiliates | .00 | (c) | .00 | (c) | .00 | (c) | .00 | (c) | – 0 | – | ||||||||||
|
| |||||||||||||||||||
Net increase (decrease) in net asset value from operations | .78 | .16 | (2.24 | ) | (.45 | ) | (.10 | ) | ||||||||||||
|
| |||||||||||||||||||
Less: Dividends | ||||||||||||||||||||
Dividends from net investment income | (.12 | ) | (.02 | ) | (.13 | ) | (.05 | ) | (.18 | ) | ||||||||||
|
| |||||||||||||||||||
Net asset value, end of period | $ 8.83 | $ 8.17 | $ 8.03 | $ 10.40 | $ 10.90 | |||||||||||||||
|
| |||||||||||||||||||
Total Return | ||||||||||||||||||||
Total investment return based on net asset value(d)†† | 9.73 | % | 2.07 | % | (21.75 | )% | (4.13 | )% | (.92 | )% | ||||||||||
Ratios/Supplemental Data | ||||||||||||||||||||
Net assets, end of period | $1,801 | $2,814 | $4,202 | $8,531 | $13,063 | |||||||||||||||
Ratio to average net assets of: | ||||||||||||||||||||
Expenses, net of waivers/reimbursements(e) | 2.02 | % | 2.03 | % | 2.00 | % | 1.93 | % | 1.75 | % | ||||||||||
Expenses, before waivers/reimbursements(e) | 2.03 | % | 2.11 | % | 2.16 | % | 2.02 | % | 2.04 | % | ||||||||||
Net investment income (loss)(b) | .27 | % | .51 | % | (.07 | )% | .34 | % | .16 | % | ||||||||||
Portfolio turnover rate | 123 | % | 119 | % | 53 | % | 73 | % | 54 | % | ||||||||||
See footnote summary on page 86.
| 78 | AB ALL MARKET REAL RETURN PORTFOLIO | abfunds.com |
CONSOLIDATED FINANCIAL HIGHLIGHTS (continued)
Selected Data For A Share Of Capital Stock Outstanding Throughout Each Period
| Advisor Class | ||||||||||||||||||||
| Year Ended October 31, | ||||||||||||||||||||
| 2017 | 2016 | 2015 | 2014 | 2013 | ||||||||||||||||
|
| |||||||||||||||||||
Net asset value, beginning of period | $ 8.22 | $ 8.13 | $ 10.56 | $ 11.09 | $ 11.37 | |||||||||||||||
|
| |||||||||||||||||||
Income From Investment Operations | ||||||||||||||||||||
Net investment income(a)(b) | .11 | .12 | .09 | .15 | .13 | |||||||||||||||
Net realized and unrealized gain (loss) on investment and foreign currency transactions | .77 | .11 | (2.27 | ) | (.50 | ) | (.12 | ) | ||||||||||||
Contributions from Affiliates | .00 | (c) | .00 | (c) | .00 | (c) | .00 | (c) | – 0 | – | ||||||||||
|
| |||||||||||||||||||
Net increase (decrease) in net asset value from operations | .88 | .23 | (2.18 | ) | (.35 | ) | .01 | |||||||||||||
|
| |||||||||||||||||||
Less: Dividends | ||||||||||||||||||||
Dividends from net investment income | (.21 | ) | (.14 | ) | (.25 | ) | (.18 | ) | (.29 | ) | ||||||||||
|
| |||||||||||||||||||
Net asset value, end of period | $ 8.89 | $ 8.22 | $ 8.13 | $ 10.56 | $ 11.09 | |||||||||||||||
|
| |||||||||||||||||||
Total Return | ||||||||||||||||||||
Total investment return based on net asset value(d) | 10.87 | % | 3.00 | % | (20.95 | )% | (3.20 | )% | .12 | % | ||||||||||
Ratios/Supplemental Data | ||||||||||||||||||||
Net assets, end of period (000’s omitted) | $27,670 | $25,307 | $30,541 | $58,399 | $64,911 | |||||||||||||||
Ratio to average net assets of: | ||||||||||||||||||||
Expenses, net of waivers/reimbursements(e) | 1.02 | % | 1.04 | % | 1.00 | % | .94 | % | .75 | % | ||||||||||
Expenses, before waivers/reimbursements(e) | 1.02 | % | 1.10 | % | 1.17 | % | 1.02 | % | 1.04 | % | ||||||||||
Net investment income(b) | 1.31 | % | 1.51 | % | .95 | % | 1.33 | % | 1.18 | % | ||||||||||
Portfolio turnover rate | 123 | % | 119 | % | 53 | % | 73 | % | 54 | % | ||||||||||
See footnote summary on page 86.
| abfunds.com | AB ALL MARKET REAL RETURN PORTFOLIO | 79 |
CONSOLIDATED FINANCIAL HIGHLIGHTS (continued)
Selected Data For A Share Of Capital Stock Outstanding Throughout Each Period
| Class R | ||||||||||||||||||||
| Year Ended October 31, | ||||||||||||||||||||
| 2017 | 2016 | 2015 | 2014 | 2013 | ||||||||||||||||
|
| |||||||||||||||||||
Net asset value, beginning of period | $ 8.14 | $ 8.06 | $ 10.51 | $ 11.04 | $ 11.32 | |||||||||||||||
|
| |||||||||||||||||||
Income From Investment Operations | ||||||||||||||||||||
Net investment income(a)(b) | .07 | .07 | .04 | .15 | .08 | |||||||||||||||
Net realized and unrealized gain (loss) on investment and foreign currency transactions | .76 | .11 | (2.24 | ) | (.55 | ) | (.13 | ) | ||||||||||||
Contributions from Affiliates | .00 | (c) | .00 | (c) | .00 | (c) | .00 | (c) | – 0 | – | ||||||||||
|
| |||||||||||||||||||
Net increase (decrease) in net asset value from operations | .83 | .18 | (2.20 | ) | (.40 | ) | (.05 | ) | ||||||||||||
|
| |||||||||||||||||||
Less: Dividends | ||||||||||||||||||||
Dividends from net investment income | (.18 | ) | (.10 | ) | (.25 | ) | (.13 | ) | (.23 | ) | ||||||||||
|
| |||||||||||||||||||
Net asset value, end of period | $ 8.79 | $ 8.14 | $ 8.06 | $ 10.51 | $ 11.04 | |||||||||||||||
|
| |||||||||||||||||||
Total Return | ||||||||||||||||||||
Total investment return based on net asset value(d)†† | 10.29 | % | 2.41 | % | (21.37 | )% | (3.66 | )% | (.47 | )% | ||||||||||
Ratios/Supplemental Data | ||||||||||||||||||||
Net assets, end of period (000’s omitted) | $239 | $201 | $162 | $182 | $38 | |||||||||||||||
Ratio to average net assets of: | ||||||||||||||||||||
Expenses, net of waivers/reimbursements(e) | 1.54 | % | 1.54 | % | 1.50 | % | 1.44 | % | 1.25 | % | ||||||||||
Expenses, before waivers/reimbursements(e) | 1.60 | % | 1.66 | % | 1.64 | % | 1.55 | % |
| 1.65 | % | |||||||||
Net investment income(b) | .81 | % | .91 | % | .42 | % | 1.36 | % | .76 | % | ||||||||||
Portfolio turnover rate | 123 | % | 119 | % | 53 | % | 73 | % | 54 | % | ||||||||||
See footnote summary on page 86.
| 80 | AB ALL MARKET REAL RETURN PORTFOLIO | abfunds.com |
CONSOLIDATED FINANCIAL HIGHLIGHTS (continued)
Selected Data For A Share Of Capital Stock Outstanding Throughout Each Period
| Class K | ||||||||||||||||||||
| Year Ended October 31, | ||||||||||||||||||||
| 2017 | 2016 | 2015 | 2014 | 2013 | ||||||||||||||||
|
| |||||||||||||||||||
Net asset value, beginning of period | $ 8.15 | $ 8.07 | $ 10.50 | $ 11.03 | $ 11.32 | |||||||||||||||
|
| |||||||||||||||||||
Income From Investment Operations | ||||||||||||||||||||
Net investment income(a)(b) | .09 | .10 | .06 | .12 | .10 | |||||||||||||||
Net realized and unrealized gain (loss) on investment and foreign currency transactions | .75 | .11 | (2.25 | ) | (.49 | ) | (.12 | ) | ||||||||||||
Contributions from Affiliates | .00 | (c) | .00 | (c) | .00 | (c) | .00 | (c) | – 0 | – | ||||||||||
|
| |||||||||||||||||||
Net increase (decrease) in net asset value from operations | .84 | .21 | (2.19 | ) | (.37 | ) | �� | (.02 | ) | |||||||||||
|
| |||||||||||||||||||
Less: Dividends | ||||||||||||||||||||
Dividends from net investment income | (.19 | ) | (.13 | ) | (.24 | ) | (.16 | ) | (.27 | ) | ||||||||||
|
| |||||||||||||||||||
Net asset value, end of period | $ 8.80 | $ 8.15 | $ 8.07 | $ 10.50 | $ 11.03 | |||||||||||||||
|
| |||||||||||||||||||
Total Return | ||||||||||||||||||||
Total investment return based on net asset value(d) | 10.48 | % | 2.81 | % | (21.19 | )% | (3.39 | )% | (.19 | )% | ||||||||||
Ratios/Supplemental Data | ||||||||||||||||||||
Net assets, end of period | $2,265 | $1,888 | $1,668 | $2,174 | $1,684 | |||||||||||||||
Ratio to average net assets of: | ||||||||||||||||||||
Expenses, net of waivers/reimbursements(e) | 1.28 | % | 1.29 | % | 1.25 | % | 1.19 | % | 1.00 | % | ||||||||||
Expenses, before waivers/reimbursements(e) | 1.29 | % | 1.35 | % | 1.34 | % | 1.24 | % | 1.33 | % | ||||||||||
Net investment income(b) | 1.05 | % | 1.23 | % | .67 | % | 1.10 | % | .95 | % | ||||||||||
Portfolio turnover rate | 123 | % | 119 | % | 53 | % | 73 | % | 54 | % | ||||||||||
See footnote summary on page 86.
| abfunds.com | AB ALL MARKET REAL RETURN PORTFOLIO | 81 |
CONSOLIDATED FINANCIAL HIGHLIGHTS (continued)
Selected Data For A Share Of Capital Stock Outstanding Throughout Each Period
| Class I | ||||||||||||||||||||
| Year Ended October 31, | ||||||||||||||||||||
| 2017 | 2016 | 2015 | 2014 | 2013 | ||||||||||||||||
|
| |||||||||||||||||||
Net asset value, beginning of period | $ 8.17 | $ 8.11 | $ 10.54 | $ 11.07 | $ 11.36 | |||||||||||||||
|
| |||||||||||||||||||
Income From Investment Operations | ||||||||||||||||||||
Net investment income(a) | .12 | (b) | .12 | (b) | .09 | .15 | .13 | (b) | ||||||||||||
Net realized and unrealized gain (loss) on investment and foreign currency transactions | .77 | .11 | (2.25 | ) | (.49 | ) | (.13 | ) | ||||||||||||
Contributions from Affiliates | .00 | (c) | .00 | (c) | .00 | (c) | .00 | (c) | – 0 | – | ||||||||||
|
| |||||||||||||||||||
Net increase (decrease) in net asset value from operations | .89 | .23 | (2.16 | ) | (.34 | ) | – 0 | – | ||||||||||||
|
| |||||||||||||||||||
Less: Dividends | ||||||||||||||||||||
Dividends from net investment income | (.23 | ) | (.17 | ) | (.27 | ) | (.19 | ) | (.29 | ) | ||||||||||
|
| |||||||||||||||||||
Net asset value, end of period | $ 8.83 | $ 8.17 | $ 8.11 | $ 10.54 | $ 11.07 | |||||||||||||||
|
| |||||||||||||||||||
Total Return | ||||||||||||||||||||
Total investment return based on net asset value(d)†† | 10.98 | % | 3.03 | % | (20.97 | )% | (3.09 | )% | .04 | % | ||||||||||
Ratios/Supplemental Data | ||||||||||||||||||||
Net assets, end of period | $16,753 | $15,646 | $14,508 | $21,341 | $19,303 | |||||||||||||||
Ratio to average net assets of: | ||||||||||||||||||||
Expenses, net of waivers/reimbursements(e) | .85 | % | .91 | % | .96 | % | .91 | % | .75 | % | ||||||||||
Expenses, before waivers/reimbursements(e) | .86 | % | .92 | % | .96 | % | .91 | % | .97 | % | ||||||||||
Net investment income | 1.48 | %(b) | 1.61 | %(b) | .99 | % | 1.37 | % | 1.17 | %(b) | ||||||||||
Portfolio turnover rate | 123 | % | 119 | % | 53 | % | 73 | % | 54 | % | ||||||||||
See footnote summary on page 86.
| 82 | AB ALL MARKET REAL RETURN PORTFOLIO | abfunds.com |
CONSOLIDATED FINANCIAL HIGHLIGHTS (continued)
Selected Data For A Share Of Capital Stock Outstanding Throughout Each Period
| Class 1 | ||||||||||||||||||||
| Year Ended October 31, | ||||||||||||||||||||
| 2017 | 2016 | 2015 | 2014 | 2013 | ||||||||||||||||
|
| |||||||||||||||||||
Net asset value, beginning of period | $ 8.11 | $ 8.05 | $ 10.46 | $ 11.00 | $ 11.29 | |||||||||||||||
|
| |||||||||||||||||||
Income From Investment Operations | ||||||||||||||||||||
Net investment income(a) | .10 | (b) | .11 | (b) | .07 | .13 | .10 | (b) | ||||||||||||
Net realized and unrealized gain (loss) on investment and foreign currency transactions | .76 | .10 | (2.24 | ) | (.50 | ) | (.12 | ) | ||||||||||||
Contributions from Affiliates | .00 | (c) | .00 | (c) | .00 | (c) | .00 | (c) | – 0 | – | ||||||||||
|
| |||||||||||||||||||
Net increase (decrease) in net asset value from operations | .86 | .21 | (2.17 | ) | (.37 | ) | (.02 | ) | ||||||||||||
|
| |||||||||||||||||||
Less: Dividends | ||||||||||||||||||||
Dividends from net investment income | (.21 | ) | (.15 | ) | (.24 | ) | (.17 | ) | (.27 | ) | ||||||||||
|
| |||||||||||||||||||
Net asset value, end of period | $ 8.76 | $ 8.11 | $ 8.05 | $ 10.46 | $ 11.00 | |||||||||||||||
|
| |||||||||||||||||||
Total Return | ||||||||||||||||||||
Total investment return based on net asset value(d)†† | 10.69 | % | 2.82 | % | (21.12 | )% | (3.35 | )% | (.19 | )% | ||||||||||
Ratios/Supplemental Data | ||||||||||||||||||||
Net assets, end of period (000’s omitted) | $649,421 | $505,143 | $474,631 | $513,633 | $420,593 | |||||||||||||||
Ratio to average net assets of: | ||||||||||||||||||||
Expenses, net of waivers/reimbursements(e) | 1.09 | % | 1.15 | % | 1.16 | % | 1.14 | % | 1.00 | % | ||||||||||
Expenses, before waivers/reimbursements(e) | 1.10 | % | 1.16 | % | 1.16 | % | 1.14 | % | 1.16 | % | ||||||||||
Net investment income | 1.24 | %(b) | 1.38 | %(b) | .79 | % | 1.16 | % | .95 | %(b) | ||||||||||
Portfolio turnover rate | 123 | % | 119 | % | 53 | % | 73 | % | 54 | % | ||||||||||
See footnote summary on page 86.
| abfunds.com | AB ALL MARKET REAL RETURN PORTFOLIO | 83 |
CONSOLIDATED FINANCIAL HIGHLIGHTS (continued)
Selected Data For A Share Of Capital Stock Outstanding Throughout Each Period
| Class 2 | ||||||||||||||||||||
| Year Ended October 31, | ||||||||||||||||||||
| 2017 | 2016 | 2015 | 2014 | 2013 | ||||||||||||||||
|
| |||||||||||||||||||
Net asset value, beginning of period | $ 8.29 | $ 8.22 | $ 10.68 | $ 11.19 | $ 11.48 | |||||||||||||||
|
| |||||||||||||||||||
Income From Investment Operations | ||||||||||||||||||||
Net investment income(a) | .13 | (b) | .13 | (b) | .09 | .15 | .13 | (b) | ||||||||||||
Net realized and unrealized gain (loss) on investment and foreign currency transactions | .77 | .11 | (2.28 | ) | (.50 | ) | (.12 | ) | ||||||||||||
Contributions from Affiliates | .00 | (c) | .00 | (c) | .00 | (c) | .00 | (c) | – 0 | – | ||||||||||
|
| |||||||||||||||||||
Net increase (decrease) in net asset value from operations | .90 | .24 | (2.19 | ) | (.35 | ) | .01 | |||||||||||||
|
| |||||||||||||||||||
Less: Dividends | ||||||||||||||||||||
Dividends from net investment income | (.23 | ) | (.17 | ) | (.27 | ) | (.16 | ) | (.30 | ) | ||||||||||
|
| |||||||||||||||||||
Net asset value, end of period | $ 8.96 | $ 8.29 | $ 8.22 | $ 10.68 | $ 11.19 | |||||||||||||||
|
| |||||||||||||||||||
Total Return | ||||||||||||||||||||
Total investment return based on net asset value(d) | 10.96 | % | 3.17 | % | (20.85 | )% | (3.12 | )% | .05 | % | ||||||||||
Ratios/Supplemental Data | ||||||||||||||||||||
Net assets, end of period | $9 | $8 | $8 | $11 | $11 | |||||||||||||||
Ratio to average net assets of: | ||||||||||||||||||||
Expenses, net of waivers/reimbursements(e) | .82 | % | .90 | % | .92 | % | .89 | % | .75 | % | ||||||||||
Expenses, before waivers/reimbursements(e) | .83 | % | .90 | % | .92 | % | .89 | % | 1.93 | % | ||||||||||
Net investment income | 1.50 | %(b) | 1.60 | %(b) | .92 | % | 1.36 | % | 1.16 | %(b) | ||||||||||
Portfolio turnover rate | 123 | % | 119 | % | 53 | % | 73 | % | 54 | % | ||||||||||
See footnote summary on page 86.
| 84 | AB ALL MARKET REAL RETURN PORTFOLIO | abfunds.com |
CONSOLIDATED FINANCIAL HIGHLIGHTS (continued)
Selected Data For A Share Of Capital Stock Outstanding Throughout Each Period
| Class Z | ||||||||||||||||
| Year Ended October 31, | January 31, 2014(f) to October 31, | |||||||||||||||
| 2017 | 2016 | 2015 | 2014 | |||||||||||||
|
| |||||||||||||||
Net asset value, beginning of period | $ 8.17 | $ 8.11 | $ 10.55 | $ 10.53 | ||||||||||||
|
| |||||||||||||||
Income From Investment Operations | ||||||||||||||||
Net investment income(a) | .13 | (b) | .12 | (b) | .07 | .13 | ||||||||||
Net realized and unrealized gain (loss) on investment and foreign currency transactions | .76 | .11 | (2.24 | ) | (.11 | ) | ||||||||||
Contributions from Affiliates(c) | .00 | .00 | .00 | .00 | ||||||||||||
|
| |||||||||||||||
Net increase (decrease) in net asset value from operations | .89 | .23 | (2.17 | ) | .02 | |||||||||||
|
| |||||||||||||||
Less: Dividends | ||||||||||||||||
Dividends from net investment income | (.23 | ) | (.17 | ) | (.27 | ) | – 0 | – | ||||||||
|
| |||||||||||||||
Net asset value, end of period | $ 8.83 | $ 8.17 | $ 8.11 | $ 10.55 | ||||||||||||
|
| |||||||||||||||
Total Return | ||||||||||||||||
Total investment return based on net asset value(d) | 10.98 | % | 3.09 | % | (20.94 | )% | .19 | % | ||||||||
Ratios/Supplemental Data | ||||||||||||||||
Net assets, end of period (000’‘s omitted) | $692,895 | $8,634 | $3,166 | $10 | ||||||||||||
Ratio to average net assets of: | ||||||||||||||||
Expenses, net of waivers/reimbursements(e) | .82 | % | .92 | % | .96 | % | .88 | %^ | ||||||||
Expenses, before waivers/reimbursements(e) | .83 | % | .92 | % | .96 | % | .88 | %^ | ||||||||
Net investment income | 1.60 | %(b) | 1.56 | %(b) | .92 | % | 1.59 | %^ | ||||||||
Portfolio turnover rate | 123 | % | 119 | % | 53 | % | 73 | % | ||||||||
See footnote summary on page 86.
| abfunds.com | AB ALL MARKET REAL RETURN PORTFOLIO | 85 |
CONSOLIDATED FINANCIAL HIGHLIGHTS (continued)
Selected Data For A Share Of Capital Stock Outstanding Throughout Each Period
| (a) | Based on average shares outstanding. |
| (b) | Net of fees and expenses waived/reimbursed by the Adviser. |
| (c) | Amount is less than $.005. |
| (d) | Total investment return is calculated assuming an initial investment made at the net asset value at the beginning of the period, reinvestment of all dividends and distributions at net asset value during the period, and redemption on the last day of the period. Initial sales charges or contingent deferred sales charges are not reflected in the calculation of total investment return. Total return does not reflect the deduction of taxes that a shareholder would pay on fund distributions or the redemption of fund shares. Total investment return calculated for a period of less than one year is not annualized. |
| (e) | In connection with the Portfolio’s investments in affiliated underlying portfolios, the Portfolio incurs no direct expenses, but bears proportionate shares of the fees and expenses (i.e., operating, administrative and investment advisory fees) of the affiliated underlying portfolios. The Adviser has contractually agreed to waive its fees from the Portfolio in an amount equal to the Portfolio’s pro rata share of certain acquired fund fees and expenses, and for the year ended October 31, 2017, such waiver amounted to 0.01% annualized for the Portfolio. |
| (f) | Commencement of distributions. |
| †† | The net asset value and total return include adjustments in accordance with accounting principles generally accepted in the United States of America for financial reporting purposes. As such, the net asset value and total return for shareholder transactions may differ from financial statements. |
| ^ | Annualized. |
See notes to consolidated financial statements.
| 86 | AB ALL MARKET REAL RETURN PORTFOLIO | abfunds.com |
REPORT OF INDEPENDENT REGISTERED
PUBLIC ACCOUNTING FIRM
To the Board of Directors and Shareholders of the AB All Market Real Return Portfolio
We have audited the accompanying consolidated statement of assets and liabilities, including the consolidated portfolio of investments, of AB All Market Real Return Portfolio (the “Fund”), one of the portfolios constituting AB Bond Fund, Inc., as of October 31, 2017, and the related consolidated statement of operations for the year then ended, the consolidated statements of changes in net assets for each of the two years in the period then ended and the consolidated financial highlights for each of the periods indicated therein. These financial statements and financial highlights are the responsibility of the Fund’s management. Our responsibility is to express an opinion on these financial statements and financial highlights based on our audits.
We conducted our audits in accordance with the standards of the Public Company Accounting Oversight Board (United States). Those standards require that we plan and perform the audit to obtain reasonable assurance about whether the financial statements and financial highlights are free of material misstatement. We were not engaged to perform an audit of the Fund’s internal control over financial reporting. Our audit included consideration of internal control over financial reporting as a basis for designing audit procedures that are appropriate in the circumstances, but not for the purpose of expressing an opinion on the effectiveness of the Fund’s internal control over financial reporting. Accordingly, we express no such opinion. An audit also includes examining, on a test basis, evidence supporting the amounts and disclosures in the financial statements and financial highlights, assessing the accounting principles used and significant estimates made by management, and evaluating the overall financial statement presentation. Our procedures included confirmation of securities owned as of October 31, 2017, by correspondence with the custodian and others or by other appropriate auditing procedures where replies from others were not received. We believe that our audits provide a reasonable basis for our opinion.
In our opinion, the financial statements and financial highlights referred to above present fairly, in all material respects, the consolidated financial position of AB All Market Real Return Portfolio, one of the portfolios constituting the AB Bond Fund, Inc., at October 31, 2017, the consolidated results of its operations for the year then ended, the consolidated changes in its net assets for each of the two years in the period then ended and the consolidated financial highlights for each of the periods indicated therein, in conformity with U.S. generally accepted accounting principles.

New York, New York
December 29, 2017
| abfunds.com | AB ALL MARKET REAL RETURN PORTFOLIO | 87 |
2017 FEDERAL TAX INFORMATION
(unaudited)
For Federal income tax purposes, the following information is furnished with respect to the distributions paid by the Portfolios during the taxable period ended October 31, 2017. For individual shareholders, the Portfolio designates 61.47% of dividends paid as qualified dividend income. For corporate shareholders, 14.97% of dividends paid qualify for the dividends received deduction. For foreign shareholders, 0.97% of ordinary dividends paid may be considered to be qualifying to be taxed as interest-related dividends.
Shareholders should not use the above information to prepare their income tax returns. The information necessary to complete your income tax returns will be included with your Form 1099-DIV which will be sent to you separately in January 2018.
��
| 88 | AB ALL MARKET REAL RETURN PORTFOLIO | abfunds.com |
BOARD OF DIRECTORS
Marshall C. Turner, Jr.(1) , Chairman John H. Dobkin(1),(2) Michael J. Downey(1) William H. Foulk, Jr.(1) D. James Guzy(1),(2) | Nancy P. Jacklin(1) Robert M. Keith, President and Chief Executive Officer Carol C. McMullen(1) Garry L. Moody(1) Earl D. Weiner(1) |
OFFICERS
Philip L. Kirstein(4), Senior Vice President and Independent Compliance Officer Vinod Chathlani(3) , Vice President Daniel J. Loewy(3), Vice President Vadim Zlotnikov(3), Vice President | Emilie D. Wrapp, Secretary Joseph J. Mantineo, Treasurer and Chief Financial Officer Phyllis J. Clarke, Controller Vincent S. Noto, Chief Compliance Officer |
Custodian and Accounting Agent State Street Bank and Trust Company State Street Corporation CCB/5 1 Iron Street Boston, MA 02210
Principal Underwriter AllianceBernstein Investments, Inc. 1345 Avenue of the Americas New York, NY 10105
Transfer Agent AllianceBernstein Investor Services, Inc. P.O. Box 786003 San Antonio, TX 78278-6003 Toll-Free (800) 221-5672 | Independent Registered Public Ernst & Young LLP 5 Times Square New York, NY 10036
Legal Counsel Seward & Kissel LLP One Battery Park Plaza New York, NY 10004 |
| 1 | Member of the Audit Committee, the Governance and Nominating Committee, and the Independent Directors Committee. |
| 2 | Messrs. Dobkin and Guzy are expected to retire on or about December 31, 2017. |
| 3 | The day-to-day management of, and investment decisions for, the Fund’s portfolio are made by the Adviser’s All Market Real Return Portfolio Team. Messrs. Chathlani, Loewy and Zlotnikov are the investment professionals with the most significant responsibility for the day-to-day management of the Fund’s portfolio. |
| 4 | Mr. Kirstein is expected to retire on or about December 31, 2017. |
| abfunds.com | AB ALL MARKET REAL RETURN PORTFOLIO | 89 |
MANAGEMENT OF THE FUND
Board of Directors Information
The business and affairs of the Strategy are managed under the direction of the Board of Directors. Certain information concerning the Strategy’s Directors is set forth below.
| NAME, ADDRESS*, AGE, (YEAR FIRST ELECTED**) | PRINCIPAL OCCUPATION(S) DURING PAST FIVE YEARS AND OTHER INFORMATION*** | PORTFOLIOS IN FUND COMPLEX DIRECTOR | OTHER PUBLIC COMPANY | |||||
| INTERESTED DIRECTOR | ||||||||
Robert M. Keith# 57 (2010) | Senior Vice President of AllianceBernstein L.P. (the “Adviser”) and the head of AllianceBernstein Investments, Inc. (“ABI’’) since July 2008; Director of ABI and President of the AB Mutual Funds. Previously, he served as Executive Managing Director of ABI from December 2006 to June 2008. Prior to joining ABI in 2006, Executive Managing Director of Bernstein Global Wealth Management, and prior thereto, Senior Managing Director and Global Head of Client Service and Sales of the Adviser’s institutional investment management business since 2004. Prior thereto, he was Managing Director and Head of North American Client Service and Sales in the Adviser’s institutional investment management business with which he has been associated since prior to 2004. | 96 | None | |||||
| 90 | AB ALL MARKET REAL RETURN PORTFOLIO | abfunds.com |
MANAGEMENT OF THE FUND (continued)
| NAME, ADDRESS*, AGE, (YEAR FIRST ELECTED**) | PRINCIPAL OCCUPATION(S) DURING PAST FIVE YEARS AND OTHER INFORMATION*** | PORTFOLIOS IN FUND COMPLEX DIRECTOR | OTHER PUBLIC COMPANY | |||||
| INDEPENDENT DIRECTORS | ||||||||
Marshall C. Turner, Jr.## Chairman of the Board 76 (2005) | Private Investor since prior to 2012. Former Chairman and CEO of Dupont Photomasks, Inc. (components of semi- conductor manufacturing). He has extensive operating leadership, and venture capital investing experience, including five interim or full-time CEO roles, and prior service as general partner of institutional venture capital partnerships. He also has extensive non-profit board leadership experience, and currently serves on the boards of two education and science-related non-profit organizations. He has served as a director of one AB Fund since 1992, and director or trustee of multiple AB Funds since 2005. He has been Chairman of the AB Funds since January 2014, and the Chairman of the Independent Directors Committees of such AB Funds since February 2014. | 96 | Xilinx, Inc. (programmable logic semi- conductors) since 2007 | |||||
| abfunds.com | AB ALL MARKET REAL RETURN PORTFOLIO | 91 |
MANAGEMENT OF THE FUND (continued)
| NAME, ADDRESS*, AGE, (YEAR FIRST ELECTED**) | PRINCIPAL OCCUPATION(S) DURING PAST FIVE YEARS AND OTHER INFORMATION*** | PORTFOLIOS IN FUND COMPLEX DIRECTOR | OTHER PUBLIC COMPANY | |||||
INDEPENDENT DIRECTORS (continued) | ||||||||
John H. Dobkin##,^ 75 (1998) | Independent Consultant since prior to 2012. Formerly, President of Save Venice, Inc. (preservation organization) from 2001-2002; Senior Advisor from June 1999-June 2000 and President of Historic Hudson Valley (historic preservation) from December 1989-May 1999. Previously, Director of the National Academy of Design. He has served as a director or trustee of various AB Funds since 1992, and as Chairman of the Audit Committees of a number of such AB Funds from 2001-2008. | 95 | None | |||||
Michael J. Downey## 73 (2005) | Private Investor since prior to 2012. Formerly, managing partner of Lexington Capital, LLC (investment advisory firm) from December 1997 until December 2003. He served as a Director of Prospect Acquisition Corp. (financial services) from 2007 until 2009. From 1987 until 1993, Chairman and CEO of Prudential Mutual Fund Management, director of the Prudential mutual funds, and member of the Executive Committee of Prudential Securities, Inc. He has served as a director or trustee of the AB Funds since 2005 and is a director and Chairman of one other registered investment company. | 96 | The Asia Pacific Fund, Inc. (registered investment company) since prior to 2012 | |||||
| 92 | AB ALL MARKET REAL RETURN PORTFOLIO | abfunds.com |
MANAGEMENT OF THE FUND (continued)
| NAME, ADDRESS*, AGE, (YEAR FIRST ELECTED**) | PRINCIPAL OCCUPATION(S) DURING PAST FIVE YEARS AND OTHER INFORMATION*** | PORTFOLIOS IN FUND COMPLEX DIRECTOR | OTHER PUBLIC COMPANY | |||||
INDEPENDENT DIRECTORS (continued) | ||||||||
William H. Foulk, Jr.## 85 (1998) | Investment Adviser and an Independent Consultant since prior to 2012. Previously, he was Senior Manager of Barrett Associates, Inc., a registered investment adviser. He was formerly Deputy Comptroller and Chief Investment Officer of the State of New York and, prior thereto, Chief Investment Officer of the New York Bank for Savings. He has served as a director or trustee of various AB Funds since 1983, and was Chairman of the Independent Directors Committees of the AB Funds from 2003 until early February 2014. He served as Chairman of such AB Funds from 2003 through December 2013. He is also active in a number of mutual fund related organizations and committees. | 96 | None | |||||
D. James Guzy##,^ 81 (2005) | Chairman of the Board of SRC Computers, Inc. (semi-conductors), with which he has been associated since prior to 2012. He served as Chairman of the Board of PLX Technology (semi-conductors) since prior to 2012 until November 2013. He was a director of Intel Corporation (semi-conductors) from 1969 until 2008, and served as Chairman of the Finance Committee of such company for several years until May 2008. He has served as a director or trustee of one or more of the AB Funds since 1982. | 93 | None | |||||
| abfunds.com | AB ALL MARKET REAL RETURN PORTFOLIO | 93 |
MANAGEMENT OF THE FUND (continued)
| NAME, ADDRESS*, AGE, (YEAR FIRST ELECTED**) | PRINCIPAL OCCUPATION(S) DURING PAST FIVE YEARS AND OTHER INFORMATION*** | PORTFOLIOS IN FUND COMPLEX DIRECTOR | OTHER PUBLIC COMPANY | |||||
INDEPENDENT DIRECTORS (continued) | ||||||||
Nancy P. Jacklin## 69 (2006) | Private Investor since prior to 2012. Professorial Lecturer at the Johns Hopkins School of Advanced International Studies (2008-2015). U.S. Executive Director of the International Monetary Fund (which is responsible for ensuring the stability of the international monetary system), (December 2002-May 2006); Partner, Clifford Chance (1992-2002); Sector Counsel, International Banking and Finance, and Associate General Counsel, Citicorp (1985-1992); Assistant General Counsel (International), Federal Reserve Board of Governors (1982-1985); and Attorney Advisor, U.S. Department of the Treasury (1973-1982). Member of the Bar of the District of Columbia and of New York; and member of the Council on Foreign Relations. She has served as a director or trustee of the AB Funds since 2006 and has been Chairman of the Governance and Nominating Committees of the AB Funds since August 2014. | 96 | None | |||||
| 94 | AB ALL MARKET REAL RETURN PORTFOLIO | abfunds.com |
MANAGEMENT OF THE FUND (continued)
| NAME, ADDRESS*, AGE, (YEAR FIRST ELECTED**) | PRINCIPAL OCCUPATION(S) DURING PAST FIVE YEARS AND OTHER INFORMATION*** | PORTFOLIOS IN FUND COMPLEX DIRECTOR | OTHER PUBLIC COMPANY | |||||
INDEPENDENT DIRECTORS (continued) | ||||||||
Carol C. McMullen## 62 (2016) | Managing Director of Slalom Consulting (consulting) since 2014, private investor and member of the Partners Healthcare Investment Committee. Formerly, Director of Norfolk & Dedham Group (mutual property and casualty insurance) from 2011 until November 2016; Director of Partners Community Physicians Organization (healthcare) from 2014 until December 2016; and Managing Director of The Crossland Group (consulting) from 2012 until 2013. She has held a number of senior positions in the asset and wealth management industries, including at Eastern Bank (where her roles included President of Eastern Wealth Management), Thomson Financial (Global Head of Sales for Investment Management), and Putnam Investments (where her roles included Head of Global Investment Research). She has served on a number of private company and nonprofit boards, and as a director or trustee of the AB Funds since June 2016. | 96 | None | |||||
| abfunds.com | AB ALL MARKET REAL RETURN PORTFOLIO | 95 |
MANAGEMENT OF THE FUND (continued)
| NAME, ADDRESS*, AGE, (YEAR FIRST ELECTED**) | PRINCIPAL OCCUPATION(S) DURING PAST FIVE YEARS AND OTHER INFORMATION*** | PORTFOLIOS IN FUND COMPLEX DIRECTOR | OTHER PUBLIC COMPANY | |||||
INDEPENDENT DIRECTORS (continued) | ||||||||
Garry L. Moody## 65 (2008) | Independent Consultant. Formerly, Partner, Deloitte & Touche LLP (1995-2008) where he held a number of senior positions, including Vice Chairman, and U.S. and Global Investment Management Practice Managing Partner; President, Fidelity Accounting and Custody Services Company (1993-1995), where he was responsible for accounting, pricing, custody and reporting for the Fidelity mutual funds; and Partner, Ernst & Young LLP (1975-1993), where he served as the National Director of Mutual Fund Tax Services and Managing Partner of its Chicago Office Tax department. He is a member of the Trustee Advisory Board of BoardIQ, a biweekly publication focused on issues and news affecting directors of mutual funds. He has served as a director or trustee, and as Chairman of the Audit Committees, of the AB Funds since 2008. | 96 | None | |||||
Earl D. Weiner## 78 (2007) | Of Counsel, and Partner prior to January 2007, of the law firm Sullivan & Cromwell LLP and is a former member of the ABA Federal Regulation of Securities Committee Task Force to draft editions of the Fund Director’s Guidebook. He also serves as a director or trustee of various non-profit organizations and has served as Chairman or Vice Chairman of a number of them. He has served as a director or trustee of the AB Funds since 2007 and served as Chairman of the Governance and Nominating Committees of the AB Funds from 2007 until August 2014. | 96 | None | |||||
| 96 | AB ALL MARKET REAL RETURN PORTFOLIO | abfunds.com |
MANAGEMENT OF THE FUND (continued)
| * | The address for each of the Strategy’s disinterested Directors is c/o AllianceBernstein L.P., Attention: Office of the Senior Officer, 1345 Avenue of the Americas, New York, NY 10105. |
| ** | There is no stated term of office for the Strategy’s Directors. |
| *** | The information above includes each Director’s principal occupation during the last five years and other information relating to the experience, attributes and skills relevant to each Director’s qualifications to serve as a Director, which led to the conclusion that each Director should serve as a Director for the Strategy. |
| # | Mr. Keith is an “interested person” of the Strategy as defined in the “40 Act”, due to his position as a Senior Vice President of the Adviser. |
| ## | Member of the Audit Committee, the Governance and Nominating Committee and the Independent Directors Committee. |
| ^ | Messrs. Dobkin and Guzy are expected to retire on or about December 31, 2017. |
| abfunds.com | AB ALL MARKET REAL RETURN PORTFOLIO | 97 |
MANAGEMENT OF THE FUND (continued)
Officer Information
Certain information concerning the Strategy’s Officers is listed below.
| NAME, ADDRESS* AND AGE | PRINCIPAL POSITION(S) HELD WITH FUND | PRINCIPAL OCCUPATION DURING PAST 5 YEARS | ||
Robert M. Keith 57 | President and Chief Executive Officer | See biography above. | ||
Philip L. Kirstein^ 72 | Senior Vice President and Independent Compliance Officer | Senior Vice President and Independent Compliance Officer of the AB Funds, with which he has been associated since October 2004. Prior thereto, he was Of Counsel to Kirkpatrick & Lockhart, LLP from October 2003 to October 2004, and General Counsel of Merrill Lynch Investment Managers, L.P. since prior to March 2003. | ||
Daniel J. Loewy 43 | Senior Vice President | Senior Vice President of the Adviser,** with which he has been associated since prior to 2012. | ||
Vadim Zlotnikov 55 | Senior Vice President | Senior Vice President of the Adviser,** with which he has been associated since prior to 2012. | ||
Vinod Chathlani 35 | Vice President | Vice President of the Adviser,** with which he has been associated since December 2013. Prior thereto, he was an investment risk manager at Oppenheimer Funds and a corporate investment strategist at Reliance Communications since prior to 2012. | ||
Emilie D. Wrapp 62 | Secretary | Senior Vice President, Assistant General Counsel and Assistant Secretary of ABI,** with which she has been associated since prior to 2012. | ||
Joseph J. Mantineo 58 | Treasurer and Chief Financial Officer | Senior Vice President of AllianceBernstein Investor Services, Inc, (“ABIS”),** with which he has been associated since prior to 2012. | ||
Phyllis J. Clarke 56 | Controller | Vice President of ABIS,** with which she has been associated since prior to 2012. | ||
Vincent S. Noto 53 | Chief Compliance Officer | Senior Vice President since 2015 and Mutual Fund Chief Compliance Officer of the Adviser** since 2014. Prior thereto, he was Vice President and Director of Mutual Fund Compliance of the Adviser** since prior to 2012. |
| * | The address for each of the Fund’s Officers is 1345 Avenue of the Americas, New York, NY 10105. |
| ** | The Adviser, ABI and ABIS are affiliates of the Strategy. |
| ^ | Mr. Kirstein is expected to retire on or about December 31, 2017. |
The Fund’s Statement of Additional Information (“SAI”) has additional information about the Strategy’s Directors and Officers and is available without charge upon request. Contact your financial representative or AB at 1-800-227-4618, or visit www.abfunds.com, for a free prospectus or SAI.
| 98 | AB ALL MARKET REAL RETURN PORTFOLIO | abfunds.com |
Information Regarding the Review and Approval of the Fund’s Advisory Agreement
The disinterested directors (the “directors”) of AB Bond Fund, Inc. (the “Company”) unanimously approved the continuance of the Company’s Advisory Agreement with the Adviser in respect of AB All Market Real Return Portfolio (the “Fund”) at a meeting held on November 1-3, 2016 (the “Meeting”).
Prior to approval of the continuance of the Advisory Agreement, the directors had requested from the Adviser, and received and evaluated, extensive materials. They reviewed the proposed continuance of the Advisory Agreement with the Adviser and with experienced counsel who are independent of the Adviser, who advised on the relevant legal standards. The directors also reviewed an independent evaluation prepared by the Company’s Senior Officer (who is also the Company’s Independent Compliance Officer) of the reasonableness of the advisory fee, in which the Senior Officer concluded that the contractual fee for the Fund was reasonable. The directors also discussed the proposed continuance in private sessions with counsel and the Company’s Senior Officer.
The directors considered their knowledge of the nature and quality of the services provided by the Adviser to the Fund gained from their experience as directors or trustees of most of the registered investment companies advised by the Adviser, their overall confidence in the Adviser’s integrity and competence they have gained from that experience, the Adviser’s initiative in identifying and raising potential issues with the directors and its responsiveness, frankness and attention to concerns raised by the directors in the past, including the Adviser’s willingness to consider and implement organizational and operational changes designed to improve investment results and the services provided to the AB Funds. The directors noted that they have four regular meetings each year, at each of which they receive presentations from the Adviser on the investment results of the Fund and review extensive materials and information presented by the Adviser.
The directors also considered all other factors they believed relevant, including the specific matters discussed below. In their deliberations, the directors did not identify any particular information that was all-important or controlling, and different directors may have attributed different weights to the various factors. The directors determined that the selection of the Adviser to manage the Fund and the overall arrangements between the Fund and the Adviser, as provided in the Advisory Agreement, including the advisory fee, were fair and reasonable in light of the services performed, expenses incurred and such other matters as the directors considered relevant in the exercise of their business judgment. The material
| abfunds.com | AB ALL MARKET REAL RETURN PORTFOLIO | 99 |
factors and conclusions that formed the basis for the directors’ determinations included the following:
Nature, Extent and Quality of Services Provided
The directors considered the scope and quality of services provided by the Adviser under the Advisory Agreement, including the quality of the investment research capabilities of the Adviser and the other resources it has dedicated to performing services for the Fund. They also noted the professional experience and qualifications of the Fund’s portfolio management team and other senior personnel of the Adviser. The directors also considered that the Advisory Agreement provides that the Fund will reimburse the Adviser for the cost to it of providing certain clerical, accounting, administrative and other services to the Fund by employees of the Adviser or its affiliates. Requests for these reimbursements are made on a quarterly basis and subject to approval by the directors. Reimbursements, to the extent requested and paid, result in a higher rate of total compensation from the Fund to the Adviser than the fee rate stated in the Advisory Agreement. The directors noted that the methodology used to determine the reimbursement amounts had been reviewed by an independent consultant retained by the Company’s Senior Officer. The quality of administrative and other services, including the Adviser’s role in coordinating the activities of the Fund’s other service providers, also was considered. The directors concluded that, overall, they were satisfied with the nature, extent and quality of services provided to the Fund under the Advisory Agreement.
Costs of Services Provided and Profitability
The directors reviewed a schedule of the revenues and expenses and related notes indicating the profitability of the Fund to the Adviser for calendar years 2014 and 2015 that had been prepared with an expense allocation methodology arrived at in consultation with an independent consultant retained by the Company’s Senior Officer. The directors noted the assumptions and methods of allocation used by the Adviser in preparing fund-specific profitability data and understood that there are a number of potentially acceptable allocation methodologies for information of this type. The directors noted that the profitability information reflected all revenues and expenses of the Adviser’s relationship with the Fund, including those relating to its subsidiaries that provide transfer agency, distribution and brokerage services to the Fund. The directors recognized that it is difficult to make comparisons of the profitability of the Advisory Agreement with the profitability of fund advisory contracts for unaffiliated funds because comparative information is not generally publicly available and is affected by numerous factors. The directors focused on the profitability of the Adviser’s relationship with the Fund before taxes and distribution expenses. The directors concluded that the Adviser’s level of profitability from its relationship with the Fund was not unreasonable.
| 100 | AB ALL MARKET REAL RETURN PORTFOLIO | abfunds.com |
Fall-Out Benefits
The directors considered the other benefits to the Adviser and its affiliates from their relationships with the Fund, including, but not limited to, benefits relating to soft dollar arrangements (whereby investment advisers receive brokerage and research services from brokers that execute transactions for their clients); 12b-1 fees and sales charges received by the Fund’s principal underwriter (which is a wholly owned subsidiary of the Adviser) in respect of certain classes of the Fund’s shares; brokerage commissions paid by the Fund to brokers affiliated with the Adviser; and transfer agency fees paid by the Fund to a wholly owned subsidiary of the Adviser. The directors recognized that the Adviser’s profitability would be somewhat lower without these benefits. The directors understood that the Adviser also might derive reputational and other benefits from its association with the Fund.
Investment Results
In addition to the information reviewed by the directors in connection with the Meeting, the directors receive detailed performance information for the Fund at each regular Board meeting during the year.
At the Meeting, the directors reviewed information prepared by Broadridge Financial Solutions, Inc. (“Broadridge”), an analytical service that is not affiliated with the Adviser, showing the performance of the Class A Shares of the Fund against a peer group and a peer universe selected by Broadridge, and information prepared by the Adviser showing performance of the Class A Shares against a broad-based securities market index, in each case for the 1-, 3- and 5-year periods ended July 31, 2016 and (in the case of comparisons with the broad-based securities market index) for the period from inception. Based on their review, and their discussion with the Adviser of the reasons for the Fund’s underperformance in certain periods, the directors concluded that the Fund’s investment performance was acceptable.
Advisory Fees and Other Expenses
The directors considered the advisory fee rate paid by the Fund to the Adviser and information prepared by Broadridge concerning advisory fee rates paid by other funds in the same Broadridge category as the Fund at a common asset level. The directors recognized that it is difficult to make comparisons of advisory fees because there are variations in the services that are included in the fees paid by other funds. The directors compared the Fund’s contractual advisory fee rate with a peer group median and took into account the impact on the advisory fee rate of the administrative expense reimbursement paid to the Adviser in the latest fiscal year.
The directors also considered the Adviser’s fee schedule for institutional clients pursuing a similar investment style. For this purpose, they reviewed the relevant advisory fee information from the Adviser’s Form ADV and the
| abfunds.com | AB ALL MARKET REAL RETURN PORTFOLIO | 101 |
evaluation from the Company’s Senior Officer and noted the differences between the Fund’s fee schedule, on the one hand, and the institutional fee schedule and the schedule of fees charged to any offshore funds and any sub-advised funds, on the other. The directors noted that the Adviser may, in some cases, agree to fee rates with large institutional clients that are lower than those reviewed by the directors and that they had previously discussed with the Adviser its policies in respect of such arrangements.
The Adviser reviewed with the directors the significantly greater scope of the services it provides to the Fund relative to institutional, offshore fund and sub-advised fund clients. In light of the substantial differences in services rendered by the Adviser to institutional, offshore fund and sub-advised fund clients as compared to funds such as the Fund, the directors considered these fee comparisons inapt and did not place significant weight on them in their deliberations.
The directors noted that the Fund invests in shares of exchange-traded funds (“ETFs”), subject to restrictions and limitations of the Investment Company Act of 1940 as these may be varied as a result of exemptive orders issued by the SEC. The directors noted that ETFs pay advisory fees pursuant to their advisory contracts, and that the Adviser had provided, and they had reviewed, information about the expense ratios of the relevant ETFs. The directors concluded, based on the Adviser’s explanation of how it uses ETFs when they are the most cost-effective way to obtain desired exposures for a fund or to temporarily “equitize” cash inflows pending purchases of underlying securities, that the advisory fee for the Fund is for services in addition to, rather than duplicative of, the services provided under the advisory contracts of the ETFs in which the Fund may invest.
The directors also considered the total expense ratio of the Class A shares of the Fund in comparison to a peer group and a peer universe selected by Broadridge. The Class A expense ratio of the Fund was based on the Fund’s latest fiscal year. The directors noted the effects of any fee waivers and/or expense reimbursements as a result of an undertaking by the Adviser. The directors noted that it was likely that the expense ratios of some of the other funds in the Fund’s Broadridge category were lowered by waivers or reimbursements by those funds’ investment advisers, which in some cases might be voluntary or temporary. The directors view expense ratio information as relevant to their evaluation of the Adviser’s services because the Adviser is responsible for coordinating services provided to the Fund by others. Based on their review, the directors concluded that the Fund’s expense ratio was acceptable.
Economies of Scale
The directors noted that the advisory fee schedule for the Fund does not contain breakpoints and that they had discussed their strong preference for breakpoints in advisory contracts with the Adviser. The directors took
| 102 | AB ALL MARKET REAL RETURN PORTFOLIO | abfunds.com |
into consideration prior presentations by an independent consultant on economies of scale in the mutual fund industry and for the AB Funds, and by the Adviser concerning certain of its views on economies of scale. The directors also had requested and received from the Adviser certain updates on economies of scale in advance of the Meeting. The directors believe that economies of scale may be realized (if at all) by the Adviser across a variety of products and services, and not only in respect of a single fund. The directors noted that there is no established methodology for setting breakpoints that give effect to the fund-specific services provided by a fund’s adviser and to the economies of scale that an adviser may realize in its overall mutual fund business or those components of it which directly or indirectly affect a fund’s operations. The directors observed that in the mutual fund industry as a whole, as well as among funds similar to the Fund, there is no uniformity or pattern in the fees and asset levels at which breakpoints (if any) apply. The directors also noted that the advisory agreements for many funds do not have breakpoints at all. The directors informed the Adviser that they would monitor the Fund’s assets (which were well below the level at which they would anticipate adding an initial breakpoint) and its profitability to the Adviser and anticipated revisiting the question of breakpoints in the future if circumstances warranted doing so.
| abfunds.com | AB ALL MARKET REAL RETURN PORTFOLIO | 103 |
This page is not part of the Shareholder Report or the Financial Statements.
AB FAMILY OF FUNDS
US EQUITY
US CORE
Core Opportunities Fund
FlexFee™ US Thematic Portfolio
Select US Equity Portfolio
US GROWTH
Concentrated Growth Fund
Discovery Growth Fund
FlexFee™ Large Cap Growth Portfolio
Growth Fund
Large Cap Growth Fund
Small Cap Growth Portfolio
US VALUE
Discovery Value Fund
Equity Income Fund
Relative Value Fund1
Small Cap Value Portfolio
Value Fund
INTERNATIONAL/ GLOBAL EQUITY
INTERNATIONAL/ GLOBAL CORE
Global Core Equity Portfolio
International Portfolio
International Strategic Core Portfolio
Sustainable Global Thematic Fund1
Tax-Managed International Portfolio
Tax-Managed Wealth Appreciation Strategy
Wealth Appreciation Strategy
INTERNATIONAL/ GLOBAL GROWTH
Concentrated International Growth Portfolio
International Growth Fund
INTERNATIONAL/ GLOBAL EQUITY (continued)
INTERNATIONAL/ GLOBAL VALUE
Asia ex-Japan Equity Portfolio
International Value Fund
FIXED INCOME
MUNICIPAL
High Income Municipal Portfolio
Intermediate California Municipal Portfolio
Intermediate Diversified Municipal Portfolio
Intermediate New York Municipal Portfolio
Municipal Bond Inflation Strategy
Tax-Aware Fixed Income Portfolio
National Portfolio
Arizona Portfolio
California Portfolio
Massachusetts Portfolio
Minnesota Portfolio
New Jersey Portfolio
New York Portfolio
Ohio Portfolio
Pennsylvania Portfolio
Virginia Portfolio
TAXABLE
Bond Inflation Strategy
FlexFee™ International Bond Portfolio
Global Bond Fund
High Income Fund
High Yield Portfolio
Income Fund
Intermediate Bond Portfolio
Limited Duration High Income Portfolio
Short Duration Portfolio
ALTERNATIVES
All Market Real Return Portfolio
Credit Long/Short Portfolio
Global Real Estate Investment Fund
Select US Long/Short Portfolio
Unconstrained Bond Fund
MULTI-ASSET
All Market Income Portfolio
All Market Total Return Portfolio1
Conservative Wealth Strategy
Emerging Markets Multi-Asset Portfolio
Global Risk Allocation Fund
Tax-Managed All Market Income Portfolio1
TARGET-DATE
Multi-Manager Select Retirement Allocation Fund
Multi-Manager Select 2010 Fund
Multi-Manager Select 2015 Fund
Multi-Manager Select 2020 Fund
Multi-Manager Select 2025 Fund
Multi-Manager Select 2030 Fund
Multi-Manager Select 2035 Fund
Multi-Manager Select 2040 Fund
Multi-Manager Select 2045 Fund
Multi-Manager Select 2050 Fund
Multi-Manager Select 2055 Fund
CLOSED-END FUNDS
Alliance California Municipal Income Fund
AllianceBernstein Global High Income Fund
AllianceBernstein National Municipal Income Fund
We also offer Government Money Market Portfolio1, which serves as the money market fund exchange vehicle for the AB mutual funds. An investment in Government Money Market Portfolio is not a deposit in a bank and is not insured or guaranteed by the Federal Deposit Insurance Corporation or any other government agency. Although the Fund seeks to preserve the value of your investment at $1.00 per share, it is possible to lose money by investing in the Fund.
Investors should consider the investment objectives, risks, charges and expenses of the Fund carefully before investing. For copies of our prospectus or summary prospectus, which contain this and other information, visit us online at www.abfunds.com or contact your AB representative. Please read the prospectus and/or summary prospectus carefully before investing.
| 1 | Prior to January 9, 2017, Relative Value Fund was named Growth & Income Fund; prior to April 17, 2017, Tax-Managed All Market Income Portfolio was named Tax-Managed Balanced Wealth Strategy; prior to April 24, 2017, All Market Total Return Portfolio was named Balanced Wealth Strategy; prior to November 10, 2017, Government Money Market Portfolio was named Government Exchange Reserves. |
| 104 | AB ALL MARKET REAL RETURN PORTFOLIO | abfunds.com |
NOTES
| abfunds.com | AB ALL MARKET REAL RETURN PORTFOLIO | 105 |
NOTES
| 106 | AB ALL MARKET REAL RETURN PORTFOLIO | abfunds.com |
NOTES
| abfunds.com | AB ALL MARKET REAL RETURN PORTFOLIO | 107 |
NOTES
| 108 | AB ALL MARKET REAL RETURN PORTFOLIO | abfunds.com |
AB ALL MARKET REAL RETURN PORTFOLIO
1345 Avenue of the Americas
New York, NY 10105
800 221 5672
AMRR-0151-1017 
OCT 10.31.17

ANNUAL REPORT
AB BOND INFLATION STRATEGY


| Investment Products Offered | • Are Not FDIC Insured • May Lose Value • Are Not Bank Guaranteed | |
Investors should consider the investment objectives, risks, charges and expenses of the Fund carefully before investing. For copies of our prospectus or summary prospectus, which contain this and other information, visit us online at www.abfunds.com or contact your AB representative. Please read the prospectus and/or summary prospectus carefully before investing.
This shareholder report must be preceded or accompanied by the Fund’s prospectus for individuals who are not current shareholders of the Fund.
You may obtain a description of the Fund’s proxy voting policies and procedures, and information regarding how the Fund voted proxies relating to portfolio securities during the most recent 12-month period ended June 30, without charge. Simply visit AB’s website at www.abfunds.com, or go to the Securities and Exchange Commission’s (the “Commission”) website at www.sec.gov, or call AB at (800) 227 4618.
The Fund files its complete schedule of portfolio holdings with the Commission for the first and third quarters of each fiscal year on Form N-Q. The Fund’s Forms N-Q are available on the Commission’s website at www.sec.gov. The Fund’s Forms N-Q may also be reviewed and copied at the Commission’s Public Reference Room in Washington, DC; information on the operation of the Public Reference Room may be obtained by calling (800) SEC 0330. AB publishes full portfolio holdings for the Fund monthly at www.abfunds.com.
AllianceBernstein Investments, Inc. (ABI) is the distributor of the AB family of mutual funds. ABI is a member of FINRA and is an affiliate of AllianceBernstein L.P., the Adviser of the funds.
The [A/B] logo is a registered service mark of AllianceBernstein and AllianceBernstein® is a registered service mark used by permission of the owner, AllianceBernstein L.P.
| FROM THE PRESIDENT |  |
Dear Shareholder,
We are pleased to provide this report for AB Bond Inflation Strategy (the “Strategy”). Please review the discussion of Strategy performance, the market conditions during the reporting period and the Strategy’s investment strategy.
As always, AB strives to keep clients ahead of what’s next by:
| + | Transforming uncommon insights into uncommon knowledge with a global research scope |
| + | Navigating markets with seasoned investment experience and sophisticated solutions |
| + | Providing thoughtful investment insights and actionable ideas |
Whether you’re an individual investor or a multi-billion-dollar institution, we put knowledge and experience to work for you.
AB’s global research organization connects and collaborates across platforms and teams to deliver impactful insights and innovative products. Better insights lead to better opportunities—anywhere in the world.
For additional information about AB’s range of products and shareholder resources, please log on to www.abfunds.com.
Thank you for your investment in the AB Mutual Funds.
Sincerely,

Robert M. Keith
President and Chief Executive Officer, AB Mutual Funds
| abfunds.com | AB BOND INFLATION STRATEGY | 1 |
ANNUAL REPORT
December 13, 2017
This report provides management’s discussion of fund performance for AB Bond Inflation Strategy for the annual reporting period ended October 31, 2017.
The Strategy’s investment objective is to maximize real return without assuming what the Adviser considers to be undue risk.
NAV RETURNS AS OF OCTOBER 31, 2017 (unaudited)
| 6 Months | 12 Months | |||||||
| AB BOND INFLATION STRATEGY | ||||||||
| Class 1 Shares1 | 0.28% | 1.01% | ||||||
| Class 2 Shares1 | 0.43% | 1.21% | ||||||
| Class A Shares | 0.29% | 0.91% | ||||||
| Class C Shares | -0.16% | 0.16% | ||||||
| Advisor Class Shares2 | 0.33% | 1.15% | ||||||
| Class R Shares2,3 | 0.12% | 0.71% | ||||||
| Class K Shares2 | 0.29% | 0.96% | ||||||
| Class I Shares2 | 0.42% | 1.15% | ||||||
| Class Z Shares2 | 0.43% | 1.19% | ||||||
| Bloomberg Barclays 1-10 Year TIPS Index | 0.02% | 0.14% | ||||||
| 1 | Class 1 shares are only available to Bernstein Global Wealth Management private client accounts. Class 2 shares are only available to large Bernstein Global Wealth Management private client accounts and the Adviser’s institutional clients or through other limited arrangements. |
| 2 | Please note that these share classes are for investors purchasing shares through accounts established under certain fee-based programs sponsored and maintained by certain broker-dealers and financial intermediaries, institutional pension plans and/or investment advisory clients of, and certain other persons associated with, the Adviser and its affiliates or the Strategy. |
| 3 | The returns shown are based on net asset values calculated for shareholder transactions and may differ from the returns shown in the Financial Highlights, which reflect adjustments made to the net asset values in accordance with accounting principles generally accepted in the United States of America. |
INVESTMENT RESULTS
The table above shows the Strategy’s performance compared to its benchmark, the Bloomberg Barclays 1-10 Year Treasury Inflation-Protected Securities (“TIPS”) Index, for the six- and 12-month periods ended October 31, 2017.
During the 12-month period, all share classes of the Strategy outperformed the benchmark, before sales charges. Sector allocation contributed relative to the benchmark, primarily because of exposures to investment-grade corporates, agency risk-sharing bonds and high-yield
| 2 | AB BOND INFLATION STRATEGY | abfunds.com |
corporates. Currency positioning was also a modest positive, helped by an overweight in the Colombian peso and a short position in the Singapore dollar. Underweight positions in the Canadian and Australian dollars detracted. The Strategy’s longer-than-benchmark TIPS duration also detracted, as yields rose over the period.
During the six-month period, all share classes of the Strategy outperformed the benchmark, before sales charges, except Class C shares. Sector positioning contributed relative to the benchmark, primarily because of exposures to investment-grade and high-yield corporates as well as non-agency mortgages. Currency positioning detracted from performance. Underweights in the Australian and Canadian dollars were negative.
During both periods, the Strategy utilized currency forwards to hedge currency risk and actively manage currency positions. Credit default swaps were utilized for hedging and investment purposes, which overall had a negative impact on performance. Treasury futures and interest rate swaps were utilized to manage the duration, country exposure and yield-curve positioning of the Strategy. Consumer Price Index (“CPI”) swaps were used to hedge inflation and for investment purposes, which had an immaterial impact on returns. Purchased options were utilized to hedge market risk in both periods, which had an immaterial impact on returns. Interest rate swaptions were used to hedge interest rate risk in the 12-month period.
MARKET REVIEW AND INVESTMENT STRATEGY
Political events and central bank action had a significant impact on bond markets in the six- and 12-month periods ended October 31, 2017. Donald Trump’s US election victory and the promise of fiscal stimulus, a retreat from globalization and relaxed regulation were treated as positive developments by financial markets. However, uncertainty regarding the Trump administration’s ability to implement meaningful change increased through the 12-month period. UK prime minister Theresa May surprised investors when she called for a snap parliamentary election in an effort to firm up the UK’s mandate going into Brexit negotiations. However, the results of the vote increased political uncertainty when May’s Conservative Party failed to secure a majority position. Investors were relieved when centrist, pro-EU candidate Emmanuel Macron was elected president of France, as his reformist agenda was seen as more business friendly than the protectionist policies espoused by his opponent. In June, the US Federal Reserve (the “Fed”) raised interest rates for the third consecutive quarter, hikes that were well-telegraphed and universally anticipated by markets. Late in the period, the Fed formally confirmed that its balance sheet reduction program would start in October, while the European Central Bank announced that it would start to taper the pace of its monthly asset purchases in January 2018.
| abfunds.com | AB BOND INFLATION STRATEGY | 3 |
Emerging-market debt rallied over both periods, helped by a positive global growth story and increasing oil prices. Outside of Europe, developed-market treasury yields generally rose; in the eurozone and UK, yields moved in different directions. Emerging-market local-currency government bonds, developed-market treasuries and investment-grade credit securities all rose in both periods, yet trailed the rally in global high yield. Within high yield, performance was almost uniformly positive, led by the transportation and basic industries sectors, while consumer sectors tended to lag the rising market.
INVESTMENT POLICIES
The Strategy seeks real return. Real return is the rate of return after adjusting for inflation. The Strategy pursues its objective by investing principally in inflation-indexed securities (such as TIPS or inflation-indexed securities from issuers other than the US Treasury) or by gaining inflation protection through derivatives transactions, such as inflation (CPI) swaps or total return swaps linked to TIPS. In deciding whether to purchase inflation-indexed securities or use inflation-linked derivatives transactions, the Adviser will consider the relative costs and efficiency of each method. In addition, in seeking to maximize real return, the Strategy may also invest in other fixed-income investments, such as US and non-US government securities, corporate fixed-income securities and mortgage-related securities, as well as derivatives linked to such securities.
Under normal circumstances, the Strategy invests at least 80% of its net assets in fixed-income securities. While the Strategy expects to invest principally in investment-grade securities, it may invest up to 15% of its total assets in fixed-income securities rated BB or B or the equivalent by at least one national rating agency (or deemed by the Adviser to be of comparable credit quality), which are not investment-grade (“junk bonds”).
Inflation-indexed securities are fixed-income securities structured to provide protection against inflation. Their principal value and/or the interest paid on them are adjusted to reflect official inflation measures. The inflation measure for TIPS is the CPI for Urban Consumers. The Strategy may also invest in other inflation-indexed securities, issued by both US and non-US issuers, and in derivative instruments linked to these securities.
The Strategy may invest in derivatives, such as options, futures contracts, forwards or swaps. The Strategy intends to use leverage for investment purposes. To do this, the Strategy expects to enter into (i) reverse repurchase agreement transactions and use the cash made available from these transactions to make additional investments in
| 4 | AB BOND INFLATION STRATEGY | abfunds.com |
(continued on next page)
fixed-income securities in accordance with the Strategy’s investment policies and (ii) total return swaps. In determining when and to what extent to employ leverage or enter into derivatives transactions, the Adviser will consider factors such as the relative risks and returns expected of potential investments and the costs of such transactions. The Adviser will consider the impact of reverse repurchase agreements, swaps and other derivatives in making its assessments of the Strategy’s risks. The resulting exposures to markets, sectors, issuers or specific securities will be continuously monitored by the Adviser.
The Adviser selects securities for purchase or sale based on its assessment of the securities’ risk and return characteristics as well as the securities’ impact on the overall risk and return characteristics of the Strategy. In making this assessment, the Adviser takes into account various factors, including the credit quality and sensitivity to interest rates of the securities under consideration and of the Strategy’s other holdings.
The Strategy may also invest in loan participations, structured securities, asset-backed securities, variable, floating, and inverse floating-rate instruments, and preferred stock, and may use other investment techniques. The Strategy may invest in fixed-income securities of any maturity and duration. If the rating of a fixed-income security falls below investment-grade, the Strategy will not be obligated to sell the security and may continue to hold it if, in the Adviser’s opinion, the investment is appropriate under the circumstances.
| abfunds.com | AB BOND INFLATION STRATEGY | 5 |
DISCLOSURES AND RISKS
Benchmark Disclosure
The Bloomberg Barclays 1-10 Year TIPS Index is unmanaged and does not reflect fees and expenses associated with the active management of a mutual fund portfolio. The Bloomberg Barclays 1-10 Year TIPS Index represents the performance of inflation-protected securities issued by the US Treasury. An investor cannot invest directly in an index, and its results are not indicative of the performance for any specific investment, including the Strategy.
A Word About Risk
Market Risk: The value of the Strategy’s assets will fluctuate as the bond market fluctuates. The value of the Strategy’s investments may decline, sometimes rapidly and unpredictably, simply because of economic changes or other events that affect large portions of the market.
Credit Risk: An issuer or guarantor of a fixed-income security, or the counterparty to a derivatives or other contract, may be unable or unwilling to make timely payments of interest or principal, or to otherwise honor its obligations. The issuer or guarantor may default, causing a loss of the full principal amount of a security. The degree of risk for a particular security may be reflected in its credit rating. There is the possibility that the credit rating of a fixed-income security may be downgraded after purchase, which may adversely affect the value of the security. Investments in fixed-income securities with lower ratings tend to have a higher probability that an issuer will default or fail to meet its payment obligations.
Interest Rate Risk: Changes in interest rates will affect the value of investments in fixed-income securities. When interest rates rise, the value of existing investments in fixed-income securities tends to fall and this decrease in value may not be offset by higher income from new investments. The Strategy may be subject to heightened interest rate risk due to rising rates as the current period of historically low rates may be ending. Interest rate risk is generally greater for fixed-income securities with longer maturities or durations.
Duration Risk: Duration is a measure that relates the expected price volatility of a fixed-income security to changes in interest rates. The duration of a fixed-income security may be shorter than or equal to full maturity of a fixed-income security. Fixed-income securities with longer durations have more risk and will decrease in price as interest rates rise. For example, a fixed-income security with a duration of three years will decrease in value by approximately 3% if interest rates increase by 1%.
Inflation Risk: This is the risk that the value of assets or income from investments will be less in the future as inflation decreases the value of money. As inflation increases, the value of the Strategy’s assets can
| 6 | AB BOND INFLATION STRATEGY | abfunds.com |
DISCLOSURES AND RISKS (continued)
decline as can the value of the Strategy’s distributions. This risk is significantly greater for fixed-income securities with longer maturities. Although the Strategy invests principally in inflation-indexed securities, the value of its securities may be vulnerable to changes in expectations of inflation or interest rates.
Derivatives Risk: Derivatives may be illiquid, difficult to price, and leveraged so that small changes may produce disproportionate losses for the Strategy, and may be subject to counterparty risk to a greater degree than more traditional investments.
Foreign (Non-US) Risk: Investments in securities of non-US issuers may involve more risk than those of US issuers. These securities may fluctuate more widely in price and may be less liquid due to adverse market, economic, political, regulatory or other factors.
Currency Risk: Fluctuations in currency exchange rates may negatively affect the value of the Strategy’s investments or reduce its returns.
Leverage Risk: To the extent the Strategy uses leveraging techniques, its net asset value (“NAV”) may be more volatile because leverage tends to exaggerate the effect of changes in interest rates and any increase or decrease in the value of the Strategy’s investments.
Liquidity Risk: Liquidity risk occurs when certain investments become difficult to purchase or sell. Difficulty in selling less liquid securities may result in sales at disadvantageous prices affecting the value of your investment in the Strategy. Causes of liquidity risk may include low trading volumes, large positions and heavy redemptions of Strategy shares. Over recent years liquidity risk has also increased because the capacity of dealers in the secondary market for fixed-income securities to make markets in these securities has decreased, even as the overall bond market has grown significantly, due to, among other things, structural changes, additional regulatory requirements and capital and risk restraints that have led to reduced inventories. Liquidity risk may be higher in a rising interest rate environment, when the value and liquidity of fixed-income securities generally go down.
Management Risk: The Strategy is subject to management risk because it is an actively managed investment fund. The Adviser will apply its investment techniques and risk analyses in making investment decisions, but there is no guarantee that its techniques will produce the intended results.
These risks are fully discussed in the Strategy’s prospectus. As with all investments, you may lose money by investing in the Strategy.
| abfunds.com | AB BOND INFLATION STRATEGY | 7 |
DISCLOSURES AND RISKS (continued)
An Important Note About Historical Performance
The investment return and principal value of an investment in the Strategy will fluctuate, so that shares, when redeemed, may be worth more or less than their original cost. Performance shown in this report represents past performance and does not guarantee future results. Current performance may be lower or higher than the performance information shown. You may obtain performance information current to the most recent month-end by visiting www.abfunds.com. For Class 1 shares, go to www.bernstein.com and click on “Investments”, then “Mutual Fund Information—Mutual Fund Performance at a Glance”.
All fees and expenses related to the operation of the Strategy have been deducted. NAV returns do not reflect sales charges; if sales charges were reflected, the Strategy’s quoted performance would be lower. SEC returns reflect the applicable sales charges for each share class: a 4.25% maximum front-end sales charge for Class A shares and a 1% 1-year contingent deferred sales charge for Class C shares. Class 1 and Class 2 shares do not carry sales charges. Returns for the different share classes will vary due to different expenses associated with each class. Performance assumes reinvestment of distributions and does not account for taxes.
| 8 | AB BOND INFLATION STRATEGY | abfunds.com |
HISTORICAL PERFORMANCE
GROWTH OF A $10,000 INVESTMENT IN THE STRATEGY (unaudited)
1/26/20101 TO 10/31/2017
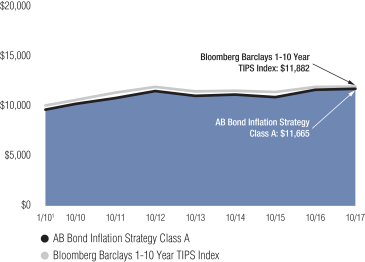
This chart illustrates the total value of an assumed $10,000 investment in AB Bond Inflation Strategy Class A shares (from 1/26/20101 to 10/31/2017) as compared to the performance of the Strategy’s benchmark. The chart reflects the deduction of the maximum 4.25% sales charge from the initial $10,000 investment in the Strategy and assumes the reinvestment of dividends and capital gains distributions.
| 1 | Inception date: 1/26/2010. |
| abfunds.com | AB BOND INFLATION STRATEGY | 9 |
HISTORICAL PERFORMANCE (continued)
AVERAGE ANNUAL RETURNS AS OF OCTOBER 31, 2017 (unaudited)
| NAV Returns | SEC Returns (reflects applicable sales charges) | SEC Yields1 | ||||||||||
| CLASS 1 SHARES2 | 0.19% | |||||||||||
| 1 Year | 1.01% | 1.01% | ||||||||||
| 5 Years | 0.56% | 0.56% | ||||||||||
| Since Inception3 | 2.78% | 2.78% | ||||||||||
| CLASS 2 SHARES2 | 0.29% | |||||||||||
| 1 Year | 1.21% | 1.21% | ||||||||||
| 5 Years | 0.66% | 0.66% | ||||||||||
| Since Inception3 | 2.87% | 2.87% | ||||||||||
| CLASS A SHARES | -0.26% | |||||||||||
| 1 Year | 0.91% | -3.34% | ||||||||||
| 5 Years | 0.39% | -0.47% | ||||||||||
| Since Inception3 | 2.57% | 2.00% | ||||||||||
| CLASS C SHARES | -1.02% | |||||||||||
| 1 Year | 0.16% | -0.83% | ||||||||||
| 5 Years | -0.34% | -0.34% | ||||||||||
| Since Inception3 | 1.84% | 1.84% | ||||||||||
| ADVISOR CLASS SHARES4 | -0.03% | |||||||||||
| 1 Year | 1.15% | 1.15% | ||||||||||
| 5 Years | 0.64% | 0.64% | ||||||||||
| Since Inception3 | 2.85% | 2.85% | ||||||||||
| CLASS R SHARES4 | -0.09% | |||||||||||
| 1 Year | 0.71% | 0.71% | ||||||||||
| 5 Years | 0.17% | 0.17% | ||||||||||
| Since Inception3 | 2.37% | 2.37% | ||||||||||
| CLASS K SHARES4 | -0.14% | |||||||||||
| 1 Year | 0.96% | 0.96% | ||||||||||
| 5 Years | 0.42% | 0.42% | ||||||||||
| Since Inception3 | 2.61% | 2.61% | ||||||||||
| CLASS I SHARES4 | 0.20% | |||||||||||
| 1 Year | 1.15% | 1.15% | ||||||||||
| 5 Years | 0.68% | 0.68% | ||||||||||
| Since Inception3 | 2.88% | 2.88% | ||||||||||
| CLASS Z SHARES4 | 0.29% | |||||||||||
| 1 Year | 1.19% | 1.19% | ||||||||||
| Since Inception3 | 2.45% | 2.45% | ||||||||||
(footnotes continued on next page)
| 10 | AB BOND INFLATION STRATEGY | abfunds.com |
HISTORICAL PERFORMANCE (continued)
The Strategy’s prospectus fee table shows the Strategy’s total annual operating expense ratios as 1.03%, 0.93%, 1.41%, 2.16%, 1.16%, 1.71%, 1.36%, 1.03% and 0.95% for Class 1, Class 2, Class A, Class C, Advisor Class, Class R, Class K, Class I and Class Z shares, respectively, gross of any fee waivers or expense reimbursements. Contractual fee waivers and/or expense reimbursements limit the Strategy’s annual operating expenses (exclusive of interest expense) to 0.60%, 0.50%, 0.75%, 1.50%, 0.50%, 1.00%, 0.75%, 0.50% and 0.50% for Class 1, Class 2, Class A, Class C, Advisor Class, Class R, Class K, Class I and Class Z shares, respectively. These waivers/reimbursements may not be terminated before January 31, 2018 and may be extended by the Adviser for additional one-year terms. Absent reimbursements or waivers, performance would have been lower. The Financial Highlights section of this report sets forth expense ratio data for the current reporting period; the expense ratios shown above may differ from the expense ratios in the Financial Highlights sections since they are based on different time periods.
| 1 | SEC yields are calculated based on SEC guidelines for the 30-day period ended October 31, 2017. |
| 2 | Class 1 shares are only available to Bernstein Global Wealth Management private client accounts. Class 2 shares are only available to large Bernstein Global Wealth Management private client accounts and the Adviser’s institutional clients or through other limited arrangements. These share classes do not carry front-end sales charges; therefore their respective NAV and SEC returns are the same. |
| 3 | Inception dates: 1/26/2010 for Class 1, Class 2, Class A, Class C, Advisor Class, Class R, Class K and Class I shares; 12/11/2014 for Class Z shares. |
| 4 | These share classes are offered at NAV to eligible investors and their SEC returns are the same as their NAV returns. Please note that these share classes are for investors purchasing shares through accounts established under certain fee-based programs sponsored and maintained by certain broker-dealers and financial intermediaries, institutional pension plans and/or investment advisory clients of, and certain other persons associated with, the Adviser and its affiliates or the Strategy. |
| abfunds.com | AB BOND INFLATION STRATEGY | 11 |
HISTORICAL PERFORMANCE (continued)
SEC AVERAGE ANNUAL RETURNS
AS OF THE MOST RECENT CALENDAR QUARTER-END
SEPTEMBER 30, 2017 (unaudited)
| SEC Returns (reflects applicable sales charges) | ||||
| CLASS 1 SHARES1 | ||||
| 1 Year | 0.97% | |||
| 5 Years | 0.64% | |||
| Since Inception2 | 2.79% | |||
| CLASS 2 SHARES1 | ||||
| 1 Year | 0.98% | |||
| 5 Years | 0.73% | |||
| Since Inception2 | 2.87% | |||
| CLASS A SHARES | ||||
| 1 Year | -3.55% | |||
| 5 Years | -0.41% | |||
| Since Inception2 | 2.00% | |||
| CLASS C SHARES | ||||
| 1 Year | -0.96% | |||
| 5 Years | -0.25% | |||
| Since Inception2 | 1.84% | |||
| ADVISOR CLASS SHARES3 | ||||
| 1 Year | 1.01% | |||
| 5 Years | 0.74% | |||
| Since Inception2 | 2.87% | |||
| CLASS R SHARES3 | ||||
| 1 Year | 0.47% | |||
| 5 Years | 0.24% | |||
| Since Inception2 | 2.37% | |||
| CLASS K SHARES3 | ||||
| 1 Year | 0.81% | |||
| 5 Years | 0.48% | |||
| Since Inception2 | 2.61% | |||
| CLASS I SHARES3 | ||||
| 1 Year | 1.00% | |||
| 5 Years | 0.74% | |||
| Since Inception2 | 2.88% | |||
| CLASS Z SHARES3 | ||||
| 1 Year | 0.97% | |||
| Since Inception2 | 2.42% | |||
(footnotes continued on next page)
| 12 | AB BOND INFLATION STRATEGY | abfunds.com |
HISTORICAL PERFORMANCE (continued)
| 1 | Class 1 shares are only available to Bernstein Global Wealth Management private client accounts. Class 2 shares are only available to large Bernstein Global Wealth Management private client accounts and the Adviser’s institutional clients or through other limited arrangements. |
| 2 | Inception dates: 1/26/2010 for Class 1, Class 2, Class A, Class C, Advisor Class, Class R, Class K and Class I shares; 12/11/2014 for Class Z shares. |
| 3 | Please note that these share classes are for investors purchasing shares through accounts established under certain fee-based programs sponsored and maintained by certain broker-dealers and financial intermediaries, institutional pension plans and/or investment advisory clients of, and certain other persons associated with, the Adviser and its affiliates or the Strategy. |
| abfunds.com | AB BOND INFLATION STRATEGY | 13 |
EXPENSE EXAMPLE
(unaudited)
As a shareholder of a mutual fund, you may incur two types of costs: (1) transaction costs, including sales charges (loads) on purchase payments, contingent deferred sales charges on redemptions and (2) ongoing costs, including management fees; distribution (12b-1) fees; and other fund expenses. This example is intended to help you understand your ongoing costs (in dollars) of investing in the Fund and to compare these costs with the ongoing costs of investing in other mutual funds.
The Example is based on an investment of $1,000 invested at the beginning of the period and held for the entire period as indicated below.
Actual Expenses
The table below provides information about actual account values and actual expenses. You may use the information in this line, together with the amount you invested, to estimate the expenses that you paid over the period. Simply divide your account value by $1,000 (for example, an $8,600 account value divided by $1,000 = 8.6), then multiply the result by the number in the first line under the heading entitled “Expenses Paid During Period” to estimate the expenses you paid on your account during this period.
Hypothetical Example for Comparison Purposes
The table below provides information about hypothetical account values and hypothetical expenses based on the Fund’s actual expense ratio and an assumed annual rate of return of 5% before expenses, which is not the Fund’s actual return. The hypothetical account values and expenses may not be used to estimate the actual ending account balance or expenses you paid for the period. You may use this information to compare the ongoing costs of investing in the Fund and other funds by comparing this 5% hypothetical example with the 5% hypothetical examples that appear in the shareholder reports of other funds.
Please note that the expenses shown in the table are meant to highlight your ongoing costs only and do not reflect any transactional costs, such as sales charges (loads), or contingent deferred sales charges on redemptions. Therefore, the hypothetical example is useful in comparing ongoing costs only, and will not help you determine the relative total costs of owning different funds. In addition, if these transactional costs were included, your costs would have been higher.
| 14 | AB BOND INFLATION STRATEGY | abfunds.com |
EXPENSE EXAMPLE (continued)
| Beginning Account Value May 1, 2017 | Ending Account Value October 31, 2017 | Expenses Paid During Period* | Annualized Expense Ratio* | Total Expenses Paid During Period+ | Total Annualized Expense Ratio+ | |||||||||||||||||||
| Class A | ||||||||||||||||||||||||
Actual | $ | 1,000 | $ | 1,002.90 | $ | 5.20 | 1.03 | % | $ | 5.25 | 1.04 | % | ||||||||||||
Hypothetical** | $ | 1,000 | $ | 1,020.01 | $ | 5.24 | 1.03 | % | $ | 5.30 | 1.04 | % | ||||||||||||
| Class C | ||||||||||||||||||||||||
Actual | $ | 1,000 | $ | 998.40 | $ | 8.97 | 1.78 | % | $ | 8.97 | 1.78 | % | ||||||||||||
Hypothetical** | $ | 1,000 | $ | 1,016.23 | $ | 9.05 | 1.78 | % | $ | 9.05 | 1.78 | % | ||||||||||||
| Advisor Class | ||||||||||||||||||||||||
Actual | $ | 1,000 | $ | 1,003.30 | $ | 3.94 | 0.78 | % | $ | 3.99 | 0.79 | % | ||||||||||||
Hypothetical** | $ | 1,000 | $ | 1,021.27 | $ | 3.97 | 0.78 | % | $ | 4.02 | 0.79 | % | ||||||||||||
| Class R | ||||||||||||||||||||||||
Actual | $ | 1,000 | $ | 1,002.10 | $ | 6.61 | 1.31 | % | $ | 6.66 | 1.32 | % | ||||||||||||
Hypothetical** | $ | 1,000 | $ | 1,018.60 | $ | 6.67 | 1.31 | % | $ | 6.72 | 1.32 | % | ||||||||||||
| Class K | ||||||||||||||||||||||||
Actual | $ | 1,000 | $ | 1,002.90 | $ | 5.20 | 1.03 | % | $ | 5.25 | 1.04 | % | ||||||||||||
Hypothetical** | $ | 1,000 | $ | 1,020.01 | $ | 5.24 | 1.03 | % | $ | 5.30 | 1.04 | % | ||||||||||||
| Class I | ||||||||||||||||||||||||
Actual | $ | 1,000 | $ | 1,004.20 | $ | 3.94 | 0.78 | % | $ | 3.94 | 0.78 | % | ||||||||||||
Hypothetical** | $ | 1,000 | $ | 1,021.27 | $ | 3.97 | 0.78 | % | $ | 3.97 | 0.78 | % | ||||||||||||
| Class 1 | ||||||||||||||||||||||||
Actual | $ | 1,000 | $ | 1,002.80 | $ | 4.44 | 0.88 | % | $ | 4.49 | 0.89 | % | ||||||||||||
Hypothetical** | $ | 1,000 | $ | 1,020.77 | $ | 4.48 | 0.88 | % | $ | 4.53 | 0.89 | % | ||||||||||||
| Class 2 | ||||||||||||||||||||||||
Actual | $ | 1,000 | $ | 1,004.30 | $ | 3.94 | 0.78 | % | $ | 3.99 | 0.79 | % | ||||||||||||
Hypothetical** | $ | 1,000 | $ | 1,021.27 | $ | 3.97 | 0.78 | % | $ | 4.02 | 0.79 | % | ||||||||||||
| Class Z | ||||||||||||||||||||||||
Actual | $ | 1,000 | $ | 1,004.30 | $ | 3.94 | 0.78 | % | $ | 3.99 | 0.79 | % | ||||||||||||
Hypothetical** | $ | 1,000 | $ | 1,021.27 | $ | 3.97 | 0.78 | % | $ | 4.02 | 0.79 | % | ||||||||||||
| * | Expenses are equal to each classes’ annualized expense ratios, multiplied by the average account value over the period, multiplied by 184/365 (to reflect the one-half year period). |
| ** | Assumes 5% annual return before expenses. |
| + | In connection with the Strategy’s investments in affiliated/unaffiliated underlying portfolios, the Strategy incurs no direct expenses, but bears proportionate shares of the fees and expenses (i.e., operating, administrative and investment advisory fees) of the affiliated/unaffiliated underlying portfolios. The Adviser has contractually agreed to waive its fees from the Strategy in an amount equal to the Strategy’s pro rata share of certain acquired fund fees and expenses of the affiliated underlying portfolios. The Strategy’s total expenses are equal to the classes’ annualized expense ratio plus the Strategy’s pro rata share of the weighted average expense ratio of the affiliated/unaffiliated underlying portfolios in which it invests, multiplied by the average account value over the period, multiplied by 184/365 (to reflect the one-half year period). |
| abfunds.com | AB BOND INFLATION STRATEGY | 15 |
PORTFOLIO SUMMARY
October 31, 2017 (unaudited)
PORTFOLIO STATISTICS
Net Assets ($mil): $492.3
Total Investments ($mil): $609.1
INFLATION PROTECTION BREAKDOWN1
| U.S. Inflation-Protected Exposure | 98.0% | |||
| Non-U.S. | 0.9 | |||
| Non-Inflation Exposure | 1.1 | |||
| 100.0% | ||||
SECTOR BREAKDOWN OF NET PORTFOLIO ASSETS, EXCLUDING TREASURY SECURITIES, TIPS, INTEREST RATE DERIVATIVES AND NET CASH EQUIVALENTS1
| Corporates–Investment Grade | 12.1% | |||
| Commercial Mortgage-Backed Securities | 6.9% | |||
| Asset-Backed Securities | 5.6% | |||
| Collateralized Mortgage Obligations | 4.4% | |||
| Corporates–Non-Investment Grade | 2.6% | |||
| Emerging Markets–Corporate Bonds | 0.5% | |||
| Quasi-Sovereigns | 0.4% | |||
| Governments–Sovereign Bonds | 0.1% | |||
| Common Stocks | 0.1% | |||
| Emerging Markets–Sovereigns | 0.1% | |||
SECTOR BREAKDOWN OF TOTAL PORTFOLIO INVESTMENTS, EXCLUDING DERIVATIVES2
| Inflation-Linked Securities | 70.7% | |||
| Corporates–Investment Grade | 9.8% | |||
| Commercial Mortgage-Backed Securities | 5.6% | |||
| Asset-Backed Securities | 4.6% | |||
| Collateralized Mortgage Obligations | 3.6% | |||
| Corporates–Non-Investment Grade | 2.1% | |||
| Emerging Markets–Treasuries | 0.7% | |||
| Emerging Markets–Corporate Bonds | 0.4% | |||
| Quasi-Sovereigns | 0.3% | |||
| Governments–Sovereign Bonds | 0.1% | |||
| Short-Term | 2.1% | |||
| 1 | All data are as of October 31, 2017. The Strategy’s sector and inflation protection exposure breakdowns are expressed as an approximate percentage of the Strategy’s total net assets (and may vary over time) inclusive of derivative exposure except as noted, based on the Adviser’s internal classification. |
| 2 | The Strategy’s sector breakdown is expressed, based on the Adviser’s internal classification, as a percentage of total investments and may vary over time. The Strategy also enters into derivative transactions (not reflected in the table), which may be used for hedging or investment purposes or to adjust the risk profile or exposures of the Strategy (see “Portfolio of Investments” section of the report for additional details). Derivative transactions may result in a form of leverage for the Strategy. The Strategy uses leverage for investment purposes by entering into reverse repurchase agreements. As a result, the Strategy’s total investments will generally exceed its net assets. |
| 16 | AB BOND INFLATION STRATEGY | abfunds.com |
PORTFOLIO OF INVESTMENTS
October 31, 2017
| Principal Amount (000) | U.S. $ Value | |||||||||||
| ||||||||||||
INFLATION-LINKED SECURITIES – 87.5% | ||||||||||||
Japan – 0.9% | ||||||||||||
Japanese Government CPI Linked Bond | JPY | 481,088 | $ | 4,459,498 | ||||||||
|
| |||||||||||
United States – 86.6% | ||||||||||||
U.S. Treasury Inflation Index | U.S.$ | 135,057 | 134,688,266 | |||||||||
0.125%, 4/15/20-7/15/26 (TIPS) | 31,504 | 31,504,816 | ||||||||||
0.375%, 7/15/23 (TIPS)(a)(b) | 19,226 | 19,432,828 | ||||||||||
0.375%, 7/15/25 (TIPS)(a) | 30,040 | 30,002,464 | ||||||||||
0.375%, 7/15/27 (TIPS) | 1,578 | 1,560,196 | ||||||||||
0.625%, 7/15/21 (TIPS)(a) | 23,634 | 24,231,904 | ||||||||||
0.625%, 1/15/24-1/15/26 (TIPS) | 79,163 | 80,435,095 | ||||||||||
1.375%, 1/15/20 (TIPS)(b) | 18,709 | 19,331,746 | ||||||||||
1.75%, 1/15/28 (TIPS) | 7,902 | 8,827,700 | ||||||||||
2.00%, 1/15/26 (TIPS) | 11,054 | 12,397,432 | ||||||||||
2.375%, 1/15/25 (TIPS) | 7,895 | 8,994,163 | ||||||||||
2.375%, 1/15/27 (TIPS)(a) | 47,254 | 55,072,915 | ||||||||||
|
| |||||||||||
| 426,479,525 | ||||||||||||
|
| |||||||||||
Total Inflation-Linked Securities | 430,939,023 | |||||||||||
|
| |||||||||||
CORPORATES – INVESTMENT GRADE – 12.1% | ||||||||||||
Industrial – 6.0% | ||||||||||||
Basic – 0.5% | ||||||||||||
Anglo American Capital PLC | 200 | 206,054 | ||||||||||
Eastman Chemical Co. | 227 | 236,350 | ||||||||||
Minsur SA | 314 | 348,540 | ||||||||||
Sociedad Quimica y Minera de Chile SA | 393 | 396,930 | ||||||||||
Vale Overseas Ltd. | 515 | 613,417 | ||||||||||
Yamana Gold, Inc. | 403 | 415,501 | ||||||||||
|
| |||||||||||
| 2,216,792 | ||||||||||||
|
| |||||||||||
Capital Goods – 0.2% | ||||||||||||
Embraer Netherlands Finance BV | 590 | 632,185 | ||||||||||
| abfunds.com | AB BOND INFLATION STRATEGY | 17 |
PORTFOLIO OF INVESTMENTS (continued)
| Principal Amount (000) | U.S. $ Value | |||||||||||
| ||||||||||||
General Electric Co. | U.S.$ | 191 | $ | 199,146 | ||||||||
|
| |||||||||||
| 831,331 | ||||||||||||
|
| |||||||||||
Communications - Media – 0.2% | ||||||||||||
CBS Corp. | 300 | 304,479 | ||||||||||
Cox Communications, Inc. | 163 | 161,104 | ||||||||||
Time Warner Cable LLC | 235 | 218,113 | ||||||||||
5.00%, 2/01/20 | 35 | 36,836 | ||||||||||
8.75%, 2/14/19 | 25 | 27,041 | ||||||||||
|
| |||||||||||
| 747,573 | ||||||||||||
|
| |||||||||||
Communications - Telecommunications – 0.7% | ||||||||||||
AT&T, Inc. | 120 | 118,577 | ||||||||||
3.90%, 8/14/27 | 950 | 945,972 | ||||||||||
4.125%, 2/17/26 | 431 | 442,025 | ||||||||||
Rogers Communications, Inc. | CAD | 55 | 45,369 | |||||||||
Sprint Spectrum Co. LLC/Sprint Spectrum Co. II LLC/Sprint Spectrum Co. III LLC | U.S.$ | 344 | 348,575 | |||||||||
Verizon Communications, Inc. | 614 | 579,346 | ||||||||||
3.50%, 11/01/24 | 565 | 578,249 | ||||||||||
5.50%, 3/16/47 | 535 | 590,512 | ||||||||||
|
| |||||||||||
| 3,648,625 | ||||||||||||
|
| |||||||||||
Consumer Cyclical - Automotive – 0.3% | ||||||||||||
Ford Motor Credit Co. LLC | 400 | 402,932 | ||||||||||
5.875%, 8/02/21 | 640 | 713,305 | ||||||||||
General Motors Co. | 425 | 431,286 | ||||||||||
|
| |||||||||||
| 1,547,523 | ||||||||||||
|
| |||||||||||
Consumer Non-Cyclical – 0.8% | ||||||||||||
Baxalta, Inc. | 700 | 724,836 | ||||||||||
Bunge Ltd. Finance Corp. | 81 | 88,964 | ||||||||||
| 18 | AB BOND INFLATION STRATEGY | abfunds.com |
PORTFOLIO OF INVESTMENTS (continued)
| Principal Amount (000) | U.S. $ Value | |||||||||||
| ||||||||||||
Mylan NV | EUR | 549 | $ | 685,917 | ||||||||
Sigma Alimentos SA de CV | U.S.$ | 209 | 208,869 | |||||||||
Teva Pharmaceutical Finance Netherlands III BV | 599 | 551,089 | ||||||||||
3.15%, 10/01/26 | 1,120 | 991,122 | ||||||||||
Tyson Foods, Inc. | 199 | 201,056 | ||||||||||
3.95%, 8/15/24 | 650 | 686,394 | ||||||||||
|
| |||||||||||
| 4,138,247 | ||||||||||||
|
| |||||||||||
Energy – 1.8% | ||||||||||||
Cenovus Energy, Inc. | 33 | 32,657 | ||||||||||
5.70%, 10/15/19 | 159 | 168,540 | ||||||||||
Ecopetrol SA | 292 | 289,810 | ||||||||||
Energy Transfer LP | 510 | 553,702 | ||||||||||
Energy Transfer LP/Regency Energy Finance Corp. | 115 | 120,814 | ||||||||||
EnLink Midstream Partners LP | 352 | 345,766 | ||||||||||
Enterprise Products Operating LLC | 771 | 796,042 | ||||||||||
5.20%, 9/01/20 | 335 | 362,279 | ||||||||||
Hess Corp. | 563 | 566,654 | ||||||||||
Kinder Morgan Energy Partners LP | 104 | 109,378 | ||||||||||
5.00%, 10/01/21 | 1,200 | 1,294,068 | ||||||||||
Marathon Petroleum Corp. | 280 | 303,321 | ||||||||||
Noble Energy, Inc. | 491 | 505,519 | ||||||||||
4.15%, 12/15/21 | 127 | 133,863 | ||||||||||
Plains All American Pipeline LP/PAA Finance Corp. | 621 | 609,331 | ||||||||||
Sabine Pass Liquefaction LLC | 418 | 449,279 | ||||||||||
Valero Energy Corp. | 476 | 516,393 | ||||||||||
| abfunds.com | AB BOND INFLATION STRATEGY | 19 |
PORTFOLIO OF INVESTMENTS (continued)
| Principal Amount (000) | U.S. $ Value | |||||||||||
| ||||||||||||
Williams Partners LP | U.S.$ | 1,250 | $ | 1,284,038 | ||||||||
4.125%, 11/15/20 | 300 | 313,662 | ||||||||||
|
| |||||||||||
| 8,755,116 | ||||||||||||
|
| |||||||||||
Other Industrial – 0.1% | ||||||||||||
Alfa SAB de CV | 600 | 636,750 | ||||||||||
|
| |||||||||||
Services – 0.3% | ||||||||||||
Expedia, Inc. | 886 | 862,184 | ||||||||||
S&P Global, Inc. | 611 | 659,862 | ||||||||||
|
| |||||||||||
| 1,522,046 | ||||||||||||
|
| |||||||||||
Technology – 1.0% | ||||||||||||
Agilent Technologies, Inc. | 7 | 7,500 | ||||||||||
Broadcom Corp./Broadcom Cayman Finance Ltd. | 190 | 196,183 | ||||||||||
3.875%, 1/15/27(c) | 407 | 418,779 | ||||||||||
Dell International LLC/EMC Corp. | 456 | 479,498 | ||||||||||
5.45%, 6/15/23(c) | 387 | 424,849 | ||||||||||
6.02%, 6/15/26(c) | 138 | 154,060 | ||||||||||
Hewlett Packard Enterprise Co. | 871 | 870,111 | ||||||||||
KLA-Tencor Corp. | 639 | 696,312 | ||||||||||
Lam Research Corp. | 250 | 253,357 | ||||||||||
Motorola Solutions, Inc. | 92 | 111,767 | ||||||||||
Seagate HDD Cayman | 398 | 394,939 | ||||||||||
VMware, Inc. | 389 | 390,256 | ||||||||||
Western Digital Corp. | 447 | 488,777 | ||||||||||
|
| |||||||||||
| 4,886,388 | ||||||||||||
|
| |||||||||||
Transportation - Services – 0.1% | ||||||||||||
Adani Ports & Special Economic Zone Ltd. | 565 | 580,643 | ||||||||||
|
| |||||||||||
| 29,511,034 | ||||||||||||
|
| |||||||||||
| 20 | AB BOND INFLATION STRATEGY | abfunds.com |
PORTFOLIO OF INVESTMENTS (continued)
| Principal Amount (000) | U.S. $ Value | |||||||||||
| ||||||||||||
Financial Institutions – 5.8% | ||||||||||||
Banking – 5.2% | ||||||||||||
ABN AMRO Bank NV | U.S.$ | 200 | $ | 212,360 | ||||||||
Banco Santander SA | 600 | 614,034 | ||||||||||
Bank of America Corp. | 1,155 | 1,158,938 | ||||||||||
3.824%, 1/20/28 | 965 | 994,191 | ||||||||||
Barclays PLC | 294 | 295,573 | ||||||||||
3.684%, 1/10/23 | 700 | 714,532 | ||||||||||
BNP Paribas SA | 332 | 344,882 | ||||||||||
Series E | EUR | 199 | 243,806 | |||||||||
BPCE SA | U.S.$ | 213 | 237,872 | |||||||||
Capital One Financial Corp. | 1,241 | 1,242,849 | ||||||||||
Citigroup, Inc. | 835 | 844,803 | ||||||||||
3.875%, 3/26/25 | 655 | 671,368 | ||||||||||
Compass Bank | 955 | 948,621 | ||||||||||
Cooperatieve Rabobank UA | 396 | 419,293 | ||||||||||
Credit Agricole SA/London | 367 | 384,495 | ||||||||||
Credit Suisse Group Funding Guernsey Ltd. | 1,285 | 1,332,134 | ||||||||||
Goldman Sachs Group, Inc. (The) | 382 | 377,867 | ||||||||||
2.917% (LIBOR 3 Month + 1.60%), 11/29/23(e) | 406 | 422,792 | ||||||||||
3.85%, 7/08/24 | 1,000 | 1,042,260 | ||||||||||
HSBC Holdings PLC | ||||||||||||
4.00%, 3/30/22 | 1,000 | 1,056,430 | ||||||||||
4.041%, 3/13/28 | 880 | 921,826 | ||||||||||
JPMorgan Chase & Co. | ||||||||||||
2.295%, 8/15/21 | 322 | 320,480 | ||||||||||
3.22%, 3/01/25 | 1,180 | 1,192,343 | ||||||||||
3.782%, 2/01/28 | 518 | 533,390 | ||||||||||
4.25%, 10/15/20 | 55 | 58,163 | ||||||||||
Lloyds Banking Group PLC | ||||||||||||
4.65%, 3/24/26 | 318 | 337,442 | ||||||||||
| abfunds.com | AB BOND INFLATION STRATEGY | 21 |
PORTFOLIO OF INVESTMENTS (continued)
| Principal Amount (000) | U.S. $ Value | |||||||||||
| ||||||||||||
Morgan Stanley | ||||||||||||
3.591%, 7/22/28 | U.S.$ | 1,200 | $ | 1,208,952 | ||||||||
Series G | ||||||||||||
5.50%, 7/28/21 | 456 | 503,670 | ||||||||||
Nationwide Building Society | ||||||||||||
4.00%, 9/14/26(c) | 820 | 828,840 | ||||||||||
PNC Bank NA | ||||||||||||
3.80%, 7/25/23 | 940 | 989,557 | ||||||||||
Santander Holdings USA, Inc. | ||||||||||||
4.40%, 7/13/27(c) | 1,190 | 1,225,807 | ||||||||||
Santander Issuances SAU | ||||||||||||
3.25%, 4/04/26(c) | EUR | 400 | 516,704 | |||||||||
Santander UK PLC | ||||||||||||
5.00%, 11/07/23(c) | U.S.$ | 505 | 546,531 | |||||||||
UBS AG/Stamford CT | ||||||||||||
7.625%, 8/17/22 | 465 | 550,332 | ||||||||||
UBS Group Funding Switzerland AG | ||||||||||||
4.125%, 9/24/25(c) | 1,153 | 1,215,619 | ||||||||||
US Bancorp | ||||||||||||
Series J | ||||||||||||
5.30%, 4/15/27(d) | 427 | 468,462 | ||||||||||
Wells Fargo & Co. | ||||||||||||
3.069%, 1/24/23 | 759 | 768,905 | ||||||||||
|
| |||||||||||
| 25,746,123 | ||||||||||||
|
| |||||||||||
Insurance – 0.3% |
| |||||||||||
Coventry Health Care, Inc. | ||||||||||||
5.45%, 6/15/21 | 415 | 454,438 | ||||||||||
Hartford Financial Services Group, Inc. (The) | ||||||||||||
5.50%, 3/30/20 | 5 | 5,381 | ||||||||||
Lincoln National Corp. | ||||||||||||
8.75%, 7/01/19 | 54 | 59,727 | ||||||||||
MetLife, Inc. | ||||||||||||
5.70%, 6/15/35 | 90 | 112,108 | ||||||||||
Nationwide Financial Services, Inc. | ||||||||||||
5.375%, 3/25/21(c) | 360 | 390,427 | ||||||||||
Nationwide Mutual Insurance Co. | ||||||||||||
9.375%, 8/15/39(c) | 125 | 208,910 | ||||||||||
XLIT Ltd. | ||||||||||||
3.25%, 6/29/47 | EUR | 250 | 293,408 | |||||||||
|
| |||||||||||
| 1,524,399 | ||||||||||||
|
| |||||||||||
REITS – 0.3% | ||||||||||||
Trust F/1401 | ||||||||||||
5.25%, 1/30/26(c) | U.S.$ | 640 | 682,418 | |||||||||
| 22 | AB BOND INFLATION STRATEGY | abfunds.com |
PORTFOLIO OF INVESTMENTS (continued)
| Principal Amount (000) | U.S. $ Value | |||||||||||
| ||||||||||||
Welltower, Inc. | U.S.$ | 708 | $ | 735,867 | ||||||||
|
| |||||||||||
| 1,418,285 | ||||||||||||
|
| |||||||||||
| 28,688,807 | ||||||||||||
|
| |||||||||||
Utility – 0.3% | ||||||||||||
Electric – 0.3% | ||||||||||||
Berkshire Hathaway Energy Co. | 340 | 444,655 | ||||||||||
CMS Energy Corp. | 144 | 158,144 | ||||||||||
Israel Electric Corp., Ltd. | 620 | 665,725 | ||||||||||
|
| |||||||||||
| 1,268,524 | ||||||||||||
|
| |||||||||||
Natural Gas – 0.0% | ||||||||||||
NiSource Finance Corp. | 12 | 12,631 | ||||||||||
|
| |||||||||||
| 1,281,155 | ||||||||||||
|
| |||||||||||
Total Corporates – Investment Grade | 59,480,996 | |||||||||||
|
| |||||||||||
COMMERCIAL MORTGAGE-BACKED SECURITIES – 6.9% | ||||||||||||
Non-Agency Fixed Rate | ||||||||||||
Banc of America Commercial Mortgage Trust | 186 | 185,453 | ||||||||||
BHMS Commercial Mortgage Trust | 1,070 | 1,078,141 | ||||||||||
CFCRE Commercial Mortgage Trust | 730 | 738,542 | ||||||||||
CGRBS Commercial Mortgage Trust | 885 | 908,471 | ||||||||||
Citigroup Commercial Mortgage Trust | 486 | 432,935 | ||||||||||
| abfunds.com | AB BOND INFLATION STRATEGY | 23 |
PORTFOLIO OF INVESTMENTS (continued)
| Principal Amount (000) | U.S. $ Value | |||||||||||
| ||||||||||||
Series 2013-GC11, Class D | ||||||||||||
4.455%, 4/10/46(c)(f) | U.S.$ | 191 | $ | 178,738 | ||||||||
Series 2015-GC27, Class A5 | ||||||||||||
3.137%, 2/10/48 | 1,382 | 1,400,132 | ||||||||||
Series 2015-GC35, Class A4 | ||||||||||||
3.818%, 11/10/48 | 450 | 475,631 | ||||||||||
Series 2016-C1, Class A4 | ||||||||||||
3.209%, 5/10/49 | 775 | 788,067 | ||||||||||
Series 2016-GC36, Class A5 | ||||||||||||
3.616%, 2/10/49 | 565 | 588,886 | ||||||||||
Commercial Mortgage Trust | ||||||||||||
Series 2013-SFS, Class A1 | ||||||||||||
1.873%, 4/12/35(c) | 273 | 267,671 | ||||||||||
Series 2015-CR24, Class A5 | ||||||||||||
3.696%, 8/10/48 | 590 | 621,535 | ||||||||||
Series 2015-CR25, Class A4 | ||||||||||||
3.759%, 8/10/48 | 1,155 | 1,221,784 | ||||||||||
Series 2015-PC1, Class A5 | ||||||||||||
3.902%, 7/10/50 | 745 | 789,525 | ||||||||||
CSAIL Commercial Mortgage Trust | ||||||||||||
Series 2015-C2, Class A4 | ||||||||||||
3.504%, 6/15/57 | 475 | 491,238 | ||||||||||
Series 2015-C3, Class A4 | ||||||||||||
3.718%, 8/15/48 | 395 | 415,624 | ||||||||||
Series 2015-C4, Class A4 | ||||||||||||
3.808%, 11/15/48 | 1,853 | 1,953,959 | ||||||||||
GS Mortgage Securities Corp. II | ||||||||||||
Series 2013-KING, Class A | ||||||||||||
2.706%, 12/10/27(c) | 719 | 725,159 | ||||||||||
GS Mortgage Securities Trust | ||||||||||||
Series 2013-G1, Class A1 | ||||||||||||
2.059%, 4/10/31(c) | 479 | 466,122 | ||||||||||
Series 2014-GC18, Class D | ||||||||||||
4.944%, 1/10/47(c)(f) | 581 | 497,573 | ||||||||||
JP Morgan Chase Commercial Mortgage Securities Trust | ||||||||||||
Series 2004-LN2, Class A1A | ||||||||||||
4.838%, 7/15/41(c) | 243 | 243,406 | ||||||||||
Series 2006-LDP9, Class AM | ||||||||||||
5.372%, 5/15/47(f) | 190 | 191,102 | ||||||||||
Series 2007-CB19, Class AM | ||||||||||||
5.795%, 2/12/49(f) | 14 | 13,795 | ||||||||||
Series 2011-C5, Class D | ||||||||||||
5.408%, 8/15/46(c)(f) | 129 | 130,260 | ||||||||||
| 24 | AB BOND INFLATION STRATEGY | abfunds.com |
PORTFOLIO OF INVESTMENTS (continued)
| Principal Amount (000) | U.S. $ Value | |||||||||||
| ||||||||||||
JPMBB Commercial Mortgage Securities Trust | U.S.$ | 22,619 | $ | 1,072,469 | ||||||||
Series 2015-C30, Class A5 | 585 | 619,330 | ||||||||||
Series 2015-C31, Class A3 | 990 | 1,047,195 | ||||||||||
Series 2015-C32, Class C | 545 | 551,923 | ||||||||||
Series 2015-C33, Class A4 | 1,150 | 1,209,493 | ||||||||||
LB-UBS Commercial Mortgage Trust | 222 | 177,343 | ||||||||||
LSTAR Commercial Mortgage Trust | 122 | 121,925 | ||||||||||
Series 2015-3, Class A2 | 605 | 606,207 | ||||||||||
Morgan Stanley Bank of America Merrill Lynch Trust | 11,168 | 741,776 | ||||||||||
Morgan Stanley Capital I Trust | 320 | 319,565 | ||||||||||
Series 2016-UB12, Class A4 | 870 | 905,682 | ||||||||||
UBS-Barclays Commercial Mortgage Trust | 2,309 | 2,338,192 | ||||||||||
Wells Fargo Commercial Mortgage Trust | 1,160 | 1,201,478 | ||||||||||
Series 2015-SG1, Class C | 537 | 532,874 | ||||||||||
Series 2016-LC25, Class C | 330 | 326,786 | ||||||||||
Series 2016-NXS6, Class A4 | 900 | 893,183 | ||||||||||
Series 2016-NXS6, Class C | 525 | 535,878 | ||||||||||
| abfunds.com | AB BOND INFLATION STRATEGY | 25 |
PORTFOLIO OF INVESTMENTS (continued)
| Principal Amount (000) | U.S. $ Value | |||||||||||
| ||||||||||||
WF-RBS Commercial Mortgage Trust | ||||||||||||
Series 2013-C14, Class A5 | U.S.$ | 494 | $ | 511,288 | ||||||||
Series 2014-C20, Class A2 | 648 | 656,896 | ||||||||||
|
| |||||||||||
| 29,173,232 | ||||||||||||
|
| |||||||||||
Non-Agency Floating Rate CMBS – 1.0% |
| |||||||||||
BX Trust SLCT | 1,150 | 1,152,539 | ||||||||||
Credit Suisse Mortgage Trust | 185 | 186,733 | ||||||||||
Great Wolf Trust | 745 | 746,164 | ||||||||||
H/2 Asset Funding NRE | 346 | 346,197 | ||||||||||
JP Morgan Chase Commercial Mortgage Securities Trust | 753 | 756,030 | ||||||||||
Morgan Stanley Capital I Trust | ||||||||||||
Series 2015-XLF2, Class AFSA | ||||||||||||
3.109% (LIBOR 1 Month + 1.87%), | 214 | 213,500 | ||||||||||
Series 2015-XLF2, Class SNMA | 241 | 240,038 | ||||||||||
Starwood Retail Property Trust | 1,084 | 1,084,357 | ||||||||||
|
| |||||||||||
| 4,725,558 | ||||||||||||
|
| |||||||||||
Total Commercial Mortgage-Backed Securities | 33,898,790 | |||||||||||
|
| |||||||||||
| 26 | AB BOND INFLATION STRATEGY | abfunds.com |
PORTFOLIO OF INVESTMENTS (continued)
| Principal Amount (000) | U.S. $ Value | |||||||||||
| ||||||||||||
ASSET-BACKED SECURITIES – 5.6% | ||||||||||||
Autos - Fixed Rate – 3.3% | ||||||||||||
Ally Auto Receivables Trust | U.S.$ | 170 | $ | 169,862 | ||||||||
Ally Master Owner Trust | 707 | 706,832 | ||||||||||
AmeriCredit Automobile Receivables Trust | 354 | 353,456 | ||||||||||
Avis Budget Rental Car Funding AESOP LLC | ||||||||||||
Series 2012-3A, Class A | 350 | 350,296 | ||||||||||
Series 2013-2A, Class A | 289 | 290,883 | ||||||||||
Bank of The West Auto Trust | 241 | 240,611 | ||||||||||
California Republic Auto Receivables Trust | ||||||||||||
Series 2014-2, Class A4 | 315 | 314,768 | ||||||||||
Series 2015-2, Class A3 | 51 | 50,546 | ||||||||||
Chrysler Capital Auto Receivables Trust | 448 | 448,245 | ||||||||||
CPS Auto Receivables Trust | 114 | 114,162 | ||||||||||
CPS Auto Trust | 1,000 | 999,319 | ||||||||||
Drive Auto Receivables Trust | ||||||||||||
Series 2017-AA, Class A3 | 765 | 765,228 | ||||||||||
Series 2017-BA, Class A3 | 880 | 880,079 | ||||||||||
Enterprise Fleet Financing LLC | 76 | 76,158 | ||||||||||
Exeter Automobile Receivables Trust | ||||||||||||
Series 2016-1A, Class D | 250 | 263,790 | ||||||||||
| abfunds.com | AB BOND INFLATION STRATEGY | 27 |
PORTFOLIO OF INVESTMENTS (continued)
| Principal Amount (000) | U.S. $ Value | |||||||||||
| ||||||||||||
Series 2016-3A, Class A | U.S.$ | 145 | $ | 145,003 | ||||||||
Series 2017-2A, Class A | 570 | 570,505 | ||||||||||
Series 2017-3A, Class A | 959 | 958,188 | ||||||||||
Flagship Credit Auto Trust | ||||||||||||
Series 2016-2, Class D | 325 | 353,038 | ||||||||||
Series 2016-4, Class D | 330 | 332,632 | ||||||||||
Series 2017-2, Class A | 765 | 764,533 | ||||||||||
Ford Credit Auto Owner Trust | 728 | 733,190 | ||||||||||
GM Financial Automobile Leasing Trust | 417 | 416,745 | ||||||||||
GMF Floorplan Owner Revolving Trust | 599 | 598,802 | ||||||||||
Harley-Davidson Motorcycle Trust | 37 | 37,461 | ||||||||||
Hertz Vehicle Financing II LP | ||||||||||||
Series 2015-1A, Class A | 625 | 624,379 | ||||||||||
Series 2015-1A, Class B | 489 | 489,955 | ||||||||||
Series 2015-2A, Class A | 508 | 507,598 | ||||||||||
Series 2015-3A, Class A | 1,000 | 994,509 | ||||||||||
Series 2016-1A, Class A | 737 | 736,163 | ||||||||||
Hertz Vehicle Financing LLC | 368 | 366,430 | ||||||||||
Hyundai Auto Lease Securitization Trust | 127 | 127,072 | ||||||||||
| 28 | AB BOND INFLATION STRATEGY | abfunds.com |
PORTFOLIO OF INVESTMENTS (continued)
| Principal Amount (000) | U.S. $ Value | |||||||||||
| ||||||||||||
Mercedes Benz Auto Lease Trust | U.S.$ | 68 | $ | 68,382 | ||||||||
Santander Drive Auto Receivables Trust | ||||||||||||
Series 2013-2, Class E | 750 | 750,467 | ||||||||||
Series 2016-3, Class A2 | 122 | 121,601 | ||||||||||
Series 2017-3, Class A2 | 581 | 580,487 | ||||||||||
|
| |||||||||||
| 16,301,375 | ||||||||||||
|
| |||||||||||
Other ABS - Fixed Rate – 1.3% | ||||||||||||
Citi Held For Asset Issuance | 63 | 63,670 | ||||||||||
CLUB Credit Trust | 1,005 | 1,005,793 | ||||||||||
CNH Equipment Trust | 493 | 493,028 | ||||||||||
Marlette Funding Trust | 88 | 88,352 | ||||||||||
Series 2017-1A, Class A | 363 | 364,721 | ||||||||||
Series 2017-2A, Class A | 701 | 700,999 | ||||||||||
Series 2017-3A, Class A | 437 | 437,146 | ||||||||||
Series 2017-3A, Class B | 297 | 297,482 | ||||||||||
Prosper Marketplace Issuance Trust | 285 | 286,813 | ||||||||||
SBA Tower Trust | 851 | 861,646 | ||||||||||
SoFi Consumer Loan Program LLC | 210 | 211,388 | ||||||||||
Series 2016-3, Class A | 538 | 542,804 | ||||||||||
Series 2017-2, Class A | 520 | 526,180 | ||||||||||
| abfunds.com | AB BOND INFLATION STRATEGY | 29 |
PORTFOLIO OF INVESTMENTS (continued)
| Principal Amount (000) | U.S. $ Value | |||||||||||
| ||||||||||||
Series 2017-5, Class A2 | U.S.$ | 855 | $ | 850,189 | ||||||||
|
| |||||||||||
| 6,730,211 | ||||||||||||
|
| |||||||||||
Autos - Floating Rate – 0.5% | ||||||||||||
BMW Floorplan Master Owner Trust | 1,037 | 1,039,657 | ||||||||||
Ford Credit Floorplan Master Owner Trust | 692 | 697,151 | ||||||||||
Wells Fargo Dealer Floorplan Master Note Trust | 620 | 620,111 | ||||||||||
|
| |||||||||||
| 2,356,919 | ||||||||||||
|
| |||||||||||
Credit Cards - Fixed Rate – 0.4% | ||||||||||||
Synchrony Credit Card Master Note Trust | 1,084 | 1,089,140 | ||||||||||
Series 2016-1, Class A | 209 | 209,571 | ||||||||||
World Financial Network Credit Card Master Trust | 373 | 373,063 | ||||||||||
Series 2016-B, Class A | 313 | 312,310 | ||||||||||
|
| |||||||||||
| 1,984,084 | ||||||||||||
|
| |||||||||||
Credit Cards - Floating Rate – 0.1% | ||||||||||||
World Financial Network Credit Card Master Trust | 403 | 403,681 | ||||||||||
|
| |||||||||||
Total Asset-Backed Securities | 27,776,270 | |||||||||||
|
| |||||||||||
| 30 | AB BOND INFLATION STRATEGY | abfunds.com |
PORTFOLIO OF INVESTMENTS (continued)
| Principal Amount (000) | U.S. $ Value | |||||||||||
| ||||||||||||
COLLATERALIZED MORTGAGE OBLIGATIONS – 4.4% | ||||||||||||
Risk Share Floating Rate – 3.1% | ||||||||||||
Bellemeade Re II Ltd. | U.S.$ | 241 | $ | 246,838 | ||||||||
Federal Home Loan Mortgage Corp. Structured Agency Credit Risk Debt Notes | 1,030 | 1,135,912 | ||||||||||
Series 2014-DN3, Class M3 | 1,016 | 1,093,085 | ||||||||||
Series 2014-HQ3, Class M3 | 323 | 356,301 | ||||||||||
Series 2015-DNA1, Class M3 | 260 | 288,987 | ||||||||||
Series 2015-DNA2, Class M2 | 633 | 645,818 | ||||||||||
Series 2015-DNA3, Class M3 | 281 | 326,749 | ||||||||||
Series 2015-HQA1, Class M2 | 465 | 475,622 | ||||||||||
Series 2015-HQA2, Class M3 | 276 | 317,185 | ||||||||||
Series 2016-DNA1, Class M3 | 324 | 377,808 | ||||||||||
Series 2016-HQA1, Class M3 | 600 | 721,049 | ||||||||||
Federal National Mortgage Association Connecticut Avenue Securities | 12 | 11,723 | ||||||||||
Series 2014-C04, Class 1M2 | 496 | 563,387 | ||||||||||
| abfunds.com | AB BOND INFLATION STRATEGY | 31 |
PORTFOLIO OF INVESTMENTS (continued)
| Principal Amount (000) | U.S. $ Value | |||||||||||
| ||||||||||||
Series 2014-C04, Class 2M2 | U.S.$ | 160 | $ | 179,887 | ||||||||
Series 2015-C01, Class 1M2 | 358 | 384,659 | ||||||||||
Series 2015-C01, Class 2M2 | 336 | 358,886 | ||||||||||
Series 2015-C02, Class 1M2 | 472 | 505,266 | ||||||||||
Series 2015-C02, Class 2M2 | 370 | 391,940 | ||||||||||
Series 2015-C03, Class 1M2 | 616 | 680,205 | ||||||||||
Series 2015-C03, Class 2M2 | 638 | 697,177 | ||||||||||
Series 2015-C04, Class 1M2 | 1,184 | 1,334,656 | ||||||||||
Series 2015-C04, Class 2M2 | 609 | 674,206 | ||||||||||
Series 2016-C01, Class 1M2 | 587 | 694,428 | ||||||||||
Series 2016-C01, Class 2M2 | 446 | 527,557 | ||||||||||
Series 2016-C02, Class 1M2 | 505 | 583,590 | ||||||||||
Series 2016-C03, Class 2M2 | 1,214 | 1,392,377 | ||||||||||
Wells Fargo Credit Risk Transfer Securities Trust | 38 | 37,747 | ||||||||||
Series 2015-WF1, Class 2M1 | 118 | 119,477 | ||||||||||
|
| |||||||||||
| 15,122,522 | ||||||||||||
|
| |||||||||||
| 32 | AB BOND INFLATION STRATEGY | abfunds.com |
PORTFOLIO OF INVESTMENTS (continued)
| Principal Amount (000) | U.S. $ Value | |||||||||||
| ||||||||||||
Agency Floating Rate – 1.3% |
| |||||||||||
Federal Home Loan Mortgage Corp. REMICs | U.S.$ | 3,074 | $ | 664,928 | ||||||||
Series 4727, Class SA | 3,500 | 737,187 | ||||||||||
Federal National Mortgage Association REMICs | 1,616 | 338,263 | ||||||||||
Series 2014-17, Class SA | 3,226 | 633,637 | ||||||||||
Series 2014-78, Class SE | 2,897 | 530,211 | ||||||||||
Series 2014-92, Class SX | 3,672 | 727,933 | ||||||||||
Series 2016-77, Class DS | 3,308 | 615,030 | ||||||||||
Series 2017-62, Class AS | 3,101 | 649,345 | ||||||||||
Series 2017-81, Class SA | 3,268 | 745,888 | ||||||||||
Government National Mortgage Association | 2,187 | 478,051 | ||||||||||
Series 2017-134, Class MS | 2,081 | 493,820 | ||||||||||
|
| |||||||||||
| 6,614,293 | ||||||||||||
|
| |||||||||||
Total Collateralized Mortgage Obligations | 21,736,815 | |||||||||||
|
| |||||||||||
| abfunds.com | AB BOND INFLATION STRATEGY | 33 |
PORTFOLIO OF INVESTMENTS (continued)
| Principal Amount (000) | U.S. $ Value | |||||||||||
| ||||||||||||
CORPORATES – NON-INVESTMENT GRADE – 2.6% | ||||||||||||
Industrial – 1.7% | ||||||||||||
Basic – 0.2% | ||||||||||||
NOVA Chemicals Corp. | U.S.$ | 391 | $ | 403,273 | ||||||||
SPCM SA | 500 | 514,865 | ||||||||||
|
| |||||||||||
| 918,138 | ||||||||||||
|
| |||||||||||
Communications - Media – 0.2% | ||||||||||||
CCO Holdings LLC/CCO Holdings Capital Corp. | 656 | 665,473 | ||||||||||
CSC Holdings LLC | 145 | 159,810 | ||||||||||
SFR Group SA | EUR | 231 | 281,434 | |||||||||
|
| |||||||||||
| 1,106,717 | ||||||||||||
|
| |||||||||||
Communications - Telecommunications – 0.3% | ||||||||||||
CenturyLink, Inc. | U.S.$ | 213 | 226,253 | |||||||||
Sprint Capital Corp. | 1,000 | 1,053,080 | ||||||||||
Wind Acquisition Finance SA | 340 | 344,172 | ||||||||||
|
| |||||||||||
| 1,623,505 | ||||||||||||
|
| |||||||||||
Consumer Cyclical - Automotive – 0.1% | ||||||||||||
Adient Global Holdings Ltd. | 321 | 329,766 | ||||||||||
Allison Transmission, Inc. | 197 | 205,428 | ||||||||||
|
| |||||||||||
| 535,194 | ||||||||||||
|
| |||||||||||
Consumer Cyclical - Other – 0.2% | ||||||||||||
International Game Technology PLC | 360 | 395,762 | ||||||||||
6.50%, 2/15/25(c) | 460 | 517,896 | ||||||||||
KB Home | 345 | 354,336 | ||||||||||
|
| |||||||||||
| 1,267,994 | ||||||||||||
|
| |||||||||||
Consumer Non-Cyclical – 0.1% | ||||||||||||
Valeant Pharmaceuticals International, Inc. | 385 | 323,400 | ||||||||||
|
| |||||||||||
| 34 | AB BOND INFLATION STRATEGY | abfunds.com |
PORTFOLIO OF INVESTMENTS (continued)
| Principal Amount (000) | U.S. $ Value | |||||||||||
| ||||||||||||
Energy – 0.5% | ||||||||||||
Cheniere Energy Partners LP | U.S.$ | 480 | $ | 494,146 | ||||||||
Diamond Offshore Drilling, Inc. | 575 | 432,688 | ||||||||||
Energy Transfer Equity LP | 755 | 768,031 | ||||||||||
Nabors Industries, Inc. | 671 | 644,522 | ||||||||||
SM Energy Co. | 41 | 41,642 | ||||||||||
|
| |||||||||||
| 2,381,029 | ||||||||||||
|
| |||||||||||
Transportation - Services – 0.1% | ||||||||||||
Avis Budget Car Rental LLC/Avis Budget Finance, Inc. | 270 | 265,577 | ||||||||||
|
| |||||||||||
| 8,421,554 | ||||||||||||
|
| |||||||||||
Financial Institutions – 0.9% | ||||||||||||
Banking – 0.8% | ||||||||||||
Bank of America Corp. | 233 | 266,454 | ||||||||||
Barclays Bank PLC | 137 | 165,863 | ||||||||||
Goldman Sachs Group, Inc. (The) | 650 | 649,883 | ||||||||||
Intesa Sanpaolo SpA | 489 | 500,927 | ||||||||||
Series E | EUR | 164 | 212,074 | |||||||||
Royal Bank of Scotland Group PLC | 150 | 169,976 | ||||||||||
8.625%, 8/15/21(d) | U.S.$ | 480 | 547,200 | |||||||||
Series U | 600 | 582,606 | ||||||||||
Standard Chartered PLC | 400 | 347,228 | ||||||||||
7.50%, 4/02/22(c)(d) | 380 | 416,841 | ||||||||||
|
| |||||||||||
| 3,859,052 | ||||||||||||
|
| |||||||||||
| abfunds.com | AB BOND INFLATION STRATEGY | 35 |
PORTFOLIO OF INVESTMENTS (continued)
| Principal Amount (000) | U.S. $ Value | |||||||||||
| ||||||||||||
Finance – 0.1% | ||||||||||||
Navient Corp. | U.S.$ | 415 | $ | 444,552 | ||||||||
7.25%, 1/25/22 | 54 | 58,896 | ||||||||||
|
| |||||||||||
| 503,448 | ||||||||||||
|
| |||||||||||
| 4,362,500 | ||||||||||||
|
| |||||||||||
Total Corporates – Non-Investment Grade | 12,784,054 | |||||||||||
|
| |||||||||||
EMERGING MARKETS – | ||||||||||||
Brazil – 0.6% | ||||||||||||
Brazil Notas do Tesouro Nacional | BRL | 9,500 | 2,944,261 | |||||||||
|
| |||||||||||
Turkey – 0.2% | ||||||||||||
Turkey Government Bond | TRY | 4,145 | 1,060,138 | |||||||||
|
| |||||||||||
Total Emerging Markets – Treasuries | 4,004,399 | |||||||||||
|
| |||||||||||
EMERGING MARKETS – CORPORATE BONDS – 0.5% | ||||||||||||
Industrial – 0.5% | ||||||||||||
Capital Goods – 0.1% | ||||||||||||
Odebrecht Finance Ltd. | U.S.$ | 426 | 157,620 | |||||||||
7.125%, 6/26/42(c) | 368 | 138,000 | ||||||||||
|
| |||||||||||
| 295,620 | ||||||||||||
|
| |||||||||||
Communications - Telecommunications – 0.1% | ||||||||||||
MTN Mauritius Investment Ltd. | 328 | 337,430 | ||||||||||
|
| |||||||||||
Consumer Non-Cyclical – 0.1% | ||||||||||||
MARB BondCo PLC | 200 | 201,500 | ||||||||||
Marfrig Holdings Europe BV | 335 | 349,531 | ||||||||||
Minerva Luxembourg SA | 218 | 226,066 | ||||||||||
Virgolino de Oliveira Finance SA | 655 | 33,568 | ||||||||||
|
| |||||||||||
| 810,665 | ||||||||||||
|
| |||||||||||
| 36 | AB BOND INFLATION STRATEGY | abfunds.com |
PORTFOLIO OF INVESTMENTS (continued)
| Principal Amount (000) | U.S. $ Value | |||||||||||
| ||||||||||||
Energy – 0.2% | ||||||||||||
Petrobras Global Finance BV | U.S.$ | 200 | $ | 216,200 | ||||||||
6.25%, 3/17/24 | 353 | 378,892 | ||||||||||
Ultrapar International SA | 330 | 338,869 | ||||||||||
|
| |||||||||||
| 933,961 | ||||||||||||
|
| |||||||||||
Total Emerging Markets – Corporate Bonds | 2,377,676 | |||||||||||
|
| |||||||||||
QUASI-SOVEREIGNS – 0.4% | ||||||||||||
Quasi-Sovereign Bonds – 0.4% | ||||||||||||
Chile – 0.1% | ||||||||||||
Corp. Nacional del Cobre de Chile | 385 | 387,410 | ||||||||||
|
| |||||||||||
Mexico – 0.3% | ||||||||||||
Petroleos Mexicanos | 657 | 672,111 | ||||||||||
6.50%, 3/13/27(c) | 895 | 976,132 | ||||||||||
|
| |||||||||||
| 1,648,243 | ||||||||||||
|
| |||||||||||
Total Quasi-Sovereigns | 2,035,653 | |||||||||||
|
| |||||||||||
GOVERNMENTS – | ||||||||||||
Mexico – 0.1% | ||||||||||||
Mexico Government International Bond | 650 | 677,300 | ||||||||||
|
| |||||||||||
| Shares | ||||||||||||
COMMON STOCKS – 0.1% | ||||||||||||
Financials – 0.1% | ||||||||||||
Insurance – 0.1% | ||||||||||||
Mt Logan Re Ltd. (Preference Shares)(f)(l) | 260 | 271,107 | ||||||||||
|
| |||||||||||
| Principal Amount (000) | ||||||||||||
EMERGING MARKETS – | ||||||||||||
Egypt – 0.1% | ||||||||||||
Egypt Government International Bond | U.S.$ | 255 | 266,156 | |||||||||
|
| |||||||||||
| abfunds.com | AB BOND INFLATION STRATEGY | 37 |
PORTFOLIO OF INVESTMENTS (continued)
| Principal Amount (000) | U.S. $ Value | |||||||||||
|
|
| ||||||||||
SHORT-TERM | ||||||||||||
Governments – Treasuries – 2.6% | ||||||||||||
Japan – 2.6% | ||||||||||||
Japan Treasury Discount Bill | JPY | 1,460,000 | $ | 12,841,790 | ||||||||
|
| |||||||||||
Total Investments – 123.7% | 609,090,029 | |||||||||||
Other assets less liabilities – (23.7)% | (116,787,562 | ) | ||||||||||
|
| |||||||||||
Net Assets – 100.0% | $ | 492,302,467 | ||||||||||
|
| |||||||||||
FUTURES (see Note D)
| Description | Number of Contracts | Expiration Month | Notional (000) | Original Value | Value at October 31, 2017 | Unrealized Appreciation/ (Depreciation) | ||||||||||||||||||||||
Purchased Contracts | ||||||||||||||||||||||||||||
U.S. T-Note | 351 | | December 2017 | | USD | 35,100 | $ | 41,393,088 | $ | 41,132,812 | $ | (260,276 | ) | |||||||||||||||
Sold Contracts | ||||||||||||||||||||||||||||
10 Yr Japan Bond (OSE) Futures | 4 | | December 2017 | | JPY | 400,000 | 5,314,255 | 5,293,347 | 20,908 | |||||||||||||||||||
Euro-BOBL Futures | 246 | | December 2017 | | EUR | 24,600 | 37,726,626 | 37,761,951 | (35,325 | ) | ||||||||||||||||||
U.S. T-Note | 367 | | December 2017 | | USD | 73,400 | 79,243,302 | 79,036,891 | 206,411 | |||||||||||||||||||
U.S. T-Note | 354 | | December 2017 | | USD | 35,400 | 44,749,920 | 44,227,875 | 522,045 | |||||||||||||||||||
|
| |||||||||||||||||||||||||||
| $ | 453,763 | |||||||||||||||||||||||||||
|
| |||||||||||||||||||||||||||
| 38 | AB BOND INFLATION STRATEGY | abfunds.com |
PORTFOLIO OF INVESTMENTS (continued)
FORWARD CURRENCY EXCHANGE CONTRACTS (see Note D)
| Counterparty | Contracts to Deliver (000) | In Exchange For (000) | Settlement Date | Unrealized Appreciation/ (Depreciation) | ||||||||||||||||
Bank of America, NA | RUB | 26,887 | USD | 461 | 11/22/17 | $ | 2,031 | |||||||||||||
Barclays Bank PLC | USD | 695 | TRY | 2,574 | 12/14/17 | (25,398 | ) | |||||||||||||
BNP Paribas SA | NZD | 1,335 | AUD | 1,227 | 11/30/17 | 26,001 | ||||||||||||||
BNP Paribas SA | GBP | 1,026 | USD | 1,390 | 12/01/17 | 26,402 | ||||||||||||||
Citibank, NA | CAD | 5,479 | USD | 4,373 | 11/10/17 | 125,741 | ||||||||||||||
Citibank, NA | USD | 1,998 | RUB | 115,351 | 11/22/17 | (28,262 | ) | |||||||||||||
Citibank, NA | USD | 1,954 | MXN | 35,984 | 12/08/17 | (88,891 | ) | |||||||||||||
Deutsche Bank AG | BRL | 5,440 | USD | 1,660 | 11/03/17 | (2,842 | ) | |||||||||||||
Deutsche Bank AG | USD | 1,662 | BRL | 5,440 | 11/03/17 | 1,371 | ||||||||||||||
Deutsche Bank AG | BRL | 5,440 | USD | 1,655 | 12/04/17 | (1,083 | ) | |||||||||||||
Goldman Sachs Bank USA | TWD | 50,843 | USD | 1,679 | 11/22/17 | (10,311 | ) | |||||||||||||
JPMorgan Chase Bank, NA | USD | 1,695 | TWD | 50,868 | 11/22/17 | (5,285 | ) | |||||||||||||
JPMorgan Chase Bank, NA | GBP | 954 | USD | 1,260 | 12/01/17 | (7,260 | ) | |||||||||||||
JPMorgan Chase Bank, NA | SEK | 7,877 | USD | 974 | 12/13/17 | 30,812 | ||||||||||||||
Morgan Stanley Capital Services, Inc. | USD | 1,306 | GBP | 960 | 12/01/17 | (29,997 | ) | |||||||||||||
Royal Bank of Scotland PLC | USD | 1,111 | CAD | 1,358 | 11/10/17 | (58,126 | ) | |||||||||||||
Royal Bank of Scotland PLC | AUD | 2,760 | USD | 2,199 | 11/30/17 | 87,236 | ||||||||||||||
Royal Bank of Scotland PLC | USD | 1,001 | AUD | 1,280 | 11/30/17 | (21,380 | ) | |||||||||||||
Royal Bank of Scotland PLC | JPY | 134,885 | USD | 1,190 | 12/05/17 | 2,465 | ||||||||||||||
Royal Bank of Scotland PLC | USD | 1,021 | NOK | 7,964 | 12/13/17 | (44,605 | ) | |||||||||||||
Royal Bank of Scotland PLC | EUR | 1,835 | USD | 2,163 | 12/15/17 | 19,866 | ||||||||||||||
Royal Bank of Scotland PLC | JPY | 2,000,000 | USD | 17,645 | 1/25/18 | (21,095 | ) | |||||||||||||
Standard Chartered Bank | BRL | 5,440 | USD | 1,698 | 11/03/17 | 34,904 | ||||||||||||||
Standard Chartered Bank | USD | 1,660 | BRL | 5,440 | 11/03/17 | 2,842 | ||||||||||||||
State Street Bank & Trust Co. | NZD | 273 | USD | 198 | 11/30/17 | 11,255 | ||||||||||||||
State Street Bank & Trust Co. | USD | 973 | SEK | 7,767 | 12/13/17 | (42,723 | ) | |||||||||||||
State Street Bank & Trust Co. | USD | 334 | EUR | 283 | 12/15/17 | (3,397 | ) | |||||||||||||
State Street Bank & Trust Co. | KRW | 1,922,787 | USD | 1,698 | 1/18/18 | (22,251 | ) | |||||||||||||
|
| |||||||||||||||||||
| $ | (41,980 | ) | ||||||||||||||||||
|
| |||||||||||||||||||
| abfunds.com | AB BOND INFLATION STRATEGY | 39 |
PORTFOLIO OF INVESTMENTS (continued)
CENTRALLY CLEARED CREDIT DEFAULT SWAPS (see Note D)
| Description | Fixed Rate (Pay) Receive | Payment Frequency | Implied Credit Spread at October 31, 2017 | Notional | Market Value | Upfront Premiums Paid (Received) | Unrealized Appreciation/ (Depreciation) | |||||||||||||||||||||
Sale Contracts |
| |||||||||||||||||||||||||||
CDX-NAHY Series 29, 5 Year Index, 12/20/22* | 5.00 | % | Quarterly | 3.11 | % | USD | 2,000 | $ | 179,324 | $ | 147,799 | $ | 31,525 | |||||||||||||||
| * | Termination date |
CENTRALLY CLEARED INTEREST RATE SWAPS (see Note D)
Rate Type | ||||||||||||||
Notional | Termination Date | Payments made by the Fund | Payments received by the Fund | Payment Frequency Paid/Received | Unrealized Appreciation/ (Depreciation) | |||||||||
| USD | 12,085 | 2/27/19 | 3 Month LIBOR | 1.544% | Quarterly/Semi-Annual | $ | (23,281 | ) | ||||||
| MXN | 19,008 | 6/22/20 | 4 Week TIIE | 6.770% | Monthly/Monthly | (12,726 | ) | |||||||
| USD | 6,420 | 8/11/20 | 3 Month LIBOR | 1.712% | Quarterly/Semi-Annual | (30,327 | ) | |||||||
| USD | 2,585 | 4/27/21 | 3 Month LIBOR | 1.341% | Quarterly/Semi-Annual | (55,878 | ) | |||||||
| SEK | 38,290 | 3/31/22 | 3 Month STIBOR | 0.341% | Quarterly/Annual | 29,032 | ||||||||
| NZD | 7,090 | 3/31/22 | 3 Month BKBM | 2.936% | Quarterly/Semi-Annual | 85,590 | ||||||||
| USD | 2,610 | 1/14/24 | 2.980% | 3 Month LIBOR | Semi-Annual/Quarterly | (144,024 | ) | |||||||
| USD | 2,300 | 2/14/24 | 2.889% | 3 Month LIBOR | Semi-Annual/Quarterly | (103,437 | ) | |||||||
| USD | 3,280 | 4/28/24 | 2.817% | 3 Month LIBOR | Semi-Annual/Quarterly | (124,814 | ) | |||||||
| USD | 4,670 | 5/06/24 | 2.736% | 3 Month LIBOR | Semi-Annual/Quarterly | (201,283 | ) | |||||||
| USD | 1,890 | 5/29/24 | 3 Month LIBOR | 2.628% | Quarterly/Semi-Annual | 66,616 | ||||||||
| USD | 3,330 | 7/02/24 | 2.632% | 3 Month LIBOR | Semi-Annual/Quarterly | (113,988 | ) | |||||||
| USD | 2,370 | 7/10/24 | 2.674% | 3 Month LIBOR | Semi-Annual/Quarterly | (87,153 | ) | |||||||
| USD | 1,160 | 6/09/25 | 2.488% | 3 Month LIBOR | Semi-Annual/Quarterly | (27,898 | ) | |||||||
| USD | 2,106 | 8/04/25 | 2.293% | 3 Month LIBOR | Semi-Annual/Quarterly | (8,531 | ) | |||||||
| USD | 5,400 | 10/04/26 | 1.487% | 3 Month LIBOR | Semi-Annual/Quarterly | 370,934 | ||||||||
| USD | 1,080 | 11/08/26 | 1.657% | 3 Month LIBOR | Semi-Annual/Quarterly | 52,522 | ||||||||
| USD | 1,080 | 11/09/26 | 1.672% | 3 Month LIBOR | Semi-Annual/Quarterly | 51,166 | ||||||||
| USD | 7,030 | 4/04/27 | 2.436% | 3 Month LIBOR | Semi-Annual/Quarterly | (57,378 | ) | |||||||
| MXN | 6,926 | 6/14/27 | 7.090% | 4 Week TIIE | Monthly/Monthly | 8,992 | ||||||||
| USD | 2,190 | 7/12/27 | 2.355% | 3 Month LIBOR | Semi-Annual/Quarterly | (12,445 | ) | |||||||
| USD | 1,490 | 11/10/35 | 2.631% | 3 Month LIBOR | Semi-Annual/Quarterly | (27,532 | ) | |||||||
|
| |||||||||||||
| $ | (365,843 | ) | ||||||||||||
|
| |||||||||||||
| 40 | AB BOND INFLATION STRATEGY | abfunds.com |
PORTFOLIO OF INVESTMENTS (continued)
CREDIT DEFAULT SWAPS (see Note D)
| Swap Counterparty & Referenced Obligation | Fixed Rate (Pay) Receive | Payment Frequency | Implied October 31, | Notional Amount (000) | Market Value | Upfront Premiums Paid (Received) | Unrealized Appreciation/ (Depreciation) | |||||||||||||||||||||
Buy Contracts | ||||||||||||||||||||||||||||
Citibank, NA | ||||||||||||||||||||||||||||
Sprint Communications, Inc., 7.000%, 8/15/20, 6/20/19* | (5.00 | )% | Quarterly | 0.49 | % | USD | 466 | $ | (36,059 | ) | $ | (9,352 | ) | $ | (26,707 | ) | ||||||||||||
Sprint Communications, Inc., 7.000%, 8/15/20, 6/20/19* | (5.00 | ) | Quarterly | 0.49 | USD | 534 | (41,320 | ) | (11,111 | ) | (30,209 | ) | ||||||||||||||||
Citigroup Global Markets, Inc. | ||||||||||||||||||||||||||||
CDX-CMBX.NA.AAA Series 9, 9/17/58* | (0.50 | ) | Monthly | 0.48 | USD | 30 | (36 | ) | 385 | (421 | ) | |||||||||||||||||
Credit Suisse International | ||||||||||||||||||||||||||||
CDX-CMBX.NA.AAA | (0.50 | ) | Monthly | 0.48 | USD | 26 | (31 | ) | 242 | (273 | ) | |||||||||||||||||
CDX-CMBX.NA.AAA | (0.50 | ) | Monthly | 0.48 | USD | 2,785 | (3,334 | ) | 35,531 | (38,865 | ) | |||||||||||||||||
Deutsche Bank AG | ||||||||||||||||||||||||||||
CDX-CMBX.NA.AAA | (0.50 | ) | Monthly | 0.48 | USD | 354 | (424 | ) | 4,869 | (5,293 | ) | |||||||||||||||||
CDX-CMBX.NA.AAA | (0.50 | ) | Monthly | 0.48 | USD | 1,041 | (1,246 | ) | 11,138 | (12,384 | ) | |||||||||||||||||
CDX-CMBX.NA.AAA | (0.50 | ) | Monthly | 0.48 | USD | 3,469 | (4,153 | ) | 37,436 | (41,589 | ) | |||||||||||||||||
Goldman Sachs International | ||||||||||||||||||||||||||||
CDX-CMBX.NA.AAA | (0.50 | ) | Monthly | 0.48 | USD | 226 | (271 | ) | 2,185 | (2,456 | ) | |||||||||||||||||
CDX-CMBX.NA.AAA | (0.50 | ) | Monthly | 0.48 | USD | 387 | (463 | ) | 5,280 | (5,743 | ) | |||||||||||||||||
Morgan Stanley Capital Services LLC | ||||||||||||||||||||||||||||
CDX-CMBX.NA.AAA | (0.50 | ) | Monthly | 0.48 | USD | 418 | (500 | ) | 5,551 | (6,051 | ) | |||||||||||||||||
CDX-CMBX.NA.AAA | (0.50 | ) | Monthly | 0.48 | USD | 836 | (1,001 | ) | 11,101 | (12,102 | ) | |||||||||||||||||
| abfunds.com | AB BOND INFLATION STRATEGY | 41 |
PORTFOLIO OF INVESTMENTS (continued)
| Swap Counterparty & Referenced Obligation | Fixed Rate (Pay) Receive | Payment Frequency | Implied October 31, | Notional Amount (000) | Market Value | Upfront Premiums Paid (Received) | Unrealized Appreciation/ (Depreciation) | |||||||||||||||||||
Sale Contracts | ||||||||||||||||||||||||||
Citigroup Global Markets, Inc. | ||||||||||||||||||||||||||
CDX-CMBX.NA.BBB- | 3.00 | % | Monthly | 7.25 | % | USD | 547 | $ | (91,194 | ) | $ | (88,122 | ) | $ | (3,072 | ) | ||||||||||
CDX-CMBX.NA.BBB- | 3.00 | Monthly | 7.25 | USD | 210 | (35,011 | ) | (29,921 | ) | (5,090 | ) | |||||||||||||||
CDX-CMBX.NA.BBB- | 3.00 | Monthly | 7.25 | USD | 248 | (41,346 | ) | (34,516 | ) | (6,830 | ) | |||||||||||||||
CDX-CMBX.NA.BBB- | 3.00 | Monthly | 7.25 | USD | 723 | (120,536 | ) | (93,897 | ) | (26,639 | ) | |||||||||||||||
Credit Suisse International | ||||||||||||||||||||||||||
CDX-CMBX.NA.BBB- | 3.00 | Monthly | 7.25 | USD | 130 | (21,673 | ) | (11,063 | ) | (10,610 | ) | |||||||||||||||
CDX-CMBX.NA.BBB- | 3.00 | Monthly | 7.25 | USD | 138 | (23,007 | ) | (10,013 | ) | (12,994 | ) | |||||||||||||||
CDX-CMBX.NA.BBB- | 3.00 | Monthly | 7.25 | USD | 169 | (28,176 | ) | (14,688 | ) | (13,488 | ) | |||||||||||||||
CDX-CMBX.NA.BBB- | 3.00 | Monthly | 7.25 | USD | 326 | (54,349 | ) | (32,640 | ) | (21,709 | ) | |||||||||||||||
CDX-CMBX.NA.BBB- | 3.00 | Monthly | 7.25 | USD | 471 | (78,524 | ) | (31,975 | ) | (46,549 | ) | |||||||||||||||
CDX-CMBX.A | 2.00 | Monthly | 3.31 | USD | 1,145 | (67,911 | ) | (26,722 | ) | (41,189 | ) | |||||||||||||||
CDX-CMBX.NA.BBB- | 3.00 | Monthly | 7.25 | USD | 122 | (20,340 | ) | (15,605 | ) | (4,735 | ) | |||||||||||||||
Deutsche Bank AG | ||||||||||||||||||||||||||
CDX-CMBX.NA.BBB- | 3.00 | Monthly | 7.25 | USD | 30 | (5,001 | ) | (3,690 | ) | (1,311 | ) | |||||||||||||||
CDX-CMBX.NA.BBB- | 3.00 | Monthly | 7.25 | USD | 130 | (21,674 | ) | (17,191 | ) | (4,483 | ) | |||||||||||||||
CDX-CMBX.NA.BBB- | 3.00 | Monthly | 7.25 | USD | 150 | (25,007 | ) | (19,835 | ) | (5,172 | ) | |||||||||||||||
CDX-CMBX.NA.BBB- | 3.00 | Monthly | 7.25 | USD | 217 | (36,178 | ) | (26,048 | ) | (10,130 | ) | |||||||||||||||
CDX-CMBX.NA.BBB- | 3.00 | Monthly | 7.25 | USD | 218 | (36,344 | ) | (26,157 | ) | (10,187 | ) | |||||||||||||||
| 42 | AB BOND INFLATION STRATEGY | abfunds.com |
PORTFOLIO OF INVESTMENTS (continued)
| Swap Counterparty & Referenced Obligation | Fixed Rate (Pay) Receive | Payment Frequency | Implied October 31, | Notional Amount (000) | Market Value | Upfront Premiums Paid (Received) | Unrealized Appreciation/ (Depreciation) | |||||||||||||||||||||
CDX-CMBX.NA.BBB- | 3.00 | % | Monthly | 7.25 | % | USD | 247 | $ | (41,179 | ) | $ | (27,924 | ) | $ | (13,255 | ) | ||||||||||||
CDX-CMBX.NA.BBB- | 3.00 | Monthly | 7.25 | USD | 464 | (77,357 | ) | (40,051 | ) | (37,306 | ) | |||||||||||||||||
CDX-CMBX.NA.BBB- | 3.00 | Monthly | 7.25 | USD | 436 | (72,689 | ) | (32,825 | ) | (39,864 | ) | |||||||||||||||||
CDX-CMBX.NA.BBB- | 3.00 | Monthly | 7.25 | USD | 662 | (110,367 | ) | (48,689 | ) | (61,678 | ) | |||||||||||||||||
CDX-CMBX.NA.BBB- | 3.00 | Monthly | 7.25 | USD | 714 | (119,036 | ) | (43,008 | ) | (76,028 | ) | |||||||||||||||||
Goldman Sachs International | ||||||||||||||||||||||||||||
CDX-CMBX.NA.BBB- | 3.00 | Monthly | 7.25 | USD | 598 | (99,697 | ) | (96,466 | ) | (3,231 | ) | |||||||||||||||||
CDX-CMBX.NA.BBB- | 3.00 | Monthly | 7.25 | USD | 15 | (2,501 | ) | (1,411 | ) | (1,090 | ) | |||||||||||||||||
CDX-CMBX.NA.BBB- | 3.00 | Monthly | 7.25 | USD | 30 | (5,002 | ) | (3,110 | ) | (1,892 | ) | |||||||||||||||||
CDX-CMBX.NA.BBB- | 3.00 | Monthly | 7.25 | USD | 30 | (5,002 | ) | (2,874 | ) | (2,128 | ) | |||||||||||||||||
CDX-CMBX.NA.BBB- | 3.00 | Monthly | 7.25 | USD | 59 | (9,836 | ) | (6,684 | ) | (3,152 | ) | |||||||||||||||||
CDX-CMBX.NA.BBB- | 3.00 | Monthly | 7.25 | USD | 322 | (53,683 | ) | (45,988 | ) | (7,695 | ) | |||||||||||||||||
CDX-CMBX.NA.BBB- | 3.00 | Monthly | 7.25 | USD | 166 | (27,675 | ) | (18,559 | ) | (9,116 | ) | |||||||||||||||||
CDX-CMBX.NA.BBB- | 3.00 | Monthly | 7.25 | USD | 178 | (29,676 | ) | (16,141 | ) | (13,535 | ) | |||||||||||||||||
CDX-CMBX.NA.BBB- | 3.00 | Monthly | 7.25 | USD | 710 | (118,368 | ) | (85,790 | ) | (32,578 | ) | |||||||||||||||||
CDX-CMBX.NA.BBB- | 3.00 | Monthly | 7.25 | USD | 1,300 | (216,731 | ) | (161,139 | ) | (55,592 | ) | |||||||||||||||||
Morgan Stanley Capital Services LLC | ||||||||||||||||||||||||||||
CDX-CMBX.NA.BBB- | 3.00 | Monthly | 7.25 | USD | 191 | (31,843 | ) | (14,134 | ) | (17,709 | ) | |||||||||||||||||
|
|
|
|
|
| |||||||||||||||||||||||
| $ | (1,815,751 | ) | $ | (1,033,621 | ) | $ | (782,130 | ) | ||||||||||||||||||||
|
|
|
|
|
| |||||||||||||||||||||||
| * | Termination date |
| abfunds.com | AB BOND INFLATION STRATEGY | 43 |
PORTFOLIO OF INVESTMENTS (continued)
INFLATION (CPI) SWAPS (see Note D)
| Rate Type | ||||||||||||||||||||
Swap | Notional Amount (000) | Termination Date | Payments made by the Fund | Payments received by the Fund | Payment Frequency Paid/Received | Unrealized Appreciation/ (Depreciation) | ||||||||||||||
Barclays Bank PLC | USD | 20,750 | 7/15/20 | 1.527 | % | CPI | # | Maturity/ Maturity | $ | 253,393 | ||||||||||
Barclays Bank PLC | USD | 6,950 | 1/15/21 | 1.490 | % | CPI | # | Maturity/ Maturity | 93,969 | |||||||||||
Bank of America, NA | USD | 23,640 | 7/15/21 | 1.765 | % | CPI | # | Maturity/ Maturity | 225,753 | |||||||||||
Deutsche Bank AG | USD | 5,190 | 7/15/21 | 2.152 | % | CPI | # | Maturity/ Maturity | (30,555 | ) | ||||||||||
|
| |||||||||||||||||||
| $ | 542,560 | |||||||||||||||||||
|
| |||||||||||||||||||
| # | Variable interest rate based on the rate of inflation as determined by the Consumer Price Index (CPI). |
INTEREST RATE SWAPS (see Note D)
| Rate Type | ||||||||||||||||||||||
Swap | Notional Amount (000) | Termination Date | Payments made by the Fund | Payments received by the Fund | Payment Frequency Paid/Received | Unrealized Appreciation/ (Depreciation) | ||||||||||||||||
Morgan Stanley Capital Services LLC | USD | 595 | 3/06/42 | 2.804 | % | 3 Month LIBOR | | Semi- Annual/ Quarterly |
| $ | (26,649 | ) | ||||||||||
REVERSE REPURCHASE AGREEMENTS (see Note D)
| Broker | Interest Rate | Maturity | U.S. $ Value at October 31, 2017 | |||||||||
HSBC Bank USA | 1.26 | % | 11/01/17 | $ | 13,659,982 | |||||||
HSBC Bank USA | 1.40 | % | 1/10/18 | 28,382,973 | ||||||||
HSBC Bank USA+ | 1.26 | % | — | 33,184,212 | ||||||||
JPMorgan Chase Bank | 1.20 | % | 11/08/17 | 46,402,003 | ||||||||
|
| |||||||||||
| $ | 121,629,170 | |||||||||||
|
| |||||||||||
| + | The reverse repurchase agreement matures on demand. Interest rate resets daily and the rate shown is the rate in effect on October 31, 2017 |
The type of underlying collateral and the remaining maturity of open reverse repurchase agreements is as follows:
| Overnight and Continuous | Up to 30 Days | 31-90 Days | Greater than 90 Days | Total | ||||||||||||||||
Inflation-Linked Securities | $ | 33,184,212 | $ | 60,061,985 | $ | 28,382,973 | $ | — | $ | 121,629,170 | ||||||||||
| (a) | Position, or a portion thereof, has been segregated to collateralize reverse repurchase agreements. |
| (b) | Position, or a portion thereof, has been segregated to collateralize OTC derivatives outstanding. |
| 44 | AB BOND INFLATION STRATEGY | abfunds.com |
PORTFOLIO OF INVESTMENTS (continued)
| (c) | Security is exempt from registration under Rule 144A of the Securities Act of 1933. These securities are considered restricted, but liquid and may be resold in transactions exempt from registration, normally to qualified institutional buyers. At October 31, 2017, the aggregate market value of these securities amounted to $55,936,825 or 11.4% of net assets. |
| (d) | Securities are perpetual and, thus, do not have a predetermined maturity date. The date shown, if applicable, reflects the next call date. |
| (e) | Floating Rate Security. Stated interest/floor rate was in effect at October 31, 2017. |
| (f) | Security in which significant unobservable inputs (Level 3) were used in determining fair value. |
| (g) | IO – Interest Only. |
| (h) | Security is exempt from registration under Rule 144A of the Securities Act of 1933. These securities, which represent 0.15% of net assets as of October 31, 2017, are considered illiquid and restricted. Additional information regarding such securities follows: |
| 144A/Restricted & Illiquid Securities | Acquisition Date | Cost | Market Value | Percentage of Net Assets | ||||||||||||
Bellemeade Re II Ltd. | 4/29/16 | $ | 240,720 | $ | 246,838 | 0.05 | % | |||||||||
H/2 Asset Funding NRE | 6/19/15 | 346,197 | 346,197 | 0.07 | % | |||||||||||
Virgolino de Oliveira Finance SA | 1/27/14 | 363,153 | 33,568 | 0.01 | % | |||||||||||
Wells Fargo Credit Risk Transfer Securities Trust Series 2015-WF1, Class 2M1 | 9/28/15 | 118,174 | 119,477 | 0.02 | % | |||||||||||
| (i) | Inverse interest only security. |
| (j) | Defaulted. |
| (k) | Non-income producing security. |
| (l) | Restricted and illiquid security. |
| Restricted & Illiquid Securities | Acquisition Date | Cost | Market Value | Percentage of Net Assets | ||||||||||||
Mt Logan Re Ltd. (Preference Shares) | 12/30/14 | $ | 260,000 | $ | 271,107 | 0.06 | % | |||||||||
Currency Abbreviations:
AUD – Australian Dollar
BRL – Brazilian Real
CAD – Canadian Dollar
EUR – Euro
GBP – Great British Pound
JPY – Japanese Yen
KRW – South Korean Won
MXN – Mexican Peso
NOK – Norwegian Krone
NZD – New Zealand Dollar
RUB – Russian Ruble
SEK – Swedish Krona
TRY – Turkish Lira
TWD – New Taiwan Dollar
USD – United States Dollar
| abfunds.com | AB BOND INFLATION STRATEGY | 45 |
PORTFOLIO OF INVESTMENTS (continued)
Glossary:
ABS – Asset-Backed Securities
BKBM – Bank Bill Benchmark (New Zealand)
BOBL – Bundesobligationen
CBT – Chicago Board of Trade
CDX-CMBX.NA – North American Commercial Mortgage-Backed Index
CDX-NAHY – North American High Yield Credit Default Swap Index
CMBS – Commercial Mortgage-Backed Securities
CPI – Consumer Price Index
EURIBOR – Euro Interbank Offered Rate
LIBOR – London Interbank Offered Rates
OSE – Osaka Securities Exchange
REIT – Real Estate Investment Trust
REMICs – Real Estate Mortgage Investment Conduits
STIBOR – Stockholm Interbank Offered Rate
TIIE – Banco de México Equilibrium Interbank Interest Rate
TIPS – Treasury Inflation Protected Security
See notes to financial statements.
| 46 | AB BOND INFLATION STRATEGY | abfunds.com |
STATEMENT OF ASSETS & LIABILITIES
October 31, 2017
| Assets | ||||
Investments in securities, at value (cost $606,299,295) | $ | 609,090,029 | ||
Cash | 1,104,874 | |||
Cash collateral due from broker | 1,742,556 | |||
Foreign currencies, at value (cost $103,265) | 97,256 | |||
Receivable for investment securities sold | 8,646,275 | |||
Interest receivable | 1,963,011 | |||
Receivable for capital stock sold | 1,446,194 | |||
Unrealized appreciation on inflation swaps | 573,115 | |||
Unrealized appreciation on forward currency exchange contracts | 370,926 | |||
Upfront premiums paid on credit default swaps | 113,718 | |||
Receivable for variation margin on exchange traded swaps | 8,179 | |||
Affiliated dividends receivable | 1,941 | |||
|
| |||
Total assets | 625,158,074 | |||
|
| |||
| Liabilities | ||||
Payable for reverse repurchase agreements | 121,629,170 | |||
Payable for capital stock redeemed | 7,291,668 | |||
Upfront premiums received on credit default swaps | 1,147,339 | |||
Payable for investment securities purchased | 1,020,079 | |||
Unrealized depreciation on credit default swaps | 782,130 | |||
Unrealized depreciation on forward currency exchange contracts | 412,906 | |||
Advisory fee payable | 100,284 | |||
Distribution fee payable | 32,850 | |||
Unrealized depreciation on inflation swaps | 30,555 | |||
Payable for variation margin on futures | 29,617 | |||
Unrealized depreciation on interest rate swaps | 26,649 | |||
Transfer Agent fee payable | 24,693 | |||
Administrative fee payable | 22,882 | |||
Directors’ fees payable | 2,434 | |||
Accrued expenses and other liabilities | 302,351 | |||
|
| |||
Total liabilities | 132,855,607 | |||
|
| |||
Net Assets | $ | 492,302,467 | ||
|
| |||
| Composition of Net Assets | ||||
Capital stock, at par | $ | 45,866 | ||
Additional paid-in capital | 500,585,748 | |||
Undistributed net investment income | 506,002 | |||
Accumulated net realized loss on investment and foreign currency transactions | (11,417,804 | ) | ||
Net unrealized appreciation on investments and foreign currency denominated assets and liabilities | 2,582,655 | |||
|
| |||
| $ | 492,302,467 | |||
|
|
See notes to financial statements.
| abfunds.com | AB BOND INFLATION STRATEGY | 47 |
STATEMENT OF ASSETS & LIABILITIES (continued)
Net Asset Value Per Share—33 billion shares of capital stock authorized, $.001 par value
| Class | Net Assets | Shares Outstanding | Net Asset Value | |||||||||
| ||||||||||||
| A | $ | 27,718,380 | 2,559,632 | $ | 10.83 | * | ||||||
| ||||||||||||
| C | $ | 3,626,967 | 341,883 | $ | 10.61 | |||||||
| ||||||||||||
| Advisor | $ | 107,544,720 | 9,918,046 | $ | 10.84 | |||||||
| ||||||||||||
| R | $ | 5,363,784 | 495,954 | $ | 10.82 | |||||||
| ||||||||||||
| K | $ | 2,902,683 | 268,603 | $ | 10.81 | |||||||
| ||||||||||||
| I | $ | 641,638 | 59,751 | $ | 10.74 | |||||||
| ||||||||||||
| 1 | $ | 274,366,572 | 25,662,541 | $ | 10.69 | |||||||
| ||||||||||||
| 2 | $ | 54,118,307 | 5,064,585 | $ | 10.69 | |||||||
| ||||||||||||
| Z | $ | 16,019,416 | 1,494,758 | $ | 10.72 | |||||||
| ||||||||||||
| * | The maximum offering price per share for Class A shares was $11.31 which reflects a sales charge of 4.25%. |
See notes to financial statements.
| 48 | AB BOND INFLATION STRATEGY | abfunds.com |
STATEMENT OF OPERATIONS
Year Ended October 31, 2017
| Investment Income | ||||||||
Interest | $ | 13,088,328 | ||||||
Dividends | ||||||||
Affiliated issuers | 32,641 | |||||||
Unaffiliated issuers | 19,923 | |||||||
Other income | 54 | $ | 13,140,946 | |||||
|
| |||||||
| Expenses | ||||||||
Advisory fee (see Note B) | 2,194,665 | |||||||
Distribution fee—Class A | 62,391 | |||||||
Distribution fee—Class C | 38,671 | |||||||
Distribution fee—Class R | 3,291 | |||||||
Distribution fee—Class K | 6,435 | |||||||
Distribution fee—Class 1 | 248,903 | |||||||
Transfer agency—Class A | 42,048 | |||||||
Transfer agency—Class C | 6,458 | |||||||
Transfer agency—Advisor Class | 150,367 | |||||||
Transfer agency—Class R | 1,222 | |||||||
Transfer agency—Class K | 5,049 | |||||||
Transfer agency—Class I | 353 | |||||||
Transfer agency—Class 1 | 36,296 | |||||||
Transfer agency—Class 2 | 8,153 | |||||||
Transfer agency—Class Z | 2,814 | |||||||
Custodian | 185,938 | |||||||
Registration fees | 152,593 | |||||||
Audit and tax | 108,505 | |||||||
Printing | 75,997 | |||||||
Administrative | 64,905 | |||||||
Legal | 39,890 | |||||||
Directors’ fees | 28,082 | |||||||
Miscellaneous | 26,579 | |||||||
|
| |||||||
Total expenses before interest expense | 3,489,605 | |||||||
Interest expense | 1,168,467 | |||||||
|
| |||||||
Total expenses | 4,658,072 | |||||||
Less: expenses waived and reimbursed by the Adviser (see Note B) | (946,439 | ) | ||||||
|
| |||||||
Net expenses | 3,711,633 | |||||||
|
| |||||||
Net investment income | 9,429,313 | |||||||
|
|
See notes to financial statements.
| abfunds.com | AB BOND INFLATION STRATEGY | 49 |
STATEMENT OF OPERATIONS (continued)
| Realized and Unrealized Gain (Loss) on Investment and Foreign Currency Transactions | ||||||||
Net realized gain (loss) on: | ||||||||
Investment transactions | $ | 1,337,719 | ||||||
Forward currency exchange contracts | (121,038 | ) | ||||||
Futures | (891,211 | ) | ||||||
Swaps | (116,680 | ) | ||||||
Swaptions written | 48,025 | |||||||
Foreign currency transactions | (220,137 | ) | ||||||
Net change in unrealized appreciation/depreciation of: | ||||||||
Investments | (4,954,645 | ) | ||||||
Forward currency exchange contracts | (144,515 | ) | ||||||
Futures | 475,573 | |||||||
Swaps | 1,356,612 | |||||||
Swaptions written | (3,987 | ) | ||||||
Foreign currency denominated assets and liabilities | (27,182 | ) | ||||||
|
| |||||||
Net loss on investment and foreign currency transactions | (3,261,466 | ) | ||||||
|
| |||||||
Contributions from Affiliates (see Note B) | 957 | |||||||
|
| |||||||
Net Increase in Net Assets from Operations | $ | 6,168,804 | ||||||
|
|
See notes to financial statements.
| 50 | AB BOND INFLATION STRATEGY | abfunds.com |
STATEMENT OF CHANGES IN NET ASSETS
| Year Ended October 31, 2017 | Year Ended October 31, 2016 | |||||||
| Increase (Decrease) in Net Assets from Operations | ||||||||
Net investment income | $ | 9,429,313 | $ | 6,136,129 | ||||
Net realized gain (loss) on investment and foreign currency transactions | 36,678 | (1,639,351 | ) | |||||
Net change in unrealized appreciation/depreciation of investments and foreign currency denominated assets and liabilities | (3,298,144 | ) | 16,608,452 | |||||
Contributions from Affiliates (see Note B) | 957 | – 0 | – | |||||
|
|
|
| |||||
Net increase in net assets from operations | 6,168,804 | 21,105,230 | ||||||
| Dividends to Shareholders from | ||||||||
Net investment income | ||||||||
Class A | (438,322 | ) | (246,245 | ) | ||||
Class C | (42,144 | ) | (36,966 | ) | ||||
Advisor Class | (1,782,646 | ) | (470,470 | ) | ||||
Class R | (8,105 | ) | (2,681 | ) | ||||
Class K | (44,541 | ) | (38,246 | ) | ||||
Class I | (10,229 | ) | (7,136 | ) | ||||
Class 1 | (5,080,600 | ) | (5,652,787 | ) | ||||
Class 2 | (1,188,735 | ) | (1,101,775 | ) | ||||
Class Z | (299,386 | ) | (255,907 | ) | ||||
| Capital Stock Transactions | ||||||||
Net increase (decrease) | 168,272,863 | (21,240,298 | ) | |||||
|
|
|
| |||||
Total increase (decrease) | 165,546,959 | (7,947,281 | ) | |||||
| Net Assets | ||||||||
Beginning of period | 326,755,508 | 334,702,789 | ||||||
|
|
|
| |||||
End of period (including undistributed net investment income of $506,002 and $574,964, respectively) | $ | 492,302,467 | $ | 326,755,508 | ||||
|
|
|
| |||||
See notes to financial statements.
| abfunds.com | AB BOND INFLATION STRATEGY | 51 |
STATEMENT OF CASH FLOWS
For the Year Ended October 31, 2017
| Cash flows from operating activities | ||||||||
Net increase in net assets from operations | $ | 6,168,804 | ||||||
| Reconciliation of net increase in net assets from operations to net decrease in cash from operating activities: | ||||||||
Purchases of long-term investments | $ | (382,029,453 | ) | |||||
Purchases of short-term investments | (311,101,247 | ) | ||||||
Proceeds from disposition of long-term investments | 244,747,004 | |||||||
Proceeds from disposition of short-term investments | 297,998,771 | |||||||
Net realized gain on investment transactions and foreign currency transactions | (36,678 | ) | ||||||
Net change in unrealized appreciation/depreciation of investments and foreign currency denominated assets and liabilities | 3,298,144 | |||||||
Net accretion of bond discount and amortization of bond premium | 3,098,558 | |||||||
Inflation index adjustment | (7,253,171 | ) | ||||||
Decrease in receivable for investments sold | 3,548,784 | |||||||
Increase in interest receivable | (466,767 | ) | ||||||
Increase in affiliated dividends receivable | (925 | ) | ||||||
Increase in cash collateral due from broker | (217,342 | ) | ||||||
Increase in payable for investments purchased | 44,509 | |||||||
Increase in advisory fee payable | 19,744 | |||||||
Increase in administrative fee payable | 6,042 | |||||||
Increase in Transfer Agent fee payable | 17,144 | |||||||
Increase in distribution fee payable | 9,458 | |||||||
Increase in directors’ fee payable | 247 | |||||||
Increase in accrued expenses | 109,618 | |||||||
Proceeds from swaptions written, net | 34,155 | |||||||
Proceeds on swaps, net | 1,015,501 | |||||||
Proceeds for exchange-traded derivatives settlements | 691,357 | |||||||
Total adjustments | (146,466,547 | ) | ||||||
|
| |||||||
Net decrease in cash from operating activities | $ | (140,297,743 | ) | |||||
|
| |||||||
| Cash flows from financing activities | ||||||||
Subscriptions of capital stock, net | 166,827,221 | |||||||
Cash dividends paid (net of dividend reinvestments)* | (1,604,463 | ) | ||||||
Repayment of reverse repurchase agreements | (26,697,288 | ) | ||||||
|
| |||||||
Net increase in cash from financing activities | 138,525,470 | |||||||
Effect of exchange rate on cash | (368,357 | ) | ||||||
|
| |||||||
Net decrease in cash | (2,140,630 | ) | ||||||
Net change in cash | ||||||||
Cash at beginning of year | 3,342,760 | |||||||
|
| |||||||
Cash at end of year | $ | 1,202,130 | ||||||
|
| |||||||
* Reinvestment of dividends | $ | 7,290,245 | ||||||
Supplemental disclosure of cash flow information: | ||||||||
Interest expense paid during the year | $ | 1,098,630 |
In accordance with U.S. GAAP, the Strategy has included a Statement of Cash Flows as a result of its significant investments in reverse repurchase agreements throughout the year.
See notes to financial statements.
| 52 | AB BOND INFLATION STRATEGY | abfunds.com |
NOTES TO FINANCIAL STATEMENTS
October 31, 2017
NOTE A
Significant Accounting Policies
AB Bond Fund, Inc. (the “Company”) is registered under the Investment Company Act of 1940 as an open-end management investment company. The Company, which is a Maryland corporation, operates as a series company comprised of eleven portfolios currently in operation. Each portfolio is considered to be a separate entity for financial reporting and tax purposes. This report relates only to the AB Bond Inflation Strategy Portfolio (the “Strategy”), a diversified portfolio. The Strategy has authorized the issuance of Class A, Class B, Class C, Advisor Class, Class R, Class K, Class I, Class Z, Class T, Class 1 and Class 2. Class B and Class T shares have not been issued. Class 1 shares are sold only to the private clients of Sanford C. Bernstein & Co. LLC by its registered representatives. Class A shares are sold with a front-end sales charge of up to 4.25% for purchases not exceeding $1,000,000. With respect to purchases of $1,000,000 or more, Class A shares redeemed within one year of purchase may be subject to a contingent deferred sales charge of 1%. Class C shares are subject to a contingent deferred sales charge of 1% on redemptions made within the first year after purchase and 0% after the first year of purchase. Effective April 10, 2017, Class C shares will automatically convert to Class A shares ten years after the end of the calendar month of purchase. Class R, Class K, and Class 1 shares are sold without an initial or contingent deferred sales charge. Advisor Class, Class I, Class 2 and Class Z shares are sold without an initial or contingent deferred sales charge and are not subject to ongoing distribution expenses. All eleven classes of shares have identical voting, dividend, liquidation and other rights, except that the classes bear different distribution and transfer agency expenses. Each class has exclusive voting rights with respect to its distribution plan. The financial statements have been prepared in conformity with U.S. generally accepted accounting principles (“U.S. GAAP”) which require management to make certain estimates and assumptions that affect the reported amounts of assets and liabilities in the financial statements and amounts of income and expenses during the reporting period. Actual results could differ from those estimates. The Strategy is an investment company under U.S. GAAP and follows the accounting and reporting guidance applicable to investment companies. The following is a summary of significant accounting policies followed by the Strategy.
1. Security Valuation
Portfolio securities are valued at their current market value determined on the basis of market quotations or, if market quotations are not readily available or are deemed unreliable, at “fair value” as determined in accordance with procedures established by and under the general supervision of the Company’s Board of Directors (the “Board”).
| abfunds.com | AB BOND INFLATION STRATEGY | 53 |
NOTES TO FINANCIAL STATEMENTS (continued)
In general, the market values of securities which are readily available and deemed reliable are determined as follows: securities listed on a national securities exchange (other than securities listed on the NASDAQ Stock Market, Inc. (“NASDAQ”)) or on a foreign securities exchange are valued at the last sale price at the close of the exchange or foreign securities exchange. If there has been no sale on such day, the securities are valued at the last traded price from the previous day. Securities listed on more than one exchange are valued by reference to the principal exchange on which the securities are traded; securities listed only on NASDAQ are valued in accordance with the NASDAQ Official Closing Price; listed or over the counter (“OTC”) market put or call options are valued at the mid level between the current bid and ask prices. If either a current bid or current ask price is unavailable, AllianceBernstein L.P. (the “Adviser”) will have discretion to determine the best valuation (e.g., last trade price in the case of listed options); open futures are valued using the closing settlement price or, in the absence of such a price, the most recent quoted bid price. If there are no quotations available for the day of valuation, the last available closing settlement price is used; U.S. Government securities and any other debt instruments having 60 days or less remaining until maturity are generally valued at market by an independent pricing vendor, if a market price is available. If a market price is not available, the securities are valued at amortized cost. This methodology is commonly used for short term securities that have an original maturity of 60 days or less, as well as short term securities that had an original term to maturity that exceeded 60 days. In instances when amortized cost is utilized, the Valuation Committee (the “Committee”) must reasonably conclude that the utilization of amortized cost is approximately the same as the fair value of the security. Such factors the Committee will consider include, but are not limited to, an impairment of the creditworthiness of the issuer or material changes in interest rates. Fixed-income securities, including mortgage-backed and asset-backed securities, may be valued on the basis of prices provided by a pricing service or at a price obtained from one or more of the major broker-dealers. In cases where broker-dealer quotes are obtained, the Adviser may establish procedures whereby changes in market yields or spreads are used to adjust, on a daily basis, a recently obtained quoted price on a security. Swaps and other derivatives are valued daily, primarily using independent pricing services, independent pricing models using market inputs, as well as third party broker-dealers or counterparties. Open end mutual funds are valued at the closing net asset value per share, while exchange traded funds are valued at the closing market price per share.
Securities for which market quotations are not readily available (including restricted securities) or are deemed unreliable are valued at fair value as deemed appropriate by the Adviser. Factors considered in making this determination may include, but are not limited to, information obtained by
| 54 | AB BOND INFLATION STRATEGY | abfunds.com |
NOTES TO FINANCIAL STATEMENTS (continued)
contacting the issuer, analysts, analysis of the issuer’s financial statements or other available documents. In addition, the Strategy may use fair value pricing for securities primarily traded in non-U.S. markets because most foreign markets close well before the Strategy values its securities at 4:00 p.m., Eastern Time. The earlier close of these foreign markets gives rise to the possibility that significant events, including broad market moves, may have occurred in the interim and may materially affect the value of those securities. To account for this, the Strategy generally values many of its foreign equity securities using fair value prices based on third party vendor modeling tools to the extent available.
2. Fair Value Measurements
In accordance with U.S. GAAP regarding fair value measurements, fair value is defined as the price that the Strategy would receive to sell an asset or pay to transfer a liability in an orderly transaction between market participants at the measurement date. U.S. GAAP establishes a framework for measuring fair value, and a three-level hierarchy for fair value measurements based upon the transparency of inputs to the valuation of an asset or liability (including those valued based on their market values as described in Note A.1 above). Inputs may be observable or unobservable and refer broadly to the assumptions that market participants would use in pricing the asset or liability. Observable inputs reflect the assumptions market participants would use in pricing the asset or liability based on market data obtained from sources independent of the Strategy. Unobservable inputs reflect the Strategy’s own assumptions about the assumptions that market participants would use in pricing the asset or liability based on the best information available in the circumstances. Each investment is assigned a level based upon the observability of the inputs which are significant to the overall valuation. The three-tier hierarchy of inputs is summarized below.
| • | Level 1—quoted prices in active markets for identical investments |
| • | Level 2—other significant observable inputs (including quoted prices for similar investments, interest rates, prepayment speeds, credit risk, etc.) |
| • | Level 3—significant unobservable inputs (including the Strategy’s own assumptions in determining the fair value of investments) |
The fair value of debt instruments, such as bonds, and over-the-counter derivatives is generally based on market price quotations, recently executed market transactions (where observable) or industry recognized modeling techniques and are generally classified as Level 2. Pricing vendor inputs to Level 2 valuations may include quoted prices for similar investments in active markets, interest rate curves, coupon rates, currency rates, yield curves, option adjusted spreads, default rates, credit spreads and
| abfunds.com | AB BOND INFLATION STRATEGY | 55 |
NOTES TO FINANCIAL STATEMENTS (continued)
other unique security features in order to estimate the relevant cash flows which are then discounted to calculate fair values. If these inputs are unobservable and significant to the fair value, these investments will be classified as Level 3. In addition, non-agency rated investments are classified as Level 3.
Where readily available market prices or relevant bid prices are not available for certain equity investments, such investments may be valued based on similar publicly traded investments, movements in relevant indices since last available prices or based upon underlying company fundamentals and comparable company data (such as multiples to earnings or other multiples to equity). Where an investment is valued using an observable input, such as another publicly traded security, the investment will be classified as Level 2. If management determines that an adjustment is appropriate based on restrictions on resale, illiquidity or uncertainty, and such adjustment is a significant component of the valuation, the investment will be classified as Level 3. An investment will also be classified as Level 3 where management uses company fundamentals and other significant inputs to determine the valuation.
Valuations of mortgage-backed or other asset-backed securities, by pricing vendors, are based on both proprietary and industry recognized models and discounted cash flow techniques. Significant inputs to the valuation of these instruments are value of the collateral, the rates and timing of delinquencies, the rates and timing of prepayments, and default and loss expectations, which are driven in part by housing prices for residential mortgages. Significant inputs are determined based on relative value analyses, which incorporate comparisons to instruments with similar collateral and risk profiles, including relevant indices. Mortgage and asset-backed securities for which management has collected current observable data through pricing services are generally categorized within Level 2. Those investments for which current observable data has not been provided are classified as Level 3.
Other fixed income investments, including non-U.S. government and corporate debt, are generally valued using quoted market prices, if available, which are typically impacted by current interest rates, maturity dates and any perceived credit risk of the issuer. Additionally, in the absence of quoted market prices, these inputs are used by pricing vendors to derive a valuation based upon industry or proprietary models which incorporate issuer specific data with relevant yield/spread comparisons with more widely quoted bonds with similar key characteristics. Those investments for which there are observable inputs are classified as Level 2. Where the inputs are not observable, the investments are classified as Level 3.
| 56 | AB BOND INFLATION STRATEGY | abfunds.com |
NOTES TO FINANCIAL STATEMENTS (continued)
The following table summarizes the valuation of the Strategy’s investments by the above fair value hierarchy levels as of October 31, 2017:
Investments in | Level 1 | Level 2 | Level 3 | Total | ||||||||||||
Assets: | ||||||||||||||||
Inflation-Linked Securities | $ | – 0 | – | $ | 430,939,023 | $ | – 0 | – | $ | 430,939,023 | ||||||
Corporates – Investment Grade | – 0 | – | 59,480,996 | – 0 | – | 59,480,996 | ||||||||||
Commercial Mortgage-Backed Securities | – 0 | – | 29,291,635 | 4,607,155 | 33,898,790 | |||||||||||
Asset-Backed Securities | – 0 | – | 21,539,087 | 6,237,183 | 27,776,270 | |||||||||||
Collateralized Mortgage Obligations | – 0 | – | 21,736,815 | – 0 | – | 21,736,815 | ||||||||||
Corporates – Non-Investment Grade | – 0 | – | 12,784,054 | – 0 | – | 12,784,054 | ||||||||||
Emerging Markets – Treasuries | – 0 | – | 4,004,399 | – 0 | – | 4,004,399 | ||||||||||
Emerging Markets – Corporate Bonds | – 0 | – | 2,377,676 | – 0 | – | 2,377,676 | ||||||||||
Quasi-Sovereigns | – 0 | – | 2,035,653 | – 0 | – | 2,035,653 | ||||||||||
Governments – Sovereign Bonds | – 0 | – | 677,300 | – 0 | – | 677,300 | ||||||||||
Common Stocks | – 0 | – | – 0 | – | 271,107 | 271,107 | ||||||||||
Emerging Markets – Sovereigns | – 0 | – | 266,156 | – 0 | – | 266,156 | ||||||||||
Short-Term Investments | ||||||||||||||||
Governments – Treasuries | – 0 | – | 12,841,790 | – 0 | – | 12,841,790 | ||||||||||
|
|
|
|
|
|
|
| |||||||||
Total Investments in Securities | – 0 | – | 597,974,584 | 11,115,445 | 609,090,029 | |||||||||||
Other Financial Instruments(a): | ||||||||||||||||
Assets: | ||||||||||||||||
Futures | 749,364 | – 0 | – | – 0 | – | 749,364 | (b) | |||||||||
Forward Currency Exchange Contracts | – 0 | – | 370,926 | – 0 | – | 370,926 | ||||||||||
Centrally Cleared Credit Default Swaps | – 0 | – | 179,324 | – 0 | – | 179,324 | (b) | |||||||||
Centrally Cleared Interest Rate Swaps | – 0 | – | 664,852 | – 0 | – | 664,852 | (b) | |||||||||
Inflation (CPI) Swaps | – 0 | – | 573,115 | – 0 | – | 573,115 | ||||||||||
Liabilities: | ||||||||||||||||
Futures | (295,601 | ) | – 0 | – | – 0 | – | (295,601 | )(b) | ||||||||
Forward Currency Exchange Contracts | – 0 | – | (412,906 | ) | – 0 | – | (412,906 | ) | ||||||||
Centrally Cleared Interest Rate Swaps | – 0 | – | (1,030,695 | ) | – 0 | – | (1,030,695 | )(b) | ||||||||
Credit Default Swaps | – 0 | – | (1,815,751 | ) | – 0 | – | (1,815,751 | ) | ||||||||
Inflation (CPI) Swaps | – 0 | – | (30,555 | ) | – 0 | – | (30,555 | ) | ||||||||
Interest Rate Swaps | – 0 | – | (26,649 | ) | – 0 | – | (26,649 | ) | ||||||||
|
|
|
|
|
|
|
| |||||||||
Total(c) | $ | 453,763 | $ | 596,446,245 | $ | 11,115,445 | $ | 608,015,453 | ||||||||
|
|
|
|
|
|
|
| |||||||||
| (a) | Other financial instruments are derivative instruments, such as futures, forwards and swaps, which are valued at the unrealized appreciation/(depreciation) on the instrument. Other financial instruments may also include swaps with upfront premiums which are valued at market value. |
| (b) | Only variation margin receivable/(payable) at period end is reported within the statement of assets and liabilities. This amount reflects cumulative unrealized appreciation/(depreciation) of exchange-traded derivatives as reported in the portfolio of investments. Exchange-traded swaps with upfront premiums are presented here as market value. |
| (c) | There were no transfers between Level 1 and Level 2 during the reporting period. |
| abfunds.com | AB BOND INFLATION STRATEGY | 57 |
NOTES TO FINANCIAL STATEMENTS (continued)
The Fund recognizes all transfers between levels of the fair value hierarchy assuming the financial instruments were transferred at the beginning of the reporting period.
The following is a reconciliation of investments in which significant unobservable inputs (Level 3) were used in determining fair value.
| Commercial Mortgage-Backed Securities | Asset-Backed Securities | Collateralized Mortgage Obligations | ||||||||||
Balance as of 10/31/16 | $ | 9,448,399 | $ | 2,749,542 | $ | 758,543 | ||||||
Accrued discounts/(premiums) | 1,678 | 39 | – 0 | – | ||||||||
Realized gain (loss) | (269,145 | ) | 13,270 | 11,891 | ||||||||
Change in unrealized appreciation/depreciation | 240,533 | (9,272 | ) | (393 | ) | |||||||
Purchases/Payups | 493,531 | 5,347,068 | – 0 | – | ||||||||
Sales/Paydowns | (5,307,841 | ) | (1,863,464 | ) | (495,298 | ) | ||||||
Transfers in to Level 3 | – 0 | – | – 0 | – | – 0 | – | ||||||
Transfers out of Level 3 | – 0 | – | – 0 | – | (274,743 | ) | ||||||
|
|
|
|
|
| |||||||
Balance as of 10/31/17 | $ | 4,607,155 | $ | 6,237,183 | $ | – 0 | – | |||||
|
|
|
|
|
| |||||||
Net change in unrealized appreciation/depreciation from investments held as of 10/31/17(a) | $ | (89,254 | ) | $ | (2,657 | ) | $ | – 0 | – | |||
|
|
|
|
|
| |||||||
| Common Stocks | Total | |||||||||||
Balance as of 10/31/16 | $ | 429,612 | $ | 13,386,096 | ||||||||
Accrued discounts/(premiums) | – 0 | – | 1,717 | |||||||||
Realized gain (loss) | – 0 | – | (243,984 | ) | ||||||||
Change in unrealized appreciation/depreciation | (3,505 | ) | 227,363 | |||||||||
Purchases/Payups | – 0 | – | 5,840,599 | |||||||||
Sales/Paydowns | (155,000 | ) | (7,821,603 | ) | ||||||||
Transfers in to Level 3 | – 0 | – | – 0 | – | ||||||||
Transfers out of Level 3 | – 0 | – | (274,743 | )(b) | ||||||||
|
|
|
| |||||||||
Balance as of 10/31/17 | $ | 271,107 | $ | 11,115,445 | ||||||||
|
|
|
| |||||||||
Net change in unrealized appreciation/depreciation from investments held as of 10/31/17(a) | $ | (3,505 | ) | $ | 83,092 | |||||||
|
|
|
| |||||||||
| (a) | The unrealized appreciation/depreciation is included in net change in unrealized appreciation/depreciation on investments and other financial instruments in the accompanying statement of operations. |
| (b) | There were de minimis transfers from Level 3 to Level 2 during the reporting period. |
The following presents information about significant unobservable inputs related to the Fund’s Level 3 investments at October 31, 2017. Securities priced by (i) by third party vendors or (ii) by brokers are excluded from the following table.
Quantitative Information about Level 3 Fair Value Measurements
| Fair Value at 10/31/17 | Valuation Technique | Unobservable Input | Input | |||||||
Common Stock | $ | 271,107 | Market Approach | NAV Equivalent | $1,019.50 / NA | |||||
| 58 | AB BOND INFLATION STRATEGY | abfunds.com |
NOTES TO FINANCIAL STATEMENTS (continued)
The Adviser established the Committee to oversee the pricing and valuation of all securities held in the Strategy. The Committee operates under pricing and valuation policies and procedures established by the Adviser and approved by the Board, including pricing policies which set forth the mechanisms and processes to be employed on a daily basis to implement these policies and procedures. In particular, the pricing policies describe how to determine market quotations for securities and other instruments. The Committee’s responsibilities include: 1) fair value and liquidity determinations (and oversight of any third parties to whom any responsibility for fair value and liquidity determinations is delegated), and 2) regular monitoring of the Adviser’s pricing and valuation policies and procedures and modification or enhancement of these policies and procedures (or recommendation of the modification of these policies and procedures) as the Committee believes appropriate.
The Committee is also responsible for monitoring the implementation of the pricing policies by the Adviser’s Pricing Group (the “Pricing Group”) and any third party which performs certain pricing functions in accordance with the pricing policies. The Pricing Group is responsible for the oversight of the third party on a day-to-day basis. The Committee and the Pricing Group perform a series of activities to provide reasonable assurance of the accuracy of prices including: 1) periodic vendor due diligence meetings, review of methodologies, new developments and processes at vendors, 2) daily comparison of security valuation versus prior day for all securities that exceeded established thresholds, and 3) daily review of unpriced, stale, and variance reports with exceptions reviewed by senior management and the Committee.
In addition, several processes outside of the pricing process are used to monitor valuation issues including: 1) performance and performance attribution reports are monitored for anomalous impacts based upon benchmark performance, and 2) portfolio managers review all portfolios for performance and analytics (which are generated using the Adviser’s prices).
3. Currency Translation
Assets and liabilities denominated in foreign currencies and commitments under forward currency exchange contracts are translated into U.S. dollars at the mean of the quoted bid and ask prices of such currencies against the U.S. dollar. Purchases and sales of portfolio securities are translated into U.S. dollars at the rates of exchange prevailing when such securities were acquired or sold. Income and expenses are translated into U.S. dollars at rates of exchange prevailing when accrued.
Net realized gain or loss on foreign currency transactions represents foreign exchange gains and losses from sales and maturities of foreign fixed
| abfunds.com | AB BOND INFLATION STRATEGY | 59 |
NOTES TO FINANCIAL STATEMENTS (continued)
income investments, holding of foreign currencies, currency gains or losses realized between the trade and settlement dates on foreign investment transactions, and the difference between the amounts of dividends, interest and foreign withholding taxes recorded on the Strategy’s books and the U.S. dollar equivalent amounts actually received or paid. Net unrealized currency gains and losses from valuing foreign currency denominated assets and liabilities at period end exchange rates are reflected as a component of net unrealized appreciation or depreciation of foreign currency denominated assets and liabilities.
4. Taxes
It is the Strategy’s policy to meet the requirements of the Internal Revenue Code applicable to regulated investment companies and to distribute all of its investment company taxable income and net realized gains, if any, to shareholders. Therefore, no provisions for federal income or excise taxes are required. The Strategy may be subject to taxes imposed by countries in which it invests. Such taxes are generally based on income and/or capital gains earned or repatriated. Taxes are accrued and applied to net investment income, net realized gains and net unrealized appreciation/depreciation as such income and/or gains are earned.
In accordance with U.S. GAAP requirements regarding accounting for uncertainties in income taxes, management has analyzed the Strategy’s tax positions taken or expected to be taken on federal and state income tax returns for all open tax years (the current and the prior three tax years) and has concluded that no provision for income tax is required in the Strategy’s financial statements.
5. Investment Income and Investment Transactions
Dividend income is recorded on the ex-dividend date or as soon as the Strategy is informed of the dividend. Interest income is accrued daily. Investment transactions are accounted for on the date the securities are purchased or sold. Investment gains or losses are determined on the identified cost basis. The Strategy amortizes premiums and accretes discounts as adjustments to interest income.
6. Class Allocations
All income earned and expenses incurred by the Strategy are borne on a pro-rata basis by each outstanding class of shares, based on the proportionate interest in the Strategy represented by the net assets of such class, except for class specific expenses which are allocated to the respective class. Expenses of the Company are charged proportionately to each portfolio or based on other appropriate methods. Realized and unrealized gains and losses are allocated among the various share classes based on respective net assets.
| 60 | AB BOND INFLATION STRATEGY | abfunds.com |
NOTES TO FINANCIAL STATEMENTS (continued)
7. Dividends and Distributions
Dividends and distributions to shareholders, if any, are recorded on the ex-dividend date. Income dividends and capital gains distributions are determined in accordance with federal tax regulations and may differ from those determined in accordance with U.S. GAAP. To the extent these differences are permanent, such amounts are reclassified within the capital accounts based on their federal tax basis treatment; temporary differences do not require such reclassification.
NOTE B
Advisory Fee and Other Transactions with Affiliates
Under the terms of the investment advisory agreement, the Strategy pays the Adviser an advisory fee at an annual rate of .50% of the first $2.5 billion, .45% of the next $2.5 billion and .40% in excess of $5 billion, of the Strategy’s average daily net assets. The Adviser has agreed to waive its fees and bear certain expenses to the extent necessary to limit total operating expenses excluding interest expense on an annual basis (“Expense Caps”) to .75%, 1.50%, .50%, 1.00%, .75%, .50%, .60%, .50% and .50% of the daily average net assets for the Class A, Class C, Advisor Class, Class R, Class K, Class I, Class 1, Class 2, and Class Z shares, respectively. Effective January 29, 2016, the Expense Cap for the Class A shares was reduced from .80% to .75% of the daily average net assets. This fee waiver and/or expense reimbursement agreement will remain in effect until January 31, 2018 and then may be extended for additional one-year terms. For the year ended October 31, 2017, such reimbursement amounted to $935,249.
Pursuant to the investment advisory agreement, the Strategy may reimburse the Adviser for certain legal and accounting services provided to the Strategy by the Adviser. For the year ended October 31, 2017, the reimbursement for such services amounted to $64,905.
During the year ended October 31, 2017, the Adviser reimbursed the Strategy $957 for trading losses incurred due to a trade entry error.
The Strategy compensates AllianceBernstein Investor Services, Inc. (“ABIS”), a wholly-owned subsidiary of the Adviser, under a Transfer Agency Agreement for providing personnel and facilities to perform transfer agency services for the Strategy. ABIS may make payments to intermediaries that provide omnibus account services, sub-accounting services and/or networking services. Such compensation retained by ABIS amounted to $133,385 for the year ended October 31, 2017.
AllianceBernstein Investments, Inc. (the “Distributor”), a wholly-owned subsidiary of the Adviser, serves as the distributor of the Strategy’s shares. The Distributor has advised the Strategy that it has retained front-end sales charges of $4,265 from the sale of Class A shares and received $2,019
| abfunds.com | AB BOND INFLATION STRATEGY | 61 |
NOTES TO FINANCIAL STATEMENTS (continued)
and $2,260 in contingent deferred sales charges imposed upon redemptions by shareholders of Class A and Class C shares, respectively, for the year ended October 31, 2017.
The Strategy may invest in AB Government Money Market Portfolio (the “Government Money Market Portfolio”) which has a contractual annual advisory fee rate of .20% of the portfolio’s average daily net assets and bears its own expenses. In connection with the investment by the Strategy in the Government Money Market Portfolio, the Adviser has contractually agreed to waive its advisory fee from the Strategy in an amount equal to the Strategy’s pro rata share of the effective advisory fees of Government Money Market Portfolio, as borne indirectly by the Strategy as an acquired fund fee and expense.
For the year ended October 31, 2017, such waiver amounted to $11,190.
A summary of the Strategy’s transactions in AB mutual funds for the year ended October 31, 2017 is as follows:
Strategy | Market Value 10/31/16 (000) | Purchases at Cost (000) | Sales Proceeds (000) | Market Value 10/31/17 (000) | Dividend Income (000) | |||||||||||||||
| Government Money Market Portfolio | $ | – 0 – | $ | 253,897 | $ | 253,897 | $ | – 0 – | $ | 33 | ||||||||||
Brokerage commissions paid on investment transactions for the year ended October 31, 2017 amounted to $9,700, of which $0 and $0, respectively, was paid to Sanford C. Bernstein & Co. LLC and Sanford C. Bernstein Limited, affiliates of the Adviser.
NOTE C
Distribution Services Agreement
The Strategy has adopted a Distribution Services Agreement (the “Agreement”) pursuant to Rule 12b-1 under the Investment Company Act of 1940. Under the Agreement, the Strategy pays distribution and servicing fees to the Distributor at an annual rate of up to .30% of the Strategy’s average daily net assets attributable to Class A shares, 1% of the Strategy’s average daily net assets attributable to Class C shares, .50% of the Strategy’s average daily net assets attributable to Class R shares, .25% of the Strategy’s average daily net assets attributable to Class K shares and .10% of the Strategy’s average daily net assets attributable to Class 1 shares. There are no distribution and servicing fees on the Advisor Class, Class I, Class 2 and Class Z shares. Effective January 29, 2016, payments under the Agreement in respect of Class A shares are limited to an annual rate of .25%
| 62 | AB BOND INFLATION STRATEGY | abfunds.com |
NOTES TO FINANCIAL STATEMENTS (continued)
of Class A shares’ average daily net assets. The fees are accrued daily and paid monthly. The Agreement provides that the Distributor will use such payments in their entirety for distribution assistance and promotional activities. Since the commencement of the Strategy’s operations, the Distributor has incurred expenses in excess of the distribution costs reimbursed by the Strategy in the amounts of $248,423, $18,721, $18,270 and $1,480,807 for Class C, Class R, Class K and Class 1 shares, respectively. While such costs may be recovered from the Strategy in future periods so long as the Agreement is in effect, the rate of the distribution and servicing fees payable under the Agreement may not be increased without a shareholder vote. In accordance with the Agreement, there is no provision for recovery of unreimbursed distribution costs incurred by the Distributor beyond the current fiscal year for Class A shares. The Agreement also provides that the Adviser may use its own resources to finance the distribution of the Strategy’s shares.
NOTE D
Investment Transactions
Purchases and sales of investment securities (excluding short-term investments) for the year ended October 31, 2017 were as follows:
| Purchases | Sales | |||||||
Investment securities (excluding U.S. government securities) | $ | 90,340,602 | $ | 78,717,311 | ||||
U.S. government securities | 291,688,851 | 147,810,294 | ||||||
The cost of investments for federal income tax purposes, gross unrealized appreciation and unrealized depreciation are as follows:
Cost | $ | 606,717,117 | ||
|
| |||
Gross unrealized appreciation | $ | 8,516,353 | ||
Gross unrealized depreciation | (5,850,621 | ) | ||
|
| |||
Net unrealized appreciation | $ | 2,665,732 | ||
|
|
1. Derivative Financial Instruments
The Strategy may use derivatives in an effort to earn income and enhance returns, to replace more traditional direct investments, to obtain exposure to otherwise inaccessible markets (collectively, “investment purposes”), or to hedge or adjust the risk profile of its portfolio.
The principal types of derivatives utilized by the Strategy, as well as the methods in which they may be used are:
| • | Futures |
The Strategy may buy or sell futures for investment purposes or for the purpose of hedging its portfolio against adverse effects of potential movements in the market. The Strategy bears the market
| abfunds.com | AB BOND INFLATION STRATEGY | 63 |
NOTES TO FINANCIAL STATEMENTS (continued)
risk that arises from changes in the value of these instruments and the imperfect correlation between movements in the price of the futures and movements in the price of the assets, reference rates or indices which they are designed to track. Among other things, the Strategy may purchase or sell futures for foreign currencies or options thereon for non-hedging purposes as a means of making direct investment in foreign currencies, as described below under “Currency Transactions”.
At the time the Strategy enters into futures, the Strategy deposits and maintains as collateral an initial margin with the broker, as required by the exchange on which the transaction is effected. Such amount is shown as cash collateral due from broker on the statement of assets and liabilities. Pursuant to the contract, the Strategy agrees to receive from or pay to the broker an amount of cash equal to the daily fluctuation in the value of the contract. Such receipts or payments are known as variation margin and are recorded by the Strategy as unrealized gains or losses. Risks may arise from the potential inability of a counterparty to meet the terms of the contract. The credit/counterparty risk for exchange-traded futures is generally less than privately negotiated futures, since the clearinghouse, which is the issuer or counterparty to each exchange-traded future, has robust risk mitigation standards, including the requirement to provide initial and variation margin. When the contract is closed, the Strategy records a realized gain or loss equal to the difference between the value of the contract at the time it was opened and the time it was closed.
Use of long futures subjects the Strategy to risk of loss in excess of the amounts shown on the statement of assets and liabilities, up to the notional value of the futures. Use of short futures subjects the Strategy to unlimited risk of loss. Under some circumstances, futures exchanges may establish daily limits on the amount that the price of futures can vary from the previous day’s settlement price, which could effectively prevent liquidation of unfavorable positions.
During the year ended October 31, 2017, the Strategy held futures for hedging and non-hedging purposes.
| • | Forward Currency Exchange Contracts |
The Strategy may enter into forward currency exchange contracts in order to hedge its exposure to changes in foreign currency exchange rates on its foreign portfolio holdings, to hedge certain firm purchase and sale commitments denominated in foreign currencies and for non-hedging purposes as a means of making direct investments in foreign currencies, as described below under “Currency Transactions”.
| 64 | AB BOND INFLATION STRATEGY | abfunds.com |
NOTES TO FINANCIAL STATEMENTS (continued)
A forward currency exchange contract is a commitment to purchase or sell a foreign currency at a future date at a negotiated forward rate. The gain or loss arising from the difference between the original contract and the closing of such contract would be included in net realized gain or loss on forward currency exchange contracts. Fluctuations in the value of open forward currency exchange contracts are recorded for financial reporting purposes as unrealized appreciation and/or depreciation by the Strategy. Risks may arise from the potential inability of a counterparty to meet the terms of a contract and from unanticipated movements in the value of a foreign currency relative to the U.S. dollar.
During the year ended October 31, 2017, the Strategy held forward currency exchange contracts for hedging and non-hedging purposes.
| • | Option Transactions |
For hedging and investment purposes, the Strategy may purchase and write (sell) put and call options on U.S. and foreign securities, including government securities, and foreign currencies that are traded on U.S. and foreign securities exchanges and over-the-counter markets. Among other things, the Strategy may use options transactions for non-hedging purposes as a means of making direct investments in foreign currencies, as described below under “Currency Transactions” and may use options strategies involving the purchase and/or writing of various combinations of call and/or put options, for hedging and investment purposes.
The risk associated with purchasing an option is that the Strategy pays a premium whether or not the option is exercised. Additionally, the Strategy bears the risk of loss of the premium and change in market value should the counterparty not perform under the contract. If a put or call option purchased by the Strategy were permitted to expire without being sold or exercised, its premium would represent a loss to the Strategy. Put and call options purchased are accounted for in the same manner as portfolio securities. The cost of securities acquired through the exercise of call options is increased by premiums paid. The proceeds from securities sold through the exercise of put options are decreased by the premiums paid.
When the Strategy writes an option, the premium received by the Strategy is recorded as a liability and is subsequently adjusted to the current market value of the option written. Premiums received from written options which expire unexercised are recorded by the Strategy on the expiration date as realized gains from options written. The difference between the premium received and the amount paid on effecting a closing purchase transaction, including brokerage commissions, is also treated as a realized gain, or if the premium
| abfunds.com | AB BOND INFLATION STRATEGY | 65 |
NOTES TO FINANCIAL STATEMENTS (continued)
received is less than the amount paid for the closing purchase transaction, as a realized loss. If a call option is exercised, the premium received is added to the proceeds from the sale of the underlying security or currency in determining whether the Strategy has realized a gain or loss. If a put option is exercised, the premium received reduces the cost basis of the security or currency purchased by the Strategy. In writing an option, the Strategy bears the market risk of an unfavorable change in the price of the security or currency underlying the written option. Exercise of an option written by the Strategy could result in the Strategy selling or buying a security or currency at a price different from the current market value.
The Strategy may also invest in options on swap agreements, also called “swaptions”. A swaption is an option that gives the buyer the right, but not the obligation, to enter into a swap on a future date in exchange for paying a market-based “premium”. A receiver swaption gives the owner the right to receive the total return of a specified asset, reference rate, or index. A payer swaption gives the owner the right to pay the total return on a specified asset, reference rate, or index. Swaptions also include options that allow an existing swap to be terminated or extended by one of the counterparties.
During the year ended October 31, 2017, the Strategy held purchased swaptions for hedging purposes.
During the year ended October 31, 2017, the Strategy held written swaptions for hedging purposes.
| • | Swaps |
The Strategy may enter into swaps to hedge its exposure to interest rates, credit risk or currencies. The Strategy may also enter into swaps for non-hedging purposes as a means of gaining market exposures, making direct investments in foreign currencies, as described below under “Currency Transactions.” A swap is an agreement that obligates two parties to exchange a series of cash flows at specified intervals based upon or calculated by reference to changes in specified prices or rates for a specified amount of an underlying asset. The payment flows are usually netted against each other, with the difference being paid by one party to the other. In addition, collateral may be pledged or received by the Strategy in accordance with the terms of the respective swaps to provide value and recourse to the Strategy or its counterparties in the event of default, bankruptcy or insolvency by one of the parties to the swap.
Risks may arise as a result of the failure of the counterparty to the swap to comply with the terms of the swap. The loss incurred by the failure of a counterparty is generally limited to the net interim payment
| 66 | AB BOND INFLATION STRATEGY | abfunds.com |
NOTES TO FINANCIAL STATEMENTS (continued)
to be received by the Strategy, and/or the termination value at the end of the contract. Therefore, the Strategy considers the creditworthiness of each counterparty to a swap in evaluating potential counterparty risk. This risk is mitigated by having a netting arrangement between the Strategy and the counterparty and by the posting of collateral by the counterparty to the Strategy to cover the Strategy’s exposure to the counterparty. Additionally, risks may arise from unanticipated movements in interest rates or in the value of the underlying securities. The Strategy accrues for the interim payments on swaps on a daily basis, with the net amount recorded within unrealized appreciation/depreciation of swaps on the statement of assets and liabilities, where applicable. Once the interim payments are settled in cash, the net amount is recorded as realized gain/(loss) on swaps on the statement of operations, in addition to any realized gain/(loss) recorded upon the termination of swaps. Upfront premiums paid or received are recognized as cost or proceeds on the statement of assets and liabilities and are amortized on a straight line basis over the life of the contract. Amortized upfront premiums are included in net realized gain/(loss) from swaps on the statement of operations. Fluctuations in the value of swaps are recorded as a component of net change in unrealized appreciation/depreciation of swaps on the statement of operations.
Certain standardized swaps, including certain interest rate swaps and credit default swaps, are (or soon will be) subject to mandatory central clearing. Cleared swaps are transacted through futures commission merchants (“FCMs”) that are members of central clearinghouses, with the clearinghouse serving as central counterparty, similar to transactions in futures contracts. Centralized clearing will be required for additional categories of swaps on a phased-in basis based on requirements published by the Securities and Exchange Commission and Commodity Futures Trading Commission.
At the time the Strategy enters into a centrally cleared swap, the Strategy deposits and maintains as collateral an initial margin with the broker, as required by the clearinghouse on which the transaction is effected. Such amount is shown as cash collateral due from broker on the statement of assets and liabilities. Pursuant to the contract, the Strategy agrees to receive from or pay to the broker an amount of cash equal to the daily fluctuation in the value of the contract. Such receipts or payments are known as variation margin and are recorded by the Strategy as unrealized gains or losses. Risks may arise from the potential inability of a counterparty to meet the terms of the contract. The credit/counterparty risk for centrally cleared swaps is generally less than non-centrally cleared swaps, since the clearinghouse, which is the
| abfunds.com | AB BOND INFLATION STRATEGY | 67 |
NOTES TO FINANCIAL STATEMENTS (continued)
issuer or counterparty to each centrally cleared swap, has robust risk mitigation standards, including the requirement to provide initial and variation margin. When the contract is closed, the Strategy records a realized gain or loss equal to the difference between the value of the contract at the time it was opened and the time it was closed.
Interest Rate Swaps:
The Strategy is subject to interest rate risk exposure in the normal course of pursuing its investment objectives. Because the Strategy holds fixed rate bonds, the value of these bonds may decrease if interest rates rise. To help hedge against this risk and to maintain its ability to generate income at prevailing market rates, the Strategy may enter into interest rate swaps. Interest rate swaps are agreements between two parties to exchange cash flows based on a notional amount. The Strategy may elect to pay a fixed rate and receive a floating rate, or, receive a fixed rate and pay a floating rate on a notional amount.
In addition, the Strategy may also enter into interest rate swap transactions to preserve a return or spread on a particular investment or portion of its portfolio, or protecting against an increase in the price of securities the Strategy anticipates purchasing at a later date. Interest rate swaps involve the exchange by a Strategy with another party of their respective commitments to pay or receive interest (e.g., an exchange of floating rate payments for fixed rate payments) computed based on a contractually-based principal (or “notional”) amount. Interest rate swaps are entered into on a net basis (i.e., the two payment streams are netted out, with the Strategy receiving or paying, as the case may be, only the net amount of the two payments).
During the year ended October 31, 2017, the Strategy held interest rate swaps for hedging and non-hedging purposes.
Inflation (CPI) Swaps:
Inflation swap agreements are contracts in which one party agrees to pay the cumulative percentage increase in a price index (the Consumer Price Index with respect to CPI swaps) over the term of the swap (with some lag on the inflation index), and the other pays a compounded fixed rate. Inflation swaps may be used to protect the net asset value (“NAV”) of a Strategy against an unexpected change in the rate of inflation measured by an inflation index since the value of these agreements is expected to increase if there are unexpected inflation increases.
During the year ended October 31, 2017, the Strategy held inflation (CPI) swaps for hedging and non-hedging purposes.
| 68 | AB BOND INFLATION STRATEGY | abfunds.com |
NOTES TO FINANCIAL STATEMENTS (continued)
Credit Default Swaps:
The Strategy may enter into credit default swaps, including to manage its exposure to the market or certain sectors of the market, to reduce its risk exposure to defaults by corporate and sovereign issuers held by the Strategy, or to create exposure to corporate or sovereign issuers to which it is not otherwise exposed. The Strategy may purchase credit protection (“Buy Contract”) or provide credit protection (“Sale Contract”) on the referenced obligation of the credit default swap. During the term of the swap, the Strategy receives/(pays) fixed payments from/(to) the respective counterparty, calculated at the agreed upon rate applied to the notional amount. If the Strategy is a buyer/(seller) of protection and a credit event occurs, as defined under the terms of the swap, the Strategy will either (i) receive from the seller/(pay to the buyer) of protection an amount equal to the notional amount of the swap (the “Maximum Payout Amount”) and deliver/(take delivery of) the referenced obligation or (ii) receive/(pay) a net settlement amount in the form of cash or securities equal to the notional amount of the swap less the recovery value of the referenced obligation.
In certain circumstances Maximum Payout Amounts may be partially offset by recovery values of the respective referenced obligations, upfront premium received upon entering into the agreement, or net amounts received from settlement of buy protection credit default swaps entered into by the Strategy for the same referenced obligations with the same counterparty. As of October 31, 2017, the Strategy did not have Buy Contracts outstanding with respect to the same referenced obligations and same counterparty for its Sale Contracts outstanding.
Credit default swaps may involve greater risks than if a Strategy had invested in the referenced obligation directly. Credit default swaps are subject to general market risk, liquidity risk, counterparty risk and credit risk. If the Strategy is a buyer of protection and no credit event occurs, it will lose the payments it made to its counterparty. If the Strategy is a seller of protection and a credit event occurs, the value of the referenced obligation received by the Strategy coupled with the periodic payments previously received, may be less than the Maximum Payout Amount it pays to the buyer, resulting in a net loss to the Strategy.
Implied credit spreads over U.S. Treasuries of comparable maturity utilized in determining the market value of credit default swaps on issuers as of period end are disclosed in the portfolio of investments. The implied spreads serve as an indicator of the current status of the
| abfunds.com | AB BOND INFLATION STRATEGY | 69 |
NOTES TO FINANCIAL STATEMENTS (continued)
payment/performance risk and typically reflect the likelihood of default by the issuer of the referenced obligation. The implied credit spread of a particular reference obligation also reflects the cost of buying/selling protection and may reflect upfront payments required to be made to enter into the agreement. Widening credit spreads typically represent a deterioration of the referenced obligation’s credit soundness and greater likelihood of default or other credit event occurring as defined under the terms of the agreement. A credit spread identified as “Defaulted” indicates a credit event has occurred for the referenced obligation.
During the year ended October 31, 2017, the Strategy held credit default swaps for hedging and non-hedging purposes.
The Strategy typically enters into International Swaps and Derivatives Association, Inc. Master Agreements (“ISDA Master Agreement”) with its OTC derivative contract counterparties in order to, among other things, reduce its credit risk to OTC counterparties. ISDA Master Agreements include provisions for general obligations, representations, collateral and events of default or termination. Under an ISDA Master Agreement, the Strategy typically may offset with the OTC counterparty certain derivative financial instruments’ payables and/or receivables with collateral held and/or posted and create one single net payment (close-out netting) in the event of default or termination. In the event of a default by an OTC counterparty, the return of collateral with market value in excess of the Strategy’s net liability, held by the defaulting party, may be delayed or denied.
The Strategy’s ISDA Master Agreements may contain provisions for early termination of OTC derivative transactions in the event the net assets of the Strategy decline below specific levels (“net asset contingent features”). If these levels are triggered, the Strategy’s OTC counterparty has the right to terminate such transaction and require the Strategy to pay or receive a settlement amount in connection with the terminated transaction. For additional details, please refer to netting arrangements by the OTC counterparty tables below.
| 70 | AB BOND INFLATION STRATEGY | abfunds.com |
NOTES TO FINANCIAL STATEMENTS (continued)
During the year ended October 31, 2017, the Strategy had entered into the following derivatives:
Asset Derivatives | Liability Derivatives | |||||||||||
Derivative | Statement of | Fair Value | Statement of | Fair Value | ||||||||
Interest rate contracts | Receivable/Payable for variation margin on futures | $ | 749,364 | * | Receivable/Payable for variation margin on futures | $ | 295,601 | * | ||||
Credit contracts | Receivable/Payable for variation margin on exchange traded swaps | | 31,525 | * | ||||||||
Interest rate contracts | Receivable/Payable for variation margin on exchange traded swaps | | 664,852 | * | Receivable/Payable for variation margin on exchange traded swaps | | 1,030,695 | * | ||||
Foreign exchange contracts | Unrealized appreciation on forward currency exchange contracts | | 370,926 | Unrealized depreciation on forward currency exchange contracts | | 412,906 | ||||||
Interest rate contracts | Unrealized depreciation on interest rate swaps | | 26,649 | |||||||||
Interest rate contracts | Unrealized appreciation on inflation swaps | | 573,115 | Unrealized depreciation on inflation swaps | | 30,555 | ||||||
Credit contracts | Unrealized depreciation on credit default swaps | | 782,130 | |||||||||
|
|
|
| |||||||||
Total | $ | 2,389,782 | $ | 2,578,536 | ||||||||
|
|
|
| |||||||||
| * | Only variation margin receivable/payable at period end is reported within the statement of assets and liabilities. This amount reflects cumulative appreciation/(depreciation) of exchange-traded derivatives as reported in the portfolio of investments. |
| abfunds.com | AB BOND INFLATION STRATEGY | 71 |
NOTES TO FINANCIAL STATEMENTS (continued)
Derivative Type | Location of Gain | Realized Gain or (Loss) on Derivatives | Change in Unrealized Appreciation or (Depreciation) | |||||||
Interest rate contracts | Net realized gain (loss) on futures; Net change in unrealized appreciation/depreciation of futures | $ | (891,211 | ) | $ | 475,573 | ||||
Foreign exchange contracts | Net realized gain (loss) on forward currency exchange contracts; Net change in unrealized appreciation/depreciation of forward currency exchange contracts | | (121,038 | ) | | (144,515 | ) | |||
Interest rate contracts | Net realized gain (loss) on investment transactions; Net change in unrealized appreciation/depreciation of investments | | (152,827 | ) | | 16,462 | ||||
Interest rate contracts | Net realized gain (loss) on swaptions written; Net change in unrealized appreciation/depreciation of swaptions written |
| 48,025 |
|
| (3,987 | ) | |||
Interest rate contracts | Net realized gain (loss) on swaps; Net change in unrealized appreciation/depreciation of swaps |
| (18,015 | ) |
| 1,862,277 |
| |||
Credit contracts | Net realized gain (loss) on swaps; Net change in unrealized appreciation/depreciation of swaps | (98,665 | ) | (505,665 | ) | |||||
|
|
|
| |||||||
Total | $ | (1,233,731 | ) | $ | 1,700,145 | |||||
|
|
|
| |||||||
| 72 | AB BOND INFLATION STRATEGY | abfunds.com |
NOTES TO FINANCIAL STATEMENTS (continued)
The following table represents the average monthly volume of the Strategy’s derivative transactions during the year ended October 31, 2017:
Futures: | ||||
Average original value of buy contracts | $ | 20,734,856 | (a) | |
Average original value of sale contracts | $ | 79,063,532 | ||
Forward Currency Exchange Contracts: | ||||
Average principal amount of buy contracts | $ | 16,776,100 | ||
Average principal amount of sale contracts | $ | 48,471,427 | ||
Purchased Options: | ||||
Average monthly cost | $ | 46,154 | (b) | |
Swaptions Written: | ||||
Average notional amount | $ | 17,763,333 | (c) | |
Interest Rate Swaps: | ||||
Average notional amount | $ | 685,385 | ||
Inflation Swaps: | ||||
Average notional amount | $ | 43,451,538 | ||
Centrally Cleared Interest Rate Swaps: | ||||
Average notional amount | $ | 140,102,684 | ||
Credit Default Swaps: | ||||
Average notional amount of buy contracts | $ | 4,350,308 | ||
Average notional amount of sale contracts | $ | 9,504,000 | ||
Centrally Cleared Credit Default Swaps: | ||||
Average notional amount of buy contracts | $ | 16,784,400 | (d) | |
Average notional amount of sale contracts | $ | 2,500,000 | (e) |
| (a) | Positions were open for nine months during the year. |
| (b) | Positions were open for four months during the year. |
| (c) | Positions were open for two months during the year. |
| (d) | Positions were open for three months during the year. |
| (e) | Positions were open for six months during the year. |
For financial reporting purposes, the Strategy does not offset derivative assets and derivative liabilities that are subject to netting arrangements in the statement of assets and liabilities.
All OTC derivatives held at period end were subject to netting arrangements. The following table presents the Strategy’s derivative assets and liabilities by OTC counterparty net of amounts available for offset under ISDA Master Agreements and net of the related collateral received/pledged by the Strategy as of October 31, 2017. Exchange-traded derivatives are not subject to netting arrangements and as such are excluded from the table.
| abfunds.com | AB BOND INFLATION STRATEGY | 73 |
NOTES TO FINANCIAL STATEMENTS (continued)
Counterparty | Derivative Assets Subject to a MA | Derivative Available for Offset | Cash Collateral Received* | Security Collateral Received* | Net Amount of Derivatives Assets | |||||||||||||||
OTC Derivatives: |
| |||||||||||||||||||
Bank of America, NA | $ | 227,784 | $ | – 0 | – | $ | – 0 | – | $ | – 0 | – | $ | 227,784 | |||||||
Barclays Bank PLC | 347,362 | (25,398 | ) | – 0 | – | (321,964 | ) | – 0 | – | |||||||||||
BNP Paribas SA | 52,403 | – 0 | – | – 0 | – | – 0 | – | 52,403 | ||||||||||||
Citibank, NA | 125,741 | (125,741 | ) | – 0 | – | – 0 | – | – 0 | – | |||||||||||
Deutsche Bank AG | 1,371 | (1,371 | ) | – 0 | – | – 0 | – | – 0 | – | |||||||||||
JPMorgan Chase Bank, NA | 30,812 | (12,545 | ) | – 0 | – | – 0 | – | 18,267 | ||||||||||||
Royal Bank of Scotland PLC | 109,567 | (109,567 | ) | – 0 | – | – 0 | – | – 0 | – | |||||||||||
Standard Chartered Bank | 37,746 | – 0 | – | – 0 | – | – 0 | – | 37,746 | ||||||||||||
State Street Bank & Trust Co. | 11,255 | (11,255 | ) | – 0 | – | – 0 | – | – 0 | – | |||||||||||
|
|
|
|
|
|
|
|
|
| |||||||||||
Total | $ | 944,041 | $ | (285,877 | ) | $ | – 0 | – | $ | (321,964 | ) | $ | 336,200 | ^ | ||||||
|
|
|
|
|
|
|
|
|
| |||||||||||
Counterparty | Derivative Liabilities Subject to a MA | Derivative Available for Offset | Cash Collateral Pledged* | Security Collateral Pledged* | Net Amount of Derivatives Liabilities | |||||||||||||||
OTC Derivatives: |
| |||||||||||||||||||
Barclays Bank PLC | $ | 25,398 | $ | (25,398 | ) | $ | – 0 | – | $ | – 0 | – | $ | – 0 | – | ||||||
Citibank, NA | 194,532 | (125,741 | ) | – 0 | – | – 0 | – | 68,791 | ||||||||||||
Citigroup Global Markets, Inc. | 288,123 | – 0 | – | – 0 | – | (283,120 | ) | 5003 | ||||||||||||
Credit Suisse International | 297,345 | – 0 | – | – 0 | – | (223,912 | ) | 73,433 | ||||||||||||
Deutsche Bank AG | 585,135 | (1,371 | ) | – 0 | – | (528,032 | ) | 55,732 | ||||||||||||
Goldman Sachs Bank USA/Goldman Sachs International | 579,216 | – 0 | – | – 0 | – | (312,568 | ) | 266,648 | ||||||||||||
JPMorgan Chase Bank, NA | 12,545 | (12,545 | ) | – 0 | – | – 0 | – | – 0 | – | |||||||||||
Morgan Stanley Capital Services LLC/Morgan Stanley Capital Services, Inc. | 89,990 | – 0 | – | (88,000 | ) | – 0 | – | 1,990 | ||||||||||||
Royal Bank of Scotland PLC | 145,206 | (109,567 | ) | – 0 | – | – 0 | – | 35,639 | ||||||||||||
| 74 | AB BOND INFLATION STRATEGY | abfunds.com |
NOTES TO FINANCIAL STATEMENTS (continued)
Counterparty | Derivative Liabilities Subject to a MA | Derivative Available for Offset | Cash Collateral Pledged* | Security Collateral Pledged* | Net Amount of Derivatives Liabilities | |||||||||||||||
State Street Bank & Trust Co. | $ | 68,371 | $ | (11,255 | ) | $ | – 0 | – | $ | – 0 | – | $ | 57,116 | |||||||
|
|
|
|
|
|
|
|
|
| |||||||||||
Total | $ | 2,285,861 | $ | (285,877 | ) | $ | (88,000 | ) | $ | (1,347,632 | ) | $ | 564,352 | ^ | ||||||
|
|
|
|
|
|
|
|
|
| |||||||||||
| * | The actual collateral received/pledged may be more than the amount reported due to over-collateralization. |
| ^ | Net amount represents the net receivable/payable that would be due from/to the counterparty in the event of default or termination. The net amount from OTC financial derivative instruments can only be netted across transactions governed under the same master agreement with the same counterparty. |
See Note D.4 for additional disclosure of netting arrangements regarding reverse repurchase agreements.
2. Currency Transactions
The Strategy may invest in non-U.S. Dollar-denominated securities on a currency hedged or unhedged basis. The Strategy may seek investment opportunities by taking long or short positions in currencies through the use of currency-related derivatives, including forward currency exchange contracts, futures and options on futures, swaps, and other options. The Strategy may enter into transactions for investment opportunities when it anticipates that a foreign currency will appreciate or depreciate in value but securities denominated in that currency are not held by the Strategy and do not present attractive investment opportunities. Such transactions may also be used when the Adviser believes that it may be more efficient than a direct investment in a foreign currency-denominated security. The Strategy may also conduct currency exchange contracts on a spot basis (i.e., for cash at the spot rate prevailing in the currency exchange market for buying or selling currencies).
3. TBA and Dollar Rolls
The Strategy may invest in TBA mortgage-backed securities. A TBA, or “To Be Announced”, trade represents a contract for the purchase or sale of mortgage-backed securities to be delivered at a future agree-upon date; however, the specific mortgage pool numbers or the number of pools that will be delivered to fulfill the trade obligation or terms of the contract are unknown at the time of the trade. Mortgage pools (including fixed-rate or variable-rate mortgages) guaranteed by the Government National Mortgage Association, or GNMA, the Federal National Mortgage Association, or FNMA, or the Federal Home Loan Mortgage Corporation, or FHLMC, are subsequently allocated to the TBA transactions.
| abfunds.com | AB BOND INFLATION STRATEGY | 75 |
NOTES TO FINANCIAL STATEMENTS (continued)
The Strategy may enter into dollar rolls. Dollar rolls involve sales by the Strategy of securities for delivery in the current month and the Strategy’s simultaneously contracting to repurchase substantially similar (same type and coupon) securities on a specified future date. During the roll period, the Strategy forgoes principal and interest paid on the securities. The Strategy is compensated by the difference between the current sales price and the lower forward price for the future purchase (often referred to as the “drop”) as well as by the interest earned on the cash proceeds of the initial sale. Dollar rolls involve the risk that the market value of the securities the Strategy is obligated to repurchase under the agreement may decline below the repurchase price. Dollar rolls are speculative techniques. During the year ended October 31, 2017, the Strategy had no transactions in dollar rolls.
4. Reverse Repurchase Agreements
The Strategy may enter into reverse repurchase transactions (“RVP”) in accordance with the terms of a Master Repurchase Agreement (“MRA”), under which the Strategy sells securities and agrees to repurchase them at a mutually agreed upon date and price. At the time the Strategy enters into a reverse repurchase agreement, it will establish a segregated account with the custodian containing liquid assets having a value comparable to the repurchase price. Under the MRA and other Master Agreements, the Strategy is permitted to offset payables and/or receivables with collateral held and/or posted to the counterparty and create one single net payment due to or from the Strategy in the event of a default. In the event of a default by a MRA counterparty, the Strategy may be considered an unsecured creditor with respect to any excess collateral (collateral with a market value in excess of the repurchase price) held by and/or posted to the counterparty, and as such the return of such excess collateral may be delayed or denied. For the year ended October 31, 2017, the average amount of reverse repurchase agreements outstanding was $130,901,870 and the daily weighted average interest rate was .88%. At October 31, 2017, the Strategy had reverse repurchase agreements outstanding in the amount of $121,629,170 as reported on the statement of assets and liabilities.
The following table presents the Strategy’s RVP liabilities by counterparty net of the related collateral pledged by the Strategy as of October 31, 2017:
Counterparty | RVP Liabilities Subject to a MRA | Securities Collateral Pledged†* | Net Amount of RVP Liabilities | |||||||||
HSBC Bank USA | $ | 75,227,167 | $ | (75,227,167 | ) | $ | – 0 | – | ||||
JPMorgan Chase Bank | 46,402,003 | (46,402,003 | ) | – 0 | – | |||||||
|
|
|
|
|
| |||||||
Total | $ | 121,629,170 | $ | (121,629,170 | ) | $ | – 0 | – | ||||
|
|
|
|
|
| |||||||
| † | Including accrued interest. |
| * | The actual collateral pledged may be more than the amount reported due to overcollateralization. |
| 76 | AB BOND INFLATION STRATEGY | abfunds.com |
NOTES TO FINANCIAL STATEMENTS (continued)
NOTE E
Capital Stock
Each class consists of 3,000,000,000 authorized shares. Transactions in capital shares for each class were as follows:
| Shares | Amount | |||||||||||||||||||||||
| Year Ended October 31, 2017 | Year Ended October 31, 2016 | Year Ended October 31, 2017 | Year Ended 2016 | |||||||||||||||||||||
|
| |||||||||||||||||||||||
| Class A | ||||||||||||||||||||||||
Shares sold | 2,481,469 | 616,312 | $ | 26,845,725 | $ | 6,657,179 | ||||||||||||||||||
| ||||||||||||||||||||||||
Shares issued in reinvestment of dividends | 35,592 | 20,509 | 385,023 | 218,687 | ||||||||||||||||||||
| ||||||||||||||||||||||||
Shares converted from Class C | 49,291 | – 0 | – | 535,791 | – 0 | – | ||||||||||||||||||
| ||||||||||||||||||||||||
Shares redeemed | (1,537,273 | ) | (414,835 | ) | (16,618,288 | ) | (4,371,321 | ) | ||||||||||||||||
| ||||||||||||||||||||||||
Net increase | 1,029,079 | 221,986 | $ | 11,148,251 | $ | 2,504,545 | ||||||||||||||||||
| ||||||||||||||||||||||||
| Class C | ||||||||||||||||||||||||
Shares sold | 328,784 | 40,692 | $ | 3,470,916 | $ | 430,613 | ||||||||||||||||||
| ||||||||||||||||||||||||
Shares issued in reinvestment of dividends | 3,156 | 2,983 | 33,459 | 31,208 | ||||||||||||||||||||
| ||||||||||||||||||||||||
Shares converted to Class A | (50,356 | ) | – 0 | – | (535,791 | ) | – 0 | – | ||||||||||||||||
| ||||||||||||||||||||||||
Shares redeemed | (173,499 | ) | (70,612 | ) | (1,842,937 | ) | (739,753 | ) | ||||||||||||||||
| ||||||||||||||||||||||||
Net increase (decrease) | 108,085 | (26,937 | ) | $ | 1,125,647 | $ | (277,932 | ) | ||||||||||||||||
| ||||||||||||||||||||||||
| Advisor Class | ||||||||||||||||||||||||
Shares sold | 10,938,589 | 1,412,206 | $ | 118,327,539 | $ | 15,223,605 | ||||||||||||||||||
| ||||||||||||||||||||||||
Shares issued in reinvestment of dividends | 135,408 | 40,289 | 1,468,124 | 431,827 | ||||||||||||||||||||
| ||||||||||||||||||||||||
Shares redeemed | (3,825,785 | ) | (536,555 | ) | (41,472,690 | ) | (5,711,476 | ) | ||||||||||||||||
| ||||||||||||||||||||||||
Net increase | 7,248,212 | 915,940 | $ | 78,322,973 | $ | 9,943,956 | ||||||||||||||||||
| ||||||||||||||||||||||||
| Class R | ||||||||||||||||||||||||
Shares sold | 481,679 | 35,469 | $ | 5,202,527 | $ | 382,901 | ||||||||||||||||||
| ||||||||||||||||||||||||
Shares issued in reinvestment of dividends | 750 | 248 | 8,105 | 2,681 | ||||||||||||||||||||
| ||||||||||||||||||||||||
Shares redeemed | (23,935 | ) | (194 | ) | (258,683 | ) | (2,101 | ) | ||||||||||||||||
| ||||||||||||||||||||||||
Net increase | 458,494 | 35,523 | $ | 4,951,949 | $ | 383,481 | ||||||||||||||||||
| ||||||||||||||||||||||||
| abfunds.com | AB BOND INFLATION STRATEGY | 77 |
NOTES TO FINANCIAL STATEMENTS (continued)
| Shares | Amount | |||||||||||||||||||||||
| Year Ended October 31, 2017 | Year Ended October 31, 2016 | Year Ended October 31, 2017 | Year Ended 2016 | |||||||||||||||||||||
|
| |||||||||||||||||||||||
| Class K | ||||||||||||||||||||||||
Shares sold | 133,650 | 100,455 | $ | 1,443,483 | $ | 1,078,846 | ||||||||||||||||||
| ||||||||||||||||||||||||
Shares issued in reinvestment of dividends | 4,128 | 3,579 | 44,541 | 38,246 | ||||||||||||||||||||
| ||||||||||||||||||||||||
Shares redeemed | (90,288 | ) | (37,944 | ) | (972,679 | ) | (402,583 | ) | ||||||||||||||||
| ||||||||||||||||||||||||
Net increase | 47,490 | 66,090 | $ | 515,345 | $ | 714,509 | ||||||||||||||||||
| ||||||||||||||||||||||||
| Class I | ||||||||||||||||||||||||
Shares sold | 80,147 | 7,138 | $ | 861,654 | $ | 75,774 | ||||||||||||||||||
| ||||||||||||||||||||||||
Shares issued in reinvestment of dividends | 953 | 671 | 10,229 | 7,136 | ||||||||||||||||||||
| ||||||||||||||||||||||||
Shares redeemed | (53,204 | ) | (1,489 | ) | (573,108 | ) | (15,768 | ) | ||||||||||||||||
| ||||||||||||||||||||||||
Net increase | 27,896 | 6,320 | $ | 298,775 | $ | 67,142 | ||||||||||||||||||
| ||||||||||||||||||||||||
| Class 1 | ||||||||||||||||||||||||
Shares sold | 9,138,261 | 3,022,337 | $ | 97,715,632 | $ | 31,867,232 | ||||||||||||||||||
| ||||||||||||||||||||||||
Shares issued in reinvestment of dividends | 379,658 | 428,634 | 4,056,730 | 4,530,676 | ||||||||||||||||||||
| ||||||||||||||||||||||||
Shares redeemed | (4,826,214 | ) | (6,952,120 | ) | (51,530,783 | ) | (72,934,157 | ) | ||||||||||||||||
| ||||||||||||||||||||||||
Net increase (decrease) | 4,691,705 | (3,501,149 | ) | $ | 50,241,579 | $ | (36,536,249 | ) | ||||||||||||||||
| ||||||||||||||||||||||||
| Class 2 | ||||||||||||||||||||||||
Shares sold | 3,117,939 | 1,627,909 | $ | 33,181,588 | $ | 16,977,155 | ||||||||||||||||||
| ||||||||||||||||||||||||
Shares issued in reinvestment of dividends | 92,146 | 87,936 | 984,648 | 928,629 | ||||||||||||||||||||
| ||||||||||||||||||||||||
Shares redeemed | (1,593,693 | ) | (2,217,803 | ) | (17,030,914 | ) | (23,295,763 | ) | ||||||||||||||||
| ||||||||||||||||||||||||
Net increase (decrease) | 1,616,392 | (501,958 | ) | $ | 17,135,322 | $ | (5,389,979 | ) | ||||||||||||||||
| ||||||||||||||||||||||||
| Class Z | ||||||||||||||||||||||||
Shares sold | 667,140 | 1,015,987 | $ | 7,136,819 | $ | 10,731,967 | ||||||||||||||||||
| ||||||||||||||||||||||||
Shares issued in reinvestment of dividends | 27,950 | 24,013 | 299,386 | 255,907 | ||||||||||||||||||||
| ||||||||||||||||||||||||
Shares redeemed | (270,196 | ) | (338,366 | ) | (2,903,183 | ) | (3,637,645 | ) | ||||||||||||||||
| ||||||||||||||||||||||||
Net increase | 424,894 | 701,634 | $ | 4,533,022 | $ | 7,350,229 | ||||||||||||||||||
| ||||||||||||||||||||||||
| 78 | AB BOND INFLATION STRATEGY | abfunds.com |
NOTES TO FINANCIAL STATEMENTS (continued)
NOTE F
Risks Involved in Investing in the Strategy
Interest Rate Risk and Credit Risk—Interest rate risk is the risk that changes in interest rates will affect the value of the Strategy’s investments in fixed-income debt securities such as bonds or notes. Increases in interest rates may cause the value of the Strategy’s investments to decline. Credit risk is the risk that the issuer or guarantor of a debt security, or the counterparty to a derivative contract, will be unable or unwilling to make timely principal and/or interest payments, or to otherwise honor its obligations. The degree of risk for a particular security may be reflected in its credit rating. Credit risk is greater for medium quality and lower-rated securities. Lower-rated debt securities and similar unrated securities (commonly known as “junk bonds”) have speculative elements or are predominantly speculative risks.
Duration Risk—Duration is a measure that relates the expected price volatility of a fixed-income security to changes in interest rates. The duration of a fixed-income security may be shorter than or equal to full maturity of a fixed-income security. Fixed-income securities with longer durations have more risk and will decrease in price as interest rates rise. For example, a fixed-income security with a duration of three years will decrease in value by approximately 3% if interest rates increase by 1%.
Inflation Risk—This is the risk that the value of assets or income from investments will be less in the future as inflation decreases the value of money. As inflation increases, the value of the Strategy’s assets can decline as can the value of the Strategy’s distributions. The risk is significantly greater for fixed-income securities with longer maturites. Although the Strategy invests principally in inflation-indexed securities, the value of its securities may be vulnerable to changes in expectations of inflation or interest rates.
Derivatives Risk—The Strategy may enter into derivative transactions such as forwards, options, futures and swaps. Derivatives may be illiquid, difficult to price, and leveraged so that small changes may produce disproportionate losses for the Strategy, and subject to counterparty risk to a greater degree than more traditional investments. Derivatives may result in significant losses, including losses that are far greater than the value of the derivatives reflected on the statement of assets and liabilities.
Foreign (Non-U.S.) Risk—Investments in securities of non-U.S. issuers may involve more risk than those of U.S. issuers. These securities may fluctuate more widely in price and may be less liquid due to adverse market, economic, political, regulatory or other factors.
| abfunds.com | AB BOND INFLATION STRATEGY | 79 |
NOTES TO FINANCIAL STATEMENTS (continued)
Currency Risk—Fluctuations in currency exchange rates may negatively affect the value of the Strategy’s investments or reduce its returns.
Leverage Risk—When the Strategy borrows money or otherwise leverages its investments, its performance may be volatile because leverage tends to exaggerate the effect of any increase or decrease in the value of the Strategy’s investments. The Strategy may create leverage through the use of reverse repurchase arrangements, forward currency exchange contracts, forward commitments, dollar rolls or futures or by borrowing money. The use of other types of derivative instruments by the Strategy, such as options and swaps, may also result in a form of leverage. Leverage may result in higher returns to the Strategy than if the Strategy were not leveraged, but may also adversely affect returns, particularly if the market is declining.
Liquidity Risk—Liquidity risk occurs when certain investments become difficult to purchase or sell. Difficulty in selling less liquid securities may result in sales at disadvantageous prices affecting the value of your investment in the Strategy. Causes of liquidity risk may include low trading volumes, large positions and heavy redemptions of fund shares. Over recent years, liquidity risk has also increased because the capacity of dealers in the secondary market for fixed-income securities to make markets in these securities has decreased, even as the overall bond market has grown significantly, due to, among other things, structural changes, additional regulatory requirements and capital and risk restraints that have led to reduced inventories. Liquidity risk may be higher in a rising interest rate environment, when the value and liquidity of fixed-income securities generally go down.
Indemnification Risk—In the ordinary course of business, the Strategy enters into contracts that contain a variety of indemnifications. The Strategy’s maximum exposure under these arrangements is unknown. However, the Strategy has not had prior claims or losses pursuant to these indemnification provisions and expects the risk of loss thereunder to be remote. Therefore, the Strategy has not accrued any liability in connection with these indemnification provisions.
NOTE G
Joint Credit Facility
A number of open-end mutual funds managed by the Adviser, including the Strategy, participate in a $280 million revolving credit facility (the “Facility”) intended to provide short-term financing, if necessary, subject to certain restrictions in connection with abnormal redemption activity. Commitment fees related to the Facility are paid by the participating funds and are included in miscellaneous expenses in the statement of operations. The Strategy did not utilize the Facility during the year ended October 31, 2017.
| 80 | AB BOND INFLATION STRATEGY | abfunds.com |
NOTES TO FINANCIAL STATEMENTS (continued)
NOTE H
Distributions to Shareholders
The tax character of distributions paid during the fiscal years ended October 31, 2017 and October 31, 2016 were as follows:
| 2017 | 2016 | |||||||
Distributions paid from: | ||||||||
Ordinary income | $ | 8,894,708 | $ | 7,812,213 | ||||
|
|
|
| |||||
Total taxable distributions paid | $ | 8,894,708 | $ | 7,812,213 | ||||
|
|
|
| |||||
As of October 31, 2017, the components of accumulated earnings/(deficit) on a tax basis were as follows:
Accumulated capital and other losses | $ | (10,706,541 | )(a) | |
Unrealized appreciation/(depreciation) | 2,646,407 | (b) | ||
|
| |||
Total accumulated earnings/(deficit) | $ | (8,060,134 | )(c) | |
|
|
| (a) | As of October 31, 2017, the Strategy had a net capital loss carryforward of $10,706,541. During the fiscal year, the Strategy utilized of $847,498 of capital loss carry forwards to offset current year net realized gains. |
| (b) | The differences between book-basis and tax-basis unrealized appreciation/(depreciation) are attributable primarily to the tax deferral of losses on wash sales, the tax treatment of swaps and passive foreign investment companies (PFICs), the recognition for tax purposes of unrealized gains/losses on certain derivative instruments. |
| (c) | Other differences between book-basis and tax-basis components of accumulated earnings/(deficit) are attributable primarily to the tax treatment of defaulted securities. |
For tax purposes, net realized capital losses may be carried over to offset future capital gains, if any. Funds are permitted to carry forward capital losses for an indefinite period, and such losses will retain their character as either short-term or long-term capital losses. As of October 31, 2017, the Strategy had a net short-term capital loss carryforward of $3,041,617 and a net long term capital loss carryforward of $7,664,924, which may be carried forward for an indefinite period.
During the current fiscal year, permanent differences primarily due to the tax treatment of swaps, foreign currency related reclassifications, paydown gain/loss reclassifications and a dividend overdistribution resulted in a net decrease in undistributed net investment income, a net decrease in accumulated net realized loss on investment and foreign currency transactions, and a net decrease in additional paid-in capital. These reclassifications had no effect on net assets.
NOTE I
Recent Accounting Pronouncements
In March 2017, the Financial Accounting Standards Board issued an Accounting Standards Update, ASU 2017-08, Receivables—Nonrefundable Fees and Other Costs (Subtopic 310-20), Premium
| abfunds.com | AB BOND INFLATION STRATEGY | 81 |
NOTES TO FINANCIAL STATEMENTS (continued)
Amortization on Purchased Callable Debt Securities (the “ASU”) which amends the amortization period for certain purchased callable debt securities held at a premium, shortening such period to the earliest call date. The ASU does not require any accounting change for debt securities held at a discount; the discount continues to be amortized to maturity. The ASU is effective for fiscal years, and interim periods within those fiscal years, beginning after December 15, 2018. At this time, management is evaluating the implications of these changes on the financial statements.
NOTE J
Subsequent Events
Management has evaluated subsequent events for possible recognition or disclosure in the financial statements through the date the financial statements are issued. Management has determined that there are no material events that would require disclosure in the Strategy’s financial statements through this date.
| 82 | AB BOND INFLATION STRATEGY | abfunds.com |
FINANCIAL HIGHLIGHTS
Selected Data For A Share Of Capital Stock Outstanding Throughout Each Period
| Class A | ||||||||||||||||||||
| Year Ended October 31, | ||||||||||||||||||||
| 2017 | 2016 | 2015 | 2014 | 2013 | ||||||||||||||||
|
| |||||||||||||||||||
Net asset value, beginning of period | $ 10.92 | $ 10.44 | $ 10.77 | $ 10.81 | $ 11.36 | |||||||||||||||
|
| |||||||||||||||||||
Income From Investment Operations | ||||||||||||||||||||
Net investment income(a)(b) | .21 | .18 | .08 | .17 | .09 | |||||||||||||||
Net realized and unrealized gain (loss) on investment and foreign currency transactions | (.11 | ) | .51 | (.31 | ) | (.04 | ) | (.57 | ) | |||||||||||
Contributions from Affiliates | .00 | (c) | – 0 | – | – 0 | – | – 0 | – | – 0 | – | ||||||||||
|
| |||||||||||||||||||
Net increase (decrease) in net asset value from operations | .10 | .69 | (.23 | ) | .13 | (.48 | ) | |||||||||||||
|
| |||||||||||||||||||
Less: Dividends and Distributions | ||||||||||||||||||||
Dividends from net investment income | (.19 | ) | (.21 | ) | (.10 | ) | (.17 | ) | (.07 | ) | ||||||||||
Distributions from net realized gain on investment transactions | – 0 | – | – 0 | – | – 0 | – | – 0 | – | .00 | (c) | ||||||||||
|
| |||||||||||||||||||
Total dividends and distributions | (.19 | ) | (.21 | ) | (.10 | ) | (.17 | ) | (.07 | ) | ||||||||||
|
| |||||||||||||||||||
Net asset value, end of period | $ 10.83 | $ 10.92 | $ 10.44 | $ 10.77 | $ 10.81 | |||||||||||||||
|
| |||||||||||||||||||
Total Return | ||||||||||||||||||||
Total investment return based on net asset value(d) | .91 | % | 6.63 | % | (2.18 | )% | 1.16 | % | (4.23 | )% | ||||||||||
Ratios/Supplemental Data | ||||||||||||||||||||
Net assets, end of period (000’s omitted) | $27,718 | $16,712 | $13,660 | $15,860 | $23,358 | |||||||||||||||
Ratio to average net assets of: | ||||||||||||||||||||
Expenses, net of waivers/reimbursements(e) | 1.01 | % | .98 | % | .88 | % | .81 | % | .80 | % | ||||||||||
Expenses, before waivers/reimbursements(e) | 1.34 | % | 1.42 | % | 1.36 | % | 1.15 | % | 1.18 | % | ||||||||||
Net investment income(b) | 1.95 | % | 1.71 | % | .75 | % | 1.57 | % | .80 | % | ||||||||||
Portfolio turnover rate** | 42 | % | 41 | % | 51 | % | 77 | % | 93 | % | ||||||||||
See footnote summary on page 92.
| abfunds.com | AB BOND INFLATION STRATEGY | 83 |
FINANCIAL HIGHLIGHTS (continued)
Selected Data For A Share Of Capital Stock Outstanding Throughout Each Period
| Class C | ||||||||||||||||||||
| Year Ended October 31, | ||||||||||||||||||||
| 2017 | 2016 | 2015 | 2014 | 2013 | ||||||||||||||||
|
| |||||||||||||||||||
Net asset value, beginning of period | $ 10.71 | $ 10.27 | $ 10.64 | $ 10.71 | $ 11.28 | |||||||||||||||
|
| |||||||||||||||||||
Income From Investment Operations | ||||||||||||||||||||
Net investment income(a)(b) | .13 | .10 | .00 | (c) | .07 | .00 | (c) | |||||||||||||
Net realized and unrealized gain (loss) on investment and foreign currency transactions | (.11 | ) | .50 | (.31 | ) | (.01 | ) | (.56 | ) | |||||||||||
Contributions from Affiliates | .00 | (c) | – 0 | – | – 0 | – | – 0 | – | – 0 | – | ||||||||||
|
| |||||||||||||||||||
Net increase (decrease) in net asset value from operations | .02 | .60 | (.31 | ) | .06 | (.56 | ) | |||||||||||||
|
| |||||||||||||||||||
Less: Dividends and Distributions | ||||||||||||||||||||
Dividends from net investment income | (.12 | ) | (.16 | ) | (.06 | ) | (.13 | ) | (.01 | ) | ||||||||||
Distributions from net realized gain on investment transactions | – 0 | – | – 0 | – | – 0 | – | – 0 | – | (.00 | )(c) | ||||||||||
|
| |||||||||||||||||||
Total dividends and distributions | (.12 | ) | (.16 | ) | (.06 | ) | (.13 | ) | (.01 | ) | ||||||||||
|
| |||||||||||||||||||
Net asset value, end of period | $ 10.61 | $ 10.71 | $ 10.27 | $ 10.64 | $ 10.71 | |||||||||||||||
|
| |||||||||||||||||||
Total Return | ||||||||||||||||||||
Total investment return based on net asset value(d) | .16 | % | 5.86 | % | (2.93 | )% | .50 | % | (4.98 | )% | ||||||||||
Ratios/Supplemental Data | ||||||||||||||||||||
Net assets, end of period (000’s omitted) | $3,627 | $2,505 | $2,679 | $3,596 | $5,845 | |||||||||||||||
Ratio to average net assets of: | ||||||||||||||||||||
Expenses, net of waivers/reimbursements(e) | 1.76 | % | 1.72 | % | 1.58 | % | 1.51 | % | 1.51 | % | ||||||||||
Expenses, before waivers/reimbursements(e) | 2.09 | % | 2.16 | % | 2.07 | % | 1.86 | % | 1.86 | % | ||||||||||
Net investment income(b) | 1.26 | % | .96 | % | .06 | % | .70 | % | .01 | % | ||||||||||
Portfolio turnover rate** | 42 | % | 41 | % | 51 | % | 77 | % | 93 | % | ||||||||||
See footnote summary on page 92.
| 84 | AB BOND INFLATION STRATEGY | abfunds.com |
FINANCIAL HIGHLIGHTS (continued)
Selected Data For A Share Of Capital Stock Outstanding Throughout Each Period
| Advisor Class | ||||||||||||||||||||
| Year Ended October 31, | ||||||||||||||||||||
| 2017 | 2016 | 2015 | 2014 | 2013 | ||||||||||||||||
|
| |||||||||||||||||||
Net asset value, beginning of period | $ 10.93 | $ 10.46 | $ 10.79 | $ 10.82 | $ 11.39 | |||||||||||||||
|
| |||||||||||||||||||
Income From Investment Operations | ||||||||||||||||||||
Net investment income(a)(b) | .25 | .22 | .13 | .19 | .06 | |||||||||||||||
Net realized and unrealized gain (loss) on investment and foreign currency transactions | (.13 | ) | .49 | (.33 | ) | (.03 | ) | (.52 | ) | |||||||||||
Contributions from Affiliates | .00 | (c) | – 0 | – | – 0 | – | – 0 | – | – 0 | – | ||||||||||
|
| |||||||||||||||||||
Net increase (decrease) in net asset value from operations | .12 | .71 | (.20 | ) | .16 | (.46 | ) | |||||||||||||
|
| |||||||||||||||||||
Less: Dividends and Distributions | ||||||||||||||||||||
Dividends from net investment income | (.21 | ) | (.24 | ) | (.13 | ) | (.19 | ) | (.11 | ) | ||||||||||
Distributions from net realized gain on investment transactions | – 0 | – | – 0 | – | – 0 | – | – 0 | – | .00 | (c) | ||||||||||
|
| |||||||||||||||||||
Total dividends and distributions | (.21 | ) | (.24 | ) | (.13 | ) | (.19 | ) | (.11 | ) | ||||||||||
|
| |||||||||||||||||||
Net asset value, end of period | $ 10.84 | $ 10.93 | $ 10.46 | $ 10.79 | $ 10.82 | |||||||||||||||
|
| |||||||||||||||||||
Total Return | ||||||||||||||||||||
Total investment return based on net asset value(d) | 1.15 | % | 6.87 | % | (1.90 | )% | 1.50 | % | (4.06 | )% | ||||||||||
Ratios/Supplemental Data | ||||||||||||||||||||
Net assets, end of period (000’s omitted) | $107,545 | $29,186 | $18,343 | $16,144 | $7,969 | |||||||||||||||
Ratio to average net assets of: | ||||||||||||||||||||
Expenses, net of waivers/reimbursements(e) | .77 | % | .73 | % | .58 | % | .52 | % | .51 | % | ||||||||||
Expenses, before waivers/reimbursements(e) | 1.10 | % | 1.16 | % | 1.06 | % | .86 | % | .87 | % | ||||||||||
Net investment income(b) | 2.31 | % | 2.04 | % | 1.23 | % | 1.77 | % | .54 | % | ||||||||||
Portfolio turnover rate** | 42 | % | 41 | % | 51 | % | 77 | % | 93 | % | ||||||||||
See footnote summary on page 92.
| abfunds.com | AB BOND INFLATION STRATEGY | 85 |
FINANCIAL HIGHLIGHTS (continued)
Selected Data For A Share Of Capital Stock Outstanding Throughout Each Period
| Class R | ||||||||||||||||||||
| Year Ended October 31, | ||||||||||||||||||||
| 2017 | 2016 | 2015 | 2014 | 2013 | ||||||||||||||||
|
| |||||||||||||||||||
Net asset value, beginning of period | $ 10.89 | $ 10.44 | $ 10.78 | $ 10.81 | $ 11.34 | |||||||||||||||
|
| |||||||||||||||||||
Income From Investment Operations | ||||||||||||||||||||
Net investment income (loss)(a)(b) | .21 | .29 | (.08 | ) | .14 | .06 | ||||||||||||||
Net realized and unrealized gain (loss) on investment and foreign currency transactions | (.12 | ) | .37 | (.19 | ) | (.02 | ) | (.57 | ) | |||||||||||
Contributions from Affiliates | .00 | (c) | – 0 | – | – 0 | – | – 0 | – | – 0 | – | ||||||||||
|
| |||||||||||||||||||
Net increase (decrease) in net asset value from operations | .09 | .66 | (.27 | ) | .12 | (.51 | ) | |||||||||||||
|
| |||||||||||||||||||
Less: Dividends and Distributions | ||||||||||||||||||||
Dividends from net investment income | (.16 | ) | (.21 | ) | (.07 | ) | (.15 | ) | (.02 | ) | ||||||||||
Distributions from net realized gain on investment transactions | – 0 | – | – 0 | – | – 0 | – | – 0 | – | .00 | (c) | ||||||||||
|
| |||||||||||||||||||
Total dividends and distributions | (.16 | ) | (.21 | ) | (.07 | ) | (.15 | ) | (.02 | ) | ||||||||||
|
| |||||||||||||||||||
Net asset value, end of period | $ 10.82 | $ 10.89 | $ 10.44 | $ 10.78 | $ 10.81 | |||||||||||||||
|
| |||||||||||||||||||
Total Return | ||||||||||||||||||||
Total investment return based on net asset value(d) | .80 | %† | 6.41 | % | (2.49 | )% | 1.10 | % | (4.51 | )% | ||||||||||
Ratios/Supplemental Data | ||||||||||||||||||||
Net assets, end of period (000’s omitted) | $5,364 | $408 | $20 | $230 | $209 | |||||||||||||||
Ratio to average net assets of: | ||||||||||||||||||||
Expenses, net of waivers/reimbursements(e) | 1.29 | % | 1.24 | % | 1.06 | % | 1.01 | % | 1.01 | % | ||||||||||
Expenses, before waivers/reimbursements(e) | 1.67 | % | 1.71 | % | 1.50 | % | 1.40 | % | 1.44 | % | ||||||||||
Net investment income (loss)(b) | 2.08 | % | 2.71 | % | (.68 | )% | 1.26 | % | .49 | % | ||||||||||
Portfolio turnover rate** | 42 | % | 41 | % | 51 | % | 77 | % | 93 | % | ||||||||||
See footnote summary on page 92.
| 86 | AB BOND INFLATION STRATEGY | abfunds.com |
FINANCIAL HIGHLIGHTS (continued)
Selected Data For A Share Of Capital Stock Outstanding Throughout Each Period
| Class K | ||||||||||||||||||||
| Year Ended October 31, | ||||||||||||||||||||
| 2017 | 2016 | 2015 | 2014 | 2013 | ||||||||||||||||
|
| |||||||||||||||||||
Net asset value, beginning of period | $ 10.89 | $ 10.42 | $ 10.77 | $ 10.80 | $ 11.35 | |||||||||||||||
|
| |||||||||||||||||||
Income From Investment Operations | ||||||||||||||||||||
Net investment income(a)(b) | .21 | .20 | .07 | .17 | .09 | |||||||||||||||
Net realized and unrealized gain (loss) on investment and foreign currency transactions | (.11 | ) | .49 | (.31 | ) | (.03 | ) | (.57 | ) | |||||||||||
Contributions from Affiliates | .00 | (c) | – 0 | – | – 0 | – | – 0 | – | – 0 | – | ||||||||||
|
| |||||||||||||||||||
Net increase (decrease) in net asset value from operations | .10 | .69 | (.24 | ) | .14 | (.48 | ) | |||||||||||||
|
| |||||||||||||||||||
Less: Dividends and Distributions | ||||||||||||||||||||
Dividends from net investment income | (.18 | ) | (.22 | ) | (.11 | ) | (.17 | ) | (.07 | ) | ||||||||||
Distributions from net realized gain on investment transactions | – 0 | – | – 0 | – | – 0 | – | – 0 | – | .00 | (c) | ||||||||||
|
| |||||||||||||||||||
Total dividends and distributions | (.18 | ) | (.22 | ) | (.11 | ) | (.17 | ) | (.07 | ) | ||||||||||
|
| |||||||||||||||||||
Net asset value, end of period | $ 10.81 | $ 10.89 | $ 10.42 | $ 10.77 | $ 10.80 | |||||||||||||||
|
| |||||||||||||||||||
Total Return | ||||||||||||||||||||
Total investment return based on net asset value(d) | .96 | % | 6.66 | % | (2.24 | )% | 1.31 | % | (4.26 | )% | ||||||||||
Ratios/Supplemental Data | ||||||||||||||||||||
Net assets, end of period (000’s omitted) | $2,903 | $2,409 | $1,616 | $2,219 | $1,981 | |||||||||||||||
Ratio to average net assets of: | ||||||||||||||||||||
Expenses, net of waivers/reimbursements(e) | 1.01 | % | .98 | % | .83 | % | .76 | % | .76 | % | ||||||||||
Expenses, before waivers/reimbursements(e) | 1.37 | % | 1.36 | % | 1.17 | % | 1.07 | % | 1.12 | % | ||||||||||
Net investment income(b) | 1.95 | % | 1.87 | % | .70 | % | 1.57 | % | .80 | % | ||||||||||
Portfolio turnover rate** | 42 | % | 41 | % | 51 | % | 77 | % | 93 | % | ||||||||||
See footnote summary on page 92.
| abfunds.com | AB BOND INFLATION STRATEGY | 87 |
FINANCIAL HIGHLIGHTS (continued)
Selected Data For A Share Of Capital Stock Outstanding Throughout Each Period
| Class I | ||||||||||||||||||||
| Year Ended October 31, | ||||||||||||||||||||
| 2017 | 2016 | 2015 | 2014 | 2013 | ||||||||||||||||
|
| |||||||||||||||||||
Net asset value, beginning of period | $ 10.84 | $ 10.38 | $ 10.73 | $ 10.77 | $ 11.33 | |||||||||||||||
|
| |||||||||||||||||||
Income From Investment Operations | ||||||||||||||||||||
Net investment income (loss)(a)(b) | .24 | .22 | (.06 | ) | .22 | .10 | ||||||||||||||
Net realized and unrealized gain (loss) on investment and foreign currency transactions | (.12 | ) | .50 | (.14 | ) | (.06 | ) | (.55 | ) | |||||||||||
Contributions from Affiliates | .00 | (c) | – 0 | – | – 0 | – | – 0 | – | – 0 | – | ||||||||||
|
| |||||||||||||||||||
Net increase (decrease) in net asset value from operations | .12 | .72 | (.20 | ) | .16 | (.45 | ) | |||||||||||||
|
| |||||||||||||||||||
Less: Dividends and Distributions | ||||||||||||||||||||
Dividends from net investment income | (.22 | ) | (.26 | ) | (.15 | ) | (.20 | ) | (.11 | ) | ||||||||||
Distributions from net realized gain on investment transactions | – 0 | – | – 0 | – | – 0 | – | – 0 | – | .00 | (c) | ||||||||||
|
| |||||||||||||||||||
Total dividends and distributions | (.22 | ) | (.26 | ) | (.15 | ) | (.20 | ) | (.11 | ) | ||||||||||
|
| |||||||||||||||||||
Net asset value, end of period | $ 10.74 | $ 10.84 | $ 10.38 | $ 10.73 | $ 10.77 | |||||||||||||||
|
| |||||||||||||||||||
Total Return | ||||||||||||||||||||
Total investment return based on net asset value(d) | 1.15 | % | 6.98 | % | (1.88 | )% | 1.52 | % | (4.00 | )% | ||||||||||
Ratios/Supplemental Data | ||||||||||||||||||||
Net assets, end of period (000’s omitted) | $642 | $345 | $265 | $841 | $2,631 | |||||||||||||||
Ratio to average net assets of: | ||||||||||||||||||||
Expenses, net of waivers/reimbursements(e) | .76 | % | .72 | % | .57 | % | .51 | % | .50 | % | ||||||||||
Expenses, before waivers/reimbursements(e) | .99 | % | 1.03 | % | .76 | % | .69 | % | .83 | % | ||||||||||
Net investment income (loss)(b) | 2.25 | % | 2.08 | % | (.50 | )% | 2.06 | % | 1.10 | % | ||||||||||
Portfolio turnover rate** | 42 | % | 41 | % | 51 | % | 77 | % | 93 | % | ||||||||||
See footnote summary on page 92.
| 88 | AB BOND INFLATION STRATEGY | abfunds.com |
FINANCIAL HIGHLIGHTS (continued)
Selected Data For A Share Of Capital Stock Outstanding Throughout Each Period
| Class 1 | ||||||||||||||||||||
| Year Ended October 31, | ||||||||||||||||||||
| 2017 | 2016 | 2015 | 2014 | 2013 | ||||||||||||||||
|
| |||||||||||||||||||
Net asset value, beginning of period | $ 10.80 | $ 10.35 | $ 10.71 | $ 10.76 | $ 11.33 | |||||||||||||||
|
| |||||||||||||||||||
Income From Investment Operations | ||||||||||||||||||||
Net investment income(a)(b) | .22 | .20 | .10 | .19 | .12 | |||||||||||||||
Net realized and unrealized gain (loss) on investment and foreign currency transactions | (.11 | ) | .51 | (.32 | ) | (.04 | ) | (.58 | ) | |||||||||||
Contributions from Affiliates | .00 | (c) | – 0 | – | – 0 | – | – 0 | – | – 0 | – | ||||||||||
|
| |||||||||||||||||||
Net increase (decrease) in net asset value from operations | .11 | .71 | (.22 | ) | .15 | (.46 | ) | |||||||||||||
|
| |||||||||||||||||||
Less: Dividends and Distributions | ||||||||||||||||||||
Dividends from net investment income | (.22 | ) | (.26 | ) | (.14 | ) | (.20 | ) | (.11 | ) | ||||||||||
Distributions from net realized gain on investment transactions | – 0 | – | – 0 | – | – 0 | – | – 0 | – | .00 | (c) | ||||||||||
|
| |||||||||||||||||||
Total dividends and distributions | (.22 | ) | (.26 | ) | (.14 | ) | (.20 | ) | (.11 | ) | ||||||||||
|
| |||||||||||||||||||
Net asset value, end of period | $ 10.69 | $ 10.80 | $ 10.35 | $ 10.71 | $ 10.76 | |||||||||||||||
|
| |||||||||||||||||||
Total Return | ||||||||||||||||||||
Total investment return based on net asset value(d) | 1.01 | % | 6.89 | % | (2.04 | )% | 1.38 | % | (4.08 | )% | ||||||||||
Ratios/Supplemental Data | ||||||||||||||||||||
Net assets, end of period (000’s omitted) | $274,366 | $226,408 | $253,402 | $288,565 | $315,187 | |||||||||||||||
Ratio to average net assets of: | ||||||||||||||||||||
Expenses, net of waivers/reimbursements(e) | .86 | % | .82 | % | .68 | % | .61 | % | .60 | % | ||||||||||
Expenses, before waivers/reimbursements(e) | 1.04 | % | 1.03 | % | .87 | % | .77 | % | .81 | % | ||||||||||
Net investment income(b) | 2.10 | % | 1.86 | % | .98 | % | 1.75 | % | 1.05 | % | ||||||||||
Portfolio turnover rate** | 42 | % | 41 | % | 51 | % | 77 | % | 93 | % | ||||||||||
See footnote summary on page 92.
| abfunds.com | AB BOND INFLATION STRATEGY | 89 |
FINANCIAL HIGHLIGHTS (continued)
Selected Data For A Share Of Capital Stock Outstanding Throughout Each Period
| Class 2 | ||||||||||||||||||||
| Year Ended October 31, | ||||||||||||||||||||
| 2017 | 2016 | 2015 | 2014 | 2013 | ||||||||||||||||
|
| |||||||||||||||||||
Net asset value, beginning of period | $ 10.79 | $ 10.35 | $ 10.71 | $ 10.75 | $ 11.33 | |||||||||||||||
|
| |||||||||||||||||||
Income From Investment Operations | ||||||||||||||||||||
Net investment income(a)(b) | .24 | .20 | .11 | .20 | .12 | |||||||||||||||
Net realized and unrealized gain (loss) on investment and foreign currency transactions | (.11 | ) | .51 | (.32 | ) | (.03 | ) | (.58 | ) | |||||||||||
Contributions from Affiliates | .00 | (c) | – 0 | – | – 0 | – | – 0 | – | – 0 | – | ||||||||||
|
| |||||||||||||||||||
Net increase (decrease) in net asset value from operations | .13 | .71 | (.21 | ) | .17 | (.46 | ) | |||||||||||||
|
| |||||||||||||||||||
Less: Dividends and Distributions | ||||||||||||||||||||
Dividends from net investment income | (.23 | ) | (.27 | ) | (.15 | ) | (.21 | ) | (.12 | ) | ||||||||||
Distributions from net realized gain on investment transactions | – 0 | – | – 0 | – | – 0 | – | – 0 | – | (.00 | )(c) | ||||||||||
|
| |||||||||||||||||||
Total dividends and distributions | (.23 | ) | (.27 | ) | (.15 | ) | (.21 | ) | (.12 | ) | ||||||||||
|
| |||||||||||||||||||
Net asset value, end of period | $ 10.69 | $ 10.79 | $ 10.35 | $ 10.71 | $ 10.75 | |||||||||||||||
|
| |||||||||||||||||||
Total Return | ||||||||||||||||||||
Total investment return based on net asset value(d) | 1.21 | % | 6.92 | % | (1.95 | )% | 1.55 | % | (4.06 | )% | ||||||||||
Ratios/Supplemental Data | ||||||||||||||||||||
Net assets, end of period (000’s omitted) | $54,118 | $37,207 | $40,897 | $47,314 | $46,554 | |||||||||||||||
Ratio to average net assets of: | ||||||||||||||||||||
Expenses, net of waivers/reimbursements(e) | .76 | % | .72 | % | .58 | % | .51 | % | .51 | % | ||||||||||
Expenses, before waivers/reimbursements(e) | .94 | % | .93 | % | .77 | % | .67 | % | .71 | % | ||||||||||
Net investment income(b) | 2.24 | % | 1.93 | % | 1.09 | % | 1.87 | % | 1.05 | % | ||||||||||
Portfolio turnover rate** | 42 | % | 41 | % | 51 | % | 77 | % | 93 | % | ||||||||||
See footnote summary on page 92.
| 90 | AB BOND INFLATION STRATEGY | abfunds.com |
FINANCIAL HIGHLIGHTS (continued)
Selected Data For A Share Of Capital Stock Outstanding Throughout Each Period
| Class Z | ||||||||||||
| Year Ended October 31, | December 11, October 31, 2015 | |||||||||||
| 2017 | 2016 | |||||||||||
|
| |||||||||||
Net asset value, beginning of period | $ 10.82 | $ 10.38 | $ 10.62 | |||||||||
|
| |||||||||||
Income From Investment Operations | ||||||||||||
Net investment income(a)(b) | .24 | .25 | .19 | |||||||||
Net realized and unrealized gain (loss) on investment and foreign currency transactions | (.11 | ) | .46 | (.28 | ) | |||||||
Contributions from Affiliates | .00 | (c) | – 0 | – | – 0 | – | ||||||
|
| |||||||||||
Net increase (decrease) in net asset value from operations | .13 | .71 | (.09 | ) | ||||||||
|
| |||||||||||
Less: Dividends | ||||||||||||
Dividends from net investment income | (.23 | ) | (.27 | ) | (.15 | ) | ||||||
|
| |||||||||||
Net asset value, end of period | $ 10.72 | $ 10.82 | $ 10.38 | |||||||||
|
| |||||||||||
Total Return | ||||||||||||
Total investment return based on net asset value(d) | 1.19 | % | 6.89 | % | (.86 | )% | ||||||
Ratios/Supplemental Data | ||||||||||||
Net assets, end of period (000’‘s omitted) | $16,019 | $11,576 | $3,821 | |||||||||
Ratio to average net assets of: | ||||||||||||
Expenses, net of waivers/reimbursements(e) | .76 | % | .73 | % | .61 | %^ | ||||||
Expenses, before waivers/reimbursements(e) | .94 | % | .95 | % | .84 | %^ | ||||||
Net investment income(b) | 2.22 | % | 2.40 | % | 2.09 | %^ | ||||||
Portfolio turnover rate** | 42 | % | 41 | % | 51 | % | ||||||
See footnote summary on page 92.
| abfunds.com | AB BOND INFLATION STRATEGY | 91 |
FINANCIAL HIGHLIGHTS (continued)
Selected Data For A Share Of Capital Stock Outstanding Throughout Each Period
| (a) | Based on average shares outstanding. |
| (b) | Net of fees and expenses waived/reimbursed by the Adviser. |
| (c) | Amount is less than $.005. |
| (d) | Total investment return is calculated assuming an initial investment made at the net asset value at the beginning of the period, reinvestment of all dividends and distributions at net asset value during the period, and redemption on the last day of the period. Initial sales charges or contingent deferred sales charges are not reflected in the calculation of total investment return. Total return does not reflect the deduction of taxes that a shareholder would pay on fund distributions or the redemption of fund shares. Total investment return calculated for a period of less than one year is not annualized. |
| (e) | The expense ratios presented below exclude interest expense: |
| Year Ended October 31, | ||||||||||||||||||||
| 2017 | 2016 | 2015 | 2014 | 2013 | ||||||||||||||||
|
| |||||||||||||||||||
Class A | ||||||||||||||||||||
Net of waivers/reimbursements | .75 | % | .76 | % | .80 | % | .79 | % | .75 | % | ||||||||||
Before waivers/reimbursements | 1.07 | % | 1.20 | % | 1.28 | % | 1.13 | % | 1.12 | % | ||||||||||
Class C | ||||||||||||||||||||
Net of waivers/reimbursements | 1.50 | % | 1.50 | % | 1.50 | % | 1.48 | % | 1.45 | % | ||||||||||
Before waivers/reimbursements | 1.82 | % | 1.94 | % | 1.99 | % | 1.84 | % | 1.81 | % | ||||||||||
Advisor Class | ||||||||||||||||||||
Net of waivers/reimbursements | .50 | % | .50 | % | .50 | % | .49 | % | .45 | % | ||||||||||
Before waivers/reimbursements | .83 | % | .93 | % | .98 | % | .84 | % | .82 | % | ||||||||||
Class R | ||||||||||||||||||||
Net of waivers/reimbursements | 1.00 | % | 1.00 | % | 1.00 | % | .99 | % | .95 | % | ||||||||||
Before waivers/reimbursements | 1.38 | % | 1.47 | % | 1.44 | % | 1.38 | % | 1.39 | % | ||||||||||
Class K | ||||||||||||||||||||
Net of waivers/reimbursements | .75 | % | .75 | % | .75 | % | .74 | % | .70 | % | ||||||||||
Before waivers/reimbursements | 1.10 | % | 1.13 | % | 1.09 | % | 1.05 | % | 1.06 | % | ||||||||||
Class I | ||||||||||||||||||||
Net of waivers/reimbursements | .50 | % | .50 | % | .50 | % | .49 | % | .45 | % | ||||||||||
Before waivers/reimbursements | .72 | % | .81 | % | .69 | % | .67 | % | .78 | % | ||||||||||
Class 1 |
| |||||||||||||||||||
Net of waivers/reimbursements | .60 | % | .60 | % | .60 | % | .59 | % | .55 | % | ||||||||||
Before waivers/reimbursements | .77 | % | .81 | % | .79 | % | .74 | % | .76 | % | ||||||||||
Class 2 |
| |||||||||||||||||||
Net of waivers/reimbursements | .50 | % | .50 | % | .50 | % | .49 | % | .45 | % | ||||||||||
Before waivers/reimbursements | .67 | % | .71 | % | .69 | % | .64 | % | .66 | % | ||||||||||
Class Z(g) |
| |||||||||||||||||||
Net of waivers/reimbursements | .50 | % | .50 | % | .50 | %^ | N/A | N/A | ||||||||||||
Before waivers/reimbursements | .68 | % | .72 | % | .73 | %^ | N/A | N/A | ||||||||||||
| (f) | Commencement of distribution. |
| (g) | Commenced distribution on December 11, 2014. |
| ** | The Strategy accounts for dollar roll transactions as purchases and sales. |
| † | The net asset value and total return include adjustments in accordance with accounting principles generally accepted in the United States of America for financial reporting purposes. As such, the net asset value and total return for shareholder transactions may differ from financial statements. |
| ^ | Annualized. |
See notes to financial statements.
| 92 | AB BOND INFLATION STRATEGY | abfunds.com |
REPORT OF INDEPENDENT REGISTERED
PUBLIC ACCOUNTING FIRM
To the Board of Directors and Shareholders
of AB Bond Inflation Strategy Portfolio
We have audited the accompanying statement of assets and liabilities, including the portfolio of investments, of AB Bond Inflation Strategy Portfolio (the “Fund”), one of the portfolios constituting the AB Bond Fund, Inc. as of October 31, 2017, and the related statements of operations and cash flows for the year then ended, the statements of changes in net assets for each of the two years in the period then ended, and the financial highlights for each of the periods indicated therein. These financial statements and financial highlights are the responsibility of the Fund’s management. Our responsibility is to express an opinion on these financial statements and financial highlights based on our audits.
We conducted our audits in accordance with the standards of the Public Company Accounting Oversight Board (United States). Those standards require that we plan and perform the audit to obtain reasonable assurance about whether the financial statements and financial highlights are free of material misstatement. We were not engaged to perform an audit of the Fund’s internal control over financial reporting. Our audits included consideration of internal control over financial reporting as a basis for designing audit procedures that are appropriate in the circumstances, but not for the purpose of expressing an opinion on the effectiveness of the Fund’s internal control over financial reporting. Accordingly, we express no such opinion. An audit also includes examining, on a test basis, evidence supporting the amounts and disclosures in the financial statements and financial highlights, assessing the accounting principles used and significant estimates made by management, and evaluating the overall financial statement presentation. Our procedures included confirmation of securities owned as of October 31, 2017, by correspondence with the custodian and others, or by other appropriate auditing procedures where replies from others were not received. We believe that our audits provide a reasonable basis for our opinion.
In our opinion, the financial statements and financial highlights referred to above present fairly, in all material respects, the financial position of AB Bond Inflation Strategy Portfolio, one of the portfolios constituting the AB Bond Fund, Inc., at October 31, 2017, the results of its operations and its cash flows for the year then ended, the changes in its net assets for each of the two years in the period then ended, and the financial highlights for each of the periods indicated therein, in conformity with U.S. generally accepted accounting principles.

New York, New York
December 28, 2017
| abfunds.com | AB BOND INFLATION STRATEGY | 93 |
2017 FEDERAL TAX INFORMATION
(unaudited)
For Federal income tax purposes, the following information is furnished with respect to the distributions paid by the Strategy during the taxable year ended October 31, 2017. For foreign shareholders, 99.93% of ordinary income dividends paid may be considered to be qualifying to be taxed as interest-related dividends.
Shareholders should not use the above information to prepare their income tax returns. The information necessary to complete your income tax returns will be included with your Form 1099-DIV which will be sent to you separately in January 2018.
| 94 | AB BOND INFLATION STRATEGY | abfunds.com |
BOARD OF DIRECTORS
Marshall C. Turner, Jr.(1), Chairman John H. Dobkin(1)(2) Michael J. Downey(1) William H. Foulk, Jr.(1) D. James Guzy(1)(2) | Nancy P. Jacklin(1) Robert M. Keith, President and Chief Executive Officer Carol C. McMullen(1) Garry L. Moody(1) Earl D. Weiner(1) |
OFFICERS
Philip L. Kirstein(3), Senior Vice President and Independent Compliance Officer Michael Canter(4), Vice President Shawn E. Keegan(4), Vice President Greg J. Wilensky(4) , Vice President | Emilie D. Wrapp, Secretary Joseph J. Mantineo, Treasurer and Chief Financial Officer Phyllis J. Clarke, Controller Vincent S. Noto, Chief Compliance Officer |
Custodian and Accounting Agent State Street Bank and Trust Company State Street Corporation CCB/5 1 Iron Street Boston, MA 02210
Principal Underwriter AllianceBernstein Investments, Inc. 1345 Avenue of the Americas New York, NY 10105
Transfer Agent AllianceBernstein Investor Services, Inc. P.O. Box 786003 San Antonio, TX 78278-6003 Toll-Free (800) 221-5672 | Independent Registered Public Ernst & Young LLP 5 Times Square New York, NY 10036
Legal Counsel Seward & Kissel LLP One Battery Park Plaza New York, NY 10004 |
| 1 | Member of the Audit Committee, the Governance and Nominating Committee, and the Independent Directors Committee. |
| 2 | Messrs. Dobkin and Guzy are expected to retire on or about December 31, 2017. |
| 3 | Mr. Kirstein is expected to retire on or about December 31, 2017. |
| 4 | The day-to-day management of, and investment decisions for, the Strategy’s portfolio are made by the Adviser’s U.S. Core Fixed-Income Team. Mr. Michael Canter, Mr. Shawn E. Keegan and Mr. Greg J. Wilensky are the investment professionals with the most significant responsibility for the day-to-day management of the Strategy’s portfolio. |
| abfunds.com | AB BOND INFLATION STRATEGY | 95 |
MANAGEMENT OF THE FUND
Board of Directors Information
The business and affairs of the Strategy are managed under the direction of the Board of Directors. Certain information concerning the Strategy’s Directors is set forth below.
| NAME, ADDRESS*, AGE, (YEAR FIRST ELECTED**) | PRINCIPAL AND OTHER INFORMATION*** | PORTFOLIOS DIRECTOR | OTHER DIRECTOR | |||||
| INTERESTED DIRECTOR | ||||||||
Robert M. Keith# 57 (2010) | Senior Vice President of AllianceBernstein L.P. (the “Adviser”) and the head of AllianceBernstein Investments, Inc. (“ABI”) since July 2008; Director of ABI and President of the AB Mutual Funds. Previously, he served as Executive Managing Director of ABI from December 2006 to June 2008. Prior to joining ABI in 2006, Executive Managing Director of Bernstein Global Wealth Management, and prior thereto, Senior Managing Director and Global Head of Client Service and Sales of the Adviser’s institutional investment management business since 2004. Prior thereto, he was Managing Director and Head of North American Client Service and Sales in the Adviser’s institutional investment management business with which he has been associated since prior to 2004. | 96 | None | |||||
| 96 | AB BOND INFLATION STRATEGY | abfunds.com |
MANAGEMENT OF THE FUND (continued)
| NAME, ADDRESS*, AGE, (YEAR FIRST ELECTED**) | PRINCIPAL AND OTHER INFORMATION*** | PORTFOLIOS DIRECTOR | OTHER DIRECTOR | |||||
| INDEPENDENT DIRECTORS | ||||||||
Marshall C. Turner, Jr.## Chairman of the Board 76 (2005) | Private Investor since prior to 2012. Former Chairman and CEO of Dupont Photomasks, Inc. (components of semi- conductor manufacturing). He has extensive operating leadership, and venture capital investing experience, including five interim or full-time CEO roles, and prior service as general partner of institutional venture capital partnerships. He also has extensive non-profit board leadership experience, and currently serves on the boards of two education and science-related non-profit organizations. He has served as a director of one AB Fund since 1992, and director or trustee of multiple AB Funds since 2005. He has been Chairman of the AB Funds since January 2014, and the Chairman of the Independent Directors Committees of such AB Funds since February 2014. | 96 | Xilinx, Inc. (programmable logic semi-conductors) since 2007 | |||||
John H. Dobkin##,^ 75 (1998) | Independent Consultant since prior to 2012. Formerly, President of Save Venice, Inc. (preservation organization) from 2001-2002; Senior Advisor from June 1999-June 2000 and President of Historic Hudson Valley (historic preservation) from December 1989-May 1999. Previously, Director of the National Academy of Design. He has served as a director or trustee of various AB Funds since 1992, and as Chairman of the Audit Committees of a number of such AB Funds from 2001-2008. | 95 | None | |||||
| abfunds.com | AB BOND INFLATION STRATEGY | 97 |
MANAGEMENT OF THE FUND (continued)
| NAME, ADDRESS*, AGE, (YEAR FIRST ELECTED**) | PRINCIPAL AND OTHER INFORMATION*** | PORTFOLIOS DIRECTOR | OTHER DIRECTOR | |||||
INDEPENDENT DIRECTORS (continued) | ||||||||
Michael J. Downey## 73 (2005) | Private Investor since prior to 2012. Formerly, managing partner of Lexington Capital, LLC (investment advisory firm) from December 1997 until December 2003. He served as a Director of Prospect Acquisition Corp. (financial services) from 2007 until 2009. From 1987 until 1993, Chairman and CEO of Prudential Mutual Fund Management, director of the Prudential mutual funds, and member of the Executive Committee of Prudential Securities, Inc. He has served as a director or trustee of the AB Funds since 2005 and is a director and Chairman of one other registered investment company. | 96 | The Asia Pacific Fund, Inc. (registered investment company) since prior to 2012 | |||||
William H. Foulk, Jr.## 85 (1998) | Investment Adviser and an Independent Consultant since prior to 2012. Previously, he was Senior Manager of Barrett Associates, Inc., a registered investment adviser. He was formerly Deputy Comptroller and Chief Investment Officer of the State of New York and, prior thereto, Chief Investment Officer of the New York Bank for Savings. He has served as a director or trustee of various AB Funds since 1983, and was Chairman of the Independent Directors Committees of the AB Funds from 2003 until early February 2014. He served as Chairman of such AB Funds from 2003 through December 2013. He is also active in a number of mutual fund related organizations and committees. | 96 | None | |||||
| 98 | AB BOND INFLATION STRATEGY | abfunds.com |
MANAGEMENT OF THE FUND (continued)
| NAME, ADDRESS*, AGE, (YEAR FIRST ELECTED**) | PRINCIPAL AND OTHER INFORMATION*** | PORTFOLIOS DIRECTOR | OTHER DIRECTOR | |||||
| INDEPENDENT DIRECTORS (continued) | ||||||||
D. James Guzy##,^ 81 (2005) | Chairman of the Board of SRC Computers, Inc. (semi-conductors), with which he has been associated since prior to 2012. He served as Chairman of the Board of PLX Technology (semi-conductors) since prior to 2012 until November 2013. He was a director of Intel Corporation (semi-conductors) from 1969 until 2008, and served as Chairman of the Finance Committee of such company for several years until May 2008. He has served as a director or trustee of one or more of the AB Funds since 1982. | 93 | None | |||||
Nancy P. Jacklin## 69 (2006) | Private Investor since prior to 2012. Professorial Lecturer at the Johns Hopkins School of Advanced International Studies (2008-2015). U.S. Executive Director of the International Monetary Fund (which is responsible for ensuring the stability of the international monetary system), (December 2002-May 2006); Partner, Clifford Chance (1992-2002); Sector Counsel, International Banking and Finance, and Associate General Counsel, Citicorp (1985-1992); Assistant General Counsel (International), Federal Reserve Board of Governors (1982-1985); and Attorney Advisor, U.S. Department of the Treasury (1973-1982). Member of the Bar of the District of Columbia and of New York; and member of the Council on Foreign Relations. She has served as a director or trustee of the AB Funds since 2006 and has been Chairman of the Governance and Nominating Committees of the AB Funds since August 2014. | 96 | None | |||||
| abfunds.com | AB BOND INFLATION STRATEGY | 99 |
MANAGEMENT OF THE FUND (continued)
| NAME, ADDRESS*, AGE, (YEAR FIRST ELECTED**) | PRINCIPAL AND OTHER INFORMATION*** | PORTFOLIOS DIRECTOR | OTHER DIRECTOR | |||||
| INDEPENDENT DIRECTORS (continued) | ||||||||
Carol C. McMullen## 62 (2016) | Managing Director of Slalom Consulting (consulting) since 2014, private investor and member of the Partners Healthcare Investment Committee. Formerly, Director of Norfolk & Dedham Group (mutual property and casualty insurance) from 2011 until November 2016; Director of Partners Community Physicians Organization (healthcare) from 2014 until December 2016; and Managing Director of The Crossland Group (consulting) from 2012 until 2013. She has held a number of senior positions in the asset and wealth management industries, including at Eastern Bank (where her roles included President of Eastern Wealth Management), Thomson Financial (Global Head of Sales for Investment Management), and Putnam Investments (where her roles included Head of Global Investment Research). She has served on a number of private company and nonprofit boards, and as a director or trustee of the AB Funds since June 2016. | 96 | None | |||||
| 100 | AB BOND INFLATION STRATEGY | abfunds.com |
MANAGEMENT OF THE FUND (continued)
| NAME, ADDRESS*, AGE, (YEAR FIRST ELECTED**) | PRINCIPAL AND OTHER INFORMATION*** | PORTFOLIOS DIRECTOR | OTHER DIRECTOR | |||||
| INDEPENDENT DIRECTORS (continued) | ||||||||
Garry L. Moody## 65 (2008) | Independent Consultant. Formerly, Partner, Deloitte & Touche LLP (1995-2008) where he held a number of senior positions, including Vice Chairman, and U.S. and Global Investment Management Practice Managing Partner; President, Fidelity Accounting and Custody Services Company (1993-1995), where he was responsible for accounting, pricing, custody and reporting for the Fidelity mutual funds; and Partner, Ernst & Young LLP (1975-1993), where he served as the National Director of Mutual Fund Tax Services and Managing Partner of its Chicago Office Tax department. He is a member of the Trustee Advisory Board of BoardlQ, a biweekly publication focused on issues and news affecting directors of mutual funds. He has served as a director or trustee, and as Chairman of the Audit Committees, of the AB Funds since 2008. | 96 | None | |||||
Earl D. Weiner## 78 (2007) | Of Counsel, and Partner prior to January 2007, of the law firm Sullivan & Cromwell LLP and is a former member of the ABA Federal Regulation of Securities Committee Task Force to draft editions of the Fund Director’s Guidebook. He also serves as a director or trustee of various non-profit organizations and has served as Chairman or Vice Chairman of a number of them. He has served as a director or trustee of the AB Funds since 2007 and served as Chairman of the Governance and Nominating Committees of the AB Funds from 2007 until August 2014. | 96 | None | |||||
| abfunds.com | AB BOND INFLATION STRATEGY | 101 |
MANAGEMENT OF THE FUND (continued)
| * | The address for each of the Strategy’s disinterested Directors is c/o AllianceBernstein L.P., Attention: Office of the Senior Officer, 1345 Avenue of the Americas, New York, NY 10105. |
| ** | There is no stated term of office for the Strategy’s Directors. |
| *** | The information above includes each Director’s principal occupation during the last five years and other information relating to the experience, attributes and skills relevant to each Director’s qualifications to serve as a Director, which led to the conclusion that each Director should serve as a Director for the Strategy. |
| # | Mr. Keith is an “interested person” of the Strategy as defined in the “40 Act”, due to his position as a Senior Vice President of the Adviser. |
| ## | Member of the Audit Committee, the Governance and Nominating Committee and the Independent Directors Committee. |
| ^ | Messrs. Dobkin and Guzy are expected to retire on or about December 31, 2017. |
| 102 | AB BOND INFLATION STRATEGY | abfunds.com |
MANAGEMENT OF THE FUND (continued)
Officer Information
Certain information concerning the Strategy’s Officers is listed below.
| NAME, ADDRESS* AND AGE | PRINCIPAL HELD WITH FUND | PRINCIPAL OCCUPATION DURING PAST 5 YEARS | ||
| Robert M. Keith 57 | President and Chief Executive Officer | See biography above. | ||
| Philip L. Kirstein^ 72 | Senior Vice President and Independent Compliance Officer | Senior Vice President and Independent Compliance Officer of the AB Funds, with which he has been associated since October 2004. Prior thereto, he was Of Counsel to Kirkpatrick & Lockhart, LLP from October 2003 to October 2004, and General Counsel of Merrill Lynch Investment Managers, L.P. since prior to March 2003. | ||
Michael Canter 48 | Vice President | Senior Vice President of the Adviser,** with which he has been associated since prior to 2012. | ||
Shawn E. Keegan 46 | Vice President | Senior Vice President of the Adviser,** with which he has been associated since prior to 2012. | ||
Greg J. Wilensky 50 | Vice President | Senior Vice President of the Adviser,** with which he has been associated since prior to 2012. | ||
| Emilie D. Wrapp 62 | Secretary | Senior Vice President, Assistant General Counsel and Assistant Secretary of ABI,** with which she has been associated since prior to 2012. | ||
| Joseph J. Mantineo 58 | Treasurer and Chief Financial Officer | Senior Vice President of AllianceBernstein Investor Services, Inc. (“ABIS”),** with which he has been associated since prior to 2012. | ||
| Phyllis J. Clarke 56 | Controller | Vice President of ABIS,** with which she has been associated since prior to 2012. | ||
| Vincent S. Noto 53 | Chief Compliance Officer | Senior Vice President since 2015 and Mutual Fund Chief Compliance Officer of the Adviser** since 2014. Prior thereto, he was Vice President and Director of Mutual Fund Compliance of the Adviser** since prior to 2012. |
| * | The address for each of the Fund’s Officers is 1345 Avenue of the Americas, New York, NY 10105. |
| ** | The Adviser, ABI and ABIS are affiliates of the Strategy. |
| ^ | Mr. Kirstein is expected to retire on or about December 31, 2017. |
The Fund’s Statement of Additional Information (“SAI”) has additional information about the Strategy’s Directors and Officers and is available without charge upon request. Contact your financial representative or AB at 1-800-227-4618, or visit www.abfunds.com, for a free prospectus or SAI.
| abfunds.com | AB BOND INFLATION STRATEGY | 103 |
Information Regarding the Review and Approval of the Fund’s Advisory Agreement
The disinterested directors (the “directors”) of AB Bond Fund, Inc. (the “Company”) unanimously approved the continuance of the Company’s Advisory Agreement with the Adviser in respect of AB Bond Inflation Strategy (the “Fund”) at a meeting held on November 1-3, 2016 (the “Meeting”).
Prior to approval of the continuance of the Advisory Agreement, the directors had requested from the Adviser, and received and evaluated, extensive materials. They reviewed the proposed continuance of the Advisory Agreement with the Adviser and with experienced counsel who are independent of the Adviser, who advised on the relevant legal standards. The directors also reviewed an independent evaluation prepared by the Company’s Senior Officer (who is also the Company’s Independent Compliance Officer) of the reasonableness of the advisory fee, in which the Senior Officer concluded that the contractual fee for the Fund was reasonable. The directors also discussed the proposed continuance in private sessions with counsel and the Company’s Senior Officer.
The directors considered their knowledge of the nature and quality of the services provided by the Adviser to the Fund gained from their experience as directors or trustees of most of the registered investment companies advised by the Adviser, their overall confidence in the Adviser’s integrity and competence they have gained from that experience, the Adviser’s initiative in identifying and raising potential issues with the directors and its responsiveness, frankness and attention to concerns raised by the directors in the past, including the Adviser’s willingness to consider and implement organizational and operational changes designed to improve investment results and the services provided to the AB Funds. The directors noted that they have four regular meetings each year, at each of which they receive presentations from the Adviser on the investment results of the Fund and review extensive materials and information presented by the Adviser.
The directors also considered all other factors they believed relevant, including the specific matters discussed below. In their deliberations, the directors did not identify any particular information that was all-important or controlling, and different directors may have attributed different weights to the various factors. The directors determined that the selection of the Adviser to manage the Fund and the overall arrangements between the Fund and the Adviser, as provided in the Advisory Agreement, including the advisory fee, were fair and reasonable in light of the services performed, expenses incurred and such other matters as the directors considered relevant in the exercise of their business judgment. The material factors and conclusions that formed the basis for the directors’ determinations included the following:
Nature, Extent and Quality of Services Provided
The directors considered the scope and quality of services provided by the Adviser under the Advisory Agreement, including the quality of the investment
| 104 | AB BOND INFLATION STRATEGY | abfunds.com |
research capabilities of the Adviser and the other resources it has dedicated to performing services for the Fund. They also noted the professional experience and qualifications of the Fund’s portfolio management team and other senior personnel of the Adviser. The directors also considered that the Advisory Agreement provides that the Fund will reimburse the Adviser for the cost to it of providing certain clerical, accounting, administrative and other services to the Fund by employees of the Adviser or its affiliates. Requests for these reimbursements are made on a quarterly basis and subject to approval by the directors. Reimbursements, to the extent requested and paid, result in a higher rate of total compensation from the Fund to the Adviser than the fee rate stated in the Advisory Agreement. The directors noted that the methodology used to determine the reimbursement amounts had been reviewed by an independent consultant retained by the Company’s Senior Officer. The quality of administrative and other services, including the Adviser’s role in coordinating the activities of the Fund’s other service providers, also was considered. The directors concluded that, overall, they were satisfied with the nature, extent and quality of services provided to the Fund under the Advisory Agreement.
Costs of Services Provided and Profitability
The directors reviewed a schedule of the revenues and expenses and related notes indicating the profitability of the Fund to the Adviser for calendar years 2014 and 2015 that had been prepared with an expense allocation methodology arrived at in consultation with an independent consultant retained by the Company’s Senior Officer. The directors noted the assumptions and methods of allocation used by the Adviser in preparing fund-specific profitability data and understood that there are a number of potentially acceptable allocation methodologies for information of this type. The directors noted that the profitability information reflected all revenues and expenses of the Adviser’s relationship with the Fund, including those relating to its subsidiaries that provide transfer agency and distribution services to the Fund. The directors recognized that it is difficult to make comparisons of the profitability of the Advisory Agreement with the profitability of fund advisory contracts for unaffiliated funds because comparative information is not generally publicly available and is affected by numerous factors. The directors focused on the profitability of the Adviser’s relationship with the Fund before taxes and distribution expenses. The directors concluded that the Adviser’s level of profitability from its relationship with the Fund in 2014 was not unreasonable. The directors noted that the Fund was not profitable to the Adviser in 2015.
Fall-Out Benefits
The directors considered the other benefits to the Adviser and its affiliates from their relationships with the Fund, including, but not limited to, benefits relating to 12b-1 fees and sales charges received by the Fund’s principal underwriter (which is a wholly owned subsidiary of the Adviser) in respect of certain classes of the Fund’s shares; and transfer agency fees paid by
| abfunds.com | AB BOND INFLATION STRATEGY | 105 |
the Fund to a wholly owned subsidiary of the Adviser. The directors recognized that the Fund’s recent unprofitability to the Adviser would be exacerbated without these benefits. The directors understood that the Adviser also might derive reputational and other benefits from its association with the Fund.
Investment Results
In addition to the information reviewed by the directors in connection with the Meeting, the directors receive detailed performance information for the Fund at each regular Board meeting during the year.
At the Meeting, the directors reviewed information prepared by Broadridge Financial Solutions, Inc. (“Broadridge”), an analytical service that is not affiliated with the Adviser, showing the performance of the Class A Shares of the Fund against a peer group and a peer universe selected by Broadridge, and information prepared by the Adviser showing performance of the Class A Shares against a broad-based securities market index, in each case for the 1-, 3- and 5-year periods ended July 31, 2016 and (in the case of comparisons with the broad-based securities market index) for the period from inception. Based on their review, the directors concluded that the Fund’s investment performance was acceptable.
Advisory Fees and Other Expenses
The directors considered the advisory fee rate paid by the Fund to the Adviser and information prepared by Broadridge concerning advisory fee rates paid by other funds in the same Broadridge category as the Fund at a common asset level. The directors recognized that it is difficult to make comparisons of advisory fees because there are variations in the services that are included in the fees paid by other funds. The directors compared the Fund’s contractual effective advisory fee rate with a peer group median and took into account the impact on the advisory fee rate of the administrative expense reimbursement paid to the Adviser in the latest fiscal year.
The directors also considered the Adviser’s fee schedule for institutional clients pursuing a similar investment style. For this purpose, they reviewed the relevant advisory fee information from the Adviser’s Form ADV and the evaluation from the Company’s Senior Officer and noted the differences between the Fund’s fee schedule, on the one hand, and the institutional fee schedule and the schedule of fees charged to any offshore funds and any sub-advised funds, on the other. The directors noted that the Adviser may, in some cases, agree to fee rates with large institutional clients that are lower than those reviewed by the directors and that they had previously discussed with the Adviser its policies in respect of such arrangements.
The Adviser reviewed with the directors the significantly greater scope of the services it provides to the Fund relative to institutional, offshore fund and sub-advised fund clients. In light of the substantial differences in services
| 106 | AB BOND INFLATION STRATEGY | abfunds.com |
rendered by the Adviser to institutional, offshore fund and sub-advised fund clients as compared to funds such as the Fund, the directors considered these fee comparisons inapt and did not place significant weight on them in their deliberations.
The directors also considered the total expense ratio of the Class A shares of the Fund in comparison to a peer group and a peer universe selected by Broadridge. The Class A expense ratio of the Fund was based on the Fund’s latest fiscal year and the information included the pro forma expense ratio to reflect a reduction in the 12b-1 fee effective February 1, 2016. The directors noted the effects of any fee waivers and/or expense reimbursements as a result of an undertaking by the Adviser. The directors noted that it was likely that the expense ratios of some of the other funds in the Fund’s Broadridge category were lowered by waivers or reimbursements by those funds’ investment advisers, which in some cases might be voluntary or temporary. The directors view expense ratio information as relevant to their evaluation of the Adviser’s services because the Adviser is responsible for coordinating services provided to the Fund by others. Based on their review, the directors concluded that the Fund’s pro forma expense ratio was acceptable.
Economies of Scale
The directors noted that the advisory fee schedule for the Fund contains breakpoints that reduce the fee rates on assets above specified levels. The directors took into consideration prior presentations by an independent consultant on economies of scale in the mutual fund industry and for the AB Funds, and by the Adviser concerning certain of its views on economies of scale. The directors also had requested and received from the Adviser certain updates on economies of scale in advance of the Meeting. The directors believe that economies of scale may be realized (if at all) by the Adviser across a variety of products and services, and not only in respect of a single fund. The directors noted that there is no established methodology for setting breakpoints that give effect to the fund-specific services provided by a fund’s adviser and to the economies of scale that an adviser may realize in its overall mutual fund business or those components of it which directly or indirectly affect a fund’s operations. The directors observed that in the mutual fund industry as a whole, as well as among funds similar to the Fund, there is no uniformity or pattern in the fees and asset levels at which breakpoints (if any) apply. The directors also noted that the advisory agreements for many funds do not have breakpoints at all. Having taken these factors into account, the directors concluded that the Fund’s shareholders would benefit from a sharing of economies of scale in the event the Fund’s net assets exceed a breakpoint in the future.
| abfunds.com | AB BOND INFLATION STRATEGY | 107 |
This page is not part of the Shareholder Report or the Financial Statements.
AB FAMILY OF FUNDS
US EQUITY
US CORE
Core Opportunities Fund
FlexFee™ US Thematic Portfolio
Select US Equity Portfolio
US GROWTH
Concentrated Growth Fund
Discovery Growth Fund
FlexFee™ Large Cap Growth Portfolio
Growth Fund
Large Cap Growth Fund
Small Cap Growth Portfolio
US VALUE
Discovery Value Fund
Equity Income Fund
Relative Value Fund1
Small Cap Value Portfolio
Value Fund
INTERNATIONAL/ GLOBAL EQUITY
INTERNATIONAL/ GLOBAL CORE
Global Core Equity Portfolio
International Portfolio
International Strategic Core Portfolio
Sustainable Global Thematic Fund1
Tax-Managed International Portfolio
Tax-Managed Wealth Appreciation Strategy
Wealth Appreciation Strategy
INTERNATIONAL/ GLOBAL GROWTH
Concentrated International Growth Portfolio
International Growth Fund
INTERNATIONAL/ GLOBAL EQUITY (continued)
INTERNATIONAL/ GLOBAL VALUE
Asia ex-Japan Equity Portfolio
International Value Fund
FIXED INCOME
MUNICIPAL
High Income Municipal Portfolio
Intermediate California Municipal Portfolio
Intermediate Diversified Municipal Portfolio
Intermediate New York Municipal Portfolio
Municipal Bond Inflation Strategy
Tax-Aware Fixed Income Portfolio
National Portfolio
Arizona Portfolio
California Portfolio
Massachusetts Portfolio
Minnesota Portfolio
New Jersey Portfolio
New York Portfolio
Ohio Portfolio
Pennsylvania Portfolio
Virginia Portfolio
TAXABLE
Bond Inflation Strategy
FlexFee™ International Bond Portfolio
Global Bond Fund
High Income Fund
High Yield Portfolio
Income Fund
Intermediate Bond Portfolio
Limited Duration High Income Portfolio
Short Duration Portfolio
ALTERNATIVES
All Market Real Return Portfolio
Credit Long/Short Portfolio
Global Real Estate Investment Fund
Select US Long/Short Portfolio
Unconstrained Bond Fund
MULTI-ASSET
All Market Income Portfolio
All Market Total Return Portfolio1
Conservative Wealth Strategy
Emerging Markets Multi-Asset Portfolio
Global Risk Allocation Fund
Tax-Managed All Market Income Portfolio1
TARGET-DATE
Multi-Manager Select Retirement Allocation Fund
Multi-Manager Select 2010 Fund
Multi-Manager Select 2015 Fund
Multi-Manager Select 2020 Fund
Multi-Manager Select 2025 Fund
Multi-Manager Select 2030 Fund
Multi-Manager Select 2035 Fund
Multi-Manager Select 2040 Fund
Multi-Manager Select 2045 Fund
Multi-Manager Select 2050 Fund
Multi-Manager Select 2055 Fund
CLOSED-END FUNDS
Alliance California Municipal Income Fund
AllianceBernstein Global High Income Fund
AllianceBernstein National Municipal Income Fund
We also offer Government Money Market Portfolio1, which serves as the money market fund exchange vehicle for the AB mutual funds. An investment in Government Money Market Portfolio is not a deposit in a bank and is not insured or guaranteed by the Federal Deposit Insurance Corporation or any other government agency. Although the Fund seeks to preserve the value of your investment at $1.00 per share, it is possible to lose money by investing in the Fund.
Investors should consider the investment objectives, risks, charges and expenses of the Fund carefully before investing. For copies of our prospectus or summary prospectus, which contain this and other information, visit us online at www.abfunds.com or contact your AB representative. Please read the prospectus and/or summary prospectus carefully before investing.
| 1 | Prior to January 9, 2017, Relative Value Fund was named Growth & Income Fund; prior to April 17, 2017, Tax-Managed All Market Income Portfolio was named Tax-Managed Balanced Wealth Strategy; prior to April 24, 2017, All Market Total Return Portfolio was named Balanced Wealth Strategy; prior to November 10, 2017, Government Money Market Portfolio was named Government Exchange Reserves. |
| 108 | AB BOND INFLATION STRATEGY | abfunds.com |
AB BOND INFLATION STRATEGY
1345 Avenue of the Americas
New York, NY 10105
800 221 5672
BIS-0151-1017 
OCT 10.31.17

ANNUAL REPORT
AB CREDIT LONG/SHORT PORTFOLIO


| Investment Products Offered | • Are Not FDIC Insured • May Lose Value • Are Not Bank Guaranteed | |
Investors should consider the investment objectives, risks, charges and expenses of the Fund carefully before investing. For copies of our prospectus or summary prospectus, which contain this and other information, visit us online at www.abfunds.com or contact your AB representative. Please read the prospectus and/or summary prospectus carefully before investing.
This shareholder report must be preceded or accompanied by the Fund’s prospectus for individuals who are not current shareholders of the Fund.
You may obtain a description of the Fund’s proxy voting policies and procedures, and information regarding how the Fund voted proxies relating to portfolio securities during the most recent 12-month period ended June 30, without charge. Simply visit AB’s website at www.abfunds.com, or go to the Securities and Exchange Commission’s (the “Commission”) website at www.sec.gov, or call AB at (800) 227 4618.
The Fund files its complete schedule of portfolio holdings with the Commission for the first and third quarters of each fiscal year on Form N-Q. The Fund’s Forms N-Q are available on the Commission’s website at www.sec.gov. The Fund’s Forms N-Q may also be reviewed and copied at the Commission’s Public Reference Room in Washington, DC; information on the operation of the Public Reference Room may be obtained by calling (800) SEC 0330. AB publishes full portfolio holdings for the Fund monthly at www.abfunds.com.
AllianceBernstein Investments, Inc. (ABI) is the distributor of the AB family of mutual funds. ABI is a member of FINRA and is an affiliate of AllianceBernstein L.P., the Adviser of the funds.
The [A/B] logo is a registered service mark of AllianceBernstein and AllianceBernstein® is a registered service mark used by permission of the owner, AllianceBernstein L.P.
| FROM THE PRESIDENT |  |
Dear Shareholder,
We are pleased to provide this report for AB Credit Long/Short Portfolio (the “Fund”). Please review the discussion of Fund performance, the market conditions during the reporting period and the Fund’s investment strategy.
As always, AB strives to keep clients ahead of what’s next by:
| + | Transforming uncommon insights into uncommon knowledge with a global research scope |
| + | Navigating markets with seasoned investment experience and sophisticated solutions |
| + | Providing thoughtful investment insights and actionable ideas |
Whether you’re an individual investor or a multi-billion-dollar institution, we put knowledge and experience to work for you.
AB’s global research organization connects and collaborates across platforms and teams to deliver impactful insights and innovative products. Better insights lead to better opportunities—anywhere in the world.
For additional information about AB’s range of products and shareholder resources, please log on to www.abfunds.com.
Thank you for your investment in the AB Mutual Funds.
Sincerely,

Robert M. Keith
President and Chief Executive Officer, AB Mutual Funds
| abfunds.com | AB CREDIT LONG/SHORT PORTFOLIO | 1 |
ANNUAL REPORT
December 15, 2017
This report provides management’s discussion of fund performance for AB Credit Long/Short Portfolio for the annual reporting period ended October 31, 2017.
The Fund’s investment objective is to seek absolute return over a full market cycle.
NAV RETURNS AS OF OCTOBER 31, 2017 (unaudited)
| 6 Months | 12 Months | |||||||
| AB CREDIT LONG/SHORT PORTFOLIO1 | ||||||||
| Class A Shares | -3.88% | -3.45% | ||||||
| Class C Shares | -4.26% | -4.21% | ||||||
| Advisor Class Shares2 | -3.76% | -3.24% | ||||||
| BofA ML 3-Month US T-Bill Index | 0.49% | 0.72% | ||||||
| 1 | Includes the impact of proceeds received and credited to the Fund resulting from class action settlements, which enhanced the performance of all share classes of the Fund for the six- and 12-month periods ended October 31, 2017, by 0.00% and 0.02%, respectively. |
| 2 | Please note that this share class is for investors purchasing shares through accounts established under certain fee-based programs sponsored and maintained by certain broker-dealers and financial intermediaries, institutional pension plans and/or investment advisory clients of, and certain other persons associated with, the Adviser and its affiliates or the Fund. |
INVESTMENT RESULTS
The table above shows the Fund’s performance compared to its benchmark, the Bank of America Merrill Lynch (“BofA ML”) 3-Month US Treasury Bill (“T-Bill”) Index, for the six- and 12-month periods ended October 31, 2017.
During both periods, all share classes of the Fund underperformed the benchmark, before sales charges. Underperformance versus the benchmark for both periods was driven by losses on single-name, directional positions and capital structure relative value positions. During the six-month period, there was a broad rally in credit markets, with little differentiation across sectors. The lack of relative movements between credit instruments was a headwind to the Fund’s performance.
During both periods, the Fund utilized derivatives including currency forwards to hedge currency exposure as well as to manage active currency risk, which detracted from absolute returns. Purchased and written equity options were also used to hedge market exposure and for investment purposes, and detracted from returns. Total return swaps were used to hedge and take active risk, and added to performance. Credit default swaps, both single name and index, were used to hedge credit risk as well as to take active credit risk, and detracted from returns. Futures were used for both hedging and investment purposes, and added to performance. Interest rate swaps were used for hedging purposes, specifically to manage duration, and had no material impact on returns.
| 2 | AB CREDIT LONG/SHORT PORTFOLIO | abfunds.com |
MARKET REVIEW AND INVESTMENT STRATEGY
Over the 12-month period, global credit markets rallied strongly. Following the US presidential election, a broad reflationary theme took hold across global financial markets, with equities and credit spreads rallying strongly and a mixed result for global interest rates. During this time, the Fund employed a variety of relative value focused strategies intended to take advantage of mispricings across credit assets, as opposed to taking outright, directional positions. With increasingly stretched valuations, the Fund was positioned with a broadly neutral risk allocation.
INVESTMENT POLICIES
At least 80% of the Fund’s net assets will under normal circumstances be invested in long and short positions in credit-related instruments. For purposes of this 80% requirement, credit-related instruments will include any type of fixed-income security, such as corporate bonds, convertible fixed-income securities, preferred stocks, US government and agency securities, securities of foreign governments and supranational entities, mortgage-related and asset-backed securities and loan participations. It is expected that a substantial portion of the Fund’s long and short positions will relate to fixed-income securities rated below investment-grade (commonly known as “junk bonds”).
In selecting securities for purchase or sale by the Fund and securities for the Fund to take short positions in, the Adviser will attempt to take advantage of inefficiencies that it believes exist in the global debt markets. These inefficiencies arise from investor behavior, market complexity and the investment limitations to which investors are subject. The Adviser will combine quantitative analysis with fundamental credit and economic research in seeking to exploit these inefficiencies.
Under normal market conditions, the net exposure of the Fund (long exposure minus short exposure) will range between 150% and -150%. For example, the Fund may hold long positions in fixed-income securities with a value equal to 95% of its net assets and hold short positions equal to 75% of its net assets, resulting in 20% net long exposure. The Fund may also take long and short positions in equity securities.
Short positions may be effectuated through derivative instruments or through conventional short sales. When the Fund sells securities short, it sells a security that it does not own (but has borrowed) at its current market price in anticipation that the price of the security will decline. To complete, or close out, the short sale transaction, the Fund buys the same security in the market at a later date and returns it to the
(continued on next page)
| abfunds.com | AB CREDIT LONG/SHORT PORTFOLIO | 3 |
lender. The Adviser expects that the Fund’s long positions will be effectuated both through derivatives and actual purchases of fixed-income securities. The Fund may invest in fixed-income securities with a range of maturities from short- to long-term, and expects to maintain a weighted average duration of between -3 and 6 years. The Fund would have a negative duration when the Adviser expects the value of the Fund’s assets to increase as interest rates rise.
While the Fund’s investments will be focused on US dollar-denominated securities, the Fund may invest to a lesser extent in securities denominated in foreign currencies. Fluctuations in currency exchange rates can have a dramatic impact on the returns of fixed-income securities. While the Adviser may hedge the foreign currency exposure resulting from the Fund’s security positions through the use of currency-related derivatives, it is not required to do so. The Fund may take long and short positions in currencies (or related derivatives) independent of any such security positions, including taking a position in a currency when it does not hold any securities denominated in that currency.
The Fund expects to use derivatives, such as options, futures contracts, forwards and swaps, to a significant extent. Derivatives may provide a more efficient and economical exposure to market segments than direct investments, and may also be a more efficient way to alter the Fund’s exposure. The Fund may, for example, use credit default, interest rate and total return swaps to establish exposure to the fixed-income markets or particular fixed-income securities and, as noted above, may use currency derivatives to hedge foreign currency exposure.
The Fund may borrow money and enter into transactions such as reverse repurchase agreements that are similar to borrowings (in addition to the borrowing of securities inherent in short sale transactions) for investment purposes. As a result of these borrowing transactions and the use of derivatives, the Fund will at times be highly leveraged, with aggregate exposure (long and short) substantially in excess of its net assets.
The Fund is “non-diversified”, which means that it may concentrate its assets in a smaller number of issuers than a diversified fund.
| 4 | AB CREDIT LONG/SHORT PORTFOLIO | abfunds.com |
DISCLOSURES AND RISKS
Benchmark Disclosure
The BofA ML® 3-Month US T-Bill Index is unmanaged and does not reflect fees and expenses associated with the active management of a mutual fund portfolio. The BofA ML 3-Month US T-Bill Index measures the performance of Treasury securities maturing in 90 days. An investor cannot invest directly in an index, and its results are not indicative of the performance for any specific investment, including the Fund.
A Word About Risk
Market Risk: The value of the Fund’s assets will fluctuate as the bond or stock market fluctuates. The value of its investments may decline, sometimes rapidly and unpredictably, simply because of economic changes or other events that affect large portions of the market.
Interest Rate Risk: Changes in interest rates will affect the value of investments in fixed-income securities. When interest rates rise, the value of existing investments in fixed-income securities tends to fall and this decrease in value may not be offset by higher income from new investments. The Fund may be subject to heightened interest rate risk due to rising rates as the current period of historically low interest rates may be ending. Interest rate risk is generally greater for fixed-income securities with longer maturities or durations.
Credit Risk: An issuer or guarantor of a fixed-income security, or the counterparty to a derivatives or other contract, may be unable or unwilling to make timely payments of interest or principal, or to otherwise honor its obligations. The issuer or guarantor may default, causing a loss of the full principal amount of a security and accrued interest. The degree of risk for a particular security may be reflected in its credit rating. There is the possibility that the credit rating of a fixed-income security may be downgraded after purchase, which may adversely affect the value of the security.
Below Investment Grade Securities Risk: Investments in fixed-income securities with lower ratings (commonly known as “junk bonds”) are subject to a higher probability that an issuer will default or fail to meet its payment obligations. These securities may be subject to greater price volatility due to such factors as specific corporate developments, negative perceptions of the junk bond market generally and less secondary market liquidity.
Duration Risk: Duration is a measure that relates the expected price volatility of a fixed-income security to changes in interest rates. The duration of a fixed-income security may be shorter than or equal to full maturity of a fixed-income security. Fixed-income securities with longer durations have more risk and will decrease in price as interest rates rise. For example, a fixed-income security with a duration of three years will decrease in value by approximately 3% if interest rates increase by 1%.
| abfunds.com | AB CREDIT LONG/SHORT PORTFOLIO | 5 |
DISCLOSURES AND RISKS (continued)
Inflation Risk: This is the risk that the value of assets or income from investments will be less in the future as inflation decreases the value of money. As inflation increases, the value of the Fund’s assets can decline as can the value of the Fund’s distributions. This risk is significantly greater if the Fund invests a significant portion of its assets in fixed-income securities with longer maturities.
Derivatives Risk: Derivatives may be illiquid, difficult to price, and leveraged so that small changes may produce disproportionate losses for the Fund, and may be subject to counterparty risk to a greater degree than more traditional investments.
Leverage Risk: To the extent the Fund uses leveraging techniques, its net asset value (“NAV”) may be more volatile because leverage tends to exaggerate the effect of changes in interest rates and any increase or decrease in the value of the Fund’s investments.
Short Sale Risk: Short sales involve the risk that the Fund will incur a loss by subsequently buying a security at a higher price than the price at which it sold the security. The amount of such loss is theoretically unlimited, as it will be based on the increase in value of the security sold short. In contrast, the risk of loss from a long position is limited to the Fund’s investment in the security, because the price of the security cannot fall below zero. The Fund may not always be able to close out a short position on favorable terms.
Foreign (Non-US) Risk: Investments in securities of non-US issuers may involve more risk than those of US issuers. These securities may fluctuate more widely in price and may be less liquid due to adverse market, economic, political, regulatory or other factors.
Emerging Market Risk: Investments in emerging-market countries may have more risk because the markets are less developed and less liquid, and because these investments may be subject to increased economic, political, regulatory or other uncertainties.
Currency Risk: Fluctuations in currency exchange rates may negatively affect the value of the Fund’s investments or reduce its returns.
Non-Diversification Risk: The Fund may have more risk because it is “non-diversified”, meaning that it can invest more of its assets in a smaller number of issuers. Accordingly, changes in the value of a single security may have a more significant effect, either negative or positive, on the Fund’s NAV.
| 6 | AB CREDIT LONG/SHORT PORTFOLIO | abfunds.com |
DISCLOSURES AND RISKS (continued)
Liquidity Risk: Liquidity risk occurs when certain investments become difficult to purchase or sell. Difficulty in selling less liquid securities may result in sales at disadvantageous prices affecting the value of your investment in the Fund. Causes of liquidity risk may include low trading volumes, large positions and heavy redemptions of Fund shares. Over recent years liquidity risk has also increased because the capacity of dealers in the secondary market for fixed-income securities to make markets in these securities has decreased, even as the overall bond market has grown significantly, due to, among other things, structural changes, additional regulatory requirements and capital and risk restraints that have led to reduced inventories. Liquidity risk may be higher in a rising interest rate environment, when the value and liquidity of fixed-income securities generally decline.
Management Risk: The Fund is subject to management risk because it is an actively managed investment fund. The Adviser will apply its investment techniques and risk analyses in making investment decisions, but there is no guarantee that its techniques will produce the intended results.
These risks are fully discussed in the Fund’s prospectus. As with all investments, you may lose money by investing in the Fund.
An Important Note About Historical Performance
The investment return and principal value of an investment in the Fund will fluctuate, so that shares, when redeemed, may be worth more or less than their original cost. Performance shown in this report represents past performance and does not guarantee future results. Current performance may be lower or higher than the performance information shown. You may obtain performance information current to the most recent month-end by visiting www.abfunds.com.
All fees and expenses related to the operation of the Fund have been deducted. NAV returns do not reflect sales charges; if sales charges were reflected, the Fund’s quoted performance would be lower. SEC returns reflect the applicable sales charges for each share class: a 4.25% maximum front-end sales charge for Class A shares and a 1% 1-year contingent deferred sales charge for Class C shares. Returns for the different share classes will vary due to different expenses associated with each class. Performance assumes reinvestment of distributions and does not account for taxes.
| abfunds.com | AB CREDIT LONG/SHORT PORTFOLIO | 7 |
HISTORICAL PERFORMANCE
GROWTH OF A $10,000 INVESTMENT IN THE FUND (unaudited)
5/7/20141 TO 10/31/2017
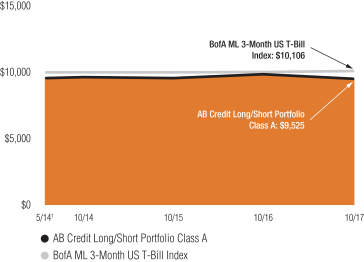
This chart illustrates the total value of an assumed $10,000 investment in AB Credit Long/Short Portfolio Class A shares (from 5/7/20141 to 10/31/2017) as compared to the performance of the Fund’s benchmark. The chart reflects the deduction of the maximum 4.25% sales charge from the initial $10,000 investment in the Fund and assumes the reinvestment of dividends and capital gains distributions.
| 1 | Inception date: 5/7/2014. |
| 8 | AB CREDIT LONG/SHORT PORTFOLIO | abfunds.com |
HISTORICAL PERFORMANCE (continued)
AVERAGE ANNUAL RETURNS AS OF OCTOBER 31, 2017 (unaudited)
| NAV Returns | SEC Returns (reflects applicable | SEC Yields1 | ||||||||||
| CLASS A SHARES | -4.98% | |||||||||||
| 1 Year | -3.45% | -7.56% | ||||||||||
| Since Inception2 | -0.16% | -1.39% | ||||||||||
| CLASS C SHARES | -5.56% | |||||||||||
| 1 Year | -4.21% | -5.16% | ||||||||||
| Since Inception2 | -0.91% | -0.91% | ||||||||||
| ADVISOR CLASS SHARES3 | -4.57% | |||||||||||
| 1 Year | -3.24% | -3.24% | ||||||||||
| Since Inception2 | 0.08% | 0.08% | ||||||||||
The Fund’s prospectus fee table shows the Fund’s total annual operating expense ratios as 9.03%, 9.83% and 8.76% for Class A, Class C and Advisor Class shares, respectively, gross of any fee waivers or expense reimbursements. Contractual fee waivers and/or expense reimbursements limit the Fund’s annual operating expense ratios exclusive of expenses associated with securities sold short, acquired fund fees and expenses other than the advisory fees of any AB mutual funds in which the Fund may invest, interest expense, extraordinary expenses, brokerage commission and other transaction costs to 1.24%, 1.99% and 0.99% for Class A, Class C and Advisor Class shares, respectively. These waivers/reimbursements may not be terminated before January 31, 2018 and may be extended by the Adviser for additional one-year terms. Any fees waived and expenses borne by the Adviser may be reimbursed by the Fund until the end of the third fiscal year after the fiscal period in which the fee was waived or the expense was borne, provided that no reimbursement payment will be made that would cause the Fund’s total annual operating expenses to exceed the expense limitations. Absent reimbursements or waivers, performance would have been lower. The Financial Highlights section of this report sets forth expense ratio data for the current reporting period; the expense ratios shown above may differ from the expense ratios in the Financial Highlights sections since they are based on different time periods.
| 1 | SEC yields are calculated based on SEC guidelines for the 30-day period ended October 31, 2017. |
| 2 | Inception date: 5/7/2014. |
| 3 | This share class is offered at NAV to eligible investors and the SEC returns are the same as the NAV returns. Please note that this share class is for investors purchasing shares through accounts established under certain fee-based programs sponsored and maintained by certain broker-dealers and financial intermediaries, institutional pension plans and/or investment advisory clients of, and certain other persons associated with, the Adviser and its affiliates or the Fund. |
| abfunds.com | AB CREDIT LONG/SHORT PORTFOLIO | 9 |
HISTORICAL PERFORMANCE (continued)
SEC AVERAGE ANNUAL RETURNS
AS OF THE MOST RECENT CALENDAR QUARTER-END
SEPTEMBER 30, 2017 (unaudited)
SEC Returns (reflects applicable | ||||
| CLASS A SHARES | ||||
| 1 Year | -6.16% | |||
| Since Inception1 | -1.12% | |||
| CLASS C SHARES | ||||
| 1 Year | -3.77% | |||
| Since Inception1 | -0.63% | |||
| ADVISOR CLASS SHARES2 | ||||
| 1 Year | -1.76% | |||
| Since Inception1 | 0.38% | |||
| 1 | Inception date: 5/7/2014. |
| 2 | Please note that this share class is for investors purchasing shares through accounts established under certain fee-based programs sponsored and maintained by certain broker-dealers and financial intermediaries, institutional pension plans and/or investment advisory clients of, and certain other persons associated with, the Adviser and its affiliates or the Fund. |
| 10 | AB CREDIT LONG/SHORT PORTFOLIO | abfunds.com |
EXPENSE EXAMPLE
(unaudited)
As a shareholder of a mutual fund, you may incur two types of costs: (1) transaction costs, including sales charges (loads) on purchase payments, contingent deferred sales charges on redemptions and (2) ongoing costs, including management fees; distribution (12b-1) fees; and other fund expenses. This example is intended to help you understand your ongoing costs (in dollars) of investing in the Fund and to compare these costs with the ongoing costs of investing in other mutual funds.
The Example is based on an investment of $1,000 invested at the beginning of the period and held for the entire period as indicated below.
Actual Expenses
The table below provides information about actual account values and actual expenses. You may use the information in this line, together with the amount you invested, to estimate the expenses that you paid over the period. Simply divide your account value by $1,000 (for example, an $8,600 account value divided by $1,000 = 8.6), then multiply the result by the number in the first line under the heading entitled “Expenses Paid During Period” to estimate the expenses you paid on your account during this period.
Hypothetical Example for Comparison Purposes
The table below provides information about hypothetical account values and hypothetical expenses based on the Fund’s actual expense ratio and an assumed annual rate of return of 5% before expenses, which is not the Fund’s actual return. The hypothetical account values and expenses may not be used to estimate the actual ending account balance or expenses you paid for the period. You may use this information to compare the ongoing costs of investing in the Fund and other funds by comparing this 5% hypothetical example with the 5% hypothetical examples that appear in the shareholder reports of other funds.
Please note that the expenses shown in the table are meant to highlight your ongoing costs only and do not reflect any transactional costs, such as sales charges (loads), or contingent deferred sales charges on redemptions. Therefore, the hypothetical example is useful in comparing ongoing costs only, and will not help you determine the relative total costs of owning different funds. In addition, if these transactional costs were included, your costs would have been higher.
| abfunds.com | AB CREDIT LONG/SHORT PORTFOLIO | 11 |
EXPENSE EXAMPLE (continued)
| Beginning Account Value May 1, 2017 | Ending Account Value October 31, 2017 | Expenses Paid During Period* | Annualized Expense Ratio* | Total Expenses Paid During Period+ | Total Annualized Expense Ratio+ | |||||||||||||||||||
| Class A | ||||||||||||||||||||||||
Actual | $ | 1,000 | $ | 961.20 | $ | 34.80 | 7.04 | % | $ | 34.90 | 7.06 | % | ||||||||||||
Hypothetical** | $ | 1,000 | $ | 989.72 | $ | 35.31 | 7.04 | % | $ | 35.41 | 7.06 | % | ||||||||||||
| Class C | ||||||||||||||||||||||||
Actual | $ | 1,000 | $ | 957.40 | $ | 39.17 | 7.94 | % | $ | 39.32 | 7.97 | % | ||||||||||||
Hypothetical** | $ | 1,000 | $ | 985.18 | $ | 39.73 | 7.94 | % | $ | 39.88 | 7.97 | % | ||||||||||||
| Advisor Class | ||||||||||||||||||||||||
Actual | $ | 1,000 | $ | 962.40 | $ | 33.78 | 6.83 | % | $ | 33.93 | 6.86 | % | ||||||||||||
Hypothetical** | $ | 1,000 | $ | 990.77 | $ | 34.27 | 6.83 | % | $ | 34.42 | 6.86 | % | ||||||||||||
| * | Expenses are equal to the classes’ annualized expense ratios multiplied by the average account value over the period, multiplied by 184/365 (to reflect the one-half year period). |
| ** | Assumes 5% annual return before expenses. |
| + | In connection with the Portfolio’s investments in affiliated/unaffiliated underlying portfolios, the Portfolio incurs no direct expenses, but bears proportionate shares of the fees and expenses (i.e., operating, administrative and investment advisory fees) of the affiliated/unaffiliated underlying portfolios. The Adviser has contractually agreed to waive its fees from the Portfolio in an amount equal to the Portfolio’s pro rata share of certain acquired fund fees and expenses of the affiliated underlying portfolios. The Portfolio’s total expenses are equal to the classes’ annualized expense ratio plus the Portfolio’s pro rata share of the weighted average expense ratio of the affiliated/unaffiliated underlying portfolios in which it invests, multiplied by the average account value over the period, multiplied by 184/365 (to reflect the one-half year period). |
| 12 | AB CREDIT LONG/SHORT PORTFOLIO | abfunds.com |
PORTFOLIO SUMMARY
October 31, 2017 (unaudited)
PORTFOLIO STATISTICS
Net Assets ($mil): $20.8
SECTOR BREAKDOWN1
| Long | Short | |||||||
| Asset-Backed Securities | 1.3 | % | — | % | ||||
| Bank Loans | 0.7 | — | ||||||
| Collateralized Mortgage Obligations | 0.7 | — | ||||||
| Common Stocks | 2.4 | — | ||||||
| Corporates – Investment Grade | 20.1 | -16.7 | ||||||
| Corporates – Non-Investment Grade | 25.7 | -67.3 | ||||||
| Emerging Markets – Corporate Bonds | 2.7 | -1.4 | ||||||
| Emerging Markets – Sovereigns | 1.4 | -0.6 | ||||||
| Emerging Markets – Treasuries | 0.9 | — | ||||||
| Governments – Treasuries | 1.6 | — | ||||||
| Inflation-Linked Securities | 1.6 | — | ||||||
| Investment Companies | 31.2 | — | ||||||
| Preferred Stocks | 1.5 | -1.9 | ||||||
| U.S. Treasury Bills | 10.7 | — | ||||||
NET COUNTRY EXPOSURE (TOP THREE)1
| Long | Short | |||||||||||||
| United States | 16.2 | % | France | -2.6 | % | |||||||||
| Brazil | 2.0 | Bermuda | -1.9 | |||||||||||
| Switzerland | 1.2 | Luxembourg | -1.7 | |||||||||||
| 1 | Holdings are expressed as a percentage of total net assets and may vary over time. The Fund also enters into derivative transactions, which may be used for hedging or investment purposes (see “Portfolio of Investments” section of the report for additional details). |
| abfunds.com | AB CREDIT LONG/SHORT PORTFOLIO | 13 |
PORTFOLIO SUMMARY (continued)
October 31, 2017 (unaudited)
TEN LARGEST HOLDINGS1
| Long | Short | |||||||||||||
| Security | Security | |||||||||||||
| CSC Holdings LLC | 3.2 | % | Kroger Co. (The) | -3.6 | % | |||||||||
| Bombardier, Inc. | 2.9 | BNP Paribas SA | -3.3 | |||||||||||
| BNP Paribas SA | 2.7 | Comcast Corp. | -3.2 | |||||||||||
| Kroger Co. (The) | 2.5 | Ashland LLC | -3.0 | |||||||||||
| Navient Corp. | 2.2 | XPO Logistics, Inc. | -3.0 | |||||||||||
| Noble Holding International Ltd. | 2.2 | Bombardier, Inc. | -3.0 | |||||||||||
| Odebrecht Finance Ltd. | 1.8 | CSC Holdings LLC | -2.9 | |||||||||||
| Brazil Notas do Tesouro Nacional | 1.6 | Berry Global, Inc. | -2.8 | |||||||||||
| Macy’s Retail Holdings, Inc. | 1.4 | Iceland Bondco PLC | -2.7 | |||||||||||
| Nabors Industries, Inc. | 1.4 | Herc Rentals, Inc. | -2.1 | |||||||||||
| 1 | Holdings are expressed as a percentage of total net assets and may vary over time. The Fund also enters into derivative transactions, which may be used for hedging or investment purposes (see “Portfolio of Investments” section of the report for additional details). |
| 14 | AB CREDIT LONG/SHORT PORTFOLIO | abfunds.com |
PORTFOLIO OF INVESTMENTS
October 31, 2017
| Principal Amount (000) | U.S. $ Value | |||||||||||
| ||||||||||||
CORPORATES – NON-INVESTMENT GRADE – 25.7% | ||||||||||||
Industrial – 21.3% | ||||||||||||
Basic – 0.4% | ||||||||||||
ArcelorMittal | U.S.$ | 56 | $ | 68,711 | ||||||||
Artsonig Pty Ltd. | 202 | 2,025 | ||||||||||
ERP Iron Ore, LLC | 5 | 5,086 | ||||||||||
Magnetation LLC/Mag Finance Corp. | 35 | – 0 | – | |||||||||
Peabody Energy Corp. | 119 | – 0 | – | |||||||||
|
| |||||||||||
| 75,822 | ||||||||||||
|
| |||||||||||
Capital Goods – 3.1% | ||||||||||||
Bombardier, Inc. | 600 | 595,926 | ||||||||||
Exide Technologies | 60 | 51,000 | ||||||||||
|
| |||||||||||
| 646,926 | ||||||||||||
|
| |||||||||||
Communications - Media – 4.7% | ||||||||||||
CCO Holdings LLC/CCO Holdings Capital Corp. | 200 | 198,490 | ||||||||||
CSC Holdings LLC | 600 | 657,132 | ||||||||||
iHeartCommunications, Inc. | 41 | 20,500 | ||||||||||
9.00%, 12/15/19-9/15/22 | 142 | 103,329 | ||||||||||
|
| |||||||||||
| 979,451 | ||||||||||||
|
| |||||||||||
Communications - Telecommunications – 0.4% | ||||||||||||
Frontier Communications Corp. | 87 | 76,038 | ||||||||||
|
| |||||||||||
Consumer Cyclical - Automotive – 0.1% | ||||||||||||
Exide Technologies | 30 | 18,073 | ||||||||||
|
| |||||||||||
Consumer Cyclical - Other – 2.4% | ||||||||||||
K. Hovnanian Enterprises, Inc. | 200 | 222,660 | ||||||||||
MDC Holdings, Inc. | 5 | 5,369 | ||||||||||
6.00%, 1/15/43 | 115 | 111,357 | ||||||||||
| abfunds.com | AB CREDIT LONG/SHORT PORTFOLIO | 15 |
PORTFOLIO OF INVESTMENTS (continued)
| Principal Amount (000) | U.S. $ Value | |||||||||||
| ||||||||||||
PulteGroup, Inc. | U.S.$ | 140 | $ | 148,263 | ||||||||
7.875%, 6/15/32 | 19 | 23,492 | ||||||||||
|
| |||||||||||
| 511,141 | ||||||||||||
|
| |||||||||||
Consumer Non-Cyclical – 0.4% | ||||||||||||
BI-LO LLC/BI-LO Finance Corp. | 35 | 11,012 | ||||||||||
9.25%, 2/15/19(h) | 88 | 80,379 | ||||||||||
|
| |||||||||||
| 91,391 | ||||||||||||
|
| |||||||||||
Energy – 9.3% | ||||||||||||
Berry Petroleum Co. LLC | 85 | – 0 | – | |||||||||
California Resources Corp. | 600 | 278,250 | ||||||||||
8.00%, 12/15/22(h) | 100 | 66,000 | ||||||||||
Denbury Resources, Inc. | 17 | 9,711 | ||||||||||
5.50%, 5/01/22 | 47 | 29,375 | ||||||||||
EP Energy LLC/Everest Acquisition Finance, Inc. | 275 | 203,159 | ||||||||||
9.375%, 5/01/20 | 169 | 142,016 | ||||||||||
Hilcorp Energy I LP/Hilcorp Finance Co. | 24 | 24,539 | ||||||||||
Nabors Industries, Inc. | 300 | 288,162 | ||||||||||
Noble Holding International Ltd. | 74 | 50,043 | ||||||||||
7.75%, 1/15/24 | 500 | 447,500 | ||||||||||
SandRidge Energy, Inc. | 150 | – 0 | – | |||||||||
SM Energy Co. | 200 | 203,132 | ||||||||||
Transocean, Inc. | 100 | 81,401 | ||||||||||
Weatherford International Ltd. | 105 | 105,919 | ||||||||||
|
| |||||||||||
| 1,929,207 | ||||||||||||
|
| |||||||||||
Other Industrial – 0.4% | ||||||||||||
General Cable Corp. | 85 | 81,455 | ||||||||||
|
| |||||||||||
Technology – 0.1% | ||||||||||||
Avaya, Inc. | 404 | 24,240 | ||||||||||
|
| |||||||||||
| 4,433,744 | ||||||||||||
|
| |||||||||||
| 16 | AB CREDIT LONG/SHORT PORTFOLIO | abfunds.com |
PORTFOLIO OF INVESTMENTS (continued)
| Principal Amount (000) | U.S. $ Value | |||||||||||
| ||||||||||||
Financial Institutions – 4.4% | ||||||||||||
Banking – 1.4% | ||||||||||||
Barclays Bank PLC | U.S.$ | 73 | $ | 88,379 | ||||||||
Royal Bank of Scotland Group PLC | EUR | 100 | 113,318 | |||||||||
Series U | U.S.$ | 100 | 97,101 | |||||||||
|
| |||||||||||
| 298,798 | ||||||||||||
|
| |||||||||||
Finance – 3.0% | ||||||||||||
Enova International, Inc. | 37 | 39,447 | ||||||||||
Navient Corp. | 453 | 466,504 | ||||||||||
8.00%, 3/25/20 | 24 | 26,480 | ||||||||||
TMX Finance LLC/TitleMax Finance Corp. | 95 | 87,651 | ||||||||||
|
| |||||||||||
| 620,082 | ||||||||||||
|
| |||||||||||
| 918,880 | ||||||||||||
|
| |||||||||||
Total Corporates – Non-Investment Grade | 5,352,624 | |||||||||||
|
| |||||||||||
CORPORATES – INVESTMENT GRADE – 20.1% | ||||||||||||
Industrial – 11.9% | ||||||||||||
Communications - Media – 1.5% | ||||||||||||
21st Century Fox America, Inc. | 55 | 58,194 | ||||||||||
Omnicom Group, Inc. | 200 | 202,864 | ||||||||||
Time Warner, Inc. | 40 | 42,176 | ||||||||||
|
| |||||||||||
| 303,234 | ||||||||||||
|
| |||||||||||
Communications - Telecommunications – 3.0% | ||||||||||||
AT&T, Inc. | 200 | 205,116 | ||||||||||
5.15%, 2/14/50 | 104 | 102,458 | ||||||||||
5.45%, 3/01/47 | 100 | 104,324 | ||||||||||
Verizon Communications, Inc. | 200 | 208,404 | ||||||||||
|
| |||||||||||
| 620,302 | ||||||||||||
|
| |||||||||||
| abfunds.com | AB CREDIT LONG/SHORT PORTFOLIO | 17 |
PORTFOLIO OF INVESTMENTS (continued)
| Principal Amount (000) | U.S. $ Value | |||||||||||
| ||||||||||||
Consumer Cyclical - Automotive – 1.0% | ||||||||||||
Ford Motor Credit Co. LLC | U.S.$ | 200 | $ | 209,162 | ||||||||
|
| |||||||||||
Consumer Cyclical - Retailers – 1.4% | ||||||||||||
Macy’s Retail Holdings, Inc. | 400 | 294,756 | ||||||||||
|
| |||||||||||
Consumer Non-Cyclical – 3.8% | ||||||||||||
Kroger Co. (The) | 600 | 525,210 | ||||||||||
Teva Pharmaceutical Finance Netherlands III BV | 300 | 265,479 | ||||||||||
|
| |||||||||||
| 790,689 | ||||||||||||
|
| |||||||||||
Energy – 0.4% | ||||||||||||
Plains All American Pipeline LP/PAA Finance Corp. | 79 | 79,265 | ||||||||||
|
| |||||||||||
Services – 0.2% | ||||||||||||
S&P Global, Inc. | 41 | 43,311 | ||||||||||
|
| |||||||||||
Technology – 0.6% | ||||||||||||
Hewlett Packard Enterprise Co. | 17 | 18,105 | ||||||||||
Xerox Corp. | 110 | 108,571 | ||||||||||
|
| |||||||||||
| 126,676 | ||||||||||||
|
| |||||||||||
| 2,467,395 | ||||||||||||
|
| |||||||||||
Financial Institutions – 6.5% | ||||||||||||
Banking – 6.5% | ||||||||||||
BNP Paribas SA | 500 | 560,630 | ||||||||||
Credit Suisse Group Funding Guernsey Ltd. | 250 | 259,170 | ||||||||||
Morgan Stanley | 248 | 271,416 | ||||||||||
Wells Fargo & Co. | 250 | 264,283 | ||||||||||
|
| |||||||||||
| 1,355,499 | ||||||||||||
|
| |||||||||||
Utility – 1.7% | ||||||||||||
Electric – 1.7% | ||||||||||||
Dominion Energy, Inc. | 100 | 96,638 | ||||||||||
| 18 | AB CREDIT LONG/SHORT PORTFOLIO | abfunds.com |
PORTFOLIO OF INVESTMENTS (continued)
| Principal Amount (000) | U.S. $ Value | |||||||||||
| ||||||||||||
Duke Energy Corp. | U.S.$ | 250 | $ | 265,172 | ||||||||
|
| |||||||||||
| 361,810 | ||||||||||||
|
| |||||||||||
Total Corporates – Investment Grade | 4,184,704 | |||||||||||
|
| |||||||||||
EMERGING MARKETS – CORPORATE BONDS – 2.7% | ||||||||||||
Industrial – 2.7% | ||||||||||||
Capital Goods – 1.8% | ||||||||||||
Odebrecht Finance Ltd. | 1,000 | 375,000 | ||||||||||
|
| |||||||||||
Energy – 0.7% | ||||||||||||
CHC Group LLC/CHC Finance Ltd. | 98 | 137,101 | ||||||||||
|
| |||||||||||
Other Industrial – 0.2% | ||||||||||||
Noble Group Ltd. | 100 | 41,250 | ||||||||||
|
| |||||||||||
Total Emerging Markets – Corporate Bonds | 553,351 | |||||||||||
|
| |||||||||||
| Shares | ||||||||||||
COMMON STOCKS – 2.4% | ||||||||||||
Industrials – 0.1% | ||||||||||||
Construction & Engineering – 0.1% | ||||||||||||
Modular Space Corp.(b) | 1,288 | 19,449 | ||||||||||
|
| |||||||||||
Energy Equipment & Services – 0.0% | ||||||||||||
Sanchez Energy Corp.(g) | 537 | 2,325 | ||||||||||
|
| |||||||||||
Energy Other – 0.0% | ||||||||||||
Tervita Corp.(c)(d)(e)(g) | 838 | 6,009 | ||||||||||
|
| |||||||||||
Road & Rail – 0.0% | ||||||||||||
Celadon Group, Inc. | 772 | 5,674 | ||||||||||
|
| |||||||||||
Trading Companies & Distributors – 0.0% | ||||||||||||
Emeco Holdings Ltd.(c)(d)(e)(g) | 30,830 | 5,567 | ||||||||||
|
| |||||||||||
| 39,024 | ||||||||||||
|
| |||||||||||
Consumer Discretionary – 0.7% | ||||||||||||
Auto Components – 0.0% | ||||||||||||
Exide Technologies(e)(g)(m) | 1,620 | 6,379 | ||||||||||
|
| |||||||||||
| abfunds.com | AB CREDIT LONG/SHORT PORTFOLIO | 19 |
PORTFOLIO OF INVESTMENTS (continued)
| Company | Shares | U.S. $ Value | ||||||||||
| ||||||||||||
Diversified Consumer Services – 0.1% | ||||||||||||
Laureate Education, Inc. – Class A(g) | 2,017 | $ | 26,967 | |||||||||
|
| |||||||||||
Hotels, Restaurants & Leisure – 0.1% | ||||||||||||
eDreams ODIGEO SA(g) | 5,321 | 16,481 | ||||||||||
|
| |||||||||||
Household Durables – 0.0% | ||||||||||||
Hovnanian Enterprises, Inc. – Class A(g) | 2,224 | 5,382 | ||||||||||
|
| |||||||||||
Media – 0.3% | ||||||||||||
Clear Channel Outdoor Holdings, Inc. – Class A | 4,650 | 17,670 | ||||||||||
DISH Network Corp. – Class A(g) | 133 | 6,456 | ||||||||||
Gray Television, Inc.(g) | 771 | 12,004 | ||||||||||
Nexstar Media Group, Inc. – Class A | 235 | 14,993 | ||||||||||
Townsquare Media, Inc. – Class A(g) | 664 | 6,932 | ||||||||||
|
| |||||||||||
| 58,055 | ||||||||||||
|
| |||||||||||
Multiline Retail – 0.2% | ||||||||||||
Macy’s, Inc. | 1,567 | 29,397 | ||||||||||
|
| |||||||||||
| 142,661 | ||||||||||||
|
| |||||||||||
Energy – 0.7% | ||||||||||||
Energy Equipment & Services – 0.1% | ||||||||||||
Weatherford International PLC(g) | 3,318 | 11,514 | ||||||||||
|
| |||||||||||
Oil, Gas & Consumable Fuels – 0.6% | ||||||||||||
Peabody Energy Corp.(g) | 679 | 20,974 | ||||||||||
CHC Group LLC(g)(m) | 1,937 | 13,559 | ||||||||||
Berry Pete Corp.(c)(d)(g) | 3,329 | 25,800 | ||||||||||
Oasis Petroleum, Inc.(g) | 947 | 8,949 | ||||||||||
SandRidge Energy, Inc.(g) | 1,200 | 22,524 | ||||||||||
Halcon Resources Corp.(g) | 879 | 5,784 | ||||||||||
Chesapeake Energy Corp.(g) | 1,571 | 6,127 | ||||||||||
EP Energy Corp. – Class A(g) | 1,809 | 4,884 | ||||||||||
Whiting Petroleum Corp.(g) | 1,439 | 8,648 | ||||||||||
Carrizo Oil & Gas, Inc.(g) | 456 | 8,067 | ||||||||||
|
| |||||||||||
| 125,316 | ||||||||||||
|
| |||||||||||
| 136,830 | ||||||||||||
|
| |||||||||||
Materials – 0.5% | ||||||||||||
Metals & Mining – 0.5% | ||||||||||||
AK Steel Holding Corp.(g) | 22,438 | 102,990 | ||||||||||
|
| |||||||||||
Telecommunication Services – 0.3% | ||||||||||||
Diversified Telecommunication Services – 0.2% |
| |||||||||||
Koninklijke KPN NV | 6,700 | 23,054 | ||||||||||
TDC A/S | 4,700 | 27,787 | ||||||||||
|
| |||||||||||
| 50,841 | ||||||||||||
|
| |||||||||||
| 20 | AB CREDIT LONG/SHORT PORTFOLIO | abfunds.com |
PORTFOLIO OF INVESTMENTS (continued)
| Company | Shares | U.S. $ Value | ||||||||||
| ||||||||||||
Wireless Telecommunication Services – 0.1% |
| |||||||||||
T-Mobile US, Inc.(g) | 175 | $ | 10,460 | |||||||||
|
| |||||||||||
| 61,301 | ||||||||||||
|
| |||||||||||
Health Care – 0.1% | ||||||||||||
Health Care Providers & Services – 0.1% | ||||||||||||
Community Health Systems, Inc.(g) | 2,300 | 13,570 | ||||||||||
Quorum Health Corp.(g) | 107 | 612 | ||||||||||
Tenet Healthcare Corp.(g) | 561 | 8,011 | ||||||||||
|
| |||||||||||
| 22,193 | ||||||||||||
|
| |||||||||||
Pharmaceuticals – 0.0% | ||||||||||||
Endo International PLC(g) | 625 | 3,987 | ||||||||||
Horizon Pharma PLC(g) | 273 | 3,702 | ||||||||||
|
| |||||||||||
| 7,689 | ||||||||||||
|
| |||||||||||
| 29,882 | ||||||||||||
|
| |||||||||||
Financials – 0.0% | ||||||||||||
Diversified Financial Services – 0.0% | ||||||||||||
Holdco, Inc.(c)(d)(e) | 12,383 | 7,925 | ||||||||||
|
| |||||||||||
Information Technology – 0.0% | ||||||||||||
Technology Hardware, Storage & Peripherals – 0.0% | ||||||||||||
Travelport Worldwide Ltd. | 340 | 5,335 | ||||||||||
|
| |||||||||||
Total Common Stocks | 525,948 | |||||||||||
|
| |||||||||||
| Principal Amount (000) | ||||||||||||
INFLATION-LINKED SECURITIES – 1.6% | ||||||||||||
Brazil – 1.6% | ||||||||||||
Brazil Notas do Tesouro Nacional | BRL | 340 | 335,085 | |||||||||
|
| |||||||||||
GOVERNMENTS – TREASURIES – 1.6% | ||||||||||||
Mexico – 1.0% | ||||||||||||
Mexican Bonos | MXN | 4,546 | 214,779 | |||||||||
|
| |||||||||||
Russia – 0.5% | ||||||||||||
Russian Federal Bond – OFZ | RUB | 6,273 | 107,741 | |||||||||
|
| |||||||||||
| abfunds.com | AB CREDIT LONG/SHORT PORTFOLIO | 21 |
PORTFOLIO OF INVESTMENTS (continued)
| Principal Amount (000) | U.S. $ Value | |||||||||||
| ||||||||||||
South Africa – 0.1% | ||||||||||||
Republic of South Africa Government Bond | ZAR | 141 | $ | 8,712 | ||||||||
|
| |||||||||||
Total Governments – Treasuries | 331,232 | |||||||||||
|
| |||||||||||
EMERGING MARKETS – SOVEREIGNS – 1.4% | ||||||||||||
Ivory Coast – 0.6% | ||||||||||||
Ivory Coast Government International Bond | EUR | 100 | 123,183 | |||||||||
|
| |||||||||||
Venezuela – 0.8% | ||||||||||||
Venezuela Government International Bond | U.S.$ | 450 | 165,376 | |||||||||
|
| |||||||||||
Total Emerging Markets – Sovereigns | 288,559 | |||||||||||
|
| |||||||||||
| Shares | ||||||||||||
PREFERRED STOCKS – 1.5% | ||||||||||||
Industrial – 1.4% | ||||||||||||
Energy – 1.4% | ||||||||||||
Berry Petroleum Co. LLC | 2,781 | 28,736 | ||||||||||
Sanchez Energy Corp. | 1,550 | 25,284 | ||||||||||
Sanchez Energy Corp. | 400 | 7,172 | ||||||||||
Tervita Corp. | 30,203 | 216,555 | ||||||||||
|
| |||||||||||
| 277,747 | ||||||||||||
|
| |||||||||||
Financial Institutions – 0.1% | ||||||||||||
Services – 0.1% | ||||||||||||
Holdco, Inc. | 79 | 7,857 | ||||||||||
|
| |||||||||||
Total Preferred Stocks | 285,604 | |||||||||||
|
| |||||||||||
| 22 | AB CREDIT LONG/SHORT PORTFOLIO | abfunds.com |
PORTFOLIO OF INVESTMENTS (continued)
| Principal Amount (000) | U.S. $ Value | |||||||||||
|
|
| ||||||||||
ASSET-BACKED SECURITIES – 1.3% | ||||||||||||
Other ABS - Fixed Rate – 1.0% | ||||||||||||
Taco Bell Funding LLC | U.S.$ | 208 | $ | 211,756 | ||||||||
|
| |||||||||||
Home Equity Loans - Fixed Rate – 0.3% | ||||||||||||
Morgan Stanley Mortgage Loan Trust | 71 | 49,790 | ||||||||||
|
| |||||||||||
Total Asset-Backed Securities | 261,546 | |||||||||||
|
| |||||||||||
EMERGING MARKETS – TREASURIES – 0.9% | ||||||||||||
Argentina – 0.4% | ||||||||||||
Argentine Bonos del Tesoro | ARS | 1,565 | 89,143 | |||||||||
|
| |||||||||||
Turkey – 0.5% | ||||||||||||
Turkey Government Bond | TRY | 367 | 93,865 | |||||||||
|
| |||||||||||
Total Emerging Markets – Treasuries | 183,008 | |||||||||||
|
| |||||||||||
BANK LOANS – 0.7% | ||||||||||||
Industrial – 0.7% | ||||||||||||
Technology – 0.7% | ||||||||||||
Avaya Inc. | ||||||||||||
5.87% (LIBOR 3 Month + 4.50%), 10/26/18(n) | U.S.$ | 40 | 33,122 | |||||||||
6.62% (LIBOR 3 Month + 5.25%), 5/29/20(f)(g)(n) | 117 | 97,322 | ||||||||||
8.74% (LIBOR 1 Month + 7.50%), 1/24/18(n) | 14 | 14,479 | ||||||||||
|
| |||||||||||
Total Bank Loans | 144,923 | |||||||||||
|
| |||||||||||
COLLATERALIZED MORTGAGE OBLIGATIONS – 0.7% | ||||||||||||
Non-Agency Fixed Rate – 0.7% | ||||||||||||
Alternative Loan Trust | 55 | 50,644 | ||||||||||
| abfunds.com | AB CREDIT LONG/SHORT PORTFOLIO | 23 |
PORTFOLIO OF INVESTMENTS (continued)
| Principal Amount (000) | U.S. $ Value | |||||||||||
|
|
| ||||||||||
Countrywide Home Loan Mortgage Pass-Through Trust | U.S.$ | 60 | $ | 50,472 | ||||||||
GSR Mortgage Loan Trust | 28 | 25,475 | ||||||||||
Wells Fargo Mortgage Backed Securities Trust | 17 | 17,102 | ||||||||||
|
| |||||||||||
Total Collateralized Mortgage Obligations | 143,693 | |||||||||||
|
| |||||||||||
| Notional Amount (000) | ||||||||||||
OPTIONS PURCHASED – PUTS – 0.0% | ||||||||||||
Options on Funds and Investment Trusts – 0.0% | ||||||||||||
SPDR S&P 500 ETF Trust | USD | 91 | 4,868 | |||||||||
|
| |||||||||||
| Shares | ||||||||||||
WARRANTS – 0.0% | ||||||||||||
Energy – 0.0% | ||||||||||||
Oil, Gas & Consumable Fuels – 0.0% | ||||||||||||
Midstates Petroleum Co., Inc., expiring 4/21/20(d)(g) | 1,429 | 857 | ||||||||||
SandRidge Energy, Inc., | 2,538 | 2,284 | ||||||||||
SandRidge Energy, Inc., | 122 | 98 | ||||||||||
|
| |||||||||||
| 3,239 | ||||||||||||
|
| |||||||||||
Financials – 0.0% | ||||||||||||
Diversified Financial Services – 0.0% | ||||||||||||
iPayment Holdings, Inc., expiring 12/29/22(c)(d)(e)(g) | 13,856 | 334 | ||||||||||
|
| |||||||||||
Total Warrants | 3,573 | |||||||||||
|
| |||||||||||
| 24 | AB CREDIT LONG/SHORT PORTFOLIO | abfunds.com |
PORTFOLIO OF INVESTMENTS (continued)
| Shares | U.S. $ Value | |||||||||||
| ||||||||||||
SHORT-TERM INVESTMENTS – 41.9% | ||||||||||||
Investment Companies – 31.2% | ||||||||||||
AB Fixed Income Shares, Inc. – Government Money Market Portfolio – Class AB, 0.85%(o)(p)(q) | 6,494,426 | $ | 6,494,426 | |||||||||
|
| |||||||||||
| Principal Amount (000) | ||||||||||||
U.S. Treasury Bills – 10.7% | ||||||||||||
U.S. Treasury Bill | ||||||||||||
Zero Coupon, 12/28/17(r) | U.S.$ | 555 | 554,023 | |||||||||
Zero Coupon, 11/02/17-12/07/17 | 1,665 | 1,664,163 | ||||||||||
|
| |||||||||||
Total U.S. Treasury Bills | 2,218,186 | |||||||||||
|
| |||||||||||
Total Short-Term Investments | 8,712,612 | |||||||||||
|
| |||||||||||
Total Investments Before Securities Sold Short – 102.5% | 21,311,330 | |||||||||||
|
| |||||||||||
SECURITIES SOLD SHORT – (88.1)% | ||||||||||||
CORPORATES – NON-INVESTMENT GRADE – (67.4)% | ||||||||||||
Industrial – (57.0)% | ||||||||||||
Basic – (11.9)% | ||||||||||||
Ashland LLC | (600 | ) | (632,292 | ) | ||||||||
Berry Global, Inc. | (564 | ) | (586,994 | ) | ||||||||
Chemours Co. (The) | (400 | ) | (424,956 | ) | ||||||||
INEOS Group Holdings SA | (400 | ) | (417,192 | ) | ||||||||
Lundin Mining Corp. | (200 | ) | (207,996 | ) | ||||||||
Platform Specialty Products Corp. | (200 | ) | (207,216 | ) | ||||||||
|
| |||||||||||
| (2,476,646 | ) | |||||||||||
|
| |||||||||||
Capital Goods – (4.9)% | ||||||||||||
Bombardier, Inc. | (600 | ) | (618,918 | ) | ||||||||
| abfunds.com | AB CREDIT LONG/SHORT PORTFOLIO | 25 |
PORTFOLIO OF INVESTMENTS (continued)
| Principal Amount (000) | U.S. $ Value | |||||||||||
| ||||||||||||
Triumph Group, Inc. | U.S.$ | (400 | ) | $ | (397,332 | ) | ||||||
|
| |||||||||||
| (1,016,250 | ) | |||||||||||
|
| |||||||||||
Communications - Media – (7.9)% | ||||||||||||
CCO Holdings LLC/CCO Holdings Capital Corp. | (400 | ) | (426,276 | ) | ||||||||
CSC Holdings LLC | (600 | ) | (598,410 | ) | ||||||||
Lamar Media Corp. | (400 | ) | (413,000 | ) | ||||||||
5.875%, 2/01/22 | (200 | ) | (205,772 | ) | ||||||||
|
| |||||||||||
| (1,643,458 | ) | |||||||||||
|
| |||||||||||
Consumer Cyclical - Automotive – (2.0)% | ||||||||||||
Dana, Inc. | (400 | ) | (423,084 | ) | ||||||||
|
| |||||||||||
Consumer Cyclical - Other – (2.0)% | ||||||||||||
Scientific Games International, Inc. | (400 | ) | (423,128 | ) | ||||||||
|
| |||||||||||
Consumer Non-Cyclical – (4.8)% | ||||||||||||
Iceland Bondco PLC | GBP | (400 | ) | (572,279 | ) | |||||||
Spectrum Brands, Inc. | U.S.$ | (400 | ) | (425,580 | ) | |||||||
|
| |||||||||||
| (997,859 | ) | |||||||||||
|
| |||||||||||
Energy – (10.2)% | ||||||||||||
Chesapeake Energy Corp. | (400 | ) | (387,356 | ) | ||||||||
Laredo Petroleum, Inc. | (400 | ) | (416,148 | ) | ||||||||
Noble Holding International Ltd. | (400 | ) | (318,912 | ) | ||||||||
Oasis Petroleum, Inc. | (175 | ) | (177,781 | ) | ||||||||
SM Energy Co. | (400 | ) | (403,252 | ) | ||||||||
Southwestern Energy Co. | (200 | ) | (204,760 | ) | ||||||||
WPX Energy, Inc. | (200 | ) | (200,196 | ) | ||||||||
|
| |||||||||||
| (2,108,405 | ) | |||||||||||
|
| |||||||||||
Services – (2.0)% | ||||||||||||
Service Corp. International/US | (400 | ) | (422,220 | ) | ||||||||
|
| |||||||||||
| 26 | AB CREDIT LONG/SHORT PORTFOLIO | abfunds.com |
PORTFOLIO OF INVESTMENTS (continued)
| Principal Amount (000) | U.S. $ Value | |||||||||||
| ||||||||||||
Technology – (4.1)% | ||||||||||||
CommScope, Inc. | U.S.$ | (400 | ) | $ | (417,744 | ) | ||||||
MSCI, Inc. | (400 | ) | (423,956 | ) | ||||||||
|
| |||||||||||
| (841,700 | ) | |||||||||||
|
| |||||||||||
Transportation - Services – (7.2)% | ||||||||||||
Herc Rentals, Inc. | (400 | ) | (432,980 | ) | ||||||||
United Rentals North America, Inc. | (400 | ) | (424,864 | ) | ||||||||
XPO Logistics, Inc. | (600 | ) | (628,836 | ) | ||||||||
|
| |||||||||||
| (1,486,680 | ) | |||||||||||
|
| |||||||||||
| (11,839,430 | ) | |||||||||||
|
| |||||||||||
Financial Institutions – (8.9)% | ||||||||||||
Banking – (2.0)% | ||||||||||||
Societe Generale SA | (400 | ) | (409,972 | ) | ||||||||
|
| |||||||||||
Finance – (2.9)% | ||||||||||||
Fly Leasing Ltd. | (200 | ) | (209,000 | ) | ||||||||
Navient Corp. | (400 | ) | (406,332 | ) | ||||||||
|
| |||||||||||
| (615,332 | ) | |||||||||||
|
| |||||||||||
REITS – (4.0)% | ||||||||||||
FelCor Lodging LP | (400 | ) | (413,608 | ) | ||||||||
Realogy Group LLC/Realogy Co-Issuer Corp. | ||||||||||||
4.50%, 4/15/19(h) | (200 | ) | (205,836 | ) | ||||||||
4.875%, 6/01/23(h) | (200 | ) | (206,002 | ) | ||||||||
|
| |||||||||||
| (825,446 | ) | |||||||||||
|
| |||||||||||
| (1,850,750 | ) | |||||||||||
|
| |||||||||||
Utility – (1.5)% | ||||||||||||
Electric – (1.5)% | ||||||||||||
Calpine Corp. | (189 | ) | (195,192 | ) | ||||||||
Enel SpA | EUR | (100 | ) | (124,869 | ) | |||||||
|
| |||||||||||
| (320,061 | ) | |||||||||||
|
| |||||||||||
Total Corporates – Non-Investment Grade | (14,010,241 | ) | ||||||||||
|
| |||||||||||
| abfunds.com | AB CREDIT LONG/SHORT PORTFOLIO | 27 |
PORTFOLIO OF INVESTMENTS (continued)
| Principal Amount (000) | U.S. $ Value | |||||||||||
| ||||||||||||
CORPORATES – INVESTMENT GRADE – (16.7)% | ||||||||||||
Industrial – (10.4)% | ||||||||||||
Communications - Media – (3.2)% | ||||||||||||
Comcast Corp. | U.S.$ | (600 | ) | $ | (657,960 | ) | ||||||
|
| |||||||||||
Consumer Non-Cyclical – (4.2)% | ||||||||||||
Kroger Co. (The) | (600 | ) | (752,910 | ) | ||||||||
Teva Pharmaceutical Finance Netherlands III BV | (150 | ) | (119,398 | ) | ||||||||
|
| |||||||||||
| (872,308 | ) | |||||||||||
|
| |||||||||||
Energy – (1.0)% | ||||||||||||
Ecopetrol SA | (200 | ) | (217,500 | ) | ||||||||
|
| |||||||||||
Technology – (2.0)% | ||||||||||||
Hewlett Packard Enterprise Co. | (400 | ) | (426,044 | ) | ||||||||
|
| |||||||||||
| (2,173,812 | ) | |||||||||||
|
| |||||||||||
Financial Institutions – (6.3)% | ||||||||||||
Banking – (4.3)% | ||||||||||||
BNP Paribas SA | (600 | ) | (693,828 | ) | ||||||||
Intesa Sanpaolo SpA | EUR | (150 | ) | (207,767 | ) | |||||||
|
| |||||||||||
| (901,595 | ) | |||||||||||
|
| |||||||||||
Insurance – (2.0)% | ||||||||||||
RenaissanceRe Finance, Inc. | U.S.$ | (400 | ) | (404,184 | ) | |||||||
|
| |||||||||||
| (1,305,779 | ) | |||||||||||
|
| |||||||||||
Total Corporates – Investment Grade | (3,479,591 | ) | ||||||||||
|
| |||||||||||
PREFERRED STOCKS – (2.0)% | ||||||||||||
Financial Institutions – (2.0)% | ||||||||||||
Insurance – (2.0)% | ||||||||||||
Axis Capital Holdings Ltd. | (16,000 | ) | (405,280 | ) | ||||||||
|
| |||||||||||
EMERGING MARKETS – CORPORATE BONDS – (1.4)% | ||||||||||||
Industrial – (1.4)% | ||||||||||||
Capital Goods – (1.4)% | ||||||||||||
Odebrecht Finance Ltd. | (800 | ) | (296,000 | ) | ||||||||
|
| |||||||||||
| 28 | AB CREDIT LONG/SHORT PORTFOLIO | abfunds.com |
PORTFOLIO OF INVESTMENTS (continued)
| Principal Amount (000) | U.S. $ Value | |||||||||||
| ||||||||||||
EMERGING MARKETS – SOVEREIGNS – (0.6)% | ||||||||||||
Venezuela – (0.6)% | ||||||||||||
Venezuela Government International Bond | U.S.$ | (400 | ) | $ | (135,002 | ) | ||||||
|
| |||||||||||
Total Securities Sold Short | (18,326,114 | ) | ||||||||||
|
| |||||||||||
Total Investments – 14.4% | 2,985,216 | |||||||||||
Other assets less liabilities – 85.6% | 17,802,709 | |||||||||||
|
| |||||||||||
Net Assets – 100.0% | $ | 20,787,925 | ||||||||||
|
| |||||||||||
FUTURES (see Note D)
| Description | Number of Contracts | Expiration Month | Notional (000) | Original Value | Value at October 31, 2017 | Unrealized Appreciation/ (Depreciation) | ||||||||||||||||||||||
Purchased Contracts |
| |||||||||||||||||||||||||||
Euro-Bund Futures | 5 | December 2017 | EUR | 500 | $ | 943,302 | $ | 947,896 | $ | 4,594 | ||||||||||||||||||
U.S. Long Bond (CBT) Futures | 4 | December 2017 | USD | 400 | 617,443 | 609,875 | (7,568 | ) | ||||||||||||||||||||
Sold Contracts |
| |||||||||||||||||||||||||||
Euro-BOBL Futures | 12 | December 2017 | EUR | 1,200 | 1,841,590 | 1,842,046 | (456 | ) | ||||||||||||||||||||
Euro-BTP Futures | 6 | December 2017 | EUR | 600 | 951,277 | 975,608 | (24,331 | ) | ||||||||||||||||||||
Euro-OAT Futures | 5 | December 2017 | EUR | 500 | 909,682 | 917,086 | (7,404 | ) | ||||||||||||||||||||
U.S. T-Note 10 Yr (CBT) Futures | 7 | December 2017 | USD | 700 | 884,835 | 874,563 | 10,272 | |||||||||||||||||||||
|
| |||||||||||||||||||||||||||
| $ | (24,893 | ) | ||||||||||||||||||||||||||
|
| |||||||||||||||||||||||||||
FORWARD CURRENCY EXCHANGE CONTRACTS (see Note D)
| Counterparty | Contracts to Deliver (000) | In Exchange For (000) | Settlement Date | Unrealized Appreciation/ (Depreciation) | ||||||||||||||||||||
Bank of America, NA | TWD | 11,647 | USD | 386 | 11/22/17 | $ | (64 | ) | ||||||||||||||||
Bank of America, NA | INR | 3,453 | USD | 53 | 11/29/17 | 211 | ||||||||||||||||||
Bank of America, NA | USD | 53 | INR | 3,466 | 11/29/17 | (91 | ) | |||||||||||||||||
Barclays Bank PLC | INR | 3,474 | USD | 53 | 11/29/17 | (671 | ) | |||||||||||||||||
Citibank, NA | RUB | 2,606 | USD | 45 | 11/22/17 | 747 | ||||||||||||||||||
Citibank, NA | USD | 54 | INR | 3,491 | 11/29/17 | (246 | ) | |||||||||||||||||
Credit Suisse International | GBP | 14 | USD | 18 | 12/01/17 | 7 | ||||||||||||||||||
Deutsche Bank AG | BRL | 882 | USD | 269 | 11/03/17 | (461 | ) | |||||||||||||||||
| abfunds.com | AB CREDIT LONG/SHORT PORTFOLIO | 29 |
PORTFOLIO OF INVESTMENTS (continued)
| Counterparty | Contracts to Deliver (000) | In Exchange For (000) | Settlement Date | Unrealized Appreciation/ (Depreciation) | ||||||||||||||||||||
Deutsche Bank AG | USD | 267 | BRL | 882 | 11/03/17 | $ | 2,263 | |||||||||||||||||
Deutsche Bank AG | BRL | 882 | USD | 266 | 12/04/17 | (2,209 | ) | |||||||||||||||||
JPMorgan Chase Bank, NA | USD | 387 | TWD | 11,652 | 11/22/17 | (306 | ) | |||||||||||||||||
JPMorgan Chase Bank, NA | USD | 580 | GBP | 439 | 12/01/17 | 3,897 | ||||||||||||||||||
Standard Chartered Bank | BRL | 882 | USD | 275 | 11/03/17 | 5,657 | ||||||||||||||||||
Standard Chartered Bank | USD | 269 | BRL | 882 | 11/03/17 | 461 | ||||||||||||||||||
State Street Bank & Trust Co. | CAD | 384 | USD | 307 | �� | 11/10/17 | 9,103 | |||||||||||||||||
State Street Bank & Trust Co. | USD | 45 | CAD | 55 | 11/10/17 | (2,366 | ) | |||||||||||||||||
State Street Bank & Trust Co. | CHF | 132 | USD | 139 | 11/29/17 | 6,280 | ||||||||||||||||||
State Street Bank & Trust Co. | USD | 139 | CHF | 133 | 11/29/17 | (5,892 | ) | |||||||||||||||||
State Street Bank & Trust Co. | AUD | 150 | USD | 120 | 11/30/17 | 4,975 | ||||||||||||||||||
State Street Bank & Trust Co. | NZD | 146 | USD | 106 | 11/30/17 | 6,033 | ||||||||||||||||||
State Street Bank & Trust Co. | ZAR | 272 | USD | 20 | 12/07/17 | 1,099 | ||||||||||||||||||
State Street Bank & Trust Co. | MXN | 2,020 | USD | 110 | 12/08/17 | 5,446 | ||||||||||||||||||
State Street Bank & Trust Co. | DKK | 174 | USD | 27 | 12/13/17 | (159 | ) | |||||||||||||||||
State Street Bank & Trust Co. | USD | 23 | EUR | 20 | 12/15/17 | 3 | ||||||||||||||||||
State Street Bank & Trust Co. | USD | 247 | EUR | 209 | 12/15/17 | (2,683 | ) | |||||||||||||||||
|
| |||||||||||||||||||||||
| $ | 31,034 | |||||||||||||||||||||||
|
| |||||||||||||||||||||||
PUT OPTIONS WRITTEN (see Note D)
| Description | Counterparty | Contracts | Exercise Price | Expiration Month | Notional (000) | Premiums Received | U.S. $ Value | |||||||||||||||||||
SPDR S&P 500 ETF Trust | Morgan Stanley & Co., Inc. | 91 | USD | 245.00 | November 2017 | USD | 9 | $ | 3,909 | $ | (2,321 | ) | ||||||||||||||
CENTRALLY CLEARED CREDIT DEFAULT SWAPS (see Note D)
| Fixed Rate (Pay) Receive | Payment Frequency | Implied Credit Spread at October 31, 2017 | Notional Amount (000) | Market Value | Upfront Premiums Paid (Received) | Unrealized Appreciation/ (Depreciation) | |||||||||||||||||||||
Buy Contracts |
| |||||||||||||||||||||||||||
CDX-NAHY Series 23, 5 Year Index, 12/20/19* | (5.00 | )% | Quarterly | 1.79 | % | USD | 485 | $ | (34,940 | ) | $ | (19,130 | ) | $ | (15,810 | ) | ||||||||||||
CDX-NAIG Series 23, 5 Year Index, 12/20/19* | (1.00 | ) | Quarterly | 0.27 | USD | 2,500 | (41,402 | ) | (20,227 | ) | (21,175 | ) | ||||||||||||||||
iTraxx-XOVER Series 25, 5 Year Index, 6/20/21* | (5.00 | ) | Quarterly | 1.43 | EUR | 18 | (2,765 | ) | (1,064 | ) | (1,701 | ) | ||||||||||||||||
| 30 | AB CREDIT LONG/SHORT PORTFOLIO | abfunds.com |
PORTFOLIO OF INVESTMENTS (continued)
| Fixed Rate (Pay) Receive | Payment Frequency | Implied Credit Spread at October 31, 2017 | Notional Amount (000) | Market Value | Upfront Premiums Paid (Received) | Unrealized Appreciation/ (Depreciation) | |||||||||||||||||||||
Sale Contracts |
| |||||||||||||||||||||||||||
CDX-NAHY Series 23, 5 Year Index, 12/20/19* | 5.00 | % | Quarterly | 1.79 | % | USD | 485 | $ | 34,940 | $ | 16,646 | $ | 18,294 | |||||||||||||||
CDX-NAHY Series 29, 5 Year Index, 12/20/22* | 5.00 | Quarterly | 3.11 | USD | 498 | 44,652 | 36,802 | 7,850 | ||||||||||||||||||||
iTraxx-XOVER Series 23, 5 Year Index, 6/20/20* | 5.00 | Quarterly | 0.88 | EUR | 114 | 15,069 | 6,782 | 8,287 | ||||||||||||||||||||
iTraxx-XOVER Series 27, 5 Year Index, 6/20/22* | 5.00 | Quarterly | 1.88 | EUR | 580 | 96,028 | 78,435 | 17,593 | ||||||||||||||||||||
|
|
|
|
|
| |||||||||||||||||||||||
| $ | 111,582 | $ | 98,244 | $ | 13,338 | |||||||||||||||||||||||
|
|
|
|
|
| |||||||||||||||||||||||
| * | Termination date |
CENTRALLY CLEARED INTEREST RATE SWAPS (see Note D)
| Rate Type | ||||||||||||||||||||||
Notional | Termination Date | Payments made by the Fund | Payments received by the Fund | Payment Frequency Paid/ Received | Unrealized Appreciation/ (Depreciation) | |||||||||||||||||
USD | 250 | 5/09/19 | 1.732 | % | 3 Month LIBOR | Semi-Annual/ Quarterly | $ | (1,249 | ) | |||||||||||||
CREDIT DEFAULT SWAPS (see Note D)
| Swap Counterparty & Referenced Obligation | Fixed Rate (Pay) Receive | Payment Frequency | Implied Credit Spread at October 31, 2017 | Notional Amount (000) | Market Value | Upfront Premiums Paid (Received) | Unrealized Appreciation/ (Depreciation) | |||||||||||||||||||||
Buy Contracts | ||||||||||||||||||||||||||||
Bank of America, NA |
| |||||||||||||||||||||||||||
Anglo American Capital, 4.450%, 9/27/20, 6/20/22* | (5.00 | )% | Quarterly | 0.96 | % | EUR | 200 | $ | (44,357 | ) | $ | (27,494 | ) | $ | (16,863 | ) | ||||||||||||
Arcelormittal, 6.125%, 6/01/18, 6/20/22* | (5.00 | ) | Quarterly | 1.12 | EUR | 200 | (42,487 | ) | (22,021 | ) | (20,466 | ) | ||||||||||||||||
| abfunds.com | AB CREDIT LONG/SHORT PORTFOLIO | 31 |
PORTFOLIO OF INVESTMENTS (continued)
| Swap Counterparty & Referenced Obligation | Fixed Rate (Pay) Receive | Payment Frequency | Implied Credit Spread at October 31, 2017 | Notional Amount (000) | Market Value | Upfront Premiums Paid (Received) | Unrealized Appreciation/ (Depreciation) | |||||||||||||||||||||
Barclays Bank PLC |
| |||||||||||||||||||||||||||
Indonesia Government International Bond, 5.875%, 3/13/20, 6/20/22* | (1.00 | )% | Quarterly | 0.83 | % | USD | 600 | $ | (4,683 | ) | $ | 8,341 | $ | (13,024 | ) | |||||||||||||
K. Hovnanian Enterprises, Inc., 7.000%, 1/15/19, 6/20/19* | (5.00 | ) | Quarterly | 12.30 | USD | 300 | 27,706 | 26,189 | 1,517 | |||||||||||||||||||
Macy’s, Inc., 3.450%, 1/15/21, 6/20/22* | (1.00 | ) | Quarterly | 2.68 | USD | 600 | 44,315 | 41,828 | 2,487 | |||||||||||||||||||
Repsol International Finance BV, 4.875%, 2/19/19, 6/20/22* | (1.00 | ) | Quarterly | 0.46 | EUR | 200 | (5,995 | ) | 1,236 | (7,231 | ) | |||||||||||||||||
Russian Foreign Bond – Eurobond, 7.500%, 3/31/30, 6/20/22* | (1.00 | ) | Quarterly | 1.13 | USD | 400 | 2,256 | 12,273 | (10,017 | ) | ||||||||||||||||||
Citibank, NA | ||||||||||||||||||||||||||||
Dell, Inc., 7.100%, 4/15/28, 12/20/21* | (1.00 | ) | Quarterly | 1.36 | USD | 200 | 2,560 | 16,578 | (14,018 | ) | ||||||||||||||||||
Quest Diagnostics, Inc., 6.950%, 7/01/37, 12/20/20* | (1.00 | ) | Quarterly | 0.18 | USD | 500 | (13,195 | ) | (1,182 | ) | (12,013 | ) | ||||||||||||||||
Renault SA, 3.125%, 3/05/21, 12/20/19* | (1.00 | ) | Quarterly | 0.21 | EUR | 160 | (3,410 | ) | – 0 | – | (3,410 | ) | ||||||||||||||||
Transocean, Inc., 7.375%, 4/15/18, 6/20/20* | (5.00 | ) | Quarterly | 1.79 | USD | 1,000 | (84,842 | ) | 56,514 | (141,356 | ) | |||||||||||||||||
| 32 | AB CREDIT LONG/SHORT PORTFOLIO | abfunds.com |
PORTFOLIO OF INVESTMENTS (continued)
| Swap Counterparty & Referenced Obligation | Fixed Rate (Pay) Receive | Payment Frequency | Implied Credit Spread at October 31, 2017 | Notional Amount (000) | Market Value | Upfront Premiums Paid (Received) | Unrealized Appreciation/ (Depreciation) | |||||||||||||||||||
Credit Suisse International | ||||||||||||||||||||||||||
AK Steel Corp., 7.000%, 3/15/27, 6/20/22* | (5.00 | )% | Quarterly | 3.66 | % | USD | 200 | $ | (11,413 | ) | $ | (6,851 | ) | $ | (4,562 | ) | ||||||||||
BellSouth LLC, 6.550%, 6/15/34, 9/20/19* | (1.00 | ) | Quarterly | 0.22 | USD | 1,000 | (15,463 | ) | (9,241 | ) | (6,222 | ) | ||||||||||||||
CDX-CMBX. | (5.00 | ) | Monthly | 12.50 | USD | 80 | 20,939 | 19,552 | 1,387 | |||||||||||||||||
CDX-CMBX. | (3.00 | ) | Monthly | 7.25 | USD | 134 | 22,339 | 16,130 | 6,209 | |||||||||||||||||
Conagra Brands, Inc., 7.000%, 10/01/28, 12/20/21* | (1.00 | ) | Quarterly | 0.43 | USD | 300 | (7,174 | ) | – 0 | – | (7,174 | ) | ||||||||||||||
Conagra Brands, Inc., 7.000%, 10/01/28, 12/20/21* | (1.00 | ) | Quarterly | 0.32 | USD | 300 | (8,502 | ) | – 0 | – | (8,502 | ) | ||||||||||||||
Deutsche Bank AG |
| |||||||||||||||||||||||||
Lloyds Bank PLC, 2.750%, 12/09/18, 12/20/19* | (1.00 | ) | Quarterly | 0.15 | EUR | 470 | (10,784 | ) | (6,012 | ) | (4,772 | ) | ||||||||||||||
Goldman Sachs International | ||||||||||||||||||||||||||
AK Steel Corp., 7.625%, 5/15/18, 6/20/22* | (5.00 | ) | Quarterly | 3.66 | USD | 300 | (17,120 | ) | (4,997 | ) | (12,123 | ) | ||||||||||||||
AK Steel Corp., 7.625%, 5/15/18, 6/20/22* | (5.00 | ) | Quarterly | 3.66 | USD | 200 | (11,413 | ) | (2,220 | ) | (9,193 | ) | ||||||||||||||
Amkor Technology, Inc., 6.625%, 6/01/21, 6/20/21* | (5.00 | ) | Quarterly | 0.76 | USD | 100 | (15,290 | ) | (3,650 | ) | (11,640 | ) | ||||||||||||||
| abfunds.com | AB CREDIT LONG/SHORT PORTFOLIO | 33 |
PORTFOLIO OF INVESTMENTS (continued)
| Swap Counterparty & Referenced Obligation | Fixed Rate (Pay) Receive | Payment Frequency | Implied Credit Spread at October 31, 2017 | Notional Amount (000) | Market Value | Upfront Premiums Paid (Received) | Unrealized Appreciation/ (Depreciation) | |||||||||||||||||||
Arconic, Inc., 5.720%, 2/23/19, 6/20/22* | (1.00 | )% | Quarterly | 1.09 | % | USD | 200 | $ | 869 | $ | 7,244 | $ | (6,375 | ) | ||||||||||||
Boyd Gaming Corp., 6.875%, 5/15/23, 6/20/22* | (5.00 | ) | Quarterly | 0.92 | USD | 200 | (36,916 | ) | (25,580 | ) | (11,336 | ) | ||||||||||||||
California Resource Corp., 6.000%, 11/15/24, 6/20/22* | (5.00 | ) | Quarterly | 19.97 | USD | 600 | 258,455 | 164,006 | 94,449 | |||||||||||||||||
CDX-CMBX. | (3.00 | ) | Monthly | 7.25 | USD | 55 | 9,170 | 9,321 | (151 | ) | ||||||||||||||||
First Data Corp., 7.000%, 12/01/23, 6/20/22* | (5.00 | ) | Quarterly | 1.17 | USD | 600 | (102,824 | ) | (82,784 | ) | (20,040 | ) | ||||||||||||||
Gap, Inc. (The), 5.950%, 4/12/21, 6/20/22* | (1.00 | ) | Quarterly | 1.38 | USD | 200 | 3,606 | 16,528 | (12,922 | ) | ||||||||||||||||
Meritor, Inc., 6.250%, 2/15/24, 6/20/22* | (5.00 | ) | Quarterly | 1.08 | USD | 200 | (35,181 | ) | (22,539 | ) | (12,642 | ) | ||||||||||||||
Meritor, Inc., 6.250%, 2/15/24, 6/20/22* | (5.00 | ) | Quarterly | 1.08 | USD | 400 | (70,362 | ) | (44,600 | ) | (25,762 | ) | ||||||||||||||
Teck Resources Ltd., 3.750%, 2/01/23, 6/20/18* | (1.00 | ) | Quarterly | 0.14 | USD | 250 | (1,660 | ) | 1,281 | (2,941 | ) | |||||||||||||||
Yum! Brands, Inc., 6.250%, 3/15/18, 6/20/21* | (1.00 | ) | Quarterly | 0.33 | USD | 200 | (4,742 | ) | 9,967 | (14,709 | ) | |||||||||||||||
JPMorgan Chase Bank, NA | ||||||||||||||||||||||||||
Federative Republic of Brazil, 4.250%, 1/07/25, 6/20/22* | (1.00 | ) | Quarterly | 1.49 | USD | 200 | 4,351 | 11,112 | (6,761 | ) | ||||||||||||||||
| 34 | AB CREDIT LONG/SHORT PORTFOLIO | abfunds.com |
PORTFOLIO OF INVESTMENTS (continued)
| Swap Counterparty & Referenced Obligation | Fixed Rate (Pay) Receive | Payment Frequency | Implied Credit Spread at October 31, 2017 | Notional Amount (000) | Market Value | Upfront Premiums Paid (Received) | Unrealized Appreciation/ (Depreciation) | |||||||||||||||||||
Republic of Colombia, 10.375%, 1/28/33, 6/20/22* | (1.00 | )% | Quarterly | 0.95 | % | USD | 600 | $ | (1,248 | ) | $ | 10,955 | $ | (12,203 | ) | |||||||||||
Morgan Stanley & Co. International PLC | ||||||||||||||||||||||||||
Anglo American Capital, 4.450%, 9/27/20, 6/20/22* | (5.00 | ) | Quarterly | 0.96 | EUR | 200 | (44,357 | ) | (40,610 | ) | (3,747 | ) | ||||||||||||||
Arcelormittal, 6.125%, 6/01/18, 6/20/22* | (5.00 | ) | Quarterly | 1.12 | EUR | 200 | (42,486 | ) | (34,975 | ) | (7,511 | ) | ||||||||||||||
Morgan Stanley Capital Services LLC | ||||||||||||||||||||||||||
British Telecommunications PLC, 5.750%, 12/07/28, 12/20/20* | (1.00 | ) | Quarterly | 0.29 | EUR | 960 | (26,684 | ) | (6,532 | ) | (20,152 | ) | ||||||||||||||
Federative Republic of Brazil, 4.250%, 1/07/25, 6/20/22* | (1.00 | ) | Quarterly | 1.49 | USD | 200 | 4,352 | 12,258 | (7,906 | ) | ||||||||||||||||
Koninklijke KPN NV, 7.500%, 2/04/19, 12/20/20* | (1.00 | ) | Quarterly | 0.24 | EUR | 350 | (10,291 | ) | (355 | ) | (9,936 | ) | ||||||||||||||
Noble Holding International Ltd., 4.900%, 8/01/20, 12/20/21* | (1.00 | ) | Quarterly | 4.28 | USD | 150 | 17,607 | 25,246 | (7,639 | ) | ||||||||||||||||
Sale Contracts | ||||||||||||||||||||||||||
Bank of America, NA | ||||||||||||||||||||||||||
Genworth Holdings, Inc., 6.515%, 5/22/18, 6/20/20* | 5.00 | Quarterly | 5.55 | USD | 20 | (155 | ) | 466 | (621 | ) | ||||||||||||||||
Barclays Bank PLC | ||||||||||||||||||||||||||
Assured Guaranty Municipal Corp., 6/20/20* | 5.00 | Quarterly | 1.22 | USD | 20 | 2,024 | 832 | 1,192 | ||||||||||||||||||
| abfunds.com | AB CREDIT LONG/SHORT PORTFOLIO | 35 |
PORTFOLIO OF INVESTMENTS (continued)
| Swap Counterparty & Referenced Obligation | Fixed Rate (Pay) Receive | Payment Frequency | Implied Credit Spread at October 31, 2017 | Notional Amount (000) | Market Value | Upfront Premiums Paid (Received) | Unrealized Appreciation/ (Depreciation) | |||||||||||||||||||
K. Hovnanian Enterprises, Inc., 7.000%, 1/15/19, 6/20/22* | 5.00 | % | Quarterly | 10.07 | % | USD | 300 | $ | (46,903 | ) | $ | (71,454 | ) | $ | 24,551 | |||||||||||
Citibank, NA | ||||||||||||||||||||||||||
Nabors Industries, Inc., 6.150%, 2/15/18, 6/20/20* | 1.00 | Quarterly | 1.53 | USD | 20 | (364 | ) | (1,264 | ) | 900 | ||||||||||||||||
Safeway, Inc., 7.250%, 2/01/31, 6/20/20* | 1.00 | Quarterly | 2.13 | USD | 20 | (615 | ) | (921 | ) | 306 | ||||||||||||||||
Staples, Inc., 2.750%, 1/12/18, 6/20/20* | 1.00 | Quarterly | 3.20 | USD | 20 | (1,187 | ) | (449 | ) | (738 | ) | |||||||||||||||
Transocean, Inc., 7.375%, 4/15/18, 6/20/20* | 1.00 | Quarterly | 1.79 | USD | 1,200 | (25,662 | ) | (158,705 | ) | 133,043 | ||||||||||||||||
Unitymedia GmbH, 6.125%, 1/15/25, 6/20/20* | 5.00 | Quarterly | 0.52 | EUR | 90 | 13,023 | 8,717 | 4,306 | ||||||||||||||||||
Weatherford International Ltd., 4.500%, 4/15/22, 6/20/20* | 1.00 | Quarterly | 3.04 | USD | 20 | (1,102 | ) | (979 | ) | (123 | ) | |||||||||||||||
Credit Suisse International | ||||||||||||||||||||||||||
AT&T, Inc., 2.450%, 6/30/20, 9/20/19* | 1.00 | Quarterly | 0.19 | USD | 1,000 | 16,117 | 10,727 | 5,390 | ||||||||||||||||||
Avon Products, Inc., 6.500%, 3/01/19, 6/20/20* | 1.00 | Quarterly | 5.41 | USD | 20 | (2,235 | ) | (1,952 | ) | (283 | ) | |||||||||||||||
| 36 | AB CREDIT LONG/SHORT PORTFOLIO | abfunds.com |
PORTFOLIO OF INVESTMENTS (continued)
| Swap Counterparty & Referenced Obligation | Fixed Rate (Pay) Receive | Payment Frequency | Implied Credit Spread at October 31, 2017 | Notional Amount (000) | Market Value | Upfront Premiums Paid (Received) | Unrealized Appreciation/ (Depreciation) | |||||||||||||||||||||
Freeport-McMoRan, Inc., 3.550%, 3/01/22, 6/20/20* | 1.00 | % | Quarterly | 0.66 | % | USD | 20 | $ | 171 | $ | (800 | ) | $ | 971 | ||||||||||||||
Transocean, Inc., 7.375%, 4/15/18, 6/20/20* | 1.00 | Quarterly | 1.79 | USD | 20 | (428 | ) | (2,383 | ) | 1,955 | ||||||||||||||||||
Deutsche Bank AG | ||||||||||||||||||||||||||||
CDX-CMBX. | 3.00 | Monthly | 7.25 | USD | 189 | (31,509 | ) | (32,006 | ) | 497 | ||||||||||||||||||
Goldman Sachs International | ||||||||||||||||||||||||||||
CDX-CMBX.NA. | 5.00 | Monthly | 12.50 | USD | 80 | (20,939 | ) | (19,398 | ) | (1,541 | ) | |||||||||||||||||
|
|
|
|
|
| |||||||||||||||||||||||
| $ | (354,118 | ) | $ | (144,653 | ) | $ | (209,465 | ) | ||||||||||||||||||||
|
|
|
|
|
| |||||||||||||||||||||||
| * | Termination date |
TOTAL RETURN SWAPS (see Note D)
Counterparty & | # of Shares or Units | Rate Paid/ Received | Payment Frequency | Notional Amount (000) | Maturity Date | Unrealized Appreciation/ (Depreciation) | ||||||||||||||||||
Receive Total Return on Reference Obligation |
| |||||||||||||||||||||||
Bank of America, NA | ||||||||||||||||||||||||
iBoxx $ Liquid High Yield Index | 492,000 | LIBOR | Quarterly | 492 | 12/20/17 | $ | 5,108 | |||||||||||||||||
iBoxx $ Liquid High Yield Index | 598,000 | LIBOR | Quarterly | 598 | 12/20/17 | 4,963 | ||||||||||||||||||
Citibank, NA | ||||||||||||||||||||||||
iBoxx $ Liquid High Yield Index | 197,000 | LIBOR | Quarterly | 197 | 12/20/17 | 2,761 | ||||||||||||||||||
iBoxx $ Liquid High Yield Index | 197,000 | LIBOR | Quarterly | 197 | 12/20/17 | 2,245 | ||||||||||||||||||
JPMorgan Chase Bank, NA | ||||||||||||||||||||||||
iBoxx $ Liquid High Yield Index | 768,000 | LIBOR | Quarterly | 768 | 12/20/17 | 7,915 | ||||||||||||||||||
iBoxx $ Liquid High Yield Index | 767,000 | LIBOR | Quarterly | 767 | 12/20/17 | 7,904 | ||||||||||||||||||
Morgan Stanley & Co. International PLC | ||||||||||||||||||||||||
iBoxx $ Liquid High Yield Index | 605,000 | LIBOR | Quarterly | 605 | 12/20/17 | 5,662 | ||||||||||||||||||
| abfunds.com | AB CREDIT LONG/SHORT PORTFOLIO | 37 |
PORTFOLIO OF INVESTMENTS (continued)
Counterparty & | # of Shares or Units | Rate Paid/ Received | Payment Frequency | Notional Amount (000) | Maturity Date | Unrealized Appreciation/ (Depreciation) | ||||||||||||||||||
Morgan Stanley Capital Services LLC | ||||||||||||||||||||||||
iBoxx $ Liquid High Yield Index | 203,000 | LIBOR | Quarterly | 203 | 12/20/17 | $ | 2,246 | |||||||||||||||||
|
| |||||||||||||||||||||||
| $ | 38,804 | |||||||||||||||||||||||
|
| |||||||||||||||||||||||
| (a) | Pay-In-Kind Payments (PIK). The issuer may pay cash interest and/or interest in additional debt securities. Rates shown are the rates in effect at October 31, 2017. |
| (b) | Security is exempt from registration under Rule 144A of the Securities Act of 1933. These securities, which represent 0.44% of net assets as of October 31, 2017, are considered illiquid and restricted. Additional information regarding such securities follows: |
| 144A/Restricted & Illiquid Securities | Acquisition Date | Cost | Market Value | Percentage of Net Assets | ||||||||||||
Artsonig Pty Ltd. | 10/01/17 | $ | 42,346 | $ | 2,025 | 0.01 | % | |||||||||
Exide Technologies | 5/24/17 | 54,388 | 51,000 | 0.25 | % | |||||||||||
Exide Technologies | 6/01/17 | 17,473 | 18,073 | 0.09 | % | |||||||||||
Magnetation LLC/Mag Finance Corp. | 2/19/15 | 21,438 | – 0 | – | 0.00 | % | ||||||||||
Modular Space Corp. | 4/03/17 | 11,343 | 19,449 | 0.09 | % | |||||||||||
| (c) | Security in which significant unobservable inputs (Level 3) were used in determining fair value. |
| (d) | Illiquid security. |
| (e) | Fair valued by the Adviser. |
| (f) | Defaulted. |
| (g) | Non-income producing security. |
| (h) | Security is exempt from registration under Rule 144A of the Securities Act of 1933. These securities are considered restricted, but liquid and may be resold in transactions exempt from registration, normally to qualified institutional buyers. At October 31, 2017, the aggregate market value of these securities amounted to $(3,818,639) or (18.4)% of net assets. |
| (i) | Convertible security. |
| (j) | Coupon rate adjusts periodically based upon a predetermined schedule. Stated interest rate in effect at October 31, 2017. |
| (k) | Securities are perpetual and, thus, do not have a predetermined maturity date. The date shown, if applicable, reflects the next call date. |
| (l) | Floating Rate Security. Stated interest/floor rate was in effect at October 31, 2017. |
| (m) | Restricted and illiquid security. |
| Restricted & Illiquid Securities | Acquisition Date | Cost | Market Value | Percentage of Net Assets | ||||||||||||
CHC Group LLC | 3/23/17 | $ | 141,676 | $ | 13,559 | 0.07 | % | |||||||||
CHC Group LLC/CHC Finance Ltd. Series AI, 10/01/2020 | 3/10/17 | 67,364 | 137,101 | 0.66 | % | |||||||||||
Exide Technologies | 5/23/17 | – 0 | – | 6,379 | 0.03 | % | ||||||||||
| (n) | The stated coupon rate represents the greater of the LIBOR or the LIBOR floor rate plus a spread at October 31, 2017. |
| (o) | Affiliated investments. |
| 38 | AB CREDIT LONG/SHORT PORTFOLIO | abfunds.com |
PORTFOLIO OF INVESTMENTS (continued)
| (p) | To obtain a copy of the fund’s shareholder report, please go to the Securities and Exchange Commission’s website at www.sec.gov, or call AB at (800) 227-4618. |
| (q) | The rate shown represents the 7-day yield as of period end. |
| (r) | Position, or a portion thereof, has been segregated to collateralize OTC derivatives outstanding. |
Currency Abbreviations:
ARS – Argentine Peso
AUD – Australian Dollar
BRL – Brazilian Real
CAD – Canadian Dollar
CHF – Swiss Franc
DKK – Danish Krone
EUR – Euro
GBP – Great British Pound
INR – Indian Rupee
MXN – Mexican Peso
NZD – New Zealand Dollar
RUB – Russian Ruble
TRY – Turkish Lira
TWD – New Taiwan Dollar
USD – United States Dollar
ZAR – South African Rand
Glossary:
ABS – Asset-Backed Securities
BOBL – Bundesobligationen
BTP – Buoni del Tesoro Poliennali
CBT – Chicago Board of Trade
CDX-CMBX.NA – North American Commercial Mortgage-Backed Index
CDX-NAHY – North American High Yield Credit Default Swap Index
CDX-NAIG – North American Investment Grade Credit Default Swap Index
ETF – Exchange Traded Fund
EURIBOR – Euro Interbank Offered Rate
LIBOR – London Interbank Offered Rates
MSCI – Morgan Stanley Capital International
OAT – Obligations Assimilables du Trésor
REIT – Real Estate Investment Trust
SPDR – Standard & Poor’s Depository Receipt
See notes to financial statements.
| abfunds.com | AB CREDIT LONG/SHORT PORTFOLIO | 39 |
STATEMENT OF ASSETS & LIABILITIES
October 31, 2017
| Assets | ||||
Investments in securities, at value | ||||
Unaffiliated issuers (cost $15,098,003) | $ | 14,816,904 | ||
Affiliated issuers (cost $6,494,426) | 6,494,426 | |||
Cash | 319 | |||
Cash collateral due from broker | 356,757 | |||
Foreign currencies, at value (cost $56,050) | 41,027 | |||
Deposit at broker for securities sold short | 17,998,506 | |||
Receivable for investment securities sold | 556,375 | |||
Upfront premiums paid on credit default swaps | 487,301 | |||
Unrealized appreciation on credit default swaps | 279,160 | |||
Interest receivable | 168,852 | |||
Unrealized appreciation on forward currency exchange contracts | 46,182 | |||
Unrealized appreciation on total return swaps | 38,804 | |||
Receivable due from Adviser | 15,879 | |||
Affiliated dividends receivable | 3,299 | |||
Receivable for variation margin on exchange traded swaps | 1,763 | |||
Receivable for capital stock sold | 21 | |||
|
| |||
Total assets | 41,305,575 | |||
|
| |||
| Liabilities | ||||
Options written, at value (premiums received $3,909) | 2,321 | |||
Payable for securities sold short, at value (proceeds received $18,306,386) | 18,326,114 | |||
Upfront premiums received on credit default swaps | 631,954 | |||
Unrealized depreciation on credit default swaps | 488,625 | |||
Payable for investment securities purchased | 443,139 | |||
Interest expense payable | 323,614 | |||
Unrealized depreciation on forward currency exchange contracts | 15,148 | |||
Transfer Agent fee payable | 3,009 | |||
Directors’ fees payable | 2,486 | |||
Payable for variation margin on futures | 1,109 | |||
Distribution fee payable | 232 | |||
Accrued expenses and other liabilities | 279,899 | |||
|
| |||
Total liabilities | 20,517,650 | |||
|
| |||
Net Assets | $ | 20,787,925 | ||
|
| |||
| Composition of Net Assets | ||||
Capital stock, at par | $ | 2,139 | ||
Additional paid-in capital | 21,343,332 | |||
Accumulated net investment loss | (275,335 | ) | ||
Accumulated net realized gain on investment | 169,899 | |||
Net unrealized depreciation on investments | (452,110 | ) | ||
|
| |||
| $ | 20,787,925 | |||
|
| |||
See notes to financial statements.
| 40 | AB CREDIT LONG/SHORT PORTFOLIO | abfunds.com |
STATEMENT OF ASSETS & LIABILITIES (continued)
Net Asset Value Per Share—33 billion shares of capital stock authorized, $.001 par value
| Class | Net Assets | Shares Outstanding | Net Asset Value | |||||||||
| ||||||||||||
| A | $ | 89,684 | 9,297 | $ | 9.65 | * | ||||||
| ||||||||||||
| C | $ | 251,018 | 26,614 | $ | 9.43 | |||||||
| ||||||||||||
| Advisor | $ | 20,447,223 | 2,103,436 | $ | 9.72 | |||||||
| ||||||||||||
| * | The maximum offering price per share for Class A shares was $10.08 which reflects a sales charge of 4.25%. |
See notes to financial statements.
| abfunds.com | AB CREDIT LONG/SHORT PORTFOLIO | 41 |
STATEMENT OF OPERATIONS
Year Ended October 31, 2017
| Investment Income | ||||||||
Interest | $ | 988,332 | ||||||
Dividends | ||||||||
Affiliated issuers | 18,331 | |||||||
Unaffiliated issuers (net of foreign taxes withheld of $627) | 17,448 | |||||||
Other income | 9 | $ | 1,024,120 | |||||
|
| |||||||
| Expenses | ||||||||
Advisory fee (see Note B) | 183,721 | |||||||
Distribution fee—Class A | 414 | |||||||
Distribution fee—Class C | 1,958 | |||||||
Transfer agency—Class A | 159 | |||||||
Transfer agency—Class C | 222 | |||||||
Transfer agency—Advisor Class | 20,666 | |||||||
Custodian | 138,957 | |||||||
Audit and tax | 127,441 | |||||||
Administrative | 62,430 | |||||||
Registration fees | 48,943 | |||||||
Legal | 39,493 | |||||||
Directors’ fees | 28,135 | |||||||
Printing | 24,915 | |||||||
Miscellaneous | 23,173 | |||||||
|
| |||||||
Total operating expenses (see Note B) | 700,627 | |||||||
Interest expense | 1,014,536 | |||||||
Dividend expense on securities sold short | 5,505 | |||||||
Broker fee on securities sold short | 219,513 | |||||||
|
| |||||||
Total expenses | 1,940,181 | |||||||
Less: expenses waived and reimbursed by the Adviser (see Note B) | (488,604 | ) | ||||||
|
| |||||||
Net expenses | 1,451,577 | |||||||
|
| |||||||
Net investment loss | (427,457 | ) | ||||||
|
| |||||||
| Realized and Unrealized Gain (Loss) on Investment and Foreign Currency Transactions | ||||||||
Net realized gain (loss) on: | ||||||||
Investment transactions | 608,033 | |||||||
Securities sold short | (114,243 | ) | ||||||
Forward currency exchange contracts | 11,323 | |||||||
Futures | 21,214 | |||||||
Options written | 60,400 | |||||||
Swaps | (194,776 | ) | ||||||
Swaptions written | 7,565 | |||||||
Foreign currency transactions | (20,167 | ) | ||||||
Net change in unrealized appreciation/depreciation of: | ||||||||
Investments | (555,475 | ) | ||||||
Securities sold short | 7,460 | |||||||
Forward currency exchange contracts | 41,875 | |||||||
Futures | (109,833 | ) | ||||||
Options written | 974 | |||||||
Swaps | (49,541 | ) | ||||||
Foreign currency denominated assets and liabilities | (740 | ) | ||||||
|
| |||||||
Net loss on investment and foreign currency transactions | (285,931 | ) | ||||||
|
| |||||||
Contributions from Adviser (see Note B) | 14 | |||||||
|
| |||||||
Net Decrease in Net Assets from Operations | $ | (713,374 | ) | |||||
|
|
See notes to financial statements.
| 42 | AB CREDIT LONG/SHORT PORTFOLIO | abfunds.com |
STATEMENT OF CHANGES IN NET ASSETS
| Year Ended October 31, 2017 | Year Ended October 31, 2016 | |||||||
| Increase (Decrease) in Net Assets from Operations | ||||||||
Net investment loss | $ | (427,457 | ) | $ | (134,207 | ) | ||
Net realized gain on investment and foreign currency transactions | 379,349 | 379,304 | ||||||
Net change in unrealized appreciation/depreciation of investments and foreign currency denominated assets and liabilities | (665,280 | ) | 465,451 | |||||
Contributions from Adviser (see Note B) | 14 | – 0 | – | |||||
|
|
|
| |||||
Net increase (decrease) in net assets from operations | (713,374 | ) | 710,548 | |||||
| Distributions to Shareholders from | ||||||||
Net realized gain on investment transactions | ||||||||
Class A | (2,076 | ) | (686 | ) | ||||
Class C | (1,830 | ) | (427 | ) | ||||
Advisor Class | (241,188 | ) | (88,969 | ) | ||||
| Capital Stock Transactions | ||||||||
Net increase (decrease) | 505,177 | (632,280 | ) | |||||
|
|
|
| |||||
Total decrease | (453,291 | ) | (11,814 | ) | ||||
| Net Assets | ||||||||
Beginning of period | 21,241,216 | 21,253,030 | ||||||
|
|
|
| |||||
End of period (including accumulated net investment loss of ($275,335) and undistributed net investment income of $49,326, respectively) | $ | 20,787,925 | $ | 21,241,216 | ||||
|
|
|
| |||||
See notes to financial statements.
| abfunds.com | AB CREDIT LONG/SHORT PORTFOLIO | 43 |
NOTES TO FINANCIAL STATEMENTS
October 31, 2017
NOTE A
Significant Accounting Policies
AB Bond Fund, Inc. (the “Company”) is registered under the Investment Company Act of 1940 as an open-end management investment company. The Company, which is a Maryland corporation, operates as a series company comprised of eleven portfolios currently in operation. Each portfolio is considered to be a separate entity for financial reporting and tax purposes. This report relates only to the AB Credit Long/Short Portfolio (the “Portfolio”), a non-diversified portfolio. The Portfolio has authorized the issuance of Class A, Class B, Class C, Advisor Class, Class R, Class K, Class I, Class Z, Class T, Class 1 and Class 2 shares. Class B, Class R, Class K, Class I, Class Z, Class T, Class 1 and Class 2 shares are not being offered. Class A shares are sold with a front-end sales charge of up to 4.25% for purchases not exceeding $1,000,000. With respect to purchases of $1,000,000 or more, Class A shares redeemed within one year of purchase may be subject to a contingent deferred sales charge of 1%. Class C shares are subject to a contingent deferred sales charge of 1% on redemptions made within the first year after purchase and 0% after the first year of purchase. Effective April 10, 2017, Class C shares will automatically convert to Class A shares ten years after the end of the calendar month of purchase. Advisor Class shares are sold without any initial or contingent deferred sales charge and are not subject to ongoing distribution expenses. All eleven classes of shares have identical voting, dividend, liquidation and other rights, except that the classes bear different distribution and transfer agency expenses. Each class has exclusive voting rights with respect to its distribution plan. The financial statements have been prepared in conformity with U.S. generally accepted accounting principles (“U.S. GAAP”) which require management to make certain estimates and assumptions that affect the reported amounts of assets and liabilities in the financial statements and amounts of income and expenses during the reporting period. Actual results could differ from those estimates. The Portfolio is an investment company under U.S. GAAP and follows the accounting and reporting guidance applicable to investment companies. The following is a summary of significant accounting policies followed by the Portfolio.
1. Security Valuation
Portfolio securities are valued at their current market value determined on the basis of market quotations or, if market quotations are not readily available or are deemed unreliable, at “fair value” as determined in accordance with procedures established by and under the general supervision of the Company’s Board of Directors (the “Board”).
In general, the market values of securities which are readily available and deemed reliable are determined as follows: securities listed on a national
| 44 | AB CREDIT LONG/SHORT PORTFOLIO | abfunds.com |
NOTES TO FINANCIAL STATEMENTS (continued)
securities exchange (other than securities listed on the NASDAQ Stock Market, Inc. (“NASDAQ”)) or on a foreign securities exchange are valued at the last sale price at the close of the exchange or foreign securities exchange. If there has been no sale on such day, the securities are valued at the last traded price from the previous day. Securities listed on more than one exchange are valued by reference to the principal exchange on which the securities are traded; securities listed only on NASDAQ are valued in accordance with the NASDAQ Official Closing Price; listed or over the counter (“OTC”) market put or call options are valued at the mid level between the current bid and ask prices. If either a current bid or current ask price is unavailable, AllianceBernstein L.P. (the “Adviser”) will have discretion to determine the best valuation (e.g., last trade price in the case of listed options); open futures are valued using the closing settlement price or, in the absence of such a price, the most recent quoted bid price. If there are no quotations available for the day of valuation, the last available closing settlement price is used; U.S. Government securities and any other debt instruments having 60 days or less remaining until maturity are generally valued at market by an independent pricing vendor, if a market price is available. If a market price is not available, the securities are valued at amortized cost. This methodology is commonly used for short term securities that have an original maturity of 60 days or less, as well as short term securities that had an original term to maturity that exceeded 60 days. In instances when amortized cost is utilized, the Valuation Committee (the “Committee”) must reasonably conclude that the utilization of amortized cost is approximately the same as the fair value of the security. Such factors the Committee will consider include, but are not limited to, an impairment of the creditworthiness of the issuer or material changes in interest rates. Fixed-income securities, including mortgage-backed and asset-backed securities, may be valued on the basis of prices provided by a pricing service or at a price obtained from one or more of the major broker-dealers. In cases where broker-dealer quotes are obtained, the Adviser may establish procedures whereby changes in market yields or spreads are used to adjust, on a daily basis, a recently obtained quoted price on a security. Swaps and other derivatives are valued daily, primarily using independent pricing services, independent pricing models using market inputs, as well as third party broker-dealers or counterparties. Open end mutual funds are valued at the closing net asset value per share, while exchange traded funds are valued at the closing market price per share.
Securities for which market quotations are not readily available (including restricted securities) or are deemed unreliable are valued at fair value as deemed appropriate by the Adviser. Factors considered in making this determination may include, but are not limited to, information obtained by contacting the issuer, analysts, analysis of the issuer’s financial statements or other available documents. In addition, the Portfolio may use fair value
| abfunds.com | AB CREDIT LONG/SHORT PORTFOLIO | 45 |
NOTES TO FINANCIAL STATEMENTS (continued)
pricing for securities primarily traded in non-U.S. markets because most foreign markets close well before the Portfolio values its securities at 4:00 p.m., Eastern Time. The earlier close of these foreign markets gives rise to the possibility that significant events, including broad market moves, may have occurred in the interim and may materially affect the value of those securities. To account for this, the Portfolio generally values many of its foreign equity securities using fair value prices based on third party vendor modeling tools to the extent available.
2. Fair Value Measurements
In accordance with U.S. GAAP regarding fair value measurements, fair value is defined as the price that the Portfolio would receive to sell an asset or pay to transfer a liability in an orderly transaction between market participants at the measurement date. U.S. GAAP establishes a framework for measuring fair value, and a three-level hierarchy for fair value measurements based upon the transparency of inputs to the valuation of an asset or liability (including those valued based on their market values as described in Note A.1 above). Inputs may be observable or unobservable and refer broadly to the assumptions that market participants would use in pricing the asset or liability. Observable inputs reflect the assumptions market participants would use in pricing the asset or liability based on market data obtained from sources independent of the Portfolio. Unobservable inputs reflect the Portfolio’s own assumptions about the assumptions that market participants would use in pricing the asset or liability based on the best information available in the circumstances. Each investment is assigned a level based upon the observability of the inputs which are significant to the overall valuation. The three-tier hierarchy of inputs is summarized below.
| • | Level 1—quoted prices in active markets for identical investments |
| • | Level 2—other significant observable inputs (including quoted prices for similar investments, interest rates, prepayment speeds, credit risk, etc.) |
| • | Level 3—significant unobservable inputs (including the Portfolio’s own assumptions in determining the fair value of investments) |
The fair value of debt instruments, such as bonds, and over-the-counter derivatives is generally based on market price quotations, recently executed market transactions (where observable) or industry recognized modeling techniques and are generally classified as Level 2. Pricing vendor inputs to Level 2 valuations may include quoted prices for similar investments in active markets, interest rate curves, coupon rates, currency rates, yield curves, option adjusted spreads, default rates, credit spreads and other unique security features in order to estimate the relevant cash flows which are then discounted to calculate fair values. If these inputs are
| 46 | AB CREDIT LONG/SHORT PORTFOLIO | abfunds.com |
NOTES TO FINANCIAL STATEMENTS (continued)
unobservable and significant to the fair value, these investments will be classified as Level 3. In addition, non-agency rated investments are classified as Level 3.
Where readily available market prices or relevant bid prices are not available for certain equity investments, such investments may be valued based on similar publicly traded investments, movements in relevant indices since last available prices or based upon underlying company fundamentals and comparable company data (such as multiples to earnings or other multiples to equity). Where an investment is valued using an observable input, such as another publicly traded security, the investment will be classified as Level 2. If management determines that an adjustment is appropriate based on restrictions on resale, illiquidity or uncertainty, and such adjustment is a significant component of the valuation, the investment will be classified as Level 3. An investment will also be classified as Level 3 where management uses company fundamentals and other significant inputs to determine the valuation.
Options are valued using market-based inputs to models, broker or dealer quotations, or alternative pricing sources with reasonable levels of price transparency, where such inputs and models are available. Alternatively the values may be obtained through unobservable management determined inputs and/or management’s proprietary models. Where models are used, the selection of a particular model to value an option depends upon the contractual terms of, and specific risks inherent in, the option as well as the availability of pricing information in the market. Valuation models require a variety of inputs, including contractual terms, market prices, measures of volatility and correlations of such inputs. Exchange traded options generally will be classified as Level 2. For options that do not trade on exchange but trade in liquid markets, inputs can generally be verified and model selection does not involve significant management judgment. Options are classified within Level 2 on the fair value hierarchy when all of the significant inputs can be corroborated to market evidence. Otherwise such instruments are classified as Level 3.
The following table summarizes the valuation of the Portfolio’s investments by the above fair value hierarchy levels as of October 31, 2017:
Investments in | Level 1 | Level 2 | Level 3 | Total | ||||||||||||
Assets: | ||||||||||||||||
Corporates – Non-Investment Grade | $ | – 0 | – | $ | 5,254,225 | $ | 98,399 | (a) | $ | 5,352,624 | ||||||
Corporates – Investment Grade | – 0 | – | 4,184,704 | – 0 | – | 4,184,704 | ||||||||||
Emerging Markets – Corporate Bonds | – 0 | – | 553,351 | – 0 | – | 553,351 | ||||||||||
Common Stocks | 373,938 | 100,330 | 51,680 | 525,948 | ||||||||||||
Inflation-Linked Securities | – 0 | – | 335,085 | – 0 | – | 335,085 | ||||||||||
Governments – Treasuries | – 0 | – | 331,232 | – 0 | – | 331,232 | ||||||||||
| abfunds.com | AB CREDIT LONG/SHORT PORTFOLIO | 47 |
NOTES TO FINANCIAL STATEMENTS (continued)
Investments in | Level 1 | Level 2 | Level 3 | Total | ||||||||||||
Emerging Markets – Sovereigns | $ | – 0 | – | $ | 288,559 | $ | – 0 | – | $ | 288,559 | ||||||
Preferred Stocks | – 0 | – | 32,456 | 253,148 | 285,604 | |||||||||||
Asset-Backed Securities | – 0 | – | – 0 | – | 261,546 | 261,546 | ||||||||||
Emerging Markets – Treasuries | – 0 | – | 183,008 | – 0 | – | 183,008 | ||||||||||
Bank Loans | – 0 | – | 144,923 | – 0 | – | 144,923 | ||||||||||
Collateralized Mortgage Obligations | – 0 | – | 143,693 | – 0 | – | 143,693 | ||||||||||
Options Purchased – Puts | – 0 | – | 4,868 | – 0 | – | 4,868 | ||||||||||
Warrants | 3,239 | – 0 | – | 334 | 3,573 | |||||||||||
Short-Term Investments: | ||||||||||||||||
Investment Companies | 6,494,426 | – 0 | – | – 0 | – | 6,494,426 | ||||||||||
U.S. Treasury Bills | – 0 | – | 2,218,186 | – 0 | – | 2,218,186 | ||||||||||
Liabilities: | ||||||||||||||||
Corporates – Non-Investment Grade | – 0 | – | (14,010,241 | ) | – 0 | – | (14,010,241 | ) | ||||||||
Corporates – Investment Grade | – 0 | – | (3,479,591 | ) | – 0 | – | (3,479,591 | ) | ||||||||
Preferred Stocks | (405,280 | ) | – 0 | – | – 0 | – | (405,280 | ) | ||||||||
Emerging Markets – Corporate Bonds | – 0 | – | (296,000 | ) | – 0 | – | (296,000 | ) | ||||||||
Emerging Markets – Sovereigns | – 0 | – | (135,002 | ) | – 0 | – | (135,002 | ) | ||||||||
|
|
|
|
|
|
|
| |||||||||
Total Investments in Securities | 6,466,323 | (4,146,214 | ) | 665,107 | 2,985,216 | |||||||||||
Other Financial Instruments(b): | ||||||||||||||||
Assets: | ||||||||||||||||
Futures | 14,866 | – 0 | – | – 0 | – | 14,866 | (c) | |||||||||
Forward Currency Exchange Contracts | – 0 | – | 46,182 | – 0 | – | 46,182 | ||||||||||
Centrally Cleared Credit Default Swaps | – 0 | – | 52,024 | – 0 | – | 52,024 | (c) | |||||||||
Credit Default Swaps | – 0 | – | 449,860 | – 0 | – | 449,860 | ||||||||||
Total Return Swaps | – 0 | – | 38,804 | – 0 | – | 38,804 | ||||||||||
Liabilities: | ||||||||||||||||
Futures | (39,759 | ) | – 0 | – | – 0 | – | (39,759 | )(c) | ||||||||
Forward Currency Exchange Contracts | – 0 | – | (15,148 | ) | – 0 | – | (15,148 | ) | ||||||||
Put Options Written | – 0 | – | (2,321 | ) | – 0 | – | (2,321 | ) | ||||||||
Centrally Cleared Credit Default Swaps | – 0 | – | (38,686 | ) | – 0 | – | (38,686 | )(c) | ||||||||
Centrally Cleared Interest Rate Swaps | – 0 | – | (1,249 | ) | – 0 | – | (1,249 | )(c) | ||||||||
Credit Default Swaps | – 0 | – | (803,978 | ) | – 0 | – | (803,978 | ) | ||||||||
|
|
|
|
|
|
|
| |||||||||
Total(d) | $ | 6,441,430 | $ | (4,420,726 | ) | $ | 665,107 | $ | 2,685,811 | |||||||
|
|
|
|
|
|
|
| |||||||||
| (a) | The Portfolio held securities with zero market value at period end. |
| (b) | Other financial instruments are derivative instruments, such as futures, forwards and swaps, which are valued at the unrealized appreciation/depreciation on the instrument. Other financial instruments may also include swaps with upfront premiums which are valued at market value. |
| (c) | Only variation margin receivable/(payable) at period end is reported within the statement of assets and liabilities. This amount reflects cumulative unrealized appreciation/(depreciation) of exchange-traded derivatives as reported in the portfolio of investments. Exchange-traded swaps with upfront premiums are presented here as market value. |
| (d) | There were de minimis transfers under 1% of net assets between Level 1 and Level 2 during the reporting period. |
The Portfolio recognizes all transfers between levels of the fair value hierarchy assuming the financial instruments were transferred at the beginning of the reporting period.
| 48 | AB CREDIT LONG/SHORT PORTFOLIO | abfunds.com |
NOTES TO FINANCIAL STATEMENTS (continued)
The following is a reconciliation of investments in which significant unobservable inputs (Level 3) were used in determining fair value.
| Corporates - Non- Investment Grade(a) | Common Stocks | Preferred Stocks | ||||||||||
Balance as of 10/31/16 | $ | 11,069 | $ | 2,355 | $ | – 0 | – | |||||
Accrued discounts/(premiums) | (1,475 | ) | – 0 | – | – 0 | – | ||||||
Realized gain (loss) | – 0 | – | 5,818 | – 0 | – | |||||||
Change in unrealized appreciation/depreciation | (70,197 | ) | (1,378 | ) | 42,605 | |||||||
Purchases/Payups | 110,677 | 51,793 | 385,875 | |||||||||
Sales/Paydowns | (10,127 | ) | (11,798 | ) | (175,332 | ) | ||||||
Transfers in to Level 3 | 58,452 | 4,890 | – 0 | – | ||||||||
Transfers out of Level 3 | – 0 | – | – 0 | – | – 0 | – | ||||||
|
|
|
|
|
| |||||||
Balance as of 10/31/17 | $ | 98,399 | $ | 51,680 | $ | 253,148 | ||||||
|
|
|
|
|
| |||||||
Net change in unrealized appreciation/depreciation from investments held as of 10/31/17(b) | $ | (68,175 | ) | $ | (807 | ) | $ | 42,605 | ||||
|
|
|
|
|
| |||||||
| Asset-Backed Securities | Bank Loans | Warrants | ||||||||||
Balance as of 10/31/16 | $ | 212,888 | $ | 5,508 | $ | 15,204 | ||||||
Accrued discounts/(premiums) | 566 | – 0 | – | – 0 | – | |||||||
Realized gain (loss) | 2,123 | (37,131 | ) | – 0 | – | |||||||
Change in unrealized appreciation/depreciation | 2,744 | 36,865 | (7,010 | ) | ||||||||
Purchases/Payups | – 0 | – | 833 | – 0 | – | |||||||
Sales/Paydowns | (11,421 | ) | (6,075 | ) | – 0 | – | ||||||
Transfers in to Level 3 | 54,646 | – 0 | – | – 0 | – | |||||||
Transfers out of Level 3 | – 0 | – | – 0 | – | (7,860 | ) | ||||||
|
|
|
|
|
| |||||||
Balance as of 10/31/17 | $ | 261,546 | $ | – 0 | – | $ | 334 | |||||
|
|
|
|
|
| |||||||
Net change in unrealized appreciation/depreciation from investments held as of 10/31/17(b) | $ | 2,744 | $ | – 0 | – | $ | (7,010 | ) | ||||
|
|
|
|
|
| |||||||
| Total | ||||||||||||
Balance as of 10/31/16 | $ | 247,024 | ||||||||||
Accrued discounts/(premiums) | (909 | ) | ||||||||||
Realized gain (loss) | (29,190 | ) | ||||||||||
Change in unrealized appreciation/depreciation | 3,629 | |||||||||||
Purchases/Payups | 549,178 | |||||||||||
Sales/Paydowns | (214,753 | ) | ||||||||||
Transfers in to Level 3 | 117,988 | |||||||||||
Transfers out of Level 3 | (7,860 | ) | ||||||||||
|
| |||||||||||
Balance as of 10/31/17 | $ | 665,107 | (c) | |||||||||
|
| |||||||||||
Net change in unrealized appreciation/depreciation from investments held as of 10/31/17(b) | $ | (30,643 | ) | |||||||||
|
| |||||||||||
| (a) | The Portfolio held securities with zero market value at period end. |
| (b) | The unrealized appreciation/(depreciation) is included in net change in unrealized appreciation/(depreciation) on investments and other financial instruments in the accompanying statement of operations. |
| (c) | There were de minimis transfers under 1% of net assets during the reporting period. |
| abfunds.com | AB CREDIT LONG/SHORT PORTFOLIO | 49 |
NOTES TO FINANCIAL STATEMENTS (continued)
The following presents information about significant unobservable inputs related to the Portfolio’s Level 3 investments at October 31, 2017. Securities priced (i) by third party vendors or (ii) using prior transaction prices, which approximate fair value, are excluded from the following table.
Quantitative Information about Level 3 Fair Value Measurements
| Fair Value at 10/31/17 | Valuation | Unobservable | Input | |||||||
Corporates – | $ | 5,086 |
| Recovery Analysis | Collateral Value | $100.00 / NA | ||||
Common Stock | $ | 7,925 | Market Approach | EBITDA* Projection | $96.00MM / N/A | |||||
| EBITDA* Multiples | 8.5–9.5X / 9.0 | |||||||||
Preferred Stocks | $ | 7,857 | Market Approach | EBITDA* Projection | $96.00MM / N/A | |||||
| EBITDA* Multiples | 8.5–9.5X / 9.0 | |||||||||
Warrants | $ | 334 | Option Pricing Model | Exercise Price | $6.64 / N/A | |||||
| * | Earnings before Interest, Taxes, Depreciation and Amortization. |
| Generally, a change in the assumptions used in any input in isolation may be accompanied by a change in another input. Significant changes in any of the unobservable inputs may significantly impact the fair value measurement. A significant increase (decrease) in appraisal value and EBITDA projections/multiples in insolation would be expected to result in a significant higher (lower) fair value measurement. |
The Adviser established the Committee to oversee the pricing and valuation of all securities held in the Portfolio. The Committee operates under pricing and valuation policies and procedures established by the Adviser and approved by the Board, including pricing policies which set forth the mechanisms and processes to be employed on a daily basis to implement these policies and procedures. In particular, the pricing policies describe how to determine market quotations for securities and other instruments. The Committee’s responsibilities include: 1) fair value and liquidity determinations (and oversight of any third parties to whom any responsibility for fair value and liquidity determinations is delegated), and 2) regular monitoring of the Adviser’s pricing and valuation policies and procedures and modification or enhancement of these policies and procedures (or recommendation of the modification of these policies and procedures) as the Committee believes appropriate.
The Committee is also responsible for monitoring the implementation of the pricing policies by the Adviser’s Pricing Group (the “Pricing Group”) and any third party which performs certain pricing functions in accordance with the pricing policies. The Pricing Group is responsible for the oversight of the third party on a day-to-day basis. The Committee and the Pricing Group perform a series of activities to provide reasonable assurance of the accuracy of prices including: 1) periodic vendor due diligence meetings,
| 50 | AB CREDIT LONG/SHORT PORTFOLIO | abfunds.com |
NOTES TO FINANCIAL STATEMENTS (continued)
review of methodologies, new developments and processes at vendors, 2) daily comparison of security valuation versus prior day for all securities that exceeded established thresholds, and 3) daily review of unpriced, stale, and variance reports with exceptions reviewed by senior management and the Committee.
In addition, several processes outside of the pricing process are used to monitor valuation issues including: 1) performance and performance attribution reports are monitored for anomalous impacts based upon benchmark performance, and 2) portfolio managers review all portfolios for performance and analytics (which are generated using the Adviser’s prices).
3. Currency Translation
Assets and liabilities denominated in foreign currencies and commitments under forward currency exchange contracts are translated into U.S. dollars at the mean of the quoted bid and ask prices of such currencies against the U.S. dollar. Purchases and sales of portfolio securities are translated into U.S. dollars at the rates of exchange prevailing when such securities were acquired or sold. Income and expenses are translated into U.S. dollars at rates of exchange prevailing when accrued.
Net realized gain or loss on foreign currency transactions represents foreign exchange gains and losses from sales and maturities of foreign fixed income investments, holding of foreign currencies, currency gains or losses realized between the trade and settlement dates on foreign investment transactions, and the difference between the amounts of dividends, interest and foreign withholding taxes recorded on the Portfolio’s books and the U.S. dollar equivalent amounts actually received or paid. Net unrealized currency gains and losses from valuing foreign currency denominated assets and liabilities at period end exchange rates are reflected as a component of net unrealized appreciation or depreciation of foreign currency denominated assets and liabilities.
4. Taxes
It is the Portfolio’s policy to meet the requirements of the Internal Revenue Code applicable to regulated investment companies and to distribute all of its investment company taxable income and net realized gains, if any, to shareholders. Therefore, no provisions for federal income or excise taxes are required. The Portfolio may be subject to taxes imposed by countries in which it invests. Such taxes are generally based on income and/or capital gains earned or repatriated. Taxes are accrued and applied to net investment income, net realized gains and net unrealized appreciation/depreciation as such income and/or gains are earned.
In accordance with U.S. GAAP requirements regarding accounting for uncertainties in income taxes, management has analyzed the Portfolio’s
| abfunds.com | AB CREDIT LONG/SHORT PORTFOLIO | 51 |
NOTES TO FINANCIAL STATEMENTS (continued)
tax positions taken or expected to be taken on federal and state income tax returns for all open tax years (the current tax year and the prior tax years) and has concluded that no provision for income tax is required in the Portfolio’s financial statements.
5. Investment Income and Investment Transactions
Dividend income (or dividend expense) is recorded on the ex-dividend date or as soon as the Portfolio is informed of the dividend. Interest income (or interest expense) is accrued daily. Investment transactions are accounted for on the date the securities are purchased or sold. Investment gains or losses are determined on the identified cost basis. The Portfolio amortizes premiums and accretes discounts as adjustments to interest income.
6. Class Allocations
All income earned and expenses incurred by the Portfolio are borne on a pro-rata basis by each outstanding class of shares, based on the proportionate interest in the Portfolio represented by the net assets of such class, except for class specific expenses which are allocated to the respective class. Expenses of the Company are charged proportionately to each portfolio or based on other appropriate methods. Realized and unrealized gains and losses are allocated among the various share classes based on respective net assets.
7. Dividends and Distributions
Dividends and distributions to shareholders, if any, are recorded on the ex-dividend date. Income dividends and capital gains distributions are determined in accordance with federal tax regulations and may differ from those determined in accordance with U.S. GAAP. To the extent these differences are permanent, such amounts are reclassified within the capital accounts based on their federal tax basis treatment; temporary differences do not require such reclassification.
NOTE B
Advisory Fee and Other Transactions with Affiliates
Under the terms of the investment advisory agreement, the Portfolio pays the Adviser an advisory fee at an annual rate of .85% of the Portfolio’s average daily net assets. Effective January 1, 2017, the advisory fee was reduced from .90% to .85% of the Portfolio’s average daily net assets. The fee is accrued daily and paid monthly. The Adviser has agreed to waive its fees and bear certain expenses to the extent necessary to limit total operating expenses (excluding expenses associated with securities sold short, acquired fund fees and expenses other than the advisory fees of any AB Mutual Funds in which the Portfolio may invest, interest expense, taxes, extraordinary expenses, and brokerage commissions and other transaction costs), on an annual basis (the “Expense Caps”) to 1.24%, 1.99% and .99% of daily average net assets for Class A, Class C and
| 52 | AB CREDIT LONG/SHORT PORTFOLIO | abfunds.com |
NOTES TO FINANCIAL STATEMENTS (continued)
Advisor Class shares, respectively. Effective January 1, 2017, the Expense Caps were reduced from 1.35% to 1.24%, 2.10% to 1.99% and 1.10% to .99% of the daily average net assets for Class A, Class C, and Advisor Class shares, respectively. Any fees waived and expenses borne by the Adviser through October 31, 2014 were subject to repayment by the Portfolio until October 31, 2017; any fees waived and expense borne by the Adviser from November 1, 2014 to May 6, 2015 are subject to repayment by the Portfolio until October 31, 2018; such waivers that are currently subject to repayment amount to $212,257. In any case, no reimbursement payment will be made that would cause the Portfolio’s total annual operating expenses to exceed the net fee percentage set forth above. For the year ended October 31, 2017, such reimbursements/waivers amounted to $419,989. The Expense Caps may not be terminated by the Adviser before January 31, 2018.
During the year ended October 31, 2017, the Adviser reimbursed the Portfolio $14 for trading losses incurred due to a trade entry error.
Pursuant to the investment advisory agreement, the Portfolio may reimburse the Adviser for certain legal and accounting services provided to the Portfolio by the Adviser. For the year ended October 31, 2017, the Adviser voluntarily agreed to waive such fees in the amount of $62,430.
The Portfolio compensates AllianceBernstein Investor Services, Inc. (“ABIS”), a wholly-owned subsidiary of the Adviser, under a Transfer Agency Agreement for providing personnel and facilities to perform transfer agency services for the Portfolio. ABIS may make payments to intermediaries that provide omnibus account services, sub-accounting services and/or networking services. Such compensation retained by ABIS amounted to $17,987 for the year ended October 31, 2017.
AllianceBernstein Investments, Inc. (the “Distributor”), a wholly-owned subsidiary of the Adviser, serves as the distributor of the Portfolio’s shares. The Distributor has advised the Portfolio that it has retained front-end sales charges of $27 from the sale of Class A shares and received $0 in contingent deferred sales charges imposed upon redemptions by shareholders of Class C shares for the year ended October 31, 2017.
The Portfolio may invest in AB Government Money Market Portfolio (the “Government Money Market Portfolio”) which has a contractual annual advisory fee rate of .20% of the portfolio’s average daily net assets and bears its own expenses. In connection with the investment by the Portfolio in the Government Money Market Portfolio, the Adviser has contractually agreed to waive its advisory fee from the Portfolio in an amount equal to the Portfolio’s pro rata share of the effective advisory fees of Government Money Market Portfolio, as borne indirectly by the Portfolio as an acquired
| abfunds.com | AB CREDIT LONG/SHORT PORTFOLIO | 53 |
NOTES TO FINANCIAL STATEMENTS (continued)
fund fee and expense. For the year ended October 31, 2017, such waiver amounted to $6,185.
A summary of the Portfolio’s transactions in AB mutual funds for the year ended October 31, 2017 is as follows:
| Portfolio | Market Value 10/31/16 (000) | Purchases at Cost (000) | Sales Proceeds (000) | Market Value 10/31/17 (000) | Dividend Income (000) | |||||||||||||||
Government Money Market Portfolio | $ | 4,595 | $ | 33,208 | $ | 31,309 | $ | 6,494 | $ | 18 | ||||||||||
Brokerage commissions paid on investment transactions for the year ended October 31, 2017 amounted to $10,287, of which $0 and $0, respectively, was paid to Sanford C. Bernstein & Co. LLC and Sanford C. Bernstein Limited, affiliates of the Adviser.
NOTE C
Distribution Services Agreement
The Portfolio has adopted a Distribution Services Agreement (the “Agreement”) pursuant to Rule 12b-1 under the Investment Company Act of 1940. Under the Agreement, the Portfolio pays distribution and servicing fees to the Distributor at an annual rate of up to .25% of the Portfolio’s average daily net assets attributable to Class A shares, 1% of the Portfolio’s average daily net assets attributable to Class C shares. There are no distribution and servicing fees on the Advisor Class shares. The fees are accrued daily and paid monthly. The Agreement provides that the Distributor will use such payments in their entirety for distribution assistance and promotional activities. Since the commencement of the Portfolio’s operations, the Distributor has incurred expenses in excess of the distribution costs reimbursed by the Portfolio in the amount of $1,472 for Class C shares. While such costs may be recovered from the Portfolio in future periods so long as the Agreement is in effect, the rate of the distribution and servicing fees payable under the Agreement may not be increased without a shareholder vote. In accordance with the Agreement, there is no provision for recovery of unreimbursed distribution costs incurred by the Distributor beyond the current fiscal year for Class A shares. The Agreement also provides that the Adviser may use its own resources to finance the distribution of the Portfolio’s shares.
NOTE D
Investment Transactions
Purchases and sales of investment securities (excluding short-term investments) for the year ended October 31, 2017, were as follows:
Purchases | Sales | Securities Sold Short | Covers on Securities Sold Short | |||||||||||
| $ | 15,402,158 | $ | 14,330,483 | $ | 12,722,564 | $ | 10,832,127 | |||||||
| 54 | AB CREDIT LONG/SHORT PORTFOLIO | abfunds.com |
NOTES TO FINANCIAL STATEMENTS (continued)
During the year ended October 31, 2017, there were no purchases or sales of U.S. Government Securities.
The cost of investments for federal income tax purposes, gross unrealized appreciation and unrealized depreciation are as follows:
Cost of | Gross Unrealized | Net Unrealized Depreciation on Investments | Net Unrealized Depreciation on Securities Sold Short | Net Unrealized depreciation | ||||||||||||||||
| Appreciation on Investments | Depreciation on Investments | |||||||||||||||||||
| $ 21,610,490 | $ | 1,246,521 | $ | (1,506,809 | ) | $ | (260,288 | ) | $ | (19,728 | )(a) | $ | (280,016 | ) | ||||||
| (a) | Gross unrealized appreciation was $534,367 and gross unrealized depreciation was $(554,095), resulting in net unrealized depreciation of $(19,728). |
1. Derivative Financial Instruments
The Portfolio may use derivatives in an effort to earn income and enhance returns, to replace more traditional direct investments, to obtain exposure to otherwise inaccessible markets (collectively, “investment purposes”), or to hedge or adjust the risk profile of its portfolio.
The principal types of derivatives utilized by the Portfolio, as well as the methods in which they may be used are:
| • | Futures |
The Portfolio may buy or sell futures for investment purposes or for the purpose of hedging its portfolio against adverse effects of potential movements in the market. The Portfolio bears the market risk that arises from changes in the value of these instruments and the imperfect correlation between movements in the price of the futures and movements in the price of the assets, reference rates or indices which they are designed to track. Among other things, the Portfolio may purchase or sell futures for foreign currencies or options thereon for non-hedging purposes as a means of making direct investment in foreign currencies, as described below under “Currency Transactions”.
At the time the Portfolio enters into futures, the Portfolio deposits and maintains as collateral an initial margin with the broker, as required by the exchange on which the transaction is effected. Such amount is shown as cash collateral due from broker on the statement of assets and liabilities. Pursuant to the contract, the Portfolio agrees to receive from or pay to the broker an amount of cash equal to the daily fluctuation in the value of the contract. Such receipts or payments are known as variation margin and are recorded by the Portfolio as unrealized gains or losses. Risks may arise from the potential inability of a counterparty to meet the terms of the contract. The credit/counterparty risk for exchange-traded futures is generally less than privately negotiated futures, since the clearinghouse, which is the issuer or counterparty to each exchange-traded future, has robust risk
| abfunds.com | AB CREDIT LONG/SHORT PORTFOLIO | 55 |
NOTES TO FINANCIAL STATEMENTS (continued)
mitigation standards, including the requirement to provide initial and variation margin. When the contract is closed, the Portfolio records a realized gain or loss equal to the difference between the value of the contract at the time it was opened and the time it was closed.
Use of long futures subjects the Portfolio to risk of loss in excess of the amounts shown on the statement of assets and liabilities, up to the notional value of the futures. Use of short futures subjects the Portfolio to unlimited risk of loss. Under some circumstances, futures exchanges may establish daily limits on the amount that the price of futures can vary from the previous day’s settlement price, which could effectively prevent liquidation of unfavorable positions.
During the year ended October 31, 2017, the Portfolio held futures for hedging and non-hedging purposes.
| • | Forward Currency Exchange Contracts |
The Portfolio may enter into forward currency exchange contracts in order to hedge its exposure to changes in foreign currency exchange rates on its foreign portfolio holdings, to hedge certain firm purchase and sale commitments denominated in foreign currencies and for non-hedging purposes as a means of making direct investments in foreign currencies, as described below under “Currency Transactions”.
A forward currency exchange contract is a commitment to purchase or sell a foreign currency at a future date at a negotiated forward rate. The gain or loss arising from the difference between the original contract and the closing of such contract would be included in net realized gain or loss on forward currency exchange contracts. Fluctuations in the value of open forward currency exchange contracts are recorded for financial reporting purposes as unrealized appreciation and/or depreciation by the Portfolio. Risks may arise from the potential inability of a counterparty to meet the terms of a contract and from unanticipated movements in the value of a foreign currency relative to the U.S. dollar.
During the year ended October 31, 2017, the Portfolio held forward currency exchange contracts for hedging and non-hedging purposes.
| • | Option Transactions |
For hedging and investment purposes, the Portfolio may purchase and write (sell) put and call options on U.S. and foreign securities, including government securities, and foreign currencies that are traded on U.S. and foreign securities exchanges and over-the-counter markets. Among other things, the Portfolio may use options transactions for non-hedging purposes as a means of making direct investments in foreign currencies, as described below under
| 56 | AB CREDIT LONG/SHORT PORTFOLIO | abfunds.com |
NOTES TO FINANCIAL STATEMENTS (continued)
“Currency Transactions” and may use options strategies involving the purchase and/or writing of various combinations of call and/or put options, for hedging and investment purposes.
The risk associated with purchasing an option is that the Portfolio pays a premium whether or not the option is exercised. Additionally, the Portfolio bears the risk of loss of the premium and change in market value should the counterparty not perform under the contract. If a put or call option purchased by the Portfolio was permitted to expire without being sold or exercised, its premium would represent a loss to the Portfolio. Put and call options purchased are accounted for in the same manner as portfolio securities. The cost of securities acquired through the exercise of call options is increased by premiums paid. The proceeds from securities sold through the exercise of put options are decreased by the premiums paid.
When the Portfolio writes an option, the premium received by the Portfolio is recorded as a liability and is subsequently adjusted to the current market value of the option written. Premiums received from written options which expire unexercised are recorded by the Portfolio on the expiration date as realized gains from options written. The difference between the premium received and the amount paid on effecting a closing purchase transaction, including brokerage commissions, is also treated as a realized gain, or if the premium received is less than the amount paid for the closing purchase transaction, as a realized loss. If a call option is exercised, the premium received is added to the proceeds from the sale of the underlying security or currency in determining whether the Portfolio has realized a gain or loss. If a put option is exercised, the premium received reduces the cost basis of the security or currency purchased by the Portfolio. In writing an option, the Portfolio bears the market risk of an unfavorable change in the price of the security or currency underlying the written option. Exercise of an option written by the Portfolio could result in the Portfolio selling or buying a security or currency at a price different from the current market value.
At October 31, 2017, the maximum payments for written put options amounted to $2,229,500. In certain circumstances maximum payout amounts may be partially offset by recovery values of the respective referenced assets and upfront premium received upon entering into the contract.
The Portfolio may also invest in options on swap agreements, also called “swaptions”. A swaption is an option that gives the buyer the right, but not the obligation, to enter into a swap on a future date in exchange for paying a market-based “premium”. A receiver swaption gives the owner the right to receive the total return of a specified
| abfunds.com | AB CREDIT LONG/SHORT PORTFOLIO | 57 |
NOTES TO FINANCIAL STATEMENTS (continued)
asset, reference rate, or index. A payer swaption gives the owner the right to pay the total return on a specified asset, reference rate, or index. Swaptions also include options that allow an existing swap to be terminated or extended by one of the counterparties.
During the year ended October 31, 2017, the Portfolio held purchased options for hedging and non-hedging purposes. During the year ended October 31, 2017, the Portfolio held written options for hedging and non-hedging purposes.
During the year ended October 31, 2017, the Portfolio held written swaptions for hedging and non-hedging purposes.
| • | Swaps |
The Portfolio may enter into swaps to hedge its exposure to interest rates, credit risk, equity markets or currencies. The Portfolio may also enter into swaps for non-hedging purposes as a means of gaining market exposures, making direct investments in foreign currencies, as described below under “Currency Transactions” or in order to take a “long” or “short” position with respect to an underlying referenced asset described below under “Total Return Swaps”. A swap is an agreement that obligates two parties to exchange a series of cash flows at specified intervals based upon or calculated by reference to changes in specified prices or rates for a specified amount of an underlying asset. The payment flows are usually netted against each other, with the difference being paid by one party to the other. In addition, collateral may be pledged or received by the Portfolio in accordance with the terms of the respective swaps to provide value and recourse to the Portfolio or its counterparties in the event of default, bankruptcy or insolvency by one of the parties to the swap.
Risks may arise as a result of the failure of the counterparty to the swap to comply with the terms of the swap. The loss incurred by the failure of a counterparty is generally limited to the net interim payment to be received by the Portfolio, and/or the termination value at the end of the contract. Therefore, the Portfolio considers the creditworthiness of each counterparty to a swap in evaluating potential counterparty risk. This risk is mitigated by having a netting arrangement between the Portfolio and the counterparty and by the posting of collateral by the counterparty to the Portfolio to cover the Portfolio’s exposure to the counterparty. Additionally, risks may arise from unanticipated movements in interest rates or in the value of the underlying securities. The Portfolio accrues for the interim payments on swaps on a daily basis, with the net amount recorded within unrealized appreciation/depreciation of swaps on the statement of assets and liabilities, where applicable. Once the interim payments are settled in cash, the net amount is recorded as realized gain/(loss) on swaps on the statement of operations, in addition to any
| 58 | AB CREDIT LONG/SHORT PORTFOLIO | abfunds.com |
NOTES TO FINANCIAL STATEMENTS (continued)
realized gain/(loss) recorded upon the termination of swaps. Upfront premiums paid or received are recognized as cost or proceeds on the statement of assets and liabilities and are amortized on a straight line basis over the life of the contract. Amortized upfront premiums are included in net realized gain/(loss) from swaps on the statement of operations. Fluctuations in the value of swaps are recorded as a component of net change in unrealized appreciation/depreciation of swaps on the statement of operations.
Certain standardized swaps, including certain interest rate swaps and credit default swaps, are (or soon will be) subject to mandatory central clearing. Cleared swaps are transacted through futures commission merchants (“FCMs”) that are members of central clearinghouses, with the clearinghouse serving as central counterparty, similar to transactions in futures contracts. Centralized clearing will be required for additional categories of swaps on a phased-in basis based on requirements published by the Securities and Exchange Commission and Commodity Futures Trading Commission.
At the time the Portfolio enters into a centrally cleared swap, the Portfolio deposits and maintains as collateral an initial margin with the broker, as required by the clearinghouse on which the transaction is effected. Such amount is shown as cash collateral due from broker on the statement of assets and liabilities. Pursuant to the contract, the Portfolio agrees to receive from or pay to the broker an amount of cash equal to the daily fluctuation in the value of the contract. Such receipts or payments are known as variation margin and are recorded by the Portfolio as unrealized gains or losses. Risks may arise from the potential inability of a counterparty to meet the terms of the contract. The credit/counterparty risk for centrally cleared swaps is generally less than non-centrally cleared swaps, since the clearinghouse, which is the issuer or counterparty to each centrally cleared swap, has robust risk mitigation standards, including the requirement to provide initial and variation margin. When the contract is closed, the Portfolio records a realized gain or loss equal to the difference between the value of the contract at the time it was opened and the time it was closed.
Interest Rate Swaps:
The Portfolio is subject to interest rate risk exposure in the normal course of pursuing its investment objectives. Because the Portfolio holds fixed rate bonds, the value of these bonds may decrease if interest rates rise. To help hedge against this risk and to maintain its ability to generate income at prevailing market rates, the Portfolio may enter into interest rate swaps. Interest rate swaps are agreements between two parties to exchange cash flows based on a notional amount. The Portfolio may elect to pay a fixed rate and receive a floating rate, or, receive a fixed rate and pay a floating rate on a notional amount.
| abfunds.com | AB CREDIT LONG/SHORT PORTFOLIO | 59 |
NOTES TO FINANCIAL STATEMENTS (continued)
In addition, the Portfolio may also enter into interest rate swap transactions to preserve a return or spread on a particular investment or portion of its portfolio, or protecting against an increase in the price of securities the Portfolio anticipates purchasing at a later date. Interest rate swaps involve the exchange by a Portfolio with another party of their respective commitments to pay or receive interest (e.g., an exchange of floating rate payments for fixed rate payments) computed based on a contractually-based principal (or “notional”) amount. Interest rate swaps are entered into on a net basis (i.e., the two payment streams are netted out, with the Portfolio receiving or paying, as the case may be, only the net amount of the two payments).
During the year ended October 31, 2017, the Portfolio held interest rate swaps for hedging and non-hedging purposes.
Credit Default Swaps:
The Portfolio may enter into credit default swaps, including to manage its exposure to the market or certain sectors of the market, to reduce its risk exposure to defaults by corporate and sovereign issuers held by the Portfolio, or to create exposure to corporate or sovereign issuers to which it is not otherwise exposed. The Portfolio may purchase credit protection (“Buy Contract”) or provide credit protection (“Sale Contract”) on the referenced obligation of the credit default swap. During the term of the swap, the Portfolio receives/(pays) fixed payments from/(to) the respective counterparty, calculated at the agreed upon rate applied to the notional amount. If the Portfolio is a buyer/(seller) of protection and a credit event occurs, as defined under the terms of the swap, the Portfolio will either (i) receive from the seller/(pay to the buyer) of protection an amount equal to the notional amount of the swap (the “Maximum Payout Amount”) and deliver/(take delivery of) the referenced obligation or (ii) receive/(pay) a net settlement amount in the form of cash or securities equal to the notional amount of the swap less the recovery value of the referenced obligation.
In certain circumstances Maximum Payout Amounts may be partially offset by recovery values of the respective referenced obligations, upfront premium received upon entering into the agreement, or net amounts received from settlement of buy protection credit default swaps entered into by the Portfolio for the same referenced obligations with the same counterparty. As of October 31, 2017, the Portfolio had Buy Contracts outstanding with respect to the same referenced obligation and same counterparty for its Sales Contracts which may partially offset the Maximum Payout Amount in the amount of $1,785,000.
| 60 | AB CREDIT LONG/SHORT PORTFOLIO | abfunds.com |
NOTES TO FINANCIAL STATEMENTS (continued)
Credit default swaps may involve greater risks than if a Portfolio had invested in the referenced obligation directly. Credit default swaps are subject to general market risk, liquidity risk, counterparty risk and credit risk. If the Portfolio is a buyer of protection and no credit event occurs, it will lose the payments it made to its counterparty. If the Portfolio is a seller of protection and a credit event occurs, the value of the referenced obligation received by the Portfolio coupled with the periodic payments previously received, may be less than the Maximum Payout Amount it pays to the buyer, resulting in a net loss to the Portfolio.
Implied credit spreads over U.S. Treasuries of comparable maturity utilized in determining the market value of credit default swaps on issuers as of period end are disclosed in the portfolio of investments. The implied spreads serve as an indicator of the current status of the payment/performance risk and typically reflect the likelihood of default by the issuer of the referenced obligation. The implied credit spread of a particular reference obligation also reflects the cost of buying/selling protection and may reflect upfront payments required to be made to enter into the agreement. Widening credit spreads typically represent a deterioration of the referenced obligation’s credit soundness and greater likelihood of default or other credit event occurring as defined under the terms of the agreement. A credit spread identified as “Defaulted” indicates a credit event has occurred for the referenced obligation.
During the year ended October 31, 2017, the Portfolio held credit default swaps for hedging and non-hedging purposes.
Total Return Swaps:
The Portfolio may enter into total return swaps in order to take a “long” or “short” position with respect to an underlying referenced asset. The Portfolio is subject to market price volatility of the underlying referenced asset. A total return swap involves commitments to pay interest in exchange for a market linked return based on a notional amount. To the extent that the total return of the security, group of securities or index underlying the transaction exceeds or falls short of the offsetting interest obligation, the Portfolio will receive a payment from or make a payment to the counterparty.
During the year ended October 31, 2017, the Portfolio held total return swaps for hedging and non-hedging purposes.
The Portfolio typically enters into International Swaps and Derivatives Association, Inc. Master Agreements (“ISDA Master Agreement”) with its OTC derivative contract counterparties in order to, among other things, reduce its credit risk to OTC counterparties. ISDA Master Agreements
| abfunds.com | AB CREDIT LONG/SHORT PORTFOLIO | 61 |
NOTES TO FINANCIAL STATEMENTS (continued)
include provisions for general obligations, representations, collateral and events of default or termination. Under an ISDA Master Agreement, the Portfolio typically may offset with the OTC counterparty certain derivative financial instruments’ payables and/or receivables with collateral held and/or posted and create one single net payment (close-out netting) in the event of default or termination. In the event of a default by an OTC counterparty, the return of collateral with market value in excess of the Portfolio’s net liability, held by the defaulting party, may be delayed or denied.
The Portfolio’s ISDA Master Agreements may contain provisions for early termination of OTC derivative transactions in the event the net assets of the Portfolio decline below specific levels (“net asset contingent features”). If these levels are triggered, the Portfolio’s OTC counterparty has the right to terminate such transaction and require the Portfolio to pay or receive a settlement amount in connection with the terminated transaction. For additional details, please refer to netting arrangements by the OTC counterparty tables below.
During the year ended October 31, 2017, the Portfolio had entered into the following derivatives:
Asset Derivatives | Liability Derivatives | |||||||||||
Derivative Type | Statement of Assets and Liabilities Location | Fair Value | Statement of Assets and Liabilities Location | Fair Value | ||||||||
Interest rate contracts | Receivable/Payable for variation margin on futures | $ | 14,866 | * | Receivable/Payable for variation margin on futures | $ | 39,759 | * | ||||
Credit contracts | Receivable/Payable for variation margin on exchange traded swaps | 52,024 | * | Receivable/Payable for variation margin on exchange traded swaps | 38,686 | * | ||||||
Interest rate contracts | Receivable/Payable for variation margin on exchange traded swaps |
| 1,249 | * | ||||||||
Foreign exchange contracts | Unrealized appreciation on forward currency exchange contracts |
| 46,182 |
| Unrealized depreciation on forward currency exchange contracts |
| 15,148 |
| ||||
Equity contracts | Investments in securities, at value | 4,868 | Options written, at value | 2,321 | ||||||||
| 62 | AB CREDIT LONG/SHORT PORTFOLIO | abfunds.com |
NOTES TO FINANCIAL STATEMENTS (continued)
Asset Derivatives | Liability Derivatives | |||||||||||
Derivative Type | Statement of Assets and Liabilities Location | Fair Value | Statement of Assets and Liabilities Location | Fair Value | ||||||||
Credit contracts | Unrealized appreciation on credit default swaps | $ | 279,160 | Unrealized depreciation on credit default swaps | $ | 488,625 | ||||||
Equity contracts | Unrealized appreciation on total return swaps | 38,804 | ||||||||||
|
|
|
| |||||||||
Total | $ | 435,904 | $ | 585,788 | ||||||||
|
|
|
| |||||||||
| * | Only variation margin receivable/payable at period end is reported within the statement of assets and liabilities. This amount reflects cumulative appreciation/(depreciation) of exchange-traded derivatives as reported in the portfolio of investments. |
Derivative Type | Location of Gain | Realized Gain or (Loss) on Derivatives | Change in Unrealized Appreciation or (Depreciation) | |||||||
Interest rate contracts | Net realized gain (loss) on futures; Net change in unrealized appreciation/depreciation of futures | $ | 51,761 | $ | (104,381 | ) | ||||
Equity contracts | Net realized gain (loss) on futures; Net change in unrealized appreciation/depreciation of futures | (30,547 | ) | (5,452 | ) | |||||
Foreign exchange contracts | Net realized gain (loss) on forward currency exchange contracts; Net change in unrealized appreciation/depreciation of forward currency exchange contracts | 11,323 | 41,875 | |||||||
Interest rate contracts | Net realized gain (loss) on investment transactions; Net change in unrealized appreciation/depreciation of investments | (2,204 | ) | – 0 | – | |||||
| abfunds.com | AB CREDIT LONG/SHORT PORTFOLIO | 63 |
NOTES TO FINANCIAL STATEMENTS (continued)
Derivative Type | Location of Gain | Realized Gain or (Loss) on Derivatives | Change in Unrealized Appreciation or (Depreciation) | |||||||
Foreign exchange contracts | Net realized gain (loss) on investment transactions; Net change in unrealized appreciation/depreciation of investments | $ | (2,477 | ) | $ | – 0 | – | |||
Credit contracts | Net realized gain (loss) on investment transactions; Net change in unrealized appreciation/depreciation of investments | (24,127 | ) | (1,807 | ) | |||||
Equity contracts | Net realized gain (loss) on investment transactions; Net change in unrealized appreciation/depreciation of investments | (134,612 | ) | (869 | ) | |||||
Foreign exchange contracts | Net realized gain (loss) on options written; Net change in unrealized appreciation/depreciation of options written | 321 | – 0 | – | ||||||
Credit contracts | Net realized gain (loss) on options written; Net change in unrealized appreciation/depreciation of options written | 2,319 | – 0 | – | ||||||
Equity contracts | Net realized gain (loss) on options written; Net change in unrealized appreciation/depreciation of options written | 57,760 | 974 | |||||||
Credit contracts | Net realized gain (loss) on swaptions written; Net change in unrealized appreciation/depreciation of swaptions written | 7,565 | – 0 | – | ||||||
| 64 | AB CREDIT LONG/SHORT PORTFOLIO | abfunds.com |
NOTES TO FINANCIAL STATEMENTS (continued)
Derivative Type | Location of Gain | Realized Gain or (Loss) on Derivatives | Change in Unrealized Appreciation or (Depreciation) | |||||||
Interest rate contracts | Net realized gain (loss) on swaps; Net change in unrealized appreciation/depreciation of swaps | $ | (2,034 | ) | $ | 4,099 | ||||
Credit contracts | Net realized gain (loss) on swaps; Net change in unrealized appreciation/depreciation of swaps | (458,580 | ) | (84,349 | ) | |||||
Equity contracts | Net realized gain (loss) on swaps; Net change in unrealized appreciation/depreciation of swaps | 265,838 | 30,709 | |||||||
|
|
|
| |||||||
Total | $ | (257,694 | ) | $ | (119,201 | ) | ||||
|
|
|
| |||||||
The following table represents the average monthly volume of the Portfolio’s derivative transactions during the year ended October 31, 2017:
Futures: | ||||
Average original value of buy contracts | $ | 1,464,263 | ||
Average original value of sale contracts | $ | 5,315,711 | ||
Forward Currency Exchange Contracts: | ||||
Average principal amount of buy contracts | $ | 2,268,217 | ||
Average principal amount of sale contracts | $ | 2,690,478 | ||
Purchased Options: | ||||
Average monthly cost | $ | 26,973 | ||
Options Written: | ||||
Average notional amount | $ | 462,686 | ||
Swaptions Written: | ||||
Average notional amount | $ | 2,091,333 | (a) | |
Centrally Cleared Interest Rate Swaps: | ||||
Average notional amount | $ | 250,000 | ||
Credit Default Swaps: | ||||
Average notional amount of buy contracts | $ | 11,672,845 | ||
Average notional amount of sale contracts | $ | 3,191,917 | ||
Centrally Cleared Credit Default Swaps: | ||||
Average notional amount of buy contracts | $ | 4,844,398 | ||
Average notional amount of sale contracts | $ | 1,668,141 | ||
Total Return Swaps: | ||||
Average notional amount | $ | 6,607,935 |
| (a) | Positions were open for three months during the year. |
For financial reporting purposes, the Portfolio does not offset derivative assets and derivative liabilities that are subject to netting arrangements in the statement of assets and liabilities.
| abfunds.com | AB CREDIT LONG/SHORT PORTFOLIO | 65 |
NOTES TO FINANCIAL STATEMENTS (continued)
All OTC derivatives held at period end were subject to netting arrangements. The following table presents the Portfolio’s derivative assets and liabilities by OTC counterparty net of amounts available for offset under ISDA Master Agreements and net of the related collateral received/pledged by the Portfolio as of October 31, 2017. Exchange-traded derivatives are not subject to netting arrangements and as such are excluded from the table.
Counterparty | Derivative Assets Subject to a MA | Derivative Available for Offset | Cash Collateral Received* | Security Collateral Received* | Net Amount of Derivatives Assets | |||||||||||||||
OTC Derivatives: | ||||||||||||||||||||
Bank of America, NA | $ | 10,282 | $ | (10,282 | ) | $ | – 0 | – | $ | – 0 | – | $ | – 0 | – | ||||||
Barclays Bank PLC | 76,301 | (58,252 | ) | – 0 | – | – 0 | – | 18,049 | ||||||||||||
Citibank, NA | 21,336 | (21,336 | ) | – 0 | – | – 0 | – | – 0 | – | |||||||||||
Credit Suisse International | 59,573 | (45,215 | ) | – 0 | – | – 0 | – | 14,358 | ||||||||||||
Deutsche Bank AG | 2,263 | (2,263 | ) | – 0 | – | – 0 | – | – 0 | – | |||||||||||
Goldman Sachs International | 272,100 | (272,100 | ) | – 0 | – | – 0 | – | – 0 | – | |||||||||||
JPMorgan Chase Bank, NA | 24,067 | (1,554 | ) | – 0 | – | – 0 | – | 22,513 | ||||||||||||
Morgan Stanley & Co. International PLC/Morgan Stanley Capital Services LLC | 29,867 | (29,867 | ) | – 0 | – | – 0 | – | – 0 | – | |||||||||||
Standard Chartered Bank | 6,118 | – 0 | – | – 0 | – | – 0 | – | 6,118 | ||||||||||||
State Street Bank & Trust Co. | 32,939 | (11,100 | ) | – 0 | – | – 0 | – | 21,839 | ||||||||||||
|
|
|
|
|
|
|
|
|
| |||||||||||
Total | $ | 534,846 | $ | (451,969 | ) | $ | – 0 | – | $ | – 0 | – | $ | 82,877 | ^ | ||||||
|
|
|
|
|
|
|
|
|
| |||||||||||
Counterparty | Derivative Liabilities Subject to a MA | Derivative Available for Offset | Cash Collateral Pledged* | Security Collateral Pledged* | Net Amount of Derivatives Liabilities | |||||||||||||||
OTC Derivatives: | ||||||||||||||||||||
Bank of America, NA | $ | 87,154 | $ | (10,282 | ) | $ | – 0 | – | $ | – 0 | – | $ | 76,872 | |||||||
Barclays Bank PLC | 58,252 | (58,252 | ) | – 0 | – | – 0 | – | – 0 | – | |||||||||||
Citibank, NA | 130,623 | (21,336 | ) | – 0 | – | (90,041 | ) | 19,246 | ||||||||||||
Credit Suisse International | 45,215 | (45,215 | ) | – 0 | – | – 0 | – | – 0 | – | |||||||||||
Deutsche Bank AG | 44,963 | (2,263 | ) | – 0 | – | – 0 | – | 42,700 | ||||||||||||
Goldman Sachs International | 316,447 | (272,100 | ) | – 0 | – | – 0 | – | 44,347 | ||||||||||||
JPMorgan Chase Bank, NA | 1,554 | (1,554 | ) | – 0 | – | – 0 | – | – 0 | – | |||||||||||
Morgan Stanley & Co. International PLC/Morgan Stanley Capital Services LLC | 123,818 | (29,867 | ) | – 0 | – | (93,951 | ) | – 0 | – | |||||||||||
State Street Bank & Trust Co. | 11,100 | (11,100 | ) | – 0 | – | – 0 | – | – 0 | – | |||||||||||
|
|
|
|
|
|
|
|
|
| |||||||||||
Total | $ | 819,126 | $ | (451,969 | ) | $ | – 0 | – | $ | (183,992 | ) | $ | 183,165 | ^ | ||||||
|
|
|
|
|
|
|
|
|
| |||||||||||
| * | The actual collateral received/pledged may be more than the amount reported due to over-collateralization. |
| ^ | Net amount represents the net receivable/payable that would be due from/to the counterparty in the event of default or termination. The net amount from OTC financial derivative instruments can only be netted across transactions governed under the same master agreement with the same counterparty. |
| 66 | AB CREDIT LONG/SHORT PORTFOLIO | abfunds.com |
NOTES TO FINANCIAL STATEMENTS (continued)
2. Currency Transactions
The Portfolio may invest in non-U.S. Dollar-denominated securities on a currency hedged or unhedged basis. The Portfolio may seek investment opportunities by taking long or short positions in currencies through the use of currency-related derivatives, including forward currency exchange contracts, futures and options on futures, swaps, and other options. The Portfolio may enter into transactions for investment opportunities when it anticipates that a foreign currency will appreciate or depreciate in value but securities denominated in that currency are not held by the Portfolio and do not present attractive investment opportunities. Such transactions may also be used when the Adviser believes that it may be more efficient than a direct investment in a foreign currency-denominated security. The Portfolio may also conduct currency exchange contracts on a spot basis (i.e., for cash at the spot rate prevailing in the currency exchange market for buying or selling currencies).
3. Short Sales
The Portfolio may sell securities short. A short sale is a transaction in which the Portfolio sells securities it does not own, but has borrowed, in anticipation of a decline in the market price of the securities. The Portfolio is obligated to replace the borrowed securities at their market price at the time of settlement. The Portfolio’s obligation to replace the securities borrowed in connection with a short sale will be fully secured by collateral deposited with the broker. The Portfolio is liable to the buyer for any dividends/interest payable on securities while those securities are in a short position. These dividends/interest are recorded as an expense of the Portfolio. Short sales by the Portfolio involve certain risks and special considerations. Possible losses from short sales differ from losses that could be incurred from a purchase of a security because losses from short sales may be unlimited, whereas losses from purchases cannot exceed the total amount invested.
NOTE E
Capital Stock
Each class consists of 3,000,000,000 authorized shares. Transactions in capital shares for each class were as follows:
| Shares | Amount | |||||||||||||||||||||||
Year Ended October 31, 2017 | Year Ended October 31, 2016 | Year Ended October 31, 2017 | Year Ended October 31, 2016 | |||||||||||||||||||||
|
| |||||||||||||||||||||||
| Class A | ||||||||||||||||||||||||
Shares sold | 3,506 | 6,854 | $ | 35,611 | $ | 67,378 | ||||||||||||||||||
| ||||||||||||||||||||||||
Shares issued in reinvestment of dividends | 192 | 66 | 1,959 | 644 | ||||||||||||||||||||
| ||||||||||||||||||||||||
Shares redeemed | (12,441 | ) | (7,812 | ) | (123,091 | ) | (76,892 | ) | ||||||||||||||||
| ||||||||||||||||||||||||
Net decrease | (8,743 | ) | (892 | ) | $ | (85,521 | ) | $ | (8,870 | ) | ||||||||||||||
| ||||||||||||||||||||||||
| abfunds.com | AB CREDIT LONG/SHORT PORTFOLIO | 67 |
NOTES TO FINANCIAL STATEMENTS (continued)
| Shares | Amount | |||||||||||||||||||||||
Year Ended October 31, 2017 | Year Ended October 31, 2016 | Year Ended October 31, 2017 | Year Ended October 31, 2016 | |||||||||||||||||||||
|
| |||||||||||||||||||||||
| Class C | ||||||||||||||||||||||||
Shares sold | 14,798 | 6,709 | $ | 144,100 | $ | 65,523 | ||||||||||||||||||
| ||||||||||||||||||||||||
Shares issued in reinvestment of dividends | 170 | 40 | 1,713 | 385 | ||||||||||||||||||||
| ||||||||||||||||||||||||
Shares redeemed | (3,982 | ) | (1,312 | ) | (38,860 | ) | (12,650 | ) | ||||||||||||||||
| ||||||||||||||||||||||||
Net increase | 10,986 | 5,437 | $ | 106,953 | $ | 53,258 | ||||||||||||||||||
| ||||||||||||||||||||||||
| Advisor Class | ||||||||||||||||||||||||
Shares sold | 72,316 | 4,752 | $ | 735,769 | $ | 47,706 | ||||||||||||||||||
| ||||||||||||||||||||||||
Shares issued in reinvestment of dividends | 703 | 540 | 7,221 | 5,253 | ||||||||||||||||||||
| ||||||||||||||||||||||||
Shares redeemed | (25,830 | ) | (73,073 | ) | (259,245 | ) | (729,627 | ) | ||||||||||||||||
| ||||||||||||||||||||||||
Net increase (decrease) | 47,189 | (67,781 | ) | $ | 483,745 | $ | (676,668 | ) | ||||||||||||||||
| ||||||||||||||||||||||||
At October 31, 2017, the Adviser owns approximately 93% of the Portfolio’s outstanding shares. Significant transactions by such shareholder, if any, may impact the Portfolio’s performance.
NOTE F
Risks Involved in Investing in the Portfolio
Interest Rate Risk and Credit Risk—Interest rate risk is the risk that changes in interest rates will affect the value of the Portfolio’s investments in fixed-income debt securities such as bonds or notes. Increases in interest rates may cause the value of the Portfolio’s investments to decline. Credit risk is the risk that the issuer or guarantor of a debt security, or the counterparty to a derivative contract, will be unable or unwilling to make timely principal and/or interest payments, or to otherwise honor its obligations. The degree of risk for a particular security may be reflected in its credit rating. Credit risk is greater for medium quality and lower-rated securities. Lower-rated debt securities and similar unrated securities (commonly known as “junk bonds”) have speculative elements or are predominantly speculative risks.
Below Investment Grade Securities Risk—Investments in fixed-income securities with lower ratings (commonly known as “junk bonds”) tend to have a higher probability that an issuer will default or fail to meet its payment obligations. These securities may be subject to greater price volatility due to such factors as specific corporate developments, interest rate sensitivity, negative perceptions of the junk bond market generally and less secondary market liquidity.
| 68 | AB CREDIT LONG/SHORT PORTFOLIO | abfunds.com |
NOTES TO FINANCIAL STATEMENTS (continued)
Duration Risk—Duration is a measure that relates the expected price volatility of a fixed-income security to changes in interest rates. The duration of a fixed-income security may be shorter than or equal to full maturity of a fixed-income security. Fixed-income securities with longer durations have more risk and will decrease in price as interest rates rise. For example, a fixed-income security with a duration of three years will decrease in value by approximately 3% if interest rates increase by 1%.
Inflation Risk—This is the risk that the value of assets or income from investments will be less in the future as inflation decreases the value of money. As inflation increases, the value of the Portfolio’s assets can decline as can the value of the Portfolio’s distributions. This risk is significantly greater if the Portfolio invests a significant portion of its assets in fixed-income securities with longer maturities.
Derivatives Risk—The Portfolio may enter into derivative transactions such as forwards, options, futures and swaps. Derivatives may be illiquid, difficult to price, and leveraged so that small changes may produce disproportionate losses for the Portfolio, and subject to counterparty risk to a greater degree than more traditional investments. Derivatives may result in significant losses, including losses that are far greater than the value of the derivatives reflected on the statement of assets and liabilities.
Leverage Risk—When the Portfolio borrows money or otherwise leverages its investments, its performance may be volatile because leverage tends to exaggerate the effect of any increase or decrease in the value of the Portfolio’s investments. The Portfolio may create leverage through the use of reverse repurchase arrangements, forward currency exchange contracts, forward commitments, dollar rolls or futures or by borrowing money. The use of other types of derivative instruments by the Portfolio, such as options and swaps, may also result in a form of leverage. Leverage may result in higher returns to the Portfolio than if the Portfolio were not leveraged, but may also adversely affect returns, particularly if the market is declining.
Short Sale Risk—Short sales involve the risk that the Portfolio will incur a loss by subsequently buying a security at a higher price than the price at which it sold the security. The amount of such loss is theoretically unlimited, as it will be based on the increase in value of the security sold short. In contrast, the risk of loss from a long position is limited to the Portfolio’s investment in the security, because the price of the security cannot fall below zero. The Portfolio may not always be able to close out a short position on favorable terms.
| abfunds.com | AB CREDIT LONG/SHORT PORTFOLIO | 69 |
NOTES TO FINANCIAL STATEMENTS (continued)
Foreign (Non-U.S.) Risk—Investments in securities of non-U.S. issuers may involve more risk than those of U.S. issuers. These securities may fluctuate more widely in price and may be less liquid due to adverse market, economic, political, regulatory or other factors.
Emerging Market Risk—Investments in emerging market countries may have more risk because the markets are less developed and less liquid, and because these investments may be subject to increased economic, political, regulatory, or other uncertainties.
Currency Risk—Fluctuations in currency exchange rates may negatively affect the value of the Portfolio’s investments or reduce its returns.
Non-Diversification Risk—The Portfolio may have more risk because it is “non-diversified”, meaning that it can invest more of its assets in a smaller number of issuers. Accordingly, changes in the value of a single security may have a more significant effect, either negative or positive, on the Portfolio’s NAV.
Liquidity Risk—Liquidity risk occurs when certain investments become difficult to purchase or sell. Difficulty in selling less liquid securities may result in sales at disadvantageous prices affecting the value of your investment in the Portfolio. Causes of liquidity risk may include low trading volumes, large positions and heavy redemptions of portfolio shares. Over recent years, liquidity risk has also increased because the capacity of dealers in the secondary market for fixed-income securities to make markets in these securities has decreased, even as the overall bond market has grown significantly, due to, among other things, structural changes, additional regulatory requirements and capital and risk restraints that have led to reduced inventories. Liquidity risk may be higher in a rising interest rate environment, when the value and liquidity of fixed-income securities generally decline.
Indemnification Risk—In the ordinary course of business, the Portfolio enters into contracts that contain a variety of indemnifications. The Portfolio’s maximum exposure under these arrangements is unknown. However, the Portfolio has not had prior claims or losses pursuant to these indemnification provisions and expect the risk of loss thereunder to be remote. Therefore, the Portfolio has not accrued any liability in connection with these indemnification provisions.
NOTE G
Joint Credit Facility
A number of open-end mutual funds managed by the Adviser, including the Portfolio, participate in a $280 million revolving credit facility (the
| 70 | AB CREDIT LONG/SHORT PORTFOLIO | abfunds.com |
NOTES TO FINANCIAL STATEMENTS (continued)
“Facility”) intended to provide short-term financing, if necessary, subject to certain restrictions in connection with abnormal redemption activity. Commitment fees related to the Facility are paid by the participating funds and are included in miscellaneous expenses in the statement of operations. The Portfolio did not utilize the Facility during the year ended October 31, 2017.
NOTE H
Distributions to Shareholders
The tax character of distributions paid during the fiscal years ended October 31, 2017 and October 31, 2016 were as follows:
| 2017 | 2016 | |||||||
Distributions paid from: | ||||||||
Ordinary income | $ | 245,094 | $ | 90,082 | ||||
|
|
|
| |||||
Total distributions paid | $ | 245,094 | $ | 90,082 | ||||
|
|
|
| |||||
As of October 31, 2017, the components of accumulated earnings/(deficit) on a tax basis were as follows:
Undistributed capital gains | $ | 170,939 | ||
Other losses | (386,004 | )(a) | ||
Unrealized appreciation/(depreciation) | (280,456 | )(b) | ||
|
| |||
Total accumulated earnings/(deficit) | $ | (495,521 | )(c) | |
|
|
| (a) | As of October 31, 2017, the cumulative deferred loss on straddles was $37,409 and the Portfolio had a qualified late-year ordinary loss deferral of $348,595. |
| (b) | The differences between book-basis and tax-basis unrealized appreciation/(depreciation) are attributable primarily to the tax deferral of losses on wash sales, the tax treatment of swaps, and the recognition for tax purposes of unrealized gains/losses on certain derivative instruments. |
| (c) | Other differences between book-basis and tax-basis components of accumulated earnings/(deficit) are attributable primarily to the tax treatment of defaulted securities. |
For tax purposes, net realized capital losses may be carried over to offset future capital gains, if any. Funds are permitted to carry forward capital losses incurred for an indefinite period, and such losses will retain their character as either short-term or long-term capital losses. As of October 31, 2017, the Portfolio did not have any capital loss carryforwards.
During the current fiscal year, permanent differences primarily due to the tax treatment of swaps, contributions from the Adviser, foreign currency reclassifications, paydown gain/loss reclassifications, the tax treatment of proceeds from the sale of defaulted securities, and the offset of net operating loss against capital gains resulted in a net decrease in accumulated net investment loss, a net decrease in accumulated net realized gain on investment and foreign currency transactions, and a net decrease in additional paid-in capital. These reclassifications had no effect on net assets.
| abfunds.com | AB CREDIT LONG/SHORT PORTFOLIO | 71 |
NOTES TO FINANCIAL STATEMENTS (continued)
NOTE I
Recent Accounting Pronouncements
In March 2017, the Financial Accounting Standards Board issued an Accounting Standards Update, ASU 2017-08, Receivables—Nonrefundable Fees and Other Costs (Subtopic 310-20), Premium Amortization on Purchased Callable Debt Securities (the “ASU”) which amends the amortization period for certain purchased callable debt securities held at a premium, shortening such period to the earliest call date. The ASU does not require any accounting change for debt securities held at a discount; the discount continues to be amortized to maturity. The ASU is effective for fiscal years, and interim periods within those fiscal years, beginning after December 15, 2018. At this time, management is evaluating the implications of these changes on the financial statements.
NOTE J
Subsequent Events
Management has evaluated subsequent events for possible recognition or disclosure in the financial statements through the date the financial statements are issued. Management has determined that there are no material events that would require disclosure in the Portfolio’s financial statements through this date.
| 72 | AB CREDIT LONG/SHORT PORTFOLIO | abfunds.com |
FINANCIAL HIGHLIGHTS
Selected Data For A Share Of Capital Stock Outstanding Throughout Each Period
| Class A | ||||||||||||||||
| Year Ended October 31, | May 7, 2014 | |||||||||||||||
| 2017 | 2016 | 2015 | ||||||||||||||
|
| |||||||||||||||
Net asset value, beginning of period | $ 10.12 | $ 9.85 | $ 10.00 | $ 10.00 | ||||||||||||
|
| |||||||||||||||
Income From Investment Operations | ||||||||||||||||
Net investment income (loss)(b)(c) | (.22 | ) | (.09 | ) | .09 | .08 | ||||||||||
Net realized and unrealized gain (loss) on investment and foreign currency transactions | (.13 | ) | .40 | (.16 | ) | (.03 | ) | |||||||||
Contributions from Adviser | .00 | (d) | – 0 | – | .00 | (d) | – 0 | – | ||||||||
|
| |||||||||||||||
Net increase (decrease) in net asset value from operations | (.35 | ) | .31 | (.07 | ) | .05 | ||||||||||
|
| |||||||||||||||
Less: Dividends and Distributions | ||||||||||||||||
Dividends from net investment income | – 0 | – | – 0 | – | (.08 | ) | (.05 | ) | ||||||||
Distributions from net realized gain on investment transactions | (.12 | ) | (.04 | ) | – 0 | – | – 0 | – | ||||||||
|
| |||||||||||||||
Total dividends and distributions | (.12 | ) | (.04 | ) | (.08 | ) | (.05 | ) | ||||||||
|
| |||||||||||||||
Net asset value, end of period | $ 9.65 | $ 10.12 | $ 9.85 | $ 10.00 | ||||||||||||
|
| |||||||||||||||
Total Return | ||||||||||||||||
Total investment return based on net asset value(e)(f) | (3.45 | )%* | 3.18 | % | (.65 | )% | .57 | % | ||||||||
Ratios/Supplemental Data | ||||||||||||||||
Net assets, end of period | $90 | $182 | $186 | $84 | ||||||||||||
Ratio to average net assets of: | ||||||||||||||||
Expenses, net of waivers/reimbursements(g)(h) | 6.93 | % | 6.81 | % | 5.02 | % | 3.56 | %^ | ||||||||
Expenses, before waivers/reimbursements(g)(h) | 9.22 | % | 9.07 | % | 7.28 | % | 4.29 | %^ | ||||||||
Net investment income (loss)(c) | (2.21 | )% | (.91 | )% | .88 | % | 1.79 | %^ | ||||||||
Portfolio turnover rate | 111 | % | 201 | % | 163 | % | 69 | % | ||||||||
Portfolio turnover rate (including securities sold short) | 88 | % | 182 | % | 147 | % | 102 | % | ||||||||
See footnote summary on page 76.
| abfunds.com | AB CREDIT LONG/SHORT PORTFOLIO | 73 |
FINANCIAL HIGHLIGHTS (continued)
Selected Data For A Share Of Capital Stock Outstanding Throughout Each Period
| Class C | ||||||||||||||||
| Year Ended October 31, | May 7, 2014 | |||||||||||||||
| 2017 | 2016 | 2015 | ||||||||||||||
|
| |||||||||||||||
Net asset value, beginning of period | $ 9.97 | $ 9.77 | $ 9.97 | $ 10.00 | ||||||||||||
|
| |||||||||||||||
Income From Investment Operations | ||||||||||||||||
Net investment income (loss)(b)(c) | (.30 | ) | (.18 | ) | .01 | .06 | ||||||||||
Net realized and unrealized gain (loss) on investment and foreign currency transactions | (.12 | ) | .42 | (.15 | ) | (.05 | ) | |||||||||
Contributions from Adviser | .00 | (d) | – 0 | – | .00 | (d) | – 0 | – | ||||||||
|
| |||||||||||||||
Net increase (decrease) in net asset value from operations | (.42 | ) | .24 | (.14 | ) | .01 | ||||||||||
|
| |||||||||||||||
Less: Dividends and Distributions | ||||||||||||||||
Dividends from net investment income | – 0 | – | – 0 | – | (.06 | ) | (.04 | ) | ||||||||
Distributions from net realized gain on investment transactions | (.12 | ) | (.04 | ) | – 0 | – | – 0 | – | ||||||||
|
| |||||||||||||||
Total dividends and distributions | (.12 | ) | (.04 | ) | (.06 | ) | (.04 | ) | ||||||||
|
| |||||||||||||||
Net asset value, end of period | $ 9.43 | $ 9.97 | $ 9.77 | $ 9.97 | ||||||||||||
|
| |||||||||||||||
Total Return | ||||||||||||||||
Total investment return based on net asset value(e)(f) | (4.21 | )%* | 2.49 | % | (1.45 | )% | .21 | % | ||||||||
Ratios/Supplemental Data | ||||||||||||||||
Net assets, end of period | $251 | $156 | $100 | $44 | ||||||||||||
Ratio to average net assets of: | ||||||||||||||||
Expenses, net of waivers/reimbursements(g)(h) | 7.90 | % | 7.61 | % | 5.78 | % | 4.18 | %^ | ||||||||
Expenses, before waivers/reimbursements(g)(h) | 10.19 | % | 9.87 | % | 8.08 | % | 6.31 | %^ | ||||||||
Net investment income (loss)(c) | (3.03 | )% | (1.88 | )% | .10 | % | 1.21 | %^ | ||||||||
Portfolio turnover rate | 111 | % | 201 | % | 163 | % | 69 | % | ||||||||
Portfolio turnover rate (including securities sold short) | 88 | % | 182 | % | 147 | % | 102 | % | ||||||||
See footnote summary on page 76.
| 74 | AB CREDIT LONG/SHORT PORTFOLIO | abfunds.com |
FINANCIAL HIGHLIGHTS (continued)
Selected Data For A Share Of Capital Stock Outstanding Throughout Each Period
| Advisor Class | ||||||||||||||||
| Year Ended October 31, | May 7, 2014 | |||||||||||||||
| 2017 | 2016 | 2015 | ||||||||||||||
|
| |||||||||||||||
Net asset value, beginning of period | $ 10.17 | $ 9.87 | $ 10.01 | $ 10.00 | ||||||||||||
|
| |||||||||||||||
Income From Investment Operations | ||||||||||||||||
Net investment income (loss)(b)(c) | (.20 | ) | (.06 | ) | .12 | .10 | ||||||||||
Net realized and unrealized gain (loss) on investment and foreign currency transactions | (.13 | ) | .40 | (.17 | ) | (.04 | ) | |||||||||
Contributions from Adviser | .00 | (d) | .00 | .00 | (d) | – 0 | – | |||||||||
|
| |||||||||||||||
Net increase (decrease) in net asset value from operations | (.33 | ) | .34 | (.05 | ) | .06 | ||||||||||
|
| |||||||||||||||
Less: Dividends and Distributions | ||||||||||||||||
Dividends from net investment income | – 0 | – | – 0 | – | (.09 | ) | (.05 | ) | ||||||||
Distributions from net realized gain on investment transactions | (.12 | ) | (.04 | ) | – 0 | – | – 0 | – | ||||||||
|
| |||||||||||||||
Total dividends and distributions | (.12 | ) | (.04 | ) | (.09 | ) | (.05 | ) | ||||||||
|
| |||||||||||||||
Net asset value, end of period | $ 9.72 | $ 10.17 | $ 9.87 | $ 10.01 | ||||||||||||
|
| |||||||||||||||
Total Return | ||||||||||||||||
Total investment return based on net asset value(e)(f) | (3.24 | )%* | 3.48 | % | (.45 | )% | .70 | % | ||||||||
Ratios/Supplemental Data | ||||||||||||||||
Net assets, end of period | $20,447 | $20,903 | $20,967 | $20,892 | ||||||||||||
Ratio to average net assets of: | ||||||||||||||||
Expenses, net of waivers/reimbursements(g)(h) | 6.77 | % | 6.55 | % | 4.67 | % | 2.79 | %^ | ||||||||
Expenses, before waivers/reimbursements(g)(h) | 9.05 | % | 8.80 | % | 6.91 | % | 5.37 | %^ | ||||||||
Net investment income (loss)(c) | (1.99 | )% | (.63 | )% | 1.20 | % | 2.01 | %^ | ||||||||
Portfolio turnover rate | 111 | % | 201 | % | 163 | % | 69 | % | ||||||||
Portfolio turnover rate (including securities sold short) | 88 | % | 182 | % | 147 | % | 102 | % | ||||||||
See footnote summary on page 76.
| abfunds.com | AB CREDIT LONG/SHORT PORTFOLIO | 75 |
FINANCIAL HIGHLIGHTS (continued)
Selected Data For A Share Of Capital Stock Outstanding Throughout Each Period
| (a) | Commencement of operations. |
| (b) | Based on average shares outstanding. |
| (c) | Net of fees and expenses waived/reimbursed by the Adviser. |
| (d) | Amount is less than $.005. |
| (e) | Total investment return is calculated assuming an initial investment made at the net asset value at the beginning of the period, reinvestment of all dividends and distributions at net asset value during the period, and redemption on the last day of the period. Initial sales charges or contingent deferred sales charges are not reflected in the calculation of total investment return. Total return does not reflect the deduction of taxes that a shareholder would pay on fund distributions or the redemption of fund shares. Total investment return calculated for a period of less than one year is not annualized. |
| (f) | The net asset value and total return include adjustments in accordance with accounting principles generally accepted in the United States of America for financial reporting purposes. As such, the net asset value and total return for shareholder transactions may differ from financial statements. |
| (g) | The expense ratios presented below exclude expenses on securities sold short: |
| Year Ended October 31, | May 7, 2014(a) to October 31, 2014 | |||||||||||||||
| 2017 | 2016 | 2015 | ||||||||||||||
Class A | ||||||||||||||||
Net of waivers/reimbursements | 1.23 | % | 1.34 | % | 1.35 | % | 1.35 | %^ | ||||||||
Before waivers/reimbursements | 3.52 | % | 3.59 | % | 3.61 | % | 2.08 | %^ | ||||||||
Class C |
| |||||||||||||||
Net of waivers/reimbursements | 1.98 | % | 2.09 | % | 2.10 | % | 2.10 | %^ | ||||||||
Before waivers/reimbursements | 4.26 | % | 4.35 | % | 4.40 | % | 4.24 | %^ | ||||||||
Advisor Class |
| |||||||||||||||
Net of waivers/reimbursements | .98 | % | 1.09 | % | 1.10 | % | 1.10 | %^ | ||||||||
Before waivers/reimbursements | 3.26 | % | 3.34 | % | 3.34 | % | 3.68 | %^ | ||||||||
| (h) | In connection with the Portfolio’s investments in affiliated underlying portfolios, the Portfolio incurs no direct expenses, but bears proportionate shares of the fees and expenses (i.e., operating, administrative and investment advisory fees) of the affiliated underlying portfolios. The Adviser has contractually agreed to waive its fees from the Portfolio in an amount equal to the Portfolio’s pro rata share of certain acquired fund fees and expenses, and for the year ended October 31, 2017 and year ended October 31, 2016 (annualized), such waiver amounted to 0.03% and 0.01%, respectively. |
| * | Includes the impact of proceeds received and credited to the Portfolio resulting from class action settlements, which enhanced the Portfolio’s performance for the year ended October 31, 2017 by 0.02%. |
| ^ | Annualized. |
See notes to financial statements.
| 76 | AB CREDIT LONG/SHORT PORTFOLIO | abfunds.com |
REPORT OF INDEPENDENT REGISTERED
PUBLIC ACCOUNTING FIRM
To the Board of Directors and Shareholders of AB Credit Long/Short Portfolio
We have audited the accompanying statement of assets and liabilities, including the portfolio of investments, of AB Credit Long/Short Portfolio (the “Fund”), (one of the portfolios constituting the AB Bond Fund, Inc.), as of October 31, 2017, the related statement of operations for the year then ended, the statements of changes in net assets for each of the two years in the period then ended, and financial highlights for each of the three years in the period then ended and the period May 7, 2014 (commencement of operations) to October 31, 2014. These financial statements and financial highlights are the responsibility of the Fund’s management. Our responsibility is to express an opinion on these financial statements and financial highlights based on our audits.
We conducted our audits in accordance with the standards of the Public Company Accounting Oversight Board (United States). Those standards require that we plan and perform the audit to obtain reasonable assurance about whether the financial statements and financial highlights are free of material misstatement. We were not engaged to perform an audit of the Fund’s internal control over financial reporting. Our audit included consideration of internal control over financial reporting as a basis for designing audit procedures that are appropriate in the circumstances, but not for the purpose of expressing an opinion on the effectiveness of the Fund’s internal control over financial reporting. Accordingly, we express no such opinion. An audit also includes examining, on a test basis, evidence supporting the amounts and disclosures in the financial statements and financial highlights, assessing the accounting principles used and significant estimates made by management, and evaluating the overall financial statement presentation. Our procedures included confirmation of securities owned as of October 31, 2017, by correspondence with the custodian and others or by other appropriate auditing procedures where replies from others were not received. We believe that our audits provide a reasonable basis for our opinion.
In our opinion, the financial statements and financial highlights referred to above present fairly, in all material respects, the financial position of AB Credit Long/Short Portfolio (one of the portfolios constituting the AB Bond Fund, Inc.) at October 31, 2017, the results of its operations for the year then ended, the statements of changes in net assets for each of the two years in the period then ended, and financial highlights for each of the three years in the period then ended and the period May 7, 2014 (commencement of operations) to October 31, 2014, in conformity with U.S. generally accepted accounting principles.

New York, New York
December 29, 2017
| abfunds.com | AB CREDIT LONG/SHORT PORTFOLIO | 77 |
2017 FEDERAL TAX INFORMATION
(unaudited)
For Federal income tax purposes, the following information is furnished with respect to the distributions paid by the Portfolio during the taxable year ended October 31, 2017. For individual shareholders, the Portfolio designates 41.18% of dividends paid as qualified dividend income. For corporate shareholders, 12.30% of dividends paid qualify for the dividends received deduction. For foreign shareholders, 7.29% of ordinary dividends paid may be considered to be qualifying to be taxed as interest-related dividends.
Shareholders should not use the above information to prepare their income tax returns. The information necessary to complete your income tax returns will be included with your form 1099-DIV which will be sent to you separately in January 2018.
| 78 | AB CREDIT LONG/SHORT PORTFOLIO | abfunds.com |
BOARD OF DIRECTORS
Marshall C. Turner, Jr.(1), Chairman John H. Dobkin(1)(2) Michael J. Downey(1) William H. Foulk, Jr.(1) D. James Guzy(1)(2) | Nancy P. Jacklin(1) Robert M. Keith, President and Chief Executive Officer Carol C. McMullen(1) Garry L. Moody(1) Earl D. Weiner(1) |
OFFICERS
Philip L. Kirstein,(3) Senior Vice President and Independent Compliance Officer Gershon M. Distenfeld(4) , Vice President Ivan Rudolph-Shabinsky(4), Vice President Robert Schwartz(4), Vice President | Ashish C. Shah(4), Vice President Joseph J. Mantineo, Treasurer and Chief Financial Officer Emilie D. Wrapp, Secretary Phyllis J. Clarke, Controller Vincent S. Noto, Chief Compliance Officer |
Custodian and Accounting Agent State Street Bank and Trust Company State Street Corporation CCB/5 1 Iron Street Boston, MA 02210
Principal Underwriter AllianceBernstein Investments, Inc. 1345 Avenue of the Americas New York, NY 10105
Transfer Agent AllianceBernstein Investor Services, Inc. P.O. Box 786003 San Antonio, TX 78278-6003 Toll-Free (800) 221-5672 | Independent Registered Public Accounting Firm Ernst & Young LLP 5 Times Square New York, NY 10036
Legal Counsel Seward & Kissel LLP One Battery Park Plaza New York, NY 10004 |
| 1 | Member of the Audit Committee, the Governance and Nominating Committee and the Independent Directors Committee. |
| 2 | Messrs. Dobkin and Guzy are expected to retire on or about December 31, 2017. |
| 3 | Mr. Kirstein is expected to retire on or about December 31, 2017. |
| 4 | The day-to-day management of, and investment decisions for, the Fund are made by the Credit Long/Short Investment Team. Messrs. Distenfeld, Rudolph-Shabinksy, Schwartz and Shah are the investment professionals with the most significant responsibility for the day-to-day management of the Fund’s portfolio. |
| abfunds.com | AB CREDIT LONG/SHORT PORTFOLIO | 79 |
MANAGEMENT OF THE FUND
| NAME, ADDRESS*, AGE, (YEAR FIRST ELECTED**) | PRINCIPAL OCCUPATION(S) DURING PAST FIVE YEARS AND OTHER INFORMATION*** | PORTFOLIOS IN FUND COMPLEX OVERSEEN BY DIRECTOR | OTHER BY DIRECTOR | |||||
| INTERESTED DIRECTOR | ||||||||
Robert M. Keith+ 1345 Avenue of the Americas New York, NY 10105 57 | Senior Vice President of AllianceBernstein L.P. (the “Adviser”) and the head of AllianceBernstein Investments, Inc. (“ABI”) since July 2008; Director of ABI and President of the AB Mutual Funds. Previously, he served as Executive Managing Director of ABI from December 2006 to June 2008. Prior to joining ABI in 2006, Executive Managing Director of Bernstein Global Wealth Management, and prior thereto, Senior Managing Director and Global Head of Client Service and Sales of the Adviser’s institutional investment management business since 2004. Prior thereto, he was Managing Director and Head of North American Client Service and Sales in the Adviser’s institutional investment management business, with which he had been associated since prior to 2004. | 96 | None | |||||
| 80 | AB CREDIT LONG/SHORT PORTFOLIO | abfunds.com |
MANAGEMENT OF THE FUND (continued)
| NAME, ADDRESS*, AGE, (YEAR FIRST ELECTED**) | PRINCIPAL OCCUPATION(S) DURING PAST FIVE YEARS AND OTHER INFORMATION*** | PORTFOLIOS IN FUND COMPLEX OVERSEEN BY DIRECTOR | OTHER BY DIRECTOR | |||||
| DISINTERESTED DIRECTORS | ||||||||
Marshall C. Turner, Jr.# Chairman of the Board 76 | Private Investor since prior to 2012. Former Chairman and CEO of Dupont Photomasks, Inc. (components of semi-conductor manufacturing). He has extensive operating leadership and venture capital investing experience, including five interim or full-time CEO roles, and prior service as general partner of institutional venture capital partnerships. He also has extensive non-profit board leadership experience, and currently serves on the boards of two education and science-related non-profit organizations. He has served as a director of one AB Fund since 1992, and director or trustee of multiple AB Funds since 2005. He has been Chairman of the AB Funds since January 2014, and the Chairman of the Independent Directors Committees of such AB Funds since February 2014. | 96 | Xilinx, Inc. (programmable logic semi-conductors) since 2007 | |||||
John H. Dobkin#,## 75 | Independent Consultant since prior to 2012. Formerly, President of Save Venice, Inc. (preservation organization) from 2001-2002; Senior Advisor from June 1999-June 2000 and President of Historic Hudson Valley (historic preservation) from December 1989-May 1999. Previously, Director of the National Academy of Design. He has served as a director or trustee of various AB Funds since 1992, and as Chairman of the Audit Committees of a number of such AB Funds from 2001-2008. | 95 | None | |||||
| abfunds.com | AB CREDIT LONG/SHORT PORTFOLIO | 81 |
MANAGEMENT OF THE FUND (continued)
| NAME, ADDRESS*, AGE, (YEAR FIRST ELECTED**) | PRINCIPAL OCCUPATION(S) DURING PAST FIVE YEARS AND OTHER INFORMATION*** | PORTFOLIOS IN FUND COMPLEX OVERSEEN BY DIRECTOR | OTHER BY DIRECTOR | |||||
DISINTERESTED DIRECTORS (continued) | ||||||||
Michael J. Downey# 73 | Private Investor since prior to 2012. Formerly, managing partner of Lexington Capital, LLC (investment advisory firm) from December 1997 until December 2003. He served as a Director of Prospect Acquisition Corp. (financial services) from 2007 until 2009. From 1987 until 1993, Chairman and CEO of Prudential Mutual Fund Management, director of the Prudential mutual funds, and member of the Executive Committee of Prudential Securities Inc. He has served as a director or trustee of the AB Funds since 2005 and is a director and Chairman of one other registered investment company. | 96 | The Asia Pacific Fund, Inc. (registered investment company) since prior to 2012 | |||||
William H. Foulk, Jr.# 85 | Investment Adviser and an Independent Consultant since prior to 2012. Previously, he was Senior Manager of Barrett Associates, Inc., a registered investment adviser. He was formerly Deputy Comptroller and Chief Investment Officer of the State of New York and, prior thereto, Chief Investment Officer of the New York Bank for Savings. He has served as a director or trustee of various AB Funds since 1983, and was Chairman of the Independent Directors Committees of the AB Funds from 2003 until early February 2014. He served as Chairman of such AB Funds from 2003 through December 2013. He is also active in a number of mutual fund related organizations and committees. | 96 | None | |||||
| 82 | AB CREDIT LONG/SHORT PORTFOLIO | abfunds.com |
MANAGEMENT OF THE FUND (continued)
| NAME, ADDRESS*, AGE, (YEAR FIRST ELECTED**) | PRINCIPAL OCCUPATION(S) DURING PAST FIVE YEARS AND OTHER INFORMATION*** | PORTFOLIOS IN FUND COMPLEX OVERSEEN BY DIRECTOR | OTHER BY DIRECTOR | |||||
DISINTERESTED DIRECTORS (continued) | ||||||||
D. James Guzy#,## 81 | Chairman of the Board of SRC Computers, Inc. (semi-conductors), with which he has been associated since prior to 2012. He served as Chairman of the Board of PLX Technology (semi-conductors) since prior to 2012 until November 2013. He was a director of Intel Corporation (semi-conductors) from 1969 until 2008, and served as Chairman of the Finance Committee of such company for several years until May 2008. He has served as a director or trustee of one or more of the AB Funds since 1982. | 93 | None | |||||
Nancy P. Jacklin# 69 | Private Investor since prior to 2012. Professorial Lecturer at the Johns Hopkins School of Advanced International Studies (2008-2015) U.S. Executive Director of the International Monetary Fund (which is responsible for ensuring the stability of the international monetary system), (December 2002-May 2006); Partner, Clifford Chance (1992-2002); Sector Counsel, International Banking and Finance, and Associate General Counsel, Citicorp (1985-1992); Assistant General Counsel (International), Federal Reserve Board of Governors (1982-1985); and Attorney Advisor, U.S. Department of the Treasury (1973-1982). Member of the Bar of the District of Columbia and of New York; and member of the Council on Foreign Relations. She has served as a director or trustee of the AB Funds since 2006 and has been Chairman of the Governance and Nominating Committees of the AB Funds since August 2014. | 96 | None | |||||
| abfunds.com | AB CREDIT LONG/SHORT PORTFOLIO | 83 |
MANAGEMENT OF THE FUND (continued)
| NAME, ADDRESS*, AGE, (YEAR FIRST ELECTED**) | PRINCIPAL OCCUPATION(S) DURING PAST FIVE YEARS AND OTHER INFORMATION*** | PORTFOLIOS IN FUND COMPLEX OVERSEEN BY DIRECTOR | OTHER BY DIRECTOR | |||||
DISINTERESTED DIRECTORS (continued) | ||||||||
Carol C. McMullen# 62 (2016) | Managing Director of Slalom Consulting (consulting) since 2014 and private investor; and member of the Partners Healthcare Investment Committee. Formerly, Director of Norfolk & Dedham Group (mutual property and casualty insurance) from 2011 until November 2016; Director of Partners Community Physicians Organization (healthcare) from 2014 until December 2016, and Formerly, Managing Director of The Crossland Group (consulting) from 2012 to 2013. She has held a number of senior positions in the asset and wealth management industries, including at Eastern Bank (where her roles included President of Eastern Wealth Management), Thomson Financial (Global Head of Sales for Investment Management), and Putnam Investments (where her roles included Head of Global Investment Research). She has served on a number of private company and nonprofit boards, and as a director or trustee of the AB Funds since June 2016. | 96 | None | |||||
| 84 | AB CREDIT LONG/SHORT PORTFOLIO | abfunds.com |
MANAGEMENT OF THE FUND (continued)
| NAME, ADDRESS*, AGE, (YEAR FIRST ELECTED**) | PRINCIPAL OCCUPATION(S) DURING PAST FIVE YEARS AND OTHER INFORMATION*** | PORTFOLIOS IN FUND COMPLEX OVERSEEN BY DIRECTOR | OTHER BY DIRECTOR | |||||
DISINTERESTED DIRECTORS (continued) | ||||||||
Garry L. Moody# 65 (2014) | Independent Consultant. Formerly, Partner, Deloitte & Touche LLP (1995-2008) where he held a number of senior positions, including Vice Chairman, and U.S. and Global Investment Management Practice Managing Partner; President, Fidelity Accounting and Custody Services Company (1993-1995), where he was responsible for accounting, pricing, custody and reporting for the Fidelity mutual funds; and Partner, Ernst & Young LLP (1975-1993), where he served as the National Director of Mutual Fund Tax Services and Managing Partner of its Chicago Office Tax department. He is a member of the Trustee Advisory Board of BoardIQ, a biweekly publication focused on issues and news affecting directors of mutual funds. He has served as a director or trustee and as Chairman of the Audit Committees of the AB Funds since 2008. | 96 | None | |||||
Earl D. Weiner# 78 (2014) | Of Counsel, and Partner prior to January 2007, of the law firm Sullivan & Cromwell LLP and is a former member of the ABA Federal Regulation of Securities Committee Task Force to draft editions of the Fund Director’s Guidebook. He also serves as a director or trustee of various non-profit organizations and has served as Chairman or Vice Chairman of a number of them. He has served as a director or trustee of the AB Funds since 2007 and served as Chairman of the Governance and Nominating Committees of the AB Funds from 2007 until August 2014. | 96 | None | |||||
| abfunds.com | AB CREDIT LONG/SHORT PORTFOLIO | 85 |
MANAGEMENT OF THE FUND (continued)
| * | The address for each of the Fund’s disinterested Directors is c/o AllianceBernstein L.P., Attention: Office of the Senior Officer, 1345 Avenue of the Americas, New York, NY 10105. |
| ** | There is no stated term of office for the Fund’s Directors. |
| *** | The information above includes each Director’s principal occupation during the last five years and other information relating to the experience, attributes and skills relevant to each Director’s qualifications to serve as a Director, which led to the conclusion that each Director should serve as a Director for the Fund. |
| + | Mr. Keith is an “interested person” of the Portfolio as defined in the Investment Company Act of 1940, due to his position as a Senior Vice President of the Adviser. |
| # | Member of the Audit Committee, the Governance and Nominating Committee and the Independent Directors Committee. |
| ## | Messrs. Dobkin and Guzy are expected to retire on or about December 31, 2017. |
| 86 | AB CREDIT LONG/SHORT PORTFOLIO | abfunds.com |
MANAGEMENT OF THE FUND (continued)
Officer Information
Certain information concerning the Fund’s Officers is listed below.
NAME, ADDRESS*, AND AGE | POSITION(S) HELD WITH FUND | PRINCIPAL OCCUPATION DURING PAST 5 YEARS | ||
Robert M. Keith 57 | President and Chief Executive Officer | See biography above. | ||
Philip L. Kirstein# 72 | Senior Vice President and Independent Compliance Officer | Senior Vice President and Independent Compliance Officer of the AB Funds, with which he has been associated since October 2004. Prior thereto, he was Of Counsel to Kirkpatrick & Lockhart, LLP from October 2003 to October 2004, and General Counsel of Merrill Lynch Investment Managers, L.P. since prior to March 2003. | ||
Gershon M. Distenfeld 42 | Vice President | Senior Vice President of the Adviser**, with which he has been associated since prior to 2012. | ||
Robert Schwartz 45 | Vice President | Senior Vice President of the Adviser**, with which he has been associated since 2012. | ||
Ivan Rudolph-Shabinsky 53 | Vice President | Senior Vice President of the Adviser**, with which he has been associated since prior to 2012. | ||
Ashish C. Shah 47 | Vice President | Senior Vice President of the Adviser** with which he has been associated since prior to 2012. | ||
Emilie D. Wrapp 62 | Secretary | Senior Vice President, Assistant General Counsel and Assistant Secretary of ABI**, with which she has been associated since prior to 2012. | ||
Joseph J. Mantineo 58 | Treasurer and Chief Compliance Officer | Senior Vice President of ABIS**, with which he has been associated since prior to 2012. | ||
Vincent S. Noto 53 | Chief Compliance Officer | Senior Vice President since 2015 and Mutual Fund Chief Compliance Officer of the Adviser** since 2014. Prior thereto, he was Vice President and Director of Mutual Fund Compliance of the Adviser**, since prior to 2012. | ||
Phyllis J. Clarke 56 | Controller | Vice President of ABIS**, with which she has been associated since prior to 2012. |
| * | The address for each of the Fund’s Officers is 1345 Avenue of the Americas, New York, NY 10105. |
| ** | The Adviser, ABI and ABIS are affiliates of the Fund. |
| # | Mr. Kirstein is expected to retire on or about December 31, 2017. |
The Fund’s Statement of Additional Information (“SAI”) has additional information about the Fund’s Directors and Officers and is available without charge upon request. Contact your financial representative or AB at 1-800-227-4618, or visit www.abfunds.com, for a free prospectus or SAI.
| abfunds.com | AB CREDIT LONG/SHORT PORTFOLIO | 87 |
Information Regarding the Review and Approval of the Fund’s Advisory Agreement
The disinterested directors (the “directors”) of AB Bond Fund, Inc. (the “Company”) unanimously approved the continuance of the Company’s Advisory Agreement with the Adviser, as proposed to be amended (the “Advisory Agreement”) to effect a fee reduction, in respect of AB Credit Long/Short Portfolio (the “Fund”) at a meeting held on November 1-3, 2016 (the “Meeting”).
Prior to approval of the continuance of the Advisory Agreement, the directors had requested from the Adviser, and received and evaluated, extensive materials. They reviewed the proposed continuance of the Advisory Agreement with the Adviser and with experienced counsel who are independent of the Adviser, who advised on the relevant legal standards. The directors also reviewed an independent evaluation prepared by the Company’s Senior Officer (who is also the Company’s Independent Compliance Officer) of the reasonableness of the proposed advisory fee, in which the Senior Officer concluded that the proposed contractual fee for the Fund was reasonable. The directors also discussed the proposed continuance in private sessions with counsel and the Company’s Senior Officer.
The directors considered their knowledge of the nature and quality of the services provided by the Adviser to the Fund gained from their experience as directors or trustees of most of the registered investment companies advised by the Adviser, their overall confidence in the Adviser’s integrity and competence they have gained from that experience, the Adviser’s initiative in identifying and raising potential issues with the directors and its responsiveness, frankness and attention to concerns raised by the directors in the past, including the Adviser’s willingness to consider and implement organizational and operational changes designed to improve investment results and the services provided to the AB Funds. The directors noted that they have four regular meetings each year, at each of which they receive presentations from the Adviser on the investment results of the Fund and review extensive materials and information presented by the Adviser.
The directors also considered all other factors they believed relevant, including the specific matters discussed below. In their deliberations, the directors did not identify any particular information that was all-important or controlling, and different directors may have attributed different weights to the various factors. The directors determined that the selection of the Adviser to manage the Fund and the overall arrangements between the Fund and the Adviser, as provided in the Advisory Agreement, including the proposed advisory fee, were fair and reasonable in light of the services performed, expenses incurred and such other matters as the directors
| 88 | AB CREDIT LONG/SHORT PORTFOLIO | abfunds.com |
considered relevant in the exercise of their business judgment. The material factors and conclusions that formed the basis for the directors’ determinations included the following:
Nature, Extent and Quality of Services Provided
The directors considered the scope and quality of services provided by the Adviser under the Advisory Agreement, including the quality of the investment research capabilities of the Adviser and the other resources it has dedicated to performing services for the Fund. They also noted the professional experience and qualifications of the Fund’s portfolio management team and other senior personnel of the Adviser. The directors also considered that the Advisory Agreement provides that the Fund will reimburse the Adviser for the cost to it of providing certain clerical, accounting, administrative and other services to the Fund by employees of the Adviser or its affiliates. Requests for these reimbursements are made on a quarterly basis and subject to approval by the directors. Reimbursements, to the extent requested and paid, result in a higher rate of total compensation from the Fund to the Adviser than the fee rate stated in the Advisory Agreement. The directors noted that the methodology used to determine the reimbursement amounts had been reviewed by an independent consultant retained by the Company’s Senior Officer. The quality of administrative and other services, including the Adviser’s role in coordinating the activities of the Fund’s other service providers, also was considered. The directors concluded that, overall, they were satisfied with the nature, extent and quality of services provided to the Fund under the Advisory Agreement.
Costs of Services Provided and Profitability
The directors reviewed a schedule of the revenues and expenses and related notes indicating the profitability of the Fund to the Adviser for the period ended December 31, 2014 and for calendar year 2015 that had been prepared with an expense allocation methodology arrived at in consultation with an independent consultant retained by the Company’s Senior Officer. The directors noted the assumptions and methods of allocation used by the Adviser in preparing fund-specific profitability data and understood that there are a number of potentially acceptable allocation methodologies for information of this type. The directors noted that the profitability information reflected all revenues and expenses of the Adviser’s relationship with the Fund, including those relating to its subsidiaries that provide transfer agency and distribution services to the Fund, and that the proposed reduction in the advisory fee rate would likely impact the Adviser’s profitability analysis in future years. The directors recognized that it is difficult to make comparisons of the profitability of the Advisory Agreement with the profitability of fund advisory contracts for unaffiliated funds because comparative information is not generally publicly available and is affected by numerous factors. The directors focused on the profitability of the Adviser’s relationship with the Fund before taxes and
| abfunds.com | AB CREDIT LONG/SHORT PORTFOLIO | 89 |
distribution expenses. The directors noted that the Fund was not profitable to the Adviser in the periods reviewed.
Fall-Out Benefits
The directors considered the other benefits to the Adviser and its affiliates from their relationships with the Fund, including, but not limited to, benefits relating to 12b-1 fees and sales charges received by the Fund’s principal underwriter (which is a wholly owned subsidiary of the Adviser) in respect of certain classes of the Fund’s shares; and transfer agency fees paid by the Fund to a wholly owned subsidiary of the Adviser. The directors recognized that the Fund’s unprofitability to the Adviser would be exacerbated without these benefits. The directors understood that the Adviser also might derive reputational and other benefits from its association with the Fund.
Investment Results
In addition to the information reviewed by the directors in connection with the Meeting, the directors receive detailed performance information for the Fund at each regular Board meeting during the year.
At the Meeting, the directors reviewed information prepared by Broadridge Financial Solutions, Inc. (“Broadridge”), an analytical service that is not affiliated with the Adviser, showing the performance of the Class A Shares of the Fund against a peer group and a peer universe selected by Broadridge, and information prepared by the Adviser showing performance of the Class A Shares against a broad-based securities market index, in each case for the 1-year period ended July 31, 2016 and (in the case of comparisons with the broad-based securities market index) for the period from inception. Based on their review, the directors concluded that the Fund’s investment performance was acceptable.
Advisory Fees and Other Expenses
The directors considered the proposed advisory fee rate payable by the Fund to the Adviser and information prepared by Broadridge concerning advisory fee rates paid by other funds in the same Broadridge category as the Fund at a common asset level. The directors recognized that it is difficult to make comparisons of advisory fees because there are variations in the services that are included in the fees paid by other funds. The directors compared the Fund’s pro forma contractual advisory fee rate (reflecting a reduction in the advisory fee rate effective January 1, 2017) with a peer group median.
The directors also considered the Adviser’s fee schedule for institutional clients pursuing a similar investment style. For this purpose, they reviewed the relevant advisory fee information from the Adviser’s Form ADV and the evaluation from the Company’s Senior Officer and noted the differences between the Fund’s fee schedule, on the one hand, and the institutional
| 90 | AB CREDIT LONG/SHORT PORTFOLIO | abfunds.com |
fee schedule and the schedule of fees charged to any offshore funds and any sub-advised funds, on the other. The directors noted that the Adviser may, in some cases, agree to fee rates with large institutional clients that are lower than those reviewed by the directors and that they had previously discussed with the Adviser its policies in respect of such arrangements.
The Adviser reviewed with the directors the significantly greater scope of the services it provides to the Fund relative to institutional, offshore fund and sub-advised fund clients. In light of the substantial differences in services rendered by the Adviser to institutional, offshore fund and sub-advised fund clients as compared to funds such as the Fund, the directors considered these fee comparisons inapt and did not place significant weight on them in their deliberations.
The directors noted that the Fund may invest in shares of exchange-traded funds (“ETFs”), subject to the restrictions and limitations of the Investment Company Act of 1940 as these may be varied as a result of exemptive orders issued by the SEC. The directors also noted that ETFs pay advisory fees pursuant to their advisory contracts. The directors concluded, based on the Adviser’s explanation of how it may use ETFs when they are the most cost-effective way to obtain desired exposures for a fund or to temporarily “equitize” cash inflows pending purchases of underlying securities, that the proposed advisory fee for the Fund would be for services in addition to, rather than duplicative of, the services provided under the advisory contracts of the ETFs in which the Fund may invest.
The directors also considered the total expense ratio of the Class A shares of the Fund in comparison to a peer group and a peer universe selected by Broadridge. The Class A expense ratio of the Fund was based on the Fund’s latest fiscal year and the information included the pro forma expense ratio to reflect a reduction in the expense cap level by the Adviser effective January 1, 2017. The directors noted the effects of any fee waivers and/or expense reimbursements as a result of an undertaking by the Adviser. The directors noted that it was likely that the expense ratios of some of the other funds in the Fund’s Broadridge category were lowered by waivers or reimbursements by those funds’ investment advisers, which in some cases might be voluntary or temporary. The directors view expense ratio information as relevant to their evaluation of the Adviser’s services because the Adviser is responsible for coordinating services provided to the Fund by others. Based on their review, the directors concluded that the Fund’s pro forma expense ratio was acceptable.
Economies of Scale
The directors noted that the proposed advisory fee schedule for the Fund, while reflecting a reduction in the advisory fee rate, does not contain breakpoints and that they had discussed their strong preference for
| abfunds.com | AB CREDIT LONG/SHORT PORTFOLIO | 91 |
breakpoints in advisory contracts with the Adviser. The directors took into consideration prior presentations by an independent consultant on economies of scale in the mutual fund industry and for the AB Funds, and by the Adviser concerning certain of its views on economies of scale. The directors also had requested and received from the Adviser certain updates on economies of scale in advance of the Meeting. The directors believe that economies of scale may be realized (if at all) by the Adviser across a variety of products and services, and not only in respect of a single fund. The directors noted that there is no established methodology for setting breakpoints that give effect to the fund-specific services provided by a fund’s adviser and to the economies of scale that an adviser may realize in its overall mutual fund business or those components of it which directly or indirectly affect a fund’s operations. The directors observed that in the mutual fund industry as a whole, as well as among funds similar to the Fund, there is no uniformity or pattern in the fees and asset levels at which breakpoints (if any) apply. The directors also noted that the advisory agreements for many funds do not have breakpoints at all. The directors informed the Adviser that they would monitor the Fund’s assets (which were well below the level at which they would anticipate adding an initial breakpoint) and its profitability (currently unprofitable) to the Adviser and anticipated revisiting the question of breakpoints in the future if circumstances warranted doing so.
| 92 | AB CREDIT LONG/SHORT PORTFOLIO | abfunds.com |
This page is not part of the Shareholder Report or the Financial Statements.
AB FAMILY OF FUNDS
US EQUITY
US CORE
Core Opportunities Fund
FlexFee™ US Thematic Portfolio
Select US Equity Portfolio
US GROWTH
Concentrated Growth Fund
Discovery Growth Fund
FlexFee™ Large Cap Growth Portfolio
Growth Fund
Large Cap Growth Fund
Small Cap Growth Portfolio
US VALUE
Discovery Value Fund
Equity Income Fund
Relative Value Fund1
Small Cap Value Portfolio
Value Fund
INTERNATIONAL/ GLOBAL EQUITY
INTERNATIONAL/ GLOBAL CORE
Global Core Equity Portfolio
International Portfolio
International Strategic Core Portfolio
Sustainable Global Thematic Fund1
Tax-Managed International Portfolio
Tax-Managed Wealth Appreciation Strategy
Wealth Appreciation Strategy
INTERNATIONAL/ GLOBAL GROWTH
Concentrated International Growth Portfolio
International Growth Fund
INTERNATIONAL/ GLOBAL EQUITY (continued)
INTERNATIONAL/ GLOBAL VALUE
Asia ex-Japan Equity Portfolio
International Value Fund
FIXED INCOME
MUNICIPAL
High Income Municipal Portfolio
Intermediate California Municipal Portfolio
Intermediate Diversified Municipal Portfolio
Intermediate New York Municipal Portfolio
Municipal Bond Inflation Strategy
Tax-Aware Fixed Income Portfolio
National Portfolio
Arizona Portfolio
California Portfolio
Massachusetts Portfolio
Minnesota Portfolio
New Jersey Portfolio
New York Portfolio
Ohio Portfolio
Pennsylvania Portfolio
Virginia Portfolio
TAXABLE
Bond Inflation Strategy
FlexFee™ International Bond Portfolio
Global Bond Fund
High Income Fund
High Yield Portfolio
Income Fund
Intermediate Bond Portfolio
Limited Duration High Income Portfolio
Short Duration Portfolio
ALTERNATIVES
All Market Real Return Portfolio
Credit Long/Short Portfolio
Global Real Estate Investment Fund
Select US Long/Short Portfolio
Unconstrained Bond Fund
MULTI-ASSET
All Market Income Portfolio
All Market Total Return Portfolio1
Conservative Wealth Strategy
Emerging Markets Multi-Asset Portfolio
Global Risk Allocation Fund
Tax-Managed All Market Income Portfolio1
TARGET-DATE
Multi-Manager Select Retirement Allocation Fund
Multi-Manager Select 2010 Fund
Multi-Manager Select 2015 Fund
Multi-Manager Select 2020 Fund
Multi-Manager Select 2025 Fund
Multi-Manager Select 2030 Fund
Multi-Manager Select 2035 Fund
Multi-Manager Select 2040 Fund
Multi-Manager Select 2045 Fund
Multi-Manager Select 2050 Fund
Multi-Manager Select 2055 Fund
CLOSED-END FUNDS
Alliance California Municipal Income Fund
AllianceBernstein Global High Income Fund
AllianceBernstein National Municipal Income Fund
We also offer Government Money Market Portfolio1, which serves as the money market fund exchange vehicle for the AB mutual funds. An investment in Government Money Market Portfolio is not a deposit in a bank and is not insured or guaranteed by the Federal Deposit Insurance Corporation or any other government agency. Although the Fund seeks to preserve the value of your investment at $1.00 per share, it is possible to lose money by investing in the Fund.
Investors should consider the investment objectives, risks, charges and expenses of the Fund carefully before investing. For copies of our prospectus or summary prospectus, which contain this and other information, visit us online at www.abfunds.com or contact your AB representative. Please read the prospectus and/or summary prospectus carefully before investing.
| 1 | Prior to January 9, 2017, Relative Value Fund was named Growth & Income Fund; prior to April 17, 2017, Tax-Managed All Market Income Portfolio was named Tax-Managed Balanced Wealth Strategy; prior to April 24, 2017, All Market Total Return Portfolio was named Balanced Wealth Strategy; prior to November 10, 2017, Government Money Market Portfolio was named Government Exchange Reserves. |
| abfunds.com | AB CREDIT LONG/SHORT PORTFOLIO | 93 |
NOTES
| 94 | AB CREDIT LONG/SHORT PORTFOLIO | abfunds.com |
NOTES
| abfunds.com | AB CREDIT LONG/SHORT PORTFOLIO | 95 |
NOTES
| 96 | AB CREDIT LONG/SHORT PORTFOLIO | abfunds.com |
NOTES
| abfunds.com | AB CREDIT LONG/SHORT PORTFOLIO | 97 |
NOTES
| 98 | AB CREDIT LONG/SHORT PORTFOLIO | abfunds.com |
NOTES
| abfunds.com | AB CREDIT LONG/SHORT PORTFOLIO | 99 |
NOTES
| 100 | AB CREDIT LONG/SHORT PORTFOLIO | abfunds.com |
AB CREDIT LONG/SHORT PORTFOLIO
1345 Avenue of the Americas
New York, NY 10105
800 221 5672
CLS-0151-1017 
OCT 10.31.17

ANNUAL REPORT
AB HIGH YIELD PORTFOLIO


| Investment Products Offered | • Are Not FDIC Insured • May Lose Value • Are Not Bank Guaranteed | |
Investors should consider the investment objectives, risks, charges and expenses of the Fund carefully before investing. For copies of our prospectus or summary prospectus, which contain this and other information, visit us online at www.abfunds.com or contact your AB representative. Please read the prospectus and/or summary prospectus carefully before investing.
This shareholder report must be preceded or accompanied by the Fund’s prospectus for individuals who are not current shareholders of the Fund.
You may obtain a description of the Fund’s proxy voting policies and procedures, and information regarding how the Fund voted proxies relating to portfolio securities during the most recent 12-month period ended June 30, without charge. Simply visit AB’s website at www.abfunds.com, or go to the Securities and Exchange Commission’s (the “Commission”) website at www.sec.gov, or call AB at (800) 227 4618.
The Fund files its complete schedule of portfolio holdings with the Commission for the first and third quarters of each fiscal year on Form N-Q. The Fund’s Forms N-Q are available on the Commission’s website at www.sec.gov. The Fund’s Forms N-Q may also be reviewed and copied at the Commission’s Public Reference Room in Washington, DC; information on the operation of the Public Reference Room may be obtained by calling (800) SEC 0330. AB publishes full portfolio holdings for the Fund monthly at www.abfunds.com.
AllianceBernstein Investments, Inc. (ABI) is the distributor of the AB family of mutual funds. ABI is a member of FINRA and is an affiliate of AllianceBernstein L.P., the Adviser of the funds.
The [A/B] logo is a registered service mark of AllianceBernstein and AllianceBernstein® is a registered service mark used by permission of the owner, AllianceBernstein L.P.
| FROM THE PRESIDENT |  |
Dear Shareholder,
We are pleased to provide this report for AB High Yield Portfolio (the “Fund”). Please review the discussion of Fund performance, the market conditions during the reporting period and the Fund’s investment strategy.
As always, AB strives to keep clients ahead of what’s next by:
| + | Transforming uncommon insights into uncommon knowledge with a global research scope |
| + | Navigating markets with seasoned investment experience and sophisticated solutions |
| + | Providing thoughtful investment insights and actionable ideas |
Whether you’re an individual investor or a multi-billion-dollar institution, we put knowledge and experience to work for you.
AB’s global research organization connects and collaborates across platforms and teams to deliver impactful insights and innovative products. Better insights lead to better opportunities—anywhere in the world.
For additional information about AB’s range of products and shareholder resources, please log on to www.abfunds.com.
Thank you for your investment in the AB Mutual Funds.
Sincerely,

Robert M. Keith
President and Chief Executive Officer, AB Mutual Funds
| abfunds.com | AB HIGH YIELD PORTFOLIO | 1 |
ANNUAL REPORT
December 12, 2017
This report provides management’s discussion of fund performance for AB High Yield Portfolio for the annual reporting period ended October 31, 2017.
The Fund’s investment objective is to seek to maximize total return consistent with prudent investment management.
NAV RETURNS AS OF OCTOBER 31, 2017 (unaudited)
| 6 Months | 12 Months | |||||||
| AB HIGH YIELD PORTFOLIO1 | ||||||||
| Class A Shares | 2.63% | 7.73% | ||||||
| Class C Shares | 2.23% | 6.92% | ||||||
| Advisor Class Shares2 | 2.76% | 8.00% | ||||||
| Class R Shares2 | 2.50% | 7.48% | ||||||
| Class K Shares2 | 2.62% | 7.73% | ||||||
| Class I Shares2 | 2.76% | 8.00% | ||||||
| Class Z Shares2 | 2.77% | 8.02% | ||||||
| Bloomberg Barclays US Corporate HY 2% Issuer Capped Index | 3.44% | 8.92% | ||||||
| 1 | Includes the impact of proceeds received and credited to the Fund resulting from class-action settlements, which enhanced the performance of the Fund for the six- and 12-month periods ended October 31, 2017, by 0.01% and 0.07%, respectively. Also includes the impact of a non-recurring refund for overbilling of prior years’ custody out of pocket fees, which enhanced performance for the six- and 12-month periods ended October 31, 2017, by 0.00% and 0.03%, respectively. The returns shown are based on net asset values calculated for shareholder transactions and may differ from the returns shown in the Financial Highlights, which reflect adjustments made to the net asset values in accordance with accounting principles generally accepted in the United States of America. |
| 2 | Please note that these share classes are for investors purchasing shares through accounts established under certain fee-based programs sponsored and maintained by certain broker-dealers and financial intermediaries, institutional pension plans and/or investment advisory clients of, and certain other persons associated with, the Adviser and its affiliates or the Fund. |
At a meeting held on October 31-November 2, 2017, the Board of Directors of the Fund (the “Board”) approved a proposal (the “Proposal”) to amend the investment advisory agreement (the “Agreement”) of the Fund to change the Fund’s advisory fee to a performance-based, or “fulcrum,” fee. The Proposal is subject to approval by the Fund’s shareholders at a special meeting of the shareholders of the Fund scheduled for January 18, 2018. Under the current Agreement, the Fund pays to the Adviser an advisory fee at the annual rate of 0.55% of the Fund’s average daily net assets up to $2.5 billion, 0.50% of average daily net assets in excess of $2.5 billion up to $5 billion, and 0.45% of average daily net assets in excess of $5 billion. Under the Agreement as proposed to be amended (the “Amended Agreement”), the Fund would pay to the Adviser an advisory fee consisting of a base (or fulcrum) fee of 0.40% and a performance
| 2 | AB HIGH YIELD PORTFOLIO | abfunds.com |
adjustment based upon the investment performance of the Advisor Class shares of the Fund in relation to the investment record of the Markit iBoxx USD Liquid High Yield Index plus 0.75% (75 basis points) (the “Performance Index”). Under the Amended Agreement, the advisory fee may be increased to as much as 0.60% annualized, or decreased to as little as 0.20% annualized, dependent upon the performance of the Fund’s Advisor Class shares versus the Performance Index; the advisory fee will be 0.40% if the performance of Advisor Class shares equals the performance of the Performance Index. The Board also approved certain additional actions with respect to the Fund, including the following: (i) a change in the Fund’s name to “AB FlexFee™ High Yield Portfolio” and (ii) the conversion of Class A, Class C, Class R, Class I and Class Z shares of the Fund to Advisor Class shares of the Fund. Implementation of these actions is conditioned upon approval of the Proposal by shareholders. Additional information regarding the proposal may be found in the supplement dated November 3, 2017 to the Fund’s prospectus. Further information about the Proposal will appear in a proxy statement to be sent to the Fund’s shareholders.
INVESTMENT RESULTS
The preceding table shows the Fund’s performance compared to its benchmark, the Bloomberg Barclays US Corporate High Yield (“HY”) 2% Issuer Capped Index, for the six- and 12-month periods ended October 31, 2017.
During the 12-month period, all share classes of the Fund underperformed the benchmark, before sales charges. The Fund’s exposures to cash and Treasuries detracted from relative performance, as risk assets performed well in the period. An overweight position in banking and underweight in retailers offset some of these negative returns. Security selection contributed to performance, helped by selections in the energy, basic industries, automotive and industrials sectors. Selections in transportation services, consumer non-cyclicals, telecommunications, capital goods and banking detracted. Yield-curve positioning was positive, helped most by the Fund’s underweight in 10-year maturities. Currency selection did not have a meaningful effect on performance.
During the six-month period, all share classes of the Fund underperformed the benchmark, before sales charges. Allocations to cash and Treasuries detracted from relative performance, as risk assets performed well in the period. An overweight in banking and underweight in energy contributed. Currency selection was a modest detractor. Yield-curve positioning was a small positive, primarily because of positioning along the 20- and 30-year part of the curve, where yields fell. Security selection had an immaterial impact on performance, as gains from selections within the basic industries, automotive and technology sectors were more than offset by losses from selections in energy, media, telecommunications and capital goods.
| abfunds.com | AB HIGH YIELD PORTFOLIO | 3 |
During both periods, the Fund utilized derivatives in the form of futures to hedge duration risk. Currency forwards were used to hedge foreign currency exposure and to take active currency risk. Currency options, both written and purchased, were used to hedge foreign currency exposure. Credit default swaps, both single name and index, were used to take active exposure as well as to hedge investment-grade and high-yield credit risk taken through cash bonds, which detracted from absolute returns during both periods. Interest rate swaps were used to manage and hedge duration risk. Total return swaps were used to create synthetic high-yield exposure, which contributed for both periods. Written swaptions were used to manage and/or take active yield-curve positioning.
MARKET REVIEW AND INVESTMENT STRATEGY
Political events and central bank action had a significant impact on bond markets in the six- and 12-month periods ended October 31, 2017. Donald Trump’s US election victory and the promise of fiscal stimulus, a retreat from globalization and relaxed regulation were treated as positive developments by financial markets. However, uncertainty regarding the Trump administration’s ability to implement meaningful change increased through the 12-month period. UK prime minister Theresa May surprised investors when she called for a snap parliamentary election in an effort to firm up the UK’s mandate going into Brexit negotiations. However, the results of the vote increased political uncertainty when May’s Conservative Party failed to secure a majority position. Investors were relieved when centrist, pro-EU candidate Emmanuel Macron was elected president of France, as his reformist agenda was seen as more business friendly than the protectionist policies espoused by his opponent. In June, the US Federal Reserve (the “Fed”) raised interest rates for the third consecutive quarter, hikes that were well-telegraphed and universally anticipated by markets. Late in the period, the Fed formally confirmed that its balance sheet reduction program would start in October, while the European Central Bank announced that it would start to taper the pace of its monthly asset purchases in January 2018.
Emerging-market debt rallied over both periods, helped by a positive global growth story and increasing oil prices. Outside of Europe, developed-market treasury yields generally rose; in the eurozone and UK, yields moved in different directions. Emerging-market local-currency government bonds, developed-market treasuries and investment-grade credit securities all rose in both periods, yet trailed the rally in global high yield. Within high yield, performance was almost uniformly positive, led by the transportation and basic industries sectors, while consumer sectors tended to lag the rising market.
| 4 | AB HIGH YIELD PORTFOLIO | abfunds.com |
INVESTMENT POLICIES
At least 80% of the Fund’s net assets will, under normal circumstances, be invested in fixed-income securities rated Ba1 or lower by Moody’s Investors Service or BB+ or lower by S&P Global Ratings or Fitch Ratings (commonly known as “junk bonds”), unrated securities considered by the Adviser to be of comparable quality, and related derivatives. The Fund may invest in fixed-income securities with a range of maturities from short- to long-term. The Fund may also invest in equity securities.
In selecting securities for purchase or sale by the Fund, the Adviser attempts to take advantage of inefficiencies that it believes exist in the global debt markets. These inefficiencies arise from investor behavior, market complexity, and the investment limitations to which investors are subject. The Adviser combines quantitative analysis with fundamental credit and economic research in seeking to exploit these inefficiencies.
The Fund will most often invest in securities of US issuers, but may also purchase fixed-income securities of foreign issuers, including securities denominated in foreign currencies. Fluctuations in currency exchange rates can have a dramatic impact on the returns of fixed-income securities denominated in foreign currencies. The Adviser may or may not hedge any foreign currency exposure through the use of currency-related derivatives.
The Fund expects to use derivatives, such as options, futures contracts, forwards and swaps, to a significant extent. Derivatives may provide a more efficient and economical exposure to market segments than direct investments, and may also be a more efficient way to alter the Fund’s exposure. The Fund may, for example, use credit default and interest rate swaps to gain exposure to the fixed-income markets or particular fixed-income securities and, as noted above, may use currency-related derivatives. The Adviser may use derivatives to effectively leverage the Fund by creating aggregate market exposure substantially in excess of the Fund’s net assets.
| abfunds.com | AB HIGH YIELD PORTFOLIO | 5 |
DISCLOSURES AND RISKS
Benchmark Disclosure
The Bloomberg Barclays US Corporate HY 2% Issuer Capped Index is unmanaged and does not reflect fees and expenses associated with the active management of a mutual fund portfolio. The Bloomberg Barclays US Corporate HY 2% Issuer Capped Index is the 2% Issuer Capped component of the US Corporate HY Index. The Bloomberg Barclays US Corporate HY Index represents the performance of fixed-income securities having a maximum quality rating of Ba1, a minimum amount outstanding of $150 million and at least one year to maturity. An investor cannot invest directly in an index or average, and their results are not indicative of the performance for any specific investment, including the Fund.
A Word About Risk
Market Risk: The value of the Fund’s assets will fluctuate as the bond or stock market fluctuates. The value of its investments may decline, sometimes rapidly and unpredictably, simply because of economic changes or other events that affect large portions of the market.
Interest Rate Risk: Changes in interest rates will affect the value of investments in fixed-income securities. When interest rates rise, the value of existing investments in fixed-income securities tends to fall and this decrease in value may not be offset by higher income from new investments. The Fund may be subject to heightened interest rate risk due to rising rates as the current period of historically low interest rates may be ending. Interest rate risk is generally greater for fixed-income securities with longer maturities or durations.
Credit Risk: An issuer or guarantor of a fixed-income security, or the counterparty to a derivatives or other contract, may be unable or unwilling to make timely payments of interest or principal, or to otherwise honor its obligations. The issuer or guarantor may default, causing a loss of the full principal amount of a security and accrued interest. The degree of risk for a particular security may be reflected in its credit rating. There is the possibility that the credit rating of a fixed-income security may be downgraded after purchase, which may adversely affect the value of the security.
Below Investment Grade Securities Risk: Investments in fixed-income securities with lower ratings (commonly known as “junk bonds”) are subject to a higher probability that an issuer will default or fail to meet its payment obligations. These securities may be subject to greater price volatility, due to such factors as specific corporate developments, negative perceptions of the junk bond market generally and less secondary market liquidity.
Duration Risk: Duration is a measure that relates the expected price volatility of a fixed-income security to changes in interest rates. The duration of
| 6 | AB HIGH YIELD PORTFOLIO | abfunds.com |
DISCLOSURES AND RISKS (continued)
a fixed-income security may be shorter than or equal to full maturity of a fixed-income security. Fixed-income securities with longer durations have more risk and will decrease in price as interest rates rise. For example, a fixed-income security with a duration of three years will decrease in value by approximately 3% if interest rates increase by 1%.
Inflation Risk: This is the risk that the value of assets or income from investments will be less in the future as inflation decreases the value of money. As inflation increases, the value of the Fund’s assets can decline as can the value of the Fund’s distributions. This risk is significantly greater if the Fund invests a significant portion of its assets in fixed-income securities with longer maturities.
Derivatives Risk: Derivatives may be illiquid, difficult to price, and leveraged so that small changes may produce disproportionate losses for the Fund, and may be subject to counterparty risk to a greater degree than more traditional investments.
Leverage Risk: To the extent the Fund uses leveraging techniques, its net asset value (“NAV”) may be more volatile because leverage tends to exaggerate the effect of changes in interest rates and any increase or decrease in the value of the Fund’s investments.
Foreign (Non-US) Risk: Investments in securities of non-US issuers may involve more risk than those of US issuers. These securities may fluctuate more widely in price and may be less liquid due to adverse market, economic, political, regulatory or other factors.
Emerging Market Risk: Investments in emerging-market countries may have more risk because the markets are less developed and less liquid, and because these investments may be subject to increased economic, political, regulatory or other uncertainties.
Currency Risk: Fluctuations in currency exchange rates may negatively affect the value of the Fund’s investments or reduce its returns.
Non-Diversification Risk: The Fund may have more risk because it is “non-diversified”, meaning that it can invest more of its assets in a smaller number of issuers. Accordingly, changes in the value of a single security may have a more significant effect, either negative or positive, on the Fund’s NAV.
Liquidity Risk: Liquidity risk occurs when certain investments become difficult to purchase or sell. Difficulty in selling less liquid securities may result in sales at disadvantageous prices affecting the value of your investment in the Fund. Causes of liquidity risk may include low trading volumes,
| abfunds.com | AB HIGH YIELD PORTFOLIO | 7 |
DISCLOSURES AND RISKS (continued)
large positions and heavy redemptions of Fund shares. Over recent years liquidity risk has also increased because the capacity of dealers in the secondary market for fixed-income securities to make markets in these securities has decreased, even as the overall bond market has grown significantly, due to, among other things, structural changes, additional regulatory requirements and capital and risk restraints that have led to reduced inventories. Liquidity risk may be higher in a rising interest rate environment, when the value and liquidity of fixed-income securities generally decline.
Management Risk: The Fund is subject to management risk because it is an actively managed investment fund. The Adviser will apply its investment techniques and risk analyses in making investment decisions, but there is no guarantee that its techniques will produce the intended results.
These risks are fully discussed in the Fund’s prospectus. As with all investments, you may lose money by investing in the Fund.
An Important Note About Historical Performance
The investment return and principal value of an investment in the Fund will fluctuate, so that shares, when redeemed, may be worth more or less than their original cost. Performance shown in this report represents past performance and does not guarantee future results. Current performance may be lower or higher than the performance information shown. You may obtain performance information current to the most recent month-end by visiting www.abfunds.com.
The performance information discussed herein reflects in part the historical performance of the High Yield Portfolio, a series of The AB Pooling Portfolios (the “Accounting Survivor”), and is based on the NAV per share of the Accounting Survivor prior to the reorganization of the Accounting Survivor into the Fund at the close of business July 26, 2016 (the “Reorganization”) and the Fund thereafter. Upon completion of the Reorganization, Class A, Class C, Advisor Class, Class R, Class K, Class I and Class Z shares of the Fund assumed the performance, financial and other historical information of the Accounting Survivor, and the Fund adopted the fiscal year-end of the Accounting Survivor, August 31. The Fund subsequently changed its fiscal year-end to October 31. Performance information of Class A, Class C, Advisor Class, Class R, Class K and Class I shares for periods prior to the Reorganization is the performance of the Fund’s Class Z shares, which is based on the Accounting Survivor’s performance, and is adjusted to reflect the respective expense ratios of the Class A, Class C, Advisor Class, Class R, Class K and Class I shares. At the time of the Reorganization, the Accounting Survivor and the Fund had substantially similar investment objectives and strategies. The Fund has higher expenses than the Accounting
| 8 | AB HIGH YIELD PORTFOLIO | abfunds.com |
DISCLOSURES AND RISKS (continued)
Survivor (including a management fee, transfer agency and shareholder servicing fees). The Accounting Survivor’s performance would have been lower than that shown had it operated at the Fund’s current expense levels.
All fees and expenses related to the operation of the Fund have been deducted. NAV returns do not reflect sales charges; if sales charges were reflected, the Fund’s quoted performance would be lower. SEC returns reflect the applicable sales charges for each share class: a 4.25% maximum front-end sales charge for Class A shares and a 1% 1-year contingent deferred sales charge for Class C shares. Returns for the different share classes will vary due to different expenses associated with each class. Performance assumes reinvestment of distributions and does not account for taxes.
| abfunds.com | AB HIGH YIELD PORTFOLIO | 9 |
HISTORICAL PERFORMANCE
GROWTH OF A $10,000 INVESTMENT IN THE FUND (unaudited)
10/31/2007 TO 10/31/2017
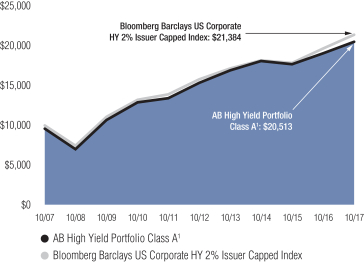
This chart illustrates the total value of an assumed $10,000 investment in AB High Yield Portfolio Class A shares (from 10/31/2007 to 10/31/2017) as compared to the performance of the Fund’s benchmark. The chart reflects the deduction of the maximum 4.25% sales charge from the initial $10,000 investment in the Fund and assumes the reinvestment of dividends and capital gains distributions.
| 1 | Performance information of Class A shares for periods prior to the Reorganization is the performance of the Fund’s Class Z shares, which is based on the Accounting Survivor’s performance, and is adjusted to reflect the expense ratios of Class A shares. |
| 10 | AB HIGH YIELD PORTFOLIO | abfunds.com |
HISTORICAL PERFORMANCE (continued)
AVERAGE ANNUAL RETURNS AS OF OCTOBER 31, 2017 (unaudited)
| NAV Returns | SEC Returns1 (reflects applicable sales charges) | SEC Yields2 | ||||||||||
| CLASS A SHARES | 3.01% | |||||||||||
| 1 Year | 7.73% | 3.14% | ||||||||||
| 5 Years | 5.96% | 5.05% | ||||||||||
| 10 Years | 7.92% | 7.45% | ||||||||||
| CLASS C SHARES | 2.73% | |||||||||||
| 1 Year | 6.92% | 5.92% | ||||||||||
| 5 Years | 5.17% | 5.17% | ||||||||||
| 10 Years | 7.12% | 7.12% | ||||||||||
| ADVISOR CLASS SHARES3 | 3.20% | |||||||||||
| 1 Year | 8.00% | 8.00% | ||||||||||
| 5 Years | 6.23% | 6.23% | ||||||||||
| 10 Years | 8.19% | 8.19% | ||||||||||
| CLASS R SHARES3 | 2.92% | |||||||||||
| 1 Year | 7.48% | 7.48% | ||||||||||
| 5 Years | 5.70% | 5.70% | ||||||||||
| 10 Years | 7.65% | 7.65% | ||||||||||
| CLASS K SHARES3 | 3.50% | |||||||||||
| 1 Year | 7.73% | 7.73% | ||||||||||
| 5 Years | 5.97% | 5.97% | ||||||||||
| 10 Years | 7.92% | 7.92% | ||||||||||
| CLASS I SHARES3 | 3.78% | |||||||||||
| 1 Year | 8.00% | 8.00% | ||||||||||
| 5 Years | 6.23% | 6.23% | ||||||||||
| 10 Years | 8.19% | 8.19% | ||||||||||
| CLASS Z SHARES3 | 3.99% | |||||||||||
| 1 Year | 8.02% | 8.02% | ||||||||||
| 5 Years | 6.21% | 6.21% | ||||||||||
| 10 Years | 8.18% | 8.18% | ||||||||||
The Fund’s prospectus fee table shows the Fund’s total annual operating expense ratios as 2.13%, 2.96%, 1.88%, 1.97%, 1.52%, 1.24% and 1.24% for Class A, Class C, Advisor Class, Class R, Class K, Class I and Class Z shares, respectively, gross of any fee waivers or expense reimbursements. Contractual fee waivers and/or expense reimbursements limit the Fund’s annual operating expense ratios exclusive of acquired fund fees and expenses other than the advisory fees of any AB mutual funds in which the Fund may invest, interest expense, taxes, extraordinary expenses, and brokerage commissions and other transaction costs to 0.95%, 1.70%, 0.70%, 1.20%, 0.95%, 0.70% and 0.70% for Class A, Class C, Advisor Class, Class R, Class K, Class I and Class Z shares, respectively. These waivers/reimbursements may not be terminated before January 31, 2018 and may be extended by the Adviser for additional one-year terms. Any fees waived and expenses borne by the Adviser prior to July 15, 2015 may be reimbursed by the Fund until the end of the third fiscal
(footnotes continued on next page)
| abfunds.com | AB HIGH YIELD PORTFOLIO | 11 |
HISTORICAL PERFORMANCE (continued)
year after the fiscal period in which the fee was waived or the expense was borne, provided that no reimbursement payment will be made that would cause the Fund’s total annual operating expenses to exceed the expense limitations. Absent reimbursements or waivers, performance would have been lower. The Financial Highlights section of this report sets forth expense ratio data for the current reporting period; the expense ratios shown above may differ from the expense ratios in the Financial Highlights sections since they are based on different time periods.
| 1 | Performance information of Class A, Class C, Advisor Class, Class R, Class K and Class I shares for periods prior to the Reorganization is the performance of the Fund’s Class Z shares, which is based on the Accounting Survivor’s performance, and is adjusted to reflect the respective expense ratios of Class A, Class C, Advisor Class, Class R, Class K and Class I shares. |
| 2 | SEC yields are calculated based on SEC guidelines for the 30-day period ended October 31, 2017. |
| 3 | These share classes are offered at NAV to eligible investors and their SEC returns are the same as their NAV returns. Please note that these share classes are for investors purchasing shares through accounts established under certain fee-based programs sponsored and maintained by certain broker-dealers and financial intermediaries, institutional pension plans and/or investment advisory clients of, and certain other persons associated with, the Adviser and its affiliates or the Fund. |
| 12 | AB HIGH YIELD PORTFOLIO | abfunds.com |
HISTORICAL PERFORMANCE (continued)
SEC AVERAGE ANNUAL RETURNS
AS OF THE MOST RECENT CALENDAR QUARTER-END
SEPTEMBER 30, 2017 (unaudited)
SEC Returns1 (reflects applicable sales charges) | ||||
| CLASS A SHARES | ||||
| 1 Year | 3.12% | |||
| 5 Years | 5.21% | |||
| 10 Years | 7.45% | |||
| CLASS C SHARES | ||||
| 1 Year | 5.90% | |||
| 5 Years | 5.34% | |||
| 10 Years | 7.12% | |||
| ADVISOR CLASS SHARES2 | ||||
| 1 Year | 7.86% | |||
| 5 Years | 6.39% | |||
| 10 Years | 8.19% | |||
| CLASS R SHARES2 | ||||
| 1 Year | 7.45% | |||
| 5 Years | 5.87% | |||
| 10 Years | 7.66% | |||
| CLASS K SHARES2 | ||||
| 1 Year | 7.71% | |||
| 5 Years | 6.13% | |||
| 10 Years | 7.92% | |||
| CLASS I SHARES2 | ||||
| 1 Year | 7.86% | |||
| 5 Years | 6.39% | |||
| 10 Years | 8.19% | |||
| CLASS Z SHARES2 | ||||
| 1 Year | 7.99% | |||
| 5 Years | 6.40% | |||
| 10 Years | 8.19% | |||
| 1 | Performance information of Class A, Class C, Advisor Class, Class R, Class K and Class I shares for periods prior to the Reorganization is the performance of the Fund’s Class Z shares, which is based on the Accounting Survivor’s performance, and is adjusted to reflect the respective expense ratios of Class A, Class C, Advisor Class, Class R, Class K and Class I shares. |
| 2 | Please note that these share classes are for investors purchasing shares through accounts established under certain fee-based programs sponsored and maintained by certain broker-dealers and financial intermediaries, institutional pension plans and/or investment advisory clients of, and certain other persons associated with, the Adviser and its affiliates or the Fund. |
| abfunds.com | AB HIGH YIELD PORTFOLIO | 13 |
EXPENSE EXAMPLE
(unaudited)
As a shareholder of the Fund, you incur two types of costs: (1) transaction costs, including sales charges (loads) on purchase payments, contingent deferred sales charges on redemptions and (2) ongoing costs, including management fees; distribution (12b-1) fees; and other Fund expenses. This example is intended to help you understand your ongoing costs (in dollars) of investing in the Fund and to compare these costs with the ongoing costs of investing in other mutual funds.
The Example is based on an investment of $1,000 invested at the beginning of the period and held for the entire period as indicated below.
Actual Expenses
The first line of the table below provides information about actual account values and actual expenses. You may use the information in this line, together with the amount you invested, to estimate the expenses that you paid over the period. Simply divide your account value by $1,000 (for example, an $8,600 account value divided by $1,000 = 8.6), then multiply the result by the number in the first line under the heading entitled “Expenses Paid During Period” to estimate the expenses you paid on your account during this period.
Hypothetical Example for Comparison Purposes
The second line of the table below provides information about hypothetical account values and hypothetical expenses based on the Fund’s actual expense ratio and an assumed annual rate of return of 5% before expenses, which is not the Fund’s actual return. The hypothetical account values and expenses may not be used to estimate the actual ending account balance or expenses you paid for the period. You may use this information to compare the ongoing costs of investing in the Fund and other funds by comparing this 5% hypothetical example with the 5% hypothetical examples that appear in the shareholder reports of other funds.
| Beginning Account Value May 1, 2017 | Ending Account Value October 31, 2017 | Expenses Paid During Period* | Annualized Expense Ratio* | Total Expenses Paid During Period+ | Total Annualized Expense Ratio+ | |||||||||||||||||||
| Class A | ||||||||||||||||||||||||
Actual | $ | 1,000 | $ | 1,026.30 | $ | 4.85 | 0.95 | % | $ | 4.90 | 0.96 | % | ||||||||||||
Hypothetical** | $ | 1,000 | $ | 1,020.42 | $ | 4.84 | 0.95 | % | $ | 4.89 | 0.96 | % | ||||||||||||
| Class C | ||||||||||||||||||||||||
Actual | $ | 1,000 | $ | 1,022.30 | $ | 8.67 | 1.70 | % | $ | 8.72 | 1.71 | % | ||||||||||||
Hypothetical** | $ | 1,000 | $ | 1,016.64 | $ | 8.64 | 1.70 | % | $ | 8.69 | 1.71 | % | ||||||||||||
| Advisor Class | ||||||||||||||||||||||||
Actual | $ | 1,000 | $ | 1,027.60 | $ | 3.58 | 0.70 | % | $ | 3.63 | 0.71 | % | ||||||||||||
Hypothetical** | $ | 1,000 | $ | 1,021.68 | $ | 3.57 | 0.70 | % | $ | 3.62 | 0.71 | % | ||||||||||||
| 14 | AB HIGH YIELD PORTFOLIO | abfunds.com |
EXPENSE EXAMPLE (continued)
| Beginning Account Value May 1, 2017 | Ending Account Value October 31, 2017 | Expenses Paid During Period* | Annualized Expense Ratio* | Total Expenses Paid During Period+ | Total Annualized Expense Ratio+ | |||||||||||||||||||
| Class R | ||||||||||||||||||||||||
Actual | $ | 1,000 | $ | 1,025.00 | $ | 6.12 | 1.20 | % | $ | 6.12 | 1.20 | % | ||||||||||||
Hypothetical** | $ | 1,000 | $ | 1,019.16 | $ | 6.11 | 1.20 | % | $ | 6.11 | 1.20 | % | ||||||||||||
| Class K | ||||||||||||||||||||||||
Actual | $ | 1,000 | $ | 1,026.20 | $ | 4.80 | 0.94 | % | $ | 4.80 | 0.94 | % | ||||||||||||
Hypothetical** | $ | 1,000 | $ | 1,020.47 | $ | 4.79 | 0.94 | % | $ | 4.79 | 0.94 | % | ||||||||||||
| Class I | ||||||||||||||||||||||||
Actual | $ | 1,000 | $ | 1,027.60 | $ | 3.58 | 0.70 | % | $ | 3.63 | 0.71 | % | ||||||||||||
Hypothetical** | $ | 1,000 | $ | 1,021.68 | $ | 3.57 | 0.70 | % | $ | 3.62 | 0.71 | % | ||||||||||||
| Class Z | ||||||||||||||||||||||||
Actual | $ | 1,000 | $ | 1,027.70 | $ | 3.94 | 0.77 | % | $ | 3.99 | 0.78 | % | ||||||||||||
Hypothetical** | $ | 1,000 | $ | 1,021.32 | $ | 3.92 | 0.77 | % | $ | 3.97 | 0.78 | % | ||||||||||||
| * | Expenses are equal to the classes’ annualized expense ratios multiplied by the average account value over the period, multiplied by 184/365 (to reflect the one-half year period). |
| ** | Assumes 5% annual return before expenses. |
| + | In connection with the Portfolio’s investments in affiliated/unaffiliated underlying portfolios, the Portfolio incurs no direct expenses, but bears proportionate shares of the fees and expenses (i.e., operating, administrative and investment advisory fees) of the affiliated/unaffiliated underlying portfolios. The Adviser has contractually agreed to waive its fees from the Portfolio in an amount equal to the Portfolio’s pro rata share of certain acquired fund fees and expenses of the affiliated underlying portfolios. The Portfolio’s total expenses are equal to the classes’ annualized expense ratio plus the Portfolio’s pro rata share of the weighted average expense ratio of the affiliated/unaffiliated underlying portfolios in which it invests, multiplied by the average account value over the period, multiplied by 184/365 (to reflect the one-half year period). |
| abfunds.com | AB HIGH YIELD PORTFOLIO | 15 |
PORTFOLIO SUMMARY
October 31, 2017 (unaudited)
PORTFOLIO STATISTICS
Net Assets ($mil): $28.3
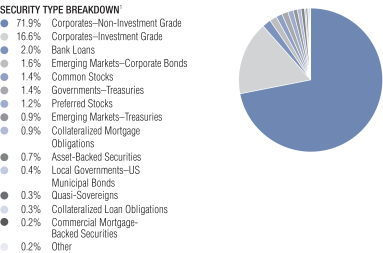
| 1 | All data are as of October 31, 2017. The Fund’s security type breakdown is expressed as a percentage of total investments and may vary over time. The Fund also enters into derivative transactions, which may be used for hedging or investment purposes (see “Portfolio of Investments” section of the report for additional details). “Other” security type weightings represent 0.1% or less in the following types: Emerging Markets–Sovereigns, Inflation-Linked Securities, Options Purchased–Calls, Options Purchased–Puts and Warrants. |
| 16 | AB HIGH YIELD PORTFOLIO | abfunds.com |
PORTFOLIO OF INVESTMENTS
October 31, 2017
| Principal Amount (000) | U.S. $ Value | |||||||||||
| ||||||||||||
CORPORATES – NON-INVESTMENT GRADE – 72.3% | ||||||||||||
Industrial – 63.7% | ||||||||||||
Basic – 5.7% | ||||||||||||
AK Steel Corp. | U.S.$ | 13 | $ | 13,278 | ||||||||
Aleris International, Inc. | 17 | 17,440 | ||||||||||
ArcelorMittal | 22 | 24,197 | ||||||||||
6.125%, 6/01/18 | 36 | 37,246 | ||||||||||
7.25%, 3/01/41 | 46 | 56,190 | ||||||||||
7.50%, 10/15/39 | 91 | 113,838 | ||||||||||
Artsonig Pty Ltd. | 76 | 759 | ||||||||||
Berry Global, Inc. | 8 | 8,397 | ||||||||||
CF Industries, Inc. | 29 | 28,918 | ||||||||||
4.95%, 6/01/43 | 10 | 9,152 | ||||||||||
5.375%, 3/15/44 | 22 | 20,988 | ||||||||||
7.125%, 5/01/20 | 28 | 30,791 | ||||||||||
Cleveland-Cliffs, Inc. | 28 | 27,192 | ||||||||||
ERP Iron Ore, LLC | 9 | 8,890 | ||||||||||
FMG Resources August 206 Pty Ltd. | 42 | 43,255 | ||||||||||
Freeport-McMoRan, Inc. | 30 | 30,297 | ||||||||||
3.10%, 3/15/20 | 28 | 28,081 | ||||||||||
3.55%, 3/01/22 | 123 | 121,649 | ||||||||||
3.875%, 3/15/23 | 31 | 30,905 | ||||||||||
5.45%, 3/15/43 | 25 | 23,583 | ||||||||||
6.75%, 2/01/22 | 32 | 33,664 | ||||||||||
Graphic Packaging International, Inc. | 26 | 27,448 | ||||||||||
Grinding Media, Inc./Moly-Cop AltaSteel Ltd. | 39 | 42,782 | ||||||||||
Huntsman International LLC | 40 | 42,039 | ||||||||||
Joseph T Ryerson & Son, Inc. | 81 | 90,942 | ||||||||||
Lecta SA | EUR | 35 | 42,715 | |||||||||
| abfunds.com | AB HIGH YIELD PORTFOLIO | 17 |
PORTFOLIO OF INVESTMENTS (continued)
| Principal Amount (000) | U.S. $ Value | |||||||||||
| ||||||||||||
Lundin Mining Corp. | U.S.$ | 26 | $ | 27,040 | ||||||||
7.875%, 11/01/22(c) | 10 | 11,058 | ||||||||||
Magnetation LLC/Mag Finance Corp. | 60 | 1 | ||||||||||
Momentive Performance Materials, Inc. | 57 | 59,156 | ||||||||||
8.875%, 10/15/20(e)(f)(g)(i) | 47 | – 0 | – | |||||||||
Multi-Color Corp. | 24 | 24,209 | ||||||||||
NOVA Chemicals Corp. | 5 | 5,157 | ||||||||||
Novelis Corp. | 8 | 8,255 | ||||||||||
6.25%, 8/15/24(c) | 39 | 41,293 | ||||||||||
Pactiv LLC | 41 | 46,519 | ||||||||||
Peabody Energy Corp. | 93 | – 0 | – | |||||||||
6.00%, 3/31/22(c) | 45 | 46,730 | ||||||||||
Plastipak Holdings, Inc. | 21 | 21,418 | ||||||||||
Reynolds Group Issuer, Inc./Reynolds Group Issuer LLC/Reynolds Group Issuer Lu | 60 | 62,339 | ||||||||||
Sealed Air Corp. | 33 | 35,033 | ||||||||||
6.875%, 7/15/33(c) | 70 | 81,824 | ||||||||||
SPCM SA | 58 | 60,012 | ||||||||||
Steel Dynamics, Inc. | 4 | 4,492 | ||||||||||
Teck Resources Ltd. | 36 | 36,225 | ||||||||||
5.40%, 2/01/43 | 32 | 32,771 | ||||||||||
6.25%, 7/15/41 | 19 | 22,143 | ||||||||||
8.50%, 6/01/24(c) | 4 | 4,671 | ||||||||||
United States Steel Corp. | 18 | 19,738 | ||||||||||
Valvoline, Inc. | 7 | 7,424 | ||||||||||
W.R. Grace & Co.-Conn | 9 | 10,209 | ||||||||||
|
| |||||||||||
| 1,622,353 | ||||||||||||
|
| |||||||||||
Capital Goods – 3.3% |
| |||||||||||
Apex Tool Group LLC | 31 | 29,654 | ||||||||||
| 18 | AB HIGH YIELD PORTFOLIO | abfunds.com |
PORTFOLIO OF INVESTMENTS (continued)
| Principal Amount (000) | U.S. $ Value | |||||||||||
| ||||||||||||
ARD Finance SA | EUR | 57 | $ | 70,911 | ||||||||
Ardagh Packaging Finance PLC/Ardagh Holdings USA, Inc. | U.S.$ | 79 | 80,993 | |||||||||
4.625%, 5/15/23(c) | 17 | 18,040 | ||||||||||
7.25%, 5/15/24(c) | 3 | 3,207 | ||||||||||
B456 Systems, Inc. | 21 | 1,603 | ||||||||||
Ball Corp. | 36 | 37,939 | ||||||||||
5.00%, 3/15/22 | 50 | 53,419 | ||||||||||
Bombardier, Inc. | 183 | 181,758 | ||||||||||
6.00%, 10/15/22(c) | 40 | 39,477 | ||||||||||
8.75%, 12/01/21(c) | 7 | 7,912 | ||||||||||
Clean Harbors, Inc. | 52 | 52,291 | ||||||||||
5.25%, 8/01/20 | 4 | 4,307 | ||||||||||
EnPro Industries, Inc. | 22 | 23,015 | ||||||||||
Exide Technologies | 43 | 36,622 | ||||||||||
Gates Global LLC/Gates Global Co. | 18 | 18,273 | ||||||||||
GFL Environmental, Inc. | 35 | 36,362 | ||||||||||
9.875%, 2/01/21(c) | 25 | 26,979 | ||||||||||
Jefferson Smurfit Corp./US | 48 | – 0 | – | |||||||||
KLX, Inc. | 54 | 56,245 | ||||||||||
Owens-Brockway Glass Container, Inc. | 20 | 20,650 | ||||||||||
Smurfit-Stone Container Enterprises, Inc. | 50 | – 0 | – | |||||||||
TA MFG. Ltd. | EUR | 29 | 35,058 | |||||||||
TransDigm, Inc. | U.S.$ | 49 | 49,704 | |||||||||
6.50%, 7/15/24 | 49 | 50,530 | ||||||||||
|
| |||||||||||
| 934,949 | ||||||||||||
|
| |||||||||||
Communications - Media – 8.4% |
| |||||||||||
Altice Financing SA | 67 | 70,255 | ||||||||||
| abfunds.com | AB HIGH YIELD PORTFOLIO | 19 |
PORTFOLIO OF INVESTMENTS (continued)
| Principal Amount (000) | U.S. $ Value | |||||||||||
| ||||||||||||
Altice Luxembourg SA | EUR | 24 | $ | 29,313 | ||||||||
CCO Holdings LLC/CCO Holdings Capital Corp. | U.S.$ | 52 | 52,751 | |||||||||
5.00%, 2/01/28(c) | 185 | 183,603 | ||||||||||
5.125%, 2/15/23 | 29 | 29,471 | ||||||||||
5.125%, 5/01/27(c) | 40 | 40,609 | ||||||||||
5.25%, 9/30/22 | 6 | 6,298 | ||||||||||
5.375%, 5/01/25(c) | 12 | 12,688 | ||||||||||
5.875%, 5/01/27(c) | 23 | 23,908 | ||||||||||
Clear Channel Worldwide Holdings, Inc. | 41 | 41,719 | ||||||||||
Series B | 89 | 92,226 | ||||||||||
CSC Holdings LLC | 3 | 2,873 | ||||||||||
6.75%, 11/15/21 | 51 | 56,209 | ||||||||||
7.625%, 7/15/18 | 50 | 51,899 | ||||||||||
10.125%, 1/15/23(c) | 97 | 111,026 | ||||||||||
DISH DBS Corp. | 12 | 11,275 | ||||||||||
5.875%, 7/15/22 | 109 | 109,802 | ||||||||||
6.75%, 6/01/21 | 20 | 21,107 | ||||||||||
7.75%, 7/01/26 | 63 | 68,974 | ||||||||||
Gray Television, Inc. | 8 | 8,205 | ||||||||||
iHeartCommunications, Inc. | 50 | 24,915 | ||||||||||
9.00%, 12/15/19-9/15/22 | 115 | 84,358 | ||||||||||
11.25%, 3/01/21(c) | 10 | 7,322 | ||||||||||
Lamar Media Corp. | 30 | 30,975 | ||||||||||
5.875%, 2/01/22 | 6 | 5,996 | ||||||||||
McGraw-Hill Global Education Holdings LLC/McGraw-Hill Global Education Finance | 40 | 40,244 | ||||||||||
Mediacom Broadband LLC/Mediacom Broadband Corp. | 47 | 49,251 | ||||||||||
NAI Entertainment Holdings/NAI Entertainment Holdings Finance Corp. | 5 | 5,292 | ||||||||||
Netflix, Inc. | 33 | 32,837 | ||||||||||
| 20 | AB HIGH YIELD PORTFOLIO | abfunds.com |
PORTFOLIO OF INVESTMENTS (continued)
| Principal Amount (000) | U.S. $ Value | |||||||||||
| ||||||||||||
Outfront Media Capital LLC/Outfront Media Capital Corp. | U.S.$ | 8 | $ | 8,489 | ||||||||
Radiate Holdco LLC/Radiate Finance, Inc. | 17 | 17,089 | ||||||||||
RR Donnelley & Sons Co. | 29 | 30,543 | ||||||||||
SFR Group SA | 68 | 70,788 | ||||||||||
7.375%, 5/01/26(c) | 185 | 199,085 | ||||||||||
Sinclair Television Group, Inc. | 9 | 8,551 | ||||||||||
6.125%, 10/01/22 | 17 | 17,424 | ||||||||||
Sirius XM Radio, Inc. | 14 | 14,266 | ||||||||||
6.00%, 7/15/24(c) | 125 | 133,626 | ||||||||||
TEGNA, Inc. | 39 | 40,411 | ||||||||||
5.125%, 7/15/20 | 25 | 26,040 | ||||||||||
5.50%, 9/15/24(c) | 5 | 5,213 | ||||||||||
6.375%, 10/15/23 | 38 | 40,414 | ||||||||||
Time, Inc. | 5 | 4,738 | ||||||||||
7.50%, 10/15/25(c) | 35 | 35,164 | ||||||||||
Townsquare Media, Inc. | 7 | 6,774 | ||||||||||
Unitymedia Hessen GmbH & Co. KG/Unitymedia NRW GmbH | 28 | 28,920 | ||||||||||
Univision Communications, Inc. | 77 | 75,951 | ||||||||||
Urban One, Inc. | 37 | 36,944 | ||||||||||
9.25%, 2/15/20(c) | 47 | 44,248 | ||||||||||
Virgin Media Finance PLC | 2 | 2,261 | ||||||||||
Virgin Media Secured Finance PLC | GBP | 68 | 93,790 | |||||||||
Wave Holdco LLC/Wave Holdco Corp. | U.S.$ | 13 | 13,064 | |||||||||
WaveDivision Escrow LLC/WaveDivision Escrow Corp. | 3 | 2,980 | ||||||||||
Ziggo Bond Finance BV | 18 | 18,646 | ||||||||||
| abfunds.com | AB HIGH YIELD PORTFOLIO | 21 |
PORTFOLIO OF INVESTMENTS (continued)
| Principal Amount (000) | U.S. $ Value | |||||||||||
| ||||||||||||
Ziggo Secured Finance BV | U.S.$ | 110 | $ | 112,314 | ||||||||
|
| |||||||||||
| 2,393,134 | ||||||||||||
|
| |||||||||||
Communications - | ||||||||||||
Arqiva Broadcast Finance PLC | GBP | 22 | 30,659 | |||||||||
CenturyLink, Inc. | U.S.$ | 38 | 40,582 | |||||||||
Series T | 58 | 59,275 | ||||||||||
Series U | 46 | 41,820 | ||||||||||
Series W | 34 | 35,151 | ||||||||||
Embarq Corp. | 29 | 28,969 | ||||||||||
Frontier Communications Corp. | 22 | 18,056 | ||||||||||
7.125%, 1/15/23 | 52 | 40,127 | ||||||||||
7.625%, 4/15/24 | 55 | 41,787 | ||||||||||
7.875%, 1/15/27 | 13 | 9,171 | ||||||||||
8.75%, 4/15/22 | 56 | 46,328 | ||||||||||
8.875%, 9/15/20 | 30 | 29,180 | ||||||||||
10.50%, 9/15/22 | 57 | 49,408 | ||||||||||
11.00%, 9/15/25 | 44 | 37,183 | ||||||||||
Hughes Satellite Systems Corp. | 29 | 30,844 | ||||||||||
6.625%, 8/01/26 | 21 | 22,166 | ||||||||||
7.625%, 6/15/21 | 19 | 21,540 | ||||||||||
Intelsat Jackson Holdings SA | 38 | 32,448 | ||||||||||
7.25%, 10/15/20 | 122 | 116,986 | ||||||||||
7.50%, 4/01/21 | 28 | 26,704 | ||||||||||
8.00%, 2/15/24(c) | 10 | 10,862 | ||||||||||
9.50%, 9/30/22(c) | 22 | 25,859 | ||||||||||
9.75%, 7/15/25(c) | 56 | 56,191 | ||||||||||
Intelsat Luxembourg SA | 42 | 26,513 | ||||||||||
Level 3 Communications, Inc. | 8 | 7,806 | ||||||||||
Level 3 Financing, Inc. | 60 | 61,512 | ||||||||||
5.25%, 3/15/26 | 27 | 27,455 | ||||||||||
5.375%, 1/15/24 | 50 | 51,821 | ||||||||||
| 22 | AB HIGH YIELD PORTFOLIO | abfunds.com |
PORTFOLIO OF INVESTMENTS (continued)
| Principal Amount (000) | U.S. $ Value | |||||||||||
| ||||||||||||
Qwest Corp. | U.S.$ | 78 | $ | 86,782 | ||||||||
6.875%, 9/15/33 | 11 | 10,915 | ||||||||||
Sable International Finance Ltd. | 42 | 45,073 | ||||||||||
SoftBank Group Corp. | 75 | 77,373 | ||||||||||
Sprint Capital Corp. | 67 | 80,844 | ||||||||||
Sprint Communications, Inc. | 153 | 166,028 | ||||||||||
Sprint Corp. | 6 | 6,307 | ||||||||||
7.25%, 9/15/21 | 146 | 159,072 | ||||||||||
7.625%, 2/15/25 | 85 | 92,620 | ||||||||||
7.875%, 9/15/23 | 25 | 27,708 | ||||||||||
T-Mobile USA, Inc. | 27 | 29,154 | ||||||||||
6.50%, 1/15/24-1/15/26 | 136 | 147,385 | ||||||||||
Telecom Italia Capital SA | 56 | 64,949 | ||||||||||
7.20%, 7/18/36 | 33 | 40,523 | ||||||||||
7.721%, 6/04/38 | 46 | 59,376 | ||||||||||
Uniti Group LP/Uniti Group Finance, Inc./CSL Capital LLC | 29 | 29,008 | ||||||||||
Wind Acquisition Finance SA | 52 | 53,095 | ||||||||||
6.50%, 4/30/20(c) | 32 | 33,107 | ||||||||||
Windstream Services LLC | 92 | 69,863 | ||||||||||
Zayo Group LLC/Zayo Capital, Inc. | 38 | 39,946 | ||||||||||
6.00%, 4/01/23 | 23 | 24,236 | ||||||||||
6.375%, 5/15/25 | 34 | 36,636 | ||||||||||
|
| |||||||||||
| 2,406,403 | ||||||||||||
|
| |||||||||||
Consumer Cyclical - Automotive – 1.1% | ||||||||||||
BCD Acquisition, Inc. | 69 | 75,800 | ||||||||||
Cooper-Standard Automotive, Inc. | 8 | 8,292 | ||||||||||
Dana Financing Luxembourg SARL | 25 | 26,936 | ||||||||||
Exide Technologies | 4 | 2,194 | ||||||||||
Series AI | 87 | 52,602 | ||||||||||
| abfunds.com | AB HIGH YIELD PORTFOLIO | 23 |
PORTFOLIO OF INVESTMENTS (continued)
| Principal Amount (000) | U.S. $ Value | |||||||||||
| ||||||||||||
Goodyear Tire & Rubber Co. (The) | U.S.$ | 67 | $ | 69,020 | ||||||||
IHO Verwaltungs GmbH | 58 | 59,453 | ||||||||||
Meritor, Inc. | 8 | 8,549 | ||||||||||
Navistar International Corp. | 14 | 14,056 | ||||||||||
|
| |||||||||||
| 316,902 | ||||||||||||
|
| |||||||||||
Consumer Cyclical - Entertainment – 0.3% | ||||||||||||
AMC Entertainment Holdings, Inc. | 13 | 12,222 | ||||||||||
National CineMedia LLC | 14 | 12,719 | ||||||||||
NCL Corp., Ltd. | 24 | 24,951 | ||||||||||
Silversea Cruise Finance Ltd. | 34 | 36,585 | ||||||||||
|
| |||||||||||
| 86,477 | ||||||||||||
|
| |||||||||||
Consumer Cyclical - Other – 4.9% | ||||||||||||
Beazer Homes USA, Inc. | 5 | 4,817 | ||||||||||
5.875%, 10/15/27(c) | 16 | 15,925 | ||||||||||
6.75%, 3/15/25 | 34 | 36,154 | ||||||||||
8.75%, 3/15/22 | 18 | 19,564 | ||||||||||
Caesars Entertainment Corp. | 11 | 21,372 | ||||||||||
Caesars Entertainment Resort Properties LLC/Caesars Entertainment Resort Prope | 33 | 33,385 | ||||||||||
CalAtlantic Group, Inc. | 23 | 25,163 | ||||||||||
8.375%, 5/15/18-1/15/21 | 72 | 76,786 | ||||||||||
Diamond Resorts International, Inc. | 25 | 26,808 | ||||||||||
Eldorado Resorts, Inc. | 16 | 17,253 | ||||||||||
GLP Capital LP/GLP Financing II, Inc. | 6 | 6,091 | ||||||||||
4.875%, 11/01/20 | 8 | 7,992 | ||||||||||
5.375%, 11/01/23 | 7 | 7,926 | ||||||||||
K. Hovnanian Enterprises, Inc. | 43 | 39,353 | ||||||||||
10.00%, 7/15/22(c) | 22 | 24,042 | ||||||||||
10.50%, 7/15/24(c) | 7 | 7,793 | ||||||||||
| 24 | AB HIGH YIELD PORTFOLIO | abfunds.com |
PORTFOLIO OF INVESTMENTS (continued)
| Principal Amount (000) | U.S. $ Value | |||||||||||
| ||||||||||||
KB Home | U.S.$ | 22 | $ | 24,968 | ||||||||
7.50%, 9/15/22 | 10 | 11,839 | ||||||||||
8.00%, 3/15/20 | 6 | 6,499 | ||||||||||
Lennar Corp. | 103 | 106,076 | ||||||||||
4.50%, 11/15/19-4/30/24 | 103 | 106,285 | ||||||||||
MDC Holdings, Inc. | 6 | 6,259 | ||||||||||
5.625%, 2/01/20 | 23 | 24,806 | ||||||||||
6.00%, 1/15/43 | 36 | 34,706 | ||||||||||
Meritage Homes Corp. | 21 | 22,957 | ||||||||||
7.00%, 4/01/22 | 29 | 33,636 | ||||||||||
MGM Resorts International | 26 | 28,522 | ||||||||||
6.75%, 10/01/20 | 25 | 27,545 | ||||||||||
7.75%, 3/15/22 | 24 | 27,790 | ||||||||||
8.625%, 2/01/19 | 45 | 48,523 | ||||||||||
Pinnacle Entertainment, Inc. | 13 | 13,030 | ||||||||||
PulteGroup, Inc. | 37 | 38,616 | ||||||||||
6.00%, 2/15/35 | 53 | 56,473 | ||||||||||
7.875%, 6/15/32 | 17 | 21,625 | ||||||||||
RSI Home Products, Inc. | 76 | 79,715 | ||||||||||
Scientific Games International, Inc. | 25 | 26,445 | ||||||||||
10.00%, 12/01/22 | 8 | 8,843 | ||||||||||
Shea Homes LP/Shea Homes Funding Corp. | 7 | 7,553 | ||||||||||
6.125%, 4/01/25(c) | 60 | 62,584 | ||||||||||
Standard Industries, Inc./NJ | 18 | 18,264 | ||||||||||
5.50%, 2/15/23(c) | 26 | 27,507 | ||||||||||
6.00%, 10/15/25(c) | 39 | 41,798 | ||||||||||
Sugarhouse HSP Gaming Prop Mezz LP/Sugarhouse HSP Gaming Finance Corp. | 16 | 15,591 | ||||||||||
Taylor Morrison Communities, Inc./Taylor Morrison Holdings II, Inc. | 17 | 18,288 | ||||||||||
5.875%, 4/15/23(c) | 8 | 8,547 | ||||||||||
Toll Brothers Finance Corp. | 15 | 15,158 | ||||||||||
4.875%, 3/15/27 | 11 | 11,595 | ||||||||||
| abfunds.com | AB HIGH YIELD PORTFOLIO | 25 |
PORTFOLIO OF INVESTMENTS (continued)
| Principal Amount (000) | U.S. $ Value | |||||||||||
| ||||||||||||
5.875%, 2/15/22 | U.S.$ | 35 | $ | 39,093 | ||||||||
|
| |||||||||||
| 1,391,560 | ||||||||||||
|
| |||||||||||
Consumer Cyclical - Restaurants – 0.2% | ||||||||||||
Golden Nugget, Inc. | 8 | 8,138 | ||||||||||
Pizzaexpress Financing 1 PLC | GBP | 1 | 1,037 | |||||||||
Stonegate Pub Co. Financing PLC | 29 | 39,205 | ||||||||||
|
| |||||||||||
| 48,380 | ||||||||||||
|
| |||||||||||
Consumer Cyclical - Retailers – 1.9% | ||||||||||||
Dollar Tree, Inc. | U.S.$ | 26 | 27,339 | |||||||||
FirstCash, Inc. | 7 | 7,325 | ||||||||||
Group 1 Automotive, Inc. | 48 | 49,707 | ||||||||||
5.25%, 12/15/23(c) | 9 | 9,337 | ||||||||||
Hanesbrands, Inc. | 21 | 21,607 | ||||||||||
JC Penney Corp., Inc. | 15 | 8,930 | ||||||||||
L Brands, Inc. | 12 | 12,848 | ||||||||||
6.875%, 11/01/35 | 148 | 147,240 | ||||||||||
7.00%, 5/01/20 | 44 | 48,142 | ||||||||||
Neiman Marcus Group Ltd. LLC | 24 | 14,270 | ||||||||||
Penske Automotive Group, Inc. | 14 | 14,281 | ||||||||||
5.50%, 5/15/26 | 34 | 34,646 | ||||||||||
5.75%, 10/01/22 | 14 | 14,436 | ||||||||||
PetSmart, Inc. | 30 | 22,818 | ||||||||||
Sally Holdings LLC/Sally Capital, Inc. | 22 | 21,818 | ||||||||||
Sonic Automotive, Inc. | 72 | 71,285 | ||||||||||
6.125%, 3/15/27 | 20 | 20,233 | ||||||||||
|
| |||||||||||
| 546,262 | ||||||||||||
|
| |||||||||||
Consumer Non-Cyclical – 10.0% | ||||||||||||
Acadia Healthcare Co., Inc. | 14 | 14,386 | ||||||||||
Air Medical Group Holdings, Inc. | 34 | 33,363 | ||||||||||
| 26 | AB HIGH YIELD PORTFOLIO | abfunds.com |
PORTFOLIO OF INVESTMENTS (continued)
| Principal Amount (000) | U.S. $ Value | |||||||||||
| ||||||||||||
Albertsons Cos. LLC/Safeway, Inc./New Albertson’s, Inc./Albertson’s LLC | U.S.$ | 23 | $ | 20,733 | ||||||||
6.625%, 6/15/24 | 22 | 20,686 | ||||||||||
BI-LO LLC/BI-LO Finance Corp. | 41 | 13,127 | ||||||||||
9.25%, 2/15/19(c) | 65 | 59,620 | ||||||||||
Boparan Finance PLC | GBP | 7 | 9,192 | |||||||||
Catalent Pharma Solutions, Inc. | EUR | 44 | 55,386 | |||||||||
4.875%, 1/15/26(c) | U.S.$ | 12 | 12,180 | |||||||||
CHS/Community Health Systems, Inc. | 59 | 57,492 | ||||||||||
6.25%, 3/31/23 | 13 | 12,505 | ||||||||||
6.875%, 2/01/22 | 31 | 22,566 | ||||||||||
7.125%, 7/15/20 | 208 | 180,421 | ||||||||||
8.00%, 11/15/19 | 10 | 9,157 | ||||||||||
DaVita, Inc. | 73 | 72,147 | ||||||||||
5.75%, 8/15/22 | 14 | 14,433 | ||||||||||
Eagle Holding Co. II LLC | 28 | 28,890 | ||||||||||
Endo Finance LLC | 54 | 47,736 | ||||||||||
Endo Finance LLC/Endo Finco, Inc. | 53 | 42,707 | ||||||||||
Envision Healthcare Corp. | 13 | 13,180 | ||||||||||
5.625%, 7/15/22 | 37 | 37,738 | ||||||||||
First Quality Finance Co., Inc. | 83 | 83,723 | ||||||||||
HCA, Inc. | 100 | 101,285 | ||||||||||
4.25%, 10/15/19 | 142 | 146,530 | ||||||||||
4.75%, 5/01/23 | 108 | 112,990 | ||||||||||
5.875%, 2/15/26 | 54 | 56,759 | ||||||||||
6.50%, 2/15/20 | 157 | 169,616 | ||||||||||
Hill-Rom Holdings, Inc. | 7 | 7,698 | ||||||||||
Kinetic Concepts, Inc./KCI USA, Inc. | 66 | 68,762 | ||||||||||
LifePoint Health, Inc. | 17 | 16,804 | ||||||||||
5.875%, 12/01/23 | 37 | 38,114 | ||||||||||
| abfunds.com | AB HIGH YIELD PORTFOLIO | 27 |
PORTFOLIO OF INVESTMENTS (continued)
| Principal Amount (000) | U.S. $ Value | |||||||||||
| ||||||||||||
Mallinckrodt International Finance SA | U.S.$ | 29 | $ | 28,553 | ||||||||
4.75%, 4/15/23 | 27 | 22,868 | ||||||||||
Mallinckrodt International Finance SA/Mallinckrodt CB LLC | 24 | 21,999 | ||||||||||
5.625%, 10/15/23(c) | 32 | 29,983 | ||||||||||
5.75%, 8/01/22(c) | 49 | 48,254 | ||||||||||
MEDNAX, Inc. | 83 | 86,542 | ||||||||||
MPH Acquisition Holdings LLC | 8 | 8,613 | ||||||||||
Post Holdings, Inc. | 14 | 14,917 | ||||||||||
5.75%, 3/01/27(c) | 28 | 29,137 | ||||||||||
6.00%, 12/15/22(c) | 56 | 58,253 | ||||||||||
Spectrum Brands, Inc. | 51 | 52,865 | ||||||||||
Tenet Healthcare Corp. | 48 | 48,009 | ||||||||||
6.00%, 10/01/20 | 85 | 89,676 | ||||||||||
6.75%, 6/15/23 | 98 | 92,012 | ||||||||||
7.50%, 1/01/22(c) | 19 | 19,551 | ||||||||||
8.125%, 4/01/22 | 97 | 97,833 | ||||||||||
Valeant Pharmaceuticals International | 52 | 51,611 | ||||||||||
Valeant Pharmaceuticals International, Inc. | 130 | 119,694 | ||||||||||
5.625%, 12/01/21(c) | 96 | 87,786 | ||||||||||
5.875%, 5/15/23(c) | 155 | 131,091 | ||||||||||
6.50%, 3/15/22(c) | 14 | 14,518 | ||||||||||
7.50%, 7/15/21(c) | 31 | 30,542 | ||||||||||
Vizient, Inc. | 16 | 18,053 | ||||||||||
Voyage Care BondCo PLC | GBP | 32 | 43,231 | |||||||||
|
| |||||||||||
| 2,825,517 | ||||||||||||
|
| |||||||||||
Energy – 10.0% | ||||||||||||
Alta Mesa Holdings LP/Alta Mesa Finance Services Corp. | U.S.$ | 23 | 25,054 | |||||||||
Antero Resources Corp. | 30 | 30,534 | ||||||||||
5.125%, 12/01/22 | 62 | 63,731 | ||||||||||
Berry Petroleum Co. LLC | 56 | – 0 | – | |||||||||
| 28 | AB HIGH YIELD PORTFOLIO | abfunds.com |
PORTFOLIO OF INVESTMENTS (continued)
| Principal Amount (000) | U.S. $ Value | |||||||||||
| ||||||||||||
Bill Barrett Corp. | U.S.$ | 17 | $ | 16,555 | ||||||||
8.75%, 6/15/25 | 21 | 20,349 | ||||||||||
California Resources Corp. | 19 | 11,026 | ||||||||||
6.00%, 11/15/24 | 5 | 2,297 | ||||||||||
8.00%, 12/15/22(c) | 114 | 75,158 | ||||||||||
Carrizo Oil & Gas, Inc. | 36 | 36,584 | ||||||||||
8.25%, 7/15/25 | 8 | 8,608 | ||||||||||
Cheniere Corpus Christi Holdings LLC | 74 | 79,532 | ||||||||||
Cheniere Energy Partners LP | 36 | 37,061 | ||||||||||
Cheniere Energy, Inc. | 27 | 26,331 | ||||||||||
Chesapeake Energy Corp. | 92 | 95,000 | ||||||||||
6.875%, 11/15/20 | 1 | 601 | ||||||||||
8.00%, 12/15/22(c) | 1 | 1,078 | ||||||||||
Continental Resources, Inc./OK | 12 | 12,108 | ||||||||||
4.90%, 6/01/44 | 35 | 33,018 | ||||||||||
5.00%, 9/15/22 | 72 | 72,955 | ||||||||||
DCP Midstream Operating LP | 22 | 21,648 | ||||||||||
4.95%, 4/01/22 | 35 | 36,409 | ||||||||||
5.60%, 4/01/44 | 27 | 25,310 | ||||||||||
Denbury Resources, Inc. | 16 | 8,989 | ||||||||||
5.50%, 5/01/22 | 53 | 32,828 | ||||||||||
Diamond Offshore Drilling, Inc. | 68 | 51,530 | ||||||||||
7.875%, 8/15/25 | 22 | 23,531 | ||||||||||
Energy Transfer Equity LP | 87 | 88,502 | ||||||||||
7.50%, 10/15/20 | 18 | 19,863 | ||||||||||
Ensco PLC | 7 | 5,484 | ||||||||||
5.20%, 3/15/25 | 113 | 94,807 | ||||||||||
EP Energy LLC/Everest Acquisition Finance, Inc. | 8 | 4,536 | ||||||||||
7.75%, 9/01/22 | 27 | 16,706 | ||||||||||
8.00%, 2/15/25(c) | 24 | 17,437 | ||||||||||
9.375%, 5/01/20 | 41 | 34,587 | ||||||||||
Genesis Energy LP/Genesis Energy Finance Corp. | 12 | 12,384 | ||||||||||
| abfunds.com | AB HIGH YIELD PORTFOLIO | 29 |
PORTFOLIO OF INVESTMENTS (continued)
| Principal Amount (000) | U.S. $ Value | |||||||||||
| ||||||||||||
Gulfport Energy Corp. | U.S.$ | 20 | $ | 20,095 | ||||||||
6.375%, 5/15/25 | 41 | 41,219 | ||||||||||
6.375%, 1/15/26(c) | 24 | 24,279 | ||||||||||
Hilcorp Energy I LP/Hilcorp Finance Co. | 77 | 79,178 | ||||||||||
Murphy Oil Corp. | 26 | 25,879 | ||||||||||
6.125%, 12/01/42(k) | 21 | 20,624 | ||||||||||
6.875%, 8/15/24 | 39 | 41,744 | ||||||||||
Murphy Oil USA, Inc. | 2 | 2,485 | ||||||||||
Nabors Industries, Inc. | 34 | 32,815 | ||||||||||
5.00%, 9/15/20 | 9 | 9,130 | ||||||||||
5.50%, 1/15/23 | 74 | 70,979 | ||||||||||
Noble Holding International Ltd. | 10 | 6,503 | ||||||||||
7.70%, 4/01/25(k) | 20 | 17,263 | ||||||||||
7.75%, 1/15/24 | 57 | 51,015 | ||||||||||
Oasis Petroleum, Inc. | 40 | 40,950 | ||||||||||
Pacific Drilling SA | 41 | 14,457 | ||||||||||
PHI, Inc. | 84 | 82,795 | ||||||||||
QEP Resources, Inc. | 58 | 57,196 | ||||||||||
5.375%, 10/01/22 | 34 | 33,427 | ||||||||||
6.875%, 3/01/21 | 15 | 15,537 | ||||||||||
Range Resources Corp. | 35 | 33,480 | ||||||||||
5.00%, 8/15/22-3/15/23 | 88 | 87,415 | ||||||||||
5.875%, 7/01/22 | 2 | 2,055 | ||||||||||
Rowan Cos., Inc. | 10 | 8,870 | ||||||||||
5.85%, 1/15/44 | 35 | 27,929 | ||||||||||
7.375%, 6/15/25 | 35 | 35,080 | ||||||||||
Sanchez Energy Corp. | 31 | 25,989 | ||||||||||
7.75%, 6/15/21 | 20 | 18,603 | ||||||||||
SandRidge Energy, Inc. | 29 | – 0 | – | |||||||||
8.125%, 10/15/22(d)(e)(f)(g) | 47 | – 0 | – | |||||||||
SemGroup Corp. | 16 | 15,793 | ||||||||||
7.25%, 3/15/26(c) | 13 | 13,258 | ||||||||||
| 30 | AB HIGH YIELD PORTFOLIO | abfunds.com |
PORTFOLIO OF INVESTMENTS (continued)
| Principal Amount (000) | U.S. $ Value | |||||||||||
| ||||||||||||
SM Energy Co. | U.S.$ | 25 | $ | 23,955 | ||||||||
6.50%, 11/15/21-1/01/23 | 86 | 87,357 | ||||||||||
Southern Star Central Corp. | 35 | 36,251 | ||||||||||
Targa Resources Partners LP/Targa Resources Partners Finance Corp. | 36 | 36,407 | ||||||||||
4.25%, 11/15/23 | 19 | 18,528 | ||||||||||
5.125%, 2/01/25 | 8 | 8,234 | ||||||||||
Transocean Phoenix 2 Ltd. | 46 | 49,590 | ||||||||||
Transocean, Inc. | 55 | 53,395 | ||||||||||
6.80%, 3/15/38 | 123 | 100,259 | ||||||||||
7.50%, 1/15/26(c) | 18 | 18,551 | ||||||||||
9.00%, 7/15/23(c) | 24 | 26,618 | ||||||||||
Vantage Drilling International | 46 | – 0 | – | |||||||||
10.00%, 12/31/20(d)(f) | 1 | 1,143 | ||||||||||
10.00%, 12/31/20(a)(f) | 1 | 857 | ||||||||||
Vine Oil & Gas LP/Vine Oil & Gas Finance Corp. | 29 | 28,353 | ||||||||||
Weatherford International Ltd. | 10 | 9,027 | ||||||||||
5.875%, 7/01/21(j) | 35 | 35,306 | ||||||||||
7.75%, 6/15/21 | 66 | 68,065 | ||||||||||
9.875%, 2/15/24 | 42 | 44,935 | ||||||||||
Whiting Petroleum Corp. | 28 | 24,882 | ||||||||||
5.75%, 3/15/21 | 30 | 30,128 | ||||||||||
WPX Energy, Inc. | 30 | 32,612 | ||||||||||
|
| |||||||||||
| 2,832,626 | ||||||||||||
|
| |||||||||||
Other Industrial – 1.6% | ||||||||||||
American Builders & Contractors Supply Co., Inc. | 43 | 45,828 | ||||||||||
American Tire Distributors, Inc. | 86 | 89,233 | ||||||||||
Belden, Inc. | EUR | 6 | 7,487 | |||||||||
General Cable Corp. | U.S.$ | 29 | 28,204 | |||||||||
5.75%, 10/01/22 | 27 | 27,951 | ||||||||||
| abfunds.com | AB HIGH YIELD PORTFOLIO | 31 |
PORTFOLIO OF INVESTMENTS (continued)
| Principal Amount (000) | U.S. $ Value | |||||||||||
| ||||||||||||
Global Partners LP/GLP Finance Corp. | U.S.$ | 85 | $ | 86,337 | ||||||||
7.00%, 6/15/23 | 20 | 19,932 | ||||||||||
H&E Equipment Services, Inc. | 12 | 12,658 | ||||||||||
HRG Group, Inc. | 67 | 67,474 | ||||||||||
Laureate Education, Inc. | 26 | 28,128 | ||||||||||
LKQ Corp. | 8 | 8,215 | ||||||||||
Travis Perkins PLC | GBP | 29 | 40,584 | |||||||||
|
| |||||||||||
| 462,031 | ||||||||||||
|
| |||||||||||
Services – 2.6% | ||||||||||||
ADT Corp. (The) | U.S.$ | 37 | 37,201 | |||||||||
6.25%, 10/15/21 | 30 | 33,238 | ||||||||||
APX Group, Inc. | 10 | 10,171 | ||||||||||
7.875%, 12/01/22 | 32 | 34,345 | ||||||||||
8.75%, 12/01/20 | 95 | 97,803 | ||||||||||
Aramark Services, Inc. | 14 | 14,951 | ||||||||||
5.125%, 1/15/24 | 7 | 7,075 | ||||||||||
Ceridian HCM Holding, Inc. | 23 | 24,092 | ||||||||||
CSVC Acquisition Corp. | 35 | 34,173 | ||||||||||
DB Master Finance LLC | 58 | 58,308 | ||||||||||
Gartner, Inc. | 13 | 13,718 | ||||||||||
GEO Group, Inc. (The) | 18 | 17,991 | ||||||||||
5.875%, 1/15/22-10/15/24 | 42 | 43,467 | ||||||||||
6.00%, 4/15/26 | 8 | 8,363 | ||||||||||
IHS Markit Ltd. | 24 | 25,835 | ||||||||||
Nielsen Co. Luxembourg SARL (The) | 28 | 28,806 | ||||||||||
Nielsen Finance LLC/Nielsen Finance Co. | 30 | 30,892 | ||||||||||
Prime Security Services Borrower LLC/Prime Finance, Inc. | 143 | 158,816 | ||||||||||
| 32 | AB HIGH YIELD PORTFOLIO | abfunds.com |
PORTFOLIO OF INVESTMENTS (continued)
| Principal Amount (000) | U.S. $ Value | |||||||||||
| ||||||||||||
Sabre GLBL, Inc. | U.S.$ | 34 | $ | 35,595 | ||||||||
Team Health Holdings, Inc. | 30 | 27,357 | ||||||||||
|
| |||||||||||
| 742,197 | ||||||||||||
|
| |||||||||||
Technology – 3.5% | ||||||||||||
Ascend Learning LLC | 17 | 17,803 | ||||||||||
Avaya, Inc. | 297 | 17,808 | ||||||||||
BMC Software Finance, Inc. | 92 | 94,160 | ||||||||||
BMC Software, Inc. | 1 | 594 | ||||||||||
Boxer Parent Co., Inc. | 8 | 8,004 | ||||||||||
CommScope, Inc. | 22 | 22,095 | ||||||||||
Conduent Finance, Inc./Conduent Business Services LLC | 55 | 65,229 | ||||||||||
CURO Financial Technologies Corp. | 43 | 47,204 | ||||||||||
Dell International LLC/EMC Corp. | 59 | 61,764 | ||||||||||
Dell, Inc. | 8 | 8,963 | ||||||||||
EMC Corp. | 91 | 90,975 | ||||||||||
First Data Corp. | 110 | 114,697 | ||||||||||
7.00%, 12/01/23(c) | 39 | 41,621 | ||||||||||
Goodman Networks, Inc. | 21 | 15,746 | ||||||||||
Infor US, Inc. | 78 | 81,155 | ||||||||||
Iron Mountain Europe PLC | GBP | 22 | 30,324 | |||||||||
Iron Mountain, Inc. | U.S.$ | 20 | 20,968 | |||||||||
Micron Technology, Inc. | 31 | 32,159 | ||||||||||
Nokia Oyj | 16 | 15,948 | ||||||||||
6.625%, 5/15/39 | 14 | 15,993 | ||||||||||
Quintiles IMS, Inc. | EUR | 38 | 45,788 | |||||||||
| abfunds.com | AB HIGH YIELD PORTFOLIO | 33 |
PORTFOLIO OF INVESTMENTS (continued)
| Principal Amount (000) | U.S. $ Value | |||||||||||
| ||||||||||||
4.875%, 5/15/23(c) | U.S.$ | 27 | $ | 28,200 | ||||||||
Sanmina Corp. | 32 | 33,288 | ||||||||||
Solera LLC/Solera Finance, Inc. | 17 | 19,717 | ||||||||||
Symantec Corp. | 27 | 28,214 | ||||||||||
Western Digital Corp. | 26 | 30,095 | ||||||||||
|
| |||||||||||
| 988,512 | ||||||||||||
|
| |||||||||||
Transportation - Services – 1.7% | ||||||||||||
Avis Budget Car Rental LLC/Avis Budget Finance, Inc. | 8 | 7,869 | ||||||||||
5.50%, 4/01/23 | 8 | 8,187 | ||||||||||
CEVA Group PLC | 22 | 20,114 | ||||||||||
Europcar Groupe SA | EUR | 7 | 8,615 | |||||||||
Herc Rentals, Inc. | U.S.$ | 10 | 11,431 | |||||||||
Hertz Corp. (The) | 25 | 22,576 | ||||||||||
5.875%, 10/15/20 | 11 | 10,933 | ||||||||||
7.375%, 1/15/21 | 101 | 101,389 | ||||||||||
7.625%, 6/01/22(c) | 7 | 7,282 | ||||||||||
Loxam SAS | EUR | 29 | 35,478 | |||||||||
4.25%, 4/15/24(c) | 29 | 36,405 | ||||||||||
United Rentals North America, Inc. | U.S.$ | 66 | 69,955 | |||||||||
5.875%, 9/15/26 | 48 | 52,309 | ||||||||||
XPO CNW, Inc. | 35 | 35,090 | ||||||||||
XPO Logistics, Inc. | 48 | 50,839 | ||||||||||
|
| |||||||||||
| 478,472 | ||||||||||||
|
| |||||||||||
| 18,075,775 | ||||||||||||
|
| |||||||||||
Financial Institutions – 6.4% | ||||||||||||
Banking – 3.3% | ||||||||||||
Ally Financial, Inc. | 29 | 29,499 | ||||||||||
3.75%, 11/18/19 | 22 | 22,434 | ||||||||||
4.125%, 3/30/20 | 19 | 19,861 | ||||||||||
4.75%, 9/10/18 | 56 | 57,097 | ||||||||||
8.00%, 11/01/31 | 111 | 147,077 | ||||||||||
| 34 | AB HIGH YIELD PORTFOLIO | abfunds.com |
PORTFOLIO OF INVESTMENTS (continued)
| Principal Amount (000) | U.S. $ Value | |||||||||||
| ||||||||||||
Banco Bilbao Vizcaya Argentaria SA | EUR | 58 | $ | 81,552 | ||||||||
Barclays Bank PLC | U.S.$ | 15 | 17,640 | |||||||||
Barclays PLC | EUR | 58 | 78,748 | |||||||||
CIT Group, Inc. | U.S.$ | 6 | 5,920 | |||||||||
Countrywide Capital III | 46 | 58,830 | ||||||||||
Credit Agricole SA | GBP | 44 | 64,651 | |||||||||
Goldman Sachs Group, Inc. (The) | U.S.$ | 41 | 40,993 | |||||||||
Royal Bank of Scotland Group PLC | EUR | 50 | 56,659 | |||||||||
8.625%, 8/15/21(l) | U.S.$ | 117 | 132,877 | |||||||||
Societe Generale SA | 31 | 36,711 | ||||||||||
Standard Chartered PLC | 67 | 73,519 | ||||||||||
Zions Bancorporation | 14 | 14,427 | ||||||||||
|
| |||||||||||
| 938,495 | ||||||||||||
|
| |||||||||||
Brokerage – 0.2% | ||||||||||||
Lehman Brothers Holdings, Inc. | 423 | 24,346 | ||||||||||
LPL Holdings, Inc. | 32 | 33,480 | ||||||||||
|
| |||||||||||
| 57,826 | ||||||||||||
|
| |||||||||||
Finance – 2.0% | ||||||||||||
Enova International, Inc. | 9 | 9,097 | ||||||||||
9.75%, 6/01/21 | 60 | 64,463 | ||||||||||
goeasy Ltd. | 13 | 13,296 | ||||||||||
Lincoln Finance Ltd. | EUR | 26 | 31,571 | |||||||||
Navient Corp. | U.S.$ | 87 | 89,299 | |||||||||
5.00%, 10/26/20 | 47 | 48,613 | ||||||||||
5.50%, 1/25/23 | 8 | 8,097 | ||||||||||
5.875%, 3/25/21 | 1 | 613 | ||||||||||
6.50%, 6/15/22 | 70 | 74,759 | ||||||||||
| abfunds.com | AB HIGH YIELD PORTFOLIO | 35 |
PORTFOLIO OF INVESTMENTS (continued)
| Principal Amount (000) | U.S. $ Value | |||||||||||
| ||||||||||||
7.25%, 1/25/22 | U.S.$ | 13 | $ | 13,983 | ||||||||
8.00%, 3/25/20 | 86 | 94,466 | ||||||||||
OneMain Financial Holdings LLC | 26 | 26,925 | ||||||||||
SLM Corp. | 21 | 21,275 | ||||||||||
TMX Finance LLC/TitleMax Finance Corp. | 71 | 65,331 | ||||||||||
|
| |||||||||||
| 561,788 | ||||||||||||
|
| |||||||||||
Insurance – 0.4% | ||||||||||||
Galaxy Bidco Ltd. | GBP | 4 | 5,919 | |||||||||
Genworth Holdings, Inc. | U.S.$ | 30 | 28,681 | |||||||||
Liberty Mutual Group, Inc. | 61 | 77,452 | ||||||||||
|
| |||||||||||
| 112,052 | ||||||||||||
|
| |||||||||||
Other Finance – 0.2% | ||||||||||||
Creditcorp | 33 | 28,901 | ||||||||||
Tempo Acquisition LLC/Tempo Acquisition Finance Corp. | 8 | 8,126 | ||||||||||
VFH Parent LLC/Orchestra Co-Issuer, Inc. | 13 | 13,512 | ||||||||||
|
| |||||||||||
| 50,539 | ||||||||||||
|
| |||||||||||
REITS – 0.3% | ||||||||||||
MPT Operating Partnership LP/MPT Finance Corp. | 7 | 7,179 | ||||||||||
5.25%, 8/01/26 | 40 | 41,267 | ||||||||||
5.50%, 5/01/24 | 26 | 27,517 | ||||||||||
SBA Communications Corp. | 15 | 15,204 | ||||||||||
4.875%, 9/01/24 | 8 | 8,236 | ||||||||||
|
| |||||||||||
| 99,403 | ||||||||||||
|
| |||||||||||
| 1,820,103 | ||||||||||||
|
| |||||||||||
Utility – 2.2% | ||||||||||||
Electric – 2.2% | ||||||||||||
AES Corp./VA | 32 | 32,808 | ||||||||||
7.375%, 7/01/21 | 51 | 57,670 | ||||||||||
Calpine Corp. | 37 | 35,968 | ||||||||||
5.50%, 2/01/24 | 4 | 4,180 | ||||||||||
5.75%, 1/15/25 | 119 | 113,333 | ||||||||||
| 36 | AB HIGH YIELD PORTFOLIO | abfunds.com |
PORTFOLIO OF INVESTMENTS (continued)
| Principal Amount (000) | U.S. $ Value | |||||||||||
| ||||||||||||
DPL, Inc. | U.S.$ | 25 | $ | 26,374 | ||||||||
Dynegy, Inc. | 8 | 7,829 | ||||||||||
7.375%, 11/01/22 | 115 | 123,011 | ||||||||||
7.625%, 11/01/24 | 7 | 7,322 | ||||||||||
NRG Energy, Inc. | 106 | 112,140 | ||||||||||
6.625%, 1/15/27 | 21 | 22,438 | ||||||||||
Talen Energy Supply LLC | 43 | 39,517 | ||||||||||
6.50%, 5/01/18-6/01/25 | 41 | 37,638 | ||||||||||
Texas Competitive/TCEH | 59 | – 0 | – | |||||||||
|
| |||||||||||
| 620,228 | ||||||||||||
|
| |||||||||||
Total Corporates – Non-Investment Grade | 20,516,106 | |||||||||||
|
| |||||||||||
CORPORATES – INVESTMENT | ||||||||||||
Industrial – 10.4% | ||||||||||||
Basic – 0.9% | ||||||||||||
Anglo American Capital PLC | 64 | 66,348 | ||||||||||
FMG Resources (August 2006) Pty Ltd. | 12 | 13,047 | ||||||||||
Glencore Finance Canada Ltd. | 34 | 35,907 | ||||||||||
6.00%, 11/15/41(c) | 5 | 5,450 | ||||||||||
Glencore Funding LLC | 5 | 5,057 | ||||||||||
Monsanto Co. | 56 | 57,214 | ||||||||||
Southern Copper Corp. | 69 | 71,547 | ||||||||||
|
| |||||||||||
| 254,570 | ||||||||||||
|
| |||||||||||
Capital Goods – 0.7% |
| |||||||||||
CNH Industrial Capital LLC | 26 | 26,045 | ||||||||||
3.625%, 4/15/18 | 15 | 15,579 | ||||||||||
3.875%, 7/16/18 | 29 | 29,207 | ||||||||||
4.375%, 4/05/22 | 33 | 35,215 | ||||||||||
Embraer Netherlands Finance BV | 40 | 42,775 | ||||||||||
General Electric Co. | 40 | 41,831 | ||||||||||
| abfunds.com | AB HIGH YIELD PORTFOLIO | 37 |
PORTFOLIO OF INVESTMENTS (continued)
| Principal Amount (000) | U.S. $ Value | |||||||||||
| ||||||||||||
Masco Corp. | U.S.$ | 13 | $ | 15,120 | ||||||||
7.125%, 3/15/20 | 1 | 821 | ||||||||||
|
| |||||||||||
| 206,593 | ||||||||||||
|
| |||||||||||
Communications - Media – 0.7% |
| |||||||||||
21st Century Fox America, Inc. | 28 | 29,683 | ||||||||||
CBS Corp. | 42 | 43,453 | ||||||||||
Charter Communications Operating LLC/Charter Communications Operating Capital | 40 | 42,476 | ||||||||||
Thomson Reuters Corp. | 13 | 13,874 | ||||||||||
Time Warner, Inc. | 24 | 24,887 | ||||||||||
Viacom, Inc. | 60 | 50,840 | ||||||||||
|
| |||||||||||
| 205,213 | ||||||||||||
|
| |||||||||||
Communications - Telecommunications – 0.2% | ||||||||||||
AT&T, Inc. | 29 | 28,877 | ||||||||||
5.45%, 3/01/47 | 39 | 40,432 | ||||||||||
|
| |||||||||||
| 69,309 | ||||||||||||
|
| |||||||||||
Consumer Cyclical - Automotive – 1.3% | ||||||||||||
FCE Bank PLC | EUR | 100 | 122,192 | |||||||||
General Motors Financial Co., Inc. | 100 | 117,088 | ||||||||||
Volkswagen International Finance NV | 100 | 117,901 | ||||||||||
|
| |||||||||||
| 357,181 | ||||||||||||
|
| |||||||||||
Consumer Cyclical - Entertainment – 0.5% | ||||||||||||
Carnival Corp. | 100 | 125,245 | ||||||||||
Royal Caribbean Cruises Ltd. | U.S.$ | 31 | 31,964 | |||||||||
|
| |||||||||||
| 157,209 | ||||||||||||
|
| |||||||||||
Consumer Cyclical - Other – 0.2% | ||||||||||||
DR Horton, Inc. | 44 | 45,845 | ||||||||||
|
| |||||||||||
| 38 | AB HIGH YIELD PORTFOLIO | abfunds.com |
PORTFOLIO OF INVESTMENTS (continued)
| Principal Amount (000) | U.S. $ Value | |||||||||||
| ||||||||||||
Consumer Cyclical - Retailers – 0.4% | ||||||||||||
AutoNation, Inc. | U.S.$ | 52 | $ | 55,516 | ||||||||
AutoZone, Inc. | 70 | 70,301 | ||||||||||
|
| |||||||||||
| 125,817 | ||||||||||||
|
| |||||||||||
Consumer Non-Cyclical – 2.0% |
| |||||||||||
Anheuser-Busch InBev Finance, Inc. | 28 | 27,941 | ||||||||||
Coca-Cola European Partners PLC | EUR | 100 | 119,108 | |||||||||
Constellation Brands, Inc. | U.S.$ | 21 | 21,883 | |||||||||
Fresenius Medical Care US Finance II, Inc. | 40 | 41,689 | ||||||||||
General Mills, Inc. | EUR | 100 | 123,381 | |||||||||
McKesson Corp. | U.S.$ | 100 | 118,186 | |||||||||
Teva Pharmaceutical Finance Netherlands III BV | 38 | 37,597 | ||||||||||
3.15%, 10/01/26 | 36 | 31,857 | ||||||||||
Tyson Foods, Inc. | 34 | 36,781 | ||||||||||
|
| |||||||||||
| 558,423 | ||||||||||||
|
| |||||||||||
Energy – 2.0% |
| |||||||||||
Andeavor Logistics LP/Tesoro Logistics Finance Corp. | 22 | 23,416 | ||||||||||
Cenovus Energy, Inc. | 5 | 5,190 | ||||||||||
3.80%, 9/15/23 | 2 | 2,374 | ||||||||||
4.25%, 4/15/27(c) | 59 | 59,074 | ||||||||||
4.45%, 9/15/42 | 31 | 28,179 | ||||||||||
5.70%, 10/15/19 | 10 | 10,193 | ||||||||||
6.75%, 11/15/39 | 1 | 1,726 | ||||||||||
Ecopetrol SA | 15 | 15,039 | ||||||||||
Enable Midstream Partners LP | 36 | 36,362 | ||||||||||
Energy Transfer LP | 30 | 30,524 | ||||||||||
EnLink Midstream Partners LP | 43 | 43,668 | ||||||||||
Hess Corp. | 42 | 42,272 | ||||||||||
| abfunds.com | AB HIGH YIELD PORTFOLIO | 39 |
PORTFOLIO OF INVESTMENTS (continued)
| Principal Amount (000) | U.S. $ Value | |||||||||||
| ||||||||||||
Kinder Morgan Energy Partners LP | U.S.$ | 28 | $ | 28,480 | ||||||||
Kinder Morgan, Inc./DE | 11 | 14,610 | ||||||||||
Marathon Oil Corp. | 34 | 40,203 | ||||||||||
Marathon Petroleum Corp. | 43 | 43,500 | ||||||||||
MPLX LP | 15 | 15,890 | ||||||||||
4.50%, 7/15/23 | 8 | 8,416 | ||||||||||
Tesoro Logistics LP/Tesoro Logistics Finance Corp. | 50 | 50,997 | ||||||||||
Williams Partners LP | 39 | 39,895 | ||||||||||
5.10%, 9/15/45 | 22 | 23,719 | ||||||||||
|
| |||||||||||
| 563,727 | ||||||||||||
|
| |||||||||||
Services – 0.1% |
| |||||||||||
Expedia, Inc. | 30 | 29,194 | ||||||||||
|
| |||||||||||
Technology – 1.0% |
| |||||||||||
Agilent Technologies, Inc. | 42 | 43,752 | ||||||||||
Dell International LLC/EMC Corp. | 38 | 41,717 | ||||||||||
Hewlett Packard Enterprise Co. | 26 | 28,220 | ||||||||||
Micron Technology, Inc. | 12 | 13,041 | ||||||||||
Seagate HDD Cayman | 28 | 27,759 | ||||||||||
4.875%, 3/01/24(c) | 3 | 3,033 | ||||||||||
4.875%, 6/01/27 | 5 | 4,470 | ||||||||||
Western Digital Corp. | 49 | 53,407 | ||||||||||
Xerox Corp. | 29 | 28,623 | ||||||||||
4.07%, 3/17/22 | 27 | 27,425 | ||||||||||
|
| |||||||||||
| 271,447 | ||||||||||||
|
| |||||||||||
Transportation - Services – 0.4% | ||||||||||||
FedEx Corp. | EUR | 100 | 119,313 | |||||||||
|
| |||||||||||
| 2,963,841 | ||||||||||||
|
| |||||||||||
| 40 | AB HIGH YIELD PORTFOLIO | abfunds.com |
PORTFOLIO OF INVESTMENTS (continued)
| Principal Amount (000) | U.S. $ Value | |||||||||||
| ||||||||||||
Financial Institutions – 5.9% |
| |||||||||||
Banking – 4.2% |
| |||||||||||
Banco Bilbao Vizcaya Argentaria SA | EUR | 100 | $ | 117,821 | ||||||||
Bank of America Corp. | U.S.$ | 27 | 28,602 | |||||||||
BNP Paribas SA | 58 | 65,346 | ||||||||||
BPCE SA | 82 | 91,769 | ||||||||||
Citigroup, Inc. | EUR | 100 | 116,852 | |||||||||
Cooperatieve Rabobank UA | 50 | 59,042 | ||||||||||
Credit Suisse Group Funding Guernsey Ltd. | 100 | 120,493 | ||||||||||
Goldman Sachs Group, Inc. (The) | 57 | 70,845 | ||||||||||
HSBC Capital Funding Dollar 1 LP | U.S.$ | 19 | 29,824 | |||||||||
HSBC Holdings PLC | EUR | 58 | 80,276 | |||||||||
JPMorgan Chase & Co. | U.S.$ | 38 | 38,191 | |||||||||
Series V | 5 | 4,804 | ||||||||||
Morgan Stanley | 39 | 42,682 | ||||||||||
Nationwide Building Society | 73 | 73,634 | ||||||||||
Royal Bank of Scotland Group PLC | 58 | 59,770 | ||||||||||
Santander Holdings USA, Inc. | 28 | 28,843 | ||||||||||
Standard Chartered PLC | 58 | 59,350 | ||||||||||
UBS Group Funding Switzerland AG | 64 | 63,878 | ||||||||||
US Bancorp | 17 | 19,182 | ||||||||||
|
| |||||||||||
| 1,171,204 | ||||||||||||
|
| |||||||||||
| abfunds.com | AB HIGH YIELD PORTFOLIO | 41 |
PORTFOLIO OF INVESTMENTS (continued)
| Principal Amount (000) | U.S. $ Value | |||||||||||
| ||||||||||||
Brokerage – 0.1% |
| |||||||||||
GFI Group, Inc. | U.S.$ | 34 | $ | 35,460 | ||||||||
|
| |||||||||||
Insurance – 1.0% |
| |||||||||||
Allstate Corp. (The) | 10 | 12,614 | ||||||||||
Berkshire Hathaway, Inc. | EUR | 100 | 118,283 | |||||||||
Chubb Corp. (The) | U.S.$ | 29 | 28,717 | |||||||||
Nationwide Mutual Insurance Co. | 31 | 51,623 | ||||||||||
Prudential Financial, Inc. | 70 | 75,945 | ||||||||||
|
| |||||||||||
| 287,182 | ||||||||||||
|
| |||||||||||
REITS – 0.6% |
| |||||||||||
DDR Corp. | 29 | 29,201 | ||||||||||
EPR Properties | 48 | 54,312 | ||||||||||
Sabra Health Care LP/Sabra Capital Corp. | 31 | 32,004 | ||||||||||
Senior Housing Properties Trust | 9 | 9,751 | ||||||||||
VEREIT Operating Partnership LP | 8 | 8,409 | ||||||||||
Welltower, Inc. | 33 | 35,282 | ||||||||||
|
| |||||||||||
| 168,959 | ||||||||||||
|
| |||||||||||
| 1,662,805 | ||||||||||||
|
| |||||||||||
Utility – 0.3% | ||||||||||||
Electric – 0.3% | ||||||||||||
Dominion Energy, Inc. | 35 | 33,823 | ||||||||||
Empresa de Energia de Bogota SA ESP | 44 | 44,518 | ||||||||||
FirstEnergy Corp. | 8 | 8,933 | ||||||||||
|
| |||||||||||
| 87,274 | ||||||||||||
|
| |||||||||||
Total Corporates – Investment Grade | 4,713,920 | |||||||||||
|
| |||||||||||
| 42 | AB HIGH YIELD PORTFOLIO | abfunds.com |
PORTFOLIO OF INVESTMENTS (continued)
| Principal Amount (000) | U.S. $ Value | ||||||||||
| ||||||||||||
BANK LOANS – 2.0% | ||||||||||||
Industrial – 2.0% | ||||||||||||
Basic – 0.1% | ||||||||||||
Foresight Energy LLC | U.S.$ | 13 | 12,284 | |||||||||
Unifrax I LLC | 11 | 11,282 | ||||||||||
|
| |||||||||||
| 23,566 | ||||||||||||
|
| |||||||||||
Capital Goods – 0.1% | ||||||||||||
Accudyne Industries Borrower S.C.A. / Accudyne Industries, LLC (fka Silver II US Holdings, LLC) | 20 | 20,429 | ||||||||||
Gardner Denver, Inc. | 19 | 19,026 | ||||||||||
HD Supply Waterworks, Ltd. | 5 | 5,031 | ||||||||||
|
| |||||||||||
| 44,486 | ||||||||||||
|
| |||||||||||
Communications - Telecommunications – 0.1% | ||||||||||||
West Corporation | 30 | 29,919 | ||||||||||
|
| |||||||||||
Consumer Cyclical - Automotive – 0.1% | ||||||||||||
Navistar, Inc. | 32 | 31,689 | ||||||||||
|
| |||||||||||
Consumer Cyclical - Entertainment – 0.1% | ||||||||||||
Seaworld Parks & Entertainment, Inc. (fka SW Acquisitions Co., Inc.) | 25 | 24,577 | ||||||||||
|
| |||||||||||
Consumer Cyclical - Retailers – 0.2% | ||||||||||||
J.C. Penney Corporation, Inc. | 30 | 27,458 | ||||||||||
Serta Simmons Bedding, LLC | 49 | 46,010 | ||||||||||
|
| |||||||||||
| 73,468 | ||||||||||||
|
| |||||||||||
| abfunds.com | AB HIGH YIELD PORTFOLIO | 43 |
PORTFOLIO OF INVESTMENTS (continued)
| Principal Amount (000) | U.S. $ Value | ||||||||||
|
|
| ||||||||||
Consumer Non-Cyclical – 0.3% | ||||||||||||
Air Medical Group Holdings, Inc. | U.S.$ | 22 | $ | 21,571 | ||||||||
Alphabet Holding Company, Inc. (fka Nature’s Bounty) | 40 | 38,950 | ||||||||||
Post Holdings, Inc. | 12 | 12,510 | ||||||||||
Vizient, Inc. | 2 | 1,891 | ||||||||||
|
| |||||||||||
| 74,922 | ||||||||||||
|
| |||||||||||
Energy – 0.2% | ||||||||||||
California Resources Corporation | 46 | 49,568 | ||||||||||
|
| |||||||||||
Other Industrial – 0.1% | ||||||||||||
Travelport Finance (Luxembourg) SARL | 37 | 36,604 | ||||||||||
|
| |||||||||||
Technology – 0.7% | ||||||||||||
Avaya Inc. 5.871% (LIBOR 3 Month + 4.50%), 1/26/18(p) | 20 | 16,561 | ||||||||||
6.621% (LIBOR 3 Month + 5.25%), 5/29/20(g)(h)(p) | 84 | 69,918 | ||||||||||
6.871% (LIBOR 3 Month + 5.50%), 3/31/18(g)(h)(p) | 5 | 4,142 | ||||||||||
8.739% (LIBOR 1 Month + 7.50%), 1/24/18(p) | 3 | 3,481 | ||||||||||
8.742% (LIBOR 1 Month + 7.50%), 1/24/18(p) | 3 | 3,481 | ||||||||||
Conduent Incorporated | 5 | 4,956 | ||||||||||
MTS Systems Corporation | 27 | 27,055 | ||||||||||
Solera, LLC (Solera Finance, Inc.) | 60 | 60,448 | ||||||||||
|
| |||||||||||
| 190,042 | ||||||||||||
|
| |||||||||||
Total Bank Loans | 578,841 | |||||||||||
|
| |||||||||||
| 44 | AB HIGH YIELD PORTFOLIO | abfunds.com |
PORTFOLIO OF INVESTMENTS (continued)
| Principal Amount (000) | U.S. $ Value | ||||||||||
|
|
| ||||||||||
EMERGING MARKETS – CORPORATE BONDS – 1.6% | ||||||||||||
Industrial – 1.6% | ||||||||||||
Basic – 0.3% | ||||||||||||
First Quantum Minerals Ltd. | U.S.$ | 13 | $ | 13,920 | ||||||||
7.25%, 4/01/23(c) | 58 | 61,775 | ||||||||||
|
| |||||||||||
| 75,695 | ||||||||||||
|
| |||||||||||
Capital Goods – 0.1% | ||||||||||||
Odebrecht Finance Ltd. | 95 | 35,514 | ||||||||||
|
| |||||||||||
Communications - | ||||||||||||
Digicel Ltd. | 36 | 35,924 | ||||||||||
|
| |||||||||||
Consumer Cyclical - Retailers – 0.0% | ||||||||||||
K2016470219 South Africa Ltd. | 14 | 715 | ||||||||||
K2016470260 South Africa Ltd. | 4 | 3,487 | ||||||||||
|
| |||||||||||
| 4,202 | ||||||||||||
|
| |||||||||||
Consumer Non-Cyclical – 0.3% | ||||||||||||
Arcelik AS | 29 | 29,235 | ||||||||||
Minerva Luxembourg SA | 58 | 60,436 | ||||||||||
Tonon Luxembourg SA | 6 | 618 | ||||||||||
Virgolino de Oliveira Finance SA | 96 | 4,928 | ||||||||||
|
| |||||||||||
| 95,217 | ||||||||||||
|
| |||||||||||
Energy – 0.6% | ||||||||||||
CHC Group LLC/CHC Finance Ltd. | 65 | �� | 91,238 | |||||||||
Petrobras Global Finance BV | 27 | 27,330 | ||||||||||
6.125%, 1/17/22 | 8 | 8,298 | ||||||||||
6.25%, 3/17/24 | 30 | 32,200 | ||||||||||
|
| |||||||||||
| 159,066 | ||||||||||||
|
| |||||||||||
Other Industrial – 0.2% | ||||||||||||
Noble Group Ltd. | 100 | 41,750 | ||||||||||
|
| |||||||||||
| abfunds.com | AB HIGH YIELD PORTFOLIO | 45 |
PORTFOLIO OF INVESTMENTS (continued)
| Principal Amount (000) | U.S. $ Value | ||||||||||
|
|
| ||||||||||
Transportation - Airlines – 0.0% | ||||||||||||
Guanay Finance Ltd. | U.S.$ | 7 | $ | 7,001 | ||||||||
|
| |||||||||||
Total Emerging Markets – Corporate Bonds | 454,369 | |||||||||||
|
| |||||||||||
| Shares | ||||||||||||
COMMON STOCKS – 1.4% | ||||||||||||
Industrials – 0.1% | ||||||||||||
Construction & Engineering – 0.1% | ||||||||||||
Modular Space Corp. | 2,407 | 36,346 | ||||||||||
|
| |||||||||||
Consumer Cyclical - Automotive – 0.0% | ||||||||||||
Exide Technologies(e)(g)(i) | 511 | 2,012 | ||||||||||
|
| |||||||||||
Energy Equipment & Services – 0.0% | ||||||||||||
Sanchez Energy Corp.(g) | 344 | 1,488 | ||||||||||
|
| |||||||||||
Energy Other – 0.0% | ||||||||||||
Tervita Corp.(d)(e)(f)(g) | 599 | 4,295 | ||||||||||
|
| |||||||||||
Road & Rail – 0.0% | ||||||||||||
Celadon Group, Inc. | 700 | 5,145 | ||||||||||
|
| |||||||||||
Trading Companies & Distributors – 0.0% | ||||||||||||
Emeco Holdings Ltd.(d)(e)(f)(g) | 5,341 | 964 | ||||||||||
|
| |||||||||||
| 50,250 | ||||||||||||
|
| |||||||||||
Energy – 0.5% | ||||||||||||
Energy Equipment & Services – 0.0% | ||||||||||||
Weatherford International PLC(g) | 2,097 | 7,277 | ||||||||||
|
| |||||||||||
Oil, Gas & Consumable Fuels – 0.5% | ||||||||||||
Berry Pete Corp.(d)(f)(g) | 2,202 | 17,066 | ||||||||||
Carrizo Oil & Gas, Inc.(g) | 405 | 7,164 | ||||||||||
CHC Group LLC(g)(i) | 1,219 | 8,533 | ||||||||||
Chesapeake Energy Corp.(g) | 1,523 | 5,940 | ||||||||||
EP Energy Corp. – Class A(g) | 2,501 | 6,753 | ||||||||||
Halcon Resources Corp.(g) | 276 | 1,816 | ||||||||||
K2016470219 South Africa Ltd. – A Shares(d)(e)(f) | 191,574 | – 0 | – | |||||||||
K2016470219 South Africa Ltd. – B Shares(d)(e)(f) | 30,276 | – 0 | – | |||||||||
Linn Energy, Inc. | 96 | 3,701 | ||||||||||
Oasis Petroleum, Inc.(g) | 972 | 9,185 | ||||||||||
Paragon Litigation – Class A(d)(f) | 267 | 289 | ||||||||||
Paragon Litigation – Class B(d)(f) | 401 | 7,619 | ||||||||||
Paragon Offshore Ltd.(d)(f) | 266 | 4,345 | ||||||||||
| 46 | AB HIGH YIELD PORTFOLIO | abfunds.com |
PORTFOLIO OF INVESTMENTS (continued)
Company | Shares | U.S. $ Value | ||||||||||
| ||||||||||||
Peabody Energy Corp.(g) | 533 | $ | 16,464 | |||||||||
SandRidge Energy, Inc.(g) | 578 | 10,849 | ||||||||||
Triangle Petroleum Corp.(g) | 3,047 | 128 | ||||||||||
Vantage Drilling International(d)(g) | 82 | 15,170 | ||||||||||
Whiting Petroleum Corp.(g) | 1,645 | 9,886 | ||||||||||
|
| |||||||||||
| 124,908 | ||||||||||||
|
| |||||||||||
| 132,185 | ||||||||||||
|
| |||||||||||
Consumer Discretionary – 0.4% | ||||||||||||
Auto Components – 0.0% | ||||||||||||
Exide Technologies(e)(g)(i) | 1,282 | 5,048 | ||||||||||
|
| |||||||||||
Diversified Consumer Services – 0.1% | ||||||||||||
Laureate Education, Inc. – Class A(g) | 1,354 | 18,103 | ||||||||||
|
| |||||||||||
Hotels, Restaurants & Leisure – 0.2% | ||||||||||||
Caesars Entertainment Corp.(g) | 2,258 | 29,241 | ||||||||||
eDreams ODIGEO SA(g) | 6,063 | 18,779 | ||||||||||
|
| |||||||||||
| 48,020 | ||||||||||||
|
| |||||||||||
Household Durables – 0.0% | ||||||||||||
Hovnanian Enterprises, Inc. – Class A(g) | 3,276 | 7,928 | ||||||||||
|
| |||||||||||
Media – 0.1% | ||||||||||||
Clear Channel Outdoor Holdings, Inc. – Class A(g) | 3,060 | 11,628 | ||||||||||
DISH Network Corp. – Class A(g) | 100 | 4,854 | ||||||||||
Gray Television, Inc.(g) | 483 | 7,520 | ||||||||||
Nexstar Media Group, Inc. – Class A | 151 | 9,634 | ||||||||||
Townsquare Media, Inc. – Class A(g) | 598 | 6,243 | ||||||||||
|
| |||||||||||
| 39,879 | ||||||||||||
|
| |||||||||||
| 118,978 | ||||||||||||
|
| |||||||||||
Financials – 0.2% | ||||||||||||
Diversified Financial Services – 0.2% | ||||||||||||
Holdco, Inc.(d)(e)(f) | 59,949 | 38,367 | ||||||||||
|
| |||||||||||
Health Care – 0.1% | ||||||||||||
Health Care Providers & Services – 0.1% | ||||||||||||
Community Health Systems, Inc.(g) | 2,078 | 12,260 | ||||||||||
LifePoint Health, Inc.(g) | 138 | 6,645 | ||||||||||
Tenet Healthcare Corp.(g) | 336 | 4,798 | ||||||||||
|
| |||||||||||
| 23,703 | ||||||||||||
|
| |||||||||||
Pharmaceuticals – 0.0% | ||||||||||||
Endo International PLC(g) | 614 | 3,917 | ||||||||||
Horizon Pharma PLC(g) | 196 | 2,658 | ||||||||||
|
| |||||||||||
| 6,575 | ||||||||||||
|
| |||||||||||
| 30,278 | ||||||||||||
|
| |||||||||||
| abfunds.com | AB HIGH YIELD PORTFOLIO | 47 |
PORTFOLIO OF INVESTMENTS (continued)
Company | Shares | U.S. $ Value | ||||||||||
| ||||||||||||
Materials – 0.1% | ||||||||||||
Metals & Mining – 0.1% | ||||||||||||
AK Steel Holding Corp.(g) | 455 | $ | 2,088 | |||||||||
Constellium NV – Class A(g) | 1,233 | 13,810 | ||||||||||
Neenah Enterprises, Inc.(d)(e)(f)(g) | 4,481 | 4,167 | ||||||||||
|
| |||||||||||
| 20,065 | ||||||||||||
|
| |||||||||||
Telecommunication Services – 0.0% | ||||||||||||
Wireless Telecommunication Services – 0.0% |
| |||||||||||
T-Mobile US, Inc.(g) | 150 | 8,965 | ||||||||||
|
| |||||||||||
Information Technology – 0.0% | ||||||||||||
IT Services – 0.0% | ||||||||||||
Goodman Networks, Inc.(d)(e)(f)(g) | 1,236 | – 0 | – | |||||||||
|
| |||||||||||
Technology Hardware, Storage & Peripherals – 0.0% | ||||||||||||
Travelport Worldwide Ltd. | 440 | 6,904 | ||||||||||
|
| |||||||||||
Total Common Stocks | 405,992 | |||||||||||
|
| |||||||||||
| Principal Amount (000) | ||||||||||||
GOVERNMENTS – TREASURIES – 1.4% | ||||||||||||
Mexico – 0.3% | ||||||||||||
Mexican Bonos | MXN | 1,202 | 56,789 | |||||||||
Series M 20 | 379 | 22,850 | ||||||||||
|
| |||||||||||
| 79,639 | ||||||||||||
|
| |||||||||||
Russia – 0.2% | ||||||||||||
Russian Federal Bond – OFZ | RUB | 3,986 | 68,461 | |||||||||
|
| |||||||||||
South Africa – 0.1% | ||||||||||||
Republic of South Africa Government Bond | ZAR | 565 | 38,847 | |||||||||
|
| |||||||||||
| 48 | AB HIGH YIELD PORTFOLIO | abfunds.com |
PORTFOLIO OF INVESTMENTS (continued)
| Principal Amount (000) | U.S. $ Value | ||||||||||
| ||||||||||||
United States – 0.8% | ||||||||||||
U.S. Treasury Bonds | U.S.$ | 135 | $ | 142,594 | ||||||||
U.S. Treasury Notes | 76 | 75,289 | ||||||||||
|
| |||||||||||
| 217,883 | ||||||||||||
|
| |||||||||||
Total Governments – Treasuries | 404,830 | |||||||||||
|
| |||||||||||
| Shares | ||||||||||||
PREFERRED STOCKS – 1.3% | ||||||||||||
Utility – 0.2% | ||||||||||||
Electric – 0.2% | ||||||||||||
Dynegy, Inc. | 600 | 49,200 | ||||||||||
SCE Trust III | 423 | 11,374 | ||||||||||
|
| |||||||||||
| 60,574 | ||||||||||||
|
| |||||||||||
Industrial – 0.9% | ||||||||||||
Consumer Cyclical - Other – 0.0% | ||||||||||||
Hovnanian Enterprises, Inc. | 490 | 3,479 | ||||||||||
|
| |||||||||||
Energy – 0.9% | ||||||||||||
Berry Petroleum Co. LLC | 1,821 | 18,816 | ||||||||||
Sanchez Energy Corp. | 962 | 15,693 | ||||||||||
Sanchez Energy Corp. | 300 | 5,379 | ||||||||||
Tervita Corp. | 24,991 | 179,185 | ||||||||||
|
| |||||||||||
| 219,073 | ||||||||||||
|
| |||||||||||
Technology – 0.0% | ||||||||||||
Goodman Networks, Inc. | 1,470 | 5,880 | ||||||||||
|
| |||||||||||
| 228,432 | ||||||||||||
|
| |||||||||||
Financial Institutions – 0.2% | ||||||||||||
Banking – 0.0% | ||||||||||||
GMAC Capital Trust I | 357 | 9,375 | ||||||||||
|
| |||||||||||
| abfunds.com | AB HIGH YIELD PORTFOLIO | 49 |
PORTFOLIO OF INVESTMENTS (continued)
Company | Shares | U.S. $ Value | ||||||||||
| ||||||||||||
Services – 0.2% | ||||||||||||
Holdco, Inc. | 440 | $ | 44,048 | |||||||||
|
| |||||||||||
| 53,423 | ||||||||||||
|
| |||||||||||
Total Preferred Stocks | 342,429 | |||||||||||
|
| |||||||||||
| Principal Amount (000) | ||||||||||||
EMERGING MARKETS – TREASURIES – 0.9% | ||||||||||||
Argentina – 0.2% | ||||||||||||
Argentine Bonos del Tesoro | ARS | 979 | 55,764 | |||||||||
|
| |||||||||||
Brazil – 0.5% | ||||||||||||
Brazil Notas do Tesouro Nacional | BRL | 425 | 133,298 | |||||||||
|
| |||||||||||
Turkey – 0.2% | ||||||||||||
Turkey Government Bond | TRY | 230 | 58,825 | |||||||||
|
| |||||||||||
Total Emerging Markets – Treasuries | 247,887 | |||||||||||
|
| |||||||||||
COLLATERALIZED MORTGAGE OBLIGATIONS – 0.9% | ||||||||||||
Risk Share Floating Rate – 0.8% | ||||||||||||
Federal Home Loan Mortgage Corp. Structured Agency Credit Risk Debt Notes | U.S.$ | 15 | 17,747 | |||||||||
Series 2013-DN2, Class M2 5.488% (LIBOR 1 Month + 4.25%), 11/25/23(m) | 52 | 57,844 | ||||||||||
Series 2014-DN1, Class M3 5.738% (LIBOR 1 Month + 4.50%), 2/25/24(m) | 36 | 42,019 | ||||||||||
Series 2014-HQ2, Class M3 4.988% (LIBOR 1 Month + 3.75%), 9/25/24(m) | 54 | 60,636 | ||||||||||
Federal National Mortgage Association Connecticut Avenue Securities | 15 | 16,803 | ||||||||||
Series 2014-C01, Class M2 5.638% (LIBOR 1 Month + 4.40%), 1/25/24(m) | 27 | 30,373 | ||||||||||
Series 2015-C03, Class 1M2 6.238% (LIBOR 1 Month + 5.00%), 7/25/25(m) | 6 | 7,176 | ||||||||||
| 50 | AB HIGH YIELD PORTFOLIO | abfunds.com |
PORTFOLIO OF INVESTMENTS (continued)
| Principal Amount (000) | U.S. $ Value | ||||||||||
| ||||||||||||
Series 2015-C03, Class 2M2 6.238% (LIBOR 1 Month + 5.00%), 7/25/25(m) | U.S.$ | 3 | $ | 2,991 | ||||||||
|
| |||||||||||
| 235,589 | ||||||||||||
|
| |||||||||||
Non-Agency Fixed Rate – 0.1% | ||||||||||||
Alternative Loan Trust | 6 | 5,214 | ||||||||||
CSMC Mortgage-Backed Trust | 8 | 6,905 | ||||||||||
|
| |||||||||||
| 12,119 | ||||||||||||
|
| |||||||||||
Total Collateralized Mortgage Obligations | 247,708 | |||||||||||
|
| |||||||||||
ASSET-BACKED SECURITIES – 0.7% | ||||||||||||
Home Equity Loans - Fixed Rate – 0.3% | ||||||||||||
CWABS Asset-Backed Certificates Trust | 57 | 56,627 | ||||||||||
GSAA Home Equity Trust | 79 | 41,496 | ||||||||||
|
| |||||||||||
| 98,123 | ||||||||||||
|
| |||||||||||
Home Equity Loans - Floating Rate – 0.2% | ||||||||||||
Lehman XS Trust | 33 | 53,605 | ||||||||||
|
| |||||||||||
Other ABS - Fixed Rate – 0.2% | ||||||||||||
Taco Bell Funding LLC | 16 | 16,810 | ||||||||||
Series 2016-1A, Class A2I | 29 | 29,384 | ||||||||||
|
| |||||||||||
| 46,194 | ||||||||||||
|
| |||||||||||
Total Asset-Backed Securities | 197,922 | |||||||||||
|
| |||||||||||
LOCAL GOVERNMENTS – US MUNICIPAL BONDS – 0.4% | ||||||||||||
United States – 0.4% | ||||||||||||
State of California | 25 | 38,870 | ||||||||||
7.95%, 3/01/36 | 55 | 62,050 | ||||||||||
|
| |||||||||||
Total Local Governments – US Municipal Bonds | 100,920 | |||||||||||
|
| |||||||||||
| abfunds.com | AB HIGH YIELD PORTFOLIO | 51 |
PORTFOLIO OF INVESTMENTS (continued)
| Principal Amount (000) | U.S. $ Value | ||||||||||
| ||||||||||||
QUASI-SOVEREIGNS – 0.3% | ||||||||||||
Quasi-Sovereign Bonds – 0.3% | ||||||||||||
Mexico – 0.3% | ||||||||||||
Petroleos Mexicanos | U.S.$ | 87 | $ | 92,743 | ||||||||
|
| |||||||||||
COLLATERALIZED LOAN | ||||||||||||
CLO - FLOATING RATE – 0.3% | ||||||||||||
CIFC Funding Ltd. | 73 | 72,080 | ||||||||||
|
| |||||||||||
COMMERCIAL MORTGAGE-BACKED SECURITIES – 0.2% | ||||||||||||
Non-Agency Fixed Rate CMBS – 0.2% | ||||||||||||
Citigroup Commercial Mortgage Trust | 15 | 12,756 | ||||||||||
GS Mortgage Securities Trust | 29 | 24,952 | ||||||||||
JPMBB Commercial Mortgage Securities Trust | 29 | 27,478 | ||||||||||
|
| |||||||||||
Total Commercial Mortgage-Backed Securities | 65,186 | |||||||||||
|
| |||||||||||
EMERGING MARKETS – | ||||||||||||
Argentina – 0.1% | ||||||||||||
Argentine Republic Government International Bond | 26 | 27,537 | ||||||||||
|
| |||||||||||
| Shares | ||||||||||||
WARRANTS – 0.0% | ||||||||||||
Information Technology – 0.0% | ||||||||||||
Semiconductors & Semiconductor Equipment – 0.0% | ||||||||||||
Smart Modular Technologies, | 152 | 4,768 | ||||||||||
|
| |||||||||||
| 52 | AB HIGH YIELD PORTFOLIO | abfunds.com |
PORTFOLIO OF INVESTMENTS (continued)
Company | Shares | U.S. $ Value | ||||||||||
| ||||||||||||
Energy – 0.0% | ||||||||||||
Oil, Gas & Consumable Fuels – 0.0% | ||||||||||||
Midstates Petroleum Co., Inc., | 860 | $ | 516 | |||||||||
SandRidge Energy, Inc., A-CW22, | 1,975 | 1,777 | ||||||||||
SandRidge Energy, Inc., B-CW22, | 830 | 664 | ||||||||||
|
| |||||||||||
| 2,957 | ||||||||||||
|
| |||||||||||
Financials – 0.0% | ||||||||||||
Diversified Financial Services – 0.0% | ||||||||||||
iPayment Holdings, Inc., | 21,438 | 517 | ||||||||||
|
| |||||||||||
Materials – 0.0% | ||||||||||||
Communications Equipment – 0.0% | ||||||||||||
FairPoint Communications, Inc., | 973 | – 0 | – | |||||||||
|
| |||||||||||
Total Warrants | 8,242 | |||||||||||
|
| |||||||||||
| Notional Amount | ||||||||||||
OPTIONS PURCHASED – PUTS – 0.0% | ||||||||||||
Options on Funds and Investment Trusts – 0.0% | ||||||||||||
SPDR S&P 500 ETF Trust | USD | 12,100 | 6,474 | |||||||||
|
| |||||||||||
| Principal Amount (000) | ||||||||||||
INFLATION-LINKED SECURITIES – 0.0% | ||||||||||||
Mexico – 0.0% | ||||||||||||
Mexican Udibonos | MXN | 88 | 4,864 | |||||||||
|
| |||||||||||
| abfunds.com | AB HIGH YIELD PORTFOLIO | 53 |
PORTFOLIO OF INVESTMENTS (continued)
Company | Notional Amount | U.S. $ Value | ||||||||||
| ||||||||||||
OPTIONS PURCHASED – CALLS – 0.0% | ||||||||||||
Options on Funds and Investment Trusts – 0.0% | ||||||||||||
SPDR S&P 500 ETF Trust | USD | 5,700 | $ | 2,537 | ||||||||
|
| |||||||||||
Total Investments – 100.4% | 28,490,587 | |||||||||||
Other assets less liabilities – (0.4)% | (105,059 | ) | ||||||||||
|
| |||||||||||
Net Assets – 100.0% | $ | 28,385,528 | ||||||||||
|
| |||||||||||
FUTURES (see Note D)
| Description | Number of Contracts | Expiration Month | Notional (000) | Original Value | Value at October 31, 2017 | Unrealized Appreciation/ (Depreciation) | ||||||||||||||||||||||
Sold Contracts |
| |||||||||||||||||||||||||||
Euro-BOBL Futures | 6 | December 2017 | EUR | 600 | $ | 917,464 | $ | 921,023 | $ | (3,559 | ) | |||||||||||||||||
Euro-OAT Futures | 2 | December 2017 | EUR | 200 | 363,873 | 366,835 | (2,962 | ) | ||||||||||||||||||||
|
| |||||||||||||||||||||||||||
| $ | (6,521 | ) | ||||||||||||||||||||||||||
|
| |||||||||||||||||||||||||||
FORWARD CURRENCY EXCHANGE CONTRACTS (see Note D)
| Counterparty | Contracts to Deliver (000) | In Exchange For (000) | Settlement Date | Unrealized Appreciation/ (Depreciation) | ||||||||||||||||
Bank of America, NA | TWD | 6,399 | USD | 212 | 11/22/17 | $ | (273 | ) | ||||||||||||
Barclays Bank PLC | INR | 2,733 | USD | 42 | 11/29/17 | (604 | ) | |||||||||||||
Citibank, NA | RUB | 4,016 | USD | 70 | 11/22/17 | 1,042 | ||||||||||||||
Citibank, NA | USD | 43 | INR | 2,756 | 11/29/17 | (117 | ) | |||||||||||||
Citibank, NA | EUR | 775 | USD | 915 | 12/15/17 | 10,026 | ||||||||||||||
Credit Suisse International | USD | 85 | PEN | 277 | 12/07/17 | (7 | ) | |||||||||||||
Deutsche Bank AG | BRL | 224 | USD | 68 | 11/03/17 | (117 | ) | |||||||||||||
Deutsche Bank AG | USD | 68 | BRL | 224 | 11/03/17 | 57 | ||||||||||||||
Deutsche Bank AG | BRL | 224 | USD | 68 | 12/04/17 | (45 | ) | |||||||||||||
JPMorgan Chase Bank, NA | USD | 213 | TWD | 6,402 | 11/22/17 | 70 | ||||||||||||||
Royal Bank of Scotland PLC | EUR | 687 | USD | 810 | 12/15/17 | 7,441 | ||||||||||||||
Standard Chartered Bank | BRL | 224 | USD | 70 | 11/03/17 | 1,439 | ||||||||||||||
Standard Chartered Bank | USD | 68 | BRL | 224 | 11/03/17 | 117 | ||||||||||||||
State Street Bank & Trust Co. | CAD | 388 | USD | 308 | 11/10/17 | 7,906 | ||||||||||||||
State Street Bank & Trust Co. | USD | 67 | CAD | 81 | 11/10/17 | (3,510 | ) | |||||||||||||
State Street Bank & Trust Co. | AUD | 178 | USD | 142 | 11/30/17 | 5,881 | ||||||||||||||
State Street Bank & Trust Co. | NZD | 197 | USD | 143 | 11/30/17 | 8,119 | ||||||||||||||
State Street Bank & Trust Co. | GBP | 267 | USD | 362 | 12/01/17 | 6,686 | ||||||||||||||
State Street Bank & Trust Co. | ZAR | 542 | USD | 40 | 12/07/17 | 2,190 | ||||||||||||||
| 54 | AB HIGH YIELD PORTFOLIO | abfunds.com |
PORTFOLIO OF INVESTMENTS (continued)
| Counterparty | Contracts to Deliver (000) | In Exchange For (000) | Settlement Date | Unrealized Appreciation/ (Depreciation) | ||||||||||||||||||||
State Street Bank & Trust Co. | MXN | 324 | USD | 18 | 12/08/17 | $ | 803 | |||||||||||||||||
State Street Bank & Trust Co. | EUR | 800 | USD | 944 | 12/15/17 | 10,045 | ||||||||||||||||||
State Street Bank & Trust Co. | EUR | 102 | USD | 119 | 12/15/17 | (6 | ) | |||||||||||||||||
State Street Bank & Trust Co. | USD | 119 | EUR | 102 | 12/15/17 | 696 | ||||||||||||||||||
State Street Bank & Trust Co. | USD | 229 | EUR | 195 | 12/15/17 | (2,275 | ) | |||||||||||||||||
State Street Bank & Trust Co. | USD | 0 | ** | KRW | 285 | 1/18/18 | 3 | |||||||||||||||||
|
| |||||||||||||||||||||||
| $ | 55,567 | |||||||||||||||||||||||
|
| |||||||||||||||||||||||
PUT OPTIONS WRITTEN (see Note D)
| Description | Counterparty | Contracts | Exercise Price | Expiration Month | Notional (000) | Premiums Received | U.S. $ Value | |||||||||||||||||||
SPDR S&P 500 ETF Trust | Morgan Stanley & Co., Inc. | 121 | USD | 245.00 | November 2017 | USD | 12 | $ | 5,198 | $ | (3,086 | ) | ||||||||||||||
CREDIT DEFAULT SWAPTIONS WRITTEN (see Note D)
| Description | Counterparty | Buy/Sell Protection | Strike Rate | Expiration Month | Notional Amount (000) | Premiums Received | Market Value | |||||||||||||||||||
CDX-NAHY Series 28, 5 Year Index RTP | Goldman Sachs International | Sell | 99.00 | % | Dec, 2017 | $ | 1,437 | $ | 2,012 | $ | (511 | ) | ||||||||||||||
CDX-NAHY Series 29, 5 Year Index RTP | Credit Suisse International | Sell | 105.50 | Nov, 2017 | 150 | 165 | (54 | ) | ||||||||||||||||||
|
|
|
| |||||||||||||||||||||||
| $ | 2,177 | $ | (565 | ) | ||||||||||||||||||||||
|
|
|
| |||||||||||||||||||||||
CENTRALLY CLEARED CREDIT DEFAULT SWAPS (see Note D)
| Fixed Rate (Pay) Receive | Payment Frequency | Implied Credit Spread at October 31, 2017 | Notional Amount (000) | Market Value | Upfront Premiums Paid (Received) | Unrealized Appreciation/ (Depreciation) | |||||||||||||||||||||
Buy Contracts |
| |||||||||||||||||||||||||||
CDX-NAHY Series 26, 5 Year Index, 6/20/21* | (5.00 | )% | Quarterly | 2.37 | % | USD | 484 | $ | (45,456 | ) | $ | (8,747 | ) | $ | (36,709 | ) | ||||||||||||
CDX-NAIG Series 20, 5 Year Index, 6/20/18* | (1.00 | ) | Quarterly | 0.08 | USD | 227 | (1,603 | ) | (400 | ) | (1,203 | ) | ||||||||||||||||
iTraxx-XOVER Series 21, 5 Year Index, 6/20/19* | (5.00 | ) | Quarterly | 0.28 | EUR | – 0 | – | (12 | ) | (6 | ) | (6 | ) | |||||||||||||||
| abfunds.com | AB HIGH YIELD PORTFOLIO | 55 |
PORTFOLIO OF INVESTMENTS (continued)
| Fixed Rate (Pay) Receive | Payment Frequency | Implied Credit Spread at October 31, 2017 | Notional Amount (000) | Market Value | Upfront Premiums Paid (Received) | Unrealized Appreciation/ (Depreciation) | |||||||||||||||||||||
iTraxx-XOVER Series 25, 5 Year Index, 6/20/21* | (5.00 | )% | Quarterly | 1.43 | % | EUR | 14 | $ | (2,151 | ) | $ | (711 | ) | $ | (1,440 | ) | ||||||||||||
iTraxx-XOVER Series 25, 5 Year Index, 6/20/21* | (5.00 | ) | Quarterly | 1.43 | EUR | 46 | (7,068 | ) | (2,330 | ) | (4,738 | ) | ||||||||||||||||
iTraxx-XOVER Series 28, 5 Year Index, 12/20/22* | (5.00 | ) | Quarterly | 2.25 | EUR | 217 | (34,304 | ) | (29,339 | ) | (4,965 | ) | ||||||||||||||||
Sale Contracts |
| |||||||||||||||||||||||||||
CDX-NAHY Series 26, 5 Year Index, 6/20/21* | 5.00 | Quarterly | 2.37 | USD | 504 | 47,297 | 15,907 | 31,390 | ||||||||||||||||||||
CDX-NAHY Series 29, 5 Year Index, 12/20/22* | 5.00 | Quarterly | 3.11 | USD | 284 | 25,464 | 20,987 | 4,477 | ||||||||||||||||||||
|
|
|
|
|
| |||||||||||||||||||||||
| $ | (17,833 | ) | $ | (4,639 | ) | $ | (13,194 | ) | ||||||||||||||||||||
|
|
|
|
|
| |||||||||||||||||||||||
| * | Termination date |
CENTRALLY CLEARED INTEREST RATE SWAPS (see Note D)
| Rate Type | ||||||||||||||||||||||||||||||||
Notional (000) | Termination Date | Payments Fund | Payments received by the Fund | Payment Frequency Paid/ Received | Market | Upfront | Unrealized Appreciation/ (Depreciation) | |||||||||||||||||||||||||
USD | 2,835 | 9/02/25 | 2.248% | | 3 Month LIBOR | | | Semi-Annual/ Quarterly | $ | 1,253 | $ | (8,649 | ) | $ | 9,902 | |||||||||||||||||
USD | 961 | 1/15/26 | 1.978% | | 3 Month LIBOR | | | Semi-Annual/ Quarterly | 18,019 | 5,595 | 12,424 | |||||||||||||||||||||
USD | 651 | 2/16/26 | 1.625% | | 3 Month LIBOR | | | Semi-Annual/ Quarterly | 33,150 | 7,701 | 25,449 | |||||||||||||||||||||
USD | 150 | 3/31/26 | 1.693% | | 3 Month LIBOR | | | Semi-Annual/ Quarterly | 7,046 | — | 7,046 | |||||||||||||||||||||
USD | 100 | 5/03/26 | 1.770% | | 3 Month LIBOR | | | Semi-Annual/ Quarterly | 3,660 | — | 3,660 | |||||||||||||||||||||
USD | 800 | 6/01/26 | 1.714% | | 3 Month LIBOR | | | Semi-Annual/ Quarterly | 33,803 | 33,561 | 242 | |||||||||||||||||||||
USD | 4,650 | 4/28/27 | | 3 Month LIBOR | | 2.330% | | Quarterly/ Semi-Annual | (9,061 | ) | 17,178 | (26,239 | ) | |||||||||||||||||||
USD | 350 | 5/03/27 | 2.285% | | 3 Month LIBOR | | | Semi-Annual/ Quarterly | (701 | ) | 115 | (816 | ) | |||||||||||||||||||
|
| |||||||||||||||||||||||||||||||
| $ | (87,169 | ) | $ | 55,501 | $ | 31,668 | ||||||||||||||||||||||||||
|
| |||||||||||||||||||||||||||||||
| 56 | AB HIGH YIELD PORTFOLIO | abfunds.com |
PORTFOLIO OF INVESTMENTS (continued)
CREDIT DEFAULT SWAPS (see Note D)
| Swap Counterparty & Referenced Obligation | Fixed Rate (Pay) Receive | Payment Frequency | Implied Credit Spread at October 31, 2017 | Notional | Market Value | Upfront Premiums Paid (Received) | Unrealized Appreciation/ (Depreciation) | |||||||||||||||||||||||||
Buy Contracts |
| |||||||||||||||||||||||||||||||
Barclays Bank PLC | ||||||||||||||||||||||||||||||||
Windstream Services, LLC, 7.500%, 6/01/22*, 6/20/18* | (5.00 | )% | Quarterly | 13.87 | % | USD | 51 | $ | 2,344 | $ | 8,669 | $ | (6,325 | ) | ||||||||||||||||||
Uniti Group, Inc., 8.250%, 10/15/23, 12/20/19* | (5.00 | ) | Quarterly | 5.13 | USD | 60 | (194 | ) | 1,434 | (1,628 | ) | |||||||||||||||||||||
Windstream Services LLC, 7.500%, 6/01/22, 3/20/18* | (5.00 | ) | Quarterly | 17.11 | USD | 49 | 1,858 | 5,905 | (4,047 | ) | ||||||||||||||||||||||
Credit Suisse International | ||||||||||||||||||||||||||||||||
CDX- | (5.00 | ) | Monthly | 12.50 | USD | 180 | 47,111 | 23,377 | 23,734 | |||||||||||||||||||||||
Goldman Sachs International | ||||||||||||||||||||||||||||||||
British Telecom- | (1.00 | ) | Quarterly | 0.24 | EUR | 170 | (4,211 | ) | (3,190 | ) | (1,021 | ) | ||||||||||||||||||||
CDX- | (3.00 | ) | Monthly | 7.25 | USD | 192 | 32,009 | 21,025 | 10,984 | |||||||||||||||||||||||
Sale Contracts |
| |||||||||||||||||||||||||||||||
Barclays Bank PLC |
| |||||||||||||||||||||||||||||||
Altice Luxembourg SA, 7.250%, 5/15/22, 6/20/22* | 5.00 | Quarterly | 1.68 | EUR | 60 | 10,773 | 8,473 | 2,300 | ||||||||||||||||||||||||
| abfunds.com | AB HIGH YIELD PORTFOLIO | 57 |
PORTFOLIO OF INVESTMENTS (continued)
| Swap Counterparty & Referenced Obligation | Fixed Rate (Pay) Receive | Payment Frequency | Implied Credit Spread at October 31, 2017 | Notional | Market Value | Upfront Premiums Paid (Received) | Unrealized Appreciation/ (Depreciation) | |||||||||||||||||||||||||
K. Hovnanian Enterprises, Inc., 7.000%, 1/15/19, 9/20/20* | 5.00 | % | Quarterly | 10.53 | % | USD | 63 | $ | (7,355 | ) | $ | (10,353 | ) | $ | 2,998 | |||||||||||||||||
New Albertson’s, Inc., 8.000%, 5/01/31, 12/20/22* | 5.00 | Quarterly | 6.67 | USD | 30 | (1,891 | ) | (2,381 | ) | 490 | ||||||||||||||||||||||
Windstream Services, LLC, 7.500%, 6/01/22, 12/20/22* | 5.00 | Quarterly | 15.65 | USD | 100 | (29,716 | ) | (36,832 | ) | 7,116 | ||||||||||||||||||||||
Citibank, NA | ||||||||||||||||||||||||||||||||
Avis Budget Group, Inc., 5.250%, 3/15/25, 6/20/22* | 5.00 | Quarterly | 2.49 | USD | 50 | 5,443 | 3,055 | 2,388 | ||||||||||||||||||||||||
Credit Suisse International | ||||||||||||||||||||||||||||||||
CDX-CMBX. | 5.00 | Monthly | 12.50 | USD | 29 | (7,590 | ) | (3,710 | ) | (3,880 | ) | |||||||||||||||||||||
CDX-CMBX. | 5.00 | Monthly | 12.50 | USD | 69 | (18,059 | ) | (8,192 | ) | (9,867 | ) | |||||||||||||||||||||
International Game Technology, 4.750%, 2/15/23, 6/20/22* | 5.00 | Quarterly | 1.52 | EUR | 100 | 18,855 | 10,510 | 8,345 | ||||||||||||||||||||||||
Deutsche Bank AG | ||||||||||||||||||||||||||||||||
CDX-CMBX. | 3.00 | Monthly | 7.25 | USD | 75 | (12,504 | ) | (5,223 | ) | (7,281 | ) | |||||||||||||||||||||
CDX-CMBX. | 3.00 | Monthly | 7.25 | USD | 252 | (42,012 | ) | (18,015 | ) | (23,997 | ) | |||||||||||||||||||||
Goldman Sachs Bank USA | ||||||||||||||||||||||||||||||||
Nine West Holdings, Inc., 6.875%, 3/15/19, 3/20/19* | 5.00 | Quarterly | 168.47 | USD | 35 | (27,226 | ) | 322 | (27,548 | ) | ||||||||||||||||||||||
| 58 | AB HIGH YIELD PORTFOLIO | abfunds.com |
PORTFOLIO OF INVESTMENTS (continued)
| Swap Counterparty & Referenced Obligation | Fixed Rate (Pay) Receive | Payment Frequency | Implied Credit Spread at October 31, 2017 | Notional | Market Value | Upfront Premiums Paid (Received) | Unrealized Appreciation/ (Depreciation) | |||||||||||||||||||||||||
Goldman Sachs International |
| |||||||||||||||||||||||||||||||
Altice Finco SA, 9.000%, 6/15/23, 6/20/22* | 5.00 | % | Quarterly | 2.27 | % | EUR | 60 | $ | 8,731 | $ | 7,264 | $ | 1,467 | |||||||||||||||||||
Avis Budget Car Rental LLC, 5.250%, 3/15/25, 6/20/22* | 5.00 | Quarterly | 2.54 | USD | 27 | 2,872 | 1,669 | 1,203 | ||||||||||||||||||||||||
CDX-CMBX.NA.BB Series 6, 5/11/63* | 5.00 | Monthly | 12.50 | USD | 163 | (42,637 | ) | (30,443 | ) | (12,194 | ) | |||||||||||||||||||||
|
|
|
|
|
| |||||||||||||||||||||||||||
| $ | (63,399 | ) | $ | (26,636 | ) | $ | (36,763 | ) | ||||||||||||||||||||||||
|
|
|
|
|
| |||||||||||||||||||||||||||
| * | Termination date |
TOTAL RETURN SWAPS (see Note D)
Counterparty & | # of Shares or Units | Rate Paid/ Received | Payment Frequency | Notional Amount (000) | Maturity Date | Unrealized Appreciation/ (Depreciation) | ||||||||||||||||||
Receive Total Return on Reference Obligation |
| |||||||||||||||||||||||
Bank of America, NA |
| |||||||||||||||||||||||
iBoxx $ Liquid High Yield Index | 466,000 | LIBOR | Quarterly | USD | 466 | 12/20/17 | $ | 3,868 | ||||||||||||||||
iBoxx $ Liquid High Yield Index | 282,000 | LIBOR | Quarterly | USD | 282 | 12/20/17 | 2,928 | |||||||||||||||||
Citibank, NA | ||||||||||||||||||||||||
iBoxx $ Liquid High Yield Index | 112,000 | LIBOR | Quarterly | USD | 112 | 12/20/17 | 1,569 | |||||||||||||||||
iBoxx $ Liquid High Yield Index | 113,000 | LIBOR | Quarterly | USD | 113 | 12/20/17 | 1,288 | |||||||||||||||||
JPMorgan Chase Bank, NA |
| |||||||||||||||||||||||
iBoxx $ Liquid High Yield Index | 462,000 | LIBOR | Quarterly | USD | 462 | 12/20/17 | 4,761 | |||||||||||||||||
iBoxx $ Liquid High Yield Index | 462,000 | LIBOR | Quarterly | USD | 462 | 12/20/17 | 4,761 | |||||||||||||||||
Pay Total Return on Reference Obligation |
| |||||||||||||||||||||||
Bank of America, NA |
| |||||||||||||||||||||||
iBoxx $ Liquid High Yield Index | 290,000 | LIBOR | Quarterly | USD | 290 | 12/20/17 | (241 | ) | ||||||||||||||||
iBoxx $ Liquid High Yield Index | 440,000 | LIBOR | Quarterly | USD | 440 | 12/20/17 | (774 | ) | ||||||||||||||||
Morgan Stanley Capital Services LLC |
| |||||||||||||||||||||||
iBoxx $ Liquid High Yield Index | 570,000 | LIBOR | Quarterly | USD | 570 | 12/20/17 | (3,937 | ) | ||||||||||||||||
iBoxx $ Liquid High Yield Index | 570,000 | LIBOR | Quarterly | USD | 570 | 12/20/17 | (5,248 | ) | ||||||||||||||||
|
| |||||||||||||||||||||||
| $ | 8,975 | |||||||||||||||||||||||
|
| |||||||||||||||||||||||
| abfunds.com | AB HIGH YIELD PORTFOLIO | 59 |
PORTFOLIO OF INVESTMENTS (continued)
| ** | Amount less than 500 contracts. |
| (a) | Security is exempt from registration under Rule 144A of the Securities Act of 1933. These securities, which represent 0.32% of net assets as of October 31, 2017, are considered illiquid and restricted. Additional information regarding such securities follows: |
144A/Restricted & Illiquid Securities | Acquisition Date | Cost | Market Value | Percentage of Net Assets | ||||||||||||
Artsonig Pty Ltd. | 4/01/17 | $ | 11,821 | $ | 759 | 0.00 | % | |||||||||
Creditcorp | 6/28/13 | 33,164 | 28,901 | 0.10 | % | |||||||||||
Exide Technologies | 5/24/17 | 36,432 | 36,622 | 0.13 | % | |||||||||||
Exide Technologies | 11/10/16 | 2,121 | 2,194 | 0.01 | % | |||||||||||
K2016470219 South Africa Ltd. | 3/13/15 | 17,995 | 715 | 0.00 | % | |||||||||||
K2016470260 South Africa Ltd. | 12/22/16 | 3,467 | 3,487 | 0.01 | % | |||||||||||
Magnetation LLC/Mag Finance Corp. | 2/19/15 | 36,766 | 1 | 0.00 | % | |||||||||||
Pacific Drilling SA | 6/03/13 | 40,788 | 14,457 | 0.05 | % | |||||||||||
Texas Competitive/TCEH | 10/03/16 | – 0 | – | – 0 | – | 0.00 | % | |||||||||
Tonon Luxembourg SA | 7/24/15 | 5,510 | 618 | 0.00 | % | |||||||||||
Vantage Drilling International | 6/17/16 | 853 | 857 | 0.00 | % | |||||||||||
Virgolino de Oliveira Finance SA | 2/13/13 | 96,457 | 4,928 | 0.02 | % | |||||||||||
| (b) | Pay-In-Kind Payments (PIK). The issuer may pay cash interest and/or interest in additional debt securities. Rates shown are the rates in effect at October 31, 2017. |
| (c) | Security is exempt from registration under Rule 144A of the Securities Act of 1933. These securities are considered restricted, but liquid and may be resold in transactions exempt from registration, normally to qualified institutional buyers. At October 31, 2017, the aggregate market value of these securities amounted to $10,648,708 or 37.6% of net assets. |
| (d) | Illiquid security. |
| (e) | Fair valued by the Adviser. |
| (f) | Security in which significant unobservable inputs (Level 3) were used in determining fair value. |
| (g) | Non-income producing security. |
| (h) | Defaulted. |
| (i) | Restricted and illiquid security. |
Restricted & Illiquid Securities | Acquisition Date | Cost | Market Value | Percentage of Net Assets | ||||||||||||
CHC Group LLC | 3/10/17 | $ | 62,260 | $ | 8,533 | 0.03 | % | |||||||||
CHC Group LLC/CHC Finance Ltd. Series AI, 10/01/20 | 3/10/17 | 43,972 | 91,238 | 0.32 | % | |||||||||||
Exide Technologies | 5/23/17 | 1,920 | 5,048 | 0.02 | % | |||||||||||
Exide Technologies | 4/30/15 | 969 | 2,012 | 0.01 | % | |||||||||||
Momentive Performance Materials, Inc. | 10/24/14 | – 0 | – | – 0 | – | 0.00 | % | |||||||||
| 60 | AB HIGH YIELD PORTFOLIO | abfunds.com |
PORTFOLIO OF INVESTMENTS (continued)
| (j) | Convertible security. |
| (k) | Coupon rate adjusts periodically based upon a predetermined schedule. Stated interest rate in effect at October 31, 2017. |
| (l) | Securities are perpetual and, thus, do not have a predetermined maturity date. The date shown, if applicable, reflects the next call date. |
| (m) | Floating Rate Security. Stated interest/floor rate was in effect at October 31, 2017. |
| (n) | Defaulted matured security. |
| (o) | Variable rate coupon, rate shown as of October 31, 2017. |
| (p) | The stated coupon rate represents the greater of the LIBOR or the LIBOR floor rate plus a spread at October 31, 2017. |
Currency Abbreviations:
ARS – Argentine Peso
AUD – Australian Dollar
BRL – Brazilian Real
CAD – Canadian Dollar
EUR – Euro
GBP – Great British Pound
INR – Indian Rupee
KRW – South Korean Won
MXN – Mexican Peso
NZD – New Zealand Dollar
PEN – Peruvian Sol
RUB – Russian Ruble
TRY – Turkish Lira
TWD – New Taiwan Dollar
USD – United States Dollar
ZAR – South African Rand
Glossary:
ABS – Asset-Backed Securities
BOBL – Bundesobligationen
CDX-CMBX.NA – North American Commercial Mortgage-Backed Index
CDX-NAHY – North American High Yield Credit Default Swap Index
CDX-NAIG – North American Investment Grade Credit Default Swap Index
CMBS – Commercial Mortgage-Backed Securities
ETF – Exchange Traded Fund
EURIBOR – Euro Interbank Offered Rate
LIBOR – London Interbank Offered Rates
OAT – Obligations Assimilables du Trésor
REIT – Real Estate Investment Trust
RTP – Right To Pay
SPDR – Standard & Poor’s Depository Receipt
TBA – To Be Announced
See notes to financial statements.
| abfunds.com | AB HIGH YIELD PORTFOLIO | 61 |
STATEMENT OF ASSETS & LIABILITIES
October 31, 2017
| Assets | ||||
Investments in securities, at value (cost $28,067,622) | $ | 28,490,587 | ||
Cash collateral due from broker | 71,325 | |||
Foreign currencies, at value (cost $145,078) | 137,854 | |||
Interest receivable | 403,123 | |||
Receivable for investment securities sold | 116,267 | |||
Upfront premiums paid on credit default swaps | 91,703 | |||
Unrealized appreciation on forward currency exchange contracts | 62,521 | |||
Unrealized appreciation on credit default swaps | 61,025 | |||
Unrealized appreciation on total return swaps | 19,175 | |||
Due from custodian | 10,626 | |||
Receivable due from Adviser | 9,049 | |||
Receivable for variation margin on exchange traded swaps | 1,569 | |||
Receivable for capital stock sold | 468 | |||
Affiliated dividends receivable | 150 | |||
|
| |||
Total assets | 29,475,442 | |||
|
| |||
| Liabilities | ||||
Due to custodian | 172,677 | |||
Options written, at value (premiums received $5,198) | 3,086 | |||
Swaptions written, at value (premiums received $2,177) | 565 | |||
Payable for investment securities purchased and foreign currency transactions | 233,232 | |||
Custody fee payable | 175,944 | |||
Audit and tax fee payable | 135,533 | |||
Upfront premiums received on credit default swaps | 118,339 | |||
Unrealized depreciation on credit default swaps | 97,788 | |||
Dividends payable | 73,605 | |||
Unrealized depreciation on total return swaps | 10,200 | |||
Payable for capital stock redeemed | 9,518 | |||
Unrealized depreciation on forward currency exchange contracts | 6,954 | |||
Transfer Agent fee payable | 2,877 | |||
Director’s fees payable | 2,486 | |||
Distribution fee payable | 1,796 | |||
Payable for variation margin on futures | 115 | |||
Accrued expenses | 45,199 | |||
|
| |||
Total liabilities | 1,089,914 | |||
|
| |||
Net Assets | $ | 28,385,528 | ||
|
| |||
| Composition of Net Assets | ||||
Capital stock, at par | $ | 2,923 | ||
Additional paid-in capital | 37,596,114 | |||
Distributions in excess of net investment income | (174,006 | ) | ||
Accumulated net realized loss on investment and foreign currency transactions | (9,505,189 | ) | ||
Net unrealized appreciation on investments and foreign currency denominated assets and liabilities | 465,686 | |||
|
| |||
| $ | 28,385,528 | |||
|
|
See notes to financial statements.
| 62 | AB HIGH YIELD PORTFOLIO | abfunds.com |
STATEMENT OF ASSETS & LIABILITIES (continued)
Net Asset Value Per Share—33 billion shares of capital stock authorized, $.001 par value
| Class | Net Assets | Shares Outstanding | Net Asset Value | |||||||||
| ||||||||||||
| A | $ | 5,149,744 | 530,542 | $ | 9.71 | * | ||||||
| ||||||||||||
| C | $ | 1,016,261 | 104,652 | $ | 9.71 | |||||||
| ||||||||||||
| Advisor | $ | 4,184,967 | 430,986 | $ | 9.71 | |||||||
| ||||||||||||
| R | $ | 33,671 | 3,468 | $ | 9.71 | |||||||
| ||||||||||||
| K | $ | 9,729 | 1,002 | $ | 9.71 | |||||||
| ||||||||||||
| I | $ | 17,492,197 | 1,801,360 | $ | 9.71 | |||||||
| ||||||||||||
| Z | $ | 498,959 | 51,428 | $ | 9.70 | |||||||
| ||||||||||||
| * | The maximum offering price per share for Class A shares was $10.14 which reflects a sales charge of 4.25%. |
See notes to financial statements.
| abfunds.com | AB HIGH YIELD PORTFOLIO | 63 |
STATEMENT OF OPERATIONS
Year Ended October 31, 2017
| Investment Income | ||||||||
Interest | $ | 3,238,432 | ||||||
Dividends | ||||||||
Unaffiliated issuers | 68,105 | |||||||
Affiliated issuers | 9,670 | |||||||
Other income | 4,122 | $ | 3,320,329 | |||||
|
| |||||||
| Expenses | ||||||||
Advisory fee (see Note B) | 319,636 | |||||||
Distribution fee—Class A | 9,762 | |||||||
Distribution fee—Class C | 6,185 | |||||||
Distribution fee—Class R | 246 | |||||||
Distribution fee—Class K | 24 | |||||||
Transfer agency—Class A | 7,233 | |||||||
Transfer agency—Class C | 1,343 | |||||||
Transfer agency—Advisor Class | 7,297 | |||||||
Transfer agency—Class R | 99 | |||||||
Transfer agency—Class K | 5 | |||||||
Transfer agency—Class I | 3,466 | |||||||
Transfer agency—Class Z | 6,248 | |||||||
Custodian | 221,726 | |||||||
Audit and tax | 154,640 | |||||||
Registration fees | 99,161 | |||||||
Administrative | 76,174 | |||||||
Legal | 44,045 | |||||||
Printing | 32,010 | |||||||
Directors’ fees | 26,645 | |||||||
Miscellaneous | 12,219 | |||||||
|
| |||||||
Total expenses before interest expense | 1,028,164 | |||||||
Interest expense | 1,227 | |||||||
|
| |||||||
Total expenses | 1,029,391 | |||||||
Less: expenses waived and reimbursed by the Adviser (see Note B) | (604,002 | ) | ||||||
|
| |||||||
Net expenses | 425,389 | |||||||
|
| |||||||
Net investment income | 2,894,940 | |||||||
|
|
See notes to financial statements.
| 64 | AB HIGH YIELD PORTFOLIO | abfunds.com |
STATEMENT OF OPERATIONS (continued)
| Realized and Unrealized Gain (Loss) on Investment and Foreign Currency Transactions | ||||||||
Net realized gain (loss) on: | ||||||||
Investment transactions(a) | $ | 833,036 | ||||||
Forward currency exchange contracts | (37,809 | ) | ||||||
Futures | (203,192 | ) | ||||||
Options written | 85,957 | |||||||
Swaps | (91,369 | ) | ||||||
Swaptions written | 17,950 | |||||||
Foreign currency transactions | (98,804 | ) | ||||||
Net change in unrealized appreciation/depreciation of: | ||||||||
Investments | 1,447,045 | |||||||
Forward currency exchange contracts | (116,266 | ) | ||||||
Futures | (16,109 | ) | ||||||
Options written | 3,328 | |||||||
Swaps | 267,172 | |||||||
Swaptions written | 1,612 | |||||||
Foreign currency denominated assets and liabilities | 2,014 | |||||||
|
| |||||||
Net gain on investment and foreign currency transactions | 2,094,565 | |||||||
|
| |||||||
Contributions from Affiliates (see Note B) | 92 | |||||||
|
| |||||||
Net Increase in Net Assets from Operations | $ | 4,989,597 | ||||||
|
|
| (a) | On April 16, 2017, the Portfolio redeemed securities in-kind with total proceeds in the amount of $63,292,270. |
See notes to financial statements.
| abfunds.com | AB HIGH YIELD PORTFOLIO | 65 |
STATEMENT OF CHANGES IN NET ASSETS
| Year Ended October 31, 2017 | September 1, 2016 to October 31, 2016(a) | Year Ended August 31, 2016 | ||||||||||
| Increase in Net Assets from Operations | ||||||||||||
Net investment income | $ | 2,894,940 | $ | 724,918 | $ | 13,704,381 | ||||||
Net realized gain (loss) on investment and foreign currency transactions | 505,769 | 42,348 | (23,901,121 | ) | ||||||||
Net change in unrealized appreciation/depreciation of investments and foreign currency denominated assets and liabilities | 1,588,796 | 65,248 | 14,488,760 | |||||||||
Contributions from Affiliates (see Note B) | 92 | – 0 | – | – 0 | – | |||||||
|
|
|
|
|
| |||||||
Net increase in net assets from operations | 4,989,597 | 832,514 | 4,292,020 | |||||||||
| Dividends to Shareholders from | ||||||||||||
Net investment income | ||||||||||||
Class A | (162,805 | ) | (7,490 | ) | (4,614 | ) | ||||||
Class C | (21,960 | ) | (1,328 | ) | (736 | ) | ||||||
Advisor Class | (164,064 | ) | (16,712 | ) | (8,493 | ) | ||||||
Class R | (1,990 | ) | (198 | ) | (133 | ) | ||||||
Class K | (415 | ) | (65 | ) | (45 | ) | ||||||
Class I | (785,002 | ) | (123,447 | ) | (82,698 | ) | ||||||
Class Z | (1,422,780 | ) | (487,477 | ) | (17,643,339 | ) | ||||||
Tax return of capital | ||||||||||||
Class A | (16,992 | ) | – 0 | – | – 0 | – | ||||||
Class C | (2,292 | ) | – 0 | – | – 0 | – | ||||||
Advisor Class | (17,124 | ) | – 0 | – | – 0 | – | ||||||
Class R | (208 | ) | – 0 | – | – 0 | – | ||||||
Class K | (43 | ) | – 0 | – | – 0 | – | ||||||
Class I | (81,932 | ) | – 0 | – | – 0 | – | ||||||
Class Z | (148,497 | ) | – 0 | – | – 0 | – | ||||||
| Capital Stock Transactions | ||||||||||||
Net decrease | (60,218,108 | ) | (1,725,148 | ) | (221,421,717 | ) | ||||||
|
|
|
|
|
| |||||||
Total decrease | (58,054,615 | ) | (1,529,351 | ) | (234,869,755 | ) | ||||||
| Net Assets | ||||||||||||
Beginning of period | 86,440,143 | 87,969,494 | 322,839,249 | |||||||||
|
|
|
|
|
| |||||||
End of period (including distributions in excess of net investment income of ($174,006) and ($351,254) and undistributed net investment income of $942,963, respectively) | $ | 28,385,528 | $ | 86,440,143 | $ | 87,969,494 | ||||||
|
|
|
|
|
| |||||||
| (a) | The Portfolio changed its fiscal year end from August 31 to October 31. |
See notes to financial statements.
| 66 | AB HIGH YIELD PORTFOLIO | abfunds.com |
NOTES TO FINANCIAL STATEMENTS
October 31, 2017
NOTE A
Significant Accounting Policies
AB Bond Fund, Inc. (the “Company”) is registered under the Investment Company Act of 1940 as an open-end management investment company. The Company, which is a Maryland corporation, operates as a series company comprised of eleven portfolios currently in operation. Each portfolio is considered to be a separate entity for financial reporting and tax purposes. This report relates only to the AB High Yield Portfolio (the “Portfolio”), a diversified portfolio. The Portfolio acquired the assets and liabilities of AB High-Yield Portfolio, a series of AB Pooling Portfolios (the “Accounting Survivor”), in a reorganization that was effective at the close of business July 26, 2016 (the “Reorganization”). The Reorganization was approved by the Accounting Survivor’s Board of Trustees and shareholders pursuant to an Agreement and Plan of Acquisition and Dissolution (the “Reorganization Agreement”) (see Note I for additional information). Upon completion of the Reorganization, the Portfolio assumed the performance, financial and other historical accounting information of the Accounting Survivor, including the adoption of the Accounting Survivor’s fiscal year end of August 31. As such, the financial statements and the Class Z shares financial highlights reflect the financial information of the Accounting Survivor through July 26, 2016. The fiscal year end of the Portfolio was subsequently changed to October 31. The Portfolio has authorized the issuance of Class A, Class B, Class C, Advisor Class, Class R, Class K, Class I, Class Z, Class T, Class 1 and Class 2 shares. Class B, Class T, Class 1 and Class 2 shares have not been issued. As of October 31, 2017, AllianceBernstein L.P. (the “Adviser”), was the sole shareholder of Class K and Class I shares. Class A shares are sold with a front-end sales charge of up to 4.25% for purchases not exceeding $1,000,000. With respect to purchases of $1,000,000 or more, Class A shares redeemed within one year of purchase may be subject to a contingent deferred sales charge of 1%. Class C shares are subject to a contingent deferred sales charge of 1% on redemptions made within the first year after purchase and 0% after the first year of purchase. Effective April 10, 2017, Class C shares will automatically convert to Class A shares ten years after the end of the calendar month of purchase. Class R and Class K shares are sold without an initial or contingent deferred sales charge. Advisor Class, Class I and Class Z shares are sold without an initial or contingent deferred sales charge and are not subject to ongoing distribution expenses. All eleven classes of shares have identical voting, dividend, liquidation and other rights, except that the classes bear different distribution and transfer agency expenses. Each class has exclusive voting rights with respect to its distribution plan. The financial statements have been prepared in conformity with U.S. generally accepted accounting principles (“U.S. GAAP”) which require management to make certain estimates and assumptions that affect the reported amounts of assets and
| abfunds.com | AB HIGH YIELD PORTFOLIO | 67 |
NOTES TO FINANCIAL STATEMENTS (continued)
liabilities in the financial statements and amounts of income and expenses during the reporting period. Actual results could differ from those estimates. The Portfolio is an investment company under U.S. GAAP and follows the accounting and reporting guidance applicable to investment companies. The following is a summary of significant accounting policies followed by the Portfolio.
1. Security Valuation
Portfolio securities are valued at their current market value determined on the basis of market quotations or, if market quotations are not readily available or are deemed unreliable, at “fair value” as determined in accordance with procedures established by and under the general supervision of the Company’s Board of Directors (the “Board”).
In general, the market values of securities which are readily available and deemed reliable are determined as follows: securities listed on a national securities exchange (other than securities listed on the NASDAQ Stock Market, Inc. (“NASDAQ”)) or on a foreign securities exchange are valued at the last sale price at the close of the exchange or foreign securities exchange. If there has been no sale on such day, the securities are valued at the last traded price from the previous day. Securities listed on more than one exchange are valued by reference to the principal exchange on which the securities are traded; securities listed only on NASDAQ are valued in accordance with the NASDAQ Official Closing Price; listed or over the counter (“OTC”) market put or call options are valued at the mid level between the current bid and ask prices. If either a current bid or current ask price is unavailable, the Adviser will have discretion to determine the best valuation (e.g., last trade price in the case of listed options); open futures are valued using the closing settlement price or, in the absence of such a price, the most recent quoted bid price. If there are no quotations available for the day of valuation, the last available closing settlement price is used; U.S. Government securities and any other debt instruments having 60 days or less remaining until maturity are generally valued at market by an independent pricing vendor, if a market price is available. If a market price is not available, the securities are valued at amortized cost. This methodology is commonly used for short term securities that have an original maturity of 60 days or less, as well as short term securities that had an original term to maturity that exceeded 60 days. In instances when amortized cost is utilized, the Valuation Committee (the “Committee”) must reasonably conclude that the utilization of amortized cost is approximately the same as the fair value of the security. Such factors the Committee will consider include, but are not limited to, an impairment of the creditworthiness of the issuer or material changes in interest rates. Fixed-income securities, including mortgage-backed and asset-backed securities, may be valued on the basis of prices provided by a pricing service or at a price
| 68 | AB HIGH YIELD PORTFOLIO | abfunds.com |
NOTES TO FINANCIAL STATEMENTS (continued)
obtained from one or more of the major broker-dealers. In cases where broker-dealer quotes are obtained, the Adviser may establish procedures whereby changes in market yields or spreads are used to adjust, on a daily basis, a recently obtained quoted price on a security. Swaps and other derivatives are valued daily, primarily using independent pricing services, independent pricing models using market inputs, as well as third party broker-dealers or counterparties. Open end mutual funds are valued at the closing net asset value per share, while exchange traded funds are valued at the closing market price per share.
Securities for which market quotations are not readily available (including restricted securities) or are deemed unreliable are valued at fair value as deemed appropriate by the Adviser. Factors considered in making this determination may include, but are not limited to, information obtained by contacting the issuer, analysts, analysis of the issuer’s financial statements or other available documents. In addition, the Portfolio may use fair value pricing for securities primarily traded in non-U.S. markets because most foreign markets close well before the Portfolio values its securities at 4:00 p.m., Eastern Time. The earlier close of these foreign markets gives rise to the possibility that significant events, including broad market moves, may have occurred in the interim and may materially affect the value of those securities. To account for this, the Portfolio generally values many of its foreign equity securities using fair value prices based on third party vendor modeling tools to the extent available.
2. Fair Value Measurements
In accordance with U.S. GAAP regarding fair value measurements, fair value is defined as the price that the Portfolio would receive to sell an asset or pay to transfer a liability in an orderly transaction between market participants at the measurement date. U.S. GAAP establishes a framework for measuring fair value, and a three-level hierarchy for fair value measurements based upon the transparency of inputs to the valuation of an asset or liability (including those valued based on their market values as described in Note A.1 above). Inputs may be observable or unobservable and refer broadly to the assumptions that market participants would use in pricing the asset or liability. Observable inputs reflect the assumptions market participants would use in pricing the asset or liability based on market data obtained from sources independent of the Portfolio. Unobservable inputs reflect the Portfolio’s own assumptions about the assumptions that market participants would use in pricing the asset or liability based on the best information available in the circumstances. Each investment is assigned a level based upon the observability of the inputs which are significant to the overall valuation. The three-tier hierarchy of inputs is summarized below.
| • | Level 1—quoted prices in active markets for identical investments |
| abfunds.com | AB HIGH YIELD PORTFOLIO | 69 |
NOTES TO FINANCIAL STATEMENTS (continued)
| • | Level 2—other significant observable inputs (including quoted prices for similar investments, interest rates, prepayment speeds, credit risk, etc.) |
| • | Level 3—significant unobservable inputs (including the Portfolio’s own assumptions in determining the fair value of investments) |
The fair value of debt instruments, such as bonds, and over-the-counter derivatives is generally based on market price quotations, recently executed market transactions (where observable) or industry recognized modeling techniques and are generally classified as Level 2. Pricing vendor inputs to Level 2 valuations may include quoted prices for similar investments in active markets, interest rate curves, coupon rates, currency rates, yield curves, option adjusted spreads, default rates, credit spreads and other unique security features in order to estimate the relevant cash flows which are then discounted to calculate fair values. If these inputs are unobservable and significant to the fair value, these investments will be classified as Level 3. In addition, non-agency rated investments are classified as Level 3.
Where readily available market prices or relevant bid prices are not available for certain equity investments, such investments may be valued based on similar publicly traded investments, movements in relevant indices since last available prices or based upon underlying company fundamentals and comparable company data (such as multiples to earnings or other multiples to equity). Where an investment is valued using an observable input, such as another publicly traded security, the investment will be classified as Level 2. If management determines that an adjustment is appropriate based on restrictions on resale, illiquidity or uncertainty, and such adjustment is a significant component of the valuation, the investment will be classified as Level 3. An investment will also be classified as Level 3 where management uses company fundamentals and other significant inputs to determine the valuation.
Options are valued using market-based inputs to models, broker or dealer quotations, or alternative pricing sources with reasonable levels of price transparency, where such inputs and models are available. Alternatively the values may be obtained through unobservable management determined inputs and/or management’s proprietary models. Where models are used, the selection of a particular model to value an option depends upon the contractual terms of, and specific risks inherent in, the option as well as the availability of pricing information in the market. Valuation models require a variety of inputs, including contractual terms, market prices, measures of volatility and correlations of such inputs. Exchange traded options generally will be classified as Level 2. For options that do not trade on exchange but trade in liquid markets, inputs can generally be
| 70 | AB HIGH YIELD PORTFOLIO | abfunds.com |
NOTES TO FINANCIAL STATEMENTS (continued)
verified and model selection does not involve significant management judgment. Options are classified within Level 2 on the fair value hierarchy when all of the significant inputs can be corroborated to market evidence. Otherwise such instruments are classified as Level 3.
Valuations of mortgage-backed or other asset-backed securities, by pricing vendors, are based on both proprietary and industry recognized models and discounted cash flow techniques. Significant inputs to the valuation of these instruments are value of the collateral, the rates and timing of delinquencies, the rates and timing of prepayments, and default and loss expectations, which are driven in part by housing prices for residential mortgages. Significant inputs are determined based on relative value analyses, which incorporate comparisons to instruments with similar collateral and risk profiles, including relevant indices. Mortgage and asset-backed securities for which management has collected current observable data through pricing services are generally categorized within Level 2. Those investments for which current observable data has not been provided are classified as Level 3.
Bank loan prices are provided by third party pricing services and consist of a composite of the quotes received by the vendor into a consensus price. Certain bank loans are classified as Level 3, as significant input used in the fair value measurement of these instruments is the market quotes that are received by the vendor and these inputs are not observable.
Other fixed income investments, including non-U.S. government and corporate debt, are generally valued using quoted market prices, if available, which are typically impacted by current interest rates, maturity dates and any perceived credit risk of the issuer. Additionally, in the absence of quoted market prices, these inputs are used by pricing vendors to derive a valuation based upon industry or proprietary models which incorporate issuer specific data with relevant yield/spread comparisons with more widely quoted bonds with similar key characteristics. Those investments for which there are observable inputs are classified as Level 2. Where the inputs are not observable, the investments are classified as Level 3.
The following table summarizes the valuation of the Portfolio’s investments by the above fair value hierarchy levels as of October 31, 2017:
Investments in | Level 1 | Level 2 | Level 3 | Total | ||||||||||||
Assets: |
| |||||||||||||||
Corporates – Non-Investment Grade | $ | – 0 | – | $ | 20,248,283 | $ | 267,823 | (a) | $ | 20,516,106 | ||||||
Corporates – Investment Grade | – 0 | – | 4,713,920 | – 0 | – | 4,713,920 | ||||||||||
Bank Loans | – 0 | – | 464,834 | 114,007 | 578,841 | |||||||||||
Emerging Markets – Corporate Bonds | – 0 | – | 449,549 | 4,820 | 454,369 | |||||||||||
| abfunds.com | AB HIGH YIELD PORTFOLIO | 71 |
NOTES TO FINANCIAL STATEMENTS (continued)
Investments in | Level 1 | Level 2 | Level 3 | Total | ||||||||||||
Common Stocks | $ | 258,162 | $ | 63,658 | $ | 84,172 | (a) | $ | 405,992 | |||||||
Governments – Treasuries | – 0 | – | 404,830 | – 0 | – | 404,830 | ||||||||||
Preferred Stocks | 73,428 | 21,072 | 247,929 | 342,429 | ||||||||||||
Emerging Markets – Treasuries | – 0 | – | 247,887 | – 0 | – | 247,887 | ||||||||||
Collateralized Mortgage Obligations | – 0 | – | 247,708 | – 0 | – | 247,708 | ||||||||||
Asset-Backed Securities | – 0 | – | – 0 | – | 197,922 | 197,922 | ||||||||||
Local Governments – US Municipal Bonds | – 0 | – | 100,920 | – 0 | – | 100,920 | ||||||||||
Quasi-Sovereigns | – 0 | – | 92,743 | – 0 | – | 92,743 | ||||||||||
Collateralized Loan Obligations | – 0 | – | – 0 | – | 72,080 | 72,080 | ||||||||||
Commercial Mortgage-Backed Securities | – 0 | – | – 0 | – | 65,186 | 65,186 | ||||||||||
Emerging Markets – Sovereigns | – 0 | – | 27,537 | – 0 | – | 27,537 | ||||||||||
Warrants | 7,725 | – 0 | – | 517 | (a) | 8,242 | ||||||||||
Options Purchased – Puts | – 0 | – | 6,474 | – 0 | – | 6,474 | ||||||||||
Inflation-Linked Securities | – 0 | – | 4,864 | – 0 | – | 4,864 | ||||||||||
Options Purchased – Calls | – 0 | – | 2,537 | – 0 | – | 2,537 | ||||||||||
|
|
|
|
|
|
|
| |||||||||
Total Investments in Securities | 339,315 | 27,096,816 | 1,054,456 | 28,490,587 | ||||||||||||
Other Financial Instruments(b): | ||||||||||||||||
Assets: |
| |||||||||||||||
Forward Currency Exchange Contracts | – 0 | – | 62,521 | – 0 | – | 62,521 | ||||||||||
Centrally Cleared Credit Default Swaps | – 0 | – | 72,761 | – 0 | – | 72,761 | (c) | |||||||||
Centrally Cleared Interest Rate Swaps | – 0 | – | 96,931 | – 0 | – | 96,931 | (c) | |||||||||
Credit Default Swaps | – 0 | – | 129,996 | – 0 | – | 129,996 | ||||||||||
Total Return Swaps | – 0 | – | 19,175 | – 0 | – | 19,175 | ||||||||||
Liabilities: |
| |||||||||||||||
Futures | (6,521 | ) | – 0 | – | – 0 | – | (6,521 | )(c) | ||||||||
Forward Currency Exchange Contracts | – 0 | – | (6,954 | ) | – 0 | – | (6,954 | ) | ||||||||
Put Options Written | – 0 | – | (3,086 | ) | – 0 | – | (3,086 | ) | ||||||||
Credit Default Swaptions Written | – 0 | – | (565 | ) | – 0 | – | (565 | ) | ||||||||
Centrally Cleared Credit Default Swaps | – 0 | – | (90,594 | ) | – 0 | – | (90,594 | )(c) | ||||||||
Centrally Cleared Interest Rate Swaps | – 0 | – | (9,762 | ) | – 0 | – | (9,762 | )(c) | ||||||||
Credit Default Swaps | – 0 | – | (193,395 | ) | – 0 | – | (193,395 | ) | ||||||||
Total Return Swaps | – 0 | – | (10,200 | ) | – 0 | – | (10,200 | ) | ||||||||
|
|
|
|
|
|
|
| |||||||||
Total(d) | $ | 332,794 | $ | 27,163,644 | $ | 1,054,456 | $ | 28,550,894 | ||||||||
|
|
|
|
|
|
|
| |||||||||
| (a) | The Portfolio held securities with zero market value at period end. |
| (b) | Other financial instruments are derivative instruments, such as futures, forwards and swaps, which are valued at the unrealized appreciation/(depreciation) on the instrument. Other financial instruments may also include swaps with upfront premiums, options written and swaptions which are valued at market value. |
| (c) | Only variation margin receivable/(payable) at period end is reported within the statement of assets and liabilities. This amount reflects cumulative unrealized appreciation/(depreciation) of exchange-traded derivatives reported in the portfolio of investments. Exchange-traded swaps with upfront premiums are presented here as market value. |
| (d) | There were no transfers between Level 1 and Level 2 during the reporting period. |
The Portfolio recognizes all transfers between levels of the fair value hierarchy assuming the financial instruments were transferred at the beginning of the reporting period.
| 72 | AB HIGH YIELD PORTFOLIO | abfunds.com |
NOTES TO FINANCIAL STATEMENTS (continued)
The following is a reconciliation of investments in which significant unobservable inputs (Level 3) were used in determining fair value.
| Corporates - Non- Investment Grade(a) | Bank Loans | Common Stocks(a) | ||||||||||
Balance as of 10/31/16 | $ | 386,482 | $ | 195,482 | $ | 105,846 | ||||||
Accrued discounts/(premiums) | (7,690 | ) | 759 | – 0 | – | |||||||
Realized gain (loss) | (195,982 | ) | (221,513 | ) | (41,290 | ) | ||||||
Change in unrealized appreciation/depreciation | 66,519 | 237,050 | (1,752 | ) | ||||||||
Purchases/Payups | 285,312 | 226,057 | 149,427 | |||||||||
Sales/Paydowns | (474,629 | ) | (323,828 | ) | (130,967 | ) | ||||||
Transfers in to Level 3 | 207,811 | – 0 | – | 2,908 | ||||||||
Transfers out of Level 3 | – 0 | – | – 0 | – | – 0 | – | ||||||
|
|
|
|
|
| |||||||
Balance as of 10/31/17 | $ | 267,823 | $ | 114,007 | $ | 84,172 | ||||||
|
|
|
|
|
| |||||||
Net change in unrealized appreciation/depreciation from investments held as of 10/31/17(b) | $ | 52,959 | $ | (124 | ) | $ | 8,854 | |||||
|
|
|
|
|
| |||||||
| Emerging Markets - Corporate Bonds | Preferred Stocks | Asset-Backed Securities | ||||||||||
Balance as of 10/31/16 | $ | 3,739 | $ | – 0 | – | $ | 723,664 | |||||
Accrued discounts/(premiums) | (982 | ) | – 0 | – | 5,680 | |||||||
Realized gain (loss) | (50,080 | ) | 109,668 | 58,133 | ||||||||
Change in unrealized appreciation/depreciation | (6,255 | ) | 51,029 | (63,481 | ) | |||||||
Purchases/Payups | 74,318 | 1,066,569 | – 0 | – | ||||||||
Sales/Paydowns | (15,920 | ) | (979,337 | ) | (526,074 | ) | ||||||
Transfers in to Level 3 | – 0 | – | – 0 | – | – 0 | – | ||||||
Transfers out of Level 3 | – 0 | – | – 0 | – | – 0 | – | ||||||
|
|
|
|
|
| |||||||
Balance as of 10/31/17 | $ | 4,820 | $ | 247,929 | $ | 197,922 | ||||||
|
|
|
|
|
| |||||||
Net change in unrealized appreciation/depreciation from investments held as of 10/31/17(b) | $ | (6,255 | ) | $ | 51,029 | $ | (63,481 | ) | ||||
|
|
|
|
|
| |||||||
| Collateralized Loan Obligations | Commercial Mortgage- Backed Securities | Warrants(a) | ||||||||||
Balance as of 10/31/16 | $ | – 0 | – | $ | 655,946 | $ | 55,217 | |||||
Accrued discounts/(premiums) | 147 | 189 | – 0 | – | ||||||||
Realized gain (loss) | 204 | (6,748 | ) | 8,886 | ||||||||
Change in unrealized appreciation/depreciation | 1,334 | 11,161 | (19,740 | ) | ||||||||
Purchases/Payups | 242,500 | – 0 | – | – 0 | – | |||||||
Sales/Paydowns | (172,105 | ) | (595,362 | ) | (27,654 | ) | ||||||
Transfers in to Level 3 | – 0 | – | – 0 | – | 33 | |||||||
Transfers out of Level 3 | – 0 | – | – 0 | – | (16,225 | ) | ||||||
|
|
|
|
|
| |||||||
Balance as of 10/31/17 | $ | 72,080 | $ | 65,186 | $ | 517 | ||||||
|
|
|
|
|
| |||||||
Net change in unrealized appreciation/depreciation from investments held as of 10/31/17(b) | $ | 1,334 | $ | 20,923 | $ | (19,740 | ) | |||||
|
|
|
|
|
| |||||||
| abfunds.com | AB HIGH YIELD PORTFOLIO | 73 |
NOTES TO FINANCIAL STATEMENTS (continued)
| Total | ||||||||||||
Balance as of 10/31/16 | $ | 2,126,376 | ||||||||||
Accrued discounts/(premiums) | (1,897 | ) | ||||||||||
Realized gain (loss) | (338,722 | ) | ||||||||||
Change in unrealized appreciation/depreciation | 275,865 | |||||||||||
Purchases/Payups | 2,044,183 | |||||||||||
Sales/Paydowns | (3,245,876 | ) | ||||||||||
Transfers in to Level 3 | 210,752 | |||||||||||
Transfers out of Level 3 | (16,225 | ) | ||||||||||
|
| |||||||||||
Balance as of 10/31/17 | $ | 1,054,456 | (c) | |||||||||
|
| |||||||||||
Net change in unrealized appreciation/depreciation from investments held as of 10/31/17(b) | $ | 45,499 | ||||||||||
|
| |||||||||||
| (a) | The Fund held securities with zero market value at period end. |
| (b) | The unrealized appreciation/(depreciation) is included in net change in unrealized appreciation/(depreciation) on investments and other financial instruments in the accompanying statement of operations. |
| (c) | There were de minimis transfers under 1% of net assets during the reporting period. |
The following presents information about significant unobservable inputs related to the Portfolio’s Level 3 investments at October 31, 2017. Securities priced (i) by third party vendors or (ii) using prior transaction prices, are excluded from the following table.
Quantitative Information about Level 3 Fair Value Measurements
| Fair Value at 10/31/17 | Valuation Technique | Unobservable | Input | |||||||
Corporates – Non-Investment Grade | $ | 8,890 |
| Recovery | Collateral Value | $100.00 / NA | ||||
Common Stocks | $ | 4,167 | Market Approach | EBITDA* Projection EBITDA* Multiples | $25MM / NA 5.1X-7.1X / 6.1X | |||||
| $ | 38,367 | Market Approach | EBITDA* Projection EBITDA* Multiples | $96MM / NA 8.5X-9.5X / 9.0X | ||||||
|
| |||||||||
| $ | 42,534 | |||||||||
|
| |||||||||
Preferred Stocks | $ | 5,880 | Market Approach | EBITDA* Projection EBITDA* Multiples | $22.8MM / NA 6.8X | |||||
| $ | 44,048 | Market Approach | EBITDA* Projection EBITDA* Multiples | $96.00MM / NA 8.5X-9.5X / 9.0X | ||||||
|
| |||||||||
| $ | 49,928 | |||||||||
|
| |||||||||
Warrants | $ | 517 | Option Pricing Model | Exercise Price | $6.64 / NA | |||||
| * | Earnings before Interest, Taxes, Depreciation and Amortization. |
Generally, a change in the assumptions used in any input in isolation may be accompanied by a change in another input. Significant changes in any of the unobservable inputs may significantly impact the fair value measurement. Significant increases (decreases) in level yield cumulative loss and delinquency rate in isolation would be expected to result in a significantly lower (higher) fair value measurement. A significant increase (decrease) in collateral
| 74 | AB HIGH YIELD PORTFOLIO | abfunds.com |
NOTES TO FINANCIAL STATEMENTS (continued)
value and EBITDA projections/multiples in insolation would be expected to result in a significant higher (lower) fair value measurement.
The Adviser established the Committee to oversee the pricing and valuation of all securities held in the Portfolio. The Committee operates under pricing and valuation policies and procedures established by the Adviser and approved by the Board, including pricing policies which set forth the mechanisms and processes to be employed on a daily basis to implement these policies and procedures. In particular, the pricing policies describe how to determine market quotations for securities and other instruments. The Committee’s responsibilities include: 1) fair value and liquidity determinations (and oversight of any third parties to whom any responsibility for fair value and liquidity determinations is delegated), and 2) regular monitoring of the Adviser’s pricing and valuation policies and procedures and modification or enhancement of these policies and procedures (or recommendation of the modification of these policies and procedures) as the Committee believes appropriate.
The Committee is also responsible for monitoring the implementation of the pricing policies by the Adviser’s Pricing Group (the “Pricing Group”) and any third party which performs certain pricing functions in accordance with the pricing policies. The Pricing Group is responsible for the oversight of the third party on a day-to-day basis. The Committee and the Pricing Group perform a series of activities to provide reasonable assurance of the accuracy of prices including: 1) periodic vendor due diligence meetings, review of methodologies, new developments and processes at vendors, 2) daily comparison of security valuation versus prior day for all securities that exceeded established thresholds, and 3) daily review of unpriced, stale, and variance reports with exceptions reviewed by senior management and the Committee.
In addition, several processes outside of the pricing process are used to monitor valuation issues including: 1) performance and performance attribution reports are monitored for anomalous impacts based upon benchmark performance, and 2) portfolio managers review all portfolios for performance and analytics (which are generated using the Adviser’s prices).
3. Currency Translation
Assets and liabilities denominated in foreign currencies and commitments under forward currency exchange contracts are translated into U.S. dollars at the mean of the quoted bid and ask prices of such currencies against the U.S. dollar. Purchases and sales of portfolio securities are translated into U.S. dollars at the rates of exchange prevailing when such securities were acquired or sold. Income and expenses are translated into U.S. dollars at rates of exchange prevailing when accrued.
Net realized gain or loss on foreign currency transactions represents foreign exchange gains and losses from sales and maturities of foreign fixed income investments, holding of foreign currencies, currency gains or losses realized between the trade and settlement dates on foreign investment
| abfunds.com | AB HIGH YIELD PORTFOLIO | 75 |
NOTES TO FINANCIAL STATEMENTS (continued)
transactions, and the difference between the amounts of dividends, interest and foreign withholding taxes recorded on the Portfolio’s books and the U.S. dollar equivalent amounts actually received or paid. Net unrealized currency gains and losses from valuing foreign currency denominated assets and liabilities at period end exchange rates are reflected as a component of net unrealized appreciation or depreciation of foreign currency denominated assets and liabilities.
4. Taxes
It is the Portfolio’s policy to meet the requirements of the Internal Revenue Code applicable to regulated investment companies and to distribute all of its investment company taxable income and net realized gains, if any, to shareholders. Therefore, no provisions for federal income or excise taxes are required. The Portfolio may be subject to taxes imposed by countries in which it invests. Such taxes are generally based on income and/or capital gains earned or repatriated. Taxes are accrued and applied to net investment income, net realized gains and net unrealized appreciation/depreciation as such income and/or gains are earned.
In accordance with U.S. GAAP requirements regarding accounting for uncertainties in income taxes, management has analyzed the Portfolio’s tax positions taken or expected to be taken on federal and state income tax returns for all open tax years (the current and the prior three tax years) and has concluded that no provision for income tax is required in the Portfolio’s financial statements.
5. Investment Income and Investment Transactions
Dividend income is recorded on the ex-dividend date or as soon as the Portfolio is informed of the dividend. Interest income is accrued daily. Investment transactions are accounted for on the date the securities are purchased or sold. Investment gains or losses are determined on the identified cost basis. The Portfolio amortizes premiums and accretes discounts as adjustments to interest income.
6. Class Allocations
All income earned and expenses incurred by the Portfolio are borne on a pro-rata basis by each outstanding class of shares, based on the proportionate interest in the Portfolio represented by the net assets of such class, except for class specific expenses which are allocated to the respective class. Expenses of the Company are charged proportionately to each portfolio or based on other appropriate methods. Realized and unrealized gains and losses are allocated among the various share classes based on respective net assets.
7. Dividends and Distributions
Dividends and distributions to shareholders, if any, are recorded on the ex-dividend date. Income dividends and capital gains distributions are determined in accordance with federal tax regulations and may differ from those determined in accordance with U.S. GAAP. To the extent these
| 76 | AB HIGH YIELD PORTFOLIO | abfunds.com |
NOTES TO FINANCIAL STATEMENTS (continued)
differences are permanent, such amounts are reclassified within the capital accounts based on their federal tax basis treatment; temporary differences do not require such reclassification.
NOTE B
Advisory Fee and Other Transactions with Affiliates
Under the terms of the investment advisory agreement, the Portfolio pays the Adviser an advisory fee at an annual rate of .55% of first $2.5 billion, .50% of the next $2.5 billion and .45% in excess of $5 billion, of the Portfolio’s average daily net assets. Effective January 1, 2017, the advisory fee was reduced from .60% to .55% of the first $2.5 billion, .55% to .50% of the next $2.5 billion and .50% to .45% in excess of $5 billion, of the Portfolio’s average daily net assets. The fee is accrued daily and paid monthly. The Adviser has agreed to waive its fees and bear certain expenses to the extent necessary to limit total operating expenses (excluding expenses associated with acquired fund fees and expenses other than the advisory fees of any AB mutual funds in which the Portfolio may invest, interest expense, taxes, extraordinary expenses, and brokerage commissions and other transaction costs), on an annual basis (the “Expense Caps”) to .95%, 1.70%, .70%, 1.20%, .95%, .70% and .70% of daily average net assets for Class A, Class C, Advisor Class, Class R, Class K, Class I and Class Z shares, respectively. Effective January 1, 2017, the Expense Caps were reduced from 1.05% to .95%, 1.80% to 1.70%, .80% to .70%, 1.30% to 1.20%, 1.05% to .95%, .80% to .70% and .80% to .70% of daily average net assets for Class A, Class C, Advisor Class, Class R, Class K, Class I and Class Z shares, respectively. Any fees waived and expenses borne by the Adviser through October 31, 2014 were subject to repayment by the Portfolio until October 31, 2017; any fees waived and expenses borne by the Adviser from November 1, 2014 to July 14, 2015, are subject to repayment by the Portfolio until October 31, 2018; such waivers that are currently subject to repayment amount to $288,388. In any case, no repayment will be made that would cause the Portfolio’s total annual operating expenses to exceed the net fee percentages set forth above. The Expense Caps may not be terminated by the Adviser before January 31, 2018. For the year ended October 31, 2017, such reimbursements/waivers amounted to $529,812.
During the year ended October 31, 2017, the Adviser reimbursed the Portfolio $92 for trading losses incurred due to a trade entry error.
Pursuant to the investment advisory agreement, the Portfolio may reimburse the Adviser for certain legal and accounting services provided to the Portfolio by the Adviser. For the year ended October 31, 2017, the reimbursement for such services amounted to $76,174. For the year ended October 31, 2017, the Adviser voluntarily agreed to waive such fees in the amount of $70,147.
| abfunds.com | AB HIGH YIELD PORTFOLIO | 77 |
NOTES TO FINANCIAL STATEMENTS (continued)
The Portfolio compensates AllianceBernstein Investor Services, Inc. (“ABIS”), a wholly-owned subsidiary of the Adviser, under a Transfer Agency Agreement for providing personnel and facilities to perform transfer agency services for the Portfolio. ABIS may make payments to intermediaries that provide omnibus account services, sub-accounting services and/or networking services. Such compensation retained by ABIS amounted to $19,214 for the year ended October 31, 2017.
AllianceBernstein Investments, Inc. (the “Distributor”), a wholly-owned subsidiary of the Adviser, serves as the distributor of the Portfolio’s shares. The Distributor has advised the Portfolio that it has retained front-end sales charges of $804 from the sale of Class A shares and received $9 and $0 in contingent deferred sales charges imposed upon redemptions by shareholders of Class A and Class C shares, respectively, for the year ended October 31, 2017.
The Portfolio may invest in AB Government Money Market Portfolio (the “Government Money Market Portfolio”) which has a contractual annual advisory fee rate of .20% of the portfolio’s average daily net assets and bears its own expenses. In connection with the investment by the Portfolio in the Government Money Market Portfolio, the Adviser has contractually agreed to waive its advisory fee from the Portfolio in an amount equal to the Portfolio’s pro rata share of the effective advisory fees of Government Money Market Portfolio, as borne indirectly by the Portfolio as an acquired fund fee and expense. For the year ended October 31, 2017, such waiver amounted to $4,043.
A summary of the Portfolio’s transactions in AB mutual funds for the year ended October 31, 2017 is as follows:
| Fund | Market Value 10/31/16 (000) | Purchases at Cost (000) | Sales Proceeds (000) | Market 10/31/17 (000) | Dividend Income (000) | |||||||||||||||
Government Money Market Portfolio | $ | 5,338 | $ | 41,897 | $ | 47,235 | $ | – 0 – | $ | 10 | ||||||||||
Brokerage commissions paid on investment transactions for the year ended October 31, 2017 amounted to $14,042, of which $0 and $0, respectively, was paid to Sanford C. Bernstein & Co. LLC and Sanford C. Bernstein Limited, affiliates of the Adviser.
NOTE C
Distribution Services Agreement
The Portfolio has adopted a Distribution Services Agreement (the “Agreement”) pursuant to Rule 12b-1 under the Investment Company Act of 1940. Under the Agreement, the Portfolio pays distribution and servicing fees to the Distributor at an annual rate of up to .25% of the Portfolio’s
| 78 | AB HIGH YIELD PORTFOLIO | abfunds.com |
NOTES TO FINANCIAL STATEMENTS (continued)
average daily net assets attributable to Class A shares, 1% of the Portfolio’s average daily net assets attributable to Class C shares, .50% of the Portfolio’s average daily net assets attributable to Class R shares and .25% of the Portfolio’s average daily net assets attributable to Class K shares. There are no distribution and servicing fees on the Advisor Class, Class I and Class Z shares. The fees are accrued daily and paid monthly. The Agreement provides that the Distributor will use such payments in their entirety for distribution assistance and promotional activities. Since the commencement of the Portfolio’s operations, the Distributor has incurred expenses in excess of the distribution costs reimbursed by the Portfolio in the amounts of $6,193, $0 and $0 for Class C, Class R and Class K shares, respectively. While such costs may be recovered from the Portfolio in future periods so long as the Agreement is in effect, the rate of the distribution and servicing fees payable under the Agreement may not be increased without a shareholder vote. In accordance with the Agreement, there is no provision for recovery of unreimbursed distribution costs incurred by the Distributor beyond the current fiscal year for Class A shares. The Agreement also provides that the Adviser may use its own resources to finance the distribution of the Portfolio’s shares.
NOTE D
Purchases and sales of investment securities (excluding short-term investments) for the year ended October 31, 2017 were as follows:
| Purchases | Sales | |||||||
Investment securities (excluding | $ | 39,851,039 | $ | 33,159,475 | ||||
U.S. government securities | 315,482 | 487,243 | ||||||
Investment Transactions
The cost of investments for federal income tax purposes, gross unrealized appreciation and unrealized depreciation are as follows:
Cost | $ | 28,077,394 | ||
|
| |||
Gross unrealized appreciation | $ | 1,564,834 | ||
Gross unrealized depreciation | (1,090,800 | ) | ||
|
| |||
Net unrealized appreciation | $ | 474,034 | ||
|
|
1. Derivative Financial Instruments
The Portfolio may use derivatives in an effort to earn income and enhance returns, to replace more traditional direct investments, to obtain exposure to otherwise inaccessible markets (collectively, “investment purposes”), or to hedge or adjust the risk profile of its portfolio.
| abfunds.com | AB HIGH YIELD PORTFOLIO | 79 |
NOTES TO FINANCIAL STATEMENTS (continued)
The principal types of derivatives utilized by the Portfolio, as well as the methods in which they may be used are:
| • | Futures |
The Portfolio may buy or sell futures for investment purposes or for the purpose of hedging its portfolio against adverse effects of potential movements in the market. The Portfolio bears the market risk that arises from changes in the value of these instruments and the imperfect correlation between movements in the price of the futures and movements in the price of the assets, reference rates or indices which they are designed to track. Among other things, the Portfolio may purchase or sell futures for foreign currencies or options thereon for non-hedging purposes as a means of making direct investment in foreign currencies, as described below under “Currency Transactions”.
At the time the Portfolio enters into futures, the Portfolio deposits and maintains as collateral an initial margin with the broker, as required by the exchange on which the transaction is effected. Such amount is shown as cash collateral due from broker on the statement of assets and liabilities. Pursuant to the contract, the Portfolio agrees to receive from or pay to the broker an amount of cash equal to the daily fluctuation in the value of the contract. Such receipts or payments are known as variation margin and are recorded by the Portfolio as unrealized gains or losses. Risks may arise from the potential inability of a counterparty to meet the terms of the contract. The credit/counterparty risk for exchange-traded futures is generally less than privately negotiated futures, since the clearinghouse, which is the issuer or counterparty to each exchange-traded future, has robust risk mitigation standards, including the requirement to provide initial and variation margin. When the contract is closed, the Portfolio records a realized gain or loss equal to the difference between the value of the contract at the time it was opened and the time it was closed.
Use of long futures subjects the Portfolio to risk of loss in excess of the amounts shown on the statement of assets and liabilities, up to the notional value of the futures. Use of short futures subjects the Portfolio to unlimited risk of loss. Under some circumstances, futures exchanges may establish daily limits on the amount that the price of futures can vary from the previous day’s settlement price, which could effectively prevent liquidation of unfavorable positions.
During the year ended October 31, 2017, the Portfolio held futures for hedging purposes.
| • | Forward Currency Exchange Contracts |
The Portfolio may enter into forward currency exchange contracts in order to hedge its exposure to changes in foreign currency exchange rates on its foreign portfolio holdings, to hedge certain firm purchase
| 80 | AB HIGH YIELD PORTFOLIO | abfunds.com |
NOTES TO FINANCIAL STATEMENTS (continued)
and sale commitments denominated in foreign currencies and for non-hedging purposes as a means of making direct investments in foreign currencies, as described below under “Currency Transactions”.
A forward currency exchange contract is a commitment to purchase or sell a foreign currency at a future date at a negotiated forward rate. The gain or loss arising from the difference between the original contract and the closing of such contract would be included in net realized gain or loss on forward currency exchange contracts. Fluctuations in the value of open forward currency exchange contracts are recorded for financial reporting purposes as unrealized appreciation and/or depreciation by the Portfolio. Risks may arise from the potential inability of a counterparty to meet the terms of a contract and from unanticipated movements in the value of a foreign currency relative to the U.S. dollar.
During the year ended October 31, 2017, the Portfolio held forward currency exchange contracts for hedging and non-hedging purposes.
| • | Option Transactions |
For hedging and investment purposes, the Portfolio may purchase and write (sell) put and call options on U.S. and foreign securities, including government securities, and foreign currencies that are traded on U.S. and foreign securities exchanges and over-the-counter markets. Among other things, the Portfolio may use options transactions for non-hedging purposes as a means of making direct investments in foreign currencies, as described below under “Currency Transactions” and may use options strategies involving the purchase and/or writing of various combinations of call and/or put options, for hedging and investment purposes.
The risk associated with purchasing an option is that the Portfolio pays a premium whether or not the option is exercised. Additionally, the Portfolio bears the risk of loss of the premium and change in market value should the counterparty not perform under the contract. If a put or call option purchased by the Portfolio were permitted to expire without being sold or exercised, its premium would represent a loss to the Portfolio. Put and call options purchased are accounted for in the same manner as portfolio securities. The cost of securities acquired through the exercise of call options is increased by premiums paid. The proceeds from securities sold through the exercise of put options are decreased by the premiums paid.
When the Portfolio writes an option, the premium received by the Portfolio is recorded as a liability and is subsequently adjusted to the current market value of the option written. Premiums received from written options which expire unexercised are recorded by the Portfolio on the expiration date as realized gains from options written. The difference between the premium received and the amount paid on
| abfunds.com | AB HIGH YIELD PORTFOLIO | 81 |
NOTES TO FINANCIAL STATEMENTS (continued)
effecting a closing purchase transaction, including brokerage commissions, is also treated as a realized gain, or if the premium received is less than the amount paid for the closing purchase transaction, as a realized loss. If a call option is exercised, the premium received is added to the proceeds from the sale of the underlying security or currency in determining whether the Portfolio has realized a gain or loss. If a put option is exercised, the premium received reduces the cost basis of the security or currency purchased by the Portfolio. In writing an option, the Portfolio bears the market risk of an unfavorable change in the price of the security or currency underlying the written option. Exercise of an option written by the Portfolio could result in the Portfolio selling or buying a security or currency at a price different from the current market value.
At October 31, 2017, the maximum payments for written put options amounted to $2,964,500. In certain circumstances maximum payout amounts may be partially offset by recovery values of the respective referenced assets and upfront premium received upon entering into the contract.
The Portfolio may also invest in options on swap agreements, also called “swaptions”. A swaption is an option that gives the buyer the right, but not the obligation, to enter into a swap on a future date in exchange for paying a market-based “premium”. A receiver swaption gives the owner the right to receive the total return of a specified asset, reference rate, or index. A payer swaption gives the owner the right to pay the total return on a specified asset, reference rate, or index. Swaptions also include options that allow an existing swap to be terminated or extended by one of the counterparties.
At October 31, 2017, the maximum payments for written put swaptions amounted to $1,587,000 with net unrealized appreciation/depreciation of $1,612, and a term of less than one year, as reflected in the portfolio of investments.
During the year ended October 31, 2017, the Portfolio held purchased options for hedging purposes. During the year ended October 31, 2017, the Portfolio held written options for hedging purposes. During the year ended October 31, 2017, the Portfolio held written swaptions for non-hedging purposes.
| • | Swaps |
The Portfolio may enter into swaps to hedge its exposure to interest rates, credit risk, equity markets or currencies. The Portfolio may also enter into swaps for non-hedging purposes as a means of gaining market exposures, making direct investments in foreign currencies, as described below under “Currency Transactions.” The Portfolio may also enter into swaps for non-hedging purposes as a means of
| 82 | AB HIGH YIELD PORTFOLIO | abfunds.com |
NOTES TO FINANCIAL STATEMENTS (continued)
gaining market exposures, making direct investments in foreign currencies, as described below under “Currency Transactions” or in order to take a “long” or “short” position with respect to an underlying referenced asset described below under “Total Return Swaps”. A swap is an agreement that obligates two parties to exchange a series of cash flows at specified intervals based upon or calculated by reference to changes in specified prices or rates for a specified amount of an underlying asset. The payment flows are usually netted against each other, with the difference being paid by one party to the other. In addition, collateral may be pledged or received by the Portfolio in accordance with the terms of the respective swaps to provide value and recourse to the Portfolio or its counterparties in the event of default, bankruptcy or insolvency by one of the parties to the swap.
Risks may arise as a result of the failure of the counterparty to the swap to comply with the terms of the swap. The loss incurred by the failure of a counterparty is generally limited to the net interim payment to be received by the Portfolio, and/or the termination value at the end of the contract. Therefore, the Portfolio considers the creditworthiness of each counterparty to a swap in evaluating potential counterparty risk. This risk is mitigated by having a netting arrangement between the Portfolio and the counterparty and by the posting of collateral by the counterparty to the Portfolio to cover the Portfolio’s exposure to the counterparty. Additionally, risks may arise from unanticipated movements in interest rates or in the value of the underlying securities. The Portfolio accrues for the interim payments on swaps on a daily basis, with the net amount recorded within unrealized appreciation/depreciation of swaps on the statement of assets and liabilities, where applicable. Once the interim payments are settled in cash, the net amount is recorded as realized gain/(loss) on swaps on the statement of operations, in addition to any realized gain/(loss) recorded upon the termination of swaps. Upfront premiums paid or received are recognized as cost or proceeds on the statement of assets and liabilities and are amortized on a straight line basis over the life of the contract. Amortized upfront premiums are included in net realized gain/(loss) from swaps on the statement of operations. Fluctuations in the value of swaps are recorded as a component of net change in unrealized appreciation/depreciation of swaps on the statement of operations.
Certain standardized swaps, including certain interest rate swaps and credit default swaps, are (or soon will be) subject to mandatory central clearing. Cleared swaps are transacted through futures commission merchants (“FCMs”) that are members of central clearinghouses, with the clearinghouse serving as central counterparty, similar to transactions in futures contracts. Centralized clearing will be required for additional categories of swaps on a phased-in basis based on requirements published by the Securities and Exchange Commission and Commodity Futures Trading Commission.
| abfunds.com | AB HIGH YIELD PORTFOLIO | 83 |
NOTES TO FINANCIAL STATEMENTS (continued)
At the time the Portfolio enters into a centrally cleared swap, the Portfolio deposits and maintains as collateral an initial margin with the broker, as required by the clearinghouse on which the transaction is effected. Such amount is shown as cash collateral due from broker on the statement of assets and liabilities. Pursuant to the contract, the Portfolio agrees to receive from or pay to the broker an amount of cash equal to the daily fluctuation in the value of the contract. Such receipts or payments are known as variation margin and are recorded by the Portfolio as unrealized gains or losses. Risks may arise from the potential inability of a counterparty to meet the terms of the contract. The credit/counterparty risk for centrally cleared swaps is generally less than non-centrally cleared swaps, since the clearinghouse, which is the issuer or counterparty to each centrally cleared swap, has robust risk mitigation standards, including the requirement to provide initial and variation margin. When the contract is closed, the Portfolio records a realized gain or loss equal to the difference between the value of the contract at the time it was opened and the time it was closed.
Interest Rate Swaps:
The Portfolio is subject to interest rate risk exposure in the normal course of pursuing its investment objectives. Because the Portfolio holds fixed rate bonds, the value of these bonds may decrease if interest rates rise. To help hedge against this risk and to maintain its ability to generate income at prevailing market rates, the Portfolio may enter into interest rate swaps. Interest rate swaps are agreements between two parties to exchange cash flows based on a notional amount. The Portfolio may elect to pay a fixed rate and receive a floating rate, or, receive a fixed rate and pay a floating rate on a notional amount.
In addition, the Portfolio may also enter into interest rate swap transactions to preserve a return or spread on a particular investment or portion of its portfolio, or protecting against an increase in the price of securities the Portfolio anticipates purchasing at a later date. Interest rate swaps involve the exchange by a Portfolio with another party of their respective commitments to pay or receive interest (e.g., an exchange of floating rate payments for fixed rate payments) computed based on a contractually-based principal (or “notional”) amount. Interest rate swaps are entered into on a net basis (i.e., the two payment streams are netted out, with the Portfolio receiving or paying, as the case may be, only the net amount of the two payments).
During the year ended October 31, 2017, the Portfolio held interest rate swaps for hedging purposes.
Credit Default Swaps:
The Portfolio may enter into credit default swaps, including to manage its exposure to the market or certain sectors of the market, to reduce
| 84 | AB HIGH YIELD PORTFOLIO | abfunds.com |
NOTES TO FINANCIAL STATEMENTS (continued)
its risk exposure to defaults by corporate and sovereign issuers held by the Portfolio, or to create exposure to corporate or sovereign issuers to which it is not otherwise exposed. The Portfolio may purchase credit protection (“Buy Contract”) or provide credit protection (“Sale Contract”) on the referenced obligation of the credit default swap. During the term of the swap, the Portfolio receives/(pays) fixed payments from/(to) the respective counterparty, calculated at the agreed upon rate applied to the notional amount. If the Portfolio is a buyer/(seller) of protection and a credit event occurs, as defined under the terms of the swap, the Portfolio will either (i) receive from the seller/(pay to the buyer) of protection an amount equal to the notional amount of the swap (the “Maximum Payout Amount”) and deliver/(take delivery of) the referenced obligation or (ii) receive/(pay) a net settlement amount in the form of cash or securities equal to the notional amount of the swap less the recovery value of the referenced obligation.
In certain circumstances Maximum Payout Amounts may be partially offset by recovery values of the respective referenced obligations, upfront premium received upon entering into the agreement, or net amounts received from settlement of buy protection credit default swaps entered into by the Portfolio for the same referenced obligations with the same counterparty. As of October 31, 2017, the Portfolio had Buy Contracts outstanding with respect to the same referenced obligation and same counterparty for its Sales Contracts which may partially offset the Maximum Payout Amount in the amount of $198,000.
Credit default swaps may involve greater risks than if a Portfolio had invested in the referenced obligation directly. Credit default swaps are subject to general market risk, liquidity risk, counterparty risk and credit risk. If the Portfolio is a buyer of protection and no credit event occurs, it will lose the payments it made to its counterparty. If the Portfolio is a seller of protection and a credit event occurs, the value of the referenced obligation received by the Portfolio coupled with the periodic payments previously received, may be less than the Maximum Payout Amount it pays to the buyer, resulting in a net loss to the Portfolio.
Implied credit spreads over U.S. Treasuries of comparable maturity utilized in determining the market value of credit default swaps on issuers as of period end are disclosed in the portfolio of investments. The implied spreads serve as an indicator of the current status of the payment/performance risk and typically reflect the likelihood of default by the issuer of the referenced obligation. The implied credit spread of a particular reference obligation also reflects the cost of buying/selling protection and may reflect upfront payments required to be made to
| abfunds.com | AB HIGH YIELD PORTFOLIO | 85 |
NOTES TO FINANCIAL STATEMENTS (continued)
enter into the agreement. Widening credit spreads typically represent a deterioration of the referenced obligation’s credit soundness and greater likelihood of default or other credit event occurring as defined under the terms of the agreement. A credit spread identified as “Defaulted” indicates a credit event has occurred for the referenced obligation.
During the year ended October 31, 2017, the Portfolio held credit default swaps for hedging and non-hedging purposes.
Total Return Swaps:
The Portfolio may enter into total return swaps in order to take a “long” or “short” position with respect to an underlying referenced asset. The Portfolio is subject to market price volatility of the underlying referenced asset. A total return swap involves commitments to pay interest in exchange for a market linked return based on a notional amount. To the extent that the total return of the security, group of securities or index underlying the transaction exceeds or falls short of the offsetting interest obligation, the Portfolio will receive a payment from or make a payment to the counterparty.
During the year ended October 31, 2017, the Portfolio held total return swaps for non-hedging purposes.
The Portfolio typically enters into International Swaps and Derivatives Association, Inc. Master Agreements (“ISDA Master Agreement”) with its OTC derivative contract counterparties in order to, among other things, reduce its credit risk to OTC counterparties. ISDA Master Agreements include provisions for general obligations, representations, collateral and events of default or termination. Under an ISDA Master Agreement, the Portfolio typically may offset with the OTC counterparty certain derivative financial instruments’ payables and/or receivables with collateral held and/or posted and create one single net payment (close-out netting) in the event of default or termination. In the event of a default by an OTC counterparty, the return of collateral with market value in excess of the Portfolio’s net liability, held by the defaulting party, may be delayed or denied.
The Portfolio’s ISDA Master Agreements may contain provisions for early termination of OTC derivative transactions in the event the net assets of the Portfolio decline below specific levels (“net asset contingent features”). If these levels are triggered, the Portfolio’s OTC counterparty has the right to terminate such transaction and require the Portfolio to pay or receive a settlement amount in connection with the terminated transaction. For additional details, please refer to netting arrangements by the OTC counterparty tables below.
| 86 | AB HIGH YIELD PORTFOLIO | abfunds.com |
NOTES TO FINANCIAL STATEMENTS (continued)
During the year ended October 31, 2017, the Portfolio had entered into the following derivatives:
Asset Derivatives | Liability Derivatives | |||||||||||
Derivative Type | Statement of | Fair Value | Statement of | Fair Value | ||||||||
Interest rate contracts | Receivable/Payable for variation margin on futures | $ | 6,521 | * | ||||||||
Credit contracts | Receivable/Payable for variation margin on exchange traded swaps | $ | 35,867 | * | Receivable/Payable for variation margin on exchange traded swaps | 49,061 | * | |||||
Interest rate contracts | Receivable/Payable for variation margin on exchange traded swaps |
| 58,723 | * | Receivable/Payable for variation margin on exchange traded swaps |
| 27,055 | * | ||||
Foreign exchange contracts | Unrealized appreciation on forward currency exchange contracts |
| 62,521 |
| Unrealized depreciation on forward currency exchange contracts |
| 6,954 |
| ||||
Equity contracts | Investments in securities, at value | 9,011 | ||||||||||
Credit contracts | Swaptions written, at value | 565 | ||||||||||
Equity contracts | Options written, at value | 3,086 | ||||||||||
Credit contracts | Unrealized appreciation on credit default swaps | 61,025 | Unrealized depreciation on credit default swaps | 97,788 | ||||||||
Equity contracts | Unrealized appreciation on total return swaps | 19,175 | Unrealized depreciation on total return swaps | 10,200 | ||||||||
|
|
|
| |||||||||
Total | $ | 246,322 | $ | 201,230 | ||||||||
|
|
|
| |||||||||
| * | Only variation margin receivable/payable at period end is reported within the statement of assets and liabilities. This amount reflects cumulative appreciation/(depreciation) of exchange-traded derivatives as reported in the portfolio of investments. |
| abfunds.com | AB HIGH YIELD PORTFOLIO | 87 |
NOTES TO FINANCIAL STATEMENTS (continued)
Derivative Type | Location of Gain or | Realized Gain or (Loss) on Derivatives | Change in Unrealized Appreciation or (Depreciation) | |||||||
Interest rate contracts | Net realized gain (loss) on futures; Net change in unrealized appreciation/depreciation of futures | $ (180,926 | ) | $ 18,223 | ||||||
Equity contracts | Net realized gain (loss) on futures; Net change in unrealized appreciation/depreciation of futures | (22,266 | ) | (34,332 | ) | |||||
Foreign exchange contracts | Net realized gain (loss) on forward currency exchange contracts; Net change in unrealized appreciation/depreciation of forward currency exchange contracts | (37,809 | ) | (116,266 | ) | |||||
Interest rate contracts | Net realized gain (loss) on investment transactions; Net change in unrealized appreciation/depreciation of investments | (2,883 | ) | – 0 | – | |||||
Foreign exchange contracts | Net realized gain (loss) on investment transactions; Net change in unrealized appreciation/depreciation of investments | (9,908 | ) | – 0 | – | |||||
Credit contracts | Net realized gain (loss) on investment transactions; Net change in unrealized appreciation/depreciation of investments | (64,354 | ) | (7,450 | ) | |||||
Equity contracts | Net realized gain (loss) on investment transactions; Net change in unrealized appreciation/depreciation of investments | (219,635 | ) | (6,753 | ) | |||||
| 88 | AB HIGH YIELD PORTFOLIO | abfunds.com |
NOTES TO FINANCIAL STATEMENTS (continued)
Derivative Type | Location of Gain or | Realized Gain or (Loss) on Derivatives | Change in Unrealized Appreciation or (Depreciation) | |||||||
Foreign exchange contracts | Net realized gain (loss) on options written; Net change in unrealized appreciation/depreciation of options written | $ | 2,048 | $ | – 0 | – | ||||
Equity contracts | Net realized gain (loss) on options written; Net change in unrealized appreciation/depreciation of options written | 83,909 | 3,328 | |||||||
Credit contracts | Net realized gain (loss) on swaptions written; Net change in unrealized appreciation/depreciation of swaptions written | 17,950 | 1,612 | |||||||
Interest rate contracts | Net realized gain (loss) on swaps; Net change in unrealized appreciation/depreciation of swaps | 25,709 | 214,282 | |||||||
Credit contracts | Net realized gain (loss) on swaps; Net change in unrealized appreciation/depreciation of swaps | (500,442 | ) | 51,426 | ||||||
Equity contracts | Net realized gain (loss) on swaps; Net change in unrealized appreciation/depreciation of swaps | 383,364 | 1,464 | |||||||
|
|
|
| |||||||
Total | $ | (525,243 | ) | $ | 125,534 | |||||
|
|
|
| |||||||
The following table represents the average monthly volume of the Portfolio’s derivative transactions during the year ended October 31, 2017:
Futures: | ||||
Average original value of buy contracts | $ | 2,850,964 | (a) | |
Average original value of sale contracts | $ | 1,016,225 | ||
Forward Currency Exchange Contracts: | ||||
Average principal amount of buy contracts | $ | 2,628,625 | ||
Average principal amount of sale contracts | $ | 6,797,170 | ||
Purchased Options: | ||||
Average monthly cost | $ | 43,101 |
| abfunds.com | AB HIGH YIELD PORTFOLIO | 89 |
NOTES TO FINANCIAL STATEMENTS (continued)
Options Written: | ||||
Average notional amount | $ | 514,402 | ||
Swaptions Written: | ||||
Average notional amount | $ | 4,146,286 | (b) | |
Centrally Cleared Interest Rate Swaps: | ||||
Average notional amount | $ | 8,189,308 | ||
Credit Default Swaps: | ||||
Average notional amount of buy contracts | $ | 1,998,247 | ||
Average notional amount of sale contracts | $ | 2,338,434 | ||
Centrally Cleared Credit Default Swaps: | ||||
Average notional amount of buy contracts | $ | 9,191,671 | ||
Average notional amount of sale contracts | $ | 5,540,383 | ||
Total Return Swaps: | ||||
Average notional amount | $ | 8,585,846 |
| (a) | Positions were open for nine months during the year. |
| (b) | Positions were open for seven months during the year. |
For financial reporting purposes, the Portfolio does not offset derivative assets and derivative liabilities that are subject to netting arrangements in the statement of assets and liabilities.
All OTC derivatives held at period end were subject to netting arrangements. The following table presents the Portfolio’s derivative assets and liabilities by OTC counterparty net of amounts available for offset under ISDA Master Agreements and net of the related collateral received/pledged by the Portfolio as of October 31, 2017. Exchange-traded derivatives are not subject to netting arrangements and as such are excluded from the table.
Counterparty | Derivative Assets Subject to a MA | Derivative Available for Offset | Cash Collateral Received* | Security Collateral Received* | Net Amount of Derivatives Assets | |||||||||||||||
OTC Derivatives: | ||||||||||||||||||||
Bank of America, NA | $ | 6,796 | $ | (1,288 | ) | $ | – 0 | – | $ | – 0 | – | $ | 5,508 | |||||||
Barclays Bank PLC | 14,975 | (14,975 | ) | – 0 | – | – 0 | – | – 0 | – | |||||||||||
Citibank, NA | 19,368 | (117 | ) | – 0 | – | – 0 | – | 19,251 | ||||||||||||
Credit Suisse International | 65,966 | (25,710 | ) | – 0 | – | – 0 | – | 40,256 | ||||||||||||
Deutsche Bank AG | 57 | (57 | ) | – 0 | – | – 0 | – | – 0 | – | |||||||||||
Goldman Sachs Bank USA/Goldman Sachs International | 43,612 | (43,612 | ) | – 0 | – | – 0 | – | – 0 | – | |||||||||||
JPMorgan Chase Bank, NA | 9,592 | – 0 | – | – 0 | – | – 0 | – | 9,592 | ||||||||||||
Royal Bank of Scotland PLC | 7,441 | – 0 | – | – 0 | – | – 0 | – | 7,441 | ||||||||||||
| 90 | AB HIGH YIELD PORTFOLIO | abfunds.com |
NOTES TO FINANCIAL STATEMENTS (continued)
Counterparty | Derivative Assets Subject to a MA | Derivative Available for Offset | Cash Collateral Received* | Security Collateral Received* | Net Amount of Derivatives Assets | |||||||||||||||
Standard Chartered Bank | $ | 1,556 | $ | – 0 | – | $ | – 0 | – | $ | – 0 | – | $ | 1,556 | |||||||
State Street Bank & Trust Co. | 42,329 | (5,791 | ) | – 0 | – | – 0 | – | 36,538 | ||||||||||||
|
|
|
|
|
|
|
|
|
| |||||||||||
Total | $ | 211,692 | $ | (91,550 | ) | $ | – 0 | – | $ | – 0 | – | $ | 120,142 | ^ | ||||||
|
|
|
|
|
|
|
|
|
| |||||||||||
Counterparty | Derivative Liabilities Subject to a MA | Derivative Available for Offset | Cash Collateral Pledged* | Security Collateral Pledged* | Net Amount of Derivatives Liabilities | |||||||||||||||
OTC Derivatives: | ||||||||||||||||||||
Bank of America, NA | $ | 1,288 | $ | (1,288 | ) | $ | – 0 | – | $ | – 0 | – | $ | – 0 | – | ||||||
Barclays Bank PLC | 39,760 | (14,975 | ) | – 0 | – | – 0 | – | 24,785 | ||||||||||||
Citibank, NA | 117 | (117 | ) | – 0 | – | – 0 | – | – 0 | – | |||||||||||
Credit Suisse International | 25,710 | (25,710 | ) | – 0 | – | – 0 | – | – 0 | – | |||||||||||
Deutsche Bank AG | 54,678 | (57 | ) | – 0 | – | – 0 | – | 54,621 | ||||||||||||
Goldman Sachs Bank USA/Goldman Sachs International | 74,585 | (43,612 | ) | – 0 | – | – 0 | – | 30,973 | ||||||||||||
Morgan Stanley Capital Services LLC | 9,185 | – 0 | – | – 0 | – | – 0 | – | 9,185 | ||||||||||||
State Street Bank & Trust Co. | 5,791 | (5,791 | ) | – 0 | – | – 0 | – | – 0 | – | |||||||||||
|
|
|
|
|
|
|
|
|
| |||||||||||
Total | $ | 211,114 | $ | (91,550 | ) | $ | – 0 | – | $ | – 0 | – | $ | 119,564 | ^ | ||||||
|
|
|
|
|
|
|
|
|
| |||||||||||
| * | The actual collateral received/pledged may be more than the amount reported due to over-collateralization. |
| ^ | Net amount represents the net receivable/payable that would be due from/to the counterparty in the event of default or termination. The net amount from OTC financial derivative instruments can only be netted across transactions governed under the same master agreement with the same counterparty. |
2. Currency Transactions
The Portfolio may invest in non-U.S. Dollar-denominated securities on a currency hedged or unhedged basis. The Portfolio may seek investment opportunities by taking long or short positions in currencies through the use of currency-related derivatives, including forward currency exchange contracts, futures and options on futures, swaps, and other options. The Portfolio may enter into transactions for investment opportunities when it anticipates that a foreign currency will appreciate or depreciate in value but securities denominated in that currency are not held by the Portfolio and
| abfunds.com | AB HIGH YIELD PORTFOLIO | 91 |
NOTES TO FINANCIAL STATEMENTS (continued)
do not present attractive investment opportunities. Such transactions may also be used when the Adviser believes that it may be more efficient than a direct investment in a foreign currency-denominated security. The Portfolio may also conduct currency exchange contracts on a spot basis (i.e., for cash at the spot rate prevailing in the currency exchange market for buying or selling currencies).
3. Reverse Repurchase Agreements
The Portfolio may enter into reverse repurchase transactions (“RVP”) in accordance with the terms of a Master Repurchase Agreement (“MRA”), under which the Portfolio sells securities and agrees to repurchase them at a mutually agreed upon date and price. At the time the Portfolio enters into a reverse repurchase agreement, it will establish a segregated account with the custodian containing liquid assets having a value comparable to the repurchase price. Under the MRA and other Master Agreements, the Portfolio is permitted to offset payables and/or receivables with collateral held and/or posted to the counterparty and create one single net payment due to or from the Portfolio in the event of a default. In the event of a default by a MRA counterparty, the Portfolio may be considered an unsecured creditor with respect to any excess collateral (collateral with a market value in excess of the repurchase price) held by and/or posted to the counterparty, and as such the return of such excess collateral may be delayed or denied. For the year ended October 31, 2017, the Portfolio had no transactions in reverse repurchase agreements.
4. Loan Participations and Assignments
The Portfolio may invest in direct debt instruments which are interests in amounts owed to lenders or lending syndicates by corporate, governmental, or other borrowers, either in the form of participations at the time the loan is originated (“Participations”) or by buying an interest in the loan in the secondary market from a financial institution or institutional investor (“Assignments”). A loan is often administered by a bank or other financial institution (the “Lender”) that acts as agent for all holders. The agent administers the term of the loan as specified in the loan agreement. When investing in Participations, the Portfolio generally has no right to enforce compliance with the terms of the loan agreement with the borrower. In addition, when investing in Participations, the Portfolio has the right to receive payments of principal, interest and any fees to which it is entitled only from the Lender and only upon receipt of payments by the Lender from the borrower. As a result, the Portfolio may be subject to the credit risk of both the borrower and the Lender. When the Portfolio purchases Assignments from Lenders, it will typically acquire direct rights against the borrower on the loan. These loans may include participations in “bridge loans”, which are loans taken out by borrowers for a short period (typically less than six months) pending arrangement of more permanent financing through, for
| 92 | AB HIGH YIELD PORTFOLIO | abfunds.com |
NOTES TO FINANCIAL STATEMENTS (continued)
example, the issuance of bonds, frequently high-yield bonds issued for the purpose of acquisitions. The Portfolio may also participate in unfunded loan commitments, which are contractual obligations for investing in future Participations, and may receive a commitment fee based on the amount of the commitment. Under these arrangements, the Portfolio may receive a fixed rate commitment fee and, if and to the extent the borrower borrows under the facility, the Portfolio may receive an additional funding fee.
Unfunded loan commitments and funded loans are marked to market daily.
As of October 31, 2017, the Portfolio had no commitments outstanding and received no commitment fees or additional funding fees.
NOTE E
Capital Stock
Each class consists of 3,000,000,000 authorized shares. Transactions in capital shares for each class were as follows:
| Shares | Amount | |||||||||||||||||||||||||||||||
| Year Ended October 31, 2017 | September 1, 2016 to October 31, 2016(a) | Year Ended August 31, 2016 | Year Ended October 31, 2017 | September 1, 2016 to October 31, 2016(a) | Year Ended August 31, 2016 | |||||||||||||||||||||||||||
|
| |||||||||||||||||||||||||||||||
| Class A(b) | ||||||||||||||||||||||||||||||||
Shares sold | 620,290 | 39,040 | 106,432 | $ | 5,947,158 | $ | 368,413 | $ | 996,211 | |||||||||||||||||||||||
| ||||||||||||||||||||||||||||||||
Shares issued in reinvestment of dividends | 15,431 | 585 | 630 | 149,397 | 5,529 | 5,916 | ||||||||||||||||||||||||||
| ||||||||||||||||||||||||||||||||
Shares redeemed | (230,551 | ) | (20,179 | ) | (1,136 | ) | (2,216,354 | ) | (191,313 | ) | (10,687 | ) | ||||||||||||||||||||
| ||||||||||||||||||||||||||||||||
Net increase | 405,170 | 19,446 | 105,926 | $ | 3,880,201 | $ | 182,629 | $ | 991,440 | |||||||||||||||||||||||
| ||||||||||||||||||||||||||||||||
| Class C(b) | ||||||||||||||||||||||||||||||||
Shares sold | 72,483 | 18,904 | 19,881 | $ | 701,341 | $ | 179,153 | $ | 186,096 | |||||||||||||||||||||||
| ||||||||||||||||||||||||||||||||
Shares issued in reinvestment of dividends | 1,866 | 105 | 87 | 18,024 | 997 | 816 | ||||||||||||||||||||||||||
| ||||||||||||||||||||||||||||||||
Shares redeemed | (8,568 | ) | (106 | ) | – 0 | – | (82,849 | ) | (995 | ) | – 0 | – | ||||||||||||||||||||
| ||||||||||||||||||||||||||||||||
Net increase | 65,781 | 18,903 | 19,968 | $ | 636,516 | $ | 179,155 | $ | 186,912 | |||||||||||||||||||||||
| ||||||||||||||||||||||||||||||||
| abfunds.com | AB HIGH YIELD PORTFOLIO | 93 |
NOTES TO FINANCIAL STATEMENTS (continued)
| Shares | Amount | |||||||||||||||||||||||||||||||
| Year Ended October 31, 2017 | September 1, 2016 to October 31, 2016(a) | Year Ended August 31, 2016 | Year Ended October 31, 2017 | September 1, 2016 to October 31, 2016(a) | Year Ended August 31, 2016 | |||||||||||||||||||||||||||
|
| |||||||||||||||||||||||||||||||
| Advisor Class(b) | ||||||||||||||||||||||||||||||||
Shares sold | 416,754 | 73,845 | 217,581 | $ | 4,010,347 | $ | 699,053 | $ | 2,039,971 | |||||||||||||||||||||||
| ||||||||||||||||||||||||||||||||
Shares issued in reinvestment of dividends | 14,028 | 1,480 | 1,146 | 135,720 | 13,990 | 10,763 | ||||||||||||||||||||||||||
| ||||||||||||||||||||||||||||||||
Shares redeemed | (288,688 | ) | (4,951 | ) | (209 | ) | (2,762,280 | ) | (46,563 | ) | (1,957 | ) | ||||||||||||||||||||
| ||||||||||||||||||||||||||||||||
Net increase | 142,094 | 70,374 | 218,518 | $ | 1,383,787 | $ | 666,480 | $ | 2,048,777 | |||||||||||||||||||||||
| ||||||||||||||||||||||||||||||||
| Class R(b) | ||||||||||||||||||||||||||||||||
Shares sold | 3,868 | 59 | 3,196 | $ | 37,554 | $ | 560 | $ | 29,918 | |||||||||||||||||||||||
| ||||||||||||||||||||||||||||||||
Shares issued in reinvestment of dividends | 169 | 14 | 14 | 1,638 | 137 | 130 | ||||||||||||||||||||||||||
| ||||||||||||||||||||||||||||||||
Shares redeemed | (3,852 | ) | – 0 | – | – 0 | – | (37,236 | ) | – 0 | – | – 0 | – | ||||||||||||||||||||
| ||||||||||||||||||||||||||||||||
Net increase | 185 | 73 | 3,210 | $ | 1,956 | $ | 697 | $ | 30,048 | |||||||||||||||||||||||
| ||||||||||||||||||||||||||||||||
| Class K(b) | ||||||||||||||||||||||||||||||||
Shares sold | 2 | – 0 | – | 1,000 | $ | 17 | $ | – 0 | – | $ | 9,364 | |||||||||||||||||||||
| ||||||||||||||||||||||||||||||||
Net increase | 2 | – 0 | – | 1,000 | $ | 17 | $ | – 0 | – | $ | 9,364 | |||||||||||||||||||||
| ||||||||||||||||||||||||||||||||
| Class I(b) | ||||||||||||||||||||||||||||||||
Shares sold | 12,323 | – 0 | – | 1,790,331 | $ | 118,537 | $ | – 0 | – | $ | 16,762,629 | |||||||||||||||||||||
| ||||||||||||||||||||||||||||||||
Shares issued in reinvestment of dividends | 396 | – 0 | – | – 0 | – | 3,837 | – 0 | – | – 0 | – | ||||||||||||||||||||||
| ||||||||||||||||||||||||||||||||
Shares redeemed | (1,690 | ) | – 0 | – | – 0 | – | (16,315 | ) | – 0 | – | – 0 | – | ||||||||||||||||||||
| ||||||||||||||||||||||||||||||||
Net increase | 11,029 | – 0 | – | 1,790,331 | $ | 106,059 | $ | – 0 | – | $ | 16,762,629 | |||||||||||||||||||||
| ||||||||||||||||||||||||||||||||
| Class Z | ||||||||||||||||||||||||||||||||
Shares sold | 53,745 | – 0 | – | 247,023 | $ | 520,610 | $ | – 0 | – | $ | 2,284,326 | |||||||||||||||||||||
| ||||||||||||||||||||||||||||||||
Shares issued in reinvestment of dividends | 143,778 | 51,603 | 1,887,844 | 1,376,188 | 487,381 | 17,643,285 | ||||||||||||||||||||||||||
| ||||||||||||||||||||||||||||||||
Shares issued in connection with the Reorganization | – 0 | – | – 0 | – | 7,289,875 | $ | – 0 | – | $ | – 0 | – | $ | 68,233,326 | |||||||||||||||||||
| ||||||||||||||||||||||||||||||||
Shares redeemed | (7,041,947 | ) | (342,633 | ) | (34,787,674 | ) | (68,123,442 | ) | (3,241,490 | ) | (329,611,824 | ) | ||||||||||||||||||||
| ||||||||||||||||||||||||||||||||
Net decrease | (6,844,424 | ) | (291,030 | ) | (25,362,932 | ) | $ | (66,226,644 | ) | $ | (2,754,109 | ) | $ | (241,450,887 | ) | |||||||||||||||||
| ||||||||||||||||||||||||||||||||
| (a) | The Portfolio changed its fiscal year end from August 31 to October 31. |
| (b) | Inception date of July 26, 2016. |
| 94 | AB HIGH YIELD PORTFOLIO | abfunds.com |
NOTES TO FINANCIAL STATEMENTS (continued)
At October 31, 2017, a shareholder of the Portfolio owned 61% of the Portfolio’s outstanding shares. Significant transactions by such shareholder, if any, may impact the Portfolio’s performance.
NOTE F
Risks Involved in Investing in the Portfolio
Interest Rate Risk and Credit Risk—Interest rate risk is the risk that changes in interest rates will affect the value of the Portfolio’s investments in fixed-income debt securities such as bonds or notes. Increases in interest rates may cause the value of the Portfolio’s investments to decline. Credit risk is the risk that the issuer or guarantor of a debt security, or the counterparty to a derivative contract, will be unable or unwilling to make timely principal and/or interest payments, or to otherwise honor its obligations. The degree of risk for a particular security may be reflected in its credit rating. Credit risk is greater for medium quality and lower-rated securities. Lower-rated debt securities and similar unrated securities (commonly known as “junk bonds”) have speculative elements or are predominantly speculative risks.
Below Investment Grade Securities Risk—Investments in fixed-income securities with lower ratings (commonly known as “junk bonds”) are subject to a higher probability that an issuer will default or fail to meet its payment obligations. These securities may be subject to greater price volatility due to such factors as specific corporate developments, negative perceptions of the junk bond market generally and less secondary market liquidity.
Duration Risk—Duration is a measure that relates the expected price volatility of a fixed-income security to changes in interest rates. The duration of a fixed-income security may be shorter than or equal to full maturity of a fixed-income security. Fixed-income securities with longer durations have more risk and will decrease in price as interest rates rise. For example, a fixed-income security with a duration of three years will decrease in value by approximately 3% if interest rates increase by 1%.
Inflation Risk—This is the risk that the value of assets or income from investments will be less in the future as inflation decreases the value of money. As inflation increases, the value of the Portfolio’s assets can decline as can the value of the Portfolio’s distributions. This risk is significantly greater for fixed-income securities with longer maturities.
Derivatives Risk—The Portfolio may enter into derivative transactions such as forwards, options, futures and swaps. Derivatives may be illiquid, difficult to price, and leveraged so that small changes may produce disproportionate losses for the Portfolio, and subject to counterparty risk to a
| abfunds.com | AB HIGH YIELD PORTFOLIO | 95 |
NOTES TO FINANCIAL STATEMENTS (continued)
greater degree than more traditional investments. Derivatives may result in significant losses, including losses that are far greater than the value of the derivatives reflected on the statement of assets and liabilities.
Leverage Risk—When the Portfolio borrows money or otherwise leverages its investments, its performance may be volatile because leverage tends to exaggerate the effect of any increase or decrease in the value of the Portfolio’s investments. The Portfolio may create leverage through the use of reverse repurchase arrangements, forward currency exchange contracts, forward commitments, dollar rolls or futures or by borrowing money. The use of other types of derivative instruments by the Portfolio, such as options and swaps, may also result in a form of leverage. Leverage may result in higher returns to the Portfolio than if the Portfolio were not leveraged, but may also adversely affect returns, particularly if the market is declining.
Foreign (Non-U.S.) Risk—Investments in securities of non-U.S. issuers may involve more risk than those of U.S. issuers. These securities may fluctuate more widely in price and may be less liquid due to adverse market, economic, political, regulatory or other factors.
Emerging Market Risk—Investments in emerging market countries may have more risk because the markets are less developed and less liquid, and because these investments may be subject to increased economic, political, regulatory, or other uncertainties.
Currency Risk—Fluctuations in currency exchange rates may negatively affect the value of the Portfolio’s investments or reduce its returns.
Non-Diversification Risk—The Portfolio may have more risk because it is “non-diversified”, meaning that it can invest more of its assets in a smaller number of issuers. Accordingly, changes in the value of a single security may have a more significant effect, either negative or positive, on the Portfolio’s NAV.
Liquidity Risk—Liquidity risk occurs when certain investments become difficult to purchase or sell. Difficulty in selling less liquid securities may result in sales at disadvantageous prices affecting the value of your investment in the Portfolio. Causes of liquidity risk may include low trading volumes, large positions and heavy redemptions of portfolio shares. Over recent years, liquidity risk has also increased because the capacity of dealers in the secondary market for fixed-income securities to make markets in these securities has decreased, even as the overall bond market has grown significantly, due to, among other things, structural changes, additional regulatory requirements and capital and risk restraints that have
| 96 | AB HIGH YIELD PORTFOLIO | abfunds.com |
NOTES TO FINANCIAL STATEMENTS (continued)
led to reduced inventories. Liquidity risk may be higher in a rising interest rate environment, when the value and liquidity of fixed-income securities generally decline.
Indemnification Risk—In the ordinary course of business, the Portfolio enters into contracts that contain a variety of indemnifications. The Portfolio’s maximum exposure under these arrangements is unknown. However, the Portfolio has not had prior claims or losses pursuant to these indemnification provisions and expects the risk of loss thereunder to be remote. Therefore, the Portfolio has not accrued any liability in connection with these indemnification provisions.
NOTE G
Joint Credit Facility
A number of open-end mutual funds managed by the Adviser, including the Portfolio, participate in a $280 million revolving credit facility (the “Facility”) intended to provide short-term financing, if necessary, subject to certain restrictions in connection with abnormal redemption activity. Commitment fees related to the Facility are paid by the participating funds and are included in miscellaneous expenses in the statement of operations. The Portfolio did not utilize the Facility during the year ended October 31, 2017.
NOTE H
Distributions to Shareholders
The tax character of distributions paid during the year ended October 31, 2017, fiscal period ended October 31, 2016 and year ended August 31, 2016 were as follows:
| October 2017 | October 2016 | August 2016 | ||||||||||
Distributions paid from: | ||||||||||||
Ordinary income | $ | 2,559,016 | $ | 636,717 | $ | 17,740,058 | ||||||
|
|
|
|
|
| |||||||
Total taxable distributions paid | 2,559,016 | 636,717 | 17,740,058 | |||||||||
Return of capital | 267,088 | – 0 | – | – 0 | – | |||||||
|
|
|
|
|
| |||||||
Total distributions paid | $ | 2,826,104 | $ | 636,717 | $ | 17,740,058 | ||||||
|
|
|
|
|
| |||||||
As of October 31, 2017, the components of accumulated earnings/(deficit) on a tax basis were as follows:
Accumulated capital and other losses | $ | (9,516,739 | )(a) | |
Unrealized appreciation/(depreciation) | 473,299 | (b) | ||
|
| |||
Total accumulated earnings/(deficit) | $ | (9,043,440 | )(c) | |
|
|
| (a) | As of October 31, 2017, the Fund had a net capital loss carryforward of $9,509,266. The Fund also had $12,466,893 of capital loss carryforwards expire during the fiscal year. As of October 31, 2017, the cumulative deferred loss on straddles was $7,473. |
| (b) | The differences between book-basis and tax-basis unrealized appreciation/(depreciation) are attributable primarily to the tax deferral of losses on wash sales, the tax treatment of swaps, and the recognition for tax purposes of unrealized gains/losses on certain derivative instruments. |
| abfunds.com | AB HIGH YIELD PORTFOLIO | 97 |
NOTES TO FINANCIAL STATEMENTS (continued)
| (c) | Other differences in book-basis and tax-basis components of accumulated earnings/(deficit) are attributable primarily to dividends payable and the tax treatment of defaulted securities. |
For tax purposes, net realized capital losses may be carried over to offset future capital gains, if any. Funds are permitted to carry forward capital losses for an indefinite period, and such losses will retain their character as either short-term or long-term capital losses. As of October 31, 2017, the Portfolio had a net short-term capital loss carryforward of $5,695,887 and a net long-term capital loss carryforward of $3,813,379, which may be carried forward for an indefinite period.
During the current fiscal year, permanent differences primarily due to the tax treatment of swaps, foreign currency reclassifications, the tax treatment of proceeds from the sale of defaulted securities, the expiration of capital loss carryforwards, contributions from Affiliates, and the tax treatment of gains from a redemption-in-kind resulted in a net increase in distributions in excess of net investment income, a net decrease in accumulated net realized loss on investment and foreign currency transactions, and a net decrease in additional paid-in capital. These reclassifications had no effect on net assets.
NOTE I
Merger and Reorganization
At a meeting held May 3-5, 2016, the Board, on behalf of the Portfolio, and the Board of Trustees of the Accounting Survivor, approved the Reorganization Agreement providing for the tax-free acquisition by the Portfolio of the assets and liabilities of the Accounting Survivor. The acquisition was completed at the close of business July 26, 2016. The Portfolio’s fiscal year end changed to October 31, effective in 2016. Pursuant to the Reorganization Agreement, the assets and liabilities of the Accounting Survivor’s shares were transferred in exchange for the Portfolio’s Class Z shares, in a tax-free exchange as follows:
| Shares outstanding before the Reorganization | Shares outstanding immediately after the Reorganization | Aggregate net assets before the Reorganization | Aggregate net assets immediately after the Reorganization | |||||||||||||
Accounting Survivor | 7,254,378 | – 0 | – | $ | 68,233,326 | + | $ | – 0 | – | |||||||
The Portfolio | 2,097,920 | 9,387,795 | $ | 19,642,348 | ++ | $ | 87,875,674 | |||||||||
| + | Includes undistributed net investment income of $404,396 and unrealized depreciation on investments of $1,497,163, with a fair value of $60,408,577 and identified cost of $61,905,740. |
| ++ | Includes unrealized depreciation of $370,906. |
| 98 | AB HIGH YIELD PORTFOLIO | abfunds.com |
NOTES TO FINANCIAL STATEMENTS (continued)
For financial reporting purposes, assets received and shares issued by the Portfolio were recorded at fair value; however, the cost basis of the investments received from the Accounting Survivor was carried forward to align ongoing reporting of the Portfolio’s realized and unrealized gains and losses with amounts distributable to shareholders for tax purposes.
NOTE J
Recent Accounting Pronouncements
In May 2015, the Financial Accounting Standards Board issued an Accounting Standards Update, ASU 2015-07 (the “ASU”) which removes the requirement to categorize within the fair value hierarchy all investments for which fair value is measured using the net asset value per share practical expedient. The ASU also removes the requirement to make certain disclosures for investments that are eligible to be measured at fair value using the net asset value per share practical expedient but do not utilize that practical expedient. The ASU is effective for annual periods beginning after December 15, 2015 and interim periods within those annual periods. Management has evaluated the implications of these changes and there will be no impact to the financial statements.
NOTE K
Subsequent Events
Management has evaluated subsequent events for possible recognition or disclosure in the financial statements through the date the financial statements are issued. Management has determined that there are no material events that would require disclosure in the Portfolio’s financial statements through this date.
| abfunds.com | AB HIGH YIELD PORTFOLIO | 99 |
FINANCIAL HIGHLIGHTS
Selected Data For A Share Of Capital Stock Outstanding Throughout Each Period
| Class A | ||||||||||||
Year Ended 2017 | September 1, 2016(a) | July 26, 2016 | ||||||||||
|
| |||||||||||
Net asset value, beginning of period | $ 9.46 | $ 9.44 | $ 9.36 | |||||||||
|
| |||||||||||
Income From Investment Operations |
| |||||||||||
Net investment income(c)(d) | .46 | .08 | # | .05 | ||||||||
Net realized and unrealized gain on investment and foreign currency transactions | .25 | .01 | .07 | † | ||||||||
Contributions from Affiliates | .00 | (e) | – 0 | – | – 0 | – | ||||||
|
| |||||||||||
Net increase in net asset value from operations | .71 | .09 | .12 | |||||||||
|
| |||||||||||
Less: Dividends |
| |||||||||||
Dividends from net investment income | (.42 | ) | (.07 | ) | (.04 | ) | ||||||
Tax return of capital | (.04 | ) | – 0 | – | – 0 | – | ||||||
|
| |||||||||||
Net asset value, end of period | $ 9.71 | $ 9.46 | $ 9.44 | |||||||||
|
| |||||||||||
Total Return |
| |||||||||||
Total investment return based on net asset value(f) | 7.61 | %*‡ | .90 | %# | 1.33 | % | ||||||
Ratios/Supplemental Data |
| |||||||||||
Net assets, end of period (000’s omitted) | $5,150 | $1,186 | $1,000 | |||||||||
Ratio to average net assets of: |
| |||||||||||
Expenses, net of waivers/reimbursements(g)(h) | .95 | % | 1.03 | %^ | 1.06 | %^ | ||||||
Expenses, before waivers/reimbursements(g)(h) | 2.64 | % | 3.25 | %^ | 2.71 | %^ | ||||||
Net investment income(d) | 4.82 | % | 4.81 | %^# | 5.13 | %^ | ||||||
Portfolio turnover rate | 65 | % | 9 | % | 44 | % | ||||||
See footnote summary on pages 107-108.
| 100 | AB HIGH YIELD PORTFOLIO | abfunds.com |
FINANCIAL HIGHLIGHTS (continued)
Selected Data For A Share Of Capital Stock Outstanding Throughout Each Period
| Class C | ||||||||||||
| Year Ended October 31, 2017 | September 1, 2016(a) | July 26, 2016 | ||||||||||
|
| |||||||||||
Net asset value, beginning of period | $ 9.46 | $ 9.44 | $ 9.36 | |||||||||
|
| |||||||||||
Income From Investment Operations |
| |||||||||||
Net investment income(c)(d) | .39 | .06 | # | .04 | ||||||||
Net realized and unrealized gain on investment and foreign currency transactions | .24 | .01 | .08 | † | ||||||||
Contributions from Affiliates | .00 | (e) | – 0 | – | – 0 | – | ||||||
|
| |||||||||||
Net increase in net asset value from operations | .63 | .07 | .12 | |||||||||
|
| |||||||||||
Less: Dividends |
| |||||||||||
Dividends from net investment income | (.34 | ) | (.05 | ) | (.04 | ) | ||||||
Tax return of capital | (.04 | ) | – 0 | – | – 0 | – | ||||||
|
| |||||||||||
Net asset value, end of period | $ 9.71 | $ 9.46 | $ 9.44 | |||||||||
|
| |||||||||||
Total Return |
| |||||||||||
Total investment return based on net asset value(f) | 6.81 | %*‡ | .78 | %# | 1.25 | % | ||||||
Ratios/Supplemental Data |
| |||||||||||
Net assets, end of period (000’s omitted) | $1,016 | $368 | $188 | |||||||||
Ratio to average net assets of: |
| |||||||||||
Expenses, net of waivers/reimbursements(g)(h) | 1.71 | % | 1.78 | %^ | 1.81 | %^ | ||||||
Expenses, before waivers/reimbursements(g)(h) | 3.44 | % | 4.29 | %^ | 3.47 | %^ | ||||||
Net investment income(d) | 4.08 | % | 4.15 | %^# | 4.36 | %^ | ||||||
Portfolio turnover rate | 65 | % | 9 | % | 44 | % | ||||||
See footnote summary on pages 107-108.
| abfunds.com | AB HIGH YIELD PORTFOLIO | 101 |
FINANCIAL HIGHLIGHTS (continued)
Selected Data For A Share Of Capital Stock Outstanding Throughout Each Period
| Advisor Class | ||||||||||||
| Year Ended October 31, 2017 | September 1, 2016(a) | July 26, 2016 | ||||||||||
|
| |||||||||||
Net asset value, beginning of period | $ 9.46 | $ 9.44 | $ 9.36 | |||||||||
|
| |||||||||||
Income From Investment Operations |
| |||||||||||
Net investment income(c)(d) | .49 | .08 | # | .05 | ||||||||
Net realized and unrealized gain on investment and foreign currency transactions | .24 | .01 | .08 | † | ||||||||
Contributions from Affiliates | .00 | (e) | – 0 | – | – 0 | – | ||||||
|
| |||||||||||
Net increase in net asset value from operations | .73 | .09 | .13 | |||||||||
|
| |||||||||||
Less: Dividends |
| |||||||||||
Dividends from net investment income | (.43 | ) | (.07 | ) | (.05 | ) | ||||||
Tax return of capital | (.05 | ) | – 0 | – | – 0 | – | ||||||
|
| |||||||||||
Net asset value, end of period | $ 9.71 | $ 9.46 | $ 9.44 | |||||||||
|
| |||||||||||
Total Return |
| |||||||||||
Total investment return based on net asset value(f) | 7.89 | %*‡ | .94 | %‡# | 1.35 | % | ||||||
Ratios/Supplemental Data |
| |||||||||||
Net assets, end of period (000’s omitted) | $4,185 | $2,733 | $2,063 | |||||||||
Ratio to average net assets of: |
| |||||||||||
Expenses, net of waivers/reimbursements(g)(h) | .71 | % | .78 | %^ | .81 | %^ | ||||||
Expenses, before waivers/reimbursements(g)(h) | 2.49 | % | 3.18 | %^ | 2.41 | %^ | ||||||
Net investment income(d) | 5.11 | % | 4.90 | %^# | 5.30 | %^ | ||||||
Portfolio turnover rate | 65 | % | 9 | % | 44 | % | ||||||
See footnote summary on pages 107-108.
| 102 | AB HIGH YIELD PORTFOLIO | abfunds.com |
FINANCIAL HIGHLIGHTS (continued)
Selected Data For A Share Of Capital Stock Outstanding Throughout Each Period
| Class R | Class R | |||||||||||
| Year Ended October 31, 2017 | September 1, 2016(a) | July 26, 2016 | ||||||||||
|
| |||||||||||
Net asset value, beginning of period | $ 9.46 | $ 9.44 | $ 9.36 | |||||||||
|
| |||||||||||
Income From Investment Operations |
| |||||||||||
Net investment income(c)(d) | .45 | .07 | # | .04 | ||||||||
Net realized and unrealized gain on investment and foreign currency transactions | .23 | .01 | .08 | † | ||||||||
Contributions from Affiliates | .00 | (e) | – 0 | – | – 0 | – | ||||||
|
| |||||||||||
Net increase in net asset value from operations | .68 | .08 | .12 | |||||||||
|
| |||||||||||
Less: Dividends |
| |||||||||||
Dividends from net investment income | (.39 | ) | (.06 | ) | (.04 | ) | ||||||
Tax return of capital | (.04 | ) | – 0 | – | – 0 | – | ||||||
|
| |||||||||||
Net asset value, end of period | $ 9.71 | $ 9.46 | $ 9.44 | |||||||||
|
| |||||||||||
Total Return |
| |||||||||||
Total investment return based on net asset value(f) | 7.36 | %*‡ | .86 | %‡# | 1.30 | % | ||||||
Ratios/Supplemental Data |
| |||||||||||
Net assets, end of period (000’s omitted) | $34 | $31 | $30 | |||||||||
Ratio to average net assets of: |
| |||||||||||
Expenses, net of waivers/reimbursements(g)(h) | 1.21 | % | 1.28 | %^ | 1.30 | %^ | ||||||
Expenses, before waivers/reimbursements(g)(h) | 2.98 | % | 3.14 | %^ | 2.70 | %^ | ||||||
Net investment income(d) | 4.65 | % | 4.48 | %^# | 4.80 | %^ | ||||||
Portfolio turnover rate | 65 | % | 9 | % | 44 | % | ||||||
See footnote summary on pages 107-108.
| abfunds.com | AB HIGH YIELD PORTFOLIO | 103 |
FINANCIAL HIGHLIGHTS (continued)
Selected Data For A Share Of Capital Stock Outstanding Throughout Each Period
| Class K | ||||||||||||
Year Ended October 31, | September 1, 2016 to October 31, 2016(a) | July 26, 2016(b) August 31, 2016 | ||||||||||
|
| |||||||||||
Net asset value, beginning of period | $ 9.46 | $ 9.44 | $ 9.36 | |||||||||
|
| |||||||||||
Income From Investment Operations | ||||||||||||
Net investment income(c)(d) | .47 | .08 | # | .05 | ||||||||
Net realized and unrealized gain on investment and foreign currency transactions | .24 | .01 | .07 | † | ||||||||
Contributions from Affiliates | .00 | (e) | – 0 | – | – 0 | – | ||||||
|
| |||||||||||
Net increase in net asset value from operations | .71 | .09 | .12 | |||||||||
|
| |||||||||||
Less: Dividends | ||||||||||||
Dividends from net investment income | (.42 | ) | (.07 | ) | (.04 | ) | ||||||
Tax return of capital | (.04 | ) | – 0 | – | – 0 | – | ||||||
|
| |||||||||||
Net asset value, end of period | $ 9.71 | $ 9.46 | $ 9.44 | |||||||||
|
| |||||||||||
Total Return | ||||||||||||
Total investment return based on net asset value(f) | 7.61 | %*‡ | .91 | %‡# | 1.33 | % | ||||||
Ratios/Supplemental Data | ||||||||||||
Net assets, end of period (000’s omitted) | $10 | $9 | $9 | |||||||||
Ratio to average net assets of: | ||||||||||||
Expenses, net of waivers/reimbursements(g)(h) | .96 | % | 1.03 | %^ | 1.05 | %^ | ||||||
Expenses, before waivers/reimbursements(g)(h) | 2.41 | % | 2.67 | %^ | 2.38 | %^ | ||||||
Net investment income(d) | 4.87 | % | 4.74 | %^# | 5.12 | %^ | ||||||
Portfolio turnover rate | 65 | % | 9 | % | 44 | % | ||||||
See footnote summary on pages 107-108.
| 104 | AB HIGH YIELD PORTFOLIO | abfunds.com |
FINANCIAL HIGHLIGHTS (continued)
Selected Data For A Share Of Capital Stock Outstanding Throughout Each Period
| Class I | ||||||||||||
Year Ended October 31, | September 1, 2016 to October 31, 2016(a) | July 26, 2016(b) August 31, 2016 | ||||||||||
|
| |||||||||||
Net asset value, beginning of period | $ 9.46 | $ 9.44 | $ 9.36 | |||||||||
|
| |||||||||||
Income From Investment Operations | ||||||||||||
Net investment income(c)(d) | .50 | .08 | # | .05 | ||||||||
Net realized and unrealized gain on investment and foreign currency transactions | .23 | .01 | .08 | † | ||||||||
Contributions from Affiliates | .00 | (e) | – 0 | – | – 0 | – | ||||||
|
| |||||||||||
Net increase in net asset value from operations | .73 | .09 | .13 | |||||||||
|
| |||||||||||
Less: Dividends | ||||||||||||
Dividends from net investment income | (.43 | ) | (.07 | ) | (.05 | ) | ||||||
Tax return of capital | (.05 | ) | – 0 | – | – 0 | – | ||||||
|
| |||||||||||
Net asset value, end of period | $ 9.71 | $ 9.46 | $ 9.44 | |||||||||
|
| |||||||||||
Total Return | ||||||||||||
Total investment return based on net asset value(f) | 7.89 | %*‡ | .94 | %‡# | 1.35 | % | ||||||
Ratios/Supplemental Data | ||||||||||||
Net assets, end of period (000’s omitted) | $17,492 | $16,936 | $16,899 | |||||||||
Ratio to average net assets of: | ||||||||||||
Expenses, net of waivers/reimbursements(g)(h) | .71 | % | .78 | %^ | .81 | %^ | ||||||
Expenses, before waivers/reimbursements(g)(h) | 2.14 | % | 2.39 | %^ | 2.06 | %^ | ||||||
Net investment income(d) | 5.14 | % | 4.97 | %^# | 5.38 | %^ | ||||||
Portfolio turnover rate | 65 | % | 9 | % | 44 | % | ||||||
See footnote summary on pages 107-108.
| abfunds.com | AB HIGH YIELD PORTFOLIO | 105 |
FINANCIAL HIGHLIGHTS (continued)
Selected Data For A Share Of Capital Stock Outstanding Throughout Each Period
| Class Z | ||||||||||||||||||||||||
Year Ended 2017 | September 1, 2016(a) | Year Ended August 31, | ||||||||||||||||||||||
| 2016 | 2015(i) | 2014(i) | 2013(i) | |||||||||||||||||||||
|
| |||||||||||||||||||||||
Net asset value, beginning of period | $ 9.45 | $ 9.43 | $ 9.87 | $ 10.85 | $ 10.33 | $ 10.26 | ||||||||||||||||||
|
| |||||||||||||||||||||||
Income From Investment Operations | ||||||||||||||||||||||||
Net investment income(c) | .49 | (d) | .08 | (d)# | .60 | (d) | .67 | .72 | .75 | |||||||||||||||
Net realized and unrealized gain (loss) on investment and foreign currency transactions | .24 | .01 | (.04 | ) | (.91 | )† | .53 | † | .18 | † | ||||||||||||||
Contributions from Affiliates | .00 | (e) | – 0 | – | – 0 | – | – 0 | – | – 0 | – | – 0 | – | ||||||||||||
|
| |||||||||||||||||||||||
Net increase (decrease) in net asset value from operations | .73 | .09 | .56 | (.24 | ) | 1.25 | .93 | |||||||||||||||||
|
| |||||||||||||||||||||||
Less: Dividends |
| |||||||||||||||||||||||
Dividends from net investment income | (.43 | ) | (.07 | ) | (1.00 | ) | (.74 | ) | (.73 | ) | (.86 | ) | ||||||||||||
Tax return of capital | (.05 | ) | – 0 | – | – 0 | – | – 0 | – | – 0 | – | – 0 | – | ||||||||||||
|
| |||||||||||||||||||||||
Net asset value, end of period | $ 9.70 | $ 9.45 | $ 9.43 | $ 9.87 | $ 10.85 | $ 10.33 | ||||||||||||||||||
|
| |||||||||||||||||||||||
Total Return |
| |||||||||||||||||||||||
Total investment return based on net asset value(f) | 7.91 | %*‡ | .94 | %‡# | 6.19 | %* | (2.27 | )%* | 12.44 | % | 9.24 | % | ||||||||||||
Ratios/Supplemental Data | ||||||||||||||||||||||||
Net assets, end of period (000’s omitted) | $499 | $65,177 | $67,780 | $322,839 | $364,934 | $366,553 | ||||||||||||||||||
Ratio to average net assets of: |
| |||||||||||||||||||||||
Expenses, net of waivers/reimbursements(g)(h) | .73 | % | .78 | %^ | .25 | % | .13 | % | .11 | % | .09 | % | ||||||||||||
Expenses, before waivers/reimbursements(g)(h) | 1.41 | % | 2.39 | %^ | .30 | % | .13 | % | .11 | % | .09 | % | ||||||||||||
Net investment income | 5.12 | % | 4.96 | %(d)^# | 6.41 | %(d) | 6.45 | % | 6.68 | % | 7.15 | % | ||||||||||||
Portfolio turnover rate | 65 | % | 9 | % | 44 | % | 51 | % | 54 | % | 63 | % | ||||||||||||
See footnote summary on pages 107-108.
| 106 | AB HIGH YIELD PORTFOLIO | abfunds.com |
FINANCIAL HIGHLIGHTS (continued)
Selected Data For A Share Of Capital Stock Outstanding Throughout Each Period
| (a) | The Portfolio changed its fiscal year end from August 31 to October 31. |
| (b) | Inception date. |
| (c) | Based on average shares outstanding. |
| (d) | Net of fees and expenses waived and reimbursed by the Adviser. |
| (e) | Amount is less than $.005. |
| (f) | Total investment return is calculated assuming an initial investment made at the net asset value at the beginning of the period, reinvestment of all dividends and distributions at net asset value during the period, and redemption on the last day of the period. Initial sales charges or contingent deferred sales charges are not reflected in the calculation of total investment return. Total return does not reflect the deduction of taxes that a shareholder would pay on fund distributions or the redemption of fund shares. Total investment return calculated for a period of less than one year is not annualized. |
| (g) | The expense ratios presented below exclude interest expense: |
| Year Ended October 31, 2017 | September 1, 2016 to October 31, 2016(a) | Year Ended August 31, | ||||||||||||||||||||||
| 2016 | 2015 | 2014 | 2013 | |||||||||||||||||||||
Class A | ||||||||||||||||||||||||
Net of waivers/reimbursements | .95 | % | N/A | 1.05 | % | |||||||||||||||||||
Before waivers/reimbursements | 2.69 | % | N/A | 2.70 | % | |||||||||||||||||||
Class C | ||||||||||||||||||||||||
Net of waivers/reimbursements | 1.70 | % | N/A | 1.80 | % | |||||||||||||||||||
Before waivers/reimbursements | 3.49 | % | N/A | 3.46 | % | |||||||||||||||||||
Advisor Class | ||||||||||||||||||||||||
Net of waivers/reimbursements | .70 | % | N/A | .80 | % | |||||||||||||||||||
Before waivers/reimbursements | 2.54 | % | N/A | 2.40 | % | |||||||||||||||||||
Class R | ||||||||||||||||||||||||
Net of waivers/reimbursements | 1.20 | % | N/A | 1.30 | % | |||||||||||||||||||
Before waivers/reimbursements | 3.03 | % | N/A | 2.70 | % | |||||||||||||||||||
Class K | ||||||||||||||||||||||||
Net of waivers/reimbursements | .96 | % | N/A | 1.05 | % | |||||||||||||||||||
Before waivers/reimbursements | 2.47 | % | N/A | 2.38 | % | |||||||||||||||||||
Class I | ||||||||||||||||||||||||
Net of waivers/reimbursements | �� | .71 | % | N/A | .80 | % | ||||||||||||||||||
Before waivers/reimbursements | 2.19 | % | N/A | 2.06 | % | |||||||||||||||||||
Class Z | ||||||||||||||||||||||||
Net of waivers/reimbursements | .73 | % | N/A | .25 | % | N/A | N/A | .09 | % | |||||||||||||||
Before waivers/reimbursements | 1.47 | % | N/A | .29 | % | N/A | N/A | .09 | % | |||||||||||||||
| (h) | In connection with the Portfolio’s investments in affiliated underlying portfolios, the Portfolio incurs no direct expenses, but bear proportionate shares of the fees and expenses (i.e., operating, administrative and investment advisory fees) of the affiliated underlying portfolios. The Adviser has contractually agreed to waive its fees from the Portfolio in an amount equal to the Portfolio’s pro rata share of certain acquired fund fees and expenses, and for the year ended October 31, 2017 and year ended October 31, 2016, such waiver amounted to 0.01% and 0.02%, respectively, annualized for the Portfolio. |
| (i) | On the date of Reorganization, the accounting and performance history of the Accounting Survivor was retained as that of the Portfolio (see Note A). As a result, the per share table has been adjusted for the prior periods presented to reflect the transaction. The conversion ratio used was 1.00489316, as the Accounting Survivor’s NAV was $9.4058 while the Portfolio’s NAV was $9.36 on the date of Reorganization. |
| abfunds.com | AB HIGH YIELD PORTFOLIO | 107 |
FINANCIAL HIGHLIGHTS (continued)
Selected Data For A Share Of Capital Stock Outstanding Throughout Each Period
| † | Due to timing of sales and repurchase of capital shares, the net realized and unrealized gain (loss) per share is not in accord with the Portfolio’s change in net realized and unrealized gain (loss) on investment transactions for the period. |
| ^ | Annualized. |
| * | Includes the impact of proceeds received and credited to the Portfolio resulting from class action settlements, which enhanced the Portfolio’s performance for the years ended October 31, 2017, August 31, 2016 and August 31, 2015 by 0.07%, 0.02% and 0.09%, respectively. |
| ‡ | The net asset value and total return include adjustments in accordance with accounting principles generally accepted in the United States of America for financial reporting purposes. As such, the net asset value and total return for shareholder transactions may differ from financial statements. |
| # | For the year ended October 31, 2016 the amount includes a refund for overbilling of prior years’ custody out of pocket fees as follows: |
| Net Investment Income Per Share | Net Investment Income Ratio | Total Return | ||
$.003 | .20% | .03% |
See notes to financial statements.
| 108 | AB HIGH YIELD PORTFOLIO | abfunds.com |
REPORT OF INDEPENDENT REGISTERED
PUBLIC ACCOUNTING FIRM
To the Board of Directors and Shareholders of AB High Yield Portfolio
We have audited the accompanying statement of assets and liabilities, including the portfolio of investments, of AB High Yield Portfolio (the “Portfolio”), one of the portfolios constituting the AB Bond Fund, Inc., as of October 31, 2017, and the related statements of operations for the year then ended, the statements of changes in net assets for the year then ended and the period September 1, 2016 to October 31, 2016 and the year ended August 31, 2016, and the financial highlights for each of the periods indicated therein. These financial statements and financial highlights are the responsibility of the Portfolio’s management. Our responsibility is to express an opinion on these financial statements and financial highlights based on our audits.
We conducted our audits in accordance with the standards of the Public Company Accounting Oversight Board (United States). Those standards require that we plan and perform the audit to obtain reasonable assurance about whether the financial statements and financial highlights are free of material misstatement. We were not engaged to perform an audit of the Portfolio’s internal control over financial reporting. Our audits included consideration of internal control over financial reporting as a basis for designing audit procedures that are appropriate in the circumstances, but not for the purpose of expressing an opinion on the effectiveness of the Portfolio’s internal control over financial reporting. Accordingly, we express no such opinion. An audit also includes examining, on a test basis, evidence supporting the amounts and disclosures in the financial statements and financial highlights, assessing the accounting principles used and significant estimates made by management, and evaluating the overall financial statement presentation. Our procedures included confirmation of securities owned as of October 31, 2017, by correspondence with the custodian and others or by other appropriate auditing procedures where replies from others were not received. We believe that our audits provide a reasonable basis for our opinion.
In our opinion, the financial statements and financial highlights referred to above present fairly, in all material respects, the financial position of AB High Yield Portfolio, one of the portfolios constituting the AB Bond Fund, Inc., at October 31, 2017, and the results of its operations for the year then ended, the changes in its net assets for the year then ended and the period September 1, 2016 to October 31, 2016 and the year ended August 31,2016 and the financial highlights for each of the periods indicated therein, in conformity with U.S. generally accepted accounting principles.

New York, New York
December 29, 2017
| abfunds.com | AB HIGH YIELD PORTFOLIO | 109 |
2017 FEDERAL TAX INFORMATION
(unaudited)
For Federal income tax purposes, the following information is furnished with respect to the distributions paid by the Portfolio during the taxable year ended October 31, 2017. For corporate shareholders, 1.18% of dividends paid qualify for the dividends received deduction. For foreign shareholders, 75.45% of ordinary income dividends paid may be considered to be qualifying to be taxed as interest-related dividends.
For the taxable year ended October 31, 2017, the Portfolio designates 1.27% as the maximum amount that may be considered qualified dividend income for individual shareholders.
Shareholders should not use the above information to prepare their income tax returns. The information necessary to complete your income tax returns will be included with your Form 1099-DIV which will be sent to you separately in January 2018.
| 110 | AB HIGH YIELD PORTFOLIO | abfunds.com |
BOARD OF DIRECTORS
Marshall C. Turner, Jr.(1) , Chairman John H. Dobkin(1)(2) Michael J. Downey(1) William H. Foulk, Jr.(1) D. James Guzy(1) (2) | Nancy P. Jacklin(1) Robert M. Keith, President and Chief Executive Officer Carol C. McMullen(1) Garry L. Moody(1) Earl D. Weiner(1) |
OFFICERS
Philip L. Kirstein,(3) Senior Vice President and Independent Compliance Officer Gershon M. Distenfeld(4), Vice President Ivan Rudolph-Shabinsky(4) , Vice President | Ashish C. Shah(4), Vice President Joseph J. Mantineo, Treasurer and Chief Financial Officer Emilie D. Wrapp, Secretary Stephen M. Woetzel, Controller Vincent S. Noto, Chief Compliance Officer |
Custodian and Accounting Agent Brown Brothers Harriman & Co. 50 Post Office Square Boston, MA 02110
Principal Underwriter AllianceBernstein Investments, Inc. 1345 Avenue of the Americas New York, NY 10105
Transfer Agent AllianceBernstein Investor Services, Inc. P.O. Box 786003 San Antonio, TX 78278-6003 Toll-Free (800) 221-5672 | Independent Registered Public Accounting Firm Ernst & Young LLP 5 Times Square New York, NY 10036
Legal Counsel Seward & Kissel LLP One Battery Park Plaza New York, NY 10004 |
| 1 | Member of the Audit Committee, the Governance and Nominating Committee and the Independent Directors Committee. |
| 2 | Messrs. Dobkin and Guzy are expected to retire on or about December 31, 2017. |
| 3 | Mr. Kirstein is expected to retire on or about December 31, 2017. |
| 4 | The day-to-day management of, and investment decisions for, the Fund are made by the High Yield Investment Team. Messrs. Distenfeld, Rudolph-Shabinksy and Shah are the investment professionals with the most significant responsibility for the day-to-day management of the Fund’s portfolio. |
| abfunds.com | AB HIGH YIELD PORTFOLIO | 111 |
MANAGEMENT OF THE FUND
NAME, ADDRESS*, AGE, (YEAR FIRST ELECTED**) | PRINCIPAL OCCUPATION(S) DURING PAST FIVE YEARS AND OTHER INFORMATION*** | PORTFOLIOS IN FUND COMPLEX OVERSEEN BY DIRECTOR | OTHER PUBLIC DIRECTORSHIP CURRENTLY HELD BY DIRECTOR | |||||
| INTERESTED DIRECTOR | ||||||||
Robert M. Keith,+ 1345 Avenue of the Americas New York, NY 10105 57 (2014) | Senior Vice President of AllianceBernstein L.P. (the “Adviser”) and the head of AllianceBernstein Investments, Inc. (“ABI”) since July 2008; Director of ABI and President of the AB Mutual Funds. Previously, he served as Executive Managing Director of ABI from December 2006 to June 2008. Prior to joining ABI in 2006, Executive Managing Director of Bernstein Global Wealth Management, and prior thereto, Senior Managing Director and Global Head of Client Service and Sales of the Adviser’s institutional investment management business since 2004. Prior thereto, he was Managing Director and Head of North American Client Service and Sales in the Adviser’s institutional investment management business, with which he had been associated since prior to 2004. | 96 | None | |||||
| 112 | AB HIGH YIELD PORTFOLIO | abfunds.com |
MANAGEMENT OF THE FUND (continued)
NAME, ADDRESS*, AGE, (YEAR FIRST ELECTED**) | PRINCIPAL OCCUPATION(S) DURING PAST FIVE YEARS AND OTHER | PORTFOLIOS IN FUND COMPLEX OVERSEEN BY DIRECTOR | OTHER PUBLIC DIRECTORSHIP CURRENTLY HELD BY DIRECTOR | |||||
| DISINTERESTED DIRECTORS | ||||||||
Marshall C. Turner, Jr.# Chairman of the Board 76 (2014) | Private Investor since prior to 2012. Former Chairman and CEO of Dupont Photomasks, Inc. (components of semi-conductor manufacturing). He has extensive operating leadership and venture capital investing experience, including five interim or full-time CEO roles, and prior service as general partner of institutional venture capital partnerships. He also has extensive non-profit board leadership experience, and currently serves on the boards of two education and science-related non-profit organizations. He has served as a director of one AB Fund since 1992, and director or trustee of multiple AB Funds since 2005. He has been Chairman of the AB Funds since January 2014, and the Chairman of the Independent Directors Committees of such AB Funds since February 2014. | 96 | Xilinx, Inc. (programmable logic semi- conductors) since 2007 | |||||
John H. Dobkin,#,## 75 (2014) | Independent Consultant since prior to 2012. Formerly, President of Save Venice, Inc. (preservation organization) from 2001–2002; Senior Advisor from June 1999-June 2000 and President of Historic Hudson Valley (historic preservation) from December 1989-May 1999. Previously, Director of the National Academy of Design. He has served as a director or trustee of various AB Funds since 1992, and as Chairman of the Audit Committees of a number of such AB Funds from 2001-2008. | 95 | None | |||||
| abfunds.com | AB HIGH YIELD PORTFOLIO | 113 |
MANAGEMENT OF THE FUND (continued)
NAME, ADDRESS*, AGE, (YEAR FIRST ELECTED**) | PRINCIPAL OCCUPATION(S) DURING PAST FIVE YEARS AND OTHER | PORTFOLIOS IN FUND COMPLEX OVERSEEN BY DIRECTOR | OTHER PUBLIC DIRECTORSHIP CURRENTLY DIRECTOR | |||||
| DISINTERESTED DIRECTORS (continued) | ||||||||
Michael J. Downey,# 73 (2014) | Private Investor since prior to 2012. Formerly, managing partner of Lexington Capital, LLC (investment advisory firm) from December 1997 until December 2003. He served as a Director of Prospect Acquisition Corp. (financial services) from 2007 until 2009. From 1987 until 1993, Chairman and CEO of Prudential Mutual Fund Management, director of the Prudential mutual funds, and member of the Executive Committee of Prudential Securities Inc. He has served as a director or trustee of the AB Funds since 2005 and is a director and Chairman of one other registered investment company. | 96 | The Asia Pacific Fund, Inc. (registered investment company) since prior to 2012 | |||||
William H. Foulk, Jr.,# 85 (2014) | Investment Adviser and an Independent Consultant since prior to 2012. Previously, he was Senior Manager of Barrett Associates, Inc., a registered investment adviser. He was formerly Deputy Comptroller and Chief Investment Officer of the State of New York and, prior thereto, Chief Investment Officer of the New York Bank for Savings. He has served as a director or trustee of various AB Funds since 1983, and was Chairman of the Independent Directors Committees of the AB Funds from 2003 until early February 2014. He served as Chairman of such AB Funds from 2003 through December 2013. He is also active in a number of mutual fund related organizations and committees. | 96 | None | |||||
| 114 | AB HIGH YIELD PORTFOLIO | abfunds.com |
MANAGEMENT OF THE FUND (continued)
NAME, ADDRESS*, AGE, (YEAR FIRST ELECTED**) | PRINCIPAL OCCUPATION(S) DURING PAST FIVE YEARS AND OTHER | PORTFOLIOS IN FUND COMPLEX OVERSEEN BY DIRECTOR | OTHER PUBLIC DIRECTORSHIP CURRENTLY HELD BY DIRECTOR | |||||
| DISINTERESTED DIRECTORS (continued) | ||||||||
D. James Guzy,#,## 81 (2014) | Chairman of the Board of SRC Computers, Inc. (semi-conductors), with which he has been associated since prior to 2012. He served as Chairman of the Board of PLX Technology (semi-conductors) since prior to 2012 until November 2013. He was a director of Intel Corporation (semi-conductors) from 1969 until 2008, and served as Chairman of the Finance Committee of such company for several years until May 2008. He has served as a director or trustee of one or more of the AB Funds since 1982. | 93 | None | |||||
Nancy P. Jacklin,# 69 (2014) | Private Investor since prior to 2012. Professorial Lecturer at the Johns Hopkins School of Advanced International Studies (2008-2015). U.S. Executive Director of the International Monetary Fund (which is responsible for ensuring the stability of the international monetary system), (December 2002-May 2006); Partner, Clifford Chance (1992-2002); Sector Counsel, International Banking and Finance, and Associate General Counsel, Citicorp (1985-1992); Assistant General Counsel (International), Federal Reserve Board of Governors (1982-1985); and Attorney Advisor, U.S. Department of the Treasury (1973-1982). Member of the Bar of the District of Columbia and of New York; and member of the Council on Foreign Relations. She has served as a director or trustee of the AB Funds since 2006 and has been Chairman of the Governance and Nominating Committees of the AB Funds since August 2014. | 96 | None | |||||
| abfunds.com | AB HIGH YIELD PORTFOLIO | 115 |
MANAGEMENT OF THE FUND (continued)
NAME, ADDRESS*, AGE, (YEAR FIRST ELECTED**) | PRINCIPAL OCCUPATION(S) DURING PAST FIVE YEARS AND OTHER | PORTFOLIOS IN FUND COMPLEX OVERSEEN BY DIRECTOR | OTHER PUBLIC DIRECTORSHIP CURRENTLY HELD BY DIRECTOR | |||||
| DISINTERESTED DIRECTORS (continued) | ||||||||
Carol C. McMullen,# 62 (2016) | Managing Director of Slalom Consulting (consulting) since 2014 and private investor; and member of the Partners Healthcare Investment Committee. Formerly, Director of Norfolk & Dedham Group (mutual property and casualty insurance) from 2011until November 2016; Director of Partners Community Physicians Organization (healthcare) from 2014 until December 2016; and Managing Director of The Crossland Group (consulting) from 2012 to 2013. She has held a number of senior positions in the asset and wealth management industries, including at Eastern Bank (where her roles included President of Eastern Wealth Management), Thomson Financial (Global Head of Sales for Investment Management), and Putnam Investments (where her roles included Head of Global Investment Research). She has served on a number of private company and nonprofit boards, and as a director or trustee of the AB Funds since June 2016. | 96 | None | |||||
| 116 | AB HIGH YIELD PORTFOLIO | abfunds.com |
MANAGEMENT OF THE FUND (continued)
NAME, ADDRESS*, AGE, (YEAR FIRST ELECTED**) | PRINCIPAL OCCUPATION(S) DURING PAST FIVE YEARS AND OTHER INFORMATION*** | PORTFOLIOS IN FUND COMPLEX OVERSEEN BY DIRECTOR | OTHER PUBLIC DIRECTORSHIP CURRENTLY HELD BY DIRECTOR | |||||
| DISINTERESTED DIRECTORS (continued) | ||||||||
Garry L. Moody,# 65 (2014) | Independent Consultant. Formerly, Partner, Deloitte & Touche LLP (1995-2008) where he held a number of senior positions, including Vice Chairman, and U.S. and Global Investment Management Practice Managing Partner; President, Fidelity Accounting and Custody Services Company (1993-1995) where he was responsible for accounting, pricing, custody and reporting for the Fidelity mutual funds; and Partner, Ernst & Young LLP (1975-1993), where he served as the National Director of Mutual Fund Tax Services and Managing Partner of its Chicago Office Tax department. He is a member of the Trustee Advisory Board of BoardIQ, a biweekly publication focused on issues and news affecting directors of mutual funds. He has served as a director or trustee, and as Chairman of the Audit Committees, of the AB Funds since 2008. | 96 | None | |||||
Earl D. Weiner,# 78 (2014) | Of Counsel, and Partner prior to January 2007, of the law firm Sullivan & Cromwell LLP and is a former member of the ABA Federal Regulation of Securities Committee Task Force to draft editions of the Fund Director’s Guidebook. He also serves as a director or trustee of various non-profit organizations and has served as Chairman or Vice Chairman of a number of them. He has served as a director or trustee of the AB Funds since 2007 and served as Chairman of the Governance and Nominating Committees of the AB Funds from 2007 until August 2014. | 96 | None | |||||
| abfunds.com | AB HIGH YIELD PORTFOLIO | 117 |
MANAGEMENT OF THE FUND (continued)
| * | The address for each of the Fund’s disinterested Directors is c/o AllianceBernstein L.P., Attention: Office of the Senior Officer, 1345 Avenue of the Americas, New York, NY 10105. |
| ** | There is no stated term of office for the Fund’s Directors. |
| *** | The information above includes each Director’s principal occupation during the last five years and other information relating to the experience, attributes and skills relevant to each Director’s qualifications to serve as a Director, which led to the conclusion that each Director should serve as a Director for the Fund. |
| + | Mr. Keith is an “interested person” of the Portfolio as defined in the Investment Company Act of 1940, due to his position as a Senior Vice President of the Adviser. |
| # | Member of the Audit Committee, the Governance and Nominating Committee and the Independent Directors Committee. |
| ## | Messrs. Dobkin and Guzy are expected to retire on or about December 31, 2017. |
| 118 | AB HIGH YIELD PORTFOLIO | abfunds.com |
MANAGEMENT OF THE FUND (continued)
Officer Information
Certain information concerning the Fund’s Officers is listed below.
| NAME, ADDRESS*, AND AGE | POSITION(S) HELD WITH FUND | PRINCIPAL OCCUPATION DURING PAST 5 YEARS | ||
Robert M. Keith 57 | President and Chief Executive Officer | See biography above. | ||
Philip L. Kirstein# 72 | Senior Vice President and Independent Compliance Officer | Senior Vice President and Independent Compliance Officer of the AB Funds, with which he has been associated since October 2004. Prior thereto, he was Of Counsel to Kirkpatrick & Lockhart, LLP from October 2003 to October 2004, and General Counsel of Merrill Lynch Investment Managers, L.P. since prior to March 2003. | ||
Gershon M. Distenfeld 42 | Vice President | Senior Vice President of the Adviser**, with which he has been associated since prior to 2011. | ||
Ivan Rudolph-Shabinsky 53 | Vice President | Senior Vice President of the Adviser**, with which he has been associated since prior to 2012. | ||
Ashish C. Shah 47 | Vice President | Senior Vice President of the Adviser**, with which he has been associated since prior to 2012. | ||
Emilie D. Wrapp 67 | Secretary | Senior Vice President, Assistant General Counsel and Assistant Secretary of ABI**, with which she has been associated since prior to 2012. | ||
Joseph J. Mantineo 58 | Treasurer and Chief Financial Officer | Senior Vice President of ABIS**, with which he has been associated since prior to 2012. | ||
Vincent S. Noto 53 | Chief Compliance Officer | Senior Vice President since 2015 and Mutual Fund Chief Compliance Officer of the Adviser** since 2014. Prior thereto, he was Vice President and Director of Mutual Fund Compliance of the Adviser** since prior to 2012. | ||
Stephen M. Woetzel 46 | Controller | Vice President of ABIS**, with which he has been associated since prior to 2012. |
| * | The address for each of the Fund’s officers is 1345 Avenue of the Americas, New York, NY 10105. |
| ** | The Adviser, ABI and ABIS are affiliates of the Fund. |
| # | Mr. Kirstein is expected to retire on or about December 31, 2017. |
The Fund’s statement of Additional Information (“SAI”) has additional information about the Fund’s Directors and Officers and is available without charge upon request. Contact your financial representative or AB 1-(800)227-4618, or visit www.abfunds.com for a free prospectus or SAI.
| abfunds.com | AB HIGH YIELD PORTFOLIO | 119 |
Information Regarding the Review and Approval of the Fund’s Advisory Agreement
The disinterested directors (the “directors”) of AB Bond Fund, Inc. (the “Company”) unanimously approved the continuance of the Company’s Advisory Agreement with the Adviser, as proposed to be amended (the “Advisory Agreement”) to effect a fee reduction, in respect of AB High Yield Portfolio (the “Portfolio”) at a meeting held on November 1-3, 2016 (the “Meeting”).
Prior to approval of the continuance of the Advisory Agreement, the directors had requested from the Adviser, and received and evaluated, extensive materials. They reviewed the proposed continuance of the Advisory Agreement with the Adviser and with experienced counsel who are independent of the Adviser, who advised on the relevant legal standards. The directors also reviewed an independent evaluation prepared by the Company’s Senior Officer (who is also the Company’s Independent Compliance Officer) of the reasonableness of the proposed advisory fee, in which the Senior Officer concluded that the proposed contractual fee for the Fund was reasonable. The directors also discussed the proposed continuance in private sessions with counsel and the Company’s Senior Officer.
The directors considered their knowledge of the nature and quality of the services provided by the Adviser to the Fund gained from their experience as directors or trustees of most of the registered investment companies advised by the Adviser, their overall confidence in the Adviser’s integrity and competence they have gained from that experience, the Adviser’s initiative in identifying and raising potential issues with the directors and its responsiveness, frankness and attention to concerns raised by the directors in the past, including the Adviser’s willingness to consider and implement organizational and operational changes designed to improve investment results and the services provided to the AB Funds. The directors noted that they have four regular meetings each year, at each of which they receive presentations from the Adviser on the investment results of the Fund and review extensive materials and information presented by the Adviser.
The directors also considered all other factors they believed relevant, including the specific matters discussed below. In their deliberations, the directors did not identify any particular information that was all-important or controlling, and different directors may have attributed different weights to the various factors. The directors determined that the selection of the Adviser to manage the Fund and the overall arrangements between the Fund and the Adviser, as provided in the Advisory Agreement, including the proposed advisory fee, were fair and reasonable in light of the services performed, expenses incurred and such other matters as the directors considered relevant in the exercise of their business judgment. The material
| 120 | AB HIGH YIELD PORTFOLIO | abfunds.com |
factors and conclusions that formed the basis for the directors’ determinations included the following:
Nature, Extent and Quality of Services Provided
The directors considered the scope and quality of services provided by the Adviser under the Advisory Agreement, including the quality of the investment research capabilities of the Adviser and the other resources it has dedicated to performing services for the Fund. They also noted the professional experience and qualifications of the Fund’s portfolio management team and other senior personnel of the Adviser. The directors also considered that the Advisory Agreement provides that the Fund will reimburse the Adviser for the cost to it of providing certain clerical, accounting, administrative and other services to the Fund by employees of the Adviser or its affiliates. Requests for these reimbursements are made on a quarterly basis and subject to approval by the directors. Reimbursements, to the extent requested and paid, result in a higher rate of total compensation from the Fund to the Adviser than the fee rate stated in the Advisory Agreement. The directors noted that the methodology used to determine the reimbursement amounts had been reviewed by an independent consultant retained by the Company’s Senior Officer. The quality of administrative and other services, including the Adviser’s role in coordinating the activities of the Fund’s other service providers, also was considered. The directors concluded that, overall, they were satisfied with the nature, extent and quality of services provided to the Fund under the Advisory Agreement.
Costs of Services Provided and Profitability
The directors reviewed a schedule of the revenues and expenses and related notes indicating the profitability of the Fund to the Adviser for calendar years 2014 and 2015 that had been prepared with an expense allocation methodology arrived at in consultation with an independent consultant retained by the Company’s Senior Officer. The directors noted the assumptions and methods of allocation used by the Adviser in preparing fund-specific profitability data and understood that there are a number of potentially acceptable allocation methodologies for information of this type. The directors noted that the profitability information reflected all revenues and expenses of the Adviser’s relationship with the Fund, including those relating to its subsidiaries that provide transfer agency and distribution services to the Fund, and that the proposed reduction in the advisory fee rate would likely impact the Adviser’s profitability analysis in future years. The directors recognized that it is difficult to make comparisons of the profitability of the Advisory Agreement with the profitability of fund advisory contracts for unaffiliated funds because comparative information is not generally publicly available and is affected by numerous factors. The directors focused on the profitability of the Adviser’s relationship with the Fund before taxes and distribution expenses. The directors noted that the Fund was not profitable to the Adviser in the periods reviewed.
| abfunds.com | AB HIGH YIELD PORTFOLIO | 121 |
Fall-Out Benefits
The directors considered the other benefits to the Adviser and its affiliates from their relationships with the Fund, including, but not limited to, benefits relating to 12b-1 fees and sales charges received by the Fund’s principal underwriter (which is a wholly owned subsidiary of the Adviser) in respect of certain classes of the Fund’s shares; and transfer agency fees paid by the Fund to a wholly owned subsidiary of the Adviser. The directors recognized that the Fund’s unprofitability to the Adviser would be exacerbated without these benefits. The directors understood that the Adviser also might derive reputational and other benefits from its association with the Fund.
Investment Results
In addition to the information reviewed by the directors in connection with the Meeting, the directors receive detailed performance information for the Fund at each regular Board meeting during the year.
At the Meeting, the directors reviewed information prepared by Broadridge Financial Solutions, Inc. (“Broadridge”), an analytical service that is not affiliated with the Adviser, showing the performance of the Class A Shares of the Fund against a peer group and a peer universe selected by Broadridge, and information prepared by the Adviser showing performance of the Class A Shares against a broad-based securities market index, in each case for the 1-, 3-, 5- and 10-year periods ended July 31, 2016 and (in the case of comparisons with the broad-based securities market index) for the period from inception. Based on their review, and their discussion with the Adviser of the reasons for the Fund’s underperformance in certain periods, the directors concluded that the Fund’s investment performance was acceptable.
Advisory Fees and Other Expenses
The directors considered the proposed advisory fee rate payable by the Fund to the Adviser and information prepared by Broadridge concerning advisory fee rates paid by other funds in the same Broadridge category as the Fund at a common asset level. The directors recognized that it is difficult to make comparisons of advisory fees because there are variations in the services that are included in the fees paid by other funds. The directors compared the Fund’s pro forma contractual effective advisory fee rate (reflecting a reduction in the advisory fee rate effective January 1, 2017) with a peer group median.
The directors also considered the Adviser’s fee schedule for institutional clients pursuing a similar investment style. For this purpose, they reviewed the relevant advisory fee information from the Adviser’s Form ADV and the evaluation from the Company’s Senior Officer and noted the differences between the Fund’s fee schedule, on the one hand, and the institutional fee schedule and the schedule of fees charged to any offshore funds and
| 122 | AB HIGH YIELD PORTFOLIO | abfunds.com |
any sub-advised funds, on the other. The directors noted that the Adviser may, in some cases, agree to fee rates with large institutional clients that are lower than those reviewed by the directors and that they had previously discussed with the Adviser its policies in respect of such arrangements.
The Adviser reviewed with the directors the significantly greater scope of the services it provides to the Fund relative to institutional, offshore fund and sub-advised fund clients. In light of the substantial differences in services rendered by the Adviser to institutional, offshore fund and sub-advised fund clients as compared to funds such as the Fund, the directors considered these fee comparisons inapt and did not place significant weight on them in their deliberations.
The directors noted that the Fund invests in shares of exchange-traded funds (“ETFs”), subject to the restrictions and limitations of the Investment Company Act of 1940 as these may be varied as a result of exemptive orders issued by the SEC. The directors also noted that ETFs pay advisory fees pursuant to their advisory contracts, and that the Adviser had provided, and they had reviewed, information about the expense ratios of the relevant ETFs. The directors concluded, based on the Adviser’s explanation of how it uses ETFs when they are the most cost-effective way to obtain desired exposures for a fund or to temporarily “equitize” cash inflows pending purchases of underlying securities, that the proposed advisory fee for the Fund is for services in addition to, rather than duplicative of, the services provided under the advisory contracts of the ETFs in which the Fund may invest.
The directors also considered the total expense ratio of the Class A shares of the Fund in comparison to a peer group and a peer universe selected by Broadridge. The Class A expense ratio of the Fund was based on the Fund’s latest fiscal year and the information included the pro forma expense ratio to reflect a reduction in the expense cap level by the Adviser effective January 1, 2017. The directors noted the effects of any fee waivers and/or expense reimbursements as a result of an undertaking by the Adviser. The directors noted that it was likely that the expense ratios of some of the other funds in the Fund’s Broadridge category were lowered by waivers or reimbursements by those funds’ investment advisers, which in some cases might be voluntary or temporary. The directors view expense ratio information as relevant to their evaluation of the Adviser’s services because the Adviser is responsible for coordinating services provided to the Fund by others. Based on their review, the directors concluded that the Fund’s pro forma expense ratio was acceptable.
Economies of Scale
The directors noted that the proposed advisory fee schedule for the Fund contains breakpoints that reduce the fee rates on assets above specified levels. The directors took into consideration prior presentations by an
| abfunds.com | AB HIGH YIELD PORTFOLIO | 123 |
independent consultant on economies of scale in the mutual fund industry and for the AB Funds, and by the Adviser concerning certain of its views on economies of scale. The directors also had requested and received from the Adviser certain updates on economies of scale in advance of the Meeting. The directors believe that economies of scale may be realized (if at all) by the Adviser across a variety of products and services, and not only in respect of a single fund. The directors noted that there is no established methodology for setting breakpoints that give effect to the fund-specific services provided by a fund’s adviser and to the economies of scale that an adviser may realize in its overall mutual fund business or those components of it which directly or indirectly affect a fund’s operations. The directors observed that in the mutual fund industry as a whole, as well as among funds similar to the Fund, there is no uniformity or pattern in the fees and asset levels at which breakpoints (if any) apply. The directors also noted that the advisory agreements for many funds do not have breakpoints at all. Having taken these factors into account, the directors concluded that the Fund’s shareholders would benefit from a sharing of economies of scale in the event the Fund’s net assets exceed a breakpoint in the future.
| 124 | AB HIGH YIELD PORTFOLIO | abfunds.com |
This page is not part of the Shareholder Report or the Financial Statements.
AB FAMILY OF FUNDS
US EQUITY
US CORE
Core Opportunities Fund
FlexFee™ US Thematic Portfolio
Select US Equity Portfolio
US GROWTH
Concentrated Growth Fund
Discovery Growth Fund
FlexFee™ Large Cap Growth Portfolio
Growth Fund
Large Cap Growth Fund
Small Cap Growth Portfolio
US VALUE
Discovery Value Fund
Equity Income Fund
Relative Value Fund1
Small Cap Value Portfolio
Value Fund
INTERNATIONAL/ GLOBAL EQUITY
INTERNATIONAL/ GLOBAL CORE
Global Core Equity Portfolio
International Portfolio
International Strategic Core Portfolio
Sustainable Global Thematic Fund1
Tax-Managed International Portfolio
Tax-Managed Wealth Appreciation Strategy
Wealth Appreciation Strategy
INTERNATIONAL/ GLOBAL GROWTH
Concentrated International Growth Portfolio
International Growth Fund
INTERNATIONAL/ GLOBAL EQUITY (continued)
INTERNATIONAL/ GLOBAL VALUE
Asia ex-Japan Equity Portfolio
International Value Fund
FIXED INCOME
MUNICIPAL
High Income Municipal Portfolio
Intermediate California Municipal Portfolio
Intermediate Diversified Municipal Portfolio
Intermediate New York Municipal Portfolio
Municipal Bond Inflation Strategy
Tax-Aware Fixed Income Portfolio
National Portfolio
Arizona Portfolio
California Portfolio
Massachusetts Portfolio
Minnesota Portfolio
New Jersey Portfolio
New York Portfolio
Ohio Portfolio
Pennsylvania Portfolio
Virginia Portfolio
TAXABLE
Bond Inflation Strategy
FlexFee™ International Bond Portfolio
Global Bond Fund
High Income Fund
High Yield Portfolio
Income Fund
Intermediate Bond Portfolio
Limited Duration High Income Portfolio
Short Duration Portfolio
ALTERNATIVES
All Market Real Return Portfolio
Credit Long/Short Portfolio
Global Real Estate Investment Fund
Select US Long/Short Portfolio
Unconstrained Bond Fund
MULTI-ASSET
All Market Income Portfolio
All Market Total Return Portfolio1
Conservative Wealth Strategy
Emerging Markets Multi-Asset Portfolio
Global Risk Allocation Fund
Tax-Managed All Market Income Portfolio1
TARGET-DATE
Multi-Manager Select Retirement Allocation Fund
Multi-Manager Select 2010 Fund
Multi-Manager Select 2015 Fund
Multi-Manager Select 2020 Fund
Multi-Manager Select 2025 Fund
Multi-Manager Select 2030 Fund
Multi-Manager Select 2035 Fund
Multi-Manager Select 2040 Fund
Multi-Manager Select 2045 Fund
Multi-Manager Select 2050 Fund
Multi-Manager Select 2055 Fund
CLOSED-END FUNDS
Alliance California Municipal Income Fund
AllianceBernstein Global High Income Fund
AllianceBernstein National Municipal Income Fund
We also offer Government Money Market Portfolio1, which serves as the money market fund exchange vehicle for the AB mutual funds. An investment in Government Money Market Portfolio is not a deposit in a bank and is not insured or guaranteed by the Federal Deposit Insurance Corporation or any other government agency. Although the Fund seeks to preserve the value of your investment at $1.00 per share, it is possible to lose money by investing in the Fund.
Investors should consider the investment objectives, risks, charges and expenses of the Fund carefully before investing. For copies of our prospectus or summary prospectus, which contain this and other information, visit us online at www.abfunds.com or contact your AB representative. Please read the prospectus and/or summary prospectus carefully before investing.
| 1 | Prior to January 9, 2017, Relative Value Fund was named Growth & Income Fund; prior to April 17, 2017, Tax-Managed All Market Income Portfolio was named Tax-Managed Balanced Wealth Strategy; prior to April 24, 2017, All Market Total Return Portfolio was named Balanced Wealth Strategy; prior to November 10, 2017, Government Money Market Portfolio was named Government Exchange Reserves. |
| abfunds.com | AB HIGH YIELD PORTFOLIO | 125 |
NOTES
| 126 | AB HIGH YIELD PORTFOLIO | abfunds.com |
NOTES
| abfunds.com | AB HIGH YIELD PORTFOLIO | 127 |
NOTES
| 128 | AB HIGH YIELD PORTFOLIO | abfunds.com |
NOTES
| abfunds.com | AB HIGH YIELD PORTFOLIO | 129 |
NOTES
| 130 | AB HIGH YIELD PORTFOLIO | abfunds.com |
NOTES
| abfunds.com | AB HIGH YIELD PORTFOLIO | 131 |
NOTES
| 132 | AB HIGH YIELD PORTFOLIO | abfunds.com |
AB HIGH YIELD PORTFOLIO
1345 Avenue of the Americas
New York, NY 10105
800 221 5672
HY-0151-1017 
OCT 10.31.17

ANNUAL REPORT
AB INCOME FUND


| Investment Products Offered | • Are Not FDIC Insured • May Lose Value • Are Not Bank Guaranteed | |
Investors should consider the investment objectives, risks, charges and expenses of the Fund carefully before investing. For copies of our prospectus or summary prospectus, which contain this and other information, visit us online at www.abfunds.com or contact your AB representative. Please read the prospectus and/or summary prospectus carefully before investing.
This shareholder report must be preceded or accompanied by the Fund’s prospectus for individuals who are not current shareholders of the Fund.
You may obtain a description of the Fund’s proxy voting policies and procedures, and information regarding how the Fund voted proxies relating to portfolio securities during the most recent 12-month period ended June 30, without charge. Simply visit AB’s website at www.abfunds.com, or go to the Securities and Exchange Commission’s (the “Commission”) website at www.sec.gov, or call AB at (800) 227 4618.
The Fund files its complete schedule of portfolio holdings with the Commission for the first and third quarters of each fiscal year on Form N-Q. The Fund’s Forms N-Q are available on the Commission’s website at www.sec.gov. The Fund’s Forms N-Q may also be reviewed and copied at the Commission’s Public Reference Room in Washington, DC; information on the operation of the Public Reference Room may be obtained by calling (800) SEC 0330. AB publishes full portfolio holdings for the Fund monthly at www.abfunds.com.
AllianceBernstein Investments, Inc. (ABI) is the distributor of the AB family of mutual funds. ABI is a member of FINRA and is an affiliate of AllianceBernstein L.P., the Adviser of the funds.
The [A/B] logo is a registered service mark of AllianceBernstein and AllianceBernstein® is a registered service mark used by permission of the owner, AllianceBernstein L.P.
| FROM THE PRESIDENT |  |
Dear Shareholder,
We are pleased to provide this report for AB Income Fund (the “Fund”). Please review the discussion of Fund performance, the market conditions during the reporting period and the Fund’s investment strategy.
As always, AB strives to keep clients ahead of what’s next by:
| + | Transforming uncommon insights into uncommon knowledge with a global research scope |
| + | Navigating markets with seasoned investment experience and sophisticated solutions |
| + | Providing thoughtful investment insights and actionable ideas |
Whether you’re an individual investor or a multi-billion-dollar institution, we put knowledge and experience to work for you.
AB’s global research organization connects and collaborates across platforms and teams to deliver impactful insights and innovative products. Better insights lead to better opportunities—anywhere in the world.
For additional information about AB’s range of products and shareholder resources, please log on to www.abfunds.com.
Thank you for your investment in the AB Mutual Funds.
Sincerely,

Robert M. Keith
President and Chief Executive Officer, AB Mutual Funds
| abfunds.com | AB INCOME FUND | 1 |
ANNUAL REPORT
December 14, 2017
This report provides management’s discussion of fund performance for AB Income Fund for the annual reporting period ended October 31, 2017.
The investment objective of the Fund is to seek high current income consistent with preservation of capital.
NAV RETURNS AS OF OCTOBER 31, 2017 (unaudited)
| 6 Months | 12 Months | |||||||
| AB INCOME FUND | ||||||||
| Class A Shares | 1.55% | 5.17% | ||||||
| Class C Shares | 1.17% | 4.37% | ||||||
| Advisor Class Shares1 | 1.69% | 5.44% | ||||||
| Bloomberg Barclays US Aggregate Bond Index | 1.58% | 0.90% | ||||||
| 1 | Please note that this share class is for investors purchasing shares through accounts established under certain fee-based programs sponsored and maintained by certain broker-dealers and financial intermediaries, institutional pension plans and/or investment advisory clients of, and certain other persons associated with, the Adviser and its affiliates or the Fund, or through other limited or special arrangements approved by the Adviser, such as purchases by shareholders of the Fund’s Predecessor Fund. |
INVESTMENT RESULTS
The table above shows the Fund’s performance compared to its benchmark, the Bloomberg Barclays US Aggregate Bond Index, for the six- and 12-month periods ended October 31, 2017.
During the 12-month period, all share classes of the Fund outperformed the benchmark, before sales charges. Sector allocation contributed relative to the benchmark, primarily because of gains from the Fund’s allocation to agency risk-sharing transactions, an overweight in high-yield corporates and an underweight to agency mortgages. An underweight position in investment-grade corporates and an overweight in US Treasuries detracted. Security selections within high-yield and investment-grade corporates were positive. Currency allocation also contributed, as gains from a long Russian ruble position outweighed negative returns from a short in the British pound. Country selection (a result of bottom-up security analysis combined with fundamental research) was a small detractor, mostly because of an exposure to Turkey. Yield-curve positioning also detracted modestly in the period.
During the six-month period, Class A and C shares underperformed the benchmark, while Advisor Class shares outperformed, before sales charges. Country positioning detracted from relative performance, with
| 2 | AB INCOME FUND | abfunds.com |
exposures to Canada and Turkey outweighing a beneficial allocation to Brazil. Yield-curve positioning also detracted, particularly an underweight on the long end of the curve, where yields fell. Security selection contributed to performance, mainly because of selections within high-yield corporates and asset-backed securities. Selections in commercial mortgage-backed securities detracted. Currency investments were positive, the result of long positions in the Norwegian krone and Swedish krona. Sector selection added to returns as well, helped by an exposure to collateralized mortgage obligations. An underweight in investment-grade corporates and an overweight in US Treasuries offset some of these gains.
During both periods, the Fund utilized derivatives in the form of futures to manage and hedge duration risk and/or take active yield-curve positioning. Currency forwards and currency options, both written and purchased, were used to hedge foreign currency exposure and to take active currency risk. Purchased and written exchange-traded fund options and index options were used in an effort to add alpha (a measure of how the Fund is performing on a risk-adjusted basis versus its benchmark) through different strategies, including but not limited to relative value, put spreads and call spreads. Written swaptions were used as hedging tools against other active equity-like risks in the Fund as well as to take active risk through high-yield exposure. Credit default swaps, both single name and index, were used to create synthetic exposure in investment-grade and high-yield credit risk. Interest rate swaps were used to hedge duration risk. Total return swaps were used to create synthetic high-yield exposure in the Fund. Variance swaps were used to add alpha by capturing risk premiums that are similar to high-yield exposure elsewhere in the Fund.
MARKET REVIEW AND INVESTMENT STRATEGY
Political events and central bank action had a significant impact on bond markets in the six- and 12-month periods ended October 31, 2017. Donald Trump’s US election victory and the promise of fiscal stimulus, a retreat from globalization and relaxed regulation were treated as positive developments by financial markets. However, uncertainty regarding the Trump administration’s ability to implement meaningful change increased through the 12-month period. UK prime minister Theresa May surprised investors when she called for a snap parliamentary election in an effort to firm up the UK’s mandate going into Brexit negotiations. However, the results of the vote increased political uncertainty when May’s Conservative Party failed to secure a majority position. Investors were relieved when centrist, pro-EU candidate Emmanuel Macron was elected president of France, as his reformist agenda was seen as more business friendly than the protectionist policies espoused by his opponent. In June, the US Federal Reserve (the “Fed”) raised interest rates for the third consecutive quarter, hikes that were well-telegraphed and universally anticipated by markets. Late in the period, the Fed formally confirmed that its balance sheet reduction program would start in October, while the European
| abfunds.com | AB INCOME FUND | 3 |
Central Bank announced that it would start to taper the pace of its monthly asset purchases in January 2018.
Emerging-market debt rallied over both periods, helped by a positive global growth story and increasing oil prices. Outside of Europe, developed-market treasury yields generally rose; in the eurozone and UK, yields moved in different directions. Emerging-market local-currency government bonds, developed-market treasuries and investment-grade credit securities all rose in both periods, yet trailed the rally in global high yield. Within high yield, performance was almost uniformly positive, led by the transportation and basic industries sectors, while consumer sectors tended to lag the rising market.
INVESTMENT POLICIES
The Fund pursues its objective by investing, under normal circumstances, at least 80% of its net assets in income-producing securities. The Fund also normally invests at least 65% of its total assets in securities of US and foreign governments, their agencies or instrumentalities and repurchase agreements relating to US government securities.
The Fund normally invests at least 65% of its total assets in US dollar-denominated securities. The Fund may also invest up to 35% of its total assets in non-government fixed-income securities, including corporate debt securities, non-government mortgage-backed and other asset-backed securities, certificates of deposit and commercial paper. The Fund may invest up to 35% of its net assets in below investment-grade securities (commonly known as “junk bonds”). The Fund may invest no more than 25% of its total assets in securities of issuers in any one country other than the US. The Fund’s investments in foreign securities may include investments in securities of emerging-market countries or of issuers in emerging markets.
The Adviser selects securities for purchase or sale based on its assessment of the securities’ risks and return characteristics as well as the securities’ impact on the overall risks and return characteristics of the Fund. In making this assessment, the Adviser takes into account various factors, including the credit quality and sensitivity to interest rates of the securities under consideration and of the Fund’s other holdings. The Fund may invest in fixed-income securities with any maturity or duration.
The Fund utilizes derivatives, such as options, futures contracts, forwards and swaps to a significant extent. The Fund may, for example, use credit default, interest rate and total return swaps to establish exposure to the fixed-income markets or particular fixed-income
(continued on next page)
| 4 | AB INCOME FUND | abfunds.com |
securities. Derivatives may provide a more efficient and economical exposure to market segments than direct investments, and may also be a more efficient way to alter the Fund’s exposure. The Fund may also enter into transactions such as reverse repurchase agreements that are similar to borrowings for investment purposes. The Fund’s use of derivatives and these borrowing transactions may create aggregate exposure that is substantially in excess of its net assets, effectively leveraging the Fund.
| abfunds.com | AB INCOME FUND | 5 |
DISCLOSURES AND RISKS
Benchmark Disclosure
The Bloomberg Barclays US Aggregate Bond Index is unmanaged and does not reflect fees and expenses associated with the active management of a mutual fund portfolio. The Bloomberg Barclays US Aggregate Bond Index represents the performance of securities within the US investment-grade fixed-rate bond market, with index components for government and corporate securities, mortgage pass-through securities, asset-backed securities and commercial mortgage-backed securities. The index is not leveraged, whereas the Fund utilizes leverage. An investor cannot invest directly in an index, and its results are not indicative of the performance for any specific investment, including the Fund.
A Word About Risk
Market Risk: The value of the Fund’s assets will fluctuate as the bond market fluctuates. The value of the Fund’s investments may decline, sometimes rapidly and unpredictably, simply because of economic changes or other events that affect large portions of the market.
Credit Risk: An issuer or guarantor of a fixed-income security, or the counterparty to a derivatives or other contract, may be unable or unwilling to make timely payments of interest or principal, or to otherwise honor its obligations. The issuer or guarantor may default, causing a loss of the full principal amount of a security. The degree of risk for a particular security may be reflected in its credit rating. There is the possibility that the credit rating of a fixed-income security may be downgraded after purchase, which may adversely affect the value of the security.
Below Investment Grade Securities Risk: Investments in fixed-income securities with lower ratings (often referred to as “junk bonds”) are subject to higher probability that an issuer will default or fail to meet its payment obligations. These securities may be subject to greater price volatility due to such factors as specific corporate developments, negative perceptions of the junk bond market generally and less secondary market liquidity. These securities are often able to be “called” or repurchased by the issuer prior to their maturity date, forcing the Fund to reinvest the proceeds, possibly at a lower rate of return.
Interest Rate Risk: Changes in interest rates will affect the value of investments in fixed-income securities. When interest rates rise, the value of existing investments in fixed-income securities tends to fall and this decrease in value may not be offset by higher income from new investments. The Fund may be subject to a heightened risk due to rising rates as the current period of historically low interest rates may be ending. Interest rate risk is generally greater for fixed-income securities with longer maturities or durations.
| 6 | AB INCOME FUND | abfunds.com |
DISCLOSURES AND RISKS (continued)
Duration Risk: Duration is a measure that relates the expected price volatility of a fixed-income security to changes in interest rates. The duration of a fixed-income security may be shorter than or equal to the full maturity of a fixed-income security. Fixed-income securities with longer durations have more risk and will decrease in price as interest rates rise. For example, a fixed-income security with a duration of three years will decrease in value by approximately 3% if interest rates increase by 1%.
Inflation Risk: This is the risk that the value of assets or income from investments will be less in the future as inflation decreases the value of money. As inflation increases, the value of the Fund’s assets can decline, as can the value of the Fund’s distributions. This risk is significantly greater for fixed-income securities with longer maturities.
Foreign (Non-US) Risk: Investments in securities of non-US issuers may involve more risk than those of US issuers. These securities may fluctuate more widely in price and may be less liquid due to adverse market, economic, political, regulatory or other factors.
Emerging Market Risk: Investments in emerging-market countries may have more risk because the markets are less developed and less liquid as well as being subject to increased economic, political, regulatory or other uncertainties.
Leverage Risk: To the extent the Fund uses leveraging techniques, its net asset value (“NAV”) may be more volatile because leverage tends to exaggerate the effect of changes in interest rates and any increase or decrease in the value of the Fund’s investments.
Currency Risk: Fluctuations in currency exchange rates may negatively affect the value of the Fund’s investments or reduce its returns.
Liquidity Risk: Liquidity risk occurs when certain investments become difficult to purchase or sell. Difficulty in selling less liquid securities may result in sales at disadvantageous prices affecting the value of your investment in the Fund. Causes of liquidity risk may include low trading volumes, large positions and heavy redemptions of Fund shares. Over recent years, liquidity risk has also increased because the capacity of dealers in the secondary market for fixed-income securities to make markets in these securities has decreased, even as the overall bond market has grown significantly, due to, among other things, structural changes, additional regulatory requirements and capital and risk restraints that have led to reduced inventories. Liquidity risk may be higher in a rising interest rate environment, when the value and liquidity of fixed-income securities generally decline.
| abfunds.com | AB INCOME FUND | 7 |
DISCLOSURES AND RISKS (continued)
Mortgage-Backed and/or Other Asset-Backed Securities Risk: Investments in mortgage-backed and other asset-backed securities are subject to certain additional risks. The value of these securities may be particularly sensitive to changes in interest rates. These risks include “extension risk”, which is the risk that, in periods of rising interest rates, issuers may delay the payment of principal, and “prepayment risk”, which is the risk that in periods of falling interest rates, issuers may pay principal sooner than expected, exposing the Fund to a lower rate of return upon reinvestment of principal. Mortgage-backed securities offered by non-governmental issuers and other asset-backed securities may be subject to other risks, such as higher rates of default in the mortgages or assets backing the securities or risks associated with the nature and servicing of mortgages or assets backing the securities.
Derivatives Risk: Derivatives may be illiquid, difficult to price, and leveraged so that small changes may produce disproportionate losses for the Fund, and may be subject to counterparty risk to a greater degree than more traditional investments.
Management Risk: The Fund is subject to management risk because it is an actively managed investment fund. The Adviser will apply its investment techniques and risk analyses in making investment decisions, but there is no guarantee that its techniques will produce the intended results.
These risks are fully discussed in the Fund’s prospectus. As with all investments, you may lose money by investing in the Fund.
An Important Note About Historical Performance
The investment return and principal value of an investment in the Fund will fluctuate, so that shares, when redeemed, may be worth more or less than their original cost. Performance shown in this report represents past performance and does not guarantee future results. Current performance may be lower or higher than the performance information shown. You may obtain performance information current to the most recent month-end by visiting www.abfunds.com.
All fees and expenses related to the operation of the Fund have been deducted. NAV returns do not reflect sales charges; if sales charges were reflected, the Fund’s quoted performance would be lower. SEC returns reflect the applicable sales charges for each share class: a 4.25% maximum front-end sales charge for Class A shares and a 1% 1-year contingent deferred sales charge for Class C shares. Returns for the different share classes will vary due to different expenses associated with each class. Performance assumes reinvestment of distributions and does not account for taxes.
| 8 | AB INCOME FUND | abfunds.com |
DISCLOSURES AND RISKS (continued)
The Fund commenced operations on April 22, 2016. The Fund acquired the assets and liabilities of the AllianceBernstein Income Fund, Inc., a closed-end fund (the “Predecessor Fund”), effective at the close of business on April 21, 2016 (the “Reorganization”). The Fund has the same investment objective that the Predecessor Fund had and similar investment strategies and policies. In addition, the Fund has higher expenses (including transfer agency and shareholder servicing fees), and a different advisory fee arrangement than the Predecessor Fund had.
Performance information prior to April 22, 2016 shown in this report reflects the historical performance of the Predecessor Fund based on its NAV. Such performance information may not be representative of performance the Fund would have achieved as an open-end fund under its current investment strategies and policies and expense levels.
| abfunds.com | AB INCOME FUND | 9 |
HISTORICAL PERFORMANCE
GROWTH OF A $10,000 INVESTMENT IN THE FUND (unaudited)
10/31/2007 TO 10/31/2017
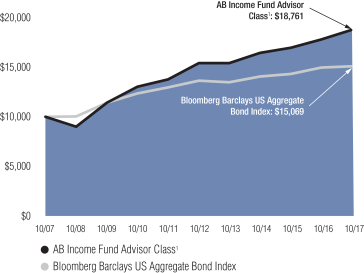
This chart illustrates the total value of an assumed $10,000 investment in AB Income Fund Advisor Class shares (from 10/31/2007 to 10/31/2017) as compared to the performance of the Fund’s benchmark. The chart assumes the reinvestment of dividends and capital gains distributions.
| 1 | Performance returns of Advisor Class shares for the periods prior to April 21, 2016 are based on the NAV per share of the Predecessor Fund. Please note that this share class is for investors purchasing shares through accounts established under certain fee-based programs sponsored and maintained by certain broker-dealers and financial intermediaries, institutional pension plans and/or investment advisory clients of, and certain other persons associated with, the Adviser and its affiliates or the Fund, or through other limited or special arrangements approved by the Adviser, such as purchases by shareholders of the Fund’s Predecessor Fund. |
| 10 | AB INCOME FUND | abfunds.com |
HISTORICAL PERFORMANCE (continued)
AVERAGE ANNUAL RETURNS AS OF OCTOBER 31, 2017 (unaudited)
| NAV Returns | SEC Returns (reflects applicable sales charges) | SEC Yields1 | ||||||||||
| CLASS A SHARES | 3.70% | |||||||||||
| 1 Year | 5.17% | 0.69% | ||||||||||
| Since Inception2 | 5.47% | 2.55% | ||||||||||
| CLASS C SHARES | 3.11% | |||||||||||
| 1 Year | 4.37% | 3.37% | ||||||||||
| Since Inception2 | 4.74% | 4.74% | ||||||||||
| ADVISOR CLASS SHARES3 | 4.11% | |||||||||||
| 1 Year | 5.44% | 5.44% | ||||||||||
| 5 Years | 4.03% | 4.03% | ||||||||||
| 10 Years | 6.49% | 6.49% | ||||||||||
The Fund’s current prospectus fee table shows the Fund’s total annual operating expense ratios as 1.25%, 2.03% and 0.86% for Class A, Class C and Advisor Class shares, respectively, gross of any fee waivers or expense reimbursements. Contractual fee waivers and/or expense reimbursements limit the Fund’s annual operating expense ratios exclusive of acquired fund fees and expenses other than the advisory fees of any AB mutual funds in which the Fund may invest, interest expense, taxes, extraordinary expenses and brokerage commissions and other transaction costs to 0.77%, 1.52% and 0.52% for Class A, Class C and Advisor Class shares, respectively. These waivers/reimbursements may not be terminated before April 22, 2018. Any fees waived and expense borne by the Adviser may be reimbursed by the Fund until the end of the third fiscal year after the fiscal period in which the fee was waived or the expense was borne, provided that no reimbursement payment will be made that would cause the Fund’s total annual operating expenses to exceed the expense reimbursement. Absent reimbursements or waivers, performance would have been lower. The Financial Highlights section of this report sets forth expense ratio data for the current reporting period; the expense ratios shown above may differ from the expense ratios in the Financial Highlights section since they are based on different time periods.
| 1 | SEC yields are calculated based on SEC guidelines for the 30-day period ended October 31, 2017. |
| 2 | Inception date: 4/21/2016. |
| 3 | Performance returns of Advisor Class shares for the periods prior to April 21, 2016 are based on the NAV per share of the Predecessor Fund. This share class is offered at NAV to eligible investors and the SEC returns are the same as the NAV returns. Please note that this share class is for investors purchasing shares through accounts established under certain fee-based programs sponsored and maintained by certain broker-dealers and financial intermediaries, institutional pension plans and/or investment advisory clients of, and certain other persons associated with, the Adviser and its affiliates or the Fund, or through other limited or special arrangements approved by the Adviser, such as purchases by shareholders of the Fund’s Predecessor Fund. |
| abfunds.com | AB INCOME FUND | 11 |
HISTORICAL PERFORMANCE (continued)
SEC AVERAGE ANNUAL RETURNS
AS OF THE MOST RECENT CALENDAR QUARTER-END
SEPTEMBER 30, 2017 (unaudited)
| SEC Returns (reflects applicable sales charges) | ||||
| CLASS A SHARES | ||||
| 1 Year | 0.79% | |||
| Since Inception1 | 2.95% | |||
| CLASS C SHARES | ||||
| 1 Year | 3.44% | |||
| Since Inception1 | 5.33% | |||
| ADVISOR CLASS SHARES2 | ||||
| 1 Year | 5.52% | |||
| 5 Years | 4.24% | |||
| 10 Years | 6.74% | |||
| 1 | Inception date: 4/21/2016. |
| 2 | Performance returns of Advisor Class shares for the periods prior to April 21, 2016 are based on the NAV per share of the Predecessor Fund. Please note that this share class is for investors purchasing shares through accounts established under certain fee-based programs sponsored and maintained by certain broker-dealers and financial intermediaries, institutional pension plans and/or investment advisory clients of, and certain other persons associated with, the Adviser and its affiliates or the Fund, or through other limited or special arrangements approved by the Adviser, such as purchases by shareholders of the Fund’s Predecessor Fund. |
| 12 | AB INCOME FUND | abfunds.com |
EXPENSE EXAMPLE
(unaudited)
As a shareholder of the Fund, you incur two types of costs: (1) transaction costs, including sales charges (loads) on purchase payments, contingent deferred sales charges on redemptions and (2) ongoing costs, including management fees; distribution (12b-1) fees; and other Fund expenses. This example is intended to help you understand your ongoing costs (in dollars) of investing in the Fund and to compare these costs with the ongoing costs of investing in other mutual funds.
The Example is based on an investment of $1,000 invested at the beginning of the period and held for the entire period as indicated below.
Actual Expenses
The first line of the table below provides information about actual account values and actual expenses. You may use the information in this line, together with the amount you invested, to estimate the expenses that you paid over the period. Simply divide your account value by $1,000 (for example, an $8,600 account value divided by $1,000 = 8.6), then multiply the result by the number in the first line under the heading entitled “Expenses Paid During Period” to estimate the expenses you paid on your account during this period.
Hypothetical Example for Comparison Purposes
The second line of the table below provides information about hypothetical account values and hypothetical expenses based on the Fund’s actual expense ratio and an assumed annual rate of return of 5% before expenses, which is not the Fund’s actual return. The hypothetical account values and expenses may not be used to estimate the actual ending account balance or expenses you paid for the period. You may use this information to compare the ongoing costs of investing in the Fund and other funds by comparing this 5% hypothetical example with the 5% hypothetical examples that appear in the shareholder reports of other funds.
| Beginning Account Value May 1, 2017 | Ending Account Value October 31, 2017 | Expenses Paid During Period* | Annualized Expense Ratio* | |||||||||||||
| Class A | ||||||||||||||||
Actual | $ | 1,000 | $ | 1,015.50 | $ | 5.18 | 1.02 | % | ||||||||
Hypothetical** | $ | 1,000 | $ | 1,020.06 | $ | 5.19 | 1.02 | % | ||||||||
| Class C | ||||||||||||||||
Actual | $ | 1,000 | $ | 1,011.70 | $ | 8.97 | 1.77 | % | ||||||||
Hypothetical** | $ | 1,000 | $ | 1,016.28 | $ | 9.00 | 1.77 | % | ||||||||
| Advisor Class | ||||||||||||||||
Actual | $ | 1,000 | $ | 1,016.90 | $ | 3.97 | 0.78 | % | ||||||||
Hypothetical** | $ | 1,000 | $ | 1,021.27 | $ | 3.97 | 0.78 | % | ||||||||
| * | Expenses are equal to the classes’ annualized expense ratios multiplied by the average account value over the period, multiplied by 184/365 (to reflect the one-half year period). |
| ** | Assumes 5% annual return before expenses. |
| abfunds.com | AB INCOME FUND | 13 |
PORTFOLIO SUMMARY
October 31, 2017 (unaudited)
PORTFOLIO STATISTICS
Net Assets ($mil): $2,033.7
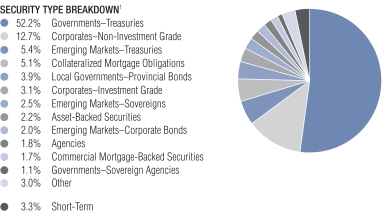
| 1 | All data are as of October 31, 2017. The Fund’s security type breakdown is expressed as a percentage of total investments and may vary over time. The Fund also enters into derivative transactions, which may be used for hedging or investment purposes (see “Portfolio of Investments” section of the report for additional details). “Other” security type weightings represent 0.7% or less in the following types: Bank Loans, Collateralized Loan Obligations, Common Stocks, Inflation-Linked Securities, Investment Companies, Local Governments–Regional Bonds, Local Governments–US Municipal Bonds, Mortgage Pass-Throughs, Options Purchased–Calls, Options Purchased–Puts, Preferred Stocks, Quasi-Sovereigns, Warrants and Whole Loan Trusts. |
| 14 | AB INCOME FUND | abfunds.com |
PORTFOLIO SUMMARY (continued)
October 31, 2017 (unaudited)
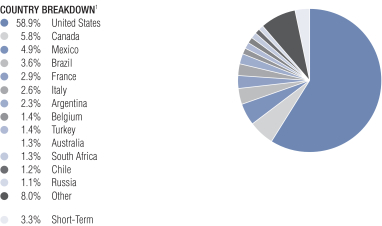
| 1 | All data are as of October 31, 2017. The Fund’s country breakdown is expressed as a percentage of total investments and may vary over time. The Fund also enters into derivative transactions, which may be used for hedging or investment purposes (see “Portfolio of Investments” section of the report for additional details). “Other” country weightings represent 1.0% or less in the following countries: Angola, Bahrain, Belarus, Cayman Islands, Colombia, Dominican Republic, Ecuador, Egypt, El Salvador, Guatemala, Honduras, Hong Kong, India, Indonesia, Ireland, Israel, Ivory Coast, Jamaica, Kenya, Lebanon, Luxembourg, Netherlands, New Zealand, Nigeria, Norway, Peru, Poland, Senegal, Spain, Sri Lanka, Sweden, Switzerland, Trinidad & Tobago, United Kingdom, Uruguay and Zambia. |
| abfunds.com | AB INCOME FUND | 15 |
PORTFOLIO OF INVESTMENTS
October 31, 2017
| Principal Amount (000) | U.S. $ Value | |||||||||||
| ||||||||||||
GOVERNMENTS – TREASURIES – 61.6% | ||||||||||||
Australia – 1.6% | ||||||||||||
Australia Government Bond | AUD | 36,630 | $ | 31,566,305 | ||||||||
|
| |||||||||||
Belgium – 1.7% | ||||||||||||
Kingdom of Belgium Government Bond | EUR | 25,193 | 34,268,854 | |||||||||
|
| |||||||||||
Chile – 1.4% | ||||||||||||
Bonos de la Tesoreria de la Republica en pesos | CLP | 17,560,000 | 27,965,097 | |||||||||
|
| |||||||||||
France – 1.7% | ||||||||||||
French Republic Government Bond OAT | EUR | 23,748 | 34,908,298 | |||||||||
|
| |||||||||||
Indonesia – 0.8% | ||||||||||||
Indonesia Treasury Bond | IDR | 26,789,000 | 2,169,094 | |||||||||
Series FR59 | 101,195,000 | 7,585,408 | ||||||||||
Series FR70 | 86,073,000 | 6,861,405 | ||||||||||
|
| |||||||||||
| 16,615,907 | ||||||||||||
|
| |||||||||||
Italy – 2.4% | ||||||||||||
Italy Buoni Poliennali Del Tesoro | EUR | 13,764 | 16,617,070 | |||||||||
3.75%, 5/01/21 | 24,140 | 31,597,845 | ||||||||||
|
| |||||||||||
| 48,214,915 | ||||||||||||
|
| |||||||||||
Mexico – 4.7% | ||||||||||||
Mexican Bonos | MXN | 440,245 | 20,799,666 | |||||||||
6.50%, 6/10/21 | 334,497 | 17,099,148 | ||||||||||
Series M 10 | 208,902 | 11,042,663 | ||||||||||
Series M 20 | 762,911 | 46,056,236 | ||||||||||
|
| |||||||||||
| 94,997,713 | ||||||||||||
|
| |||||||||||
Poland – 1.1% | ||||||||||||
Republic of Poland Government Bond | PLN | 51,575 | 16,145,889 | |||||||||
| 16 | AB INCOME FUND | abfunds.com |
PORTFOLIO OF INVESTMENTS (continued)
| Principal Amount (000) | U.S. $ Value | |||||||||||
| ||||||||||||
Series 1023 | PLN | 22,000 | $ | 6,395,560 | ||||||||
|
| |||||||||||
| 22,541,449 | ||||||||||||
|
| |||||||||||
Russia – 1.3% | ||||||||||||
Russian Federal Bond – OFZ | RUB | 170,867 | 2,952,598 | |||||||||
Series 6212 | 149,874 | 2,486,350 | ||||||||||
Series 6217 | 1,244,076 | 21,367,346 | ||||||||||
|
| |||||||||||
| 26,806,294 | ||||||||||||
|
| |||||||||||
South Africa – 1.2% |
| |||||||||||
Republic of South Africa Government Bond |
| |||||||||||
Series 2023 | ZAR | 220,538 | 15,163,116 | |||||||||
Series 2048 | 51,166 | 3,160,924 | ||||||||||
Series R186 | 89,830 | 6,891,787 | ||||||||||
|
| |||||||||||
| 25,215,827 | ||||||||||||
|
| |||||||||||
United States – 43.6% |
| |||||||||||
U.S. Treasury Bonds | U.S.$ | 40,188 | 42,260,194 | |||||||||
6.25%, 5/15/30(b) | 119,000 | 168,087,500 | ||||||||||
6.375%, 8/15/27(b)(c) | 86,284 | 116,806,965 | ||||||||||
6.50%, 11/15/26 | 12,276 | 16,469,021 | ||||||||||
7.125%, 2/15/23 | 10,600 | 13,289,750 | ||||||||||
8.00%, 11/15/21(b)(c) | 122,400 | 151,508,250 | ||||||||||
8.125%, 8/15/21(b) | 44,158 | 54,286,741 | ||||||||||
8.75%, 8/15/20 | 19,350 | 23,065,805 | ||||||||||
U.S. Treasury Notes | 23,356 | 23,224,622 | ||||||||||
1.75%, 12/31/20 | 54,190 | 54,138,997 | ||||||||||
2.00%, 10/31/21(b) | 52,292 | 52,504,838 | ||||||||||
2.125%, 8/31/20(b)(c) | 40,000 | 40,449,899 | ||||||||||
2.25%, 2/15/27 | 17,000 | 16,837,969 | ||||||||||
2.375%, 12/31/20 | 10,056 | 10,239,836 | ||||||||||
3.125%, 5/15/21(b)(c) | 57,725 | 60,304,586 | ||||||||||
3.50%, 5/15/20(c) | 5,011 | 5,238,061 | ||||||||||
3.625%, 2/15/21(c)(d) | 36,605 | 38,755,544 | ||||||||||
|
| |||||||||||
| 887,468,578 | ||||||||||||
|
| |||||||||||
Uruguay – 0.1% |
| |||||||||||
Uruguay Government International Bond | UYU | 37,222 | 1,276,251 | |||||||||
| abfunds.com | AB INCOME FUND | 17 |
PORTFOLIO OF INVESTMENTS (continued)
| Principal Amount (000) | U.S. $ Value | |||||||||||
| ||||||||||||
9.875%, 6/20/22(a) | UYU | 20,752 | $ | 755,393 | ||||||||
|
| |||||||||||
| 2,031,644 | ||||||||||||
|
| |||||||||||
Total Governments – Treasuries | 1,252,600,881 | |||||||||||
|
| |||||||||||
CORPORATES – NON-INVESTMENT GRADE – 14.9% | ||||||||||||
Industrial – 11.5% | ||||||||||||
Basic – 1.5% | ||||||||||||
ArcelorMittal | ||||||||||||
7.25%, 3/01/41 | U.S.$ | 1,000 | 1,226,980 | |||||||||
7.50%, 10/15/39 | 1,846 | 2,304,879 | ||||||||||
Axalta Coating Systems LLC | 1,728 | 1,805,674 | ||||||||||
CF Industries, Inc. | 492 | 450,269 | ||||||||||
5.375%, 3/15/44 | 371 | 356,290 | ||||||||||
ERP Iron Ore, LLC | 210 | 210,467 | ||||||||||
Freeport-McMoRan, Inc. | 1,908 | 1,799,835 | ||||||||||
6.875%, 2/15/23 | 2,558 | 2,796,047 | ||||||||||
Joseph T Ryerson & Son, Inc. | 2,275 | 2,563,857 | ||||||||||
Magnetation LLC/Mag Finance Corp. | 1,407 | 14 | ||||||||||
Multi-Color Corp. | 1,587 | 1,600,823 | ||||||||||
NOVA Chemicals Corp. | 348 | 358,924 | ||||||||||
Novelis Corp. | 420 | 433,377 | ||||||||||
Peabody Energy Corp. | 2,305 | 2,380,673 | ||||||||||
Plastipak Holdings, Inc. | 1,140 | 1,162,686 | ||||||||||
Reynolds Group Issuer, Inc./Reynolds Group Issuer LLC/Reynolds Group Issuer Lu | 2,554 | 2,653,555 | ||||||||||
Sealed Air Corp. | 2,246 | 2,627,820 | ||||||||||
SPCM SA | 913 | 940,143 | ||||||||||
Steel Dynamics, Inc. | 1,820 | 1,830,884 | ||||||||||
| 18 | AB INCOME FUND | abfunds.com |
PORTFOLIO OF INVESTMENTS (continued)
| Principal Amount (000) | U.S. $ Value | |||||||||||
| ||||||||||||
Teck Resources Ltd. | U.S.$ | 786 | $ | 896,629 | ||||||||
8.50%, 6/01/24(a) | 151 | 172,889 | ||||||||||
Valvoline, Inc. | 1,237 | 1,247,440 | ||||||||||
5.50%, 7/15/24(a) | 381 | 404,439 | ||||||||||
|
| |||||||||||
| 30,224,594 | ||||||||||||
|
| |||||||||||
Capital Goods – 0.8% |
| |||||||||||
Apex Tool Group LLC | 975 | 921,238 | ||||||||||
Ardagh Packaging Finance PLC/Ardagh Holdings USA, Inc. | EUR | 5,143 | 6,182,587 | |||||||||
Bombardier, Inc. | U.S.$ | 3,124 | 3,102,788 | |||||||||
6.00%, 10/15/22(a) | 124 | 122,378 | ||||||||||
8.75%, 12/01/21(a) | 552 | 613,968 | ||||||||||
Exide Technologies | 3,099 | 2,633,919 | ||||||||||
TransDigm, Inc. | 847 | 861,822 | ||||||||||
6.50%, 7/15/24 | 1,989 | 2,051,097 | ||||||||||
|
| |||||||||||
| 16,489,797 | ||||||||||||
|
| |||||||||||
Communications - Media – 1.4% |
| |||||||||||
Altice Financing SA | 2,600 | 2,856,126 | ||||||||||
Altice Luxembourg SA | 817 | 865,260 | ||||||||||
CCO Holdings LLC/CCO Holdings Capital Corp. | 869 | 862,439 | ||||||||||
5.50%, 5/01/26(a) | 1,722 | 1,765,653 | ||||||||||
CSC Holdings LLC | 268 | 293,519 | ||||||||||
10.875%, 10/15/25(a) | 709 | 870,489 | ||||||||||
DISH DBS Corp. | 4,125 | 4,516,133 | ||||||||||
iHeartCommunications, Inc. | 2,205 | 1,607,748 | ||||||||||
Netflix, Inc. | 2,197 | 2,186,169 | ||||||||||
SFR Group SA | 766 | 804,384 | ||||||||||
7.375%, 5/01/26(a) | 4,500 | 4,841,640 | ||||||||||
TEGNA, Inc. | 1,495 | 1,589,977 | ||||||||||
| abfunds.com | AB INCOME FUND | 19 |
PORTFOLIO OF INVESTMENTS (continued)
| Principal Amount (000) | U.S. $ Value | |||||||||||
| ||||||||||||
Virgin Media Finance PLC | U.S.$ | 2,246 | $ | 2,182,101 | ||||||||
6.00%, 10/15/24(a) | 503 | 529,634 | ||||||||||
Ziggo Bond Finance BV | 3,000 | 3,059,700 | ||||||||||
|
| |||||||||||
| 28,830,972 | ||||||||||||
|
| |||||||||||
Communications - Telecommunications – 1.0% |
| |||||||||||
C&W Senior Financing Designated Activity Co. | 1,247 | 1,303,252 | ||||||||||
Frontier Communications Corp. | 919 | 757,219 | ||||||||||
10.50%, 9/15/22 | 510 | 445,740 | ||||||||||
Hughes Satellite Systems Corp. | 810 | 854,971 | ||||||||||
Intelsat Jackson Holdings SA | 1,625 | 1,561,008 | ||||||||||
9.50%, 9/30/22(a) | 700 | 822,752 | ||||||||||
Qwest Corp. | 1,275 | 1,256,857 | ||||||||||
Sprint Corp. | 2,424 | 2,654,474 | ||||||||||
Wind Tre SpA | 3,845 | 3,868,685 | ||||||||||
Series X | 3,845 | 3,859,419 | ||||||||||
Windstream Services LLC | 1,400 | 1,063,132 | ||||||||||
Zayo Group LLC/Zayo Capital, Inc. | 429 | 452,372 | ||||||||||
6.375%, 5/15/25 | 1,495 | 1,610,907 | ||||||||||
|
| |||||||||||
| 20,510,788 | ||||||||||||
|
| |||||||||||
Consumer Cyclical - Automotive – 0.3% |
| |||||||||||
Adient Global Holdings Ltd. | 609 | 625,632 | ||||||||||
Allison Transmission, Inc. | 1,578 | 1,593,054 | ||||||||||
BCD Acquisition, Inc. | 1,714 | 1,874,790 | ||||||||||
Cooper-Standard Automotive, Inc. | 905 | 938,060 | ||||||||||
Exide Technologies | 184 | 111,453 | ||||||||||
Series AI | 2,596 | 1,570,299 | ||||||||||
|
| |||||||||||
| 6,713,288 | ||||||||||||
|
| |||||||||||
| 20 | AB INCOME FUND | abfunds.com |
PORTFOLIO OF INVESTMENTS (continued)
| Principal Amount (000) | U.S. $ Value | |||||||||||
| ||||||||||||
Consumer Cyclical - Other – 0.4% |
| |||||||||||
Beazer Homes USA, Inc. | U.S.$ | 1,121 | $ | 1,115,720 | ||||||||
K. Hovnanian Enterprises, Inc. | 3,649 | 3,987,627 | ||||||||||
10.50%, 7/15/24(a) | 649 | 722,532 | ||||||||||
Shea Homes LP/Shea Homes Funding Corp. | 697 | 726,678 | ||||||||||
Sugarhouse HSP Gaming Prop Mezz LP/Sugarhouse HSP Gaming Finance Corp. | 688 | 670,436 | ||||||||||
Taylor Morrison Communities, Inc./Taylor Morrison Holdings II, Inc. | 1,008 | 1,076,907 | ||||||||||
|
| |||||||||||
| 8,299,900 | ||||||||||||
|
| |||||||||||
Consumer Cyclical - Restaurants – 0.0% |
| |||||||||||
Stonegate Pub Co. Financing PLC | GBP | 496 | 667,320 | |||||||||
|
| |||||||||||
Consumer Cyclical - Retailers – 0.3% |
| |||||||||||
FirstCash, Inc. | U.S.$ | 271 | 283,572 | |||||||||
L Brands, Inc. | 2,540 | 2,521,864 | ||||||||||
Neiman Marcus Group Ltd. LLC | 852 | 502,680 | ||||||||||
Penske Automotive Group, Inc. | 1,350 | 1,392,053 | ||||||||||
PetSmart, Inc. | 1,842 | 1,409,093 | ||||||||||
Sally Holdings LLC/Sally Capital, Inc. | 853 | 845,937 | ||||||||||
|
| |||||||||||
| 6,955,199 | ||||||||||||
|
| |||||||||||
Consumer Non-Cyclical – 1.2% |
| |||||||||||
Air Medical Group Holdings, Inc. | 1,414 | 1,371,156 | ||||||||||
BI-LO LLC/BI-LO Finance Corp. | 817 | 260,279 | ||||||||||
Catalent Pharma Solutions, Inc. | 713 | 723,667 | ||||||||||
CHS/Community Health Systems, Inc. | 3,246 | 2,362,893 | ||||||||||
Endo Dac/Endo Finance LLC/Endo Finco, Inc. | 1,521 | 1,232,831 | ||||||||||
| abfunds.com | AB INCOME FUND | 21 |
PORTFOLIO OF INVESTMENTS (continued)
| Principal Amount (000) | U.S. $ Value | |||||||||||
| ||||||||||||
Endo Finance LLC/Endo Finco, Inc. | U.S.$ | 1,170 | $ | 942,786 | ||||||||
Envision Healthcare Corp. | 1,500 | 1,520,775 | ||||||||||
6.25%, 12/01/24(a) | 1,322 | 1,387,598 | ||||||||||
HCA, Inc. | 313 | 315,626 | ||||||||||
5.25%, 6/15/26 | 548 | 582,836 | ||||||||||
5.875%, 2/15/26 | 825 | 867,149 | ||||||||||
Mallinckrodt International Finance SA/Mallinckrodt CB LLC | 1,190 | 1,069,548 | ||||||||||
5.625%, 10/15/23(a) | 118 | 110,376 | ||||||||||
5.75%, 8/01/22(a) | 1,334 | 1,303,438 | ||||||||||
Post Holdings, Inc. | 2,004 | 2,014,942 | ||||||||||
Tenet Healthcare Corp. | 1,642 | 1,595,154 | ||||||||||
7.50%, 1/01/22(a) | 396 | 417,669 | ||||||||||
8.125%, 4/01/22 | 1,359 | 1,365,251 | ||||||||||
Valeant Pharmaceuticals International, Inc. | EUR | 1,800 | 1,775,804 | |||||||||
5.375%, 3/15/20(a) | U.S.$ | 494 | 485,395 | |||||||||
6.125%, 4/15/25(a) | 892 | 749,280 | ||||||||||
6.50%, 3/15/22(a) | 740 | 784,437 | ||||||||||
|
| |||||||||||
| 23,238,890 | ||||||||||||
|
| |||||||||||
Energy – 2.0% |
| |||||||||||
Berry Petroleum Co. LLC | 1,904 | – 0 | – | |||||||||
Bill Barrett Corp. | 807 | 785,857 | ||||||||||
California Resources Corp. | 2,860 | 1,887,600 | ||||||||||
Carrizo Oil & Gas, Inc. | 865 | 879,030 | ||||||||||
Cheniere Energy Partners LP | 1,669 | 1,718,185 | ||||||||||
Cheniere Energy, Inc. | 1,657 | 1,615,940 | ||||||||||
Chesapeake Energy Corp. | 1,300 | 1,312,948 | ||||||||||
6.625%, 8/15/20 | 1,345 | 1,388,861 | ||||||||||
Denbury Resources, Inc. | 332 | 189,655 | ||||||||||
5.50%, 5/01/22 | 1,049 | 655,625 | ||||||||||
Diamond Offshore Drilling, Inc. | 1,482 | 1,585,147 | ||||||||||
| 22 | AB INCOME FUND | abfunds.com |
PORTFOLIO OF INVESTMENTS (continued)
| Principal Amount (000) | U.S. $ Value | |||||||||||
| ||||||||||||
Energy Transfer Equity LP | U.S.$ | 2,400 | $ | 2,441,424 | ||||||||
7.50%, 10/15/20 | 1,130 | 1,271,713 | ||||||||||
EP Energy LLC/Everest Acquisition Finance, Inc. | 1,394 | 1,171,420 | ||||||||||
Golden Energy Offshore Services AS | NOK | 14,977 | 825,106 | |||||||||
Gulfport Energy Corp. | U.S.$ | 280 | 281,324 | |||||||||
6.375%, 5/15/25 | 1,493 | 1,509,274 | ||||||||||
6.375%, 1/15/26(a) | 1,501 | 1,518,442 | ||||||||||
Murphy Oil Corp. | 1,379 | 1,484,107 | ||||||||||
Murphy Oil USA, Inc. | 67 | 71,413 | ||||||||||
Nabors Industries, Inc. | 845 | 811,656 | ||||||||||
Oasis Petroleum, Inc. | 2,000 | 2,052,060 | ||||||||||
QEP Resources, Inc. | 746 | 735,153 | ||||||||||
Range Resources Corp. | 1,377 | 1,367,266 | ||||||||||
Rowan Cos., Inc. | 436 | 330,366 | ||||||||||
SandRidge Energy, Inc. | 1,259 | – 0 | – | |||||||||
SemGroup Corp. | 1,021 | 1,007,799 | ||||||||||
7.25%, 3/15/26(a) | 882 | 899,534 | ||||||||||
SM Energy Co. | 1,759 | 1,786,762 | ||||||||||
Transocean Phoenix 2 Ltd. | 720 | 777,881 | ||||||||||
Transocean, Inc. | 1,061 | 1,093,498 | ||||||||||
9.00%, 7/15/23(a) | 2,375 | 2,582,765 | ||||||||||
Vantage Drilling International | 3,068 | – 0 | – | |||||||||
10.00%, 12/31/20(g)(i) | 77 | 75,460 | ||||||||||
10.00%, 12/31/20(e)(g) | 91 | 89,180 | ||||||||||
Vine Oil & Gas LP/Vine Oil & Gas Finance Corp. | 1,858 | 1,816,529 | ||||||||||
Weatherford International Ltd. | 338 | 340,958 | ||||||||||
7.75%, 6/15/21 | 650 | 670,339 | ||||||||||
| abfunds.com | AB INCOME FUND | 23 |
PORTFOLIO OF INVESTMENTS (continued)
| Principal Amount (000) | U.S. $ Value | |||||||||||
| ||||||||||||
9.875%, 2/15/24 | U.S.$ | 1,346 | $ | 1,440,045 | ||||||||
Whiting Petroleum Corp. | 165 | 166,252 | ||||||||||
WPX Energy, Inc. | 250 | 282,040 | ||||||||||
|
| |||||||||||
| 40,918,614 | ||||||||||||
|
| |||||||||||
Other Industrial – 0.6% |
| |||||||||||
American Tire Distributors, Inc. | 2,669 | 2,783,020 | ||||||||||
Global Partners LP/GLP Finance Corp. | 1,100 | 1,123,848 | ||||||||||
H&E Equipment Services, Inc. | 635 | 669,804 | ||||||||||
Laureate Education, Inc. | 2,096 | 2,247,981 | ||||||||||
Travis Perkins PLC | GBP | 4,276 | 5,955,347 | |||||||||
|
| |||||||||||
| 12,780,000 | ||||||||||||
|
| |||||||||||
Services – 0.5% |
| |||||||||||
APX Group, Inc. | U.S.$ | 1,171 | 1,190,977 | |||||||||
8.75%, 12/01/20 | 1,785 | 1,828,608 | ||||||||||
Carlson Travel, Inc. | 837 | 827,048 | ||||||||||
Gartner, Inc. | 419 | 442,137 | ||||||||||
GEO Group, Inc. (The) | 760 | 785,377 | ||||||||||
KAR Auction Services, Inc. | 485 | 502,048 | ||||||||||
Prime Security Services Borrower LLC/Prime Finance, Inc. | 2,786 | 3,087,250 | ||||||||||
Team Health Holdings, Inc. | 692 | 637,643 | ||||||||||
|
| |||||||||||
| 9,301,088 | ||||||||||||
|
| |||||||||||
Technology – 0.7% |
| |||||||||||
Avaya, Inc. | 1,985 | 1,664,919 | ||||||||||
10.50%, 3/01/21(a)(g)(j)(k) | 720 | 43,200 | ||||||||||
BMC Software Finance, Inc. | 2,100 | 2,154,852 | ||||||||||
Conduent Finance, Inc./Conduent Business Services LLC | 1,573 | 1,860,812 | ||||||||||
| 24 | AB INCOME FUND | abfunds.com |
PORTFOLIO OF INVESTMENTS (continued)
| Principal Amount (000) | U.S. $ Value | |||||||||||
| ||||||||||||
First Data Corp. | U.S.$ | 1,550 | $ | 1,616,185 | ||||||||
Infor Software Parent LLC/Infor Software Parent, Inc. | 2,340 | 2,403,203 | ||||||||||
Solera LLC/Solera Finance, Inc. | 1,500 | 1,707,075 | ||||||||||
Symantec Corp. | 573 | 598,756 | ||||||||||
Veritas US, Inc./Veritas Bermuda Ltd. | 1,307 | 1,393,602 | ||||||||||
|
| |||||||||||
| 13,442,604 | ||||||||||||
|
| |||||||||||
Transportation - Services – 0.8% |
| |||||||||||
Avis Budget Car Rental LLC/Avis Budget Finance, Inc. | 1,121 | 1,102,638 | ||||||||||
5.50%, 4/01/23 | 1,300 | 1,304,433 | ||||||||||
Hertz Corp. (The) | 1,478 | 1,334,708 | ||||||||||
5.875%, 10/15/20 | 524 | 520,798 | ||||||||||
7.625%, 6/01/22(a) | 819 | 851,940 | ||||||||||
Loxam SAS | EUR | 4,855 | 6,192,602 | |||||||||
United Rentals North America, Inc. | U.S.$ | 1,302 | 1,395,249 | |||||||||
5.875%, 9/15/26 | 812 | 884,901 | ||||||||||
XPO CNW, Inc. | 2,134 | 2,123,757 | ||||||||||
XPO Logistics, Inc. | 845 | 890,546 | ||||||||||
|
| |||||||||||
| 16,601,572 | ||||||||||||
|
| |||||||||||
| 234,974,626 | ||||||||||||
|
| |||||||||||
Financial Institutions – 3.0% |
| |||||||||||
Banking – 2.5% |
| |||||||||||
ABN AMRO Bank NV | EUR | 3,200 | 4,130,836 | |||||||||
Banco Bilbao Vizcaya Argentaria SA | 3,000 | 4,198,001 | ||||||||||
Banco Santander SA | 1,900 | 2,418,268 | ||||||||||
6.75%, 4/25/22(a)(m) | U.S.$ | 600 | 799,154 | |||||||||
Barclays Bank PLC | 656 | 794,206 | ||||||||||
Barclays PLC | GBP | 1,350 | 1,965,848 | |||||||||
8.00%, 12/15/20(m) | EUR | 2,000 | 2,702,451 | |||||||||
| abfunds.com | AB INCOME FUND | 25 |
PORTFOLIO OF INVESTMENTS (continued)
| Principal Amount (000) | U.S. $ Value | |||||||||||
| ||||||||||||
Citigroup, Inc. | U.S.$ | 2,055 | $ | 2,241,717 | ||||||||
Credit Agricole SA | EUR | 4,806 | 6,479,994 | |||||||||
8.125%, 12/23/25(a)(m) | U.S.$ | 2,233 | 2,683,128 | |||||||||
Credit Suisse Group AG | 640 | 700,000 | ||||||||||
7.50%, 12/11/23(a)(m) | 1,428 | 1,661,692 | ||||||||||
Goldman Sachs Group, Inc. (The) | 3,368 | 3,367,394 | ||||||||||
Intesa Sanpaolo SpA | 1,262 | 1,292,780 | ||||||||||
Series E | EUR | 246 | 318,111 | |||||||||
Lloyds Banking Group PLC | U.S.$ | 1,108 | 1,273,391 | |||||||||
Macquarie Bank Ltd./London | 200 | 209,892 | ||||||||||
Royal Bank of Scotland Group PLC | EUR | 150 | 169,977 | |||||||||
6.10%, 6/10/23 | U.S.$ | 1,819 | 2,025,675 | |||||||||
Series U | 2,900 | 2,815,929 | ||||||||||
Societe Generale SA | 2,015 | 2,350,538 | ||||||||||
Series E | 1,824 | 1,931,962 | ||||||||||
Standard Chartered PLC | 300 | 260,421 | ||||||||||
7.50%, 4/02/22(a)(m) | 1,278 | 1,401,902 | ||||||||||
7.75%, 4/02/23(a)(m) | 265 | 293,872 | ||||||||||
SunTrust Banks, Inc. | 838 | 859,185 | ||||||||||
UBS Group AG | 1,863 | 2,046,673 | ||||||||||
|
| |||||||||||
| 51,392,997 | ||||||||||||
|
| |||||||||||
Finance – 0.3% |
| |||||||||||
Enova International, Inc. | 3,178 | 3,212,164 | ||||||||||
goeasy Ltd. | 844 | 863,243 | ||||||||||
| 26 | AB INCOME FUND | abfunds.com |
PORTFOLIO OF INVESTMENTS (continued)
| Principal Amount (000) | U.S. $ Value | |||||||||||
| ||||||||||||
Navient Corp. | U.S.$ | 2,067 | $ | 2,196,684 | ||||||||
8.00%, 3/25/20 | 422 | 465,609 | ||||||||||
|
| |||||||||||
| 6,737,700 | ||||||||||||
|
| |||||||||||
Other Finance – 0.1% |
| |||||||||||
Creditcorp | 1,199 | 1,043,130 | ||||||||||
VFH Parent LLC/Orchestra Co-Issuer, Inc. | 118 | 122,651 | ||||||||||
|
| |||||||||||
| 1,165,781 | ||||||||||||
|
| |||||||||||
REITS – 0.1% |
| |||||||||||
Iron Mountain, Inc. | 736 | 746,356 | ||||||||||
MPT Operating Partnership LP/MPT Finance Corp. | 339 | 347,651 | ||||||||||
SBA Communications Corp. | 824 | 835,223 | ||||||||||
|
| |||||||||||
| 1,929,230 | ||||||||||||
|
| |||||||||||
| 61,225,708 | ||||||||||||
|
| |||||||||||
Utility – 0.4% |
| |||||||||||
Electric – 0.4% |
| |||||||||||
Calpine Corp. | 662 | 643,537 | ||||||||||
5.75%, 1/15/25 | 1,160 | 1,100,457 | ||||||||||
Dynegy, Inc. | 2,179 | 2,339,396 | ||||||||||
NRG Energy, Inc. | 1,801 | 1,924,333 | ||||||||||
Talen Energy Supply LLC | 965 | 882,338 | ||||||||||
6.50%, 6/01/25 | 540 | 469,676 | ||||||||||
|
| |||||||||||
| 7,359,737 | ||||||||||||
|
| |||||||||||
Natural Gas – 0.0% |
| |||||||||||
NGL Energy Partners LP/NGL Energy Finance Corp. | 214 | 213,730 | ||||||||||
|
| |||||||||||
| 7,573,467 | ||||||||||||
|
| |||||||||||
Total Corporates – Non-Investment Grade | 303,773,801 | |||||||||||
|
| |||||||||||
| abfunds.com | AB INCOME FUND | 27 |
PORTFOLIO OF INVESTMENTS (continued)
| Principal Amount (000) | U.S. $ Value | |||||||||||
| ||||||||||||
EMERGING MARKETS – TREASURIES – 6.3% | ||||||||||||
Argentina – 1.7% | ||||||||||||
Argentina POM Politica Monetaria | ARS | 309,074 | $ | 18,760,898 | ||||||||
Argentine Bonos del Tesoro | 48,330 | 2,850,603 | ||||||||||
16.00%, 10/17/23 | 75,139 | 4,279,958 | ||||||||||
18.20%, 10/03/21 | 103,390 | 5,977,337 | ||||||||||
21.20%, 9/19/18 | 35,317 | 1,961,289 | ||||||||||
|
| |||||||||||
| 33,830,085 | ||||||||||||
|
| |||||||||||
Brazil – 2.7% | ||||||||||||
Brazil Notas do Tesouro Nacional | BRL | 174,642 | 54,549,849 | |||||||||
|
| |||||||||||
Dominican Republic – 0.2% | ||||||||||||
Dominican Republic International Bond | DOP | 149,900 | 3,986,747 | |||||||||
|
| |||||||||||
Nigeria – 0.1% | ||||||||||||
Nigeria Government Bond | NGN | 695,000 | 1,897,684 | |||||||||
|
| |||||||||||
Sri Lanka – 0.3% | ||||||||||||
Sri Lanka Government Bonds | LKR | 444,000 | 2,871,560 | |||||||||
Series A | 644,000 | 4,398,995 | ||||||||||
|
| |||||||||||
| 7,270,555 | ||||||||||||
|
| |||||||||||
Turkey – 1.3% | ||||||||||||
Turkey Government Bond | TRY | 23,586 | 5,906,497 | |||||||||
11.00%, 2/24/27 | 82,608 | 21,128,036 | ||||||||||
|
| |||||||||||
| 27,034,533 | ||||||||||||
|
| |||||||||||
Total Emerging Markets – Treasuries | 128,569,453 | |||||||||||
|
| |||||||||||
COLLATERALIZED MORTGAGE OBLIGATIONS – 6.0% | ||||||||||||
Risk Share Floating Rate – 4.7% | ||||||||||||
Bellemeade Re Ltd. | U.S.$ | 5,300 | 5,300,000 | |||||||||
| 28 | AB INCOME FUND | abfunds.com |
PORTFOLIO OF INVESTMENTS (continued)
| Principal Amount (000) | U.S. $ Value | |||||||||
| ||||||||||
Federal Home Loan Mortgage Corp Structured Agency Credit Risk Debt Notes | U.S.$ | 4,550 | $ | 4,701,665 | ||||||
Federal Home Loan Mortgage Corp. Structured Agency Credit Risk Debt Notes | 3,250 | 3,958,746 | ||||||||
Series 2013-DN2, Class M2 | 5,605 | 6,181,349 | ||||||||
Series 2014-DN1, Class M3 | 4,455 | 5,139,156 | ||||||||
Series 2014-DN2, Class M3 | 4,170 | 4,592,569 | ||||||||
Series 2014-DN3, Class M3 | 4,877 | 5,247,846 | ||||||||
Series 2014-DN4, Class M3 | 643 | 700,487 | ||||||||
Series 2014-HQ2, Class M3 | 1,010 | 1,136,043 | ||||||||
Series 2015-DN1, Class B | 2,632 | 3,813,819 | ||||||||
Series 2015-DNA2, Class B | 1,497 | 1,813,132 | ||||||||
Series 2015-DNA2, Class M2 | 2,939 | 2,998,632 | ||||||||
Series 2015-HQA1, Class B | 1,588 | 1,904,343 | ||||||||
Series 2016-DNA2, Class M3 | 6,000 | 6,799,319 | ||||||||
Series 2017-DNA2, Class B1 | 1,650 | 1,780,990 | ||||||||
| abfunds.com | AB INCOME FUND | 29 |
PORTFOLIO OF INVESTMENTS (continued)
| Principal Amount (000) | U.S. $ Value | |||||||||
| ||||||||||
Series 2017-DNA2, Class M2 | U.S.$ | 1,168 | $ | 1,238,332 | ||||||
Federal National Mortgage Association Connecticut Avenue Securities | 1,606 | 1,806,955 | ||||||||
Series 2014-C04, Class 1M2 | 5,736 | 6,508,827 | ||||||||
Series 2015-C01, Class 1M2 | 3,596 | 3,863,685 | ||||||||
Series 2015-C02, Class 2M2 | 763 | 806,812 | ||||||||
Series 2015-C03, Class 1M2 | 1,089 | 1,203,127 | ||||||||
Series 2015-C03, Class 2M2 | 2,554 | 2,791,582 | ||||||||
Series 2016-C05, Class 2B | 2,749 | 3,455,249 | ||||||||
Series 2016-C05, Class 2M2 | 5,000 | 5,503,974 | ||||||||
Series 2016-C07, Class 2B | 1,193 | 1,415,180 | ||||||||
Series 2017-C01, Class 1B1 | 4,300 | 4,855,642 | ||||||||
Series 2017-C02, Class 2M2 | 709 | 755,158 | ||||||||
JP Morgan Madison Avenue Securities Trust | 1,723 | 1,877,648 | ||||||||
Series 2015-CH1, Class M2 | 2,225 | 2,512,331 | ||||||||
| 30 | AB INCOME FUND | abfunds.com |
PORTFOLIO OF INVESTMENTS (continued)
| Principal Amount (000) | U.S. $ Value | |||||||||||
| ||||||||||||
Wells Fargo Credit Risk Transfer Securities Trust | U.S.$ | 934 | $ | 1,059,507 | ||||||||
|
| |||||||||||
| 95,722,105 | ||||||||||||
|
| |||||||||||
Non-Agency Fixed Rate – 0.9% | ||||||||||||
Alternative Loan Trust | 164 | 146,581 | ||||||||||
Series 2006-19CB, Class A24 | 105 | 93,844 | ||||||||||
Series 2006-24CB, Class A15 | 1,638 | 1,380,451 | ||||||||||
Series 2006-41CB, Class 2A13 | 1,327 | 1,095,890 | ||||||||||
Series 2007-13, Class A2 | 2,054 | 1,766,220 | ||||||||||
BCAP LLC Trust | 729 | 565,621 | ||||||||||
BNPP Mortgage Securities LLC Trust | 1,219 | 996,871 | ||||||||||
Citigroup Mortgage Loan Trust | 2,601 | 2,480,023 | ||||||||||
Series 2007-AR4, Class 1A1A | 346 | 334,620 | ||||||||||
Series 2010-3, Class 2A2 | 622 | 539,352 | ||||||||||
Countrywide Home Loan Mortgage Pass-Through Trust | 1,029 | 893,874 | ||||||||||
Series 2007-16, Class A1 | 1,005 | 879,435 | ||||||||||
Series 2007-HY4, Class 1A1 | 569 | 531,281 | ||||||||||
Credit Suisse Mortgage Trust | 906 | 922,133 | ||||||||||
CSMC Mortgage-Backed Trust | 688 | 573,649 | ||||||||||
Morgan Stanley Mortgage Loan Trust | 642 | 579,656 | ||||||||||
| abfunds.com | AB INCOME FUND | 31 |
PORTFOLIO OF INVESTMENTS (continued)
| Principal Amount (000) | U.S. $ Value | |||||||||||
| ||||||||||||
Nomura Resecuritization Trust | U.S.$ | 1,805 | $ | 1,558,241 | ||||||||
Wells Fargo Mortgage Backed Securities Trust | 2,612 | 2,528,923 | ||||||||||
|
| |||||||||||
| 17,866,665 | ||||||||||||
|
| |||||||||||
Agency Fixed Rate – 0.4% | ||||||||||||
Federal National Mortgage Association REMICs | 8,808 | 830,006 | ||||||||||
Government National Mortgage Association | 41,006 | 7,677,447 | ||||||||||
|
| |||||||||||
| 8,507,453 | ||||||||||||
|
| |||||||||||
Non-Agency Floating Rate – 0.0% | ||||||||||||
Credit Suisse Mortgage Trust | 178 | 144,272 | ||||||||||
First Horizon Alternative Mortgage Securities Trust | 625 | 357,222 | ||||||||||
Lehman XS Trust | 704 | 126,956 | ||||||||||
|
| |||||||||||
| 628,450 | ||||||||||||
|
| |||||||||||
Total Collateralized Mortgage Obligations | 122,724,673 | |||||||||||
|
| |||||||||||
LOCAL GOVERNMENTS – PROVINCIAL BONDS – 4.6% | ||||||||||||
Canada – 4.6% | ||||||||||||
Province of Alberta Canada | CAD | 16,314 | 13,451,810 | |||||||||
Province of British Columbia Canada | 11,254 | 12,365,268 | ||||||||||
Province of Manitoba Canada | 15,924 | 16,959,720 | ||||||||||
Province of Ontario Canada | 11,092 | 12,814,050 | ||||||||||
| 32 | AB INCOME FUND | abfunds.com |
PORTFOLIO OF INVESTMENTS (continued)
| Principal Amount (000) | U.S. $ Value | |||||||||||
| ||||||||||||
Province of Quebec Canada | CAD | 19,724 | $ | 22,083,817 | ||||||||
Province of Saskatchewan Canada | 19,693 | 16,098,772 | ||||||||||
|
| |||||||||||
Total Local Governments – Provincial Bonds | 93,773,437 | |||||||||||
|
| |||||||||||
CORPORATES – INVESTMENT GRADE – 3.7% | ||||||||||||
Financial Institutions – 2.2% | ||||||||||||
Banking – 0.5% | ||||||||||||
BNP Paribas SA | U.S.$ | 1,310 | 1,468,851 | |||||||||
Cooperatieve Rabobank UA | EUR | 1,000 | 1,354,137 | |||||||||
11.00%, 6/30/19(a)(m) | U.S.$ | 1,061 | 1,204,596 | |||||||||
HSBC Holdings PLC | EUR | 896 | 1,131,397 | |||||||||
JPMorgan Chase & Co. | U.S.$ | 2,998 | 3,458,852 | |||||||||
Santander Holdings USA, Inc. | 2,686 | 2,766,822 | ||||||||||
|
| |||||||||||
| 11,384,655 | ||||||||||||
|
| |||||||||||
Insurance – 1.7% | ||||||||||||
ACE Capital Trust II | 750 | 1,132,200 | ||||||||||
AIG Life Holdings, Inc. | 509 | 715,145 | ||||||||||
American International Group, Inc. | 2,525 | 3,441,626 | ||||||||||
Assicurazioni Generali SpA | EUR | 2,700 | 4,068,965 | |||||||||
CNP Assurances | 1,000 | 1,351,225 | ||||||||||
Fairfax Financial Holdings Ltd. | U.S.$ | 5,000 | 6,205,700 | |||||||||
Great-West Life & Annuity Insurance | 2,707 | 2,693,032 | ||||||||||
Groupama SA | EUR | 3,100 | 4,572,291 | |||||||||
| abfunds.com | AB INCOME FUND | 33 |
PORTFOLIO OF INVESTMENTS (continued)
| Principal Amount (000) | U.S. $ Value | |||||||||||
| ||||||||||||
Hartford Financial Services Group, Inc. (The) | U.S.$ | 3,275 | $ | 3,142,428 | ||||||||
MetLife, Inc. | 2,033 | 2,344,130 | ||||||||||
Prudential Financial, Inc. | 1,180 | 1,302,272 | ||||||||||
Transatlantic Holdings, Inc. | 2,122 | 2,878,047 | ||||||||||
|
| |||||||||||
| 33,847,061 | ||||||||||||
|
| |||||||||||
| 45,231,716 | ||||||||||||
|
| |||||||||||
Industrial – 1.3% | ||||||||||||
Basic – 0.3% | ||||||||||||
Anglo American Capital PLC | 655 | 692,040 | ||||||||||
Braskem Finance Ltd. | 1,204 | 1,370,935 | ||||||||||
GTL Trade Finance, Inc. | 2,711 | 2,929,642 | ||||||||||
7.25%, 4/16/44(a) | 274 | 300,112 | ||||||||||
Minsur SA | 285 | 316,350 | ||||||||||
|
| |||||||||||
| 5,609,079 | ||||||||||||
|
| |||||||||||
Capital Goods – 0.1% | ||||||||||||
CNH Industrial Capital LLC | 119 | 126,906 | ||||||||||
General Electric Co. | 1,203 | 1,254,308 | ||||||||||
|
| |||||||||||
| 1,381,214 | ||||||||||||
|
| |||||||||||
Communications - Media – 0.0% | ||||||||||||
Myriad International Holdings BV | 683 | 741,055 | ||||||||||
|
| |||||||||||
Communications - Telecommunications – 0.1% | ||||||||||||
Sprint Spectrum Co. LLC/Sprint Spectrum | 1,215 | 1,231,159 | ||||||||||
|
| |||||||||||
Consumer Non-Cyclical – 0.3% | ||||||||||||
Teva Pharmaceutical Finance Netherlands III BV | 6,159 | 5,789,460 | ||||||||||
|
| |||||||||||
| 34 | AB INCOME FUND | abfunds.com |
PORTFOLIO OF INVESTMENTS (continued)
| Principal Amount (000) | U.S. $ Value | |||||||||||
| ||||||||||||
Energy – 0.3% |
| |||||||||||
Andeavor Logistics LP/Tesoro Logistics Finance Corp. | U.S.$ | 1,586 | $ | 1,688,059 | ||||||||
Ecopetrol SA | 716 | 807,290 | ||||||||||
Hess Corp. | 1,598 | 1,927,108 | ||||||||||
Kinder Morgan, Inc./DE | 1,073 | 1,379,471 | ||||||||||
|
| |||||||||||
| 5,801,928 | ||||||||||||
|
| |||||||||||
Technology – 0.2% |
| |||||||||||
Hewlett Packard Enterprise Co. | 336 | 357,844 | ||||||||||
VMware, Inc. | 3,140 | 3,150,142 | ||||||||||
Xerox Corp. | 1,714 | 1,691,735 | ||||||||||
|
| |||||||||||
| 5,199,721 | ||||||||||||
|
| |||||||||||
| 25,753,616 | ||||||||||||
|
| |||||||||||
| Utility – 0.2% | ||||||||||||
Electric – 0.2% |
| |||||||||||
ComEd Financing III | 3,462 | 3,785,143 | ||||||||||
|
| |||||||||||
Total Corporates – Investment Grade | 74,770,475 | |||||||||||
|
| |||||||||||
EMERGING MARKETS – SOVEREIGNS – 2.9% | ||||||||||||
Angola – 0.1% |
| |||||||||||
Angolan Government International Bond | 2,615 | 2,843,812 | ||||||||||
|
| |||||||||||
Argentina – 0.6% |
| |||||||||||
Argentine Republic Government International Bond | 9,843 | 10,735,971 | ||||||||||
7.50%, 4/22/26 | 870 | 983,100 | ||||||||||
|
| |||||||||||
| 11,719,071 | ||||||||||||
|
| |||||||||||
Bahrain – 0.1% |
| |||||||||||
Bahrain Government International Bond | 1,709 | 1,703,121 | ||||||||||
7.00%, 10/12/28(a) | 1,288 | 1,321,810 | ||||||||||
|
| |||||||||||
| 3,024,931 | ||||||||||||
|
| |||||||||||
Belarus – 0.0% |
| |||||||||||
Republic of Belarus International Bond | 275 | 292,589 | ||||||||||
|
| |||||||||||
| abfunds.com | AB INCOME FUND | 35 |
PORTFOLIO OF INVESTMENTS (continued)
| Principal Amount (000) | U.S. $ Value | |||||||||||
| ||||||||||||
Dominican Republic – 0.2% |
| |||||||||||
Dominican Republic International Bond | U.S.$ | 1,213 | $ | 1,303,975 | ||||||||
7.45%, 4/30/44(a) | 1,873 | 2,221,846 | ||||||||||
|
| |||||||||||
| 3,525,821 | ||||||||||||
|
| |||||||||||
Ecuador – 0.3% |
| |||||||||||
Ecuador Government International Bond | 4,000 | 4,084,120 | ||||||||||
9.65%, 12/13/26(a) | 734 | 790,885 | ||||||||||
10.50%, 3/24/20(a) | 1,974 | 2,141,790 | ||||||||||
|
| |||||||||||
| 7,016,795 | ||||||||||||
|
| |||||||||||
Egypt – 0.4% |
| |||||||||||
Citigroup Global Markets Holdings, Inc./United States | EGP | 49,911 | 2,716,912 | |||||||||
Egypt Government International Bond | U.S.$ | 4,666 | 4,870,138 | |||||||||
|
| |||||||||||
| 7,587,050 | ||||||||||||
|
| |||||||||||
El Salvador – 0.1% |
| |||||||||||
El Salvador Government International Bond | 1,427 | 1,480,513 | ||||||||||
|
| |||||||||||
Honduras – 0.1% |
| |||||||||||
Honduras Government International Bond | 1,555 | 1,675,513 | ||||||||||
|
| |||||||||||
Ivory Coast – 0.1% |
| |||||||||||
Ivory Coast Government International Bond | 2,440 | 2,531,500 | ||||||||||
|
| |||||||||||
Kenya – 0.1% |
| |||||||||||
Kenya Government International Bond | 1,252 | 1,287,995 | ||||||||||
|
| |||||||||||
Lebanon – 0.1% |
| |||||||||||
Lebanon Government International Bond | 2,500 | 2,650,000 | ||||||||||
|
| |||||||||||
Nigeria – 0.1% | ||||||||||||
Nigeria Government International Bond | 248 | 254,820 | ||||||||||
6.75%, 1/28/21(a) | 501 | 532,939 | ||||||||||
7.875%, 2/16/32(a) | 426 | 467,002 | ||||||||||
|
| |||||||||||
| 1,254,761 | ||||||||||||
|
| |||||||||||
| 36 | AB INCOME FUND | abfunds.com |
PORTFOLIO OF INVESTMENTS (continued)
| Principal Amount (000) | U.S. $ Value | |||||||||||
| ||||||||||||
Senegal – 0.1% | ||||||||||||
Senegal Government International Bond | U.S.$ | 608 | $ | 628,940 | ||||||||
8.75%, 5/13/21(a) | 864 | 1,000,080 | ||||||||||
|
| |||||||||||
| 1,629,020 | ||||||||||||
|
| |||||||||||
Sri Lanka – 0.1% | ||||||||||||
Sri Lanka Government International Bond | 2,000 | 2,134,520 | ||||||||||
6.20%, 5/11/27(a) | 685 | 726,634 | ||||||||||
|
| |||||||||||
| 2,861,154 | ||||||||||||
|
| |||||||||||
Turkey – 0.3% | ||||||||||||
Turkey Government International Bond | 4,597 | 4,249,287 | ||||||||||
6.00%, 3/25/27 | 1,761 | 1,855,654 | ||||||||||
|
| |||||||||||
| 6,104,941 | ||||||||||||
|
| |||||||||||
Zambia – 0.1% | ||||||||||||
Zambia Government International Bond | 1,553 | 1,661,710 | ||||||||||
|
| |||||||||||
Total Emerging Markets – Sovereigns | 59,147,176 | |||||||||||
|
| |||||||||||
ASSET-BACKED SECURITIES – 2.6% | ||||||||||||
Autos - Fixed Rate – 1.5% | ||||||||||||
CPS Auto Receivables Trust | 2,500 | 2,676,825 | ||||||||||
Series 2017-C, Class E | 1,400 | 1,432,965 | ||||||||||
CPS Auto Trust | 3,000 | 3,165,350 | ||||||||||
Series 2017-A, Class E | 3,500 | 3,607,395 | ||||||||||
Exeter Automobile Receivables Trust | 1,220 | 1,287,296 | ||||||||||
Series 2016-3A, Class D | 1,090 | 1,119,865 | ||||||||||
Series 2017-1A, Class D | 2,000 | 2,062,763 | ||||||||||
Series 2017-3A, Class D | ||||||||||||
5.28%, 10/15/24(a) | 4,370 | 4,351,663 | ||||||||||
Flagship Credit Auto Trust |
| |||||||||||
Series 2015-2, Class D | 1,750 | 1,818,221 | ||||||||||
| abfunds.com | AB INCOME FUND | 37 |
PORTFOLIO OF INVESTMENTS (continued)
| Principal Amount (000) | U.S. $ Value | |||||||||||
| ||||||||||||
Series 2016-2, Class D | U.S.$ | 4,200 | $ | 4,562,337 | ||||||||
Series 2017-1, Class E | 1,000 | 1,035,463 | ||||||||||
Hertz Vehicle Financing LLC | 2,169 | 2,159,749 | ||||||||||
|
| |||||||||||
| 29,279,892 | ||||||||||||
|
| |||||||||||
Other ABS - Fixed Rate – 1.1% | ||||||||||||
Atlas Ltd. | 1,317 | 1,318,203 | ||||||||||
Marlette Funding Trust | 1,850 | 1,896,859 | ||||||||||
Prosper Marketplace Issuance Trust | 4,650 | 4,679,576 | ||||||||||
SoFi Consumer Loan Program LLC | ||||||||||||
Zero Coupon, 8/25/25(g)(i) | 11,603 | 3,654,969 | ||||||||||
Zero Coupon, 9/25/28(g)(i) | 24 | 1,206,793 | ||||||||||
Series 2017-1, Class B | 2,205 | 2,280,156 | ||||||||||
Series 2017-2, Class R | ||||||||||||
Zero Coupon, 2/25/26(g)(i) | 13 | 988,585 | ||||||||||
Series 2017-3, Class B | 2,026 | 2,040,589 | ||||||||||
Series 2017-3, Class R | ||||||||||||
Zero Coupon, 5/25/26(g)(i) | 10 | 1,208,627 | ||||||||||
Zero Coupon, 5/26/26(g)(i) | 19 | 2,078,128 | ||||||||||
Zero Coupon, 9/25/26(g)(i) | 17 | 1,758,337 | ||||||||||
|
| |||||||||||
| 23,110,822 | ||||||||||||
|
| |||||||||||
Home Equity Loans - Fixed Rate – 0.0% | ||||||||||||
Morgan Stanley Mortgage Loan Trust | 944 | 663,866 | ||||||||||
|
| |||||||||||
Total Asset-Backed Securities | 53,054,580 | |||||||||||
|
| |||||||||||
| 38 | AB INCOME FUND | abfunds.com |
PORTFOLIO OF INVESTMENTS (continued)
| Principal Amount (000) | U.S. $ Value | |||||||||||
| ||||||||||||
EMERGING MARKETS – CORPORATE BONDS – 2.3% | ||||||||||||
Industrial – 2.0% |
| |||||||||||
Basic – 0.5% | ||||||||||||
Consolidated Energy Finance SA | U.S.$ | 787 | $ | 832,095 | ||||||||
Elementia SAB de CV | 1,039 | 1,067,573 | ||||||||||
Nexa Resources SA | 1,300 | 1,373,027 | ||||||||||
Petra Diamonds US Treasury PLC | 461 | 457,086 | ||||||||||
Stillwater Mining Co. | 1,575 | 1,601,381 | ||||||||||
7.125%, 6/27/25(a) | 1,116 | 1,147,706 | ||||||||||
Suzano Austria GmbH | 1,883 | 2,024,225 | ||||||||||
Vedanta Resources PLC | 1,474 | 1,540,330 | ||||||||||
|
| |||||||||||
| 10,043,423 | ||||||||||||
|
| |||||||||||
Capital Goods – 0.3% | ||||||||||||
Indo Energy Finance II BV | 1,390 | 1,401,038 | ||||||||||
Odebrecht Finance Ltd. | 6,760 | 2,535,000 | ||||||||||
5.25%, 6/27/29(a) | 2,103 | 778,110 | ||||||||||
|
| |||||||||||
| 4,714,148 | ||||||||||||
|
| |||||||||||
Communications - Telecommunications – 0.2% | ||||||||||||
Digicel Ltd. | 700 | 688,625 | ||||||||||
6.75%, 3/01/23(a) | 385 | 379,706 | ||||||||||
Millicom International Cellular SA | 1,762 | 1,776,061 | ||||||||||
MTN Mauritius Investment Ltd. | 1,500 | 1,543,125 | ||||||||||
|
| |||||||||||
| 4,387,517 | ||||||||||||
|
| |||||||||||
Consumer Cyclical - Other – 0.1% | ||||||||||||
Servicios Corporativos Javer SAB de CV | 884 | 909,207 | ||||||||||
|
| |||||||||||
Consumer Non-Cyclical – 0.4% | ||||||||||||
Central American Bottling Corp. | 718 | 757,195 | ||||||||||
Cosan Ltd. | 587 | 606,653 | ||||||||||
Marfrig Holdings Europe BV | 2,420 | 2,524,967 | ||||||||||
Minerva Luxembourg SA | 3,300 | 3,422,100 | ||||||||||
| abfunds.com | AB INCOME FUND | 39 |
PORTFOLIO OF INVESTMENTS (continued)
| Principal Amount (000) | U.S. $ Value | |||||||||||
| ||||||||||||
Tonon Luxembourg SA | U.S.$ | 2,280 | $ | 253,685 | ||||||||
Virgolino de Oliveira Finance SA | 4,738 | 242,818 | ||||||||||
10.875%, 1/13/20(i)(j)(k) | 750 | 206,246 | ||||||||||
11.75%, 2/09/22(i)(j)(k) | 1,690 | 86,611 | ||||||||||
|
| |||||||||||
| 8,100,275 | ||||||||||||
|
| |||||||||||
Energy – 0.4% |
| |||||||||||
Petrobras Global Finance BV | 2,416 | 2,611,696 | ||||||||||
6.25%, 3/17/24 | 2,863 | 3,073,001 | ||||||||||
YPF SA | 2,036 | 2,178,298 | ||||||||||
16.50%, 5/09/22(a) | ARS | 13,912 | 736,668 | |||||||||
|
| |||||||||||
| 8,599,663 | ||||||||||||
|
| |||||||||||
Other Industrial – 0.0% |
| |||||||||||
Noble Group Ltd. | U.S.$ | 1,362 | 563,555 | |||||||||
|
| |||||||||||
Technology – 0.0% |
| |||||||||||
IHS Netherlands Holdco BV | 500 | 530,000 | ||||||||||
|
| |||||||||||
Transportation - Services – 0.1% |
| |||||||||||
Rumo Luxembourg SARL | 2,272 | 2,481,024 | ||||||||||
|
| |||||||||||
| 40,328,812 | ||||||||||||
|
| |||||||||||
Financial Institutions – 0.2% |
| |||||||||||
Banking – 0.2% |
| |||||||||||
Akbank Turk AS | 530 | 548,174 | ||||||||||
Banco do Brasil SA/Cayman | 1,431 | 1,570,522 | ||||||||||
Zenith Bank PLC | 1,400 | 1,435,000 | ||||||||||
|
| |||||||||||
| 3,553,696 | ||||||||||||
|
| |||||||||||
Finance – 0.0% |
| |||||||||||
Unifin Financiera SAB de CV SOFOM ENR | 575 | 604,239 | ||||||||||
|
| |||||||||||
| 4,157,935 | ||||||||||||
|
| |||||||||||
Utility – 0.1% |
| |||||||||||
Electric – 0.1% |
| |||||||||||
Pampa Energia SA | 2,500 | 2,725,500 | ||||||||||
|
| |||||||||||
Total Emerging Markets – Corporate Bonds | 47,212,247 | |||||||||||
|
| |||||||||||
| 40 | AB INCOME FUND | abfunds.com |
PORTFOLIO OF INVESTMENTS (continued)
| Principal Amount (000) | U.S. $ Value | |||||||||||
| ||||||||||||
| AGENCIES – 2.2% | ||||||||||||
Agency Debentures – 2.2% | ||||||||||||
Federal Home Loan Banks | U.S.$ | 8,695 | $ | 11,729,816 | ||||||||
Federal Home Loan Mortgage Corp. 6.25%, 7/15/32 | 15,000 | 21,112,500 | ||||||||||
6.75%, 3/15/31 | 4,000 | 5,764,400 | ||||||||||
Residual Funding Corp. Principal Strip | 5,277 | 5,003,546 | ||||||||||
|
| |||||||||||
Total Agencies | 43,610,262 | |||||||||||
|
| |||||||||||
COMMERCIAL MORTGAGE-BACKED SECURITIES – 2.1% | ||||||||||||
Non-Agency Fixed Rate CMBS – 2.0% | ||||||||||||
Citigroup Commercial Mortgage Trust | 6,525 | 6,235,445 | ||||||||||
Commercial Mortgage Trust | 3,219 | 2,747,643 | ||||||||||
Series 2014-LC17, Class D | 3,549 | 2,437,553 | ||||||||||
Series 2015-DC1, Class D | 2,730 | 2,102,098 | ||||||||||
Csail Commercial Mortgage Trust | 4,091 | 3,105,863 | ||||||||||
GS Mortgage Securities Trust | 2,652 | 2,567,743 | ||||||||||
Series 2013-GC13, Class D | 9,440 | 8,750,913 | ||||||||||
JP Morgan Chase Commercial Mortgage Securities Trust | 1,863 | 1,871,992 | ||||||||||
JPMBB Commercial Mortgage Securities Trust | 1,300 | 1,316,755 | ||||||||||
LB-UBS Commercial Mortgage Trust | 1,750 | 1,775,988 | ||||||||||
Morgan Stanley Bank of America Merrill Lynch Trust | 603 | 486,904 | ||||||||||
| abfunds.com | AB INCOME FUND | 41 |
PORTFOLIO OF INVESTMENTS (continued)
| Principal Amount (000) | U.S. $ Value | |||||||||||
| ||||||||||||
WF-RBS Commercial Mortgage Trust Series 2012-C8, Class E | U.S.$ | 4,000 | $ | 3,880,149 | ||||||||
Series 2014-C23, Class D | ||||||||||||
3.992%, 10/15/57(a)(g) | 2,699 | 2,162,353 | ||||||||||
|
| |||||||||||
| 39,441,399 | ||||||||||||
|
| |||||||||||
Non-Agency Floating Rate CMBS – 0.1% | ||||||||||||
CLNS Trust | 1,480 | 1,487,415 | ||||||||||
Credit Suisse Mortgage Trust | 755 | 762,072 | ||||||||||
|
| |||||||||||
| 2,249,487 | ||||||||||||
|
| |||||||||||
Agency CMBS – 0.0% | ||||||||||||
Government National Mortgage Association | 447 | 264 | ||||||||||
|
| |||||||||||
Total Commercial Mortgage-Backed Securities | 41,691,150 | |||||||||||
|
| |||||||||||
GOVERNMENTS – SOVEREIGN AGENCIES – 1.3% | ||||||||||||
Canada – 1.3% | ||||||||||||
Canada Housing Trust No. 1 | CAD | 32,700 | 27,117,098 | |||||||||
|
| |||||||||||
QUASI-SOVEREIGNS – 0.9% | ||||||||||||
Quasi-Sovereign Bonds – 0.9% | ||||||||||||
Indonesia – 0.3% | ||||||||||||
Majapahit Holding BV | U.S.$ | 4,738 | 6,423,449 | |||||||||
|
| |||||||||||
Mexico – 0.6% | ||||||||||||
Petroleos Mexicanos | 4,145 | 4,247,382 | ||||||||||
5.50%, 1/21/21 | 6,025 | 6,401,562 | ||||||||||
|
| |||||||||||
| 10,648,944 | ||||||||||||
|
| |||||||||||
Total Quasi-Sovereigns | 17,072,393 | |||||||||||
|
| |||||||||||
| 42 | AB INCOME FUND | abfunds.com |
PORTFOLIO OF INVESTMENTS (continued)
| Principal Amount (000) | U.S. $ Value | |||||||||||
| ||||||||||||
COLLATERALIZED LOAN OBLIGATIONS – 0.7% | ||||||||||||
CLO - Floating Rate – 0.7% | ||||||||||||
Apidos CLO XXVI | U.S.$ | 550 | $ | 544,319 | ||||||||
BlueMountain CLO Ltd. | 2,000 | 2,029,132 | ||||||||||
BlueMountain Fuji US Clo II Ltd. | 3,300 | 3,311,362 | ||||||||||
CBAM 2017-3 Ltd. | 1,604 | 1,610,480 | ||||||||||
CIFC Funding Ltd. | 250 | 247,360 | ||||||||||
Dryden 49 Senior Loan Fund | 605 | 599,072 | ||||||||||
OZLM VII Ltd. | 1,000 | 1,003,755 | ||||||||||
Series 2014-7A, Class D | 2,000 | 1,964,328 | ||||||||||
OZLM VIII Ltd. | 1,908 | 1,909,778 | ||||||||||
Venture XXVII CLO Ltd. | 1,591 | 1,625,608 | ||||||||||
|
| |||||||||||
Total Collateralized Loan Obligations | 14,845,194 | |||||||||||
|
| |||||||||||
WHOLE LOAN TRUSTS – 0.5% | ||||||||||||
Performing Asset – 0.5% | ||||||||||||
Alpha Credit Debt Fund LLC | 106 | 106,429 | ||||||||||
16.00%, 1/01/21(e)(f)(g) | MXN | 25,281 | 1,318,665 | |||||||||
| abfunds.com | AB INCOME FUND | 43 |
PORTFOLIO OF INVESTMENTS (continued)
| Principal Amount (000) | U.S. $ Value | |||||||||||
| ||||||||||||
AlphaCredit Capital, SA de CV | MXN | 6,899 | $ | 359,829 | ||||||||
Deutsche Bank Mexico SA | 37,292 | 1,196,840 | ||||||||||
8.00%, 10/31/34(e)(f)(g) | 23,322 | 748,490 | ||||||||||
Flexpath Wh I LLC | U.S.$ | 607 | 327,564 | |||||||||
Recife Funding Ltd. | 2,884 | 2,431,466 | ||||||||||
Sheridan Auto Loan Holdings I LLC | 2,225 | 1,400,148 | ||||||||||
Sheridan Consumer Finance Trust | 3,075 | 2,844,263 | ||||||||||
|
| |||||||||||
Total Whole Loan Trusts | 10,733,694 | |||||||||||
|
| |||||||||||
INFLATION-LINKED SECURITIES – 0.5% | ||||||||||||
Brazil – 0.2% | ||||||||||||
Brazil Notas do Tesouro Nacional | BRL | 4,145 | 4,235,949 | |||||||||
|
| |||||||||||
Mexico – 0.3% | ||||||||||||
Mexican Udibonos | MXN | 122,772 | 6,490,235 | |||||||||
|
| |||||||||||
Total Inflation-Linked Securities | 10,726,184 | |||||||||||
|
| |||||||||||
| Shares | ||||||||||||
COMMON STOCKS – 0.2% | ||||||||||||
Energy – 0.1% | ||||||||||||
Oil, Gas & Consumable Fuels – 0.1% | ||||||||||||
Berry Pete Corp.(e)(g)(k) | 74,583 | 578,018 | ||||||||||
Paragon Litigation – Class A(e)(g) | 10,360 | 11,220 | ||||||||||
Paragon Litigation – Class B(e)(g) | 15,538 | 295,222 | ||||||||||
Paragon Offshore Ltd.(e)(g) | 10,358 | 169,177 | ||||||||||
SandRidge Energy, Inc.(k) | 2,859 | 53,664 | ||||||||||
Vantage Drilling International(e)(k) | 5,303 | 981,055 | ||||||||||
|
| |||||||||||
| 2,088,356 | ||||||||||||
|
| |||||||||||
Financials – 0.1% | ||||||||||||
Diversified Financial Services – 0.1% | ||||||||||||
Holdco, Inc.(e)(f)(g) | 1,836,868 | 1,175,596 | ||||||||||
|
| |||||||||||
| 44 | AB INCOME FUND | abfunds.com |
PORTFOLIO OF INVESTMENTS (continued)
| Shares | U.S. $ Value | |||||||||||
|
|
| ||||||||||
Consumer Discretionary – 0.0% | ||||||||||||
Media – 0.0% | ||||||||||||
Ion Media Networks, Inc. – Class A(e)(f)(g)(k) | 2,512 | $ | 942,251 | |||||||||
|
| |||||||||||
Industrials – 0.0% | ||||||||||||
Consumer Cyclical - Automotive – 0.0% | ||||||||||||
Exide Technologies/Old(f)(k)(r) | 45,790 | 181,002 | ||||||||||
|
|
|
| |||||||||
Total Common Stocks | 4,387,205 | |||||||||||
|
| |||||||||||
| Principal Amount (000) | ||||||||||||
LOCAL GOVERNMENTS – REGIONAL BONDS – 0.2% | ||||||||||||
Argentina – 0.2% | ||||||||||||
Provincia de Buenos Aires/Argentina | ||||||||||||
5.75%, 6/15/19(a) | U.S.$ | 1,057 | 1,093,995 | |||||||||
9.125%, 3/16/24(a) | 363 | 423,803 | ||||||||||
24.50% (BADLAR + 3.83%), 5/31/22(n) | ARS | 28,600 | 1,649,985 | |||||||||
Provincia de Cordoba | U.S.$ | 493 | 531,207 | |||||||||
|
| |||||||||||
Total Local Governments – Regional Bonds | 3,698,990 | |||||||||||
|
| |||||||||||
| Shares | ||||||||||||
PREFERRED STOCKS – 0.2% | ||||||||||||
Financial Institutions – 0.2% | ||||||||||||
Services – 0.1% | ||||||||||||
Holdco, Inc. | 11,763 | 1,176,290 | ||||||||||
|
| |||||||||||
Industrial – 0.1% | ||||||||||||
Energy – 0.1% | ||||||||||||
Berry Petroleum Co. LLC | 62,301 | 643,756 | ||||||||||
Tervita Corp. | 245,313 | 1,758,891 | ||||||||||
|
|
|
| |||||||||
| 2,402,647 | ||||||||||||
|
| |||||||||||
Total Preferred Stocks | 3,578,937 | |||||||||||
|
| |||||||||||
| abfunds.com | AB INCOME FUND | 45 |
PORTFOLIO OF INVESTMENTS (continued)
| Principal Amount (000) | U.S. $ Value | |||||||||||
|
|
| ||||||||||
LOCAL GOVERNMENTS – US MUNICIPAL BONDS – 0.2% | ||||||||||||
United States – 0.2% | ||||||||||||
Texas Transportation Commission State Highway Fund | U.S.$ | 2,560 | $ | 3,072,563 | ||||||||
|
| |||||||||||
BANK LOANS – 0.1% | ||||||||||||
Industrial – 0.1% | ||||||||||||
Basic – 0.0% | ||||||||||||
Foresight Energy LLC | 465 | 437,951 | ||||||||||
|
| |||||||||||
Consumer Non-Cyclical – 0.1% | ||||||||||||
Alphabet Holding Company, Inc. (fka Nature’s Bounty) | 2,133 | 2,077,333 | ||||||||||
|
| |||||||||||
Technology – 0.0% | ||||||||||||
Avaya Inc. | 79 | 79,384 | ||||||||||
8.742%, (LIBOR 1 Month + 7.50%), 1/24/18(r) | 112 | 112,460 | ||||||||||
|
| |||||||||||
| 191,844 | ||||||||||||
|
| |||||||||||
Total Bank Loans | 2,707,128 | |||||||||||
|
| |||||||||||
| Shares | ||||||||||||
INVESTMENT COMPANIES – 0.1% | ||||||||||||
Funds and Investment Trusts – 0.1% | ||||||||||||
OCL Opportunities Fund II(e)(f)(t) | 6,916 | 1,257,250 | ||||||||||
|
| |||||||||||
| Notional Amount | ||||||||||||
OPTIONS PURCHASED – CALLS – 0.0% | ||||||||||||
Options on Forward Contracts – 0.0% | ||||||||||||
SEK/EUR | SEK | 293,658,750 | 152,869 | |||||||||
TRY/USD | TRY | 68,816,000 | 77,169 | |||||||||
| 46 | AB INCOME FUND | abfunds.com |
PORTFOLIO OF INVESTMENTS (continued)
| Notional Amount | U.S. $ Value | |||||||||||
| ||||||||||||
TRY/EUR | TRY | 33,371,888 | $ | 14,067 | ||||||||
ZAR/USD | ZAR | 124,135,800 | 26,980 | |||||||||
ZAR/USD | 123,955,000 | 18,130 | ||||||||||
|
| |||||||||||
Total Options Purchased – Calls | 289,215 | |||||||||||
|
| |||||||||||
OPTIONS PURCHASED – PUTS – 0.0% |
| |||||||||||
Options on Forward Contracts – 0.0% | ||||||||||||
USD/MXN | USD | 14,650,000 | 77,894 | |||||||||
|
| |||||||||||
Options on Indices – 0.0% | ||||||||||||
S&P 500 Index | 146,980,000 | 54,677 | ||||||||||
|
| |||||||||||
Total Options Purchased – Puts | 132,571 | |||||||||||
|
| |||||||||||
| Principal Amount (000) | ||||||||||||
MORTGAGE PASS-THROUGHS – 0.0% |
| |||||||||||
Agency Fixed Rate 30-Year – 0.0% | ||||||||||||
Federal National Mortgage Association | U.S.$ | 12 | 13,764 | |||||||||
| abfunds.com | AB INCOME FUND | 47 |
PORTFOLIO OF INVESTMENTS (continued)
| Principal Amount (000) | U.S. $ Value | |||||||||||
| ||||||||||||
Series 1999 | U.S.$ | 17 | $ | 19,991 | ||||||||
|
| |||||||||||
Total Mortgage Pass-Throughs | 33,755 | |||||||||||
|
| |||||||||||
| Shares | ||||||||||||
WARRANTS – 0.0% | ||||||||||||
Encore Automotive Acceptance, expiring 7/05/31(e)(f)(g)(k) | 12 | – 0 | – | |||||||||
Flexpath Capital, Inc., | 17,195 | – 0 | – | |||||||||
SandRidge Energy, Inc., A-CW22, expiring 10/04/22(k) | 2,475 | 2,227 | ||||||||||
SandRidge Energy, Inc., B-CW22, expiring 10/04/22(k) | 1,042 | 834 | ||||||||||
|
| |||||||||||
Total Warrants | 3,061 | |||||||||||
|
| |||||||||||
SHORT-TERM INVESTMENTS – 3.9% | ||||||||||||
Investment Companies – 3.9% | ||||||||||||
AB Fixed Income Shares, Inc. – Government Money Market Portfolio – Class AB, 0.85%(u)(v)(w) | 79,428,174 | 79,428,174 | ||||||||||
|
| |||||||||||
Total Investments – 118.0% | 2,400,011,547 | |||||||||||
Other assets less liabilities – (18.0)% | (366,319,161 | ) | ||||||||||
|
| |||||||||||
Net Assets – 100.0% | $ | 2,033,692,386 | ||||||||||
|
| |||||||||||
FUTURES (see Note D)
| Description | Number of Contracts | Expiration Month | Notional | Original Value | Value at October 31, 2017 | Unrealized Appreciation/ (Depreciation) | ||||||||||||||||||||||
Purchased Contracts |
| |||||||||||||||||||||||||||
10 Yr Canadian Bond Futures | 128 | | December 2017 | | CAD | 12,800 | $ | 13,410,697 | $ | 13,635,408 | $ | 224,711 | ||||||||||||||||
U.S. T-Note 2 Yr (CBT) Futures | 564 | | December 2017 | | USD | 112,800 | 122,009,845 | 121,462,688 | (547,157 | ) | ||||||||||||||||||
U.S. T-Note 5 Yr (CBT) Futures | 6,545 | | December 2017 | | USD | 654,500 | 772,261,556 | 766,992,187 | (5,269,369 | ) | ||||||||||||||||||
U.S. T-Note 10 Yr (CBT) Futures | 1,275 | | December 2017 | | USD | 127,500 | 160,777,950 | 159,295,313 | (1,482,637 | ) | ||||||||||||||||||
U.S. 10 Yr Ultra Futures | 169 | | December 2017 | | USD | 16,900 | 22,971,004 | 22,632,797 | (338,207 | ) | ||||||||||||||||||
| 48 | AB INCOME FUND | abfunds.com |
PORTFOLIO OF INVESTMENTS (continued)
| Description | Number of Contracts | Expiration Month | Notional | Original Value | Value at October 31, 2017 | Unrealized Appreciation/ (Depreciation) | ||||||||||||||||||||||
Sold Contracts |
| |||||||||||||||||||||||||||
Euro-BOBL Futures | 905 | | December 2017 | | EUR | 90,500 | $ | 138,549,145 | $ | 138,921,000 | $ | (371,855 | ) | |||||||||||||||
Euro-Schatz Futures | 2,235 | | December 2017 | | EUR | 223,500 | 291,934,636 | 292,275,038 | (340,402 | ) | ||||||||||||||||||
U.S. Long Bond (CBT) Futures | 1,220 | | December 2017 | | USD | 122,000 | 188,316,401 | 186,011,875 | 2,304,526 | |||||||||||||||||||
|
| |||||||||||||||||||||||||||
| $ | (5,820,390 | ) | ||||||||||||||||||||||||||
|
| |||||||||||||||||||||||||||
FORWARD CURRENCY EXCHANGE CONTRACTS (see Note D)
| Counterparty | Contracts to Deliver (000) | In Exchange For (000) | Settlement Date | Unrealized Appreciation/ (Depreciation) | ||||||||||||
Australia and New Zealand Banking Group Ltd. | CNY | 119,357 | USD | 18,129 | 11/28/17 | $ | 162,992 | |||||||||
Australia and New Zealand Banking Group Ltd. | USD | 36,417 | CNY | 239,875 | 11/28/17 | (310,533 | ) | |||||||||
Australia and New Zealand Banking Group Ltd. | NZD | 27,341 | USD | 19,700 | 11/30/17 | 999,754 | ||||||||||
Bank of America, NA | BRL | 33,706 | USD | 10,286 | 11/03/17 | (17,608 | ) | |||||||||
Bank of America, NA | USD | 10,707 | BRL | 33,706 | 11/03/17 | (403,569 | ) | |||||||||
Bank of America, NA | USD | 6,697 | IDR | 90,339,957 | 11/16/17 | (41,089 | ) | |||||||||
Bank of America, NA | TWD | 790,122 | USD | 26,216 | 11/22/17 | (33,724 | ) | |||||||||
Bank of America, NA | USD | 4,709 | TWD | 140,884 | 11/22/17 | (28,180 | ) | |||||||||
Bank of America, NA | INR | 1,003,382 | USD | 15,499 | 11/29/17 | 33,135 | ||||||||||
Bank of America, NA | USD | 35,151 | INR | 2,264,521 | 11/29/17 | (246,485 | ) | |||||||||
Bank of America, NA | USD | 9,079 | AUD | 11,847 | 11/30/17 | (14,607 | ) | |||||||||
Bank of America, NA | USD | 5,794 | BRL | 19,012 | 12/04/17 | (6,527 | ) | |||||||||
Bank of America, NA | JPY | 2,307,395 | USD | 20,283 | 12/05/17 | (38,009 | ) | |||||||||
Bank of America, NA | USD | 9,150 | ZAR | 130,534 | 12/07/17 | 26,671 | ||||||||||
Bank of America, NA | MXN | 1,126,891 | USD | 61,090 | 12/08/17 | 2,672,111 | ||||||||||
Bank of America, NA | USD | 1,444 | RUB | 84,248 | 12/11/17 | (9,068 | ) | |||||||||
Bank of America, NA | USD | 17,870 | HUF | 4,665,365 | 12/12/17 | (387,503 | ) | |||||||||
Bank of America, NA | ZAR | 58,259 | USD | 4,262 | 12/13/17 | 169,972 | ||||||||||
Barclays Bank PLC | SGD | 3,779 | USD | 2,774 | 11/16/17 | 1,816 | ||||||||||
Barclays Bank PLC | USD | 2,553 | IDR | 34,499,945 | 11/16/17 | (10,961 | ) | |||||||||
Barclays Bank PLC | RUB | 1,151,085 | USD | 19,737 | 11/22/17 | 86,026 | ||||||||||
Barclays Bank PLC | USD | 17,491 | TWD | 524,747 | 11/22/17 | (57,551 | ) | |||||||||
Barclays Bank PLC | CHF | 8,300 | USD | 8,434 | 11/29/17 | 100,614 | ||||||||||
Barclays Bank PLC | INR | 3,658,053 | USD | 55,756 | 11/29/17 | (628,115 | ) | |||||||||
Barclays Bank PLC | JPY | 555,915 | USD | 4,895 | 12/05/17 | (506 | ) | |||||||||
Barclays Bank PLC | USD | 7,946 | TRY | 29,409 | 12/14/17 | (290,230 | ) | |||||||||
Barclays Bank PLC | EUR | 162,361 | USD | 191,277 | 12/15/17 | 1,695,107 | ||||||||||
Barclays Bank PLC | USD | 10,614 | EUR | 8,933 | 12/15/17 | (183,893 | ) | |||||||||
Barclays Bank PLC | USD | 17,289 | MYR | 73,039 | 1/26/18 | (31,547 | ) | |||||||||
BNP Paribas SA | USD | 14,005 | CAD | 17,116 | 11/10/17 | (736,614 | ) | |||||||||
BNP Paribas SA | USD | 15,638 | SGD | 21,258 | 11/16/17 | (42,050 | ) | |||||||||
BNP Paribas SA | AUD | 15,293 | USD | 12,038 | 11/30/17 | 336,597 | ||||||||||
BNP Paribas SA | GBP | 19,066 | USD | 25,833 | 12/01/17 | 490,624 | ||||||||||
BNP Paribas SA | USD | 14,605 | JPY | 1,631,144 | 12/05/17 | (240,288 | ) | |||||||||
| abfunds.com | AB INCOME FUND | 49 |
PORTFOLIO OF INVESTMENTS (continued)
| Counterparty | Contracts to Deliver (000) | In Exchange For (000) | Settlement Date | Unrealized Appreciation/ (Depreciation) | ||||||||||||
BNP Paribas SA | USD | 2,923 | ZAR | 41,377 | 12/07/17 | $ | (13,763 | ) | ||||||||
BNP Paribas SA | USD | 15,243 | PLN | 54,802 | 12/12/17 | (186,539 | ) | |||||||||
BNP Paribas SA | USD | 2,440 | TRY | 9,340 | 12/14/17 | (9,062 | ) | |||||||||
BNP Paribas SA | USD | 18,403 | EUR | 15,593 | 12/15/17 | (195,297 | ) | |||||||||
Citibank, NA | USD | 16,367 | RUB | 944,334 | 11/22/17 | (244,907 | ) | |||||||||
Citibank, NA | USD | 14,418 | TWD | 432,906 | 11/22/17 | (35,512 | ) | |||||||||
Citibank, NA | USD | 11,231 | INR | 726,605 | 11/29/17 | (30,813 | ) | |||||||||
Citibank, NA | USD | 4,064 | NOK | 32,302 | 12/13/17 | (105,017 | ) | |||||||||
Citibank, NA | USD | 50,446 | SEK | 402,963 | 12/13/17 | (2,195,766 | ) | |||||||||
Citibank, NA | NOK | 16,983 | CAD | 2,668 | 1/10/18 | (13,474 | ) | |||||||||
Citibank, NA | TRY | 32,518 | USD | 8,519 | 1/10/18 | 120,336 | ||||||||||
Citibank, NA | TRY | 5,506 | USD | 1,527 | 3/13/18 | 130,595 | ||||||||||
Citibank, NA | SEK | 175,878 | EUR | 18,272 | 4/03/18 | 266,054 | ||||||||||
Credit Suisse International | CAD | 4,146 | MXN | 59,679 | 11/08/17 | (103,587 | ) | |||||||||
Credit Suisse International | ILS | 130,930 | USD | 37,257 | 11/16/17 | 59,162 | ||||||||||
Credit Suisse International | USD | 27,810 | SGD | 37,530 | 11/16/17 | (274,716 | ) | |||||||||
Credit Suisse International | USD | 1,243 | SEK | 10,816 | 11/20/17 | 50,173 | ||||||||||
Credit Suisse International | CNY | 127,525 | USD | 19,196 | 11/28/17 | 514 | ||||||||||
Credit Suisse International | CAD | 4,762 | NOK | 29,814 | 11/29/17 | (39,669 | ) | |||||||||
Credit Suisse International | CHF | 3,360 | SEK | 28,197 | 11/30/17 | (885 | ) | |||||||||
Credit Suisse International | NZD | 32,152 | CAD | 28,133 | 11/30/17 | (177,986 | ) | |||||||||
Credit Suisse International | CHF | 3,360 | SEK | 27,962 | 12/01/17 | (29,041 | ) | |||||||||
Credit Suisse International | ZAR | 51,100 | USD | 3,578 | 12/07/17 | (14,672 | ) | |||||||||
Credit Suisse International | SEK | 480,218 | USD | 59,114 | 12/13/17 | 1,613,184 | ||||||||||
Credit Suisse International | USD | 4,262 | ZAR | 58,259 | 12/13/17 | (169,974 | ) | |||||||||
Credit Suisse International | EUR | 17,374 | USD | 20,185 | 12/15/17 | (101,074 | ) | |||||||||
Credit Suisse International | JPY | 1,907,479 | EUR | 14,264 | 12/15/17 | (153,471 | ) | |||||||||
Credit Suisse International | USD | 5,082 | ZAR | 68,154 | 12/18/17 | (299,622 | ) | |||||||||
Credit Suisse International | AUD | 3,948 | CHF | 2,875 | 12/19/17 | (129,123 | ) | |||||||||
Credit Suisse International | USD | 922 | TRY | 3,596 | 12/21/17 | 12,614 | ||||||||||
Credit Suisse International | AUD | 1,596 | NOK | 10,151 | 12/27/17 | 23,761 | ||||||||||
Credit Suisse International | EUR | 5,657 | TRY | 24,576 | 1/04/18 | (255,822 | ) | |||||||||
Credit Suisse International | TRY | 1,284 | EUR | 296 | 1/04/18 | 13,573 | ||||||||||
Credit Suisse International | CAD | 5,157 | NZD | 5,800 | 1/23/18 | (37,982 | ) | |||||||||
Credit Suisse International | USD | 1,527 | TRY | 5,506 | 3/13/18 | (130,581 | ) | |||||||||
Credit Suisse International | EUR | 18,272 | SEK | 175,879 | 4/03/18 | (265,952 | ) | |||||||||
Credit Suisse International | USD | 1,842 | MXN | 34,308 | 7/23/18 | (128,448 | ) | |||||||||
Credit Suisse International | MXN | 120,988 | USD | 6,387 | 8/06/18 | 356,660 | ||||||||||
Credit Suisse International | USD | 6,387 | MXN | 120,988 | 8/06/18 | (356,656 | ) | |||||||||
Deutsche Bank AG | USD | 1,857 | ZAR | 25,256 | 11/02/17 | (71,125 | ) | |||||||||
Deutsche Bank AG | BRL | 55,977 | USD | 17,082 | 11/03/17 | (29,242 | ) | |||||||||
Deutsche Bank AG | USD | 17,097 | BRL | 55,977 | 11/03/17 | 14,111 | ||||||||||
Deutsche Bank AG | MXN | 6,698 | CAD | 465 | 11/08/17 | 11,567 | ||||||||||
Deutsche Bank AG | NOK | 29,814 | CAD | 4,762 | 11/29/17 | 39,659 | ||||||||||
Deutsche Bank AG | AUD | 55,559 | USD | 44,351 | 11/30/17 | 1,840,359 | ||||||||||
Deutsche Bank AG | CAD | 21,390 | NZD | 24,525 | 11/30/17 | 190,048 | ||||||||||
Deutsche Bank AG | SEK | 28,197 | CHF | 3,360 | 11/30/17 | 910 | ||||||||||
Deutsche Bank AG | BRL | 55,977 | USD | 17,030 | 12/04/17 | (11,147 | ) | |||||||||
Deutsche Bank AG | JPY | 2,094,364 | USD | 18,816 | 12/05/17 | 371,465 | ||||||||||
Deutsche Bank AG | USD | 9,506 | COP | 28,074,253 | 12/07/17 | (307,445 | ) | |||||||||
Deutsche Bank AG | CHF | 2,875 | AUD | 3,948 | 12/19/17 | 129,175 | ||||||||||
Deutsche Bank AG | NOK | 10,151 | AUD | 1,596 | 12/27/17 | (23,753 | ) | |||||||||
| 50 | AB INCOME FUND | abfunds.com |
PORTFOLIO OF INVESTMENTS (continued)
| Counterparty | Contracts to Deliver (000) | In Exchange For (000) | Settlement Date | Unrealized Appreciation/ (Depreciation) | ||||||||||||
Deutsche Bank AG | TRY | 5,739 | EUR | 1,326 | 1/04/18 | $ | 65,613 | |||||||||
Deutsche Bank AG | SEK | 34,665 | EUR | 3,614 | 1/22/18 | 67,134 | ||||||||||
Goldman Sachs Bank USA | MXN | 52,982 | CAD | 3,680 | 11/08/17 | 91,955 | ||||||||||
Goldman Sachs Bank USA | CAD | 33,071 | USD | 26,418 | 11/10/17 | 781,565 | ||||||||||
Goldman Sachs Bank USA | NZD | 11,549 | USD | 8,372 | 11/30/17 | 473,434 | ||||||||||
Goldman Sachs Bank USA | GBP | 14,416 | USD | 19,146 | 12/01/17 | (15,389 | ) | |||||||||
Goldman Sachs Bank USA | USD | 1,436 | BRL | 4,676 | 12/04/17 | (12,796 | ) | |||||||||
Goldman Sachs Bank USA | JPY | 1,544,463 | USD | 13,908 | 12/05/17 | 306,637 | ||||||||||
Goldman Sachs Bank USA | TRY | 17,551 | EUR | 4,036 | 1/04/18 | 177,238 | ||||||||||
HSBC Bank USA | CAD | 4,013 | USD | 3,214 | 11/10/17 | 103,422 | ||||||||||
HSBC Bank USA | ILS | 6,638 | USD | 1,893 | 11/16/17 | 7,672 | ||||||||||
HSBC Bank USA | SGD | 4,487 | USD | 3,309 | 11/16/17 | 17,538 | ||||||||||
HSBC Bank USA | CNY | 228,655 | USD | 34,888 | 11/28/17 | 470,634 | ||||||||||
HSBC Bank USA | CNY | 16,688 | USD | 2,503 | 11/28/17 | (9,277 | ) | |||||||||
HSBC Bank USA | MXN | 435,518 | USD | 22,783 | 12/08/17 | 205,960 | ||||||||||
JPMorgan Chase Bank, NA | ZAR | 25,256 | USD | 1,857 | 11/02/17 | 71,132 | ||||||||||
JPMorgan Chase Bank, NA | AUD | 4,434 | JPY | 360,679 | 11/06/17 | (220,556 | ) | |||||||||
JPMorgan Chase Bank, NA | JPY | 360,673 | AUD | 4,434 | 11/06/17 | 220,607 | ||||||||||
JPMorgan Chase Bank, NA | CAD | 160,780 | USD | 128,299 | 11/10/17 | 3,664,008 | ||||||||||
JPMorgan Chase Bank, NA | SEK | 10,816 | USD | 1,243 | 11/20/17 | (50,176 | ) | |||||||||
JPMorgan Chase Bank, NA | CHF | 39,733 | USD | 41,642 | 11/29/17 | 1,747,845 | ||||||||||
JPMorgan Chase Bank, NA | GBP | 14,564 | USD | 19,411 | 12/01/17 | 51,621 | ||||||||||
JPMorgan Chase Bank, NA | SEK | 27,962 | CHF | 3,360 | 12/01/17 | 29,044 | ||||||||||
JPMorgan Chase Bank, NA | ZAR | 645,869 | USD | 47,776 | 12/07/17 | 2,370,365 | ||||||||||
JPMorgan Chase Bank, NA | ZAR | 68,790 | USD | 4,824 | 12/07/17 | (11,667 | ) | |||||||||
JPMorgan Chase Bank, NA | USD | 4,656 | MXN | 88,864 | 12/08/17 | (49,334 | ) | |||||||||
JPMorgan Chase Bank, NA | RUB | 84,248 | USD | 1,444 | 12/11/17 | 9,068 | ||||||||||
JPMorgan Chase Bank, NA | ZAR | 68,154 | USD | 5,082 | 12/18/17 | 299,640 | ||||||||||
JPMorgan Chase Bank, NA | TRY | 3,596 | USD | 922 | 12/21/17 | (12,608 | ) | |||||||||
JPMorgan Chase Bank, NA | CAD | 2,668 | NOK | 16,983 | 1/10/18 | 13,464 | ||||||||||
JPMorgan Chase Bank, NA | EUR | 3,614 | SEK | 34,649 | 1/22/18 | (68,966 | ) | |||||||||
JPMorgan Chase Bank, NA | NZD | 5,800 | CAD | 5,158 | 1/23/18 | 38,184 | ||||||||||
JPMorgan Chase Bank, NA | TRY | 5,296 | USD | 1,475 | 3/08/18 | 129,944 | ||||||||||
JPMorgan Chase Bank, NA | USD | 1,475 | TRY | 5,296 | 3/08/18 | (129,965 | ) | |||||||||
JPMorgan Chase Bank, NA | TRY | 5,649 | USD | 1,540 | 3/20/18 | 110,071 | ||||||||||
JPMorgan Chase Bank, NA | USD | 1,540 | TRY | 5,649 | 3/20/18 | (110,071 | ) | |||||||||
JPMorgan Chase Bank, NA | MXN | 34,307 | USD | 1,842 | 7/23/18 | 128,451 | ||||||||||
Morgan Stanley & Co., Inc. | USD | 17,943 | GBP | 13,189 | 12/01/17 | (411,976 | ) | |||||||||
Royal Bank of Scotland PLC | USD | 3,838 | CAD | 4,788 | 11/10/17 | (126,566 | ) | |||||||||
Royal Bank of Scotland PLC | USD | 9,457 | NZD | 13,475 | 11/30/17 | (241,147 | ) | |||||||||
Royal Bank of Scotland PLC | JPY | 4,344,673 | USD | 39,112 | 12/05/17 | 849,099 | ||||||||||
Royal Bank of Scotland PLC | USD | 33,453 | NOK | 261,037 | 12/13/17 | (1,461,973 | ) | |||||||||
Standard Chartered Bank | BRL | 89,683 | USD | 27,990 | 11/03/17 | 575,416 | ||||||||||
Standard Chartered Bank | USD | 27,368 | BRL | 89,683 | 11/03/17 | 46,850 | ||||||||||
Standard Chartered Bank | SGD | 50,505 | USD | 36,944 | 11/16/17 | (110,830 | ) | |||||||||
Standard Chartered Bank | TWD | 1,487,193 | USD | 49,049 | 11/22/17 | (359,301 | ) | |||||||||
Standard Chartered Bank | USD | 5,710 | TWD | 172,215 | 11/22/17 | 11,356 | ||||||||||
Standard Chartered Bank | USD | 14,422 | TWD | 432,906 | 11/22/17 | (40,196 | ) | |||||||||
Standard Chartered Bank | USD | 24,129 | ZAR | 346,189 | 12/07/17 | 208,074 | ||||||||||
Standard Chartered Bank | IDR | 44,862,431 | USD | 3,270 | 1/29/18 | (6,453 | ) | |||||||||
State Street Bank & Trust Co. | CAD | 6,048 | USD | 4,717 | 11/10/17 | 28,719 | ||||||||||
| abfunds.com | AB INCOME FUND | 51 |
PORTFOLIO OF INVESTMENTS (continued)
| Counterparty | Contracts to Deliver (000) | In Exchange For (000) | Settlement Date | Unrealized Appreciation/ (Depreciation) | ||||||||||||
State Street Bank & Trust Co. | CNY | 15,654 | USD | 2,355 | 11/28/17 | $ | (1,608 | ) | ||||||||
State Street Bank & Trust Co. | BRL | 2,704 | USD | 825 | 12/04/17 | 1,582 | ||||||||||
State Street Bank & Trust Co. | ZAR | 238,070 | USD | 17,627 | 12/07/17 | 890,736 | ||||||||||
State Street Bank & Trust Co. | MXN | 3,850 | USD | 203 | 12/08/17 | 3,239 | ||||||||||
State Street Bank & Trust Co. | EUR | 1,595 | USD | 1,882 | 12/15/17 | 20,226 | ||||||||||
State Street Bank & Trust Co. | KRW | 26,606,035 | USD | 23,498 | 1/18/18 | (307,895 | ) | |||||||||
UBS AG | USD | 26,089 | INR | 1,694,208 | 11/29/17 | 25,334 | ||||||||||
UBS AG | USD | 2,446 | MYR | 10,372 | 1/26/18 | 4,437 | ||||||||||
|
| |||||||||||||||
| $ | 12,677,123 | |||||||||||||||
|
| |||||||||||||||
CREDIT DEFAULT SWAPTIONS WRITTEN (see Note D)
| Description | Counterparty | Buy/Sell Protection | Strike Rate | Expiration Month | Notional Amount (000) | Premiums Received | Market Value | |||||||||||||||||||
Put | ||||||||||||||||||||||||||
CDX-NAHY Series 28, 5 Year Index RTP | Goldman Sachs International | Sell | 102.00 | % | December 2017 | $ | 35,810 | $ | 109,220 | $ | (26,020 | ) | ||||||||||||||
CDX-NAHY Series 29, 5 Year Index RTP | Credit Suisse International | Sell | 105.50 | November 2017 | 9,700 | 10,670 | (3,500 | ) | ||||||||||||||||||
CDX-NAHY Series 29, 5 Year Index RTP | Credit Suisse International | Sell | 105.50 | December 2017 | 38,200 | 127,015 | (72,124 | ) | ||||||||||||||||||
|
|
|
| |||||||||||||||||||||||
| $ | 246,905 | $ | (101,644 | ) | ||||||||||||||||||||||
|
|
|
| |||||||||||||||||||||||
CURRENCY OPTIONS WRITTEN (see Note D)
| Description/ Counterparty | Exercise Price | Expiration Month | Contracts | Notional Amount (000) | Premiums Received | U.S. $ Value | ||||||||||||||||||
Call | ||||||||||||||||||||||||
AUD vs. CHF/ | AUD | 0.760 | 12/2017 | 16,450,000 | AUD | 16,450 | $ | 103,743 | $ | (148,990 | ) | |||||||||||||
AUD vs. JPY/ | AUD | 84.80 | 11/2017 | 16,300,000 | AUD | 16,300 | 151,264 | (324,418 | ) | |||||||||||||||
AUD vs. NOK/ | AUD | 6.70 | 12/2017 | 8,400,000 | AUD | 8,400 | 41,804 | (4,288 | ) | |||||||||||||||
AUD vs. NZD/ | AUD | 1.124 | 11/2017 | 20,570,000 | AUD | 20,570 | 94,046 | (104,331 | ) | |||||||||||||||
| 52 | AB INCOME FUND | abfunds.com |
PORTFOLIO OF INVESTMENTS (continued)
| Description/ Counterparty | Exercise Price | Expiration Month | Contracts | Notional Amount (000) | Premiums Received | U.S. $ Value | ||||||||||||||||||
CAD vs. MXN/ | CAD | 15.00 | 11/2017 | 18,725,000 | CAD | 18,725 | $ | 106,664 | $ | (35,081 | ) | |||||||||||||
CAD vs. NOK/ | CAD | 6.429 | 11/2017 | 20,350,000 | CAD | 20,350 | 97,646 | (32,920 | ) | |||||||||||||||
CAD vs. NZD/ | CAD | 0.867 | 01/2018 | 23,387,000 | CAD | 23,387 | 105,975 | (148,652 | ) | |||||||||||||||
CHF vs. SEK/ | CHF | 8.645 | 11/2017 | 15,850,000 | CHF | 15,850 | 112,365 | (16,539 | ) | |||||||||||||||
CHF vs. SEK/ | CHF | 8.567 | 11/2017 | 15,850,000 | CHF | 15,850 | 108,466 | (31,425 | ) | |||||||||||||||
EUR vs. NOK/ | EUR | 9.585 | 11/2017 | 12,900,000 | EUR | 12,900 | 84,201 | (15,658 | ) | |||||||||||||||
EUR vs. SEK/ | EUR | 9.65 | 11/2017 | 13,556,000 | EUR | 13,556 | 96,051 | (183,409 | ) | |||||||||||||||
EUR vs. SEK/ | EUR | 9.751 | 12/2017 | 14,475,000 | EUR | 14,475 | 80,316 | (114,555 | ) | |||||||||||||||
USD vs. MXN/ | USD | 21.07 | 11/2017 | 5,500,000 | USD | 5,500 | 85,800 | (1,018 | ) | |||||||||||||||
USD vs. MXN/ | USD | 21.50 | 07/2018 | 8,090,000 | USD | 8,090 | 138,347 | (197,995 | ) | |||||||||||||||
USD vs. MXN/ | USD | 22.00 | 08/2018 | 14,650,000 | USD | 14,650 | 285,236 | (318,740 | ) | |||||||||||||||
USD vs. MXN/ | USD | 22.00 | 08/2018 | 7,837,000 | USD | 7,837 | 142,100 | (178,025 | ) | |||||||||||||||
USD vs. RUB/ | USD | 65.00 | 11/2017 | 2,750,000 | USD | 2,750 | 49,225 | (118 | ) | |||||||||||||||
USD vs. RUB/ | USD | 65.00 | 11/2017 | 2,750,000 | USD | 2,750 | 48,812 | (118 | ) | |||||||||||||||
USD vs. RUB/ | USD | 65.85 | 02/2018 | 8,008,000 | USD | 8,008 | 134,246 | (37,686 | ) | |||||||||||||||
USD vs. SEK/ | USD | 9.064 | 11/2017 | 5,650,000 | USD | 5,650 | 52,969 | (435 | ) | |||||||||||||||
USD vs. TRY/ | USD | 4.30 | 12/2017 | 4,850,000 | USD | 4,850 | 118,825 | (7,396 | ) | |||||||||||||||
USD vs. TRY/ | USD | 3.835 | 03/2018 | 8,625,000 | USD | 8,625 | 131,100 | (373,411 | ) | |||||||||||||||
USD vs. TRY/ | USD | 4.368 | 07/2018 | 6,900,000 | USD | 6,900 | 182,850 | (161,225 | ) | |||||||||||||||
| abfunds.com | AB INCOME FUND | 53 |
PORTFOLIO OF INVESTMENTS (continued)
| Description/ Counterparty | Exercise Price | Expiration Month | Contracts | Notional Amount (000) | Premiums Received | U.S. $ Value | ||||||||||||||||||
Put | ||||||||||||||||||||||||
MXN vs. USD/ | MXN | 20.00 | 07/2018 | 178,000,000 | MXN | 178,000 | $ | 231,667 | $ | (438,395 | ) | |||||||||||||
NOK vs. CAD/ | NOK | 6.525 | 01/2018 | 75,690,000 | NOK | 75,690 | 52,522 | (26,493 | ) | |||||||||||||||
NZD vs. AUD/ | NZD | 1.139 | 12/2017 | 24,677,000 | NZD | 24,677 | 100,663 | (63,510 | ) | |||||||||||||||
RUB vs. USD/ | RUB | 61.50 | 12/2017 | 535,050,000 | RUB | 535,050 | 78,126 | (31,510 | ) | |||||||||||||||
SEK vs. EUR/ | SEK | 9.777 | 01/2018 | 160,591,000 | SEK | 160,591 | 83,322 | (166,506 | ) | |||||||||||||||
SEK vs. EUR/ | SEK | 9.85 | 03/2018 | 306,089,000 | SEK | 306,089 | 315,750 | (372,901 | ) | |||||||||||||||
TRY vs. EUR/ | TRY | 4.523 | 01/2018 | 35,281,000 | TRY | 35,281 | 92,687 | (181,541 | ) | |||||||||||||||
TRY vs. EUR/ | TRY | 4.55 | 01/2018 | 35,831,000 | TRY | 35,831 | 85,724 | (164,991 | ) | |||||||||||||||
TRY vs. USD/ | TRY | 4.05 | 01/2018 | 75,735,000 | TRY | 75,735 | 180,479 | (177,002 | ) | |||||||||||||||
TRY vs. USD/ | TRY | 3.86 | 03/2018 | 33,679,000 | TRY | 33,679 | 133,798 | (363,423 | ) | |||||||||||||||
TRY vs. USD/ | TRY | 3.93 | 03/2018 | 34,977,000 | TRY | 34,977 | 141,910 | (312,350 | ) | |||||||||||||||
ZAR vs. USD/ | ZAR | 14.40 | 12/2017 | 135,216,000 | ZAR | 135,216 | 80,388 | (192,542 | ) | |||||||||||||||
ZAR vs. USD/ | ZAR | 14.00 | 12/2017 | 133,490,000 | ZAR | 133,490 | 105,171 | (336,228 | ) | |||||||||||||||
ZAR vs. USD/ | ZAR | 16.00 | 04/2018 | 151,680,000 | ZAR | 151,680 | 112,291 | (185,315 | ) | |||||||||||||||
|
|
|
| |||||||||||||||||||||
| $ | 4,346,549 | $ | (5,449,140 | ) | ||||||||||||||||||||
|
|
|
| |||||||||||||||||||||
| 54 | AB INCOME FUND | abfunds.com |
PORTFOLIO OF INVESTMENTS (continued)
CENTRALLY CLEARED CREDIT DEFAULT SWAPS (see Note D)
Description | Fixed Rate (Pay) Receive | Payment Frequency | Implied Credit Spread at October 31, 2017 | Notional Amount (000) | Market Value | Upfront Premiums Paid (Received) | Unrealized Appreciation/ (Depreciation) | |||||||||||||||||||||
Buy Contracts |
| |||||||||||||||||||||||||||
CDX-NAIG Series 28, 5 Year Index, 06/20/22* | (1.00 | )% | Quarterly | 0.51 | % | USD | 61,160 | $ | (1,403,034 | ) | $ | (1,048,316 | ) | $ | (354,718 | ) | ||||||||||||
Sale Contracts |
| |||||||||||||||||||||||||||
CDX-NAHY Series 29, 5 Year Index, 12/20/22* | 5.00 | Quarterly | 3.11 | USD | 4,063 | 364,296 | 304,814 | 59,482 | ||||||||||||||||||||
|
|
|
|
|
| |||||||||||||||||||||||
| $ | (1,038,738 | ) | $ | (743,502 | ) | $ | (295,236 | ) | ||||||||||||||||||||
|
|
|
|
|
| |||||||||||||||||||||||
| * | Termination date |
CENTRALLY CLEARED INTEREST RATE SWAPS (see Note D)
| Rate Type | ||||||||||||||||||
| Notional Amount (000) | Termination Date | Payments made by the Fund | Payments received by the Fund | Payment Frequency Paid/Received | Unrealized Appreciation/ (Depreciation) | |||||||||||||
| USD | 30,755 | 2/10/25 | 2.034 | % | 3 Month LIBOR | Semi-Annual/Quarterly | $ | 386,340 | ||||||||||
| USD | 6,010 | 6/09/25 | 2.491 | % | 3 Month LIBOR | Semi-Annual/Quarterly | (146,109 | ) | ||||||||||
| USD | 10,000 | 1/11/27 | 2.285 | % | 3 Month LIBOR | Semi-Annual/Quarterly | (14,321 | ) | ||||||||||
| USD | 46,860 | 4/02/24 | 2.851 | % | 3 Month LIBOR | Semi-Annual/Quarterly | (1,976,516 | ) | ||||||||||
| USD | 11,920 | 4/26/27 | 2.287 | % | 3 Month LIBOR | Semi-Annual/Quarterly | 67,267 | |||||||||||
|
| |||||||||||||||||
| $ | (1,683,339 | ) | ||||||||||||||||
|
| |||||||||||||||||
CREDIT DEFAULT SWAPS (see Note D)
| Swap Counterparty & Referenced Obligation | Fixed Rate (Pay) Receive | Payment Frequency | Implied Credit Spread at October 31, 2017 | Notional Amount (000) | Market Value | Upfront Premiums Paid (Received) | Unrealized Appreciation/ (Depreciation) | |||||||||||||||||||||||||
Sale Contracts |
| |||||||||||||||||||||||||||||||
Barclays Bank PLC | ||||||||||||||||||||||||||||||||
CDX-CMBX. | 5.00 | % | Monthly | 12.50 | % | USD | 5,000 | $ | (1,308,639 | ) | $ | (131,007 | ) | $ | (1,177,632 | ) | ||||||||||||||||
Citigroup Global Markets, Inc. | ||||||||||||||||||||||||||||||||
CDX-CMBX. | 3.00 | Monthly | 7.25 | USD | 5,000 | (833,582 | ) | (534,494 | ) | (299,088 | ) | |||||||||||||||||||||
| abfunds.com | AB INCOME FUND | 55 |
PORTFOLIO OF INVESTMENTS (continued)
| Swap Counterparty & Referenced Obligation | Fixed Rate (Pay) Receive | Payment Frequency | Implied Credit Spread at October 31, 2017 | Notional Amount (000) | Market Value | Upfront Premiums Paid (Received) | Unrealized Appreciation/ (Depreciation) | |||||||||||||||||||||||||
CDX-CMBX. | 3.00 | % | Monthly | 7.25 | % | USD | 5,000 | $ | (833,583 | ) | $ | (643,440 | ) | $ | (190,143 | ) | ||||||||||||||||
CDX-CMBX. | 3.00 | Monthly | 7.25 | USD | 5,000 | (833,583 | ) | (542,340 | ) | (291,243 | ) | |||||||||||||||||||||
Credit Suisse International | ||||||||||||||||||||||||||||||||
CDX-CMBX. | 5.00 | Monthly | 12.50 | USD | 4,000 | (1,046,911 | ) | 49,003 | (1,095,914 | ) | ||||||||||||||||||||||
CDX-CMBX. | 3.00 | Monthly | 7.25 | USD | 9,220 | (1,537,128 | ) | (1,179,300 | ) | (357,828 | ) | |||||||||||||||||||||
CDX-CMBX. | 3.00 | Monthly | 7.25 | USD | 660 | (110,033 | ) | (9,103 | ) | (100,930 | ) | |||||||||||||||||||||
Deutsche Bank AG | ||||||||||||||||||||||||||||||||
CDX-CMBX. | 3.00 | Monthly | 7.25 | USD | 20,000 | (3,336,000 | ) | (3,055,922 | ) | (280,078 | ) | |||||||||||||||||||||
Goldman Sachs International | ||||||||||||||||||||||||||||||||
CDX-CMBX. | 5.00 | Monthly | 12.50 | USD | 16,500 | (4,318,509 | ) | (3,943,968 | ) | (374,541 | ) | |||||||||||||||||||||
CDX-CMBX. | 3.00 | Monthly | 7.25 | USD | 32,853 | (5,477,143 | ) | (4,842,646 | ) | (634,497 | ) | |||||||||||||||||||||
Morgan Stanley Capital Services LLC | ||||||||||||||||||||||||||||||||
CDX-CMBX. | 3.00 | Monthly | �� | 7.25 | USD | 547 | (91,194 | ) | (40,478 | ) | (50,716 | ) | ||||||||||||||||||||
|
|
|
|
|
| |||||||||||||||||||||||||||
| $ | (19,726,305 | ) | $ | (14,873,695 | ) | $ | (4,852,610 | ) | ||||||||||||||||||||||||
|
|
|
|
|
| |||||||||||||||||||||||||||
| * | Termination date |
| 56 | AB INCOME FUND | abfunds.com |
PORTFOLIO OF INVESTMENTS (continued)
VARIANCE SWAPS (see Note D)
| Swap Counterparty & Referenced Obligation | Volatility Strike Price | Notional Amount (000) | Payment Frequency | Market Value | Upfront Premiums (Paid) Received | Unrealized Appreciation/ (Depreciation) | ||||||||||||||||||
Sale Contracts | ||||||||||||||||||||||||
Bank of America, NA | 88.36 | USD | 3 | Maturity | $ | 110,899 | $ | – 0 | – | $ | 110,899 | |||||||||||||
JPMorgan Chase Bank, NA | 340.77 | HKD | 3 | Maturity | 8,273 | – 0 | – | 8,273 | ||||||||||||||||
Hong Kong Hang Seng Index 11/29/17* | 223.50 | HKD | 4 | Maturity | 10,893 | – 0 | – | 10,893 | ||||||||||||||||
SPDR S&P 500 ETF Trust 11/03/17* | 74.82 | USD | 4 | Maturity | 88,830 | – 0 | – | 88,830 | ||||||||||||||||
|
|
|
|
|
| |||||||||||||||||||
| $ | 218,895 | $ | – 0 | – | $ | 218,895 | ||||||||||||||||||
|
|
|
|
|
| |||||||||||||||||||
| * | Termination date |
REVERSE REPURCHASE AGREEMENTS (see Note D)
| Broker | Interest Rate | Maturity | U.S. $ Value at October 31, 2017 | |||||||||
Barclays Capital, Inc.+ | (0.75 | )%* | — | $ | 677,284 | |||||||
Barclays Capital, Inc.+ | (1.125 | )%* | — | 839,241 | ||||||||
HSBC Bank USA+ | 1.25 | % | — | 89,951,566 | ||||||||
HSBC Bank USA | 1.33 | % | 1/16/18 | 93,831,780 | ||||||||
JP Morgan Chase Bank | 1.35 | % | 1/08/18 | 44,723,987 | ||||||||
JP Morgan Chase Bank | 1.35 | % | 1/11/18 | 97,255,278 | ||||||||
JP Morgan Chase Bank | 1.35 | % | 1/18/18 | 42,106,556 | ||||||||
|
| |||||||||||
| $ | 369,385,692 | |||||||||||
|
| |||||||||||
| + | The reverse repurchase agreement matures on demand. Interest rate resets daily and the rate shown is the rate in effect on October 31, 2017 |
| * | Interest payment due from counterparty. |
The type of underlying collateral and the remaining maturity of open reverse repurchase on the statements of assets and liabilities is as follows:
| Overnight and Continuous | Up to 30 Days | 31-90 Days | Greater than 90 Days | Total | ||||||||||||||||
Corporates –Non-Investment Grade | $ | 1,516,525 | $ | – 0 | – | $ | – 0 | – | $ | – 0 | – | $ | 1,516,525 | |||||||
Governments – Treasuries | 89,951,566 | — | 277,917,601 | — | 367,869,167 | |||||||||||||||
|
|
|
|
|
|
|
|
|
| |||||||||||
Total | $ | 91,468,091 | $ | – 0 | – | $ | 277,917,601 | $ | – 0 | – | $ | 369,385,692 | ||||||||
|
|
|
|
|
|
|
|
|
| |||||||||||
| (a) | Security is exempt from registration under Rule 144A of the Securities Act of 1933. These securities are considered restricted, but liquid and may be resold in transactions exempt from registration, normally to qualified institutional buyers. At October 31, 2017, the aggregate market value of these securities amounted to $541,528,825 or 26.6% of net assets. |
| abfunds.com | AB INCOME FUND | 57 |
PORTFOLIO OF INVESTMENTS (continued)
| (b) | Position, or a portion thereof, has been segregated to collateralize reverse repurchase agreements. |
| (c) | Position, or a portion thereof, has been segregated to collateralize OTC derivatives outstanding. |
| (d) | Position, or a portion thereof, has been segregated to collateralize margin requirements for open futures contracts. |
| (e) | Illiquid security. |
| (f) | Fair valued by the Adviser. |
| (g) | Security in which significant unobservable inputs (Level 3) were used in determining fair value. |
| (h) | Pay-In-Kind Payments (PIK). The issuer may pay cash interest and/or interest in additional debt securities. Rates shown are the rates in effect at October 31, 2017. |
| (i) | Security is exempt from registration under Rule 144A of the Securities Act of 1933. These securities, which represent 0.94% of net assets as of October 31, 2017, are considered illiquid and restricted. Additional information regarding such securities follows: |
144A/Restricted & | Acquisition Date | Cost | Market Value | Percentage of Net Assets | ||||||||||||
Creditcorp | 6/28/13 | $ | 1,197,037 | $ | 1,043,130 | 0.05 | % | |||||||||
Exide Technologies | 5/23/17 | 2,563,179 | 2,633,919 | 0.13 | % | |||||||||||
Exide Technologies | 11/16/16 | 107,752 | 111,453 | 0.01 | % | |||||||||||
Golden Energy Offshore Services AS | 11/16/15 | 2,103,742 | 825,106 | 0.04 | % | |||||||||||
JP Morgan Madison Avenue Securities Trust Series 2014-CH1, Class M2 | 11/06/15 | 1,703,074 | 1,877,648 | 0.09 | % | |||||||||||
Magnetation LLC/Mag Finance Corp. | 2/19/15 | 861,787 | 14 | 0.00 | % | |||||||||||
SoFi Consumer Loan Program LLC | 7/28/17 | 3,760,847 | 3,654,969 | 0.18 | % | |||||||||||
SoFi Consumer Loan Program LLC | 6/28/17 | 1,956,053 | 2,078,128 | 0.10 | % | |||||||||||
SoFi Consumer Loan Program LLC | 9/18/17 | 1,758,337 | 1,758,337 | 0.09 | % | |||||||||||
SoFi Consumer Loan Program LLC | 5/11/17 | 1,107,300 | 1,208,627 | 0.06 | % | |||||||||||
SoFi Consumer Loan Program LLC | 6/23/17 | 1,275,923 | 1,206,793 | 0.06 | % | |||||||||||
| 58 | AB INCOME FUND | abfunds.com |
PORTFOLIO OF INVESTMENTS (continued)
144A/Restricted & | Acquisition Date | Cost | Market Value | Percentage of Net Assets | ||||||||||||
SoFi Consumer Loan Program LLC | 6/15/17 | $ | 953,251 | $ | 988,585 | 0.05 | % | |||||||||
Tonon Luxembourg SA | 7/24/15 | 2,272,218 | 253,685 | 0.01 | % | |||||||||||
Vantage Drilling International | 6/17/16 | 72,857 | 75,460 | 0.00 | % | |||||||||||
Virgolino de Oliveira Finance SA | 1/27/14 | 3,510,948 | 242,818 | 0.01 | % | |||||||||||
Virgolino de Oliveira Finance SA | 6/09/14 | 745,965 | 206,246 | 0.01 | % | |||||||||||
Virgolino de Oliveira Finance SA | 2/03/14 | 916,308 | 86,611 | 0.00 | % | |||||||||||
Wells Fargo Credit Risk Transfer Securities Trust Series 2015-WF1, Class 1M2 | 9/06/16 | 946,067 | 1,059,507 | 0.05 | % | |||||||||||
| (j) | Defaulted. |
| (k) | Non-income producing security. |
| (l) | Convertible security. |
| (m) | Securities are perpetual and, thus, do not have a predetermined maturity date. The date shown, if applicable, reflects the next call date. |
| (n) | Floating Rate Security. Stated interest/floor rate was in effect at October 31, 2017. |
| (o) | IO – Interest Only. |
| (p) | Inverse interest only security. |
| (q) | Variable rate coupon, rate shown as of October 31, 2017. |
| (r) | Restricted and illiquid security. |
Restricted & Illiquid | Acquisition Date | Cost | Market Value | Percentage of Net Assets | ||||||||||||
Exide Technologies/Old | 4/30/15 | $ | 87,194 | $ | 181,002 | 0.01 | % | |||||||||
| (s) | The stated coupon rate represents the greater of the LIBOR or the LIBOR floor rate plus a spread at October 31, 2017. |
| (t) | The company invests on a global basis in multiple asset classes including (but not limited to) private equity debt securities, property-related assets and private equity securities including warrants and preferred stock. |
| (u) | Affiliated investments. |
| (v) | To obtain a copy of the fund’s shareholder report, please go to the Securities and Exchange Commission’s website at www.sec.gov, or call AB at (800) 227-4618. |
| (w) | The rate shown represents the 7-day yield as of period end. |
| abfunds.com | AB INCOME FUND | 59 |
PORTFOLIO OF INVESTMENTS (continued)
Currency Abbreviations:
ARS – Argentine Peso AUD – Australian Dollar BRL – Brazilian Real CAD – Canadian Dollar CHF – Swiss Franc CLP – Chilean Peso CNY – Chinese Yuan Renminbi COP – Colombian Peso DOP – Dominican Peso EGP – Egyptian Pound EUR – Euro GBP – Great British Pound HKD – Hong Kong Dollar HUF – Hungarian Forint IDR – Indonesian Rupiah ILS – Israeli Shekel INR – Indian Rupee | JPY – Japanese Yen KRW – South Korean Won LKR – Sri Lankan Rupee MXN – Mexican Peso MYR – Malaysian Ringgit NGN – Nigerian Naira NOK – Norwegian Krone NZD – New Zealand Dollar PLN – Polish Zloty RUB – Russian Ruble SEK – Swedish Krona SGD – Singapore Dollar TRY – Turkish Lira TWD – New Taiwan Dollar USD – United States Dollar UYU – Uruguayan Peso ZAR – South African Rand |
Glossary:
ABS – Asset-Backed Securities
ARPP7DRR – Argentina Central Bank 7-Day Repo Reference Rate
BADLAR – Argentina Deposit Rates Badlar Private Banks
BOBL – Bundesobligationen
CBT – Chicago Board of Trade
CDX-CMBX.NA – North American Commercial Mortgage-Backed Index
CDX-NAHY – North American High Yield Credit Default Swap Index
CDX-NAIG – North American Investment Grade Credit Default Swap Index
CMBS – Commercial Mortgage-Backed Securities
ETF – Exchange Traded Fund
EURIBOR – Euro Interbank Offered Rate
LIBOR – London Interbank Offered Rates
OAT – Obligations Assimilables du Trésor
REIT – Real Estate Investment Trust
REMICs – Real Estate Mortgage Investment Conduits
RTP – Right To Pay
SPDR – Standard & Poor’s Depository Receipt
See notes to financial statements.
| 60 | AB INCOME FUND | abfunds.com |
STATEMENT OF ASSETS & LIABILITIES
October 31, 2017
| Assets | ||||
Investments in securities, at value | ||||
Unaffiliated issuers (cost $2,320,615,271) | $ | 2,320,583,373 | ||
Affiliated issuers (cost $79,428,174) | 79,428,174 | |||
Cash | 5,268,344 | |||
Cash collateral due from broker | 3,417,725 | |||
Foreign currencies, at value (cost $4,306,929) | 3,925,932 | |||
Receivable for capital stock sold | 38,916,012 | |||
Interest receivable | 33,418,465 | |||
Unrealized appreciation on forward currency exchange contracts | 26,336,653 | |||
Receivable for investment securities sold and foreign currency transactions | 2,587,688 | |||
Unrealized appreciation on variance swaps | 218,895 | |||
Upfront premiums paid on credit default swaps | 49,003 | |||
Receivable for variation margin on exchange traded swaps | 25,442 | |||
Affiliated dividends receivable | 12,944 | |||
|
| |||
Total assets | 2,514,188,650 | |||
|
| |||
| Liabilities | ||||
Options written, at value (premiums received $4,346,549) | 5,449,140 | |||
Swaptions written, at value (premiums received $246,905) | 101,644 | |||
Payable for reverse repurchase agreements | 369,385,692 | |||
Payable for investment securities purchased and foreign currency transactions | 61,656,937 | |||
Upfront premiums received on credit default swaps | 14,922,698 | |||
Unrealized depreciation on forward currency exchange contracts | 13,659,530 | |||
Payable for capital stock repurchased | 7,800,712 | |||
Unrealized depreciation on credit default swaps | 4,852,610 | |||
Payable for variation margin on futures | 660,100 | |||
Advisory fee payable | 465,917 | |||
Dividends payable | 421,274 | |||
Cash collateral due to broker | 312,000 | |||
Distribution fee payable | 77,309 | |||
Transfer Agent fee payable | 71,017 | |||
Administrative fee payable | 24,074 | |||
Directors’ fees payable | 2,295 | |||
Accrued expenses and other liabilities | 633,315 | |||
|
| |||
Total liabilities | 480,496,264 | |||
|
| |||
Net Assets | $ | 2,033,692,386 | ||
|
| |||
| Composition of Net Assets | ||||
Capital stock, at par | $ | 250,994 | ||
Additional paid-in capital | 2,076,716,538 | |||
Undistributed net investment income | 7,163,137 | |||
Accumulated net realized loss on investment and foreign currency transactions | (49,014,773 | ) | ||
Net unrealized depreciation on investments and foreign currency denominated assets and liabilities | (1,423,510 | ) | ||
|
| |||
| $ | 2,033,692,386 | |||
|
|
See notes to financial statements.
| abfunds.com | AB INCOME FUND | 61 |
STATEMENT OF ASSETS & LIABILITIES (continued)
Net Asset Value Per Share—33 billion shares of capital stock authorized, $.001 par value
| Class | Net Assets | Shares Outstanding | Net Asset Value | |||||||||
| ||||||||||||
| A | $ | 165,293,826 | 20,421,808 | $ | 8.09 | * | ||||||
| ||||||||||||
| C | $ | 62,121,160 | 7,665,230 | $ | 8.10 | |||||||
| ||||||||||||
| Advisor | $ | 1,806,277,400 | 222,907,038 | $ | 8.10 | |||||||
| ||||||||||||
| * | The maximum offering price per share for Class A shares was $8.45 which reflects a sales charge of 4.25%. |
See notes to financial statements.
| 62 | AB INCOME FUND | abfunds.com |
STATEMENT OF OPERATIONS
Year Ended October 31, 2017
| Investment Income | ||||||||
Interest (net of foreign taxes withheld of $39,519) | $ | 70,448,094 | ||||||
Dividends | ||||||||
Unaffiliated issuers | 713,558 | |||||||
Affiliated issuers | 98,729 | |||||||
Other income | 29,807 | $ | 71,290,188 | |||||
|
| |||||||
| Expenses | ||||||||
Advisory fee (see Note B) | 5,759,192 | |||||||
Distribution fee—Class A | 120,482 | |||||||
Distribution fee—Class C | 189,337 | |||||||
Transfer agency—Class A | 43,045 | |||||||
Transfer agency—Class C | 17,071 | |||||||
Transfer agency—Advisor Class | 1,099,013 | |||||||
Custodian | 256,573 | |||||||
Registration fees | 176,774 | |||||||
Audit and tax | 146,520 | |||||||
Printing | 142,169 | |||||||
Administrative | 65,061 | |||||||
Legal | 43,450 | |||||||
Directors’ fees | 27,944 | |||||||
Miscellaneous | 103,948 | |||||||
|
| |||||||
Total expenses before interest expense | 8,190,579 | |||||||
Interest expense | 3,329,973 | |||||||
Total expenses | 11,520,552 | |||||||
|
| |||||||
Less: expenses waived and reimbursed by the Adviser (see Note B) | (1,391,000 | ) | ||||||
|
| |||||||
Net expenses | 10,129,552 | |||||||
|
| |||||||
Net investment income | 61,160,636 | |||||||
|
| |||||||
| Realized and Unrealized Gain (Loss) on Investment and Foreign Currency Transactions | ||||||||
Net realized gain (loss) on: | ||||||||
Investment transactions | (2,674,138 | ) | ||||||
Forward currency exchange contracts | 1,515,149 | |||||||
Futures | 25,835,580 | |||||||
Options written | 6,094,322 | |||||||
Swaps | 4,712,278 | |||||||
Swaptions written | 942,542 | |||||||
Foreign currency transactions | (2,143,786 | ) | ||||||
Net change in unrealized appreciation/depreciation of: | ||||||||
Investments | (33,864,676 | ) | ||||||
Forward currency exchange contracts | 11,494,401 | |||||||
Futures | (18,201,713 | ) | ||||||
Options written | (1,102,591 | ) | ||||||
Swaps | 1,032,661 | |||||||
Swaptions written | 145,261 | |||||||
Foreign currency denominated assets and liabilities | (595,032 | ) | ||||||
|
| |||||||
Net loss on investment and foreign currency transactions | (6,809,742 | ) | ||||||
|
| |||||||
Contributions from Affiliates (see Note B) | 346 | |||||||
|
| |||||||
Net Increase in Net Assets from Operations | $ | 54,351,240 | ||||||
|
|
See notes to financial statements.
| abfunds.com | AB INCOME FUND | 63 |
STATEMENT OF CHANGES IN NET ASSETS
| Year Ended October 31, 2017 | For the Period January 1, 2016 to October 31, 2016(a) | Year Ended December 31, 2015 | ||||||||||
| Increase (Decrease) in Net Assets from Operations | ||||||||||||
Net investment income | $ | 61,160,636 | $ | 53,457,885 | $ | 82,910,856 | ||||||
Net realized gain (loss) on investment and foreign currency transactions | 34,281,947 | (13,956,269 | ) | 24,568,704 | ||||||||
Net change in unrealized appreciation/depreciation of investments and foreign currency denominated assets and liabilities | (41,091,689 | ) | 64,944,521 | (109,308,486 | ) | |||||||
Contributions from Affiliates (see Note B) | 346 | – 0 | – | – 0 | – | |||||||
|
|
|
|
|
| |||||||
Net increase (decrease) in net assets from operations | 54,351,240 | 104,446,137 | (1,828,926 | ) | ||||||||
| Dividends and Distributions to Shareholders from | ||||||||||||
Net investment income | ||||||||||||
Class A | (2,100,463 | ) | (15,961 | ) | – 0 | – | ||||||
Class C | (684,581 | ) | (5,811 | ) | – 0 | – | ||||||
Advisor Class | (57,585,904 | ) | (53,017,830 | ) | (101,719,576 | ) | ||||||
Net realized gain on investment transactions | ||||||||||||
Advisor Class | – 0 | – | – 0 | – | (9,712,602 | ) | ||||||
| Capital Stock Transactions | ||||||||||||
Net increase (decrease) | 1,120,697,788 | (828,348,508 | ) | – 0 | – | |||||||
See notes to financial statements.
| 64 | AB INCOME FUND | abfunds.com |
STATEMENT OF CHANGES IN NET ASSETS (continued)
| Year Ended October 31, 2017 | For the Period January 1, 2016 to October 31, 2016(a) | Year Ended December 31, 2015 | ||||||||||
| Common Stock (see Note E) | ||||||||||||
Repurchase of Shares (12,172,242 shares) | $ | – 0 | – | $ | – 0 | – | $ | (92,499,158 | ) | |||
|
|
|
|
|
| |||||||
Total increase (decrease) | 1,114,678,080 | (776,941,973 | ) | (205,760,262 | ) | |||||||
| Net Assets | ||||||||||||
Beginning of period | 919,014,306 | 1,695,956,279 | 1,901,716,541 | |||||||||
|
|
|
|
|
| |||||||
End of period (including undistributed net investment income of $7,163,137 and distributions in excess of net investment income of ($704,342) and ($3,296,673), respectively) | $ | 2,033,692,386 | $ | 919,014,306 | $ | 1,695,956,279 | ||||||
|
|
|
|
|
| |||||||
| (a) | AllianceBernstein Income Fund’s (the “Predecessor Fund”) fiscal year end was December 31 and the Fund’s fiscal year end is October 31. |
See notes to financial statements.
| abfunds.com | AB INCOME FUND | 65 |
STATEMENT OF CASH FLOWS
For the Year Ended October 31, 2017
| Cash flows from operating activities | ||||||||
Net increase in net assets from operations | $ | 54,351,240 | ||||||
| Reconciliation of net increase in net assets from operations to net decrease in cash from operating activities: | ||||||||
Purchases of long-term investments | $ | (1,688,719,566 | ) | |||||
Purchases of short-term investments | (813,657,760 | ) | ||||||
Proceeds from disposition of long-term investments | 685,086,445 | |||||||
Proceeds from disposition of short-term investments | 741,449,758 | |||||||
Net realized gain on investment transactions and foreign currency transactions | (34,281,947 | ) | ||||||
Net change in unrealized appreciation/depreciation of investments and foreign currency denominated assets and liabilities | 41,091,689 | |||||||
Net accretion of bond discount and amortization of bond premium | 16,724,767 | |||||||
Inflation index adjustment | (459,534 | ) | ||||||
Decrease in receivable for investments sold | 10,633,895 | |||||||
Increase in interest receivable | (17,526,792 | ) | ||||||
Increase in affiliated dividends receivable | (7,487 | ) | ||||||
Decrease in due from custodian | 317,253 | |||||||
Decrease in cash collateral due from broker | 957,860 | |||||||
Increase in payable for investments purchased | 46,288,341 | |||||||
Increase in cash collateral due to broker | 312,000 | |||||||
Increase in advisory fee payable | 251,474 | |||||||
Increase in administrative fee payable | 1,354 | |||||||
Increase in Transfer Agent fee payable | 31,665 | |||||||
Increase in distribution fee payable | 76,118 | |||||||
Increase in directors’ fees payable | 2,295 | |||||||
Increase in accrued expenses | 331,813 | |||||||
Proceeds from options written, net | 10,531,693 | |||||||
Proceeds from swaptions written, net | 1,187,562 | |||||||
Proceeds on swaps, net | 18,778,133 | |||||||
Proceeds for exchange-traded derivatives settlements | 9,221,403 | |||||||
Total adjustments | (971,377,568 | ) | ||||||
|
| |||||||
Net decrease in cash from operating activities | $ | (917,026,328 | ) | |||||
|
| |||||||
| Cash flows from financing activities | ||||||||
Repurchase of Shares | 1,055,699,216 | |||||||
Cash dividends paid (net of dividend reinvestments)* | (28,824,661 | ) | ||||||
Repayment of reverse repurchase agreements | (100,862,463 | ) | ||||||
|
| |||||||
Net increase in cash from financing activities | 926,012,092 | |||||||
Effect of exchange rate on cash | (1,223,669 | ) | ||||||
|
|
See notes to financial statements.
| 66 | AB INCOME FUND | abfunds.com |
STATEMENT OF CASH FLOWS (continued)
Net increase in cash | $ | 7,762,095 | ||||||
Net change in cash | ||||||||
Cash at beginning of year | 1,432,181 | |||||||
|
| |||||||
Cash at end of year | $ | 9,194,276 | ||||||
|
| |||||||
* Reinvestment of dividends | $ | 31,931,750 | ||||||
Supplemental disclosure of cash flow information: | ||||||||
Interest expense paid during the year | $ | 3,369,582 |
In accordance with U.S. GAAP, the Fund has included a Statement of Cash Flows as a result of its significant investments in reverse repurchase agreements throughout the year.
See notes to financial statements.
| abfunds.com | AB INCOME FUND | 67 |
NOTES TO FINANCIAL STATEMENTS
October 31, 2017
NOTE A
Significant Accounting Policies
AB Bond Fund, Inc. (the “Company”) is registered under the Investment Company Act of 1940 as an open-end management investment company. The Company, which is a Maryland corporation, operates as a series company comprised of eleven portfolios currently in operation. Each portfolio is considered to be a separate entity for financial reporting and tax purposes. This report relates only to the AB Income Fund, Inc. (the “Fund”), a diversified portfolio. The fund acquired the assets and liabilities of the AllianceBernstein Income Fund, Inc., a closed-end fund (the “Predecessor Fund”) that was effective at the close of business April 21, 2016 (the “Reorganization”). The Reorganization was approved by the Predecessor Fund’s Board of Directors (the “Board”) and shareholders pursuant to an Agreement and Plan of Acquisition and Dissolution (the “Reorganization Agreement”), see Note I for additional information. The Predecessor Fund was the accounting survivor in the Reorganization and as such, the financial statements and the Advisor Class shares financial highlights reflect the financial information of the Predecessor Fund through April 21, 2016. The Fund has authorized the issuance of Class A, Class B, Class C, Advisor Class, Class R, Class K, Class I, Class Z, Class T, Class 1 and Class 2 shares. Class B, Class K, Class R, Class I, Class Z, Class T, Class 1 and Class 2 shares have not been issued. Class A shares are sold with a front-end sales charge of up to 4.25% for purchases not exceeding $1,000,000. With respect to purchases of $1,000,000 or more, Class A shares redeemed within one year of purchase may be subject to a contingent deferred sales charge of 1%. Class C shares are subject to a contingent deferred sales charge of 1% on redemptions made within the first year after purchase and 0% after the first year of purchase. Effective April 10, 2017, Class C shares will automatically convert to Class A shares ten years after the end of the calendar month of purchase. Advisor Class shares are sold without any initial or contingent deferred sales charge and are not subject to ongoing distribution expenses. All eleven classes of shares have identical voting, dividend, liquidation and other rights, except that the classes bear different distribution and transfer agency expenses. Each class has exclusive voting rights with respect to its distribution plan. The financial statements have been prepared in conformity with U.S. generally accepted accounting principles (“U.S. GAAP”) which require management to make certain estimates and assumptions that affect the reported amounts of assets and liabilities in the financial statements and amounts of income and expenses during the reporting period. Actual results could differ from those estimates. The Fund is an investment company under U.S. GAAP and follows the accounting and reporting guidance applicable to investment companies. The following is a summary of significant accounting policies followed by the Fund.
| 68 | AB INCOME FUND | abfunds.com |
NOTES TO FINANCIAL STATEMENTS (continued)
1. Security Valuation
Portfolio securities are valued at their current market value determined on the basis of market quotations or, if market quotations are not readily available or are deemed unreliable, at “fair value” as determined in accordance with procedures established by and under the general supervision of the Company’s Board of Directors (the “Board”).
In general, the market values of securities which are readily available and deemed reliable are determined as follows: securities listed on a national securities exchange (other than securities listed on the NASDAQ Stock Market, Inc. (“NASDAQ”)) or on a foreign securities exchange are valued at the last sale price at the close of the exchange or foreign securities exchange. If there has been no sale on such day, the securities are valued at the last traded price from the previous day. Securities listed on more than one exchange are valued by reference to the principal exchange on which the securities are traded; securities listed only on NASDAQ are valued in accordance with the NASDAQ Official Closing Price; listed or over the counter (“OTC”) market put or call options are valued at the mid level between the current bid and ask prices. If either a current bid or current ask price is unavailable, AllianceBernstein L.P. (the “Adviser”) will have discretion to determine the best valuation (e.g., last trade price in the case of listed options); open futures are valued using the closing settlement price or, in the absence of such a price, the most recent quoted bid price. If there are no quotations available for the day of valuation, the last available closing settlement price is used; U.S. Government securities and any other debt instruments having 60 days or less remaining until maturity are generally valued at market by an independent pricing vendor, if a market price is available. If a market price is not available, the securities are valued at amortized cost. This methodology is commonly used for short term securities that have an original maturity of 60 days or less, as well as short term securities that had an original term to maturity that exceeded 60 days. In instances when amortized cost is utilized, the Valuation Committee (the “Committee”) must reasonably conclude that the utilization of amortized cost is approximately the same as the fair value of the security. Such factors the Committee will consider include, but are not limited to, an impairment of the creditworthiness of the issuer or material changes in interest rates. Fixed-income securities, including mortgage-backed and asset-backed securities, may be valued on the basis of prices provided by a pricing service or at a price obtained from one or more of the major broker-dealers. In cases where broker-dealer quotes are obtained, the Adviser may establish procedures whereby changes in market yields or spreads are used to adjust, on a daily basis, a recently obtained quoted price on a security. Swaps and other derivatives are valued daily, primarily using independent pricing services, independent pricing models using market inputs, as well as third party broker-dealers or counterparties.
| abfunds.com | AB INCOME FUND | 69 |
NOTES TO FINANCIAL STATEMENTS (continued)
Open end mutual funds are valued at the closing net asset value per share, while exchange traded funds are valued at the closing market price per share.
Securities for which market quotations are not readily available (including restricted securities) or are deemed unreliable are valued at fair value as deemed appropriate by the Adviser. Factors considered in making this determination may include, but are not limited to, information obtained by contacting the issuer, analysts, analysis of the issuer’s financial statements or other available documents. In addition, the Fund may use fair value pricing for securities primarily traded in non-U.S. markets because most foreign markets close well before the Fund values its securities at 4:00 p.m., Eastern Time. The earlier close of these foreign markets gives rise to the possibility that significant events, including broad market moves, may have occurred in the interim and may materially affect the value of those securities. To account for this, the Fund generally values many of its foreign equity securities using fair value prices based on third party vendor modeling tools to the extent available.
2. Fair Value Measurements
In accordance with U.S. GAAP regarding fair value measurements, fair value is defined as the price that the Fund would receive to sell an asset or pay to transfer a liability in an orderly transaction between market participants at the measurement date. U.S. GAAP establishes a framework for measuring fair value, and a three-level hierarchy for fair value measurements based upon the transparency of inputs to the valuation of an asset or liability (including those valued based on their market values as described in Note A.1 above). Inputs may be observable or unobservable and refer broadly to the assumptions that market participants would use in pricing the asset or liability. Observable inputs reflect the assumptions market participants would use in pricing the asset or liability based on market data obtained from sources independent of the Fund. Unobservable inputs reflect the Fund’s own assumptions about the assumptions that market participants would use in pricing the asset or liability based on the best information available in the circumstances. Each investment is assigned a level based upon the observability of the inputs which are significant to the overall valuation. The three-tier hierarchy of inputs is summarized below.
| • | Level 1—quoted prices in active markets for identical investments |
| • | Level 2—other significant observable inputs (including quoted prices for similar investments, interest rates, prepayment speeds, credit risk, etc.) |
| • | Level 3—significant unobservable inputs (including the Fund’s own assumptions in determining the fair value of investments) |
| 70 | AB INCOME FUND | abfunds.com |
NOTES TO FINANCIAL STATEMENTS (continued)
The fair value of debt instruments, such as bonds, and over-the-counter derivatives is generally based on market price quotations, recently executed market transactions (where observable) or industry recognized modeling techniques and are generally classified as Level 2. Pricing vendor inputs to Level 2 valuations may include quoted prices for similar investments in active markets, interest rate curves, coupon rates, currency rates, yield curves, option adjusted spreads, default rates, credit spreads and other unique security features in order to estimate the relevant cash flows which are then discounted to calculate fair values. If these inputs are unobservable and significant to the fair value, these investments will be classified as Level 3. In addition, non-agency rated investments are classified as Level 3.
Where readily available market prices or relevant bid prices are not available for certain equity investments, such investments may be valued based on similar publicly traded investments, movements in relevant indices since last available prices or based upon underlying company fundamentals and comparable company data (such as multiples to earnings or other multiples to equity). Where an investment is valued using an observable input, such as another publicly traded security, the investment will be classified as Level 2. If management determines that an adjustment is appropriate based on restrictions on resale, illiquidity or uncertainty, and such adjustment is a significant component of the valuation, the investment will be classified as Level 3. An investment will also be classified as Level 3 where management uses company fundamentals and other significant inputs to determine the valuation.
Options are valued using market-based inputs to models, broker or dealer quotations, or alternative pricing sources with reasonable levels of price transparency, where such inputs and models are available. Alternatively the values may be obtained through unobservable management determined inputs and/or management’s proprietary models. Where models are used, the selection of a particular model to value an option depends upon the contractual terms of, and specific risks inherent in, the option as well as the availability of pricing information in the market. Valuation models require a variety of inputs, including contractual terms, market prices, measures of volatility and correlations of such inputs. Exchange traded options generally will be classified as Level 2. For options that do not trade on exchange but trade in liquid markets, inputs can generally be verified and model selection does not involve significant management judgment. Options are classified within Level 2 on the fair value hierarchy when all of the significant inputs can be corroborated to market evidence. Otherwise such instruments are classified as Level 3.
| abfunds.com | AB INCOME FUND | 71 |
NOTES TO FINANCIAL STATEMENTS (continued)
Valuations of mortgage-backed or other asset-backed securities, by pricing vendors, are based on both proprietary and industry recognized models and discounted cash flow techniques. Significant inputs to the valuation of these instruments are value of the collateral, the rates and timing of delinquencies, the rates and timing of prepayments, and default and loss expectations, which are driven in part by housing prices for residential mortgages. Significant inputs are determined based on relative value analyses, which incorporate comparisons to instruments with similar collateral and risk profiles, including relevant indices. Mortgage and asset-backed securities for which management has collected current observable data through pricing services are generally categorized within Level 2. Those investments for which current observable data has not been provided are classified as Level 3.
Bank loan prices are provided by third party pricing services and consist of a composite of the quotes received by the vendor into a consensus price. Certain bank loans are classified as Level 3, as significant input used in the fair value measurement of these instruments is the market quotes that are received by the vendor and these inputs are not observable.
Other fixed income investments, including non-U.S. government and corporate debt, are generally valued using quoted market prices, if available, which are typically impacted by current interest rates, maturity dates and any perceived credit risk of the issuer. Additionally, in the absence of quoted market prices, these inputs are used by pricing vendors to derive a valuation based upon industry or proprietary models which incorporate issuer specific data with relevant yield/spread comparisons with more widely quoted bonds with similar key characteristics. Those investments for which there are observable inputs are classified as Level 2. Where the inputs are not observable, the investments are classified as Level 3.
The following table summarizes the valuation of the Fund’s investments by the above fair value hierarchy levels as of October 31, 2017:
Investments in | Level 1 | Level 2 | Level 3 | Total | ||||||||||||
Assets: | ||||||||||||||||
Governments – Treasuries | $ | – 0 | – | $ | 1,252,600,881 | $ | – 0 | – | $ | 1,252,600,881 | ||||||
Corporates – Non-Investment Grade | – 0 | – | 294,933,844 | 8,839,957 | (a) | 303,773,801 | ||||||||||
Emerging Markets – Treasuries | – 0 | – | 128,569,453 | – 0 | – | 128,569,453 | ||||||||||
Collateralized Mortgage Obligations | – 0 | – | 117,424,673 | 5,300,000 | 122,724,673 | |||||||||||
Local Governments – Provincial Bonds | – 0 | – | 93,773,437 | – 0 | – | 93,773,437 | ||||||||||
Corporates – Investment Grade | – 0 | – | 74,770,475 | – 0 | – | 74,770,475 | ||||||||||
| 72 | AB INCOME FUND | abfunds.com |
NOTES TO FINANCIAL STATEMENTS (continued)
Investments in | Level 1 | Level 2 | Level 3 | Total | ||||||||||||
Emerging Markets –Sovereigns | $ | – 0 | – | $ | 59,147,176 | $ | – 0 | – | $ | 59,147,176 | ||||||
Asset-Backed Securities | – 0 | – | 29,279,892 | 23,774,688 | 53,054,580 | |||||||||||
Emerging Markets – Corporate Bonds | – 0 | – | 46,958,562 | 253,685 | 47,212,247 | |||||||||||
Agencies | – 0 | – | 43,610,262 | – 0 | – | 43,610,262 | ||||||||||
Commercial Mortgage-Backed Securities | – 0 | – | 264 | 41,690,886 | 41,691,150 | |||||||||||
Governments – Sovereign Agencies | – 0 | – | 27,117,098 | – 0 | – | 27,117,098 | ||||||||||
Quasi-Sovereigns | – 0 | – | 17,072,393 | – 0 | – | 17,072,393 | ||||||||||
Collateralized Loan Obligations | – 0 | – | – 0 | – | 14,845,194 | 14,845,194 | ||||||||||
Whole Loan Trusts | – 0 | – | – 0 | – | 10,733,694 | 10,733,694 | ||||||||||
Inflation-Linked Securities | – 0 | – | 10,726,184 | – 0 | – | 10,726,184 | ||||||||||
Common Stocks | 1,034,719 | – 0 | – | 3,352,486 | 4,387,205 | |||||||||||
Local Governments – Regional Bonds | – 0 | – | 3,698,990 | – 0 | – | 3,698,990 | ||||||||||
Preferred Stocks | – 0 | – | – 0 | – | 3,578,937 | 3,578,937 | ||||||||||
Local Governments – US Municipal Bonds | – 0 | – | 3,072,563 | – 0 | – | 3,072,563 | ||||||||||
Bank Loans | – 0 | – | 629,795 | 2,077,333 | 2,707,128 | |||||||||||
Investment Companies | – 0 | – | – 0 | – | – 0 | – | – 0 | – | ||||||||
Options Purchased – Calls | – 0 | – | 289,215 | – 0 | – | 289,215 | ||||||||||
Options Purchased – Puts | – 0 | – | 132,571 | – 0 | – | 132,571 | ||||||||||
Mortgage Pass-Throughs | – 0 | – | 33,755 | – 0 | – | 33,755 | ||||||||||
Warrants | 3,061 | – 0 | – | – 0 | –(a) | 3,061 | ||||||||||
Short-Term Investments | 79,428,174 | – 0 | – | – 0 | – | 79,428,174 | ||||||||||
Investments valued at NAV(b) | – 0 | – | – 0 | – | – 0 | – | 1,257,250 | |||||||||
|
|
|
|
|
|
|
| |||||||||
Total Investments in Securities | 80,465,954 | 2,203,841,483 | 114,446,860 | 2,400,011,547 | ||||||||||||
Other Financial Instruments(c): | ||||||||||||||||
Assets: | ||||||||||||||||
Futures | 2,529,237 | – 0 | – | – 0 | – | 2,529,237 | (d) | |||||||||
Forward Currency Exchange Contracts | – 0 | – | 26,336,653 | – 0 | – | 26,336,653 | ||||||||||
Centrally Cleared Credit Default Swaps | – 0 | – | 364,296 | – 0 | – | 364,296 | (d) | |||||||||
Centrally Cleared Interest Rate Swaps | – 0 | – | 453,607 | – 0 | – | 453,607 | (d) | |||||||||
Variance Swaps | – 0 | – | 218,895 | – 0 | – | 218,895 | ||||||||||
Liabilities: | ||||||||||||||||
Futures | (8,349,627 | ) | – 0 | – | – 0 | – | (8,349,627 | )(d) | ||||||||
Forward Currency Exchange Contracts | – 0 | – | (13,659,530 | ) | – 0 | – | (13,659,530 | ) | ||||||||
Credit Default Swaptions Written | – 0 | – | (101,644 | ) | – 0 | – | (101,644 | ) | ||||||||
Currency Options Written | – 0 | – | (5,449,140 | ) | – 0 | – | (5,449,140 | ) | ||||||||
| abfunds.com | AB INCOME FUND | 73 |
NOTES TO FINANCIAL STATEMENTS (continued)
Investments in | Level 1 | Level 2 | Level 3 | Total | ||||||||||||
Centrally Cleared Credit Default Swaps | $ | – 0 | – | $ | (1,403,034 | ) | $ | – 0 | – | $ | (1,403,034 | )(d) | ||||
Centrally Cleared Interest Rate Swaps | – 0 | – | (2,136,946 | ) | – 0 | – | (2,136,946 | )(d) | ||||||||
Credit Default Swaps | – 0 | – | (19,726,305 | ) | – 0 | – | (19,726,305 | ) | ||||||||
|
|
|
|
|
|
|
| |||||||||
Total(e) | $ | 74,645,564 | $ | 2,188,738,335 | $ | 114,446,860 | $ | 2,379,088,009 | ||||||||
|
|
|
|
|
|
|
| |||||||||
| (a) | The Fund held securities with zero market value at period end. |
| (b) | In May 2015, the Financial Accounting Standards Board issued an Accounting Standards Update, ASU 2015-07 (the “ASU”) which removes the requirement to categorize within the fair value hierarchy all investments for which fair value is measured using the net asset value per share practical expedient. The ASU is effective for annual periods beginning after December 15, 2015 and interim periods within those annual periods, with application of the amendments noted above retrospectively to all periods presented. The retrospective approach requires that an investment for which fair value is measured using the net asset value per share practical expedient be removed from the fair value hierarchy in all periods presented herein. Accordingly, the total investments with a fair value of $1,257,250 have not been categorized in the fair value hierarchy. |
(c) Other financial instruments are derivative instruments, such as futures, forwards and swaps, which are valued at the unrealized appreciation/(depreciation) on the instrument. Other financial instruments may also include swaps with upfront premiums and options written which are valued at market value.
(d) Only variation margin receivable/(payable) at period end is reported within the statement of assets and liabilities. This amount reflects cumulative unrealized appreciation/(depreciation) of exchange-traded derivatives as reported in the portfolio of investments. Exchange-traded swaps with upfront premiums are presented here as market value.
(e) There were no transfers between Level 1 and Level 2 during the reporting period.
The Fund recognizes all transfers between levels of the fair value hierarchy assuming the financial instruments were transferred at the beginning of the reporting period.
The following is a reconciliation of investments in which significant unobservable inputs (Level 3) were used in determining fair value.
| Corporates - Non- Investment Grade(a) | Collateralized Mortgage Obligations | Asset-Backed Securities | ||||||||||
Balance as of 10/31/16 | $ | 4,215,547 | $ | 3,977,389 | $ | 3,522,021 | ||||||
Accrued discounts/(premiums) | 285,028 | – 0 | – | 15,960 | ||||||||
Realized gain (loss) | (378,523 | ) | 1 | (355,520 | ) | |||||||
Change in unrealized appreciation/depreciation | 550,721 | (32,348 | ) | 264,605 | ||||||||
Purchases/Payups | 5,628,456 | 5,300,000 | 23,965,161 | |||||||||
Sales/Paydowns | (2,474,523 | ) | (3,945,042 | ) | (2,389,158 | ) | ||||||
Reclassification | – 0 | – | – 0 | – | (1,977,000 | ) | ||||||
Transfers in to Level 3 | 1,013,251 | – 0 | – | 728,619 | ||||||||
Transfers out of Level 3 | – 0 | – | – 0 | – | – 0 | – | ||||||
|
|
|
|
|
| |||||||
Balance as of 10/31/17 | $ | 8,839,957 | $ | 5,300,000 | $ | 23,774,688 | ||||||
|
|
|
|
|
| |||||||
Net change in unrealized appreciation/depreciation from investments held as of 10/31/17(b) | $ | 128,186 | $ | – 0 | – | $ | 264,605 | |||||
|
|
|
|
|
| |||||||
| 74 | AB INCOME FUND | abfunds.com |
NOTES TO FINANCIAL STATEMENTS (continued)
| Emerging Markets - Corporate Bonds | Commercial Mortgage-Backed Securities | Collateralized Loan Obligations | ||||||||||
Balance as of 10/31/16 | $ | 447,328 | $ | 48,863,351 | $ | – 0 | – | |||||
Accrued discounts/(premiums) | (2,182 | ) | 125,039 | 7,261 | ||||||||
Realized gain (loss) | (590 | ) | (805,805 | ) | – 0 | – | ||||||
Change in unrealized appreciation/depreciation | (116,823 | ) | 1,693,952 | 224,498 | ||||||||
Purchases/Payups | – 0 | – | 2,235,000 | 12,636,435 | ||||||||
Sales/Paydowns | (74,048 | ) | (10,420,651 | ) | – 0 | – | ||||||
Reclassification | – 0 | – | – 0 | – | 1,977,000 | |||||||
Transfers in to Level 3 | – 0 | – | – 0 | – | – 0 | – | ||||||
Transfers out of Level 3 | – 0 | – | – 0 | – | – 0 | – | ||||||
|
|
|
|
|
| |||||||
Balance as of 10/31/17 | $ | 253,685 | $ | 41,690,886 | $ | 14,845,194 | ||||||
|
|
|
|
|
| |||||||
Net change in unrealized appreciation/depreciation from investments held as of 10/31/17(b) | $ | (116,823 | ) | $ | 503,952 | $ | 224,498 | |||||
|
|
|
|
|
| |||||||
| Whole Loan Trusts | Common Stocks | Preferred Stocks | ||||||||||
Balance as of 10/31/16 | $ | 20,704,736 | $ | 1,428,957 | $ | – 0 | – | |||||
Accrued discounts/(premiums) | 57,156 | – 0 | – | – 0 | – | |||||||
Realized gain (loss) | (1,777,835 | ) | (205,316 | ) | – 0 | – | ||||||
Change in unrealized appreciation/depreciation | (1,139,385 | ) | (289,797 | ) | 442,510 | |||||||
Purchases/Payups | (12,881 | ) | 2,489,288 | 4,466,745 | ||||||||
Sales/Paydowns | (7,098,097 | ) | (70,646 | ) | (1,330,318 | ) | ||||||
Reclassification | – 0 | – | – 0 | – | – 0 | – | ||||||
Transfers in to Level 3 | – 0 | – | – 0 | – | – 0 | – | ||||||
Transfers out of Level 3 | – 0 | – | – 0 | – | – 0 | – | ||||||
|
|
|
|
|
| |||||||
Balance as of 10/31/17 | $ | 10,733,694 | $ | 3,352,486 | $ | 3,578,937 | ||||||
|
|
|
|
|
| |||||||
Net change in unrealized appreciation/depreciation from investments held as of 10/31/17(b) | $ | (1,139,385 | ) | $ | (201,489 | ) | $ | 442,510 | ||||
|
|
|
|
|
| |||||||
| abfunds.com | AB INCOME FUND | 75 |
NOTES TO FINANCIAL STATEMENTS (continued)
| Bank Loans | Warrants(a) | Total | ||||||||||
Balance as of 10/31/16 | $ | 227,922 | $ | –0 | – | $ | 83,387,251 | |||||
Accrued discounts/(premiums) | 197 | – 0 | – | 488,459 | ||||||||
Realized gain (loss) | (1,536,360 | ) | – 0 | – | (5,059,948 | ) | ||||||
Change in unrealized appreciation/depreciation | 1,490,461 | – 0 | – | 3,088,394 | ||||||||
Purchases/Payups | 2,146,481 | – 0 | – | 58,854,685 | ||||||||
Sales/Paydowns | (251,368 | ) | – 0 | – | (28,053,851 | ) | ||||||
Reclassification | – 0 | – | – 0 | – | – 0 | – | ||||||
Transfers in to Level 3 | – 0 | – | – 0 | – | 1,741,870 | |||||||
Transfers out of Level 3 | – 0 | – | – 0 | – | – 0 | – | ||||||
|
|
|
|
|
| |||||||
Balance as of 10/31/17 | $ | 2,077,333 | $ | – 0 | – | $ | 114,446,860 | (c) | ||||
|
|
|
|
|
| |||||||
Net change in unrealized appreciation/depreciation from investments held as of 10/31/17(b) | $ | (34,864 | ) | $ | – 0 | – | $ | 71,190 | ||||
|
|
|
|
|
| |||||||
| (a) | The Fund held securities with zero market value at period end. |
| (b) | The unrealized appreciation/depreciation is included in net change in unrealized appreciation/depreciation on investments and other financial instruments in the accompanying statement of operations. |
| (c) | There were de minimis transfers under 1% of net assets during the reporting period. |
The following presents information about significant unobservable inputs related to the Fund’s Level 3 investments at October 31, 2017. Securities priced (i) by third party vendors, (ii) by brokers or (iii) using prior transaction prices, which approximates fair value, are excluded from the following table.
Quantitative Information about Level 3 Fair Value Measurements
| Fair Value at 10/31/17 | Valuation Technique | Unobservable Input | Input | |||||||
Corporates – Non-Investment Grade | $ | – 0 | – | Qualitative Assessment | $0.00 / NA | |||||
| $ | 210,467 | Recovery Analysis | Collateral Value | $100.00 / NA | ||||||
|
| |||||||||
| $ | 210,467 | |||||||||
|
| |||||||||
Whole Loan Trusts | $ | 2,844,263 | Discounted Cash Flow | Level Yield | 92.50% / NA | |||||
| $ | 2,431,466 | Market- Approach | Underlying NAV of the collateral | $84.32 / NA | ||||||
| $ | 1,425,094 | Recovery Analysis | Delinquency Rate | <4% / NA | ||||||
| $ | 1,019,161 | Recovery Analysis | Cumulative Loss | <20% | ||||||
| $ | 380,987 | Recovery Analysis | Cumulative Loss | <20% | ||||||
| $ | 359,829 | Recovery Analysis | Delinquency Rate Collateralization | <4% / NA 1.1X / NA | ||||||
| $ | 327,564 | Discounted Cash Flow | Level Yield | $53.93 / NA | ||||||
|
| |||||||||
| $ | 8,788,364 | |||||||||
|
| |||||||||
| 76 | AB INCOME FUND | abfunds.com |
NOTES TO FINANCIAL STATEMENTS (continued)
| Fair Value at 10/31/17 | Valuation Technique | Unobservable Input | Input | |||||||
Common Stocks | $ | 1,175,596 | Market- Approach | EBITDA* Projection EBITDA* Multiples | $96.00MM / NA 8.5X-9.5X / 9.0X | |||||
| $ | 942,251 | Market- Approach | EBITDA* Projection EBITDA* Multiples | $237.2MM / NA 6.9X-8.9X / 7.9X | ||||||
|
| |||||||||
| $ | 2,117,847 | |||||||||
|
| |||||||||
Preferred Stocks | $ | 1,176,290 | Market- Approach | EBITDA* Projection EBITDA* Multiples | $96.00MM / NA 8.5X-9.5X / 9.0X | |||||
| * | Earnings before Interest, Taxes, Depreciation and Amortization. |
Generally, a change in the assumptions used in any input in isolation may be accompanied by a change in another input. Significant changes in any of the unobservable inputs may significantly impact the fair value measurement. Significant increases (decreases) in level yield, cumulative loss and delinquency rate in isolation would be expected to result in a significantly lower (higher) fair value measurement. A significant increase (decrease) in collateral value and EBITDA projections/multiples in insolation would be expected to result in a significant higher (lower) fair value measurement.
The Adviser established the Committee to oversee the pricing and valuation of all securities held in the Fund. The Committee operates under pricing and valuation policies and procedures established by the Adviser and approved by the Board, including pricing policies which set forth the mechanisms and processes to be employed on a daily basis to implement these policies and procedures. In particular, the pricing policies describe how to determine market quotations for securities and other instruments. The Committee’s responsibilities include: 1) fair value and liquidity determinations (and oversight of any third parties to whom any responsibility for fair value and liquidity determinations is delegated), and 2) regular monitoring of the Adviser’s pricing and valuation policies and procedures and modification or enhancement of these policies and procedures (or recommendation of the modification of these policies and procedures) as the Committee believes appropriate.
The Committee is also responsible for monitoring the implementation of the pricing policies by the Adviser’s Pricing Group (the “Pricing Group”) and any third party which performs certain pricing functions in accordance with the pricing policies. The Pricing Group is responsible for the oversight of the third party on a day-to-day basis. The Committee and the Pricing Group perform a series of activities to provide reasonable assurance of the accuracy of prices including: 1) periodic vendor due diligence meetings, review of methodologies, new developments and processes at vendors, 2) daily comparison of security valuation versus prior day for all securities that exceeded established thresholds, and 3) daily review of unpriced, stale, and variance reports with exceptions reviewed by senior management and the Committee.
In addition, several processes outside of the pricing process are used to monitor valuation issues including: 1) performance and performance attribution reports are monitored for anomalous impacts based upon benchmark performance, and 2) portfolio managers review all portfolios for performance and analytics (which are generated using the Adviser’s prices).
| abfunds.com | AB INCOME FUND | 77 |
NOTES TO FINANCIAL STATEMENTS (continued)
3. Currency Translation
Assets and liabilities denominated in foreign currencies and commitments under forward currency exchange contracts are translated into U.S. dollars at the mean of the quoted bid and ask prices of such currencies against the U.S. dollar. Purchases and sales of portfolio securities are translated into U.S. dollars at the rates of exchange prevailing when such securities were acquired or sold. Income and expenses are translated into U.S. dollars at rates of exchange prevailing when accrued.
Net realized gain or loss on foreign currency transactions represents foreign exchange gains and losses from sales and maturities of foreign fixed income investments, holding of foreign currencies, currency gains or losses realized between the trade and settlement dates on foreign investment transactions, and the difference between the amounts of dividends, interest and foreign withholding taxes recorded on the Fund’s books and the U.S. dollar equivalent amounts actually received or paid. Net unrealized currency gains and losses from valuing foreign currency denominated assets and liabilities at period end exchange rates are reflected as a component of net unrealized appreciation or depreciation of foreign currency denominated assets and liabilities.
4. Taxes
It is the Fund’s policy to meet the requirements of the Internal Revenue Code applicable to regulated investment companies and to distribute all of its investment company taxable income and net realized gains, if any, to shareholders. Therefore, no provisions for federal income or excise taxes are required. The Fund may be subject to taxes imposed by countries in which it invests. Such taxes are generally based on income and/or capital gains earned or repatriated. Taxes are accrued and applied to net investment income, net realized gains and net unrealized appreciation/depreciation as such income and/or gains are earned.
In accordance with U.S. GAAP requirements regarding accounting for uncertainties in income taxes, management has analyzed the Fund’s tax positions taken or expected to be taken on federal and state income tax returns for all open tax years (the current and the prior three tax years) and has concluded that no provision for income tax is required in the Fund’s financial statements.
5. Investment Income and Investment Transactions
Dividend income is recorded on the ex-dividend date or as soon as the Fund is informed of the dividend. Interest income is accrued daily. Investment transactions are accounted for on the date the securities are purchased or sold. Investment gains or losses are determined on the identified cost basis. The Fund amortizes premiums and accretes discounts as adjustments to interest income.
6. Class Allocations
All income earned and expenses incurred by the Fund are borne on a pro-rata basis by each outstanding class of shares, based on the proportionate interest
| 78 | AB INCOME FUND | abfunds.com |
NOTES TO FINANCIAL STATEMENTS (continued)
in the Fund represented by the net assets of such class, except for class specific expenses which are allocated to the respective class. Expenses of the Company are charged proportionately to each fund or based on other appropriate methods. Realized and unrealized gains and losses are allocated among the various share classes based on respective net assets.
7. Dividends and Distributions
Dividends and distributions to shareholders, if any, are recorded on the ex-dividend date. Income dividends and capital gains distributions are determined in accordance with federal tax regulations and may differ from those determined in accordance with U.S. GAAP. To the extent these differences are permanent, such amounts are reclassified within the capital accounts based on their federal tax basis treatment; temporary differences do not require such reclassification.
8. Repurchase Agreements
It is the Fund’s policy that its custodian or designated subcustodian take control of securities as collateral under repurchase agreements and to determine on a daily basis that the value of such securities are sufficient to cover the value of the repurchase agreements. If the seller defaults and the value of the collateral declines or if bankruptcy proceedings are commenced with respect to the seller of the security, realization of collateral by the Fund may be delayed or limited.
9. Redemption Fees
The Fund imposed a .75% fee on redemption and exchanges of Advisor Class shares. This fee is retained by the Fund and is included in the financials statements as a component of additional paid-in capital. The fee was effective until July 22, 2016.
10. Change of Fiscal Year End
The Predecessor Fund’s fiscal year end was December 31 and the Fund’s fiscal year end is October 31. Accordingly, the statement of operations, statement of changes in net assets, statement of cash flows and the Advisor Class financial highlights reflect the ten months from January 1, 2016 to October 31, 2016. The financial highlights for Class A and Class C reflect the period from April 21, 2016 (inception date) to October 31, 2016.
NOTE B
Advisory Fee and Other Transactions with Affiliates
Under the terms of the investment advisory agreement, the Fund pays the Adviser an advisory fee at an annual rate of .45% of the first $2.5 billion of the Fund’s average daily net assets, .40% of the excess over $2.5 billion up to $5 billion and .35% in excess of $5 billion, of the Fund’s average daily net assets. Effective January 29, 2017, the fee was reduced from .60% to .45 of the first $2.5 billion of the Fund’s average daily net assets, from .55% to .40% of the excess over $2.5 billion up to $5 billion and from .50% to .35% in excess of $5 billion, of the Fund’s average daily net assets. The fee is accrued daily and paid monthly. The Adviser has agreed
| abfunds.com | AB INCOME FUND | 79 |
NOTES TO FINANCIAL STATEMENTS (continued)
to waive its fees and bear certain expenses to the extent necessary to limit total operating expenses (excluding expenses associated with securities sold short, acquired fund fees and expenses other than the advisory fees of any AB Mutual Funds in which the Fund may invest, interest expense, taxes, extraordinary expenses, and brokerage commissions and other transactions cost), on an annual basis (the “Expense Caps”) to .77%, 1.52% and .52% of daily average net assets for Class A, Class C, and Advisor Class shares, respectively. Effective January 29, 2017, the Expense Caps were reduced from .88% to .77%, 1.63% to 1.52%, and .63% to .52% of daily average net assets for Class A, Class C, and Advisor Class shares, respectively. Any fees waived and expenses borne by the Adviser through October 31, 2016 are subject to repayment by the Fund until October 31, 2019; such waivers that are subject to repayment amount to $990,111. In any case, no reimbursement payment will be made that would cause the Fund’s total annual operating expenses to exceed the net fee percentage set forth above. The Expense Caps may not be terminated by the Adviser before April 22, 2018. The Predecessor Fund did not have an Expense Cap. For the year ended October 31, 2017, such reimbursement/waivers amounted to $1,361,441. Prior to April 21, 2016, the Predecessor Fund paid the Adviser a monthly advisory fee in an amount equal to the sum of 1/12th of .30 of 1% of the Predecessor Fund’s average weekly net assets up to $250 million, 1/12th of .25 of 1% of the Predecessor Fund’s average weekly net assets in excess of $250 million, and 4.75% of the Predecessor Fund’s daily gross income (i.e., income other than gains from the sale of securities and foreign currency transactions or gains realized from options, futures and swap, less interest on money borrowed by the Predecessor Fund) accrued by the Predecessor Fund during the month. However, such monthly advisory fee shall not exceed in the aggregate 1/12th of .80% of the Predecessor Fund’s average weekly net assets during the month (approximately .80% on an annual basis).
During the year ended October 31, 2017, the Adviser reimbursed the Fund $346 for trading losses incurred due to a trade entry error.
Pursuant to the investment advisory agreement, the Fund may reimburse the Adviser for certain legal and accounting services provided to the Fund by the Adviser. For the year ended October 31, 2017, the reimbursement for such services amounted to $65,061.
The Fund compensates AllianceBernstein Investor Services, Inc. (“ABIS”), a wholly-owned subsidiary of the Adviser, under a Transfer Agency Agreement for providing personnel and facilities to perform transfer agency services for the Fund. ABIS may make payments to intermediaries that provide omnibus account services, sub-accounting services and/or networking services. Prior to the Reorganization Computershare Trust Company, N.A. was the Transfer Agent. Such compensation retained by ABIS amounted to $443,882 for the year ended October 31, 2017.
| 80 | AB INCOME FUND | abfunds.com |
NOTES TO FINANCIAL STATEMENTS (continued)
AllianceBernstein Investments, Inc. (the “Distributor”), a wholly-owned subsidiary of the Adviser, serves as the distributor of the Fund’s shares. The Distributor has advised the Fund that it has retained front-end sales charges of $57,304 from the sale of Class A shares and received $71 and $5,248 in contingent deferred sales charges imposed upon redemptions by shareholders of Class A and Class C shares, respectively for the year ended October 31, 2017.
The Fund may invest in AB Government Money Market Portfolio (the “Government Money Market Portfolio”) which has a contractual annual advisory fee rate of .20% of the portfolio’s average daily net assets and bears its own expenses. In connection with the investment by the Fund in the Government Money Market Portfolio, the Adviser has contractually agreed to waive its advisory fee from the Fund in an amount equal to the Fund’s pro rata share of the effective advisory fees of Government Money Market Portfolio, as borne indirectly by the Fund as an acquired fund fee and expense. For the year ended October 31, 2017, such waiver amounted to $29,559.
A summary of the Fund’s transactions in AB mutual funds for the year ended October 31, 2017 is as follows:
Fund | Market Value 10/31/16 (000) | Purchases at Cost (000) | Sales Proceeds (000) | Market Value 10/31/17 (000) | Dividend Income (000) | |||||||||||||||
Government Money Market Portfolio | $ | 12,471 | $ | 806,928 | $ | 739,971 | $ | 79,428 | $ | 99 | ||||||||||
Brokerage commissions paid on investment transactions for the year ended October 31, 2017 amounted to $121,163, of which $0 and $0, respectively, was paid to Sanford C. Bernstein & Co. LLC and Sanford C. Bernstein Limited, affiliates of the Adviser.
NOTE C
Distribution Services Agreement
The Fund has adopted a Distribution Services Agreement (the “Agreement”) pursuant to Rule 12b-1 under the Investment Company Act of 1940. Under the Agreement, the Fund pays distribution and servicing fees to the Distributor at an annual rate of up to .25% of the Fund’s average daily net assets attributable to Class A shares and 1% of the Fund’s average daily net assets attributable to Class C shares. There are no distribution and servicing fees on the Advisor Class shares. The fees are accrued daily and paid monthly. The Agreement provides that the Distributor will use such payments in their entirety for distribution assistance and
| abfunds.com | AB INCOME FUND | 81 |
NOTES TO FINANCIAL STATEMENTS (continued)
promotional activities. Since the commencement of the Fund’s operations, the Distributor has incurred expenses in excess of the distribution costs reimbursed by the Fund in the amount of $472,875 for Class C shares. While such costs may be recovered from the Fund in future periods so long as the Agreement is in effect, the rate of the distribution and servicing fees payable under the Agreement may not be increased without a shareholder vote. In accordance with the Agreement, there is no provision for recovery of unreimbursed distribution costs incurred by the Distributor beyond the current fiscal year for Class A shares. The Agreement also provides that the Adviser may use its own resources to finance the distribution of the Fund’s shares.
NOTE D
Investment Transactions
Purchases and sales of investment securities (excluding short-term investments) for the year ended October 31, 2017 were as follows:
| Purchases | Sales | |||||||
Investment securities (excluding | $ | 1,214,821,898 | $ | 250,785,315 | ||||
U.S. government securities | 473,897,668 | 416,771,708 | ||||||
The cost of investments for federal income tax purposes, gross unrealized appreciation and unrealized depreciation are as follows:
Cost | $ | 2,400,964,917 | ||
|
| |||
Gross unrealized appreciation | $ | 82,862,264 | ||
Gross unrealized depreciation | (86,835,395 | ) | ||
|
| |||
Net unrealized depreciation | $ | (3,973,131 | ) | |
|
|
1. Derivative Financial Instruments
The Fund may use derivatives in an effort to earn income and enhance returns, to replace more traditional direct investments, to obtain exposure to otherwise inaccessible markets (collectively, “investment purposes”), or to hedge or adjust the risk profile of its portfolio.
The principal types of derivatives utilized by the Fund, as well as the methods in which they may be used are:
| • | Futures |
The Fund may buy or sell futures for investment purposes or for the purpose of hedging its portfolio against adverse effects of potential movements in the market. The Fund bears the market risk that arises from changes in the value of these instruments and the imperfect correlation between movements in the price of the futures and movements in the price of the assets, reference rates or indices which they are designed to track. Among other things, the Fund may
| 82 | AB INCOME FUND | abfunds.com |
NOTES TO FINANCIAL STATEMENTS (continued)
purchase or sell futures for foreign currencies or options thereon for non-hedging purposes as a means of making direct investment in foreign currencies, as described below under “Currency Transactions”.
At the time the Fund enters into futures, the Fund deposits and maintains as collateral an initial margin with the broker, as required by the exchange on which the transaction is effected. Such amount is shown as cash collateral due from broker on the statement of assets and liabilities. Pursuant to the contract, the Fund agrees to receive from or pay to the broker an amount of cash equal to the daily fluctuation in the value of the contract. Such receipts or payments are known as variation margin and are recorded by the Fund as unrealized gains or losses. Risks may arise from the potential inability of a counterparty to meet the terms of the contract. The credit/counterparty risk for exchange-traded futures is generally less than privately negotiated futures, since the clearinghouse, which is the issuer or counterparty to each exchange-traded future, has robust risk mitigation standards, including the requirement to provide initial and variation margin. When the contract is closed, the Fund records a realized gain or loss equal to the difference between the value of the contract at the time it was opened and the time it was closed.
Use of long futures subjects the Fund to risk of loss in excess of the amounts shown on the statement of assets and liabilities, up to the notional value of the futures. Use of short futures subjects the Fund to unlimited risk of loss. Under some circumstances, futures exchanges may establish daily limits on the amount that the price of futures can vary from the previous day’s settlement price, which could effectively prevent liquidation of unfavorable positions.
During the year ended October 31, 2017, the Fund held futures for hedging and non-hedging purposes.
| • | Forward Currency Exchange Contracts |
The Fund may enter into forward currency exchange contracts in order to hedge its exposure to changes in foreign currency exchange rates on its foreign portfolio holdings, to hedge certain firm purchase and sale commitments denominated in foreign currencies and for non-hedging purposes as a means of making direct investments in foreign currencies, as described below under “Currency Transactions”.
A forward currency exchange contract is a commitment to purchase or sell a foreign currency at a future date at a negotiated forward rate. The gain or loss arising from the difference between the original
| abfunds.com | AB INCOME FUND | 83 |
NOTES TO FINANCIAL STATEMENTS (continued)
contract and the closing of such contract would be included in net realized gain or loss on forward currency exchange contracts. Fluctuations in the value of open forward currency exchange contracts are recorded for financial reporting purposes as unrealized appreciation and/or depreciation by the Fund. Risks may arise from the potential inability of a counterparty to meet the terms of a contract and from unanticipated movements in the value of a foreign currency relative to the U.S. dollar.
During the year ended October 31, 2017, the Fund held forward currency exchange contracts for hedging and non-hedging purposes.
| • | Option Transactions |
For hedging and investment purposes, the Fund may purchase and write (sell) put and call options on U.S. and foreign securities, including government securities, and foreign currencies that are traded on U.S. and foreign securities exchanges and over-the-counter markets. Among other things, the Fund may use options transactions for non-hedging purposes as a means of making direct investments in foreign currencies, as described below under “Currency Transactions” and may use options strategies involving the purchase and/or writing of various combinations of call and/or put options, for hedging and investment purposes.
The risk associated with purchasing an option is that the Fund pays a premium whether or not the option is exercised. Additionally, the Fund bears the risk of loss of the premium and change in market value should the counterparty not perform under the contract. If a put or call option purchased by the Fund were permitted to expire without being sold or exercised, its premium would represent a loss to the Fund. Put and call options purchased are accounted for in the same manner as portfolio securities. The cost of securities acquired through the exercise of call options is increased by premiums paid. The proceeds from securities sold through the exercise of put options are decreased by the premiums paid.
When the Fund writes an option, the premium received by the Fund is recorded as a liability and is subsequently adjusted to the current market value of the option written. Premiums received from written options which expire unexercised are recorded by the Fund on the expiration date as realized gains from options written. The difference between the premium received and the amount paid on effecting a closing purchase transaction, including brokerage commissions, is also treated as a realized gain, or if the premium received is less than the amount paid for the closing purchase transaction, as a realized
| 84 | AB INCOME FUND | abfunds.com |
NOTES TO FINANCIAL STATEMENTS (continued)
loss. If a call option is exercised, the premium received is added to the proceeds from the sale of the underlying security or currency in determining whether the Fund has realized a gain or loss. If a put option is exercised, the premium received reduces the cost basis of the security or currency purchased by the Fund. In writing an option, the Fund bears the market risk of an unfavorable change in the price of the security or currency underlying the written option. Exercise of an option written by the Fund could result in the Fund selling or buying a security or currency at a price different from the current market value.
The Fund may also invest in options on swap agreements, also called “swaptions”. A swaption is an option that gives the buyer the right, but not the obligation, to enter into a swap on a future date in exchange for paying a market-based “premium”. A receiver swaption gives the owner the right to receive the total return of a specified asset, reference rate, or index. A payer swaption gives the owner the right to pay the total return on a specified asset, reference rate, or index. Swaptions also include options that allow an existing swap to be terminated or extended by one of the counterparties.
At October 31, 2017, the maximum payments for written put options amounted to $10,759,767,775. In certain circumstances maximum payout amounts may be partially offset by recovery values of the respective referenced assets and upfront premium received upon entering into the contract.
At October 31, 2017, the maximum payments for written put swaptions amounted to $83,710,000, with net unrealized appreciation/depreciation of $145,261, and a term of less than one year, as reflected in the portfolio of investments.
During the year ended October 31, 2017, the Fund held purchased options for hedging and non-hedging purposes.
During the year ended October 31, 2017, the Fund held written options and swaptions for hedging and non-hedging purposes.
| • | Swaps |
The Fund may enter into swaps to hedge its exposure to interest rates, credit risk, equity markets or currencies. The Fund may also enter into swaps for non-hedging purposes as a means of gaining market exposures, making direct investments in foreign currencies, as described below under “Currency Transactions.” A swap is an agreement that obligates two parties to exchange a series of cash flows at specified intervals based upon or calculated by reference to
| abfunds.com | AB INCOME FUND | 85 |
NOTES TO FINANCIAL STATEMENTS (continued)
changes in specified prices or rates for a specified amount of an underlying asset. The payment flows are usually netted against each other, with the difference being paid by one party to the other. In addition, collateral may be pledged or received by the Fund in accordance with the terms of the respective swaps to provide value and recourse to the Fund or its counterparties in the event of default, bankruptcy or insolvency by one of the parties to the swap.
Risks may arise as a result of the failure of the counterparty to the swap to comply with the terms of the swap. The loss incurred by the failure of a counterparty is generally limited to the net interim payment to be received by the Fund, and/or the termination value at the end of the contract. Therefore, the Fund considers the creditworthiness of each counterparty to a swap in evaluating potential counterparty risk. This risk is mitigated by having a netting arrangement between the Fund and the counterparty and by the posting of collateral by the counterparty to the Fund to cover the Fund’s exposure to the counterparty. Additionally, risks may arise from unanticipated movements in interest rates or in the value of the underlying securities. The Fund accrues for the interim payments on swaps on a daily basis, with the net amount recorded within unrealized appreciation/depreciation of swaps on the statement of assets and liabilities, where applicable. Once the interim payments are settled in cash, the net amount is recorded as realized gain/(loss) on swaps on the statement of operations, in addition to any realized gain/(loss) recorded upon the termination of swaps. Upfront premiums paid or received are recognized as cost or proceeds on the statement of assets and liabilities and are amortized on a straight line basis over the life of the contract. Amortized upfront premiums are included in net realized gain/(loss) from swaps on the statement of operations. Fluctuations in the value of swaps are recorded as a component of net change in unrealized appreciation/depreciation of swaps on the statement of operations.
Certain standardized swaps, including certain interest rate swaps and credit default swaps, are (or soon will be) subject to mandatory central clearing. Cleared swaps are transacted through futures commission merchants (“FCMs”) that are members of central clearinghouses, with the clearinghouse serving as central counterparty, similar to transactions in futures contracts. Centralized clearing will be required for additional categories of swaps on a phased-in basis based on requirements published by the Securities and Exchange Commission and Commodity Futures Trading Commission.
| 86 | AB INCOME FUND | abfunds.com |
NOTES TO FINANCIAL STATEMENTS (continued)
At the time the Fund enters into a centrally cleared swap, the Fund deposits and maintains as collateral an initial margin with the broker, as required by the clearinghouse on which the transaction is effected. Such amount is shown as cash collateral due from broker on the statement of assets and liabilities. Pursuant to the contract, the Fund agrees to receive from or pay to the broker an amount of cash equal to the daily fluctuation in the value of the contract. Such receipts or payments are known as variation margin and are recorded by the Fund as unrealized gains or losses. Risks may arise from the potential inability of a counterparty to meet the terms of the contract. The credit/counterparty risk for centrally cleared swaps is generally less than non-centrally cleared swaps, since the clearinghouse, which is the issuer or counterparty to each centrally cleared swap, has robust risk mitigation standards, including the requirement to provide initial and variation margin. When the contract is closed, the Fund records a realized gain or loss equal to the difference between the value of the contract at the time it was opened and the time it was closed.
Interest Rate Swaps:
The Fund is subject to interest rate risk exposure in the normal course of pursuing its investment objectives. Because the Fund holds fixed rate bonds, the value of these bonds may decrease if interest rates rise. To help hedge against this risk and to maintain its ability to generate income at prevailing market rates, the Fund may enter into interest rate swaps. Interest rate swaps are agreements between two parties to exchange cash flows based on a notional amount. The Fund may elect to pay a fixed rate and receive a floating rate, or, receive a fixed rate and pay a floating rate on a notional amount.
In addition, the Fund may also enter into interest rate swap transactions to preserve a return or spread on a particular investment or portion of its portfolio, or protecting against an increase in the price of securities the Fund anticipates purchasing at a later date. Interest rate swaps involve the exchange by a Fund with another party of their respective commitments to pay or receive interest (e.g., an exchange of floating rate payments for fixed rate payments) computed based on a contractually-based principal (or “notional”) amount. Interest rate swaps are entered into on a net basis (i.e., the two payment streams are netted out, with the Fund receiving or paying, as the case may be, only the net amount of the two payments).
During the year ended October 31, 2017, the Fund held interest rate swaps for hedging purposes.
| abfunds.com | �� | AB INCOME FUND | 87 |
NOTES TO FINANCIAL STATEMENTS (continued)
Credit Default Swaps:
The Fund may enter into credit default swaps, including to manage its exposure to the market or certain sectors of the market, to reduce its risk exposure to defaults by corporate and sovereign issuers held by the Fund, or to create exposure to corporate or sovereign issuers to which it is not otherwise exposed. The Fund may purchase credit protection (“Buy Contract”) or provide credit protection (“Sale Contract”) on the referenced obligation of the credit default swap. During the term of the swap, the Fund receives/(pays) fixed payments from/(to) the respective counterparty, calculated at the agreed upon rate applied to the notional amount. If the Fund is a buyer/(seller) of protection and a credit event occurs, as defined under the terms of the swap, the Fund will either (i) receive from the seller/(pay to the buyer) of protection an amount equal to the notional amount of the swap (the “Maximum Payout Amount”) and deliver/(take delivery of) the referenced obligation or (ii) receive/(pay) a net settlement amount in the form of cash or securities equal to the notional amount of the swap less the recovery value of the referenced obligation.
In certain circumstances Maximum Payout Amounts may be partially offset by recovery values of the respective referenced obligations, upfront premium received upon entering into the agreement, or net amounts received from settlement of buy protection credit default swaps entered into by the Fund for the same referenced obligations with the same counterparty. As of October 31, 2017, the Fund did not have Buy Contracts outstanding with respect to the same referenced obligations and same counterparty for its Sale Contracts outstanding.
Credit default swaps may involve greater risks than if a Fund had invested in the referenced obligation directly. Credit default swaps are subject to general market risk, liquidity risk, counterparty risk and credit risk. If the Fund is a buyer of protection and no credit event occurs, it will lose the payments it made to its counterparty. If the Fund is a seller of protection and a credit event occurs, the value of the referenced obligation received by the Fund coupled with the periodic payments previously received, may be less than the Maximum Payout Amount it pays to the buyer, resulting in a net loss to the Fund.
Implied credit spreads over U.S. Treasuries of comparable maturity utilized in determining the market value of credit default swaps on issuers as of period end are disclosed in the portfolio of investments. The implied spreads serve as an indicator of the current status of the payment/performance risk and typically reflect the likelihood of default by the issuer of the referenced obligation. The implied credit spread of
| 88 | AB INCOME FUND | abfunds.com |
NOTES TO FINANCIAL STATEMENTS (continued)
a particular reference obligation also reflects the cost of buying/selling protection and may reflect upfront payments required to be made to enter into the agreement. Widening credit spreads typically represent a deterioration of the referenced obligation’s credit soundness and greater likelihood of default or other credit event occurring as defined under the terms of the agreement. A credit spread identified as “Defaulted” indicates a credit event has occurred for the referenced obligation.
During the year ended October 31, 2017, the Fund held credit default swaps for non-hedging purposes.
Total Return Swaps:
The Fund may enter into total return swaps in order to take a “long” or “short” position with respect to an underlying referenced asset. The Fund is subject to market price volatility of the underlying referenced asset. A total return swap involves commitments to pay interest in exchange for a market linked return based on a notional amount. To the extent that the total return of the security, group of securities or index underlying the transaction exceeds or falls short of the offsetting interest obligation, the Fund will receive a payment from or make a payment to the counterparty.
During the year ended October 31, 2017, the Fund held total return swaps for non-hedging purposes.
Variance Swaps:
The Fund may enter into variance swaps to hedge equity market risk or adjust exposure to the equity markets. Variance swaps are contracts in which two parties agree to exchange cash payments based on the difference between the stated level of variance and the actual variance realized on underlying asset(s) or index(es). Actual “variance” as used here is defined as the sum of the square of the returns on the reference asset(s) or index(es) (which in effect is a measure of its “volatility”) over the length of the contract term. So the parties to a variance swap can be said to exchange actual volatility for a contractually stated rate of volatility.
During the year ended October 31, 2017, the Fund held variance swaps for non-hedging purposes.
The Fund typically enters into International Swaps and Derivatives Association, Inc. Master Agreements (“ISDA Master Agreement”) with its OTC derivative contract counterparties in order to, among other things, reduce its credit risk to OTC counterparties. ISDA Master Agreements include provisions for general obligations, representations, collateral and events of
| abfunds.com | AB INCOME FUND | 89 |
NOTES TO FINANCIAL STATEMENTS (continued)
default or termination. Under an ISDA Master Agreement, the Fund typically may offset with the OTC counterparty certain derivative financial instruments’ payables and/or receivables with collateral held and/or posted and create one single net payment (close-out netting) in the event of default or termination. In the event of a default by an OTC counterparty, the return of collateral with market value in excess of the Fund’s net liability, held by the defaulting party, may be delayed or denied.
The Fund’s ISDA Master Agreements may contain provisions for early termination of OTC derivative transactions in the event the net assets of the Fund decline below specific levels (“net asset contingent features”). If these levels are triggered, the Fund’s OTC counterparty has the right to terminate such transaction and require the Fund to pay or receive a settlement amount in connection with the terminated transaction. For additional details, please refer to netting arrangements by the OTC counterparty tables below.
During the year ended October 31, 2017, the Fund had entered into the following derivatives:
Asset Derivatives | Liability Derivatives | |||||||||||
Derivative Type | Statement of | Fair Value | Statement of | Fair Value | ||||||||
Interest rate contracts | Receivable/Payable for variation margin on futures | $ | 2,529,237 | * | Receivable/Payable for variation margin on futures | $ | 8,349,627 | * | ||||
Credit contracts | Receivable/Payable for variation margin on exchange traded swaps | 59,482 | * | Receivable/Payable for variation margin on exchange traded swaps | 354,718 | * | ||||||
Interest rate contracts | Receivable/Payable for variation margin on exchange traded swaps | 453,607 | * | Receivable/Payable for variation margin on exchange traded swaps | 2,136,946 | * | ||||||
Foreign exchange contracts | Unrealized appreciation on forward currency exchange contracts | 26,336,653 | Unrealized depreciation on forward currency exchange contracts | 13,659,530 | ||||||||
Foreign exchange contracts | Investments in securities, at value | 367,109 | ||||||||||
Equity contracts | Investments in securities, at value | 54,677 | ||||||||||
| 90 | AB INCOME FUND | abfunds.com |
NOTES TO FINANCIAL STATEMENTS (continued)
Asset Derivatives | Liability Derivatives | |||||||||||
Derivative Type | Statement of | Fair Value | Statement of | Fair Value | ||||||||
Foreign exchange contracts | Options written, at value | $ | 5,449,140 | |||||||||
Credit contracts | Swaptions written, at value | 101,644 | ||||||||||
Credit contracts | Unrealized depreciation on credit default swaps | 4,852,610 | ||||||||||
Equity contracts | Unrealized appreciation on variance swaps | $ | 218,895 | |||||||||
|
|
|
| |||||||||
Total | $ | 30,019,660 | $ | 34,904,215 | ||||||||
|
|
|
| |||||||||
| * | Only variation margin receivable/payable at period end is reported within the statement of assets and liabilities. This amount reflects cumulative appreciation/(depreciation) of exchange-traded derivatives as reported in the portfolio of investments. |
Derivative Type | Location of Gain or (Loss) on Derivatives Within Statement of Operations | Realized Gain or (Loss) on Derivatives | Change in Unrealized Appreciation or (Depreciation) | |||||||
Interest rate contracts | Net realized gain (loss) on futures; Net change in unrealized appreciation/depreciation of futures | $ | 25,688,784 | $ | (18,201,713 | ) | ||||
Equity contracts | Net realized gain (loss) on futures; Net change in unrealized appreciation/depreciation of futures | 146,796 | – 0 | – | ||||||
Foreign exchange contracts | Net realized gain (loss) on forward currency exchange contracts; Net change in unrealized appreciation/depreciation of forward currency exchange contracts | 1,515,149 | 11,494,401 | |||||||
Interest rate contracts | Net realized gain (loss) on investment transactions; Net change in unrealized appreciation/depreciation of investments | (437,774 | ) | – 0 | – | |||||
| abfunds.com | AB INCOME FUND | 91 |
NOTES TO FINANCIAL STATEMENTS (continued)
Derivative Type | Location of Gain or (Loss) on Derivatives Within Statement of Operations | Realized Gain or (Loss) on Derivatives | Change in Unrealized Appreciation or (Depreciation) | |||||||
Foreign exchange contracts | Net realized gain (loss) on investment transactions; Net change in unrealized appreciation/depreciation of investments | $ | (1,048,161 | ) | $ | (564,526 | ) | |||
Equity contracts | Net realized gain (loss) on investment transactions; Net change in unrealized appreciation/depreciation of investments | (2,039,668 | ) | (130,886 | ) | |||||
Foreign exchange contracts | Net realized gain (loss) on options written; Net change in unrealized appreciation/depreciation of options written | 5,063,099 | (1,102,591 | ) | ||||||
Equity contracts | Net realized gain (loss) on options written; Net change in unrealized appreciation/depreciation of options written | 1,031,223 | – 0 | – | ||||||
Interest rate contracts | Net realized gain (loss) on swaptions written; Net change in unrealized appreciation/depreciation of swaptions written | 717,381 | – 0 | – | ||||||
Credit contracts | Net realized gain (loss) on swaptions written; Net change in unrealized appreciation/depreciation of swaptions written | 255,161 | 145,261 | |||||||
Interest rate contracts | Net realized gain (loss) on swaps; Net change in unrealized appreciation/depreciation of swaps | (1,359,801 | ) | 4,333,525 | ||||||
Credit contracts | Net realized gain (loss) on swaps; Net change in unrealized appreciation/depreciation of swaps | (1,887,687 | ) | (3,519,759 | ) | |||||
| 92 | AB INCOME FUND | abfunds.com |
NOTES TO FINANCIAL STATEMENTS (continued)
Derivative Type | Location of Gain or (Loss) on Derivatives Within Statement of Operations | Realized Gain or (Loss) on Derivatives | Change in Unrealized Appreciation or (Depreciation) | |||||||
Equity contracts | Net realized gain (loss) on swaps; Net change in unrealized appreciation/depreciation of swaps | $ | 7,959,766 | $ | 218,895 | |||||
|
|
|
| |||||||
Total | $ | 35,574,268 | $ | (7,327,393 | ) | |||||
|
|
|
| |||||||
The following table represents the average monthly volume of the Fund’s derivative transactions during the year ended October 31, 2017:
Futures: | ||||
Average original value of buy contracts | $ | 584,321,879 | (a) | |
Average original value of sale contracts | $ | 343,379,908 | ||
Forward Currency Exchange Contracts: | ||||
Average principal amount of buy contracts | $ | 302,796,519 | ||
Average principal amount of sale contracts | $ | 559,016,747 | ||
Purchased Options: | ||||
Average monthly cost | $ | 943,520 | ||
Options Written: | ||||
Average notional amount | $ | 273,392,533 | ||
Swaptions Written: | ||||
Average notional amount | $ | 70,374,610 | (b) | |
Interest Rate Swaps: | ||||
Average notional amount | $ | 32,111,529 | (c) | |
Centrally Cleared Interest Rate Swaps: | ||||
Average notional amount | $ | 162,454,643 | ||
Credit Default Swaps: | ||||
Average notional amount of sale contracts | $ | 55,609,769 | ||
Centrally Cleared Credit Default Swaps: | ||||
Average notional amount of buy contracts | $ | 59,950,190 | ||
Average notional amount of sale contracts | $ | 30,906,499 | ||
Total Return Swaps: | ||||
Average notional amount | $ | 6,667,429 | (d) | |
Variance Swaps: | ||||
Average notional amount | $ | 826,373 | (e) |
| (a) | Positions were open for eleven months during the year. |
| (b) | Positions were open for five months during the year. |
| (c) | Positions were open for less than one month during the year. |
| (d) | Positions were open for four months during the year. |
| (e) | Positions were open for ten months during the year. |
For financial reporting purposes, the Fund does not offset derivative assets and derivative liabilities that are subject to netting arrangements in the statement of assets and liabilities.
| abfunds.com | AB INCOME FUND | 93 |
NOTES TO FINANCIAL STATEMENTS (continued)
All OTC derivatives held at period end were subject to netting arrangements. The following table presents the Fund’s derivative assets and liabilities by OTC counterparty net of amounts available for offset under ISDA Master Agreements and net of the related collateral received/pledged by the Fund as of October 31, 2017. Exchange-traded derivatives are not subject to netting arrangements and as such are excluded from the table.
Counterparty | Derivative Assets Subject to a MA | Derivative Available for Offset | Cash Collateral Received* | Security Collateral Received* | Net Amount of Derivatives Assets | |||||||||||||||
OTC Derivatives: | ||||||||||||||||||||
Australia and New Zealand Banking Group Ltd. | $ | 1,162,746 | $ | (310,533 | ) | $ | – 0 | – | $ | – 0 | – | $ | 852,213 | |||||||
Bank of America, NA | 3,039,768 | (1,787,635 | ) | – 0 | – | – 0 | – | 1,252,133 | ||||||||||||
Barclays Bank PLC | 1,883,563 | (1,883,563 | ) | – 0 | – | – 0 | – | – 0 | – | |||||||||||
BNP Paribas SA | 827,221 | (827,221 | ) | – 0 | – | – 0 | – | – 0 | – | |||||||||||
Citibank, NA | 747,023 | (747,023 | ) | – 0 | – | – 0 | – | – 0 | – | |||||||||||
Credit Suisse International | 2,207,535 | (2,207,535 | ) | – 0 | – | – 0 | – | – 0 | – | |||||||||||
Deutsche Bank AG | 2,730,041 | (2,730,041 | ) | – 0 | – | – 0 | – | – 0 | – | |||||||||||
Goldman Sachs Bank USA/Goldman Sachs International | 1,844,896 | (1,844,896 | ) | – 0 | – | – 0 | – | – 0 | – | |||||||||||
HSBC Bank USA | 805,226 | (9,277 | ) | – 0 | – | – 0 | – | 795,949 | ||||||||||||
JPMorgan Chase Bank, NA | 9,009,570 | (2,762,012 | ) | – 0 | – | – 0 | – | 6,247,558 | ||||||||||||
Morgan Stanley & Co., Inc./Morgan Stanley Capital Services LLC | 54,677 | (54,677 | ) | – 0 | – | – 0 | – | – 0 | – | |||||||||||
Royal Bank of Scotland PLC | 849,099 | (849,099 | ) | – 0 | – | – 0 | – | – 0 | – | |||||||||||
Standard Chartered Bank | 841,696 | (516,780 | ) | (312,000 | ) | – 0 | – | 12,916 | ||||||||||||
State Street Bank & Trust Co. | 944,502 | (309,503 | ) | – 0 | – | –0 | – | 634,999 | ||||||||||||
UBS AG | 29,771 | – 0 | – | – 0 | – | – 0 | – | 29,771 | ||||||||||||
|
|
|
|
|
|
|
|
|
| |||||||||||
Total | $ | 26,977,334 | $ | (16,839,795 | ) | $ | (312,000 | ) | $ | –0 | – | $ | 9,825,539 | ^ | ||||||
|
|
|
|
|
|
|
|
|
| |||||||||||
| 94 | AB INCOME FUND | abfunds.com |
NOTES TO FINANCIAL STATEMENTS (continued)
Counterparty | Derivative Liabilities Subject to a MA | Derivative Available for Offset | Cash Collateral Pledged* | Security Collateral Pledged* | Net Amount of Derivatives Liabilities | |||||||||||||||
OTC Derivatives: | ||||||||||||||||||||
Australia and New Zealand Banking Group Ltd. | $ | 310,533 | $ | (310,533 | ) | $ | – 0 | – | $ | – 0 | – | $ | – 0 | – | ||||||
Bank of America, NA | 1,787,635 | (1,787,635 | ) | – 0 | – | – 0 | – | – 0 | – | |||||||||||
Barclays Bank PLC | 2,511,442 | (1,883,563 | ) | – 0 | – | (627,879 | ) | – 0 | – | |||||||||||
BNP Paribas SA | 1,423,613 | (827,221 | ) | – 0 | – | (533,784 | ) | 62,608 | ||||||||||||
Citibank, NA | 3,629,836 | (747,023 | ) | – 0 | – | (1,078,296 | ) | 1,804,517 | ||||||||||||
Citigroup Global Markets, Inc. | 2,500,748 | – 0 | – | – 0 | – | (2,272,196 | ) | 228,552 | ||||||||||||
Credit Suisse International | 5,993,378 | (2,730,041 | ) | – 0 | – | (3,369,154 | ) | 416,689 | ||||||||||||
Deutsche Bank AG | 4,329,614 | (2,730,041 | ) | – 0 | – | (1,599,573 | ) | – 0 | – | |||||||||||
Goldman Sachs Bank USA/Goldman Sachs International | 10,358,167 | (1,844,896 | ) | – 0 | – | (8,513,271 | ) | – 0 | – | |||||||||||
HSBC Bank USA | 9,277 | (9,277 | ) | – 0 | – | – 0 | – | – 0 | – | |||||||||||
JPMorgan Chase Bank, NA | 2,762,012 | (2,762,012 | ) | – 0 | – | – 0 | – | – 0 | – | |||||||||||
Morgan Stanley & Co., Inc./Morgan Stanley Capital Services LLC | 664,395 | (54,677 | ) | – 0 | – | – 0 | – | 609,718 | ||||||||||||
Royal Bank of Scotland PLC | 1,829,686 | (849,099 | ) | – 0 | – | – 0 | – | 980,587 | ||||||||||||
| abfunds.com | AB INCOME FUND | 95 |
NOTES TO FINANCIAL STATEMENTS (continued)
Counterparty | Derivative Liabilities Subject to a MA | Derivative Available for Offset | Cash Collateral Pledged* | Security Collateral Pledged* | Net Amount of Derivatives Liabilities | |||||||||||||||
Standard Chartered Bank | $ | 516,780 | $ | (516,780 | ) | $ | – 0 | – | $ | – 0 | – | $ | – 0 | – | ||||||
State Street Bank & Trust Co. | 309,503 | (309,503 | ) | – 0 | – | – 0 | – | – 0 | – | |||||||||||
|
|
|
|
|
|
|
|
|
| |||||||||||
Total | $ | 38,936,619 | $ | (16,839,795 | ) | $ | – 0 | – | $ | (17,994,153 | ) | $ | 4,102,671 | ^ | ||||||
|
|
|
|
|
|
|
|
|
| |||||||||||
| * | The actual collateral received/pledged may be more than the amount reported due to over-collateralization. |
| ^ | Net amount represents the net receivable/payable that would be due from/to the counterparty in the event of default or termination. The net amount from OTC financial derivative instruments can only be netted across transactions governed under the same master agreement with the same counterparty. |
See Note D.4 for additional disclosure of netting arrangements regarding reverse repurchase agreements.
2. Currency Transactions
The Fund may invest in non-U.S. Dollar-denominated securities on a currency hedged or unhedged basis. The Fund may seek investment opportunities by taking long or short positions in currencies through the use of currency-related derivatives, including forward currency exchange contracts, futures and options on futures, swaps, and other options. The Fund may enter into transactions for investment opportunities when it anticipates that a foreign currency will appreciate or depreciate in value but securities denominated in that currency are not held by the Fund and do not present attractive investment opportunities. Such transactions may also be used when the Adviser believes that it may be more efficient than a direct investment in a foreign currency-denominated security. The Fund may also conduct currency exchange contracts on a spot basis (i.e., for cash at the spot rate prevailing in the currency exchange market for buying or selling currencies).
3. Dollar Rolls
The Fund may enter into dollar rolls. Dollar rolls involve sales by the Fund of securities for delivery in the current month and the Fund’s simultaneously contracting to repurchase substantially similar (same type and coupon) securities on a specified future date. During the roll period, the Fund forgoes principal and interest paid on the securities. The Fund is compensated by the difference between the current sales price and the lower forward price for the future purchase (often referred to as the “drop”) as well as by the interest earned on the cash proceeds of the initial sale. Dollar rolls involve the risk that the market value of the securities the Fund is obligated to repurchase under the agreement may decline below the repurchase price. Dollar rolls are speculative techniques. During the year ended October 31, 2017, the Fund had no transactions in dollar rolls.
| 96 | AB INCOME FUND | abfunds.com |
NOTES TO FINANCIAL STATEMENTS (continued)
4. Reverse Repurchase Agreements
The Fund may enter into reverse repurchase transactions (“RVP”) in accordance with the terms of a Master Repurchase Agreement (“MRA”), under which the Fund sells securities and agrees to repurchase them at a mutually agreed upon date and price. At the time the Fund enters into a reverse repurchase agreement, it will establish a segregated account with the custodian containing liquid assets having a value comparable to the repurchase price. Under the MRA and other Master Agreements, the Fund is permitted to offset payables and/or receivables with collateral held and/or posted to the counterparty and create one single net payment due to or from the Fund in the event of a default. In the event of a default by a MRA counterparty, the Fund may be considered an unsecured creditor with respect to any excess collateral (collateral with a market value in excess of the repurchase price) held by and/or posted to the counterparty, and as such the return of such excess collateral may be delayed or denied. For the year ended October 31, 2017, the average amount of reverse repurchase agreements outstanding was $289,553,285 and the daily weighted average interest rate was 1.12%. At October 31, 2017, the Fund had reverse repurchase agreements outstanding in the amount of $369,385,692 as reported on the statement of assets and liabilities.
The following table presents the Fund’s RVP liabilities by counterparty net of the related collateral pledged by the Fund as of October 31, 2017:
Counterparty | RVP Liabilities Subject to a MRA | Securities Collateral Pledged†* | Net Amount of RVP Liabilities | |||||||||
Barclays Capital, Inc. | $ | 1,516,525 | $ | (1,516,525 | ) | $ | – 0 | – | ||||
HSBC Bank USA | 183,783,346 | (183,752,409 | ) | 30,937 | ||||||||
JP Morgan Chase Bank | 184,085,821 | (184,085,821 | ) | – 0 | – | |||||||
|
|
|
|
|
| |||||||
Total | $ | 369,385,692 | $ | (369,354,755) | $ | 30,937 | ||||||
|
|
|
|
|
| |||||||
| † | Including accrued interest. |
| * | The actual collateral pledged may be more than the amount reported due to overcollateralization. |
5. Loan Participations and Assignments
The Fund may invest in direct debt instruments which are interests in amounts owed to lenders or lending syndicates by corporate, governmental, or other borrowers, either in the form of participations at the time the loan is originated (“Participations”) or by buying an interest in the loan in the secondary market from a financial institution or institutional investor (“Assignments”). A loan is often administered by a bank or other financial institution (the “Lender”) that acts as agent for all holders. The agent administers the term of the loan as specified in the loan agreement. When investing in Participations, the Fund generally has no right to enforce compliance with the terms of the loan agreement with the borrower. In addition, when investing in Participations, the Fund has the right to receive
| abfunds.com | AB INCOME FUND | 97 |
NOTES TO FINANCIAL STATEMENTS (continued)
payments of principal, interest and any fees to which it is entitled only from the Lender and only upon receipt of payments by the Lender from the borrower. As a result, the Fund may be subject to the credit risk of both the borrower and the Lender. When the Fund purchases Assignments from Lenders, it will typically acquire direct rights against the borrower on the loan. These loans may include participations in “bridge loans”, which are loans taken out by borrowers for a short period (typically less than six months) pending arrangement of more permanent financing through, for example, the issuance of bonds, frequently high-yield bonds issued for the purpose of acquisitions. The Fund may also participate in unfunded loan commitments, which are contractual obligations for investing in future Participations, and may receive a commitment fee based on the amount of the commitment. Under these arrangements, the Fund may receive a fixed rate commitment fee and, if and to the extent the borrower borrows under the facility, the Fund may receive an additional funding fee.
Unfunded loan commitments and funded loans are marked to market daily.
During the year ended October 31, 2017, the Fund had no commitments outstanding and received no commitment fees or additional funding fees.
NOTE E
Common Stock
During the years ended December 31, 2015 and December 31, 2014 the Predecessor Fund did not issue any shares in connection with the Fund’s dividend reinvestment plan.
On June 25, 2014, the Predecessor Fund announced a share repurchase program for the Predecessor Fund’s discretionary repurchase of up to 15% of its then outstanding shares of common stock (valued at up to approximately $306 million as of June 24, 2014 based on Predecessor Fund total net assets of approximately $2.04 billion) in open market transactions over a one-year period. This share repurchase program is intended to benefit long-term Predecessor Fund stockholders by the repurchase of Predecessor Fund shares at a discount to their net asset value. During the years ended December 31, 2015 and December 31, 2014, the Predecessor Fund repurchased 12,172,242 and 14,903,847 shares, respectively, at an average discount of 10.45% and 10.09%, respectively, from net asset value. The share repurchase program expired on June 25, 2015.
| 98 | AB INCOME FUND | abfunds.com |
NOTES TO FINANCIAL STATEMENTS (continued)
NOTE F
Capital Stock
Each class consists of 3,000,000,000 authorized shares. Transactions in capital shares for each class were as follows:
| Shares | Amount | |||||||||||||||||||||||
| Year Ended October 31, 2017 | For the Period January 1, 2016 | Year Ended October 31, 2017 | For the Period January 1, 2016 | |||||||||||||||||||||
|
| |||||||||||||||||||||||
| Class A(b) | ||||||||||||||||||||||||
Shares sold | 23,455,002 | 299,970 | $ | 191,015,549 | $ | 2,441,972 | ||||||||||||||||||
| ||||||||||||||||||||||||
Shares issued in reinvestment of dividends and distributions | 161,151 | 1,566 | 1,312,042 | 12,705 | ||||||||||||||||||||
| ||||||||||||||||||||||||
Shares converted from Class C | 11,746 | – 0 | – | 95,630 | – 0 | – | ||||||||||||||||||
| ||||||||||||||||||||||||
Shares redeemed | (3,466,393 | ) | (41,234 | ) | (28,278,499 | ) | (334,002 | ) | ||||||||||||||||
| ||||||||||||||||||||||||
Net increase | 20,161,506 | 260,302 | $ | 164,144,722 | $ | 2,120,675 | ||||||||||||||||||
| ||||||||||||||||||||||||
| Class C(b) | ||||||||||||||||||||||||
Shares sold | 7,657,205 | 139,491 | $ | 62,456,060 | $ | 1,134,187 | ||||||||||||||||||
| ||||||||||||||||||||||||
Shares issued in reinvestment of dividends and distributions | 58,798 | 533 | 479,345 | 4,327 | ||||||||||||||||||||
| ||||||||||||||||||||||||
Shares converted to Class A | (11,732 | ) | – 0 | – | (95,630 | ) | – 0 | – | ||||||||||||||||
| ||||||||||||||||||||||||
Shares redeemed | (179,030 | ) | (35 | ) | (1,463,342 | ) | (285 | ) | ||||||||||||||||
| ||||||||||||||||||||||||
Net increase | 7,525,241 | 139,989 | $ | 61,376,433 | $ | 1,138,229 | ||||||||||||||||||
| ||||||||||||||||||||||||
| Advisor Class | ||||||||||||||||||||||||
Shares sold | 134,693,611 | 1,526,459 | $ | 1,097,096,092 | $ | 12,542,792 | ||||||||||||||||||
| ||||||||||||||||||||||||
Shares issued in reinvestment of dividends and distributions | 3,720,533 | 1,556,770 | 30,140,363 | 12,608,123 | ||||||||||||||||||||
| ||||||||||||||||||||||||
Shares redeemed | (28,723,376 | ) | (105,702,567 | ) | (232,059,822 | ) | (856,758,327 | ) | ||||||||||||||||
| ||||||||||||||||||||||||
Net increase (decrease) | 109,690,768 | (102,619,338 | ) | $ | 895,176,633 | $ | (831,607,412 | ) | ||||||||||||||||
| ||||||||||||||||||||||||
| (a) | The Predecessor Fund’s fiscal year end was December 31 and the Fund’s fiscal year end is October 31. |
| (b) | Inception date of April 21, 2016. |
NOTE G
Risks Involved in Investing in the Fund
Interest Rate Risk and Credit Risk—Interest rate risk is the risk that changes in interest rates will affect the value of the Fund’s investments in fixed-income debt securities such as bonds or notes. Increases in interest
| abfunds.com | AB INCOME FUND | 99 |
NOTES TO FINANCIAL STATEMENTS (continued)
rates may cause the value of the Fund’s investments to decline. Credit risk is the risk that the issuer or guarantor of a debt security, or the counterparty to a derivative contract, will be unable or unwilling to make timely principal and/or interest payments, or to otherwise honor its obligations. The degree of risk for a particular security may be reflected in its credit rating. Credit risk is greater for medium quality and lower-rated securities. Lower-rated debt securities and similar unrated securities (commonly known as “junk bonds”) have speculative elements or are predominantly speculative risks.
Below Investment Grade Securities Risk—Investments in fixed-income securities with lower ratings (commonly known as “junk bonds”) tend to have a higher probability that an issuer will default or fail to meet its payment obligations. These securities may be subject to greater price volatility due to such factors as specific corporate developments, interest rate sensitivity, negative perceptions of the junk bond market generally and less secondary market liquidity. These securities are often able to be “called” or repurchased by the issuer prior to their maturity date, forcing the Fund to reinvest the proceeds, possibly at a lower rate of return.
Duration Risk—Duration is a measure that relates the expected price volatility of a fixed-income security to changes in interest rates. The duration of a fixed-income security may be shorter than or equal to full maturity of a fixed-income security. Fixed-income securities with longer durations have more risk and will decrease in price as interest rates rise. For example, a fixed-income security with a duration of three years will decrease in value by approximately 3% if interest rates increase by 1%.
Inflation Risk—This is the risk that the value of assets or income from investments will be less in the future as inflation decreases the value of money. As inflation increases, the value of the Fund’s assets can decline as can the value of the Fund’s distributions. This risk is significantly greater for fixed-income securities with longer maturities.
Foreign (Non-U.S.) Risk—Investments in securities of non-U.S. issuers may involve more risk than those of U.S. issuers. These securities may fluctuate more widely in price and may be less liquid due to adverse market, economic, political, regulatory or other factors.
Emerging Market Risk—Investments in emerging market countries may have more risk because the markets are less developed and less liquid, and because these investments may be subject to increased economic, political, regulatory, or other uncertainties.
Leverage Risk—When the Fund borrows money or otherwise leverages its investments, its performance may be volatile because leverage tends to
| 100 | AB INCOME FUND | abfunds.com |
NOTES TO FINANCIAL STATEMENTS (continued)
exaggerate the effect of any increase or decrease in the value of the Fund’s investments. The Fund may create leverage through the use of reverse repurchase arrangements, forward currency exchange contracts, forward commitments, dollar rolls or futures or by borrowing money. The use of other types of derivative instruments by the Fund, such as options and swaps, may also result in a form of leverage. Leverage may result in higher returns to the Fund than if the Fund were not leveraged, but may also adversely affect returns, particularly if the market is declining.
Currency Risk—Fluctuations in currency exchange rates may negatively affect the value of the Fund’s investments or reduce its returns.
Liquidity Risk—Liquidity risk occurs when certain investments become difficult to purchase or sell. Difficulty in selling less liquid securities may result in sales at disadvantageous prices affecting the value of your investment in the Fund. Causes of liquidity risk may include low trading volumes, large positions and heavy redemptions of fund shares. Over recent years, liquidity risk has also increased because the capacity of dealers in the secondary market for fixed-income securities to make markets in these securities has decreased, even as the overall bond market has grown significantly, due to, among other things, structural changes, additional regulatory requirements and capital and risk restraints that have led to reduced inventories. Liquidity risk may be higher in a rising interest rate environment, when the value and liquidity of fixed-income securities generally decline.
Mortgage-Backed and/or Other Asset-Backed Securities Risk—Investments in mortgage-backed and other asset-backed securities are subject to certain additional risks. The value of these securities may be particularly sensitive to changes in interest rates. These risks include “extension risk”, which is the risk that, in periods of rising interest rates, issuers may delay the payment of principal, and “prepayment risk”, which is the risk that in periods of falling interest rates, issuers may pay principal sooner than expected, exposing the Fund to a lower rate of return upon reinvestment of principal. Mortgage-backed securities offered by non-governmental issuers and other asset-backed securities may be subject to other risks, such as higher rates of default in the mortgages or assets backing the securities or risks associated with the nature and servicing of mortgages or assets backing the securities.
Derivatives Risk—The Fund may enter into derivative transactions such as forwards, options, futures and swaps. Derivatives may be illiquid, difficult to price, and leveraged so that small changes may produce disproportionate losses for the Fund, and subject to counterparty risk to a greater degree than more traditional investments. Derivatives may result in significant losses, including losses that are far greater than the value of the derivatives reflected on the statement of assets and liabilities.
| abfunds.com | AB INCOME FUND | 101 |
NOTES TO FINANCIAL STATEMENTS (continued)
Indemnification Risk—In the ordinary course of business, the Fund enters into contracts that contain a variety of indemnifications. The Fund’s maximum exposure under these arrangements is unknown. However, the Fund has not had prior claims or losses pursuant to these indemnification provisions and expects the risk of loss thereunder to be remote. Therefore, the Fund has not accrued any liability in connection with these indemnification provisions.
NOTE H
Joint Credit Facility
A number of open-end mutual funds managed by the Adviser, including the Fund, participate in a $280 million revolving credit facility (the “Facility”) intended to provide short-term financing, if necessary, subject to certain restrictions in connection with abnormal redemption activity. Commitment fees related to the Facility are paid by the participating funds and are included in miscellaneous expenses in the statement of operations. The Fund did not utilize the Facility during the year ended October 31, 2017.
NOTE I
Distributions to Shareholders
The tax character of distributions paid during the fiscal years ended October 31, 2017 and October 31, 2016 and year ended December 31, 2015 were as follows:
| 2017 | 2016 | 2015 | ||||||||||
Distributions paid from: | ||||||||||||
Ordinary income | $ | 60,370,948 | $ | 53,039,602 | $ | 107,568,721 | ||||||
Net long-term capital gains | – 0 | – | – 0 | – | 3,863,457 | |||||||
|
|
|
|
|
| |||||||
Total taxable distributions | $ | 60,370,948 | $ | 53,039,602 | $ | 111,432,178 | ||||||
|
|
|
|
|
| |||||||
As of October 31, 2017, the components of accumulated earnings/(deficit) on a tax basis were as follows:
Undistributed ordinary income | $ | 20,428,559 | ||
Accumulated capital and other losses | (54,688,818 | )(a) | ||
Unrealized appreciation/(depreciation) | (4,651,856 | )(b) | ||
|
| |||
Total accumulated earnings/(deficit) | $ | (38,912,115 | )(c) | |
|
|
| (a) | As of October 31, 2017, the Fund had a net capital loss carryforward of $39,792,946. As of October 31, 2017, the cumulative deferred loss on straddles was $14,895,872. |
| (b) | The differences between book-basis and tax-basis unrealized appreciation/(depreciation) are attributable primarily to the tax deferral of losses on wash sales, the tax treatment of swaps, the tax treatment of passive foreign investment companies (PFICs), the tax treatment of partnership investments, and the recognition for tax purposes of unrealized gains/losses on certain derivative instruments. |
| (c) | The differences between book-basis and tax-basis components of accumulated earnings/(deficit) are attributable primarily to dividends payable and the tax treatment of defaulted securities. |
| 102 | AB INCOME FUND | abfunds.com |
NOTES TO FINANCIAL STATEMENTS (continued)
For tax purposes, net realized capital losses may be carried over to offset future capital gains, if any. Funds are permitted to carry forward capital losses for an indefinite period, and such losses will retain their character as either short-term or long-term capital losses. As of October 31, 2017, the Fund had a net short-term capital loss carryforward of $1,316,731 and a net long-term capital loss carryforward of $38,476,215, which may be carried forward for an indefinite period.
During the current fiscal year, permanent differences primarily due to the tax treatment of swaps, the tax treatment of partnership investments, foreign currency reclassifications, paydown gain/loss reclassifications, contributions from Affiliates, and the tax treatment of options resulted in a net increase in undistributed net investment income, a net increase in accumulated net realized loss on investment and foreign currency transactions, and a net decrease in additional paid-in capital. These reclassifications had no effect on net assets.
NOTE J
Reorganization
At a meeting held on August 6, 2015 the Board, on behalf of the Fund, and the Board of Directors of the Predecessor Fund, approved the Reorganization Agreement providing for the tax-free acquisition by the Fund of the assets and liabilities of the Predecessor Fund, and the Predecessor Fund shareholders approved the Reorganization Agreement at a Special Meeting of Shareholders held on March 1, 2016. The acquisition was completed at the close of business April 21, 2016. Pursuant to the Reorganization Agreement, the assets and liabilities of the Predecessor Fund’s shares were transferred in exchange for the Fund’s Advisor Class shares, in a tax-free exchange as follows:
| Shares outstanding before the Reorganization | Shares outstanding immediately after the Reorganization | Aggregate net assets before the Reorganization | Aggregate net assets immediately after the Reorganization | |||||||||||||
Predecessor Fund* | 215,833,695 | – 0 | – | $ | 1,725,148,833 | + | $ | – 0 | – | |||||||
The Fund | – 0 | – | 215,833,695 | $ | – 0 | – | $ | 1,725,148,833 | ||||||||
| * | Represents the accounting survivor. |
| + | Includes distributions in excess of net investment income of ($20,163,122) and unrealized appreciation on investments of $61,667,545, with a fair value of $2,379,923,538 and identified cost of $2,318,255,993. |
For financial reporting purposes, assets received and shares issued by the Fund were recorded at fair value; however, the cost basis of the investments received from the Predecessor Fund was carried forward to align ongoing reporting of the Fund’s realized and unrealized gains and losses with amounts distributable to shareholders for tax purposes.
| abfunds.com | AB INCOME FUND | 103 |
NOTES TO FINANCIAL STATEMENTS (continued)
NOTE K
Recent Accounting Pronouncements
In March 2017, the Financial Accounting Standards Board issued an Accounting Standards Update, ASU 2017-08, Receivables—Nonrefundable Fees and Other Costs (Subtopic 310-20), Premium Amortization on Purchased Callable Debt Securities (the “ASU”) which amends the amortization period for certain purchased callable debt securities held at a premium, shortening such period to the earliest call date. The ASU does not require any accounting change for debt securities held at a discount; the discount continues to be amortized to maturity. The ASU is effective for fiscal years, and interim periods within those fiscal years, beginning after December 15, 2018. At this time, management is evaluating the implications of these changes on the financial statements.
NOTE L
Subsequent Events
Management has evaluated subsequent events for possible recognition or disclosure in the financial statements through the date the financial statements are issued. Management has determined that there are no material events that would require disclosure in the Fund’s financial statements through this date.
| 104 | AB INCOME FUND | abfunds.com |
FINANCIAL HIGHLIGHTS
Selected Data For A Share Of Capital Stock Outstanding Throughout Each Period
| Class A | ||||||||
| Year Ended October 31, 2017 | April 21, 2016(a) to October 31, 2016 | |||||||
|
| |||||||
Net asset value, beginning of period | $ 8.08 | $ 7.99 | ||||||
|
| |||||||
Income From Investment Operations | ||||||||
Net investment income(b)(c) | .36 | .17 | † | |||||
Net realized and unrealized gain on investment and foreign currency transactions | .05 | .08 | ||||||
Contributions from Affiliates | .00 | (d) | – 0 | – | ||||
|
| |||||||
Net increase in net asset value from operations | .41 | .25 | ||||||
|
| |||||||
Less: Dividends | ||||||||
Dividends from net investment income | (.40 | ) | (.16 | ) | ||||
|
| |||||||
Net asset value, end of period | $ 8.09 | $ 8.08 | ||||||
|
| |||||||
Total Return | ||||||||
Total investment return based on net asset value(e) | 5.17 | % | 3.14 | %† | ||||
Ratios/Supplemental Data | ||||||||
Net assets, end of period (000’s omitted) | $165,294 | $2,104 | ||||||
Ratio to average net assets of: | ||||||||
Expenses, net of waivers/reimbursements(f) | 1.03 | % | 1.16 | %^ | ||||
Expenses, before waivers/reimbursements(f) | 1.11 | % | 1.37 | %^ | ||||
Net investment income(c) | 4.42 | % | 4.06 | %^† | ||||
Portfolio turnover rate | 42 | % | 14 | % | ||||
See footnote summary on page 108.
| abfunds.com | AB INCOME FUND | 105 |
FINANCIAL HIGHLIGHTS (continued)
Selected Data For A Share Of Capital Stock Outstanding Throughout Each Period
| Class C | ||||||||
| Year Ended October 31, 2017 | April 21, 2016(a) to October 31, 2016 | |||||||
|
| |||||||
Net asset value, beginning of period | $ 8.09 | $ 7.99 | ||||||
|
| |||||||
Income From Investment Operations | ||||||||
Net investment income(b)(c) | .30 | .14 | † | |||||
Net realized and unrealized gain on investment and foreign currency transactions | .05 | .09 | ||||||
Contributions from Affiliates | .00 | (d) | – 0 | – | ||||
|
| |||||||
Net increase in net asset value from operations | .35 | .23 | ||||||
|
| |||||||
Less: Dividends | ||||||||
Dividends from net investment income | (.34 | ) | (.13 | ) | ||||
|
| |||||||
Net asset value, end of period | $ 8.10 | $ 8.09 | ||||||
|
| |||||||
Total Return | ||||||||
Total investment return based on net asset value(e) | 4.37 | % | 2.85 | %† | ||||
Ratios/Supplemental Data | ||||||||
Net assets, end of period (000’s omitted) | $62,121 | $1,133 | ||||||
Ratio to average net assets of: | ||||||||
Expenses, net of waivers/reimbursements(f) | 1.78 | % | 1.90 | %^ | ||||
Expenses, before waivers/reimbursements(f) | 1.87 | % | 2.15 | %^ | ||||
Net investment income(c) | 3.68 | % | 3.34 | %^† | ||||
Portfolio turnover rate | 42 | % | 14 | % | ||||
See footnote summary on page 108.
| 106 | AB INCOME FUND | abfunds.com |
FINANCIAL HIGHLIGHTS (continued)
Selected Data For A Share Of Capital Stock Outstanding Throughout Each Period
| Advisor Class | ||||||||||||||||||||||||
Year Ended 2017 | January 1, 2016(g) | Year Ended October 31, | ||||||||||||||||||||||
| 2015 | 2014 | 2013 | 2012 | |||||||||||||||||||||
|
| |||||||||||||||||||||||
Net asset value, beginning of period | $ 8.09 | $ 7.86 | $ 8.34 | $ 8.13 | $ 8.89 | $ 8.93 | ||||||||||||||||||
|
| |||||||||||||||||||||||
Income From Investment Operations | ||||||||||||||||||||||||
Net investment income(b) | .41 | (c)† | .29 | (c)† | .38 | .42 | .40 | .40 | ||||||||||||||||
Net realized and unrealized gain (loss) on investment and foreign currency transactions | .02 | .22 | (.41 | ) | .19 | (.71 | ) | .57 | ||||||||||||||||
Contributions from Affiliates | .00 | (d) | – 0 | – | – 0 | – | – 0 | – | – 0 | – | .00 | (d) | ||||||||||||
|
| |||||||||||||||||||||||
Net increase (decrease) in net asset value from operations | .43 | .51 | (.03 | ) | .61 | (.31 | ) | .97 | ||||||||||||||||
|
| |||||||||||||||||||||||
Less: Dividends and Distributions | ||||||||||||||||||||||||
Dividends from net investment income | (.42 | ) | (.28 | ) | (.46 | ) | (.45 | ) | (.41 | ) | (.48 | ) | ||||||||||||
Distributions from net realized gain on investment transactions | – 0 | – | – 0 | – | (.05 | ) | – 0 | – | (.04 | ) | (.53 | ) | ||||||||||||
|
| |||||||||||||||||||||||
Total dividends and distributions | (.42 | ) | (.28 | ) | (.51 | ) | (.45 | ) | (.45 | ) | (1.01 | ) | ||||||||||||
|
| |||||||||||||||||||||||
Redemption fee | – 0 | – | .00 | (d) | – 0 | – | – 0 | – | – 0 | – | – 0 | – | ||||||||||||
Anti-Dilutive Effect of Share Repurchase Program | – 0 | – | – 0 | – | .06 | .05 | – 0 | – | – 0 | – | ||||||||||||||
|
| |||||||||||||||||||||||
Net asset value, end of period | $ 8.10 | $ 8.09 | $ 7.86 | $ 8.34 | $ 8.13 | $ 8.89 | ||||||||||||||||||
|
| |||||||||||||||||||||||
Market value, end of period | N/A | N/A | $ 7.67 | $ 7.47 | $ 7.13 | $ 8.10 | ||||||||||||||||||
|
| |||||||||||||||||||||||
Discount, end of period | N/A | % | N/A | (2.42 | )% | (10.43 | )% | (12.30 | )% | (8.89 | )% | |||||||||||||
Total Return | ||||||||||||||||||||||||
Total investment return based on: | ||||||||||||||||||||||||
Market value | N/A | N/A | 9.71 | %(h) | 11.28 | %(h) | (6.50 | )%(h) | 13.80 | %(h) | ||||||||||||||
Net asset value | 5.44 | %(e)† | 6.66 | %(e)† | .70 | %(h) | 8.96 | %(h) | (2.86 | )%(h) | 12.15 | %(h) | ||||||||||||
Ratios/Supplemental Data | ||||||||||||||||||||||||
Net assets, end of period (000,000’s omitted) | $1,806 | $916 | $1,696 | $1,902 | $1,976 | $2,159 | ||||||||||||||||||
Ratio to average net assets of: | ||||||||||||||||||||||||
Expenses, net of waivers/reimbursements(f) | .81 | % | .88 | %^ | .75 | % | .67 | % | .63 | % | .64 | % | ||||||||||||
Expenses, before waivers/reimbursements(f) | .93 | % | .96 | %^ | .75 | % | .67 | % | .63 | % | .64 | % | ||||||||||||
Net investment income | 5.11 | %(c)† | 4.29 | %(c)^† | 4.57 | % | 5.02 | % | 4.74 | % | 4.34 | % | ||||||||||||
Portfolio turnover rate | 42 | % | 14 | % | 34 | % | 32 | % | 107 | % | 58 | % | ||||||||||||
See footnote summary on page 108.
| abfunds.com | AB INCOME FUND | 107 |
FINANCIAL HIGHLIGHTS (continued)
Selected Data For A Share Of Capital Stock Outstanding Throughout Each Period
| (a) | Inception date. |
| (b) | Based on average shares outstanding. |
| (c) | Net of fees and expenses waived by the Adviser. |
| (d) | Amount is less than $.005. |
| (e) | Total investment return is calculated assuming an initial investment made at the net asset value at the beginning of the period, reinvestment of all dividends and distributions at net asset value during the period, and redemption on the last day of the period. Initial sales charges or contingent deferred sales charges are not reflected in the calculation of total investment return. Total return does not reflect the deduction of taxes that a shareholder would pay on fund distributions or the redemption of fund shares. Total investment return calculated for a period of less than one year is not annualized. |
| (f) | The expense ratios, excluding interest expense are: |
| Year Ended October 31, 2017 | January 1, 2016 to October 31, 2016(g) | Year Ended October 31, | ||||||||||||||||||||||
| 2015 | 2014 | 2013 | 2012 | |||||||||||||||||||||
|
| |||||||||||||||||||||||
Class A | ||||||||||||||||||||||||
Net of waivers/reimbursements | .77 | % | .88 | %^ | N/A | N/A | N/A | N/A | ||||||||||||||||
Before waivers/reimbursements | .85 | % | 1.09 | %^ | N/A | N/A | N/A | N/A | ||||||||||||||||
Class C | ||||||||||||||||||||||||
Net of waivers | 1.52 | % | 1.63 | %^ | N/A | N/A | N/A | N/A | ||||||||||||||||
Before waivers | 1.61 | % | 1.87 | %^ | N/A | N/A | N/A | N/A | ||||||||||||||||
Advisor Class | ||||||||||||||||||||||||
Net of waivers | .54 | % | .61 | %^ | .61 | % | .61 | % | .57 | % | .55 | % | ||||||||||||
Before waivers | .65 | % | .69 | %^ | .61 | % | .61 | % | .57 | % | .55 | % | ||||||||||||
| (g) | The Predecessor Fund’s fiscal year end was December 31 and the Fund’s fiscal year end is October 31. |
| (h) | Total investment return is calculated assuming a purchase of common stock on the opening of the first day and a sale on the closing of the last day of each period reported. Dividends and distributions, if any, are assumed for purposes of this calculation, to be reinvested at prices obtained under the Fund’s dividend reinvestment plan. Generally, total investment return based on net asset value will be higher than total investment return based on market value in periods where there is an increase in the discount or a decrease in the premium of the market value to the net asset value from the beginning to the end of such periods. Conversely, total investment return based on net asset value will be lower than total investment return based on market value in periods where there is a decrease in the discount or an increase in the premium of the market value to the net asset value from the beginning to the end of such periods. Total investment return calculated for a period of less than one year is not annualized. |
| † | For the year ended October 31, 2016 the amount includes a refund for overbilling of prior years’ custody out of pocket fees as follows: |
Net Investment Income Per Share | Net Investment Income Ratio | Total Return | ||||
$ .003 | .04% | .03% |
| ^ | Annualized. |
See notes to financial statements.
| 108 | AB INCOME FUND | abfunds.com |
REPORT OF INDEPENDENT REGISTERED
PUBLIC ACCOUNTING FIRM
To the Board of Directors and Shareholders of AB Income Fund, Inc.:
We have audited the accompanying statement of assets and liabilities, including the portfolio of investments, of AB Income Fund, Inc. (the “Fund”), one of the portfolios constituting the AB Bond Fund, Inc., as of October 31, 2017, and the related statements of operations and cash flows for the year then ended, the statements of changes in net assets for the year then ended and the period January 1, 2016 to October 31, 2016 and the year ended December 31, 2015, and the financial highlights for each of the periods indicated therein. These financial statements and financial highlights are the responsibility of the Fund’s management. Our responsibility is to express an opinion on these financial statements and financial highlights based on our audits.
We conducted our audits in accordance with the standards of the Public Company Accounting Oversight Board (United States). Those standards require that we plan and perform the audit to obtain reasonable assurance about whether the financial statements and financial highlights are free of material misstatement. We were not engaged to perform an audit of the Fund’s internal control over financial reporting. Our audits included consideration of internal control over financial reporting as a basis for designing audit procedures that are appropriate in the circumstances, but not for the purpose of expressing an opinion on the effectiveness of the Fund’s internal control over financial reporting. Accordingly, we express no such opinion. An audit also includes examining, on a test basis, evidence supporting the amounts and disclosures in the financial statements and financial highlights, assessing the accounting principles used and significant estimates made by management, and evaluating the overall financial statement presentation. Our procedures included confirmation of securities owned as of October 31, 2017, by correspondence with the custodian and others, or by other appropriate auditing procedures where replies from others were not received. We believe that our audits provide a reasonable basis for our opinion.
In our opinion, the financial statements and financial highlights referred to above present fairly, in all material respects, the financial position of AB Income Fund, Inc., one of the portfolios constituting the AB Bond Fund, Inc., at October 31, 2017, and the results of its operations and its cash flows for the year then ended, the changes in its net assets for the year then ended and the period January 1, 2016 to October 31, 2016 and the year ended December 31, 2015, and the financial highlights for each of the periods indicated therein, in conformity with U.S. generally accepted accounting principles.

New York, New York
December 29, 2017
| abfunds.com | AB INCOME FUND | 109 |
2017 FEDERAL TAX INFORMATION
(unaudited)
For Federal income tax purposes, the following information is furnished with respect to the distributions paid by the Fund during the taxable year ended October 31, 2017. For foreign shareholders, 46.93% of ordinary income dividends paid may be considered to be qualifying to be taxed as interest-related dividends.
Shareholders should not use the above information to prepare their income tax returns. The information necessary to complete your income tax returns will be included with your Form 1099-DIV which will be sent to you separately in January 2018.
| 110 | AB INCOME FUND | abfunds.com |
BOARD OF DIRECTORS
Marshall C. Turner, Jr.(1), Chairman John H. Dobkin(1)(2) Michael J. Downey(1) William H. Foulk, Jr.(1) D. James Guzy(1) (2) | Nancy P. Jacklin(1) Robert M. Keith, President and Chief Executive Officer Carol C. McMullen(1) Garry L. Moody(1) Earl D. Weiner(1) |
OFFICERS
Philip L. Kirstein,(3) Senior Vice President and Independent Compliance Officer Paul J. DeNoon(4), Vice President Gershon M. Distenfeld(4), Douglas J. Peebles(4), Vice President Ashish Shah(4), Vice President | Matthew Sheridan(4), Vice President Emilie D. Wrapp, Secretary Joseph J. Mantineo, Treasurer and Chief Financial Officer Phyllis J. Clarke, Controller |
Custodian and Accounting Agent State Street Bank and Trust Company State Street Corporation CCB/5 1 Iron Street Boston, MA 02210
Principal Underwriter AllianceBernstein Investments, Inc. 1345 Avenue of the Americas New York, NY 10105
Transfer Agent AllianceBernstein Investor Services, Inc. P.O. Box 786003 San Antonio, TX 78278-6003 Toll-Free (800) 221-5672 | Independent Registered Public Ernst & Young LLP 5 Times Square New York, NY 10036
Legal Counsel Seward & Kissel LLP One Battery Park Plaza New York, NY 10004 |
| 1 | Member of the Audit Committee, the Governance and Nominating Committee and the Independent Directors Committee. |
| 2 | Messrs. Dobkin and Guzy are expected to retire on or about December 31, 2017. |
| 3 | Mr. Kirstein is expected to retire on or about December 31, 2017. |
| 4 | The day-to-day management of, and investment decisions for, the Fund’s portfolio are made by a team of investment professionals consisting of Messrs. DeNoon, Distenfeld, Peebles, Shah and Sheridan. |
| abfunds.com | AB INCOME FUND | 111 |
MANAGEMENT OF THE FUND
Board of Directors Information
The business and affairs of the Fund are managed under the direction of the Board of Directors. Certain information concerning the Fund’s Directors is set forth below.
| NAME, ADDRESS*, AGE, (YEAR FIRST ELECTED**) | PRINCIPAL OCCUPATION(S) DURING PAST FIVE YEARS AND OTHER INFORMATION*** | PORTFOLIOS IN FUND COMPLEX OVERSEEN BY DIRECTOR | OTHER PUBLIC COMPANY DIRECTORSHIPS CURRENTLY HELD BY DIRECTOR | |||||
| INTERESTED DIRECTOR | ||||||||
Robert M. Keith# 1345 Avenue of the Americas New York, NY 10105 57 (2010) | Senior Vice President of AllianceBernstein L.P. (the “Adviser”) and the head of AllianceBernstein Investments, Inc. (“ABI”) since July 2008; Director of ABI and President of the AB Mutual Funds. Previously, he served as Executive Managing Director of ABI from December 2006 to June 2008. Prior to joining ABI in 2006, Executive Managing Director of Bernstein Global Wealth Management, and prior thereto, Senior Managing Director and Global Head of Client Service and Sales of the Adviser’s institutional investment management business since 2004. Prior thereto, he was Managing Director and Head of North American Client Service and Sales in the Adviser’s institutional investment management business, with which he had been associated since prior to 2004. | 96 | None | |||||
| 112 | AB INCOME FUND | abfunds.com |
MANAGEMENT OF THE FUND (continued)
| NAME, ADDRESS*, AGE, (YEAR FIRST ELECTED**) | PRINCIPAL OCCUPATION(S) DURING PAST FIVE YEARS AND OTHER INFORMATION*** | PORTFOLIOS IN FUND COMPLEX OVERSEEN BY DIRECTOR | OTHER PUBLIC COMPANY DIRECTORSHIPS CURRENTLY HELD BY DIRECTOR | |||||
| DISINTERESTED DIRECTORS | ||||||||
Marshall C. Turner, Jr.## Chairman of the Board 76 (2005) | Private Investor since prior to 2012. Former Chairman and CEO of Dupont Photomasks, Inc. (components of semi-conductor manufacturing). He has extensive operating leadership and venture capital investing experience, including five interim or full-time CEO roles, and prior service as general partner of institutional venture capital partnerships. He also has extensive non-profit board leadership experience, and currently serves on the boards of two education and science-related non-profit organizations. He has served as a director of one AB Fund since 1992, and director or trustee of multiple AB Funds since 2005. He has been Chairman of the AB Funds since January 2014, and the Chairman of the Independent Directors Committees of such AB Funds since February 2014. | 96 | Xilinx, Inc. (programmable logic semi-conductors) since 2007 | |||||
John H. Dobkin##, + 75 | Independent Consultant since prior to 2012. Formerly, President of Save Venice, Inc. (preservation organization) from 2001–2002; Senior Advisor from June 1999-June 2000 and President of Historic Hudson Valley (historic preservation) from December 1989-May 1999. Previously, Director of the National Academy of Design. He has served as a director or trustee of various AB Funds since 1992, and as Chairman of the Audit Committees of a number of such AB Funds from 2001-2008. | 95 | None | |||||
| abfunds.com | AB INCOME FUND | 113 |
MANAGEMENT OF THE FUND (continued)
| NAME, ADDRESS*, AGE, (YEAR FIRST ELECTED**) | PRINCIPAL OCCUPATION(S) DURING PAST FIVE YEARS AND OTHER INFORMATION*** | PORTFOLIOS IN FUND COMPLEX OVERSEEN BY DIRECTOR | OTHER PUBLIC COMPANY DIRECTORSHIPS CURRENTLY HELD BY DIRECTOR | |||||
DISINTERESTED DIRECTORS (continued) | ||||||||
Michael J. Downey## 73 | Private Investor since prior to 2012. Formerly, managing partner of Lexington Capital, LLC (investment advisory firm) from December 1997 until December 2003. He served as a Director of Prospect Acquisition Corp. (financial services) from 2007 until 2009. From 1987 until 1993, Chairman and CEO of Prudential Mutual Fund Management, director of the Prudential mutual funds, and member of the Executive Committee of Prudential Securities Inc. He has served as a director or trustee of the AB Funds since 2005 and is a director and Chairman of one other registered investment company. | 96 | The Asia Pacific Fund, Inc. (registered investment company) since prior to 2012 | |||||
William H. Foulk, Jr.## 85 (1990) | Investment Adviser and an Independent Consultant since prior to 2012. Previously, he was Senior Manager of Barrett Associates, Inc., a registered investment adviser. He was formerly Deputy Comptroller and Chief Investment Officer of the State of New York and, prior thereto, Chief Investment Officer of the New York Bank for Savings. He has served as a director or trustee of various AB Funds since 1983, and was Chairman of the Independent Directors Committees of the AB Funds from 2003 until early February 2014. He served as Chairman of such AB Funds from 2003 through December 2013. He is also active in a number of mutual fund related organizations and committees. | 96 | None | |||||
| 114 | AB INCOME FUND | abfunds.com |
MANAGEMENT OF THE FUND (continued)
| NAME, ADDRESS*, AGE, (YEAR FIRST ELECTED**) | PRINCIPAL OCCUPATION(S) DURING PAST FIVE YEARS AND OTHER INFORMATION*** | PORTFOLIOS IN FUND COMPLEX OVERSEEN BY DIRECTOR | OTHER PUBLIC COMPANY DIRECTORSHIPS CURRENTLY HELD BY DIRECTOR | |||||
DISINTERESTED DIRECTORS (continued) | ||||||||
D. James Guzy##, + 81 (2005) | Chairman of the Board of SRC Computers, Inc. (semi-conductors), with which he has been associated since prior to 2012. He served as Chairman of the Board of PLX Technology (semi-conductors) since prior to 2012 until November 2013. He was a director of Intel Corporation (semi-conductors) from 1969 until 2008, and served as Chairman of the Finance Committee of such company for several years until May 2008. He has served as a director or trustee of one or more of the AB Funds since 1982. | 93 | None | |||||
Nancy P. Jacklin## 69 (2006) | Private Investor since prior to 2012. Professorial Lecturer at the Johns Hopkins School of Advanced International Studies (2008-2015). U.S. Executive Director of the International Monetary Fund (which is responsible for ensuring the stability of the international monetary system), (December 2002-May 2006); Partner, Clifford Chance (1992-2002); Sector Counsel, International Banking and Finance, and Associate General Counsel, Citicorp (1985-1992); Assistant General Counsel (International), Federal Reserve Board of Governors (1982-1985); and Attorney Advisor, U.S. Department of the Treasury (1973-1982). Member of the Bar of the District of Columbia and of New York; and member of the Council on Foreign Relations. She has served as a director or trustee of the AB Funds since 2006 and has been Chairman of the Governance and Nominating Committees of the AB Funds since August 2014. | 96 | None | |||||
| abfunds.com | AB INCOME FUND | 115 |
MANAGEMENT OF THE FUND (continued)
| NAME, ADDRESS*, AGE, (YEAR FIRST ELECTED**) | PRINCIPAL OCCUPATION(S) DURING PAST FIVE YEARS AND OTHER INFORMATION*** | PORTFOLIOS IN FUND COMPLEX OVERSEEN BY DIRECTOR | OTHER PUBLIC COMPANY DIRECTORSHIPS CURRENTLY HELD BY DIRECTOR | |||||
DISINTERESTED DIRECTORS (continued) | ||||||||
Carol C. McMullen## 62 (2016) | Managing Director of Slalom Consulting (consulting) since 2014 and private investor; and member at the Partners Healthcare Investment Committee. Formerly, Director of Norfolk & Dedham Group (mutual property and casualty insurance) from 2011 until November 2016; Director of Partners Community Physicians Organization (healthcare) from 2014 until December 2016; and Managing Director of The Crossland Group (consulting) from 2012 to 2013. She has held a number of senior positions in the asset and wealth management industries, including at Eastern Bank (where her roles included President of Eastern Wealth Management), Thomson Financial (Global Head of Sales for Investment Management), and Putnam Investments (where her roles included Head of Global Investment Research). She has served on a number of private company and nonprofit boards, and as a director or trustee of the AB Funds since June 2016. | 96 | None | |||||
| 116 | AB INCOME FUND | abfunds.com |
MANAGEMENT OF THE FUND (continued)
| NAME, ADDRESS*, AGE, (YEAR FIRST ELECTED**) | PRINCIPAL INFORMATION*** | PORTFOLIOS IN FUND COMPLEX OVERSEEN BY DIRECTOR | OTHER PUBLIC COMPANY DIRECTORSHIPS CURRENTLY HELD BY DIRECTOR | |||||
DISINTERESTED DIRECTORS (continued) | ||||||||
Garry L. Moody## 65 (2008) | Independent Consultant. Formerly, Partner, Deloitte & Touche LLP (1995-2008) where he held a number of senior positions, including Vice Chairman, and U.S. and Global Investment Management Practice Managing Partner; President, Fidelity Accounting and Custody Services Company (1993-1995), where he was responsible for accounting, pricing, custody and reporting for the Fidelity mutual funds; and Partner, Ernst & Young LLP (1975-1993), where he served as the National Director of Mutual Fund Tax Services and Managing Partner of its Chicago Office Tax department. He is a member of the Trustee Advisory Board of BoardIQ, a biweekly publication focused on issues and news affecting directors of mutual funds. He has served as a director or trustee, and as Chairman of the Audit Committees, of the AB Funds since 2008. | 96 | None | |||||
Earl D. Weiner## 78 (2007) | Of Counsel, and Partner prior to January 2007, of the law firm Sullivan & Cromwell LLP and is a former member of the ABA Federal Regulation of Securities Committee Task Force to draft editions of the Fund Director’s Guidebook. He also serves as a director or trustee of various non-profit organizations and has served as Chairman or Vice Chairman of a number of them. He has served as a director or trustee of the AB Funds since 2007 and served as Chairman of the Governance and Nominating Committees of the AB Funds from 2007 until August 2014. | 96 | None | |||||
| abfunds.com | AB INCOME FUND | 117 |
MANAGEMENT OF THE FUND (continued)
| * | The address for each of the Fund’s disinterested Directors is c/o AllianceBernstein L.P., Attention: Office of the Senior Officer, 1345 Avenue of the Americas, New York, NY 10105 |
| ** | There is no stated term of office for the Fund’s Directors. |
| *** | The information above includes each Director’s principal occupation during the last five years and other information relating to the experience, attributes, and skills relevant to each Director’s qualifications to serve as a Director, which led to the conclusion that each Director should serve as a Director for the Fund. |
| # | Mr. Keith is an “interested person” of the Fund, as defined in the 1940 Act, due to this position as a Senior Vice President of the Adviser. |
| ## | Member of the Audit Committee, the Governance and Nominating Committee and the Independent Directors Committee. |
| + | Messrs. Dobkin and Guzy are expected to retire on or about December 31, 2017. |
| 118 | AB INCOME FUND | abfunds.com |
MANAGEMENT OF THE FUND (continued)
Officer Information
Certain information concerning the Fund’s Officers is listed below.
| NAME, ADDRESS* AND AGE | POSITION(S) HELD WITH FUND | PRINCIPAL OCCUPATION DURING PAST FIVE YEARS | ||
Robert M. Keith 57 | President and Chief Executive Officer | See biography above. | ||
Philip L. Kirstein# | Senior Vice President and Independent Compliance Officer | Senior Vice President and Independent Compliance Officer of the AB Funds, with which he has been associated since October 2004. Prior thereto, he was Of Counsel to Kirkpatrick & Lockhart, LLP from October 2003 to October 2004, and General Counsel of Merrill Lynch Investment Managers, L .P. since prior to March 2003. | ||
| Paul J. DeNoon 55 | Vice President | Senior Vice President of the Adviser**, with which he has been associated since prior to 2012. | ||
| Gershon M. Distenfeld 42 | Vice President | Senior Vice President of the Adviser**, with which he has been associated since prior to 2012. | ||
| Douglas J. Peebles 51 | Vice President | Senior Vice President of the Adviser**, with which he has been associated since prior to 2012. | ||
Ashish C. Shah 74 | Vice President | Senior Vice President of the Adviser**, with which he has been associated since prior to 2012. | ||
| Matthew S. Sheridan 42 | Vice President | Senior Vice President of the Adviser**, with which he has been associated since prior to 2012. | ||
| Emilie D. Wrapp 62 | Secretary | Senior Vice President, Assistant General Counsel and Assistant Secretary of ABI**, with which she has been associated since prior to 2012. | ||
| Joseph J. Mantineo 58 | Treasurer and Chief Financial Officer | Senior Vice President of AllianceBernstein Investor Services, Inc. (“ABIS”**), with which he has been associated since prior to 2012. | ||
| Phyllis J. Clarke 56 | Controller | Vice President of ABIS**, with which she has been associated since prior to 2012. | ||
| Vincent S. Noto 53 | Chief Compliance Officer | Senior Vice President since 2015 and Mutual Fund Chief Compliance Officer of the Adviser** since 2014. Prior thereto, he was Vice President and Director of Mutual Fund Compliance of the Adviser**, since prior to 2012. |
| * | The address for each of the Fund’s Officers is 1345 Avenue of the Americas, New York, NY 10105. |
| ** | The Adviser, ABI and ABIS are affiliates of the Fund. |
| # | Mr. Kirstein is expected to retire on or about December 31, 2017. |
The Fund’s Statement of Additional Information (“SAI”) has additional information about the Fund’s Directors and Officers and is available without charge upon request. Contact your financial representative or AB at 1-(800)227-4618, or visit www.abfunds.com for a free prospectus or SAI.
| abfunds.com | AB INCOME FUND | 119 |
Information Regarding the Review and Approval of the Fund’s Advisory Agreement
The disinterested directors (the “directors”) of AB Bond Fund, Inc. (the “Company”) unanimously approved the continuance of the Company’s Advisory Agreement with the Adviser, as proposed to be amended (the “Advisory Agreement”) to effect a fee reduction, in respect of AB Income Fund (the “Fund”) at a meeting held on November 1-3, 2016 (the “Meeting”).
Prior to approval of the continuance of the Advisory Agreement, the directors had requested from the Adviser, and received and evaluated, extensive materials. They reviewed the proposed continuance of the Advisory Agreement with the Adviser and with experienced counsel who are independent of the Adviser, who advised on the relevant legal standards. The directors also reviewed an independent evaluation prepared by the Company’s Senior Officer (who is also the Company’s Independent Compliance Officer) of the reasonableness of the proposed advisory fee, in which the Senior Officer concluded that the proposed contractual fee for the Fund was reasonable. The directors also discussed the proposed continuance in private sessions with counsel and the Company’s Senior Officer.
The directors considered their knowledge of the nature and quality of the services provided by the Adviser to the Fund gained from their experience as directors or trustees of most of the registered investment companies advised by the Adviser, their overall confidence in the Adviser’s integrity and competence they have gained from that experience, the Adviser’s initiative in identifying and raising potential issues with the directors and its responsiveness, frankness and attention to concerns raised by the directors in the past, including the Adviser’s willingness to consider and implement organizational and operational changes designed to improve investment results and the services provided to the AB Funds. The directors noted that they have four regular meetings each year, at each of which they receive presentations from the Adviser on the investment results of the Fund and review extensive materials and information presented by the Adviser.
The directors also considered all other factors they believed relevant, including the specific matters discussed below. In their deliberations, the directors did not identify any particular information that was all-important or controlling, and different directors may have attributed different weights to the various factors. The directors determined that the selection of the Adviser to manage the Fund and the overall arrangements between the Fund and the Adviser, as provided in the Advisory Agreement, including the proposed advisory fee, were fair and reasonable in light of the services performed, expenses incurred and such other matters as the directors
| 120 | AB INCOME FUND | abfunds.com |
considered relevant in the exercise of their business judgment. The material factors and conclusions that formed the basis for the directors’ determinations included the following:
Nature, Extent and Quality of Services Provided
The directors considered the scope and quality of services provided by the Adviser under the Advisory Agreement, including the quality of the investment research capabilities of the Adviser and the other resources it has dedicated to performing services for the Fund. They also noted the professional experience and qualifications of the Fund’s portfolio management team and other senior personnel of the Adviser. The directors also considered that the Advisory Agreement provides that the Fund will reimburse the Adviser for the cost to it of providing certain clerical, accounting, administrative and other services to the Fund by employees of the Adviser or its affiliates. Requests for these reimbursements are made on a quarterly basis and subject to approval by the directors. Reimbursements, to the extent requested and paid, result in a higher rate of total compensation from the Fund to the Adviser than the fee rate stated in the Advisory Agreement. The directors noted that the methodology used to determine the reimbursement amounts had been reviewed by an independent consultant retained by the Company’s Senior Officer. The quality of administrative and other services, including the Adviser’s role in coordinating the activities of the Fund’s other service providers, also was considered. The directors concluded that, overall, they were satisfied with the nature, extent and quality of services provided to the Fund under the Advisory Agreement.
Costs of Services Provided and Profitability
Because the Fund commenced operations on April 21, 2016, the directors were unable to consider historical information about the profitability of the Fund for calendar years 2014 and 2015. However, the Adviser agreed to provide the directors with profitability information in connection with future proposed continuances of the Advisory Agreement.
Fall-Out Benefits
The directors considered the other benefits to the Adviser and its affiliates from their relationships with the Fund, including, but not limited to, benefits relating to 12b-1 fees and sales charges received by the Fund’s principal underwriter (which is a wholly owned subsidiary of the Adviser) in respect of certain classes of the Fund’s shares; and transfer agency fees paid by the Fund to a wholly owned subsidiary of the Adviser. The directors recognized that the Adviser’s future profitability would be somewhat lower without these benefits. The directors understood that the Adviser also might derive reputational and other benefits from its association with the Fund.
Investment Results
At the Meeting, the directors reviewed information prepared by the Adviser showing performance of the Class A Shares against a broad-based
| abfunds.com | AB INCOME FUND | 121 |
securities market index for the period from inception (April 21, 2016) through July 31, 2016. Based on their review, the directors concluded that the Fund’s investment performance was acceptable.
Advisory Fees and Other Expenses
The directors considered the proposed advisory fee rate paid by the Fund to the Adviser and information prepared by Broadridge Financial Solutions, Inc. (“Broadridge”), an analytical service that is not affiliated with the Adviser, concerning advisory fee rates paid by other funds in the same Broadridge category as the Fund at a common asset level. The directors recognized that it is difficult to make comparisons of advisory fees because there are variations in the services that are included in the fees paid by other funds. The directors compared the Fund’s pro forma contractual effective advisory fee rate (reflecting a reduction in the advisory fee rate effective January 29, 2017) with a peer group median.
The Adviser informed the directors that there were no institutional products managed by it that have a substantially similar investment style.
The directors noted that the Fund may invest in shares of exchange-traded funds (“ETFs”), subject to restrictions and limitations of the Investment Company Act of 1940 as these may be varied as a result of exemptive orders issued by the SEC. The directors also noted that ETFs pay advisory fees pursuant to their advisory contracts. The directors concluded, based on the Adviser’s explanation of how it may use ETFs when they are the most cost-effective way to obtain desired exposures or to “equitize” cash inflows pending purchases of underlying securities, that the proposed advisory fee would be for services in addition to, rather than duplicative of, the services provided under the advisory contracts of the ETFs in which the Fund may invest.
The directors also considered the total expense ratio of the Class A shares of the Fund in comparison to a peer group and a peer universe selected by Broadridge. Information regarding the Class A expense ratio of the Fund included the pro forma expense ratio to reflect a reduction in the expense cap by the Adviser effective January 29, 2017. The directors noted the effects of any fee waivers and/or expense reimbursements as a result of an undertaking by the Adviser. The directors noted that it was likely that the expense ratios of some of the other funds in the Fund’s Broadridge category were lowered by waivers or reimbursements by those funds’ investment advisers, which in some cases might be voluntary or temporary. The directors view expense ratio information as relevant to their evaluation of the Adviser’s services because the Adviser is responsible for coordinating services provided to the Fund by others. Based on their review, the directors concluded that the Fund’s pro forma expense ratio was acceptable.
| 122 | AB INCOME FUND | abfunds.com |
Economies of Scale
The directors noted that the proposed advisory fee schedule for the Fund contains breakpoints that reduce the fee rates on assets above specified levels. The directors took into consideration prior presentations by an independent consultant on economies of scale in the mutual fund industry and for the AB Funds, and by the Adviser concerning certain of its views on economies of scale. The directors also had requested and received from the Adviser certain updates on economies of scale in advance of the Meeting. The directors believe that economies of scale may be realized (if at all) by the Adviser across a variety of products and services, and not only in respect of a single fund. The directors noted that there is no established methodology for setting breakpoints that give effect to the fund-specific services provided by a fund’s adviser and to the economies of scale that an adviser may realize in its overall mutual fund business or those components of it which directly or indirectly affect a fund’s operations. The directors observed that in the mutual fund industry as a whole, as well as among funds similar to the Fund, there is no uniformity or pattern in the fees and asset levels at which breakpoints (if any) apply. The directors also noted that the advisory agreements for many funds do not have breakpoints at all. [Having taken these factors into account, the directors concluded that the Fund’s shareholders would benefit from a sharing of economies of scale in the event the Fund’s net assets exceed a breakpoint in the future.
| abfunds.com | AB INCOME FUND | 123 |
This page is not part of the Shareholder Report or the Financial Statements.
AB FAMILY OF FUNDS
US EQUITY
US CORE
Core Opportunities Fund
FlexFee™ US Thematic Portfolio
Select US Equity Portfolio
US GROWTH
Concentrated Growth Fund
Discovery Growth Fund
FlexFee™ Large Cap Growth Portfolio
Growth Fund
Large Cap Growth Fund
Small Cap Growth Portfolio
US VALUE
Discovery Value Fund
Equity Income Fund
Relative Value Fund1
Small Cap Value Portfolio
Value Fund
INTERNATIONAL/ GLOBAL EQUITY
INTERNATIONAL/ GLOBAL CORE
Global Core Equity Portfolio
International Portfolio
International Strategic Core Portfolio
Sustainable Global Thematic Fund1
Tax-Managed International Portfolio
Tax-Managed Wealth Appreciation Strategy
Wealth Appreciation Strategy
INTERNATIONAL/ GLOBAL GROWTH
Concentrated International Growth Portfolio
International Growth Fund
INTERNATIONAL/ GLOBAL EQUITY (continued)
INTERNATIONAL/ GLOBAL VALUE
Asia ex-Japan Equity Portfolio
International Value Fund
FIXED INCOME
MUNICIPAL
High Income Municipal Portfolio
Intermediate California Municipal Portfolio
Intermediate Diversified Municipal Portfolio
Intermediate New York Municipal Portfolio
Municipal Bond Inflation Strategy
Tax-Aware Fixed Income Portfolio
National Portfolio
Arizona Portfolio
California Portfolio
Massachusetts Portfolio
Minnesota Portfolio
New Jersey Portfolio
New York Portfolio
Ohio Portfolio
Pennsylvania Portfolio
Virginia Portfolio
TAXABLE
Bond Inflation Strategy
FlexFee™ International Bond Portfolio
Global Bond Fund
High Income Fund
High Yield Portfolio
Income Fund
Intermediate Bond Portfolio
Limited Duration High Income Portfolio
Short Duration Portfolio
ALTERNATIVES
All Market Real Return Portfolio
Credit Long/Short Portfolio
Global Real Estate Investment Fund
Select US Long/Short Portfolio
Unconstrained Bond Fund
MULTI-ASSET
All Market Income Portfolio
All Market Total Return Portfolio1
Conservative Wealth Strategy
Emerging Markets Multi-Asset Portfolio
Global Risk Allocation Fund
Tax-Managed All Market Income Portfolio1
TARGET-DATE
Multi-Manager Select Retirement Allocation Fund
Multi-Manager Select 2010 Fund
Multi-Manager Select 2015 Fund
Multi-Manager Select 2020 Fund
Multi-Manager Select 2025 Fund
Multi-Manager Select 2030 Fund
Multi-Manager Select 2035 Fund
Multi-Manager Select 2040 Fund
Multi-Manager Select 2045 Fund
Multi-Manager Select 2050 Fund
Multi-Manager Select 2055 Fund
CLOSED-END FUNDS
Alliance California Municipal Income Fund
AllianceBernstein Global High Income Fund
AllianceBernstein National Municipal Income Fund
We also offer Government Money Market Portfolio1, which serves as the money market fund exchange vehicle for the AB mutual funds. An investment in Government Money Market Portfolio is not a deposit in a bank and is not insured or guaranteed by the Federal Deposit Insurance Corporation or any other government agency. Although the Fund seeks to preserve the value of your investment at $1.00 per share, it is possible to lose money by investing in the Fund.
Investors should consider the investment objectives, risks, charges and expenses of the Fund carefully before investing. For copies of our prospectus or summary prospectus, which contain this and other information, visit us online at www.abfunds.com or contact your AB representative. Please read the prospectus and/or summary prospectus carefully before investing.
| 1 | Prior to January 9, 2017, Relative Value Fund was named Growth & Income Fund; prior to April 17, 2017, Tax-Managed All Market Income Portfolio was named Tax-Managed Balanced Wealth Strategy; prior to April 24, 2017, All Market Total Return Portfolio was named Balanced Wealth Strategy; prior to November 10, 2017, Government Money Market Portfolio was named Government Exchange Reserves. |
| 124 | AB INCOME FUND | abfunds.com |
AB INCOME FUND
1345 Avenue of the Americas
New York, NY 10105
800 221 5672
IF-0151-1017 
OCT 10.31.17

ANNUAL REPORT
AB INTERMEDIATE BOND PORTFOLIO


| Investment Products Offered | • Are Not FDIC Insured • May Lose Value • Are Not Bank Guaranteed | |
Investors should consider the investment objectives, risks, charges and expenses of the Fund carefully before investing. For copies of our prospectus or summary prospectus, which contain this and other information, visit us online at www.abfunds.com or contact your AB representative. Please read the prospectus and/or summary prospectus carefully before investing.
This shareholder report must be preceded or accompanied by the Fund’s prospectus for individuals who are not current shareholders of the Fund.
You may obtain a description of the Fund’s proxy voting policies and procedures, and information regarding how the Fund voted proxies relating to portfolio securities during the most recent 12-month period ended June 30, without charge. Simply visit AB’s website at www.abfunds.com, or go to the Securities and Exchange Commission’s (the “Commission”) website at www.sec.gov, or call AB at (800) 227 4618.
The Fund files its complete schedule of portfolio holdings with the Commission for the first and third quarters of each fiscal year on Form N-Q. The Fund’s Forms N-Q are available on the Commission’s website at www.sec.gov. The Fund’s Forms N-Q may also be reviewed and copied at the Commission’s Public Reference Room in Washington, DC; information on the operation of the Public Reference Room may be obtained by calling (800) SEC 0330. AB publishes full portfolio holdings for the Fund monthly at www.abfunds.com.
AllianceBernstein Investments, Inc. (ABI) is the distributor of the AB family of mutual funds. ABI is a member of FINRA and is an affiliate of AllianceBernstein L.P., the Adviser of the funds.
The [A/B] logo is a registered service mark of AllianceBernstein and AllianceBernstein® is a registered service mark used by permission of the owner, AllianceBernstein L.P.
| FROM THE PRESIDENT |  |
Dear Shareholder,
We are pleased to provide this report for AB Intermediate Bond Portfolio (the “Portfolio”). Please review the discussion of Portfolio performance, the market conditions during the reporting period and the Portfolio’s investment strategy.
As always, AB strives to keep clients ahead of what’s next by:
| + | Transforming uncommon insights into uncommon knowledge with a global research scope |
| + | Navigating markets with seasoned investment experience and sophisticated solutions |
| + | Providing thoughtful investment insights and actionable ideas |
Whether you’re an individual investor or a multi-billion-dollar institution, we put knowledge and experience to work for you.
AB’s global research organization connects and collaborates across platforms and teams to deliver impactful insights and innovative products. Better insights lead to better opportunities—anywhere in the world.
For additional information about AB’s range of products and shareholder resources, please log on to www.abfunds.com.
Thank you for your investment in the AB Mutual Funds.
Sincerely,

Robert M. Keith
President and Chief Executive Officer, AB Mutual Funds
| abfunds.com | AB INTERMEDIATE BOND PORTFOLIO | 1 |
ANNUAL REPORT
December 13, 2017
This report provides management’s discussion of fund performance for AB Intermediate Bond Portfolio for the annual reporting period ended October 31, 2017.
The Portfolio’s investment objective is to generate income and price appreciation without assuming what the Adviser considers undue risk.
NAV RETURNS AS OF OCTOBER 31, 2017 (unaudited)
| 6 Months | 12 Months | |||||||
| AB INTERMEDIATE BOND PORTFOLIO1 | ||||||||
| Class A Shares | 1.58% | 1.68% | ||||||
| Class B Shares2 | 1.20% | 0.92% | ||||||
| Class C Shares | 1.11% | 0.83% | ||||||
| Advisor Class Shares3 | 1.62% | 1.84% | ||||||
| Class R Shares3 | 1.36% | 1.34% | ||||||
| Class K Shares3 | 1.49% | 1.59% | ||||||
| Class I Shares3 | 1.62% | 1.93% | ||||||
| Class Z Shares3 | 1.71% | 1.84% | ||||||
| Bloomberg Barclays US Aggregate Bond Index | 1.58% | 0.90% | ||||||
| 1 | Includes the impact of a non-recurring refund for overbilling of prior years’ custody out of pocket fees, which enhanced performance for the six- and 12-month periods ended October 31, 2017, by 0.00% and 0.02%, respectively. |
| 2 | Effective January 31, 2009, Class B shares are no longer available for purchase to new investors. Please see Note A for additional information. |
| 3 | Please note that these share classes are for investors purchasing shares through accounts established under certain fee-based programs sponsored and maintained by certain broker-dealers and financial intermediaries, institutional pension plans and/or investment advisory clients of, and certain other persons associated with, the Adviser and its affiliates or the Portfolio. |
INVESTMENT RESULTS
The table above shows the Portfolio’s performance compared with its benchmark, the Bloomberg Barclays US Aggregate Bond Index, for the six- and 12-month periods ended October 31, 2017.
During the 12-month period, all share classes of the Portfolio except Class C shares outperformed the benchmark, before sales charges. Industry allocation contributed to relative performance, primarily because of an overweight position in collateralized mortgage obligations. Security selection was also positive, as gains from selections within banking and Treasuries more than offset losses from selection in mortgage-backed
| 2 | AB INTERMEDIATE BOND PORTFOLIO | abfunds.com |
securities agencies. Yield-curve positioning detracted, particularly along the intermediate portion of the curve, though the Portfolio’s shorter-than-benchmark duration contributed. Currency positioning was a modest negative.
During the six-month period, Class B, C, R and K shares of the Portfolio underperformed the benchmark, before sales charges, while Class I, Z and Advisor Class shares outperformed, and Class A shares performed in-line. Yield-curve positioning detracted from relative performance, though the Portfolio’s overall shorter-than-benchmark duration contributed. Security selection detracted, specifically due to losses in the commercial mortgage-backed securities sector. Currency positioning was a modest negative as well. Industry allocation contributed, primarily because of an overweight to collateralized mortgage obligations and an underweight in Treasuries.
During both periods, the Portfolio utilized currency forwards to hedge currency risk and actively manage currency positions. Credit default swaps were utilized for hedging and investment purposes, which overall detracted from performance. Treasury futures and interest rate swaps were utilized to manage duration, country exposure and yield-curve positioning. Purchased options were utilized to hedge market risk in the 12-month period, which had an immaterial impact on returns. Interest rate swaptions were used to hedge interest rate risk in the 12-month period, which had an immaterial impact on returns.
MARKET REVIEW AND INVESTMENT STRATEGY
Political events and central bank action had a significant impact on bond markets in the six- and 12-month periods ended October 31, 2017. Donald Trump’s US election victory and the promise of fiscal stimulus, a retreat from globalization and relaxed regulation were treated as positive developments by financial markets. However, uncertainty regarding the Trump administration’s ability to implement meaningful change increased through the 12-month period. UK prime minister Theresa May surprised investors when she called for a snap parliamentary election in an effort to firm up the UK’s mandate going into Brexit negotiations. However, the results of the vote increased political uncertainty when May’s Conservative Party failed to secure a majority position. Investors were relieved when centrist, pro-EU candidate Emmanuel Macron was elected president of France, as his reformist agenda was seen as more business friendly than the protectionist policies espoused by his opponent. In June, the US Federal Reserve (the “Fed”) raised interest rates for the third consecutive quarter, hikes that were well-telegraphed and universally anticipated by markets. Late in the period, the Fed formally confirmed that its balance sheet reduction program would start in October, while the European Central Bank announced that it would start to taper the pace of its monthly asset purchases in January 2018.
| abfunds.com | AB INTERMEDIATE BOND PORTFOLIO | 3 |
Emerging-market debt rallied over both periods, helped by a positive global growth story and increasing oil prices. Outside of Europe, developed-market treasury yields generally rose; in the eurozone and UK, yields moved in different directions. Emerging-market local-currency government bonds, developed-market treasuries and investment-grade credit securities all rose in both periods, yet trailed the rally in global high yield. Within high yield, performance was almost uniformly positive, led by the transportation and basic industries sectors, while consumer sectors tended to lag the rising market.
INVESTMENT POLICIES
The Portfolio invests, under normal circumstances, at least 80% of its net assets in fixed-income securities. The Portfolio expects to invest in readily marketable fixed-income securities with a range of maturities from short- to long-term and relatively attractive yields that do not involve undue risk of loss of capital. The Portfolio expects to invest in fixed-income securities with a dollar-weighted average maturity of between three to 10 years and an average duration of three to six years. The Portfolio may invest up to 25% of its net assets in below investment-grade bonds. The Portfolio may use leverage for investment purposes.
The Portfolio may invest without limit in US dollar-denominated foreign fixed-income securities and may invest up to 25% of its assets in non-US dollar-denominated foreign fixed-income securities. These investments may include, in each case, developed- and emerging-market debt securities.
The Adviser selects securities for purchase or sale based on its assessment of the securities’ risk and return characteristics as well as the securities’ impact on the overall risk and return characteristics of the Portfolio. In making this assessment, the Adviser takes into account various factors, including the credit quality and sensitivity to interest rates of the securities under consideration and of the Portfolio’s other holdings.
The Portfolio may invest in mortgage-related and other asset-backed securities, loan participations, inflation-indexed securities, structured securities, variable, floating, and inverse floating-rate instruments and preferred stock, and may use other investment techniques. The Portfolio intends, among other things, to enter into transactions such as reverse repurchase agreements and dollar rolls. The Portfolio may invest, without limit, in derivatives, such as options, futures contracts, forwards or swaps.
| 4 | AB INTERMEDIATE BOND PORTFOLIO | abfunds.com |
DISCLOSURES AND RISKS
Benchmark Disclosure
The Bloomberg Barclays US Aggregate Bond Index is unmanaged and does not reflect fees and expenses associated with the active management of a mutual fund portfolio. The Bloomberg Barclays US Aggregate Bond Index represents the performance of securities within the US investment-grade fixed-rate bond market, with index components for government and corporate securities, mortgage pass-through securities, asset-backed securities and commercial mortgage-backed securities. An investor cannot invest directly in an index, and its results are not indicative of the performance for any specific investment, including the Portfolio.
A Word About Risk
Market Risk: The value of the Portfolio’s assets will fluctuate as the stock or bond market fluctuates. The value of its investments may decline, sometimes rapidly and unpredictably, simply because of economic changes or other events that affect large portions of the market.
Interest Rate Risk: Changes in interest rates will affect the value of investments in fixed-income securities. When interest rates rise, the value of existing investments in fixed-income securities tends to fall and this decrease in value may not be offset by higher income from new investments. The Portfolio may be subject to heightened interest rate risk due to rising rates as the current period of historically low interest rates may be ending. Interest rate risk is generally greater for fixed-income securities with longer maturities or durations.
Credit Risk: An issuer or guarantor of a fixed-income security, or the counterparty to a derivatives or other contract, may be unable or unwilling to make timely payments of interest or principal, or to otherwise honor its obligations. The issuer or guarantor may default, causing a loss of the full principal amount of a security and accrued interest. The degree of risk for a particular security may be reflected in its credit rating. There is the possibility that the credit rating of a fixed-income security may be downgraded after purchase, which may adversely affect the value of the security.
Below Investment Grade Securities Risk: Investments in fixed-income securities with lower ratings (commonly known as “junk bonds”) are subject to a higher probability that an issuer will default or fail to meet its payment obligations. These securities may be subject to greater price volatility due to such factors as specific corporate developments, negative perceptions of the junk bond market generally and less secondary market liquidity.
Duration Risk: Duration is a measure that relates the expected price volatility of a fixed-income security to changes in interest rates. The duration of a fixed-income security may be shorter than or equal to full maturity of a fixed-income security. Fixed-income securities with longer durations have
| abfunds.com | AB INTERMEDIATE BOND PORTFOLIO | 5 |
DISCLOSURES AND RISKS (continued)
more risk and will decrease in price as interest rates rise. For example, a fixed-income security with a duration of three years will decrease in value by approximately 3% if interest rates increase by 1%.
Inflation Risk: This is the risk that the value of assets or income from investments will be less in the future as inflation decreases the value of money. As inflation increases, the value of the Portfolio’s assets can decline as can the value of the Portfolio’s distributions. This risk is significantly greater if the Portfolio invests a significant portion of its assets in fixed-income securities with longer maturities.
Foreign (Non-US) Risk: Investments in securities of non-US issuers may involve more risk than those of US issuers. These securities may fluctuate more widely in price and may be less liquid due to adverse market, economic, political, regulatory or other factors.
Emerging Market Risk: Investments in emerging-market countries may have more risk because the markets are less developed and less liquid, and because these investments may be subject to increased economic, political, regulatory or other uncertainties.
Currency Risk: Fluctuations in currency exchange rates may negatively affect the value of the Portfolio’s investments or reduce its returns.
Prepayment Risk: The value of mortgage-related or asset-backed securities may be particularly sensitive to changes in prevailing interest rates. Early payments of principal on some mortgage-related securities may occur during periods of falling mortgage interest rates and expose the Portfolio to a lower rate of return upon reinvestment of principal. Early payments associated with mortgage-related securities cause these securities to experience significantly greater price and yield volatility than is experienced by traditional fixed-income securities. During periods of rising interest rates, a reduction in prepayments may increase the effective life of mortgage-related securities, subjecting them to greater risk of decline in market value in response to rising interest rates. If the life of a mortgage-related security is inaccurately predicted, the Portfolio may not be able to realize the rate of return it expected.
Leverage Risk: To the extent the Portfolio uses leveraging techniques, its net asset value (“NAV”) may be more volatile because leverage tends to exaggerate the effect of changes in interest rates and any increase or decrease in the value of the Portfolio’s investments.
Derivatives Risk: Derivatives may be illiquid, difficult to price, and leveraged so that small changes may produce disproportionate losses for the Portfolio, and may be subject to counterparty risk to a greater degree than more traditional investments.
| 6 | AB INTERMEDIATE BOND PORTFOLIO | abfunds.com |
DISCLOSURES AND RISKS (continued)
Liquidity Risk: Liquidity risk occurs when certain investments become difficult to purchase or sell. Difficulty in selling less liquid securities may result in sales at disadvantageous prices affecting the value of your investment in the Portfolio. Causes of liquidity risk may include low trading volumes, large positions and heavy redemptions of Portfolio shares. Over recent years liquidity risk has also increased because the capacity of dealers in the secondary market for fixed-income securities to make markets in these securities has decreased, even as the overall bond market has grown significantly, due to, among other things, structural changes, additional regulatory requirements and capital and risk restraints that have led to reduced inventories. Liquidity risk may be higher in a rising interest rate environment, when the value and liquidity of fixed-income securities generally decline.
Management Risk: The Portfolio is subject to management risk because it is an actively managed investment fund. The Adviser will apply its investment techniques and risk analyses in making investment decisions, but there is no guarantee that its techniques will produce the intended results.
These risks are fully discussed in the Portfolio’s prospectus. As with all investments, you may lose money by investing in the Portfolio.
An Important Note About Historical Performance
The investment return and principal value of an investment in the Portfolio will fluctuate, so that shares, when redeemed, may be worth more or less than their original cost. Performance shown in this report represents past performance and does not guarantee future results. Current performance may be lower or higher than the performance information shown. You may obtain performance information current to the most recent month-end by visiting www.abfunds.com.
All fees and expenses related to the operation of the Portfolio have been deducted. NAV returns do not reflect sales charges; if sales charges were reflected, the Portfolio’s quoted performance would be lower. SEC returns reflect the applicable sales charges for each share class: a 4.25% maximum front-end sales charge for Class A shares; the applicable contingent deferred sales charge for Class B shares (3% year 1, 2% year 2, 1% year 3) and a 1% 1-year contingent deferred sales charge for Class C shares. Returns for the different share classes will vary due to different expenses associated with each class. Performance assumes reinvestment of distributions and does not account for taxes.
| abfunds.com | AB INTERMEDIATE BOND PORTFOLIO | 7 |
HISTORICAL PERFORMANCE
GROWTH OF A $10,000 INVESTMENT IN THE PORTFOLIO (unaudited)
10/31/2007 TO 10/31/2017
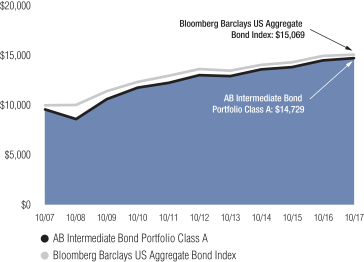
This chart illustrates the total value of an assumed $10,000 investment in AB Intermediate Bond Portfolio Class A shares (from 10/31/2007 to 10/31/2017) as compared to the performance of the Portfolio’s benchmark. The chart reflects the deduction of the maximum 4.25% sales charge from the initial $10,000 investment in the Portfolio and assumes the reinvestment of dividends and capital gains distributions.
| 8 | AB INTERMEDIATE BOND PORTFOLIO | abfunds.com |
HISTORICAL PERFORMANCE (continued)
AVERAGE ANNUAL RETURNS AS OF OCTOBER 31, 2017 (unaudited)
| NAV Returns | SEC Returns (reflects applicable sales charges) | SEC Yields1 | ||||||||||
| CLASS A SHARES | 1.72% | |||||||||||
| 1 Year | 1.68% | -2.65% | ||||||||||
| 5 Years | 2.49% | 1.60% | ||||||||||
| 10 Years | 4.40% | 3.95% | ||||||||||
| CLASS B SHARES | 1.03% | |||||||||||
| 1 Year | 0.92% | -2.05% | ||||||||||
| 5 Years | 1.74% | 1.74% | ||||||||||
| 10 Years2 | 3.98% | 3.98% | ||||||||||
| CLASS C SHARES | 1.06% | |||||||||||
| 1 Year | 0.83% | -0.16% | ||||||||||
| 5 Years | 1.74% | 1.74% | ||||||||||
| 10 Years | 3.66% | 3.66% | ||||||||||
| ADVISOR CLASS SHARES3 | 2.05% | |||||||||||
| 1 Year | 1.84% | 1.84% | ||||||||||
| 5 Years | 2.75% | 2.75% | ||||||||||
| 10 Years | 4.69% | 4.69% | ||||||||||
| CLASS R SHARES3 | 1.42% | |||||||||||
| 1 Year | 1.34% | 1.34% | ||||||||||
| 5 Years | 2.25% | 2.25% | ||||||||||
| 10 Years | 4.16% | 4.16% | ||||||||||
| CLASS K SHARES3 | 1.71% | |||||||||||
| 1 Year | 1.59% | 1.59% | ||||||||||
| 5 Years | 2.50% | 2.50% | ||||||||||
| 10 Years | 4.42% | 4.42% | ||||||||||
| CLASS I SHARES3 | 2.11% | |||||||||||
| 1 Year | 1.93% | 1.93% | ||||||||||
| 5 Years | 2.75% | 2.75% | ||||||||||
| 10 Years | 4.70% | 4.70% | ||||||||||
| CLASS Z SHARES3 | 2.14% | |||||||||||
| 1 Year | 1.84% | 1.84% | ||||||||||
| Since Inception4 | 3.25% | 3.25% | ||||||||||
The Portfolio’s prospectus fee table shows the Portfolio’s total annual operating expense ratios as 1.03%, 1.81%, 1.78%, 0.78%, 1.38%, 1.09%, 0.76% and 0.66% for Class A, Class B, Class C, Advisor Class, Class R, Class K, Class I and Class Z shares, respectively, gross of any fee waivers or expense reimbursements. Contractual fee waivers and/or expense reimbursements limit the Portfolio’s annual operating expense ratios exclusive of interest expense to 0.77%, 1.52%, 1.52%, 0.52%, 1.02%, 0.77%, 0.52% and 0.52% for Class A, Class B, Class C, Advisor Class, Class R, Class K, Class I and Class Z shares, respectively.
(footnotes continued on next page)
| abfunds.com | AB INTERMEDIATE BOND PORTFOLIO | 9 |
HISTORICAL PERFORMANCE (continued)
These waivers/reimbursements may not be terminated before January 31, 2018 and may be extended by the Adviser for additional one-year terms. Absent reimbursements or waivers, performance would have been lower. The Financial Highlights section of this report sets forth expense ratio data for the current reporting period; the expense ratios shown above may differ from the expense ratios in the Financial Highlights sections since they are based on different time periods.
| 1 | SEC yields are calculated based on SEC guidelines for the 30-day period ended October 31, 2017. |
| 2 | Assumes conversion of Class B shares into Class A shares after six years. |
| 3 | These share classes are offered at NAV to eligible investors and their SEC returns are the same as their NAV returns. Please note that these share classes are for investors purchasing shares through accounts established under certain fee-based programs sponsored and maintained by certain broker-dealers and financial intermediaries, institutional pension plans and/or investment advisory clients of, and certain other persons associated with, the Adviser and its affiliates or the Portfolio. |
| 4 | Inception date: 4/25/2014. |
| 10 | AB INTERMEDIATE BOND PORTFOLIO | abfunds.com |
HISTORICAL PERFORMANCE (continued)
SEC AVERAGE ANNUAL RETURNS
AS OF THE MOST RECENT CALENDAR QUARTER-END
SEPTEMBER 30, 2017 (unaudited)
| SEC Returns (reflects applicable sales charges) | ||||
| CLASS A SHARES | ||||
| 1 Year | -3.23% | |||
| 5 Years | 1.68% | |||
| 10 Years | 4.00% | |||
| CLASS B SHARES | ||||
| 1 Year | -2.66% | |||
| 5 Years | 1.82% | |||
| 10 Years1 | 4.02% | |||
| CLASS C SHARES | ||||
| 1 Year | -0.69% | |||
| 5 Years | 1.83% | |||
| 10 Years | 3.72% | |||
| ADVISOR CLASS SHARES2 | ||||
| 1 Year | 1.29% | |||
| 5 Years | 2.86% | |||
| 10 Years | 4.76% | |||
| CLASS R SHARES2 | ||||
| 1 Year | 0.79% | |||
| 5 Years | 2.33% | |||
| 10 Years | 4.23% | |||
| CLASS K SHARES2 | ||||
| 1 Year | 1.04% | |||
| 5 Years | 2.59% | |||
| 10 Years | 4.49% | |||
| CLASS I SHARES2 | ||||
| 1 Year | 1.39% | |||
| 5 Years | 2.86% | |||
| 10 Years | 4.76% | |||
| CLASS Z SHARES2 | ||||
| 1 Year | 1.20% | |||
| Since Inception3 | 3.29% | |||
| 1 | Assumes conversion of Class B shares into Class A shares after six years. |
| 2 | Please note that these share classes are for investors purchasing shares through accounts established under certain fee-based programs sponsored and maintained by certain broker-dealers and financial intermediaries, institutional pension plans and/or investment advisory clients of, and certain other persons associated with, the Adviser and its affiliates or the Portfolio. |
| 3 | Inception date: 4/25/2014. |
| abfunds.com | AB INTERMEDIATE BOND PORTFOLIO | 11 |
EXPENSE EXAMPLE
(unaudited)
As a shareholder of the Fund, you incur two types of costs: (1) transaction costs, including sales charges (loads) on purchase payments, contingent deferred sales charges on redemptions and (2) ongoing costs, including management fees; distribution (12b-1) fees; and other Fund expenses. This example is intended to help you understand your ongoing costs (in dollars) of investing in the Fund and to compare these costs with the ongoing costs of investing in other mutual funds.
The Example is based on an investment of $1,000 invested at the beginning of the period and held for the entire period as indicated below.
Actual Expenses
The table below provides information about actual account values and actual expenses. You may use the information, together with the amount you invested, to estimate the expenses that you paid over the period. Simply divide your account value by $1,000 (for example, an $8,600 account value divided by $1,000 = 8.6), then multiply the result by the number under the heading entitled “Expenses Paid During Period” to estimate the expenses you paid on your account during this period.
Hypothetical Example for Comparison Purposes
The table below also provides information about hypothetical account values and hypothetical expenses based on the Fund’s actual expense ratio and an assumed annual rate of return of 5% before expenses, which is not the Fund’s actual return. The hypothetical account values and expenses may not be used to estimate the actual ending account balance or expenses you paid for the period. You may use this information to compare the ongoing costs of investing in the Fund and other funds by comparing this 5% hypothetical example with the 5% hypothetical examples that appear in the shareholder reports of other funds.
Please note that the expenses shown in the table are meant to highlight your ongoing costs only and do not reflect any transactional costs, such as sales charges (loads), or contingent deferred sales charges on redemptions. Therefore, the hypothetical example is useful in comparing ongoing costs only, and will not help you determine the relative total costs of owning different funds. In addition, if these transactional costs were included, your costs would have been higher.
| 12 | AB INTERMEDIATE BOND PORTFOLIO | abfunds.com |
EXPENSE EXAMPLE (continued)
| Beginning Account Value May 1, 2017 | Ending Account Value October 31, 2017 | Expenses Paid During Period* | Annualized Expense Ratio* | |||||||||||||
Class A | ||||||||||||||||
Actual | $ | 1,000 | $ | 1,015.80 | $ | 3.91 | 0.77 | % | ||||||||
Hypothetical** | $ | 1,000 | $ | 1,021.32 | $ | 3.92 | 0.77 | % | ||||||||
Class B | ||||||||||||||||
Actual | $ | 1,000 | $ | 1,012.00 | $ | 7.71 | 1.52 | % | ||||||||
Hypothetical** | $ | 1,000 | $ | 1,017.54 | $ | 7.73 | 1.52 | % | ||||||||
Class C | ||||||||||||||||
Actual | $ | 1,000 | $ | 1,011.10 | $ | 7.70 | 1.52 | % | ||||||||
Hypothetical** | $ | 1,000 | $ | 1,017.54 | $ | 7.73 | 1.52 | % | ||||||||
| Advisor Class | ||||||||||||||||
Actual | $ | 1,000 | $ | 1,016.20 | $ | 2.64 | 0.52 | % | ||||||||
Hypothetical** | $ | 1,000 | $ | 1,022.58 | $ | 2.65 | 0.52 | % | ||||||||
Class R | ||||||||||||||||
Actual | $ | 1,000 | $ | 1,013.60 | $ | 5.18 | 1.02 | % | ||||||||
Hypothetical** | $ | 1,000 | $ | 1,020.06 | $ | 5.19 | 1.02 | % | ||||||||
Class K | ||||||||||||||||
Actual | $ | 1,000 | $ | 1,014.90 | $ | 3.91 | 0.77 | % | ||||||||
Hypothetical** | $ | 1,000 | $ | 1,021.32 | $ | 3.92 | 0.77 | % | ||||||||
Class I | ||||||||||||||||
Actual | $ | 1,000 | $ | 1,016.20 | $ | 2.64 | 0.52 | % | ||||||||
Hypothetical** | $ | 1,000 | $ | 1,022.58 | $ | 2.65 | 0.52 | % | ||||||||
Class Z | ||||||||||||||||
Actual | $ | 1,000 | $ | 1,017.10 | $ | 2.64 | 0.52 | % | ||||||||
Hypothetical** | $ | 1,000 | $ | 1,022.58 | $ | 2.65 | 0.52 | % | ||||||||
| * | Expenses are equal to the classes’ annualized expense ratios multiplied by the average account value over the period, multiplied by 184/365 (to reflect the one-half year period). |
| ** | Assumes 5% annual return before expenses. |
| abfunds.com | AB INTERMEDIATE BOND PORTFOLIO | 13 |
PORTFOLIO SUMMARY
October 31, 2017 (unaudited)
PORTFOLIO STATISTICS
Net Assets ($mil): $360.1
TOP TEN SECTORS (including derivatives)1
| Mortgage Pass-Throughs | 20.2 | % | ||
| Corporates – Investment Grade | 19.7 | |||
| Governments – Treasuries2 | 13.1 | |||
| Asset-Backed Securities | 12.8 | |||
| Commercial Mortgage-Backed Securities3 | 10.1 | |||
| Agency Discount Notes | 7.7 | |||
| Collateralized Mortgage Obligations | 7.3 | |||
| Inflation-Linked Securities | 5.5 | |||
| Corporates – Non-Investment Grade3 | 3.9 | |||
| Interest Rate Swaps4 | -1.3 |
SECTOR BREAKDOWN (excluding derivatives)5
| Mortgage Pass-Throughs | 18.3 | % | Emerging Markets – Treasuries | 0.7 | % | |||||||||
| Corporates – Investment Grade | 17.5 | Emerging Markets – Corporate Bonds | 0.5 | |||||||||||
| Governments – Treasuries | 12.1 | Local Governments – US Municipal Bonds | 0.4 | |||||||||||
| Asset-Backed Securities | 11.3 | Quasi-Sovereigns | 0.4 | |||||||||||
| Commercial Mortgage-Backed Securities | 8.2 | Common Stocks | 0.2 | |||||||||||
| Collateralized Mortgage Obligations | 6.5 | Other | 0.2 | |||||||||||
| Inflation-Linked Securities | 4.8 | Short-Term | 15.2 | |||||||||||
| Corporates – Non-Investment Grade | 3.7 | 100.0 | % |
| 1 | All data are as of October 31, 2017. The Portfolio’s sectors include derivative exposure and are expressed as approximate percentages of the Portfolio’s total net assets, based on the Adviser’s internal classification. The percentages will vary over time. |
| 2 | Includes Treasury Futures. |
| 3 | Includes Credit Default Swaps. |
| 4 | Represents the exposure of the Portfolio’s fixed-rate payments on the Interest Rate Swaps. Interest Rate Swaps involve the exchange by a fund with another party of payments calculated by reference to specified interest rates (e.g., an exchange of floating-rate payments for fixed-rate payments). |
| 5 | All data are as of October 31, 2017. The Portfolio’s sector breakdown is expressed as a percentage of total investments and may vary over time. The Portfolio also enters into derivative transactions, which may be used for hedging or investment purposes (see “Portfolio of Investments” section of the report for additional details). “Other” represents the following categories: Emerging Markets – Sovereigns and Governments – Sovereign Bonds. |
| 14 | AB INTERMEDIATE BOND PORTFOLIO | abfunds.com |
PORTFOLIO OF INVESTMENTS
October 31, 2017
| Principal Amount (000) | U.S. $ Value | |||||||||||
| ||||||||||||
MORTGAGE PASS-THROUGHS – 20.6% | ||||||||||||
Agency ARMs – 0.0% | ||||||||||||
Federal Home Loan Mortgage Corp. | U.S.$ | 30 | $ | 31,138 | ||||||||
|
| |||||||||||
Agency Fixed Rate 15-Year – 1.6% | ||||||||||||
Federal National Mortgage Association | 2,144 | 2,156,071 | ||||||||||
Series 2016 | 3,735 | 3,756,488 | ||||||||||
|
| |||||||||||
| 5,912,559 | ||||||||||||
|
| |||||||||||
Agency Fixed Rate 30-Year – 18.4% | ||||||||||||
Federal Home Loan Mortgage Corp. Gold | 241 | 268,501 | ||||||||||
Series 2007 | 33 | 36,230 | ||||||||||
Series 2017 | 1,321 | 1,395,379 | ||||||||||
4.00%, 2/01/46 | 1,673 | 1,766,850 | ||||||||||
Federal National Mortgage Association | 26,953 | 27,704,735 | ||||||||||
4.00%, 11/25/47, TBA | 12,320 | 12,930,224 | ||||||||||
4.50%, 1/01/39-4/01/47 | 8,266 | 8,855,497 | ||||||||||
Series 2003 | 238 | 264,000 | ||||||||||
Series 2004 | 135 | 149,720 | ||||||||||
Series 2005 | 99 | 109,625 | ||||||||||
Series 2007 | 2,671 | 2,822,265 | ||||||||||
5.50%, 1/01/35 | 639 | 710,373 | ||||||||||
5.50%, 8/01/37 | 447 | 496,808 | ||||||||||
Government National Mortgage Association | 1,316 | 1,333,066 | ||||||||||
3.50%, 11/01/47, TBA | 6,990 | 7,251,033 | ||||||||||
Series 1990 | – 0 | –** | 4 | |||||||||
Series 1999 | 20 | 21,199 | ||||||||||
|
| |||||||||||
| 66,115,509 | ||||||||||||
|
| |||||||||||
| abfunds.com | AB INTERMEDIATE BOND PORTFOLIO | 15 |
PORTFOLIO OF INVESTMENTS (continued)
| Principal Amount (000) | U.S. $ Value | |||||||||||
| ||||||||||||
Other Agency Fixed Rate | ||||||||||||
Federal National Mortgage Association | U.S.$ | 180 | $ | 181,567 | ||||||||
4.50%, 4/01/28-4/01/34 | 1,779 | 1,902,029 | ||||||||||
|
| |||||||||||
| 2,083,596 | ||||||||||||
|
| |||||||||||
Total Mortgage Pass-Throughs | 74,142,802 | |||||||||||
|
| |||||||||||
CORPORATES – INVESTMENT GRADE – 19.7% | ||||||||||||
Financial Institutions – 9.8% | ||||||||||||
Banking – 8.5% | ||||||||||||
ABN AMRO Bank NV | 200 | 212,360 | ||||||||||
Banco Santander SA | 400 | 409,356 | ||||||||||
Bank of America Corp. | 900 | 903,069 | ||||||||||
3.824%, 1/20/28 | 905 | 932,376 | ||||||||||
Series G | 890 | 899,844 | ||||||||||
Barclays PLC | 389 | 391,081 | ||||||||||
BNP Paribas SA | 347 | 360,464 | ||||||||||
Series E | EUR | 345 | 422,678 | |||||||||
BPCE SA | U.S.$ | 230 | 256,857 | |||||||||
Capital One Financial Corp. | 901 | 902,343 | ||||||||||
Citigroup, Inc. | 1,240 | 1,254,558 | ||||||||||
3.70%, 1/12/26 | 1,000 | 1,030,770 | ||||||||||
Compass Bank | 895 | 889,021 | ||||||||||
5.50%, 4/01/20 | 1,339 | 1,419,407 | ||||||||||
Cooperatieve Rabobank UA | 1,373 | 1,453,760 | ||||||||||
Credit Agricole SA/London | 387 | 405,448 | ||||||||||
Credit Suisse Group Funding Guernsey Ltd. | 600 | 622,008 | ||||||||||
Goldman Sachs Group, Inc. (The) | 710 | 702,318 | ||||||||||
| 16 | AB INTERMEDIATE BOND PORTFOLIO | abfunds.com |
PORTFOLIO OF INVESTMENTS (continued)
| Principal Amount (000) | U.S. $ Value | |||||||||||
| ||||||||||||
3.75%, 5/22/25 | U.S.$ | 254 | $ | 261,615 | ||||||||
3.85%, 7/08/24 | 905 | 943,245 | ||||||||||
Series D | 1,282 | 1,400,277 | ||||||||||
HSBC Holdings PLC | 1,965 | 2,058,397 | ||||||||||
JPMorgan Chase & Co. | 890 | 899,309 | ||||||||||
3.54%, 5/01/28 | 1,615 | 1,633,201 | ||||||||||
Lloyds Banking Group PLC | 920 | 937,489 | ||||||||||
4.65%, 3/24/26 | 366 | 388,377 | ||||||||||
Mitsubishi UFJ Financial Group, Inc. | 234 | 243,582 | ||||||||||
Morgan Stanley | 1,500 | 1,511,190 | ||||||||||
5.625%, 9/23/19 | 478 | 508,339 | ||||||||||
Series G | 590 | 639,696 | ||||||||||
Nationwide Building Society | 950 | 960,241 | ||||||||||
Santander Holdings USA, Inc. | 890 | 916,780 | ||||||||||
Santander Issuances SAU | EUR | 300 | 387,528 | |||||||||
5.179%, 11/19/25 | U.S.$ | 600 | 648,444 | |||||||||
Santander UK PLC | 500 | 541,120 | ||||||||||
UBS AG/Stamford CT | 620 | 733,776 | ||||||||||
UBS Group Funding Switzerland AG | 436 | 459,679 | ||||||||||
US Bancorp | 380 | 416,898 | ||||||||||
Wells Fargo & Co. | 712 | 721,292 | ||||||||||
|
| |||||||||||
| 30,678,193 | ||||||||||||
|
| |||||||||||
Insurance – 1.1% | ||||||||||||
American International Group, Inc. | 940 | 1,281,239 | ||||||||||
Guardian Life Insurance Co. of America (The) | 542 | 776,334 | ||||||||||
Hartford Financial Services Group, Inc. (The) | 110 | 118,386 | ||||||||||
Lincoln National Corp. | 111 | 122,771 | ||||||||||
| abfunds.com | AB INTERMEDIATE BOND PORTFOLIO | 17 |
PORTFOLIO OF INVESTMENTS (continued)
| Principal Amount (000) | U.S. $ Value | |||||||||||
| ||||||||||||
MetLife Capital Trust IV | U.S.$ | 699 | $ | 940,218 | ||||||||
Nationwide Mutual Insurance Co. | 246 | 411,135 | ||||||||||
XLIT Ltd. | EUR | 199 | 233,553 | |||||||||
|
| |||||||||||
| 3,883,636 | ||||||||||||
|
| |||||||||||
REITS – 0.2% | ||||||||||||
Trust F/1401 | U.S.$ | 565 | 602,447 | |||||||||
|
| |||||||||||
| 35,164,276 | ||||||||||||
|
| |||||||||||
Industrial – 9.4% | ||||||||||||
Basic – 1.2% | ||||||||||||
Anglo American Capital PLC | 200 | 206,054 | ||||||||||
Eastman Chemical Co. | 220 | 229,062 | ||||||||||
Glencore Funding LLC | 516 | 540,355 | ||||||||||
Minsur SA | 335 | 371,850 | ||||||||||
Mosaic Co. (The) | 244 | 255,366 | ||||||||||
Sociedad Quimica y Minera de Chile SA | 1,607 | 1,623,070 | ||||||||||
Vale Overseas Ltd. | 495 | 589,594 | ||||||||||
Yamana Gold, Inc. | 339 | 349,516 | ||||||||||
|
| |||||||||||
| 4,164,867 | ||||||||||||
|
| |||||||||||
Capital Goods – 0.2% | ||||||||||||
Embraer Netherlands Finance BV | 540 | 578,610 | ||||||||||
General Electric Co. | 187 | 194,975 | ||||||||||
|
| |||||||||||
| 773,585 | ||||||||||||
|
| |||||||||||
Communications - Media – 0.6% | ||||||||||||
Charter Communications Operating LLC/Charter Communications Operating Capital | 740 | 786,946 | ||||||||||
Cox Communications, Inc. | 233 | 230,290 | ||||||||||
Time Warner Cable LLC | 230 | 213,472 | ||||||||||
| 18 | AB INTERMEDIATE BOND PORTFOLIO | abfunds.com |
PORTFOLIO OF INVESTMENTS (continued)
| Principal Amount (000) | U.S. $ Value | |||||||||||
| ||||||||||||
5.00%, 2/01/20 | U.S.$ | 740 | $ | 778,813 | ||||||||
|
| |||||||||||
| 2,009,521 | ||||||||||||
|
| |||||||||||
Communications - Telecommunications – 2.0% | ||||||||||||
AT&T, Inc. | 1,610 | 1,590,905 | ||||||||||
4.125%, 2/17/26 | 1,161 | 1,190,698 | ||||||||||
5.15%, 2/14/50 | 395 | 389,142 | ||||||||||
Rogers Communications, Inc. | CAD | 130 | 107,237 | |||||||||
Sprint Spectrum Co. LLC/Sprint Spectrum Co. II LLC/Sprint Spectrum Co. III LLC | U.S.$ | 400 | 405,320 | |||||||||
Verizon Communications, Inc. | 988 | 932,237 | ||||||||||
3.50%, 11/01/24 | 2,015 | 2,062,252 | ||||||||||
5.50%, 3/16/47 | 485 | 535,324 | ||||||||||
|
| |||||||||||
| 7,213,115 | ||||||||||||
|
| |||||||||||
Consumer Cyclical - Automotive – 0.9% | ||||||||||||
Ford Motor Credit Co. LLC | 603 | 610,206 | ||||||||||
5.875%, 8/02/21 | 1,291 | 1,438,871 | ||||||||||
General Motors Co. | 340 | 345,029 | ||||||||||
General Motors Financial Co., Inc. | 560 | 566,961 | ||||||||||
3.25%, 5/15/18 | 43 | 43,337 | ||||||||||
4.00%, 1/15/25 | 106 | 108,575 | ||||||||||
4.30%, 7/13/25 | 135 | 139,942 | ||||||||||
|
| |||||||||||
| 3,252,921 | ||||||||||||
|
| |||||||||||
Consumer Non-Cyclical – 1.1% | ||||||||||||
Becton Dickinson and Co. | 180 | 184,817 | ||||||||||
Biogen, Inc. | 683 | 725,496 | ||||||||||
Bunge Ltd. Finance Corp. | 6 | 6,590 | ||||||||||
Mylan NV | EUR | 344 | 429,792 | |||||||||
Teva Pharmaceutical Finance Netherlands III BV | U.S.$ | 680 | 625,610 | |||||||||
3.15%, 10/01/26 | 1,267 | 1,121,206 | ||||||||||
Tyson Foods, Inc. | 164 | 165,694 | ||||||||||
| abfunds.com | AB INTERMEDIATE BOND PORTFOLIO | 19 |
PORTFOLIO OF INVESTMENTS (continued)
| Principal Amount (000) | U.S. $ Value | |||||||||||
| ||||||||||||
3.95%, 8/15/24 | U.S.$ | 541 | $ | 571,291 | ||||||||
|
| |||||||||||
| 3,830,496 | ||||||||||||
|
| |||||||||||
Energy – 1.3% | ||||||||||||
Cenovus Energy, Inc. | 42 | 41,563 | ||||||||||
5.70%, 10/15/19 | 169 | 179,140 | ||||||||||
Ecopetrol SA | 245 | 243,162 | ||||||||||
Encana Corp. | 415 | 429,550 | ||||||||||
Energy Transfer LP | 411 | 423,498 | ||||||||||
Energy Transfer LP/Regency Energy Finance Corp. | 135 | 141,826 | ||||||||||
5.75%, 9/01/20 | 420 | 451,521 | ||||||||||
Enterprise Products Operating LLC | 235 | 254,136 | ||||||||||
Hess Corp. | 648 | 652,206 | ||||||||||
Noble Energy, Inc. | 463 | 476,691 | ||||||||||
Plains All American Pipeline LP/PAA Finance Corp. | 594 | 582,839 | ||||||||||
Sabine Pass Liquefaction LLC | 482 | 518,068 | ||||||||||
Williams Partners LP | 403 | 421,353 | ||||||||||
|
| |||||||||||
| 4,815,553 | ||||||||||||
|
| |||||||||||
Other Industrial – 0.1% | ||||||||||||
Alfa SAB de CV | 530 | 562,462 | ||||||||||
|
| |||||||||||
Services – 0.4% | ||||||||||||
Expedia, Inc. | 636 | 618,904 | ||||||||||
S&P Global, Inc. | 584 | 630,703 | ||||||||||
Total System Services, Inc. | 116 | 119,458 | ||||||||||
|
| |||||||||||
| 1,369,065 | ||||||||||||
|
| |||||||||||
Technology – 1.5% | ||||||||||||
Agilent Technologies, Inc. | 217 | 232,498 | ||||||||||
| 20 | AB INTERMEDIATE BOND PORTFOLIO | abfunds.com |
PORTFOLIO OF INVESTMENTS (continued)
| Principal Amount (000) | U.S. $ Value | |||||||||||
| ||||||||||||
Broadcom Corp./Broadcom Cayman Finance Ltd. | U.S.$ | 181 | $ | 186,890 | ||||||||
3.875%, 1/15/27(b) | 395 | 406,431 | ||||||||||
Dell International LLC/EMC Corp. | 865 | 949,597 | ||||||||||
6.02%, 6/15/26(b) | 145 | 161,875 | ||||||||||
Hewlett Packard Enterprise Co. | 629 | 628,358 | ||||||||||
HP, Inc. | 266 | 286,934 | ||||||||||
KLA-Tencor Corp. | 614 | 669,070 | ||||||||||
Lam Research Corp. | 269 | 272,613 | ||||||||||
Motorola Solutions, Inc. | 400 | 405,500 | ||||||||||
7.50%, 5/15/25 | 43 | 52,239 | ||||||||||
Seagate HDD Cayman | 336 | 333,416 | ||||||||||
VMware, Inc. | 283 | 283,914 | ||||||||||
Western Digital Corp. | 508 | 555,478 | ||||||||||
|
| |||||||||||
| 5,424,813 | ||||||||||||
|
| |||||||||||
Transportation - Services – 0.1% | ||||||||||||
Adani Ports & Special Economic Zone Ltd. | 545 | 560,089 | ||||||||||
|
| |||||||||||
| 33,976,487 | ||||||||||||
|
| |||||||||||
Utility – 0.5% | ||||||||||||
Electric – 0.5% | ||||||||||||
Dominion Energy, Inc. | 750 | 829,710 | ||||||||||
Israel Electric Corp., Ltd. | 580 | 622,775 | ||||||||||
TECO Finance, Inc. | 380 | 403,362 | ||||||||||
|
| |||||||||||
| 1,855,847 | ||||||||||||
|
| |||||||||||
Total Corporates – Investment Grade | 70,996,610 | |||||||||||
|
| |||||||||||
GOVERNMENTS – TREASURIES – 13.6% | ||||||||||||
United States – 13.6% | ||||||||||||
U.S. Treasury Bonds | 1,484 | 1,379,428 | ||||||||||
| abfunds.com | AB INTERMEDIATE BOND PORTFOLIO | 21 |
PORTFOLIO OF INVESTMENTS (continued)
| Principal Amount (000) | U.S. $ Value | |||||||||||
| ||||||||||||
2.875%, 8/15/45-11/15/46 | U.S.$ | 1,556 | $ | 1,557,250 | ||||||||
3.00%, 5/15/45-5/15/47 | 2,876 | 2,948,986 | ||||||||||
3.125%, 8/15/44 | 10,677 | 11,227,217 | ||||||||||
4.375%, 2/15/38 | 960 | 1,215,300 | ||||||||||
4.50%, 2/15/36 | 416 | 532,289 | ||||||||||
5.375%, 2/15/31 | 1,444 | 1,924,356 | ||||||||||
U.S. Treasury Notes | 4,261 | 4,259,668 | ||||||||||
1.50%, 8/15/26 | 900 | 839,627 | ||||||||||
1.625%, 2/15/26(d) | 418 | 396,215 | ||||||||||
1.75%, 11/30/21 | 7,129 | 7,084,146 | ||||||||||
1.875%, 1/31/22-4/30/22 | 7,985 | 7,960,389 | ||||||||||
2.25%, 11/15/24-8/15/27 | 2,783 | 2,766,642 | ||||||||||
2.25%, 11/15/25(d) | 3,979 | 3,964,378 | ||||||||||
2.375%, 8/15/24 | 1,040 | 1,050,865 | ||||||||||
|
| |||||||||||
Total Governments – Treasuries | 49,106,756 | |||||||||||
|
| |||||||||||
ASSET-BACKED SECURITIES – 12.8% | ||||||||||||
Autos - Fixed Rate – 7.8% | ||||||||||||
Ally Auto Receivables Trust | 411 | 410,458 | ||||||||||
Ally Master Owner Trust | 1,226 | 1,225,708 | ||||||||||
AmeriCredit Automobile Receivables Trust | 408 | 407,418 | ||||||||||
Series 2017-3, Class A2A | 435 | 434,393 | ||||||||||
Avis Budget Rental Car Funding AESOP LLC Series 2012-3A, Class A | 838 | 838,209 | ||||||||||
Series 2016-1A, Class A | 418 | 422,088 | ||||||||||
Bank of The West Auto Trust | 403 | 402,836 | ||||||||||
California Republic Auto Receivables Trust Series 2014-2, Class A4 | 202 | 202,192 | ||||||||||
Series 2015-2, Class A3 | 52 | 51,690 | ||||||||||
| 22 | AB INTERMEDIATE BOND PORTFOLIO | abfunds.com |
PORTFOLIO OF INVESTMENTS (continued)
| Principal Amount (000) | U.S. $ Value | |||||||||
| ||||||||||
CarMax Auto Owner Trust | U.S.$ | 456 | $ | 455,015 | ||||||
Chrysler Capital Auto Receivables Trust | 429 | 429,938 | ||||||||
Series 2016-AA, Class A3 | 862 | 861,920 | ||||||||
CPS Auto Receivables Trust | 97 | 97,141 | ||||||||
Series 2016-C, Class E | 600 | 642,438 | ||||||||
CPS Auto Trust | 550 | 566,876 | ||||||||
Series 2017-D, Class A | 1,015 | 1,014,309 | ||||||||
Drive Auto Receivables Trust | 392 | 392,300 | ||||||||
DT Auto Owner Trust | 377 | 377,050 | ||||||||
Enterprise Fleet Financing LLC | 128 | 127,988 | ||||||||
Exeter Automobile Receivables Trust | 270 | 284,893 | ||||||||
Series 2016-3A, Class A | 168 | 167,789 | ||||||||
Series 2016-3A, Class D | 350 | 359,590 | ||||||||
Series 2017-1A, Class D | 525 | 541,475 | ||||||||
Series 2017-2A, Class A | 444 | 444,128 | ||||||||
Series 2017-3A, Class A | 864 | 862,846 | ||||||||
Series 2017-3A, Class C | 385 | 384,184 | ||||||||
Fifth Third Auto Trust | 721 | 720,679 | ||||||||
| abfunds.com | AB INTERMEDIATE BOND PORTFOLIO | 23 |
PORTFOLIO OF INVESTMENTS (continued)
| Principal Amount (000) | U.S. $ Value | |||||||||
| ||||||||||
First Investors Auto Owner Trust | U.S.$ | 290 | $ | 288,666 | ||||||
Flagship Credit Auto Trust | 350 | 380,195 | ||||||||
Series 2016-3, Class A1 | 201 | 200,851 | ||||||||
Series 2016-4, Class E | 565 | 583,731 | ||||||||
Series 2017-2, Class A | 575 | 574,411 | ||||||||
Series 2017-3, Class A | 575 | 573,470 | ||||||||
Ford Credit Auto Owner Trust | 322 | 324,296 | ||||||||
Ford Credit Floorplan Master Owner Trust | 906 | 904,096 | ||||||||
Series 2016-1, Class A1 | 682 | 681,319 | ||||||||
Series 2017-1, Class A1 | 710 | 709,920 | ||||||||
GM Financial Automobile Leasing Trust | 564 | 564,016 | ||||||||
Series 2015-3, Class A3 | 857 | 856,970 | ||||||||
GMF Floorplan Owner Revolving Trust | 575 | 574,818 | ||||||||
Series 2016-1, Class A1 | 860 | 860,557 | ||||||||
Harley-Davidson Motorcycle Trust | 268 | 267,692 | ||||||||
Hertz Vehicle Financing II LP | 386 | 386,754 | ||||||||
Series 2015-3A, Class A | 180 | 179,012 | ||||||||
Series 2016-1A, Class A | 678 | 677,230 | ||||||||
Hertz Vehicle Financing LLC | 2,370 | 2,368,239 | ||||||||
| 24 | AB INTERMEDIATE BOND PORTFOLIO | abfunds.com |
PORTFOLIO OF INVESTMENTS (continued)
| Principal Amount (000) | U.S. $ Value | |||||||||||
| ||||||||||||
Hyundai Auto Lease Securitization Trust | U.S.$ | 123 | $ | 122,966 | ||||||||
Mercedes Benz Auto Lease Trust | 134 | 133,753 | ||||||||||
Santander Drive Auto Receivables Trust | 894 | 894,557 | ||||||||||
Series 2016-3, Class A2 | 233 | 233,184 | ||||||||||
Series 2017-3, Class A2 | 416 | 415,633 | ||||||||||
Westlake Automobile Receivables Trust | 159 | 158,665 | ||||||||||
Wheels SPV 2 LLC | 950 | 947,110 | ||||||||||
|
| |||||||||||
| 27,987,662 | ||||||||||||
|
| |||||||||||
Other ABS - Fixed Rate – 2.4% | ||||||||||||
Ascentium Equipment Receivables Trust | 60 | 60,076 | ||||||||||
CLUB Credit Trust | 700 | 703,622 | ||||||||||
CNH Equipment Trust | 616 | 616,036 | ||||||||||
Marlette Funding Trust | 206 | 206,629 | ||||||||||
Series 2017-1A, Class A | 297 | 297,536 | ||||||||||
Series 2017-1A, Class C | 750 | 768,997 | ||||||||||
Series 2017-2A, Class A | 516 | 516,271 | ||||||||||
Series 2017-3A, Class A | 314 | 314,105 | ||||||||||
Series 2017-3A, Class B | 543 | 543,881 | ||||||||||
Prosper Marketplace Issuance Trust | 215 | 216,367 | ||||||||||
| abfunds.com | AB INTERMEDIATE BOND PORTFOLIO | 25 |
PORTFOLIO OF INVESTMENTS (continued)
| Principal Amount (000) | U.S. $ Value | |||||||||||
| ||||||||||||
SBA Tower Trust | U.S.$ | 688 | $ | 696,607 | ||||||||
SoFi Consumer Loan Program 2017-4 LLC | 870 | 868,732 | ||||||||||
SoFi Consumer Loan Program LLC | 414 | 417,271 | ||||||||||
Series 2016-3, Class A | 461 | 464,645 | ||||||||||
Series 2017-1, Class A | 378 | 383,007 | ||||||||||
Series 2017-2, Class A | 527 | 533,591 | ||||||||||
Series 2017-3, Class A | 436 | 437,506 | ||||||||||
Series 2017-5, Class A2 | 720 | 715,949 | ||||||||||
|
| |||||||||||
| 8,760,828 | ||||||||||||
|
| |||||||||||
Credit Cards - Fixed Rate – 1.5% | ||||||||||||
Barclays Dryrock Issuance Trust | 703 | 703,010 | ||||||||||
Series 2015-4, Class A | 630 | 630,037 | ||||||||||
Synchrony Credit Card Master Note Trust | 1,050 | 1,054,978 | ||||||||||
Series 2015-3, Class A | 859 | 859,264 | ||||||||||
Series 2016-1, Class A | 544 | 545,487 | ||||||||||
World Financial Network Credit Card Master Trust | 570 | 570,096 | ||||||||||
Series 2016-B, Class A | 416 | 415,084 | ||||||||||
Series 2017-B, Class A | 685 | 684,541 | ||||||||||
|
| |||||||||||
| 5,462,497 | ||||||||||||
|
| |||||||||||
Autos - Floating Rate – 0.6% | ||||||||||||
BMW Floorplan Master Owner Trust | 997 | 999,555 | ||||||||||
| 26 | AB INTERMEDIATE BOND PORTFOLIO | abfunds.com |
PORTFOLIO OF INVESTMENTS (continued)
| Principal Amount (000) | U.S. $ Value | |||||||||||
| ||||||||||||
Wells Fargo Dealer Floorplan Master Note Trust | U.S.$ | 1,073 | $ | 1,073,192 | ||||||||
|
| |||||||||||
| 2,072,747 | ||||||||||||
|
| |||||||||||
Credit Cards - Floating Rate – 0.5% | ||||||||||||
Discover Card Execution Note Trust | 964 | 964,867 | ||||||||||
World Financial Network Credit Card Master Trust | 681 | 682,150 | ||||||||||
|
| |||||||||||
| 1,647,017 | ||||||||||||
|
| |||||||||||
Home Equity Loans - Fixed Rate – 0.0% | ||||||||||||
Credit-Based Asset Servicing & Securitization LLC | 76 | 76,473 | ||||||||||
|
| |||||||||||
Home Equity Loans - Floating | ||||||||||||
Asset Backed Funding Certificates Trust | 39 | 37,871 | ||||||||||
|
| |||||||||||
Total Asset-Backed Securities | 46,045,095 | |||||||||||
|
| |||||||||||
COMMERCIAL MORTGAGE-BACKED SECURITIES – 9.2% | ||||||||||||
Non-Agency Fixed Rate CMBS – 7.9% | ||||||||||||
Banc of America Commercial Mortgage Trust | 296 | 295,650 | ||||||||||
BHMS Commercial Mortgage Trust | 890 | 896,772 | ||||||||||
CFCRE Commercial Mortgage Trust | 735 | 743,601 | ||||||||||
| abfunds.com | AB INTERMEDIATE BOND PORTFOLIO | 27 |
PORTFOLIO OF INVESTMENTS (continued)
| Principal Amount (000) | U.S. $ Value | |||||||||
| ||||||||||
CGRBS Commercial Mortgage Trust | U.S.$ | 1,305 | $ | 1,339,610 | ||||||
Citigroup Commercial Mortgage Trust | 633 | 564,474 | ||||||||
Series 2013-GC17, Class D | 565 | 539,927 | ||||||||
Series 2015-GC27, Class A5 | 1,223 | 1,238,255 | ||||||||
Series 2015-GC35, Class A4 | 340 | 359,365 | ||||||||
Series 2016-C1, Class A4 | 1,359 | 1,381,913 | ||||||||
Series 2016-GC36, Class A5 | 425 | 442,968 | ||||||||
Commercial Mortgage Trust | 393 | 385,558 | ||||||||
Series 2015-CR24, Class A5 | 430 | 452,983 | ||||||||
Series 2015-CR25, Class A4 | 1,045 | 1,105,423 | ||||||||
Series 2015-PC1, Class A5 | 685 | 725,939 | ||||||||
CSAIL Commercial Mortgage Trust | 332 | 343,492 | ||||||||
Series 2015-C3, Class A4 | 573 | 602,526 | ||||||||
Series 2015-C4, Class A4 | 1,450 | 1,529,414 | ||||||||
GS Mortgage Securities Corp. II | 1,163 | 1,173,669 | ||||||||
GS Mortgage Securities Trust | 766 | 761,450 | ||||||||
JP Morgan Chase Commercial Mortgage Securities Trust | 266 | 266,110 | ||||||||
Series 2006-LDP9, Class AM | 183 | 183,865 | ||||||||
Series 2007-CB19, Class AM | 22 | 21,978 | ||||||||
| 28 | AB INTERMEDIATE BOND PORTFOLIO | abfunds.com |
PORTFOLIO OF INVESTMENTS (continued)
| Principal Amount (000) | U.S. $ Value | |||||||||
| ||||||||||
Series 2011-C5, Class D | U.S.$ | 127 | $ | 128,576 | ||||||
Series 2012-C6, Class D | 690 | 704,277 | ||||||||
Series 2012-C6, Class E | 389 | 346,151 | ||||||||
JPMBB Commercial Mortgage Securities Trust | 425 | 449,941 | ||||||||
Series 2015-C31, Class A3 | 1,009 | 1,067,320 | ||||||||
Series 2015-C32, Class C | 540 | 546,453 | ||||||||
Series 2015-C33, Class A4 | 1,050 | 1,104,320 | ||||||||
LB-UBS Commercial Mortgage Trust | 219 | 175,154 | ||||||||
LSTAR Commercial Mortgage Trust | 101 | 101,390 | ||||||||
Series 2015-3, Class A2 | 584 | 585,364 | ||||||||
Series 2016-4, Class A2 | 615 | 606,745 | ||||||||
Morgan Stanley Capital I Trust | 365 | 364,504 | ||||||||
Series 2016-UB12, Class A4 | 660 | 687,069 | ||||||||
Prudential Securities Secured Financing Corp. | 501 | 5 | ||||||||
UBS-Barclays Commercial Mortgage Trust | 1,098 | 1,112,181 | ||||||||
Wells Fargo Commercial Mortgage Trust | 1,040 | 1,077,187 | ||||||||
Series 2015-SG1, Class C | 516 | 512,230 | ||||||||
Series 2016-LC25, Class C | 545 | 539,692 | ||||||||
Series 2016-NXS6, Class A4 | 900 | 893,183 | ||||||||
Series 2016-NXS6, Class C | 600 | 612,432 | ||||||||
| abfunds.com | AB INTERMEDIATE BOND PORTFOLIO | 29 |
PORTFOLIO OF INVESTMENTS (continued)
| Principal Amount (000) | U.S. $ Value | |||||||||||
| ||||||||||||
WF-RBS Commercial Mortgage Trust | U.S.$ | 8,157 | $ | 413,204 | ||||||||
Series 2013-C14, Class A5 | 655 | 677,547 | ||||||||||
Series 2014-C20, Class A2 | 546 | 552,783 | ||||||||||
|
| |||||||||||
| 28,612,650 | ||||||||||||
|
| |||||||||||
Non-Agency Floating Rate CMBS – 1.3% | ||||||||||||
BX Trust SLCT | 805 | 806,777 | ||||||||||
Credit Suisse Mortgage Trust | 450 | 454,215 | ||||||||||
Great Wolf Trust | 655 | 656,023 | ||||||||||
H/2 Asset Funding NRE | 334 | 334,295 | ||||||||||
JP Morgan Chase Commercial Mortgage Securities Trust | 728 | 731,213 | ||||||||||
Morgan Stanley Capital I Trust | 202 | 202,128 | ||||||||||
Series 2015-XLF2, Class SNMA | 229 | 227,253 | ||||||||||
Starwood Retail Property Trust | 1,179 | 1,179,283 | ||||||||||
|
| |||||||||||
| 4,591,187 | ||||||||||||
|
| |||||||||||
Agency CMBS – 0.0% | ||||||||||||
Government National Mortgage Association | 864 | 9 | ||||||||||
|
| |||||||||||
| 30 | AB INTERMEDIATE BOND PORTFOLIO | abfunds.com |
PORTFOLIO OF INVESTMENTS (continued)
| Principal Amount (000) | U.S. $ Value | |||||||||||
| ||||||||||||
Total Commercial Mortgage-Backed Securities | $ | 33,203,846 | ||||||||||
|
| |||||||||||
COLLATERALIZED MORTGAGE OBLIGATIONS – 7.3% | ||||||||||||
Risk Share Floating Rate – 4.5% | ||||||||||||
Bellemeade Re II Ltd. | U.S.$ | 256 | 262,101 | |||||||||
Bellemeade Re Ltd. | 550 | 550,000 | ||||||||||
Federal Home Loan Mortgage Corp. Structured Agency Credit Risk Debt Notes | 1,040 | 1,146,941 | ||||||||||
Series 2014-DN3, Class M3 | 838 | 901,407 | ||||||||||
Series 2014-DN4, Class M3 | 276 | 300,209 | ||||||||||
Series 2014-HQ3, Class M3 | 820 | 904,540 | ||||||||||
Series 2015-DNA1, Class M3 | 265 | 294,545 | ||||||||||
Series 2015-DNA2, Class M2 | 616 | 628,089 | ||||||||||
Series 2015-DNA3, Class M3 | 280 | 325,024 | ||||||||||
Series 2015-HQA1, Class M2 | 444 | 454,003 | ||||||||||
Series 2015-HQA2, Class M3 | 500 | 574,952 | ||||||||||
Series 2016-DNA1, Class M3 | 330 | 384,633 | ||||||||||
| abfunds.com | AB INTERMEDIATE BOND PORTFOLIO | 31 |
PORTFOLIO OF INVESTMENTS (continued)
| Principal Amount (000) | U.S. $ Value | |||||||||
| ||||||||||
Federal National Mortgage Association | U.S.$ | 10 | $ | 9,769 | ||||||
Series 2014-C04, Class 1M2 | 480 | 545,248 | ||||||||
Series 2014-C04, Class 2M2 | 160 | 179,887 | ||||||||
Series 2015-C01, Class 1M2 | 282 | 303,453 | ||||||||
Series 2015-C01, Class 2M2 | 362 | 386,799 | ||||||||
Series 2015-C02, Class 1M2 | 510 | 545,971 | ||||||||
Series 2015-C02, Class 2M2 | 358 | 378,729 | ||||||||
Series 2015-C03, Class 1M2 | 628 | 693,503 | ||||||||
Series 2015-C03, Class 2M2 | 634 | 693,072 | ||||||||
Series 2015-C04, Class 1M2 | 863 | 972,988 | ||||||||
Series 2015-C04, Class 2M2 | 620 | 686,495 | ||||||||
Series 2016-C01, Class 1M2 | 982 | 1,160,571 | ||||||||
Series 2016-C01, Class 2M2 | 478 | 564,707 | ||||||||
Series 2016-C02, Class 1M2 | 539 | 622,881 | ||||||||
Series 2016-C03, Class 2M2 | 881 | 1,010,448 | ||||||||
| 32 | AB INTERMEDIATE BOND PORTFOLIO | abfunds.com |
PORTFOLIO OF INVESTMENTS (continued)
| Principal Amount (000) | U.S. $ Value | |||||||||||
| ||||||||||||
JP Morgan Madison Avenue Securities Trust | U.S.$ | 97 | $ | 105,215 | ||||||||
Wells Fargo Credit Risk Transfer Securities Trust | 393 | 446,040 | ||||||||||
Series 2015-WF1, Class 2M2 | 104 | 123,975 | ||||||||||
|
| |||||||||||
| 16,156,195 | ||||||||||||
|
| |||||||||||
Agency Floating Rate – 1.4% | ||||||||||||
Federal Home Loan Mortgage Corp. | 1,711 | 361,477 | ||||||||||
Series 4719, Class JS | 1,986 | 375,220 | ||||||||||
Federal National Mortgage Association REMICs | 1,212 | 253,698 | ||||||||||
Series 2012-70, Class SA | 2,229 | 490,144 | ||||||||||
Series 2015-90, Class SL | 2,487 | 494,765 | ||||||||||
Series 2016-77, Class DS | 2,472 | 459,654 | ||||||||||
Series 2017-16, Class SG | 2,448 | 517,725 | ||||||||||
Series 2017-26, Class TS | 2,260 | 500,490 | ||||||||||
Series 2017-62, Class AS | 2,328 | 487,510 | ||||||||||
Series 2017-81, Class SA | 2,377 | 542,464 | ||||||||||
| abfunds.com | AB INTERMEDIATE BOND PORTFOLIO | 33 |
PORTFOLIO OF INVESTMENTS (continued)
| Principal Amount (000) | U.S. $ Value | |||||||||||
| ||||||||||||
Government National Mortgage Association | U.S.$ | 2,386 | $ | 509,308 | ||||||||
|
| |||||||||||
| 4,992,455 | ||||||||||||
|
| |||||||||||
Non-Agency Fixed Rate – 1.0% | ||||||||||||
Alternative Loan Trust | 197 | 178,392 | ||||||||||
Series 2006-23CB, Class 1A7 | 122 | 118,831 | ||||||||||
Series 2006-24CB, Class A16 | 357 | 300,998 | ||||||||||
Series 2006-28CB, Class A14 | 247 | 207,561 | ||||||||||
Series 2006-J1, Class 1A13 | 207 | 188,669 | ||||||||||
Citigroup Mortgage Loan Trust, Inc. | 363 | 366,200 | ||||||||||
Countrywide Home Loan Mortgage Pass-Through Trust | 105 | 91,422 | ||||||||||
Credit Suisse Mortgage Trust | 360 | 298,756 | ||||||||||
First Horizon Alternative Mortgage Securities Trust | 329 | 282,170 | ||||||||||
JP Morgan Alternative Loan Trust | 677 | 600,984 | ||||||||||
RBSSP Resecuritization Trust | 528 | 468,444 | ||||||||||
Series 2010-9, Class 7A6 | 456 | 371,611 | ||||||||||
Structured Asset Securities Corp. Mortgage Pass-Through Certificates | 452 | 417,941 | ||||||||||
|
| |||||||||||
| 3,891,979 | ||||||||||||
|
| |||||||||||
| 34 | AB INTERMEDIATE BOND PORTFOLIO | abfunds.com |
PORTFOLIO OF INVESTMENTS (continued)
| Principal Amount (000) | U.S. $ Value | |||||||||||
| ||||||||||||
Non-Agency Floating Rate – 0.4% | ||||||||||||
Deutsche Alt-A Securities Mortgage Loan Trust | U.S.$ | 755 | $ | 474,536 | ||||||||
HomeBanc Mortgage Trust | 277 | 247,365 | ||||||||||
Impac Secured Assets Corp. | 386 | 311,227 | ||||||||||
Residential Accredit Loans, Inc. Trust | 736 | 245,592 | ||||||||||
|
| |||||||||||
| 1,278,720 | ||||||||||||
|
| |||||||||||
Agency Fixed Rate – 0.0% | ||||||||||||
Federal National Mortgage Association Grantor Trust | 65 | 60,816 | ||||||||||
|
| |||||||||||
Total Collateralized Mortgage Obligations | 26,380,165 | |||||||||||
|
| |||||||||||
INFLATION-LINKED SECURITIES – 5.4% | ||||||||||||
Japan – 0.9% | ||||||||||||
Japanese Government CPI Linked Bond | JPY | 373,521 | 3,462,395 | |||||||||
|
| |||||||||||
United States – 4.5% | ||||||||||||
U.S. Treasury Inflation Index | U.S.$ | 5,807 | 5,820,432 | |||||||||
0.125%, 4/15/20 (TIPS) | 1,688 | 1,693,597 | ||||||||||
0.25%, 1/15/25 (TIPS) | 3,684 | 3,641,633 | ||||||||||
0.375%, 7/15/25 (TIPS) | 5,014 | 5,007,303 | ||||||||||
|
| |||||||||||
| 16,162,965 | ||||||||||||
|
| |||||||||||
Total Inflation-Linked Securities | 19,625,360 | |||||||||||
|
| |||||||||||
| abfunds.com | AB INTERMEDIATE BOND PORTFOLIO | 35 |
PORTFOLIO OF INVESTMENTS (continued)
| Principal Amount (000) | U.S. $ Value | |||||||||||
| ||||||||||||
CORPORATES – NON-INVESTMENT GRADE – 4.2% | ||||||||||||
Industrial – 2.8% | ||||||||||||
Basic – 0.2% | ||||||||||||
NOVA Chemicals Corp. | U.S.$ | 331 | $ | 341,390 | ||||||||
SPCM SA | 286 | 294,503 | ||||||||||
|
| |||||||||||
| 635,893 | ||||||||||||
|
| |||||||||||
Communications - Media – 0.1% | ||||||||||||
CSC Holdings LLC | 120 | 132,257 | ||||||||||
SFR Group SA | EUR | 222 | 270,468 | |||||||||
|
| |||||||||||
| 402,725 | ||||||||||||
|
| |||||||||||
Communications - Telecommunications – 0.8% | ||||||||||||
Arqiva Broadcast Finance PLC | GBP | 300 | 420,858 | |||||||||
CenturyLink, Inc. | U.S.$ | 243 | 258,119 | |||||||||
Sprint Capital Corp. | 970 | 1,021,488 | ||||||||||
Wind Acquisition Finance SA | 700 | 722,988 | ||||||||||
Windstream Services LLC | 750 | 546,510 | ||||||||||
|
| |||||||||||
| 2,969,963 | ||||||||||||
|
| |||||||||||
Consumer Cyclical - Automotive – 0.2% | ||||||||||||
Adient Global Holdings Ltd. | 379 | 389,351 | ||||||||||
Allison Transmission, Inc. | 216 | 225,240 | ||||||||||
|
| |||||||||||
| 614,591 | ||||||||||||
|
| |||||||||||
Consumer Cyclical - Other – 0.3% | ||||||||||||
International Game Technology PLC | 360 | 395,763 | ||||||||||
6.50%, 2/15/25(b) | 520 | 585,447 | ||||||||||
KB Home | 286 | 293,739 | ||||||||||
|
| |||||||||||
| 1,274,949 | ||||||||||||
|
| |||||||||||
Consumer Non-Cyclical – 0.2% | ||||||||||||
First Quality Finance Co., Inc. | 475 | 479,897 | ||||||||||
| 36 | AB INTERMEDIATE BOND PORTFOLIO | abfunds.com |
PORTFOLIO OF INVESTMENTS (continued)
| Principal Amount (000) | U.S. $ Value | |||||||||||
| ||||||||||||
Valeant Pharmaceuticals International, Inc. | U.S.$ | 375 | $ | 315,000 | ||||||||
|
| |||||||||||
| 794,897 | ||||||||||||
|
| |||||||||||
Energy – 0.6% | ||||||||||||
Cheniere Energy Partners LP | 346 | 356,197 | ||||||||||
Diamond Offshore Drilling, Inc. | 567 | 426,668 | ||||||||||
Energy Transfer Equity LP | 540 | 549,320 | ||||||||||
Nabors Industries, Inc. | 721 | 692,549 | ||||||||||
SM Energy Co. | 35 | 35,548 | ||||||||||
|
| |||||||||||
| 2,060,282 | ||||||||||||
|
| |||||||||||
Other Industrial – 0.3% | ||||||||||||
General Cable Corp. | 655 | 672,292 | ||||||||||
Global Partners LP/GLP Finance Corp. | 361 | 368,826 | ||||||||||
|
| |||||||||||
| 1,041,118 | ||||||||||||
|
| |||||||||||
Transportation - Services – 0.1% | ||||||||||||
Avis Budget Car Rental LLC/Avis Budget Finance, Inc. | 309 | 303,939 | ||||||||||
|
| |||||||||||
| 10,098,357 | ||||||||||||
|
| |||||||||||
Financial Institutions – 1.4% | ||||||||||||
Banking – 1.2% | ||||||||||||
Bank of America Corp. | 213 | 243,582 | ||||||||||
Barclays Bank PLC | 129 | 156,178 | ||||||||||
Credit Suisse Group AG | 363 | 422,405 | ||||||||||
Goldman Sachs Group, Inc. (The) | 477 | 476,914 | ||||||||||
Intesa Sanpaolo SpA | 369 | 378,000 | ||||||||||
Series E | EUR | 141 | 182,332 | |||||||||
Lloyds Banking Group PLC | U.S.$ | 402 | 462,006 | |||||||||
| abfunds.com | AB INTERMEDIATE BOND PORTFOLIO | 37 |
PORTFOLIO OF INVESTMENTS (continued)
| Principal Amount (000) | U.S. $ Value | |||||||||||
| ||||||||||||
Royal Bank of Scotland Group PLC | EUR | 50 | $ | 56,659 | ||||||||
8.625%, 8/15/21(c) | U.S.$ | 570 | 649,800 | |||||||||
Series U | 700 | 679,707 | ||||||||||
Standard Chartered PLC | 400 | 347,228 | ||||||||||
7.50%, 4/02/22(b)(c) | 363 | 398,193 | ||||||||||
|
| |||||||||||
| 4,453,004 | ||||||||||||
|
| |||||||||||
Finance – 0.2% | ||||||||||||
Navient Corp. | 440 | 471,333 | ||||||||||
7.25%, 1/25/22 | 99 | 107,975 | ||||||||||
|
| |||||||||||
| 579,308 | ||||||||||||
|
| |||||||||||
| 5,032,312 | ||||||||||||
|
| |||||||||||
Total Corporates – Non-Investment Grade | 15,130,669 | |||||||||||
|
| |||||||||||
EMERGING MARKETS – TREASURIES – 0.8% |
| |||||||||||
Brazil – 0.6% | ||||||||||||
Brazil Notas do Tesouro Nacional | BRL | 7,235 | 2,241,950 | |||||||||
|
| |||||||||||
Turkey – 0.2% | ||||||||||||
Turkey Government Bond | TRY | 2,960 | 757,059 | |||||||||
|
| |||||||||||
Total Emerging Markets – Treasuries | 2,999,009 | |||||||||||
|
| |||||||||||
EMERGING MARKETS – CORPORATE BONDS – 0.6% | ||||||||||||
Industrial – 0.6% | ||||||||||||
Capital Goods – 0.1% | ||||||||||||
Odebrecht Finance Ltd. | U.S.$ | 541 | 200,170 | |||||||||
7.125%, 6/26/42(b) | 394 | 147,750 | ||||||||||
|
| |||||||||||
| 347,920 | ||||||||||||
|
| |||||||||||
Communications - Telecommunications – 0.1% | ||||||||||||
MTN Mauritius Investment Ltd. | 377 | 387,839 | ||||||||||
|
| |||||||||||
| 38 | AB INTERMEDIATE BOND PORTFOLIO | abfunds.com |
PORTFOLIO OF INVESTMENTS (continued)
| Principal Amount (000) | U.S. $ Value | |||||||||||
| ||||||||||||
Consumer Non-Cyclical – 0.2% | ||||||||||||
Marfrig Holdings Europe BV | U.S.$ | 350 | $ | 365,181 | ||||||||
Minerva Luxembourg SA | 233 | 241,621 | ||||||||||
Virgolino de Oliveira Finance SA | 660 | 33,825 | ||||||||||
|
| |||||||||||
| 640,627 | ||||||||||||
|
| |||||||||||
Energy – 0.2% | ||||||||||||
Petrobras Global Finance BV | 192 | 207,552 | ||||||||||
6.25%, 3/17/24 | 256 | 274,777 | ||||||||||
Ultrapar International SA | 379 | 389,186 | ||||||||||
| �� |
|
| ||||||||||
| 871,515 | ||||||||||||
|
| |||||||||||
Total Emerging Markets – Corporate Bonds | 2,247,901 | |||||||||||
|
| |||||||||||
LOCAL GOVERNMENTS – US MUNICIPAL BONDS – 0.4% | ||||||||||||
United States – 0.4% | ||||||||||||
State of California | 970 | 1,492,093 | ||||||||||
|
| |||||||||||
QUASI-SOVEREIGNS – 0.4% | ||||||||||||
Quasi-Sovereign Bonds – 0.4% | ||||||||||||
Chile – 0.1% | ||||||||||||
Corp. Nacional del Cobre de Chile | 313 | 314,959 | ||||||||||
|
| |||||||||||
Mexico – 0.3% | ||||||||||||
Petroleos Mexicanos | 756 | 773,388 | ||||||||||
6.50%, 3/13/27(b) | 335 | 365,368 | ||||||||||
|
| |||||||||||
| 1,138,756 | ||||||||||||
|
| |||||||||||
Total Quasi-Sovereigns | 1,453,715 | |||||||||||
|
| |||||||||||
| Shares | ||||||||||||
COMMON STOCKS – 0.2% | ||||||||||||
Financials – 0.2% | ||||||||||||
Insurance – 0.2% | ||||||||||||
Mt Logan Re Ltd. (Preference Shares)(e)(l)(m) | 439 | 457,753 | ||||||||||
Mt Logan Re Ltd. (Preference Shares)(e)(l)(m) | 187 | 194,988 | ||||||||||
|
| |||||||||||
Total Common Stocks | 652,741 | |||||||||||
|
| |||||||||||
| abfunds.com | AB INTERMEDIATE BOND PORTFOLIO | 39 |
PORTFOLIO OF INVESTMENTS (continued)
| Principal Amount (000) | U.S. $ Value | |||||||||||
| ||||||||||||
GOVERNMENTS – SOVEREIGN BONDS – 0.2% | ||||||||||||
Mexico – 0.2% | ||||||||||||
Mexico Government International Bond | U.S.$ | 551 | $ | 574,142 | ||||||||
|
| |||||||||||
EMERGING MARKETS – SOVEREIGNS – 0.1% | ||||||||||||
Egypt – 0.1% | ||||||||||||
Egypt Government International Bond | 235 | 245,281 | ||||||||||
|
| |||||||||||
SHORT-TERM INVESTMENTS – 17.2% | ||||||||||||
Agency Discount Note – 7.7% | ||||||||||||
Federal Home Loan Bank Discount Notes | 27,755 | 27,693,417 | ||||||||||
|
| |||||||||||
Governments – Treasuries – 6.6% | ||||||||||||
Japan – 6.6% | ||||||||||||
Japan Treasury Discount Bill | JPY | 2,709,000 | 23,827,853 | |||||||||
|
| |||||||||||
Commercial Paper – 1.5% | ||||||||||||
Mizuho Bank Ltd. | U.S.$ | 5,410 | 5,394,092 | |||||||||
|
| |||||||||||
U.S. Treasury Bills – 1.2% | ||||||||||||
U.S. Treasury Bill | 4,200 | 4,192,190 | ||||||||||
|
| |||||||||||
| Shares | ||||||||||||
Investment Companies – 0.2% | ||||||||||||
AB Fixed Income Shares, Inc. – Government Money Market Portfolio – Class AB, 0.85%(n)(o)(p) | 616,692 | 616,692 | ||||||||||
|
| |||||||||||
Total Short-Term Investments | 61,724,244 | |||||||||||
|
| |||||||||||
Total Investments – 112.7% | 406,020,429 | |||||||||||
Other assets less liabilities – (12.7)% | (45,901,678 | ) | ||||||||||
|
| |||||||||||
Net Assets – 100.0% | $ | 360,118,751 | ||||||||||
|
| |||||||||||
| 40 | AB INTERMEDIATE BOND PORTFOLIO | abfunds.com |
PORTFOLIO OF INVESTMENTS (continued)
FUTURES (see Note D)
| Description | Number of Contracts | Expiration Month | Notional (000) | Original Value | Value at October 31, 2017 | Unrealized Appreciation/ (Depreciation) | ||||||||||||||||||
Purchased Contracts |
| |||||||||||||||||||||||
U.S. T-Note 5 Yr (CBT) Futures | 579 | December 2017 | USD | 57,900 | $ | 68,408,946 | $ | 67,851,562 | $ | (557,384 | ) | |||||||||||||
U.S. Ultra Bond (CBT) Futures | 70 | December 2017 | USD | 7,000 | 11,683,807 | 11,534,688 | (149,119 | ) | ||||||||||||||||
Sold Contracts |
| |||||||||||||||||||||||
10 Yr Japan Bond (OSE) Futures | 3 | December 2017 | JPY | 300,000 | 3,985,823 | 3,970,010 | 15,813 | |||||||||||||||||
Euro-BOBL Futures | 178 | December 2017 | EUR | 17,800 | 27,298,785 | 27,323,688 | (24,903 | ) | ||||||||||||||||
U.S. T-Note 2 Yr (CBT) Futures | 230 | December 2017 | USD | 46,000 | 49,755,188 | 49,532,656 | 222,532 | |||||||||||||||||
U.S. T-Note 10 Yr (CBT) Futures | 199 | December 2017 | USD | 19,900 | 25,146,962 | 24,862,563 | 284,399 | |||||||||||||||||
|
| |||||||||||||||||||||||
| $ | (208,662 | ) | ||||||||||||||||||||||
|
| |||||||||||||||||||||||
FORWARD CURRENCY EXCHANGE CONTRACTS (see Note D)
| Counterparty | Contracts to Deliver (000) | In Exchange For (000) | Settlement Date | Unrealized Appreciation/ (Depreciation) | ||||||||||||
Bank of America, NA | RUB | 19,664 | USD | 337 | 11/22/17 | $ | 1,485 | |||||||||
Barclays Bank PLC | USD | 512 | TRY | 1,896 | 12/14/17 | (18,715 | ) | |||||||||
BNP Paribas SA | NZD | 1,034 | AUD | 950 | 11/30/17 | 20,129 | ||||||||||
BNP Paribas SA | GBP | 969 | USD | 1,313 | 12/01/17 | 24,936 | ||||||||||
Citibank, NA | CAD | 4,210 | USD | 3,360 | 11/10/17 | 96,614 | ||||||||||
Citibank, NA | USD | 1,443 | RUB | 83,343 | 11/22/17 | (20,467 | ) | |||||||||
Citibank, NA | USD | 1,413 | MXN | 26,010 | 12/08/17 | (64,252 | ) | |||||||||
Credit Suisse International | GBP | 676 | USD | 893 | 12/01/17 | (5,277 | ) | |||||||||
Credit Suisse International | SEK | 5,688 | USD | 704 | 12/13/17 | 22,709 | ||||||||||
Deutsche Bank AG | BRL | 4,205 | USD | 1,283 | 11/03/17 | (2,197 | ) | |||||||||
Deutsche Bank AG | USD | 1,284 | BRL | 4,205 | 11/03/17 | 1,060 | ||||||||||
Deutsche Bank AG | BRL | 4,205 | USD | 1,279 | 12/04/17 | (837 | ) | |||||||||
Goldman Sachs Bank USA | TWD | 38,223 | USD | 1,262 | 11/22/17 | (7,751 | ) | |||||||||
Goldman Sachs Bank USA | AUD | 2,121 | USD | 1,691 | 11/30/17 | 67,478 | ||||||||||
JPMorgan Chase Bank, NA | USD | 1,273 | TWD | 38,196 | 11/22/17 | (3,968 | ) | |||||||||
| abfunds.com | AB INTERMEDIATE BOND PORTFOLIO | 41 |
PORTFOLIO OF INVESTMENTS (continued)
| Counterparty | Contracts to Deliver (000) | In Exchange For (000) | Settlement Date | Unrealized Appreciation/ (Depreciation) | ||||||||||||
Morgan Stanley & Co., Inc. | USD | 944 | GBP | 694 | 12/01/17 | $ | (21,679 | ) | ||||||||
Royal Bank of Scotland PLC | USD | 959 | CAD | 1,173 | 11/10/17 | (50,203 | ) | |||||||||
Royal Bank of Scotland PLC | USD | 718 | AUD | 918 | 11/30/17 | (15,331 | ) | |||||||||
Royal Bank of Scotland PLC | JPY | 116,302 | USD | 1,026 | 12/05/17 | 2,125 | ||||||||||
Royal Bank of Scotland PLC | USD | 748 | NOK | 5,835 | 12/13/17 | (32,681 | ) | |||||||||
Royal Bank of Scotland PLC | EUR | 1,557 | USD | 1,835 | 12/15/17 | 16,857 | ||||||||||
Royal Bank of Scotland PLC | JPY | 3,160,000 | USD | 27,879 | 1/25/18 | (33,330 | ) | |||||||||
Standard Chartered Bank | BRL | 4,205 | USD | 1,312 | 11/03/17 | 26,979 | ||||||||||
Standard Chartered Bank | USD | 1,283 | BRL | 4,205 | 11/03/17 | 2,197 | ||||||||||
State Street Bank & Trust Co. | NZD | 120 | USD | 87 | 11/30/17 | 4,957 | ||||||||||
State Street Bank & Trust Co. | USD | 702 | SEK | 5,601 | 12/13/17 | (30,810 | ) | |||||||||
State Street Bank & Trust Co. | USD | 299 | EUR | 253 | 12/15/17 | (3,049 | ) | |||||||||
State Street Bank & Trust Co. | KRW | 1,494,072 | USD | 1,320 | 1/18/18 | (17,290 | ) | |||||||||
|
| |||||||||||||||
| $ | (40,311 | ) | ||||||||||||||
|
| |||||||||||||||
CENTRALLY CLEARED INTEREST RATE SWAPS (see Note D)
| Rate Type | ||||||||||||||||
Notional | Termination Date | Payments made by the Fund | Payments received by the Fund | Payment Frequency Paid/Received | Unrealized Appreciation/ (Depreciation) | |||||||||||
SEK | 30,420 | 3/31/22 | 3 Month STIBOR | 0.341% | Quarterly/ Quarterly | $ | 23,065 | |||||||||
USD | 2,300 | 2/14/24 | 2.889% | 3 Month LIBOR | Semi- Annual/ Quarterly | (103,437 | ) | |||||||||
MXN | 14,267 | 6/22/20 | 4 Week TIIE | 6.770% | Monthly/ Monthly | (9,552 | ) | |||||||||
NZD | 6,235 | 3/31/22 | 3 Month BKBM | 2.936% | Quarterly/ Semi- Annual | 75,270 | ||||||||||
USD | 2,630 | 1/14/24 | 2.980% | 3 Month LIBOR | Semi- Annual/ Quarterly | (145,128 | ) | |||||||||
USD | 3,600 | 11/10/25 | 2.256% | 3 Month LIBOR | Semi- Annual/ Quarterly | (20,275 | ) | |||||||||
| 42 | AB INTERMEDIATE BOND PORTFOLIO | abfunds.com |
PORTFOLIO OF INVESTMENTS (continued)
| Rate Type | ||||||||||||||||||||
Notional | Termination Date | Payments made by the Fund | Payments received by the Fund | Payment Frequency Paid/Received | Unrealized Appreciation/ (Depreciation) | |||||||||||||||
USD | 456 | 6/28/26 | 1.460% | 3 Month LIBOR | | Semi- Annual/ Quarterly | $ | 29,309 | ||||||||||||
MXN | 5,198 | 6/14/27 | 7.090% | 4 Week TIIE | | Monthly/ Monthly | | 6,748 | ||||||||||||
USD | 1,670 | 7/12/27 | 2.355% | 3 Month LIBOR | | Semi- Annual/ Quarterly | (9,490 | ) | ||||||||||||
USD | 985 | 11/08/26 | 1.657% | 3 Month LIBOR | | Semi- Annual/ Quarterly | 47,902 | |||||||||||||
USD | 1,240 | 11/09/26 | 1.672% | 3 Month LIBOR | | Semi- Annual/ Quarterly | 58,746 | |||||||||||||
|
| |||||||||||||||||||
| $ | (46,842 | ) | ||||||||||||||||||
|
| |||||||||||||||||||
CREDIT DEFAULT SWAPS (see Note D)
| Swap Counterparty & Referenced Obligation | Fixed Rate (Pay) Receive | Payment Frequency | Implied Credit Spread at October 31, 2017 | Notional Amount (000) | Market Value | Upfront Premiums Paid (Received) | Unrealized Appreciation/ (Depreciation) | |||||||||||||||||||||
Buy Contracts | ||||||||||||||||||||||||||||
Citibank, NA | ||||||||||||||||||||||||||||
Sprint Communications, Inc., | (5.00 | )% | Quarterly | 0.49 | % | USD | 452 | $ | (34,976 | ) | $ | (9,071 | ) | $ | (25,905 | ) | ||||||||||||
Sprint Communications, Inc., | (5.00 | ) | Quarterly | 0.49 | USD | 518 | (40,083 | ) | (10,779 | ) | (29,304 | ) | ||||||||||||||||
Citigroup Global Markets, Inc. | ||||||||||||||||||||||||||||
CDX- | (0.50 | ) | Monthly | 0.48 | USD | 57 | (68 | ) | 732 | (800 | ) | |||||||||||||||||
Credit Suisse International | ||||||||||||||||||||||||||||
CDX-CMBX. | (0.50 | ) | Monthly | 0.48 | USD | 2,085 | (2,496 | ) | 26,600 | (29,096 | ) | |||||||||||||||||
| abfunds.com | AB INTERMEDIATE BOND PORTFOLIO | 43 |
PORTFOLIO OF INVESTMENTS (continued)
| Swap Counterparty & Referenced Obligation | Fixed Rate (Pay) Receive | Payment Frequency | Implied Credit Spread at October 31, 2017 | Notional Amount (000) | Market Value | Upfront Premiums Paid (Received) | Unrealized Appreciation/ (Depreciation) | |||||||||||||||||||||
CDX-CMBX. | (0.50 | )% | Monthly | 0.48 | % | USD | 20 | $ | (24 | ) | $ | 186 | $ | (210 | ) | |||||||||||||
CDX-CMBX. | (3.00 | ) | Monthly | 5.40 | USD | 2,150 | 249,650 | 141,249 | 108,401 | |||||||||||||||||||
Deutsche Bank AG | ||||||||||||||||||||||||||||
CDX-CMBX. | (0.50 | ) | Monthly | 0.48 | USD | 695 | (832 | ) | 9,560 | (10,392 | ) | |||||||||||||||||
CDX-CMBX. | (0.50 | ) | Monthly | 0.48 | USD | 2,592 | (3,103 | ) | 27,972 | (31,075 | ) | |||||||||||||||||
CDX-CMBX. | (0.50 | ) | Monthly | 0.48 | USD | 777 | (931 | ) | 8,313 | (9,244 | ) | |||||||||||||||||
Goldman Sachs International | ||||||||||||||||||||||||||||
CDX-CMBX. | (0.50 | ) | Monthly | 0.48 | USD | 762 | (913 | ) | 10,395 | (11,308 | ) | |||||||||||||||||
CDX-CMBX. | (0.50 | ) | Monthly | 0.48 | USD | 169 | (202 | ) | 1,634 | (1,836 | ) | |||||||||||||||||
Sale Contracts |
| |||||||||||||||||||||||||||
Citigroup Global Markets, Inc. | ||||||||||||||||||||||||||||
CDX-CMBX. | 3.00 | Monthly | 7.25 | USD | 201 | (33,510 | ) | (27,974 | ) | (5,536 | ) | |||||||||||||||||
CDX-CMBX. | 3.00 | Monthly | 7.25 | USD | 85 | (14,171 | ) | (12,111 | ) | (2,060 | ) | |||||||||||||||||
| 44 | AB INTERMEDIATE BOND PORTFOLIO | abfunds.com |
PORTFOLIO OF INVESTMENTS (continued)
| Swap Counterparty & Referenced Obligation | Fixed Rate (Pay) Receive | Payment Frequency | Implied Credit Spread at October 31, 2017 | Notional Amount (000) | Market Value | Upfront Premiums Paid (Received) | Unrealized Appreciation/ (Depreciation) | |||||||||||||||||||
CDX-CMBX. | 3.00 | % | Monthly | 7.25 | % | USD | 297 | $ | (49,515 | ) | $ | (47,847 | ) | $ | (1,668 | ) | ||||||||||
Credit Suisse International | ||||||||||||||||||||||||||
CDX-CMBX. | 3.00 | Monthly | 7.25 | USD | 509 | (84,858 | ) | (34,554 | ) | (50,304 | ) | |||||||||||||||
CDX-CMBX. | 3.00 | Monthly | 7.25 | USD | 155 | (25,841 | ) | (11,246 | ) | (14,595 | ) | |||||||||||||||
CDX-CMBX. | 3.00 | Monthly | 7.25 | USD | 1,882 | (313,729 | ) | (80,740 | ) | (232,989 | ) | |||||||||||||||
CDX-CMBX. | 3.00 | Monthly | 7.25 | USD | 2,150 | (358,441 | ) | (130,573 | ) | (227,868 | ) | |||||||||||||||
Deutsche Bank AG | ||||||||||||||||||||||||||
CDX-CMBX. | 2.00 | Monthly | 3.31 | USD | 850 | (50,415 | ) | (17,449 | ) | (32,966 | ) | |||||||||||||||
CDX-CMBX. | 3.00 | Monthly | 7.25 | USD | 745 | (124,204 | ) | (54,793 | ) | (69,411 | ) | |||||||||||||||
CDX-CMBX. | 3.00 | Monthly | 7.25 | USD | 46 | (7,669 | ) | (2,771 | ) | (4,898 | ) | |||||||||||||||
CDX-CMBX. | 3.00 | Monthly | 7.25 | USD | 179 | (29,842 | ) | (21,486 | ) | (8,356 | ) | |||||||||||||||
CDX-CMBX. | 3.00 | Monthly | 7.25 | USD | 181 | (30,176 | ) | (21,718 | ) | (8,458 | ) | |||||||||||||||
CDX-CMBX. | 3.00 | Monthly | 7.25 | USD | 531 | (88,526 | ) | (45,834 | ) | (42,692 | ) | |||||||||||||||
| abfunds.com | AB INTERMEDIATE BOND PORTFOLIO | 45 |
PORTFOLIO OF INVESTMENTS (continued)
| Swap Counterparty & Referenced Obligation | Fixed Rate (Pay) Receive | Payment Frequency | Implied Credit Spread at October 31, 2017 | Notional Amount (000) | Market Value | Upfront Premiums Paid (Received) | Unrealized Appreciation/ (Depreciation) | |||||||||||||||||||
CDX-CMBX. | 3.00 | % | Monthly | 7.25 | % | USD | 530 | $ | (88,360 | ) | $ | (59,918 | ) | $ | (28,442 | ) | ||||||||||
CDX-CMBX. | 3.00 | Monthly | 7.25 | USD | 52 | (8,670 | ) | (6,397 | ) | (2,273 | ) | |||||||||||||||
CDX-CMBX. | 3.00 | Monthly | 7.25 | USD | 322 | (53,683 | ) | (42,580 | ) | (11,103 | ) | |||||||||||||||
Goldman Sachs International | ||||||||||||||||||||||||||
CDX-CMBX. | 3.00 | Monthly | 7.25 | USD | 325 | (54,183 | ) | (52,427 | ) | (1,756 | ) | |||||||||||||||
CDX-CMBX. | 3.00 | Monthly | 7.25 | USD | 1,469 | (244,907 | ) | (75,391 | ) | (169,516 | ) | |||||||||||||||
CDX-CMBX. | 3.00 | Monthly | 7.25 | USD | 760 | (126,705 | ) | (63,493 | ) | (63,212 | ) | |||||||||||||||
CDX-CMBX. | 3.00 | Monthly | 7.25 | USD | 1,125 | (187,556 | ) | (90,253 | ) | (97,303 | ) | |||||||||||||||
CDX-CMBX. | 3.00 | Monthly | 7.25 | USD | 260 | (43,346 | ) | (37,133 | ) | (6,213 | ) | |||||||||||||||
CDX-CMBX. | 3.00 | Monthly | 7.25 | USD | 311 | (51,848 | ) | (28,201 | ) | (23,647 | ) | |||||||||||||||
CDX-CMBX. | 3.00 | Monthly | 7.25 | USD | 26 | (4,335 | ) | (2,445 | ) | (1,890 | ) | |||||||||||||||
CDX-CMBX. | 3.00 | Monthly | 7.25 | USD | 52 | (8,669 | ) | (4,981 | ) | (3,688 | ) | |||||||||||||||
| 46 | AB INTERMEDIATE BOND PORTFOLIO | abfunds.com |
PORTFOLIO OF INVESTMENTS (continued)
| Swap Counterparty & Referenced Obligation | Fixed Rate (Pay) Receive | Payment Frequency | Implied Credit Spread at October 31, 2017 | Notional Amount (000) | Market Value | Upfront Premiums Paid (Received) | Unrealized Appreciation/ (Depreciation) | |||||||||||||||||||||
CDX-CMBX. | 3.00 | % | Monthly | 7.25 | % | USD | 52 | $ | (8,669 | ) | $ | (5,390 | ) | $ | (3,279 | ) | ||||||||||||
CDX-CMBX. | 3.00 | Monthly | 7.25 | USD | 219 | (36,511 | ) | (15,236 | ) | (21,275 | ) | |||||||||||||||||
CDX-CMBX. | 3.00 | Monthly | 7.25 | USD | 574 | (95,695 | ) | (79,860 | ) | (15,835 | ) | |||||||||||||||||
CDX-CMBX. | 3.00 | Monthly | 7.25 | USD | 356 | (59,351 | ) | (39,802 | ) | (19,549 | ) | |||||||||||||||||
CDX-CMBX. | 3.00 | Monthly | 7.25 | USD | 104 | (17,338 | ) | (11,782 | ) | (5,556 | ) | |||||||||||||||||
|
|
|
|
|
| |||||||||||||||||||||||
| $ | (2,134,701 | ) | $ | (917,594 | ) | $ | (1,217,107 | ) | ||||||||||||||||||||
|
|
|
|
|
| |||||||||||||||||||||||
| * | Termination date |
| ** | Principal amount less than 500. |
| (a) | Floating Rate Security. Stated interest/floor rate was in effect at October 31, 2017. |
| (b) | Security is exempt from registration under Rule 144A of the Securities Act of 1933. These securities are considered restricted, but liquid and may be resold in transactions exempt from registration, normally to qualified institutional buyers. At October 31, 2017, the aggregate market value of these securities amounted to $68,924,846 or 19.1% of net assets. |
| (c) | Securities are perpetual and, thus, do not have a predetermined maturity date. The date shown, if applicable, reflects the next call date. |
| (d) | Position, or a portion thereof, has been segregated to collateralize OTC derivatives outstanding. |
| (e) | Security in which significant unobservable inputs (Level 3) were used in determining fair value. |
| (f) | Variable rate coupon, rate shown as of October 31, 2017. |
| (g) | Security is exempt from registration under Rule 144A of the Securities Act of 1933. These securities, which represent 0.36% of net assets as of October 31, 2017, are considered illiquid and restricted. Additional information regarding such securities follows: |
| abfunds.com | AB INTERMEDIATE BOND PORTFOLIO | 47 |
PORTFOLIO OF INVESTMENTS (continued)
| 144A/Restricted & Illiquid Securities | Acquisition Date | Cost | Market Value | Percentage of Net Assets | ||||||||||||
Bellemeade Re II Ltd. | 4/29/16 | $ | 255,605 | $ | 262,101 | 0.07 | % | |||||||||
H/2 Asset Funding NRE | 6/19/15 | 334,295 | 334,295 | 0.09 | % | |||||||||||
JP Morgan Madison Avenue Securities Trust | 11/06/15 | 95,432 | 105,215 | 0.03 | % | |||||||||||
Prudential Securities Secured Financing Corp. | 11/02/07 | 7 | 5 | 0.00 | % | |||||||||||
Virgolino de Oliveira Finance SA | 1/24/14 | 365,927 | 33,825 | 0.01 | % | |||||||||||
Wells Fargo Credit Risk Transfer Securities Trust | 9/28/15 | 393,013 | 446,040 | 0.13 | % | |||||||||||
Wells Fargo Credit Risk Transfer Securities Trust | 9/28/15 | 104,273 | 123,975 | 0.03 | % | |||||||||||
| (h) | IO – Interest Only. |
| (i) | Inverse interest only security. |
| (j) | Non-income producing security. |
| (k) | Defaulted. |
| (l) | The security is subject to a 12 month lock-up period, after which semi-annual redemptions are permitted. |
| (m) | Restricted and illiquid security. |
| Restricted & Illiquid Securities | Acquisition Date | Cost | Market Value | Percentage of Net Assets | ||||||||||||
Mt Logan Re Ltd. | 1/02/14 | $ | 439,000 | $ | 457,753 | 0.13 | % | |||||||||
Mt Logan Re Ltd. | 12/30/14 | 187,000 | 194,988 | 0.05 | % | |||||||||||
| (n) | Affiliated investments. |
| (o) | To obtain a copy of the fund’s shareholder report, please go to the Securities and Exchange Commission’s website at www.sec.gov, or call AB at (800) 227-4618. |
| (p) | The rate shown represents the 7-day yield as of period end. |
| 48 | AB INTERMEDIATE BOND PORTFOLIO | abfunds.com |
PORTFOLIO OF INVESTMENTS (continued)
Currency Abbreviations:
AUD – Australian Dollar
BRL – Brazilian Real
CAD – Canadian Dollar
EUR – Euro
GBP – Great British Pound
JPY – Japanese Yen
KRW – South Korean Won
MXN – Mexican Peso
NOK – Norwegian Krone
NZD – New Zealand Dollar
RUB – Russian Ruble
SEK – Swedish Krona
TRY – Turkish Lira
TWD – New Taiwan Dollar
USD – United States Dollar
Glossary:
ABS – Asset-Backed Securities
ARMs – Adjustable Rate Mortgages
BKBM – Bank Bill Benchmark (New Zealand)
BOBL – Bundesobligationen
CBT – Chicago Board of Trade
CDX-CMBX.NA – North American Commercial Mortgage-Backed Index
CMBS – Commercial Mortgage-Backed Securities
EURIBOR – Euro Interbank Offered Rate
LIBOR – London Interbank Offered Rates
OSE – Osaka Securities Exchange
REIT – Real Estate Investment Trust
REMICs – Real Estate Mortgage Investment Conduits
STIBOR – Stockholm Interbank Offered Rate
TBA – To Be Announced
TIIE – Banco de México Equilibrium Interbank Interest Rate
TIPS – Treasury Inflation Protected Security
See notes to financial statements.
| abfunds.com | AB INTERMEDIATE BOND PORTFOLIO | 49 |
STATEMENT OF ASSETS & LIABILITIES
October 31, 2017
| Assets | ||||
Investments in securities, at value | ||||
Unaffiliated issuers (cost $403,014,150) | $ | 405,403,737 | ||
Affiliated issuers (cost $616,692) | 616,692 | |||
Cash collateral due from broker | 990,748 | |||
Foreign currencies, at value (cost $272,222) | 282,266 | |||
Receivable for investment securities sold | 2,870,055 | |||
Interest receivable | 1,773,695 | |||
Receivable for capital stock sold | 304,616 | |||
Unrealized appreciation on forward currency exchange contracts | 287,526 | |||
Upfront premiums paid on credit default swaps | 226,641 | |||
Unrealized appreciation on credit default swaps | 108,401 | |||
Receivable for variation margin on futures | 14,782 | |||
Receivable for variation margin on exchange traded swaps | 9,040 | |||
Affiliated dividends receivable | 2,122 | |||
|
| |||
Total assets | 412,890,321 | |||
|
| |||
| Liabilities | ||||
Payable for investment securities purchased | 48,693,283 | |||
Unrealized depreciation on credit default swaps | 1,325,508 | |||
Upfront premiums received on credit default swaps | 1,144,235 | |||
Payable for capital stock redeemed | 574,961 | |||
Unrealized depreciation on forward currency exchange contracts | 327,837 | |||
Dividends payable | 153,595 | |||
Distribution fee payable | 65,492 | |||
Advisory fee payable | 57,870 | |||
Transfer Agent fee payable | 40,800 | |||
Administrative fee payable | 23,273 | |||
Directors’ fees payable | 2,485 | |||
Accrued expenses | 362,231 | |||
|
| |||
Total liabilities | 52,771,570 | |||
|
| |||
Net Assets | $ | 360,118,751 | ||
|
| |||
| Composition of Net Assets | ||||
Capital stock, at par | $ | 32,421 | ||
Additional paid-in capital | 360,076,939 | |||
Undistributed net investment income | 792,734 | |||
Accumulated net realized loss on investment and foreign currency transactions | (1,650,539 | ) | ||
Net unrealized appreciation on investments and foreign currency denominated assets and liabilities | 867,196 | |||
|
| |||
| $ | 360,118,751 | |||
|
| |||
See notes to financial statements.
| 50 | AB INTERMEDIATE BOND PORTFOLIO | abfunds.com |
STATEMENT OF ASSETS & LIABILITIES (continued)
Net Asset Value Per Share—27 billion shares of capital stock authorized, $.001 par value
| Class | Net Assets | Shares Outstanding | Net Asset Value | |||||||||
| ||||||||||||
| A | $ | 240,386,485 | 21,644,894 | $ | 11.11 | * | ||||||
| ||||||||||||
| B | $ | 742,772 | 66,864 | $ | 11.11 | |||||||
| ||||||||||||
| C | $ | 15,676,273 | 1,414,651 | $ | 11.08 | |||||||
| ||||||||||||
| Advisor | $ | 67,356,640 | 6,062,204 | $ | 11.11 | |||||||
| ||||||||||||
| R | $ | 2,699,343 | 243,113 | $ | 11.10 | |||||||
| ||||||||||||
| K | $ | 5,875,661 | 528,631 | $ | 11.11 | |||||||
| ||||||||||||
| I | $ | 2,728,609 | 245,338 | $ | 11.12 | |||||||
| ||||||||||||
| Z | $ | 24,652,968 | 2,214,924 | $ | 11.13 | |||||||
| ||||||||||||
| * | The maximum offering price per share for Class A shares was $11.60 which reflects a sales charge of 4.25%. |
See notes to financial statements.
| abfunds.com | AB INTERMEDIATE BOND PORTFOLIO | 51 |
STATEMENT OF OPERATIONS
Year Ended October 31, 2017
| Investment Income | ||||||||
Interest | $ | 10,441,566 | ||||||
Dividends | ||||||||
Unaffiliated issuers | 46,638 | |||||||
Affiliated issuers | 25,016 | |||||||
Other income(a) | 64,035 | $ | 10,577,255 | |||||
|
| |||||||
| Expenses | ||||||||
Advisory fee (see Note B) | 1,615,767 | |||||||
Distribution fee—Class A | 596,062 | |||||||
Distribution fee—Class B | 8,783 | |||||||
Distribution fee—Class C | 283,598 | |||||||
Distribution fee—Class R | 13,933 | |||||||
Distribution fee—Class K | 13,019 | |||||||
Transfer agency—Class A | 327,273 | |||||||
Transfer agency—Class B | 1,490 | |||||||
Transfer agency—Class C | 41,206 | |||||||
Transfer agency—Advisor Class | 83,887 | |||||||
Transfer agency—Class R | 7,067 | |||||||
Transfer agency—Class K | 10,416 | |||||||
Transfer agency—Class I | 3,011 | |||||||
Transfer agency—Class Z | 3,825 | |||||||
Custodian | 218,049 | |||||||
Registration fees | 125,976 | |||||||
Audit and tax | 95,993 | |||||||
Printing | 79,904 | |||||||
Administrative | 63,860 | |||||||
Legal | 36,625 | |||||||
Directors’ fees | 28,135 | |||||||
Miscellaneous | 34,644 | |||||||
|
| |||||||
Total expenses | 3,692,523 | |||||||
Less: expenses waived and reimbursed by the Adviser (see Note B) | (845,137 | ) | ||||||
|
| |||||||
Net expenses | 2,847,386 | |||||||
|
| |||||||
Net investment income | $ | 7,729,869 | ||||||
|
|
See notes to financial statements.
| 52 | AB INTERMEDIATE BOND PORTFOLIO | abfunds.com |
STATEMENT OF OPERATIONS (continued)
| Realized and Unrealized Gain (Loss) on Investment and Foreign Currency Transactions | ||||||||
Net realized gain (loss) on: | ||||||||
Investment transactions | $ | (283,578 | ) | |||||
Forward currency exchange contracts | 846,245 | |||||||
Futures | (2,033,007 | ) | ||||||
Swaps | 378,182 | |||||||
Swaptions written | 45,037 | |||||||
Foreign currency transactions | (665,922 | ) | ||||||
Net change in unrealized appreciation/depreciation of: | ||||||||
Investments | (612,185 | ) | ||||||
Forward currency exchange contracts | (236,348 | ) | ||||||
Futures | 687,223 | |||||||
Swaps | (222,465 | ) | ||||||
Swaptions written | (4,561 | ) | ||||||
Foreign currency denominated assets and liabilities | (14,877 | ) | ||||||
|
| |||||||
Net loss on investment and foreign currency transactions | (2,116,256 | ) | ||||||
|
| |||||||
Contributions from Affiliates (see Note B) | 848 | |||||||
|
| |||||||
Net Increase in Net Assets from Operations | $ | 5,614,461 | ||||||
|
|
| (a) | Other income includes a refund for overbilling of prior years’ custody out-of-pocket fees. |
See notes to financial statements.
| abfunds.com | AB INTERMEDIATE BOND PORTFOLIO | 53 |
STATEMENT OF CHANGES IN NET ASSETS
| Year Ended October 31, 2017 | Year Ended October 31, 2016 | |||||||
| Increase (Decrease) in Net Assets from Operations | ||||||||
Net investment income | $ | 7,729,869 | $ | 8,098,827 | ||||
Net realized gain (loss) on investment and foreign currency transactions | (1,713,043 | ) | 1,728,366 | |||||
Net change in unrealized appreciation/depreciation of investments and foreign currency denominated assets and liabilities | (403,213 | ) | 7,073,367 | |||||
Contributions from Affiliates (see Note B) | 848 | – 0 | – | |||||
|
|
|
| |||||
Net increase in net assets from operations | 5,614,461 | 16,900,560 | ||||||
| Dividends and Distributions to Shareholders from | ||||||||
Net investment income | ||||||||
Class A | (4,943,450 | ) | (8,196,991 | ) | ||||
Class B | (12,336 | ) | (35,840 | ) | ||||
Class C | (399,665 | ) | (1,044,850 | ) | ||||
Advisor Class | (1,410,824 | ) | (1,369,668 | ) | ||||
Class R | (51,715 | ) | (85,941 | ) | ||||
Class K | (107,449 | ) | (147,387 | ) | ||||
Class I | (61,860 | ) | (28,992 | ) | ||||
Class Z | (438,598 | ) | (398,815 | ) | ||||
Net realized gain on investment transactions | ||||||||
Class A | (859,057 | ) | – 0 | – | ||||
Class B | (3,644 | ) | – 0 | – | ||||
Class C | (145,770 | ) | – 0 | – | ||||
Advisor Class | (198,792 | ) | – 0 | – | ||||
Class R | (10,587 | ) | – 0 | – | ||||
Class K | (19,032 | ) | – 0 | – | ||||
Class I | (10,045 | ) | – 0 | – | ||||
Class Z | (60,304 | ) | – 0 | – | ||||
Tax return of capital | ||||||||
Class A | (738,365 | ) | – 0 | – | ||||
Class B | (1,842 | ) | – 0 | – | ||||
Class C | (59,695 | ) | – 0 | – | ||||
Advisor Class | (210,724 | ) | – 0 | – | ||||
Class R | (7,724 | ) | – 0 | – | ||||
Class K | (16,049 | ) | – 0 | – | ||||
Class I | (9,239 | ) | – 0 | – | ||||
Class Z | (65,510 | ) | – 0 | – | ||||
| Capital Stock Transactions | ||||||||
Net increase (decrease) | (9,872,834 | ) | 38,117,126 | |||||
|
|
|
| |||||
Total increase (decrease) | (14,100,649 | ) | 43,709,202 | |||||
| Net Assets | ||||||||
Beginning of period | 374,219,400 | 330,510,198 | ||||||
|
|
|
| |||||
End of period (including undistributed net investment income of $792,734 and distributions in excess of net investment income of ($123,774), respectively) | $ | 360,118,751 | $ | 374,219,400 | ||||
|
|
|
| |||||
See notes to financial statements.
| 54 | AB INTERMEDIATE BOND PORTFOLIO | abfunds.com |
NOTES TO FINANCIAL STATEMENTS
October 31, 2017
NOTE A
Significant Accounting Policies
AB Bond Fund, Inc. (the “Company”) is registered under the Investment Company Act of 1940 as an open-end management investment company. The Company, which is a Maryland corporation, operates as a series company comprised of eleven portfolios currently in operation. Each portfolio is considered to be a separate entity for financial reporting and tax purposes. This report relates only to the AB Intermediate Bond Portfolio (the “Portfolio”), a diversified portfolio. The Portfolio offers Class A, Class B, Class C, Advisor Class, Class R, Class K, Class I, Class T and Class Z shares. Class T shares have been authorized but currently are not offered. Class A shares are sold with a front-end sales charge of up to 4.25% for purchases not exceeding $1,000,000. With respect to purchases of $1,000,000 or more, Class A shares redeemed within one year of purchase may be subject to a contingent deferred sales charge of 1%. Class B shares are currently sold with a contingent deferred sales charge which declines from 3% to zero depending on the period of time the shares are held. Effective January 31, 2009, sales of Class B shares of the Portfolio to new investors were suspended. Class B shares will only be issued (i) upon the exchange of Class B shares from another AB Mutual Fund, (ii) for purposes of dividend reinvestment, (iii) through the Portfolio’s Automatic Investment Program (the “Program”) for accounts that established the Program prior to January 31, 2009, and (iv) for purchases of additional shares by Class B shareholders as of January 31, 2009. The ability to establish a new Program for accounts containing Class B shares was suspended as of January 31, 2009. Class B shares will automatically convert to Class A shares six years after the end of the calendar month of purchase. Class C shares are subject to a contingent deferred sales charge of 1% on redemptions made within the first year after purchase and 0% after the first year of purchase. Effective April 10, 2017, Class C shares will automatically convert to Class A shares ten years after the end of the calendar month of purchase. Class R and Class K shares are sold without an initial or contingent deferred sales charge. Advisor Class, Class I and Class Z shares are sold without an initial or contingent deferred sales charge and are not subject to ongoing distribution expenses. All nine classes of shares have identical voting, dividend, liquidation and other rights, except that the classes bear different distribution and transfer agency expenses. Each class has exclusive voting rights with respect to its distribution plan. The financial statements have been prepared in conformity with U.S. generally accepted accounting principles (“U.S. GAAP”) which require management to make certain estimates and assumptions that affect the reported amounts of assets and liabilities in the financial statements and amounts of income and expenses during the reporting period. Actual results could differ from those estimates. The Portfolio is an
| abfunds.com | AB INTERMEDIATE BOND PORTFOLIO | 55 |
NOTES TO FINANCIAL STATEMENTS (continued)
investment company under U.S. GAAP and follows the accounting and reporting guidance applicable to investment companies. The following is a summary of significant accounting policies followed by the Portfolio.
1. Security Valuation
Portfolio securities are valued at their current market value determined on the basis of market quotations or, if market quotations are not readily available or are deemed unreliable, at “fair value” as determined in accordance with procedures established by and under the general supervision of the Company’s Board of Directors (the “Board”).
In general, the market values of securities which are readily available and deemed reliable are determined as follows: securities listed on a national securities exchange (other than securities listed on the NASDAQ Stock Market, Inc. (“NASDAQ”)) or on a foreign securities exchange are valued at the last sale price at the close of the exchange or foreign securities exchange. If there has been no sale on such day, the securities are valued at the last traded price from the previous day. Securities listed on more than one exchange are valued by reference to the principal exchange on which the securities are traded; securities listed only on NASDAQ are valued in accordance with the NASDAQ Official Closing Price; listed or over the counter (“OTC”) market put or call options are valued at the mid level between the current bid and ask prices. If either a current bid or current ask price is unavailable, AllianceBernstein L.P. (the “Adviser”) will have discretion to determine the best valuation (e.g., last trade price in the case of listed options); open futures are valued using the closing settlement price or, in the absence of such a price, the most recent quoted bid price. If there are no quotations available for the day of valuation, the last available closing settlement price is used; U.S. Government securities and any other debt instruments having 60 days or less remaining until maturity are generally valued at market by an independent pricing vendor, if a market price is available. If a market price is not available, the securities are valued at amortized cost. This methodology is commonly used for short term securities that have an original maturity of 60 days or less, as well as short term securities that had an original term to maturity that exceeded 60 days. In instances when amortized cost is utilized, the Valuation Committee (the “Committee”) must reasonably conclude that the utilization of amortized cost is approximately the same as the fair value of the security. Such factors the Committee will consider include, but are not limited to, an impairment of the creditworthiness of the issuer or material changes in interest rates. Fixed-income securities, including mortgage-backed and asset-backed securities, may be valued on the basis of prices provided by a pricing service or at a price obtained from one or more of the major broker-dealers. In cases where broker-dealer quotes are obtained, the Adviser may establish procedures whereby changes in market yields or
| 56 | AB INTERMEDIATE BOND PORTFOLIO | abfunds.com |
NOTES TO FINANCIAL STATEMENTS (continued)
spreads are used to adjust, on a daily basis, a recently obtained quoted price on a security. Swaps and other derivatives are valued daily, primarily using independent pricing services, independent pricing models using market inputs, as well as third party broker-dealers or counterparties. Open end mutual funds are valued at the closing net asset value per share, while exchange traded funds are valued at the closing market price per share.
Securities for which market quotations are not readily available (including restricted securities) or are deemed unreliable are valued at fair value as deemed appropriate by the Adviser. Factors considered in making this determination may include, but are not limited to, information obtained by contacting the issuer, analysts, analysis of the issuer’s financial statements or other available documents. In addition, the Portfolio may use fair value pricing for securities primarily traded in non-U.S. markets because most foreign markets close well before the Portfolio values its securities at 4:00 p.m., Eastern Time. The earlier close of these foreign markets gives rise to the possibility that significant events, including broad market moves, may have occurred in the interim and may materially affect the value of those securities. To account for this, the Portfolio generally values many of its foreign equity securities using fair value prices based on third party vendor modeling tools to the extent available.
2. Fair Value Measurements
In accordance with U.S. GAAP regarding fair value measurements, fair value is defined as the price that the Portfolio would receive to sell an asset or pay to transfer a liability in an orderly transaction between market participants at the measurement date. U.S. GAAP establishes a framework for measuring fair value, and a three-level hierarchy for fair value measurements based upon the transparency of inputs to the valuation of an asset or liability (including those valued based on their market values as described in Note A.1 above). Inputs may be observable or unobservable and refer broadly to the assumptions that market participants would use in pricing the asset or liability. Observable inputs reflect the assumptions market participants would use in pricing the asset or liability based on market data obtained from sources independent of the Portfolio. Unobservable inputs reflect the Portfolio’s own assumptions about the assumptions that market participants would use in pricing the asset or liability based on the best information available in the circumstances. Each investment is assigned a level based upon the observability of the inputs which are significant to the overall valuation. The three-tier hierarchy of inputs is summarized below.
| • | Level 1—quoted prices in active markets for identical investments |
| abfunds.com | AB INTERMEDIATE BOND PORTFOLIO | 57 |
NOTES TO FINANCIAL STATEMENTS (continued)
| • | Level 2—other significant observable inputs (including quoted prices for similar investments, interest rates, prepayment speeds, credit risk, etc.) |
| • | Level 3—significant unobservable inputs (including the Portfolio’s own assumptions in determining the fair value of investments) |
The fair value of debt instruments, such as bonds, and over-the-counter derivatives is generally based on market price quotations, recently executed market transactions (where observable) or industry recognized modeling techniques and are generally classified as Level 2. Pricing vendor inputs to Level 2 valuations may include quoted prices for similar investments in active markets, interest rate curves, coupon rates, currency rates, yield curves, option adjusted spreads, default rates, credit spreads and other unique security features in order to estimate the relevant cash flows which are then discounted to calculate fair values. If these inputs are unobservable and significant to the fair value, these investments will be classified as Level 3. In addition, non-agency rated investments are classified as Level 3.
Valuations of mortgage-backed or other asset-backed securities, by pricing vendors, are based on both proprietary and industry recognized models and discounted cash flow techniques. Significant inputs to the valuation of these instruments are value of the collateral, the rates and timing of delinquencies, the rates and timing of prepayments, and default and loss expectations, which are driven in part by housing prices for residential mortgages. Significant inputs are determined based on relative value analyses, which incorporate comparisons to instruments with similar collateral and risk profiles, including relevant indices. Mortgage and asset-backed securities for which management has collected current observable data through pricing services are generally categorized within Level 2. Those investments for which current observable data has not been provided are classified as Level 3.
Other fixed income investments, including non-U.S. government and corporate debt, are generally valued using quoted market prices, if available, which are typically impacted by current interest rates, maturity dates and any perceived credit risk of the issuer. Additionally, in the absence of quoted market prices, these inputs are used by pricing vendors to derive a valuation based upon industry or proprietary models which incorporate issuer specific data with relevant yield/spread comparisons with more widely quoted bonds with similar key characteristics. Those investments for which there are observable inputs are classified as Level 2. Where the inputs are not observable, the investments are classified as Level 3.
| 58 | AB INTERMEDIATE BOND PORTFOLIO | abfunds.com |
NOTES TO FINANCIAL STATEMENTS (continued)
The following table summarizes the valuation of the Portfolio’s investments by the above fair value hierarchy levels as of October 31, 2017:
Investments in | Level 1 | Level 2 | Level 3 | Total | ||||||||||||
Assets: | ||||||||||||||||
Mortgage Pass-Throughs | $ | – 0 | – | $ | 74,142,802 | $ | – 0 | – | $ | 74,142,802 | ||||||
Corporates – Investment Grade | – 0 | – | 70,996,610 | – 0 | – | 70,996,610 | ||||||||||
Governments – Treasuries | – 0 | – | 49,106,756 | – 0 | – | 49,106,756 | ||||||||||
Asset-Backed Securities | – 0 | – | 37,846,035 | 8,199,060 | 46,045,095 | |||||||||||
Commercial Mortgage-Backed Securities | – 0 | – | 26,879,968 | 6,323,878 | 33,203,846 | |||||||||||
Collateralized Mortgage Obligations | – 0 | – | 25,769,349 | 610,816 | 26,380,165 | |||||||||||
Inflation-Linked Securities | – 0 | – | 19,625,360 | – 0 | – | 19,625,360 | ||||||||||
Corporates – Non-Investment Grade | – 0 | – | 15,130,669 | – 0 | – | 15,130,669 | ||||||||||
Emerging Markets – Treasuries | – 0 | – | 2,999,009 | – 0 | – | 2,999,009 | ||||||||||
Emerging Markets – Corporate Bonds | – 0 | – | 2,247,901 | – 0 | – | 2,247,901 | ||||||||||
Local Governments – US Municipal Bonds | – 0 | – | 1,492,093 | – 0 | – | 1,492,093 | ||||||||||
Quasi-Sovereigns | – 0 | – | 1,453,715 | – 0 | – | 1,453,715 | ||||||||||
Common Stocks | – 0 | – | – 0 | – | 652,741 | 652,741 | ||||||||||
Governments – Sovereign Bonds | – 0 | – | 574,142 | – 0 | – | 574,142 | ||||||||||
Emerging Markets – Sovereigns | – 0 | – | 245,281 | – 0 | – | 245,281 | ||||||||||
Short-Term Investments: | ||||||||||||||||
Agency Discount Notes | – 0 | – | 27,693,417 | – 0 | – | 27,693,417 | ||||||||||
Governments – Treasuries | – 0 | – | 23,827,853 | – 0 | – | 23,827,853 | ||||||||||
Commercial Paper | – 0 | – | 5,394,092 | – 0 | – | 5,394,092 | ||||||||||
U.S. Treasury Bills | – 0 | – | 4,192,190 | – 0 | – | 4,192,190 | ||||||||||
Investment Companies | 616,692 | – 0 | – | – 0 | – | 616,692 | ||||||||||
|
|
|
|
|
|
|
| |||||||||
Total Investments in Securities | 616,692 | 389,617,242 | 15,786,495 | 406,020,429 | ||||||||||||
Other Financial Instruments(a): | ||||||||||||||||
Assets: | ||||||||||||||||
Futures | 522,744 | – 0 | – | – 0 | – | 522,744 | (b) | |||||||||
Forward Currency Exchange Contracts | – 0 | – | 287,526 | – 0 | – | 287,526 | ||||||||||
Centrally Cleared Interest Rate Swaps | – 0 | – | 241,040 | – 0 | – | 241,040 | (b) | |||||||||
Credit Default Swaps | – 0 | – | 249,650 | – 0 | – | 249,650 | ||||||||||
Liabilities: | ||||||||||||||||
Futures | (731,406 | ) | – 0 | – | – 0 | – | (731,406 | )(b) | ||||||||
Forward Currency Exchange Contracts | – 0 | – | (327,837 | ) | – 0 | – | (327,837 | ) | ||||||||
Centrally Cleared Interest Rate Swaps | – 0 | – | (287,882 | ) | – 0 | – | (287,882 | )(b) | ||||||||
Credit Default Swaps | – 0 | – | (2,384,351 | ) | – 0 | – | (2,384,351 | ) | ||||||||
|
|
|
|
|
|
|
| |||||||||
Total(c) | $ | 408,030 | $ | 387,395,388 | $ | 15,786,495 | $ | 403,589,913 | ||||||||
|
|
|
|
|
|
|
| |||||||||
| (a) | Other financial instruments are derivative instruments, such as futures, forwards and swaps, which are valued at the unrealized appreciation/(depreciation) on the instrument. Other financial instruments may also include credit default swaps which are valued at market value. |
| abfunds.com | AB INTERMEDIATE BOND PORTFOLIO | 59 |
NOTES TO FINANCIAL STATEMENTS (continued)
| (b) | Only variation margin receivable/(payable) at period end is reported within the statement of assets and liabilities. This amount reflects cumulative unrealized appreciation/(depreciation) of exchange-traded derivatives as reported in the portfolio of investments. |
| (c) | There were no transfers between Level 1 and Level 2 during the reporting period. |
The Portfolio recognizes all transfers between levels of the fair value hierarchy assuming the financial instruments were transferred at the beginning of the reporting period.
The following is a reconciliation of investments in which significant unobservable inputs (Level 3) were used in determining fair value.
| Asset-Backed Securities | Commercial Mortgage-Backed Securities | Collateralized Mortgage Obligations | ||||||||||
Balance as of 10/31/16 | $ | 3,445,583 | $ | 11,234,132 | $ | 831,988 | ||||||
Accrued discounts/(premiums) | 155 | (1,435 | ) | – 0 | – | |||||||
Realized gain (loss) | (1,728,537 | ) | (303,470 | ) | 10,432 | |||||||
Change in unrealized appreciation/depreciation | 43,628 | 217,301 | 2,678 | |||||||||
Purchases/Payups | 7,004,146 | 1,686,416 | 550,000 | |||||||||
Sales/Paydowns | (565,915 | ) | (6,509,066 | ) | (550,310 | ) | ||||||
Transfers in to Level 3 | – 0 | – | – 0 | – | 57,760 | |||||||
Transfers out of Level 3 | – 0 | – | – 0 | – | (291,732 | ) | ||||||
|
|
|
|
|
| |||||||
Balance as of 10/31/17 | $ | 8,199,060 | $ | 6,323,878 | $ | 610,816 | ||||||
|
|
|
|
|
| |||||||
Net change in unrealized appreciation/depreciation from investments held as of 10/31/17(a) | $ | 33,118 | $ | 77,225 | $ | 3,056 | ||||||
|
|
|
|
|
| |||||||
| Common Stocks | Total | |||||||||||
Balance as of 10/31/16 | $ | 1,032,105 | $ | 16,543,808 | ||||||||
Accrued discounts/(premiums) | – 0 | – | (1,280 | ) | ||||||||
Realized gain (loss) | – 0 | – | (2,021,575 | ) | ||||||||
Change in unrealized appreciation/depreciation | (8,364 | ) | 255,243 | |||||||||
Purchases/Payups | – 0 | – | 9,240,562 | |||||||||
Sales/Paydowns | (371,000 | ) | (7,996,291 | ) | ||||||||
Transfers in to Level 3 | – 0 | – | 57,760 | |||||||||
Transfers out of Level 3 | – 0 | – | (291,732 | ) | ||||||||
|
|
|
| |||||||||
Balance as of 10/31/17 | $ | 652,741 | $ | 15,786,495 | (b) | |||||||
|
|
|
| |||||||||
Net change in unrealized appreciation/depreciation from investments held as of 10/31/17(a) | $ | (8,364 | ) | $ | 105,035 | |||||||
|
|
|
| |||||||||
| (a) | The unrealized appreciation/(depreciation) is included in net change in unrealized appreciation/(depreciation) on investments and other financial instruments in the accompanying statement of operations. |
| (b) | There were de minimis transfers under 1% of net assets during the reporting period. |
| 60 | AB INTERMEDIATE BOND PORTFOLIO | abfunds.com |
NOTES TO FINANCIAL STATEMENTS (continued)
The following presents information about significant unobservable inputs related to the Fund’s Level 3 investments at October 31, 2017. Securities priced (i) by third party vendors or (ii) by brokers, which approximates fair value, are excluded from the following table.
Quantitative Information about Level 3 Fair Value Measurements
| Fair Value at 10/30/17 | Valuation Technique | Unobservable Input | Input | |||||||
Common Stock | $ | 652,741 | Market Approach | NAV Equivalent | $1,042.72 / NA | |||||
Generally, a change in the assumptions used in any input in isolation may be accompanied by a change in another input. Significant changes in any of the unobservable inputs may significantly impact the fair value measurement. Significant increases (decreases) in NAV Equivalent would be expected to result in a significantly higher (lower) fair value measurement.
The Adviser established the Committee to oversee the pricing and valuation of all securities held in the Portfolio. The Committee operates under pricing and valuation policies and procedures established by the Adviser and approved by the Board, including pricing policies which set forth the mechanisms and processes to be employed on a daily basis to implement these policies and procedures. In particular, the pricing policies describe how to determine market quotations for securities and other instruments. The Committee’s responsibilities include: 1) fair value and liquidity determinations (and oversight of any third parties to whom any responsibility for fair value and liquidity determinations is delegated), and 2) regular monitoring of the Adviser’s pricing and valuation policies and procedures and modification or enhancement of these policies and procedures (or recommendation of the modification of these policies and procedures) as the Committee believes appropriate.
The Committee is also responsible for monitoring the implementation of the pricing policies by the Adviser’s Pricing Group (the “Pricing Group”) and any third party which performs certain pricing functions in accordance with the pricing policies. The Pricing Group is responsible for the oversight of the third party on a day-to-day basis. The Committee and the Pricing Group perform a series of activities to provide reasonable assurance of the accuracy of prices including: 1) periodic vendor due diligence meetings, review of methodologies, new developments and processes at vendors, 2) daily comparison of security valuation versus prior day for all securities that exceeded established thresholds, and 3) daily review of unpriced, stale, and variance reports with exceptions reviewed by senior management and the Committee.
In addition, several processes outside of the pricing process are used to monitor valuation issues including: 1) performance and performance attribution reports are monitored for anomalous impacts based upon benchmark performance, and 2) portfolio managers review all portfolios for performance and analytics (which are generated using the Adviser’s prices).
| abfunds.com | AB INTERMEDIATE BOND PORTFOLIO | 61 |
NOTES TO FINANCIAL STATEMENTS (continued)
3. Currency Translation
Assets and liabilities denominated in foreign currencies and commitments under forward currency exchange contracts are translated into U.S. dollars at the mean of the quoted bid and ask prices of such currencies against the U.S. dollar. Purchases and sales of portfolio securities are translated into U.S. dollars at the rates of exchange prevailing when such securities were acquired or sold. Income and expenses are translated into U.S. dollars at rates of exchange prevailing when accrued.
Net realized gain or loss on foreign currency transactions represents foreign exchange gains and losses from sales and maturities of foreign fixed income investments, holding of foreign currencies, currency gains or losses realized between the trade and settlement dates on foreign investment transactions, and the difference between the amounts of dividends, interest and foreign withholding taxes recorded on the Portfolio’s books and the U.S. dollar equivalent amounts actually received or paid. Net unrealized currency gains and losses from valuing foreign currency denominated assets and liabilities at period end exchange rates are reflected as a component of net unrealized appreciation or depreciation of foreign currency denominated assets and liabilities.
4. Taxes
It is the Portfolio’s policy to meet the requirements of the Internal Revenue Code applicable to regulated investment companies and to distribute all of its investment company taxable income and net realized gains, if any, to shareholders. Therefore, no provisions for federal income or excise taxes are required. The Portfolio may be subject to taxes imposed by countries in which it invests. Such taxes are generally based on income and/or capital gains earned or repatriated. Taxes are accrued and applied to net investment income, net realized gains and net unrealized appreciation/depreciation as such income and/or gains are earned.
In accordance with U.S. GAAP requirements regarding accounting for uncertainties in income taxes, management has analyzed the Portfolio’s tax positions taken or expected to be taken on federal and state income tax returns for all open tax years (the current and the prior three tax years) and has concluded that no provision for income tax is required in the Portfolio’s financial statements.
5. Investment Income and Investment Transactions
Dividend income is recorded on the ex-dividend date or as soon as the Portfolio is informed of the dividend. Interest income is accrued daily. Investment transactions are accounted for on the date the securities are purchased or sold. Investment gains or losses are determined on the identified cost basis. The Portfolio amortizes premiums and accretes discounts as adjustments to interest income.
| 62 | AB INTERMEDIATE BOND PORTFOLIO | abfunds.com |
NOTES TO FINANCIAL STATEMENTS (continued)
6. Class Allocations
All income earned and expenses incurred by the Portfolio are borne on a pro-rata basis by each outstanding class of shares, based on the proportionate interest in the Portfolio represented by the net assets of such class, except for class specific expenses which are allocated to the respective class. Expenses of the Company are charged proportionately to each portfolio or based on other appropriate methods. Realized and unrealized gains and losses are allocated among the various share classes based on respective net assets.
7. Dividends and Distributions
Dividends and distributions to shareholders, if any, are recorded on the ex-dividend date. Income dividends and capital gains distributions are determined in accordance with federal tax regulations and may differ from those determined in accordance with U.S. GAAP. To the extent these differences are permanent, such amounts are reclassified within the capital accounts based on their federal tax basis treatment; temporary differences do not require such reclassification.
NOTE B
Advisory Fee and Other Transactions with Affiliates
Under the terms of the investment advisory agreement, the Portfolio pays the Adviser an advisory fee at an annual rate of .45% of the first $2.5 billion, .40% of the next $2.5 billion and .35% in excess of $5 billion, of the Portfolio’s average daily net assets. The fee is accrued daily and paid monthly. The Adviser has agreed to waive its fees and bear certain expenses to the extent necessary to limit total operating expenses on an annual basis (the “Expense Caps”) to .77%, 1.52%, 1.52%, .52%, 1.02%, ..77%, .52%, and .52% of the daily average net assets for the Class A, Class B, Class C, Advisor Class, Class R, Class K, Class I, and Class Z shares, respectively. Effective February 1, 2017, the Expense Cap were reduced from .85% to .77%, 1.60% to 1.52%, 1.60% to 1.52%, .60% to .52%, 1.10% to 1.02%, .85% to .77%, .60% to .52%, and .60% to .52% of the daily average net assets for Class A, Class B, Class C, Advisor Class, Class R, Class K, Class I and Class Z shares, respectively. This waiver extends through January 31, 2018 and then may be extended by the Adviser for additional one year terms. For the year ended October 31, 2017, such reimbursements/waivers amounted to $836,778.
Pursuant to the investment advisory agreement, the Portfolio may reimburse the Adviser for certain legal and accounting services provided to the Portfolio by the Adviser. For the year ended October 31, 2017, the Adviser voluntarily agreed to waive such fees in the amount of $63,860.
During the year ended October 31, 2017, the Adviser reimbursed the Portfolio $848 for trading losses incurred due to a trade entry error.
The Portfolio compensates AllianceBernstein Investor Services, Inc. (“ABIS”), a wholly-owned subsidiary of the Adviser, under a Transfer Agency
| abfunds.com | AB INTERMEDIATE BOND PORTFOLIO | 63 |
NOTES TO FINANCIAL STATEMENTS (continued)
Agreement for providing personnel and facilities to perform transfer agency services for the Portfolio. ABIS may make payments to intermediaries that provide omnibus account services, sub-accounting services and/or networking services. Such compensation retained by ABIS amounted to $209,373 for the year ended October 31, 2017.
AllianceBernstein Investments, Inc. (the “Distributor”), a wholly-owned subsidiary of the Adviser, serves as the distributor of the Portfolio’s shares. The Distributor has advised the Portfolio that it has retained front-end sales charges of $3,747 from the sale of Class A shares and received $3,712, $564 and $896 in contingent deferred sales charges imposed upon redemptions by shareholders of Class A, Class B and Class C shares, respectively, for the year ended October 31, 2017.
The Portfolio may invest in AB Government Money Market Portfolio (the “Government Money Market Portfolio”) which has a contractual annual advisory fee rate of .20% of the portfolio’s average daily net assets and bears its own expenses. In connection with the investment by the Portfolio in the Government Money Market Portfolio, the Adviser has contractually agreed to waive its advisory fee from the Portfolio in an amount equal to the Portfolio’s pro rata share of the effective advisory fees of Government Money Market Portfolio, as borne indirectly by the Portfolio as an acquired fund fee and expense. For the year ended October 31, 2017, such waiver amounted to $8,359.
Portfolio | Market Value 10/31/16 (000) | Purchases at Cost (000) | Sales Proceeds (000) | Market Value 10/31/17 (000) | Dividend Income (000) | |||||||||||||
| Government Money Market Portfolio | $ 8,129 | $ | 184,632 | $ | 192,144 | $ | 617 | $ | 25 | |||||||||
Brokerage commissions paid on investment transactions for the year ended October 31, 2017 amounted to $17,782, of which $0 and $0, respectively, was paid to Sanford C. Bernstein & Co. LLC and Sanford C. Bernstein Limited, affiliates of the Adviser.
NOTE C
Distribution Services Agreement
The Portfolio has adopted a Distribution Services Agreement (the “Agreement”) pursuant to Rule 12b-1 under the Investment Company Act of 1940. Under the Agreement, the Portfolio pays distribution and servicing fees to the Distributor at an annual rate of up to .30% of the Portfolio’s average daily net assets attributable to Class A shares, 1% of the Portfolio’s average daily net assets attributable to both Class B and Class C shares, .50% of the Portfolio’s average daily net assets attributable to Class R shares and ..25% of the Portfolio’s average daily net assets attributable to Class K shares. Effective June 1, 2015, payments under the
| 64 | AB INTERMEDIATE BOND PORTFOLIO | abfunds.com |
NOTES TO FINANCIAL STATEMENTS (continued)
Agreement in respect of Class A shares are limited to an annual rate of .25% of Class A shares’ average daily net assets. There are no distribution and servicing fees on the Advisor Class, Class I and Class Z shares. The fees are accrued daily and paid monthly. The Agreement provides that the Distributor will use such payments in their entirety for distribution assistance and promotional activities. Since the commencement of the Portfolio’s operations, the Distributor has incurred expenses in excess of the distribution costs reimbursed by the Portfolio in the amounts of $0, $1,193,523, $134,393 and $52,977 for Class B, Class C, Class R and Class K shares, respectively. While such costs may be recovered from the Portfolio in future periods so long as the Agreement is in effect, the rate of the distribution and servicing fees payable under the Agreement may not be increased without a shareholder vote. In accordance with the Agreement, there is no provision for recovery of unreimbursed distribution costs incurred by the Distributor beyond the current fiscal year for Class A shares. The Agreement also provides that the Adviser may use its own resources to finance the distribution of the Portfolio’s shares.
NOTE D
Investment Transactions
Purchases and sales of investment securities (excluding short-term investments) for the year ended October 31, 2017 were as follows:
| Purchases | Sales | |||||||
Investment securities (excluding | $ | 83,754,004 | $ | 82,776,889 | ||||
U.S. government securities | 648,056,062 | 632,603,579 | ||||||
The cost of investments for federal income tax purposes, gross unrealized appreciation and unrealized depreciation are as follows:
Cost | $ | 403,659,719 | ||
|
| |||
Gross unrealized appreciation | $ | 8,650,733 | ||
Gross unrealized depreciation | (6,265,346 | ) | ||
|
| |||
Net unrealized appreciation | $ | 2,385,387 | ||
|
|
1. Derivative Financial Instruments
The Portfolio may use derivatives in an effort to earn income and enhance returns, to replace more traditional direct investments, to obtain exposure to otherwise inaccessible markets (collectively, “investment purposes”), or to hedge or adjust the risk profile of its portfolio.
The principal types of derivatives utilized by the Portfolio, as well as the methods in which they may be used are:
| • | Futures |
The Portfolio may buy or sell futures for investment purposes or for the purpose of hedging its portfolio against adverse effects of potential movements in the market. The Portfolio bears the market
| abfunds.com | AB INTERMEDIATE BOND PORTFOLIO | 65 |
NOTES TO FINANCIAL STATEMENTS (continued)
risk that arises from changes in the value of these instruments and the imperfect correlation between movements in the price of the futures and movements in the price of the assets, reference rates or indices which they are designed to track. Among other things, the Portfolio may purchase or sell futures for foreign currencies or options thereon for non-hedging purposes as a means of making direct investment in foreign currencies, as described below under “Currency Transactions”.
At the time the Portfolio enters into futures, the Portfolio deposits and maintains as collateral an initial margin with the broker, as required by the exchange on which the transaction is effected. Such amount is shown as cash collateral due from broker on the statement of assets and liabilities. Pursuant to the contract, the Portfolio agrees to receive from or pay to the broker an amount of cash equal to the daily fluctuation in the value of the contract. Such receipts or payments are known as variation margin and are recorded by the Portfolio as unrealized gains or losses. Risks may arise from the potential inability of a counterparty to meet the terms of the contract. The credit/counterparty risk for exchange-traded futures is generally less than privately negotiated futures, since the clearinghouse, which is the issuer or counterparty to each exchange-traded future, has robust risk mitigation standards, including the requirement to provide initial and variation margin. When the contract is closed, the Portfolio records a realized gain or loss equal to the difference between the value of the contract at the time it was opened and the time it was closed.
Use of long futures subjects the Portfolio to risk of loss in excess of the amounts shown on the statement of assets and liabilities, up to the notional value of the futures. Use of short futures subjects the Portfolio to unlimited risk of loss. Under some circumstances, futures exchanges may establish daily limits on the amount that the price of futures can vary from the previous day’s settlement price, which could effectively prevent liquidation of unfavorable positions.
During the year ended October 31, 2017, the Portfolio held futures for hedging and non-hedging purposes.
| • | Forward Currency Exchange Contracts |
The Portfolio may enter into forward currency exchange contracts in order to hedge its exposure to changes in foreign currency exchange rates on its foreign portfolio holdings, to hedge certain firm purchase and sale commitments denominated in foreign currencies and for non-hedging purposes as a means of making direct investments in foreign currencies, as described below under “Currency Transactions”.
A forward currency exchange contract is a commitment to purchase or sell a foreign currency at a future date at a negotiated forward rate. The gain or loss arising from the difference between the original contract and the closing of such contract would be included in net
| 66 | AB INTERMEDIATE BOND PORTFOLIO | abfunds.com |
NOTES TO FINANCIAL STATEMENTS (continued)
realized gain or loss on forward currency exchange contracts. Fluctuations in the value of open forward currency exchange contracts are recorded for financial reporting purposes as unrealized appreciation and/or depreciation by the Portfolio. Risks may arise from the potential inability of a counterparty to meet the terms of a contract and from unanticipated movements in the value of a foreign currency relative to the U.S. dollar.
During the year ended October 31, 2017, the Portfolio held forward currency exchange contracts for hedging and non-hedging purposes.
| • | Option Transactions |
For hedging and investment purposes, the Portfolio may purchase and write (sell) put and call options on U.S. and foreign securities, including government securities, and foreign currencies that are traded on U.S. and foreign securities exchanges and over-the-counter markets. Among other things, the Portfolio may use options transactions for non-hedging purposes as a means of making direct investments in foreign currencies, as described below under “Currency Transactions” and may use options strategies involving the purchase and/or writing of various combinations of call and/or put options, for hedging and investment purposes.
The risk associated with purchasing an option is that the Portfolio pays a premium whether or not the option is exercised. Additionally, the Portfolio bears the risk of loss of the premium and change in market value should the counterparty not perform under the contract. If a put or call option purchased by the Portfolio was permitted to expire without being sold or exercised, its premium would represent a loss to the Portfolio. Put and call options purchased are accounted for in the same manner as portfolio securities. The cost of securities acquired through the exercise of call options is increased by premiums paid. The proceeds from securities sold through the exercise of put options are decreased by the premiums paid.
When the Portfolio writes an option, the premium received by the Portfolio is recorded as a liability and is subsequently adjusted to the current market value of the option written. Premiums received from written options which expire unexercised are recorded by the Portfolio on the expiration date as realized gains from options written. The difference between the premium received and the amount paid on effecting a closing purchase transaction, including brokerage commissions, is also treated as a realized gain, or if the premium received is less than the amount paid for the closing purchase transaction, as a realized loss. If a call option is exercised, the premium received is added to the proceeds from the sale of the underlying security or currency in determining whether the Portfolio
| abfunds.com | AB INTERMEDIATE BOND PORTFOLIO | 67 |
NOTES TO FINANCIAL STATEMENTS (continued)
has realized a gain or loss. If a put option is exercised, the premium received reduces the cost basis of the security or currency purchased by the Portfolio. In writing an option, the Portfolio bears the market risk of an unfavorable change in the price of the security or currency underlying the written option. Exercise of an option written by the Portfolio could result in the Portfolio selling or buying a security or currency at a price different from the current market value.
The Portfolio may also invest in options on swap agreements, also called “swaptions”. A swaption is an option that gives the buyer the right, but not the obligation, to enter into a swap on a future date in exchange for paying a market-based “premium”. A receiver swaption gives the owner the right to receive the total return of a specified asset, reference rate, or index. A payer swaption gives the owner the right to pay the total return on a specified asset, reference rate, or index. Swaptions also include options that allow an existing swap to be terminated or extended by one of the counterparties.
During the year ended October 31, 2017, the Portfolio held purchased options for hedging purposes.
During the year ended October 31, 2017, the Portfolio held written swaptions for hedging purposes.
| • | Swaps |
The Portfolio may enter into swaps to hedge its exposure to interest rates, credit risk or currencies. The Portfolio may also enter into swaps for non-hedging purposes as a means of gaining market exposures, making direct investments in foreign currencies, as described below under “Currency Transactions.” A swap is an agreement that obligates two parties to exchange a series of cash flows at specified intervals based upon or calculated by reference to changes in specified prices or rates for a specified amount of an underlying asset. The payment flows are usually netted against each other, with the difference being paid by one party to the other. In addition, collateral may be pledged or received by the Portfolio in accordance with the terms of the respective swaps to provide value and recourse to the Portfolio or its counterparties in the event of default, bankruptcy or insolvency by one of the parties to the swap.
Risks may arise as a result of the failure of the counterparty to the swap to comply with the terms of the swap. The loss incurred by the failure of a counterparty is generally limited to the net interim payment to be received by the Portfolio, and/or the termination value at the end of the contract. Therefore, the Portfolio considers the creditworthiness of each counterparty to a swap in evaluating potential counterparty risk. This risk is mitigated by having a netting arrangement between
| 68 | AB INTERMEDIATE BOND PORTFOLIO | abfunds.com |
NOTES TO FINANCIAL STATEMENTS (continued)
the Portfolio and the counterparty and by the posting of collateral by the counterparty to the Portfolio to cover the Portfolio’s exposure to the counterparty. Additionally, risks may arise from unanticipated movements in interest rates or in the value of the underlying securities. The Portfolio accrues for the interim payments on swaps on a daily basis, with the net amount recorded within unrealized appreciation/depreciation of swaps on the statement of assets and liabilities, where applicable. Once the interim payments are settled in cash, the net amount is recorded as realized gain/(loss) on swaps on the statement of operations, in addition to any realized gain/(loss) recorded upon the termination of swaps. Upfront premiums paid or received are recognized as cost or proceeds on the statement of assets and liabilities and are amortized on a straight line basis over the life of the contract. Amortized upfront premiums are included in net realized gain/(loss) from swaps on the statement of operations. Fluctuations in the value of swaps are recorded as a component of net change in unrealized appreciation/depreciation of swaps on the statement of operations.
Certain standardized swaps, including certain interest rate swaps and credit default swaps, are (or soon will be) subject to mandatory central clearing. Cleared swaps are transacted through futures commission merchants (“FCMs”) that are members of central clearinghouses, with the clearinghouse serving as central counterparty, similar to transactions in futures contracts. Centralized clearing will be required for additional categories of swaps on a phased-in basis based on requirements published by the Securities and Exchange Commission and Commodity Futures Trading Commission.
At the time the Portfolio enters into a centrally cleared swap, the Portfolio deposits and maintains as collateral an initial margin with the broker, as required by the clearinghouse on which the transaction is effected. Such amount is shown as cash collateral due from broker on the statement of assets and liabilities. Pursuant to the contract, the Portfolio agrees to receive from or pay to the broker an amount of cash equal to the daily fluctuation in the value of the contract. Such receipts or payments are known as variation margin and are recorded by the Portfolio as unrealized gains or losses. Risks may arise from the potential inability of a counterparty to meet the terms of the contract. The credit/counterparty risk for centrally cleared swaps is generally less than non-centrally cleared swaps, since the clearinghouse, which is the issuer or counterparty to each centrally cleared swap, has robust risk mitigation standards, including the requirement to provide initial and variation margin. When the contract is closed, the Portfolio records a realized gain or loss equal to the difference between the value of the contract at the time it was opened and the time it was closed.
| abfunds.com | AB INTERMEDIATE BOND PORTFOLIO | 69 |
NOTES TO FINANCIAL STATEMENTS (continued)
Interest Rate Swaps:
The Portfolio is subject to interest rate risk exposure in the normal course of pursuing its investment objectives. Because the Portfolio holds fixed rate bonds, the value of these bonds may decrease if interest rates rise. To help hedge against this risk and to maintain its ability to generate income at prevailing market rates, the Portfolio may enter into interest rate swaps. Interest rate swaps are agreements between two parties to exchange cash flows based on a notional amount. The Portfolio may elect to pay a fixed rate and receive a floating rate, or, receive a fixed rate and pay a floating rate on a notional amount.
In addition, the Portfolio may also enter into interest rate swap transactions to preserve a return or spread on a particular investment or portion of its portfolio, or protecting against an increase in the price of securities the Portfolio anticipates purchasing at a later date. Interest rate swaps involve the exchange by a Portfolio with another party of their respective commitments to pay or receive interest (e.g., an exchange of floating rate payments for fixed rate payments) computed based on a contractually-based principal (or “notional”) amount. Interest rate swaps are entered into on a net basis (i.e., the two payment streams are netted out, with the Portfolio receiving or paying, as the case may be, only the net amount of the two payments).
During the year ended October 31, 2017, the Portfolio held interest rate swaps for hedging and non-hedging purposes.
Credit Default Swaps:
The Portfolio may enter into credit default swaps, including to manage its exposure to the market or certain sectors of the market, to reduce its risk exposure to defaults by corporate and sovereign issuers held by the Portfolio, or to create exposure to corporate or sovereign issuers to which it is not otherwise exposed. The Portfolio may purchase credit protection (“Buy Contract”) or provide credit protection (“Sale Contract”) on the referenced obligation of the credit default swap. During the term of the swap, the Portfolio receives/(pays) fixed payments from/(to) the respective counterparty, calculated at the agreed upon rate applied to the notional amount. If the Portfolio is a buyer/(seller) of protection and a credit event occurs, as defined under the terms of the swap, the Portfolio will either (i) receive from the seller/(pay to the buyer) of protection an amount equal to the notional amount of the swap (the “Maximum Payout Amount”) and deliver/(take delivery of) the referenced obligation or (ii) receive/(pay) a net settlement amount in the form of cash or securities equal to the notional amount of the swap less the recovery value of the referenced obligation.
| 70 | AB INTERMEDIATE BOND PORTFOLIO | abfunds.com |
NOTES TO FINANCIAL STATEMENTS (continued)
In certain circumstances Maximum Payout Amounts may be partially offset by recovery values of the respective referenced obligations, upfront premium received upon entering into the agreement, or net amounts received from settlement of buy protection credit default swaps entered into by the Portfolio for the same referenced obligations with the same counterparty. As of October 31, 2017, the Portfolio did not have Buy Contracts outstanding with respect to the same referenced obligations and same counterparty for its Sale Contracts outstanding.
Credit default swaps may involve greater risks than if a Portfolio had invested in the referenced obligation directly. Credit default swaps are subject to general market risk, liquidity risk, counterparty risk and credit risk. If the Portfolio is a buyer of protection and no credit event occurs, it will lose the payments it made to its counterparty. If the Portfolio is a seller of protection and a credit event occurs, the value of the referenced obligation received by the Portfolio coupled with the periodic payments previously received, may be less than the Maximum Payout Amount it pays to the buyer, resulting in a net loss to the Portfolio.
Implied credit spreads over U.S. Treasuries of comparable maturity utilized in determining the market value of credit default swaps on issuers as of period end are disclosed in the portfolio of investments. The implied spreads serve as an indicator of the current status of the payment/performance risk and typically reflect the likelihood of default by the issuer of the referenced obligation. The implied credit spread of a particular reference obligation also reflects the cost of buying/selling protection and may reflect upfront payments required to be made to enter into the agreement. Widening credit spreads typically represent a deterioration of the referenced obligation’s credit soundness and greater likelihood of default or other credit event occurring as defined under the terms of the agreement. A credit spread identified as “Defaulted” indicates a credit event has occurred for the referenced obligation.
During the year ended October 31, 2017, the Portfolio held credit default swaps for hedging and non-hedging purposes.
The Portfolio typically enters into International Swaps and Derivatives Association, Inc. Master Agreements (“ISDA Master Agreement”) with its OTC derivative contract counterparties in order to, among other things, reduce its credit risk to OTC counterparties. ISDA Master Agreements include provisions for general obligations, representations, collateral and events of default or termination. Under an ISDA Master Agreement, the Portfolio typically may offset with the OTC counterparty certain derivative financial instruments’ payables and/or receivables with collateral held and/or posted and create one single net payment (close-out netting) in the
| abfunds.com | AB INTERMEDIATE BOND PORTFOLIO | 71 |
NOTES TO FINANCIAL STATEMENTS (continued)
event of default or termination. In the event of a default by an OTC counterparty, the return of collateral with market value in excess of the Portfolio’s net liability, held by the defaulting party, may be delayed or denied.
The Portfolio’s ISDA Master Agreements may contain provisions for early termination of OTC derivative transactions in the event the net assets of the Portfolio decline below specific levels (“net asset contingent features”). If these levels are triggered, the Portfolio’s OTC counterparty has the right to terminate such transaction and require the Portfolio to pay or receive a settlement amount in connection with the terminated transaction. For additional details, please refer to netting arrangements by the OTC counterparty tables below.
During the year ended October 31, 2017, the Portfolio had entered into the following derivatives:
| Asset Derivatives | Liability Derivatives | |||||||||||
Derivative Type | Statement of Assets and Liabilities Location | Fair Value | Statement of Assets and Liabilities Location | Fair Value | ||||||||
Interest rate | Receivable/ Payable for variation margin on futures | $ | 522,744 | * | Receivable/ Payable for variation margin on futures | $ | 731,406 | * | ||||
Interest rate | Receivable/ Payable for variation margin on exchange traded swaps | | 241,040 | * | Receivable/ Payable for variation margin on exchange traded swaps | 287,882 | * | |||||
Foreign exchange contracts | Unrealized | | 287,526 | Unrealized depreciation on forward currency exchange contracts | | 327,837 | ||||||
Credit | Unrealized appreciation on credit default swaps | | 108,401 | Unrealized depreciation on credit default swaps | | 1,325,508 | ||||||
|
|
|
| |||||||||
Total | $ | 1,159,711 | $ | 2,672,633 | ||||||||
|
|
|
| |||||||||
| * | Only variation margin receivable/payable at period end is reported within the statement of assets and liabilities. This amount reflects cumulative appreciation/(depreciation) of exchange-traded derivatives as reported in the portfolio of investments. |
| 72 | AB INTERMEDIATE BOND PORTFOLIO | abfunds.com |
NOTES TO FINANCIAL STATEMENTS (continued)
Derivative Type | Location of | Realized Gain or (Loss) on Derivatives | Change in Unrealized Appreciation or (Depreciation) | |||||||
Interest rate contracts | Net realized gain (loss) on futures; Net change in unrealized appreciation/depreciation of futures | $ | (2,033,007 | ) | $ | 687,223 | ||||
Foreign exchange contracts | Net realized gain (loss) on forward currency exchange contracts; Net change in unrealized appreciation/depreciation of forward currency exchange contracts | 846,245 | (236,348 | ) | ||||||
Interest rate contracts | Net realized gain (loss) on investment transactions; Net change in unrealized appreciation/depreciation of investments | (60,577 | ) | 18,829 | ||||||
Interest rate contracts | Net realized gain (loss) on swaptions written; Net change in unrealized appreciation/depreciation of swaptions written | 45,037 | (4,561 | ) | ||||||
Interest rate contracts | Net realized gain (loss) on swaps; Net change in unrealized appreciation/depreciation of swaps | 133,673 | 821,582 | |||||||
Credit contracts | Net realized gain (loss) on swaps; Net change in unrealized appreciation/depreciation of swaps | 244,509 | (1,044,047 | ) | ||||||
|
|
|
| |||||||
Total | $ | (824,120 | ) | $ | 242,678 | |||||
|
|
|
| |||||||
| abfunds.com | AB INTERMEDIATE BOND PORTFOLIO | 73 |
NOTES TO FINANCIAL STATEMENTS (continued)
The following table represents the average monthly volume of the Portfolio’s derivative transactions during the year ended October 31, 2017:
Futures: | ||||
Average original value of buy contracts | $ | 89,824,144 | ||
Average original value of sale contracts | $ | 54,702,150 | ||
Forward Currency Exchange Contracts: | ||||
Average principal amount of buy contracts | $ | 14,214,616 | ||
Average principal amount of sale contracts | $ | 53,115,219 | ||
Purchased Options: | ||||
Average monthly cost | $ | 34,187 | (a) | |
Swaptions Written: | ||||
Average notional amount | $ | 17,120,000 | (b) | |
Interest Rate Swaps: | ||||
Average notional amount | $ | 7,314,286 | (c) | |
Centrally Cleared Interest Rate Swaps: | ||||
Average notional amount | $ | 81,173,171 | ||
Credit Default Swaps: | ||||
Average notional amount of buy contracts | $ | 5,603,692 | ||
Average notional amount of sale contracts | $ | 13,078,968 |
| (a) | Positions were open for three months during the year. |
| (b) | Positions were open for two months during the year. |
| (c) | Positions were open for six months during the year. |
For financial reporting purposes, the Portfolio does not offset derivative assets and derivative liabilities that are subject to netting arrangements in the statement of assets and liabilities.
All OTC derivatives held at period end were subject to netting arrangements. The following table presents the Portfolio’s derivative assets and liabilities by OTC counterparty net of amounts available for offset under ISDA Master Agreements and net of the related collateral received/pledged by the Portfolio as of October 31, 2017. Exchange-traded derivatives are not subject to netting arrangements and as such are excluded from the table.
Counterparty | Derivative Assets Subject to a MA | Derivative Available for Offset | Cash Collateral Received* | Security Collateral Received* | Net Amount of Derivatives Assets | |||||||||||||||
OTC Derivatives: |
| |||||||||||||||||||
Bank of America, NA | $ | 1,485 | $ | – 0 | – | $ | – 0 | – | $ | – 0 | – | $ | 1,485 | |||||||
BNP Paribas SA | 45,065 | – 0 | – | – 0 | – | – 0 | – | 45,065 | ||||||||||||
Citibank, NA | 96,614 | (96,614 | ) | – 0 | – | – 0 | – | – 0 | – | |||||||||||
Credit Suisse International | 272,359 | (272,359 | ) | – 0 | – | – 0 | – | – 0 | – | |||||||||||
Deutsche Bank AG | 1,060 | (1,060 | ) | – 0 | – | – 0 | – | – 0 | – | |||||||||||
Goldman Sachs Bank USA | 67,478 | (67,478 | ) | – 0 | – | – 0 | – | – 0 | – | |||||||||||
| 74 | AB INTERMEDIATE BOND PORTFOLIO | abfunds.com |
NOTES TO FINANCIAL STATEMENTS (continued)
Counterparty | Derivative Assets Subject to a MA | Derivative Available for Offset | Cash Collateral Received* | Security Collateral Received* | Net Amount of Derivatives Assets | |||||||||||||||
Royal Bank of Scotland PLC | $ | 18,982 | $ | (18,982 | ) | $ | – 0 | – | $ | – 0 | – | $ | – 0 | – | ||||||
Standard Chartered Bank | 29,176 | – 0 | – | – 0 | – | – 0 | – | 29,176 | ||||||||||||
State Street Bank & Trust Co. | 4,957 | (4,957 | ) | – 0 | – | – 0 | – | – 0 | – | |||||||||||
|
|
|
|
|
|
|
|
|
| |||||||||||
Total | $ | 537,176 | $ | (461,450 | ) | $ | – 0 | – | $ | – 0 | – | $ | 75,726 | ^ | ||||||
|
|
|
|
|
|
|
|
|
| |||||||||||
Counterparty | Derivative Liabilities Subject to a MA | Derivative Available for Offset | Cash Collateral Pledged* | Security Collateral Pledged* | Net Amount of Derivatives Liabilities | |||||||||||||||
OTC Derivatives: |
| |||||||||||||||||||
Barclays Bank PLC | $ | 18,715 | – 0 | – | $ | – 0 | – | $ | – 0 | – | $ | 18,715 | ||||||||
Citibank, NA | 159,778 | (96,614 | ) | – 0 | – | – 0 | – | 63,164 | ||||||||||||
Citigroup Global Markets, Inc. | 97,264 | – 0 | – | – 0 | – | – 0 | – | 97,264 | ||||||||||||
Credit Suisse International | 790,666 | (272,359 | ) | – 0 | – | (509,939 | ) | 8,368 | ||||||||||||
Deutsche Bank AG | 489,445 | (1,060 | ) | – 0 | – | (274,865 | ) | 213,520 | ||||||||||||
Goldman Sachs Bank USA/Goldman Sachs International | 947,979 | (67,478 | ) | – 0 | – | (804,372 | ) | 76,129 | ||||||||||||
JPMorgan Chase Bank, NA | 3,968 | – 0 | – | – 0 | – | – 0 | – | 3,968 | ||||||||||||
Morgan Stanley & Co., Inc. | 21,679 | – 0 | – | – 0 | – | – 0 | – | 21,679 | ||||||||||||
Royal Bank of Scotland PLC | 131,545 | (18,982 | ) | – 0 | – | – 0 | – | 112,563 | ||||||||||||
State Street Bank & Trust Co. | 51,149 | (4,957 | ) | – 0 | – | – 0 | – | 46,192 | ||||||||||||
|
|
|
|
|
|
|
|
|
| |||||||||||
Total | $ | 2,712,188 | $ | (461,450 | ) | $ | - 0 | - | $ | (1,589,176 | ) | $ | 661,562 | ^ | ||||||
|
|
|
|
|
|
|
|
|
| |||||||||||
| * | The actual collateral received/pledged may be more than the amount reported due to over-collateralization. |
| ^ | Net amount represents the net receivable/payable that would be due from/to the counterparty in the event of default or termination. The net amount from OTC financial derivative instruments can only be netted across transactions governed under the same master agreement with the same counterparty. |
| abfunds.com | AB INTERMEDIATE BOND PORTFOLIO | 75 |
NOTES TO FINANCIAL STATEMENTS (continued)
2. Currency Transactions
The Portfolio may invest in non-U.S. Dollar-denominated securities on a currency hedged or unhedged basis. The Portfolio may seek investment opportunities by taking long or short positions in currencies through the use of currency-related derivatives, including forward currency exchange contracts, futures and options on futures, swaps, and other options. The Portfolio may enter into transactions for investment opportunities when it anticipates that a foreign currency will appreciate or depreciate in value but securities denominated in that currency are not held by the Portfolio and do not present attractive investment opportunities. Such transactions may also be used when the Adviser believes that it may be more efficient than a direct investment in a foreign currency-denominated security. The Portfolio may also conduct currency exchange contracts on a spot basis (i.e., for cash at the spot rate prevailing in the currency exchange market for buying or selling currencies).
3. TBA and Dollar Rolls
The Portfolio may invest in TBA mortgage-backed securities. A TBA, or “To Be Announced”, trade represents a contract for the purchase or sale of mortgage-backed securities to be delivered at a future agree-upon date; however, the specific mortgage pool numbers or the number of pools that will be delivered to fulfill the trade obligation or terms of the contract are unknown at the time of the trade. Mortgage pools (including fixed-rate or variable-rate mortgages) guaranteed by the Government National Mortgage Association, or GNMA, the Federal National Mortgage Association, or FNMA, or the Federal Home Loan Mortgage Corporation, or FHLMC, are subsequently allocated to the TBA transactions.
The Portfolio may enter into dollar rolls. Dollar rolls involve sales by the Portfolio of securities for delivery in the current month and the Portfolio’s simultaneously contracting to repurchase substantially similar (same type and coupon) securities on a specified future date. During the roll period, the Portfolio forgoes principal and interest paid on the securities. The Portfolio is compensated by the difference between the current sales price and the lower forward price for the future purchase (often referred to as the “drop”) as well as by the interest earned on the cash proceeds of the initial sale. Dollar rolls involve the risk that the market value of the securities the Portfolio is obligated to repurchase under the agreement may decline below the repurchase price. Dollar rolls are speculative techniques. For the year ended October 31, 2017, the Portfolio earned drop income of $637,012 which is included in interest income in the accompanying statement of operations.
| 76 | AB INTERMEDIATE BOND PORTFOLIO | abfunds.com |
NOTES TO FINANCIAL STATEMENTS (continued)
NOTE E
Capital Stock
Each class consists of 3,000,000,000 authorized shares. Transactions in capital shares for each class were as follows:
| Shares | Amount | |||||||||||||||||||||||
| Year Ended October 31, 2017 | Year Ended October 31, 2016 | Year Ended October 31, 2017 | Year Ended October 31, 2016 | |||||||||||||||||||||
|
| |||||||||||||||||||||||
| Class A | ||||||||||||||||||||||||
Shares sold | 1,441,055 | 2,201,706 | $ | 15,957,028 | $ | 24,368,945 | ||||||||||||||||||
| ||||||||||||||||||||||||
Shares issued in reinvestment of dividends and distributions | 448,010 | 527,574 | 4,947,934 | 5,831,973 | ||||||||||||||||||||
| ||||||||||||||||||||||||
Shares converted from Class B | 26,419 | 49,298 | 292,232 | 546,216 | ||||||||||||||||||||
| ||||||||||||||||||||||||
Shares converted from Class C | 1,790,738 | – 0 | – | 19,828,064 | – 0 | – | ||||||||||||||||||
| ||||||||||||||||||||||||
Shares redeemed | (3,936,642 | ) | (3,778,000 | ) | (43,496,748 | ) | (41,905,564 | ) | ||||||||||||||||
| ||||||||||||||||||||||||
Net decrease | (230,420 | ) | (999,422 | ) | $ | (2,471,490 | ) | $ | (11,158,430 | ) | ||||||||||||||
| ||||||||||||||||||||||||
Class B | ||||||||||||||||||||||||
Shares sold | 10,541 | 12,222 | $ | 116,178 | $ | 135,425 | ||||||||||||||||||
| ||||||||||||||||||||||||
Shares issued in reinvestment of dividends and distributions | 1,521 | 2,880 | 16,789 | 31,751 | ||||||||||||||||||||
| ||||||||||||||||||||||||
Shares converted to Class A | (26,411 | ) | (49,288 | ) | (292,232 | ) | (546,216 | ) | ||||||||||||||||
| ||||||||||||||||||||||||
Shares redeemed | (17,214 | ) | (20,383 | ) | (189,992 | ) | (225,858 | ) | ||||||||||||||||
| ||||||||||||||||||||||||
Net decrease | (31,563 | ) | (54,569 | ) | $ | (349,257 | ) | $ | (604,898 | ) | ||||||||||||||
|
|
|
|
|
|
|
|
|
|
| ||||||||||||||
Class C | ||||||||||||||||||||||||
Shares sold | 235,175 | 707,843 | $ | 2,598,185 | $ | 7,817,124 | ||||||||||||||||||
| ||||||||||||||||||||||||
Shares issued in reinvestment of dividends and distributions | 41,607 | 67,345 | 457,225 | 742,400 | ||||||||||||||||||||
| ||||||||||||||||||||||||
Shares converted to Class A | (1,794,039 | ) | – 0 | – | (19,828,064 | ) | – 0 | – | ||||||||||||||||
| ||||||||||||||||||||||||
Shares redeemed | (804,733 | ) | (746,536 | ) | (8,862,049 | ) | (8,256,301 | ) | ||||||||||||||||
| ||||||||||||||||||||||||
Net increase (decrease) | (2,321,990 | ) | 28,652 | $ | (25,634,703 | ) | $ | 303,223 | ||||||||||||||||
| ||||||||||||||||||||||||
| abfunds.com | AB INTERMEDIATE BOND PORTFOLIO | 77 |
NOTES TO FINANCIAL STATEMENTS (continued)
| Shares | Amount | |||||||||||||||||||||||
| Year Ended October 31, 2017 | Year Ended October 31, 2016 | Year Ended October 31, 2017 | Year Ended October 31, 2016 | |||||||||||||||||||||
|
| |||||||||||||||||||||||
Advisor Class |
| |||||||||||||||||||||||
Shares sold | 3,558,736 | 4,427,579 | $ | 39,217,553 | $ | 49,003,433 | ||||||||||||||||||
| ||||||||||||||||||||||||
Shares issued in reinvestment of dividends and distributions | 100,138 | 74,968 | 1,107,548 | 831,653 | ||||||||||||||||||||
| ||||||||||||||||||||||||
Shares redeemed | (2,587,093 | ) | (1,564,156 | ) | (28,536,859 | ) | (17,378,185 | ) | ||||||||||||||||
| ||||||||||||||||||||||||
Net increase | 1,071,781 | 2,938,391 | $ | 11,788,242 | $ | 32,456,901 | ||||||||||||||||||
| ||||||||||||||||||||||||
Class R |
| |||||||||||||||||||||||
Shares sold | 100,402 | 49,530 | $ | 1,108,586 | $ | 550,840 | ||||||||||||||||||
| ||||||||||||||||||||||||
Shares issued in reinvestment of dividends and distributions | 6,274 | 7,524 | 69,262 | 83,149 | ||||||||||||||||||||
| ||||||||||||||||||||||||
Shares redeemed | (132,743 | ) | (53,430 | ) | (1,467,549 | ) | (585,664 | ) | ||||||||||||||||
| ||||||||||||||||||||||||
Net increase (decrease) | (26,067 | ) | 3,624 | $ | (289,701 | ) | $ | 48,325 | ||||||||||||||||
| ||||||||||||||||||||||||
Class K |
| |||||||||||||||||||||||
Shares sold | 158,517 | 186,805 | $ | 1,764,118 | $ | 2,068,640 | ||||||||||||||||||
| ||||||||||||||||||||||||
Shares issued in reinvestment of dividends and distributions | 12,863 | 13,274 | 142,184 | 147,054 | ||||||||||||||||||||
| ||||||||||||||||||||||||
Shares redeemed | (150,357 | ) | (46,817 | ) | (1,656,583 | ) | (517,323 | ) | ||||||||||||||||
| ||||||||||||||||||||||||
Net increase | 21,023 | 153,262 | $ | 249,719 | $ | 1,698,371 | ||||||||||||||||||
| ||||||||||||||||||||||||
Class I |
| |||||||||||||||||||||||
Shares sold | 44,879 | 196,134 | $ | 493,946 | $ | 2,200,619 | ||||||||||||||||||
| ||||||||||||||||||||||||
Shares issued in reinvestment of dividends and distributions | 7,290 | 2,550 | 80,647 | 28,431 | ||||||||||||||||||||
| ||||||||||||||||||||||||
Shares redeemed | (39,277 | ) | (12,405 | ) | (433,148 | ) | (137,850 | ) | ||||||||||||||||
| ||||||||||||||||||||||||
Net increase | 12,892 | 186,279 | $ | 141,445 | $ | 2,091,200 | ||||||||||||||||||
| ||||||||||||||||||||||||
Class Z |
| |||||||||||||||||||||||
Shares sold | 1,172,124 | 2,295,097 | $ | 13,024,067 | $ | 25,699,685 | ||||||||||||||||||
| ||||||||||||||||||||||||
Shares issued in reinvestment of dividends and distributions | 50,947 | 34,717 | 564,384 | 385,137 | ||||||||||||||||||||
| ||||||||||||||||||||||||
Shares redeemed | (619,318 | ) | (1,156,346 | ) | (6,895,540 | ) | (12,802,388 | ) | ||||||||||||||||
| ||||||||||||||||||||||||
Net increase | 603,753 | 1,173,468 | $ | 6,692,911 | $ | 13,282,434 | ||||||||||||||||||
| ||||||||||||||||||||||||
| 78 | AB INTERMEDIATE BOND PORTFOLIO | abfunds.com |
NOTES TO FINANCIAL STATEMENTS (continued)
NOTE F
Risks Involved in Investing in the Portfolio
Interest Rate Risk and Credit Risk—Interest rate risk is the risk that changes in interest rates will affect the value of the Portfolio’s investments in fixed-income debt securities such as bonds or notes. Increases in interest rates may cause the value of the Portfolio’s investments to decline. Credit risk is the risk that the issuer or guarantor of a debt security, or the counterparty to a derivative contract, will be unable or unwilling to make timely principal and/or interest payments, or to otherwise honor its obligations. The degree of risk for a particular security may be reflected in its credit rating. Credit risk is greater for medium quality and lower-rated securities. Lower-rated debt securities and similar unrated securities (commonly known as “junk bonds”) have speculative elements or are predominantly speculative risks.
Below Investment Grade Securities Risk—Investments in fixed-income securities with lower ratings (commonly known as “junk bonds”) are subject to a higher probability that an issuer will default or fail to meet its payment obligations. These securities may be subject to greater price volatility due to such factors as specific corporate developments, negative perceptions of the junk bond market generally and less secondary market liquidity.
Duration Risk—Duration is a measure that relates the expected price volatility of a fixed-income security to changes in interest rates. The duration of a fixed-income security may be shorter than or equal to full maturity of a fixed-income security. Fixed-income securities with longer durations have more risk and will decrease in price as interest rates rise. For example, a fixed-income security with a duration of three years will decrease in value by approximately 3% if interest rates increase by 1%.
Inflation Risk—This is the risk that the value of assets or income from investments will be less in the future as inflation decreases the value of money. As inflation increases, the value of the Portfolio’s assets can decline as can the value of the Portfolio’s distributions. This risk is significantly greater for fixed-income securities with longer maturities.
Foreign (Non-U.S.) Risk—Investments in securities of non-U.S. issuers may involve more risk than those of U.S. issuers. These securities may fluctuate more widely in price and may be less liquid due to adverse market, economic, political, regulatory or other factors.
Emerging Market Risk—Investments in emerging market countries may have more risk because the markets are less developed and less liquid, and because these investments may be subject to increased economic, political, regulatory, or other uncertainties.
| abfunds.com | AB INTERMEDIATE BOND PORTFOLIO | 79 |
NOTES TO FINANCIAL STATEMENTS (continued)
Currency Risk—Fluctuations in currency exchange rates may negatively affect the value of the Portfolio’s investments or reduce its returns.
Prepayment Risk—The value of mortgage-related or asset-backed securities may be particularly sensitive to changes in prevailing interest rates. Early payments of principal on some mortgage-related securities may occur during periods of falling mortgage interest rates and expose the Portfolio to a lower rate of return upon reinvestment of principal. Early payments associated with mortgage-related securities cause these securities to experience significantly greater price and yield volatility than is experienced by traditional fixed-income securities. During periods of rising interest rates, a reduction in prepayments may increase the effective life of mortgage-related securities, subjecting them to greater risk of decline in market value in response to rising interest rates. If the life of a mortgage-related security is inaccurately predicted, the Portfolio may not be able to realize the rate of return it expected.
Leverage Risk—When the Portfolio borrows money or otherwise leverages its investments, its performance may be volatile because leverage tends to exaggerate the effect of any increase or decrease in the value of the Portfolio’s investments. The Portfolio may create leverage through the use of reverse repurchase arrangements, forward currency exchange contracts, forward commitments, dollar rolls or futures or by borrowing money. The use of other types of derivative instruments by the Portfolio, such as options and swaps, may also result in a form of leverage. Leverage may result in higher returns to the Portfolio than if the Portfolio were not leveraged, but may also adversely affect returns, particularly if the market is declining.
Derivatives Risk—The Portfolio may enter into derivative transactions such as forwards, options, futures and swaps. Derivatives may be illiquid, difficult to price, and leveraged so that small changes may produce disproportionate losses for the Portfolio, and subject to counterparty risk to a greater degree than more traditional investments. Derivatives may result in significant losses, including losses that are far greater than the value of the derivatives reflected on the statement of assets and liabilities.
Liquidity Risk—Liquidity risk occurs when certain investments become difficult to purchase or sell. Difficulty in selling less liquid securities may result in sales at disadvantageous prices affecting the value of your investment in the Portfolio. Causes of liquidity risk may include low trading volumes, large positions and heavy redemptions of portfolio shares. Over recent years, liquidity risk has also increased because the capacity of dealers in the secondary market for fixed-income securities to make markets in these securities has decreased, even as the overall bond market
| 80 | AB INTERMEDIATE BOND PORTFOLIO | abfunds.com |
NOTES TO FINANCIAL STATEMENTS (continued)
has grown significantly, due to, among other things, structural changes, additional regulatory requirements and capital and risk restraints that have led to reduced inventories. Liquidity risk may be higher in a rising interest rate environment, when the value and liquidity of fixed-income securities generally decline.
Indemnification Risk—In the ordinary course of business, the Portfolio enters into contracts that contain a variety of indemnifications. The Portfolio’s maximum exposure under these arrangements is unknown. However, the Portfolio has not had prior claims or losses pursuant to these indemnification provisions and expects the risk of loss thereunder to be remote. Therefore, the Portfolio has not accrued any liability in connection with these indemnification provisions.
NOTE G
Joint Credit Facility
A number of open-end mutual funds managed by the Adviser, including the Portfolio, participate in a $280 million revolving credit facility (the “Facility”) intended to provide short-term financing, if necessary, subject to certain restrictions in connection with abnormal redemption activity. Commitment fees related to the Facility are paid by the participating funds and are included in miscellaneous expenses in the statement of operations. The Portfolio did not utilize the Facility during the year ended October 31, 2017.
NOTE H
Distributions to Shareholders
The tax character of distributions paid during the fiscal years ended October 31, 2017 and October 31, 2016 were as follows:
| 2017 | 2016 | |||||||
Distributions paid from: | ||||||||
Ordinary income | $ | 8,551,774 | $ | 11,308,484 | ||||
Net long-term capital gains | 181,353 | 0 | ||||||
|
|
|
| |||||
Total taxable distributions paid | $ | 8,733,127 | $ | 11,308,484 | ||||
Return of capital | 1,109,149 | 0 | ||||||
|
|
|
| |||||
Total distributions paid | $ | 9,842,276 | $ | 11,308,484 | ||||
|
|
|
| |||||
As of October 31, 2017, the components of accumulated earnings/(deficit) on a tax basis were as follows:
Accumulated capital and other losses | $ | (1,941,842 | )(a) | |
Unrealized appreciation/(depreciation) | 2,375,917 | (b) | ||
|
| |||
Total accumulated earnings/(deficit) | $ | 434,075 | (c) | |
|
|
| (a) | As of October 31, 2017, the Portfolio had a net capital loss carryforward of $1,912,685. As of October 31, 2017, the cumulative deferred loss on straddles was $29,157. |
| abfunds.com | AB INTERMEDIATE BOND PORTFOLIO | 81 |
NOTES TO FINANCIAL STATEMENTS (continued)
| (b) | The differences between book-basis and tax-basis unrealized appreciation/(depreciation) are attributable primarily to the tax deferral of losses on wash sales, the tax treatment of swaps, the tax treatment of passive foreign investment companies (PFICs), the recognition for tax purposes of unrealized gains/losses on certain derivative instruments, and corporate restructuring. |
| (c) | Other differences in book-basis and tax-basis components of accumulated earnings/(deficit) are attributable primarily to dividends payable and the tax treatment of defaulted securities. |
For tax purposes, net realized capital losses may be carried over to offset future capital gains, if any. Funds are permitted to carry forward capital losses for an indefinite period, and such losses will retain their character as either short-term or long-term capital losses. As of October 31, 2017, the Portfolio had a net short-term capital loss carryforward of $1,008,599 and a net long-term capital loss carryforward of $904,086, which may be carried forward for an indefinite period.
During the current fiscal year, permanent differences primarily due to the tax treatment of swaps, foreign currency reclassifications, paydown gain/loss reclassifications, contributions from Affiliates, and the redesignation of dividends resulted in a net increase in undistributed net investment income, a net increase in accumulated net realized loss on investment and foreign currency transactions, and a net decrease in additional paid-in capital. These reclassifications had no effect on net assets.
NOTE I
Recent Accounting Pronouncements
In March 2017, the Financial Accounting Standards Board issued an Accounting Standards Update, ASU 2017-08, Receivables - Nonrefundable Fees and Other Costs (Subtopic 310-20), Premium Amortization on Purchased Callable Debt Securities (the “ASU”) which amends the amortization period for certain purchased callable debt securities held at a premium, shortening such period to the earliest call date. The ASU does not require any accounting change for debt securities held at a discount; the discount continues to be amortized to maturity. The ASU is effective for fiscal years, and interim periods within those fiscal years, beginning after December 15, 2018. At this time, management is evaluating the implications of these changes on the financial statements.
NOTE J
Subsequent Events
Management has evaluated subsequent events for possible recognition or disclosure in the financial statements through the date the financial statements are issued. Management has determined that there are no material events that would require disclosure in the Portfolio’s financial statements through this date.
| 82 | AB INTERMEDIATE BOND PORTFOLIO | abfunds.com |
FINANCIAL HIGHLIGHTS
Selected Data For A Share Of Capital Stock Outstanding Throughout Each Period
| Class A | ||||||||||||||||||||
| Year Ended October 31, | ||||||||||||||||||||
| 2017 | 2016 | 2015 | 2014 | 2013 | ||||||||||||||||
|
| |||||||||||||||||||
Net asset value, beginning of period | $ 11.23 | $ 11.06 | $ 11.24 | $ 11.00 | $ 11.40 | |||||||||||||||
|
| |||||||||||||||||||
Income From Investment Operations | ||||||||||||||||||||
Net investment income(a)(b) | .24 | † | .26 | .28 | .35 | .26 | ||||||||||||||
Net realized and unrealized gain (loss) on investment and foreign currency transactions | (.06 | ) | .27 | (.12 | ) | .23 | (.35 | ) | ||||||||||||
Contributions from Affiliates | .00 | (c) | – 0 | – | – 0 | – | – 0 | – | – 0 | – | ||||||||||
|
| |||||||||||||||||||
Net increase (decrease) in net asset value from operations | .18 | .53 | .16 | .58 | (.09 | ) | ||||||||||||||
|
| |||||||||||||||||||
Less: Dividends and Distributions | ||||||||||||||||||||
Dividends from net investment income | (.23 | ) | (.36 | ) | (.34 | ) | (.34 | ) | (.31 | ) | ||||||||||
Distributions from net realized gain on investment transactions | (.04 | ) | – 0 | – | – 0 | – | – 0 | – | – 0 | – | ||||||||||
Tax return of capital | (.03 | ) | – 0 | – | – 0 | – | – 0 | – | – 0 | – | ||||||||||
|
| |||||||||||||||||||
Total dividends and distributions | (.30 | ) | (.36 | ) | (.34 | ) | (.34 | ) | (.31 | ) | ||||||||||
|
| |||||||||||||||||||
Net asset value, end of period | $ 11.11 | $ 11.23 | $ 11.06 | $ 11.24 | $ 11.00 | |||||||||||||||
|
| |||||||||||||||||||
Total Return | ||||||||||||||||||||
Total investment return based on net asset value(d) | 1.68 | %† | 4.93 | % | 1.45 | % | 5.34 | %* | (.81 | )%†† | ||||||||||
Ratios/Supplemental Data | ||||||||||||||||||||
Net assets, end of period (000’s omitted) | $240,386 | $245,683 | $252,965 | $273,962 | $301,764 | |||||||||||||||
Ratio to average net assets of: | ||||||||||||||||||||
Expenses, net of waivers/reimbursements | .79 | % | .85 | % | .88 | % | .90 | % | .89 | % | ||||||||||
Expenses, before waivers/reimbursements | 1.03 | % | 1.03 | % | 1.06 | % | 1.06 | % | 1.02 | % | ||||||||||
Net investment income(b) | 2.16 | %† | 2.35 | % | 2.51 | % | 3.15 | % | 2.32 | % | ||||||||||
Portfolio turnover rate** | 209 | % | 128 | % | 198 | % | 221 | % | 189 | % | ||||||||||
See footnote summary on page 91.
| abfunds.com | AB INTERMEDIATE BOND PORTFOLIO | 83 |
FINANCIAL HIGHLIGHTS (continued)
Selected Data For A Share Of Capital Stock Outstanding Throughout Each Period
| Class B | ||||||||||||||||||||
| Year Ended October 31, | ||||||||||||||||||||
| 2017 | 2016 | 2015 | 2014 | 2013 | ||||||||||||||||
|
| |||||||||||||||||||
Net asset value, beginning of period | $ 11.23 | $ 11.06 | $ 11.24 | $ 11.00 | $ 11.41 | |||||||||||||||
|
| |||||||||||||||||||
Income From Investment Operations | ||||||||||||||||||||
Net investment income(a)(b) | .15 | † | .18 | .20 | .28 | .18 | ||||||||||||||
Net realized and unrealized gain (loss) on investment and foreign currency transactions | (.05 | ) | .27 | (.12 | ) | .22 | (.36 | ) | ||||||||||||
Contributions from Affiliates | .00 | (c) | – 0 | – | – 0 | – | – 0 | – | – 0 | – | ||||||||||
|
| |||||||||||||||||||
Net increase (decrease) in net asset value from operations | .10 | .45 | .08 | .50 | (.18 | ) | ||||||||||||||
|
| |||||||||||||||||||
Less: Dividends and Distributions | ||||||||||||||||||||
Dividends from net investment income | (.16 | ) | (.28 | ) | (.26 | ) | (.26 | ) | (.23 | ) | ||||||||||
Distributions from net realized gain on investment transactions | (.04 | ) | – 0 | – | – 0 | – | – 0 | – | – 0 | – | ||||||||||
Tax return of capital | (.02 | ) | – 0 | – | – 0 | – | – 0 | – | – 0 | – | ||||||||||
|
| |||||||||||||||||||
Total dividends and distributions | (.22 | ) | (.28 | ) | (.26 | ) | (.26 | ) | (.23 | ) | ||||||||||
|
| |||||||||||||||||||
Net asset value, end of period | $ 11.11 | $ 11.23 | $ 11.06 | $ 11.24 | $ 11.00 | |||||||||||||||
|
| |||||||||||||||||||
Total Return | ||||||||||||||||||||
Total investment return based on net asset value(d) | .92 | %† | 4.15 | % | .72 | % | 4.61 | %* | (1.59 | )%†† | ||||||||||
Ratios/Supplemental Data | ||||||||||||||||||||
Net assets, end of period (000’s omitted) | $743 | $1,106 | $1,692 | $3,017 | $5,348 | |||||||||||||||
Ratio to average net assets of: | ||||||||||||||||||||
Expenses, net of waivers/reimbursements | 1.54 | % | 1.60 | % | 1.60 | % | 1.60 | % | 1.58 | % | ||||||||||
Expenses, before waivers/reimbursements | 1.81 | % | 1.81 | % | 1.80 | % | 1.78 | % | 1.74 | % | ||||||||||
Net investment income(b) | 1.38 | %† | 1.59 | % | 1.77 | % | 2.48 | % | 1.59 | % | ||||||||||
Portfolio turnover rate** | 209 | % | 128 | % | 198 | % | 221 | % | 189 | % | ||||||||||
See footnote summary on page 91.
| 84 | AB INTERMEDIATE BOND PORTFOLIO | abfunds.com |
FINANCIAL HIGHLIGHTS (continued)
Selected Data For A Share Of Capital Stock Outstanding Throughout Each Period
| Class C | ||||||||||||||||||||
| Year Ended October 31, | ||||||||||||||||||||
| 2017 | 2016 | 2015 | 2014 | 2013 | ||||||||||||||||
|
| |||||||||||||||||||
Net asset value, beginning of period | $ 11.21 | $ 11.04 | $ 11.22 | $ 10.98 | $ 11.38 | |||||||||||||||
|
| |||||||||||||||||||
Income From Investment Operations | ||||||||||||||||||||
Net investment income(a)(b) | .15 | † | .18 | .20 | .27 | .18 | ||||||||||||||
Net realized and unrealized gain (loss) on investment and foreign currency transactions | (.06 | ) | .27 | (.12 | ) | .23 | (.35 | ) | ||||||||||||
Contributions from Affiliates | .00 | (c) | – 0 | – | – 0 | – | – 0 | – | – 0 | – | ||||||||||
|
| |||||||||||||||||||
Net increase (decrease) in net asset value from operations | .09 | .45 | .08 | .50 | (.17 | ) | ||||||||||||||
|
| |||||||||||||||||||
Less: Dividends and Distributions | ||||||||||||||||||||
Dividends from net investment income | (.16 | ) | (.28 | ) | (.26 | ) | (.26 | ) | (.23 | ) | ||||||||||
Distributions from net realized gain on investment transactions | (.04 | ) | – 0 | – | – 0 | – | – 0 | – | – 0 | – | ||||||||||
Tax return of capital | (.02 | ) | – 0 | – | – 0 | – | – 0 | – | – 0 | – | ||||||||||
|
| |||||||||||||||||||
Total dividends and distributions | (.22 | ) | (.28 | ) | (.26 | ) | (.26 | ) | (.23 | ) | ||||||||||
|
| |||||||||||||||||||
Net asset value, end of period | $ 11.08 | $ 11.21 | $ 11.04 | $ 11.22 | $ 10.98 | |||||||||||||||
|
| |||||||||||||||||||
Total Return | ||||||||||||||||||||
Total investment return based on net asset value(d) | .83 | %† | 4.16 | % | .73 | % | 4.63 | %* | (1.51 | )%†† | ||||||||||
Ratios/Supplemental Data | ||||||||||||||||||||
Net assets, end of period (000’s omitted) | $15,676 | $41,886 | $40,928 | $42,690 | $47,530 | |||||||||||||||
Ratio to average net assets of: | ||||||||||||||||||||
Expenses, net of waivers/reimbursements | 1.55 | % | 1.60 | % | 1.60 | % | 1.60 | % | 1.59 | % | ||||||||||
Expenses, before waivers/reimbursements | 1.78 | % | 1.78 | % | 1.78 | % | 1.77 | % | 1.73 | % | ||||||||||
Net investment income(b) | 1.38 | %† | 1.60 | % | 1.79 | % | 2.46 | % | 1.62 | % | ||||||||||
Portfolio turnover rate** | 209 | % | 128 | % | 198 | % | 221 | % | 189 | % | ||||||||||
See footnote summary on page 91.
| abfunds.com | AB INTERMEDIATE BOND PORTFOLIO | 85 |
FINANCIAL HIGHLIGHTS (continued)
Selected Data For A Share Of Capital Stock Outstanding Throughout Each Period
| Advisor Class | ||||||||||||||||||||
| Year Ended October 31, | ||||||||||||||||||||
| 2017 | 2016 | 2015 | 2014 | 2013 | ||||||||||||||||
|
| |||||||||||||||||||
Net asset value, beginning of period | $ 11.24 | $ 11.06 | $ 11.24 | $ 11.00 | $ 11.41 | |||||||||||||||
|
| |||||||||||||||||||
Income From Investment Operations | ||||||||||||||||||||
Net investment income(a)(b) | .27 | † | .29 | .31 | .39 | .29 | ||||||||||||||
Net realized and unrealized gain (loss) on investment and foreign currency transactions | (.07 | ) | .28 | (.12 | ) | .22 | (.36 | ) | ||||||||||||
Contributions from Affiliates | .00 | (c) | – 0 | – | – 0 | – | – 0 | – | – 0 | – | ||||||||||
|
| |||||||||||||||||||
Net increase (decrease) in net asset value from operations | .20 | .57 | .19 | .61 | (.07 | ) | ||||||||||||||
|
| |||||||||||||||||||
Less: Dividends and Distributions | ||||||||||||||||||||
Dividends from net investment income | (.25 | ) | (.39 | ) | (.37 | ) | (.37 | ) | (.34 | ) | ||||||||||
Distributions from net realized gain on investment transactions | (.04 | ) | – 0 | – | – 0 | – | – 0 | – | – 0 | – | ||||||||||
Tax return of capital | (.04 | ) | – 0 | – | – 0 | – | – 0 | – | – 0 | – | ||||||||||
|
| |||||||||||||||||||
Total dividends and distributions | (.33 | ) | (.39 | ) | (.37 | ) | (.37 | ) | (.34 | ) | ||||||||||
|
| |||||||||||||||||||
Net asset value, end of period | $ 11.11 | $ 11.24 | $ 11.06 | $ 11.24 | $ 11.00 | |||||||||||||||
|
| |||||||||||||||||||
Total Return | ||||||||||||||||||||
Total investment return based on net asset value(d) | 1.84 | %† | 5.29 | % | 1.73 | % | 5.65 | %* | (.61 | )%†† | ||||||||||
Ratios/Supplemental Data | ||||||||||||||||||||
Net assets, end of period (000’s omitted) | $67,357 | $56,068 | $22,705 | $26,352 | $73,445 | |||||||||||||||
Ratio to average net assets of: | ||||||||||||||||||||
Expenses, net of waivers/reimbursements | .54 | % | .60 | % | .60 | % | .60 | % | .59 | % | ||||||||||
Expenses, before waivers/reimbursements | .78 | % | .78 | % | .77 | % | .75 | % | .72 | % | ||||||||||
Net investment income(b) | 2.41 | %† | 2.60 | % | 2.78 | % | 3.51 | % | 2.60 | % | ||||||||||
Portfolio turnover rate** | 209 | % | 128 | % | 198 | % | 221 | % | 189 | % | ||||||||||
See footnote summary on page 91.
| 86 | AB INTERMEDIATE BOND PORTFOLIO | abfunds.com |
FINANCIAL HIGHLIGHTS (continued)
Selected Data For A Share Of Capital Stock Outstanding Throughout Each Period
| Class R | ||||||||||||||||||||
| Year Ended October 31, | ||||||||||||||||||||
| 2017 | 2016 | 2015 | 2014 | 2013 | ||||||||||||||||
|
| |||||||||||||||||||
Net asset value, beginning of period | $ 11.23 | $ 11.06 | $ 11.24 | $ 11.00 | $ 11.40 | |||||||||||||||
|
| |||||||||||||||||||
Income From Investment Operations | ||||||||||||||||||||
Net investment income(a)(b) | .21 | † | .23 | .26 | .33 | .24 | ||||||||||||||
Net realized and unrealized gain (loss) on investment and foreign currency transactions | (.06 | ) | .28 | (.12 | ) | .23 | (.36 | ) | ||||||||||||
Contributions from Affiliates | .00 | (c) | – 0 | – | – 0 | – | – 0 | – | – 0 | – | ||||||||||
|
| |||||||||||||||||||
Net increase (decrease) in net asset value from operations | .15 | .51 | .14 | .56 | (.12 | ) | ||||||||||||||
|
| |||||||||||||||||||
Less: Dividends and Distributions | ||||||||||||||||||||
Dividends from net investment income | (.21 | ) | (.34 | ) | (.32 | ) | (.32 | ) | (.28 | ) | ||||||||||
Distributions from net realized gain on investment transactions | (.04 | ) | – 0 | – | – 0 | – | – 0 | – | – 0 | – | ||||||||||
Tax return of capital | (.03 | ) | – 0 | – | – 0 | – | – 0 | – | – 0 | – | ||||||||||
|
| |||||||||||||||||||
Total dividends and distributions | (.28 | ) | (.34 | ) | (.32 | ) | (.32 | ) | (.28 | ) | ||||||||||
|
| |||||||||||||||||||
Net asset value, end of period | $ 11.10 | $ 11.23 | $ 11.06 | $ 11.24 | $ 11.00 | |||||||||||||||
|
| |||||||||||||||||||
Total Return | ||||||||||||||||||||
Total investment return based on net asset value(d) | 1.34 | %† | 4.67 | % | 1.23 | % | 5.13 | %* | (1.01 | )%†† | ||||||||||
Ratios/Supplemental Data | ||||||||||||||||||||
Net assets, end of period (000’s omitted) | $2,699 | $3,023 | $2,936 | $2,368 | $2,241 | |||||||||||||||
Ratio to average net assets of: | ||||||||||||||||||||
Expenses, net of waivers/reimbursements | 1.04 | % | 1.10 | % | 1.10 | % | 1.10 | % | 1.09 | % | ||||||||||
Expenses, before waivers/reimbursements | 1.39 | % | 1.38 | % | 1.38 | % | 1.36 | % | 1.31 | % | ||||||||||
Net investment income(b) | 1.91 | %† | 2.10 | % | 2.29 | % | 2.94 | % | 2.13 | % | ||||||||||
Portfolio turnover rate** | 209 | % | 128 | % | 198 | % | 221 | % | 189 | % | ||||||||||
See footnote summary on page 91.
| abfunds.com | AB INTERMEDIATE BOND PORTFOLIO | 87 |
FINANCIAL HIGHLIGHTS (continued)
Selected Data For A Share Of Capital Stock Outstanding Throughout Each Period
| Class K | ||||||||||||||||||||
| Year Ended October 31, | ||||||||||||||||||||
| 2017 | 2016 | 2015 | 2014 | 2013 | ||||||||||||||||
|
| |||||||||||||||||||
Net asset value, beginning of period | $ 11.24 | $ 11.07 | $ 11.24 | $ 11.01 | $ 11.41 | |||||||||||||||
|
| |||||||||||||||||||
Income From Investment Operations | ||||||||||||||||||||
Net investment income(a)(b) | .24 | † | .26 | .28 | .35 | .27 | ||||||||||||||
Net realized and unrealized gain (loss) on investment and foreign currency transactions | (.07 | ) | .27 | (.10 | ) | .22 | (.36 | ) | ||||||||||||
Contributions from Affiliates | .00 | (c) | – 0 | – | – 0 | – | – 0 | – | – 0 | – | ||||||||||
|
| |||||||||||||||||||
Net increase (decrease) in net asset value from operations | .17 | .53 | .18 | .57 | (.09 | ) | ||||||||||||||
|
| |||||||||||||||||||
Less: Dividends and Distributions | ||||||||||||||||||||
Dividends from net investment income | (.23 | ) | (.36 | ) | (.35 | ) | (.34 | ) | (.31 | ) | ||||||||||
Distributions from net realized gain on investment transactions | (.04 | ) | – 0 | – | – 0 | – | – 0 | – | – 0 | – | ||||||||||
Tax return of capital | (.03 | ) | – 0 | – | – 0 | – | – 0 | – | – 0 | – | ||||||||||
|
| |||||||||||||||||||
Total dividends and distributions | (.30 | ) | (.36 | ) | (.35 | ) | (.34 | ) | (.31 | ) | ||||||||||
|
| |||||||||||||||||||
Net asset value, end of period | $ 11.11 | $ 11.24 | $ 11.07 | $ 11.24 | $ 11.01 | |||||||||||||||
|
| |||||||||||||||||||
Total Return | ||||||||||||||||||||
Total investment return based on net asset value(d) | 1.59 | %† | 4.93 | % | 1.57 | % | 5.30 | %* | (.76 | )%†† | ||||||||||
Ratios/Supplemental Data | ||||||||||||||||||||
Net assets, end of period (000’s omitted) | $5,876 | $5,706 | $3,922 | $4,515 | $3,459 | |||||||||||||||
Ratio to average net assets of: | ||||||||||||||||||||
Expenses, net of waivers/reimbursements | .79 | % | .85 | % | .85 | % | .85 | % | .84 | % | ||||||||||
Expenses, before waivers/reimbursements | 1.09 | % | 1.09 | % | 1.08 | % | 1.03 | % | .93 | % | ||||||||||
Net investment income(b) | 2.15 | %† | 2.34 | % | 2.53 | % | 3.17 | % | 2.38 | % | ||||||||||
Portfolio turnover rate** | 209 | % | 128 | % | 198 | % | 221 | % | 189 | % | ||||||||||
See footnote summary on page 91.
| 88 | AB INTERMEDIATE BOND PORTFOLIO | abfunds.com |
FINANCIAL HIGHLIGHTS (continued)
Selected Data For A Share Of Capital Stock Outstanding Throughout Each Period
| Class I | ||||||||||||||||||||
| Year Ended October 31, | ||||||||||||||||||||
| 2017 | 2016 | 2015 | 2014 | 2013 | ||||||||||||||||
|
| |||||||||||||||||||
Net asset value, beginning of period | $ 11.24 | $ 11.07 | $ 11.25 | $ 11.01 | $ 11.42 | |||||||||||||||
|
| |||||||||||||||||||
Income From Investment Operations | ||||||||||||||||||||
Net investment income(a)(b) | .27 | † | .28 | .31 | .36 | .18 | ||||||||||||||
Net realized and unrealized gain (loss) on investment and foreign currency transactions | (.06 | ) | .28 | (.12 | ) | .25 | (.25 | ) | ||||||||||||
Contributions from Affiliates | .00 | (c) | – 0 | – | – 0 | – | – 0 | – | – 0 | – | ||||||||||
|
| |||||||||||||||||||
Net increase (decrease) in net asset value from operations | .21 | .56 | .19 | .61 | (.07 | ) | ||||||||||||||
|
| |||||||||||||||||||
Less: Dividends and Distributions | ||||||||||||||||||||
Dividends from net investment income | (.25 | ) | (.39 | ) | (.37 | ) | (.37 | ) | (.34 | ) | ||||||||||
Distributions from net realized gain on investment transactions | (.04 | ) | – 0 | – | – 0 | – | – 0 | – | – 0 | – | ||||||||||
Tax return of capital | (.04 | ) | – 0 | – | – 0 | – | – 0 | – | – 0 | – | ||||||||||
|
| |||||||||||||||||||
Total dividends and distributions | (.33 | ) | (.39 | ) | (.37 | ) | (.37 | ) | (.34 | ) | ||||||||||
|
| |||||||||||||||||||
Net asset value, end of period | $ 11.12 | $ 11.24 | $ 11.07 | $ 11.25 | $ 11.01 | |||||||||||||||
|
| |||||||||||||||||||
Total Return | ||||||||||||||||||||
Total investment return based on net asset value(d) | 1.93 | %† | 5.20 | % | 1.73 | % | 5.65 | %* | (.62 | )%†† | ||||||||||
Ratios/Supplemental Data | ||||||||||||||||||||
Net assets, end of period (000’s omitted) | $2,729 | $2,613 | $511 | $107 | $14 | |||||||||||||||
Ratio to average net assets of: | ||||||||||||||||||||
Expenses, net of waivers/reimbursements | .54 | % | .60 | % | .60 | % | .60 | % | .56 | % | ||||||||||
Expenses, before waivers/reimbursements | .75 | % | .76 | % | .75 | % | .75 | % | .67 | % | ||||||||||
Net investment income(b) | 2.41 | %† | 2.56 | % | 2.74 | % | 3.22 | % | 2.46 | % | ||||||||||
Portfolio turnover rate** | 209 | % | 128 | % | 198 | % | 221 | % | 189 | % | ||||||||||
See footnote summary on page 91.
| abfunds.com | AB INTERMEDIATE BOND PORTFOLIO | 89 |
FINANCIAL HIGHLIGHTS (continued)
Selected Data For A Share Of Capital Stock Outstanding Throughout Each Period
| Class Z | ||||||||||||||||
| Year Ended October 31, | April 28, October 31, | |||||||||||||||
| 2017 | 2016 | 2015 | ||||||||||||||
|
| |||||||||||||||
Net asset value, beginning of period | $ 11.26 | $ 11.08 | $ 11.26 | $ 11.15 | ||||||||||||
|
| |||||||||||||||
Income From Investment Operations | ||||||||||||||||
Net investment income(a)(b) | .27 | † | .28 | .32 | .19 | |||||||||||
Net realized and unrealized gain (loss) on investment and foreign currency transactions | (.07 | ) | .29 | (.13 | ) | .10 | ||||||||||
Contributions from Affiliates | .00 | (c) | – 0 | – | – 0 | – | – 0 | – | ||||||||
|
| |||||||||||||||
Net increase in net asset value from operations | .20 | .57 | .19 | .29 | ||||||||||||
|
| |||||||||||||||
Less: Dividends and Distributions | ||||||||||||||||
Dividends from net investment income | (.25 | ) | (.39 | ) | (.37 | ) | (.37 | ) | ||||||||
Distributions from net realized gain on investment transactions | (.04 | ) | – 0 | – | – 0 | – | – 0 | – | ||||||||
Tax return of capital | (.04 | ) | – 0 | – | – 0 | – | – 0 | – | ||||||||
|
| |||||||||||||||
Total dividends and distributions | (.33 | ) | (.39 | ) | (.37 | ) | (.18 | ) | ||||||||
|
| |||||||||||||||
Net asset value, end of period | $ 11.13 | $ 11.26 | $ 11.08 | $ 11.26 | ||||||||||||
|
| |||||||||||||||
Total Return | ||||||||||||||||
Total investment return based on net asset value(d) | 1.84 | %† | 5.28 | % | 1.72 | % | 2.61 | % | ||||||||
Ratios/Supplemental Data | ||||||||||||||||
Net assets, end of period | $24,653 | $18,134 | $4,851 | $10 | ||||||||||||
Ratio to average net assets of: | ||||||||||||||||
Expenses, net of waivers/reimbursements | .54 | % | .60 | % | .60 | % | .60 | %^ | ||||||||
Expenses, before waivers/reimbursements | .66 | % | .66 | % | .71 | % | .66 | %^ | ||||||||
Net investment income(b) | 2.42 | %† | 2.52 | % | 2.91 | % | 3.29 | %^ | ||||||||
Portfolio turnover rate** | 209 | % | 128 | % | 198 | % | 221 | % | ||||||||
See footnote summary on page 91.
| 90 | AB INTERMEDIATE BOND PORTFOLIO | abfunds.com |
FINANCIAL HIGHLIGHTS (continued)
Selected Data For A Share Of Capital Stock Outstanding Throughout Each Period
| (a) | Based on average shares outstanding. |
| (b) | Net of fees waived and expenses reimbursed by the Adviser. |
| (c) | Amount is less than $.005. |
| (d) | Total investment return is calculated assuming an initial investment made at the net asset value at the beginning of the period, reinvestment of all dividends and distributions at net asset value during the period, and redemption on the last day of the period. Initial sales charges or contingent deferred sales charges are not reflected in the calculation of total investment return. Total return does not reflect the deduction of taxes that a shareholder would pay on portfolio distributions or the redemption of portfolio shares. Total investment return calculated for a period of less than one year is not annualized. |
| (e) | Commencement of operations. |
| † | For the year ended October 31, 2017 the amount includes a refund for overbilling of prior years’ custody out of pocket fees as follows: |
Net Investment | Net Investment | Total | ||
| $ .002 | .02% | .02% |
| * | Includes the impact of proceeds received and credited to the Portfolio resulting from class action settlements, which enhanced the Portfolio’s performance for the year ended October 31, 2014 by 0.01%. |
| †† | Includes the impact of proceeds received and credited to the Portfolio resulting from regulatory settlements, which enhanced the Portfolio’s performance for the year ended October 31, 2013 by 0.14%. |
| ** | The Portfolio accounts for dollar roll transactions as purchases and sales. |
See notes to financial statements.
| abfunds.com | AB INTERMEDIATE BOND PORTFOLIO | 91 |
REPORT OF INDEPENDENT REGISTERED
PUBLIC ACCOUNTING FIRM
To the Board of Directors and Shareholders
of AB Intermediate Bond Portfolio
We have audited the accompanying statement of assets and liabilities, including the portfolio of investments, of AB Intermediate Bond Portfolio (the “Fund”), one of the portfolios constituting the AB Bond Fund, Inc., as of October 31, 2017, and the related statement of operations for the year then ended, the statements of changes in net assets for each of the two years in the period then ended, and the financial highlights for each of the periods presented therein. These financial statements and financial highlights are the responsibility of the Fund’s management. Our responsibility is to express an opinion on these financial statements and financial highlights based on our audits.
We conducted our audits in accordance with the standards of the Public Company Accounting Oversight Board (United States). Those standards require that we plan and perform the audit to obtain reasonable assurance about whether the financial statements and financial highlights are free of material misstatement. We were not engaged to perform an audit of the Fund’s internal control over financial reporting. Our audits included consideration of internal control over financial reporting as a basis for designing audit procedures that are appropriate in the circumstances, but not for the purpose of expressing an opinion on the effectiveness of the Fund’s internal control over financial reporting. Accordingly, we express no such opinion. An audit also includes examining, on a test basis, evidence supporting the amounts and disclosures in the financial statements and financial highlights, assessing the accounting principles used and significant estimates made by management, and evaluating the overall financial statement presentation. Our procedures included confirmation of securities owned as of October 31, 2017, by correspondence with the custodian and others, or by other appropriate auditing procedures where replies from others were not received. We believe that our audits provide a reasonable basis for our opinion.
In our opinion, the financial statements and financial highlights referred to above present fairly, in all material respects, the financial position of AB Intermediate Bond Portfolio (one of the portfolios constituting the AB Bond Fund, Inc.) at October 31, 2017, the results of its operations for the year then ended, the changes in its net assets for each of the two years in the period then ended, and the financial highlights for each of the periods presented therein, in conformity with U.S. generally accepted accounting principles.

New York, New York
December 29, 2017
| 92 | AB INTERMEDIATE BOND PORTFOLIO | abfunds.com |
2017 FEDERAL TAX INFORMATION
(unaudited)
For Federal income tax purposes, the following information is furnished with respect to the distributions paid by the Portfolio during the taxable year ended October 31, 2017. For foreign shareholders, 90.38% of ordinary income dividends paid may be considered to be qualifying to be taxed as interest-related dividends.
Shareholders should not use the above information to prepare their income tax returns. The information necessary to complete your income tax returns will be included with your Form 1099-DIV which will be sent to you separately in January 2018.
| abfunds.com | AB INTERMEDIATE BOND PORTFOLIO | 93 |
BOARD OF DIRECTORS
Marshall C. Turner, Jr.(1), Chairman John H. Dobkin(1)(2) Michael J. Downey(1) William H. Foulk, Jr.(1) D. James Guzy(1)(2) | Nancy P. Jacklin(1) Robert M. Keith, President and Chief Executive Officer Carol C. McMullen(1) Garry L. Moody(1) Earl D. Weiner(1) |
OFFICERS
Philip L. Kirstein(3), Senior Vice President and Independent Compliance Officer Shawn E. Keegan(4), Vice President Douglas J. Peebles(4), Vice President Greg J. Wilensky(4), Vice President | Michael Canter(4), Vice President Emilie D. Wrapp, Secretary Joseph J. Mantineo, Treasurer and Chief Financial Officer Phyllis J. Clarke, Controller Vincent S. Noto, Chief Compliance Officer |
Custodian and Accounting Agent State Street Bank and Trust Company State Street Corporation CCB/5 1 Iron Street Boston, MA 02210
Principal Underwriter AllianceBernstein Investments, Inc. 1345 Avenue of the Americas New York, NY 10105
Transfer Agent AllianceBernstein Investor Services, Inc. P.O. Box 786003 San Antonio, TX 78278-6003 Toll-Free (800) 221-5672 | Independent Registered Public Ernst & Young LLP 5 Times Square New York, NY 10036
Legal Counsel Seward & Kissel LLP One Battery Park Plaza New York, NY 10004 |
| 1 | Member of the Audit Committee, the Governance and Nominating Committee, and the Independent Directors Committee. |
| 2 | Messrs. Dobkin and Guzy are expected to retire on or about December 31, 2017. |
| 3 | Mr. Kirstein is expected to retire on or about December 31, 2017. |
| 4 | The day-to-day management of, and investment decisions for, the Fund’s portfolio are made by the Adviser’s U.S. Investment Grade Core Fixed Income Team. Mr. Shawn E. Keegan, Mr. Douglas J. Peebles, Mr. Greg J. Wilensky and Mr. Michael Canter are the investment professionals with the most significant responsibility for the day-to-day management of the Fund’s portfolio. |
| 94 | AB INTERMEDIATE BOND PORTFOLIO | abfunds.com |
MANAGEMENT OF THE FUND
Board of Directors Information
The business and affairs of the Fund are managed under the direction of the Board of Directors. Certain information concerning the Fund’s Directors is set forth below.
NAME, ADDRESS* AND AGE (YEAR FIRST ELECTED**) | PRINCIPAL DURING PAST FIVE YEARS | PORTFOLIOS IN FUND COMPLEX OVERSEEN BY DIRECTOR | OTHER PUBLIC COMPANY DIRECTORSHIPS CURRENTLY HELD BY DIRECTOR | |||||
| INTERESTED DIRECTOR | ||||||||
Robert M. Keith+ 1345 Avenue of the Americas New York, NY 10105 57 (2010) | Senior Vice President of AllianceBernstein L.P. (the “Adviser”) and head of AllianceBernstein Investments, Inc. (“ABI”) since July 2008; Director of ABI and President of the AB Mutual Funds. Previously, he served as Executive Managing Director of ABI from December 2006 to June 2008. Prior to joining ABI in 2006, Executive Managing Director of Bernstein Global Wealth Management, and prior thereto, Senior Managing Director and Global Head of Client Service and Sales of the Adviser’s institutional investment management business since 2004. Prior thereto, he was Managing Director and Head of North American Client Service and Sales in the Adviser’s institutional investment management business, with which he had been associated since prior to 2004. | 96 | None | |||||
| abfunds.com | AB INTERMEDIATE BOND PORTFOLIO | 95 |
MANAGEMENT OF THE FUND (continued)
NAME, ADDRESS* AND AGE (YEAR FIRST ELECTED**) | PRINCIPAL DURING PAST FIVE YEARS | PORTFOLIOS IN FUND COMPLEX OVERSEEN BY DIRECTOR | OTHER PUBLIC COMPANY DIRECTORSHIPS CURRENTLY HELD BY DIRECTOR | |||||
| DISINTERESTED DIRECTORS | ||||||||
Marshall C. Turner, Jr.# Chairman of the Board 76 (2005) | Private Investor since prior to 2012. Former Chairman and CEO of Dupont Photomasks, Inc. (components of semi-conductor manufacturing). He has extensive operating leadership and venture capital investing experience, including five interim or full-time CEO roles, and prior service as general partner of institutional venture capital partnerships. He also has extensive non-profit board leadership experience, and currently serves on the boards of two education and science-related non-profit organizations. He has served as a director of one AB Fund since 1992, and director or trustee of multiple AB Funds since 2005. He has been Chairman of the AB Funds since January 2014, and the Chairman of the Independent Directors Committees of such AB Funds since February 2014. | 96 | Xilinx, Inc. (programmable logic semi-conductors) since 2007 | |||||
John H. Dobkin#,## 75 (1998) | Independent Consultant since prior to 2012. Formerly, President of Save Venice, Inc. (preservation organization) from 2001-2002; Senior Advisor from June 1999-June 2000 and President of Historic Hudson Valley (historic preservation) from December 1989-May 1999. Previously, Director of the National Academy of Design. He has served as a director or trustee of various AB Funds since 1992, and as Chairman of the Audit Committees of a number of such AB Funds from 2001-2008. | 95 | None | |||||
| 96 | AB INTERMEDIATE BOND PORTFOLIO | abfunds.com |
MANAGEMENT OF THE FUND (continued)
NAME, ADDRESS* AND AGE (YEAR FIRST ELECTED**) | PRINCIPAL DURING PAST FIVE YEARS | PORTFOLIOS IN FUND COMPLEX OVERSEEN BY DIRECTOR | OTHER PUBLIC COMPANY DIRECTORSHIPS CURRENTLY HELD BY DIRECTOR | |||||
| DISINTERESTED DIRECTORS (continued) | ||||||||
Michael J. Downey# 73 (2005) | Private Investor since prior to 2012. Formerly, managing partner of Lexington Capital, LLC (investment advisory firm) from December 1997 until December 2003. He served as a Director of Prospect Acquisition Corp. (financial services) from 2007 until 2009. From 1987 until 1993, Chairman and CEO of Prudential Mutual Fund Management, director of the Prudential mutual funds, and member of the Executive Committee of Prudential Securities Inc. He has served as a director or trustee of the AB Funds since 2005 and is a director and Chairman of one other registered investment company. | 96 | The Asia Pacific Fund, Inc. (registered investment company) since prior to 2012 | |||||
William H. Foulk, Jr.# 85 (1998) | Investment Adviser and an Independent Consultant since prior to 2012. Previously, he was Senior Manager of Barrett Associates, Inc., a registered investment adviser. He was formerly Deputy Comptroller and Chief Investment Officer of the State of New York and, prior thereto, Chief Investment Officer of the New York Bank for Savings. He has served as a director or trustee of various AB Funds since 1983, and was Chairman of the Independent Directors Committees of the AB Funds from 2003 until early February 2014. He served as Chairman of such AB Funds from 2003 through December 2013. He is also active in a number of mutual fund related organizations and committees. | 96 | None | |||||
| abfunds.com | AB INTERMEDIATE BOND PORTFOLIO | 97 |
MANAGEMENT OF THE FUND (continued)
NAME, ADDRESS* AND AGE (YEAR FIRST ELECTED**) | PRINCIPAL DURING PAST FIVE YEARS | PORTFOLIOS IN FUND COMPLEX OVERSEEN BY DIRECTOR | OTHER PUBLIC COMPANY DIRECTORSHIPS CURRENTLY HELD BY DIRECTOR | |||||
| DISINTERESTED DIRECTORS (continued) | ||||||||
D. James Guzy#,## 81 (2005) | Chairman of the Board of SRC Computers, Inc. (semi-conductors), with which he has been associated since prior to 2012. He served as Chairman of the Board of PLX Technology (semi-conductors) since prior to 2012 until November 2013. He was a Director of Intel Corporation (semi-conductors) from 1969 until 2008, and served as Chairman of the Finance Committee of such company for several years until May 2008. He has served as a director or trustee of one or more of the AB Funds since 1982. | 93 | None | |||||
Nancy P. Jacklin# 69 (2006) | Private Investor since prior to 2012. Professorial Lecturer at the Johns Hopkins School of Advanced International Studies (2008-2015). U.S. Executive Director of the International Monetary Fund (which is responsible for ensuring the stability of the international monetary system), (December 2002-May 2006); Partner, Clifford Chance (1992-2002); Sector Counsel, International Banking and Finance, and Associate General Counsel, Citicorp (1985-1992); Assistant General Counsel (International), Federal Reserve Board of Governors (1982-1985); and Attorney Advisor, U.S. Department of the Treasury (1973-1982). Member of the Bar of the District of Columbia and of New York; and member of the Council on Foreign Relations. She has served as a director or trustee of the AB Funds since 2006 and has been Chairman of the Governance and Nominating Committees of the AB Funds since August 2014. | 96 | None | |||||
| 98 | AB INTERMEDIATE BOND PORTFOLIO | abfunds.com |
MANAGEMENT OF THE FUND (continued)
NAME, ADDRESS* AND AGE (YEAR FIRST ELECTED**) | PRINCIPAL DURING PAST FIVE YEARS | PORTFOLIOS IN FUND COMPLEX OVERSEEN BY DIRECTOR | OTHER PUBLIC COMPANY DIRECTORSHIPS CURRENTLY HELD BY DIRECTOR | |||||
| DISINTERESTED DIRECTORS (continued) | ||||||||
Carol C. McMullen# 62 (2016) | Managing Director of Slalom Consulting (consulting) since 2014 and private investor and member of the Partners Healthcare Investment Committee. Formerly, Director of Norfolk & Dedham Group (mutual property and casualty insurance) from 2011 until November 2016; Director of Partners Community Physicians Organization (healthcare) from 2014 until December 2016 and Managing Director of The Crossland Group (consulting) from 2012 to 2013. She has held a number of senior positions in the asset and wealth management industries, including at Eastern Bank (where her roles included President of Eastern Wealth Management), Thomson Financial (Global Head of Sales for Investment Management), and Putnam Investments (where her roles included Head of Global Investment Research). She has served on a number of private company and nonprofit boards, and as a director or trustee of the AB Funds since June 2016. | 96 | None | |||||
| abfunds.com | AB INTERMEDIATE BOND PORTFOLIO | 99 |
MANAGEMENT OF THE FUND (continued)
NAME, ADDRESS* AND AGE (YEAR FIRST ELECTED**) | PRINCIPAL DURING PAST FIVE YEARS | PORTFOLIOS IN FUND COMPLEX OVERSEEN BY DIRECTOR | OTHER PUBLIC COMPANY DIRECTORSHIPS CURRENTLY HELD BY DIRECTOR | |||||
| DISINTERESTED DIRECTORS (continued) | ||||||||
Garry L. Moody# 65 (2008) | Independent Consultant. Formerly, Partner, Deloitte & Touche LLP (1995-2008) where he held a number of senior positions, including Vice Chairman, and U.S. and Global Investment Management Practice Managing Partner; President, Fidelity Accounting and Custody Services Company (1993-1995), where he was responsible for accounting, pricing, custody and reporting for the Fidelity mutual funds; and Partner, Ernst & Young LLP (1975-1993), where he served as the National Director of Mutual Fund Tax Services and Managing Partner of its Chicago Office Tax department. He is a member of the Trustee Advisory Board of BoardIQ, a biweekly publication focused on issues and news affecting directors of mutual funds. He has served as a director or trustee and as Chairman of the Audit Committees of the AB Funds since 2008. | 96 | None | |||||
Earl D. Weiner# 78 (2007) | Of Counsel, and Partner prior to January 2007, of the law firm Sullivan & Cromwell LLP and is a former member of the ABA Federal Regulation of Securities Committee Task Force to draft editions of the Fund Director’s Guidebook. He also serves as a director or trustee of various non-profit organizations and has served as Chairman or Vice Chairman of a number of them. He has served as a director or trustee of the AB Funds since 2007 and served as Chairman of the Governance and Nominating Committees of the AB Funds from 2007 until August 2014. | 96 | None | |||||
| 100 | AB INTERMEDIATE BOND PORTFOLIO | abfunds.com |
MANAGEMENT OF THE FUND (continued)
| * | The address for each of the Fund’s disinterested Directors is c/o AllianceBernstein L.P., Attention: Office of the Senior Officer, 1345 Avenue of the Americas, New York, NY 10105. |
| ** | There is no stated term of office for the Fund’s Directors. |
| *** | The information above includes each Director’s principal occupation during the last five years and other information relating to the experience, attributes and skills relevant to each Director’s qualifications to serve as a Director, which led to the conclusion that each Director should serve as a Director for the Fund. |
| + | Mr. Keith is an “interested person” of the Fund as defined in the “40 Act”, due to his position as a Senior Vice President of the Adviser. |
| # | Member of the Audit Committee, the Governance and Nominating Committee and the Independent Directors Committee. |
| ## | Messrs. Dobkin and Guzy are expected to retire on or about December 31, 2017. |
| abfunds.com | AB INTERMEDIATE BOND PORTFOLIO | 101 |
MANAGEMENT OF THE FUND (continued)
Officer Information
Certain information concerning the Fund’s Officers is set forth below.
| NAME, ADDRESS* AND AGE | PRINCIPAL POSITION(S) HELD WITH FUND | PRINCIPAL OCCUPATION DURING PAST 5 YEARS | ||
Robert M. Keith 57 | President and Chief Executive Officer | See biography above. | ||
| Philip L. Kirstein# 72 | Senior Vice President and Independent Compliance Officer | Senior Vice President and Independent Compliance Officer of the AB Funds, with which he has been associated since October 2004. Prior thereto, he was Of Counsel to Kirkpatrick & Lockhart, LLP from October 2003 to October 2004, and General Counsel of Merrill Lynch Investment Managers, L.P. since prior to March 2003. | ||
| Shawn E. Keegan 46 | Vice President | Vice President of the Adviser**, with which he has been associated since prior to 2012. | ||
| Douglas J. Peebles 52 | Vice President | Senior Vice President of the Adviser**, with which he has been associated since prior to 2012. | ||
| Greg J. Wilensky 50 | Vice President | Senior Vice President of the Adviser**, with which he has been associated since prior to 2012. | ||
| Michael Canter 48 | Vice President | Senior Vice President of the Adviser**, with which he has been associated since prior to 2012. | ||
| Emilie D. Wrapp 62 | Secretary | Senior Vice President, Assistant General Counsel and Assistant Secretary of ABI**, with which she has been associated since prior to 2012. | ||
| Joseph J. Mantineo 58 | Treasurer and Chief Financial Officer | Senior Vice President of AllianceBernstein Investor Services, Inc. (“ABIS”)**, with which he has been associated since prior to 2012. | ||
| Phyllis J. Clarke 56 | Controller | Vice President of ABIS**, with which she has been associated since prior to 2012. | ||
Vincent S. Noto 53 | Chief Compliance Officer | Senior Vice President since 2015 and Mutual Fund Chief Compliance Officer of the Adviser ** since 2014. Prior thereto, he was Vice President and Director of Mutual Fund Compliance of the Adviser** since 2012. |
| * | The address for each of the Fund’s Officers is 1345 Avenue of the Americas, New York, NY 10105. |
| ** | The Adviser, ABI and ABIS are affiliates of the Fund. |
| # | Mr. Kirstein is expected to retire on or about December 31, 2017. |
The Fund’s Statement of Additional Information (“SAI”) has additional information about the Fund’s Directors and Officers and is available without charge upon request. Contact your financial representative or AB at 1-800-227-4618, or visit www.abfunds.com, for a free prospectus or SAI.
| 102 | AB INTERMEDIATE BOND PORTFOLIO | abfunds.com |
Information Regarding the Review and Approval of the Fund’s Advisory Agreement
The disinterested directors (the “directors”) of AB Bond Fund, Inc. (the “Company”) unanimously approved the continuance of the Company’s Advisory Agreement with the Adviser in respect of AB Intermediate Bond Portfolio (the “Fund”) at a meeting held on November 1-3, 2016 (the “Meeting”).
Prior to approval of the continuance of the Advisory Agreement, the directors had requested from the Adviser, and received and evaluated, extensive materials. They reviewed the proposed continuance of the Advisory Agreement with the Adviser and with experienced counsel who are independent of the Adviser, who advised on the relevant legal standards. The directors also reviewed an independent evaluation prepared by the Company’s Senior Officer (who is also the Company’s Independent Compliance Officer) of the reasonableness of the advisory fee, in which the Senior Officer concluded that the contractual fee for the Fund was reasonable. The directors also discussed the proposed continuance in private sessions with counsel and the Company’s Senior Officer.
The directors considered their knowledge of the nature and quality of the services provided by the Adviser to the Fund gained from their experience as directors or trustees of most of the registered investment companies advised by the Adviser, their overall confidence in the Adviser’s integrity and competence they have gained from that experience, the Adviser’s initiative in identifying and raising potential issues with the directors and its responsiveness, frankness and attention to concerns raised by the directors in the past, including the Adviser’s willingness to consider and implement organizational and operational changes designed to improve investment results and the services provided to the AB Funds. The directors noted that they have four regular meetings each year, at each of which they receive presentations from the Adviser on the investment results of the Fund and review extensive materials and information presented by the Adviser.
The directors also considered all other factors they believed relevant, including the specific matters discussed below. In their deliberations, the directors did not identify any particular information that was all-important or controlling, and different directors may have attributed different weights to the various factors. The directors determined that the selection of the Adviser to manage the Fund and the overall arrangements between the Fund and the Adviser, as provided in the Advisory Agreement, including the advisory fee, were fair and reasonable in light of the services performed, expenses incurred and such other matters as the directors considered relevant in the exercise of their business judgment. The material factors and conclusions that formed the basis for the directors’ determinations included the following:
Nature, Extent and Quality of Services Provided
The directors considered the scope and quality of services provided by the Adviser under the Advisory Agreement, including the quality of the investment
| abfunds.com | AB INTERMEDIATE BOND PORTFOLIO | 103 |
research capabilities of the Adviser and the other resources it has dedicated to performing services for the Fund. They also noted the professional experience and qualifications of the Fund’s portfolio management team and other senior personnel of the Adviser. The directors also considered that the Advisory Agreement provides that the Fund will reimburse the Adviser for the cost to it of providing certain clerical, accounting, administrative and other services to the Fund by employees of the Adviser or its affiliates. Requests for these reimbursements are made on a quarterly basis and subject to approval by the directors. Reimbursements, to the extent requested and paid, result in a higher rate of total compensation from the Fund to the Adviser than the fee rate stated in the Advisory Agreement. The directors noted that the methodology used to determine the reimbursement amounts had been reviewed by an independent consultant retained by the Company’s Senior Officer. The quality of administrative and other services, including the Adviser’s role in coordinating the activities of the Fund’s other service providers, also was considered. The directors concluded that, overall, they were satisfied with the nature, extent and quality of services provided to the Fund under the Advisory Agreement.
Costs of Services Provided and Profitability
The directors reviewed a schedule of the revenues and expenses and related notes indicating the profitability of the Fund to the Adviser for calendar years 2014 and 2015 that had been prepared with an expense allocation methodology arrived at in consultation with an independent consultant retained by the Company’s Senior Officer. The directors noted the assumptions and methods of allocation used by the Adviser in preparing fund-specific profitability data and understood that there are a number of potentially acceptable allocation methodologies for information of this type. The directors noted that the profitability information reflected all revenues and expenses of the Adviser’s relationship with the Fund, including those relating to its subsidiaries that provide transfer agency and distribution services to the Fund. The directors recognized that it is difficult to make comparisons of the profitability of the Advisory Agreement with the profitability of fund advisory contracts for unaffiliated funds because comparative information is not generally publicly available and is affected by numerous factors. The directors focused on the profitability of the Adviser’s relationship with the Fund before taxes and distribution expenses. The directors concluded that the Adviser’s level of profitability from its relationship with the Fund was not unreasonable.
Fall-Out Benefits
The directors considered the other benefits to the Adviser and its affiliates from their relationships with the Fund, including, but not limited to, benefits relating to 12b-1 fees and sales charges received by the Fund’s principal underwriter (which is a wholly owned subsidiary of the Adviser) in respect of certain classes of the Fund’s shares; and transfer agency fees paid by the Fund to a wholly owned subsidiary of the Adviser. The directors
| 104 | AB INTERMEDIATE BOND PORTFOLIO | abfunds.com |
recognized that the Adviser’s profitability would be somewhat lower without these benefits. The directors understood that the Adviser also might derive reputational and other benefits from its association with the Fund.
Investment Results
In addition to the information reviewed by the directors in connection with the Meeting, the directors receive detailed performance information for the Fund at each regular Board meeting during the year.
At the Meeting, the directors reviewed information prepared by Broadridge Financial Solutions, Inc. (“Broadridge”), an analytical service that is not affiliated with the Adviser, showing the performance of the Class A Shares of the Fund against a peer group and a peer universe selected by Broadridge, and information prepared by the Adviser showing performance of the Class A Shares against a broad-based securities market index, in each case for the 1-, 3-, 5- and 10-year periods ended July 31, 2016 and (in the case of comparisons with the broad-based securities market index) for the period from inception. Based on their review, the directors concluded that the Fund’s investment performance was acceptable.
Advisory Fees and Other Expenses
The directors considered the advisory fee rate paid by the Fund to the Adviser and information prepared by Broadridge concerning advisory fee rates paid by other funds in the same Broadridge category as the Fund at a common asset level. The directors recognized that it is difficult to make comparisons of advisory fees because there are variations in the services that are included in the fees paid by other funds. The directors compared the Fund’s contractual effective advisory fee rate with a peer group median and took into account the impact on the advisory fee rate of the administrative expense reimbursement paid to the Adviser in the latest fiscal year.
The directors also considered the Adviser’s fee schedule for institutional clients pursuing a similar investment style. For this purpose, they reviewed the relevant advisory fee information from the Adviser’s Form ADV and the evaluation from the Company’s Senior Officer and noted the differences between the Fund’s fee schedule, on the one hand, and the institutional fee schedule and the schedule of fees charged to any offshore funds and any sub-advised funds, on the other. The directors noted that the Adviser may, in some cases, agree to fee rates with large institutional clients that are lower than those reviewed by the directors and that they had previously discussed with the Adviser its policies in respect of such arrangements. The directors also compared the fee rate for the Fund with that for another AB Fund with a similar investment style.
The Adviser reviewed with the directors the significantly greater scope of the services it provides to the Fund relative to institutional, offshore fund
| abfunds.com | AB INTERMEDIATE BOND PORTFOLIO | 105 |
and sub-advised fund clients. In light of the substantial differences in services rendered by the Adviser to institutional, offshore fund and sub-advised fund clients as compared to funds such as the Fund, the directors considered these fee comparisons inapt and did not place significant weight on them in their deliberations.
The directors also considered the total expense ratio of the Class A shares of the Fund in comparison to a peer group and a peer universe selected by Broadridge. The Class A expense ratio of the Fund was based on the Fund’s latest fiscal year and the information included the pro forma expense ratio to reflect a reduction in the expense cap level by the Adviser effective February 1, 2017. The directors noted the effects of any fee waivers and/or expense reimbursements as a result of an undertaking by the Adviser. The directors noted that it was likely that the expense ratios of some of the other funds in the Fund’s Broadridge category were lowered by waivers or reimbursements by those funds’ investment advisers, which in some cases might be voluntary or temporary. The directors view expense ratio information as relevant to their evaluation of the Adviser’s services because the Adviser is responsible for coordinating services provided to the Fund by others. Based on their review, the directors concluded that the Fund’s pro forma expense ratio was acceptable.
Economies of Scale
The directors noted that the advisory fee schedule for the Fund contains breakpoints that reduce the fee rates on assets above specified levels. The directors took into consideration prior presentations by an independent consultant on economies of scale in the mutual fund industry and for the AB Funds, and by the Adviser concerning certain of its views on economies of scale. The directors also had requested and received from the Adviser certain updates on economies of scale in advance of the Meeting. The directors believe that economies of scale may be realized (if at all) by the Adviser across a variety of products and services, and not only in respect of a single fund. The directors noted that there is no established methodology for setting breakpoints that give effect to the fund-specific services provided by a fund’s adviser and to the economies of scale that an adviser may realize in its overall mutual fund business or those components of it which directly or indirectly affect a fund’s operations. The directors observed that in the mutual fund industry as a whole, as well as among funds similar to the Fund, there is no uniformity or pattern in the fees and asset levels at which breakpoints (if any) apply. The directors also noted that the advisory agreements for many funds do not have breakpoints at all. Having taken these factors into account, the directors concluded that the Fund’s shareholders would benefit from a sharing of economies of scale in the event the Fund’s net assets exceed a breakpoint in the future.
| 106 | AB INTERMEDIATE BOND PORTFOLIO | abfunds.com |
This page is not part of the Shareholder Report or the Financial Statements.
AB FAMILY OF FUNDS
US EQUITY
US CORE
Core Opportunities Fund
FlexFee™ US Thematic Portfolio
Select US Equity Portfolio
US GROWTH
Concentrated Growth Fund
Discovery Growth Fund
FlexFee™ Large Cap Growth Portfolio
Growth Fund
Large Cap Growth Fund
Small Cap Growth Portfolio
US VALUE
Discovery Value Fund
Equity Income Fund
Relative Value Fund1
Small Cap Value Portfolio
Value Fund
INTERNATIONAL/ GLOBAL EQUITY
INTERNATIONAL/ GLOBAL CORE
Global Core Equity Portfolio
International Portfolio
International Strategic Core Portfolio
Sustainable Global Thematic Fund1
Tax-Managed International Portfolio
Tax-Managed Wealth Appreciation Strategy
Wealth Appreciation Strategy
INTERNATIONAL/ GLOBAL GROWTH
Concentrated International Growth Portfolio
International Growth Fund
INTERNATIONAL/ GLOBAL EQUITY (continued)
INTERNATIONAL/ GLOBAL VALUE
Asia ex-Japan Equity Portfolio
International Value Fund
FIXED INCOME
MUNICIPAL
High Income Municipal Portfolio
Intermediate California Municipal Portfolio
Intermediate Diversified Municipal Portfolio
Intermediate New York Municipal Portfolio
Municipal Bond Inflation Strategy
Tax-Aware Fixed Income Portfolio
National Portfolio
Arizona Portfolio
California Portfolio
Massachusetts Portfolio
Minnesota Portfolio
New Jersey Portfolio
New York Portfolio
Ohio Portfolio
Pennsylvania Portfolio
Virginia Portfolio
TAXABLE
Bond Inflation Strategy
FlexFee™ International Bond Portfolio
Global Bond Fund
High Income Fund
High Yield Portfolio
Income Fund
Intermediate Bond Portfolio
Limited Duration High Income Portfolio
Short Duration Portfolio
ALTERNATIVES
All Market Real Return Portfolio
Credit Long/Short Portfolio
Global Real Estate Investment Fund
Select US Long/Short Portfolio
Unconstrained Bond Fund
MULTI-ASSET
All Market Income Portfolio
All Market Total Return Portfolio1
Conservative Wealth Strategy
Emerging Markets Multi-Asset Portfolio
Global Risk Allocation Fund
Tax-Managed All Market Income Portfolio1
TARGET-DATE
Multi-Manager Select Retirement Allocation Fund
Multi-Manager Select 2010 Fund
Multi-Manager Select 2015 Fund
Multi-Manager Select 2020 Fund
Multi-Manager Select 2025 Fund
Multi-Manager Select 2030 Fund
Multi-Manager Select 2035 Fund
Multi-Manager Select 2040 Fund
Multi-Manager Select 2045 Fund
Multi-Manager Select 2050 Fund
Multi-Manager Select 2055 Fund
CLOSED-END FUNDS
Alliance California Municipal Income Fund
AllianceBernstein Global High Income Fund
AllianceBernstein National Municipal Income Fund
We also offer Government Money Market Portfolio1, which serves as the money market fund exchange vehicle for the AB mutual funds. An investment in Government Money Market Portfolio is not a deposit in a bank and is not insured or guaranteed by the Federal Deposit Insurance Corporation or any other government agency. Although the Fund seeks to preserve the value of your investment at $1.00 per share, it is possible to lose money by investing in the Fund.
Investors should consider the investment objectives, risks, charges and expenses of the Fund carefully before investing. For copies of our prospectus or summary prospectus, which contain this and other information, visit us online at www.abfunds.com or contact your AB representative. Please read the prospectus and/or summary prospectus carefully before investing.
| 1 | Prior to January 9, 2017, Relative Value Fund was named Growth & Income Fund; prior to April 17, 2017, Tax-Managed All Market Income Portfolio was named Tax-Managed Balanced Wealth Strategy; prior to April 24, 2017, All Market Total Return Portfolio was named Balanced Wealth Strategy; prior to November 10, 2017, Government Money Market Portfolio was named Government Exchange Reserves. |
| abfunds.com | AB INTERMEDIATE BOND PORTFOLIO | 107 |
NOTES
| 108 | AB INTERMEDIATE BOND PORTFOLIO | abfunds.com |
AB INTERMEDIATE BOND PORTFOLIO
1345 Avenue of the Americas
New York, NY 10105
800 221 5672
IB-0151-1017 
OCT 10.31.17

ANNUAL REPORT
AB MUNICIPAL BOND INFLATION STRATEGY


| Investment Products Offered | • Are Not FDIC Insured • May Lose Value • Are Not Bank Guaranteed | |
Investors should consider the investment objectives, risks, charges and expenses of the Fund carefully before investing. For copies of our prospectus or summary prospectus, which contain this and other information, visit us online at www.abfunds.com or contact your AB representative. Please read the prospectus and/or summary prospectus carefully before investing.
This shareholder report must be preceded or accompanied by the Fund’s prospectus for individuals who are not current shareholders of the Fund.
You may obtain a description of the Fund’s proxy voting policies and procedures, and information regarding how the Fund voted proxies relating to portfolio securities during the most recent 12-month period ended June 30, without charge. Simply visit AB’s website at www.abfunds.com, or go to the Securities and Exchange Commission’s (the “Commission”) website at www.sec.gov, or call AB at (800) 227 4618.
The Fund files its complete schedule of portfolio holdings with the Commission for the first and third quarters of each fiscal year on Form N-Q. The Fund’s Forms N-Q are available on the Commission’s website at www.sec.gov. The Fund’s Forms N-Q may also be reviewed and copied at the Commission’s Public Reference Room in Washington, DC; information on the operation of the Public Reference Room may be obtained by calling (800) SEC 0330. AB publishes full portfolio holdings for the Fund monthly at www.abfunds.com.
AllianceBernstein Investments, Inc. (ABI) is the distributor of the AB family of mutual funds. ABI is a member of FINRA and is an affiliate of AllianceBernstein L.P., the Adviser of the funds.
The [A/B] logo is a registered service mark of AllianceBernstein and AllianceBernstein® is a registered service mark used by permission of the owner, AllianceBernstein L.P.
| FROM THE PRESIDENT |  |
Dear Shareholder,
We are pleased to provide this report for AB Municipal Bond Inflation Strategy (the “Strategy”). Please review the discussion of Strategy performance, the market conditions during the reporting period and the Strategy’s investment strategy.
As always, AB strives to keep clients ahead of what’s next by:
| + | Transforming uncommon insights into uncommon knowledge with a global research scope |
| + | Navigating markets with seasoned investment experience and sophisticated solutions |
| + | Providing thoughtful investment insights and actionable ideas |
Whether you’re an individual investor or a multi-billion-dollar institution, we put knowledge and experience to work for you.
AB’s global research organization connects and collaborates across platforms and teams to deliver impactful insights and innovative products. Better insights lead to better opportunities—anywhere in the world.
For additional information about AB’s range of products and shareholder resources, please log on to www.abfunds.com.
Thank you for your investment in the AB Mutual Funds.
Sincerely,

Robert M. Keith
President and Chief Executive Officer, AB Mutual Funds
| abfunds.com | AB MUNICIPAL BOND INFLATION STRATEGY | 1 |
ANNUAL REPORT
December 27, 2017
This report provides management’s discussion of fund performance for AB Municipal Bond Inflation Strategy for the annual period ended October 31, 2017.
The Strategy’s investment objective is to maximize real after-tax return for investors subject to federal income taxes, without undue risk to principal.
NAV RETURNS AS OF OCTOBER 31, 2017 (unaudited)
| 6 Months | 12 Months | |||||||
| AB MUNICIPAL BOND INFLATION STRATEGY | ||||||||
| Class 1 Shares1 | 0.93% | 1.94% | ||||||
| Class 2 Shares1 | 0.97% | 2.04% | ||||||
| Class A Shares | 0.83% | 1.75% | ||||||
| Class C Shares | 0.44% | 0.99% | ||||||
| Advisor Class Shares2 | 0.95% | 2.00% | ||||||
| Bloomberg Barclays 1-10 Year TIPS Index | 0.02% | 0.14% | ||||||
| 1 | Class 1 shares are only available to Bernstein Global Wealth Management private client accounts. Class 2 shares are only available to large Bernstein Global Wealth Management private client accounts and the Adviser’s institutional clients or through other limited arrangements. |
| 2 | Please note that this share class is for investors purchasing shares through accounts established under certain fee-based programs sponsored and maintained by certain broker-dealers and financial intermediaries, institutional pension plans and/or investment advisory clients of, and certain other persons associated with, the Adviser and its affiliates or the Strategy. |
INVESTMENT RESULTS
The table above shows the Strategy’s performance for the six- and 12-month periods ended October 31, 2017, compared to its benchmark, the Bloomberg Barclays 1-10 Year Treasury Inflation-Protected Securities (“TIPS”) Index.
All share classes of the Strategy outperformed the benchmark for both periods, before sales charges.
In order to pursue the investment objective of after-tax real return, the Strategy invests in municipal bonds and uses derivatives for inflation protection. Outperformance relative to the benchmark for both periods was driven by the Strategy’s investment in municipal bonds, which outperformed comparable maturity taxable bonds over both periods.
Consumer price index (“CPI”), or inflation hedges, detracted from performance over the 12-month period, but added to returns over the six-month
| 2 | AB MUNICIPAL BOND INFLATION STRATEGY | abfunds.com |
period as CPI hedges outperformed TIPS inflation breakevens. For both periods, the Strategy’s allocation to mid-grade municipals credit added to relative returns.
The Strategy utilized derivatives for hedging purposes in the form of interest rate swaps, which had no material impact on absolute performance for either period, as well as CPI swaps, which added for the 12-month period and detracted for the six-month period.
MARKET REVIEW AND INVESTMENT STRATEGY
The relatively strong returns in both equities and corporate bonds over both periods were consistent with a positive economic backdrop; major developed and emerging markets—including China—grew at a decent clip while inflation remained moderate. Municipal bond prices were supported by strong technicals, as supply remained low and an historic number of bonds matured or were called by issuers. Municipals delivered positive absolute returns over both periods. Demand for income, along with limited supply, helped mid-grade and high-yield municipals rally strongly.
The US Federal Reserve (the “Fed”) raised its target for the Federal Funds rate by 75 basis points over the past 12 months. On the horizon, major central banks across the globe are likely to normalize monetary policy, which suggests higher interest rates and the eventual end of nearly a decade of quantitative easing. And, in September, the Fed confirmed it would begin the multiyear process of reducing its $4.2 trillion portfolio of Treasury and mortgage-backed bonds.
At the end of the reporting period, municipal investors were focused on the specter of tax reform and how it could potentially impact the after-tax relative attractiveness of municipal bonds. Ultimately, the final legislation included tax reductions for individuals, but the largest reductions in tax rates were those applicable to corporations. The relatively slight lowering of individual tax rates is not expected to significantly reduce the demand from individual investors for municipal bonds. Whether corporations, primarily insurance companies and banks, will reduce their demand for municipal bonds will be a function of the after-tax yield and the potential tax consequences of selling municipal bonds they currently hold, in order to purchase other bonds that offer more attractive after-tax yields. With the after-tax yield advantage for municipal bonds already low by historical standards, the Strategy’s Senior Investment Management Team continues to position the Strategy with an underweight to the longest maturity bonds; this potentially reduces the Strategy’s exposure to a rise in yields, which could result from reduced investor demand for certain municipal bonds.
The Strategy may purchase municipal securities that are insured under policies issued by certain insurance companies. Historically, insured municipal securities typically received a higher credit rating, which meant that the issuer of the securities paid a lower interest rate. As a result of declines in
| abfunds.com | AB MUNICIPAL BOND INFLATION STRATEGY | 3 |
the credit quality and associated downgrades of most fund insurers, insurance has less value than it did in the past. The market now values insured municipal securities primarily based on the credit quality of the issuer of the security with little value given to the insurance feature. In purchasing such insured securities, the Adviser evaluates the risk and return of municipal securities through its own research. If an insurance company’s rating is downgraded or the company becomes insolvent, the prices of municipal securities insured by the insurance company may decline. As of October 31, 2017, the Strategy’s percentages of investments in municipal bonds that are insured and in insured municipal bonds that have been pre-refunded or escrowed to maturity were 5.61% and 0.08%, respectively.
INVESTMENT POLICIES
The Strategy seeks real after-tax return for investors subject to federal income taxes. Real return is the rate of return after adjusting for inflation. The Strategy pursues its objective by investing principally in high-quality, predominantly investment-grade, municipal securities that pay interest exempt from federal taxation. As a fundamental policy, the Strategy will invest at least 80% of its net assets in municipal securities. These securities may be subject to the federal alternative minimum tax for some taxpayers.
The Strategy will invest at least 80% of its total assets in fixed-income securities rated A or better or the equivalent by one or more national rating agencies or deemed to be of comparable credit quality by the Adviser. In deciding whether to take direct or indirect exposure, the Strategy may invest up to 20% of its total assets in fixed-income securities rated BB or B or the equivalent by one or more national rating agencies (or deemed to be of comparable credit quality by the Adviser), which are not investment grade (“junk bonds”). If the rating of a fixed-income security falls below investment-grade, the Strategy will not be obligated to sell the security and may continue to hold it if, in the Adviser’s opinion, the investment is appropriate under the circumstances.
The Strategy may invest in fixed-income securities with any maturity and duration.
To provide inflation protection, the Strategy will typically enter into inflation swaps. The Strategy may use other inflation-indexed instruments. Payments to the Strategy pursuant to swaps will result in taxable income, either ordinary income or capital gains, rather than income exempt from federal income taxation. It is expected that the Strategy’s primary use of derivatives will be for the purpose of inflation protection.
(continued on next page)
| 4 | AB MUNICIPAL BOND INFLATION STRATEGY | abfunds.com |
The Strategy may also invest in forward commitments; zero-coupon municipal securities and variable, floating and inverse floating-rate municipal securities; certain types of mortgage-related securities; and derivatives, such as options, futures contracts, forwards and swaps.
The Strategy may utilize leverage for investment purposes through the use of tender option bond transactions (“TOBs”). The Adviser will consider the impact of TOBs, swaps and other derivatives in making its assessments of the Strategy’s risks. The resulting exposures to markets, sectors, issuers or specific securities will be continuously monitored by the Adviser.
| abfunds.com | AB MUNICIPAL BOND INFLATION STRATEGY | 5 |
DISCLOSURES AND RISKS
Benchmark Disclosure
The Bloomberg Barclays 1-10 Year TIPS Index is unmanaged and does not reflect fees and expenses associated with the active management of a mutual fund portfolio. The Bloomberg Barclays 1-10 Year TIPS Index represents the performance of inflation-protected securities issued by the US Treasury. An investor cannot invest directly in an index, and its results are not indicative of the performance for any specific investment, including the Strategy.
A Word About Risk
Market Risk: The value of the Strategy’s assets will fluctuate as the bond market fluctuates. The value of the Strategy’s investments may decline, sometimes rapidly and unpredictably, simply because of economic changes or other events that affect large portions of the market.
Credit Risk: An issuer or guarantor of a fixed-income security, or the counterparty to a derivatives or other contract, may be unable or unwilling to make timely payments of interest or principal, or to otherwise honor its obligations. The issuer or guarantor may default, causing a loss of the full principal amount of a security. The degree of risk for a particular security may be reflected in its credit rating. There is the possibility that the credit rating of a fixed-income security may be downgraded after purchase, which may adversely affect the value of the security. Investments in fixed-income securities with lower ratings tend to have a higher probability that an issuer will default or fail to meet its payment obligations.
Municipal Market Risk: This is the risk that special factors may adversely affect the value of municipal securities and have a significant effect on the yield or value of the Strategy’s investments in municipal securities. These factors include economic conditions, political or legislative changes, uncertainties related to the tax status of municipal securities, or the rights of investors in these securities. To the extent that the Strategy invests more of its assets in a particular state’s municipal securities, the Strategy is vulnerable to events adversely affecting that state, including economic, political and regulatory occurrences, court decisions, terrorism and catastrophic natural disasters. The Strategy’s investments in certain municipal securities with principal and interest payments that are made from the revenues of a specific project or facility, and not general tax revenues, may have increased risks. Factors affecting the project or facility, such as local business or economic conditions, could have a significant effect on the project’s ability to make payments of principal and interest on these securities. Recent federal legislation included reductions in tax rates for individuals, with relatively larger reductions in tax rates for corporations. These tax rate reductions may reduce the demand for municipal bonds which could reduce the value of municipal bonds held by the Strategy.
| 6 | AB MUNICIPAL BOND INFLATION STRATEGY | abfunds.com |
DISCLOSURES AND RISKS (continued)
Interest Rate Risk: Changes in interest rates will affect the value of investments in fixed-income securities. When interest rates rise, the value of existing investments in fixed-income securities tends to fall and this decrease in value may not be offset by higher income from new investments. The Strategy may be subject to heightened interest rate risk due to rising rates as the current period of historically low rates may be ending. Interest rate risk is generally greater for fixed-income securities with longer maturities or durations.
Duration Risk: Duration is a measure that relates the expected price volatility of a fixed-income security to changes in interest rates. The duration of a fixed-income security may be shorter than or equal to full maturity of a fixed-income security. Fixed-income securities with longer durations have more risk and will decrease in price as interest rates rise. For example, a fixed-income security with a duration of three years will decrease in value by approximately 3% if interest rates increase by 1%.
Inflation Risk: This is the risk that the value of assets or income from investments will be less in the future as inflation decreases the value of money. As inflation increases, the value of the Strategy’s assets can decline as can the value of the Strategy’s distributions. This risk is significantly greater for fixed-income securities with longer maturities.
Derivatives Risk: Derivatives may be illiquid, difficult to price, and leveraged so that small changes may produce disproportionate losses for the Strategy, and may be subject to counterparty risk to a greater degree than more traditional investments.
Leverage Risk: To the extent the Strategy uses leveraging techniques, such as TOBs, its net asset value (“NAV”) may be more volatile because leverage tends to exaggerate the effect of changes in interest rates and any increase or decrease in the value of the Strategy’s investments.
Liquidity Risk: Liquidity risk occurs when certain investments become difficult to purchase or sell. Difficulty in selling less liquid securities may result in sales at disadvantageous prices affecting the value of your investment in the Strategy. Causes of liquidity risk may include low trading volumes, large positions and heavy redemptions of Strategy shares. Over recent years liquidity risk has also increased because the capacity of dealers in the secondary market for fixed-income securities to make markets in these securities has decreased, even as the overall bond market has grown significantly, due to, among other things, structural changes, additional regulatory requirements and capital and risk restraints that have led to reduced inventories. Liquidity risk may be higher in a rising interest rate environment, when the value and liquidity of fixed-income securities generally go down.
| abfunds.com | AB MUNICIPAL BOND INFLATION STRATEGY | 7 |
DISCLOSURES AND RISKS (continued)
Management Risk: The Strategy is subject to management risk because it is an actively managed investment fund. The Adviser will apply its investment techniques and risk analyses in making investment decisions, but there is no guarantee that its techniques will produce the intended results.
These risks are fully discussed in the Strategy’s prospectus. As with all investments, you may lose money by investing in the Strategy.
An Important Note About Historical Performance
The investment return and principal value of an investment in the Strategy will fluctuate, so that shares, when redeemed, may be worth more or less than their original cost. Performance shown in this report represents past performance and does not guarantee future results. Current performance may be lower or higher than the performance information shown. You may obtain performance information current to the most recent month-end by visiting www.abfunds.com. For Class 1 shares visit www.bernstein.com, click on “Investments”, then “Mutual Funds—Mutual Fund Performance at a Glance”.
All fees and expenses related to the operation of the Strategy have been deducted. NAV returns do not reflect sales charges; if sales charges were reflected, the Strategy’s quoted performance would be lower. SEC returns reflect the applicable sales charges for each share class: a 3.00% maximum front-end sales charge for Class A shares and a 1% 1-year contingent deferred sales charge for Class C shares. Class 1 and 2 shares do not carry sales charges. Returns for the different share classes will vary due to different expenses associated with each class. Performance assumes reinvestment of distributions and does not account for taxes.
| 8 | AB MUNICIPAL BOND INFLATION STRATEGY | abfunds.com |
HISTORICAL PERFORMANCE
GROWTH OF A $10,000 INVESTMENT IN THE STRATEGY (unaudited)
1/26/20101 TO 10/31/2017
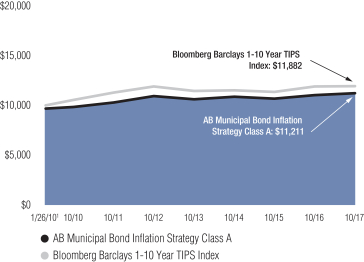
This chart illustrates the total value of an assumed $10,000 investment in AB Municipal Bond Inflation Strategy Class A shares (from 1/26/20101 to 10/31/2017) as compared to the performance of its benchmark. The chart reflects the deduction of the maximum 3.00% sales charge from the initial $10,000 investment in the Strategy and assumes the reinvestment of dividends and capital gains distributions.
| 1 | Inception date: 1/26/2010. |
| abfunds.com | AB MUNICIPAL BOND INFLATION STRATEGY | 9 |
HISTORICAL PERFORMANCE (continued)
AVERAGE ANNUAL RETURNS AS OF OCTOBER 31, 2017 (unaudited)
| NAV Returns | SEC Returns (reflects applicable sales charges) | SEC Yields1 | ||||||||||
| CLASS 1 SHARES2 | 1.29% | |||||||||||
| 1 Year | 1.94% | 1.94% | ||||||||||
| 5 Years | 0.72% | 0.72% | ||||||||||
| Since Inception3 | 2.07% | 2.07% | ||||||||||
| CLASS 2 SHARES2 | 1.39% | |||||||||||
| 1 Year | 2.04% | 2.04% | ||||||||||
| 5 Years | 0.80% | 0.80% | ||||||||||
| Since Inception3 | 2.16% | 2.16% | ||||||||||
| CLASS A SHARES | 0.98% | |||||||||||
| 1 Year | 1.75% | -1.32% | ||||||||||
| 5 Years | 0.52% | -0.08% | ||||||||||
| Since Inception3 | 1.88% | 1.48% | ||||||||||
| CLASS C SHARES | 0.27% | |||||||||||
| 1 Year | 0.99% | -0.01% | ||||||||||
| 5 Years | -0.21% | -0.21% | ||||||||||
| Since Inception3 | 1.16% | 1.16% | ||||||||||
| ADVISOR CLASS SHARES4 | 1.26% | |||||||||||
| 1 Year | 2.00% | 2.00% | ||||||||||
| 5 Years | 0.80% | 0.80% | ||||||||||
| Since Inception3 | 2.17% | 2.17% | ||||||||||
The Strategy’s current prospectus fee table shows the Strategy’s total annual operating expense ratios as 0.68%, 0.58%, 0.86%, 1.61% and 0.61% for Class 1, Class 2, Class A, Class C and Advisor Class shares, respectively, gross of any fee waivers or expense reimbursements. Contractual fee waivers and/or expense reimbursements limit the Strategy’s annual operating expense ratios to 0.60%, 0.50%, 0.75%, 1.50% and 0.50% for Class 1, Class 2, Class A, Class C and Advisor Class shares, respectively. These waivers/reimbursements may not be terminated prior to January 31, 2018 and may be extended by the Adviser for additional one-year terms. Absent reimbursements or waivers, performance would have been lower. The Financial Highlights section of this report sets forth expense ratio data for the current reporting period; the expense ratios shown above may differ from the expense ratios in the Financial Highlights sections since they are based on different time periods.
| 1 | SEC yields are calculated based on SEC guidelines for the 30-day period ended October 31, 2017. |
| 2 | Class 1 shares are only available to Bernstein Global Wealth Management private client accounts. Class 2 shares are only available to large Bernstein Global Wealth Management private client accounts and the Adviser’s institutional clients or through other limited arrangements. |
| 3 | Inception date: 1/26/2010. |
| 4 | This share class is offered at NAV to eligible investors and the SEC returns are the same as the NAV returns. Please note that this share class is for investors purchasing shares through accounts established under certain fee-based programs sponsored and maintained by certain broker-dealers and financial intermediaries, institutional pension plans and/or investment advisory clients of, and certain other persons associated with, the Adviser and its affiliates or the Strategy. |
| 10 | AB MUNICIPAL BOND INFLATION STRATEGY | abfunds.com |
HISTORICAL PERFORMANCE (continued)
SEC AVERAGE ANNUAL RETURNS
AS OF THE MOST RECENT CALENDAR QUARTER-END
SEPTEMBER 30, 2017 (unaudited)
SEC Returns sales charges) | ||||
| CLASS 1 SHARES1 | ||||
| 1 Year | 1.92% | |||
| 5 Years | 0.78% | |||
| Since Inception2 | 2.05% | |||
| CLASS 2 SHARES1 | ||||
| 1 Year | 2.12% | |||
| 5 Years | 0.88% | |||
| Since Inception2 | 2.16% | |||
| CLASS A SHARES | ||||
| 1 Year | -1.23% | |||
| 5 Years | 0.00% | |||
| Since Inception2 | 1.48% | |||
| CLASS C SHARES | ||||
| 1 Year | 0.08% | |||
| 5 Years | -0.11% | |||
| Since Inception2 | 1.16% | |||
| ADVISOR CLASS SHARES3 | ||||
| 1 Year | 2.18% | |||
| 5 Years | 0.90% | |||
| Since Inception2 | 2.17% | |||
| 1 | Class 1 shares are only available to Bernstein Global Wealth Management private client accounts. Class 2 shares are only available to large Bernstein Global Wealth Management private client accounts and the Adviser’s institutional clients or through other limited arrangements. |
| 2 | Inception date: 1/26/2010. |
| 3 | Please note that this share class is for investors purchasing shares through accounts established under certain fee-based programs sponsored and maintained by certain broker-dealers and financial intermediaries, institutional pension plans and/or investment advisory clients of, and certain other persons associated with, the Adviser and its affiliates or the Strategy. |
| abfunds.com | AB MUNICIPAL BOND INFLATION STRATEGY | 11 |
FUND EXPENSES
(unaudited)
As a shareholder of a mutual fund, you may incur two types of costs: (1) transaction costs, including sales charges (loads) on purchase payments, contingent deferred sales charges on redemptions and (2) ongoing costs, including management fees; distribution (12b-1) fees; and other fund expenses. This example is intended to help you understand your ongoing costs (in dollars) of investing in the Fund and to compare these costs with the ongoing costs of investing in other mutual funds.
The Example is based on an investment of $1,000 invested at the beginning of the period and held for the entire period as indicated below.
Actual Expenses
The table below provides information about actual account values and actual expenses. You may use the information in this line, together with the amount you invested, to estimate the expenses that you paid over the period. Simply divide your account value by $1,000 (for example, an $8,600 account value divided by $1,000 = 8.6), then multiply the result by the number in the first line under the heading entitled “Expenses Paid During Period” to estimate the expenses you paid on your account during this period.
Hypothetical Example for Comparison Purposes
The table below provides information about hypothetical account values and hypothetical expenses based on the Fund’s actual expense ratio and an assumed annual rate of return of 5% before expenses, which is not the Fund’s actual return. The hypothetical account values and expenses may not be used to estimate the actual ending account balance or expenses you paid for the period. You may use this information to compare the ongoing costs of investing in the Fund and other funds by comparing this 5% hypothetical example with the 5% hypothetical examples that appear in the shareholder reports of other funds.
Please note that the expenses shown in the table are meant to highlight your ongoing costs only and do not reflect any transactional costs, such as sales charges (loads), or contingent deferred sales charges on redemptions. Therefore, the hypothetical example is useful in comparing ongoing costs only, and will not help you determine the relative total costs of owning different funds. In addition, if these transactional costs were included, your costs would have been higher.
| 12 | AB MUNICIPAL BOND INFLATION STRATEGY | abfunds.com |
EXPENSE EXAMPLE (continued)
| Beginning Account Value May 1, 2017 | Ending Account Value October 31, 2017 | Expenses Paid During Period* | Annualized Expense Ratio* | |||||||||||||
| Class A | ||||||||||||||||
Actual | $ | 1,000 | $ | 1,008.30 | $ | 3.80 | 0.75 | % | ||||||||
Hypothetical** | $ | 1,000 | $ | 1,021.42 | $ | 3.82 | 0.75 | % | ||||||||
| Class C | ||||||||||||||||
Actual | $ | 1,000 | $ | 1,004.40 | $ | 7.58 | 1.50 | % | ||||||||
Hypothetical** | $ | 1,000 | $ | 1,017.64 | $ | 7.63 | 1.50 | % | ||||||||
| Advisor Class | ||||||||||||||||
Actual | $ | 1,000 | $ | 1,009.50 | $ | 2.53 | 0.50 | % | ||||||||
Hypothetical** | $ | 1,000 | $ | 1,022.68 | $ | 2.55 | 0.50 | % | ||||||||
| Class 1 | ||||||||||||||||
Actual | $ | 1,000 | $ | 1,009.30 | $ | 3.04 | 0.60 | % | ||||||||
Hypothetical** | $ | 1,000 | $ | 1,022.18 | $ | 3.06 | 0.60 | % | ||||||||
| Class 2 | ||||||||||||||||
Actual | $ | 1,000 | $ | 1,009.70 | $ | 2.53 | 0.50 | % | ||||||||
Hypothetical** | $ | 1,000 | $ | 1,022.68 | $ | 2.55 | 0.50 | % | ||||||||
| * | Expenses are equal to the classes’ annualized expense ratios multiplied by the average account value over the period, multiplied by 184/365 (to reflect the one-half year period). |
| ** | Assumes 5% annual return before expenses. |
| abfunds.com | AB MUNICIPAL BOND INFLATION STRATEGY | 13 |
PORTFOLIO SUMMARY
October 31, 2017 (unaudited)
PORTFOLIO STATISTICS
Net Assets ($mil): $908.8
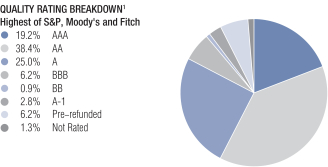
| 1 | All data are as of October 31, 2017. The Strategy’s quality rating breakdown is expressed as a percentage of the Strategy’s total investments in municipal securities and may vary over time. The Strategy also enters into derivative transactions, which may be used for hedging or investment purposes (see “Portfolio of Investments” section of the report for additional details). The quality ratings are determined by using the Standard & Poor’s Global Ratings (“S&P”), Moody’s Investors Services, Inc. (“Moody’s”) and Fitch Ratings, Ltd. (“Fitch”). The Strategy considers the credit ratings issued by S&P, Moody’s and Fitch and uses the highest rating issued by the agencies. These ratings are a measure of the quality and safety of a bond or portfolio, based on the issuer’s financial condition. AAA is the highest (best) and D is the lowest (worst). If applicable, the Pre-refunded category includes bonds which are secured by U.S. Government securities and therefore are deemed high-quality investment-grade by the Adviser. If applicable, Not Applicable (N/A) includes non-creditworthy investments, such as equities, currency contracts, futures and options. If applicable, the Not Rated category includes bonds that are not rated by a nationally recognized statistical rating organization. The Adviser evaluates the creditworthiness of non-rated securities based on a number of factors including, but not limited to, cash flows, enterprise value and economic environment. |
| 14 | AB MUNICIPAL BOND INFLATION STRATEGY | abfunds.com |
PORTFOLIO OF INVESTMENTS
October 31, 2017
| Principal Amount (000) | U.S. $ Value | |||||||
| ||||||||
MUNICIPAL OBLIGATIONS – 98.7% | ||||||||
Long-Term Municipal Bonds – 96.0% | ||||||||
Alabama – 2.3% | ||||||||
Alabama Special Care Facilities Financing Authority-Birmingham AL | $ | 3,905 | $ | 4,561,860 | ||||
County of Jefferson AL Sewer Revenue | 1,825 | 1,875,826 | ||||||
Infirmary Health System Special Care Facilities Financing Authority of Mobile | 2,110 | 2,483,956 | ||||||
Special Care Facilities Financing Authority of the City of Pell City Alabama | 11,235 | 12,344,456 | ||||||
|
| |||||||
| 21,266,098 | ||||||||
|
| |||||||
Arizona – 2.1% | ||||||||
Arizona State University COP | 8,345 | 9,399,046 | ||||||
City of Phoenix Civic Improvement Corp. | 3,330 | 3,742,653 | ||||||
County of Pima AZ Sewer System Revenue | 630 | 692,049 | ||||||
5.00%, 7/01/21 | 1,135 | 1,246,786 | ||||||
Salt River Project Agricultural Improvement & Power District | 3,140 | 3,586,791 | ||||||
|
| |||||||
| 18,667,325 | ||||||||
|
| |||||||
California – 2.4% | ||||||||
San Francisco City & County Airport Comm-San Francisco International Airport | 450 | 476,753 | ||||||
NATL Series 2006-32F | 290 | 296,229 | ||||||
| abfunds.com | AB MUNICIPAL BOND INFLATION STRATEGY | 15 |
PORTFOLIO OF INVESTMENTS (continued)
| Principal Amount (000) | U.S. $ Value | |||||||
| ||||||||
State of California | $ | 5,000 | $ | 5,547,000 | ||||
Series 2012 | 9,305 | 10,297,006 | ||||||
Series 2014 | 4,250 | 5,024,327 | ||||||
|
| |||||||
| 21,641,315 | ||||||||
|
| |||||||
Colorado – 3.5% | ||||||||
Centerra Metropolitan District No 1 | 1,510 | 1,641,400 | ||||||
City & County of Denver CO Airport System Revenue | 375 | 414,517 | ||||||
Series 2012A | 10,395 | 11,957,161 | ||||||
5.00%, 11/15/25 | 3,000 | 3,449,280 | ||||||
Denver City & County School District No 1 | 4,730 | 5,628,038 | ||||||
Denver Urban Renewal Authority | 5,655 | 6,197,986 | ||||||
Plaza Metropolitan District No 1 | 1,310 | 1,399,656 | ||||||
Prairie Center Metropolitan District No 3 | 1,000 | 1,007,950 | ||||||
Regional Transportation District | 440 | 473,691 | ||||||
|
| |||||||
| 32,169,679 | ||||||||
|
| |||||||
Connecticut – 2.2% | ||||||||
State of Connecticut | 5,035 | 5,763,111 | ||||||
Series 2014A | 2,230 | 2,526,545 | ||||||
Series 2014F | 1,275 | 1,471,478 | ||||||
| 16 | AB MUNICIPAL BOND INFLATION STRATEGY | abfunds.com |
PORTFOLIO OF INVESTMENTS (continued)
| Principal Amount (000) | U.S. $ Value | |||||||
| ||||||||
Series 2015B | $ | 4,330 | $ | 5,086,494 | ||||
State of Connecticut | 4,360 | 5,114,455 | ||||||
|
| |||||||
| 19,962,083 | ||||||||
|
| |||||||
Florida – 7.7% | ||||||||
Citizens Property Insurance Corp. | 7,315 | 8,423,149 | ||||||
City of Jacksonville FL | 1,720 | 1,897,212 | ||||||
City of Jacksonville FL | 10,190 | 11,759,541 | ||||||
City of Tampa FL Water & Wastewater System Revenue | 1,565 | 1,774,992 | ||||||
County of Miami-Dade FL | 18,500 | 21,646,125 | ||||||
County of Miami-Dade FL Spl Tax | 1,500 | 1,736,985 | ||||||
Florida Department of Environmental Protection | 3,775 | 4,144,686 | ||||||
Series 2013A | 3,905 | 4,080,620 | ||||||
Florida Municipal Power Agency | 2,890 | 3,258,966 | ||||||
Series 2015B | 1,500 | 1,765,350 | ||||||
Florida State Board of Education | 1,725 | 1,947,560 | ||||||
| abfunds.com | AB MUNICIPAL BOND INFLATION STRATEGY | 17 |
PORTFOLIO OF INVESTMENTS (continued)
| Principal Amount (000) | U.S. $ Value | |||||||
| ||||||||
Greater Orlando Aviation Authority | $ | 4,000 | $ | 4,696,560 | ||||
Martin County Industrial Development Authority | 1,900 | 1,946,835 | ||||||
Mid-Bay Bridge Authority | 1,000 | 1,160,560 | ||||||
|
| |||||||
| 70,239,141 | ||||||||
|
| |||||||
Georgia – 0.4% | ||||||||
Cherokee County Board of Education | 1,000 | 1,102,370 | ||||||
City of Atlanta Department of Aviation | 2,500 | 2,516,000 | ||||||
|
| |||||||
| 3,618,370 | ||||||||
|
| |||||||
Illinois – 5.5% | ||||||||
Chicago O’Hare International Airport | 5,000 | 5,843,650 | ||||||
Series 2016C | 5,000 | 5,781,850 | ||||||
Series 2017B | 1,475 | 1,714,909 | ||||||
Chicago O’Hare International Airport | 2,500 | 2,884,725 | ||||||
5.50%, 1/01/25 | 2,250 | 2,630,858 | ||||||
Illinois Finance Authority | 6,355 | 6,893,275 | ||||||
Sangamon County Water Reclamation District | 2,170 | 2,363,694 | ||||||
State of Illinois | 1,040 | 1,091,282 | ||||||
| 18 | AB MUNICIPAL BOND INFLATION STRATEGY | abfunds.com |
PORTFOLIO OF INVESTMENTS (continued)
| Principal Amount (000) | U.S. $ Value | |||||||
| ||||||||
Series 2010 | $ | 500 | $ | 502,780 | ||||
Series 2013 | 1,670 | 1,810,113 | ||||||
Series 2013A | 4,080 | 4,300,728 | ||||||
Series 2014 | 4,180 | 4,471,346 | ||||||
Series 2017D | 9,220 | 9,972,586 | ||||||
|
| |||||||
| 50,261,796 | ||||||||
|
| |||||||
Indiana – 0.6% | ||||||||
Indiana Municipal Power Agency | 2,860 | 3,090,144 | ||||||
5.00%, 1/01/23 (Pre-refunded/ETM) | 2,105 | 2,380,334 | ||||||
|
| |||||||
| 5,470,478 | ||||||||
|
| |||||||
Kentucky – 1.4% | ||||||||
Kentucky Economic Development Finance Authority | 3,845 | 4,354,961 | ||||||
Kentucky Municipal Power Agency | 4,875 | 5,603,580 | ||||||
Kentucky Turnpike Authority | 2,275 | 2,636,793 | ||||||
|
| |||||||
| 12,595,334 | ||||||||
|
| |||||||
Louisiana – 5.3% | ||||||||
Jefferson Sales Tax District | 1,800 | 2,111,130 | ||||||
State of Louisiana | 30,210 | 35,733,845 | ||||||
State of Louisiana Gasoline & Fuels Tax Revenue | 2,860 | 3,295,092 | ||||||
5.00%, 5/01/27 | 6,225 | 7,104,966 | ||||||
|
| |||||||
| 48,245,033 | ||||||||
|
| |||||||
| abfunds.com | AB MUNICIPAL BOND INFLATION STRATEGY | 19 |
PORTFOLIO OF INVESTMENTS (continued)
| Principal Amount (000) | U.S. $ Value | |||||||
| ||||||||
Maryland – 4.6% | ||||||||
State of Maryland | $ | 10,165 | $ | 11,205,591 | ||||
5.00%, 8/01/21(b) | 26,600 | 30,198,182 | ||||||
|
| |||||||
| 41,403,773 | ||||||||
|
| |||||||
Massachusetts – 4.1% | ||||||||
Commonwealth of Massachusetts | 9,575 | 9,663,090 | ||||||
NATL Series 2000D | 500 | 461,270 | ||||||
NATL Series 2000E | 4,525 | 4,161,914 | ||||||
NATL Series 2000F | 1,000 | 922,580 | ||||||
Commonwealth of Massachusetts | 3,450 | 3,558,364 | ||||||
Massachusetts Bay Transportation Authority | 3,330 | 3,797,798 | ||||||
Series 2004C | 2,650 | 2,685,643 | ||||||
Massachusetts Clean Water Trust (The) | 3,240 | 3,294,238 | ||||||
Massachusetts School Building Authority | 2,475 | 2,871,074 | ||||||
Metropolitan Boston Transit Parking Corp. | 5,025 | 5,656,896 | ||||||
|
| |||||||
| 37,072,867 | ||||||||
|
| |||||||
| 20 | AB MUNICIPAL BOND INFLATION STRATEGY | abfunds.com |
PORTFOLIO OF INVESTMENTS (continued)
| Principal Amount (000) | U.S. $ Value | |||||||
| ||||||||
Michigan – 2.9% | ||||||||
City of Detroit MI Sewage Disposal System | $ | 3,750 | $ | 4,169,325 | ||||
Michigan Finance Authority | 2,735 | 3,180,934 | ||||||
Michigan Finance Authority | 10,545 | 12,358,424 | ||||||
Michigan Finance Authority | 1,785 | 2,059,979 | ||||||
University of Michigan | 4,000 | 4,804,240 | ||||||
|
| |||||||
| 26,572,902 | ||||||||
|
| |||||||
Minnesota – 1.8% | ||||||||
City of Minneapolis MN | 8,205 | 8,464,360 | ||||||
Minnesota Higher Education Facilities Authority | 1,295 | 1,387,567 | ||||||
State of Minnesota | 6,715 | 6,912,824 | ||||||
|
| |||||||
| 16,764,751 | ||||||||
|
| |||||||
Mississippi – 0.5% | ||||||||
Mississippi Development Bank | 1,500 | 1,566,015 | ||||||
Series 2013A | 1,000 | 1,044,010 | ||||||
| abfunds.com | AB MUNICIPAL BOND INFLATION STRATEGY | 21 |
PORTFOLIO OF INVESTMENTS (continued)
| Principal Amount (000) | U.S. $ Value | |||||||
| ||||||||
Mississippi Hospital Equipment & Facilities | $ | 1,500 | $ | 1,668,630 | ||||
|
| |||||||
| 4,278,655 | ||||||||
|
| |||||||
Missouri – 0.3% | ||||||||
City of Springfield MO Public Utility Revenue | 1,390 | 1,394,504 | ||||||
Lees Summit Industrial Development Authority | 1,675 | 1,771,245 | ||||||
|
| |||||||
| 3,165,749 | ||||||||
|
| |||||||
Montana – 0.4% | ||||||||
Montana Facility Finance Authority | 3,275 | 3,784,797 | ||||||
|
| |||||||
Nevada – 1.2% | ||||||||
City of Reno NV | 1,000 | 1,057,690 | ||||||
Series 2013B | 2,210 | 2,337,495 | ||||||
County of Clark Department of Aviation | 775 | 836,753 | ||||||
Las Vegas Valley Water District | 1,500 | 1,643,595 | ||||||
Series 2015B | 4,250 | 4,728,762 | ||||||
|
| |||||||
| 10,604,295 | ||||||||
|
| |||||||
New Jersey – 4.9% | ||||||||
New Jersey Economic Development Authority | 20 | 20,097 | ||||||
New Jersey Economic Development Authority | 1,150 | 1,251,097 | ||||||
| 22 | AB MUNICIPAL BOND INFLATION STRATEGY | abfunds.com |
PORTFOLIO OF INVESTMENTS (continued)
| Principal Amount (000) | U.S. $ Value | |||||||
| ||||||||
Series 2014U | $ | 4,250 | $ | 4,783,885 | ||||
Series 2017B | 1,000 | 1,082,000 | ||||||
New Jersey Transportation Trust Fund Authority | 4,390 | 4,931,726 | ||||||
New Jersey Transportation Trust Fund Authority | 10,000 | 10,939,600 | ||||||
Series 2014C | 2,960 | 3,240,845 | ||||||
New Jersey Turnpike Authority | 1,600 | 1,878,096 | ||||||
5.00%, 1/01/23 | 200 | 232,492 | ||||||
Series 2014A | 4,785 | 5,637,065 | ||||||
Series 2014C | 1,590 | 1,845,751 | ||||||
Series 2017A | 7,300 | 8,570,565 | ||||||
|
| |||||||
| 44,413,219 | ||||||||
|
| |||||||
New York – 14.1% | ||||||||
City of New York NY | 4,250 | 4,801,565 | ||||||
Series 2014J | 6,100 | 6,894,037 | ||||||
Metropolitan Transportation Authority | 4,065 | 4,756,904 | ||||||
5.00%, 11/15/25 (Pre-refunded/ETM) | 5,000 | 5,851,050 | ||||||
Series 2012F | 3,635 | 4,205,877 | ||||||
Series 2013A | 2,300 | 2,682,191 | ||||||
Series 2013E | 8,510 | 10,071,670 | ||||||
New York City Municipal Water Finance Authority | 3,875 | 4,364,141 | ||||||
| abfunds.com | AB MUNICIPAL BOND INFLATION STRATEGY | 23 |
PORTFOLIO OF INVESTMENTS (continued)
| Principal Amount (000) | U.S. $ Value | |||||||
| ||||||||
New York City Transitional Finance Authority Future Tax Secured Revenue | $ | 6,830 | $ | 7,983,929 | ||||
New York State Dormitory Authority | 3,000 | 3,358,410 | ||||||
Series 2012A | 14,610 | 17,096,914 | ||||||
Series 2012B | 7,900 | 8,604,917 | ||||||
Series 2014A | 6,565 | 7,735,474 | ||||||
New York State Energy Research & Development Authority | 3,500 | 3,290,000 | ||||||
New York State Environmental Facilities Corp. | 3,000 | 3,384,360 | ||||||
New York State Thruway Authority | 17,025 | 19,145,974 | ||||||
New York Transportation Development Corp. | 4,000 | 4,191,520 | ||||||
Triborough Bridge & Tunnel Authority | 4,360 | 4,698,685 | ||||||
Series 2013B | 4,100 | 4,559,241 | ||||||
|
| |||||||
| 127,676,859 | ||||||||
|
| |||||||
North Carolina – 1.7% | ||||||||
North Carolina Eastern Municipal Power Agency | 6,700 | 7,472,510 | ||||||
| 24 | AB MUNICIPAL BOND INFLATION STRATEGY | abfunds.com |
PORTFOLIO OF INVESTMENTS (continued)
| Principal Amount (000) | U.S. $ Value | |||||||
| ||||||||
State of North Carolina | $ | 6,710 | $ | 8,086,221 | ||||
|
| |||||||
| 15,558,731 | ||||||||
|
| |||||||
Ohio – 1.7% | ||||||||
American Municipal Power, Inc. | 5,000 | 5,701,050 | ||||||
City of Cleveland OH Airport System Revenue | 2,585 | 3,014,047 | ||||||
City of Cleveland OH COP | 700 | 700,952 | ||||||
County of Cuyahoga OH | 5,600 | 6,053,040 | ||||||
|
| |||||||
| 15,469,089 | ||||||||
|
| |||||||
Oregon – 1.3% | ||||||||
Deschutes County Administrative School District No 1 Bend-La Pine | 5,180 | 5,680,388 | ||||||
Deschutes County Hospital Facilities Authority | 1,000 | 1,051,240 | ||||||
Tri-County Metropolitan Transportation District of Oregon | 4,605 | 5,241,733 | ||||||
|
| |||||||
| 11,973,361 | ||||||||
|
| |||||||
Pennsylvania – 6.2% | ||||||||
Allegheny County Sanitary Authority | 2,250 | 2,382,345 | ||||||
City of Philadelphia PA | 12,990 | 15,571,892 | ||||||
City of Philadelphia PA Water & Wastewater Revenue | 2,135 | 2,528,577 | ||||||
AGM Series 2010A | 550 | 563,370 | ||||||
| abfunds.com | AB MUNICIPAL BOND INFLATION STRATEGY | 25 |
PORTFOLIO OF INVESTMENTS (continued)
| Principal Amount (000) | U.S. $ Value | |||||||
| ||||||||
Montgomery County Industrial Development Authority/PA | $ | 475 | $ | 506,108 | ||||
Moon Industrial Development Authority | 2,060 | 2,205,951 | ||||||
Pennsylvania Economic Development Financing Authority | 3,085 | 3,223,702 | ||||||
Series 2012B | 7,550 | 7,672,310 | ||||||
Pennsylvania Turnpike Commission | 7,580 | 8,704,230 | ||||||
School District of Philadelphia (The) | 1,800 | 1,950,840 | ||||||
Series 2016F | 5,000 | 5,525,250 | ||||||
State Public School Building Authority | 5,150 | 5,656,462 | ||||||
|
| |||||||
| 56,491,037 | ||||||||
|
| |||||||
South Carolina – 0.8% | ||||||||
Renewable Water Resources | 2,570 | 2,937,304 | ||||||
South Carolina Public Service Authority | 2,535 | 2,877,710 | ||||||
Series 2016C | 930 | 1,061,781 | ||||||
|
| |||||||
| 6,876,795 | ||||||||
|
| |||||||
Tennessee – 0.3% | ||||||||
Metropolitan Government of Nashville & Davidson County TN | 455 | 527,358 | ||||||
5.00%, 7/01/23 | 1,930 | 2,234,091 | ||||||
|
| |||||||
| 2,761,449 | ||||||||
|
| |||||||
| 26 | AB MUNICIPAL BOND INFLATION STRATEGY | abfunds.com |
PORTFOLIO OF INVESTMENTS (continued)
| Principal Amount (000) | U.S. $ Value | |||||||
| ||||||||
Texas – 6.6% | ||||||||
Austin Community College District Public Facility Corp. | $ | 1,000 | $ | 1,066,750 | ||||
Birdville Independent School District | 3,825 | 4,392,362 | ||||||
Central Texas Regional Mobility Authority | 2,085 | 2,269,106 | ||||||
City of Corpus Christi TX Utility System Revenue | 5,675 | 6,400,833 | ||||||
City of Garland TX | 500 | 541,055 | ||||||
City of Houston TX Airport System Revenue | 2,105 | 2,228,437 | ||||||
City of Houston TX Combined Utility System Revenue | 2,735 | 3,122,358 | ||||||
City of Lubbock TX | 1,740 | 1,825,712 | ||||||
Conroe Independent School District | 255 | 276,601 | ||||||
5.00%, 2/15/24-2/15/26 | 4,955 | 5,370,966 | ||||||
5.00%, 2/15/26 (Pre-refunded/ETM) | 1,030 | 1,117,251 | ||||||
Harris County-Houston Sports Authority | 4,220 | 4,752,184 | ||||||
New Hope Cultural Education Facilities Finance Corp. | 1,000 | 1,043,560 | ||||||
New Hope Cultural Education Facilities Finance Corp. | 800 | 789,800 | ||||||
| abfunds.com | AB MUNICIPAL BOND INFLATION STRATEGY | 27 |
PORTFOLIO OF INVESTMENTS (continued)
| Principal Amount (000) | U.S. $ Value | |||||||
| ||||||||
New Hope Cultural Education Facilities Finance Corp. | $ | 1,000 | $ | 1,123,360 | ||||
North Texas Tollway Authority | 3,625 | 4,150,988 | ||||||
Series 2017A | 3,000 | 3,353,400 | ||||||
Rockwall Independent School District | 3,280 | 3,441,147 | ||||||
San Antonio Independent School District/TX | 1,710 | 1,906,411 | ||||||
Spring Branch Independent School District | 3,485 | 3,897,171 | ||||||
Tarrant County Cultural Education Facilities | 900 | 868,464 | ||||||
Tarrant County Cultural Education Facilities | 1,550 | 1,551,473 | ||||||
Texas Transportation Commission State Highway Fund | 2,865 | 3,517,045 | ||||||
University of Texas System (The) | 1,070 | 1,161,902 | ||||||
|
| |||||||
| 60,168,336 | ||||||||
|
| |||||||
Virginia – 0.7% | ||||||||
Fairfax County Economic Development Authority | 2,000 | 2,180,280 | ||||||
5.00%, 4/01/26 (Pre-refunded/ETM) | 4,000 | 4,360,560 | ||||||
|
| |||||||
| 6,540,840 | ||||||||
|
| |||||||
| 28 | AB MUNICIPAL BOND INFLATION STRATEGY | abfunds.com |
PORTFOLIO OF INVESTMENTS (continued)
| Principal Amount (000) | U.S. $ Value | |||||||
| ||||||||
Washington – 6.9% | ||||||||
Central Puget Sound Regional Transit Authority | $ | 7,815 | $ | 8,965,964 | ||||
Chelan County Public Utility District No 1 | 3,305 | 3,735,377 | ||||||
City of Seattle WA Municipal Light & Power Revenue | 2,070 | 2,110,655 | ||||||
City of Seattle WA Water System Revenue | 4,020 | 4,753,007 | ||||||
City of Tacoma WA Electric System Revenue | 1,280 | 1,383,001 | ||||||
5.00%, 1/01/20 | 1,220 | 1,319,210 | ||||||
Series 2013A | 1,500 | 1,566,735 | ||||||
Energy Northwest | 680 | 697,619 | ||||||
Series 2012A | 4,200 | 4,463,508 | ||||||
Port of Seattle WA | 4,820 | 5,601,756 | ||||||
State of Washington | 710 | 767,766 | ||||||
Series 2015R | 13,325 | 16,059,290 | ||||||
Series 2017D | 9,985 | 11,149,051 | ||||||
|
| |||||||
| 62,572,939 | ||||||||
|
| |||||||
Wisconsin – 1.6% | ||||||||
Wisconsin Department of Transportation | 9,520 | 11,264,016 | ||||||
5.00%, 7/01/24 (Pre-refunded/ETM)(a) | 2,480 | 2,942,173 | ||||||
|
| |||||||
| 14,206,189 | ||||||||
|
| |||||||
Total Long-Term Municipal Bonds | 872,493,285 | |||||||
|
| |||||||
| abfunds.com | AB MUNICIPAL BOND INFLATION STRATEGY | 29 |
PORTFOLIO OF INVESTMENTS (continued)
| Principal Amount (000) | U.S. $ Value | |||||||
| ||||||||
Short-Term Municipal Notes – 2.7% | ||||||||
Mississippi – 0.5% | ||||||||
Mississippi Business Finance Corp. | $ | 5,000 | $ | 5,000,000 | ||||
|
| |||||||
New York – 1.1% | ||||||||
City of New York NY | 10,000 | 10,000,000 | ||||||
|
| |||||||
Texas – 1.1% | ||||||||
Gulf Coast Waste Disposal Authority | 10,000 | 10,000,000 | ||||||
|
| |||||||
Total Short-Term Municipal Notes | 25,000,000 | |||||||
|
| |||||||
Total Municipal Obligations | 897,493,285 | |||||||
|
| |||||||
GOVERNMENTS – TREASURIES – 4.9% | ||||||||
United States – 4.9% | ||||||||
U.S. Treasury Notes | 6,632 | 6,605,057 | ||||||
2.125%, 11/30/23(b) | 37,655 | 37,631,466 | ||||||
|
| |||||||
Total Governments – Treasuries | 44,236,523 | |||||||
|
| |||||||
| Shares | ||||||||
SHORT-TERM INVESTMENTS – 1.2% | ||||||||
Investment Companies – 1.2% | ||||||||
AB Fixed Income Shares, Inc. – | 11,054,293 | 11,054,293 | ||||||
|
| |||||||
Total Investments – 104.8% | 952,784,101 | |||||||
Other assets less liabilities – (4.8)% | (44,014,717 | ) | ||||||
|
| |||||||
Net Assets – 100.0% | $ | 908,769,384 | ||||||
|
| |||||||
| 30 | AB MUNICIPAL BOND INFLATION STRATEGY | abfunds.com |
PORTFOLIO OF INVESTMENTS (continued)
INFLATION (CPI) SWAPS (see Note D)
| Rate Type | ||||||||||||||||||||||||
Swap Counterparty | Notional Amount (000) | Termination Date | Payments made by the Fund | Payments received by the Fund | Payment Frequency Paid/ Received | Unrealized Appreciation/ (Depreciation) | ||||||||||||||||||
Bank of America, NA | $ | 25,000 | 9/02/20 | 1.548 | % | CPI | # | Maturity | $ | 316,358 | ||||||||||||||
Bank of America, NA | 25,000 | 2/02/32 | 2.403 | % | CPI | # | Maturity | (823,516 | ) | |||||||||||||||
Barclays Bank PLC | 5,500 | 6/02/19 | 2.580 | % | CPI | # | Maturity | (500,281 | ) | |||||||||||||||
Barclays Bank PLC | 4,000 | 6/15/20 | 2.480 | % | CPI | # | Maturity | (343,941 | ) | |||||||||||||||
Barclays Bank PLC | 35,000 | 7/02/20 | 2.256 | % | CPI | # | Maturity | (1,829,249 | ) | |||||||||||||||
Barclays Bank PLC | 1,500 | 8/04/20 | 2.308 | % | CPI | # | Maturity | (91,333 | ) | |||||||||||||||
Barclays Bank PLC | 2,000 | 11/10/20 | 2.500 | % | CPI | # | Maturity | (158,098 | ) | |||||||||||||||
Barclays Bank PLC | 1,000 | 5/04/21 | 2.845 | % | CPI | # | Maturity | (130,668 | ) | |||||||||||||||
Barclays Bank PLC | 3,000 | 5/12/21 | 2.815 | % | CPI | # | Maturity | (385,087 | ) | |||||||||||||||
Barclays Bank PLC | 14,000 | 4/03/22 | 2.663 | % | CPI | # | Maturity | (1,610,227 | ) | |||||||||||||||
Barclays Bank PLC | 16,700 | 10/05/22 | 2.765 | % | CPI | # | Maturity | (1,957,430 | ) | |||||||||||||||
Barclays Bank PLC | 25,000 | 8/07/24 | 2.573 | % | CPI | # | Maturity | (2,233,641 | ) | |||||||||||||||
Barclays Bank PLC | 19,000 | 5/05/25 | 2.125 | % | CPI | # | Maturity | (305,014 | ) | |||||||||||||||
Barclays Bank PLC | 5,400 | 3/06/27 | 2.695 | % | CPI | # | Maturity | (786,500 | ) | |||||||||||||||
Barclays Bank PLC | 20,000 | 6/06/32 | 2.145 | % | CPI | # | Maturity | 132,553 | ||||||||||||||||
Barclays Bank PLC | 14,000 | 9/01/32 | 2.128 | % | CPI | # | Maturity | 203,122 | ||||||||||||||||
Citibank, NA | 22,000 | 7/02/18 | 2.084 | % | CPI | # | Maturity | (824,573 | ) | |||||||||||||||
Citibank, NA | 15,600 | 12/14/20 | 1.548 | % | CPI | # | Maturity | 298,179 | ||||||||||||||||
Citibank, NA | 9,000 | 6/29/22 | 2.398 | % | CPI | # | Maturity | (783,065 | ) | |||||||||||||||
Citibank, NA | 5,400 | 7/19/22 | 2.400 | % | CPI | # | Maturity | (454,221 | ) | |||||||||||||||
Citibank, NA | 4,000 | 8/10/22 | 2.550 | % | CPI | # | Maturity | (389,902 | ) | |||||||||||||||
Citibank, NA | 15,500 | 12/07/22 | 2.748 | % | CPI | # | Maturity | (1,878,993 | ) | |||||||||||||||
Citibank, NA | 47,000 | 5/24/23 | 2.533 | % | CPI | # | Maturity | (4,423,222 | ) | |||||||||||||||
Citibank, NA | 30,000 | 10/29/23 | 2.524 | % | CPI | # | Maturity | (2,548,595 | ) | |||||||||||||||
Citibank, NA | 30,000 | 9/19/24 | 2.070 | % | CPI | # | Maturity | 71,878 | ||||||||||||||||
Citibank, NA | 15,800 | 2/08/28 | 2.940 | % | CPI | # | Maturity | (2,853,067 | ) | |||||||||||||||
Deutsche Bank AG | 11,000 | 6/20/21 | 2.655 | % | CPI | # | Maturity | (1,265,114 | ) | |||||||||||||||
Deutsche Bank AG | 9,800 | 9/07/21 | 2.400 | % | CPI | # | Maturity | (813,225 | ) | |||||||||||||||
Deutsche Bank AG | 25,000 | 9/02/25 | 1.880 | % | CPI | # | Maturity | 190,969 | ||||||||||||||||
JPMorgan Chase Bank, NA | 1,000 | 7/29/20 | 2.305 | % | CPI | # | Maturity | (61,379 | ) | |||||||||||||||
JPMorgan Chase Bank, NA | 19,000 | 8/17/22 | 2.523 | % | CPI | # | Maturity | (1,770,257 | ) | |||||||||||||||
JPMorgan Chase Bank, NA | 1,400 | 6/30/26 | 2.890 | % | CPI | # | Maturity | (263,724 | ) | |||||||||||||||
JPMorgan Chase Bank, NA | 3,300 | 7/21/26 | 2.935 | % | CPI | # | Maturity | (650,730 | ) | |||||||||||||||
JPMorgan Chase Bank, NA | 2,400 | 10/03/26 | 2.485 | % | CPI | # | Maturity | (264,841 | ) | |||||||||||||||
JPMorgan Chase Bank, NA | 5,400 | 11/14/26 | 2.488 | % | CPI | # | Maturity | (601,780 | ) | |||||||||||||||
JPMorgan Chase Bank, NA | 4,850 | 12/23/26 | 2.484 | % | CPI | # | Maturity | (526,704 | ) | |||||||||||||||
JPMorgan Chase Bank, NA | 13,000 | 3/01/27 | 2.279 | % | CPI | # | Maturity | (264,330 | ) | |||||||||||||||
JPMorgan Chase Bank, NA | 21,350 | 2/20/28 | 2.899 | % | CPI | # | Maturity | (3,682,515 | ) | |||||||||||||||
JPMorgan Chase Bank, NA | 12,000 | 3/26/28 | 2.880 | % | CPI | # | Maturity | (2,017,426 | ) | |||||||||||||||
Morgan Stanley Capital Services LLC | 50,000 | 4/16/18 | 2.395 | % | CPI | # | Maturity | (2,928,958 | ) | |||||||||||||||
| abfunds.com | AB MUNICIPAL BOND INFLATION STRATEGY | 31 |
PORTFOLIO OF INVESTMENTS (continued)
| Rate Type | ||||||||||||||||||||||||
Swap | Notional Amount (000) | Termination Date | Payments made by the Fund | Payments received by the Fund | Payment Frequency Paid/ Received | Unrealized Appreciation/ (Depreciation) | ||||||||||||||||||
Morgan Stanley Capital Services LLC | $ | 2,000 | 10/14/20 | 2.370 | % | CPI | # | Maturity | $ | (128,269 | ) | |||||||||||||
Morgan Stanley Capital Services LLC | 13,000 | 5/23/21 | 2.680 | % | CPI | # | Maturity | (1,479,375 | ) | |||||||||||||||
Morgan Stanley Capital Services LLC | 10,000 | 4/16/23 | 2.690 | % | CPI | # | Maturity | (1,121,547 | ) | |||||||||||||||
Morgan Stanley Capital Services LLC | 5,000 | 8/15/26 | 2.885 | % | CPI | # | Maturity | (926,629 | ) | |||||||||||||||
|
| |||||||||||||||||||||||
| $ | (42,864,367 | ) | ||||||||||||||||||||||
|
| |||||||||||||||||||||||
| # | Variable interest rate based on the rate of inflation as determined by the Consumer Price Index (CPI). |
| (a) | Security in which significant unobservable inputs (Level 3) were used in determining fair value. |
| (b) | Position, or a portion thereof, has been segregated to collateralize OTC derivatives outstanding. |
| (c) | Security is exempt from registration under Rule 144A of the Securities Act of 1933. These securities are considered restricted, but liquid and may be resold in transactions exempt from registration, normally to qualified institutional buyers. At October 31, 2017, the aggregate market value of these securities amounted to $4,354,441 or 0.5% of net assets. |
| (d) | When-Issued or delayed delivery security. |
| (e) | Variable rate coupon, rate shown as of October 31, 2017. |
| (f) | An auction rate security whose interest rate resets at each auction date. Auctions are typically held every week or month. The rate shown is as of October 31, 2017 and the aggregate market value of these securities amounted to $8,835,764 or 0.97% of net assets. |
| (g) | Variable Rate Demand Notes are instruments whose interest rates change on a specific date (such as coupon date or interest payment date) or whose interest rates vary with changes in a designated base rate (such as the prime interest rate). This instrument is payable on demand and is secured by letters of credit or other credit support agreements from major banks. |
| (h) | Affiliated investments. |
| (i) | The rate shown represents the 7-day yield as of period end. |
| (j) | To obtain a copy of the fund’s shareholder report, please go to the Securities and Exchange Commission’s website at www.sec.gov, or call AB at (800) 227-4618. |
As of October 31, 2017, the Strategy’s percentages of investments in municipal bonds that are insured and in insured municipal bonds that have been pre-refunded or escrowed to maturity are 5.6% and 0.1%, respectively.
Glossary:
AGM – Assured Guaranty Municipal
AMBAC – Ambac Assurance Corporation
COP – Certificate of Participation
CPIYOYX – Consumer Price Index Year Over Year Change
DOT – Department of Transportation
ETM – Escrowed to Maturity
NATL – National Interstate Corporation
SRF – State Revolving Fund
See notes to financial statements.
| 32 | AB MUNICIPAL BOND INFLATION STRATEGY | abfunds.com |
STATEMENT OF ASSETS & LIABILITIES
October 31, 2017
| Assets | ||||
Investments in securities, at value | ||||
Unaffiliated issuers (cost $913,301,479) | $ | 941,729,808 | ||
Affiliated issuers (cost $11,054,293) | 11,054,293 | |||
Interest receivable | 11,129,550 | |||
Receivable for capital stock sold | 1,874,939 | |||
Unrealized appreciation on inflation swaps | 1,213,059 | |||
Affiliated dividends receivable | 4,593 | |||
|
| |||
Total assets | 967,006,242 | |||
|
| |||
| Liabilities | ||||
Unrealized depreciation on inflation swaps | 44,077,426 | |||
Payable for investment securities purchased | 13,396,205 | |||
Advisory fee payable | 287,553 | |||
Payable for capital stock redeemed | 110,047 | |||
Distribution fee payable | 57,101 | |||
Administrative fee payable | 23,213 | |||
Transfer Agent fee payable | 17,068 | |||
Directors’ fees payable | 2,433 | |||
Accrued expenses | 265,812 | |||
|
| |||
Total liabilities | 58,236,858 | |||
|
| |||
Net Assets | $ | 908,769,384 | ||
|
| |||
| Composition of Net Assets | ||||
Capital stock, at par | $ | 88,568 | ||
Additional paid-in capital | 931,110,398 | |||
Undistributed net investment income | 493,825 | |||
Accumulated net realized loss on investment transactions | (8,487,369 | ) | ||
Net unrealized depreciation on investments | (14,436,038 | ) | ||
|
| |||
| $ | 908,769,384 | |||
|
| |||
Net Asset Value Per Share—30 billion shares of capital stock authorized, $.001 par value
| Class | Net Assets | Shares Outstanding | Net Asset Value | |||||||||
| ||||||||||||
| A | $ | 58,270,215 | 5,665,998 | $ | 10.28 | * | ||||||
| ||||||||||||
| C | $ | 12,693,471 | 1,236,752 | $ | 10.26 | |||||||
| ||||||||||||
| Advisor | $ | 199,635,026 | 19,400,907 | $ | 10.29 | |||||||
| ||||||||||||
| 1 | $ | 424,290,507 | 41,405,592 | $ | 10.25 | |||||||
| ||||||||||||
| 2 | $ | 213,880,165 | 20,858,927 | $ | 10.25 | |||||||
| ||||||||||||
| * | The maximum offering price per share for Class A shares was $10.60 which reflects a sales charge of 3.00%. |
See notes to financial statements.
| abfunds.com | AB MUNICIPAL BOND INFLATION STRATEGY | 33 |
STATEMENT OF OPERATIONS
Year Ended October 31, 2017
| Investment Income | ||||||||
Interest | $ | 21,698,039 | ||||||
Dividends—Affiliated issuers | 104,330 | |||||||
Other income | 82 | $ | 21,802,451 | |||||
|
| |||||||
| Expenses | ||||||||
Advisory fee (see Note B) | 4,127,148 | |||||||
Distribution fee—Class A | 139,991 | |||||||
Distribution fee—Class C | 125,381 | |||||||
Distribution fee—Class 1 | 373,045 | |||||||
Transfer agency—Class A | 26,585 | |||||||
Transfer agency—Class C | 6,002 | |||||||
Transfer agency—Advisor Class | 90,675 | |||||||
Transfer agency—Class 1 | 22,230 | |||||||
Transfer agency—Class 2 | 11,437 | |||||||
Custodian | 160,685 | |||||||
Registration fees | 96,076 | |||||||
Audit and tax | 84,030 | |||||||
Administrative | 65,428 | |||||||
Printing | 43,544 | |||||||
Legal | 38,728 | |||||||
Directors’ fees | 28,083 | |||||||
Miscellaneous | 34,642 | |||||||
|
| |||||||
Total expenses | 5,473,710 | |||||||
Less: expenses waived and reimbursed by the Adviser (see Note B) | (745,985 | ) | ||||||
|
| |||||||
Net expenses | 4,727,725 | |||||||
|
| |||||||
Net investment income | 17,074,726 | |||||||
|
| |||||||
| Realized and Unrealized Gain (Loss) on Investment Transactions | ||||||||
Net realized loss on: | ||||||||
Investment transactions | (26,367 | ) | ||||||
Swaps | (2,741,128 | ) | ||||||
Net change in unrealized appreciation/depreciation of: | ||||||||
Investments | (4,834,177 | ) | ||||||
Swaps | 7,569,050 | |||||||
|
| |||||||
Net loss on investment transactions | (32,622 | ) | ||||||
|
| |||||||
Net Increase in Net Assets from Operations | $ | 17,042,104 | ||||||
|
|
See notes to financial statements.
| 34 | AB MUNICIPAL BOND INFLATION STRATEGY | abfunds.com |
STATEMENT OF CHANGES IN NET ASSETS
| Year Ended October 31, 2017 | Year Ended October 31, 2016 | |||||||
| Increase (Decrease) in Net Assets from Operations | ||||||||
Net investment income | $ | 17,074,726 | $ | 14,330,212 | ||||
Net realized loss on investment transactions | (2,767,495 | ) | (1,293,189 | ) | ||||
Net change in unrealized appreciation/depreciation of investments | 2,734,873 | 12,779,736 | ||||||
|
|
|
| |||||
Net increase in net assets from operations | 17,042,104 | 25,816,759 | ||||||
| Dividends to Shareholders from | ||||||||
Net investment income | ||||||||
Class A | (1,019,585 | ) | (695,439 | ) | ||||
Class C | (135,480 | ) | (129,987 | ) | ||||
Advisor Class | (3,944,867 | ) | (3,429,320 | ) | ||||
Class 1 | (7,492,362 | ) | (7,315,833 | ) | ||||
Class 2 | (4,032,613 | ) | (3,595,101 | ) | ||||
| Capital Stock Transactions | ||||||||
Net increase (decrease) | 204,460,858 | (95,338,279 | ) | |||||
|
|
|
| |||||
Total increase (decrease) | 204,878,055 | (84,687,200 | ) | |||||
| Net Assets | ||||||||
Beginning of period | 703,891,329 | 788,578,529 | ||||||
|
|
|
| |||||
End of period (including undistributed net investment income of $493,825 and $70,756, respectively) | $ | 908,769,384 | $ | 703,891,329 | ||||
|
|
|
| |||||
See notes to financial statements.
| abfunds.com | AB MUNICIPAL BOND INFLATION STRATEGY | 35 |
NOTES TO FINANCIAL STATEMENTS
October 31, 2017
NOTE A
Significant Accounting Policies
AB Bond Fund, Inc. (the “Company”) is registered under the Investment Company Act of 1940 as an open-end management investment company. The Company, which is a Maryland corporation, operates as a series company comprised of eleven portfolios currently in operation. Each portfolio is considered to be a separate entity for financial reporting and tax purposes. This report relates only to the AB Municipal Bond Inflation Strategy (the “Strategy”), a diversified portfolio. The Strategy offers Class A, Class C, Advisor Class, Class 1 and Class 2 shares. Class 1 shares are sold only to the private clients of Sanford C. Bernstein & Co. LLC by its registered representatives. Class B, Class R, Class K, Class I and Class T shares have been authorized but currently are not offered. Class A shares are sold with a front-end sales charge of up to 3.0% for purchases not exceeding $500,000. With respect to purchases of $500,000 or more, Class A shares redeemed within one year of purchase may be subject to a contingent deferred sales charge of 1%. Class C shares are subject to a contingent deferred sales charge of 1% on redemptions made within the first year after purchase and 0% after the first year of purchase. Effective April 10, 2017, Class C shares will automatically convert to Class A shares ten years after the end of the calendar month of purchase. Advisor Class and Class 2 shares are sold without an initial or contingent deferred sales charge and are not subject to ongoing distribution expenses. Class 1 shares are sold without an initial or contingent deferred sales charge, but are subject to ongoing distribution expenses. All ten classes of shares have identical voting, dividend, liquidation and other rights, except that the classes bear different distribution and transfer agency expenses. Each class has exclusive voting rights with respect to its distribution plan. The financial statements have been prepared in conformity with U.S. generally accepted accounting principles (“U.S. GAAP”) which require management to make certain estimates and assumptions that affect the reported amounts of assets and liabilities in the financial statements and amounts of income and expenses during the reporting period. Actual results could differ from those estimates. The Strategy is an investment company under U.S. GAAP and follows the accounting and reporting guidance applicable to investment companies. The following is a summary of significant accounting policies followed by the Strategy.
1. Security Valuation
Portfolio securities are valued at their current market value determined on the basis of market quotations or, if market quotations are not readily available or are deemed unreliable, at “fair value” as determined in accordance with procedures established by and under the general supervision of the Company’s Board of Directors (the “Board”).
| 36 | AB MUNICIPAL BOND INFLATION STRATEGY | abfunds.com |
NOTES TO FINANCIAL STATEMENTS (continued)
In general, the market values of securities which are readily available and deemed reliable are determined as follows: securities listed on a national securities exchange (other than securities listed on the NASDAQ Stock Market, Inc. (“NASDAQ”)) or on a foreign securities exchange are valued at the last sale price at the close of the exchange or foreign securities exchange. If there has been no sale on such day, the securities are valued at the last traded price from the previous day. Securities listed on more than one exchange are valued by reference to the principal exchange on which the securities are traded; securities listed only on NASDAQ are valued in accordance with the NASDAQ Official Closing Price; listed or over the counter (“OTC”) market put or call options are valued at the mid level between the current bid and ask prices. If either a current bid or current ask price is unavailable, AllianceBernstein L.P. (the “Adviser”) will have discretion to determine the best valuation (e.g., last trade price in the case of listed options); open futures are valued using the closing settlement price or, in the absence of such a price, the most recent quoted bid price. If there are no quotations available for the day of valuation, the last available closing settlement price is used; U.S. Government securities and any other debt instruments having 60 days or less remaining until maturity are generally valued at market by an independent pricing vendor, if a market price is available. If a market price is not available, the securities are valued at amortized cost. This methodology is commonly used for short term securities that have an original maturity of 60 days or less, as well as short term securities that had an original term to maturity that exceeded 60 days. In instances when amortized cost is utilized, the Valuation Committee (the “Committee”) must reasonably conclude that the utilization of amortized cost is approximately the same as the fair value of the security. Such factors the Committee will consider include, but are not limited to, an impairment of the creditworthiness of the issuer or material changes in interest rates. Fixed-income securities, including mortgage-backed and asset-backed securities, may be valued on the basis of prices provided by a pricing service or at a price obtained from one or more of the major broker-dealers. In cases where broker-dealer quotes are obtained, the Adviser may establish procedures whereby changes in market yields or spreads are used to adjust, on a daily basis, a recently obtained quoted price on a security. Swaps and other derivatives are valued daily, primarily using independent pricing services, independent pricing models using market inputs, as well as third party broker-dealers or counterparties. Open end mutual funds are valued at the closing net asset value per share, while exchange traded funds are valued at the closing market price per share.
Securities for which market quotations are not readily available (including restricted securities) or are deemed unreliable are valued at fair value as deemed appropriate by the Adviser. Factors considered in making this determination may include, but are not limited to, information obtained by
| abfunds.com | AB MUNICIPAL BOND INFLATION STRATEGY | 37 |
NOTES TO FINANCIAL STATEMENTS (continued)
contacting the issuer, analysts, analysis of the issuer’s financial statements or other available documents. In addition, the Strategy may use fair value pricing for securities primarily traded in non-U.S. markets because most foreign markets close well before the Strategy values its securities at 4:00 p.m., Eastern Time. The earlier close of these foreign markets gives rise to the possibility that significant events, including broad market moves, may have occurred in the interim and may materially affect the value of those securities. To account for this, the Strategy generally values many of its foreign equity securities using fair value prices based on third party vendor modeling tools to the extent available.
2. Fair Value Measurements
In accordance with U.S. GAAP regarding fair value measurements, fair value is defined as the price that the Strategy would receive to sell an asset or pay to transfer a liability in an orderly transaction between market participants at the measurement date. U.S. GAAP establishes a framework for measuring fair value, and a three-level hierarchy for fair value measurements based upon the transparency of inputs to the valuation of an asset or liability (including those valued based on their market values as described in Note A.1 above). Inputs may be observable or unobservable and refer broadly to the assumptions that market participants would use in pricing the asset or liability. Observable inputs reflect the assumptions market participants would use in pricing the asset or liability based on market data obtained from sources independent of the Strategy. Unobservable inputs reflect the Strategy’s own assumptions about the assumptions that market participants would use in pricing the asset or liability based on the best information available in the circumstances. Each investment is assigned a level based upon the observability of the inputs which are significant to the overall valuation. The three-tier hierarchy of inputs is summarized below.
| • | Level 1—quoted prices in active markets for identical investments |
| • | Level 2—other significant observable inputs (including quoted prices for similar investments, interest rates, prepayment speeds, credit risk, etc.) |
| • | Level 3—significant unobservable inputs (including the Strategy’s own assumptions in determining the fair value of investments) |
The fair value of debt instruments, such as bonds, and over-the-counter derivatives is generally based on market price quotations, recently executed market transactions (where observable) or industry recognized modeling techniques and are generally classified as Level 2. Pricing vendor inputs to Level 2 valuations may include quoted prices for similar investments in active markets, interest rates, coupon rates, yield curves, option adjusted spreads, default rates, credit spreads and other unique security features in order to estimate the relevant cash flows which is then
| 38 | AB MUNICIPAL BOND INFLATION STRATEGY | abfunds.com |
NOTES TO FINANCIAL STATEMENTS (continued)
discounted to calculate fair values. If these inputs are unobservable and significant to the fair value, these investments will be classified as Level 3. In addition, non-agency rated investments are classified as Level 3.
Other fixed income investments, including non-U.S. government and corporate debt, are generally valued using quoted market prices, if available, which are typically impacted by current interest rates, maturity dates and any perceived credit risk of the issuer. Additionally, in the absence of quoted market prices, these inputs are used by pricing vendors to derive a valuation based upon industry or proprietary models which incorporate issuer specific data with relevant yield/spread comparisons with more widely quoted bonds with similar key characteristics. Those investments for which there are observable inputs are classified as Level 2. Where the inputs are not observable, the investments are classified as Level 3.
The following table summarizes the valuation of the Strategy’s investments by the above fair value hierarchy levels as of October 31, 2017:
Investments in | Level 1 | Level 2 | Level 3 | Total | ||||||||||||
Assets: | ||||||||||||||||
Long-Term Municipal Bonds | $ | – 0 | – | $ | 853,365,227 | $ | 19,128,058 | $ | 872,493,285 | |||||||
Short-Term Municipal Notes | – 0 | – | 25,000,000 | – 0 | – | 25,000,000 | ||||||||||
Governments – Treasuries | – 0 | – | 44,236,523 | – 0 | – | 44,236,523 | ||||||||||
Short-Term Investments | 11,054,293 | – 0 | – | – 0 | – | 11,054,293 | ||||||||||
|
|
|
|
|
|
|
| |||||||||
Total Investments in Securities | 11,054,293 | 922,601,750 | 19,128,058 | 952,784,101 | ||||||||||||
Other Financial Instruments(a): | ||||||||||||||||
Assets: | ||||||||||||||||
Inflation (CPI) Swaps | – 0 | – | 1,213,059 | – 0 | – | 1,213,059 | ||||||||||
Liabilities: | ||||||||||||||||
Inflation (CPI) Swaps | – 0 | – | (44,077,426 | ) | – 0 | – | (44,077,426 | ) | ||||||||
|
|
|
|
|
|
|
| |||||||||
Total(b) | $ | 11,054,293 | $ | 879,737,383 | $ | 19,128,058 | $ | 909,919,734 | ||||||||
|
|
|
|
|
|
|
| |||||||||
| (a) | Other financial instruments are derivative instruments, such as futures, forwards and swaps, which are valued at the unrealized appreciation/(depreciation) on the instrument. Other financial instruments may also include swaps with upfront premiums, options written and swaptions which are valued at market value. |
| (b) | There were no transfers between any levels during the reporting period. |
The Strategy recognizes all transfers between levels of the fair value hierarchy assuming the financial instruments were transferred at the beginning of the reporting period.
| abfunds.com | AB MUNICIPAL BOND INFLATION STRATEGY | 39 |
NOTES TO FINANCIAL STATEMENTS (continued)
The following is a reconciliation of investments in which significant unobservable inputs (Level 3) were used in determining fair value.
| Long-Term Municipal Bonds | Total | |||||||
Balance as of 10/31/16 | $ | 6,068,785 | $ | 6,068,785 | ||||
Accrued discounts/(premiums) | (75,753 | ) | (75,753 | ) | ||||
Realized gain (loss) | 10,312 | 10,312 | ||||||
Change in unrealized appreciation/depreciation | 242,450 | 242,450 | ||||||
Purchases | 13,359,560 | 13,359,560 | ||||||
Sales | (477,296 | ) | (477,296 | ) | ||||
Transfers in to Level 3 | – 0 | – | – 0 | – | ||||
Transfers out of Level 3 | – 0 | – | – 0 | – | ||||
|
|
|
| |||||
Balance as of 10/31/17 | $ | 19,128,058 | $ | 19,128,058 | ||||
|
|
|
| |||||
Net change in unrealized appreciation/depreciation from investments held as of 10/31/17(a) | $ | 255,771 | $ | 255,771 | ||||
|
|
|
| |||||
| (a) | The unrealized appreciation/(depreciation) is included in net change in unrealized appreciation/(depreciation) on investments and other financial instruments in the accompanying statement of operations. |
As of October 31, 2017, all Level 3 securities were priced by third party vendors.
The Adviser established the Committee to oversee the pricing and valuation of all securities held in the Strategy. The Committee operates under pricing and valuation policies and procedures established by the Adviser and approved by the Board, including pricing policies which set forth the mechanisms and processes to be employed on a daily basis to implement these policies and procedures. In particular, the pricing policies describe how to determine market quotations for securities and other instruments. The Committee’s responsibilities include: 1) fair value and liquidity determinations (and oversight of any third parties to whom any responsibility for fair value and liquidity determinations is delegated), and 2) regular monitoring of the Adviser’s pricing and valuation policies and procedures and modification or enhancement of these policies and procedures (or recommendation of the modification of these policies and procedures) as the Committee believes appropriate.
The Committee is also responsible for monitoring the implementation of the pricing policies by the Adviser’s Pricing Group (the “Pricing Group”) and any third party which performs certain pricing functions in accordance with the pricing policies. The Pricing Group is responsible for the oversight of the third party on a day-to-day basis. The Committee and the Pricing Group perform a series of activities to provide reasonable assurance of the accuracy of prices including: 1) periodic vendor due diligence meetings, review of methodologies, new developments and processes at vendors, 2) daily comparison of security valuation versus prior day for all securities that exceeded established thresholds, and 3) daily review of unpriced, stale, and variance reports with exceptions reviewed by senior management and the Committee.
| 40 | AB MUNICIPAL BOND INFLATION STRATEGY | abfunds.com |
NOTES TO FINANCIAL STATEMENTS (continued)
In addition, several processes outside of the pricing process are used to monitor valuation issues including: 1) performance and performance attribution reports are monitored for anomalous impacts based upon benchmark performance, and 2) portfolio managers review all portfolios for performance and analytics (which are generated using the Adviser’s prices).
3. Taxes
It is the Strategy’s policy to meet the requirements of the Internal Revenue Code applicable to regulated investment companies and to distribute all of its investment company taxable income and net realized gains, if any, to shareholders. Therefore, no provisions for federal income or excise taxes are required.
In accordance with U.S. GAAP requirements regarding accounting for uncertainties in income taxes, management has analyzed the Strategy’s tax positions taken or expected to be taken on federal and state income tax returns for all open tax years (the current and the prior three tax years) and has concluded that no provision for income tax is required in the Strategy’s financial statements.
4. Investment Income and Investment Transactions
Dividend income is recorded on the ex-dividend date or as soon as the Strategy is informed of the dividend. Interest income is accrued daily. Investment transactions are accounted for on the date the securities are purchased or sold. Investment gains or losses are determined on the identified cost basis. The Strategy amortizes premiums and accretes original issue discounts and market discounts as adjustments to interest income.
5. Class Allocations
All income earned and expenses incurred by the Strategy are borne on a pro-rata basis by each outstanding class of shares, based on the proportionate interest in the Strategy represented by the net assets of such class, except for class specific expenses which are allocated to the respective class. Expenses of the Company are charged proportionately to each portfolio or based on other appropriate methods. Realized and unrealized gains and losses are allocated among the various share classes based on respective net assets.
6. Dividends and Distributions
Dividends and distributions to shareholders, if any, are recorded on the ex-dividend date. Income dividends and capital gains distributions are determined in accordance with federal tax regulations and may differ from those determined in accordance with U.S. GAAP. To the extent these differences are permanent, such amounts are reclassified within the capital accounts based on their federal tax basis treatment; temporary differences do not require such reclassification.
| abfunds.com | AB MUNICIPAL BOND INFLATION STRATEGY | 41 |
NOTES TO FINANCIAL STATEMENTS (continued)
NOTE B
Advisory Fee and Other Transactions with Affiliates
Under the terms of the investment advisory agreement, the Strategy pays the Adviser an advisory fee at an annual rate of .50% of the first $2.5 billion, .45% of the next $2.5 billion and .40% in excess of $5 billion of the Strategy’s average daily net assets. The fee is accrued daily and paid monthly. The Adviser has agreed to waive its fees and bear certain expenses to the extent necessary to limit total operating expenses on an annual basis (the “Expense Caps”) to .75%, 1.50%, .50%, .60% and .50% of the daily average net assets for the Class A, Class C, Advisor Class, Class 1 and Class 2 shares, respectively. Effective January 30, 2015, the Expense Cap for the Class A shares was reduced from .80% to .75% of the daily average net assets. This fee waiver and/or expense reimbursement agreement will remain in effect until January 31, 2018 and then may be extended by the Adviser for additional one-year terms. For the year ended October 31, 2017, such reimbursements/waivers amounted to $708,145.
Pursuant to the investment advisory agreement, the Strategy may reimburse the Adviser for certain legal and accounting services provided to the Strategy by the Adviser. For the year ended October 31, 2017, the reimbursement for such services amounted to $65,428.
The Strategy compensates AllianceBernstein Investor Services, Inc. (“ABIS”), a wholly-owned subsidiary of the Adviser, under a Transfer Agency Agreement for providing personnel and facilities to perform transfer agency services for the Strategy. ABIS may make payments to intermediaries that provide omnibus account services, sub-accounting services and/or networking services. Such compensation retained by ABIS amounted to $58,789 for the year ended October 31, 2017.
AllianceBernstein Investments, Inc. (the “Distributor”), a wholly-owned subsidiary of the Adviser, serves as the distributor of the Strategy’s shares. The Distributor has advised the Strategy that it has retained front-end sales charges of $16 from the sale of Class A shares and received $11,969 and $1,296 in contingent deferred sales charges imposed upon redemptions by shareholders of Class A and Class C shares, respectively, for the year ended October 31, 2017.
The Strategy may invest in AB Government Money Market Portfolio (the “Government Money Market Portfolio”) which has a contractual annual advisory fee rate of .20% of the portfolio’s average daily net assets and bears its own expenses. In connection with the investment by the Strategy in the Government Money Market Portfolio, the Adviser has contractually agreed to waive its advisory fee from the Strategy in an amount equal to
| 42 | AB MUNICIPAL BOND INFLATION STRATEGY | abfunds.com |
NOTES TO FINANCIAL STATEMENTS (continued)
the Strategy’s pro rata share of the effective advisory fees of Government Money Market Portfolio, as borne indirectly by the Strategy as an acquired fund fee and expense. For the year ended October 31, 2017, such waiver amounted to $37,840.
A summary of the Strategy’s transactions in AB mutual funds for the year ended October 31, 2017 is as follows:
Strategy | Market Value 10/31/16 (000) | Purchases at Cost (000) | Sales Proceeds (000) | Market Value 10/31/17 (000) | Dividend Income (000) | |||||||||||||||
| Government Money Market Portfolio | $ | 14,945 | $ | 289,730 | $ | 293,621 | $ | 11,054 | $ | 104 | ||||||||||
NOTE C
Distribution Services Agreement
The Strategy has adopted a Distribution Services Agreement (the “Agreement”) pursuant to Rule 12b-1 under the Investment Company Act of 1940. Under the Agreement, the Strategy pays distribution and servicing fees to the Distributor at an annual rate of up to ..30% of the Strategy’s average daily net assets attributable to Class A shares, 1% of the Strategy’s average daily net assets attributable to Class C shares and .10% of the Strategy’s average daily net assets attributable to Class 1 shares. There are no distribution and servicing fees on the Advisor Class and Class 2 shares. Effective January 30, 2015, payments under the Agreement in respect of Class A shares are limited to an annual rate of ..25% of Class A shares’ average daily net assets. The fees are accrued daily and paid monthly. The Agreement provides that the Distributor will use such payments in their entirety for distribution assistance and promotional activities. Since the commencement of the Strategy’s operations, the Distributor has incurred expenses in excess of the distribution costs reimbursed by the Strategy in the amount of $386,292 and $1,637,884 for Class C and Class 1 shares, respectively. While such costs may be recovered from the Strategy in future periods so long as the Agreement is in effect, the rate of the distribution and servicing fees payable under the Agreement may not be increased without a shareholder vote. In accordance with the Agreement, there is no provision for recovery of unreimbursed distribution costs incurred by the Distributor beyond the current fiscal year for Class A shares. The Agreement also provides that the Adviser may use its own resources to finance the distribution of the Strategy’s shares.
| abfunds.com | AB MUNICIPAL BOND INFLATION STRATEGY | 43 |
NOTES TO FINANCIAL STATEMENTS (continued)
NOTE D
Investment Transactions
Purchases and sales of investment securities (excluding short-term investments) for the year ended October 31, 2017 were as follows:
| Purchases | Sales | |||||||
Investment securities (excluding | $ | 229,065,745 | $ | 65,748,117 | ||||
U.S. government securities | 37,542,030 | 6,200,000 | ||||||
The cost of investments for federal income tax purposes, gross unrealized appreciation and unrealized depreciation are as follows:
Cost | $ | 924,355,772 | ||
|
| |||
Gross unrealized appreciation | $ | 31,024,791 | ||
Gross unrealized depreciation | (45,460,829 | ) | ||
|
| |||
Net unrealized depreciation | $ | (14,436,038 | ) | |
|
|
1. Derivative Financial Instruments
The Strategy may use derivatives in an effort to earn income and enhance returns, to replace more traditional direct investments, to obtain exposure to otherwise inaccessible markets (collectively, “investment purposes”), or to hedge or adjust the risk profile of its portfolio.
The principal type of derivative utilized by the Strategy, as well as the methods in which they may be used are:
| • | Swaps |
The Strategy may enter into swaps to hedge its exposure to interest rates or credit risk. A swap is an agreement that obligates two parties to exchange a series of cash flows at specified intervals based upon or calculated by reference to changes in specified prices or rates for a specified amount of an underlying asset. The payment flows are usually netted against each other, with the difference being paid by one party to the other. In addition, collateral may be pledged or received by the Strategy in accordance with the terms of the respective swaps to provide value and recourse to the Strategy or its counterparties in the event of default, bankruptcy or insolvency by one of the parties to the swap.
Risks may arise as a result of the failure of the counterparty to the swap to comply with the terms of the swap. The loss incurred by the failure of a counterparty is generally limited to the net interim payment to be received by the Strategy, and/or the termination value at the end of the contract. Therefore, the Strategy considers the creditworthiness of each counterparty to a swap in evaluating potential counterparty risk. This risk is mitigated by having a netting arrangement between the Strategy and
| 44 | AB MUNICIPAL BOND INFLATION STRATEGY | abfunds.com |
NOTES TO FINANCIAL STATEMENTS (continued)
the counterparty and by the posting of collateral by the counterparty to the Strategy to cover the Strategy’s exposure to the counterparty. Additionally, risks may arise from unanticipated movements in interest rates or in the value of the underlying securities. The Strategy accrues for the interim payments on swaps on a daily basis, with the net amount recorded within unrealized appreciation/depreciation of swaps on the statement of assets and liabilities, where applicable. Once the interim payments are settled in cash, the net amount is recorded as realized gain/(loss) on swaps on the statement of operations, in addition to any realized gain/(loss) recorded upon the termination of swaps. Upfront premiums paid or received are recognized as cost or proceeds on the statement of assets and liabilities and are amortized on a straight line basis over the life of the contract. Amortized upfront premiums are included in net realized gain/(loss) from swaps on the statement of operations. Fluctuations in the value of swaps are recorded as a component of net change in unrealized appreciation/depreciation of swaps on the statement of operations.
Inflation (CPI) Swaps:
Inflation swap agreements are contracts in which one party agrees to pay the cumulative percentage increase in a price index (the Consumer Price Index with respect to CPI swaps) over the term of the swap (with some lag on the inflation index), and the other pays a compounded fixed rate. Inflation swaps may be used to protect the net asset value (“NAV”) of a Strategy against an unexpected change in the rate of inflation measured by an inflation index since the value of these agreements is expected to increase if there are unexpected inflation increases.
During the year ended October 31, 2017, the Strategy held inflation (CPI) swaps for hedging purposes.
Interest Rate Swaps:
The Strategy is subject to interest rate risk exposure in the normal course of pursuing its investment objectives. Because the Strategy holds fixed rate bonds, the value of these bonds may decrease if interest rates rise. To help hedge against this risk and to maintain its ability to generate income at prevailing market rates, the Strategy may enter into interest rate swaps. Interest rate swaps are agreements between two parties to exchange cash flows based on a notional amount. The Strategy may elect to pay a fixed rate and receive a floating rate, or, receive a fixed rate and pay a floating rate on a notional amount.
In addition, the Strategy may also enter into interest rate swap transactions to preserve a return or spread on a particular investment or portion of its portfolio, or protecting against an increase in the price
| abfunds.com | AB MUNICIPAL BOND INFLATION STRATEGY | 45 |
NOTES TO FINANCIAL STATEMENTS (continued)
of securities the Strategy anticipates purchasing at a later date. Interest rate swaps involve the exchange by a Strategy with another party of their respective commitments to pay or receive interest (e.g., an exchange of floating rate payments for fixed rate payments) computed based on a contractually-based principal (or “notional”) amount. Interest rate swaps are entered into on a net basis (i.e., the two payment streams are netted out, with the Strategy receiving or paying, as the case may be, only the net amount of the two payments).
During the year ended October 31, 2017, the Strategy held interest rate swaps for hedging purposes.
The Strategy typically enters into International Swaps and Derivatives Association, Inc. Master Agreements (“ISDA Master Agreement”) with its OTC derivative contract counterparties in order to, among other things, reduce its credit risk to OTC counterparties. ISDA Master Agreements include provisions for general obligations, representations, collateral and events of default or termination. Under an ISDA Master Agreement, the Strategy typically may offset with the OTC counterparty certain derivative financial instruments’ payables and/or receivables with collateral held and/or posted and create one single net payment (close-out netting) in the event of default or termination. In the event of a default by an OTC counterparty, the return of collateral with market value in excess of the Strategy’s net liability, held by the defaulting party, may be delayed or denied.
The Strategy’s ISDA Master Agreements may contain provisions for early termination of OTC derivative transactions in the event the net assets of the Strategy decline below specific levels (“net asset contingent features”). If these levels are triggered, the Strategy’s OTC counterparty has the right to terminate such transaction and require the Strategy to pay or receive a settlement amount in connection with the terminated transaction. For additional details, please refer to netting arrangements by the OTC counterparty tables below.
During the year ended October 31, 2017, the Strategy had entered into the following derivatives:
Asset Derivatives | Liability Derivatives | |||||||||||
Derivative Type | Statement of | Fair Value | Statement of | Fair Value | ||||||||
Interest rate contracts |
Unrealized appreciation on inflation swaps | $ | 1,213,059 |
|
Unrealized depreciation on inflation swaps | $ | 44,077,426 |
| ||||
|
|
|
| |||||||||
Total | $ | 1,213,059 | $ | 44,077,426 | ||||||||
|
|
|
| |||||||||
| 46 | AB MUNICIPAL BOND INFLATION STRATEGY | abfunds.com |
NOTES TO FINANCIAL STATEMENTS (continued)
Derivative Type | Location of | Realized Gain or (Loss) on Derivatives | Change in Unrealized Appreciation or (Depreciation) | |||||||
Interest rate contracts | Net realized gain (loss) on swaps; Net change in unrealized appreciation/depreciation of swaps | $ | (2,741,128 | ) | $ | 7,569,050 | ||||
|
|
|
| |||||||
Total | $ | (2,741,128 | ) | $ | 7,569,050 | |||||
|
|
|
| |||||||
The following table represents the average monthly volume of the Strategy’s derivative transactions during the year ended October 31, 2017:
Interest Rate Swaps: | ||||
Average notional amount | $ | 12,700,000 | (a) | |
Inflation Swaps: |
| |||
Average notional amount | $ | 609,130,769 | ||
| (a) | Positions were open for five months during the year. |
For financial reporting purposes, the Strategy does not offset derivative assets and derivative liabilities that are subject to netting arrangements in the statement of assets and liabilities.
All OTC derivatives held at period end were subject to netting arrangements. The following table presents the Strategy’s derivative assets and liabilities by OTC counterparty net of amounts available for offset under ISDA Master Agreements and net of the related collateral received/pledged by the Strategy as of October 31, 2017.
Counterparty | Derivative Assets Subject to a MA | Derivative Available for Offset | Cash Collateral Received* | Security Collateral Received* | Net Amount of Derivatives Assets | |||||||||||||||
OTC Derivatives: | ||||||||||||||||||||
Bank of America, NA | $ | 316,358 | $ | (316,358 | ) | $ | – 0 | – | $ | – 0 | – | $ | – 0 | – | ||||||
Barclays Bank PLC | 335,675 | (335,675 | ) | – 0 | – | – 0 | – | – 0 | – | |||||||||||
Citibank, NA | 370,057 | (370,057 | ) | – 0 | – | – 0 | – | – 0 | – | |||||||||||
Deutsche Bank AG | 190,969 | (190,969 | ) | – 0 | – | – 0 | – | – 0 | – | |||||||||||
|
|
|
|
|
|
|
|
|
| |||||||||||
Total | $ | 1,213,059 | $ | (1,213,059 | ) | $ | – 0 | – | $ | – 0 | – | $ | – 0 | – | ||||||
|
|
|
|
|
|
|
|
|
| |||||||||||
| abfunds.com | AB MUNICIPAL BOND INFLATION STRATEGY | 47 |
NOTES TO FINANCIAL STATEMENTS (continued)
Counterparty | Derivative Liabilities Subject to a MA | Derivative Available for Offset | Cash Collateral Pledged* | Security Collateral Pledged* | Net Amount of Derivatives Liabilities | |||||||||||||||
OTC Derivatives: | ||||||||||||||||||||
Bank of America, NA | $ | 823,516 | $ | (316,358 | ) | $ | – 0 | – | $ | (461,411 | ) | $ | 45,747 | |||||||
Barclays Bank PLC | 10,331,469 | (335,675 | ) | – 0 | – | (9,995,794 | ) | – 0 | – | |||||||||||
Citibank, NA | 14,155,638 | (370,057 | ) | – 0 | – | (13,785,581 | ) | – 0 | – | |||||||||||
Deutsche Bank AG | 2,078,339 | (190,969 | ) | – 0 | – | (1,887,370 | ) | – 0 | – | |||||||||||
JPMorgan Chase Bank, NA | 10,103,686 | – 0 | – | – 0 | – | (10,103,686 | ) | – 0 | – | |||||||||||
Morgan Stanley Capital Services LLC | 6,584,778 | – 0 | – | – 0 | – | (6,584,778 | ) | – 0 | – | |||||||||||
|
|
|
|
|
|
|
|
|
| |||||||||||
Total | $ | 44,077,426 | $ | (1,213,059 | ) | $ | – 0 | – | $ | (42,818,620 | ) | $ | 45,747 | ^ | ||||||
|
|
|
|
|
|
|
|
|
| |||||||||||
| * | The actual collateral received/pledged may be more than the amount reported due to over-collateralization. |
| ^ | Net amount represents the net receivable/payable that would be due from/to the counterparty in the event of default or termination. The net amount from OTC financial derivative instruments can only be netted across transactions governed under the same master agreement with the same counterparty. |
NOTE E
Capital Stock
Each class consists of 3,000,000,000 authorized shares. Transactions in capital shares for Class A, Class C, Advisor Class, Class 1 and Class 2 were as follows:
| Shares | Amount | |||||||||||||||||||||||
| Year Ended October 31, 2017 | Year Ended October 31, 2016 | Year Ended October 31, 2017 | Year Ended October 31, 2016 | |||||||||||||||||||||
|
| |||||||||||||||||||||||
| Class A | ||||||||||||||||||||||||
Shares sold | 3,860,338 | 612,904 | $ | 39,389,359 | $ | 6,270,343 | ||||||||||||||||||
| ||||||||||||||||||||||||
Shares issued in reinvestment of dividends | 68,587 | 47,816 | 702,584 | 487,459 | ||||||||||||||||||||
| ||||||||||||||||||||||||
Shares converted from Class C | 18,459 | – 0 | – | 189,571 | – 0 | – | ||||||||||||||||||
| ||||||||||||||||||||||||
Shares redeemed | (1,910,262 | ) | (1,087,170 | ) | (19,554,001 | ) | (11,086,129 | ) | ||||||||||||||||
| ||||||||||||||||||||||||
Net increase (decrease) | 2,037,122 | (426,450 | ) | $ | 20,727,513 | $ | (4,328,327 | ) | ||||||||||||||||
| ||||||||||||||||||||||||
| 48 | AB MUNICIPAL BOND INFLATION STRATEGY | abfunds.com |
NOTES TO FINANCIAL STATEMENTS (continued)
| Shares | Amount | |||||||||||||||||||||||
| Year Ended October 31, 2017 | Year Ended October 31, 2016 | Year Ended October 31, 2017 | Year Ended October 31, 2016 | |||||||||||||||||||||
|
| |||||||||||||||||||||||
| Class C | ||||||||||||||||||||||||
Shares sold | 482,829 | 74,599 | $ | 4,914,367 | $ | 760,864 | ||||||||||||||||||
| ||||||||||||||||||||||||
Shares issued in reinvestment of dividends | 9,794 | 9,167 | 100,174 | 93,308 | ||||||||||||||||||||
| ||||||||||||||||||||||||
Shares converted to Class A | (18,496 | ) | – 0 | – | (189,571 | ) | – 0 | – | ||||||||||||||||
| ||||||||||||||||||||||||
Shares redeemed | (289,370 | ) | (331,629 | ) | (2,958,533 | ) | (3,381,118 | ) | ||||||||||||||||
| ||||||||||||||||||||||||
Net increase (decrease) | 184,757 | (247,863 | ) | $ | 1,866,437 | $ | (2,526,946 | ) | ||||||||||||||||
| ||||||||||||||||||||||||
| Advisor Class | ||||||||||||||||||||||||
Shares sold | 12,317,124 | 1,850,768 | $ | 125,893,746 | $ | 18,907,336 | ||||||||||||||||||
| ||||||||||||||||||||||||
Shares issued in reinvestment of dividends | 272,759 | 235,187 | 2,795,556 | 2,399,197 | ||||||||||||||||||||
| ||||||||||||||||||||||||
Shares redeemed | (7,978,907 | ) | (4,229,484 | ) | (81,741,861 | ) | (43,229,628 | ) | ||||||||||||||||
| ||||||||||||||||||||||||
Net increase (decrease) | 4,610,976 | (2,143,529 | ) | $ | 46,947,441 | $ | (21,923,095 | ) | ||||||||||||||||
| ||||||||||||||||||||||||
| Class 1 | ||||||||||||||||||||||||
Shares sold | 13,846,820 | 3,544,601 | $ | 141,531,447 | $ | 36,078,979 | ||||||||||||||||||
| ||||||||||||||||||||||||
Shares issued in reinvestment of dividends | 581,371 | 565,721 | 5,936,458 | 5,749,029 | ||||||||||||||||||||
| ||||||||||||||||||||||||
Shares redeemed | (5,516,471 | ) | (9,837,890 | ) | (56,316,601 | ) | (100,065,872 | ) | ||||||||||||||||
| ||||||||||||||||||||||||
Net increase (decrease) | 8,911,720 | (5,727,568 | ) | $ | 91,151,304 | $ | (58,237,864 | ) | ||||||||||||||||
| ||||||||||||||||||||||||
| Class 2 | ||||||||||||||||||||||||
Shares sold | 5,861,015 | 2,818,891 | $ | 59,930,076 | $ | 28,753,538 | ||||||||||||||||||
| ||||||||||||||||||||||||
Shares issued in reinvestment of dividends | 301,058 | 246,291 | 3,075,422 | 2,505,442 | ||||||||||||||||||||
| ||||||||||||||||||||||||
Shares redeemed | (1,881,524 | ) | (3,889,115 | ) | (19,237,335 | ) | (39,581,027 | ) | ||||||||||||||||
| ||||||||||||||||||||||||
Net increase (decrease) | 4,280,549 | (823,933 | ) | $ | 43,768,163 | $ | (8,322,047 | ) | ||||||||||||||||
| ||||||||||||||||||||||||
NOTE F
Risks Involved in Investing in the Strategy
Credit Risk—An issuer or guarantor of a fixed-income security, or the counterparty to a derivatives or other contract, may be unable or unwilling to make timely payments of interest or principal, or to otherwise honor its obligations. The issuer or guarantor may default, causing a loss of the full principal amount of a security and accrued interest. The degree of risk for a particular security may be reflected in its credit rating. There is the
| abfunds.com | AB MUNICIPAL BOND INFLATION STRATEGY | 49 |
NOTES TO FINANCIAL STATEMENTS (continued)
possibility that the credit rating of a fixed-income security may be downgraded after purchase, which may adversely affect the value of the security. Investments in fixed-income securities with lower ratings (commonly known as “junk bonds”) are subject to have a higher probability that an issuer will default or fail to meet its payment obligations.
Municipal Market Risk—This is the risk that special factors may adversely affect the value of municipal securities and have a significant effect on the yield or value of the Strategy’s investments in municipal securities. These factors include economic conditions, political or legislative changes, uncertainties related to the tax status of municipal securities, or the rights of investors in these securities. To the extent that the Strategy invests more of its assets in a particular state’s municipal securities, the Strategy may be vulnerable to events adversely affecting that state, including economic, political and regulatory occurrences, court decisions, terrorism and catastrophic natural disasters. The Strategy’s investments in certain municipal securities with principal and interest payments that are made from the revenues of a specific project or facility, and not general tax revenues, may have increased risks. Factors affecting the project or facility, such as local business or economic conditions, could have a significant effect on the project’s ability to make payments of principal and interest on these securities. Recent federal legislation included reductions in tax rates for individuals, with relatively larger reductions in tax rates for corporations. These tax rate reductions may reduce the demand for municipal bonds which could reduce the value of municipal bonds held by the Strategy.
Interest Rate Risk—Changes in interest rates will affect the value of investments in fixed-income securities. When interest rates rise, the value of investments in fixed-income securities tends to fall and this decrease in value may not be offset by higher income from new investments. The Strategy may be subject to a heightened risk of rising interest rates as the current period of historically low rates is beginning to end and rates have begun rising. Interest rate risk is generally greater for fixed-income securities with longer maturities or durations.
Duration Risk—Duration is a measure that relates the expected price volatility of a fixed-income security to changes in interest rates. The duration of a fixed-income security may be shorter than or equal to full maturity of a fixed-income security. Fixed-income securities with longer durations have more risk and will decrease in price as interest rates rise. For example, a fixed-income security with a duration of three years will decrease in value by approximately 3% if interest rates increase by 1%.
Inflation Risk—This is the risk that the value of assets or income from investments will be less in the future as inflation decreases the value of
| 50 | AB MUNICIPAL BOND INFLATION STRATEGY | abfunds.com |
NOTES TO FINANCIAL STATEMENTS (continued)
money. As inflation increases, the value of the Strategy’s assets can decline as can the value of the Strategy’s distributions. This risk is significantly greater for fixed-income securities with longer maturities.
Derivatives Risk—The Strategy may enter into derivative transactions such as forwards, options, futures and swaps. Derivatives may be illiquid, difficult to price, and leveraged so that small changes may produce disproportionate losses for the Strategy, and subject to counterparty risk to a greater degree than more traditional investments. Derivatives may result in significant losses, including losses that are far greater than the value of the derivatives reflected on the statement of assets and liabilities.
Leverage Risk—When the Strategy borrows money or otherwise leverages its investments, its performance may be volatile because leverage tends to exaggerate the effect of any increase or decrease in the value of the Strategy’s investments. The Strategy may create leverage through the use of reverse repurchase arrangements, forward currency exchange contracts, forward commitments, dollar rolls or futures or by borrowing money. The use of other types of derivative instruments by the Strategy, such as options and swaps, may also result in a form of leverage. Leverage may result in higher returns to the Strategy than if the Strategy were not leveraged, but may also adversely affect returns, particularly if the market is declining.
Liquidity Risk—Liquidity risk occurs when certain investments become difficult to purchase or sell. Difficulty in selling less liquid securities may result in sales at disadvantageous prices affecting the value of your investment in the Strategy. Causes of liquidity risk may include low trading volumes, large positions and heavy redemptions of fund shares. Over recent years, liquidity risk has also increased because the capacity of dealers in the secondary market for fixed-income securities to make markets in these securities has decreased, even as the overall bond market has grown significantly, due to, among other things, structural changes, additional regulatory requirements and capital and risk restraints that have led to reduced inventories. Liquidity risk may be higher in a rising interest rate environment, when the value and liquidity of fixed-income securities generally go down.
Indemnification Risk—In the ordinary course of business, the Strategy enters into contracts that contain a variety of indemnifications. The Strategy’s maximum exposure under these arrangements is unknown. However, the Strategy has not had prior claims or losses pursuant to these indemnification provisions and expects the risk of loss thereunder to be remote. Therefore, the Strategy has not accrued any liability in connection with these indemnification provisions.
| abfunds.com | AB MUNICIPAL BOND INFLATION STRATEGY | 51 |
NOTES TO FINANCIAL STATEMENTS (continued)
NOTE G
Joint Credit Facility
A number of open-end mutual funds managed by the Adviser, including the Strategy, participate in a $280 million revolving credit facility (the “Facility”) intended to provide short-term financing, if necessary, subject to certain restrictions in connection with abnormal redemption activity. Commitment fees related to the Facility are paid by the participating funds and are included in miscellaneous expenses in the statement of operations. The Strategy did not utilize the Facility during the year ended October 31, 2017.
NOTE H
Distributions to Shareholders
The tax character of distributions paid during the fiscal years ended October 31, 2017 and October 31, 2016 were as follows:
| 2017 | 2016 | |||||||
Distributions paid from: | ||||||||
Ordinary income | $ | 719,132 | $ | 423,254 | ||||
Long-term capital gains | – 0 | – | $ | – 0 | – | |||
|
|
|
| |||||
Total taxable distributions | 719,132 | $ | 423,254 | |||||
Tax-exempt income | 15,905,775 | 14,742,426 | ||||||
|
|
|
| |||||
Total distributions paid | $ | 16,624,907 | $ | 15,165,680 | ||||
|
|
|
| |||||
As of October 31, 2017, the components of accumulated earnings/(deficit) on a tax basis were as follows:
Undistributed tax-exempt income | $ | 493,825 | ||
Accumulated capital and other losses | (8,487,369 | )(a) | ||
Unrealized appreciation/(depreciation) | (14,436,038 | ) | ||
|
| |||
Total accumulated earnings/(deficit) | $ | (22,429,582 | ) | |
|
|
| (a) | As of October 31, 2017, the Strategy had a net capital loss carryforward of $8,487,369. |
For tax purposes, net realized capital losses may be carried over to offset future capital gains, if any. Funds are permitted to carry forward capital losses for an indefinite period, and such losses will retain their character as either short-term or long-term capital losses. As of October 31, 2017, the Strategy had a net short-term capital loss carryforward of $213,464 and a net long-term capital loss carryforward of $8,273,905, which may be carried forward for an indefinite period.
During the current fiscal year, permanent differences primarily due to the tax treatment of swaps resulted in a net decrease in undistributed net investment income and a net decrease in accumulated net realized loss on investments. These reclassifications had no effect on net assets.
| 52 | AB MUNICIPAL BOND INFLATION STRATEGY | abfunds.com |
NOTES TO FINANCIAL STATEMENTS (continued)
NOTE I
Recent Accounting Pronouncements
In March 2017, the Financial Accounting Standards Board issued an Accounting Standards Update, ASU 2017-08, Receivables—Nonrefundable Fees and Other Costs (Subtopic 310-20), Premium Amortization on Purchased Callable Debt Securities (the “ASU”) which amends the amortization period for certain purchased callable debt securities held at a premium, shortening such period to the earliest call date. The ASU does not require any accounting change for debt securities held at a discount; the discount continues to be amortized to maturity. The ASU is effective for fiscal years, and interim periods within those fiscal years, beginning after December 15, 2018. At this time, management is evaluating the implications of these changes on the financial statements.
NOTE J
Subsequent Events
Management has evaluated subsequent events for possible recognition or disclosure in the financial statements through the date the financial statements are issued. Management has determined that there are no material events that would require disclosure in the Strategy’s financial statements through this date.
| abfunds.com | AB MUNICIPAL BOND INFLATION STRATEGY | 53 |
FINANCIAL HIGHLIGHTS
Selected Data For A Share Of Capital Stock Outstanding Throughout Each Period
| Class A | ||||||||||||||||||||
| Year Ended October 31, | ||||||||||||||||||||
| 2017 | 2016 | 2015 | 2014 | 2013 | ||||||||||||||||
|
| |||||||||||||||||||
Net asset value, beginning of period | $ 10.29 | $ 10.14 | $ 10.48 | $ 10.35 | $ 10.80 | |||||||||||||||
|
| |||||||||||||||||||
Income From Investment Operations | ||||||||||||||||||||
Net investment income(a)(b) | .19 | .18 | .15 | .13 | .12 | |||||||||||||||
Net realized and unrealized gain (loss) on investment transactions | (.01 | ) | .16 | (.34 | ) | .12 | (.44 | ) | ||||||||||||
|
| |||||||||||||||||||
Net increase (decrease) in net asset value from operations | .18 | .34 | (.19 | ) | .25 | (.32 | ) | |||||||||||||
|
| |||||||||||||||||||
Less: Dividends and Distributions | ||||||||||||||||||||
Dividends from net investment income | (.19 | ) | (.19 | ) | (.15 | ) | (.12 | ) | (.11 | ) | ||||||||||
Distributions from net realized gain on investment transactions | – 0 | – | – 0 | – | – 0 | – | (.00 | )(c) | (.02 | ) | ||||||||||
|
| |||||||||||||||||||
Total dividends and distributions | (.19 | ) | (.19 | ) | (.15 | ) | (.12 | ) | (.13 | ) | ||||||||||
|
| |||||||||||||||||||
Net asset value, end of period | $ 10.28 | $ 10.29 | $ 10.14 | $ 10.48 | $ 10.35 | |||||||||||||||
|
| |||||||||||||||||||
Total Return | ||||||||||||||||||||
Total investment return based on net asset value(d) | 1.75 | % | 3.38 | % | (1.83 | )% | 2.44 | % | (2.98 | )% | ||||||||||
Ratios/Supplemental Data | ||||||||||||||||||||
Net assets, end of period | $58,270 | $37,345 | $41,122 | $60,016 | $95,466 | |||||||||||||||
Ratio to average net assets of: | ||||||||||||||||||||
Expenses, net of waivers/reimbursements | .75 | % | .75 | % | .76 | % | .80 | % | .80 | % | ||||||||||
Expenses, before waivers/reimbursements | .86 | % | .86 | % | .87 | % | .90 | % | .91 | % | ||||||||||
Net investment income(a) | 1.90 | % | 1.78 | % | 1.49 | % | 1.24 | % | 1.10 | % | ||||||||||
Portfolio turnover rate | 9 | % | 9 | % | 17 | % | 18 | % | 15 | % | ||||||||||
See footnote summary on page 58.
| 54 | AB MUNICIPAL BOND INFLATION STRATEGY | abfunds.com |
FINANCIAL HIGHLIGHTS (continued)
Selected Data For A Share Of Capital Stock Outstanding Throughout Each Period
| Class C | ||||||||||||||||||||
| Year Ended October 31, | ||||||||||||||||||||
| 2017 | 2016 | 2015 | 2014 | 2013 | ||||||||||||||||
|
| |||||||||||||||||||
Net asset value, beginning of period | $ 10.27 | $ 10.12 | $ 10.46 | $ 10.33 | $ 10.78 | |||||||||||||||
|
| |||||||||||||||||||
Income From Investment Operations | ||||||||||||||||||||
Net investment income(a)(b) | .12 | .10 | .08 | .06 | .04 | |||||||||||||||
Net realized and unrealized gain (loss) on investment transactions | (.02 | ) | .16 | (.35 | ) | .12 | (.43 | ) | ||||||||||||
|
| |||||||||||||||||||
Net increase (decrease) in net asset value from operations | .10 | .26 | (.27 | ) | .18 | (.39 | ) | |||||||||||||
|
| |||||||||||||||||||
Less: Dividends and Distributions | ||||||||||||||||||||
Dividends from net investment income | (.11 | ) | (.11 | ) | (.07 | ) | (.05 | ) | (.04 | ) | ||||||||||
Distributions from net realized gain on investment transactions | – 0 | – | – 0 | – | – 0 | – | (.00 | )(c) | (.02 | ) | ||||||||||
|
| |||||||||||||||||||
Total dividends and distributions | (.11 | ) | (.11 | ) | (.07 | ) | (.05 | ) | (.06 | ) | ||||||||||
|
| |||||||||||||||||||
Net asset value, end of period | $ 10.26 | $ 10.27 | $ 10.12 | $ 10.46 | $ 10.33 | |||||||||||||||
|
| |||||||||||||||||||
Total Return | ||||||||||||||||||||
Total investment return based on net asset value(d) | .99 | % | 2.61 | % | (2.56 | )% | 1.72 | % | (3.67 | )% | ||||||||||
Ratios/Supplemental Data | ||||||||||||||||||||
Net assets, end of period | $12,693 | $10,805 | $13,154 | $20,873 | $29,748 | |||||||||||||||
Ratio to average net assets of: | ||||||||||||||||||||
Expenses, net of waivers/reimbursements | 1.50 | % | 1.50 | % | 1.50 | % | 1.50 | % | 1.50 | % | ||||||||||
Expenses, before waivers/reimbursements | 1.61 | % | 1.61 | % | 1.61 | % | 1.60 | % | 1.61 | % | ||||||||||
Net investment income(a) | 1.15 | % | 1.03 | % | .75 | % | .54 | % | .41 | % | ||||||||||
Portfolio turnover rate | 9 | % | 9 | % | 17 | % | 18 | % | 15 | % | ||||||||||
See footnote summary on page 58.
| abfunds.com | AB MUNICIPAL BOND INFLATION STRATEGY | 55 |
FINANCIAL HIGHLIGHTS (continued)
Selected Data For A Share Of Capital Stock Outstanding Throughout Each Period
| Advisor Class | ||||||||||||||||||||
| Year Ended October 31, | ||||||||||||||||||||
| 2017 | 2016 | 2015 | 2014 | 2013 | ||||||||||||||||
|
| |||||||||||||||||||
Net asset value, beginning of period | $ 10.30 | $ 10.14 | $ 10.48 | $ 10.35 | $ 10.81 | |||||||||||||||
|
| |||||||||||||||||||
Income From Investment Operations | ||||||||||||||||||||
Net investment income(a)(b) | .22 | .21 | .18 | .16 | .15 | |||||||||||||||
Net realized and unrealized gain (loss) on investment transactions | (.02 | ) | .17 | (.34 | ) | .12 | (.45 | ) | ||||||||||||
|
| |||||||||||||||||||
Net increase (decrease) in net asset value from operations | .20 | .38 | (.16 | ) | .28 | (.30 | ) | |||||||||||||
|
| |||||||||||||||||||
Less: Dividends and Distributions | ||||||||||||||||||||
Dividends from net investment income | (.21 | ) | (.22 | ) | (.18 | ) | (.15 | ) | (.14 | ) | ||||||||||
Distributions from net realized gain on investment transactions | – 0 | – | – 0 | – | – 0 | – | (.00 | )(c) | (.02 | ) | ||||||||||
|
| |||||||||||||||||||
Total dividends and distributions | (.21 | ) | (.22 | ) | (.18 | ) | (.15 | ) | (.16 | ) | ||||||||||
|
| |||||||||||||||||||
Net asset value, end of period | $ 10.29 | $ 10.30 | $ 10.14 | $ 10.48 | $ 10.35 | |||||||||||||||
|
| |||||||||||||||||||
Total Return | ||||||||||||||||||||
Total investment return based on net asset value(d) | 2.00 | % | 3.74 | % | (1.56 | )% | 2.75 | % | (2.78 | )% | ||||||||||
Ratios/Supplemental Data | ||||||||||||||||||||
Net assets, end of period | $199,635 | $152,275 | $171,789 | $185,106 | $179,620 | |||||||||||||||
Ratio to average net assets of: | ||||||||||||||||||||
Expenses, net of waivers/reimbursements | .50 | % | .50 | % | .50 | % | .50 | % | .50 | % | ||||||||||
Expenses, before waivers/reimbursements | .61 | % | .61 | % | .61 | % | .60 | % | .61 | % | ||||||||||
Net investment income(a) | 2.15 | % | 2.03 | % | 1.76 | % | 1.55 | % | 1.39 | % | ||||||||||
Portfolio turnover rate | 9 | % | 9 | % | 17 | % | 18 | % | 15 | % | ||||||||||
See footnote summary on page 58.
| 56 | AB MUNICIPAL BOND INFLATION STRATEGY | abfunds.com |
FINANCIAL HIGHLIGHTS (continued)
Selected Data For A Share Of Capital Stock Outstanding Throughout Each Period
| Class 1 | ||||||||||||||||||||
| Year Ended October 31, | ||||||||||||||||||||
| 2017 | 2016 | 2015 | 2014 | 2013 | ||||||||||||||||
|
| |||||||||||||||||||
Net asset value, beginning of period | $ 10.26 | $ 10.11 | $ 10.45 | $ 10.33 | $ 10.78 | |||||||||||||||
|
| |||||||||||||||||||
Income From Investment Operations | ||||||||||||||||||||
Net investment income(a)(b) | .21 | .20 | .17 | .15 | .14 | |||||||||||||||
Net realized and unrealized gain (loss) on investment transactions | (.01 | ) | .16 | (.34 | ) | .12 | (.43 | ) | ||||||||||||
|
| |||||||||||||||||||
Net increase (decrease) in net asset value from operations | .20 | .36 | (.17 | ) | .27 | (.29 | ) | |||||||||||||
|
| |||||||||||||||||||
Less: Dividends and Distributions | ||||||||||||||||||||
Dividends from net investment income | (.21 | ) | (.21 | ) | (.17 | ) | (.15 | ) | (.14 | ) | ||||||||||
Distributions from net realized gain on investment transactions | – 0 | – | – 0 | – | – 0 | – | (.00 | )(c) | (.02 | ) | ||||||||||
|
| |||||||||||||||||||
Total dividends and distributions | (.21 | ) | (.21 | ) | (.17 | ) | (.15 | ) | (.16 | ) | ||||||||||
|
| |||||||||||||||||||
Net asset value, end of period | $ 10.25 | $ 10.26 | $ 10.11 | $ 10.45 | $ 10.33 | |||||||||||||||
|
| |||||||||||||||||||
Total Return | ||||||||||||||||||||
Total investment return based on net asset value(d) | 1.94 | % | 3.58 | % | (1.62 | )% | 2.60 | % | (2.76 | )% | ||||||||||
Ratios/Supplemental Data | ||||||||||||||||||||
Net assets, end of period | $424,291 | $333,311 | $386,448 | $408,307 | $419,573 | |||||||||||||||
Ratio to average net assets of: | ||||||||||||||||||||
Expenses, net of waivers/reimbursements | .60 | % | .60 | % | .60 | % | .60 | % | .60 | % | ||||||||||
Expenses, before waivers/reimbursements | .67 | % | .68 | % | .67 | % | .66 | % | .67 | % | ||||||||||
Net investment income(a) | 2.05 | % | 1.93 | % | 1.66 | % | 1.44 | % | 1.30 | % | ||||||||||
Portfolio turnover rate | 9 | % | 9 | % | 17 | % | 18 | % | 15 | % | ||||||||||
See footnote summary on page 58.
| abfunds.com | AB MUNICIPAL BOND INFLATION STRATEGY | 57 |
FINANCIAL HIGHLIGHTS (continued)
Selected Data For A Share Of Capital Stock Outstanding Throughout Each Period
| Class 2 | ||||||||||||||||||||
| Year Ended October 31, | ||||||||||||||||||||
| 2017 | 2016 | 2015 | 2014 | 2013 | ||||||||||||||||
|
| |||||||||||||||||||
Net asset value, beginning of period | $ 10.26 | $ 10.12 | $ 10.46 | $ 10.33 | $ 10.79 | |||||||||||||||
|
| |||||||||||||||||||
Income From Investment Operations | ||||||||||||||||||||
Net investment income(a)(b) | .22 | .21 | .18 | .16 | .15 | |||||||||||||||
Net realized and unrealized gain (loss) on investment transactions | (.01 | ) | .15 | (.34 | ) | .13 | (.44 | ) | ||||||||||||
|
| |||||||||||||||||||
Net increase (decrease) in net asset value from operations | .21 | .36 | (.16 | ) | .29 | (.29 | ) | |||||||||||||
|
| |||||||||||||||||||
Less: Dividends and Distributions | ||||||||||||||||||||
Dividends from net investment income | (.22 | ) | (.22 | ) | (.18 | ) | (.16 | ) | (.15 | ) | ||||||||||
Distributions from net realized gain on investment transactions | – 0 | – | – 0 | – | – 0 | – | (.00 | )(c) | (.02 | ) | ||||||||||
|
| |||||||||||||||||||
Total dividends and distributions | (.22 | ) | (.22 | ) | (.18 | ) | (.16 | ) | (.17 | ) | ||||||||||
|
| |||||||||||||||||||
Net asset value, end of period | $ 10.25 | $ 10.26 | $ 10.12 | $ 10.46 | $ 10.33 | |||||||||||||||
|
| |||||||||||||||||||
Total Return | ||||||||||||||||||||
Total investment return based on net asset value(d) | 2.04 | % | 3.58 | % | (1.52 | )% | 2.79 | % | (2.75 | )% | ||||||||||
Ratios/Supplemental Data | ||||||||||||||||||||
Net assets, end of period | $213,880 | $170,155 | $176,066 | $185,904 | $183,237 | |||||||||||||||
Ratio to average net assets of: | ||||||||||||||||||||
Expenses, net of waivers/reimbursements | .50 | % | .50 | % | .50 | % | .50 | % | .50 | % | ||||||||||
Expenses, before waivers/reimbursements | .57 | % | .58 | % | .57 | % | .56 | % | .57 | % | ||||||||||
Net investment income(a) | 2.14 | % | 2.03 | % | 1.76 | % | 1.54 | % | 1.39 | % | ||||||||||
Portfolio turnover rate. | 9 | % | 9 | % | 17 | % | 18 | % | 15 | % | ||||||||||
| (a) | Net of fees waived and expenses reimbursed by the Adviser. |
| (b) | Based on average shares outstanding. |
| (c) | Amount is less than $.005. |
| (d) | Total investment return is calculated assuming an initial investment made at the net asset value at the beginning of the period, reinvestment of all dividends and distributions at net asset value during the period, and redemption on the last day of the period. Initial sales charges or contingent deferred sales charges are not reflected in the calculation of total investment return. Total return does not reflect the deduction of taxes that a shareholder would pay on portfolio distributions or the redemption of portfolio shares. Total investment return calculated for a period of less than one year is not annualized. |
See notes to financial statements.
| 58 | AB MUNICIPAL BOND INFLATION STRATEGY | abfunds.com |
REPORT OF INDEPENDENT REGISTERED
PUBLIC ACCOUNTING FIRM
To the Board of Directors and Shareholders of
AB Municipal Bond Inflation Strategy
We have audited the accompanying statement of assets and liabilities, including the portfolio of investments, of AB Municipal Bond Inflation Strategy (the “Strategy”), one of the portfolios constituting the AB Bond Fund, Inc., as of October 31, 2017, and the related statement of operations for the year then ended, the statements of changes in net assets for each of the two years in the period then ended, and the financial highlights for each of the five years in the period then ended. These financial statements and financial highlights are the responsibility of the Strategy’s management. Our responsibility is to express an opinion on these financial statements and financial highlights based on our audits.
We conducted our audits in accordance with the standards of the Public Company Accounting Oversight Board (United States). Those standards require that we plan and perform the audit to obtain reasonable assurance about whether the financial statements and financial highlights are free of material misstatement. We were not engaged to perform an audit of the Strategy’s internal control over financial reporting. Our audits included consideration of internal control over financial reporting as a basis for designing audit procedures that are appropriate in the circumstances, but not for the purpose of expressing an opinion on the effectiveness of the Strategy’s internal control over financial reporting. Accordingly, we express no such opinion. An audit also includes examining, on a test basis, evidence supporting the amounts and disclosures in the financial statements and financial highlights, assessing the accounting principles used and significant estimates made by management, and evaluating the overall financial statement presentation. Our procedures included confirmation of securities owned as of October 31, 2017, by correspondence with the custodian and others, or by other appropriate auditing procedures where replies from others were not received. We believe that our audits provide a reasonable basis for our opinion.
In our opinion, the financial statements and financial highlights referred to above present fairly, in all material respects, the financial position of AB Municipal Bond Inflation Strategy, one of the portfolios constituting the AB Bond Fund, Inc., at October 31, 2017, the results of its operations for the year then ended, the changes in its net assets for each of the two years in the period then ended and the financial highlights for each of five years in the period then ended, in conformity with U.S. generally accepted accounting principles.

New York, New York
December 28, 2017
| abfunds.com | AB MUNICIPAL BOND INFLATION STRATEGY | 59 |
BOARD OF DIRECTORS
Marshall C. Turner, Jr.(1), Chairman John H. Dobkin(1)(2) Michael J. Downey(1) William H. Foulk, Jr.(1) D. James Guzy(1)(2) | Nancy P. Jacklin(1) Robert M. Keith, President and Chief Executive Officer Carol C. McMullen(1) Garry L. Moody(1) Earl D. Weiner(1) |
OFFICERS
Philip L. Kirstein(3) , Senior Vice President and Independent Compliance Officer Robert (“Guy”) B. Davidson III(4) , Vice President Terrance T. Hults(4), Vice President Matthew J. Norton(4), Vice President | Andrew D. Potter(4), Vice President Emilie D. Wrapp, Secretary Joseph J. Mantineo, Treasurer and Chief Financial Officer Phyllis J. Clarke, Controller Vincent S. Noto, Chief Compliance Officer |
Custodian and Accounting Agent State Street Bank and Trust Company State Street Corporation CCB/5 1 Iron Street Boston, MA 02210
Principal Underwriter AllianceBernstein Investments, Inc. 1345 Avenue of the Americas New York, NY 10105
Transfer Agent AllianceBernstein Investor Services, Inc. P.O. Box 786003 San Antonio, TX 78278-6003 Toll-Free (800) 221-5672 | Independent Registered Public Accounting Firm Ernst & Young LLP 5 Times Square New York, NY 10036
Legal Counsel Seward & Kissel LLP One Battery Park Plaza New York, NY 10004 |
| 1 | Member of the Audit Committee, the Governance and Nominating Committee and the Independent Directors Committee. |
| 2 | Messrs. Dobkin and Guzy are expected to retire on or about December 31, 2017. |
| 3 | Mr. Kirstein is expected to retire on or about December 31, 2017. |
| 4 | The day-to-day management of, and investment decisions for, the Strategy’s portfolio are made by the Adviser’s Municipal Bond Investment Team. Messrs. Robert “Guy” B. Davidson III, Terrance T. Hults, Matthew J. Norton and Andrew D. Potter are the investment professionals with the most significant responsibility for the day-to-day management of the Strategy’s portfolio. |
| 60 | AB MUNICIPAL BOND INFLATION STRATEGY | abfunds.com |
MANAGEMENT OF THE FUND
Board of Directors Information
The business and affairs of the Strategy are managed under the direction of the Board of Directors. Certain information concerning the Strategy’s Directors is set forth below.
| NAME, ADDRESS*, AGE, (YEAR FIRST ELECTED**) | PRINCIPAL OCCUPATION(S) DURING PAST FIVE YEARS AND OTHER INFORMATION*** | PORTFOLIOS IN FUND COMPLEX OVERSEEN BY DIRECTOR | OTHER PUBLIC COMPANY DIRECTORSHIPS CURRENTLY HELD BY DIRECTOR | |||||
| INTERESTED DIRECTOR | ||||||||
Robert M. Keith# 57 (2010) | Senior Vice President of AllianceBernstein L.P. (the “Adviser”) and the head of AllianceBernstein Investments, Inc. (“ABI”) since July 2008; Director of ABI and President of the AB Mutual Funds. Previously, he served as Executive Managing Director of ABI from December 2006 to June 2008. Prior to joining ABI in 2006, Executive Managing Director of Bernstein Global Wealth Management, and prior thereto, Senior Managing Director and Global Head of Client Service and Sales of the Adviser’s institutional investment management business since 2004. Prior thereto, he was Managing Director and Head of North American Client Service and Sales in the Adviser’s institutional investment management business with which he has been associated since prior to 2004. | 96 | None | |||||
| abfunds.com | AB MUNICIPAL BOND INFLATION STRATEGY | 61 |
MANAGEMENT OF THE FUND (continued)
| NAME, ADDRESS*, AGE, (YEAR FIRST ELECTED**) | PRINCIPAL OCCUPATION(S) DURING PAST FIVE YEARS AND OTHER INFORMATION*** | PORTFOLIOS IN FUND COMPLEX OVERSEEN BY DIRECTOR | OTHER PUBLIC COMPANY DIRECTORSHIPS CURRENTLY HELD BY DIRECTOR | |||||
| INTERESTED DIRECTOR (continued) | ||||||||
Marshall C. Turner, Jr.## Chairman of the Board 76 (2005) | Private Investor since prior to 2012. Former Chairman and CEO of Dupont Photomasks, Inc. (components of semiconductor manufacturing). He has extensive operating leadership, and venture capital investing experience, including five interim or full-time CEO roles, and prior service as general partner of institutional venture capital partnerships. He also has extensive non-profit board leadership experience, and currently serves on the boards of two education and science-related non profit organizations. He has served as a director of one AB Fund since 1992, and director or trustee of multiple AB Funds since 2005. He has been Chairman of the AB Funds since January 2014, and the Chairman of the Independent Directors Committees of such AB Funds since February 2014. | 96 | Xilinx, Inc. (programmable logic semi-conductors) since 2007 | |||||
John H. Dobkin##,^ 75 (1998) | Independent Consultant since prior to 2012. Formerly, President of Save Venice, Inc. (preservation organization) from 2001-2002; Senior Advisor from June 1999-June 2000 and President of Historic Hudson Valley (historic preservation) from December 1989-May 1999. Previously, Director of the National Academy of Design. He has served as a director or trustee of various AB Funds since 1992, and as Chairman of the Audit Committees of a number of such AB Funds from 2001-2008. | 95 | None | |||||
| 62 | AB MUNICIPAL BOND INFLATION STRATEGY | abfunds.com |
MANAGEMENT OF THE FUND (continued)
| NAME, ADDRESS*, AGE, (YEAR FIRST ELECTED**) | PRINCIPAL OCCUPATION(S) DURING PAST FIVE YEARS AND OTHER INFORMATION*** | PORTFOLIOS IN FUND COMPLEX OVERSEEN BY DIRECTOR | OTHER PUBLIC COMPANY DIRECTORSHIPS CURRENTLY HELD BY DIRECTOR | |||||
| INTERESTED DIRECTOR (continued) | ||||||||
Michael J. Downey## 73 (2005) | Private Investor since prior to 2012. Formerly, managing partner of Lexington Capital, LLC (investment advisory firm) from December 1997 until December 2003. He served as a Director of Prospect Acquisition Corp. (financial services) from 2007 until 2009. From 1987 until 1993, Chairman and CEO of Prudential Mutual Fund Management, director of the Prudential mutual funds, and member of the Executive Committee of Prudential Securities, Inc. He has served as a director or trustee of the AB Funds since 2005 and is a director and Chairman of one other registered investment company. | 96 | The Asia Pacific Fund, Inc. (registered investment company) since prior to 2012 | |||||
William H. Foulk, Jr.## 85 (1998) | Investment Adviser and an Independent Consultant since prior to 2012. Previously, he was Senior Manager of Barrett Associates, Inc., a registered investment adviser. He was formerly Deputy Comptroller and Chief Investment Officer of the State of New York and, prior thereto, Chief Investment Officer of the New York Bank for Savings. He has served as a director or trustee of various AB Funds since 1983, and was Chairman of the Independent Directors Committees of the AB Funds from 2003 until early February 2014. He served as Chairman of such AB Funds from 2003 through December 2013. He is also active in a number of mutual fund related organizations and committees. | 96 | None | |||||
| abfunds.com | AB MUNICIPAL BOND INFLATION STRATEGY | 63 |
MANAGEMENT OF THE FUND (continued)
| NAME, ADDRESS*, AGE, (YEAR FIRST ELECTED**) | PRINCIPAL OCCUPATION(S) DURING PAST FIVE YEARS AND OTHER INFORMATION*** | PORTFOLIOS IN FUND COMPLEX OVERSEEN BY DIRECTOR | OTHER PUBLIC COMPANY DIRECTORSHIPS CURRENTLY HELD BY DIRECTOR | |||||
| INTERESTED DIRECTOR (continued) | ||||||||
| D. James Guzy##,^ 81 (2005) | Chairman of the Board of SRC Computers, Inc. (semi-conductors), with which he has been associated since prior to 2012. He served as Chairman of the Board of PLX Technology (semi-conductors) since prior to 2012 until November 2013. He was a director of Intel Corporation (semi-conductors) from 1969 until 2008, and served as Chairman of the Finance Committee of such company for several years until May 2008. He has served as a director or trustee of one or more of the AB Funds since 1982. | 93 | None | |||||
| Nancy P. Jacklin## 69 (2006) | Private Investor since prior to 2012. Professorial Lecturer at the Johns Hopkins School of Advanced International Studies (2008-2015). U.S. Executive Director of the International Monetary Fund (which is responsible for ensuring the stability of the international monetary system), (December 2002-May 2006); Partner, Clifford Chance (1992-2002); Sector Counsel, International Banking and Finance, and Associate General Counsel, Citicorp (1985-1992); Assistant General Counsel (International), Federal Reserve Board of Governors (1982-1985); and Attorney Advisor, U.S. Department of the Treasury (1973-1982). Member of the Bar of the District of Columbia and of New York; and member of the Council on Foreign Relations. She has served as a director or trustee of the AB Funds since 2006 and has been Chairman of the Governance and Nominating Committees of the AB Funds since August 2014. | 96 | None | |||||
| 64 | AB MUNICIPAL BOND INFLATION STRATEGY | abfunds.com |
MANAGEMENT OF THE FUND (continued)
| NAME, ADDRESS*, AGE, (YEAR FIRST ELECTED**) | PRINCIPAL OCCUPATION(S) DURING PAST FIVE YEARS AND OTHER INFORMATION*** | PORTFOLIOS IN FUND COMPLEX OVERSEEN BY DIRECTOR | OTHER PUBLIC COMPANY DIRECTORSHIPS CURRENTLY HELD BY DIRECTOR | |||||
| INTERESTED DIRECTOR (continued) | ||||||||
| Carol C. McMullen## 62 (2016) | Managing Director of Slalom Consulting (consulting) since 2014, private investor and member of the Partners Healthcare Investment Committee. Formerly, Director of Norfolk & Dedham Group (mutual property and casualty insurance) from 2011 until November 2016; Director of Partners Community Physicians Organization (healthcare) from 2014 until December 2016; and Managing Director of The Crossland Group (consulting) from 2012 until 2013. She has held a number of senior positions in the asset and wealth management industries, including at Eastern Bank (where her roles included President of Eastern Wealth Management), Thomson Financial (Global Head of Sales for Investment Management), and Putnam Investments (where her roles included Head of Global Investment Research). She has served on a number of private company and nonprofit boards, and as a director or trustee of the AB Funds since June 2016. | 96 | None | |||||
| abfunds.com | AB MUNICIPAL BOND INFLATION STRATEGY | 65 |
MANAGEMENT OF THE FUND (continued)
| NAME, ADDRESS*, AGE, (YEAR FIRST ELECTED**) | PRINCIPAL OCCUPATION(S) DURING PAST FIVE YEARS AND OTHER INFORMATION*** | PORTFOLIOS IN FUND COMPLEX OVERSEEN BY DIRECTOR | OTHER PUBLIC COMPANY DIRECTORSHIPS CURRENTLY HELD BY DIRECTOR | |||||
| INTERESTED DIRECTOR (continued) | ||||||||
| Garry L. Moody## 65 (2008) | Independent Consultant. Formerly, Partner, Deloitte & Touche LLP (1995-2008) where he held a number of senior positions, including Vice Chairman, and U.S. and Global Investment Management Practice Managing Partner; President, Fidelity Accounting and Custody Services Company (1993-1995), where he was responsible for accounting, pricing, custody and reporting for the Fidelity mutual funds; and Partner, Ernst & Young LLP (1975-1993), where he served as the National Director of Mutual Fund Tax Services and Managing Partner of its Chicago Office Tax department. He is a member of the Trustee Advisory Board of BoardIQ, a biweekly publication focused on issues and news affecting directors of mutual funds. He has served as a director or trustee, and as Chairman of the Audit Committees, of the AB Funds since 2008. | 96 | None | |||||
Earl D. Weiner## 78 (2007) | Of Counsel, and Partner prior to January 2007, of the law firm Sullivan & Cromwell LLP and is a former member of the ABA Federal Regulation of Securities Committee Task Force to draft editions of the Fund Director’s Guidebook. He also serves as a director or trustee of various non-profit organizations and has served as Chairman or Vice Chairman of a number of them. He has served as a director or trustee of the AB Funds since 2007 and served as Chairman of the Governance and Nominating Committees of the AB Funds from 2007 until August 2014. | 96 | None | |||||
| 66 | AB MUNICIPAL BOND INFLATION STRATEGY | abfunds.com |
MANAGEMENT OF THE FUND (continued)
| * | The address for each of the Strategy’s disinterested Directors is c/o AllianceBernstein L.P., Attention: Office of the Senior Officer, 1345 Avenue of the Americas, New York, NY 10105. |
| ** | There is no stated term of office for the Strategy’s Directors. |
| *** | The information above includes each Director’s principal occupation during the last five years and other information relating to the experience, attributes and skills relevant to each Director’s qualifications to serve as a Director, which led to the conclusion that each Director should serve as a Director for the Strategy. |
| # | Mr. Keith is an “interested person” of the Strategy as defined in the “40 Act,” due to his position as a Senior Vice President of the Adviser. |
| ## | Member of the Audit Committee, the Governance and Nominating Committee and the Independent Directors Committee. |
| ^ | Messrs. Dobkin and Guzy are expected to retire on or about December 31, 2017. |
| abfunds.com | AB MUNICIPAL BOND INFLATION STRATEGY | 67 |
MANAGEMENT OF THE FUND (continued)
Officer Information
Certain information concerning the Strategy’s Officers is listed below.
| NAME, ADDRESS* AND AGE | PRINCIPAL POSITION(S) HELD WITH FUND | PRINCIPAL OCCUPATION DURING PAST 5 YEARS | ||
| Robert M. Keith 57 | President and Chief Executive Officer | See biography above. | ||
| Philip L. Kirstein^ 72 | Senior Vice President and Independent Compliance Officer | Senior Vice President and Independent Compliance Officer of the AB Funds, with which he has been associated since October 2004. Prior thereto, he was Of Counsel to Kirkpatrick & Lockhart, LLP from October 2003 to October 2004, and General Counsel of Merrill Lynch Investment Managers, L.P. since prior to March 2003. | ||
| Robert “Guy” B. Davidson III 56 | Vice President | Senior Vice President of the Adviser,** with which he has been associated since prior to 2012. | ||
| Terrance T. Hults 51 | Vice President | Senior Vice President of the Adviser,** with which he has been associated since prior to 2012. | ||
| Matthew J. Norton 34 | Vice President | Vice President of the Adviser,** with which he has been associated since prior to 2012. | ||
Andrew D. Potter 32 | Vice President | Vice President of the Adviser,** with which he has been associated since prior to 2012. | ||
| Emilie D. Wrapp 62 | Secretary | Senior Vice President, Assistant General Counsel and Assistant Secretary of ABI,** with which she has been associated since prior to 2012. | ||
| Joseph J. Mantineo 58 | Treasurer and Chief Financial Officer | Senior Vice President of AllianceBernstein Investor Services, Inc. (“ABIS”),** with which he has been associated since prior to 2012. | ||
| Phyllis J. Clarke 56 | Controller | Vice President of ABIS,** with which she has been associated since prior to 2012. | ||
| Vincent S. Noto 53 | Chief Compliance Officer | Senior Vice President since 2015 and Mutual Fund Chief Compliance Officer of the Adviser** since 2014. Prior thereto, he was Vice President and Director of Mutual Fund Compliance of the Adviser** since 2012. |
| * | The address for each of the Fund’s Officers is 1345 Avenue of the Americas, New York, NY 10105. |
| ** | The Adviser, ABI and ABIS are affiliates of the Strategy. |
| ^ | Mr. Kirstein is expected to retire on or about December 31, 2017. |
The Fund’s Statement of Additional Information (“SAI”) has additional information about the Strategy’s Directors and Officers and is available without charge upon request. Contact your financial representative or AB at 1-800-227-4618, or visit www.abfunds.com, for a free prospectus or SAI.
| 68 | AB MUNICIPAL BOND INFLATION STRATEGY | abfunds.com |
Information Regarding the Review and Approval of the Fund’s Advisory Agreement
The disinterested directors (the “directors”) of AB Bond Fund, Inc. (the “Company”) unanimously approved the continuance of the Company’s Advisory Agreement with the Adviser in respect of AB Municipal Bond Inflation Strategy (the “Fund”) at a meeting held on November 1-3, 2016 (the “Meeting”).
Prior to approval of the continuance of the Advisory Agreement, the directors had requested from the Adviser, and received and evaluated, extensive materials. They reviewed the proposed continuance of the Advisory Agreement with the Adviser and with experienced counsel who are independent of the Adviser, who advised on the relevant legal standards. The directors also reviewed an independent evaluation prepared by the Company’s Senior Officer (who is also the Company’s Independent Compliance Officer) of the reasonableness of the advisory fee, in which the Senior Officer concluded that the contractual fee for the Fund was reasonable. The directors also discussed the proposed continuance in private sessions with counsel and the Company’s Senior Officer.
The directors considered their knowledge of the nature and quality of the services provided by the Adviser to the Fund gained from their experience as directors or trustees of most of the registered investment companies advised by the Adviser, their overall confidence in the Adviser’s integrity and competence they have gained from that experience, the Adviser’s initiative in identifying and raising potential issues with the directors and its responsiveness, frankness and attention to concerns raised by the directors in the past, including the Adviser’s willingness to consider and implement organizational and operational changes designed to improve investment results and the services provided to the AB Funds. The directors noted that they have four regular meetings each year, at each of which they receive presentations from the Adviser on the investment results of the Fund and review extensive materials and information presented by the Adviser.
The directors also considered all other factors they believed relevant, including the specific matters discussed below. In their deliberations, the directors did not identify any particular information that was all-important or controlling, and different directors may have attributed different weights to the various factors. The directors determined that the selection of the Adviser to manage the Fund and the overall arrangements between the Fund and the Adviser, as provided in the Advisory Agreement, including the advisory fee, were fair and reasonable in light of the services performed, expenses incurred and such other matters as the directors considered relevant in the exercise of their business judgment. The
| abfunds.com | AB MUNICIPAL BOND INFLATION STRATEGY | 69 |
material factors and conclusions that formed the basis for the directors’ determinations included the following:
Nature, Extent and Quality of Services Provided
The directors considered the scope and quality of services provided by the Adviser under the Advisory Agreement, including the quality of the investment research capabilities of the Adviser and the other resources it has dedicated to performing services for the Fund. They also noted the professional experience and qualifications of the Fund’s portfolio management team and other senior personnel of the Adviser. The directors also considered that the Advisory Agreement provides that the Fund will reimburse the Adviser for the cost to it of providing certain clerical, accounting, administrative and other services to the Fund by employees of the Adviser or its affiliates. Requests for these reimbursements are made on a quarterly basis and subject to approval by the directors. Reimbursements, to the extent requested and paid, result in a higher rate of total compensation from the Fund to the Adviser than the fee rate stated in the Advisory Agreement. The directors noted that the methodology used to determine the reimbursement amounts had been reviewed by an independent consultant retained by the Company’s Senior Officer. The quality of administrative and other services, including the Adviser’s role in coordinating the activities of the Fund’s other service providers, also was considered. The directors concluded that, overall, they were satisfied with the nature, extent and quality of services provided to the Fund under the Advisory Agreement.
Costs of Services Provided and Profitability
The directors reviewed a schedule of the revenues and expenses and related notes indicating the profitability of the Fund to the Adviser for calendar years 2014 and 2015 that had been prepared with an expense allocation methodology arrived at in consultation with an independent consultant retained by the Company’s Senior Officer. The directors noted the assumptions and methods of allocation used by the Adviser in preparing fund-specific profitability data and understood that there are a number of potentially acceptable allocation methodologies for information of this type. The directors noted that the profitability information reflected all revenues and expenses of the Adviser’s relationship with the Fund, including those relating to its subsidiaries that provide transfer agency and distribution services to the Fund. The directors recognized that it is difficult to make comparisons of the profitability of the Advisory Agreement with the profitability of fund advisory contracts for unaffiliated funds because comparative information is not generally publicly available and is affected by numerous factors. The directors focused on the profitability of the Adviser’s relationship with the Fund before taxes and distribution expenses. The directors concluded that the Adviser’s level of profitability from its relationship with the Fund was not unreasonable.
| 70 | AB MUNICIPAL BOND INFLATION STRATEGY | abfunds.com |
Fall-Out Benefits
The directors considered the other benefits to the Adviser and its affiliates from their relationships with the Fund, including, but not limited to, benefits relating to 12b-1 fees and sales charges received by the Fund’s principal underwriter (which is a wholly owned subsidiary of the Adviser) in respect of certain classes of the Fund’s shares; and transfer agency fees paid by the Fund to a wholly owned subsidiary of the Adviser. The directors recognized that the Adviser’s profitability would be somewhat lower without these benefits. The directors understood that the Adviser also might derive reputational and other benefits from its association with the Fund.
Investment Results
In addition to the information reviewed by the directors in connection with the Meeting, the directors receive detailed performance information for the Fund at each regular Board meeting during the year.
At the Meeting, the directors reviewed information prepared by Broadridge Financial Solutions, Inc. (“Broadridge”), an analytical service that is not affiliated with the Adviser, showing the performance of the Class A Shares of the Fund against a peer group and a peer universe selected by Broadridge, and information prepared by the Adviser showing performance of the Class A Shares against a broad-based securities market index, in each case for the 1-, 3- and 5-year periods ended July 31, 2016 and (in the case of comparisons with the broad-based securities market index) for the period from inception. Based on their review, and their discussion with the Adviser of the reasons for the Fund’s underperformance in certain periods, the directors concluded that the Fund’s investment performance was acceptable.
Advisory Fees and Other Expenses
The directors considered the advisory fee rate paid by the Fund to the Adviser and information prepared by Broadridge concerning advisory fee rates paid by other funds in the same Broadridge category as the Fund at a common asset level. The directors recognized that it is difficult to make comparisons of advisory fees because there are variations in the services that are included in the fees paid by other funds. The directors compared the Fund’s contractual effective advisory fee rate with a peer group median and took into account the impact on the advisory fee rate of the administrative expense reimbursement paid to the Adviser in the latest fiscal year.
The directors also considered the Adviser’s fee schedule for institutional clients pursuing a similar investment style. For this purpose, they reviewed the relevant advisory fee information from the Adviser’s Form ADV and the evaluation from the Company’s Senior Officer and noted the differences between the Fund’s fee schedule, on the one hand, and the institutional fee
| abfunds.com | AB MUNICIPAL BOND INFLATION STRATEGY | 71 |
schedule and the schedule of fees charged to any offshore funds and any sub-advised funds, on the other. The directors noted that the Adviser may, in some cases, agree to fee rates with large institutional clients that are lower than those reviewed by the directors and that they had previously discussed with the Adviser its policies in respect of such arrangements.
The Adviser reviewed with the directors the significantly greater scope of the services it provides to the Fund relative to institutional, offshore fund and sub-advised fund clients. In light of the substantial differences in services rendered by the Adviser to institutional, offshore fund and sub-advised fund clients as compared to funds such as the Fund, the directors considered these fee comparisons inapt and did not place significant weight on them in their deliberations.
The directors also considered the total expense ratio of the Class A shares of the Fund in comparison to a peer group and a peer universe selected by Broadridge. The Class A expense ratio of the Fund was based on the Fund’s latest fiscal year. The directors noted the effects of any fee waivers and/or expense reimbursements as a result of an undertaking by the Adviser. The directors noted that it was likely that the expense ratios of some of the other funds in the Fund’s Broadridge category were lowered by waivers or reimbursements by those funds’ investment advisers, which in some cases might be voluntary or temporary. The directors view expense ratio information as relevant to their evaluation of the Adviser’s services because the Adviser is responsible for coordinating services provided to the Fund by others. Based on their review, the directors concluded that the Fund’s expense ratio was acceptable.
Economies of Scale
The directors noted that the advisory fee schedule for the Fund contains breakpoints that reduce the fee rates on assets above specified levels. The directors took into consideration prior presentations by an independent consultant on economies of scale in the mutual fund industry and for the AB Funds, and by the Adviser concerning certain of its views on economies of scale. The directors also had requested and received from the Adviser certain updates on economies of scale in advance of the Meeting. The directors believe that economies of scale may be realized (if at all) by the Adviser across a variety of products and services, and not only in respect of a single fund. The directors noted that there is no established methodology for setting breakpoints that give effect to the fund-specific services provided by a fund’s adviser and to the economies of scale that an adviser may realize in its overall mutual fund business or those components of it which directly or indirectly affect a fund’s operations. The directors observed that in the mutual fund industry as a whole, as well as among funds similar to the Fund, there is no uniformity or pattern in the fees and asset levels at which breakpoints (if any) apply. The directors also
| 72 | AB MUNICIPAL BOND INFLATION STRATEGY | abfunds.com |
noted that the advisory agreements for many funds do not have breakpoints at all. Having taken these factors into account, the directors concluded that the Fund’s shareholders would benefit from a sharing of economies of scale in the event the Fund’s net assets exceed a breakpoint in the future.
| abfunds.com | AB MUNICIPAL BOND INFLATION STRATEGY | 73 |
This page is not part of the Shareholder Report or the Financial Statements.
AB FAMILY OF FUNDS
US EQUITY
US CORE
Core Opportunities Fund
FlexFee™ US Thematic Portfolio
Select US Equity Portfolio
US GROWTH
Concentrated Growth Fund
Discovery Growth Fund
FlexFee™ Large Cap Growth Portfolio
Growth Fund
Large Cap Growth Fund
Small Cap Growth Portfolio
US VALUE
Discovery Value Fund
Equity Income Fund
Relative Value Fund1
Small Cap Value Portfolio
Value Fund
INTERNATIONAL/ GLOBAL EQUITY
INTERNATIONAL/ GLOBAL CORE
Global Core Equity Portfolio
International Portfolio
International Strategic Core Portfolio
Sustainable Global Thematic Fund1
Tax-Managed International Portfolio
Tax-Managed Wealth Appreciation Strategy
Wealth Appreciation Strategy
INTERNATIONAL/ GLOBAL GROWTH
Concentrated International Growth Portfolio
International Growth Fund
INTERNATIONAL/ GLOBAL EQUITY (continued)
INTERNATIONAL/ GLOBAL VALUE
Asia ex-Japan Equity Portfolio
International Value Fund
FIXED INCOME
MUNICIPAL
High Income Municipal Portfolio
Intermediate California Municipal Portfolio
Intermediate Diversified Municipal Portfolio
Intermediate New York Municipal Portfolio
Municipal Bond Inflation Strategy
Tax-Aware Fixed Income Portfolio
National Portfolio
Arizona Portfolio
California Portfolio
Massachusetts Portfolio
Minnesota Portfolio
New Jersey Portfolio
New York Portfolio
Ohio Portfolio
Pennsylvania Portfolio
Virginia Portfolio
TAXABLE
Bond Inflation Strategy
FlexFee™ International Bond Portfolio
Global Bond Fund
High Income Fund
High Yield Portfolio
Income Fund
Intermediate Bond Portfolio
Limited Duration High Income Portfolio
Short Duration Portfolio
ALTERNATIVES
All Market Real Return Portfolio
Credit Long/Short Portfolio
Global Real Estate Investment Fund
Select US Long/Short Portfolio
Unconstrained Bond Fund
MULTI-ASSET
All Market Income Portfolio
All Market Total Return Portfolio1
Conservative Wealth Strategy
Emerging Markets Multi-Asset Portfolio
Global Risk Allocation Fund
Tax-Managed All Market Income Portfolio1
TARGET-DATE
Multi-Manager Select Retirement Allocation Fund
Multi-Manager Select 2010 Fund
Multi-Manager Select 2015 Fund
Multi-Manager Select 2020 Fund
Multi-Manager Select 2025 Fund
Multi-Manager Select 2030 Fund
Multi-Manager Select 2035 Fund
Multi-Manager Select 2040 Fund
Multi-Manager Select 2045 Fund
Multi-Manager Select 2050 Fund
Multi-Manager Select 2055 Fund
CLOSED-END FUNDS
Alliance California Municipal Income Fund
AllianceBernstein Global High Income Fund
AllianceBernstein National Municipal Income Fund
We also offer Government Money Market Portfolio1, which serves as the money market fund exchange vehicle for the AB mutual funds. An investment in Government Money Market Portfolio is not a deposit in a bank and is not insured or guaranteed by the Federal Deposit Insurance Corporation or any other government agency. Although the Fund seeks to preserve the value of your investment at $1.00 per share, it is possible to lose money by investing in the Fund.
Investors should consider the investment objectives, risks, charges and expenses of the Fund carefully before investing. For copies of our prospectus or summary prospectus, which contain this and other information, visit us online at www.abfunds.com or contact your AB representative. Please read the prospectus and/or summary prospectus carefully before investing.
| 1 | Prior to January 9, 2017, Relative Value Fund was named Growth & Income Fund; prior to April 17, 2017, Tax-Managed All Market Income Portfolio was named Tax-Managed Balanced Wealth Strategy; prior to April 24, 2017, All Market Total Return Portfolio was named Balanced Wealth Strategy; prior to November 10, 2017, Government Money Market Portfolio was named Government Exchange Reserves. |
| 74 | AB MUNICIPAL BOND INFLATION STRATEGY | abfunds.com |
NOTES
| abfunds.com | AB MUNICIPAL BOND INFLATION STRATEGY | 75 |
NOTES
| 76 | AB MUNICIPAL BOND INFLATION STRATEGY | abfunds.com |
AB MUNICIPAL BOND INFLATION STRATEGY
1345 Avenue of the Americas
New York, NY 10105
800 221 5672
MBIS-0151-1017 
OCT 10.31.17

ANNUAL REPORT
AB TAX-AWARE FIXED INCOME PORTFOLIO


| Investment Products Offered | • Are Not FDIC Insured • May Lose Value • Are Not Bank Guaranteed | |
Investors should consider the investment objectives, risks, charges and expenses of the Fund carefully before investing. For copies of our prospectus or summary prospectus, which contain this and other information, visit us online at www.abfunds.com or contact your AB representative. Please read the prospectus and/or summary prospectus carefully before investing.
This shareholder report must be preceded or accompanied by the Fund’s prospectus for individuals who are not current shareholders of the Fund.
You may obtain a description of the Fund’s proxy voting policies and procedures, and information regarding how the Fund voted proxies relating to portfolio securities during the most recent 12-month period ended June 30, without charge. Simply visit AB’s website at www.abfunds.com, or go to the Securities and Exchange Commission’s (the “Commission”) website at www.sec.gov, or call AB at (800) 227 4618.
The Fund files its complete schedule of portfolio holdings with the Commission for the first and third quarters of each fiscal year on Form N-Q. The Fund’s Forms N-Q are available on the Commission’s website at www.sec.gov. The Fund’s Forms N-Q may also be reviewed and copied at the Commission’s Public Reference Room in Washington, DC; information on the operation of the Public Reference Room may be obtained by calling (800) SEC 0330. AB publishes full portfolio holdings for the Fund monthly at www.abfunds.com.
AllianceBernstein Investments, Inc. (ABI) is the distributor of the AB family of mutual funds. ABI is a member of FINRA and is an affiliate of AllianceBernstein L.P., the Adviser of the funds.
The [A/B] logo is a registered service mark of AllianceBernstein and AllianceBernstein® is a registered service mark used by permission of the owner, AllianceBernstein L.P.
| FROM THE PRESIDENT |  |
Dear Shareholder,
We are pleased to provide this report for AB Tax-Aware Fixed Income Portfolio (the “Fund”). Please review the discussion of Fund performance, the market conditions during the reporting period and the Fund’s investment strategy.
As always, AB strives to keep clients ahead of what’s next by:
| + | Transforming uncommon insights into uncommon knowledge with a global research scope |
| + | Navigating markets with seasoned investment experience and sophisticated solutions |
| + | Providing thoughtful investment insights and actionable ideas |
Whether you’re an individual investor or a multi-billion-dollar institution, we put knowledge and experience to work for you.
AB’s global research organization connects and collaborates across platforms and teams to deliver impactful insights and innovative products. Better insights lead to better opportunities—anywhere in the world.
For additional information about AB’s range of products and shareholder resources, please log on to www.abfunds.com.
Thank you for your investment in the AB Mutual Funds.
Sincerely,

Robert M. Keith
President and Chief Executive Officer, AB Mutual Funds
| abfunds.com | AB TAX-AWARE FIXED INCOME PORTFOLIO | 1 |
ANNUAL REPORT
December 27, 2017
This report provides management’s discussion of fund performance for AB Tax-Aware Fixed Income Portfolio for the annual reporting period ended October 31, 2017.
The investment objective of the Fund is to seek to maximize after-tax return and income.
NAV RETURNS AS OF OCTOBER 31, 2017 (unaudited)
| 6 Months | 12 Months | |||||||
| AB TAX-AWARE FIXED INCOME PORTFOLIO | ||||||||
| Class A Shares | 2.18% | 1.09% | ||||||
| Class C Shares | 1.79% | 0.33% | ||||||
| Advisor Class Shares1 | 2.31% | 1.34% | ||||||
| Bloomberg Barclays Municipal Bond Index | 2.55% | 2.19% | ||||||
| 1 | Please note that this share class is for investors purchasing shares through accounts established under certain fee-based programs sponsored and maintained by certain broker-dealers and financial intermediaries, institutional pension plans and/or investment advisory clients of, and certain other persons associated with, the Adviser and its affiliates or the Fund. |
INVESTMENT RESULTS
The table above shows the Fund’s performance compared to its benchmark, the Bloomberg Barclays Municipal Bond Index, for the six- and 12-month periods ended October 31, 2017.
All share classes of the Fund underperformed the benchmark for both periods, before sales changes. A sector overweight in US Treasuries detracted from performance relative to the benchmark, for both periods. An allocation to US Treasuries was added to the Fund as a hedge against any possible adverse outcomes in the tax-reform debate. For the 12-month period, security selection in the industrial development, airline and public higher education sectors detracted, while selections in the local general obligation sector contributed. Yield-curve positioning also detracted.
For the six-month period, security selection within the public higher education and toll road/transit sectors detracted, while selections in the miscellaneous revenue and health care sectors contributed. Yield-curve positioning also contributed and was driven by an overweight to intermediate duration municipals.
The Fund utilized derivatives during both periods, which had no material impact on absolute performance. Interest rate swaps were used for hedging purposes; credit default swaps were used for investment purposes. Inflation
| 2 | AB TAX-AWARE FIXED INCOME PORTFOLIO | abfunds.com |
swaps were utilized for hedging purposes and had no material impact on the 12-month period; they were not used for the six-month period.
MARKET REVIEW AND INVESTMENT STRATEGY
The relatively strong returns in both equities and corporate bonds over both periods were consistent with a positive economic backdrop; major developed and emerging markets—including China—grew at a decent clip while inflation remained moderate. Municipal bond prices were supported by strong technicals, as supply remained low and an historic number of bonds matured or were called by issuers. Municipals delivered positive absolute returns over both periods. Demand for income, along with limited supply, helped mid-grade and high-yield municipals rally strongly.
The US Federal Reserve (the “Fed”) raised its target for the Federal Funds rate by 75 basis points over the past 12 months. On the horizon, major central banks across the globe are likely to normalize monetary policy, which suggests higher interest rates and the eventual end of nearly a decade of quantitative easing. And, in September, the Fed confirmed it would begin the multiyear process of reducing its $4.2 trillion portfolio of Treasury and mortgage-backed bonds.
At the end of the reporting period, municipal investors were focused on the specter of tax reform and how it could potentially impact the after-tax relative attractiveness of municipal bonds. Ultimately, the final legislation included tax reductions for individuals, but the largest reductions in tax rates were those applicable to corporations. The relatively slight lowering of individual tax rates is not expected to significantly reduce the demand from individual investors for municipal bonds. Whether corporations, primarily insurance companies and banks, will reduce their demand for municipal bonds will be a function of the after-tax yield and the potential tax consequences of selling municipal bonds they currently hold, in order to purchase other bonds that offer more attractive after-tax yields. With the after-tax yield advantage for municipal bonds already low by historical standards, the Fund’s Senior Investment Management Team continues to position the Fund with an underweight to the longest maturity bonds; this potentially reduces the Fund’s exposure to a rise in yields, which could result from reduced investor demand for certain municipal bonds.
The Fund may purchase municipal securities that are insured under policies issued by certain insurance companies. Historically, insured municipal securities typically received a higher credit rating, which meant that the issuer of the securities paid a lower interest rate. As a result of declines in the credit quality and associated downgrades of most fund insurers, insurance has less value than it did in the past. The market now values insured municipal securities primarily based on the credit quality of the issuer of the security with little value given to the insurance feature. In purchasing such insured securities, the Adviser evaluates the risk and return of municipal securities through its own research. If an insurance company’s
| abfunds.com | AB TAX-AWARE FIXED INCOME PORTFOLIO | 3 |
rating is downgraded or the company becomes insolvent, the prices of municipal securities insured by the insurance company may decline. As of October 31, 2017, the Fund’s percentages of investments in municipal bonds that are insured and in insured municipal bonds that have been pre-refunded or escrowed to maturity were 2.07% and 0.00%, respectively.
INVESTMENT POLICIES
The Fund pursues its objective by investing principally in a national portfolio of both municipal and taxable fixed-income securities. The Fund invests, under normal circumstances, at least 80% of its net assets in fixed-income securities. The Fund also invests, under normal circumstances, at least 65% of its total assets in municipal securities that pay interest that is exempt from federal income tax. These securities may pay interest that is subject to the federal alternative minimum tax for certain taxpayers. The income earned and distributed to shareholders on non-municipal securities would not be exempt from federal income tax. The Fund may invest in fixed-income securities rated below investment-grade (commonly known as “junk bonds”), although such securities are not expected to be the Fund’s primary focus.
The Adviser selects securities for the Fund based on a variety of factors, including credit quality, maturity, diversification benefits, and the relative expected after-tax returns of taxable and municipal securities (considering federal tax rates and without regard to state and local income taxes). As the objective is to increase the after-tax return of the Fund, an investor in the Fund may incur a tax liability that will generally be greater than the same investor would have in a fund investing exclusively in municipal securities, and that will be higher if the investor is in a higher tax bracket. In addition, the tax implications of the Fund’s trading activity, such as realizing taxable gains, are considered in making purchase and sale decisions for the Fund. The Fund may invest in fixed-income securities of any maturity from short- to long-term.
The Fund may also invest in forward commitments, zero-coupon municipal securities and variable, floating and inverse floating-rate municipal securities.
The Fund may use derivatives, such as swaps, options, futures contracts and forwards, to achieve its investment strategies. For example, the Fund may enter into credit default and interest rate swaps relating to municipal and taxable fixed-income securities or securities indices. Derivatives may provide more efficient and economical exposure to fixed-income securities markets than direct investments.
| 4 | AB TAX-AWARE FIXED INCOME PORTFOLIO | abfunds.com |
DISCLOSURES AND RISKS
Benchmark Disclosure
The Bloomberg Barclays Municipal Bond Index is unmanaged and does not reflect fees and expenses associated with the active management of a mutual fund portfolio. The Bloomberg Barclays Municipal Bond Index represents the performance of the long-term tax-exempt bond market consisting of investment-grade bonds. An investor cannot invest directly in an index, and its results are not indicative of the performance for any specific investment, including the Fund.
A Word About Risk
Market Risk: The value of the Fund’s assets will fluctuate as the bond market fluctuates. The value of its investments may decline, sometimes rapidly and unpredictably, simply because of economic changes or other events that affect large portions of the market.
Credit Risk: An issuer or guarantor of a fixed-income security, or the counterparty to a derivatives or other contract, may be unable or unwilling to make timely payments of interest or principal, or to otherwise honor its obligations. The issuer or guarantor may default, causing a loss of the full principal amount of a security and accrued interest. The degree of risk for a particular security may be reflected in its credit rating. There is the possibility that the credit rating of a fixed-income security may be downgraded after purchase, which may adversely affect the value of the security.
Below Investment Grade Securities Risk: Investments in fixed-income securities with lower ratings (commonly known as “junk bonds”) are subject to a higher probability that an issuer will default or fail to meet its payment obligations. These securities may be subject to greater price volatility due to such factors as specific municipal or corporate developments, negative performance of the junk bond market generally and less secondary market liquidity.
Municipal Market Risk: This is the risk that special factors may adversely affect the value of municipal securities and have a significant effect on the yield or value of the Fund’s investments in municipal securities. These factors include economic conditions, political or legislative changes, uncertainties related to the tax status of municipal securities, or the rights of investors in these securities. To the extent that the Fund invests more of its assets in a particular state’s municipal securities, the Fund may be vulnerable to events adversely affecting that state, including economic, political and regulatory occurrences, court decisions, terrorism and catastrophic natural disasters, such as hurricanes or earthquakes. The Fund’s investments in certain municipal securities with principal and interest payments that are made from the revenues of a specific project or facility, and not general tax revenues, may have increased risks. Factors affecting
| abfunds.com | AB TAX-AWARE FIXED INCOME PORTFOLIO | 5 |
DISCLOSURES AND RISKS (continued)
the project or facility, such as local business or economic conditions, could have a significant effect on the project’s ability to make payments of principal and interest on these securities.
The Fund may invest in the municipal securities of Puerto Rico or other US territories and their governmental agencies and municipalities, which are exempt from federal, state, and, where applicable, local income taxes. These municipal securities may have more risks than those of other US issuers of municipal securities. Puerto Rico experienced a significant downturn during the recession. Puerto Rico’s downturn was particularly severe, and Puerto Rico continues to face a very challenging economic and fiscal environment. Municipal securities issued by Puerto Rico issuers have extremely low ratings by the credit rating organizations. More recently Puerto Rico has defaulted on its debt payments, and if the general economic situation in Puerto Rico persists, the volatility and credit quality of Puerto Rican municipal securities will continue to be adversely affected, and the market for such securities may experience continued volatility. In addition, Puerto Rico’s difficulties have resulted in increased volatility in portions of the broader municipal securities market from time to time, and this may recur in the future.
Tax Risk: There is no guarantee that the income on the Fund’s municipal securities will be exempt from regular federal income and state income taxes. Unfavorable legislation, adverse interpretations by federal or state authorities, litigation or noncompliant conduct by the issuer of a municipal security could affect the tax-exempt status of municipal securities. If the Internal Revenue Service or a state authority determines that an issuer of a municipal security has not complied with applicable requirements, interest from the security could become subject to regular federal income tax and/ or state personal income tax, possibly retroactively to the date the security was issued, the value of the security could decline significantly, and a portion of the distributions to Fund shareholders could be recharacterized as taxable. Recent federal legislation included reductions in tax rates for individuals, with relatively larger reductions in tax rates for corporations. These tax rate reductions may reduce the demand for municipal bonds which could reduce the value of municipal bonds held by the Fund.
Interest Rate Risk: Changes in interest rates will affect the value of investments in fixed-income securities. When interest rates rise, the value of existing investments in fixed-income securities tends to fall and this decrease in value may not be offset by higher income from new investments. The Fund may be subject to heightened interest rate risk due to rising rates as the current period of historically low interest rates may be ending. Interest rate risk is generally greater for fixed-income securities with longer maturities or durations.
| 6 | AB TAX-AWARE FIXED INCOME PORTFOLIO | abfunds.com |
DISCLOSURES AND RISKS (continued)
Duration Risk: Duration is a measure that relates the expected price volatility of a fixed-income security to changes in interest rates. The duration of a fixed-income security may be shorter than or equal to full maturity of a fixed-income security. Fixed-income securities with longer durations have more risk and will decrease in price as interest rates rise. For example, a fixed-income security with a duration of three years will decrease in value by approximately 3% if interest rates increase by 1%.
Inflation Risk: This is the risk that the value of assets or income from investments will be less in the future as inflation decreases the value of money. As inflation increases, the value of the Fund’s assets can decline as can the value of the Fund’s distributions. This risk is significantly greater for fixed-income securities with longer maturities.
Liquidity Risk: Liquidity risk occurs when certain investments become difficult to purchase or sell. Difficulty in selling less liquid securities may result in sales at disadvantageous prices affecting the value of your investment in the Fund. Causes of liquidity risk may include low trading volumes and large positions. Municipal securities may have more liquidity risk than other fixed-income securities because they trade less frequently and the market for municipal securities is generally smaller than many other markets.
Leverage Risk: To the extent the Fund uses leveraging techniques, its NAV may be more volatile because leverage tends to exaggerate the effect of changes in interest rates and any increase or decrease in the value of the Fund’s investments.
Derivatives Risk: Derivatives may be illiquid, difficult to price, and leveraged so that small changes may produce disproportionate losses for the Fund, and may be subject to counterparty risk to a greater degree than more traditional investments.
Management Risk: The Fund is subject to management risk because it is an actively managed investment fund. The Adviser will apply its investment techniques and risk analyses in making investment decisions, but there is no guarantee that its techniques will produce the intended results.
These and other risks are more fully discussed in the Fund’s prospectus. As with all investments, you may lose money by investing in the Fund.
| abfunds.com | AB TAX-AWARE FIXED INCOME PORTFOLIO | 7 |
DISCLOSURES AND RISKS (continued)
An Important Note About Historical Performance
The investment return and principal value of an investment in the Fund will fluctuate, so that shares, when redeemed, may be worth more or less than their original cost. Performance shown in this report represents past performance and does not guarantee future results. Current performance may be lower or higher than the performance information shown. You may obtain performance information current to the most recent month-end by visiting www.abfunds.com.
All fees and expenses related to the operation of the Fund have been deducted. NAV returns do not reflect sales charges; if sales charges were reflected, the Fund’s quoted performance would be lower. SEC returns and the Fund’s returns shown in the line graphs reflect the applicable sales charges for each share class: a 3% maximum front-end sales charge for Class A shares and a 1% 1-year contingent deferred sales charge for Class C shares. Returns for the different share classes will vary due to their different expenses associated with each class. Performance assumes reinvestment of distributions and does not account for taxes.
| 8 | AB TAX-AWARE FIXED INCOME PORTFOLIO | abfunds.com |
HISTORICAL PERFORMANCE
GROWTH OF A $10,000 INVESTMENT IN THE FUND (unaudited)
12/11/20131 TO 10/31/2017
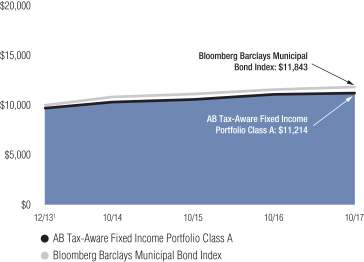
This chart illustrates the total value of an assumed $10,000 investment in AB Tax-Aware Fixed Income Portfolio Class A shares (from 12/11/20131 to 10/31/2017) as compared to the performance of its benchmark. The chart reflects the deduction of the maximum 3.00% sales charge from the initial $10,000 investment in the Fund and assumes the reinvestment of dividends and capital gains distributions.
| 1 | Inception date: 12/11/2013. |
| abfunds.com | AB TAX-AWARE FIXED INCOME PORTFOLIO | 9 |
HISTORICAL PERFORMANCE (continued)
AVERAGE ANNUAL RETURNS AS OF OCTOBER 31, 2017 (unaudited)
| NAV Returns | SEC Returns (reflects applicable sales charges) | |||||||
| CLASS A SHARES | ||||||||
| 1 Year | 1.09% | -1.98% | ||||||
| Since Inception1 | 3.80% | 2.99% | ||||||
| CLASS C SHARES | ||||||||
| 1 Year | 0.33% | -0.66% | ||||||
| Since Inception1 | 3.05% | 3.05% | ||||||
| ADVISOR CLASS SHARES2 | ||||||||
| 1 Year | 1.34% | 1.34% | ||||||
| Since Inception1 | 4.08% | 4.08% | ||||||
SEC AVERAGE ANNUAL RETURNS
AS OF THE MOST RECENT CALENDAR QUARTER-END
SEPTEMBER 30, 2017 (unaudited)
SEC Returns (reflects applicable | ||||
| CLASS A SHARES | ||||
| 1 Year | -3.02% | |||
| Since Inception1 | 3.01% | |||
| CLASS C SHARES | ||||
| 1 Year | -1.75% | |||
| Since Inception1 | 3.09% | |||
| ADVISOR CLASS SHARES2 | ||||
| 1 Year | 0.32% | |||
| Since Inception1 | 4.15% | |||
The Fund’s current prospectus fee table shows the Fund’s total annual operating expense ratios as 1.67%, 2.42% and 1.42% for Class A, Class C and Advisor Class shares, respectively, gross of any fee waivers or expense reimbursements. Contractual fee waivers and/or expense reimbursements limit the Fund’s annual operating expense ratios exclusive of expenses associated with securities sold short, acquired fund fees and expenses other than the advisory fees of any AB mutual funds in which the Fund may invest, interest expense, taxes, extraordinary expenses, brokerage commissions and other transaction costs to 0.75%, 1.50% and 0.50% for Class A, Class C and Advisor Class shares, respectively. These waivers/reimbursements may not be terminated prior to January 31, 2018 and may be extended by the Adviser for additional one-year terms. Absent reimbursements or waivers, performance would have been lower. The Financial Highlights section of this report sets forth expense ratio data for the current reporting period; the expense ratios shown above may differ from the expense ratios in the Financial Highlights section since they are based on different time periods.
| 1 | Inception date: 12/11/2013. |
| 2 | This share class is offered at NAV to eligible investors and the SEC returns are the same as the NAV returns. Please note that this share class is for investors purchasing shares through accounts established under certain fee-based programs sponsored and maintained by certain broker-dealers and financial intermediaries, institutional pension plans and/or investment advisory clients of, and certain other persons associated with, the Adviser and its affiliates or the Fund. |
| 10 | AB TAX-AWARE FIXED INCOME PORTFOLIO | abfunds.com |
EXPENSE EXAMPLE
(unaudited)
As a shareholder of the Fund, you incur two types of costs: (1) transaction costs, including sales charges (loads) on purchase payments, contingent deferred sales charges on redemptions and (2) ongoing costs, including management fees; distribution (12b-1) fees; and other Fund expenses. This example is intended to help you understand your ongoing costs (in dollars) of investing in the Fund and to compare these costs with the ongoing costs of investing in other mutual funds.
The Example is based on an investment of $1,000 invested at the beginning of the period and held for the entire period as indicated below.
Actual Expenses
The table below provides information about actual account values and actual expenses. You may use the information, together with the amount you invested, to estimate the expenses that you paid over the period. Simply divide your account value by $1,000 (for example, an $8,600 account value divided by $1,000 = 8.6), then multiply the result by the number under the heading entitled “Expenses Paid During Period” to estimate the expenses you paid on your account during this period.
Hypothetical Example for Comparison Purposes
The table below also provides information about hypothetical account values and hypothetical expenses based on the Fund’s actual expense ratio and an assumed annual rate of return of 5% before expenses, which is not the Fund’s actual return. The hypothetical account values and expenses may not be used to estimate the actual ending account balance or expenses you paid for the period. You may use this information to compare the ongoing costs of investing in the Fund and other funds by comparing this 5% hypothetical example with the 5% hypothetical examples that appear in the shareholder reports of other funds.
Please note that the expenses shown in the table are meant to highlight your ongoing costs only and do not reflect any transactional costs, such as sales charges (loads), or contingent deferred sales charges on redemptions. Therefore, the hypothetical example is useful in comparing ongoing costs only, and will not help you determine the relative total costs of owning different funds. In addition, if these transactional costs were included, your costs would have been higher.
| abfunds.com | AB TAX-AWARE FIXED INCOME PORTFOLIO | 11 |
EXPENSE EXAMPLE (continued)
| Beginning Account Value May 1, 2017 | Ending Account Value October 31, 2017 | Expenses Paid During Period* | Annualized Expense Ratio* | Total Expenses Paid During Period+ | Total Annualized Expense Ratio+ | |||||||||||||||||||
| Class A | ||||||||||||||||||||||||
Actual | $ | 1,000 | $ | 1,021.80 | $ | 3.77 | 0.74 | % | $ | 3.82 | 0.75 | % | ||||||||||||
Hypothetical** | $ | 1,000 | $ | 1,021.48 | $ | 3.77 | 0.74 | % | $ | 3.82 | 0.75 | % | ||||||||||||
| Class C | ||||||||||||||||||||||||
Actual | $ | 1,000 | $ | 1,017.90 | $ | 7.58 | 1.49 | % | $ | 7.63 | 1.50 | % | ||||||||||||
Hypothetical** | $ | 1,000 | $ | 1,017.69 | $ | 7.58 | 1.49 | % | $ | 7.63 | 1.50 | % | ||||||||||||
| Advisor Class | ||||||||||||||||||||||||
Actual | $ | 1,000 | $ | 1,023.10 | $ | 2.50 | 0.49 | % | $ | 2.55 | 0.50 | % | ||||||||||||
Hypothetical** | $ | 1,000 | $ | 1,022.74 | $ | 2.50 | 0.49 | % | $ | 2.55 | 0.50 | % | ||||||||||||
| * | Expenses are equal to the classes’ annualized expense ratios multiplied by the average account value over the period, multiplied by 184/365 (to reflect the one-half year period). |
| ** | Assumes 5% annual return before expenses. |
| + | In connection with the Portfolio’s investments in affiliated/unaffiliated underlying portfolios, the Portfolio incurs no direct expenses, but bears proportionate shares of the fees and expenses (i.e., operating, administrative and investment advisory fees) of the affiliated/unaffiliated underlying portfolios. The Adviser has contractually agreed to waive its fees from the Portfolio in an amount equal to the Portfolio’s pro rata share of certain acquired fund fees and expenses of the affiliated underlying portfolios. The Portfolio’s total expenses are equal to the classes’ annualized expense ratio plus the Portfolio’s pro rata share of the weighted average expense ratio of the affiliated/unaffiliated underlying portfolios in which it invests, multiplied by the average account value over the period, multiplied by 184/365 (to reflect the one-half year period). |
| 12 | AB TAX-AWARE FIXED INCOME PORTFOLIO | abfunds.com |
PORTFOLIO SUMMARY
October 31, 2017 (unaudited)
PORTFOLIO STATISTICS
Net Assets ($mil): $68.9
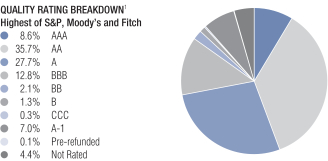
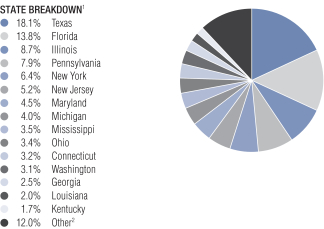
| 1 | All data are as of October 31, 2017. The Fund’s quality rating and state breakdowns are expressed as a percentage of the Fund’s total investments in municipal securities and may vary over time. The quality ratings are determined by using the Standard & Poor’s Global Ratings (“S&P”), Moody’s Investors Services, Inc. (“Moody’s”) and Fitch Ratings, Ltd. (“Fitch”). The Fund considers the credit ratings issued by S&P, Moody’s and Fitch and uses the highest rating issued by the agencies. These ratings are a measure of the quality and safety of a bond or portfolio, based on the issuer’s financial condition. AAA is the highest (best) and D is the lowest (worst). If applicable, the Pre-refunded category includes bonds which are secured by U.S. Government securities and therefore are deemed high-quality investment-grade by the Adviser. If applicable, Not Applicable (N/A) includes non-creditworthy investments, such as equities, currency contracts, futures and options. If applicable, the Not Rated category includes bonds that are not rated by a nationally recognized statistical rating organization. The Adviser evaluates the creditworthiness of non-rated securities based on a number of factors including, but not limited to, cash flows, enterprise value and economic environment. |
| 2 | “Other” represents less than 1.6% in 19 different states and Puerto Rico. |
| abfunds.com | AB TAX-AWARE FIXED INCOME PORTFOLIO | 13 |
PORTFOLIO OF INVESTMENTS
October 31, 2017
| Principal Amount (000) | U.S. $ Value | |||||||
| ||||||||
MUNICIPAL OBLIGATIONS – 83.3% | ||||||||
Long-Term Municipal Bonds – 77.5% | ||||||||
Alabama – 1.3% | ||||||||
County of Jefferson AL Sewer Revenue | $ | 110 | $ | 128,335 | ||||
Water Works Board of the City of Birmingham | 680 | 798,952 | ||||||
|
| |||||||
| 927,287 | ||||||||
|
| |||||||
Arizona – 0.5% | ||||||||
Arizona Health Facilities Authority | 110 | 109,995 | ||||||
Industrial Development Authority of the City of Phoenix (The) | 100 | 105,914 | ||||||
Salt Verde Financial Corp. | 100 | 121,828 | ||||||
|
| |||||||
| 337,737 | ||||||||
|
| |||||||
California – 0.7% | ||||||||
Alameda Corridor Transportation Authority | 175 | 198,530 | ||||||
California Pollution Control Financing Authority | 250 | 269,340 | ||||||
|
| |||||||
| 467,870 | ||||||||
|
| |||||||
Colorado – 0.6% | ||||||||
Colorado Health Facilities Authority | 170 | 183,268 | ||||||
Colorado Health Facilities Authority | 200 | 230,430 | ||||||
|
| |||||||
| 413,698 | ||||||||
|
| |||||||
| 14 | AB TAX-AWARE FIXED INCOME PORTFOLIO | abfunds.com |
PORTFOLIO OF INVESTMENTS (continued)
| Principal Amount (000) | U.S. $ Value | |||||||
| ||||||||
Connecticut – 2.6% | ||||||||
Connecticut State Health & Educational Facility Authority | $ | 100 | $ | 102,069 | ||||
State of Connecticut | ||||||||
Series 2015F | 1,000 | 1,173,030 | ||||||
Series 2016G | 500 | 549,405 | ||||||
|
| |||||||
| 1,824,504 | ||||||||
|
| |||||||
District of Columbia – 0.2% | ||||||||
District of Columbia | 100 | 108,067 | ||||||
|
| |||||||
Florida – 11.5% | ||||||||
Bexley Community Development District | 100 | 99,303 | ||||||
Brevard County School District COP | 290 | 349,012 | ||||||
Citizens Property Insurance Corp. | 560 | 621,189 | ||||||
City of Gainesville FL Utilities System Revenue | 2,250 | 2,773,867 | ||||||
County of Miami-Dade FL | 780 | 906,781 | ||||||
County of Miami-Dade FL Aviation Revenue | 265 | 305,916 | ||||||
County of Orange FL Tourist Development Tax Revenue | 435 | 494,434 | ||||||
Florida Development Finance Corp. | 100 | 96,619 | ||||||
| abfunds.com | AB TAX-AWARE FIXED INCOME PORTFOLIO | 15 |
PORTFOLIO OF INVESTMENTS (continued)
| Principal Amount (000) | U.S. $ Value | |||||||
| ||||||||
Florida Development Finance Corp. | $ | 100 | $ | 81,032 | ||||
Florida’s Turnpike Enterprise | 1,605 | 1,762,627 | ||||||
School District of Broward County/FL | 365 | 442,727 | ||||||
|
| |||||||
| 7,933,507 | ||||||||
|
| |||||||
Georgia – 2.1% | ||||||||
City of Atlanta Department of Aviation | 310 | 348,158 | ||||||
Clarke County Board of Education/GA | 1,000 | 1,070,280 | ||||||
|
| |||||||
| 1,418,438 | ||||||||
|
| |||||||
Illinois – 7.2% | ||||||||
Chicago Board of Education | 240 | 236,950 | ||||||
Chicago O’Hare International Airport | 335 | 375,595 | ||||||
Series 2017B | 725 | 842,921 | ||||||
City of Chicago IL | 100 | 102,824 | ||||||
Illinois Finance Authority | 50 | 28,000 | ||||||
Illinois Finance Authority | 150 | 163,759 | ||||||
Illinois Finance Authority | 85 | 84,090 | ||||||
Series 2016C | 15 | 824 | ||||||
| 16 | AB TAX-AWARE FIXED INCOME PORTFOLIO | abfunds.com |
PORTFOLIO OF INVESTMENTS (continued)
| Principal Amount (000) | U.S. $ Value | |||||||
| ||||||||
Illinois Finance Authority | $ | 100 | $ | 103,583 | ||||
Illinois Finance Authority | 250 | 271,975 | ||||||
Illinois Municipal Electric Agency | 465 | 526,585 | ||||||
Metropolitan Pier & Exposition Authority | 600 | 610,380 | ||||||
State of Illinois | 100 | 103,894 | ||||||
Series 2013 | 270 | 298,828 | ||||||
Series 2014 | 130 | 136,993 | ||||||
Series 2016 | 375 | 405,645 | ||||||
Series 2017D | 625 | 682,462 | ||||||
|
| |||||||
| 4,975,308 | ||||||||
|
| |||||||
Indiana – 0.7% | ||||||||
Indiana Finance Authority | 160 | 168,851 | ||||||
Indiana Finance Authority | 190 | 205,090 | ||||||
Indiana Finance Authority | 100 | 108,015 | ||||||
|
| |||||||
| 481,956 | ||||||||
|
| |||||||
Kentucky – 1.4% | ||||||||
Kentucky Economic Development Finance Authority | 175 | 192,621 | ||||||
| abfunds.com | AB TAX-AWARE FIXED INCOME PORTFOLIO | 17 |
PORTFOLIO OF INVESTMENTS (continued)
| Principal Amount (000) | U.S. $ Value | |||||||
| ||||||||
Kentucky Economic Development Finance Authority | $ | 65 | $ | 68,222 | ||||
Kentucky Economic Development Finance Authority | 425 | 463,484 | ||||||
Louisville/Jefferson County Metropolitan Government | 225 | 259,063 | ||||||
|
| |||||||
| 983,390 | ||||||||
|
| |||||||
Louisiana – 1.6% | ||||||||
City of New Orleans LA Water Revenue | 100 | 113,011 | ||||||
Louisiana Local Government Environmental Facilities & Community Development Auth | 675 | 768,400 | ||||||
Louisiana Public Facilities Authority | 250 | 2,500 | ||||||
New Orleans Aviation Board | 215 | 244,238 | ||||||
|
| |||||||
| 1,128,149 | ||||||||
|
| |||||||
Maine – 0.4% | ||||||||
Finance Authority of Maine | 100 | 107,585 | ||||||
Maine Health & Higher Educational Facilities Authority | 165 | 187,683 | ||||||
|
| |||||||
| 295,268 | ||||||||
|
| |||||||
| 18 | AB TAX-AWARE FIXED INCOME PORTFOLIO | abfunds.com |
PORTFOLIO OF INVESTMENTS (continued)
| Principal Amount (000) | U.S. $ Value | |||||||
| ||||||||
Maryland – 3.8% | ||||||||
City of Baltimore MD | $ | 120 | $ | 138,310 | ||||
City of Baltimore MD | 150 | 161,076 | ||||||
University System of Maryland | 365 | 371,011 | ||||||
Series 2017A | 1,635 | 1,923,103 | ||||||
|
| |||||||
| 2,593,500 | ||||||||
|
| |||||||
Massachusetts – 0.6% | ||||||||
Commonwealth of Massachusetts | 125 | 114,970 | ||||||
NATL Series 2000G | 300 | 276,687 | ||||||
|
| |||||||
| 391,657 | ||||||||
|
| |||||||
Michigan – 3.3% | ||||||||
City of Detroit MI Sewage Disposal System Revenue | 115 | 130,232 | ||||||
Great Lakes Water Authority Sewage Disposal System Revenue | 1,000 | 1,145,810 | ||||||
Michigan Finance Authority | 735 | 754,897 | ||||||
Michigan Finance Authority | 235 | 265,378 | ||||||
|
| |||||||
| 2,296,317 | ||||||||
|
| |||||||
Minnesota – 0.3% | ||||||||
City of Minneapolis MN | 200 | 230,888 | ||||||
|
| |||||||
| abfunds.com | AB TAX-AWARE FIXED INCOME PORTFOLIO | 19 |
PORTFOLIO OF INVESTMENTS (continued)
| Principal Amount (000) | U.S. $ Value | |||||||
| ||||||||
Missouri – 0.1% | ||||||||
Kansas City Industrial Development Authority | $ | 100 | $ | 97,960 | ||||
|
| |||||||
Nebraska – 0.2% | ||||||||
Central Plains Energy Project | 100 | 108,787 | ||||||
|
| |||||||
New Hampshire – 0.2% | ||||||||
New Hampshire Health and Education Facilities Authority Act | 115 | 123,795 | ||||||
|
| |||||||
New Jersey – 4.4% | ||||||||
New Jersey Economic Development Authority | 30 | 32,547 | ||||||
New Jersey Economic Development Authority | 260 | 277,116 | ||||||
Series 2014P | 200 | 217,582 | ||||||
New Jersey Economic Development Authority | 85 | 93,064 | ||||||
New Jersey Health Care Facilities Financing Authority | 280 | 320,597 | ||||||
New Jersey Transportation Trust Fund Authority | 550 | 617,870 | ||||||
New Jersey Transportation Trust Fund Authority | 240 | 257,897 | ||||||
| 20 | AB TAX-AWARE FIXED INCOME PORTFOLIO | abfunds.com |
PORTFOLIO OF INVESTMENTS (continued)
| Principal Amount (000) | U.S. $ Value | |||||||
| ||||||||
New Jersey Turnpike Authority | $ | 315 | $ | 356,271 | ||||
Series 2017B | 540 | 648,669 | ||||||
Tobacco Settlement Financing Corp./NJ | 200 | 191,720 | ||||||
|
| |||||||
| 3,013,333 | ||||||||
|
| |||||||
New York – 5.3% | ||||||||
City of New York NY | 340 | 384,258 | ||||||
Metropolitan Transportation Authority | 315 | 364,826 | ||||||
New York State Dormitory Authority | 200 | 218,646 | ||||||
New York State Dormitory Authority | 425 | 500,773 | ||||||
Series 2017B | 1,040 | 1,280,677 | ||||||
New York State Energy Research & Development Authority | 200 | 187,208 | ||||||
New York State Thruway Authority | 365 | 421,389 | ||||||
New York Transportation Development Corp. | 175 | 192,659 | ||||||
Ulster County Industrial Development Agency | 110 | 110,096 | ||||||
|
| |||||||
| 3,660,532 | ||||||||
|
| |||||||
| abfunds.com | AB TAX-AWARE FIXED INCOME PORTFOLIO | 21 |
PORTFOLIO OF INVESTMENTS (continued)
| Principal Amount (000) | U.S. $ Value | |||||||
| ||||||||
North Carolina – 0.8% | ||||||||
North Carolina Turnpike Authority | $ | 500 | $ | 576,550 | ||||
|
| |||||||
Ohio – 2.9% | ||||||||
Buckeye Tobacco Settlement Financing Authority | 285 | 266,820 | ||||||
City of Akron OH | 445 | 510,713 | ||||||
City of Chillicothe OH | 175 | 199,073 | ||||||
City of Columbus OH | 110 | 123,276 | ||||||
County of Cuyahoga OH | 365 | 417,188 | ||||||
County of Cuyahoga OH | 205 | 219,118 | ||||||
Dayton-Montgomery County Port Authority | 100 | 101,849 | ||||||
Ohio Air Quality Development Authority | 145 | 143,350 | ||||||
|
| |||||||
| 1,981,387 | ||||||||
|
| |||||||
Pennsylvania – 6.6% | ||||||||
City of Philadelphia PA | 1,000 | 1,182,740 | ||||||
Delaware River Joint Toll Bridge Commission | 1,500 | 1,770,690 | ||||||
Montour School District | 450 | 520,866 | ||||||
| 22 | AB TAX-AWARE FIXED INCOME PORTFOLIO | abfunds.com |
PORTFOLIO OF INVESTMENTS (continued)
| Principal Amount (000) | U.S. $ Value | |||||||
| ||||||||
Moon Industrial Development Authority | $ | 100 | $ | 107,953 | ||||
Pennsylvania Economic Development Financing Authority | 100 | 111,992 | ||||||
Pennsylvania Turnpike Commission | 200 | 228,434 | ||||||
Philadelphia Authority for Industrial Development | 150 | 159,689 | ||||||
Philadelphia Gas Works Co. | 415 | 480,188 | ||||||
|
| |||||||
| 4,562,552 | ||||||||
|
| |||||||
Puerto Rico – 0.1% | ||||||||
Puerto Rico Industrial Tourist Educational Medical & Envirml Ctl Facs Fing Auth | 100 | 80,500 | ||||||
|
| |||||||
South Carolina – 0.8% | ||||||||
South Carolina Public Service Authority | 265 | 299,900 | ||||||
Spartanburg County School District No 1/SC | 250 | 286,663 | ||||||
|
| |||||||
| 586,563 | ||||||||
|
| |||||||
Tennessee – 0.4% | ||||||||
Metropolitan Government Nashville & Davidson County Health & Educational Facs Bd | 215 | 244,421 | ||||||
|
| |||||||
Texas – 12.2% | ||||||||
Austin Convention Enterprises, Inc. | 500 | 568,420 | ||||||
| abfunds.com | AB TAX-AWARE FIXED INCOME PORTFOLIO | 23 |
PORTFOLIO OF INVESTMENTS (continued)
| Principal Amount (000) | U.S. $ Value | |||||||
| ||||||||
Central Texas Regional Mobility Authority | $ | 100 | $ | 108,948 | ||||
City of Houston TX | 260 | 296,543 | ||||||
Series 2015 | 160 | 182,488 | ||||||
City of San Antonio TX Electric & Gas Systems Revenue | 1,155 | 1,252,540 | ||||||
Dallas Area Rapid Transit | 580 | 699,010 | ||||||
Dallas County Flood Control District No 1 | 100 | 105,169 | ||||||
Love Field Airport Modernization Corp. | 500 | 575,235 | ||||||
New Hope Cultural Education Facilities Finance Corp. | 100 | 104,010 | ||||||
North Texas Tollway Authority | 250 | 286,165 | ||||||
Tarrant County Cultural Education Facilities Finance Corp. | 100 | 106,414 | ||||||
Tarrant County Cultural Education Facilities Finance Corp. | 100 | 107,170 | ||||||
Texas Transportation Commission State Highway Fund | 1,300 | 1,415,869 | ||||||
| 24 | AB TAX-AWARE FIXED INCOME PORTFOLIO | abfunds.com |
PORTFOLIO OF INVESTMENTS (continued)
| Principal Amount (000) | U.S. $ Value | |||||||
| ||||||||
Travis County Cultural Education Facilities Finance Corp. | $ | 160 | $ | 166,078 | ||||
Travis County Health Facilities Development Corp. | 55 | 59,648 | ||||||
Trinity River Authority Central Regional Wastewater System Revenue | 795 | 889,428 | ||||||
Trinity River Authority LLC | 335 | 374,054 | ||||||
University of Houston | 1,000 | 1,116,570 | ||||||
|
| |||||||
| 8,413,759 | ||||||||
|
| |||||||
Vermont – 0.3% |
| |||||||
Vermont Economic Development Authority | 200 | 208,288 | ||||||
|
| |||||||
Virginia – 0.2% |
| |||||||
Tobacco Settlement Financing Corp./VA | 165 | 158,593 | ||||||
|
| |||||||
Washington – 2.6% |
| |||||||
Port of Seattle WA | 510 | 576,305 | ||||||
State of Washington | 830 | 961,787 | ||||||
Washington State Housing Finance Commission | 100 | 109,769 | ||||||
Washington State Housing Finance Commission | 100 | 116,723 | ||||||
|
| |||||||
| 1,764,584 | ||||||||
|
| |||||||
| abfunds.com | AB TAX-AWARE FIXED INCOME PORTFOLIO | 25 |
PORTFOLIO OF INVESTMENTS (continued)
| Principal Amount (000) | U.S. $ Value | |||||||
| ||||||||
West Virginia – 0.4% |
| |||||||
West Virginia Economic Development Authority | $ | 155 | $ | 151,482 | ||||
West Virginia Hospital Finance Authority | 100 | 91,222 | ||||||
|
| |||||||
| 242,704 | ||||||||
|
| |||||||
Wisconsin – 1.2% |
| |||||||
Wisconsin Public Finance Authority | 100 | 115,337 | ||||||
Wisconsin Public Finance Authority | 100 | 102,506 | ||||||
Wisconsin Public Finance Authority | 130 | 139,681 | ||||||
Wisconsin Public Finance Authority | 165 | 162,804 | ||||||
Wisconsin Public Finance Authority | 276 | 275,956 | ||||||
|
| |||||||
| 796,284 | ||||||||
|
| |||||||
Total Long-Term Municipal Bonds | 53,428,133 | |||||||
|
| |||||||
Short-Term Municipal Notes – 5.8% |
| |||||||
Mississippi – 2.9% |
| |||||||
County of Jackson MS | 2,000 | 2,000,000 | ||||||
|
| |||||||
Texas – 2.9% |
| |||||||
Gulf Coast Industrial Development Authority | 2,000 | 2,000,000 | ||||||
|
| |||||||
| 26 | AB TAX-AWARE FIXED INCOME PORTFOLIO | abfunds.com |
PORTFOLIO OF INVESTMENTS (continued)
| Principal Amount (000) | U.S. $ Value | |||||||
| ||||||||
Total Short-Term Municipal Bonds | $ | 4,000,000 | ||||||
|
| |||||||
Total Municipal Obligations | 57,428,133 | |||||||
|
| |||||||
GOVERNMENTS – TREASURIES – 14.0% | ||||||||
United States – 14.0% | ||||||||
U.S. Treasury Notes | $ | 1,150 | 1,149,281 | |||||
2.25%, 12/31/23 | 8,434 | 8,481,442 | ||||||
|
| |||||||
Total Governments – Treasuries | 9,630,723 | |||||||
|
| |||||||
CORPORATES – INVESTMENT GRADE – 3.7% | ||||||||
Industrial – 2.1% | ||||||||
Basic – 0.2% | ||||||||
Glencore Funding LLC | 100 | 100,043 | ||||||
Capital Goods – 0.4% | ||||||||
John Deere Capital Corp. | 300 | 299,715 | ||||||
Communications - Telecommunications – 0.2% | ||||||||
AT&T, Inc. | 150 | 151,518 | ||||||
Consumer Cyclical - Automotive – 0.5% | ||||||||
General Motors Financial Co., Inc. | 150 | 151,864 | ||||||
Ford Motor Credit Co. LLC | 200 | 200,618 | ||||||
|
| |||||||
| 352,482 | ||||||||
|
| |||||||
Consumer Cyclical - Entertainment – 0.2% | ||||||||
Mattel, Inc. | 150 | 147,459 | ||||||
Consumer Non-Cyclical – 0.4% | ||||||||
Allergan Funding SCS | 150 | 152,349 | ||||||
Amgen, Inc. | 150 | 150,293 | ||||||
|
| |||||||
| 302,642 | ||||||||
|
| |||||||
| abfunds.com | AB TAX-AWARE FIXED INCOME PORTFOLIO | 27 |
PORTFOLIO OF INVESTMENTS (continued)
| Principal Amount (000) | U.S. $ Value | |||||||
| ||||||||
Technology – 0.2% | ||||||||
Hewlett Packard Enterprise Co. | $ | 105 | $ | 104,893 | ||||
|
| |||||||
| 1,458,752 | ||||||||
|
| |||||||
Financial Institutions – 1.6% | ||||||||
Banking – 1.2% | ||||||||
Bank of America Corp. | 305 | 304,692 | ||||||
Capital One Financial Corp. | 165 | 165,119 | ||||||
Morgan Stanley | 300 | 304,413 | ||||||
|
| |||||||
| 774,224 | ||||||||
|
| |||||||
Finance – 0.2% | ||||||||
AIG Global Funding | 150 | 149,874 | ||||||
|
| |||||||
Insurance – 0.2% | ||||||||
Metropolitan Life Global Funding I | 150 | 149,712 | ||||||
|
| |||||||
| 1,073,810 | ||||||||
|
| |||||||
Total Corporates – Investment Grade | 2,532,562 | |||||||
|
| |||||||
ASSET-BACKED SECURITIES – 0.9% |
| |||||||
Autos - Fixed Rate – 0.7% | ||||||||
Ally Auto Receivables Trust | 100 | 99,704 | ||||||
CarMax Auto Owner Trust | 110 | 109,897 | ||||||
GM Financial Automobile Leasing Trust | 100 | 99,947 | ||||||
Hertz Vehicle Financing II LP | 100 | 99,886 | ||||||
Mercedes-Benz Auto Lease Trust | 100 | 99,944 | ||||||
|
| |||||||
Total Autos – Fixed Rate | 509,378 | |||||||
|
| |||||||
| 28 | AB TAX-AWARE FIXED INCOME PORTFOLIO | abfunds.com |
PORTFOLIO OF INVESTMENTS (continued)
| Principal Amount (000) | U.S. $ Value | |||||||
| ||||||||
Credit Cards - Fixed Rate – 0.2% |
| |||||||
Synchrony Credit Card Master Note Trust | $ | 100 | $ | 100,273 | ||||
|
| |||||||
Total Asset-Backed Securities | 609,651 | |||||||
|
| |||||||
COMMERCIAL MORTGAGE-BACKED SECURITIES – 0.4% | ||||||||
Non-Agency Fixed Rate CMBS – 0.2% | ||||||||
Citigroup Commercial Mortgage Trust | 100 | 100,961 | ||||||
|
| |||||||
Non-Agency Floating Rate CMBS – 0.2% |
| |||||||
BX Trust SLCT | 150 | 150,331 | ||||||
|
| |||||||
Total Commercial Mortgage-Backed Securities | 251,292 | |||||||
|
| |||||||
CORPORATES – NON-INVESTMENT GRADE – 0.2% | ||||||||
Industrial – 0.2% | ||||||||
Communications - Media – 0.2% | ||||||||
CCO Holdings LLC/CCO Holdings Capital Corp. 4.00%, 3/01/23(b) | 130 | 131,877 | ||||||
|
| |||||||
COLLATERALIZED MORTGAGE OBLIGATIONS – 0.0% | ||||||||
Risk Share Floating Rate – 0.0% | ||||||||
Federal National Mortgage Association | 2 | 2,382 | ||||||
|
| |||||||
| Shares | ||||||||
SHORT-TERM INVESTMENTS – 1.2% | ||||||||
Investment Companies – 1.2% | ||||||||
AB Fixed Income Shares, Inc. – Government Money Market Portfolio – Class AB, 0.85%(k)(l)(m) | 836,624 | 836,624 | ||||||
|
| |||||||
Total Investments – 103.7% | 71,423,244 | |||||||
Other assets less liabilities – (3.7)% | (2,520,262 | ) | ||||||
|
| |||||||
Net Assets – 100.0% | $ | 68,902,982 | ||||||
|
| |||||||
| abfunds.com | AB TAX-AWARE FIXED INCOME PORTFOLIO | 29 |
PORTFOLIO OF INVESTMENTS (continued)
CENTRALLY CLEARED INTEREST RATE SWAPS (see Note D)
| Rate Type | ||||||||||||||||||||
| Notional Amount (000) | Termination Date | Payments made by the Fund | Payments received by the Fund | Payment Frequency Paid/Received | Unrealized Appreciation/ (Depreciation) | |||||||||||||||
USD 9,110 | 9/30/52 | 2.454% | 3 Month LIBOR | Semi-Annual/Quarterly | $ | 441,304 | ||||||||||||||
USD 8,200 | 9/28/57 | 3 Month LIBOR | 2.644% | Quarterly/Semi-Annual | (10,381 | ) | ||||||||||||||
|
| |||||||||||||||||||
| $ | 430,923 | |||||||||||||||||||
|
| |||||||||||||||||||
CREDIT DEFAULT SWAPS (see Note D)
| Swap Counterparty & Referenced Obligation | Fixed Rate (Pay) Receive | Payment Frequency | Implied Credit Spread at October 31, 2017 | Notional Amount (000) | Market Value | Upfront Premiums Paid (Received) | Unrealized Appreciation/ (Depreciation) | |||||||||||||||||||||
Sale Contracts | ||||||||||||||||||||||||||||
Deutsche Bank AG | ||||||||||||||||||||||||||||
CDX-CMBX.NA.A Series 6, 5/11/63* | 2.00 | % | Monthly | 3.31 | % | USD | 350 | $ | (20,759 | ) | $ | (19,720 | ) | $ | (1,039 | ) | ||||||||||||
|
|
|
|
|
| |||||||||||||||||||||||
| * | Termination date |
| (a) | Security in which significant unobservable inputs (Level 3) were used in determining fair value. |
| (b) | Security is exempt from registration under Rule 144A of the Securities Act of 1933. These securities are considered restricted, but liquid and may be resold in transactions exempt from registration, normally to qualified institutional buyers. At October 31, 2017, the aggregate market value of these securities amounted to $2,885,306 or 4.2% of net assets. |
| (c) | When-Issued or delayed delivery security. |
| (d) | Restricted and illiquid security. |
Restricted & Illiquid Securities | Acquisition Date | Cost | Market Value | Percentage of Net Assets | ||||||||||||
Illinois Finance Authority | 12/18/13 | $ | 48,112 | $ | 28,000 | 0.04 | % | |||||||||
Louisiana Public Facilities Authority | 7/31/14 | 173,773 | 2,500 | 0.00 | % | |||||||||||
Puerto Rico Industrial Tourist Educational Medical & Envirml Ctl Facs Fing Auth | 10/08/14 | 95,744 | 80,500 | 0.12 | % | |||||||||||
| 30 | AB TAX-AWARE FIXED INCOME PORTFOLIO | abfunds.com |
PORTFOLIO OF INVESTMENTS (continued)
| (e) | Non-income producing security. |
| (f) | Defaulted. |
| (g) | Illiquid security. |
| (h) | An auction rate security whose interest rate resets at each auction date. Auctions are typically held every week or month. The rate shown is as of October 31, 2017 and the aggregate market value of these securities amounted to $670,087 or 0.97% of net assets. |
| (i) | Variable Rate Demand Notes are instruments whose interest rates change on a specific date (such as coupon date or interest payment date) or whose interest rates vary with changes in a designated base rate (such as the prime interest rate). This instrument is payable on demand and is secured by letters of credit or other credit support agreements from major banks. |
| (j) | Floating Rate Security. Stated interest/floor rate was in effect at October 31, 2017. |
| (k) | Affiliated investments. |
| (l) | The rate shown represents the 7-day yield as of period end. |
| (m) | To obtain a copy of the fund’s shareholder report, please go to the Securities and Exchange Commission’s website at www.sec.gov, or call AB at (800) 227-4618. |
As of October 31, 2017, the Fund’s percentages of investments in municipal bonds that are insured and in insured municipal bonds that have been pre-refunded or escrowed to maturity are 2.1% and 0.0%, respectively.
Glossary:
AGM – Assured Guaranty Municipal
CMBS – Commercial Mortgage-Backed Securities
COP – Certificate of Participation
ETM – Escrowed to Maturity
LIBOR – London Interbank Offered Rates
NATL – National Interstate Corporation
XLCA – XL Capital Assurance Inc.
See notes to financial statements.
| abfunds.com | AB TAX-AWARE FIXED INCOME PORTFOLIO | 31 |
STATEMENT OF ASSETS & LIABILITIES
October 31, 2017
| Assets | ||||
Investments in securities, at value | ||||
Unaffiliated issuers (cost $69,137,295) | $ | 70,586,620 | ||
Affiliated issuers (cost $836,624) | 836,624 | |||
Cash collateral due from broker | 77,555 | |||
Interest receivable | 722,533 | |||
Receivable for capital stock sold | 446,554 | |||
Receivable for newly entered credit default swaps | 19,703 | |||
Receivable due from Adviser | 14,214 | |||
Affiliated dividends receivable | 1,692 | |||
Receivable for terminated interest rate swaps | 1,159 | |||
|
| |||
Total assets | 72,706,654 | |||
|
| |||
| Liabilities | ||||
Due to custodian | 19,703 | |||
Payable for investment securities purchased | 3,471,266 | |||
Payable for capital stock redeemed | 110,002 | |||
Dividends payable | 19,722 | |||
Upfront premiums received on credit default swaps | 19,720 | |||
Transfer Agent fee payable | 3,055 | |||
Distribution fee payable | 2,541 | |||
Directors’ fees payable | 2,486 | |||
Payable for variation margin on exchange traded swaps | 1,327 | |||
Unrealized depreciation on credit default swaps | 1,039 | |||
Accrued expenses | 152,811 | |||
|
| |||
Total liabilities | 3,803,672 | |||
|
| |||
Net Assets | $ | 68,902,982 | ||
|
| |||
| Composition of Net Assets | ||||
Capital stock, at par | $ | 6,399 | ||
Additional paid-in capital | 67,105,653 | |||
Undistributed net investment income | 11,722 | |||
Accumulated net realized loss on investment transactions | (100,001 | ) | ||
Net unrealized appreciation on investments | 1,879,209 | |||
|
| |||
| $ | 68,902,982 | |||
|
|
Net Asset Value Per Share—21 billion shares of capital stock authorized, $.001 par value
| Class | Net Assets | Shares Outstanding | Net Asset Value | |||||||||
| ||||||||||||
| A | $ | 8,064,597 | 749,012 | $ | 10.77 | * | ||||||
| ||||||||||||
| C | $ | 1,056,139 | 98,076 | $ | 10.77 | |||||||
| ||||||||||||
| Advisor | $ | 59,782,246 | 5,551,461 | $ | 10.77 | |||||||
| ||||||||||||
| * | The maximum offering price per share for Class A shares was $11.10 which reflects a sales charge of 3.00%. |
See notes to financial statements.
| 32 | AB TAX-AWARE FIXED INCOME PORTFOLIO | abfunds.com |
STATEMENT OF OPERATIONS
Year Ended October 31, 2017
| Investment Income | ||||||||
Interest | $ | 1,546,593 | ||||||
Dividends—Affiliated issuers | 15,636 | |||||||
Other income | 12 | $ | 1,562,241 | |||||
|
| |||||||
| Expenses | ||||||||
Advisory fee (see Note B) | 258,988 | |||||||
Distribution fee—Class A | 20,899 | |||||||
Distribution fee—Class C | 14,148 | |||||||
Transfer agency—Class A | 4,577 | |||||||
Transfer agency—Class C | 825 | |||||||
Transfer agency—Advisor Class | 25,393 | |||||||
Custodian | 86,599 | |||||||
Administrative | 64,579 | |||||||
Audit and tax | 59,826 | |||||||
Registration fees | 56,494 | |||||||
Legal | 36,483 | |||||||
Directors’ fees | 28,138 | |||||||
Printing | 24,274 | |||||||
Miscellaneous | 6,513 | |||||||
|
| |||||||
Total expenses | 687,736 | |||||||
Less: expenses waived and reimbursed by the Adviser (see Note B) | (371,112 | ) | ||||||
|
| |||||||
Net expenses | 316,624 | |||||||
|
| |||||||
Net investment income | 1,245,617 | |||||||
|
| |||||||
| Realized and Unrealized Gain (Loss) on Investment Transactions | ||||||||
Net realized gain (loss) on: | ||||||||
Investment transactions | (18,301 | ) | ||||||
Swaps | 99,035 | |||||||
Net change in unrealized appreciation/depreciation of: | ||||||||
Investments | (5,004 | ) | ||||||
Swaps | 10,098 | |||||||
|
| |||||||
Net gain on investment transactions | 85,828 | |||||||
|
| |||||||
Net Increase in Net Assets from Operations | $ | 1,331,445 | ||||||
|
|
See notes to financial statements.
| abfunds.com | AB TAX-AWARE FIXED INCOME PORTFOLIO | 33 |
STATEMENT OF CHANGES IN NET ASSETS
| Year Ended October 31, 2017 | Year Ended October 31, 2016 | |||||||
| Increase (Decrease) in Net Assets from Operations | ||||||||
Net investment income | $ | 1,245,617 | $ | 845,201 | ||||
Net realized gain (loss) on investment transactions | 80,734 | (148,501 | ) | |||||
Net change in unrealized appreciation/depreciation of investments | 5,094 | 1,057,313 | ||||||
|
|
|
| |||||
Net increase in net assets from operations | 1,331,445 | 1,754,013 | ||||||
| Dividends to Shareholders from | ||||||||
Net investment income | ||||||||
Class A | (167,984 | ) | (127,309 | ) | ||||
Class C | (17,586 | ) | (23,951 | ) | ||||
Advisor Class | (1,058,874 | ) | (688,508 | ) | ||||
| Capital Stock Transactions | ||||||||
Net increase | 26,741,682 | 8,526,502 | ||||||
|
|
|
| |||||
Total increase | 26,828,683 | 9,440,747 | ||||||
| Net Assets | ||||||||
Beginning of period | 42,074,299 | 32,633,552 | ||||||
|
|
|
| |||||
End of period (including undistributed net investment income of $11,722 and $14,960, respectively) | $ | 68,902,982 | $ | 42,074,299 | ||||
|
|
|
| |||||
See notes to financial statements.
| 34 | AB TAX-AWARE FIXED INCOME PORTFOLIO | abfunds.com |
NOTES TO FINANCIAL STATEMENTS
October 31, 2017
NOTE A
Significant Accounting Policies
AB Bond Fund, Inc. (the “Company”) is registered under the Investment Company Act of 1940 as an open-end management investment company. The Company, which is a Maryland corporation, operates as a series company comprised of eleven portfolios currently in operation. Each portfolio is considered to be a separate entity for financial reporting and tax purposes. This report relates only to the AB Tax-Aware Fixed Income Portfolio (the “Portfolio”), a diversified portfolio. The Portfolio has authorized the issuance of Class A, Class B, Class C, Advisor Class, Class T, Class 1 and Class 2 shares. Class B, Class T, Class 1 and Class 2 shares have not been issued. Class A shares are sold with a front-end sales charge of up to 3.0% for purchases not exceeding $500,000. With respect to purchases of $500,000 or more, Class A shares redeemed within one year of purchase may be subject to a contingent deferred sales charge of 1%. Class C shares are subject to a contingent deferred sales charge of 1% on redemptions made within the first year after purchase and, 0% after the first year of purchase. Effective April 10, 2017, Class C shares will automatically convert to Class A shares ten years after the end of the calendar month of purchase. Advisor Class shares are sold without any initial or contingent deferred sales charge and are not subject to ongoing distribution expenses. All seven classes of shares have identical voting, dividend, liquidation and other rights, except that the classes bear different distribution and transfer agency expenses. Each class has exclusive voting rights with respect to its distribution plan. The financial statements have been prepared in conformity with U.S. generally accepted accounting principles (“U.S. GAAP”) which require management to make certain estimates and assumptions that affect the reported amounts of assets and liabilities in the financial statements and amounts of income and expenses during the reporting period. Actual results could differ from those estimates. The Portfolio is an investment company under U.S. GAAP and follows the accounting and reporting guidance applicable to investment companies. The following is a summary of significant accounting policies followed by the Portfolio.
1. Security Valuation
Portfolio securities are valued at their current market value determined on the basis of market quotations or, if market quotations are not readily available or are deemed unreliable, at “fair value” as determined in accordance with procedures established by and under the general supervision of the Company’s Board of Directors (the “Board”).
In general, the market values of securities which are readily available and deemed reliable are determined as follows: securities listed on a national securities exchange (other than securities listed on the NASDAQ Stock Market, Inc. (“NASDAQ”)) or on a foreign securities exchange are valued at
| abfunds.com | AB TAX-AWARE FIXED INCOME PORTFOLIO | 35 |
NOTES TO FINANCIAL STATEMENTS (continued)
the last sale price at the close of the exchange or foreign securities exchange. If there has been no sale on such day, the securities are valued at the last traded price from the previous day. Securities listed on more than one exchange are valued by reference to the principal exchange on which the securities are traded; securities listed only on NASDAQ are valued in accordance with the NASDAQ Official Closing Price; listed or over the counter (“OTC”) market put or call options are valued at the mid level between the current bid and ask prices. If either a current bid or current ask price is unavailable, AllianceBernstein L.P. (the “Adviser”) will have discretion to determine the best valuation (e.g., last trade price in the case of listed options); open futures are valued using the closing settlement price or, in the absence of such a price, the most recent quoted bid price. If there are no quotations available for the day of valuation, the last available closing settlement price is used; U.S. Government securities and any other debt instruments having 60 days or less remaining until maturity are generally valued at market by an independent pricing vendor, if a market price is available. If a market price is not available, the securities are valued at amortized cost. This methodology is commonly used for short term securities that have an original maturity of 60 days or less, as well as short term securities that had an original term to maturity that exceeded 60 days. In instances when amortized cost is utilized, the Valuation Committee (the “Committee”) must reasonably conclude that the utilization of amortized cost is approximately the same as the fair value of the security. Such factors the Committee will consider include, but are not limited to, an impairment of the creditworthiness of the issuer or material changes in interest rates. Fixed-income securities, including mortgage-backed and asset-backed securities, may be valued on the basis of prices provided by a pricing service or at a price obtained from one or more of the major broker-dealers. In cases where broker-dealer quotes are obtained, the Adviser may establish procedures whereby changes in market yields or spreads are used to adjust, on a daily basis, a recently obtained quoted price on a security. Swaps and other derivatives are valued daily, primarily using independent pricing services, independent pricing models using market inputs, as well as third party broker-dealers or counterparties. Open end mutual funds are valued at the closing net asset value per share, while exchange traded funds are valued at the closing market price per share.
Securities for which market quotations are not readily available (including restricted securities) or are deemed unreliable are valued at fair value as deemed appropriate by the Adviser. Factors considered in making this determination may include, but are not limited to, information obtained by contacting the issuer, analysts, analysis of the issuer’s financial statements or other available documents. In addition, the Portfolio may use fair value pricing for securities primarily traded in non-U.S. markets because most foreign markets close well before the Portfolio values its securities at 4:00 p.m., Eastern Time. The earlier close of these foreign markets gives rise to the possibility that significant events, including broad market moves, may have occurred in the interim and may materially affect the value of those securities.
| 36 | AB TAX-AWARE FIXED INCOME PORTFOLIO | abfunds.com |
NOTES TO FINANCIAL STATEMENTS (continued)
To account for this, the Portfolio generally values many of its foreign equity securities using fair value prices based on third party vendor modeling tools to the extent available.
2. Fair Value Measurements
In accordance with U.S. GAAP regarding fair value measurements, fair value is defined as the price that the Portfolio would receive to sell an asset or pay to transfer a liability in an orderly transaction between market participants at the measurement date. U.S. GAAP establishes a framework for measuring fair value, and a three-level hierarchy for fair value measurements based upon the transparency of inputs to the valuation of an asset or liability (including those valued based on their market values as described in Note A.1 above). Inputs may be observable or unobservable and refer broadly to the assumptions that market participants would use in pricing the asset or liability. Observable inputs reflect the assumptions market participants would use in pricing the asset or liability based on market data obtained from sources independent of the Portfolio. Unobservable inputs reflect the Portfolio’s own assumptions about the assumptions that market participants would use in pricing the asset or liability based on the best information available in the circumstances. Each investment is assigned a level based upon the observability of the inputs which are significant to the overall valuation. The three-tier hierarchy of inputs is summarized below.
| • | Level 1—quoted prices in active markets for identical investments |
| • | Level 2—other significant observable inputs (including quoted prices for similar investments, interest rates, prepayment speeds, credit risk, etc.) |
| • | Level 3—significant unobservable inputs (including the Portfolio’s own assumptions in determining the fair value of investments) |
The fair value of debt instruments, such as bonds, and over-the-counter derivatives is generally based on market price quotations, recently executed market transactions (where observable) or industry recognized modeling techniques and are generally classified as Level 2. Pricing vendor inputs to Level 2 valuations may include quoted prices for similar investments in active markets, interest rate curves, coupon rates, currency rates, yield curves, option adjusted spreads, default rates, credit spreads and other unique security features in order to estimate the relevant cash flows which are then discounted to calculate fair values. If these inputs are unobservable and significant to the fair value, these investments will be classified as Level 3. In addition, non-agency rated investments are classified as Level 3.
Valuations of mortgage-backed or other asset-backed securities, by pricing vendors, are based on both proprietary and industry recognized models and discounted cash flow techniques. Significant inputs to the valuation of these instruments are value of the collateral, the rates and timing of delinquencies, the rates and timing of prepayments, and default and loss expectations, which are driven in part by housing prices for residential mortgages. Significant
| abfunds.com | AB TAX-AWARE FIXED INCOME PORTFOLIO | 37 |
NOTES TO FINANCIAL STATEMENTS (continued)
inputs are determined based on relative value analyses, which incorporate comparisons to instruments with similar collateral and risk profiles, including relevant indices. Mortgage and asset-backed securities for which management has collected current observable data through pricing services are generally categorized within Level 2. Those investments for which current observable data has not been provided are classified as Level 3.
Other fixed income investments, including non-U.S. government and corporate debt, are generally valued using quoted market prices, if available, which are typically impacted by current interest rates, maturity dates and any perceived credit risk of the issuer. Additionally, in the absence of quoted market prices, these inputs are used by pricing vendors to derive a valuation based upon industry or proprietary models which incorporate issuer specific data with relevant yield/spread comparisons with more widely quoted bonds with similar key characteristics. Those investments for which there are observable inputs are classified as Level 2. Where the inputs are not observable, the investments are classified as Level 3.
The following table summarizes the valuation of the Portfolio’s investments by the above fair value hierarchy levels as of October 31, 2017:
Investments in | Level 1 | Level 2 | Level 3 | Total | ||||||||||||
Assets: | ||||||||||||||||
Long-Term Municipal Bonds | $ | – 0 | – | $ | 50,881,949 | $ | 2,546,184 | $ | 53,428,133 | |||||||
Short-Term Municipal Notes | – 0 | – | 4,000,000 | – 0 | – | 4,000,000 | ||||||||||
Governments – Treasuries | – 0 | – | 9,630,723 | – 0 | – | 9,630,723 | ||||||||||
Corporates – Investment Grade | – 0 | – | 2,532,562 | – 0 | – | 2,532,562 | ||||||||||
Asset-Backed Securities | – 0 | – | 609,651 | – 0 | – | 609,651 | ||||||||||
Commercial Mortgage-Backed Securities | – 0 | – | 251,292 | – 0 | – | 251,292 | ||||||||||
Corporates – Non-Investment Grade | – 0 | – | 131,877 | – 0 | – | 131,877 | ||||||||||
Collateralized Mortgage Obligations | – 0 | – | 2,382 | – 0 | – | 2,382 | ||||||||||
Short-Term Investments | 836,624 | – 0 | – | – 0 | – | 836,624 | ||||||||||
|
|
|
|
|
|
|
| |||||||||
Total Investments in Securities | 836,624 | 68,040,436 | 2,546,184 | 71,423,244 | ||||||||||||
Other Financial Instruments(a): | ||||||||||||||||
Assets: | ||||||||||||||||
Centrally Cleared Interest Rate Swaps | – 0 | – | 441,304 | – 0 | – | 441,304 | (b) | |||||||||
Liabilities: | ||||||||||||||||
Centrally Cleared Interest Rate Swaps | – 0 | – | (10,381 | ) | – 0 | – | (10,381 | )(b) | ||||||||
Credit Default Swaps | – 0 | – | (20,759 | ) | – 0 | – | (20,759 | ) | ||||||||
|
|
|
|
|
|
|
| |||||||||
Total(c) | $ | 836,624 | $ | 68,450,600 | $ | 2,546,184 | $ | 71,833,408 | ||||||||
|
|
|
|
|
|
|
| |||||||||
| (a) | Other financial instruments are derivative instruments, such as futures, forwards and swaps, which are valued at the unrealized appreciation/depreciation on the instrument. Other financial instruments may also include swaps with upfront premiums, options written and swaptions which are valued at market value. |
| (b) | Only variation margin receivable/payable at period end is reported within the statement of assets and liabilities. This amount reflects cumulative unrealized appreciation/depreciation on exchange-traded futures and swaps as reported in the portfolio of investments. Exchange-traded swaps with upfront premiums are presented here as market value. |
| (c) | There were no transfers between any levels during the reporting period. |
| 38 | AB TAX-AWARE FIXED INCOME PORTFOLIO | abfunds.com |
NOTES TO FINANCIAL STATEMENTS (continued)
The Portfolio recognizes all transfers between levels of the fair value hierarchy assuming the financial instruments were transferred at the beginning of the reporting period.
The following is a reconciliation of investments in which significant unobservable inputs (Level 3) were used in determining fair value.
| Long-Term Municipal Bonds | Total | |||||||
Balance as of 10/31/16 | $ | 2,401,063 | $ | 2,401,063 | ||||
Accrued discounts/(premiums) | (3,476 | ) | (3,476 | ) | ||||
Realized gain (loss) | 22,811 | 22,811 | ||||||
Change in unrealized appreciation/depreciation | (118,531 | ) | (118,531 | ) | ||||
Purchases | 679,887 | 679,887 | ||||||
Sales | (435,570 | ) | (435,570 | ) | ||||
Transfers in to Level 3 | – 0 | – | – 0 | – | ||||
Transfers out of Level 3 | – 0 | – | – 0 | – | ||||
|
|
|
| |||||
Balance as of 10/31/17 | $ | 2,546,184 | $ | 2,546,184 | ||||
|
|
|
| |||||
Net change in unrealized appreciation/depreciation from investments held as of 10/31/17(a) | $ | (87,277 | ) | $ | (87,277 | ) | ||
|
|
|
| |||||
As of October 31, 2017, all Level 3 securities were priced by third party vendors.
The Adviser established the Committee to oversee the pricing and valuation of all securities held in the Portfolio. The Committee operates under pricing and valuation policies and procedures established by the Adviser and approved by the Board, including pricing policies which set forth the mechanisms and processes to be employed on a daily basis to implement these policies and procedures. In particular, the pricing policies describe how to determine market quotations for securities and other instruments. The Committee’s responsibilities include: 1) fair value and liquidity determinations (and oversight of any third parties to whom any responsibility for fair value and liquidity determinations is delegated), and 2) regular monitoring of the Adviser’s pricing and valuation policies and procedures and modification or enhancement of these policies and procedures (or recommendation of the modification of these policies and procedures) as the Committee believes appropriate.
The Committee is also responsible for monitoring the implementation of the pricing policies by the Adviser’s Pricing Group (the “Pricing Group”) and any third party which performs certain pricing functions in accordance with the pricing policies. The Pricing Group is responsible for the oversight of the third party on a day-to-day basis. The Committee and the Pricing Group perform a series of activities to provide reasonable assurance of the accuracy of prices including: 1) periodic vendor due diligence meetings,
| abfunds.com | AB TAX-AWARE FIXED INCOME PORTFOLIO | 39 |
NOTES TO FINANCIAL STATEMENTS (continued)
review of methodologies, new developments and processes at vendors, 2) daily comparison of security valuation versus prior day for all securities that exceeded established thresholds, and 3) daily review of unpriced, stale, and variance reports with exceptions reviewed by senior management and the Committee.
In addition, several processes outside of the pricing process are used to monitor valuation issues including: 1) performance and performance attribution reports are monitored for anomalous impacts based upon benchmark performance, and 2) portfolio managers review all portfolios for performance and analytics (which are generated using the Adviser’s prices).
3. Currency Translation
Assets and liabilities denominated in foreign currencies and commitments under forward currency exchange contracts are translated into U.S. dollars at the mean of the quoted bid and ask prices of such currencies against the U.S. dollar. Purchases and sales of portfolio securities are translated into U.S. dollars at the rates of exchange prevailing when such securities were acquired or sold. Income and expenses are translated into U.S. dollars at rates of exchange prevailing when accrued.
Net realized gain or loss on foreign currency transactions represents foreign exchange gains and losses from sales and maturities of foreign fixed income investments, holding of foreign currencies, currency gains or losses realized between the trade and settlement dates on foreign investment transactions, and the difference between the amounts of dividends, interest and foreign withholding taxes recorded on the Portfolio’s books and the U.S. dollar equivalent amounts actually received or paid. Net unrealized currency gains and losses from valuing foreign currency denominated assets and liabilities at period end exchange rates are reflected as a component of net unrealized appreciation or depreciation of foreign currency denominated assets and liabilities.
4. Taxes
It is the Portfolio’s policy to meet the requirements of the Internal Revenue Code applicable to regulated investment companies and to distribute all of its investment company taxable income and net realized gains, if any, to shareholders. Therefore, no provisions for federal income or excise taxes are required. The Portfolio may be subject to taxes imposed by countries in which it invests. Such taxes are generally based on income and/or capital gains earned or repatriated. Taxes are accrued and applied to net investment income, net realized gains and net unrealized appreciation/depreciation as such income and/or gains are earned.
| 40 | AB TAX-AWARE FIXED INCOME PORTFOLIO | abfunds.com |
NOTES TO FINANCIAL STATEMENTS (continued)
In accordance with U.S. GAAP requirements regarding accounting for uncertainties in income taxes, management has analyzed the Portfolio’s tax positions taken or expected to be taken on federal and state income tax returns for all open tax years (the current and the prior three tax years) and has concluded that no provision for income tax is required in the Portfolio’s financial statements.
5. Investment Income and Investment Transactions
Dividend income is recorded on the ex-dividend date or as soon as the Portfolio is informed of the dividend. Interest income is accrued daily. Investment transactions are accounted for on the date the securities are purchased or sold. Investment gains or losses are determined on the identified cost basis. The Portfolio amortizes premiums and accretes discounts as adjustments to interest income.
6. Class Allocations
All income earned and expenses incurred by the Portfolio are borne on a pro-rata basis by each outstanding class of shares, based on the proportionate interest in the Portfolio represented by the net assets of such class, except for class specific expenses which are allocated to the respective class. Expenses of the Company are charged proportionately to each portfolio or based on other appropriate methods. Realized and unrealized gains and losses are allocated among the various share classes based on respective net assets.
7. Dividends and Distributions
Dividends and distributions to shareholders, if any, are recorded on the ex-dividend date. Income dividends and capital gains distributions are determined in accordance with federal tax regulations and may differ from those determined in accordance with U.S. GAAP. To the extent these differences are permanent, such amounts are reclassified within the capital accounts based on their federal tax basis treatment; temporary differences do not require such reclassification.
NOTE B
Advisory Fee and Other Transactions with Affiliates
Under the terms of the investment advisory agreement, the Portfolio pays the Adviser a management fee at an annual rate of .45% of the first $2.5 billion of the Portfolio’s average daily net assets, .40% of the excess over $2.5 billion up to $5 billion and .35% in excess of $5 billion of the Portfolio’s average daily net assets. Prior to January 1, 2017, the Portfolio paid the Adviser a management fee at an annual rate of 0.50% of the Portfolio’s average daily net assets. The Adviser has agreed to waive its fees and bear certain expenses to the extent necessary to limit total operating expenses on an annual basis (the “Expense Caps”) to .75%, 1.50% and
| abfunds.com | AB TAX-AWARE FIXED INCOME PORTFOLIO | 41 |
NOTES TO FINANCIAL STATEMENTS (continued)
.50%, of average daily net assets for Class A, Class C and Advisor Class shares, respectively. Effective January 1, 2017, the Expense Cap was reduced from .80% to .75%, 1.55% to 1.50% and .55% to .50% of the daily average net assets for the Class A, Class C and the Advisor Class shares, respectively. For the year ended October 31, 2017, such reimbursements/waivers amounted to $300,737. The Expense Caps may not be terminated before January 31, 2018.
Pursuant to the investment advisory agreement, the Portfolio may reimburse the Adviser for certain legal and accounting services provided to the Portfolio by the Adviser. For the year ended October 31, 2017, the Adviser voluntarily agreed to waive such fees in the amount of $64,579.
The Portfolio compensates AllianceBernstein Investor Services, Inc. (“ABIS”), a wholly-owned subsidiary of the Adviser, under a Transfer Agency Agreement for providing personnel and facilities to perform transfer agency services for the Portfolio. ABIS may make payments to intermediaries that provide omnibus account services, sub-accounting services and/or networking services. Such compensation retained by ABIS amounted to $18,142 for the year ended October 31, 2017.
AllianceBernstein Investments, Inc. (the “Distributor”), a wholly-owned subsidiary of the Adviser, serves as the distributor of the Portfolio’s shares. The Distributor has advised the Portfolio that it has retained front-end sales charges of $0 from the sale of Class A shares and received $492 in contingent deferred sales charges imposed upon redemptions by shareholders of Class C shares, for the year ended October 31, 2017.
The Portfolio may invest in AB Government Money Market Portfolio (the “Government Money Market Portfolio”) which has a contractual annual advisory fee rate of .20% of the portfolio’s average daily net assets and bears its own expenses. In connection with the investment by the Portfolio in the Government Money Market Portfolio, the Adviser has contractually agreed to waive its advisory fee from the Portfolio in an amount equal to the Portfolio’s pro rata share of the effective advisory fees of Government Money Market Portfolio, as borne indirectly by the Portfolio as an acquired fund fee and expense. For the year ended October 31, 2017, such waiver amounted to $5,796.
| 42 | AB TAX-AWARE FIXED INCOME PORTFOLIO | abfunds.com |
NOTES TO FINANCIAL STATEMENTS (continued)
A summary of the Portfolio’s transactions in AB mutual funds for the year ended October 31, 2017 is as follows:
Fund | Market Value 10/31/16 (000) | Purchases at Cost (000) | Sales Proceeds (000) | Market Value 10/31/17 (000) | Dividend Income (000) | |||||||||||||||
| Government Money Market Portfolio | $ | 1,026 | $ | 42,230 | $ | 42,419 | $ | 837 | $ | 16 | ||||||||||
NOTE C
Distribution Services Agreement
The Portfolio has adopted a Distribution Services Agreement (the “Agreement”) pursuant to Rule 12b-1 under the Investment Company Act of 1940. Under the Agreement, the Portfolio pays distribution and servicing fees to the Distributor at an annual rate of up to 0.30% of the Portfolio’s average daily net assets attributable to Class A shares and 1% of the Portfolio’s average daily net assets attributable to Class C shares. Effective January 30, 2015, payments under the Agreement in respect of Class A shares are limited to an annual rate of 0.25% of Class A Shares’ average daily net assets. The fees are accrued daily and paid monthly. The Agreement provides that the Distributor will use such payments in their entirety for distribution assistance and promotional activities. Since the commencement of the Portfolio’s operations, the Distributor has incurred expenses in excess of the distribution costs reimbursed by the Portfolio in the amount of $9,639 for Class C shares. While such costs may be recovered from the Portfolio in future periods so long as the Agreement is in effect, the rate of the distribution and servicing fees payable under the Agreement may not be increased without a shareholder vote. In accordance with the Agreement, there is no provision for recovery of unreimbursed distribution costs incurred by the Distributor beyond the current fiscal year for Class A shares. The Agreement also provides that the Adviser may use its own resources to finance the distribution of the Portfolio’s shares.
NOTE D
Investment Transactions
Purchases and sales of investment securities (excluding short-term investments) for the year ended October 31, 2017 were as follows:
| Purchases | Sales | |||||||
Investment securities (excluding | $ | 33,012,065 | $ | 14,795,412 | ||||
U.S. government securities | 11,606,653 | 3,565,314 | ||||||
| abfunds.com | AB TAX-AWARE FIXED INCOME PORTFOLIO | 43 |
NOTES TO FINANCIAL STATEMENTS (continued)
The cost of investments for federal income tax purposes, gross unrealized appreciation and unrealized depreciation are as follows:
Cost | $ | 69,973,919 | ||
|
| |||
Gross unrealized appreciation | $ | 2,157,519 | ||
Gross unrealized depreciation | (277,271 | ) | ||
|
| |||
Net unrealized appreciation | $ | 1,880,248 | ||
|
|
1. Derivative Financial Instruments
The Portfolio may use derivatives in an effort to earn income and enhance returns, to replace more traditional direct investments, to obtain exposure to otherwise inaccessible markets (collectively, “investment purposes”), or to hedge or adjust the risk profile of its portfolio.
The principal types of derivatives utilized by the Portfolio, as well as the methods in which they may be used are:
| • | Swaps |
The Portfolio may enter into swaps to hedge its exposure to interest rates or credit risk. A swap is an agreement that obligates two parties to exchange a series of cash flows at specified intervals based upon or calculated by reference to changes in specified prices or rates for a specified amount of an underlying asset. The payment flows are usually netted against each other, with the difference being paid by one party to the other. In addition, collateral may be pledged or received by the Portfolio in accordance with the terms of the respective swaps to provide value and recourse to the Portfolio or its counterparties in the event of default, bankruptcy or insolvency by one of the parties to the swap.
Risks may arise as a result of the failure of the counterparty to the swap to comply with the terms of the swap. The loss incurred by the failure of a counterparty is generally limited to the net interim payment to be received by the Portfolio, and/or the termination value at the end of the contract. Therefore, the Portfolio considers the creditworthiness of each counterparty to a swap in evaluating potential counterparty risk. This risk is mitigated by having a netting arrangement between the Portfolio and the counterparty and by the posting of collateral by the counterparty to the Portfolio to cover the Portfolio’s exposure to the counterparty. Additionally, risks may arise from unanticipated movements in interest rates or in the value of the underlying securities. The Portfolio accrues for the interim payments on swaps on a daily basis, with the net amount recorded within unrealized appreciation/depreciation of swaps on the statement of assets and liabilities, where applicable. Once the interim payments are settled in cash, the net amount is recorded as realized gain/(loss) on swaps on the statement
| 44 | AB TAX-AWARE FIXED INCOME PORTFOLIO | abfunds.com |
NOTES TO FINANCIAL STATEMENTS (continued)
of operations, in addition to any realized gain/(loss) recorded upon the termination of swaps. Upfront premiums paid or received are recognized as cost or proceeds on the statement of assets and liabilities and are amortized on a straight line basis over the life of the contract. Amortized upfront premiums are included in net realized gain/(loss) from swaps on the statement of operations. Fluctuations in the value of swaps are recorded as a component of net change in unrealized appreciation/depreciation of swaps on the statement of operations.
Certain standardized swaps, including certain interest rate swaps and credit default swaps, are (or soon will be) subject to mandatory central clearing. Cleared swaps are transacted through futures commission merchants (“FCMs”) that are members of central clearinghouses, with the clearinghouse serving as central counterparty, similar to transactions in futures contracts. Centralized clearing will be required for additional categories of swaps on a phased-in basis based on requirements published by the Securities and Exchange Commission and Commodity Futures Trading Commission.
At the time the Portfolio enters into a centrally cleared swap, the Portfolio deposits and maintains as collateral an initial margin with the broker, as required by the clearinghouse on which the transaction is effected. Such amount is shown as cash collateral due from broker on the statement of assets and liabilities. Pursuant to the contract, the Portfolio agrees to receive from or pay to the broker an amount of cash equal to the daily fluctuation in the value of the contract. Such receipts or payments are known as variation margin and are recorded by the Portfolio as unrealized gains or losses. Risks may arise from the potential inability of a counterparty to meet the terms of the contract. The credit/counterparty risk for centrally cleared swaps is generally less than non-centrally cleared swaps, since the clearinghouse, which is the issuer or counterparty to each centrally cleared swap, has robust risk mitigation standards, including the requirement to provide initial and variation margin. When the contract is closed, the Portfolio records a realized gain or loss equal to the difference between the value of the contract at the time it was opened and the time it was closed.
Interest Rate Swaps:
The Portfolio is subject to interest rate risk exposure in the normal course of pursuing its investment objectives. Because the Portfolio holds fixed rate bonds, the value of these bonds may decrease if interest rates rise. To help hedge against this risk and to maintain its ability to generate income at prevailing market rates, the Portfolio may enter into interest rate swaps. Interest rate swaps are agreements
| abfunds.com | AB TAX-AWARE FIXED INCOME PORTFOLIO | 45 |
NOTES TO FINANCIAL STATEMENTS (continued)
between two parties to exchange cash flows based on a notional amount. The Portfolio may elect to pay a fixed rate and receive a floating rate, or, receive a fixed rate and pay a floating rate on a notional amount.
In addition, the Portfolio may also enter into interest rate swap transactions to preserve a return or spread on a particular investment or portion of its portfolio, or protecting against an increase in the price of securities the Portfolio anticipates purchasing at a later date. Interest rate swaps involve the exchange by a Portfolio with another party of their respective commitments to pay or receive interest (e.g., an exchange of floating rate payments for fixed rate payments) computed based on a contractually-based principal (or “notional”) amount. Interest rate swaps are entered into on a net basis (i.e., the two payment streams are netted out, with the Portfolio receiving or paying, as the case may be, only the net amount of the two payments).
During the year ended October 31, 2017, the Portfolio held interest rate swaps for hedging purposes.
Inflation (CPI) Swaps:
Inflation swap agreements are contracts in which one party agrees to pay the cumulative percentage increase in a price index (the Consumer Price Index with respect to CPI swaps) over the term of the swap (with some lag on the inflation index), and the other pays a compounded fixed rate. Inflation swaps may be used to protect the net asset value (“NAV”) of a Portfolio against an unexpected change in the rate of inflation measured by an inflation index since the value of these agreements is expected to increase if there are unexpected inflation increases.
During the year ended October 31, 2017, the Portfolio held inflation (CPI) swaps for hedging purposes.
Credit Default Swaps:
The Portfolio may enter into credit default swaps, including to manage its exposure to the market or certain sectors of the market, to reduce its risk exposure to defaults by corporate and sovereign issuers held by the Portfolio, or to create exposure to corporate or sovereign issuers to which it is not otherwise exposed. The Portfolio may purchase credit protection (“Buy Contract”) or provide credit protection (“Sale Contract”) on the referenced obligation of the credit default swap. During the term of the swap, the Portfolio receives/(pays) fixed payments from/(to) the respective counterparty, calculated at the agreed upon rate applied to the notional amount. If the Portfolio is a buyer/(seller) of protection and a credit event occurs, as defined
| 46 | AB TAX-AWARE FIXED INCOME PORTFOLIO | abfunds.com |
NOTES TO FINANCIAL STATEMENTS (continued)
under the terms of the swap, the Portfolio will either (i) receive from the seller/(pay to the buyer) of protection an amount equal to the notional amount of the swap (the “Maximum Payout Amount”) and deliver/(take delivery of) the referenced obligation or (ii) receive/(pay) a net settlement amount in the form of cash or securities equal to the notional amount of the swap less the recovery value of the referenced obligation.
In certain circumstances Maximum Payout Amounts may be partially offset by recovery values of the respective referenced obligations, upfront premium received upon entering into the agreement, or net amounts received from settlement of buy protection credit default swaps entered into by the Portfolio for the same referenced obligations with the same counterparty. As of October 31, 2017, the Portfolio did not have Buy Contracts outstanding with respect to the same referenced obligations and same counterparty for its Sale Contracts outstanding.
Credit default swaps may involve greater risks than if a Portfolio had invested in the referenced obligation directly. Credit default swaps are subject to general market risk, liquidity risk, counterparty risk and credit risk. If the Portfolio is a buyer of protection and no credit event occurs, it will lose the payments it made to its counterparty. If the Portfolio is a seller of protection and a credit event occurs, the value of the referenced obligation received by the Portfolio coupled with the periodic payments previously received, may be less than the Maximum Payout Amount it pays to the buyer, resulting in a net loss to the Portfolio.
Implied credit spreads over U.S. Treasuries of comparable maturity utilized in determining the market value of credit default swaps on issuers as of period end are disclosed in the portfolio of investments. The implied spreads serve as an indicator of the current status of the payment/performance risk and typically reflect the likelihood of default by the issuer of the referenced obligation. The implied credit spread of a particular reference obligation also reflects the cost of buying/selling protection and may reflect upfront payments required to be made to enter into the agreement. Widening credit spreads typically represent a deterioration of the referenced obligation’s credit soundness and greater likelihood of default or other credit event occurring as defined under the terms of the agreement. A credit spread identified as “Defaulted” indicates a credit event has occurred for the referenced obligation.
During the year ended October 31, 2017, the Portfolio held credit default swaps for non-hedging purposes.
| abfunds.com | AB TAX-AWARE FIXED INCOME PORTFOLIO | 47 |
NOTES TO FINANCIAL STATEMENTS (continued)
The Portfolio typically enters into International Swaps and Derivatives Association, Inc. Master Agreements (“ISDA Master Agreement”) with its OTC derivative contract counterparties in order to, among other things, reduce its credit risk to OTC counterparties. ISDA Master Agreements include provisions for general obligations, representations, collateral and events of default or termination. Under an ISDA Master Agreement, the Portfolio typically may offset with the OTC counterparty certain derivative financial instruments’ payables and/or receivables with collateral held and/or posted and create one single net payment (close-out netting) in the event of default or termination. In the event of a default by an OTC counterparty, the return of collateral with market value in excess of the Portfolio’s net liability, held by the defaulting party, may be delayed or denied.
The Portfolio’s ISDA Master Agreements may contain provisions for early termination of OTC derivative transactions in the event the net assets of the Portfolio decline below specific levels (“net asset contingent features”). If these levels are triggered, the Portfolio’s OTC counterparty has the right to terminate such transaction and require the Portfolio to pay or receive a settlement amount in connection with the terminated transaction. For additional details, please refer to netting arrangements by the OTC counterparty tables below.
During the year ended October 31, 2017, the Portfolio had entered into the following derivatives:
Asset Derivatives | Liability Derivatives | |||||||||||
Derivative Type | Statement of | Fair Value | Statement of | Fair Value | ||||||||
Interest rate contracts | Receivable/Payable for variation margin on exchange traded swaps | $ | 441,304 | * | Receivable/Payable for variation margin on exchange traded swaps | $ | 10,381 | * | ||||
Credit contracts | Unrealized depreciation on credit default swaps | 1,039 | ||||||||||
|
|
|
| |||||||||
Total | $ | 441,304 | $ | 11,420 | ||||||||
|
|
|
| |||||||||
| * | Only variation margin receivable/payable at period end is reported within the statement of assets and liabilities. This amount reflects cumulative appreciation/(depreciation) of exchange-traded derivatives as reported in the portfolio of investments. |
| 48 | AB TAX-AWARE FIXED INCOME PORTFOLIO | abfunds.com |
NOTES TO FINANCIAL STATEMENTS (continued)
Derivative Type | Location of Gain or (Loss) on Derivatives Within Statement of Operations | Realized Gain or (Loss) on Derivatives | Change in Unrealized Appreciation or (Depreciation) | |||||||
Interest rate contracts | Net realized gain (loss) on swaps; Net change in unrealized appreciation/depreciation of swaps | $ | 99,052 | $ | 11,137 | |||||
Credit contracts | Net realized gain (loss) on swaps; Net change in unrealized appreciation/depreciation of swaps | (17 | ) | (1,039 | ) | |||||
|
|
|
| |||||||
Total | $ | 99,035 | $ | 10,098 | ||||||
|
|
|
| |||||||
The following table represents the average monthly volume of the Portfolio’s derivative transactions during the year ended October 31, 2017:
Interest Rate Swaps: | ||||
Average notional amount | $ | 1,211,667 | (a) | |
Inflation Swaps: | ||||
Average notional amount | $ | 1,400,000 | (b) | |
Centrally Cleared Interest Rate Swaps: | ||||
Average notional amount | $ | 19,183,333 | (a) | |
Credit Default Swaps: | ||||
Average notional amount of sale contracts | $ | 350,000 | (c) |
| (a) | Positions were open for five months during the year. |
| (b) | Positions were open for less than one month during the year. |
| (c) | Positions were open for one month during the year. |
For financial reporting purposes, the Portfolio does not offset derivative assets and derivative liabilities that are subject to netting arrangements in the statement of assets and liabilities.
All OTC derivatives held at period end were subject to netting arrangements. The following table presents the Portfolio’s derivative assets and liabilities by OTC counterparty net of amounts available for offset under ISDA Master Agreements and net of the related collateral received/pledged by the Portfolio as of October 31, 2017. Exchange-traded derivatives are not subject to netting arrangements and as such are excluded from the table.
| abfunds.com | AB TAX-AWARE FIXED INCOME PORTFOLIO | 49 |
NOTES TO FINANCIAL STATEMENTS (continued)
Counterparty | Derivative Liabilities Subject to a MA | Derivative Available for Offset | Cash Collateral Pledged* | Security Collateral Pledged* | Net Amount of Derivatives Liabilities | |||||||||||||||
OTC Derivatives: | ||||||||||||||||||||
Deutsche Bank AG | $ | 20,759 | $ | – 0 | – | $ | – 0 | – | $ | – 0 | – | $ | 20,759 | |||||||
|
|
|
|
|
|
|
|
|
| |||||||||||
Total | $ | 20,759 | $ | – 0 | – | $ | – 0 | – | $ | – 0 | – | $ | 20,759 | ^ | ||||||
|
|
|
|
|
|
|
|
|
| |||||||||||
| * | The actual collateral received/pledged may be more than the amount reported due to over-collateralization. |
| ^ | Net amount represents the net receivable/payable that would be due from/to the counterparty in the event of default or termination. The net amount from OTC financial derivative instruments can only be netted across transactions governed under the same master agreement with the same counterparty. |
NOTE E
Capital Stock
Each class consists of 3,000,000,000 authorized shares. Transactions in capital shares for each class were as follows:
| Shares | Amount | |||||||||||||||||||||||
| Year Ended October 31, 2017 | Year Ended October 31, 2016 | Year Ended 2017 | Year Ended 2016 | |||||||||||||||||||||
|
| |||||||||||||||||||||||
| Class A | ||||||||||||||||||||||||
Shares sold | 573,430 | 419,502 | $ | 6,009,085 | $ | 4,523,103 | ||||||||||||||||||
| ||||||||||||||||||||||||
Shares issued in reinvestment of dividends | 4,866 | 5,728 | 51,860 | 62,365 | ||||||||||||||||||||
| ||||||||||||||||||||||||
Shares redeemed | (416,871 | ) | (289,428 | ) | (4,428,970 | ) | (3,149,530 | ) | ||||||||||||||||
| ||||||||||||||||||||||||
Net increase | 161,425 | 135,802 | $ | 1,631,975 | $ | 1,435,938 | ||||||||||||||||||
| ||||||||||||||||||||||||
Class C | ||||||||||||||||||||||||
Shares sold | 4,987 | 131,822 | $ | 53,215 | $ | 1,433,498 | ||||||||||||||||||
| ||||||||||||||||||||||||
Shares issued in reinvestment of dividends | 1,249 | 1,590 | 13,263 | 17,323 | ||||||||||||||||||||
| ||||||||||||||||||||||||
Shares redeemed | (94,163 | ) | (90,740 | ) | (998,573 | ) | (983,319 | ) | ||||||||||||||||
| ||||||||||||||||||||||||
Net increase (decrease) | (87,927 | ) | 42,672 | $ | (932,095 | ) | $ | 467,502 | ||||||||||||||||
| ||||||||||||||||||||||||
Advisor Class | ||||||||||||||||||||||||
Shares sold | 4,007,921 | 1,397,419 | $ | 42,642,565 | $ | 15,152,409 | ||||||||||||||||||
| ||||||||||||||||||||||||
Shares issued in reinvestment of dividends | 42,423 | 26,897 | 452,915 | 292,728 | ||||||||||||||||||||
| ||||||||||||||||||||||||
Shares redeemed | (1,596,583 | ) | (813,451 | ) | (17,053,678 | ) | (8,822,075 | ) | ||||||||||||||||
| ||||||||||||||||||||||||
Net increase | 2,453,761 | 610,865 | $ | 26,041,802 | $ | 6,623,062 | ||||||||||||||||||
| ||||||||||||||||||||||||
| 50 | AB TAX-AWARE FIXED INCOME PORTFOLIO | abfunds.com |
NOTES TO FINANCIAL STATEMENTS (continued)
At October 31, 2017, the Adviser owned 14% of the Portfolio’s outstanding shares. Significant transactions by such shareholders, if any, may impact the Portfolio’s performance.
NOTE F
Risks Involved in Investing in the Portfolio
Credit Risk—An issuer or guarantor of a fixed-income security, or the counterparty to a derivatives or other contract, may be unable or unwilling to make timely payments of interest or principal, or to otherwise honor its obligations. The issuer or guarantor may default, causing a loss of the full principal amount of a security and accrued interest. The degree of risk for a particular security may be reflected in its credit rating. There is the possibility that the credit rating of a fixed-income security may be downgraded after purchase, which may adversely affect the value of the security.
Below Investment Grade Securities Risk—Investments in fixed-income securities with lower ratings (commonly known as “junk bonds”) are subject to a higher probability that an issuer will default or fail to meet its payment obligations. These securities may be subject to greater price volatility due to such factors as specific municipal or corporate developments, negative perceptions of the junk bond market generally and less secondary market liquidity.
Municipal Market Risk—This is the risk that special factors may adversely affect the value of municipal securities and have a significant effect on the yield or value of the Portfolio’s investments in municipal securities. These factors include economic conditions, political or legislative changes, uncertainties related to the tax status of municipal securities, or the rights of investors in these securities. To the extent that the Portfolio invests more of its assets in a particular state’s municipal securities, the Portfolio may be vulnerable to events adversely affecting that state, including economic, political and regulatory occurrences, court decisions, terrorism and catastrophic natural disasters, such as hurricanes or earthquakes. The Portfolio’s investments in certain municipal securities with principal and interest payments that are made from the revenues of a specific project or facility, and not general tax revenues, may have increased risks. Factors affecting the project or facility, such as local business or economic conditions, could have a significant effect on the project’s ability to make payments of principal and interest on these securities.
The Portfolio may invest in the municipal securities of Puerto Rico and other U.S. territories and their governmental agencies and municipalities, which are exempt from federal, state, and, where applicable, local income taxes. These municipal securities may have more risks than those of other U.S. issuers of municipal securities. Puerto Rico experienced a significant
| abfunds.com | AB TAX-AWARE FIXED INCOME PORTFOLIO | 51 |
NOTES TO FINANCIAL STATEMENTS (continued)
downturn during the recession. Puerto Rico’s downturn was particularly severe, and Puerto Rico continues to face a very challenging economic and fiscal environment. Municipal securities issued by Puerto Rico issuers have extremely low ratings by the credit rating organizations. More recently Puerto Rico has defaulted on its debt payments, and if the general economic situation in Puerto Rico persists, the volatility and credit quality of Puerto Rican municipal securities will continue to be adversely affected, and the market for such securities may experience continued volatility. In addition, Puerto Rico’s difficulties have resulted in increased volatility in portions of the broader municipal securities market from time to time, and this may recur in the future.
Tax Risk—There is no guarantee that the income on the Portfolio’s municipal securities will be exempt from regular federal income and state income taxes. Unfavorable legislation, adverse interpretations by federal or state authorities, litigation or noncompliant conduct by the issuer of a municipal security could affect the tax-exempt status of municipal securities. If the Internal Revenue Service or a state authority determines that an issuer of a municipal security has not complied with applicable requirements, interest from the security could become subject to regular federal income tax and/or state personal income tax, possibly retroactively to the date the security was issued, the value of the security could decline significantly, and a portion of the distributions to Fund shareholders could be recharacterized as taxable. Recent federal legislation included reductions in tax rates for individuals, with relatively larger reductions in tax rates for corporations. These tax rate reductions may reduce the demand for municipal bonds which could reduce the value of municipal bonds held by the Portfolio.
Interest Rate Risk—Changes in interest rates will affect the value of investments in fixed-income securities. When interest rates rise, the value of investments in fixed-income securities tends to fall and this decrease in value may not be offset by higher income from new investments. The Portfolio may be subject to a heightened risk of rising interest rates as the current period of historically low interest rates may be ending. Interest rate risk is generally greater for fixed-income securities with longer maturities or durations.
Duration Risk—Duration is a measure that relates the expected price volatility of a fixed-income security to changes in interest rates. The duration of a fixed-income security may be shorter than or equal to full maturity of a fixed-income security. Fixed-income securities with longer durations have more risk and will decrease in price as interest rates rise. For example, a fixed-income security with a duration of three years will decrease in value by approximately 3% if interest rates increase by 1%.
| 52 | AB TAX-AWARE FIXED INCOME PORTFOLIO | abfunds.com |
NOTES TO FINANCIAL STATEMENTS (continued)
Inflation Risk—This is the risk that the value of assets or income from investments will be less in the future as inflation decreases the value of money. As inflation increases, the value of the Portfolio’s assets can decline as can the value of the Portfolio’s distributions. This risk is significantly greater for fixed-income securities with longer maturities.
Liquidity Risk—Liquidity risk exists when particular investments are difficult to purchase or sell, possibly preventing the Portfolio from selling out of these securities at an advantageous price. Derivatives and securities involving substantial market and credit risk tend to involve greater liquidity risk. The Portfolio is subject to liquidity risk because the market for municipal securities is generally smaller than many other markets.
Leverage Risk—To the extent the Portfolio uses leveraging techniques, its NAV may be more volatile because leverage tends to exaggerate the effect of changes in interest rates and any increase or decrease in the value of the Portfolio’s investments.
Derivatives Risk—The Portfolio may enter into derivative transactions such as forwards, options, futures and swaps. Derivatives may be illiquid, difficult to price, and leveraged so that small changes may produce disproportionate losses for the Portfolio, and subject to counterparty risk to a greater degree than more traditional investments. Derivatives may result in significant losses, including losses that are far greater than the value of the derivatives reflected on the statement of assets and liabilities.
Indemnification Risk—In the ordinary course of business, the Portfolio enters into contracts that contain a variety of indemnifications. The Portfolio’s maximum exposure under these arrangements is unknown. However, the Portfolio has not had prior claims or losses pursuant to these indemnification provisions and expects the risk of loss thereunder to be remote. Therefore, the Portfolio has not accrued any liability in connection with these indemnification provisions.
NOTE G
Joint Credit Facility
A number of open-end mutual funds managed by the Adviser, including the Portfolio, participate in a $280 million revolving credit facility (the “Facility”) intended to provide short-term financing, if necessary, subject to certain restrictions in connection with abnormal redemption activity. Commitment fees related to the Facility are paid by the participating funds and are included in miscellaneous expenses in the statement of operations. The Portfolio did not utilize the Facility during the year ended October 31, 2017.
| abfunds.com | AB TAX-AWARE FIXED INCOME PORTFOLIO | 53 |
NOTES TO FINANCIAL STATEMENTS (continued)
NOTE H
Distributions to Shareholders
The tax character of distributions paid during the fiscal years ended October 31, 2017 and October 31, 2016 were as follows:
| 2017 | 2016 | |||||||
Distributions paid from: | ||||||||
Ordinary income | $ | 153,454 | $ | 67,221 | ||||
|
|
|
| |||||
Total taxable distributions | $ | 153,454 | $ | 67,221 | ||||
Tax-exempt distributions | 1,090,990 | 772,547 | ||||||
|
|
|
| |||||
Total distributions paid… | $ | 1,244,444 | $ | 839,768 | ||||
|
|
|
| |||||
As of October 31, 2017, the components of accumulated earnings/(deficit) on a tax basis were as follows:
Undistributed tax-exempt income | $ | 30,269 | ||
Accumulated capital and other losses | (99,865 | )(a) | ||
Unrealized appreciation/(depreciation) | 1,880,248 | (b) | ||
|
| |||
Total accumulated earnings/(deficit) | $ | 1,810,652 | (c) | |
|
|
| (a) | As of October 31, 2017, the Portfolio had a net capital loss carryforward of $99,865. During the fiscal year, the Portfolio utilized $85,281 of capital loss carry forwards to offset current year net realized gains. |
| (b) | The difference between book-basis and tax-basis unrealized appreciation/(depreciation) is attributable primarily to the tax treatment of swaps. |
| (c) | Other differences between book-basis and tax-basis components of accumulated earnings/(deficit) are attributable primarily to dividends payable. |
For tax purposes, net realized capital losses may be carried over to offset future capital gains, if any. Funds are permitted to carry forward capital losses for an indefinite period, and such losses will retain their character as either short-term or long-term capital losses. As of October 31, 2017, the Portfolio had a net short-term capital loss carryforward of $99,865, which may be carried forward for an indefinite period.
During the current fiscal year, permanent differences primarily due to the tax treatment of swaps resulted in a net decrease in undistributed net investment income and a net decrease in accumulated net realized loss on investment and foreign currency transactions. These reclassifications had no effect on net assets.
NOTE I
Recent Accounting Pronouncements
In March 2017, the Financial Accounting Standards Board issued an Accounting Standards Update, ASU 2017-08, Receivables—Nonrefundable Fees and Other Costs (Subtopic 310-20), Premium Amortization on Purchased Callable Debt Securities (the “ASU”) which amends the amortization period for certain purchased callable debt securities held
| 54 | AB TAX-AWARE FIXED INCOME PORTFOLIO | abfunds.com |
NOTES TO FINANCIAL STATEMENTS (continued)
at a premium, shortening such period to the earliest call date. The ASU does not require any accounting change for debt securities held at a discount; the discount continues to be amortized to maturity. The ASU is effective for fiscal years, and interim periods within those fiscal years, beginning after December 15, 2018. At this time, management is evaluating the implications of these changes on the financial statements.
NOTE J
Subsequent Event
Management has evaluated subsequent events for possible recognition or disclosure in the financial statements through the date the financial statements are issued. Management has determined that there are no material events that would require disclosure in the Portfolio’s financial statements through this date.
| abfunds.com | AB TAX-AWARE FIXED INCOME PORTFOLIO | 55 |
FINANCIAL HIGHLIGHTS
Selected Data For A Share Of Capital Stock Outstanding Throughout Each Period
| Class A | ||||||||||||||||
| December 11, 2013(a) to October 31, | ||||||||||||||||
| Year Ended October 31, | ||||||||||||||||
| 2017 | 2016 | 2015 | 2014 | |||||||||||||
|
| |||||||||||||||
Net asset value, beginning of period | $ 10.87 | $ 10.59 | $ 10.51 | $ 10.00 | ||||||||||||
|
| |||||||||||||||
Income From Investment Operations | ||||||||||||||||
Net investment income(b)(c) | .21 | .22 | .18 | .14 | ||||||||||||
Net realized and unrealized gain (loss) on investment transactions | (.10 | )* | .28 | .09 | .50 | |||||||||||
|
| |||||||||||||||
Net increase in net asset value from operations | .11 | .50 | .27 | .64 | ||||||||||||
|
| |||||||||||||||
Less: Dividends and Distributions | ||||||||||||||||
Dividends from net investment income | (.21 | ) | (.22 | ) | (.18 | ) | (.13 | ) | ||||||||
Distributions from net realized gain on investment transactions | – 0 | – | – 0 | – | (.01 | ) | – 0 | – | ||||||||
|
| |||||||||||||||
Total dividends and distributions | (.21 | ) | (.22 | ) | (.19 | ) | (.13 | ) | ||||||||
|
| |||||||||||||||
Net asset value, end of period | $ 10.77 | $ 10.87 | $ 10.59 | $ 10.51 | ||||||||||||
|
| |||||||||||||||
Total Return | ||||||||||||||||
Total investment return based on net asset value(d) | 1.09 | % | 4.69 | % | 2.64 | % | 6.44 | % | ||||||||
Ratios/Supplemental Data | ||||||||||||||||
Net assets, end of period (000’s omitted) | $8,065 | $6,385 | $4,783 | $1,954 | ||||||||||||
Ratio to average net assets of: | ||||||||||||||||
Expenses, net of waivers/reimbursements(e) | .75 | % | .80 | % | .81 | % | .85 | %^ | ||||||||
Expenses, before waivers/reimbursements(e) | 1.40 | % | 1.72 | % | 2.19 | % | 3.59 | %^ | ||||||||
Net investment income(c) | 2.01 | % | 1.98 | % | 1.75 | % | 1.57 | %^ | ||||||||
Portfolio turnover rate | 34 | % | 36 | % | 35 | % | 42 | % | ||||||||
See footnote summary on page 59.
| 56 | AB TAX-AWARE FIXED INCOME PORTFOLIO | abfunds.com |
FINANCIAL HIGHLIGHTS (continued)
Selected Data For A Share Of Capital Stock Outstanding Throughout Each Period
| Class C | ||||||||||||||||
| December 11, 2013(a) to October 31, | ||||||||||||||||
| Year Ended October 31, | ||||||||||||||||
| 2017 | 2016 | 2015 | 2014 | |||||||||||||
|
| |||||||||||||||
Net asset value, beginning of period | $ 10.87 | $ 10.59 | $ 10.52 | $ 10.00 | ||||||||||||
|
| |||||||||||||||
Income From Investment Operations | ||||||||||||||||
Net investment income(b)(c) | .13 | .13 | .10 | .07 | ||||||||||||
Net realized and unrealized gain (loss) on investment transactions | (.10 | )* | .28 | .09 | .52 | |||||||||||
|
| |||||||||||||||
Net increase in net asset value from operations | .03 | .41 | .19 | .59 | ||||||||||||
|
| |||||||||||||||
Less: Dividends and Distributions | ||||||||||||||||
Dividends from net investment income | (.13 | ) | (.13 | ) | (.11 | ) | (.07 | ) | ||||||||
Distributions from net realized gain on investment transactions | – 0 | – | – 0 | – | (.01 | ) | – 0 | – | ||||||||
|
| |||||||||||||||
Total dividends and distributions | (.13 | ) | (.13 | ) | (.12 | ) | (.07 | ) | ||||||||
|
| |||||||||||||||
Net asset value, end of period | $ 10.77 | $ 10.87 | $ 10.59 | $ 10.52 | ||||||||||||
|
| |||||||||||||||
Total Return | ||||||||||||||||
Total investment return based on net asset value(d) | .33 | % | 3.91 | % | 1.78 | % | 5.92 | % | ||||||||
Ratios/Supplemental Data | ||||||||||||||||
Net assets, end of period (000’s omitted) | $1,056 | $2,022 | $1,518 | $369 | ||||||||||||
Ratio to average net assets of: | ||||||||||||||||
Expenses, net of waivers/reimbursements(e) | 1.50 | % | 1.55 | % | 1.55 | % | 1.55 | %^ | ||||||||
Expenses, before waivers/reimbursements(e) | 2.18 | % | 2.47 | % | 2.85 | % | 4.33 | %^ | ||||||||
Net investment income(c) | 1.25 | % | 1.23 | % | .99 | % | .82 | %^ | ||||||||
Portfolio turnover rate | 34 | % | 36 | % | 35 | % | 42 | % | ||||||||
See footnote summary on page 59.
| abfunds.com | AB TAX-AWARE FIXED INCOME PORTFOLIO | 57 |
FINANCIAL HIGHLIGHTS (continued)
Selected Data For A Share Of Capital Stock Outstanding Throughout Each Period
| Advisor Class | ||||||||||||||||
| December 11, 2013(a) to October 31, | ||||||||||||||||
| Year Ended October 31, | ||||||||||||||||
| 2017 | 2016 | 2015 | 2014 | |||||||||||||
|
| |||||||||||||||
Net asset value, beginning of period | $ 10.87 | $ 10.59 | $ 10.52 | $ 10.00 | ||||||||||||
|
| |||||||||||||||
Income From Investment Operations | ||||||||||||||||
Net investment income(b)(c) | .24 | .24 | .21 | .16 | ||||||||||||
Net realized and unrealized gain (loss) on investment transactions | (.10 | )* | .28 | .08 | .52 | |||||||||||
|
| |||||||||||||||
Net increase in net asset value from operations | .14 | .52 | .29 | .68 | ||||||||||||
|
| |||||||||||||||
Less: Dividends and Distributions | ||||||||||||||||
Dividends from net investment income | (.24 | ) | (.24 | ) | (.21 | ) | (.16 | ) | ||||||||
Distributions from net realized gain on investment transactions | – 0 | – | – 0 | – | (.01 | ) | – 0 | – | ||||||||
|
| |||||||||||||||
Total dividends and distributions | (.24 | ) | (.24 | ) | (.22 | ) | (.16 | ) | ||||||||
|
| |||||||||||||||
Net asset value, end of period | $ 10.77 | $ 10.87 | $ 10.59 | $ 10.52 | ||||||||||||
|
| |||||||||||||||
Total Return | ||||||||||||||||
Total investment return based on net asset value(d) | 1.34 | % | 4.96 | % | 2.81 | % | 6.84 | % | ||||||||
Ratios/Supplemental Data | ||||||||||||||||
Net assets, end of period (000’s omitted) | $59,782 | $33,667 | $26,333 | $14,584 | ||||||||||||
Ratio to average net assets of: | ||||||||||||||||
Expenses, net of waivers/reimbursements(e) | .50 | % | .55 | % | .55 | % | .55 | %^ | ||||||||
Expenses, before waivers/reimbursements(e) | 1.15 | % | 1.47 | % | 1.92 | % | 3.82 | %^ | ||||||||
Net investment income(c) | 2.26 | % | 2.24 | % | 1.99 | % | 1.76 | %^ | ||||||||
Portfolio turnover rate | 34 | % | 36 | % | 35 | % | 42 | % | ||||||||
See footnote summary on page 59.
| 58 | AB TAX-AWARE FIXED INCOME PORTFOLIO | abfunds.com |
FINANCIAL HIGHLIGHTS (continued)
Selected Data For A Share Of Capital Stock Outstanding Throughout Each Period
| (a) | Commencement of operations. |
| (b) | Based on average shares outstanding. |
| (c) | Net of fees and expenses waived/reimbursed by the Adviser. |
| (d) | Total investment return is calculated assuming an initial investment made at the net asset value at the beginning of the period, reinvestment of all dividends and distributions at net asset value during the period, and redemption on the last day of the period. Initial sales charges or contingent deferred sales charges are not reflected in the calculation of total investment return. Total return does not reflect the deduction of taxes that a shareholder would pay on fund distributions or the redemption of fund shares. Total investment return calculated for a period of less than one year is not annualized. |
| (e) | In connection with the Portfolio’s investments in affiliated underlying portfolios, the Portfolio incurs no direct expenses, but bears proportionate shares of the fees and expenses (i.e., operating, administrative and investment advisory fees) of the affiliated underlying portfolios. The Adviser has contractually agreed to waive its fees from the Portfolio in an amount equal to the Portfolio’s pro rata share of certain acquired fund fees and expenses, and for the year ended October 31, 2017, such waiver amounted to 0.01% for the Portfolio. |
| * | Due to timing of sales and repurchase of capital shares, the net realized and unrealized gain (loss) per share is not in accord with the Portfolio’s change in net realized and unrealized gain (loss) on investment transactions for the period. |
| ^ | Annualized. |
See notes to financial statements.
| abfunds.com | AB TAX-AWARE FIXED INCOME PORTFOLIO | 59 |
REPORT OF INDEPENDENT REGISTERED
PUBLIC ACCOUNTING FIRM
To the Board of Directors and Shareholders
of AB Tax-Aware Fixed Income Portfolio
We have audited the accompanying statement of assets and liabilities, including the portfolio of investments, of AB Tax-Aware Fixed Income Portfolio (the “Portfolio”), one of the portfolios constituting the AB Bond Fund, Inc., as of October 31, 2017, and the related statement of operations for the year then ended, the statements of changes in net assets for each of the two years in the period then ended, and the financial highlights for each of the three years in the period then ended and for the period of December 11, 2013 (commencement of operations) through October 31, 2014. These financial statements and financial highlights are the responsibility of the Portfolio’s management. Our responsibility is to express an opinion on these financial statements and financial highlights based on our audits.
We conducted our audits in accordance with the standards of the Public Company Accounting Oversight Board (United States). Those standards require that we plan and perform the audit to obtain reasonable assurance about whether the financial statements and financial highlights are free of material misstatement. We were not engaged to perform an audit of the Portfolio’s internal control over financial reporting. Our audits included consideration of internal control over financial reporting as a basis for designing audit procedures that are appropriate in the circumstances, but not for the purpose of expressing an opinion on the effectiveness of the Portfolio’s internal control over financial reporting. Accordingly, we express no such opinion. An audit also includes examining, on a test basis, evidence supporting the amounts and disclosures in the financial statements and financial highlights, assessing the accounting principles used and significant estimates made by management, and evaluating the overall financial statement presentation. Our procedures included confirmation of securities owned as of October 31, 2017, by correspondence with the custodian and others, or by other appropriate auditing procedures where replies from others were not received. We believe that our audits provide a reasonable basis for our opinion.
In our opinion, the financial statements and financial highlights referred to above present fairly, in all material respects, the financial position of AB Tax-Aware Fixed Income Portfolio, one of the portfolios constituting the AB Bond Fund, Inc., at October 31, 2017, the results of its operations for the year then ended, the changes in its net assets for each of the two years in the period then ended, and the financial highlights for each of the three years in the period then ended and for the period of December 11, 2013 (commencement of operations) through October 31, 2014, in conformity with U.S. generally accepted accounting principles.

New York, New York
December 28, 2017
| 60 | AB TAX-AWARE FIXED INCOME PORTFOLIO | abfunds.com |
2017 FEDERAL TAX INFORMATION
(unaudited)
For Federal income tax purposes, the following information is furnished with respect to the distributions paid by the Portfolio during the taxable year ended October 31, 2017. For foreign shareholders, 92.62% of ordinary income dividends paid may be considered to be qualifying to be taxed as interest-related dividends.
Shareholders should not use the above information to prepare their income tax returns. The information necessary to complete your income tax returns will be included with your Form 1099-DIV which will be sent to you separately in January 2018.
| abfunds.com | AB TAX-AWARE FIXED INCOME PORTFOLIO | 61 |
BOARD OF DIRECTORS
Marshall C. Turner, Jr.(1) , Chairman John H. Dobkin(1)(2) Michael J. Downey(1) William H. Foulk, Jr.(1) D. James Guzy(1)(2) Nancy P. Jacklin(1) | Robert M. Keith, President and Chief Executive Officer Carol C. McMullen(1) Garry L. Moody(1) Earl D. Weiner(1) |
OFFICERS
Philip L. Kirstein(3) , Senior Vice President and Independent Compliance Officer Robert “Guy” B. Davidson III(4) , Vice President Terrance T. Hults(4) , Vice President Shawn E. Keegan(4), Vice President Matthew J. Norton(4), Vice President | Emilie D. Wrapp, Secretary Joseph J. Mantineo, Treasurer and Chief Financial Officer Phyllis J. Clarke, Controller Vincent S. Noto, Chief Compliance Officer |
Custodian and Accounting Agent State Street Bank and Trust Company State Street Corporation CCB/5 1 Iron Street Boston, MA 02210
Principal Underwriter AllianceBernstein Investments, Inc. 1345 Avenue of the Americas New York, NY 10105
Transfer Agent AllianceBernstein Investor Services, Inc. P.O. Box 786003 San Antonio, TX 78278-6003 Toll-Free (800) 221-5672 | Independent Registered Public Accounting Firm Ernst & Young LLP 5 Times Square New York, NY 10036
Legal Counsel Seward & Kissel LLP One Battery Park Plaza New York, NY 10004 |
| 1 | Member of the Audit Committee, the Governance and Nominating Committee and the Independent Directors Committee. |
| 2 | Messrs. Dobkin and Guzy are expected to retire on or about December 31, 2017. |
| 3 | Mr. Kirstein is expected to retire on or about December 31, 2017. |
| 4 | The day-to-day management of, and investment decisions for, the Fund are made by its senior investment management team. Messrs. Davidson, Hults, Keegan and Norton are the investment professionals with the most significant responsibility for the day-to-day management of the Fund’s portfolio. |
| 62 | AB TAX-AWARE FIXED INCOME PORTFOLIO | abfunds.com |
MANAGEMENT OF THE FUND
Board of Directors Information
The business and affairs of the Fund are managed under the direction of the Board of Directors. Certain information concerning the Fund’s Directors is set forth below.
NAME, ADDRESS*, AGE, (YEAR FIRST ELECTED**) | PRINCIPAL OCCUPATION(S) DURING PAST FIVE YEARS AND INFORMATION*** | PORTFOLIOS IN FUND COMPLEX OVERSEEN BY DIRECTOR | OTHER PUBLIC COMPANY DIRECTORSHIPS CURRENTLY HELD | |||||
| INTERESTED DIRECTOR | ||||||||
Robert M. Keith# 57 (2013) | Senior Vice President of AllianceBernstein L.P. (the “Adviser”) and the head of AllianceBernstein Investments, Inc. (“ABI”) since July 2008; Director of ABI and President of the AB Mutual Funds. Previously, he served as Executive Managing Director of ABI from December 2006 to June 2008. Prior to joining ABI in 2006, Executive Managing Director of Bernstein Global Wealth Management, and prior thereto, Senior Managing Director and Global Head of Client Service and Sales of the Adviser’s institutional investment management business since 2004. Prior thereto, he was Managing Director and Head of North American Client Service and Sales in the Adviser’s institutional investment management business with which he has been associated since prior to 2004. | 96 | None | |||||
| abfunds.com | AB TAX-AWARE FIXED INCOME PORTFOLIO | 63 |
MANAGEMENT OF THE FUND (continued)
NAME, ADDRESS*, AGE, (YEAR FIRST ELECTED**) | PRINCIPAL OCCUPATION(S) DURING PAST FIVE YEARS AND INFORMATION*** | PORTFOLIOS IN FUND COMPLEX OVERSEEN BY DIRECTOR | OTHER PUBLIC COMPANY DIRECTORSHIPS CURRENTLY HELD | |||||
| INDEPENDENT DIRECTORS | ||||||||
Marshall C. Turner, Jr.## Chairman of the Board 76 (2013) | Private Investor since prior to 2012. Former Chairman and CEO of Dupont Photomasks, Inc. (components of semi-conductor manufacturing). He has extensive operating leadership, and venture capital investing experience, including five interim or full-time CEO roles, and prior service as general partner of institutional venture capital partnerships. He also has extensive non-profit board leadership experience, and currently serves on the boards of two education and science-related non-profit organizations. He has served as a director of one AB Fund since 1992, and director or trustee of multiple AB Funds since 2005. He has been Chairman of the AB Funds since January 2014, and the Chairman of the Independent Directors Committees of such AB Funds since February 2014. | 96 | Xilinx, Inc. (programmable logic semi-conductors) since 2007 | |||||
John H. Dobkin##,^ 75 (2013) | Independent Consultant since prior to 2012. Formerly, President of Save Venice, Inc. (preservation organization) from 2001-2002; Senior Advisor from June 1999-June 2000 and President of Historic Hudson Valley (historic preservation) from December 1989-May 1999. Previously, Director of the National Academy of Design. He has served as a director or trustee of various AB Funds since 1992, and as Chairman of the Audit Committees of a number of such AB Funds from 2001-2008. | 95 | None | |||||
| 64 | AB TAX-AWARE FIXED INCOME PORTFOLIO | abfunds.com |
MANAGEMENT OF THE FUND (continued)
NAME, ADDRESS*, AGE, (YEAR FIRST ELECTED**) | PRINCIPAL OCCUPATION(S) DURING PAST FIVE YEARS AND INFORMATION*** | PORTFOLIOS IN FUND COMPLEX OVERSEEN BY DIRECTOR | OTHER PUBLIC COMPANY DIRECTORSHIPS CURRENTLY HELD | |||||
| INDEPENDENT DIRECTORS (continued) | ||||||||
Michael J. Downey## 73 (2013) | Private Investor since prior to 2012. Formerly, managing partner of Lexington Capital, LLC (investment advisory firm) from December 1997 until December 2003. He served as a Director of Prospect Acquisition Corp. (financial services) from 2007 until 2009. From 1987 until 1993, Chairman and CEO of Prudential Mutual Fund Management, director of the Prudential mutual funds, and member of the Executive Committee of Prudential Securities, Inc. He has served as a director or trustee of the AB Funds since 2005 and is a director and Chairman of one other registered investment company. | 96 | The Asia Pacific Fund, Inc. (registered investment company) since prior to 2012 | |||||
William H. Foulk, Jr.## 85 (2013) | Investment Adviser and an Independent Consultant since prior to 2012. Previously, he was Senior Manager of Barrett Associates, Inc., a registered investment adviser. He was formerly Deputy Comptroller and Chief Investment Officer of the State of New York and, prior thereto, Chief Investment Officer of the New York Bank for Savings. He has served as a director or trustee of various AB Funds since 1983, and was Chairman of the Independent Directors Committees of the AB Funds from 2003 until early February 2014. He served as Chairman of such AB Funds from 2003 through December 2013. He is also active in a number of mutual fund related organizations and committees. | 96 | None | |||||
| abfunds.com | AB TAX-AWARE FIXED INCOME PORTFOLIO | 65 |
MANAGEMENT OF THE FUND (continued)
NAME, ADDRESS*, AGE, (YEAR FIRST ELECTED**) | PRINCIPAL OCCUPATION(S) DURING PAST FIVE YEARS AND INFORMATION*** | PORTFOLIOS IN FUND COMPLEX OVERSEEN BY DIRECTOR | OTHER PUBLIC COMPANY DIRECTORSHIPS CURRENTLY HELD | |||||
| INDEPENDENT DIRECTORS (continued) | ||||||||
D. James Guzy##,^ 81 (2013) | Chairman of the Board of SRC Computers, Inc. (semi-conductors), with which he has been associated since prior to 2012. He served as Chairman of the Board of PLX Technology (semi-conductors) since prior to 2012 until November 2013. He was a director of Intel Corporation (semi-conductors) from 1969 until 2008, and served as Chairman of the Finance Committee of such company for several years until May 2008. He has served as a director or trustee of one or more of the AB Funds since 1982. | 93 | None | |||||
Nancy P. Jacklin## 69 (2013) | Private Investor since prior to 2012. Professorial Lecturer at the Johns Hopkins School of Advanced International Studies (2008-2015). U.S. Executive Director of the International Monetary Fund (which is responsible for ensuring the stability of the international monetary system), (December 2002-May 2006); Partner, Clifford Chance (1992-2002); Sector Counsel, International Banking and Finance, and Associate General Counsel, Citicorp (1985-1992); Assistant General Counsel (International), Federal Reserve Board of Governors (1982-1985); and Attorney Advisor, U.S. Department of the Treasury (1973-1982). Member of the Bar of the District of Columbia and of New York; and member of the Council on Foreign Relations. She has served as a director or trustee of the AB Funds since 2006 and has been Chairman of the Governance and Nominating Committees of the AB Funds since August 2014. | 96 | None | |||||
| 66 | AB TAX-AWARE FIXED INCOME PORTFOLIO | abfunds.com |
MANAGEMENT OF THE FUND (continued)
NAME, ADDRESS*, AGE, (YEAR FIRST ELECTED**) | PRINCIPAL OCCUPATION(S) DURING PAST FIVE YEARS AND INFORMATION*** | PORTFOLIOS IN FUND COMPLEX OVERSEEN BY DIRECTOR | OTHER PUBLIC COMPANY DIRECTORSHIPS CURRENTLY HELD | |||||
| INDEPENDENT DIRECTORS (continued) | ||||||||
Carol C. McMullen## 62 (2016) | Managing Director of Slalom Consulting (consulting) since 2014, private investor and member of the Partners Healthcare Investment Committee. Formerly, Director of Norfolk & Dedham Group (mutual property and casualty insurance) from 2011 until November 2016; Director of Partners Community Physicians Organization (healthcare) from 2014 until December 2016; and Managing Director of The Crossland Group (consulting) from 2012 until 2013. She has held a number of senior positions in the asset and wealth management industries, including at Eastern Bank (where her roles included President of Eastern Wealth Management), Thomson Financial (Global Head of Sales for Investment Management), and Putnam Investments (where her roles included Head of Global Investment Research). She has served on a number of private company and nonprofit boards, and as a director or trustee of the AB Funds since June 2016. | 96 | None | |||||
| abfunds.com | AB TAX-AWARE FIXED INCOME PORTFOLIO | 67 |
MANAGEMENT OF THE FUND (continued)
NAME, ADDRESS*, AGE, (YEAR FIRST ELECTED**) | PRINCIPAL OCCUPATION(S) DURING PAST FIVE YEARS AND INFORMATION*** | PORTFOLIOS IN FUND COMPLEX OVERSEEN BY DIRECTOR | OTHER PUBLIC COMPANY DIRECTORSHIPS CURRENTLY HELD | |||||
| INDEPENDENT DIRECTORS (continued) | ||||||||
Garry L. Moody## 65 (2013) | Independent Consultant. Formerly, Partner, Deloitte & Touche LLP (1995-2008) where he held a number of senior positions, including Vice Chairman, and U.S. and Global Investment Management Practice Managing Partner; President, Fidelity Accounting and Custody Services Company (1993-1995), where he was responsible for accounting, pricing, custody and reporting for the Fidelity mutual funds; and Partner, Ernst & Young LLP (1975-1993), where he served as the National Director of Mutual Fund Tax Services and Managing Partner of its Chicago Office Tax department. He is a member of the Trustee Advisory Board of BoardIQ, a biweekly publication focused on issues and news affecting directors of mutual funds. He has served as a director or trustee, and as Chairman of the Audit Committees, of the AB Funds since 2008. | 96 | None | |||||
Earl D. Weiner## 78 (2013) | Of Counsel, and Partner prior to January 2007, of the law firm Sullivan & Cromwell LLP and is a former member of the ABA Federal Regulation of Securities Committee Task Force to draft editions of the Fund Director’s Guidebook. He also serves as a director or trustee of various non-profit organizations and has served as Chairman or Vice Chairman of a number of them. He has served as a director or trustee of the AB Funds since 2007 and served as Chairman of the Governance and Nominating Committees of the AB Funds from 2007 until August 2014. | 96 | None | |||||
| 68 | AB TAX-AWARE FIXED INCOME PORTFOLIO | abfunds.com |
MANAGEMENT OF THE FUND (continued)
| * | The address for each of the Fund’s disinterested Directors is c/o AllianceBernstein L.P., Attention: Office of the Senior Officer, 1345 Avenue of the Americas, New York, NY 10105. |
| ** | There is no stated term of office for the Fund’s Directors. |
| *** | The information above includes each Director’s principal occupation during the last five years and other information relating to the experience, attributes and skills relevant to each Director’s qualifications to serve as a Director, which led to the conclusion that each Director should serve as a Director for the Fund. |
| # | Mr. Keith is an “interested person” of the Fund, as defined in the 1940 Act, due to his position as a Senior Vice President of the Adviser. |
| ## | Member of the Audit Committee, the Governance and Nominating Committee and the Independent Directors Committee. |
| ^ | Messrs. Dobkin and Guzy are expected to retire on or about December 31, 2017. |
| abfunds.com | AB TAX-AWARE FIXED INCOME PORTFOLIO | 69 |
MANAGEMENT OF THE FUND (continued)
Officer Information
Certain information concerning the Fund’s Officers is listed below.
| NAME, ADDRESS* AND AGE | POSITION(S) HELD WITH FUND | PRINCIPAL OCCUPATION DURING PAST 5 YEARS | ||
Robert M. Keith 57 | President and Chief Executive Officer | See biography above. | ||
Philip L. Kirstein^ 72 | Senior Vice President and Independent Compliance Officer | Senior Vice President and Independent Compliance Officer of the AB Funds, with which he has been associated since October 2004. Prior thereto, he was Of Counsel to Kirkpatrick & Lockhart, LLP from October 2003 to October 2004, and General Counsel of Merrill Lynch Investment Managers, L.P. since prior to March 2003. | ||
Robert “Guy” 56 | Vice President | Senior Vice President of the Adviser,** with which he has been associated since prior to 2012. | ||
Terrance T. Hults 51 | Vice President | Senior Vice President of the Adviser,** with which he has been associated since prior to 2012. | ||
Shawn E. Keegan 46 | Vice President | Senior Vice President of the Adviser,** with which he has been associated since prior to 2012. | ||
Matthew Norton 34 | Vice President | Vice President of the Adviser,** with which he has been associated since prior to 2012. | ||
Emilie D. Wrapp 62 | Secretary | Senior Vice President, Assistant General Counsel and Assistant Secretary of ABI,** with which she has been associated since prior to 2012. | ||
Joseph J. Mantineo 58 | Treasurer and Chief Financial Officer | Senior Vice President of AllianceBernstein Investor Services, Inc. (“ABIS”),** with which he has been associated since prior to 2012. | ||
Phyllis J. Clarke 56 | Controller | Vice President of ABIS,** with which she has been associated since prior to 2012. | ||
Vincent S. Noto 53 | Chief Compliance Officer | Senior Vice President since 2015 and Mutual Fund Chief Compliance Officer of the Adviser** since 2014. Prior thereto, he was Vice President and Director of Mutual Fund Compliance of the Adviser** since prior to 2012. |
| * | The address for the Fund’s Officers is 1345 Avenue of the Americas, New York, NY 10105. |
| ** | The Adviser, ABI and ABIS are affiliates of the Fund. |
| ^ | Mr. Kirstein is expected to retire on or about December 31, 2017. |
The Fund’s Statement of Additional Information (“SAI”) has additional information about the Fund’s Directors and Officers and is available without charge upon request. Contact your financial representative or AB at 1-800-227-4618, or visit www.abfunds.com, for a free prospectus of SAI.
| 70 | AB TAX-AWARE FIXED INCOME PORTFOLIO | abfunds.com |
Information Regarding the Review and Approval of the Fund’s Advisory Agreement
The disinterested directors (the “directors”) of AB Bond Fund, Inc. (the “Company”) unanimously approved the continuance of the Company’s Advisory Agreement with the Adviser, as proposed to be amended (the “Advisory Agreement”) to effect a fee reduction, in respect of AB Tax-Aware Fixed Income Portfolio (the “Fund”) at a meeting held on November 1-3, 2016 (the “Meeting”).
Prior to approval of the continuance of the Advisory Agreement, the directors had requested from the Adviser, and received and evaluated, extensive materials. They reviewed the proposed continuance of the Advisory Agreement with the Adviser and with experienced counsel who are independent of the Adviser, who advised on the relevant legal standards. The directors also reviewed an independent evaluation prepared by the Company’s Senior Officer (who is also the Company’s Independent Compliance Officer) of the reasonableness of the proposed advisory fee, in which the Senior Officer concluded that the proposed contractual fee for the Fund was reasonable. The directors also discussed the proposed continuance in private sessions with counsel and the Company’s Senior Officer.
The directors considered their knowledge of the nature and quality of the services provided by the Adviser to the Fund gained from their experience as directors or trustees of most of the registered investment companies advised by the Adviser, their overall confidence in the Adviser’s integrity and competence they have gained from that experience, the Adviser’s initiative in identifying and raising potential issues with the directors and its responsiveness, frankness and attention to concerns raised by the directors in the past, including the Adviser’s willingness to consider and implement organizational and operational changes designed to improve investment results and the services provided to the AB Funds. The directors noted that they have four regular meetings each year, at each of which they receive presentations from the Adviser on the investment results of the Fund and review extensive materials and information presented by the Adviser.
The directors also considered all other factors they believed relevant, including the specific matters discussed below. In their deliberations, the directors did not identify any particular information that was all-important or controlling, and different directors may have attributed different weights to the various factors. The directors determined that the selection of the Adviser to manage the Fund and the overall arrangements between the Fund and the Adviser, as provided in the Advisory Agreement, including the proposed advisory fee, were fair and reasonable in light of the services performed, expenses incurred and such other matters as the directors considered relevant in the exercise of their business judgment.
| abfunds.com | AB TAX-AWARE FIXED INCOME PORTFOLIO | 71 |
The material factors and conclusions that formed the basis for the directors’ determinations included the following:
Nature, Extent and Quality of Services Provided
The directors considered the scope and quality of services provided by the Adviser under the Advisory Agreement, including the quality of the investment research capabilities of the Adviser and the other resources it has dedicated to performing services for the Fund. They also noted the professional experience and qualifications of the Fund’s portfolio management team and other senior personnel of the Adviser. The directors also considered that the Advisory Agreement provides that the Fund will reimburse the Adviser for the cost to it of providing certain clerical, accounting, administrative and other services to the Fund by employees of the Adviser or its affiliates. Requests for these reimbursements are made on a quarterly basis and subject to approval by the directors. Reimbursements, to the extent requested and paid, result in a higher rate of total compensation from the Fund to the Adviser than the fee rate stated in the Advisory Agreement. The directors noted that the methodology used to determine the reimbursement amounts had been reviewed by an independent consultant retained by the Company’s Senior Officer. The quality of administrative and other services, including the Adviser’s role in coordinating the activities of the Fund’s other service providers, also was considered. The directors concluded that, overall, they were satisfied with the nature, extent and quality of services provided to the Fund under the Advisory Agreement.
Costs of Services Provided and Profitability
The directors reviewed a schedule of the revenues and expenses and related notes indicating the profitability of the Fund to the Adviser for calendar years 2014 and 2015 that had been prepared with an expense allocation methodology arrived at in consultation with an independent consultant retained by the Company’s Senior Officer. The directors noted the assumptions and methods of allocation used by the Adviser in preparing fund-specific profitability data and understood that there are a number of potentially acceptable allocation methodologies for information of this type. The directors noted that the profitability information reflected all revenues and expenses of the Adviser’s relationship with the Fund, including those relating to its subsidiaries that provide transfer agency and distribution services to the Fund, and that the proposed reduction in the advisory fee rate would likely impact the Adviser’s profitability analysis in future years. The directors recognized that it is difficult to make comparisons of the profitability of the Advisory Agreement with the profitability of fund advisory contracts for unaffiliated funds because comparative information is not generally publicly available and is affected by numerous factors. The directors focused on the profitability of the Adviser’s relationship with the Fund before taxes and distribution expenses. The directors noted that the Fund was not profitable to the Adviser in the periods reviewed.
| 72 | AB TAX-AWARE FIXED INCOME PORTFOLIO | abfunds.com |
Fall-Out Benefits
The directors considered the other benefits to the Adviser and its affiliates from their relationships with the Fund, including, but not limited to, benefits relating to 12b-1 fees and sales charges received by the Fund’s principal underwriter (which is a wholly owned subsidiary of the Adviser) in respect of certain classes of the Fund’s shares; and transfer agency fees paid by the Fund to a wholly owned subsidiary of the Adviser. The directors recognized that the Fund’s unprofitability to the Adviser would be exacerbated without these benefits. The directors understood that the Adviser also might derive reputational and other benefits from its association with the Fund.
Investment Results
In addition to the information reviewed by the directors in connection with the Meeting, the directors receive detailed performance information for the Fund at each regular Board meeting during the year.
At the Meeting, the directors reviewed information prepared by Broadridge Financial Solutions, Inc. (“Broadridge”), an analytical service that is not affiliated with the Adviser, showing the performance of the Class A Shares of the Fund against a peer group and a peer universe selected by Broadridge, and information prepared by the Adviser showing performance of the Class A Shares against a broad-based securities market index, in each case for the 1-year period ended July 31, 2016 and (in the case of comparisons with the broad-based securities market index) for the period from inception. Based on their review, the directors concluded that the Fund’s investment performance was acceptable.
Advisory Fees and Other Expenses
The directors considered the proposed advisory fee rate paid by the Fund to the Adviser and information prepared by Broadridge concerning advisory fee rates paid by other funds in the same Broadridge category as the Fund at a common asset level. The directors recognized that it is difficult to make comparisons of advisory fees because there are variations in the services that are included in the fees paid by other funds. The directors compared the Fund’s pro forma contractual effective advisory fee rate (reflecting a reduction in the advisory fee rate effective January 1, 2017) with a peer group median.
The Adviser informed the directors that there were no institutional products managed by it that have a substantially similar investment style.
The directors noted that the Fund may invest in shares of exchange-traded funds (“ETFs”), subject to the restrictions and limitations of the Investment Company Act of 1940 as these may be varied as a result of exemptive orders issued by the SEC. The directors also noted that ETFs pay advisory fees pursuant to their advisory contracts. The directors concluded, based
| abfunds.com | AB TAX-AWARE FIXED INCOME PORTFOLIO | 73 |
on the Adviser’s explanation of how it may use ETFs when they are the most cost-effective way to obtain desired exposures for a fund or to temporarily “equitize” cash inflows pending purchases of underlying securities, that the proposed advisory fee for the Fund would be for services in addition to, rather than duplicative of, the services provided under the advisory contracts of the ETFs in which the Fund may invest.
The directors also considered the total expense ratio of the Class A shares of the Fund in comparison to a peer group and a peer universe selected by Broadridge. The Class A expense ratio of the Fund was based on the Fund’s latest fiscal year and the information included the pro forma expense ratio to reflect a reduction in the expense cap level by the Adviser effective January 1, 2017. The directors noted the effects of any fee waivers and/or expense reimbursements as a result of an undertaking by the Adviser. The directors noted that it was likely that the expense ratios of some of the other funds in the Fund’s Broadridge category were lowered by waivers or reimbursements by those funds’ investment advisers, which in some cases might be voluntary or temporary. The directors view expense ratio information as relevant to their evaluation of the Adviser’s services because the Adviser is responsible for coordinating services provided to the Fund by others. Based on their review, the directors concluded that the Fund’s pro forma expense ratio was acceptable.
Economies of Scale
The directors noted that the proposed advisory fee schedule for the Fund contains breakpoints that reduce the fee rates on assets above specified levels. The directors took into consideration prior presentations by an independent consultant on economies of scale in the mutual fund industry and for the AB Funds, and by the Adviser concerning certain of its views on economies of scale. The directors also had requested and received from the Adviser certain updates on economies of scale in advance of the Meeting. The directors believe that economies of scale may be realized (if at all) by the Adviser across a variety of products and services, and not only in respect of a single fund. The directors noted that there is no established methodology for setting breakpoints that give effect to the fund-specific services provided by a fund’s adviser and to the economies of scale that an adviser may realize in its overall mutual fund business or those components of it which directly or indirectly affect a fund’s operations. The directors observed that in the mutual fund industry as a whole, as well as among funds similar to the Fund, there is no uniformity or pattern in the fees and asset levels at which breakpoints (if any) apply. The directors also noted that the advisory agreements for many funds do not have breakpoints at all. Having taken these factors into account, the directors concluded that the Fund’s shareholders would benefit from a sharing of economies of scale in the event the Fund’s net assets exceed a breakpoint in the future.
| 74 | AB TAX-AWARE FIXED INCOME PORTFOLIO | abfunds.com |
This page is not part of the Shareholder Report or the Financial Statements.
AB FAMILY OF FUNDS
US EQUITY
US CORE
Core Opportunities Fund
FlexFee™ US Thematic Portfolio
Select US Equity Portfolio
US GROWTH
Concentrated Growth Fund
Discovery Growth Fund
FlexFee™ Large Cap Growth Portfolio
Growth Fund
Large Cap Growth Fund
Small Cap Growth Portfolio
US VALUE
Discovery Value Fund
Equity Income Fund
Relative Value Fund1
Small Cap Value Portfolio
Value Fund
INTERNATIONAL/ GLOBAL EQUITY
INTERNATIONAL/ GLOBAL CORE
Global Core Equity Portfolio
International Portfolio
International Strategic Core Portfolio
Sustainable Global Thematic Fund1
Tax-Managed International Portfolio
Tax-Managed Wealth Appreciation Strategy
Wealth Appreciation Strategy
INTERNATIONAL/ GLOBAL GROWTH
Concentrated International Growth Portfolio
International Growth Fund
INTERNATIONAL/ GLOBAL EQUITY (continued)
INTERNATIONAL/ GLOBAL VALUE
Asia ex-Japan Equity Portfolio
International Value Fund
FIXED INCOME
MUNICIPAL
High Income Municipal Portfolio
Intermediate California Municipal Portfolio
Intermediate Diversified Municipal Portfolio
Intermediate New York Municipal Portfolio
Municipal Bond Inflation Strategy
Tax-Aware Fixed Income Portfolio
National Portfolio
Arizona Portfolio
California Portfolio
Massachusetts Portfolio
Minnesota Portfolio
New Jersey Portfolio
New York Portfolio
Ohio Portfolio
Pennsylvania Portfolio
Virginia Portfolio
TAXABLE
Bond Inflation Strategy
FlexFee™ International Bond Portfolio
Global Bond Fund
High Income Fund
High Yield Portfolio
Income Fund
Intermediate Bond Portfolio
Limited Duration High Income Portfolio
Short Duration Portfolio
ALTERNATIVES
All Market Real Return Portfolio
Credit Long/Short Portfolio
Global Real Estate Investment Fund
Select US Long/Short Portfolio
Unconstrained Bond Fund
MULTI-ASSET
All Market Income Portfolio
All Market Total Return Portfolio1
Conservative Wealth Strategy
Emerging Markets Multi-Asset Portfolio
Global Risk Allocation Fund
Tax-Managed All Market Income Portfolio1
TARGET-DATE
Multi-Manager Select Retirement Allocation Fund
Multi-Manager Select 2010 Fund
Multi-Manager Select 2015 Fund
Multi-Manager Select 2020 Fund
Multi-Manager Select 2025 Fund
Multi-Manager Select 2030 Fund
Multi-Manager Select 2035 Fund
Multi-Manager Select 2040 Fund
Multi-Manager Select 2045 Fund
Multi-Manager Select 2050 Fund
Multi-Manager Select 2055 Fund
CLOSED-END FUNDS
Alliance California Municipal Income Fund
AllianceBernstein Global High Income Fund
AllianceBernstein National Municipal Income Fund
We also offer Government Money Market Portfolio1, which serves as the money market fund exchange vehicle for the AB mutual funds. An investment in Government Money Market Portfolio is not a deposit in a bank and is not insured or guaranteed by the Federal Deposit Insurance Corporation or any other government agency. Although the Fund seeks to preserve the value of your investment at $1.00 per share, it is possible to lose money by investing in the Fund.
Investors should consider the investment objectives, risks, charges and expenses of the Fund carefully before investing. For copies of our prospectus or summary prospectus, which contain this and other information, visit us online at www.abfunds.com or contact your AB representative. Please read the prospectus and/or summary prospectus carefully before investing.
| 1 | Prior to January 9, 2017, Relative Value Fund was named Growth & Income Fund; prior to April 17, 2017, Tax-Managed All Market Income Portfolio was named Tax-Managed Balanced Wealth Strategy; prior to April 24, 2017, All Market Total Return Portfolio was named Balanced Wealth Strategy; prior to November 10, 2017, Government Money Market Portfolio was named Government Exchange Reserves. |
| abfunds.com | AB TAX-AWARE FIXED INCOME PORTFOLIO | 75 |
NOTES
| 76 | AB TAX-AWARE FIXED INCOME PORTFOLIO | abfunds.com |
AB TAX-AWARE FIXED INCOME PORTFOLIO
1345 Avenue of the Americas
New York, NY 10105
800 221 5672
TAFI-0151-1017 
| ITEM 2. | CODE OF ETHICS. |
(a) The registrant has adopted a code of ethics that applies to its principal executive officer, principal financial officer and principal accounting officer. A copy of the registrant’s code of ethics is filed herewith as Exhibit 12(a)(1).
(b) During the period covered by this report, no material amendments were made to the provisions of the code of ethics adopted in 2(a) above.
(c) During the period covered by this report, no implicit or explicit waivers to the provisions of the code of ethics adopted in 2(a) above were granted.
| ITEM 3. | AUDIT COMMITTEE FINANCIAL EXPERT. |
The registrant’s Board of Directors has determined that independent directors Garry L. Moody, William H. Foulk, Jr. and Marshall C. Turner, Jr. qualify as audit committee financial experts.
| ITEM 4. | PRINCIPAL ACCOUNTANT FEES AND SERVICES. |
(a) - (c) The following table sets forth the aggregate fees billed by the independent registered public accounting firm Ernst & Young LLP, for the Fund’s last two fiscal years for professional services rendered for: (i) the audit of the Fund’s annual financial statements included in the Fund’s annual report to stockholders; (ii) assurance and related services that are reasonably related to the performance of the audit of the Fund’s financial statements and are not reported under (i), which include advice and education related to accounting and auditing issues and quarterly press release review (for those Funds which issue press releases), and preferred stock maintenance testing (for those Funds that issue preferred stock); and (iii) tax compliance, tax advice and tax return preparation.
| Audit Fees | Audit - Related Fees | Tax Fees | ||||||||||||||
AB Intermediate Bond | 2016 | $ | 75,281 | $ | 17 | $ | 18,753 | |||||||||
| 2017 | $ | 75,281 | $ | 45 | $ | 19,210 | ||||||||||
AB Bond Inflation Strategy | 2016 | $ | 86,472 | $ | 16 | $ | 18,359 | |||||||||
| 2017 | $ | 86,472 | $ | 60 | $ | 19,256 | ||||||||||
AB Municipal Bond Inflation Strategy | 2016 | $ | 66,207 | $ | 36 | $ | 18,042 | |||||||||
| 2017 | $ | 66,207 | $ | 113 | $ | 17,886 | ||||||||||
AB All Market Real Return | 2016 | $ | 79,481 | $ | 28 | $ | 38,778 | |||||||||
| 2017 | $ | 79,481 | $ | 47 | $ | 40,467 | ||||||||||
AB Credit Long/Short | 2016 | $ | 96,890 | $ | — | $ | 28,523 | |||||||||
| 2017 | $ | 96,890 | $ | — | $ | 29,101 | ||||||||||
AB High Yield | 2016 | $ | 114,070 | $ | — | $ | 30,973 | * | ||||||||
| 2016 | $ | 96,960 | $ | 11,000 | $ | 32,648 | ** | |||||||||
| 2017 | $ | 114,071 | $ | — | $ | 35,656 | ||||||||||
AB Tax Aware Fixed Income | 2016 | $ | 36,060 | $ | — | $ | 23,493 | |||||||||
| 2017 | $ | 36,060 | $ | — | $ | 23,996 | ||||||||||
AB Income | 2016 | $ | 111,185 | $ | 3,165 | $ | 32,435 | |||||||||
| 2017 | $ | 111,185 | $ | 158 | $ | 27,883 | ||||||||||
| * | Year End August 2016 |
| ** | Year End October 2016 |
(d) Not applicable.
(e) (1) Beginning with audit and non-audit service contracts entered into on or after May 6, 2003, the Fund’s Audit Committee policies and procedures require the pre-approval of all audit and non-audit services provided to the Fund by the Fund’s independent registered public accounting firm. The Fund’s Audit Committee policies and procedures also require pre-approval of all audit and non-audit services provided to the Adviser and Service Affiliates to the extent that these services are directly related to the operations or financial reporting of the Fund.
(e) (2) All of the amounts for Audit Fees, Audit-Related Fees and Tax Fees in the table under Item 4 (a) – (c) are for services pre-approved by the Fund’s Audit Committee.
(f) Not applicable.
(g) The following table sets forth the aggregate non-audit services provided to the Fund, the Fund’s Adviser and entities that control, are controlled by or under common control with the Adviser that provide ongoing services to the Fund:
| All Fees for Non-Audit Services Provided to the Portfolio, the Adviser and Service Affiliates | Pre-approved by the Audit Committee (Portion Comprised of Audit Related Fees) (Portion Comprised of Tax Fees) | |||||||||||
AB Intermediate Bond | 2016 | $ | 454,590 | $ | 18,770 | |||||||
| $ | (17 | ) | ||||||||||
| $ | (18,753 | ) | ||||||||||
| 2017 | $ | 742,370 | $ | 19,255 | ||||||||
| $ | (45 | ) | ||||||||||
| $ | (19,210 | ) | ||||||||||
AB Bond Inflation Strategy | 2016 | $ | 454,195 | $ | 18,375 | |||||||
| $ | (16 | ) | ||||||||||
| $ | (18,359 | ) | ||||||||||
| 2017 | $ | 742,431 | $ | 19,316 | ||||||||
| $ | (60 | ) | ||||||||||
| $ | (19,256 | ) | ||||||||||
AB Municipal Bond Inflation Strategy | 2016 | $ | 453,898 | $ | 18,078 | |||||||
| $ | (36 | ) | ||||||||||
| $ | (18,042 | ) | ||||||||||
| 2017 | $ | 741,114 | $ | 17,999 | ||||||||
| $ | (113 | ) | ||||||||||
| $ | (17,886 | ) | ||||||||||
AB All Market Real Return | 2016 | $ | 474,626 | $ | 38,806 | |||||||
| $ | (28 | ) | ||||||||||
| $ | (38,778 | ) | ||||||||||
| 2017 | $ | 763,629 | $ | 40,514 | ||||||||
| $ | (47 | ) | ||||||||||
| $ | (40,467 | ) | ||||||||||
AB Credit Long/Short | 2016 | $ | 464,343 | $ | 28,523 | |||||||
| $ | — | |||||||||||
| $ | (28,523 | ) | ||||||||||
| 2017 | $ | 752,216 | $ | 29,101 | ||||||||
| $ | — | |||||||||||
| $ | (29,101 | ) | ||||||||||
AB High Yield | 2016 | * | $ | 288,518 | $ | 30,973 | ||||||
| $ | — | |||||||||||
| $ | (30,973 | ) | ||||||||||
| 2016 | ** | $ | 479,468 | $ | 43,648 | |||||||
| $ | (11,000 | ) | ||||||||||
| $ | (32,648 | ) | ||||||||||
| 2017 | $ | 758,771 | $ | 35,656 | ||||||||
| $ | — | |||||||||||
| $ | (35,656 | ) | ||||||||||
AB Tax Aware Fixed Income | 2016 | $ | 459,313 | $ | 23,493 | |||||||
| $ | — | |||||||||||
| $ | (23,493 | ) | ||||||||||
| 2017 | $ | 747,111 | $ | 23,996 | ||||||||
| $ | — | |||||||||||
| $ | (23,996 | ) | ||||||||||
AB Income | 2016 | $ | 471,420 | $ | 35,600 | |||||||
| $ | (3,165 | ) | ||||||||||
| $ | (32,435 | ) | ||||||||||
| 2017 | $ | 751,156 | $ | 28,041 | ||||||||
| $ | (158 | ) | ||||||||||
| $ | (27,883 | ) | ||||||||||
| * | Year End August 2016 |
| ** | Year End October 2016 |
(h) The Audit Committee of the Fund has considered whether the provision of any non-audit services not pre-approved by the Audit Committee provided by the Fund’s independent registered public accounting firm to the Adviser and Service Affiliates is compatible with maintaining the auditor’s independence.
| ITEM 5. | AUDIT COMMITTEE OF LISTED REGISTRANTS. |
Not applicable to the registrant.
| ITEM 6. | SCHEDULE OF INVESTMENTS. |
Please see Schedule of Investments contained in the Report to Shareholders included under Item 1 of this Form N-CSR.
ITEM 7. DISCLOSURE OF PROXY VOTING POLICIES AND PROCEDURES FOR CLOSED-END MANAGEMENT INVESTMENT COMPANIES.
Not applicable to the registrant.
ITEM 8. PORTFOLIO MANAGERS OF CLOSED-END MANAGEMENT INVESTMENT COMPANIES.
Not applicable to the registrant.
ITEM 9. PURCHASES OF EQUITY SECURITIES BY CLOSED-END MANAGEMENT INVESTMENT COMPANY AND AFFILIATED PURCHASERS.
Not applicable to the registrant.
| ITEM 10. | SUBMISSION OF MATTERS TO A VOTE OF SECURITY HOLDERS. |
There have been no material changes to the procedures by which shareholders may recommend nominees to the Fund’s Board of Directors since the Fund last provided disclosure in response to this item.
| ITEM 11. | CONTROLS AND PROCEDURES. |
(a) The registrant’s principal executive officer and principal financial officer have concluded that the registrant’s disclosure controls and procedures (as defined in Rule 30a-3 (c) under the Investment Company Act of 1940, as amended) are effective at the reasonable assurance level based on their evaluation of these controls and procedures as of a date within 90 days of the filing date of this document.
(b) There were no changes in the registrant’s internal controls over financial reporting that occurred during the second fiscal quarter of the period that has materially affected, or is reasonably likely to materially affect, the registrant’s internal control over financial reporting.
| ITEM 12. | EXHIBITS. |
The following exhibits are attached to this Form N-CSR:
EXHIBIT | DESCRIPTION OF EXHIBIT | |
12 (a) (1) | Code of Ethics that is subject to the disclosure of Item 2 hereof | |
12 (b) (1) | Certification of Principal Executive Officer Pursuant to Section 302 of the Sarbanes-Oxley Act of 2002 | |
12 (b) (2) | Certification of Principal Financial Officer Pursuant to Section 302 of the Sarbanes-Oxley Act of 2002 | |
12 (c) | Certification of Principal Executive Officer and Principal Financial Officer Pursuant to Section 906 of the Sarbanes-Oxley Act of 2002 | |
SIGNATURES
Pursuant to the requirements of the Securities Exchange Act of 1934 and the Investment Company Act of 1940, the registrant has duly caused this report to be signed on its behalf by the undersigned, thereunto duly authorized.
(Registrant): AB Bond Fund, Inc.
| By: | /s/ Robert M. Keith | |
| Robert M. Keith | ||
| President | ||
| Date: | December 29, 2017 | |
Pursuant to the requirements of the Securities Exchange Act of 1934 and the Investment Company Act of 1940, this report has been signed below by the following persons on behalf of the registrant and in the capacities and on the dates indicated.
| By: | /s/ Robert M. Keith | |
| Robert M. Keith | ||
| President | ||
| Date: | December 29, 2017 | |
| By: | /s/ Joseph J. Mantineo | |
| Joseph J. Mantineo | ||
| Treasurer and Chief Financial Officer | ||
| Date: | December 29, 2017 | |