UNITED STATES
SECURITIES AND EXCHANGE COMMISSION
WASHINGTON, D.C. 20549
FORMN-CSR
CERTIFIED SHAREHOLDER REPORT OF REGISTERED
MANAGEMENT INVESTMENT COMPANIES
Investment Company Act file number:811-02383
AB BOND FUND, INC.
(Exact name of registrant as specified in charter)
1345 Avenue of the Americas, New York, New York 10105
(Address of principal executive offices) (Zip code)
Joseph J. Mantineo
AllianceBernstein L.P.
1345 Avenue of the Americas
New York, New York 10105
(Name and address of agent for service)
Registrant’s telephone number, including area code: (800)221-5672
Date of fiscal year end: December 31, 2018
Date of reporting period: December 31, 2018
ITEM 1. REPORTS TO STOCKHOLDERS.
DEC 12.31.18

ANNUAL REPORT
AB FLEXFEETM HIGH YIELD PORTFOLIO

Beginning January 1, 2021, as permitted by new regulations adopted by the Securities and Exchange Commission, the Fund’s annual and semi-annual shareholder reports will no longer be sent by mail, unless you specifically request paper copies of the reports. Instead, the reports will be made available on a website, and you will be notified by mail each time a report is posted and provided with a website address to access the report.
If you already elected to receive shareholder reports electronically, you will not be affected by this change and you need not take any action. You may elect to receive shareholder reports and other communications from the Fund electronically at any time by contacting your financial intermediary (such as a broker-dealer or bank) or, if you are a direct investor, by calling the Fund at (800) 221 5672.
You may elect to receive all future reports in paper form free of charge. If you invest through a financial intermediary, you can contact your financial intermediary to request that you continue to receive paper copies of your shareholder reports; if you invest directly with the Fund, you can call the Fund at (800) 221 5672. Your election to receive reports in paper form will apply to all funds held in your account with your financial intermediary or, if you invest directly, to all AB Mutual Funds you hold.
| Investment Products Offered | • Are Not FDIC Insured• May Lose Value• Are Not Bank Guaranteed | |
Investors should consider the investment objectives, risks, charges and expenses of the Fund carefully before investing. For copies of our prospectus or summary prospectus, which contain this and other information, visit us online at www.abfunds.com or contact your AB representative. Please read the prospectus and/or summary prospectus carefully before investing.
This shareholder report must be preceded or accompanied by the Fund’s prospectus for individuals who are not current shareholders of the Fund.
You may obtain a description of the Fund’s proxy voting policies and procedures, and information regarding how the Fund voted proxies relating to portfolio securities during the most recent12-month period ended June 30, without charge. Simply visit AB’s website at www.abfunds.com, or go to the Securities and Exchange Commission’s (the “Commission”) website at www.sec.gov, or call AB at (800) 227 4618.
The Fund files its complete schedule of portfolio holdings with the Commission for the first and third quarters of each fiscal year. The Fund’s portfolio holdings reports are available on the Commission’s website at www.sec.gov. The Fund’s portfolio holdings reports may also be reviewed and copied at the Commission’s Public Reference Room in Washington, DC; information on the operation of the Public Reference Room may be obtained by calling (800) SEC 0330. AB publishes full portfolio holdings for the Fund monthly at www.abfunds.com.
AllianceBernstein Investments, Inc. (ABI) is the distributor of the AB family of mutual funds. ABI is a member of FINRA and is an affiliate of AllianceBernstein L.P., the Adviser of the funds.
The [A/B] logo is a registered service mark of AllianceBernstein and AllianceBernstein® is a registered service mark used by permission of the owner, AllianceBernstein L.P.
| FROM THE PRESIDENT |  |
Dear Shareholder,
We are pleased to provide this report for AB FlexFee High Yield Portfolio (the “Fund”). Please review the discussion of Fund performance, the market conditions during the reporting period and the Fund’s investment strategy.
As always, AB strives to keep clients ahead of what’s next by:
| + | Transforming uncommon insights into uncommon knowledge with a global research scope |
| + | Navigating markets with seasoned investment experience and sophisticated solutions |
| + | Providing thoughtful investment insights and actionable ideas |
Whether you’re an individual investor or a multi-billion-dollar institution, we put knowledge and experience to work for you.
AB’s global research organization connects and collaborates across platforms and teams to deliver impactful insights and innovative products. Better insights lead to better opportunities—anywhere in the world.
For additional information about AB’s range of products and shareholder resources, please log on to www.abfunds.com.
Thank you for your investment in the AB Mutual Funds.
Sincerely,

Robert M. Keith
President and Chief Executive Officer, AB Mutual Funds
| abfunds.com | AB FLEXFEE HIGH YIELD PORTFOLIO | 1 | |
ANNUAL REPORT
February 12, 2019
This report provides management’s discussion of fund performance for AB FlexFee High Yield Portfolio (formerly AB High Yield Portfolio) for the annual reporting period ended December 31, 2018.
Effective February 26, 2018, the Fund implemented a performance-based, or fulcrum, advisory fee. Accordingly, performance information shown prior to February 26, 2018 does not reflect performance fee adjustments and would have been different if the Fund had been managed under the performance (fulcrum) fee arrangement. The Fund subsequently changed its fiscalyear-end from October 31 to December 31.
The Fund’s investment objective is to seek to maximize total return consistent with prudent investment management.
NAV RETURNS AS OF DECEMBER 31, 2018(unaudited)
| 2 Months | 6 Months | 12 Months | ||||||||||
| AB FLEXFEE HIGH YIELD PORTFOLIO1 | ||||||||||||
| Advisor Class Shares | -3.45% | -3.18% | -2.41% | |||||||||
| Markit iBoxx USD Liquid High Yield Index | -2.63% | -1.83% | -1.51% | |||||||||
| 1 | Includes the impact of proceeds received and credited to the Fund resulting from class-action settlements, which enhanced the performance of the Fund for thetwo-,six- and12-month periods ended December 31, 2018, by 0.00%, 0.03% and 0.03%, respectively. Also includes the impact of a reimbursement from the Adviser for trading losses incurred due to a trade entry error, which enhanced the performance of all share classes of the Fund for thetwo-,six- and12-month periods ended December 31, 2018, by 0.00%, 0.00% and 0.01%, respectively. |
INVESTMENT RESULTS
The table above shows the Fund’s performance compared to its benchmark, the Markit iBoxx USD Liquid High Yield Index, for thetwo-,six- and12-month periods ended December 31, 2018.
The Fund underperformed the benchmark for all periods. The Fund’s advisory fee, which is performance-based, was being accrued at its minimum rate. (The actual advisory fee payable by the Fund for its current performance period will be determined based on the Fund’s performance relative to the benchmark as of the end of such period, which runs from February 26, 2018 through December 31, 2019.)
In the12-month period, security selection detracted from performance, relative to the benchmark, primarily within the other-finance and basic-
| 2 | AB FLEXFEE HIGH YIELD PORTFOLIO | abfunds.com | |
industries sectors. Technology and consumernon-cyclical selections were positive. Industry positioning contributed, as gains from the Fund’s overweight position in the other-finance sector more than offset losses from an overweight in energy. Yield-curve and currency positioning were also positive in the period.
In thesix-month period, industry positioning was negative as a result of an overweight to energy and an underweight to media. Security decisions also detracted, as gains from selection within consumernon-cyclicals and other industrials were more than offset by losses from selection within energy, basic industries and capital goods. The Fund’s modestly longer-than-benchmark duration positioning contributed. Currency positioning had no material impact on returns.
In thetwo-month period, security selection detracted, particularly within the energy and basic-industries sectors, while consumernon-cyclical selection added to returns. Industry allocation was also negative because of an underweight position in media; however, an exposure to treasuries contributed. The Fund’s longer-than-benchmark duration positioning also contributed. Currency positioning had no material impact on returns.
During all periods, the Fund utilized derivatives in the form of futures and interest rate swaps to hedge duration risk. Currency forwards were used to hedge foreign currency exposure and to achieve active exposure. Credit default swaps, both single name and index, were used to take active exposure as well as to hedge investment-grade and high-yield credit risk taken through cash bonds. Total return swaps were used to create synthetic high-yield exposure. Purchased equity options were used to take active exposure. Currency options, both written and purchased, were used to hedge foreign currency exposure. Written and purchased swaptions were used to manage and/or take active yield-curve positioning.
MARKET REVIEW AND INVESTMENT STRATEGY
Fixed-income markets had mixed performance over the12-month period ended December 31, 2018, amid concerns over tighter monetary policy, global trade tensions and geopolitical uncertainty. Developed-market treasuries rallied, while investment-grade securities posted neutral returns, and high-yield and emerging-market debt sectors sold off. The US Federal Reserve raised interest rates four times in 2018 and began to formally reduce its balance sheet, as widely anticipated, but at the very end of the period signaled a possible slowdown in its pace of rate hikes, leading markets to discount anticipated 2019 hikes that had previously been reflected in bond prices. Meanwhile, as announced earlier in the year, the European Central Bank ended its bond buying program in December. Over the period, US yields rose dramatically, with10- and30-year Treasury yields touching
| abfunds.com | AB FLEXFEE HIGH YIELD PORTFOLIO | 3 | |
multiyear highs, on the back of higher inflation forecasts and a robust US labor market. Meanwhile, the US administration announced tariffs on imports from China, the European Union, Mexico and Canada, all of which reciprocated with tariffs on the US, triggering a global trade war. An upsurge in geopolitical uncertainty regarding Brexit and budget discussions between Italy and its European Union partners sparked a flight to quality.
The Fund’s Senior Investment Management Team (the “Team”) continues to seek to maximize total return, utilizing a high-yield strategy with a global, multi-sector approach. The Team invests in corporate bonds from US andnon-US issuers and government bonds from developed and emerging markets, primarily focusing on lower-rated bonds (“junk bonds”), although it may also invest in investment-grade bonds.
INVESTMENT POLICIES
At least 80% of the Fund’s net assets will, under normal circumstances, be invested in fixed-income securities rated Ba1 or lower by Moody’s Investors Service or BB+ or lower by S&P Global Ratings or Fitch Ratings (commonly known as “junk bonds”), unrated securities considered by the Adviser to be of comparable quality, and related derivatives. The Fund may invest in fixed-income securities with a range of maturities from short- to long-term. The Fund may also invest in equity securities.
In selecting securities for purchase or sale by the Fund, the Adviser attempts to take advantage of inefficiencies that it believes exist in the global debt markets. These inefficiencies arise from investor behavior, market complexity, and the investment limitations to which investors are subject. The Adviser combines quantitative analysis with fundamental credit and economic research in seeking to exploit these inefficiencies.
The Fund will most often invest in securities of US issuers, but may also purchase fixed-income securities of foreign issuers, including securities denominated in foreign currencies. The Adviser may or may not hedge any foreign currency exposure through the use of currency-related derivatives.
The Fund expects to use derivatives, such as options, futures contracts, forwards and swaps, to a significant extent. Derivatives may provide a more efficient and economical exposure to market segments than direct investments, and may also be a more efficient way to alter the Fund’s exposure. The Fund may, for example, use credit
| 4 | AB FLEXFEE HIGH YIELD PORTFOLIO | abfunds.com | |
(continued on next page)
default and interest rate swaps to gain exposure to the fixed-income markets or particular fixed-income securities and, as noted above, may use currency-related derivatives. The Adviser may use derivatives to effectively leverage the Fund by creating aggregate market exposure substantially in excess of the Fund’s net assets.
| abfunds.com | AB FLEXFEE HIGH YIELD PORTFOLIO | 5 | |
DISCLOSURES AND RISKS
Benchmark Disclosure
The Markit iBoxx USD Liquid High Yield Index is unmanaged and does not reflect fees and expenses associated with the active management of a mutual fund portfolio. The Markit iBoxx USD Liquid High Yield Index consists of USD high-yield bond issues with more than $400 million outstanding, selected to provide a balanced representation of the broad USD high-yield liquid corporate bond universe. An investor cannot invest directly in an index or average, and their results are not indicative of the performance for any specific investment, including the Fund.
A Word About Risk
Market Risk:The value of the Fund’s assets will fluctuate as the bond or stock market fluctuates. The value of its investments may decline, sometimes rapidly and unpredictably, simply because of economic changes or other events that affect large portions of the market.
Interest-Rate Risk:Changes in interest rates will affect the value of investments in fixed-income securities. When interest rates rise, the value of existing investments in fixed-income securities tends to fall and this decrease in value may not be offset by higher income from new investments. The Fund may be subject to heightened interest-rate risk due to rising rates as the current period of historically low interest rates may be ending. Interest-rate risk is generally greater for fixed-income securities with longer maturities or durations.
Credit Risk:An issuer or guarantor of a fixed-income security, or the counterparty to a derivatives or other contract, may be unable or unwilling to make timely payments of interest or principal, or to otherwise honor its obligations. The issuer or guarantor may default, causing a loss of the full principal amount of a security and accrued interest. The degree of risk for a particular security may be reflected in its credit rating. There is the possibility that the credit rating of a fixed-income security may be downgraded after purchase, which may adversely affect the value of the security.
Below Investment-Grade Securities Risk:Investments in fixed-income securities with lower ratings (commonly known as “junk bonds”) are subject to a higher probability that an issuer will default or fail to meet its payment obligations. These securities may be subject to greater price volatility, due to such factors as specific corporate developments, negative perceptions of the junk bond market generally and less secondary market liquidity.
Duration Risk:Duration is a measure that relates the expected price volatility of a fixed-income security to changes in interest rates. The duration of a fixed-income security may be shorter than or equal to full maturity of a fixed-income security. Fixed-income securities with longer durations have more risk and will decrease in price as interest rates rise. For example,
| 6 | AB FLEXFEE HIGH YIELD PORTFOLIO | abfunds.com | |
DISCLOSURES AND RISKS(continued)
generally a fixed-income security with a duration of three years will decrease in value by approximately 3% if interest rates increase by 1%.
Inflation Risk:This is the risk that the value of assets or income from investments will be less in the future as inflation decreases the value of money. As inflation increases, the value of the Fund’s assets can decline as can the value of the Fund’s distributions. This risk is significantly greater if the Fund invests a significant portion of its assets in fixed-income securities with longer maturities.
Derivatives Risk:Derivatives may be illiquid, difficult to price, and leveraged so that small changes may produce disproportionate losses for the Fund, and may be subject to counterparty risk to a greater degree than more traditional investments.
Leverage Risk: To the extent the Fund uses leveraging techniques, its net asset value (“NAV”) may be more volatile because leverage tends to exaggerate the effect of changes in interest rates and any increase or decrease in the value of the Fund’s investments.
Foreign(Non-US) Risk: Investments in securities ofnon-US issuers may involve more risk than those of US issuers. These securities may fluctuate more widely in price and may be less liquid due to adverse market, economic, political, regulatory or other factors.
Emerging-Market Risk: Investments in emerging-market countries may have more risk because the markets are less developed and less liquid, and because these investments may be subject to increased economic, political, regulatory or other uncertainties.
Currency Risk: Fluctuations in currency exchange rates may negatively affect the value of the Fund’s investments or reduce its returns.
Liquidity Risk: Liquidity risk occurs when certain investments become difficult to purchase or sell. Difficulty in selling less liquid securities may result in sales at disadvantageous prices affecting the value of your investment in the Fund. Causes of liquidity risk may include low trading volumes, large positions and heavy redemptions of Fund shares. Over recent years liquidity risk has also increased because the capacity of dealers in the secondary market for fixed-income securities to make markets in these securities has decreased, even as the overall bond market has grown significantly, due to, among other things, structural changes, additional regulatory requirements and capital and risk restraints that have led to reduced inventories. Liquidity risk may be higher in a rising interest-rate environment, when the value and liquidity of fixed-income securities generally decline.
| abfunds.com | AB FLEXFEE HIGH YIELD PORTFOLIO | 7 | |
DISCLOSURES AND RISKS(continued)
Management Risk: The Fund is subject to management risk because it is an actively managed investment fund. The Adviser will apply its investment techniques and risk analyses in making investment decisions, but there is no guarantee that its techniques will produce the intended results.
These risks are fully discussed in the Fund’s prospectus. As with all investments, you may lose money by investing in the Fund.
An Important Note About Historical Performance
The investment return and principal value of an investment in the Fund will fluctuate, so that shares, when redeemed, may be worth more or less than their original cost. Performance shown in this report represents past performance and does not guarantee future results. Current performance may be lower or higher than the performance information shown. You may obtain performance information current to the most recentmonth-end by visiting www.abfunds.com.
Performance information prior to July 26, 2016 shown in this report reflects the historical performance of the AB High Yield Portfolio, a series of the AB Pooling Portfolios (the “Accounting Survivor”), adjusted to reflect the expense ratio of Advisor Class shares of the Fund as of July 26, 2016. Upon completion of a reorganization of the Accounting Survivor into the Fund on July 26, 2016, the Fund assumed the performance and financial history of the Accounting Survivor. At the time of the reorganization, the Accounting Survivor and the Fund had substantially similar investment objectives and strategies.
Effective February 26, 2018, the Fund implemented a performance-based, or fulcrum, advisory fee. Accordingly, performance information shown prior to February 26, 2018 does not reflect performance fee adjustments and would have been different if the Fund had been managed under the performance (fulcrum) fee arrangement. Effective February 26, 2018, all previously offered shares of the Fund, including Class Z shares, were converted to Advisor Class shares.
All fees and expenses related to the operation of the Fund have been deducted. Performance assumes reinvestment of distributions and does not account for taxes.
| 8 | AB FLEXFEE HIGH YIELD PORTFOLIO | abfunds.com | |
HISTORICAL PERFORMANCE
GROWTH OF A $10,000 INVESTMENT IN THE FUND(unaudited)
12/31/2008 TO 12/31/2018
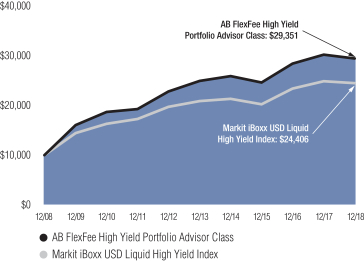
This chart illustrates the total value of an assumed $10,000 investment in AB FlexFee High Yield Portfolio Advisor Class shares (from 12/31/2008 to 12/31/2018) as compared to the performance of the Fund’s benchmark.
| abfunds.com | AB FLEXFEE HIGH YIELD PORTFOLIO | 9 | |
HISTORICAL PERFORMANCE(continued)
AVERAGE ANNUAL RETURNS AS OF DECEMBER 31, 2018(unaudited)
| NAV Returns | SEC Returns (reflects applicable sales charges) | SEC Yields1 | ||||||||||
| ADVISOR CLASS SHARES2 | 5.27% | |||||||||||
| 1 Year | -2.41% | -2.41% | ||||||||||
| 5 Years | 3.40% | 3.40% | ||||||||||
| 10 Years | 11.37% | 11.37% | ||||||||||
SEC AVERAGE ANNUAL RETURNS
AS OF THE MOST RECENT CALENDARQUARTER-END
DECEMBER 31, 2018(unaudited)
SEC Returns (reflects applicable | ||||
| ADVISOR CLASS SHARES | ||||
| 1 Year | -2.41% | |||
| 5 Years | 3.40% | |||
| 10 Years | 11.37% | |||
The Fund’s current prospectus fee table shows the Fund’s total annual operating expense ratio as 2.42% for Advisor Class shares, gross of any fee waivers or expense reimbursements. Contractual fee waivers and/or expense reimbursements limit the Fund’s annual operating expense ratio exclusive of the Fund’s advisory fees, acquired fund fees and expenses other than the advisory fees of any AB mutual funds in which the Fund may invest, interest expense, taxes, extraordinary expenses, and brokerage commissions and other transaction costs to 0.10% for Advisor Class shares. These waivers/reimbursements may not be terminated before February 29, 2020. Any fees waived and expenses borne by the Adviser through December 31, 2019 may be reimbursed by the Fund until the end of the third fiscal year after the fiscal period in which the fee was waived or the expense was borne, provided that no reimbursement payment will be made that would cause the Fund’s total annual operating expenses to exceed the expense limitations. Absent reimbursements or waivers, performance would have been lower. The Financial Highlights section of this report sets forth expense ratio data for the current reporting period; the expense ratio shown above may differ from the expense ratio in the Financial Highlights section since they are based on different time periods.
| 1 | SEC yields are calculated based on SEC guidelines for the30-day period ended December 31, 2018. |
| 2 | This share class is offered at NAV to eligible investors and the SEC returns are the same as the NAV returns. |
| 10 | AB FLEXFEE HIGH YIELD PORTFOLIO | abfunds.com | |
EXPENSE EXAMPLE
(unaudited)
As a shareholder of the Fund, you incur two types of costs: (1) transaction costs, including sales charges (loads) on purchase payments, contingent deferred sales charges on redemptions and (2) ongoing costs, including management fees; distribution(12b-1) fees; and other Fund expenses. This example is intended to help you understand your ongoing costs (in dollars) of investing in the Fund and to compare these costs with the ongoing costs of investing in other mutual funds.
The Example is based on an investment of $1,000 invested at the beginning of the period and held for the entire period as indicated below.
Actual Expenses
The first line of the table below provides information about actual account values and actual expenses. You may use the information in this line, together with the amount you invested, to estimate the expenses that you paid over the period. Simply divide your account value by $1,000 (for example, an $8,600 account value divided by $1,000 = 8.6), then multiply the result by the number in the first line under the heading entitled “Expenses Paid During Period” to estimate the expenses you paid on your account during this period.
Hypothetical Example for Comparison Purposes
The second line of the table below provides information about hypothetical account values and hypothetical expenses based on the Fund’s actual expense ratio and an assumed annual rate of return of 5% before expenses, which is not the Fund’s actual return. The hypothetical account values and expenses may not be used to estimate the actual ending account balance or expenses you paid for the period. You may use this information to compare the ongoing costs of investing in the Fund and other funds by comparing this 5% hypothetical example with the 5% hypothetical examples that appear in the shareholder reports of other funds.
| Beginning Account Value 11/1/2018 | Ending Account Value 12/31/2018 | Expenses Paid During Period* | Annualized Expense Ratio* | Total Expenses Paid During Period+ | Total Annualized Expense Ratio+ | |||||||||||||||||||
| Advisor Class | ||||||||||||||||||||||||
Actual | $ | 1,000 | $ | 965.50 | $ | 0.48 | 0.29 | % | $ | 0.49 | 0.30 | % | ||||||||||||
Hypothetical** | $ | 1,000 | $ | 1,007.87 | $ | 0.49 | 0.29 | % | $ | 0.50 | 0.30 | % | ||||||||||||
| * | Expenses are equal to the classes’ annualized expense ratios multiplied by the average account value over the period, multiplied by 61/365 (to reflect the two months period). |
| + | In connection with the Fund’s investments in affiliated/unaffiliated underlying portfolios, the Fund incurs no direct expenses, but bears proportionate shares of the fees and expenses (i.e., operating, administrative and investment advisory fees) of the affiliated/unaffiliated underlying portfolios. The Adviser has contractually agreed to waive its fees from the Fund in an amount equal to the Fund’s pro rata share of certain acquired fund fees and expenses of the affiliated underlying portfolios. The Fund’s total expenses are equal to the classes’ annualized expense ratio plus the Fund’s pro rata share of the weighted average expense ratio of the affiliated/unaffiliated underlying portfolios in which it invests, multiplied by the average account value over the period, multiplied by 61/365 (to reflect the two months period). |
| ** | Assumes 5% annual return before expenses. |
| abfunds.com | AB FLEXFEE HIGH YIELD PORTFOLIO | 11 | |
PORTFOLIO SUMMARY
December 31, 2018(unaudited)
PORTFOLIO STATISTICS
Net Assets ($mil): $30.5
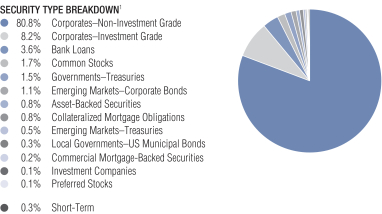
| 1 | All data are as of December 31, 2018. The Fund’s security type breakdown is expressed as a percentage of total investments and may vary over time. The Fund also enters into derivative transactions, which may be used for hedging or investment purposes (see “Portfolio of Investments” section of the report for additional details). |
| 12 | AB FLEXFEE HIGH YIELD PORTFOLIO | abfunds.com | |
PORTFOLIO OF INVESTMENTS
December 31, 2018
| Principal Amount (000) | U.S. $ Value | |||||||||||
| ||||||||||||
CORPORATES –NON-INVESTMENT GRADE – 79.5% | ||||||||||||
Industrial – 70.3% | ||||||||||||
Basic – 5.9% | ||||||||||||
AK Steel Corp. | U.S.$ | 30 | $ | 29,800 | ||||||||
Berry Global, Inc. | 8 | 7,922 | ||||||||||
CF Industries, Inc. | 10 | 7,750 | ||||||||||
5.15%, 3/15/34 | 55 | 46,476 | ||||||||||
5.375%, 3/15/44 | 57 | 46,337 | ||||||||||
7.125%, 5/01/20 | 14 | 14,405 | ||||||||||
Cleveland-Cliffs, Inc. | 28 | 25,165 | ||||||||||
Commercial Metals Co. | 50 | 47,251 | ||||||||||
Crown Americas LLC/Crown Americas Capital Corp. VI | 41 | 38,801 | ||||||||||
Eldorado Gold Corp. | 12 | 10,954 | ||||||||||
ERP Iron Ore, LLC | 7 | 7,003 | ||||||||||
Flex Acquisition Co., Inc. | 7 | 6,240 | ||||||||||
FMG Resources (August 2006) Pty Ltd. | 81 | 76,389 | ||||||||||
5.125%,3/15/23-5/15/24(a) | 93 | 86,331 | ||||||||||
Freeport-McMoRan, Inc. | 28 | 27,370 | ||||||||||
3.55%, 3/01/22 | 183 | 173,224 | ||||||||||
3.875%, 3/15/23 | 31 | 28,931 | ||||||||||
5.45%, 3/15/43 | 25 | 19,031 | ||||||||||
Graphic Packaging International LLC | 26 | 25,649 | ||||||||||
Grinding Media,Inc./Moly-Cop AltaSteel Ltd. | 29 | 28,379 | ||||||||||
Hexion, Inc. | 145 | 115,773 | ||||||||||
Huntsman International LLC | 40 | 40,118 | ||||||||||
Joseph T Ryerson & Son, Inc. | 135 | 135,699 | ||||||||||
Lecta SA | EUR | 105 | 111,082 | |||||||||
| abfunds.com | AB FLEXFEE HIGH YIELD PORTFOLIO | 13 | |
PORTFOLIO OF INVESTMENTS(continued)
| Principal Amount (000) | U.S. $ Value | |||||||||||
| ||||||||||||
Magnetation LLC/Mag Finance Corp. | U.S.$ | 60 | $ | 1 | ||||||||
Momentive Performance Materials, Inc. | 43 | 45,628 | ||||||||||
8.875%, 10/15/20(b)(d)(f)(j) | 33 | – 0 | – | |||||||||
New Gold, Inc. | 9 | 7,516 | ||||||||||
Novelis Corp. | 8 | 7,045 | ||||||||||
6.25%, 8/15/24(a) | 35 | 32,981 | ||||||||||
Nufarm Australia Ltd./Nufarm Americas, Inc. | 20 | 18,151 | ||||||||||
Pactiv LLC | 23 | 22,856 | ||||||||||
Peabody Energy Corp. | 45 | 44,288 | ||||||||||
6.375%, 3/31/25(a) | 20 | 18,678 | ||||||||||
Reynolds Group Issuer, Inc./Reynolds Group Issuer LLC/Reynolds Group Issuer Lu | 105 | 99,905 | ||||||||||
Sealed Air Corp. | 33 | 32,727 | ||||||||||
6.875%, 7/15/33(a) | 70 | 70,578 | ||||||||||
SPCM SA | 58 | 51,798 | ||||||||||
Teck Resources Ltd. | 36 | 30,515 | ||||||||||
5.40%, 2/01/43 | 32 | 28,117 | ||||||||||
8.50%, 6/01/24(a) | 4 | 4,377 | ||||||||||
United States Steel Corp. | 30 | 26,513 | ||||||||||
6.875%, 8/15/25 | 52 | 48,077 | ||||||||||
Valvoline, Inc. | 7 | 6,837 | ||||||||||
W.R. Grace & Co.-Conn | 18 | 17,879 | ||||||||||
5.625%, 10/01/24(a) | 24 | 24,383 | ||||||||||
|
| |||||||||||
| 1,794,930 | ||||||||||||
|
| |||||||||||
Capital Goods – 4.0% | ||||||||||||
A123 Systems, Inc. | 21 | 1,448 | ||||||||||
Arconic, Inc. | 4 | 3,834 | ||||||||||
Ardagh Packaging Finance PLC/Ardagh Holdings USA, Inc. | EUR | 100 | 112,201 | |||||||||
| 14 | AB FLEXFEE HIGH YIELD PORTFOLIO | abfunds.com | |
PORTFOLIO OF INVESTMENTS(continued)
| Principal Amount (000) | U.S. $ Value | |||||||||
| ||||||||||
4.25%, 9/15/22(a) | U.S.$ | 79 | $ | 74,501 | ||||||
4.625%, 5/15/23(a) | 17 | 16,512 | ||||||||
7.25%, 5/15/24(a) | 3 | 2,888 | ||||||||
Ball Corp. | 27 | 27,304 | ||||||||
5.00%, 3/15/22 | 50 | 50,251 | ||||||||
BBA US Holdings, Inc. | 11 | 10,388 | ||||||||
Bombardier, Inc. | 183 | 171,624 | ||||||||
6.00%, 10/15/22(a) | 35 | 32,818 | ||||||||
6.125%, 1/15/23(a) | 5 | 4,685 | ||||||||
7.50%,12/01/24-3/15/25(a) | 56 | 53,159 | ||||||||
BWAY Holding Co. | EUR | 105 | 118,034 | |||||||
7.25%, 4/15/25(a) | U.S.$ | 4 | 3,600 | |||||||
Clean Harbors, Inc. | 52 | 51,270 | ||||||||
Cleaver-Brooks, Inc. | 14 | 13,692 | ||||||||
Crown Cork & Seal Co., Inc. | 20 | 21,332 | ||||||||
Gates Global LLC/Gates Global Co. | 5 | 4,653 | ||||||||
GFL Environmental, Inc. | 56 | 49,527 | ||||||||
5.625%, 5/01/22(a) | 40 | 37,083 | ||||||||
Hulk Finance Corp. | 25 | 21,810 | ||||||||
JELD-WEN, Inc. | 6 | 5,280 | ||||||||
4.875%, 12/15/27(a) | 8 | 6,880 | ||||||||
Mueller Water Products, Inc. | 44 | 42,693 | ||||||||
Owens-Brockway Glass Container, Inc. | 20 | 19,326 | ||||||||
RBS Global, Inc./Rexnord LLC | 57 | 52,250 | ||||||||
Stevens Holding Co., Inc. | 20 | 19,726 | ||||||||
Summit Materials LLC/Summit Materials Finance Corp. | 20 | 19,752 | ||||||||
TransDigm, Inc. | 132 | 129,183 | ||||||||
Triumph Group, Inc. | 8 | 6,917 | ||||||||
| abfunds.com | AB FLEXFEE HIGH YIELD PORTFOLIO | 15 | |
PORTFOLIO OF INVESTMENTS(continued)
| Principal Amount (000) | U.S. $ Value | |||||||||||
| ||||||||||||
7.75%, 8/15/25 | U.S.$ | 25 | $ | 21,715 | ||||||||
|
| |||||||||||
| 1,206,336 | ||||||||||||
|
| |||||||||||
Communications - Media – 8.7% | ||||||||||||
Altice Financing SA | 67 | 64,228 | ||||||||||
Altice France SA/France | 185 | 169,741 | ||||||||||
Cablevision Systems Corp. | 85 | 83,649 | ||||||||||
CCO Holdings LLC/CCO Holdings Capital Corp. | 52 | 48,587 | ||||||||||
5.00%, 2/01/28(a) | 189 | 173,862 | ||||||||||
5.125%, 2/15/23 | 29 | 27,863 | ||||||||||
5.125%, 5/01/27(a) | 290 | 270,140 | ||||||||||
5.25%, 9/30/22 | 6 | 6,095 | ||||||||||
5.375%, 5/01/25(a) | 12 | 11,738 | ||||||||||
5.75%, 2/15/26(a) | 11 | 10,784 | ||||||||||
5.875%, 5/01/27(a) | 3 | 2,739 | ||||||||||
Clear Channel Worldwide Holdings, Inc. | 16 | 15,471 | ||||||||||
Series B | 89 | 89,422 | ||||||||||
7.625%, 3/15/20 | 59 | 58,200 | ||||||||||
CSC Holdings LLC | 200 | 184,204 | ||||||||||
6.625%, 10/15/25(a) | 3 | 2,656 | ||||||||||
DISH DBS Corp. | 16 | 12,895 | ||||||||||
5.875%, 7/15/22 | 115 | 105,335 | ||||||||||
6.75%, 6/01/21 | 242 | 239,909 | ||||||||||
iHeartCommunications, Inc. | 50 | 9,966 | ||||||||||
9.00%, 12/15/19(e)(f) | 75 | 50,572 | ||||||||||
11.25%, 3/01/21(a)(e)(f) | 10 | 6,740 | ||||||||||
Meredith Corp. | 57 | 56,054 | ||||||||||
Netflix, Inc. | 33 | 30,112 | ||||||||||
5.875%, 11/15/28(a) | 69 | 67,155 | ||||||||||
Outfront Media Capital LLC/Outfront Media Capital Corp. | 8 | 7,848 | ||||||||||
Radiate Holdco LLC/Radiate Finance, Inc. | 17 | 15,075 | ||||||||||
6.875%, 2/15/23(a) | 17 | 15,481 | ||||||||||
| 16 | AB FLEXFEE HIGH YIELD PORTFOLIO | abfunds.com | |
PORTFOLIO OF INVESTMENTS(continued)
| Principal Amount (000) | U.S. $ Value | |||||||||||
| ||||||||||||
RR Donnelley & Sons Co. | U.S.$ | 29 | $ | 28,917 | ||||||||
Sinclair Television Group, Inc. | 9 | 7,986 | ||||||||||
5.625%, 8/01/24(a) | 40 | 37,571 | ||||||||||
6.125%, 10/01/22 | 17 | 17,024 | ||||||||||
Sirius XM Radio, Inc. | 33 | 31,599 | ||||||||||
4.625%, 5/15/23(a) | 21 | 20,120 | ||||||||||
5.00%, 8/01/27(a) | 94 | 85,850 | ||||||||||
5.375%, 7/15/26(a) | 35 | 33,079 | ||||||||||
6.00%, 7/15/24(a) | 93 | 93,611 | ||||||||||
TEGNA, Inc. | 25 | 25,324 | ||||||||||
6.375%, 10/15/23 | 68 | 68,101 | ||||||||||
Urban One, Inc. | 37 | 34,697 | ||||||||||
Virgin Media Finance PLC | EUR | 200 | 226,303 | |||||||||
Ziggo Bond Co. BV | U.S.$ | 18 | 16,469 | |||||||||
Ziggo BV | 110 | 99,133 | ||||||||||
|
| |||||||||||
| 2,662,305 | ||||||||||||
|
| |||||||||||
Communications - Telecommunications – 7.6% | ||||||||||||
CBT-Mobile USA, Inc. | 152 | – 0 | – | |||||||||
6.375%, 3/01/25(b)(c)(d)(f) | 27 | – 0 | – | |||||||||
6.50%,1/15/24-1/15/26(b)(c)(d)(f) | 136 | – 0 | – | |||||||||
CenturyLink, Inc. | 65 | 57,208 | ||||||||||
Series S | 36 | 36,286 | ||||||||||
Series T | 97 | 93,554 | ||||||||||
Embarq Corp. | 100 | 90,175 | ||||||||||
Frontier Communications Corp. | 144 | 81,992 | ||||||||||
7.625%, 4/15/24 | 55 | 28,145 | ||||||||||
7.875%, 1/15/27 | 13 | 6,279 | ||||||||||
8.75%, 4/15/22 | 101 | 64,423 | ||||||||||
10.50%, 9/15/22 | 55 | 38,147 | ||||||||||
11.00%, 9/15/25 | 37 | 22,966 | ||||||||||
| abfunds.com | AB FLEXFEE HIGH YIELD PORTFOLIO | 17 | |
PORTFOLIO OF INVESTMENTS(continued)
| Principal Amount (000) | U.S. $ Value | |||||||||||
| ||||||||||||
GTT Communications, Inc. | U.S.$ | 6 | $ | 5,197 | ||||||||
Hughes Satellite Systems Corp. | 29 | 29,424 | ||||||||||
6.625%, 8/01/26 | 30 | 27,560 | ||||||||||
7.625%, 6/15/21 | 19 | 20,008 | ||||||||||
Intelsat Jackson Holdings SA | 88 | 77,480 | ||||||||||
8.00%, 2/15/24(a) | 10 | 10,514 | ||||||||||
8.50%, 10/15/24(a) | 35 | 33,775 | ||||||||||
9.50%, 9/30/22(a) | 53 | 60,447 | ||||||||||
9.75%, 7/15/25(a) | 56 | 56,266 | ||||||||||
Level 3 Financing, Inc. | 60 | 57,891 | ||||||||||
5.25%, 3/15/26 | 66 | 60,891 | ||||||||||
5.375%, 1/15/24 | 17 | 16,193 | ||||||||||
Level 3 Parent LLC | 54 | 52,600 | ||||||||||
Qwest Corp. | 78 | 80,045 | ||||||||||
6.875%, 9/15/33 | 11 | 9,940 | ||||||||||
7.25%, 9/15/25 | 55 | 56,397 | ||||||||||
Sable International Finance Ltd. | 27 | 27,675 | ||||||||||
Sprint Capital Corp. | 31 | 29,302 | ||||||||||
8.75%, 3/15/32 | 102 | 107,444 | ||||||||||
Sprint Communications, Inc. | 298 | 306,042 | ||||||||||
Sprint Corp. | 44 | 43,921 | ||||||||||
7.875%, 9/15/23 | 22 | 22,572 | ||||||||||
T-Mobile USA, Inc. | 192 | 177,342 | ||||||||||
4.75%, 2/01/28 | 4 | 3,681 | ||||||||||
6.375%, 3/01/25 | 27 | 27,286 | ||||||||||
6.50%,1/15/24-1/15/26 | 136 | 139,431 | ||||||||||
Telecom Italia Capital SA | 56 | 49,821 | ||||||||||
7.20%, 7/18/36 | 33 | 31,167 | ||||||||||
7.721%, 6/04/38 | 76 | 75,130 | ||||||||||
Uniti Group LP/Uniti Group Finance, Inc./CSL Capital LLC | 29 | 26,390 | ||||||||||
Zayo Group LLC/Zayo Capital, Inc. | 76 | 67,532 | ||||||||||
|
| |||||||||||
| 2,308,539 | ||||||||||||
|
| |||||||||||
| 18 | AB FLEXFEE HIGH YIELD PORTFOLIO | abfunds.com | |
PORTFOLIO OF INVESTMENTS(continued)
| Principal Amount (000) | U.S. $ Value | |||||||||||
| ||||||||||||
Consumer Cyclical - Automotive – 1.7% | ||||||||||||
American Axle & Manufacturing, Inc. | U.S.$ | 90 | $ | 81,768 | ||||||||
BCD Acquisition, Inc. | 69 | 71,390 | ||||||||||
Cooper-Standard Automotive, Inc. | 5 | 4,395 | ||||||||||
Exide Technologies | 100 | 55,229 | ||||||||||
11.00%, 4/30/22(b)(g)(i) | 48 | 38,264 | ||||||||||
IHO Verwaltungs GmbH | 58 | 55,532 | ||||||||||
Meritor, Inc. | 30 | 28,723 | ||||||||||
Navistar International Corp. | 43 | 41,556 | ||||||||||
Tenneco, Inc. | 64 | 49,128 | ||||||||||
Tesla, Inc. | 49 | 42,626 | ||||||||||
Titan International, Inc. | 47 | 41,935 | ||||||||||
|
| |||||||||||
| 510,546 | ||||||||||||
|
| |||||||||||
Consumer Cyclical - Entertainment – 0.6% | ||||||||||||
AMC Entertainment Holdings, Inc. | 7 | 5,790 | ||||||||||
5.875%, 11/15/26 | 6 | 5,142 | ||||||||||
Cinemark USA, Inc. | 25 | 24,000 | ||||||||||
National CineMedia LLC | 21 | 18,561 | ||||||||||
NCL Corp., Ltd. | 12 | 11,978 | ||||||||||
Silversea Cruise Finance Ltd. | 34 | 36,028 | ||||||||||
Six Flags Entertainment Corp. | 20 | 18,942 | ||||||||||
VOC Escrow Ltd. | 52 | 48,222 | ||||||||||
|
| |||||||||||
| 168,663 | ||||||||||||
|
| |||||||||||
Consumer Cyclical - Other – 5.9% | ||||||||||||
Beazer Homes USA, Inc. | 16 | 12,640 | ||||||||||
6.75%, 3/15/25 | 34 | 29,434 | ||||||||||
8.75%, 3/15/22 | 18 | 17,567 | ||||||||||
| abfunds.com | AB FLEXFEE HIGH YIELD PORTFOLIO | 19 | |
PORTFOLIO OF INVESTMENTS(continued)
| Principal Amount (000) | U.S. $ Value | |||||||||
| ||||||||||
Caesars Entertainment Corp. | U.S.$ | 11 | $ | 13,297 | ||||||
Eldorado Resorts, Inc. | 37 | 35,711 | ||||||||
Five Point Operating Co. LP/Five Point Capital Corp. | 55 | 53,022 | ||||||||
Hilton Domestic Operating Co., Inc. | 95 | 89,864 | ||||||||
5.125%, 5/01/26(a) | 30 | 28,767 | ||||||||
K. Hovnanian Enterprises, Inc. | 43 | 34,049 | ||||||||
10.00%, 7/15/22(a) | 22 | 19,303 | ||||||||
10.50%, 7/15/24(a) | 7 | 5,812 | ||||||||
KB Home | 22 | 22,562 | ||||||||
7.50%, 9/15/22 | 10 | 10,512 | ||||||||
8.00%, 3/15/20 | 6 | 6,022 | ||||||||
Lennar Corp. | 74 | 71,234 | ||||||||
4.50%,11/15/19-4/30/24 | 103 | 100,624 | ||||||||
4.75%, 11/29/27 | 55 | 49,924 | ||||||||
6.25%, 12/15/21(a) | 1 | 742 | ||||||||
6.25%, 12/15/21 | 22 | 22,400 | ||||||||
8.375%, 1/15/21 | 20 | 21,268 | ||||||||
Marriott Ownership Resorts, Inc./ILG LLC | 72 | 69,428 | ||||||||
MDC Holdings, Inc. | 36 | 34,395 | ||||||||
5.625%, 2/01/20 | 23 | 23,693 | ||||||||
6.00%, 1/15/43 | 70 | 54,615 | ||||||||
Meritage Homes Corp. | 29 | 30,252 | ||||||||
MGM Resorts International | 35 | 31,456 | ||||||||
5.75%, 6/15/25 | 4 | 3,864 | ||||||||
6.00%, 3/15/23 | 20 | 20,065 | ||||||||
6.75%, 10/01/20 | 25 | 25,716 | ||||||||
7.75%, 3/15/22 | 16 | 17,006 | ||||||||
8.625%, 2/01/19 | 45 | 45,242 | ||||||||
PulteGroup, Inc. | 128 | 116,245 | ||||||||
5.50%, 3/01/26 | 4 | 3,860 | ||||||||
6.00%, 2/15/35 | 57 | 49,806 | ||||||||
7.875%, 6/15/32 | 17 | 18,158 | ||||||||
Scientific Games International, Inc. | 8 | 8,106 | ||||||||
| 20 | AB FLEXFEE HIGH YIELD PORTFOLIO | abfunds.com | |
PORTFOLIO OF INVESTMENTS(continued)
| Principal Amount (000) | U.S. $ Value | |||||||||||
| ||||||||||||
Shea Homes LP/Shea Homes Funding Corp. | U.S.$ | 50 | $ | 45,653 | ||||||||
6.125%, 4/01/25(a) | 60 | 53,430 | ||||||||||
Standard Industries, Inc./NJ | 64 | 53,427 | ||||||||||
5.375%, 11/15/24(a) | 68 | 64,023 | ||||||||||
5.50%, 2/15/23(a) | 26 | 25,464 | ||||||||||
6.00%, 10/15/25(a) | 39 | 36,715 | ||||||||||
Stars Group Holdings BV/Stars Group USCo-Borrower LLC | 33 | 31,894 | ||||||||||
Sugarhouse HSP Gaming Prop Mezz LP/Sugarhouse HSP Gaming Finance Corp. | 16 | 14,763 | ||||||||||
Taylor Morrison Communities, Inc./Taylor Morrison Holdings II, Inc. | 17 | 16,611 | ||||||||||
5.875%, 4/15/23(a) | 8 | 7,720 | ||||||||||
Toll Brothers Finance Corp. | 93 | 84,697 | ||||||||||
5.875%, 2/15/22 | 35 | 35,421 | ||||||||||
Wyndham Hotels & Resorts, Inc. | 25 | 23,716 | ||||||||||
Wynn Las Vegas LLC/Wynn Las Vegas Capital Corp. | 4 | 3,530 | ||||||||||
5.50%, 3/01/25(a) | 124 | 116,521 | ||||||||||
|
| |||||||||||
| 1,810,246 | ||||||||||||
|
| |||||||||||
Consumer Cyclical - Restaurants – 0.3% | ||||||||||||
Golden Nugget, Inc. | 14 | 13,438 | ||||||||||
IRB Holding Corp. | 92 | 79,984 | ||||||||||
|
| |||||||||||
| 93,422 | ||||||||||||
|
| |||||||||||
Consumer Cyclical - Retailers – 1.6% | ||||||||||||
Asbury Automotive Group, Inc. | 51 | 49,242 | ||||||||||
FirstCash, Inc. | 7 | 6,834 | ||||||||||
Group 1 Automotive, Inc. | 79 | 73,818 | ||||||||||
Hanesbrands, Inc. | 50 | 46,841 | ||||||||||
JC Penney Corp., Inc. | 15 | 5,111 | ||||||||||
| abfunds.com | AB FLEXFEE HIGH YIELD PORTFOLIO | 21 | |
PORTFOLIO OF INVESTMENTS(continued)
| Principal Amount (000) | U.S. $ Value | |||||||||||
| ||||||||||||
L Brands, Inc. | U.S.$ | 19 | $ | 16,240 | ||||||||
5.625%,2/15/22-10/15/23 | 38 | 37,613 | ||||||||||
6.875%, 11/01/35 | 73 | 61,288 | ||||||||||
7.00%, 5/01/20 | 44 | 44,932 | ||||||||||
Penske Automotive Group, Inc. | 14 | 13,704 | ||||||||||
5.50%, 5/15/26 | 52 | 48,359 | ||||||||||
5.75%, 10/01/22 | 14 | 13,944 | ||||||||||
PetSmart, Inc. | 60 | 34,766 | ||||||||||
Sonic Automotive, Inc. | 32 | 29,172 | ||||||||||
6.125%, 3/15/27 | 20 | 16,880 | ||||||||||
|
| |||||||||||
| 498,744 | ||||||||||||
|
| |||||||||||
ConsumerNon-Cyclical – 11.2% | ||||||||||||
Air Medical Group Holdings, Inc. | 49 | 41,748 | ||||||||||
Albertsons Cos. LLC/Safeway, Inc./New Albertsons LP/Albertson’s LLC | 145 | 127,292 | ||||||||||
6.625%, 6/15/24 | 22 | 20,591 | ||||||||||
Avantor, Inc. | 74 | 73,958 | ||||||||||
Aveta, Inc. | 297 | – 0 | – | |||||||||
Avon Products, Inc. | 12 | 11,940 | ||||||||||
Bausch Health Cos., Inc. | 102 | 92,830 | ||||||||||
5.625%, 12/01/21(a) | 122 | 120,589 | ||||||||||
5.875%, 5/15/23(a) | 155 | 142,984 | ||||||||||
Charles River Laboratories International, Inc. | 5 | 4,938 | ||||||||||
CHS/Community Health Systems, Inc. | 79 | 73,484 | ||||||||||
6.25%, 3/31/23 | 28 | 25,470 | ||||||||||
8.125%, 6/30/24(a) | 63 | 45,447 | ||||||||||
DaVita, Inc. | 88 | 79,847 | ||||||||||
5.125%, 7/15/24 | 85 | 79,681 | ||||||||||
5.75%, 8/15/22 | 14 | 13,972 | ||||||||||
Dean Foods Co. | 7 | 5,637 | ||||||||||
Eagle Holding Co. II LLC | 99 | 94,987 | ||||||||||
| 22 | AB FLEXFEE HIGH YIELD PORTFOLIO | abfunds.com | |
PORTFOLIO OF INVESTMENTS(continued)
| Principal Amount (000) | U.S. $ Value | |||||||||
| ||||||||||
Encompass Health Corp. | U.S.$ | 30 | $ | 29,060 | ||||||
Endo Finance LLC | 87 | 72,847 | ||||||||
Endo Finance LLC/Endo Finco, Inc. | 81 | 61,015 | ||||||||
Envision Healthcare Corp. | 5 | 4,329 | ||||||||
First Quality Finance Co., Inc. | 83 | 80,194 | ||||||||
Hadrian Merger Sub, Inc. | 40 | 35,993 | ||||||||
HCA, Inc. | 142 | 142,059 | ||||||||
4.50%, 2/15/27 | 105 | 99,900 | ||||||||
4.75%, 5/01/23 | 108 | 106,360 | ||||||||
5.00%, 3/15/24 | 32 | 31,758 | ||||||||
5.375%, 9/01/26 | 33 | 32,103 | ||||||||
5.625%, 9/01/28 | 35 | 33,834 | ||||||||
5.875%, 2/15/26 | 54 | 54,191 | ||||||||
6.50%, 2/15/20 | 157 | 161,045 | ||||||||
Immucor, Inc. | 20 | 20,164 | ||||||||
Kinetic Concepts, Inc./KCI USA, Inc. | 146 | 147,562 | ||||||||
Mallinckrodt International Finance SA/Mallinckrodt CB LLC | 25 | 17,579 | ||||||||
5.625%, 10/15/23(a) | 32 | 24,354 | ||||||||
5.75%, 8/01/22(a) | 99 | 84,662 | ||||||||
MEDNAX, Inc. | 107 | 105,047 | ||||||||
Ortho-Clinical Diagnostics, Inc./Ortho-Clinical Diagnostics SA | 14 | 12,510 | ||||||||
Post Holdings, Inc. | 54 | 49,730 | ||||||||
RegionalCare Hospital Partners Holdings, Inc. | 51 | 51,514 | ||||||||
RegionalCare Hospital Partners Holdings, Inc./LifePoint Health, Inc. | 96 | 91,427 | ||||||||
Spectrum Brands Holdings, Inc. | 133 | 135,111 | ||||||||
Spectrum Brands, Inc. | 19 | 19,164 | ||||||||
| abfunds.com | AB FLEXFEE HIGH YIELD PORTFOLIO | 23 | |
PORTFOLIO OF INVESTMENTS(continued)
| Principal Amount (000) | U.S. $ Value | |||||||||||
| ||||||||||||
Tenet Healthcare Corp. | U.S.$ | 25 | $ | 24,205 | ||||||||
4.50%, 4/01/21 | 48 | 46,520 | ||||||||||
6.00%, 10/01/20 | 85 | 85,704 | ||||||||||
6.75%, 6/15/23 | 98 | 91,999 | ||||||||||
7.00%, 8/01/25 | 4 | 3,716 | ||||||||||
7.50%, 1/01/22(a) | 19 | 18,816 | ||||||||||
8.125%, 4/01/22 | 130 | 130,552 | ||||||||||
Valeant Pharmaceuticals International | 120 | 116,259 | ||||||||||
Vizient, Inc. | 117 | 123,672 | ||||||||||
|
| |||||||||||
| 3,400,350 | ||||||||||||
|
| |||||||||||
Energy – 13.7% | ||||||||||||
Alta Mesa Holdings LP/Alta Mesa Finance Services Corp. | 76 | 48,224 | ||||||||||
Antero Resources Corp. | 30 | 27,157 | ||||||||||
5.625%, 6/01/23 | 50 | 47,625 | ||||||||||
Berry Petroleum Co. LLC | 56 | – 0 | – | |||||||||
7.00%, 2/15/26(a) | 25 | 22,349 | ||||||||||
Bristow Group, Inc. | 39 | 27,991 | ||||||||||
Bruin E&P Partners LLC | 67 | 59,600 | ||||||||||
California Resources Corp. | 19 | 13,395 | ||||||||||
8.00%, 12/15/22(a) | 148 | 99,988 | ||||||||||
Carrizo Oil & Gas, Inc. | 107 | 98,877 | ||||||||||
8.25%, 7/15/25 | 8 | 7,875 | ||||||||||
Cheniere Corpus Christi Holdings LLC | 74 | 73,258 | ||||||||||
Cheniere Energy Partners LP | 68 | 63,975 | ||||||||||
Chesapeake Energy Corp. | 37 | 32,232 | ||||||||||
5.75%, 3/15/23 | 20 | 17,288 | ||||||||||
6.125%, 2/15/21 | 68 | 64,729 | ||||||||||
6.875%, 11/15/20 | 1 | 569 | ||||||||||
8.00%,1/15/25-6/15/27 | 121 | 102,487 | ||||||||||
Covey Park Energy LLC/Covey Park Finance Corp. | 141 | 122,991 | ||||||||||
DCP Midstream Operating LP | 35 | 34,654 | ||||||||||
| 24 | AB FLEXFEE HIGH YIELD PORTFOLIO | abfunds.com | |
PORTFOLIO OF INVESTMENTS(continued)
| Principal Amount (000) | U.S. $ Value | |||||||||
| ||||||||||
Denbury Resources, Inc. | U.S.$ | 39 | $ | 31,394 | ||||||
9.00%, 5/15/21(a) | 20 | 18,700 | ||||||||
9.25%, 3/31/22(a) | 72 | 66,554 | ||||||||
Diamond Offshore Drilling, Inc. | 68 | 38,241 | ||||||||
7.875%, 8/15/25 | 62 | 51,470 | ||||||||
Energy Transfer LP | 87 | 83,901 | ||||||||
7.50%, 10/15/20 | 18 | 18,444 | ||||||||
Ensco PLC | 7 | 4,373 | ||||||||
5.20%, 3/15/25 | 136 | 90,495 | ||||||||
EP Energy LLC/Everest Acquisition Finance, Inc. | 78 | 31,530 | ||||||||
9.375%, 5/01/24(a) | 131 | 57,795 | ||||||||
Genesis Energy LP/Genesis Energy Finance Corp. | 45 | 38,646 | ||||||||
6.25%, 5/15/26 | 98 | 84,249 | ||||||||
6.50%, 10/01/25 | 47 | 41,483 | ||||||||
6.75%, 8/01/22 | 12 | 11,759 | ||||||||
Gulfport Energy Corp. | 125 | 110,625 | ||||||||
6.375%,5/15/25-1/15/26 | 79 | 69,186 | ||||||||
Hess Infrastructure Partners LP/Hess Infrastructure Partners Finance Corp. | 128 | 124,447 | ||||||||
HighPoint Operating Corp. | 87 | 79,314 | ||||||||
8.75%, 6/15/25 | 25 | 23,608 | ||||||||
Hilcorp Energy I LP/Hilcorp Finance Co. | 7 | 6,220 | ||||||||
5.75%, 10/01/25(a) | 127 | 113,556 | ||||||||
Indigo Natural Resources LLC | 142 | 122,294 | ||||||||
Murphy Oil Corp. | 26 | 24,229 | ||||||||
5.875%, 12/01/42(l) | 21 | 16,460 | ||||||||
Murphy Oil USA, Inc. | 2 | 2,249 | ||||||||
Nabors Industries, Inc. | 54 | 48,590 | ||||||||
5.00%, 9/15/20 | 9 | 8,606 | ||||||||
5.50%, 1/15/23 | 104 | 82,314 | ||||||||
5.75%, 2/01/25 | 35 | 26,414 | ||||||||
| abfunds.com | AB FLEXFEE HIGH YIELD PORTFOLIO | 25 | |
PORTFOLIO OF INVESTMENTS(continued)
| Principal Amount (000) | U.S. $ Value | |||||||||||
| ||||||||||||
Nine Energy Service, Inc. | U.S.$ | 41 | $ | 38,874 | ||||||||
Noble Holding International Ltd. | 77 | 58,907 | ||||||||||
7.95%, 4/01/25 | 20 | 14,881 | ||||||||||
Oasis Petroleum, Inc. | 9 | 8,314 | ||||||||||
Parkland Fuel Corp. | 67 | 62,869 | ||||||||||
PBF Holding Co. LLC/PBF Finance Corp. | 13 | 12,337 | ||||||||||
PDC Energy, Inc. | 71 | 62,928 | ||||||||||
Precision Drilling Corp. | 48 | 41,741 | ||||||||||
QEP Resources, Inc. | 100 | 88,892 | ||||||||||
5.375%, 10/01/22 | 34 | 30,689 | ||||||||||
Range Resources Corp. | 22 | 17,785 | ||||||||||
5.00%,8/15/22-3/15/23 | 166 | 147,467 | ||||||||||
5.875%, 7/01/22 | 2 | 1,859 | ||||||||||
Rowan Cos., Inc. | 10 | 7,396 | ||||||||||
5.85%, 1/15/44 | 35 | 21,165 | ||||||||||
Sable Permian Resources Land LLC/AEPB Finance Corp. | 13 | 3,098 | ||||||||||
Sanchez Energy Corp. | 45 | 7,977 | ||||||||||
7.25%, 2/15/23(a) | 45 | 36,675 | ||||||||||
7.75%, 6/15/21 | 20 | 4,659 | ||||||||||
SandRidge Energy, Inc. | 29 | – 0 | – | |||||||||
8.125%, 10/15/22(b)(c)(d)(f) | 47 | – 0 | – | |||||||||
SemGroup Corp. | 16 | 14,817 | ||||||||||
7.25%, 3/15/26 | 24 | 22,483 | ||||||||||
SemGroup Corp./Rose Rock Finance Corp. | 65 | 59,651 | ||||||||||
SM Energy Co. | 25 | 21,861 | ||||||||||
5.625%, 6/01/25 | 35 | 30,450 | ||||||||||
6.125%, 11/15/22 | 24 | 22,680 | ||||||||||
6.625%, 1/15/27 | 39 | 34,515 | ||||||||||
Southern Star Central Corp. | 35 | 33,569 | ||||||||||
| 26 | AB FLEXFEE HIGH YIELD PORTFOLIO | abfunds.com | |
PORTFOLIO OF INVESTMENTS(continued)
| Principal Amount (000) | U.S. $ Value | |||||||||||
| ||||||||||||
SRC Energy, Inc. | U.S.$ | 23 | $ | 19,257 | ||||||||
Sunoco LP/Sunoco Finance Corp. | 40 | 39,078 | ||||||||||
5.50%, 2/15/26 | 109 | 102,853 | ||||||||||
5.875%, 3/15/28 | 67 | 62,771 | ||||||||||
Targa Resources Partners LP/Targa Resources Partners Finance Corp. | 16 | 15,918 | ||||||||||
4.25%, 11/15/23 | 19 | 17,309 | ||||||||||
Transocean Phoenix 2 Ltd. | 41 | 40,658 | ||||||||||
Transocean, Inc. | 102 | 68,849 | ||||||||||
7.50%, 1/15/26(a) | 18 | 15,822 | ||||||||||
9.00%, 7/15/23(a) | 39 | 39,270 | ||||||||||
Vantage Drilling International | 46 | – 0 | – | |||||||||
Vine Oil & Gas LP/Vine Oil & Gas Finance Corp. | 61 | 47,687 | ||||||||||
Weatherford International LLC | 31 | 18,714 | ||||||||||
Weatherford International Ltd. | 10 | 5,875 | ||||||||||
5.875%, 7/01/21(k) | 35 | 22,064 | ||||||||||
7.75%, 6/15/21 | 66 | 49,615 | ||||||||||
9.875%, 2/15/24 | 73 | 44,653 | ||||||||||
Whiting Petroleum Corp. | 28 | 26,172 | ||||||||||
5.75%, 3/15/21 | 105 | 99,894 | ||||||||||
6.25%, 4/01/23 | 9 | 8,202 | ||||||||||
6.625%, 1/15/26 | 25 | 21,380 | ||||||||||
WPX Energy, Inc. | 27 | 24,606 | ||||||||||
|
| |||||||||||
| 4,191,596 | ||||||||||||
|
| |||||||||||
Other Industrial – 1.8% | ||||||||||||
Algeco Global Finance PLC | EUR | 100 | 111,983 | |||||||||
American Builders & Contractors Supply Co., Inc. | U.S.$ | 25 | 24,790 | |||||||||
American Tire Distributors, Inc. | 112 | 17,090 | ||||||||||
Global Partners LP/GLP Finance Corp. | 105 | 99,033 | ||||||||||
7.00%, 6/15/23 | 40 | 38,645 | ||||||||||
| abfunds.com | AB FLEXFEE HIGH YIELD PORTFOLIO | 27 | |
PORTFOLIO OF INVESTMENTS(continued)
| Principal Amount (000) | U.S. $ Value | |||||||||||
| ||||||||||||
H&E Equipment Services, Inc. | U.S.$ | 20 | $ | 18,326 | ||||||||
KAR Auction Services, Inc. | 66 | 59,565 | ||||||||||
Laureate Education, Inc. | 61 | 62,906 | ||||||||||
Rexel SA | EUR | 100 | 113,533 | |||||||||
|
| |||||||||||
| 545,871 | ||||||||||||
|
| |||||||||||
Services – 2.8% | ||||||||||||
ADT Security Corp. (The) | U.S.$ | 69 | 64,119 | |||||||||
4.125%, 6/15/23 | 49 | 44,835 | ||||||||||
4.875%, 7/15/32(a) | 108 | 80,701 | ||||||||||
Aptim Corp. | 25 | 18,959 | ||||||||||
APX Group, Inc. | 151 | 142,620 | ||||||||||
8.75%, 12/01/20 | 29 | 28,062 | ||||||||||
Aramark Services, Inc. | 26 | 24,997 | ||||||||||
5.125%, 1/15/24 | 7 | 6,645 | ||||||||||
Carriage Services, Inc. | 30 | 29,513 | ||||||||||
GEO Group, Inc. (The) | 18 | 16,021 | ||||||||||
5.875%,1/15/22-10/15/24 | 42 | 40,581 | ||||||||||
6.00%, 4/15/26 | 8 | 7,020 | ||||||||||
Monitronics International, Inc. | 14 | 3,490 | ||||||||||
Nielsen Co. Luxembourg SARL (The) | 28 | 27,849 | ||||||||||
Nielsen Finance LLC/Nielsen Finance Co. | 30 | 28,798 | ||||||||||
Prime Security Services Borrower LLC/Prime Finance, Inc. | 73 | 75,594 | ||||||||||
Refinitiv US Holdings, Inc. | 23 | 22,136 | ||||||||||
8.25%, 11/15/26(a) | 18 | 16,449 | ||||||||||
Ritchie Bros Auctioneers, Inc. | 12 | 11,749 | ||||||||||
Sabre GLBL, Inc. | 79 | 78,071 | ||||||||||
Team Health Holdings, Inc. | 81 | 65,897 | ||||||||||
| 28 | AB FLEXFEE HIGH YIELD PORTFOLIO | abfunds.com | |
PORTFOLIO OF INVESTMENTS(continued)
| Principal Amount (000) | U.S. $ Value | |||||||||||
| ||||||||||||
Verscend Escrow Corp. | U.S.$ | 34 | $ | 31,954 | ||||||||
|
| |||||||||||
| 866,060 | ||||||||||||
|
| |||||||||||
Technology – 2.6% | ||||||||||||
Amkor Technology, Inc. | 20 | 19,972 | ||||||||||
Banff Merger Sub, Inc. | 111 | 101,580 | ||||||||||
CDK Global, Inc. | 50 | 49,944 | ||||||||||
Conduent Finance, Inc./Conduent Business Services LLC | 0 | ** | 162 | |||||||||
Dell International LLC/EMC Corp. | 59 | 59,109 | ||||||||||
Dell, Inc. | 53 | 55,060 | ||||||||||
First Data Corp. | 81 | 79,476 | ||||||||||
5.75%, 1/15/24(a) | 60 | 58,473 | ||||||||||
Genesys Telecommunications Laboratories, Inc./Greeneden Lux 3 SARL/Greeneden US Ho | 7 | 7,333 | ||||||||||
Goodman Networks, Inc. | 20 | 9,748 | ||||||||||
Harland Clarke Holdings Corp. | 18 | 15,948 | ||||||||||
Infor Software Parent LLC/Infor Software Parent, Inc. | 4 | 3,889 | ||||||||||
Infor US, Inc. | 78 | 75,135 | ||||||||||
IQVIA, Inc. | 27 | 26,501 | ||||||||||
Iron Mountain, Inc. | 20 | 20,194 | ||||||||||
Nokia Oyj | 16 | 15,156 | ||||||||||
6.625%, 5/15/39 | 64 | 64,948 | ||||||||||
Rackspace Hosting, Inc. | 17 | 13,257 | ||||||||||
Sanmina Corp. | 8 | 8,421 | ||||||||||
Solera LLC/Solera Finance, Inc. | 32 | 34,426 | ||||||||||
| abfunds.com | AB FLEXFEE HIGH YIELD PORTFOLIO | 29 | |
PORTFOLIO OF INVESTMENTS(continued)
| Principal Amount (000) | U.S. $ Value | |||||||||||
| ||||||||||||
West Corp. | U.S.$ | 19 | $ | 15,295 | ||||||||
Western Digital Corp. | 58 | 50,314 | ||||||||||
Xerox Corp. | 18 | 16,169 | ||||||||||
|
| |||||||||||
| 800,510 | ||||||||||||
|
| |||||||||||
Transportation - Services – 1.9% | ||||||||||||
Avis Budget Car Rental LLC/Avis Budget Finance, Inc. | 77 | 74,842 | ||||||||||
EC Finance PLC | EUR | 100 | 111,621 | |||||||||
Herc Rentals, Inc. | U.S.$ | 8 | 8,773 | |||||||||
Hertz Corp. (The) | 29 | 21,247 | ||||||||||
5.875%, 10/15/20 | 11 | 10,686 | ||||||||||
6.25%, 10/15/22 | 20 | 17,257 | ||||||||||
7.375%, 1/15/21 | 104 | 101,087 | ||||||||||
7.625%, 6/01/22(a) | 39 | 36,854 | ||||||||||
Park Aerospace Holdings Ltd. | 15 | 14,069 | ||||||||||
5.25%, 8/15/22(a) | 30 | 29,120 | ||||||||||
United Rentals North America, Inc. | 20 | 19,649 | ||||||||||
5.75%, 11/15/24 | 48 | 46,186 | ||||||||||
6.50%, 12/15/26 | 54 | 53,190 | ||||||||||
XPO Logistics, Inc. | 48 | 46,532 | ||||||||||
|
| |||||||||||
| 591,113 | ||||||||||||
|
| |||||||||||
| 21,449,231 | ||||||||||||
|
| |||||||||||
Financial Institutions – 7.2% | ||||||||||||
Banking – 2.4% | ||||||||||||
Ally Financial, Inc. | 19 | 18,989 | ||||||||||
8.00%, 11/01/31 | 151 | 168,235 | ||||||||||
Barclays Bank PLC | 15 | 15,033 | ||||||||||
Barclays PLC | 200 | 200,046 | ||||||||||
CIT Group, Inc. | 45 | 43,314 | ||||||||||
5.00%, 8/15/22 | 65 | 64,108 | ||||||||||
5.25%, 3/07/25 | 32 | 31,377 | ||||||||||
6.125%, 3/09/28 | 19 | 18,921 | ||||||||||
| 30 | AB FLEXFEE HIGH YIELD PORTFOLIO | abfunds.com | |
PORTFOLIO OF INVESTMENTS(continued)
| Principal Amount (000) | U.S. $ Value | |||||||||||
| ||||||||||||
Goldman Sachs Group, Inc. (The) | U.S.$ | 44 | $ | 37,065 | ||||||||
Royal Bank of Scotland Group PLC | 117 | 120,678 | ||||||||||
Societe Generale SA | 3 | 3,022 | ||||||||||
SunTrust Banks, Inc. | 10 | 8,476 | ||||||||||
|
| |||||||||||
| 729,264 | ||||||||||||
|
| |||||||||||
Brokerage – 0.2% |
| |||||||||||
Lehman Brothers Holdings, Inc. | 423 | 8,045 | ||||||||||
LPL Holdings, Inc. | 58 | 54,549 | ||||||||||
|
| |||||||||||
| 62,594 | ||||||||||||
|
| |||||||||||
Finance – 1.9% |
| |||||||||||
Compass Group Diversified Holdings LLC | 39 | 38,671 | ||||||||||
Curo Group Holdings Corp. | 61 | 47,569 | ||||||||||
Enova International, Inc. | 112 | 91,957 | ||||||||||
goeasy Ltd. | 13 | 13,182 | ||||||||||
Navient Corp. |
| |||||||||||
5.00%, 10/26/20 | 47 | 45,318 | ||||||||||
5.50%, 1/25/23 | 79 | 69,260 | ||||||||||
5.875%, 3/25/21 | 1 | 558 | ||||||||||
6.50%, 6/15/22 | 125 | 116,860 | ||||||||||
7.25%,1/25/22-9/25/23 | 32 | 29,819 | ||||||||||
8.00%, 3/25/20 | 51 | 51,481 | ||||||||||
SLM Corp. | 21 | 19,979 | ||||||||||
Springleaf Finance Corp. | 48 | 42,851 | ||||||||||
TMX Finance LLC/TitleMax Finance Corp. | 23 | 18,610 | ||||||||||
|
| |||||||||||
| 586,115 | ||||||||||||
|
| |||||||||||
Insurance – 1.1% |
| |||||||||||
Ambac Assurance Corp. | 2 | 2,679 | ||||||||||
Genworth Holdings, Inc. |
| |||||||||||
7.20%, 2/15/21 | 30 | 29,347 | ||||||||||
7.625%, 9/24/21 | 35 | 34,213 | ||||||||||
| abfunds.com | AB FLEXFEE HIGH YIELD PORTFOLIO | 31 | |
PORTFOLIO OF INVESTMENTS(continued)
| Principal Amount (000) | U.S. $ Value | |||||||||||
| ||||||||||||
Liberty Mutual Group, Inc. | U.S.$ | 61 | $ | 65,335 | ||||||||
Polaris Intermediate Corp. | 138 | 125,849 | ||||||||||
USIS Merger Sub, Inc. | 7 | 6,439 | ||||||||||
WellCare Health Plans, Inc. | 65 | 62,851 | ||||||||||
|
| |||||||||||
| 326,713 | ||||||||||||
|
| |||||||||||
Other Finance – 0.6% |
| |||||||||||
LHC3 PLC | EUR | 100 | 109,053 | |||||||||
NVA Holdings, Inc./United States | U.S.$ | 26 | 23,120 | |||||||||
Tempo Acquisition LLC/Tempo Acquisition Finance Corp. | 27 | 25,431 | ||||||||||
Travelport Corporate Finance PLC | 18 | 18,149 | ||||||||||
|
| |||||||||||
| 175,753 | ||||||||||||
|
| |||||||||||
REITS – 1.0% | ||||||||||||
Iron Mountain, Inc. | ||||||||||||
4.875%, 9/15/27(a) | 85 | 74,168 | ||||||||||
5.25%, 3/15/28(a) | 55 | 48,554 | ||||||||||
MGM Growth Properties Operating Partnership LP/MGP FinanceCo-Issuer, Inc. | 50 | 49,488 | ||||||||||
MPT Operating Partnership LP/MPT Finance Corp. | ||||||||||||
5.00%, 10/15/27 | 56 | 51,123 | ||||||||||
5.25%, 8/01/26 | 40 | 37,391 | ||||||||||
5.50%, 5/01/24 | 26 | 25,912 | ||||||||||
SBA Communications Corp. | ||||||||||||
4.00%, 10/01/22 | 15 | 14,295 | ||||||||||
4.875%, 9/01/24 | 8 | 7,588 | ||||||||||
|
| |||||||||||
| 308,519 | ||||||||||||
|
| |||||||||||
| 2,188,958 | ||||||||||||
|
| |||||||||||
Utility – 2.0% | ||||||||||||
Electric – 1.6% | ||||||||||||
AES Corp./VA | 54 | 53,083 | ||||||||||
Calpine Corp. | ||||||||||||
5.375%, 1/15/23 | 12 | 11,238 | ||||||||||
5.50%, 2/01/24 | 96 | 88,174 | ||||||||||
5.75%, 1/15/25 | 151 | 138,330 | ||||||||||
| 32 | AB FLEXFEE HIGH YIELD PORTFOLIO | abfunds.com | |
PORTFOLIO OF INVESTMENTS(continued)
| Principal Amount (000) | U.S. $ Value | |||||||||||
| ||||||||||||
Talen Energy Supply LLC | ||||||||||||
4.60%, 12/15/21 | U.S.$ | 1 | $ | 1,100 | ||||||||
6.50%, 6/01/25 | 77 | 54,634 | ||||||||||
10.50%, 1/15/26(a) | 36 | 30,492 | ||||||||||
Texas Competitive/TCEH | 59 | – 0 | – | |||||||||
Vistra Energy Corp. | ||||||||||||
5.875%, 6/01/23 | 8 | 7,590 | ||||||||||
7.375%, 11/01/22 | 115 | 118,274 | ||||||||||
7.625%, 11/01/24 | 7 | 7,089 | ||||||||||
|
| |||||||||||
| 510,004 | ||||||||||||
|
| |||||||||||
Natural Gas – 0.4% | ||||||||||||
NGL Energy Partners LP/NGL Energy Finance Corp. | 125 | 120,371 | ||||||||||
|
| |||||||||||
| 630,375 | ||||||||||||
|
| |||||||||||
Total Corporates –Non-Investment Grade | 24,268,564 | |||||||||||
|
| |||||||||||
CORPORATES – INVESTMENT GRADE – 8.0% | ||||||||||||
Financial Institutions – 5.0% | ||||||||||||
Banking – 1.6% | ||||||||||||
Bank of America Corp. | 46 | 57,322 | ||||||||||
Series DD | 22 | 22,361 | ||||||||||
Series Z | 2 | 2,052 | ||||||||||
BNP Paribas SA | 58 | 59,322 | ||||||||||
BPCE SA | 82 | 85,207 | ||||||||||
Credit Agricole SA | EUR | 100 | 116,740 | |||||||||
Goldman Sachs Group, Inc. (The) | 57 | 67,263 | ||||||||||
Santander Holdings USA, Inc. | U.S.$ | 28 | 26,431 | |||||||||
Standard Chartered PLC | 58 | 56,785 | ||||||||||
|
| |||||||||||
| 493,483 | ||||||||||||
|
| |||||||||||
| abfunds.com | AB FLEXFEE HIGH YIELD PORTFOLIO | 33 | |
PORTFOLIO OF INVESTMENTS(continued)
| Principal Amount (000) | U.S. $ Value | |||||||||||
| ||||||||||||
Insurance – 1.7% | ||||||||||||
ACE Capital Trust II | U.S.$ | 20 | $ | 26,371 | ||||||||
Allstate Corp. (The) | 10 | 10,766 | ||||||||||
American International Group, Inc. | 40 | 35,004 | ||||||||||
Aviva PLC | EUR | 100 | 110,681 | |||||||||
Berkshire Hathaway, Inc. | 100 | 115,202 | ||||||||||
CNP Assurances | 100 | 116,007 | ||||||||||
Nationwide Mutual Insurance Co. | U.S.$ | 31 | 46,283 | |||||||||
Prudential Financial, Inc. | 70 | 68,765 | ||||||||||
|
| |||||||||||
| �� | 529,079 | |||||||||||
|
| |||||||||||
REITS – 1.7% | ||||||||||||
EPR Properties | 55 | 56,674 | ||||||||||
GLP Capital LP/GLP Financing II, Inc. | ||||||||||||
4.375%, 4/15/21 | 6 | 5,766 | ||||||||||
4.875%, 11/01/20 | 8 | 7,659 | ||||||||||
5.25%, 6/01/25 | 30 | 29,879 | ||||||||||
5.375%,11/01/23-4/15/26 | 62 | 61,282 | ||||||||||
5.75%, 6/01/28 | 19 | 18,889 | ||||||||||
HCP, Inc. | ||||||||||||
3.875%, 8/15/24 | 50 | 49,073 | ||||||||||
4.20%, 3/01/24 | 9 | 9,003 | ||||||||||
Omega Healthcare Investors, Inc. | 47 | 47,093 | ||||||||||
Regency Centers LP | 55 | 54,034 | ||||||||||
Sabra Health Care LP | 59 | 54,251 | ||||||||||
Sabra Health Care LP/Sabra Capital Corp. | 31 | 31,210 | ||||||||||
Senior Housing Properties Trust | 9 | 9,160 | ||||||||||
Spirit Realty LP | 66 | 63,976 | ||||||||||
Ventas Realty LP | 15 | 14,835 | ||||||||||
|
| |||||||||||
| 512,784 | ||||||||||||
|
| |||||||||||
| 1,535,346 | ||||||||||||
|
| |||||||||||
| 34 | AB FLEXFEE HIGH YIELD PORTFOLIO | abfunds.com | |
PORTFOLIO OF INVESTMENTS(continued)
| Principal Amount (000) | U.S. $ Value | |||||||||||
| ||||||||||||
Industrial – 3.0% |
| |||||||||||
Basic – 0.4% |
| |||||||||||
ArcelorMittal | U.S.$ | 22 | $ | 22,697 | ||||||||
7.00%, 10/15/39 | 45 | 47,316 | ||||||||||
Glencore Finance Canada Ltd. | 5 | 4,549 | ||||||||||
Glencore Funding LLC | 5 | 4,719 | ||||||||||
4.125%, 5/30/23(a) | 45 | 44,554 | ||||||||||
|
| |||||||||||
| 123,835 | ||||||||||||
|
| |||||||||||
Capital Goods – 0.4% |
| |||||||||||
CNH Industrial Capital LLC | 26 | 25,574 | ||||||||||
4.375%, 4/05/22 | 33 | 33,353 | ||||||||||
General Electric Co. | 40 | 30,810 | ||||||||||
Masco Corp. | 13 | 14,136 | ||||||||||
7.125%, 3/15/20 | 1 | 771 | ||||||||||
|
| |||||||||||
| 104,644 | ||||||||||||
|
| |||||||||||
Consumer Cyclical - Other – 0.2% |
| |||||||||||
DR Horton, Inc. | 44 | 44,375 | ||||||||||
|
| |||||||||||
ConsumerNon-Cyclical – 0.2% |
| |||||||||||
Anheuser-Busch InBev Finance, Inc. | 15 | 14,341 | ||||||||||
Bayer US Finance II LLC | 56 | 53,310 | ||||||||||
|
| |||||||||||
| 67,651 | ||||||||||||
|
| |||||||||||
Energy – 1.3% |
| |||||||||||
Andeavor Logistics LP/Tesoro Logistics Finance Corp. | 8 | 8,155 | ||||||||||
Boardwalk Pipelines LP | 32 | 29,569 | ||||||||||
Cenovus Energy, Inc. | 10 | 9,479 | ||||||||||
3.80%, 9/15/23 | 39 | 37,551 | ||||||||||
4.25%, 4/15/27 | 9 | 8,196 | ||||||||||
4.45%, 9/15/42 | 31 | 23,709 | ||||||||||
6.75%, 11/15/39 | 1 | 1,432 | ||||||||||
Ecopetrol SA | 15 | 14,206 | ||||||||||
| abfunds.com | AB FLEXFEE HIGH YIELD PORTFOLIO | 35 | |
PORTFOLIO OF INVESTMENTS(continued)
| Principal Amount (000) | U.S. $ Value | |||||||||||
| ||||||||||||
Enable Midstream Partners LP | U.S.$ | 36 | $ | 34,265 | ||||||||
Energy Transfer Operating LP | 32 | 29,965 | ||||||||||
EQM Midstream Partners LP | 30 | 29,466 | ||||||||||
Hess Corp. | 42 | 38,502 | ||||||||||
Kinder Morgan, Inc./DE | 11 | 13,653 | ||||||||||
Marathon Oil Corp. | 34 | 37,361 | ||||||||||
MPLX LP | 31 | 29,539 | ||||||||||
Noble Energy, Inc. | 2 | 1,817 | ||||||||||
Phillips 66 Partners LP | 32 | 29,559 | ||||||||||
Sunoco Logistics Partners Operations LP | 30 | 27,449 | ||||||||||
|
| |||||||||||
| 403,873 | ||||||||||||
|
| |||||||||||
Services – 0.1% |
| |||||||||||
Expedia Group, Inc. | 30 | 27,231 | ||||||||||
|
| |||||||||||
Technology – 0.4% |
| |||||||||||
Broadcom Corp./Broadcom Cayman Finance Ltd. | 63 | 56,488 | ||||||||||
Dell International LLC/EMC Corp. | 32 | 32,608 | ||||||||||
Micron Technology, Inc. | 15 | 14,715 | ||||||||||
Seagate HDD Cayman | 28 | 24,898 | ||||||||||
4.875%, 6/01/27 | 5 | 3,876 | ||||||||||
|
| |||||||||||
| 132,585 | ||||||||||||
|
| |||||||||||
| 904,194 | ||||||||||||
|
| |||||||||||
Utility – 0.0% | ||||||||||||
Electric – 0.0% | ||||||||||||
DPL, Inc. | 13 | 13,269 | ||||||||||
|
| |||||||||||
Total Corporates – Investment Grade | 2,452,809 | |||||||||||
|
| |||||||||||
| 36 | AB FLEXFEE HIGH YIELD PORTFOLIO | abfunds.com | |
PORTFOLIO OF INVESTMENTS(continued)
| Principal Amount (000) | U.S. $ Value | |||||||||||
| ||||||||||||
BANK LOANS – 3.6% | ||||||||||||
Industrial – 3.6% | ||||||||||||
Basic – 0.1% | ||||||||||||
Foresight Energy LLC | U.S.$ | 12 | $ | 11,820 | ||||||||
Starfruit Finco B.V. (Starfruit US Holdco LLC) (fka AkzoNobel) | 10 | 9,550 | ||||||||||
|
| |||||||||||
| 21,370 | ||||||||||||
|
| |||||||||||
Capital Goods – 0.4% | ||||||||||||
Accudyne Industries Borrower S.C.A. / Accudyne Industries, LLC (fka Silver II US Holdings, LLC) | 18 | 17,053 | ||||||||||
Apex Tool Group, LLC | 60 | 57,962 | ||||||||||
Brookfield WEC Holdings Inc. (fka Westinghouse Electric Company LLC) | ||||||||||||
6.272% (LIBOR 1 Month + 3.75%), 8/01/25(n) | 29 | 28,273 | ||||||||||
9.272% (LIBOR 1 Month + 6.75%), 8/03/26(n) | 10 | 9,750 | ||||||||||
Gardner Denver, Inc. | 14 | 13,510 | ||||||||||
Honeywell Technologies SARL (fka Garrett Motion Inc.) | 8 | 7,987 | ||||||||||
|
| |||||||||||
| 134,535 | ||||||||||||
|
| |||||||||||
Communications - Telecommunications – 0.1% | ||||||||||||
Intelsat Jackson Holdings S.A. | ||||||||||||
6.625%, 1/02/24 | 6 | 6,179 | ||||||||||
7.006% (LIBOR 1 Month + 4.50%), 1/02/24(n) | 4 | 3,716 | ||||||||||
West Corporation | 30 | 27,071 | ||||||||||
|
| |||||||||||
| 36,966 | ||||||||||||
|
| |||||||||||
| abfunds.com | AB FLEXFEE HIGH YIELD PORTFOLIO | 37 | |
PORTFOLIO OF INVESTMENTS(continued)
| Principal Amount (000) | U.S. $ Value | |||||||||||
| ||||||||||||
Consumer Cyclical - Automotive – 0.0% | ||||||||||||
Navistar, Inc. | U.S.$ | 10 | $ | 9,303 | ||||||||
|
| |||||||||||
Consumer Cyclical - Entertainment – 0.1% | ||||||||||||
Seaworld Parks & Entertainment, Inc. (fka SW Acquisitions Co., Inc.) | 25 | 23,557 | ||||||||||
|
| |||||||||||
Consumer Cyclical - Other – 0.2% | ||||||||||||
Caesars Resort Collection, LLC (fka Caesars Growth Properties Holdings, LLC) | 38 | 36,845 | ||||||||||
Stars Group Holdings B.V. | 10 | 9,786 | ||||||||||
|
| |||||||||||
| 46,631 | ||||||||||||
|
| |||||||||||
Consumer Cyclical - Restaurants – 0.0% | ||||||||||||
IRB Holding Corp. (fka Arby’s / Buffalo Wild Wings) | 6 | 5,902 | ||||||||||
|
| |||||||||||
Consumer Cyclical - Retailers – 0.3% | ||||||||||||
Serta Simmons Bedding, LLC | 49 | 34,406 | ||||||||||
Specialty Building Products Holdings, LLC | 43 | 41,067 | ||||||||||
|
| |||||||||||
| 75,473 | ||||||||||||
|
| |||||||||||
ConsumerNon-Cyclical – 0.9% | ||||||||||||
Air Medical Group Holdings, Inc. | ||||||||||||
5.682% (LIBOR 1 Month + 3.25%), 4/28/22(n) | 21 | 19,877 | ||||||||||
6.754% (LIBOR 1 Month + 4.25%), 3/14/25(n) | 16 | 14,959 | ||||||||||
Alphabet Holding Company, Inc. (fka Nature’s Bounty) | 54 | 44,280 | ||||||||||
BI-LO, LLC | ||||||||||||
10.445% (LIBOR 3 Month + 8.00%), 5/31/24(n) | 34 | 32,112 | ||||||||||
| 38 | AB FLEXFEE HIGH YIELD PORTFOLIO | abfunds.com | |
PORTFOLIO OF INVESTMENTS(continued)
| Principal Amount (000) | U.S. $ Value | |||||||||||
| ||||||||||||
10.616% (LIBOR 3 Month + 8.00%), 5/31/24(n) | U.S.$ | 34 | $ | 32,112 | ||||||||
10.779% (LIBOR 3 Month + 8.00%), 5/31/24(n) | 32 | 30,632 | ||||||||||
Envision Healthcare Corporation | 29 | 26,561 | ||||||||||
Owens & Minor, Inc. | 29 | 22,185 | ||||||||||
Post Holdings, Inc. | 7 | 7,145 | ||||||||||
Regionalcare Hospital Partners Holdings, Inc. | 36 | 34,065 | ||||||||||
Vizient, Inc. | 1 | 630 | ||||||||||
|
| |||||||||||
| 264,558 | ||||||||||||
|
| |||||||||||
Energy – 0.4% | ||||||||||||
California Resources Corporation | 46 | 45,248 | ||||||||||
Triton Solar US Acquisition Co. | 88 | 81,774 | ||||||||||
|
| |||||||||||
| 127,022 | ||||||||||||
|
| |||||||||||
Other Industrial – 0.1% | ||||||||||||
American Tire Distributors, Inc. | 15 | 12,440 | ||||||||||
HD Supply Waterworks, Ltd. | ||||||||||||
5.707% (LIBOR 3 Month + 3.00%), 8/01/24(n) | 3 | 2,531 | ||||||||||
5.738% (LIBOR 3 Month + 3.00%), 8/01/24(n) | 2 | 2,242 | ||||||||||
Travelport Finance (Luxembourg) SARL | 23 | 22,176 | ||||||||||
|
| |||||||||||
| 39,389 | ||||||||||||
|
| |||||||||||
Services – 0.6% | ||||||||||||
Financial & Risk US Holdings, Inc. (fka Refinitiv) | 15 | 14,250 | ||||||||||
Monitronics International, Inc. | 69 | 61,236 | ||||||||||
| abfunds.com | AB FLEXFEE HIGH YIELD PORTFOLIO | 39 | |
PORTFOLIO OF INVESTMENTS(continued)
| Principal Amount (000) | U.S. $ Value | |||||||||||
| ||||||||||||
Pi Lux Finco SARL | U.S.$ | 100 | $ | 95,875 | ||||||||
Verscend Holding Corp. | 27 | 25,845 | ||||||||||
|
| |||||||||||
| 197,206 | ||||||||||||
|
| |||||||||||
Technology – 0.4% | ||||||||||||
Boxer Parent Company Inc. (fka BMC Software, Inc.) | 30 | 28,866 | ||||||||||
MTS Systems Corporation | 23 | 22,096 | ||||||||||
Solera, LLC (Solera Finance, Inc.) | 59 | 55,735 | ||||||||||
|
| |||||||||||
| 106,697 | ||||||||||||
|
| |||||||||||
Total Bank Loans | 1,088,609 | |||||||||||
|
| |||||||||||
| Shares | ||||||||||||
COMMON STOCKS – 1.7% | ||||||||||||
Energy – 0.8% | ||||||||||||
Energy Equipment & Services – 0.4% | ||||||||||||
Tervita Corp.(f) | 25,589 | 117,711 | ||||||||||
|
| |||||||||||
Oil, Gas & Consumable Fuels – 0.4% | ||||||||||||
Berry Petroleum Corp. | 3,917 | 34,274 | ||||||||||
CHC Group LLC(f)(j) | 1,219 | 4,876 | ||||||||||
Denbury Resources, Inc.(f) | 2,999 | 5,128 | ||||||||||
Halcon Resources Corp.(f) | 239 | 406 | ||||||||||
K201640219 (South Africa) Ltd. A Shares(b)(c)(d)(f) | 191,574 | – 0 | – | |||||||||
K201640219 (South Africa) Ltd. B Shares(b)(c)(d)(f) | 30,276 | – 0 | – | |||||||||
Oasis Petroleum, Inc.(f) | 972 | 5,375 | ||||||||||
Paragon Offshore Ltd. – Class A(b)(c)(f) | 267 | 234 | ||||||||||
Paragon Offshore Ltd. – Class B(b)(c)(f) | 401 | 13,634 | ||||||||||
Peabody Energy Corp. | 533 | 16,246 | ||||||||||
Roan Resources, Inc.(f) | 42 | 352 | ||||||||||
Triangle Petroleum Corp.(f) | 3,047 | 31 | ||||||||||
Vantage Drilling International(b)(c)(f) | 82 | 21,320 | ||||||||||
Whiting Petroleum Corp.(f) | 205 | 4,651 | ||||||||||
|
| |||||||||||
| 106,527 | ||||||||||||
|
| |||||||||||
| 224,238 | ||||||||||||
|
| |||||||||||
| 40 | AB FLEXFEE HIGH YIELD PORTFOLIO | abfunds.com | |
PORTFOLIO OF INVESTMENTS(continued)
| Company | Shares | U.S. $ Value | ||||||||||
| ||||||||||||
Consumer Discretionary – 0.4% | ||||||||||||
Auto Components – 0.0% | ||||||||||||
Exide Technologies(b)(d)(f)(j) | 1,793 | $ | 448 | |||||||||
|
| |||||||||||
Diversified Consumer Services – 0.0% | ||||||||||||
Ascent Capital Group, Inc. – Class A(f) | 539 | 210 | ||||||||||
Laureate Education, Inc. – Class A(f) | 757 | 11,537 | ||||||||||
|
| |||||||||||
| 11,747 | ||||||||||||
|
| |||||||||||
Hotels, Restaurants & Leisure – 0.2% | ||||||||||||
Caesars Entertainment Corp.(f) | 1,258 | 8,542 | ||||||||||
eDreams ODIGEO SA(f) | 12,845 | 34,953 | ||||||||||
|
| |||||||||||
| 43,495 | ||||||||||||
|
| |||||||||||
Household Durables – 0.2% | ||||||||||||
Hovnanian Enterprises, Inc. – Class A(f) | 3,276 | 2,240 | ||||||||||
M/I Homes, Inc.(f) | 728 | 15,303 | ||||||||||
MDC Holdings, Inc. | 614 | 17,260 | ||||||||||
Meritage Homes Corp.(f) | 469 | 17,222 | ||||||||||
Taylor Morrison Home Corp. – Class A(f) | 1,098 | 17,458 | ||||||||||
|
| |||||||||||
| 69,483 | ||||||||||||
|
| |||||||||||
Internet & Direct Marketing Retail – 0.0% | ||||||||||||
Travelport Worldwide Ltd. | 110 | 1,718 | ||||||||||
|
| |||||||||||
| 126,891 | ||||||||||||
|
| |||||||||||
Materials – 0.2% | ||||||||||||
Containers & Packaging – 0.0% | ||||||||||||
Westrock Co. | 6 | 227 | ||||||||||
|
| |||||||||||
Metals & Mining – 0.2% | ||||||||||||
BIS Industries Holdings Ltd.(b)(c)(d)(f) | 21,027 | 21 | ||||||||||
Constellium NV – Class A(f) | 3,216 | 22,480 | ||||||||||
Eldorado Gold Corp.(f) | 6,921 | 20,278 | ||||||||||
Neenah Enterprises, Inc.(b)(c)(d)(f) | 4,481 | 2,151 | ||||||||||
|
| |||||||||||
| 44,930 | ||||||||||||
|
| |||||||||||
| 45,157 | ||||||||||||
|
| |||||||||||
Information Technology – 0.1% | ||||||||||||
IT Services – 0.0% | ||||||||||||
Goodman Networks, Inc.(b)(c)(d)(f) | 1,236 | – 0 | – | |||||||||
|
| |||||||||||
Software – 0.1% | ||||||||||||
Avaya Holdings Corp.(f) | 2,740 | 39,894 | ||||||||||
|
| |||||||||||
| 39,894 | ||||||||||||
|
| |||||||||||
Communication Services – 0.1% | ||||||||||||
Media – 0.1% | ||||||||||||
Clear Channel Outdoor Holdings, Inc. – Class A | 3,060 | 15,881 | ||||||||||
| abfunds.com | AB FLEXFEE HIGH YIELD PORTFOLIO | 41 | |
PORTFOLIO OF INVESTMENTS(continued)
| Company | Shares | U.S. $ Value | ||||||||||
| ||||||||||||
DISH Network Corp. – Class A(f) | 100 | $ | 2,497 | |||||||||
|
| |||||||||||
| 18,378 | ||||||||||||
|
| |||||||||||
Wireless Telecommunication Services – 0.0% | ||||||||||||
T-Mobile US, Inc.(f) | 150 | 9,542 | ||||||||||
|
| |||||||||||
| 27,920 | ||||||||||||
|
| |||||||||||
Consumer Staples – 0.1% | ||||||||||||
Food & Staples Retailing – 0.1% | ||||||||||||
Southeastern Grocers, Inc. Npv(b)(c)(d)(f) | 828 | 27,738 | ||||||||||
|
| |||||||||||
Health Care – 0.0% | ||||||||||||
Pharmaceuticals – 0.0% | ||||||||||||
Endo International PLC(f) | 614 | 4,482 | ||||||||||
Horizon Pharma PLC(f) | 196 | 3,830 | ||||||||||
|
| |||||||||||
| 8,312 | ||||||||||||
|
| |||||||||||
Industrials – 0.0% | ||||||||||||
Construction & Engineering – 0.0% | ||||||||||||
Willscot Corp.(c)(d)(f) | 508 | 4,785 | ||||||||||
|
| |||||||||||
Energy Equipment & Services – 0.0% | ||||||||||||
Sanchez Energy Corp.(f) | 1,643 | 444 | ||||||||||
|
| |||||||||||
Trading Companies & Distributors – 0.0% | ||||||||||||
Emeco Holdings Ltd.(f) | 602 | 860 | ||||||||||
|
| |||||||||||
| 6,089 | ||||||||||||
|
| |||||||||||
Total Common Stocks | 506,239 | |||||||||||
|
| |||||||||||
| Principal Amount (000) | ||||||||||||
GOVERNMENTS – TREASURIES – 1.4% | ||||||||||||
Mexico – 0.2% | ||||||||||||
Mexican Bonos | MXN | 1,202 | 51,637 | |||||||||
Series M 20 | 480 | 25,918 | ||||||||||
|
| |||||||||||
| 77,555 | ||||||||||||
|
| |||||||||||
Russia – 0.2% | ||||||||||||
Russian Federal Bond – OFZ | RUB | 3,986 | 56,585 | |||||||||
|
| |||||||||||
United States – 1.0% | ||||||||||||
U.S. Treasury Notes | U.S.$ | 300 | 303,328 | |||||||||
|
| |||||||||||
Total Governments – Treasuries | 437,468 | |||||||||||
|
| |||||||||||
| 42 | AB FLEXFEE HIGH YIELD PORTFOLIO | abfunds.com | |
PORTFOLIO OF INVESTMENTS(continued)
| Principal Amount (000) | U.S. $ Value | |||||||||||
| ||||||||||||
EMERGING MARKETS – CORPORATE BONDS – 1.1% | ||||||||||||
Industrial – 1.0% | ||||||||||||
Basic – 0.2% | ||||||||||||
First Quantum Minerals Ltd. | U.S.$ | 13 | $ | 12,868 | ||||||||
7.25%, 4/01/23(a) | 58 | 51,303 | ||||||||||
|
| |||||||||||
| 64,171 | ||||||||||||
|
| |||||||||||
Communications - | ||||||||||||
Digicel Ltd. | 36 | 28,548 | ||||||||||
|
| |||||||||||
Consumer Cyclical - Retailers – 0.0% | ||||||||||||
Edcon Ltd. | EUR | 1 | – 0 | – | ||||||||
K2016470219 South Africa Ltd. | U.S.$ | 15 | 2 | |||||||||
K2016470260 South Africa Ltd. | 5 | 1,358 | ||||||||||
|
| |||||||||||
| 1,360 | ||||||||||||
|
| |||||||||||
ConsumerNon-Cyclical – 0.3% | ||||||||||||
Teva Pharmaceutical Finance Netherlands III | 38 | 37,779 | ||||||||||
2.80%, 7/21/23 | 9 | 7,718 | ||||||||||
3.15%, 10/01/26 | 63 | 48,352 | ||||||||||
Tonon Luxembourg SA | 6 | 129 | ||||||||||
Virgolino de Oliveira Finance SA | 96 | 5,896 | ||||||||||
|
| |||||||||||
| 99,874 | ||||||||||||
|
| |||||||||||
Energy – 0.4% | ||||||||||||
CHC Group LLC/CHC Finance Ltd. | 65 | 55,394 | ||||||||||
Petrobras Global Finance BV | 27 | 25,460 | ||||||||||
6.25%, 3/17/24 | 35 | 35,490 | ||||||||||
|
| |||||||||||
| 116,344 | ||||||||||||
|
| |||||||||||
Transportation – Airlines – 0.0% | ||||||||||||
Guanay Finance Ltd. | 4 | 4,361 | ||||||||||
|
| |||||||||||
| 314,658 | ||||||||||||
|
| |||||||||||
| abfunds.com | AB FLEXFEE HIGH YIELD PORTFOLIO | 43 | |
PORTFOLIO OF INVESTMENTS(continued)
| Principal Amount (000) | U.S. $ Value | |||||||||||
| ||||||||||||
Utility – 0.1% | ||||||||||||
Electric – 0.1% | ||||||||||||
Terraform Global Operating LLC | U.S.$ | 12 | $ | 11,099 | ||||||||
|
| |||||||||||
Financial Institutions – 0.0% | ||||||||||||
Insurance – 0.0% | ||||||||||||
Ambac LSNI LLC | 9 | 8,732 | ||||||||||
|
| |||||||||||
Total Emerging Markets – Corporate Bonds | 334,489 | |||||||||||
|
| |||||||||||
ASSET-BACKED SECURITIES – 0.8% | ||||||||||||
Other ABS - Fixed Rate – 0.4% | ||||||||||||
DB Master Finance LLC | 57 | 55,480 | ||||||||||
Taco Bell Funding LLC | 16 | 16,268 | ||||||||||
Wendy’s Funding LLC | 70 | 67,362 | ||||||||||
|
| |||||||||||
| 139,110 | ||||||||||||
|
| |||||||||||
Home Equity Loans - Fixed Rate – 0.4% | ||||||||||||
CWABS Asset-Backed Certificates Trust | 57 | �� | 56,492 | |||||||||
GSAA Home Equity Trust | 74 | 34,406 | ||||||||||
Lehman XS Trust | 21 | 20,420 | ||||||||||
|
| |||||||||||
| 111,318 | ||||||||||||
|
| |||||||||||
Total Asset-Backed Securities | 250,428 | |||||||||||
|
| |||||||||||
COLLATERALIZED MORTGAGE OBLIGATIONS – 0.8% | ||||||||||||
Risk Share Floating Rate – 0.7% | ||||||||||||
Federal Home Loan Mortgage Corp. Structured Agency Credit Risk Debt Notes | 14 | 16,683 | ||||||||||
| 44 | AB FLEXFEE HIGH YIELD PORTFOLIO | abfunds.com | |
PORTFOLIO OF INVESTMENTS(continued)
| Principal Amount (000) | U.S. $ Value | |||||||||||
| ||||||||||||
Series2013-DN2, Class M2 | U.S.$ | 47 | $ | 51,416 | ||||||||
Series2014-DN1, Class M3 | 36 | 40,840 | ||||||||||
Series2014-HQ2, Class M3 | 54 | 59,313 | ||||||||||
Federal National Mortgage Association Connecticut Avenue Securities | 14 | 16,133 | ||||||||||
Series2014-C01, Class M2 | 27 | 29,837 | ||||||||||
Series2015-C03, Class 1M2 | 5 | 5,742 | ||||||||||
Series2015-C03, Class 2M2 | 2 | 2,188 | ||||||||||
|
| |||||||||||
| 222,152 | ||||||||||||
|
| |||||||||||
Non-Agency Fixed Rate – 0.1% | ||||||||||||
Alternative Loan Trust | 6 | 4,381 | ||||||||||
CSMC Mortgage-Backed Trust | 7 | 5,563 | ||||||||||
|
| |||||||||||
| 9,944 | ||||||||||||
|
| |||||||||||
Total Collateralized Mortgage Obligations | 232,096 | |||||||||||
|
| |||||||||||
EMERGING MARKETS – | ||||||||||||
Argentina – 0.1% | ||||||||||||
Argentina POM Politica Monetaria | ARS | 748 | 21,129 | |||||||||
Argentine Bonos del Tesoro | 717 | 15,914 | ||||||||||
|
| |||||||||||
| 37,043 | ||||||||||||
|
| |||||||||||
| abfunds.com | AB FLEXFEE HIGH YIELD PORTFOLIO | 45 | |
PORTFOLIO OF INVESTMENTS(continued)
| Principal Amount (000) | U.S. $ Value | |||||||||||
| ||||||||||||
Brazil – 0.3% | ||||||||||||
Brazil Notas do Tesouro Nacional | BRL | 349 | $ | 94,184 | ||||||||
|
| |||||||||||
South Africa – 0.1% | ||||||||||||
Republic of South Africa Government Bond | ZAR | 283 | 19,385 | |||||||||
|
| |||||||||||
Total Emerging Markets – Treasuries | 150,612 | |||||||||||
|
| |||||||||||
LOCAL GOVERNMENTS – US MUNICIPAL BONDS – 0.3% | ||||||||||||
United States – 0.3% | ||||||||||||
State of California | U.S.$ | 25 | 36,069 | |||||||||
7.95%, 3/01/36 | 55 | 58,067 | ||||||||||
|
| |||||||||||
Total Local Governments – US Municipal Bonds | 94,136 | |||||||||||
|
| |||||||||||
COMMERCIAL MORTGAGE-BACKED SECURITIES – 0.2% | ||||||||||||
Non-Agency Fixed Rate CMBS – 0.2% | ||||||||||||
Citigroup Commercial Mortgage Trust | 15 | 12,997 | ||||||||||
GS Mortgage Securities Trust | 29 | 25,282 | ||||||||||
JPMBB Commercial Mortgage Securities Trust | 29 | 28,387 | ||||||||||
|
| |||||||||||
Total Commercial Mortgage-Backed Securities | 66,666 | |||||||||||
|
| |||||||||||
| Shares | ||||||||||||
INVESTMENT COMPANIES – 0.1% | ||||||||||||
Funds and Investment Trusts – 0.1% | ||||||||||||
iShares MSCI Global Metals & Mining | 805 | 21,719 | ||||||||||
|
| |||||||||||
| 46 | AB FLEXFEE HIGH YIELD PORTFOLIO | abfunds.com | |
PORTFOLIO OF INVESTMENTS(continued)
| Company | Shares | U.S. $ Value | ||||||||||
| ||||||||||||
PREFERRED STOCKS – 0.1% | ||||||||||||
Utility – 0.1% | ||||||||||||
Electric – 0.1% | ||||||||||||
SCE Trust III | 423 | $ | 9,788 | |||||||||
|
| |||||||||||
Financial Institutions – 0.0% | ||||||||||||
Banking – 0.0% | ||||||||||||
GMAC Capital Trust I | 357 | 9,050 | ||||||||||
|
| |||||||||||
Industrial – 0.0% | ||||||||||||
Consumer Cyclical - Other – 0.0% | ||||||||||||
Hovnanian Enterprises, Inc. | 490 | 1,225 | ||||||||||
|
| |||||||||||
Energy – 0.0% | ||||||||||||
Sanchez Energy Corp. | 962 | 991 | ||||||||||
Series B | 300 | 312 | ||||||||||
|
| |||||||||||
| 1,303 | ||||||||||||
|
| |||||||||||
Technology – 0.0% | ||||||||||||
Goodman Networks, Inc. | 1,470 | – 0 | – | |||||||||
|
| |||||||||||
| 2,528 | ||||||||||||
|
| |||||||||||
Total Preferred Stocks | 21,366 | |||||||||||
|
| |||||||||||
| Notional Amount | ||||||||||||
OPTIONS PURCHASED – CALLS – 0.0% | ||||||||||||
Swaptions – 0.0% | ||||||||||||
CDX-NAHY Series 31, 5 Year Index | USD | 345,000 | 120 | |||||||||
CDX-NAHY Series 31, 5 Year Index | 721,000 | 284 | ||||||||||
| abfunds.com | AB FLEXFEE HIGH YIELD PORTFOLIO | 47 | |
PORTFOLIO OF INVESTMENTS(continued)
| Notional Amount | U.S. $ Value | |||||||||||
| ||||||||||||
CDX-NAHY Series 31, 5 Year Index | USD | 960,000 | $ | 4,906 | ||||||||
|
| |||||||||||
Total Options Purchased – Calls | 5,310 | |||||||||||
|
| |||||||||||
| Shares | ||||||||||||
RIGHTS – 0.0% | ||||||||||||
Vistra Energy Corp., | 3,442 | 2,444 | ||||||||||
|
| |||||||||||
WARRANTS – 0.0% | ||||||||||||
Avaya Holdings Corp., | 1,210 | – 0 | – | |||||||||
Midstates Petroleum Co., Inc., | 860 | 129 | ||||||||||
SandRidge Energy, Inc.,A-CW22, | 1,975 | 138 | ||||||||||
SandRidge Energy, Inc.,B-CW22, | 830 | 83 | ||||||||||
Willscot Corp., | 787 | 921 | ||||||||||
|
| |||||||||||
Total Warrants | 1,271 | |||||||||||
|
| |||||||||||
SHORT-TERM INVESTMENTS – 0.3% | ||||||||||||
Investment Companies – 0.3% | ||||||||||||
AB Fixed Income Shares, Inc. – Government Money Market Portfolio – Class AB, | 87,151 | 87,151 | ||||||||||
|
| |||||||||||
Total Investments – 98.4% | 30,021,377 | |||||||||||
Other assets less liabilities – 1.6% | 487,283 | |||||||||||
|
| |||||||||||
Net Assets – 100.0% | $ | 30,508,660 | ||||||||||
|
| |||||||||||
| 48 | AB FLEXFEE HIGH YIELD PORTFOLIO | abfunds.com | |
PORTFOLIO OF INVESTMENTS(continued)
FUTURES (see Note D)
| Description | Number of Contracts | Expiration Month | Notional (000) | Original Value | Value at December 31, 2018 | Unrealized Appreciation/ (Depreciation) | ||||||||||||||||||
Purchased Contracts |
| |||||||||||||||||||||||
E-Mini Russell 2000 Index Futures | 1 | March 2019 | USD | 0 | *** | $ | 72,982 | $ | 67,450 | $ | (5,532 | ) | ||||||||||||
U.S.T-Note 10 Yr (CBT) Futures | 16 | March 2019 | USD | 1,600 | 1,907,375 | 1,952,250 | 44,875 | |||||||||||||||||
Sold Contracts |
| |||||||||||||||||||||||
Euro-BOBL Futures | 5 | March 2019 | EUR | 500 | 757,226 | 759,174 | (1,948 | ) | ||||||||||||||||
Euro-OAT Futures | 2 | March 2019 | EUR | 200 | 345,638 | 345,558 | 80 | |||||||||||||||||
|
| |||||||||||||||||||||||
| $ | 37,475 | |||||||||||||||||||||||
|
| |||||||||||||||||||||||
FORWARD CURRENCY EXCHANGE CONTRACTS (see Note D)
| Counterparty | Contracts to Deliver (000) | In Exchange For (000) | Settlement Date | Unrealized Appreciation/ (Depreciation) | ||||||||||||||||
Brown Brothers Harriman & Co. | EUR | 1,220 | USD | 1,411 | 1/09/19 | $ | 12,993 | |||||||||||||
Brown Brothers Harriman & Co. | EUR | 407 | USD | 464 | 1/09/19 | (1,971 | ) | |||||||||||||
Brown Brothers Harriman & Co. | USD | 190 | EUR | 166 | 1/09/19 | 187 | ||||||||||||||
Brown Brothers Harriman & Co. | CAD | 300 | USD | 227 | 1/17/19 | 7,294 | ||||||||||||||
Brown Brothers Harriman & Co. | USD | 42 | CAD | 57 | 1/17/19 | (230 | ) | |||||||||||||
Brown Brothers Harriman & Co. | MXN | 1,599 | USD | 78 | 1/25/19 | (2,628 | ) | |||||||||||||
Brown Brothers Harriman & Co. | ZAR | 246 | USD | 18 | 1/30/19 | 588 | ||||||||||||||
Brown Brothers Harriman & Co. | AUD | 2 | USD | 1 | 2/20/19 | 48 | ||||||||||||||
Brown Brothers Harriman & Co. | NZD | 197 | USD | 136 | 2/20/19 | 4,219 | ||||||||||||||
Deutsche Bank AG | USD | 64 | INR | 4,579 | 3/18/19 | 1,136 | ||||||||||||||
Morgan Stanley Capital Services LLC | BRL | 380 | USD | 98 | 1/03/19 | 24 | ||||||||||||||
Morgan Stanley Capital Services LLC | BRL | 380 | USD | 98 | 1/03/19 | (520 | ) | |||||||||||||
Morgan Stanley Capital Services LLC | USD | 97 | BRL | 380 | 1/03/19 | 1,378 | ||||||||||||||
Morgan Stanley Capital Services LLC | USD | 98 | BRL | 380 | 1/03/19 | (24 | ) | |||||||||||||
Morgan Stanley Capital Services LLC | RUB | 4,120 | USD | 62 | 1/24/19 | 2,903 | ||||||||||||||
Morgan Stanley Capital Services LLC | BRL | 380 | USD | 97 | 2/04/19 | (1,357 | ) | |||||||||||||
Standard Chartered Bank | TWD | 2,031 | USD | 67 | 3/14/19 | (216 | ) | |||||||||||||
|
| |||||||||||||||||||
| $ | 23,824 | |||||||||||||||||||
|
| |||||||||||||||||||
| abfunds.com | AB FLEXFEE HIGH YIELD PORTFOLIO | 49 | |
PORTFOLIO OF INVESTMENTS(continued)
CREDIT DEFAULT SWAPTIONS WRITTEN (see Note D)
| Description | Counterparty | Buy/Sell Protection | Strike Rate | Expiration Month | Notional Amount (000) | Premiums Received | Market Value | |||||||||||||||||||||
Put |
| |||||||||||||||||||||||||||
CDX-NAHY Series 31, 5 Year Index(t) | | Credit Suisse International | | Sell | 1.00 | % | Jan, 2019 | USD | 345 | $ | 1,511 | $ | (939 | ) | ||||||||||||||
CDX-NAHY Series 31, 5 Year Index(t) | | Deutsche Bank AG | | Sell | 1.00 | Jan, 2019 | USD | 721 | 3,028 | (1,962 | ) | |||||||||||||||||
CDX-NAHY Series 31, 5 Year Index(t) | | Deutsche Bank AG | | Sell | 0.97 | Feb, 2019 | USD | 960 | 5,617 | (3,892 | ) | |||||||||||||||||
|
|
|
| |||||||||||||||||||||||||
| $ | 10,156 | $ | (6,793 | ) | ||||||||||||||||||||||||
|
|
|
| |||||||||||||||||||||||||
CENTRALLY CLEARED CREDIT DEFAULT SWAPS (see Note D)
| Description | Fixed Rate (Pay) Receive | Payment Frequency | Implied Credit Spread at December 31, 2018 | Notional Amount (000) | Market Value | Upfront Premiums Paid (Received) | Unrealized Appreciation/ (Depreciation) | |||||||||||||||||||||
Buy Contracts |
| |||||||||||||||||||||||||||
iTraxx Europe Crossover Series 21, 5 Year Index, 6/20/19* | (5.00 | )% | Quarterly | 0.57 | % | EUR | 0 | *** | $ | (5 | ) | $ | (9 | ) | $ | 4 | ||||||||||||
iTraxx Europe Crossover Series 25, 5 Year Index, 6/20/21* | (5.00 | ) | Quarterly | 2.47 | EUR | 14 | (980 | ) | (497 | ) | (483 | ) | ||||||||||||||||
Sale Contracts |
| |||||||||||||||||||||||||||
CDX-NAHY Series 31, 5 Year Index, 12/20/23* | 5.00 | Quarterly | 4.50 | USD | 54 | 1,185 | 2,220 | (1,035 | ) | |||||||||||||||||||
| 50 | AB FLEXFEE HIGH YIELD PORTFOLIO | abfunds.com | |
PORTFOLIO OF INVESTMENTS(continued)
| Description | Fixed Rate (Pay) Receive | Payment Frequency | Implied Credit Spread at December 31, 2018 | Notional Amount (000) | Market Value | Upfront Premiums Paid (Received) | Unrealized Appreciation/ (Depreciation) | |||||||||||||||||||||
iTraxx Europe Crossover Series 25, 5 Year Index, 6/20/21* | 5.00 | % | Quarterly | 2.47 | % | EUR | 14 | $ | 980 | $ | 1,387 | $ | (407 | ) | ||||||||||||||
|
|
|
|
|
| |||||||||||||||||||||||
| $ | 1,180 | $ | 3,101 | $ | (1,921 | ) | ||||||||||||||||||||||
|
|
|
|
|
| |||||||||||||||||||||||
| * | Termination date |
CENTRALLY CLEARED INTEREST RATE SWAPS (see Note D)
Rate Type | ||||||||||||||||||||||||||
Notional (000) | Termination Date | Payments made by the Fund | Payments received by the Fund | Payment Frequency Paid/ Received | Market Value | Upfront Premiums Paid (Received) | Unrealized Appreciation/ (Depreciation) | |||||||||||||||||||
| USD | 1,770 | 3/06/23 | 3 Month LIBOR | 2.714% | | Quarterly/ Semi-Annual | $ | 22,006 | $ | — | $ | 22,006 | ||||||||||||||
| USD | 2,835 | 9/02/25 | 2.248% | 3 Month LIBOR | | Semi-Annual/ Quarterly | 51,133 | (8,311 | ) | 59,444 | ||||||||||||||||
| USD | 961 | 1/15/26 | 1.978% | 3 Month LIBOR | | Semi-Annual/ Quarterly | 37,166 | 5,398 | 31,768 | |||||||||||||||||
| USD | 651 | 2/16/26 | 1.625% | 3 Month LIBOR | | Semi-Annual/ Quarterly | 41,276 | 7,434 | 33,842 | |||||||||||||||||
| USD | 150 | 3/31/26 | 1.693% | 3 Month LIBOR | | Semi-Annual/ Quarterly | 8,794 | — | 8,794 | |||||||||||||||||
| USD | 100 | 5/03/26 | 1.770% | 3 Month LIBOR | | Semi-Annual/ Quarterly | 5,996 | — | 5,996 | |||||||||||||||||
| USD | 800 | 6/01/26 | 1.714% | 3 Month LIBOR | | Semi-Annual/ Quarterly | 51,260 | 32,362 | 18,898 | |||||||||||||||||
| USD | 4,650 | 4/28/27 | 3 Month LIBOR | 2.330% | | Quarterly/ Semi-Annual | (122,668 | ) | 16,658 | (139,326 | ) | |||||||||||||||
| USD | 350 | 5/03/27 | 2.285% | 3 Month LIBOR | | Semi-Annual/ Quarterly | 10,504 | 112 | 10,392 | |||||||||||||||||
| USD | 940 | 3/06/28 | 2.876% | 3 Month LIBOR | | Semi-Annual/ Quarterly | (20,063 | ) | — | (20,063 | ) | |||||||||||||||
|
|
|
|
|
| |||||||||||||||||||||
| $ | 85,404 | $ | 53,653 | $ | 31,751 | |||||||||||||||||||||
|
|
|
|
|
| |||||||||||||||||||||
| abfunds.com | AB FLEXFEE HIGH YIELD PORTFOLIO | 51 | |
PORTFOLIO OF INVESTMENTS(continued)
CREDIT DEFAULT SWAPS (see Note D)
| Swap Counterparty & Referenced Obligation | Fixed Rate (Pay) Receive | Payment Frequency | Implied Credit Spread at December 31, 2018 | Notional Amount (000) | Market Value | Upfront Premiums Paid (Received) | Unrealized Appreciation/ (Depreciation) | |||||||||||||||||||||
Buy Contracts | ||||||||||||||||||||||||||||
Barclays Bank PLC |
| |||||||||||||||||||||||||||
Uniti Group, Inc., 8.250%, 10/15/23, 12/20/19* | (5.00 | )% | Quarterly | 5.67 | % | USD | 60 | $ | 271 | $ | 774 | $ | (503 | ) | ||||||||||||||
Credit Suisse International |
| |||||||||||||||||||||||||||
CDX-CMBX.NA.BB Series 6, 5/11/63* | (5.00 | ) | Monthly | 15.53 | USD | 180 | 50,448 | 22,796 | 27,652 | |||||||||||||||||||
Goldman Sachs International |
| |||||||||||||||||||||||||||
British Telecommunications PLC, 5.750%, 12/07/28, 6/20/20* | (1.00 | ) | Quarterly | �� | 0.27 | EUR | 170 | (2,024 | ) | (2,009 | ) | (15 | ) | |||||||||||||||
CDX-CMBX.NA.BBB-Series 6, 5/11/63* | (3.00 | ) | Monthly | 8.38 | USD | 192 | 30,874 | 20,499 | 10,375 | |||||||||||||||||||
Sale Contracts | ||||||||||||||||||||||||||||
Barclays Bank PLC |
| |||||||||||||||||||||||||||
Altice Luxembourg SA, | 5.00 | Quarterly | 7.37 | EUR | 60 | (4,929 | ) | 6,385 | (11,314 | ) | ||||||||||||||||||
New Albertsons LP, | 5.00 | Quarterly | 6.20 | USD | 30 | (1,166 | ) | (1,858 | ) | 692 | ||||||||||||||||||
Citibank, NA | ||||||||||||||||||||||||||||
Altice France SA, 5.375%, 5/15/22, 6/20/23* | 5.00 | Quarterly | 3.95 | EUR | 100 | 4,802 | 7,834 | (3,032 | ) | |||||||||||||||||||
Avis Budget Car Rental LLC, 5.250%, 3/15/25, 6/20/22* | 5.00 | Quarterly | 2.76 | USD | 50 | 3,388 | 2,311 | 1,077 | ||||||||||||||||||||
Credit Suisse International |
| |||||||||||||||||||||||||||
CDX-CMBX.NA.BB Series 6, 5/11/63* | 5.00 | Monthly | 15.53 | USD | 29 | (8,128 | ) | (3,618 | ) | (4,510 | ) | |||||||||||||||||
CDX-CMBX.NA.BB Series 6, 5/11/63* | 5.00 | Monthly | 15.53 | USD | 69 | (19,338 | ) | (7,989 | ) | (11,349 | ) | |||||||||||||||||
International Game Technology PLC, | 5.00 | Quarterly | 1.82 | EUR | 100 | 12,246 | 7,888 | 4,358 | ||||||||||||||||||||
| 52 | AB FLEXFEE HIGH YIELD PORTFOLIO | abfunds.com | |
PORTFOLIO OF INVESTMENTS(continued)
| Swap Counterparty & Referenced Obligation | Fixed Rate (Pay) Receive | Payment Frequency | Implied Credit Spread at December 31, 2018 | Notional Amount (000) | Market Value | Upfront Premiums Paid (Received) | Unrealized Appreciation/ (Depreciation) | |||||||||||||||||||||
Deutsche Bank AG |
| |||||||||||||||||||||||||||
CDX-CMBX.NA.BBB-Series 6, 5/11/63* | 3.00 | % | Monthly | 8.38 | % | USD | 75 | $ | (12,066 | ) | $ | (5,093 | ) | $ | (6,973 | ) | ||||||||||||
CDX-CMBX.NA.BBB-Series 6, 5/11/63* | 3.00 | Monthly | 8.38 | USD | 252 | (40,543 | ) | (17,568 | ) | (22,975 | ) | |||||||||||||||||
Goldman Sachs International | ||||||||||||||||||||||||||||
Avis Budget Car Rental LLC, 5.250%, 3/15/25, 6/20/22* | 5.00 | Quarterly | 2.86 | USD | 13 | 835 | 607 | 228 | ||||||||||||||||||||
CDX-CMBX.NA.BB Series 6, 5/11/63* | 5.00 | Monthly | 15.53 | USD | 163 | (45,657 | ) | (29,687 | ) | (15,970 | ) | |||||||||||||||||
New Albertsons LP, 8.000%, 5/01/31, 12/20/22* | 5.00 | Quarterly | 6.20 | USD | 60 | (2,332 | ) | (3,309 | ) | 977 | ||||||||||||||||||
|
|
|
|
|
| |||||||||||||||||||||||
| $ | (33,319 | ) | $ | (2,037 | ) | $ | (31,282 | ) | ||||||||||||||||||||
|
|
|
|
|
| |||||||||||||||||||||||
| * | Termination date |
TOTAL RETURN SWAPS (see Note D)
| Counterparty & Referenced Obligation | # of Shares or Units | Rate Paid/ Received | Payment Frequency | Notional Amount (000) | Maturity Date | Unrealized Appreciation/ (Depreciation) | ||||||||||||||||||||||
Receive Total Return on Reference Obligation |
| |||||||||||||||||||||||||||
Goldman Sachs International | ||||||||||||||||||||||||||||
Markit iBoxx $ Contingent Convertible Liquid Developed Market AT1 | 4,364 | LIBOR | Quarterly | USD | 580 | 3/20/19 | $ | (518 | ) | |||||||||||||||||||
Markit iBoxx EUR Contingent Convertible Liquid Developed Market AT1 | 1,789 | EURIBOR | Quarterly | EUR | 240 | 3/20/19 | (720 | ) | ||||||||||||||||||||
JPMorgan Chase Bank, NA | ||||||||||||||||||||||||||||
iBoxx $ Liquid High Yield Index | 1,302 | LIBOR | Quarterly | USD | 350 | 3/20/19 | (5,917 | ) | ||||||||||||||||||||
|
| |||||||||||||||||||||||||||
| $ | (7,155 | ) | ||||||||||||||||||||||||||
|
| |||||||||||||||||||||||||||
| ** | Principal amount less than 500. |
| *** | Notional amount less than 500. |
| (a) | Security is exempt from registration under Rule 144A of the Securities Act of 1933. These securities are considered restricted, but liquid and may be resold in transactions exempt from registration, normally to qualified institutional buyers. At December 31, 2018, the aggregate market value of these securities amounted to $12,189,770 or 40.0% of net assets. |
| abfunds.com | AB FLEXFEE HIGH YIELD PORTFOLIO | 53 | |
PORTFOLIO OF INVESTMENTS(continued)
| (b) | Security in which significant unobservable inputs (Level 3) were used in determining fair value. |
| (c) | Illiquid security. |
| (d) | Fair valued by the Adviser. |
| (e) | Defaulted. |
| (f) | Non-income producing security. |
| (g) | Pay-In-Kind Payments (PIK). The issuer may pay cash interest and/or interest in additional debt securities. Rates shown are the rates in effect at December 31, 2018. |
| (h) | Defaulted matured security. |
| (i) | Security is exempt from registration under Rule 144A of the Securities Act of 1933. These securities, which represent 0.33% of net assets as of December 31, 2018, are considered illiquid and restricted. Additional information regarding such securities follows: |
| 144A/Restricted & Illiquid Securities | Acquisition Date | Cost | Market Value | Percentage of Net Assets | ||||||||||||
Aveta, Inc. | 12/15/17 | $ | – 0 | – | $ | – 0 | – | 0.00 | % | |||||||
Exide Technologies | 11/10/16 | 94,857 | 55,229 | 0.18 | % | |||||||||||
Exide Technologies | 5/23/17 | 42,513 | 38,264 | 0.13 | % | |||||||||||
K2016470219 South Africa Ltd. | 3/13/15 | 17,023 | 2 | 0.00 | % | |||||||||||
K2016470260 South Africa Ltd. | 12/22/16 | 4,458 | 1,358 | 0.00 | % | |||||||||||
MagnetationLLC/Mag Finance Corp. | 2/19/15 | 36,767 | 1 | 0.00 | % | |||||||||||
Texas Competitive/TCEH | 10/03/16 | – 0 | – | – 0 | – | 0.00 | % | |||||||||
Tonon Luxembourg SA | 1/16/13 | 5,510 | 129 | 0.00 | % | |||||||||||
Virgolino de Oliveira Finance SA | 2/13/13 | 96,161 | 5,896 | 0.02 | % | |||||||||||
| (j) | Restricted and illiquid security. |
| Restricted & Illiquid Securities | Acquisition Date | Cost | Market Value | Percentage of Net Assets | ||||||||||||
CHC Group LLC | 3/10/17 | $ | 62,260 | $ | 4,876 | 0.02 | % | |||||||||
CHC Group LLC/CHC Finance Ltd. | 3/10/17 | 51,531 | 55,394 | 0.18 | % | |||||||||||
Exide Technologies | 4/30/15 | 2,889 | 448 | 0.00 | % | |||||||||||
Momentive Performance Materials, Inc. | 10/24/14 | – 0 | – | – 0 | – | 0.00 | % | |||||||||
| (k) | Convertible security. |
| (l) | Coupon rate adjusts periodically based upon a predetermined schedule. Stated interest rate in effect at December 31, 2018. |
| (m) | Securities are perpetual and, thus, do not have a predetermined maturity date. The date shown, if applicable, reflects the next call date. |
| 54 | AB FLEXFEE HIGH YIELD PORTFOLIO | abfunds.com | |
PORTFOLIO OF INVESTMENTS(continued)
| (n) | The stated coupon rate represents the greater of the LIBOR or the LIBOR floor rate plus a spread at December 31, 2018. |
| (o) | This position or a portion of this position represents an unsettled loan purchase. The coupon rate will be determined at the time of settlement and will be based upon the London-Interbank Offered Rate (“LIBOR”) plus a premium which was determined at the time of purchase. |
| (p) | Floating Rate Security. Stated interest/floor/ceiling rate was in effect at December 31, 2018. |
| (q) | To obtain a copy of the fund’s shareholder report, please go to the Securities and Exchange Commission’s website at www.sec.gov. Additionally, shareholder reports for AB funds can be obtained by calling AB at (800)227-4618. |
| (r) | Affiliated investments. |
| (s) | The rate shown represents the7-day yield as of period end. |
| (t) | One contract relates to 1 share. |
Currency Abbreviations:
ARS – Argentine Peso
AUD – Australian Dollar
BRL – Brazilian Real
CAD – Canadian Dollar
EUR – Euro
INR – Indian Rupee
MXN – Mexican Peso
NZD – New Zealand Dollar
RUB – Russian Ruble
TWD – New Taiwan Dollar
USD – United States Dollar
ZAR – South African Rand
Glossary:
ABS – Asset-Backed Securities
ARLLMONP – Argentina Blended Policy Rate
BOBL – Bundesobligationen
CBT – Chicago Board of Trade
CDX-CMBX.NA – North American Commercial Mortgage-Backed Index
CDX-NAHY – North American High Yield Credit Default Swap Index
CMBS – Commercial Mortgage-Backed Securities
ETF – Exchange Traded Fund
EURIBOR – Euro Interbank Offered Rate
LIBOR – London Interbank Offered Rates
MSCI – Morgan Stanley Capital International
OAT – Obligations Assimilables du Trésor
REIT – Real Estate Investment Trust
See notes to financial statements.
| abfunds.com | AB FLEXFEE HIGH YIELD PORTFOLIO | 55 | |
STATEMENT OF ASSETS & LIABILITIES
December 31, 2018
| Assets | ||||
Investments in securities, at value | $ | 29,934,226 | ||
Affiliated issuers (cost $87,151) | 87,151 | |||
Cash | 30,741 | |||
Cash collateral due from broker | 65,010 | |||
Foreign currencies, at value (cost $88,870) | 88,812 | |||
Unaffiliated dividends and interest receivable | 495,571 | |||
Market value of credit default swaps (net premiums paid $62,709) | 102,864 | |||
Receivable from Adviser | 64,883 | |||
Receivable for investment securities sold | 41,810 | |||
Unrealized appreciation on forward currency exchange contracts | 30,770 | |||
Receivable for variation margin on futures | 6,666 | |||
Affiliated dividends receivable | 3,303 | |||
Receivable for terminated total return swaps | 219 | |||
Receivable for capital stock sold | 187 | |||
Receivable for variation margin on centrally cleared swaps | 82 | |||
|
| |||
Total assets | 30,952,295 | |||
|
| |||
| Liabilities | ||||
Swaptions written, at value (premiums received $10,156) | 6,793 | |||
Market value of credit default swaps (net premiums received $64,746) | 136,183 | |||
Audit and tax fee payable | 98,370 | |||
Payable for investment securities purchased | 35,640 | |||
Custody fee payable | 32,841 | |||
Printing fee payable | 25,551 | |||
Payable for terminated total return swaps | 25,042 | |||
Unrealized depreciation on total return swaps | 7,155 | |||
Unrealized depreciation on forward currency exchange contracts | 6,946 | |||
Transfer Agent fee payable | 3,070 | |||
Payable for capital stock redeemed | 1,811 | |||
Payable for variation margin on centrally cleared swaps | 1,470 | |||
Accrued expenses and other liabilities | 62,763 | |||
|
| |||
Total liabilities | 443,635 | |||
|
| |||
Net Assets | $ | 30,508,660 | ||
|
| |||
| Composition of Net Assets | ||||
Capital stock, at par | $ | 3,430 | ||
Additionalpaid-in capital | 42,546,200 | |||
Accumulated loss | (12,040,970 | ) | ||
|
| |||
| $ | 30,508,660 | |||
|
|
Net Asset Value Per Share—33 billion shares of capital stock authorized, $.001 par value
| Class | Net Assets | Shares Outstanding | Net Asset Value | |||||||||
| ||||||||||||
| Advisor | $ | 30,508,660 | 3,429,596 | $ | 8.90 | |||||||
| ||||||||||||
See notes to financial statements.
| 56 | AB FLEXFEE HIGH YIELD PORTFOLIO | abfunds.com | |
STATEMENT OF OPERATIONS
| For the Period November 1, 2018 to December 31, 2018(a) | Year Ended October 31, 2018 | |||||||
| Investment Income | ||||||||
Interest (net of foreign taxes withheld of $47 and $178, respectively) | $ | 335,234 | $ | 1,713,066 | ||||
Dividends Affiliated issuers | 6,559 | 34,820 | ||||||
Unaffiliated issuers | 2,276 | – 0 | – | |||||
Other income | – 0 | – | 2,500 | |||||
|
|
|
| |||||
Total Income | 344,069 | 1,750,386 | ||||||
|
|
|
| |||||
| Expenses | ||||||||
Advisory fee (see Note B) | 11,428 | 94,551 | ||||||
Transfer agency—Class A | – 0 | – | 3,629 | |||||
Transfer agency—Class C | – 0 | – | 873 | |||||
Transfer agency—Advisor Class | 4,932 | 23,919 | ||||||
Transfer agency—Class R | – 0 | – | 28 | |||||
Transfer agency—Class K | – 0 | – | 1 | |||||
Transfer agency—Class I | – 0 | – | 1,115 | |||||
Transfer agency—Class Z | – 0 | – | 37 | |||||
Distribution fee—Class A | – 0 | – | 3,481 | |||||
Distribution fee—Class C | – 0 | – | 3,257 | |||||
Distribution fee—Class R | – 0 | – | 64 | |||||
Distribution fee—Class K | – 0 | – | 7 | |||||
Audit and tax | 108,032 | 142,673 | ||||||
Custodian | 15,313 | 117,859 | ||||||
Administrative | 11,452 | 77,405 | ||||||
Printing | �� | 11,001 | 44,504 | |||||
Legal | 4,555 | 167,272 | ||||||
Directors’ fees | 4,141 | 25,383 | ||||||
Registration fees | 3,991 | 67,212 | ||||||
Miscellaneous | 10,938 | 59,752 | ||||||
|
|
|
| |||||
Total expenses before interest expense | 185,783 | 833,022 | ||||||
Interest expense | – 0 | – | 3,183 | |||||
|
|
|
| |||||
Total expenses | 185,783 | 836,205 | ||||||
Less: expenses waived and reimbursed by the Adviser (see Note B) | (168,959 | ) | (698,658 | ) | ||||
|
|
|
| |||||
Net expenses | 16,824 | 137,547 | ||||||
|
|
|
| |||||
Net investment income | 327,245 | 1,612,839 | ||||||
|
|
|
| |||||
See notes to financial statements.
| abfunds.com | AB FLEXFEE HIGH YIELD PORTFOLIO | 57 | |
STATEMENT OF OPERATIONS(continued)
| For the Period November 1, 2018 to December 31, 2018(a) | Year Ended October 31, 2018 | |||||||
| Realized and Unrealized Gain (Loss) on Investment and Foreign Currency Transactions | ||||||||
Net realized gain (loss) on: | ||||||||
Investment transactions | $ | (47,264 | ) | $ | 143,706 | (b) | ||
Forward currency exchange contracts | (10,814 | ) | 29,762 | |||||
Futures | (23,258 | ) | (10,816 | ) | ||||
Options written | – 0 | – | 16,707 | |||||
Swaps | (61,711 | ) | 33,650 | |||||
Swaptions written | – 0 | – | 8,774 | |||||
Foreign currency transactions | 1,479 | 116,081 | ||||||
Net change in unrealized appreciation/depreciation on: | ||||||||
Investments | (1,441,643 | ) | (1,509,353 | ) | ||||
Forward currency exchange contracts | 9,867 | (41,610 | ) | |||||
Futures | 66,935 | (22,939 | ) | |||||
Options written | – 0 | – | (2,112 | ) | ||||
Swaps | (51,654 | ) | 52,361 | |||||
Swaptions written | 3,125 | (1,374 | ) | |||||
Foreign currency denominated assets and liabilities | (751 | ) | 1,364 | |||||
|
|
|
| |||||
Net loss on investment and foreign currency transactions | (1,555,689 | ) | (1,185,799 | ) | ||||
|
|
|
| |||||
Contributions from Affiliates (see Note B) | – 0 | – | 2,881 | |||||
|
|
|
| |||||
Net Increase (Decrease) in Net Assets from Operations | $ | (1,228,444 | ) | $ | 429,921 | |||
|
|
|
| |||||
| (a) | The Fund changed its fiscal year end from October 31 to December 31. |
| (b) | Net of foreign capital gains taxes of $20,721. |
See notes to financial statements.
| 58 | AB FLEXFEE HIGH YIELD PORTFOLIO | abfunds.com | |
STATEMENT OF CHANGES IN NET ASSETS
| For the Period November 1, 2018 to December 31, 2018(a) | Year Ended October 31, 2018 | Year Ended October 31, 2017 | ||||||||||
| Increase (Decrease) in Net Assets from Operations | ||||||||||||
Net investment income | $ | 327,245 | $ | 1,612,839 | $ | 2,894,940 | ||||||
Net realized gain (loss) on investment and foreign currency transactions | (141,568 | ) | 337,864 | 505,769 | ||||||||
Net change in unrealized appreciation/depreciation on investments and foreign currency denominated assets and liabilities | (1,414,121 | ) | (1,523,663 | ) | 1,588,796 | |||||||
Contributions from Affiliates (see Note B) | – 0 | – | 2,881 | 92 | ||||||||
|
|
|
|
|
| |||||||
Net increase (decrease) in net assets from operations | (1,228,444 | ) | 429,921 | 4,989,597 | ||||||||
Distributions to Shareholders | ||||||||||||
Class A | – 0 | – | (68,765 | ) | (162,805 | ) | ||||||
Class C | – 0 | – | (13,824 | ) | (21,960 | ) | ||||||
Advisor Class | (485,472 | ) | (1,180,041 | ) | (164,064 | ) | ||||||
Class R | – 0 | – | (606 | ) | (1,990 | ) | ||||||
Class K | – 0 | – | (137 | ) | (415 | ) | ||||||
Class I | – 0 | – | (292,713 | ) | (785,002 | ) | ||||||
Class Z | – 0 | – | (9,658 | ) | (1,422,780 | ) | ||||||
Return of capital | ||||||||||||
Class A | – 0 | – | – 0 | – | (16,992 | ) | ||||||
Class C | – 0 | – | – 0 | – | (2,292 | ) | ||||||
Advisor Class | – 0 | – | – 0 | – | (17,124 | ) | ||||||
Class R | – 0 | – | – 0 | – | (208 | ) | ||||||
Class K | – 0 | – | – 0 | – | (43 | ) | ||||||
Class I | – 0 | – | – 0 | – | (81,932 | ) | ||||||
Class Z | – 0 | – | – 0 | – | (148,497 | ) | ||||||
| Capital Stock Transactions | ||||||||||||
Net increase (decrease) | (1,767,552 | ) | 6,740,423 | (60,218,108 | ) | |||||||
|
|
|
|
|
| |||||||
Total increase (decrease) | (3,481,468 | ) | 5,604,600 | (58,054,615 | ) | |||||||
| Net Assets | ||||||||||||
Beginning of period | 33,990,128 | 28,385,528 | 86,440,143 | |||||||||
|
|
|
|
|
| |||||||
End of period | $ | 30,508,660 | $ | 33,990,128 | $ | 28,385,528 | ||||||
|
|
|
|
|
| |||||||
| (a) | The Fund changed its fiscal year end from October 31 to December 31. |
See notes to financial statements.
| abfunds.com | AB FLEXFEE HIGH YIELD PORTFOLIO | 59 | |
NOTES TO FINANCIAL STATEMENTS
December 31, 2018
NOTE A
Significant Accounting Policies
AB Bond Fund, Inc. (the “Company”) is registered under the Investment Company Act of 1940 as anopen-end management investment company. The Company, which is a Maryland corporation, operates as a series company comprised of 10 portfolios currently in operation. Each portfolio is considered to be a separate entity for financial reporting and tax purposes. This report relates only to the AB FlexFee High Yield Portfolio (the “Fund”), a diversified portfolio. On February 26, 2018, the Fund’s name was changed from the AB High Yield Portfolio to the AB FlexFee High Yield Portfolio. At a meeting held on October 31, 2017 to November 2, 2017, the Fund’s Board of Directors (the “Board”) approved the conversion of Class A, Class C, Class R, Class I and Class Z shares of the Fund to Advisor Class shares of the Fund on a relative net assets basis. The conversion was effective on February 26, 2018. The Fund acquired the assets and liabilities of ABHigh-Yield Portfolio, a series of AB Pooling Portfolios (the “Accounting Survivor”), in a reorganization that was effective at the close of business July 26, 2016 (the “Reorganization”). The Reorganization was approved by the Accounting Survivor’s Board of Trustees and shareholders pursuant to an Agreement and Plan of Acquisition and Dissolution (the “Reorganization Agreement”) (see Note I for additional information). Upon completion of the Reorganization, the Class Z shares of the Fund assumed the performance, financial and other historical accounting information of the Accounting Survivor, including the adoption of the Accounting Survivor’s fiscal year end of August 31. As such, the financial statements and the financial highlights reflect the financial information of the Accounting Survivor through July 26, 2016. The fiscal year end of the Fund was subsequently changed to October 31 in 2016. The fiscal year end of the Fund changed to December 31 in 2018. The Fund has authorized the issuance of Class A, Class B, Class C, Advisor Class, Class R, Class K, Class I, Class Z, Class T, Class 1 and Class 2 shares. Class B, Class T, Class 1 and Class 2 shares have not been issued, and no shares of Class A, Class C, Class R, Class K, Class I or Class Z were outstanding as of December 31, 2018. Advisor class shares are sold without an initial or contingent deferred sales charge and are not subject to ongoing distribution expenses. All eleven classes of shares have identical voting, dividend, liquidation and other rights, except that the classes bear different distribution and transfer agency expenses. Each class has exclusive voting rights with respect to its distribution plan. The financial statements have been prepared in conformity with U.S. generally accepted accounting principles (“U.S. GAAP”), which require management to make certain estimates and assumptions that affect the reported amounts of assets and liabilities in the financial statements and amounts of income and expenses during the reporting period. Actual results could differ from those estimates. The Fund is an investment
| 60 | AB FLEXFEE HIGH YIELD PORTFOLIO | abfunds.com | |
NOTES TO FINANCIAL STATEMENTS(continued)
company under U.S. GAAP and follows the accounting and reporting guidance applicable to investment companies. The following is a summary of significant accounting policies followed by the Fund.
1. Security Valuation
Portfolio securities are valued at their current market value determined on the basis of market quotations or, if market quotations are not readily available or are deemed unreliable, at “fair value” as determined in accordance with procedures established by and under the general supervision of the Fund’s Board.
In general, the market values of securities which are readily available and deemed reliable are determined as follows: securities listed on a national securities exchange (other than securities listed on the NASDAQ Stock Market, Inc. (“NASDAQ”)) or on a foreign securities exchange are valued at the last sale price at the close of the exchange or foreign securities exchange. If there has been no sale on such day, the securities are valued at the last traded price from the previous day. Securities listed on more than one exchange are valued by reference to the principal exchange on which the securities are traded; securities listed only on NASDAQ are valued in accordance with the NASDAQ Official Closing Price; listed or over the counter (“OTC”) market put or call options are valued at the mid level between the current bid and ask prices. If either a current bid or current ask price is unavailable, AllianceBernstein L.P. (the “Adviser”) will have discretion to determine the best valuation (e.g., last trade price in the case of listed options); open futures are valued using the closing settlement price or, in the absence of such a price, the most recent quoted bid price. If there are no quotations available for the day of valuation, the last available closing settlement price is used; U.S. Government securities and any other debt instruments having 60 days or less remaining until maturity are generally valued at market by an independent pricing vendor, if a market price is available. If a market price is not available, the securities are valued at amortized cost. This methodology is commonly used for short term securities that have an original maturity of 60 days or less, as well as short term securities that had an original term to maturity that exceeded 60 days. In instances when amortized cost is utilized, the Valuation Committee (the “Committee”) must reasonably conclude that the utilization of amortized cost is approximately the same as the fair value of the security. Such factors the Committee will consider include, but are not limited to, an impairment of the creditworthiness of the issuer or material changes in interest rates. Fixed-income securities, including mortgage-backed and asset-backed securities, may be valued on the basis of prices provided by a pricing service or at a price obtained from one or more of the major broker-dealers. In cases where broker-dealer quotes are obtained, the Adviser may establish procedures whereby changes in market yields or
| abfunds.com | AB FLEXFEE HIGH YIELD PORTFOLIO | 61 | |
NOTES TO FINANCIAL STATEMENTS(continued)
spreads are used to adjust, on a daily basis, a recently obtained quoted price on a security. Swaps and other derivatives are valued daily, primarily using independent pricing services, independent pricing models using market inputs, as well as third party broker-dealers or counterparties. Open end mutual funds are valued at the closing net asset value per share, while exchange traded funds are valued at the closing market price per share.
Securities for which market quotations are not readily available (including restricted securities) or are deemed unreliable are valued at fair value as deemed appropriate by the Adviser. Factors considered in making this determination may include, but are not limited to, information obtained by contacting the issuer, analysts, analysis of the issuer’s financial statements or other available documents. In addition, the Fund may use fair value pricing for securities primarily traded innon-U.S. markets because most foreign markets close well before the Fund values its securities at 4:00 p.m., Eastern Time. The earlier close of these foreign markets gives rise to the possibility that significant events, including broad market moves, may have occurred in the interim and may materially affect the value of those securities. To account for this, the Fund generally values many of its foreign equity securities using fair value prices based on third party vendor modeling tools to the extent available.
2. Fair Value Measurements
In accordance with U.S. GAAP regarding fair value measurements, fair value is defined as the price that the Fund would receive to sell an asset or pay to transfer a liability in an orderly transaction between market participants at the measurement date. U.S. GAAP establishes a framework for measuring fair value, and a three-level hierarchy for fair value measurements based upon the transparency of inputs to the valuation of an asset or liability (including those valued based on their market values as described in Note A.1 above). Inputs may be observable or unobservable and refer broadly to the assumptions that market participants would use in pricing the asset or liability. Observable inputs reflect the assumptions market participants would use in pricing the asset or liability based on market data obtained from sources independent of the Fund. Unobservable inputs reflect the Fund’s own assumptions about the assumptions that market participants would use in pricing the asset or liability based on the best information available in the circumstances. Each investment is assigned a level based upon the observability of the inputs which are significant to the overall valuation. The three-tier hierarchy of inputs is summarized below.
| • | Level 1—quoted prices in active markets for identical investments |
| • | Level 2—other significant observable inputs (including quoted prices for similar investments, interest rates, prepayment speeds, credit risk, etc.) |
| 62 | AB FLEXFEE HIGH YIELD PORTFOLIO | abfunds.com | |
NOTES TO FINANCIAL STATEMENTS(continued)
| • | Level 3—significant unobservable inputs (including the Fund’s own assumptions in determining the fair value of investments) |
The fair value of debt instruments, such as bonds, andover-the-counter derivatives is generally based on market price quotations, recently executed market transactions (where observable) or industry recognized modeling techniques and are generally classified as Level 2. Pricing vendor inputs to Level 2 valuations may include quoted prices for similar investments in active markets, interest rate curves, coupon rates, currency rates, yield curves, option adjusted spreads, default rates, credit spreads and other unique security features in order to estimate the relevant cash flows which are then discounted to calculate fair values. If these inputs are unobservable and significant to the fair value, these investments will be classified as Level 3. In addition,non-agency rated investments are classified as Level 3.
Where readily available market prices or relevant bid prices are not available for certain equity investments, such investments may be valued based on similar publicly traded investments, movements in relevant indices since last available prices or based upon underlying company fundamentals and comparable company data (such as multiples to earnings or other multiples to equity). Where an investment is valued using an observable input, such as another publicly traded security, the investment will be classified as Level 2. If management determines that an adjustment is appropriate based on restrictions on resale, illiquidity or uncertainty, and such adjustment is a significant component of the valuation, the investment will be classified as Level 3. An investment will also be classified as Level 3 where management uses company fundamentals and other significant inputs to determine the valuation.
Options are valued using market-based inputs to models, broker or dealer quotations, or alternative pricing sources with reasonable levels of price transparency, where such inputs and models are available. Alternatively the values may be obtained through unobservable management determined inputs and/or management’s proprietary models. Where models are used, the selection of a particular model to value an option depends upon the contractual terms of, and specific risks inherent in, the option as well as the availability of pricing information in the market. Valuation models require a variety of inputs, including contractual terms, market prices, measures of volatility and correlations of such inputs. Exchange-traded options generally will be classified as Level 2. For options that do not trade on exchange but trade in liquid markets, inputs can generally be verified and model selection does not involve significant management judgment. Options are classified within Level 2 on the fair value hierarchy when all of the significant inputs can be corroborated to market evidence. Otherwise such instruments are classified as Level 3.
| abfunds.com | AB FLEXFEE HIGH YIELD PORTFOLIO | 63 | |
NOTES TO FINANCIAL STATEMENTS(continued)
Valuations of mortgage-backed or other asset-backed securities, by pricing vendors, are based on both proprietary and industry recognized models and discounted cash flow techniques. Significant inputs to the valuation of these instruments are value of the collateral, the rates and timing of delinquencies, the rates and timing of prepayments, and default and loss expectations, which are driven in part by housing prices for residential mortgages. Significant inputs are determined based on relative value analyses, which incorporate comparisons to instruments with similar collateral and risk profiles, including relevant indices. Mortgage and asset-backed securities for which management has collected current observable data through pricing services are generally categorized within Level 2. Those investments for which current observable data has not been provided are classified as Level 3.
Bank loan prices are provided by third party pricing services and consist of a composite of the quotes received by the vendor into a consensus price. Certain bank loans are classified as Level 3, as significant input used in the fair value measurement of these instruments is the market quotes that are received by the vendor and these inputs are not observable.
Other fixed income investments, includingnon-U.S. government and corporate debt, are generally valued using quoted market prices, if available, which are typically impacted by current interest rates, maturity dates and any perceived credit risk of the issuer. Additionally, in the absence of quoted market prices, these inputs are used by pricing vendors to derive a valuation based upon industry or proprietary models which incorporate issuer specific data with relevant yield/spread comparisons with more widely quoted bonds with similar key characteristics. Those investments for which there are observable inputs are classified as Level 2. Where the inputs are not observable, the investments are classified as Level 3.
The following table summarizes the valuation of the Fund’s investments by the above fair value hierarchy levels as of December 31, 2018:
Investments in Securities | Level 1 | Level 2 | Level 3 | Total | ||||||||||||
Assets: | ||||||||||||||||
Corporates –Non-Investment Grade | $ | – 0 | – | $ | 24,105,794 | $ | 162,770 | # | $ | 24,268,564 | ||||||
Corporates – Investment Grade | – 0 | – | 2,452,809 | 0 | # | 2,452,809 | ||||||||||
Bank Loans | – 0 | – | 761,459 | 327,150 | 1,088,609 | |||||||||||
Common Stocks | 439,833 | 860 | 65,546 | # | 506,239 | |||||||||||
Governments – Treasuries | – 0 | – | 437,468 | – 0 | – | 437,468 | ||||||||||
Emerging Markets – Corporate Bonds | – 0 | – | 318,372 | 16,117 | # | 334,489 | ||||||||||
Asset-Backed Securities | – 0 | – | – 0 | – | 250,428 | 250,428 | ||||||||||
Collateralized Mortgage Obligations | – 0 | – | 232,096 | – 0 | – | 232,096 | ||||||||||
Emerging Markets – Treasuries | – 0 | – | 150,612 | – 0 | – | 150,612 | ||||||||||
Local Governments – US Municipal Bonds | – 0 | – | 94,136 | – 0 | – | 94,136 | ||||||||||
| 64 | AB FLEXFEE HIGH YIELD PORTFOLIO | abfunds.com | |
NOTES TO FINANCIAL STATEMENTS(continued)
Investments in Securities | Level 1 | Level 2 | Level 3 | Total | ||||||||||||
Commercial Mortgage-Backed Securities | $ | – 0 | – | $ | – 0 | – | $ | 66,666 | $ | 66,666 | ||||||
Investment Companies | 21,719 | – 0 | – | – 0 | – | 21,719 | ||||||||||
Preferred Stocks | 20,063 | 1,303 | 0 | # | 21,366 | |||||||||||
Options Purchased – Calls | – 0 | – | 5,310 | – 0 | – | 5,310 | ||||||||||
Rights | – 0 | – | – 0 | – | 2,444 | 2,444 | ||||||||||
Warrants | 350 | # | – 0 | – | 921 | 1,271 | ||||||||||
Short-Term Investments: | ||||||||||||||||
Investment Companies | 87,151 | – 0 | – | – 0 | – | 87,151 | ||||||||||
|
|
|
|
|
|
|
| |||||||||
Total Investments in Securities | 569,116 | 28,560,219 | 892,042 | 30,021,377 | ||||||||||||
Other Financial Instruments*: | ||||||||||||||||
Assets | ||||||||||||||||
Futures | 44,955 | – 0 | – | – 0 | – | 44,955 | † | |||||||||
Forward Currency Exchange Contracts | – 0 | – | 30,770 | – 0 | – | 30,770 | ||||||||||
Centrally Cleared Credit Default Swaps | – 0 | – | 2,165 | – 0 | – | 2,165 | † | |||||||||
Centrally Cleared Interest Rate Swaps | – 0 | – | 228,135 | – 0 | – | 228,135 | † | |||||||||
Credit Default Swaps | – 0 | – | 102,864 | – 0 | – | 102,864 | ||||||||||
Liabilities | ||||||||||||||||
Futures | (7,480 | ) | – 0 | – | – 0 | – | (7,480 | )† | ||||||||
Forward Currency Exchange Contracts | – 0 | – | (6,946 | ) | – 0 | – | (6,946 | ) | ||||||||
Credit Default Swaptions Written | – 0 | – | (6,793 | ) | – 0 | – | (6,793 | ) | ||||||||
Centrally Cleared Credit Default Swaps | – 0 | – | (985 | ) | – 0 | – | (985 | )† | ||||||||
Centrally Cleared Interest Rate Swaps | – 0 | – | (142,731 | ) | – 0 | – | (142,731 | )† | ||||||||
Credit Default Swaps | – 0 | – | (136,183 | ) | – 0 | – | (136,183 | ) | ||||||||
Total Return Swaps | – 0 | – | (7,155 | ) | – 0 | – | (7,155 | ) | ||||||||
|
|
|
|
|
|
|
| |||||||||
Total^ | $ | 606,591 | $ | 28,623,360 | $ | 892,042 | $ | 30,121,993 | ||||||||
|
|
|
|
|
|
|
| |||||||||
| # | The Fund held securities with zero market value at period end. |
| * | Other financial instruments are derivative instruments, such as futures, forwards and swaps, which are valued at the unrealized appreciation/(depreciation) on the instrument. Other financial instruments may also include swaps with upfront premiums, options written and swaptions written which are valued at market value. |
| † | Only variation margin receivable/payable at period end is reported within the statement of assets and liabilities. This amount reflects cumulative unrealized appreciation/(depreciation) on futures and centrally cleared swaps as reported in the portfolio of investments. Centrally cleared swaps with upfront premiums are presented here at market value. |
| ^ | There were no transfers between Level 1 and Level 2 during the reporting period. |
The Fund recognizes all transfers between levels of the fair value hierarchy assuming the financial instrument was transferred at the beginning of the reporting period.
| abfunds.com | AB FLEXFEE HIGH YIELD PORTFOLIO | 65 | |
NOTES TO FINANCIAL STATEMENTS(continued)
The following is a reconciliation of investments in which significant unobservable inputs (Level 3) were used in determining fair value.
| Corporates - Non-Investment Grade# | Corporates - Investment Grade# | Bank Loans | Common Stocks# | |||||||||||||
Balance as of 10/31/18 | $ | 159,386 | $ | – 0 | – | $ | 230,038 | $ | 75,546 | |||||||
Accrued discounts/ | (1,311 | ) | – 0 | – | 221 | – 0 | – | |||||||||
Realized gain (loss) | 14 | – 0 | – | – 0 | – | – 0 | – | |||||||||
Change in unrealized appreciation/ depreciation | (17,663 | ) | – 0 | – | (14,535 | ) | (10,000 | ) | ||||||||
Purchases | 5,012 | – 0 | – | – 0 | – | – 0 | – | |||||||||
Sales | (2,040 | ) | – 0 | – | (89 | ) | – 0 | – | ||||||||
Transfers into level 3 | 19,372 | – 0 | – | 151,429 | – 0 | – | ||||||||||
Transfers out of level 3 | – 0 | – | – 0 | – | (39,914 | ) | – 0 | – | ||||||||
|
|
|
|
|
|
|
| |||||||||
Balance as of 12/31/18 | $ | 162,770 | $ | – 0 | – | $ | 327,150 | $ | 65,546 | |||||||
|
|
|
|
|
|
|
| |||||||||
Net change in unrealized appreciation/depreciation from investments held as of 12/31/18** | $ | (17,701 | ) | $ | – 0 | – | $ | (14,535 | ) | $ | (10,000 | ) | ||||
|
|
|
|
|
|
|
| |||||||||
| Emerging Markets - Corporate Bonds# | Asset- Backed Securities | Commercial Mortgage- Backed Securities | Collateralized Loan Obligations | |||||||||||||
Balance as of 10/31/18 | $ | 16,604 | $ | 283,840 | $ | 67,862 | $ | 72,871 | ||||||||
Accrued discounts/ | 75 | 472 | 12 | 3 | ||||||||||||
Realized gain (loss) | 91 | 1,625 | – 0 | – | 2,057 | |||||||||||
Change in unrealized appreciation/ depreciation | (526 | ) | (3,888 | ) | (1,208 | ) | (1,900 | ) | ||||||||
Purchases | – 0 | – | – 0 | – | – 0 | – | – 0 | – | ||||||||
Sales/Paydowns | (127 | ) | (31,621 | ) | – 0 | – | (73,031 | ) | ||||||||
Transfers into level 3 | – 0 | – | – 0 | – | – 0 | – | – 0 | – | ||||||||
Transfers out of level 3 | – 0 | – | – 0 | – | – 0 | – | – 0 | – | ||||||||
|
|
|
|
|
|
|
| |||||||||
Balance as of 12/31/18 | $ | 16,117 | $ | 250,428 | $ | 66,666 | $ | – 0 | – | |||||||
|
|
|
|
|
|
|
| |||||||||
Net change in unrealized appreciation/depreciation from investments held as of 12/31/18** | $ | (526 | ) | $ | (3,915 | ) | $ | (1,208 | ) | $ | – 0 | – | ||||
|
|
|
|
|
|
|
| |||||||||
| 66 | AB FLEXFEE HIGH YIELD PORTFOLIO | abfunds.com | |
NOTES TO FINANCIAL STATEMENTS(continued)
| Preferred Stocks# | Rights | Warrants | Total | |||||||||||||
Balance as of 10/31/18 | $ | – 0 | – | $ | 2,695 | $ | 2,998 | $ | 911,840 | |||||||
Accrued discounts/ (premiums) | – 0 | – | – 0 | – | – 0 | – | (528 | ) | ||||||||
Realized gain (loss) | – 0 | – | – 0 | – | – 0 | – | 3,787 | |||||||||
Change in unrealized appreciation/ depreciation | – 0 | – | (251 | ) | (2,077 | ) | (52,048 | ) | ||||||||
Purchases | – 0 | – | – 0 | – | – 0 | – | 5,012 | |||||||||
Sales/Paydowns | – 0 | – | – 0 | – | – 0 | – | (106,908 | ) | ||||||||
Transfers into level 3 | – 0 | – | – 0 | – | – 0 | – | 170,801 | |||||||||
Transfers out of level 3 | – 0 | – | – 0 | – | – 0 | – | (39,914 | ) | ||||||||
|
|
|
|
|
|
|
| |||||||||
Balance as of 12/31/18 | $ | – 0 | – | $ | 2,444 | $ | 921 | $ | 892,042 | + | ||||||
|
|
|
|
|
|
|
| |||||||||
Net change in unrealized appreciation/depreciation from investments held as of 12/31/18** | $ | – 0 | – | $ | (251 | ) | $ | (2,077 | ) | $ | (50,213 | ) | ||||
|
|
|
|
|
|
|
| |||||||||
| # | The Fund held securities with zero market value that were sold/expired/written off during the reporting period. |
| ** | The unrealized appreciation/(depreciation) is included in net change in unrealized appreciation/depreciation of investments and other financial instruments in the accompanying statement of operations. |
| + | There were de minimis transfers under 1% of net assets during the reporting period. |
The following presents information about significant unobservable inputs related to the Fund’s Level 3 investments at December 31, 2018. Securities priced (i) by third party vendors or (ii) by brokers are excluded from the following table.
Quantitative Information about Level 3 Fair Value Measurements
| Fair Value at 12/31/18 | Valuation Technique | Unobservable | Range/ Weighted Average | |||||||
Corporates –Non-Investment Grade | $ | 7,003 |
| Recovery | Collateral Value | $100.00 / N/A | ||||
Common Stocks | $ | 2,151 | Market Approach | EBITDA* Projection | $49.4mm / N/A | |||||
| EBITDA* Multiples | 1.8X-3.8X / 2.8X | |||||||||
| $ | 448 | Market Approach | EBITDA* Projection | $149.0mm / N/A | ||||||
| EBITDA* Multiples | 4.0X-6.0X / 5.0X | |||||||||
| $ | 21 | Market Approach | EBITDA* Projection | $72mm / N/A | ||||||
| EBITDA* Multiples | 3.4X / N/A | |||||||||
| $ | – 0 | – | Qualitative Assessment | $0.00 / N/A | ||||||
|
| |||||||||
| $ | 2,620 | |||||||||
|
| |||||||||
| abfunds.com | AB FLEXFEE HIGH YIELD PORTFOLIO | 67 | |
NOTES TO FINANCIAL STATEMENTS(continued)
| Fair Value at 12/31/18 | Valuation | Unobservable | Range/ Weighted Average | |||||||
Warrants | $ | 921 | Option Pricing Model | Exercise Price | $1.17 / N/A | |||||
Generally, a change in the assumptions used in any input in isolation may be accompanied by a change in another input. Significant changes in any of the unobservable inputs may significantly impact the fair value measurement. A significant increase (decrease) in Collateral Value, Exercise Price, EBITDA projections and EBITDA Multiple in insolation would be expected to result in a significant higher (lower) fair value measurement.
The Adviser established the Committee to oversee the pricing and valuation of all securities held in the Fund. The Committee operates under pricing and valuation policies and procedures established by the Adviser and approved by the Board, including pricing policies which set forth the mechanisms and processes to be employed on a daily basis to implement these policies and procedures. In particular, the pricing policies describe how to determine market quotations for securities and other instruments. The Committee’s responsibilities include: 1) fair value and liquidity determinations (and oversight of any third parties to whom any responsibility for fair value and liquidity determinations is delegated), and 2) regular monitoring of the Adviser’s pricing and valuation policies and procedures and modification or enhancement of these policies and procedures (or recommendation of the modification of these policies and procedures) as the Committee believes appropriate.
The Committee is also responsible for monitoring the implementation of the pricing policies by the Adviser’s Pricing Group (the “Pricing Group”) and any third party which performs certain pricing functions in accordance with the pricing policies. The Pricing Group is responsible for the oversight of the third party on aday-to-day basis. The Committee and the Pricing Group perform a series of activities to provide reasonable assurance of the accuracy of prices including: 1) periodic vendor due diligence meetings, review of methodologies, new developments and process at vendors, 2) daily comparison of security valuation versus prior day for all securities that exceeded established thresholds, and 3) daily review of unpriced, stale, and variance reports with exceptions reviewed by senior management and the Committee.
In addition, several processes outside of the pricing process are used to monitor valuation issues including: 1) performance and performance attribution reports are monitored for anomalous impacts based upon benchmark performance, and 2) portfolio managers review all portfolios for performance and analytics (which are generated using the Adviser’s prices).
| 68 | AB FLEXFEE HIGH YIELD PORTFOLIO | abfunds.com | |
NOTES TO FINANCIAL STATEMENTS(continued)
3. Currency Translation
Assets and liabilities denominated in foreign currencies and commitments under forward currency exchange contracts are translated into U.S. dollars at the mean of the quoted bid and ask prices of such currencies against the U.S. dollar. Purchases and sales of portfolio securities are translated into U.S. dollars at the rates of exchange prevailing when such securities were acquired or sold. Income and expenses are translated into U.S. dollars at the rates of exchange prevailing when accrued.
Net realized gain or loss on foreign currency transactions represents foreign exchange gains and losses from sales and maturities of foreign fixed income investments, holding of foreign currencies, currency gains or losses realized between the trade and settlement dates on foreign investment transactions, and the difference between the amounts of dividends, interest and foreign withholding taxes recorded on the Fund’s books and the U.S. dollar equivalent amounts actually received or paid. Net unrealized currency gains and losses from valuing foreign currency denominated assets and liabilities at period end exchange rates are reflected as a component of net unrealized appreciation and depreciation of foreign currency denominated assets and liabilities.
4. Taxes
It is the Fund’s policy to meet the requirements of the Internal Revenue Code applicable to regulated investment companies and to distribute all of its investment company taxable income and net realized gains, if any, to shareholders. Therefore, no provisions for federal income or excise taxes are required. The Fund may be subject to taxes imposed by countries in which it invests. Such taxes are generally based on income and/or capital gains earned or repatriated. Taxes are accrued and applied to net investment income, net realized gains and net unrealized appreciation/depreciation as such income and/or gains are earned.
In accordance with U.S. GAAP requirements regarding accounting for uncertainties in income taxes, management has analyzed the Fund’s tax positions taken or expected to be taken on federal and state income tax returns for all open tax years (the current and the prior three tax years) and has concluded that no provision for income tax is required in the Fund’s financial statements.
5. Investment Income and Investment Transactions
Dividend income is recorded on theex-dividend date or as soon as the Fund is informed of the dividend. Interest income is accrued daily. Investment transactions are accounted for on the date securities are purchased or sold. Investment gains or losses are determined on the identified cost basis. The Fund amortizes premiums and accretes discounts as adjustments to interest income.
| abfunds.com | AB FLEXFEE HIGH YIELD PORTFOLIO | 69 | |
NOTES TO FINANCIAL STATEMENTS(continued)
6. Expense Allocations
Expenses of the Company are charged proportionately to each portfolio or based on other appropriate methods.
7. Dividends and Distributions
Dividends and distributions to shareholders, if any, are recorded on theex-dividend date. Income dividends and capital gains distributions are determined in accordance with federal tax regulations and may differ from those determined in accordance with U.S. GAAP. To the extent these differences are permanent, such amounts are reclassified within the capital accounts based on their federal tax basis treatment; temporary differences do not require such reclassification.
8. Change of Fiscal Year End
The Fund changed its fiscal year end from October 31 to December 31. Accordingly, the statement of operations, statement of changes in net assets and the financial highlights reflect the two months from November 1, 2018 to December 31, 2018.
NOTE B
Advisory Fee and Other Transactions with Affiliates
Effective February 26, 2018, under an amended investment advisory agreement, the Fund calculates and accrues daily a base fee, at an annualized rate of .40% of the Fund’s average daily net assets (“Base Fee”). The advisory fee is increased or decreased from the Base Fee by a performance adjustment (“Performance Adjustment”) that depends on whether, and to what extent, the investment performance of the Advisor Class shares of the Fund (“Measuring Class”) exceeds, or is exceeded by, the performance of the Markit iBoxx USD Liquid High Yield Index (“Index”) plus .75% (“Index Hurdle”) over the Performance Period (as defined below). The Performance Adjustment is calculated and accrued daily, according to a schedule that adds or subtracts .002667% of the Fund’s average daily net assets for each .01% of absolute performance by which the performance of the Measuring Class exceeds or lags the Index Hurdle for the period from the beginning of the Performance Period through the current business day. The maximum Performance Adjustment (positive or negative) will not exceed an annualized rate of +/- .20% (“Maximum Performance Adjustment”) of the Fund’s average daily net assets, which would occur when the performance of the Measuring Class exceeds, or is exceeded by, the Index Hurdle by .75% or more for the Performance Period. On a monthly basis, the Fund will pay the Adviser the minimum fee rate of .20% on an annualized basis (Base Fee minus the Maximum Performance Adjustment) applied to the average daily net assets for the month. At the end of the Performance Period, the Fund will pay to the Adviser the total advisory fee, less the amount of any minimum fees paid during the Performance Period and any
| 70 | AB FLEXFEE HIGH YIELD PORTFOLIO | abfunds.com | |
NOTES TO FINANCIAL STATEMENTS(continued)
waivers described below. The period over which performance is measured (“Performance Period”) is initially from February 26, 2018 to December 31, 2019 and thereafter each12-month period beginning on the first day in the month of January through December 31 of the same year. In addition, the Adviser has agreed to waive its advisory fee by limiting the Fund’s accrual of the advisory fee (Base Fee plus Performance Adjustment) on any day to the amount corresponding to the maximum fee rate multiplied by the Fund’s current net assets if such amount is less than the amount that would have been accrued based on the Fund’s average daily net assets for the Performance Period. For the period ended November 1, 2018 to December 31, 2018, the Fund accrued advisory fees of $11,428, as reflected in the statement of operations, at an annual effective rate (excluding the impact from any expense waivers in effect) of .20% of the Fund’s average net assets, which reflected a (.20)% Performance Adjustment of $(11,431). For the Performance Period from February 26, 2018 to December 31, 2018, the Fund accrued advisory fees of $56,729, at an annual effective rate (excluding the impact from any expense waivers in effect) of .20% of the Fund’s average net assets, which reflected a (.20)% Performance Adjustment of $(56,743). Prior to February 26, 2018, under the terms of the investment advisory agreement, the Fund paid the Adviser an advisory fee at an annual rate of .55% of first $2.5 billion, .50% of the next $2.5 billion and .45% in excess of $5 billion, of the Fund’s average daily net assets. Effective January 1, 2017, the advisory fee was reduced from .60% to .55% of the first $2.5 billion, .55% to .50% of the next $2.5 billion and .50% to .45% in excess of $5 billion, of the Fund’s average daily net assets. The fee was accrued daily and paid monthly.
The Adviser has contractually agreed to waive its fees and bear certain expenses through February 29, 2020 to the extent necessary to limit total expenses (excluding expenses associated with acquired fund fees and expenses other than the advisory fees of any AB mutual funds in which the Fund may invest, interest expense, taxes, extraordinary expenses, and brokerage commissions and other transaction costs), on an annual basis from exceeding .10% of average daily net assets (the “Expense Cap”). For the period ended December 31, 2018, such reimbursements/waivers amounted to $157,175. Prior to February 26, 2018, the Adviser agreed to waive its fees and bear certain expenses to the extent necessary to limit total operating expenses (excluding expenses associated with acquired fund fees and expenses other than the advisory fees of any AB mutual funds in which the Fund may invest, interest expense, taxes, extraordinary expenses, and brokerage commissions and other transaction costs), on an annual basis to .95%, 1.70%, .70%, 1.20%, .95%, .70% and .70% of daily average net assets for Class A, Class C, Advisor Class, Class R, Class K, Class I and Class Z shares, respectively (the “Old Expense Caps”). Effective January 1, 2017, the Old Expense Caps were reduced from 1.05% to .95%, 1.80% to
| abfunds.com | AB FLEXFEE HIGH YIELD PORTFOLIO | 71 | |
NOTES TO FINANCIAL STATEMENTS(continued)
1.70%, .80% to .70%, 1.30% to 1.20%, 1.05% to .95%, .80% to .70% and .80% to .70% of daily average net assets for Class A, Class C, Advisor Class, Class R, Class K, Class I and Class Z shares, respectively. Any fees waived and expenses borne by the Adviser between February 26, 2018 and December 31, 2019 are subject to repayment by the Fund until the end of the third fiscal year after the fiscal period in which the fee were waived or the expense were borne; such waivers that are subject to repayment amount to $450,749 for the period ended October 31, 2018, and $157,175 for the period ended December 31, 2018. In any case, no repayment will be made that would cause the Fund’s total annual expenses (subject to the exclusions set forth above) to exceed .10% or, for fees waived or expenses borne prior to February 26, 2018, the Old Expense Caps.
During 2017, AXA S.A. (“AXA”), a French holding company for the AXA Group, a worldwide leader in life, property and casualty and health insurance and asset management, announced its intention to pursue the sale of a minority stake in its subsidiary, AXA Equitable Holdings, Inc. (“AXA Equitable”), the holding company for a diversified financial services organization, through an initial public offering (“IPO”). AXA Equitable is the holding company for a diverse group of financial services companies, including AllianceBernstein L.P., the investment adviser to the Funds (“the Adviser”). During the second quarter of 2018, AXA Equitable completed the IPO, and, as a result, AXA held approximately 72.2% of the outstanding common stock of AXA Equitable as of September 30, 2018. Contemporaneously with the IPO, AXA sold $862.5 million aggregate principal amount of its 7.25% mandatorily exchangeable notes (the “MxB Notes”) due May 15, 2021 and exchangeable into up to 43,125,000 shares of common stock (or approximately 7% of the outstanding shares of common stock of AXA Equitable). AXA retains ownership (including voting rights) of such shares of common stock until the MxB Notes are exchanged, which may be on a date that is earlier than the maturity date at AXA’s option upon the occurrence of certain events.
In March 2018, AXA announced its intention to sell its entire interest in AXA Equitable over time, subject to market conditions and other factors (the “Plan”). It is anticipated that one or more of the transactions contemplated by the Plan may ultimately result in the indirect transfer of a “controlling block” of voting securities of the Adviser (a “Change of Control Event”) and therefore may be deemed an “assignment” causing a termination of each Fund’s current investment advisory agreement. In order to ensure that the existing investment advisory services could continue uninterrupted, at meetings held in late July through early August 2018, the Boards of Directors/Trustees (each a “Board” and collectively, the “Boards”) approved new investment advisory agreements with the Adviser, in connection with the Plan. The Boards also agreed to call and hold a joint meeting of
| 72 | AB FLEXFEE HIGH YIELD PORTFOLIO | abfunds.com | |
NOTES TO FINANCIAL STATEMENTS(continued)
shareholders on October 11, 2018 for shareholders of each Fund to (1) approve the new investment advisory agreement with the Adviser that would be effective after the first Change of Control Event and (2) approve any future advisory agreement approved by the Board and that has terms not materially different from the current agreement, in the event there are subsequent Change of Control Events arising from completion of the Plan that terminate the advisory agreement after the first Change of Control Event. Approval of a future advisory agreement means that shareholders may not have another opportunity to vote on a new agreement with the Adviser even upon a change of control, as long as no single person or group of persons acting together gains “control” (as defined in the 1940 Act) of AXA Equitable.
At the October 11, 2018 meeting, shareholders approved the new and future investment advisory agreements.
On November 20, 2018, AXA completed a public offering of 60,000,000 shares of AXA Equitable’s common stock and simultaneously sold 30,000,000 of such shares to AXA Equitable pursuant to a separate agreement with it. As a result AXA currently owns approximately 59.2% of the shares of common stock of AXA Equitable.
During the year ended October 31, 2018 and the year ended October 31, 2017, the Adviser reimbursed the Fund $2,881 and $92, respectively, for trading losses incurred due to a trade entry error.
Pursuant to the investment advisory agreement, the Fund may reimburse the Adviser for certain legal and accounting services provided to the Fund by the Adviser. For the period ended December 31, 2018, the Adviser voluntarily agreed to waive such fees in the amount of $11,452.
The Fund compensates AllianceBernstein Investor Services, Inc. (“ABIS”), a wholly-owned subsidiary of the Adviser, under a Transfer Agency Agreement for providing personnel and facilities to perform transfer agency services for the Fund. ABIS may make payments to intermediaries that provide omnibus account services,sub-accounting services and/or networking services. Such compensation retained by ABIS amounted to $2,988 for the period ended December 31, 2018.
AllianceBernstein Investments, Inc. (the “Distributor”), a wholly-owned subsidiary of the Adviser, serves as the distributor of the Fund’s shares. The Distributor has advised the Fund that it has retainedfront-end sales charges of $28 from the sale of Class A shares and received $0 and $44 in contingent deferred sales charges imposed upon redemptions by shareholders of Class A and Class C shares, respectively, for the year ended October 31, 2018.
| abfunds.com | AB FLEXFEE HIGH YIELD PORTFOLIO | 73 | |
NOTES TO FINANCIAL STATEMENTS(continued)
The Fund may invest in AB Government Money Market Portfolio (the “Government Money Market Portfolio”) which has a contractual annual advisory fee rate of ..20% of the portfolio’s average daily net assets and bears its own expenses. Effective August 1, 2018, the Adviser has contractually agreed to waive .10% of the advisory fee of Government Money Market Portfolio until August 31, 2019. In connection with the investment by the Fund in Government Money Market Portfolio, the Adviser has contractually agreed to waive its advisory fee from the Fund in an amount equal to the Fund’s pro rata share of the effective advisory fees of Government Money Market Portfolio, as borne indirectly by the Fund as an acquired fund fee and expense. For the period ended December 31, 2018, such waiver amounted to $332.
A summary of the Fund’s transactions in AB mutual funds for the period ended December 31, 2018 is as follows:
Fund | Market Value 10/31/18 (000) | Purchases at Cost (000) | Sales Proceeds (000) | Market Value 12/31/18 (000) | Dividend Income (000) | |||||||||||||||
Government Money Market Portfolio | $ | 1,015 | $ | 5,519 | $ | 6,447 | $ | 87 | $ | 7 | ||||||||||
Brokerage commissions paid on investment transactions for the period ended December 31, 2018 amounted to $157, of which $0 and $0, respectively, was paid to Sanford C. Bernstein & Co. LLC and Sanford C. Bernstein Limited, affiliates of the Adviser.
NOTE C
Distribution Services Agreement
The Fund has adopted a Distribution Services Agreement (the “Agreement”) pursuant to Rule12b-1 under the Investment Company Act of 1940. Under the Agreement, the Fund pays distribution and servicing fees to the Distributor at an annual rate of up to .25% of the Fund’s average daily net assets attributable to Class A shares and 1% of the Fund’s average daily net assets attributable to Class C shares, .50% of the Fund’s average daily net assets attributable to Class R shares and .25% of the Fund’s average daily net assets attributable to Class K shares. There are no distribution and servicing fees on Advisor Class, Class I and Class Z shares. The fees are accrued daily and paid monthly. The Agreement provides that the Distributor will use such payments in their entirety for distribution assistance and promotional activities. Since the commencement of the Fund’s operations, the Distributor has incurred expenses in excess of the distribution costs reimbursed by the Fund in the amounts of $4,940, $0 and $0 for Class C, Class R and Class K shares, respectively. While such costs may be recovered from the Fund in future periods so long as
| 74 | AB FLEXFEE HIGH YIELD PORTFOLIO | abfunds.com | |
NOTES TO FINANCIAL STATEMENTS(continued)
the Agreement is in effect, the rate of the distribution and servicing fees payable under the Agreement may not be increased without a shareholder vote. In accordance with the Agreement, there is no provision for recovery of unreimbursed distribution costs incurred by the Distributor beyond the current fiscal year for Class A shares. The Agreement also provides that the Adviser may use its own resources to finance the distribution of the Fund’s shares.
NOTE D
Investment Transactions
Purchases and sales of investment securities (excluding short-term investments) for the period ended December 31, 2018, were as follows:
| Purchases | Sales | |||||||
Investment securities (excluding U.S. government securities) | $ | 1,527,795 | $ | 2,802,525 | ||||
U.S. government securities | – 0 | – | – 0 | – | ||||
The cost of investments for federal income tax purposes, gross unrealized appreciation and unrealized depreciation are as follows:
Cost | $ | 32,552,635 | ||
|
| |||
Gross unrealized appreciation | $ | 560,902 | ||
Gross unrealized depreciation | (3,044,498 | ) | ||
|
| |||
Net unrealized depreciation | $ | (2,483,596 | ) | |
|
|
1. Derivative Financial Instruments
The Fund may use derivatives in an effort to earn income and enhance returns, to replace more traditional direct investments, to obtain exposure to otherwise inaccessible markets (collectively, “investment purposes”), or to hedge or adjust the risk profile of its portfolio.
The principal types of derivatives utilized by the Fund, as well as the methods in which they may be used are:
| • | Forward Currency Exchange Contracts |
The Fund may enter into forward currency exchange contracts in order to hedge its exposure to changes in foreign currency exchange rates on its foreign portfolio holdings, to hedge certain firm purchase and sales commitments denominated in foreign currencies and fornon-hedging purposes as a means of making direct investments in foreign currencies, as described below under “Currency Transactions”.
A forward currency exchange contract is a commitment to purchase or sell a foreign currency at a future date at a negotiated forward rate.
| abfunds.com | AB FLEXFEE HIGH YIELD PORTFOLIO | 75 | |
NOTES TO FINANCIAL STATEMENTS(continued)
The gain or loss arising from the difference between the original contract and the closing of such contract would be included in net realized gain or loss on forward currency exchange contracts. Fluctuations in the value of open forward currency exchange contracts are recorded for financial reporting purposes as unrealized appreciation and/or depreciation by the Fund. Risks may arise from the potential inability of a counterparty to meet the terms of a contract and from unanticipated movements in the value of a foreign currency relative to the U.S. dollar.
During the period ended December 31, 2018, the Fund held forward currency exchange contracts for hedging and non-hedging purposes.
| • | Futures |
The Fund may buy or sell futures for investment purposes or for the purpose of hedging its portfolio against adverse effects of potential movements in the market. The Fund bears the market risk that arises from changes in the value of these instruments and the imperfect correlation between movements in the price of the futures and movements in the price of the assets, reference rates or indices which they are designed to track. Among other things, the Fund may purchase or sell futures for foreign currencies or options thereon fornon-hedging purposes as a means of making direct investment in foreign currencies, as described below under “Currency Transactions”.
At the time the Fund enters into a future, the Fund deposits and maintains as collateral an initial margin with the broker, as required by the exchange on which the transaction is effected. Such amount is shown as cash collateral due from broker on the statement of assets and liabilities. Pursuant to the contract, the Fund agrees to receive from or pay to the broker an amount of cash equal to the daily fluctuation in the value of the contract. Such receipts or payments are known as variation margin and are recorded by the Fund as unrealized gains or losses. Risks may arise from the potential inability of a counterparty to meet the terms of the contract. The credit/counterparty risk for exchange-traded futures is generally less than privately negotiated futures, since the clearinghouse, which is the issuer or counterparty to each exchange-traded future, has robust risk mitigation standards, including the requirement to provide initial and variation margin. When the contract is closed, the Fund records realized gain or loss equal to the difference between the value of the contract at the time it was opened and the time it was closed.
Use of long futures subjects the Fund to risk of loss in excess of the amounts shown on the statement of assets and liabilities, up to the notional value of the future. Use of short futures subjects the Fund to unlimited risk of loss. Under some circumstances, futures exchanges
| 76 | AB FLEXFEE HIGH YIELD PORTFOLIO | abfunds.com | |
NOTES TO FINANCIAL STATEMENTS(continued)
may establish daily limits on the amount that the price of a future can vary from the previous day’s settlement price, which could effectively prevent liquidation of unfavorable positions.
During the period ended December 31, 2018, the Fund held futures for hedging purposes.
| • | Option Transactions |
For hedging and investment purposes, the Fund may purchase and write (sell) put and call options on U.S. and foreign securities, including government securities, and foreign currencies that are traded on U.S. and foreign securities exchanges andover-the-counter markets. Among other things, the Fund may use options transactions fornon-hedging purposes as a means of making direct investments in foreign currencies, as described below under “Currency Transactions” and may use options strategies involving the purchase and/or writing of various combinations of call and/or put options, for hedging and investment purposes.
The risk associated with purchasing an option is that the Fund pays a premium whether or not the option is exercised. Additionally, the Fund bears the risk of loss of the premium and change in market value should the counterparty not perform under the contract. If a put or call option purchased by the Fund were permitted to expire without being sold or exercised, its premium would represent a loss to the Fund. Put and call options purchased are accounted for in the same manner as portfolio securities. The cost of securities acquired through the exercise of call options is increased by premiums paid. The proceeds from securities sold through the exercise of put options are decreased by the premiums paid.
The Fund may also invest in options on swaps, also called “swaptions”. A swaption is an option that gives the buyer the right, but not the obligation, to enter into a swap on a future date in exchange for paying a market-based “premium”. A receiver swaption gives the owner the right to receive the total return of a specified asset, reference rate, or index. A payer swaption gives the owner the right to pay the total return of a specified asset, reference rate, or index. Swaptions also include options that allow an existing swap to be terminated or extended by one of the counterparties. The fund’s maximum payment for written put swaptions equates to the notional amount of the underlying swap. In certain circumstances maximum payout amounts may be partially offset by recovery values of the respective referenced assets and upfront premium received upon entering into the contract.
| abfunds.com | AB FLEXFEE HIGH YIELD PORTFOLIO | 77 | |
NOTES TO FINANCIAL STATEMENTS(continued)
During the period ended December 31, 2018, the Fund held purchased options for non-hedging purposes.
During the period ended December 31, 2018, the Fund held purchased swaptions for non-hedging purposes.
During the period ended December 31, 2018, the Fund held written swaptions for non-hedging purposes.
| • | Swaps |
The Fund may enter into swaps to hedge its exposure to interest rates, credit risk, or currencies. The Fund may also enter into swaps fornon-hedging purposes as a means of gaining market exposures including by making direct investments in foreign currencies, as described below under “Currency Transactions”. A swap is an agreement that obligates two parties to exchange a series of cash flows at specified intervals based upon or calculated by reference to changes in specified prices or rates for a specified amount of an underlying asset. The payment flows are usually netted against each other, with the difference being paid by one party to the other. In addition, collateral may be pledged or received by the Fund in accordance with the terms of the respective swaps to provide value and recourse to the Fund or its counterparties in the event of default, bankruptcy or insolvency by one of the parties to the swap.
Risks may arise as a result of the failure of the counterparty to the swap to comply with the terms of the swap. The loss incurred by the failure of a counterparty is generally limited to the net interim payment to be received by the Fund, and/or the termination value at the end of the contract. Therefore, the Fund considers the creditworthiness of each counterparty to a swap in evaluating potential counterparty risk. This risk is mitigated by having a netting arrangement between the Fund and the counterparty and by the posting of collateral by the counterparty to the Fund to cover the Fund’s exposure to the counterparty. Additionally, risks may arise from unanticipated movements in interest rates or in the value of the underlying securities. The Fund accrues for the interim payments on swaps on a daily basis, with the net amount recorded within unrealized appreciation/depreciation of swaps on the statement of assets and liabilities, where applicable. Once the interim payments are settled in cash, the net amount is recorded as realized gain/(loss) on swaps on the statement of operations, in addition to any realized gain/(loss) recorded upon the termination of swaps. Upfront premiums paid or received for OTC swaps are recognized as cost or proceeds on the statement of assets and liabilities and are amortized on a straight line basis over the life of the contract. Amortized upfront premiums are included in net realized gain/(loss) from swaps on the statement of operations. Fluctuations in
| 78 | AB FLEXFEE HIGH YIELD PORTFOLIO | abfunds.com | |
NOTES TO FINANCIAL STATEMENTS(continued)
the value of swaps are recorded as a component of net change in unrealized appreciation/depreciation of swaps on the statement of operations.
Certain standardized swaps, including certain interest rate swaps and credit default swaps, are (or soon will be) subject to mandatory central clearing. Cleared swaps are transacted through futures commission merchants (“FCMs”) that are members of central clearinghouses, with the clearinghouse serving as central counterparty, similar to transactions in futures contracts. Centralized clearing will be required for additional categories of swaps on aphased-in basis based on requirements published by the Securities and Exchange Commission and Commodity Futures Trading Commission.
At the time the Fund enters into a centrally cleared swap, the Fund deposits and maintains as collateral an initial margin with the broker, as required by the clearinghouse on which the transaction is effected. Such amount is shown as cash collateral due from broker on the statement of assets and liabilities. Pursuant to the contract, the Fund agrees to receive from or pay to the broker an amount of cash equal to the daily fluctuation in the value of the contract. Such receipts or payments are known as variation margin and are recorded by the Fund as unrealized gains or losses. Risks may arise from the potential inability of a counterparty to meet the terms of the contract. The credit/counterparty risk for centrally cleared swaps is generally less thannon-centrally cleared swaps, since the clearinghouse, which is the issuer or counterparty to each centrally cleared swap, has robust risk mitigation standards, including the requirement to provide initial and variation margin. When the contract is closed, the Fund records a realized gain or loss equal to the difference between the value of the contract at the time it was opened and the time it was closed.
Interest Rate Swaps:
The Fund is subject to interest rate risk exposure in the normal course of pursuing its investment objectives. Because the Fund holds fixed rate bonds, the value of these bonds may decrease if interest rates rise. To help hedge against this risk and to maintain its ability to generate income at prevailing market rates, the Fund may enter into interest rate swaps. Interest rate swaps are agreements between two parties to exchange cash flows based on a notional amount. The Fund may elect to pay a fixed rate and receive a floating rate, or, receive a fixed rate and pay a floating rate on a notional amount.
In addition, the Fund may also enter into interest rate swap transactions to preserve a return or spread on a particular investment or portion of its portfolio, or protecting against an increase in the price of securities the Fund anticipates purchasing at a later date. Interest
| abfunds.com | AB FLEXFEE HIGH YIELD PORTFOLIO | 79 | |
NOTES TO FINANCIAL STATEMENTS(continued)
rate swaps involve the exchange by a Fund with another party of their respective commitments to pay or receive interest (e.g., an exchange of floating rate payments for fixed rate payments) computed based on a contractually-based principal (or “notional”) amount. Interest rate swaps are entered into on a net basis (i.e., the two payment streams are netted out, with the Fund receiving or paying, as the case may be, only the net amount of the two payments).
During period ended December 31, 2018, the Fund held interest rate swaps for hedging purposes.
Credit Default Swaps:
The Fund may enter into credit default swaps, including to manage its exposure to the market or certain sectors of the market, to reduce its risk exposure to defaults by corporate and sovereign issuers held by the Fund, or to create exposure to corporate or sovereign issuers to which it is not otherwise exposed. The Fund may purchase credit protection (“Buy Contract”) or provide credit protection (“Sale Contract”) on the referenced obligation of the credit default swap. During the term of the swap, the Fund receives/(pays) fixed payments from/(to) the respective counterparty, calculated at the agreed upon rate applied to the notional amount. If the Fund is a buyer/(seller) of protection and a credit event occurs, as defined under the terms of the swap, the Fund will either (i) receive from the seller/(pay to the buyer) of protection an amount equal to the notional amount of the swap (the “Maximum Payout Amount”) and deliver/(take delivery of) the referenced obligation or (ii) receive/(pay) a net settlement amount in the form of cash or securities equal to the notional amount of the swap less the recovery value of the referenced obligation.
In certain circumstances Maximum Payout Amounts may be partially offset by recovery values of the respective referenced obligations, upfront premium received upon entering into the agreement, or net amounts received from settlement of buy protection credit default swaps entered into by the Fund for the same referenced obligation with the same counterparty. As of December 31, 2018, the Fund had Buy Contracts outstanding with respect to the same referenced obligation and counterparty as certain Sales Contracts which may partially offset the Maximum Payout Amount in the amount of $98,000.
Credit default swaps may involve greater risks than if the Fund had invested in the referenced obligation directly. Credit default swaps are subject to general market risk, liquidity risk, counterparty risk and credit risk. If the Fund is a buyer of protection and no credit event occurs, it will lose the payments it made to its counterparty. If the Fund is a seller of protection and a credit event occurs, the value of the referenced
| 80 | AB FLEXFEE HIGH YIELD PORTFOLIO | abfunds.com | |
NOTES TO FINANCIAL STATEMENTS(continued)
obligation received by the Fund coupled with the periodic payments previously received may be less than the Maximum Payout Amount it pays to the buyer, resulting in a net loss to the Fund.
Implied credit spreads over Treasuries of comparable maturity utilized in determining the market value of credit default swaps on issuers as of period end are disclosed in the portfolio of investments. The implied spreads serve as an indicator of the current status of the payment/performance risk and typically reflect the likelihood of default by the issuer on the referenced obligation. The implied credit spread of a particular reference entity reflects the cost of buying/selling protection and may include upfront payments required to be made to enter into the agreement. Widening credit spreads typically represent a deterioration of the referenced entity’s credit soundness and greater likelihood of default or other credit event occurring as defined under the terms of the agreement. A credit spread identified as “Defaulted” indicates a credit event has occurred for the referenced entity or obligation.
During the period ended December 31, 2018, the Fund held credit default swaps for hedging and non-hedging purposes.
Total Return Swaps:
The Fund may enter into total return swaps in order to take a “long” or “short” position with respect to an underlying referenced asset. The Fund is subject to market price volatility of the underlying referenced asset. A total return swap involves commitments to pay interest in exchange for a market linked return based on a notional amount. To the extent that the total return of the security, group of securities or index underlying the transaction exceeds or falls short of the offsetting interest obligation, the Fund will receive a payment from or make a payment to the counterparty.
During the period ended December 31, 2018, the Fund held total return swaps for non-hedging purposes.
The Fund typically enters into International Swaps and Derivatives Association, Inc. Master Agreements (“ISDA Master Agreement”) with its OTC derivative contract counterparties in order to, among other things, reduce its credit risk to OTC counterparties. ISDA Master Agreements include provisions for general obligations, representations, collateral and events of default or termination. Under an ISDA Master Agreement, the Fund typically may offset with the OTC counterparty certain derivative financial instruments’ payables and/or receivables with collateral held and/or posted and create one single net payment(close-out netting) in the event of default or termination. In the event of a default by an OTC counterparty,
| abfunds.com | AB FLEXFEE HIGH YIELD PORTFOLIO | 81 | |
NOTES TO FINANCIAL STATEMENTS(continued)
the return of collateral with market value in excess of the Fund’s net liability, held by the defaulting party, may be delayed or denied.
The Fund’s ISDA Master Agreements may contain provisions for early termination of OTC derivative transactions in the event the net assets of the Fund decline below specific levels (“net asset contingent features”). If these levels are triggered, the Fund’s OTC counterparty has the right to terminate such transaction and require the Fund to pay or receive a settlement amount in connection with the terminated transaction. If OTC derivatives were held at period end, please refer to netting arrangements by the OTC counterparty table below for additional details.
During the period ended December 31, 2018, the Fund had entered into the following derivatives:
Asset Derivatives | Liability Derivatives | |||||||||||
Derivative Type | Statement of | Fair Value | Statement of | Fair Value | ||||||||
Interest rate contracts | Receivable/Payable for variation margin on futures | $ | 44,955 | * | Receivable/Payable for variation margin on futures | $ | 1,948 | * | ||||
Interest rate contracts | Receivable/Payable for variation margin on centrally cleared swaps |
| 191,140 | * | Receivable/Payable for variation margin on centrally cleared swaps |
| 159,389 | * | ||||
Foreign currency contracts | Unrealized appreciation on forward currency exchange contracts |
| 30,770 |
| Unrealized depreciation on forward currency exchange contracts |
| 6,946 |
| ||||
Credit contracts | Investment in securities, at value | 5,310 | ||||||||||
Credit contracts | Market value of credit default swaps | 102,864 | Market value of credit default swaps | 136,183 | ||||||||
Credit contracts | Receivable/Payable for variation margin on centrally cleared swaps | 4 | * | Receivable/Payable for variation margin on centrally cleared swaps | 1,925 | * | ||||||
Credit contracts | Swaptions written, at value | 6,793 | ||||||||||
Equity contracts | Unrealized depreciation on total return swaps | 7,155 | ||||||||||
| 82 | AB FLEXFEE HIGH YIELD PORTFOLIO | abfunds.com | |
NOTES TO FINANCIAL STATEMENTS(continued)
Asset Derivatives | Liability Derivatives | |||||||||||
Derivative Type | Statement of | Fair Value | Statement of | Fair Value | ||||||||
Equity contracts | Receivable/Payable for variation margin on futures | $ | 5,532 | * | ||||||||
|
|
|
| |||||||||
Total | $ | 375,043 | $ | 325,871 | ||||||||
|
|
|
| |||||||||
| * | Only variation margin receivable/payable at period end is reported within the statement of assets and liabilities. This amount reflects cumulative unrealized appreciation/depreciation on futures and centrally cleared swaps as reported in the portfolio of investments. |
Derivative Type | Location of Gain or | Realized Gain or (Loss) on Derivatives | Change in Unrealized Appreciation or (Depreciation) | |||||||
Interest rate contracts | Net realized gain/(loss) on swaps; Net change in unrealized appreciation/ depreciation on swaps | $ | 11,850 | $ | (29,856 | ) | ||||
Interest rate contracts | Net realized gain/(loss) on futures; Net change in unrealized appreciation/ depreciation on futures | (13,117 | ) | 65,145 | ||||||
Foreign currency contracts | Net realized gain/(loss) on forward currency exchange contracts; Net change in unrealized appreciation/depreciation on forward currency exchange contracts | (10,814 | ) | 9,867 | ||||||
Foreign currency contracts | Net realized gain/(loss) on investment transactions; Net change in unrealized appreciation/depreciation on investments | (2,898 | ) | – 0 | – | |||||
Credit contracts | Net realized gain/(loss) on investment transactions; Net change in unrealized appreciation/depreciation on investments | – 0 | – | (3,225 | ) | |||||
| abfunds.com | AB FLEXFEE HIGH YIELD PORTFOLIO | 83 | |
NOTES TO FINANCIAL STATEMENTS(continued)
Derivative Type | Location of Gain or | Realized Gain or (Loss) on Derivatives | Change in Unrealized Appreciation or (Depreciation) | |||||||
Credit contracts | Net realized gain/(loss) on swaps; Net change in unrealized appreciation/ depreciation on swaps | $ | 9,868 | $ | (23,902 | ) | ||||
Credit contracts | Net realized gain/(loss) on swaptions written; Net change in unrealized appreciation/depreciation on swaptions written | – 0 | – | 3,125 | ||||||
Equity contracts | Net realized gain/(loss) on swaps; Net change in unrealized appreciation/ depreciation on swaps | (83,429 | ) | 2,104 | ||||||
Equity contracts | Net realized gain/(loss) on futures; Net change in unrealized appreciation/depreciation on futures | (10,141 | ) | 1,790 | ||||||
Equity contracts | Net realized gain/(loss) on investment transactions; Net change in unrealized appreciation/depreciation on investments | (2,084 | ) | 1,434 | ||||||
|
|
|
| |||||||
Total | $ | (100,765 | ) | $ | 26,482 | |||||
|
|
|
| |||||||
The following table represents the average monthly volume of the Fund’s derivative transactions during the period ended December 31, 2018.
Centrally Cleared Credit Default Swaps: | ||||
Average original value of buy contracts | $ | 241,252 | ||
Average original value of sale contracts | $ | 360,725 | ||
Centrally Cleared Interest Rate Swaps: | ||||
Average notional amount of contracts | $ | 13,207,000 | ||
Credit Default Swaps: | ||||
Average notional amount of buy contracts | $ | 625,262 | ||
Average notional amount of sale contracts | $ | 1,036,482 | ||
Futures: | ||||
Average original value of buy contracts | $ | 1,990,918 | ||
Average original value of sale contracts | $ | 1,094,553 | ||
Forward Currency Exchange Contracts: | ||||
Average principal amount of buy contracts | $ | 433,691 | ||
Average principal amount of sale contracts | $ | 2,685,900 |
| 84 | AB FLEXFEE HIGH YIELD PORTFOLIO | abfunds.com | |
NOTES TO FINANCIAL STATEMENTS(continued)
Total Return Swaps: | ||||
Average notional amount | $ | 4,819,507 | ||
Purchased Options: | ||||
Average notional amount | $ | 13,000 | (a) | |
Purchased Swaptions: | ||||
Average notional amount | $ | 1,145,667 | ||
Swaptions Written: | ||||
Average notional amount | $ | 1,145,667 |
| (a) | Positions were open for one month during the reporting period. |
For financial reporting purposes, the Fund does not offset derivative assets and derivative liabilities that are subject to netting arrangements in the statement of assets and liabilities.
All OTC derivatives held at period end were subject to netting arrangements. The following table presents the Fund’s derivative assets and liabilities by OTC counterparty net of amounts available for offset under ISDA Master Agreements (“MA”) and net of the related collateral received/pledged by the Fund as of December 31, 2018. Exchange-traded derivatives and centrally cleared swaps are not subject to netting arrangements and as such are excluded from the table.
Counterparty | Derivative Assets Subject to a MA | Derivatives Available for Offset | Cash Collateral Received* | Security Collateral Received* | Net Amount of Derivatives Assets | |||||||||||||||
Barclays Bank PLC | $ | 271 | $ | (271 | ) | $ | – 0 | – | $ | – 0 | – | $ | – 0 | – | ||||||
Brown Brothers Harriman & Co. | 25,329 | (4,829 | ) | – 0 | – | – 0 | – | 20,500 | ||||||||||||
Citibank, NA | 8,190 | – 0 | – | – 0 | – | – 0 | – | 8,190 | ||||||||||||
Credit Suisse International | 62,814 | (28,405 | ) | – 0 | – | – 0 | – | 34,409 | ||||||||||||
Deutsche Bank AG | 6,326 | (6,326 | ) | – 0 | – | – 0 | – | – 0 | – | |||||||||||
Goldman Sachs Bank USA/ Goldman Sachs International | 31,709 | (31,709 | ) | – 0 | – | – 0 | – | – 0 | – | |||||||||||
Morgan Stanley & Co. International PLC/ Morgan Stanley Capital Services LLC | 4,305 | (1,901 | ) | – 0 | – | – 0 | – | 2,404 | ||||||||||||
|
|
|
|
|
|
|
|
|
| |||||||||||
Total | $ | 138,944 | $ | (73,441 | ) | $ | – 0 | – | $ | – 0 | – | $ | 65,503 | ^ | ||||||
|
|
|
|
|
|
|
|
|
| |||||||||||
| abfunds.com | AB FLEXFEE HIGH YIELD PORTFOLIO | 85 | |
NOTES TO FINANCIAL STATEMENTS(continued)
Counterparty | Derivative Liabilities Subject to a MA | Derivatives Available for Offset | Cash Collateral Pledged* | Security Collateral Pledged* | Net Amount of Derivatives Liabilities | |||||||||||||||
Barclays Bank PLC | $ | 6,095 | $ | (271 | ) | $ | – 0 | – | $ | – 0 | – | $ | 5,824 | |||||||
Brown Brothers Harriman & Co. | 4,829 | (4,829 | ) | – 0 | – | – 0 | – | – 0 | – | |||||||||||
Credit Suisse International | 28,405 | (28,405 | ) | – 0 | – | – 0 | – | – 0 | – | |||||||||||
Deutsche Bank AG | 58,463 | (6,326 | ) | – 0 | – | – 0 | – | 52,137 | ||||||||||||
Goldman Sachs Bank USA/ Goldman Sachs International | 51,251 | (31,709 | ) | – 0 | – | – 0 | – | 19,542 | ||||||||||||
JPMorgan Chase Bank, NA | 5,917 | – 0 | – | – 0 | – | – 0 | – | 5,917 | ||||||||||||
Morgan Stanley & Co. International PLC/ Morgan Stanley Capital Services LLC | 1,901 | (1,901 | ) | – 0 | – | – 0 | – | – 0 | – | |||||||||||
Standard Chartered Bank | 216 | – 0 | – | – 0 | – | – 0 | – | 216 | ||||||||||||
|
|
|
|
|
|
|
|
|
| |||||||||||
Total | $ | 157,077 | $ | (73,441 | ) | $ | – 0 | – | $ | – 0 | – | $ | 83,636 | ^ | ||||||
|
|
|
|
|
|
|
|
|
| |||||||||||
| * | The actual collateral received/pledged may be more than the amount reported due to overcollateralization. |
| ^ | Net amount represents the net receivable/payable that would be due from/to the counterparty in the event of default or termination. The net from OTC financial derivative instruments can only be netted across transactions governed under the same master agreement with the same counterparty. |
2. Currency Transactions
The Fund may invest innon-U.S. Dollar-denominated securities on a currency hedged or unhedged basis. The Fund may seek investment opportunities by taking long or short positions in currencies through the use of currency-related derivatives, including forward currency exchange contracts, futures and options on futures, swaps, and other options. The Fund may enter into transactions for investment opportunities when it anticipates that a foreign currency will appreciate or depreciate in value but securities denominated in that currency are not held by the Fund and do not present attractive investment opportunities. Such transactions may also be used when the Adviser believes that it may be more efficient than a direct investment in a foreign currency-denominated security. The Fund may also conduct currency exchange contracts on a spot basis (i.e., for cash at the spot rate prevailing in the currency exchange market for buying or selling currencies).
3. Loan Participations and Assignments
The Fund may invest in direct debt instruments which are interests in amounts owed to lenders or lending syndicates by corporate, governmental, or other borrowers, either in the form of participations at the time the loan is originated (“Participations”) or by buying an interest in the loan in the secondary market from a financial institution or institutional
| 86 | AB FLEXFEE HIGH YIELD PORTFOLIO | abfunds.com | |
NOTES TO FINANCIAL STATEMENTS(continued)
investor (“Assignments”). A loan is often administered by a bank or other financial institution (the “Lender”) that acts as agent for all holders. The agent administers the term of the loan as specified in the loan agreement. When investing in Participations, the Fund generally has no right to enforce compliance with the terms of the loan agreement with the borrower. In addition, when investing in Participations, the Fund has the right to receive payments of principal, interest and any fees to which it is entitled only from the Lender and only upon receipt of payments by the Lender from the borrower. As a result, the Fund may be subject to the credit risk of both the borrower and the Lender. When the Fund purchases Assignments from Lenders, it will typically acquire direct rights against the borrower on the loan. These loans may include participations in “bridge loans”, which are loans taken out by borrowers for a short period (typically less than six months) pending arrangement of more permanent financing through, for example, the issuance of bonds, frequently high-yield bonds issued for the purpose of acquisitions. The Fund may also participate in unfunded loan commitments, which are contractual obligations for investing in future Participations, and may receive a commitment fee based on the amount of the commitment. Under these arrangements, the Fund may receive a fixed rate commitment fee and, if and to the extent the borrower borrows under the facility, the Fund may receive an additional funding fee.
Unfunded loan commitments and funded loans are marked to market daily.
As of December 31, 2018, the Fund had no unfunded loan commitments outstanding.
As of December 31, 2018, the Fund had no bridge loan commitments outstanding.
During the period ended December 31, 2018, the Fund received no commitment fees.
During the period ended December 31, 2018, the Fund received no additional funding fees.
| abfunds.com | AB FLEXFEE HIGH YIELD PORTFOLIO | 87 | |
NOTES TO FINANCIAL STATEMENTS(continued)
NOTE E
Capital Stock
Each class consists of 3,000,000,000 authorized shares. Transactions in capital shares for each class were as follows:
| Shares | Amount | |||||||||||||||||||||||||||||||
November 1, 2018(a) | Year Ended 2018 | Year Ended 2017 | November 1, 2018(a) | Year Ended 2018 | Year Ended 2017 | |||||||||||||||||||||||||||
|
| |||||||||||||||||||||||||||||||
| Class A* | ||||||||||||||||||||||||||||||||
Shares sold | – 0 | – | 80,300 | 620,290 | $ | – 0 | – | $ | 773,372 | $ | 5,947,158 | |||||||||||||||||||||
| ||||||||||||||||||||||||||||||||
Shares issued in reinvestment of dividends | – 0 | – | 4,572 | 15,431 | – 0 | – | 44,190 | 149,397 | ||||||||||||||||||||||||
| ||||||||||||||||||||||||||||||||
Shares converted to Advisor Class | – 0 | – | (327,609 | ) | – 0 | – | – 0 | – | (3,130,897 | ) | – 0 | – | ||||||||||||||||||||
| ||||||||||||||||||||||||||||||||
Shares redeemed | – 0 | – | (287,805 | ) | (230,551 | ) | – 0 | – | (2,784,633 | ) | (2,216,354 | ) | ||||||||||||||||||||
| ||||||||||||||||||||||||||||||||
Net increase (decrease) | – 0 | – | (530,542 | ) | 405,170 | $ | – 0 | – | $ | (5,097,968 | ) | $ | 3,880,201 | |||||||||||||||||||
| ||||||||||||||||||||||||||||||||
| Class C* | ||||||||||||||||||||||||||||||||
Shares sold | – 0 | – | 8,025 | 72,483 | $ | – 0 | – | $ | 77,391 | $ | 701,341 | |||||||||||||||||||||
| ||||||||||||||||||||||||||||||||
Shares issued in reinvestment of dividends | – 0 | – | 134 | 1,866 | – 0 | – | 1,301 | 18,024 | ||||||||||||||||||||||||
| ||||||||||||||||||||||||||||||||
Shares converted to Advisor Class | – 0 | – | (101,817 | ) | – 0 | – | – 0 | – | (973,623 | ) | – 0 | – | ||||||||||||||||||||
| ||||||||||||||||||||||||||||||||
Shares redeemed | – 0 | – | (10,994 | ) | (8,568 | ) | – 0 | – | (105,962 | ) | (82,849 | ) | ||||||||||||||||||||
| ||||||||||||||||||||||||||||||||
Net increase (decrease) | – 0 | – | (104,652 | ) | 65,781 | $ | – 0 | – | $ | (1,000,893 | ) | $ | 636,516 | |||||||||||||||||||
| ||||||||||||||||||||||||||||||||
| Advisor Class |
| |||||||||||||||||||||||||||||||
Shares sold | 371,197 | 2,150,314 | 416,754 | $ | 3,479,652 | $ | 20,535,226 | $ | 4,010,347 | |||||||||||||||||||||||
| ||||||||||||||||||||||||||||||||
Shares converted from: | ||||||||||||||||||||||||||||||||
Class A | – 0 | – | 327,383 | – 0 | – | – 0 | – | 3,130,897 | – 0 | – | ||||||||||||||||||||||
Class C | – 0 | – | 101,807 | – 0 | – | – 0 | – | 973,623 | – 0 | – | ||||||||||||||||||||||
Class R | – 0 | – | 4,192 | – 0 | – | – 0 | – | 40,092 | – 0 | – | ||||||||||||||||||||||
Class I | – 0 | – | 1,800,976 | – 0 | – | – 0 | – | 17,223,455 | – 0 | – | ||||||||||||||||||||||
Class Z | – 0 | – | 43,624 | – 0 | – | – 0 | – | 417,196 | – 0 | – | ||||||||||||||||||||||
| ||||||||||||||||||||||||||||||||
Shares issued in reinvestment of dividends | 20,649 | 37,893 | 14,028 | 184,654 | 360,732 | 135,720 | ||||||||||||||||||||||||||
| ||||||||||||||||||||||||||||||||
Shares redeemed | (592,586 | ) | (1,266,839 | ) | (288,688 | ) | (5,431,858 | ) | (12,085,551 | ) | (2,762,280 | ) | ||||||||||||||||||||
| ||||||||||||||||||||||||||||||||
Net increase (decrease) | (200,740 | ) | 3,199,350 | 142,094 | $ | (1,767,552 | ) | $ | 30,595,670 | $ | 1,383,787 | |||||||||||||||||||||
| ||||||||||||||||||||||||||||||||
| 88 | AB FLEXFEE HIGH YIELD PORTFOLIO | abfunds.com | |
NOTES TO FINANCIAL STATEMENTS(continued)
| Shares | Amount | |||||||||||||||||||||||||||||||
November 1, 2018(a) | Year Ended 2018 | Year 2017 | November 1, 2018(a) | Year Ended 2018 | Year Ended 2017 | |||||||||||||||||||||||||||
|
| |||||||||||||||||||||||||||||||
| Class R* | ||||||||||||||||||||||||||||||||
Shares sold | – 0 | – | 689 | 3,868 | $ | – 0 | – | $ | 6,677 | $ | 37,554 | |||||||||||||||||||||
| ||||||||||||||||||||||||||||||||
Shares issued in reinvestment of dividends | – 0 | – | 37 | 169 | – 0 | – | 356 | 1,638 | ||||||||||||||||||||||||
| ||||||||||||||||||||||||||||||||
Shares converted to Advisor Class | – 0 | – | (4,194 | ) | – 0 | – | – 0 | – | (40,092 | ) | – 0 | – | ||||||||||||||||||||
| ||||||||||||||||||||||||||||||||
Shares redeemed | – 0 | – | – 0 | – | (3,852 | ) | – 0 | – | – 0 | – | (37,236 | ) | ||||||||||||||||||||
| ||||||||||||||||||||||||||||||||
Net increase (decrease) | – 0 | – | (3,468 | ) | 185 | $ | – 0 | – | $ | (33,059 | ) | $ | 1,956 | |||||||||||||||||||
| ||||||||||||||||||||||||||||||||
| Class K | ||||||||||||||||||||||||||||||||
Shares sold | – 0 | – | – 0 | – | 2 | $ | – 0 | – | $ | – 0 | – | $ | 17 | |||||||||||||||||||
| ||||||||||||||||||||||||||||||||
Shares redeemed | – 0 | – | (1,002 | ) | – 0 | – | – 0 | – | (9,526 | ) | – 0 | – | ||||||||||||||||||||
| ||||||||||||||||||||||||||||||||
Net increase (decrease) | – 0 | – | (1,002 | ) | 2 | $ | – 0 | – | $ | (9,526 | ) | $ | 17 | |||||||||||||||||||
| ||||||||||||||||||||||||||||||||
| Class I* | ||||||||||||||||||||||||||||||||
Shares sold | – 0 | – | 17,953 | 12,323 | $ | – 0 | – | $ | 174,977 | $ | 118,537 | |||||||||||||||||||||
| ||||||||||||||||||||||||||||||||
Shares issued in reinvestment of dividends | – 0 | – | 121 | 396 | – 0 | – | 1,168 | 3,837 | ||||||||||||||||||||||||
| ||||||||||||||||||||||||||||||||
Shares converted to Advisor Class | – 0 | – | (1,801,240 | ) | – 0 | – | – 0 | – | (17,223,455 | ) | – 0 | – | ||||||||||||||||||||
| ||||||||||||||||||||||||||||||||
Shares redeemed | – 0 | – | (18,194 | ) | (1,690 | ) | – 0 | – | (176,546 | ) | (16,315 | ) | ||||||||||||||||||||
| ||||||||||||||||||||||||||||||||
Net increase (decrease) | – 0 | – | (1,801,360 | ) | 11,029 | $ | – 0 | – | $ | (17,223,856 | ) | $ | 106,059 | |||||||||||||||||||
| ||||||||||||||||||||||||||||||||
| Class Z* | ||||||||||||||||||||||||||||||||
Shares sold | – 0 | – | 23,116 | 53,745 | $ | – 0 | – | $ | 223,599 | $ | 520,610 | |||||||||||||||||||||
| ||||||||||||||||||||||||||||||||
Shares issued in reinvestment of dividends | – 0 | – | 737 | 143,778 | – 0 | – | 7,117 | 1,376,188 | ||||||||||||||||||||||||
| ||||||||||||||||||||||||||||||||
Shares converted to Advisor Class | – 0 | – | (43,670 | ) | – 0 | – | – 0 | – | (417,196 | ) | – 0 | – | ||||||||||||||||||||
| ||||||||||||||||||||||||||||||||
Shares redeemed | – 0 | – | (31,611 | ) | (7,041,947 | ) | – 0 | – | (303,465 | ) | (68,123,442 | ) | ||||||||||||||||||||
| ||||||||||||||||||||||||||||||||
Net decrease | – 0 | – | (51,428 | ) | (6,844,424 | ) | $ | – 0 | – | $ | (489,945 | ) | $ | (66,226,644 | ) | |||||||||||||||||
| ||||||||||||||||||||||||||||||||
| (a) | The Fund changed its fiscal year end from October 31 to December 31. |
| * | Converted to Advisor Class on February 26, 2018. |
| abfunds.com | AB FLEXFEE HIGH YIELD PORTFOLIO | 89 | |
NOTES TO FINANCIAL STATEMENTS(continued)
At December 31, 2018, the Adviser owned 52% of the Fund’s outstanding shares. Significant transactions by such shareholder, if any, may impact the Fund’s performance.
NOTE F
Risks Involved in Investing in the Fund
Interest Rate Risk and Credit Risk—Interest rate risk is the risk that changes in interest rates will affect the value of the Fund’s investments in fixed-income debt securities such as bonds or notes. Increases in interest rates may cause the value of the Fund’s investments to decline. Credit risk is the risk that the issuer or guarantor of a debt security, or the counterparty to a derivative contract, will be unable or unwilling to make timely principal and/or interest payments, or to otherwise honor its obligations. The degree of risk for a particular security may be reflected in its credit rating. Credit risk is greater for medium quality and lower-rated securities. Lower-rated debt securities and similar unrated securities (commonly known as “junk bonds”) have speculative elements or are predominantly speculative risks.
Below Investment Grade Securities Risk—Investments in fixed-income securities with lower ratings (commonly known as “junk bonds”) tend to have a higher probability that an issuer will default or fail to meet its payment obligations. These securities may be subject to greater price volatility due to such factors as specific corporate developments, negative perceptions of the junk bond market generally and less secondary market liquidity.
Duration Risk—Duration is a measure that relates the expected price volatility of a fixed-income security to changes in interest rates. The duration of a fixed-income security may be shorter than or equal to full maturity of a fixed-income security. Fixed-income securities with longer durations have more risk and will decrease in price as interest rates rise. For example, generally a fixed-income security with a duration of three years will decrease in value by approximately 3% if interest rates increase by 1%.
Inflation Risk—This is the risk that the value of assets or income from investments will be less in the future as inflation decreases the value of money. As inflation increases, the value of the Fund’s assets can decline as can the value of the Fund’s distributions. This risk is significantly greater if the Fund invests a significant portion of its assets in fixed-income securities with longer maturities.
Derivatives Risk—The Fund may enter into derivative transactions such as forwards, options, futures and swaps. Derivatives may be illiquid, difficult to price, and leveraged so that small changes may produce disproportionate
| 90 | AB FLEXFEE HIGH YIELD PORTFOLIO | abfunds.com | |
NOTES TO FINANCIAL STATEMENTS(continued)
losses for the Fund, and subject to counterparty risk to a greater degree than more traditional investments. Derivatives may result in significant losses, including losses that are far greater than the value of the derivatives reflected on the statement of assets and liabilities.
Leverage Risk—When the Fund borrows money or otherwise leverages its investments, its performance may be volatile because leverage tends to exaggerate the effect of any increase or decrease in the value of the Fund’s investments. The Fund may create leverage through the use of reverse repurchase arrangements, forward currency exchange contracts, forward commitments, dollar rolls or futures or by borrowing money. The use of other types of derivative instruments by the Fund, such as options and swaps, may also result in a form of leverage. Leverage may result in higher returns to the Fund than if the Fund were not leveraged, but may also adversely affect returns, particularly if the market is declining.
Foreign(Non-U.S.) Risk—Investments in securities ofnon-U.S. issuers may involve more risk than those of U.S. issuers. These securities may fluctuate more widely in price and may be less liquid due to adverse market, economic, political, regulatory or other factors.
Emerging Market Risk—Investments in emerging market countries may have more risk because the markets are less developed and less liquid, and because these investments may be subject to increased economic, political, regulatory or other uncertainties.
Currency Risk—Fluctuations in currency exchange rates may negatively affect the value of the Fund’s investments in fixed-income securities denominated in foreign currencies or reduce its returns.
Liquidity Risk—Liquidity risk occurs when certain investments become difficult to purchase or sell. Difficulty in selling less liquid securities may result in sales at disadvantageous prices affecting the value of your investment in the Fund. Causes of liquidity risk may include low trading volumes, large positions and heavy redemptions of Fund shares. Over recent years, liquidity risk has also increased because the capacity of dealers in the secondary market for fixed-income securities to make markets in these securities has decreased, even as the overall bond market has grown significantly, due to, among other things, structural changes, additional regulatory requirements and capital and risk restraints that have led to reduced inventories. Liquidity risk may be higher in a rising interest rate environment, when the value and liquidity of fixed-income securities generally decline.
| abfunds.com | AB FLEXFEE HIGH YIELD PORTFOLIO | 91 | |
NOTES TO FINANCIAL STATEMENTS(continued)
Indemnification Risk—In the ordinary course of business, the Fund enters into contracts that contain a variety of indemnifications. The Fund’s maximum exposure under these arrangements is unknown. However, the Fund has not had prior claims or losses pursuant to these indemnification provisions and expects the risk of loss thereunder to be remote. Therefore, the Fund has not accrued any liability in connection with these indemnification provisions.
NOTE G
Joint Credit Facility
A number ofopen-end mutual funds managed by the Adviser, including the Fund, participate in a $325 million revolving credit facility (the “Facility”) intended to provide short-term financing, if necessary, subject to certain restrictions in connection with abnormal redemption activity. Commitment fees related to the Facility are paid by the participating funds and are included in miscellaneous expenses in the statement of operations. The Fund did not utilize the Facility during the period ended December 31, 2018.
NOTE H
Distributions to Shareholders
The tax character of distributions paid during the fiscal period ended December 31, 2018 and years ended October 31, 2018 and October 31, 2017 were as follows:
| December 2018 | October 2018 | October 2017 | ||||||||||
Distributions paid from: | ||||||||||||
Ordinary income | $ | 485,472 | $ | 1,565,744 | $ | 2,559,016 | ||||||
|
|
|
|
|
| |||||||
Total taxable distributions paid | 485,472 | 1,565,744 | 2,559,016 | |||||||||
Return of capital | – 0 | – | – 0 | – | 267,088 | |||||||
|
|
|
|
|
| |||||||
Total distributions paid | $ | 485,472 | $ | 1,565,744 | $ | 2,826,104 | ||||||
|
|
|
|
|
| |||||||
As of December 31, 2018, the components of accumulated earnings/(deficit) on a tax basis were as follows:
Accumulated capital losses | $ | (9,429,229 | )(a) | |
Other losses | (31,538 | )(b) | ||
Unrealized appreciation/(depreciation) | (2,483,717 | )(c) | ||
|
| |||
Total accumulated earnings/(deficit) | $ | (11,944,484 | )(d) | |
|
|
| (a) | As of December 31, 2018, the Fund had a net capital loss carryforward of $9,429,229. |
| (b) | As of December 31, 2018, the Fund had a qualified late-year ordinary loss deferral of $31,298. As of December 31, 2018, the cumulative deferred loss on straddles was $240. |
| (c) | The differences between book-basis and tax-basis unrealized appreciation/(depreciation) are attributable primarily to the tax deferral of losses on wash sales, the tax treatment of swaps, the tax treatment of partnership investments, and the recognition for tax purposes of unrealized gains/losses on certain derivative instruments. |
| 92 | AB FLEXFEE HIGH YIELD PORTFOLIO | abfunds.com | |
NOTES TO FINANCIAL STATEMENTS(continued)
| (d) | The differences between book-basis and tax-basis components of accumulated earnings/(deficit) are attributable primarily to the tax treatment of defaulted securities and the accrual of foreign capital gains tax. |
For tax purposes, net realized capital losses may be carried over to offset future capital gains, if any. Funds are permitted to carry forward capital losses for an indefinite period, and such losses will retain their character as either short-term or long-term capital losses. As of December 31, 2018, the Fund had a net short-term capital loss carryforward of $5,782,854 and a net long-term capital loss carryforward of $3,646,375, which may be carried forward for an indefinite period.
During the current fiscal period, permanent differences primarily due to taxable overdistributions resulted in a net decrease in accumulated loss and a net decrease in additional paid-in capital. These reclassifications had no effect on net assets.
NOTE I
Merger and Reorganization
At a meeting held May3-5, 2016, the Board, on behalf of the Fund, and the Board of Trustees of the Accounting Survivor, approved the Reorganization Agreement providing for thetax-free acquisition by the Fund of the assets and liabilities of the Accounting Survivor. The acquisition was completed at the close of business July 26, 2016. Pursuant to the Reorganization Agreement, the assets and liabilities of the Accounting Survivor’s shares were transferred in exchange for the Fund’s Class Z shares, in atax-free exchange as follows:
| Shares outstanding before the Reorganization | Shares outstanding immediately after the Reorganization | Aggregate net assets before the Reorganization | Aggregate net assets immediately after the Reorganization | |||||||||||||
Accounting Survivor | 7,254,378 | – 0 | – | $ | 68,233,326 | + | $ | – 0 | – | |||||||
The Fund | 2,097,920 | 9,387,795 | $ | 19,642,348 | ++ | $ | 87,875,674 | |||||||||
| + | Includes undistributed net investment income of $404,396 and unrealized depreciation on investments of $1,497,163, with a fair value of $60,408,577 and identified cost of $61,905,740. |
| ++ | Includes unrealized depreciation of $370,906. |
NOTE J
Recent Accounting Pronouncements
In March 2017, the Financial Accounting Standards Board issued an Accounting Standards Update, ASU2017-08, Receivables—Nonrefundable Fees and Other Costs (Subtopic310-20), Premium Amortization on Purchased Callable Debt Securities which amends the amortization period for certain purchased callable debt securities held at a premium, shortening such
| abfunds.com | AB FLEXFEE HIGH YIELD PORTFOLIO | 93 | |
NOTES TO FINANCIAL STATEMENTS(continued)
period to the earliest call date. The ASU2017-08 does not require any accounting change for debt securities held at a discount; the discount continues to be amortized to maturity. The ASU2017-08 is effective for fiscal years, and interim periods within those fiscal years, beginning after December 15, 2018. At this time, management is evaluating the implications of these changes on the financial statements.
In August 2018, the Financial Accounting Standards Board issued an Accounting Standards Update, ASU2018-13, Fair Value Measurement (Topic 820), Disclosure Framework-Changes to the Disclosure Requirements for Fair Value Measurement which removes, modifies and adds disclosures to Topic 820. The amendments in this ASU2018-13 apply to all entities that are required, under existing U.S. GAAP, to make disclosures about recurring or nonrecurring fair value measurements. The amendments in this ASU2018-13 are effective for all entities for fiscal years, and interim periods within those fiscal years, beginning after December 15, 2019. At this time, management is evaluating the implications of these changes on the financial statements.
In October 2018, the U.S. Securities and Exchange Commission adopted amendments to certain disclosure requirements included in RegulationS-X that had become “redundant, duplicative, overlapping, outdated or superseded, in light of the other Commission disclosure requirements, GAAP or changes in the information environment.” The compliance date for the amendments to RegulationS-X was November 5, 2018 (for reporting period end dates of September 30, 2018 or after). Management has adopted the amendments which simplified certain disclosure requirements on the financial statements.
NOTE K
Subsequent Events
Management has evaluated subsequent events for possible recognition or disclosure in the financial statements through the date the financial statements are issued. Management has determined that there are no material events that would require disclosure in the Fund’s financial statements through this date.
| 94 | AB FLEXFEE HIGH YIELD PORTFOLIO | abfunds.com | |
FINANCIAL HIGHLIGHTS
Selected Data For A Share Of Capital Stock Outstanding Throughout Each Period
| Advisor Class | ||||||||||||||||||||
| November 1 2018 to December 31, 2018(a) | Year Ended October 31, | September 1, 2016 to October 31, 2016(b) | July 26, 2016(c) to August 31, 2016 | |||||||||||||||||
| 2018 | 2017 | |||||||||||||||||||
|
| |||||||||||||||||||
Net asset value, beginning of period | $ 9.36 | $ 9.71 | $ 9.46 | $ 9.44 | $ 9.36 | |||||||||||||||
|
| |||||||||||||||||||
Income From Investment Operations | ||||||||||||||||||||
Net investment income(d)(e) | .09 | .50 | .49 | .08 | # | .05 | ||||||||||||||
Net realized and unrealized gain (loss) on investment and foreign currency transactions | (.41 | ) | (.37 | ) | .24 | .01 | .08† | |||||||||||||
Contributions from Affiliates | – 0 | – | .00 | (f) | .00 | (f) | – 0 | – | – 0 | – | ||||||||||
|
| |||||||||||||||||||
Net increase in net asset value from operations | (.32 | ) | .13 | .73 | .09 | .13 | ||||||||||||||
|
| |||||||||||||||||||
Less: Dividends | ||||||||||||||||||||
Dividends from net investment income | (.14 | ) | (.48 | ) | (.43 | ) | (.07 | ) | (.05 | ) | ||||||||||
Return of capital | – 0 | – | – 0 | – | (.05 | ) | – 0 | – | – 0 | – | ||||||||||
|
| |||||||||||||||||||
Total dividends and distributions | (.14 | ) | (.48 | ) | (.48 | ) | (.07 | ) | (.05 | ) | ||||||||||
|
| |||||||||||||||||||
Net asset value, end of period | $ 8.90 | $ 9.36 | $ 9.71 | $ 9.46 | $ 9.44 | |||||||||||||||
|
| |||||||||||||||||||
Total Return | ||||||||||||||||||||
Total investment return based on net asset value(g)* | (3.45 | )% | 1.32 | %** | 7.89 | %+ | .94 | %+# | 1.35 | % | ||||||||||
Ratios/Supplemental Data | ||||||||||||||||||||
Net assets, end of period (000’s omitted) | $30,509 | $33,990 | $4,185 | $2,733 | $2,063 | |||||||||||||||
Ratio to average net assets of: | ||||||||||||||||||||
Expenses, net of waivers/reimbursements(i)† | .29 | %^ | .33 | %(h) | .71 | %(h) | .78 | %(h)^ | .81 | %(h)^ | ||||||||||
Expenses, before waivers/reimbursements(i)† | 3.25 | %^ | 2.56 | %(h) | 2.49 | %(h) | 3.18 | %(h)^ | 2.41 | %(h)^ | ||||||||||
Net investment income(e) | 5.73 | %^ | 5.20 | % | 5.11 | % | 4.90 | %^# | 5.30 | %^ | ||||||||||
Portfolio turnover rate | 5 | % | 75 | % | 65 | % | 9 | % | 44 | % | ||||||||||
† Expense ratios exclude the estimated acquired fund fees of affiliated/unaffiliated underlying |
| |||||||||||||||||||
portfolios | .01 | % | .01 | % | .01 | % | .02 | % | .00 | % | ||||||||||
See footnote summary on page 96.
| abfunds.com | AB FLEXFEE HIGH YIELD PORTFOLIO | 95 | |
FINANCIAL HIGHLIGHTS(continued)
Selected Data For A Share Of Capital Stock Outstanding Throughout Each Period
| (a) | The Fund changed its fiscal year end from October 31 to December 31. |
| (b) | The Fund changed its fiscal year end from August 31 to October 31. |
| (c) | Inception date. |
| (d) | Based on average shares outstanding. |
| (e) | Net expenses waived/reimbursed by the Adviser. |
| (f) | Amount is less than $.005. |
| (g) | Total investment return is calculated assuming an initial investment made at the net asset value at the beginning of the period, reinvestment of all dividends and distributions at net asset value during the period, and redemption on the last day of the period. Total investment return does not reflect the deduction of taxes that a shareholder would pay on fund distributions or the redemption of fund shares. Total investment return for a period of less than one year is not annualized. |
| (h) | The expense ratios presented below exclude interest expense: |
| November 1, 2018 to December 31, 2018(a) | Year Ended | September 1, 2016 to October 31, 2016(b) | July 26, 2016(c) to August 31, 2016 | |||||||||||||||||
| October 31, 2018 | October 31, 2017 | |||||||||||||||||||
Advisor Class | ||||||||||||||||||||
Net of waivers/reimbursements | .29 | % | .31 | % | .70 | % | N/A | .80 | % | |||||||||||
Before waivers/reimbursements | 3.25 | % | 2.54 | % | 2.54 | % | N/A | 2.40 | % | |||||||||||
| (i) | In connection with the Fund’s investments in affiliated underlying portfolios, the Fund incurs no direct expenses, but bears proportionate shares of the fees and expenses (i.e., operating, administrative and investment advisory fees) of the affiliated underlying portfolios. The Adviser has contractually agreed to waive its fees from the Fund in an amount equal to the Fund’s pro rata share of certain acquired fund fees and expenses, and for the period ended December 31, 2018, years ended October 31, 2018, October 31, 2017 and period ended October 31, 2016, such waivers amounted to .01% (annualized), .01%, .01% and .02% (annualized), respectively. |
| † | Due to timing of sales and repurchase of capital shares, the net realized and unrealized gain (loss) per share is not in accord with the Fund’s change in net realized and unrealized gain (loss) on investment transactions for the period. |
| ^ | Annualized. |
| * | Includes the impact of proceeds received and credited to the Fund resulting from class action settlements, which enhanced the Fund’s performance for the years ended October 31, 2018, October 31, 2017 and August 31, 2016 by .03%, .07% and .02%, respectively. |
| ** | Includes the impact of reimbursements from the Adviser which enhanced the Fund’s performance for the year ended October 31, 2018 by .01%. |
| + | The net asset value and total return include adjustments in accordance with accounting principles generally accepted in the United States of America for financial reporting purposes. As such, the net asset value and total return for shareholder transactions may differ from financial statements. |
| # | For the year ended October 31, 2016 the amount includes a refund for overbilling of prior years’ custody out of pocket fees as follows: |
Net Investment Income Per Share | Net Investment Income Ratio | Total Return | ||
| $.003 | .20% | .03% |
See notes to financial statements.
| 96 | AB FLEXFEE HIGH YIELD PORTFOLIO | abfunds.com | |
REPORT OF INDEPENDENT REGISTERED
PUBLIC ACCOUNTING FIRM
To the Shareholders and the Board of Directors of
AB FlexFee High Yield Portfolio
Opinion on the Financial Statements
We have audited the accompanying statement of assets and liabilities of AB FlexFee High Yield Portfolio, formerly known as AB High Yield Portfolio (the “Fund”), (one of the funds constituting the AB Bond Fund, Inc. (the “Company”)), including the portfolio of investments, as of December 31, 2018, and the related statements of operations for the period November 1, 2018 to December 31, 2018 and the year ended October 31, 2018, the statements of changes in net assets for the period November 1, 2018 to December 31, 2018 and each of the two years in the period ended October 31, 2018, the financial highlights for the period November 1, 2018 to December 31, 2018, each of the two years in the period ended October 31, 2018, the period September 1, 2016 to October 31, 2016 and the period July 26, 2016 to August 31, 2016, and the related notes (collectively referred to as the “financial statements”). In our opinion, the financial statements present fairly, in all material respects, the financial position of the Fund (one of the funds constituting the AB Bond Fund, Inc.) at December 31, 2018, the results of its operations for the period November 1, 2018 to December 31, 2018 and the year ended October 31, 2018, the changes in its net assets for the period November 1, 2018 to December 31, 2018 and each of the two years in the period ended October 31, 2018 and its financial highlights for the period November 1, 2018 to December 31, 2018, each of the two years in the period ended October 31, 2018, the period September 1, 2016 to October 31, 2016 and the period July 26, 2016 to August 31, 2016, in conformity with U.S. generally accepted accounting principles.
Basis for Opinion
These financial statements are the responsibility of the Company’s management. Our responsibility is to express an opinion on the Fund’s financial statements based on our audits. We are a public accounting firm registered with the Public Company Accounting Oversight Board (United States) (“PCAOB”) and are required to be independent with respect to the Company in accordance with the U.S. federal securities laws and the applicable rules and regulations of the Securities and Exchange Commission and the PCAOB.
We conducted our audits in accordance with the standards of the PCAOB. Those standards require that we plan and perform the audit to obtain reasonable assurance about whether the financial statements are free of material misstatement, whether due to error or fraud. The Company is not required to have, nor were we engaged to perform, an audit of the Company’s internal control over financial reporting. As part of our audits,
| abfunds.com | AB FLEXFEE HIGH YIELD PORTFOLIO | 97 | |
REPORT OF INDEPENDENT REGISTERED
PUBLIC ACCOUNTING FIRM(continued)
we are required to obtain an understanding of internal control over financial reporting, but not for the purpose of expressing an opinion on the effectiveness of the Company’s internal control over financial reporting. Accordingly, we express no such opinion.
Our audits included performing procedures to assess the risks of material misstatement of the financial statements, whether due to error or fraud, and performing procedures that respond to those risks. Such procedures included examining, on a test basis, evidence regarding the amounts and disclosures in the financial statements. Our procedures included confirmation of securities owned as of December 31, 2018, by correspondence with the custodian and others or by other appropriate auditing procedures where replies from others were not received. Our audits also included evaluating the accounting principles used and significant estimates made by management, as well as evaluating the overall presentation of the financial statements. We believe that our audits provide a reasonable basis for our opinion.

We have served as the auditor of one or more of the AB investment companies since 1968.
New York, New York
February 26, 2019
| 98 | AB FLEXFEE HIGH YIELD PORTFOLIO | abfunds.com | |
2018 FEDERAL TAX INFORMATION
(unaudited)
For Federal income tax purposes, the following information is furnished with respect to the distributions paid by the Fund during the calendar year ended December 31, 2018. For foreign shareholders, 54.22% of ordinary income dividends paid may be considered to be qualifying to be taxed as interest-related dividends.
| abfunds.com | AB FLEXFEE HIGH YIELD PORTFOLIO | 99 | |
BOARD OF DIRECTORS
Marshall C. Turner, Jr.(1), Chairman Michael J. Downey(1) Nancy P. Jacklin(1) | Robert M. Keith,President and Chief Executive Officer Carol C. McMullen(1) Garry L. Moody(1) Earl D. Weiner(1) |
OFFICERS
Gershon M. Distenfeld(2),Vice President William Smith(2), Vice President Jacqueline Pincus(2), Vice President Emilie D. Wrapp,Secretary | Michael B. Reyes,Senior Analyst Joseph J. Mantineo,Treasurer and Chief Financial Officer Stephen M. Woetzel,Controller Vincent S. Noto,Chief Compliance Officer |
Custodian and Accounting Agent Brown Brothers Harriman & Co. 50 Post Office Square Boston, MA 02110
Principal Underwriter AllianceBernstein Investments, Inc. 1345 Avenue of the Americas New York, NY 10105
Transfer Agent AllianceBernstein Investor Services, Inc. P.O. Box 786003 San Antonio, TX 78278-6003 Toll-Free (800) 221-5672 | Independent Registered Public Accounting Firm Ernst & Young LLP 5 Times Square New York, NY 10036
Legal Counsel Seward & Kissel LLP One Battery Park Plaza New York, NY 10004 |
| 1 | Member of the Audit Committee, the Governance and Nominating Committee and the Independent Directors Committee. |
| 2 | The day-to-day management of, and investment decisions for, the Fund are made by the High Yield Investment Team. Messrs. Distenfeld and Smith and Ms. Pincus are the investment professionals with the most significant responsibility for the day-to-day management of the Fund’s portfolio. |
| 100 | AB FLEXFEE HIGH YIELD PORTFOLIO | abfunds.com | |
MANAGEMENT OF THE FUND
NAME, ADDRESS*, AGE, (YEAR FIRST ELECTED**) | PRINCIPAL OCCUPATION(S) DURING PAST FIVE YEARS AND OTHER INFORMATION*** | PORTFOLIOS IN AB FUND COMPLEX OVERSEEN BY DIRECTOR | OTHER PUBLIC DIRECTORSHIPS CURRENTLY HELD BY DIRECTOR | |||||
| INTERESTED DIRECTOR | ||||||||
Robert M. Keith,+ 1345 Avenue of the Americas New York, NY 10105 58 (2014) | Senior Vice President of AllianceBernstein L.P. (the “Adviser”) and the head of AllianceBernstein Investments, Inc. (“ABI”) since July 2008; Director of ABI and President of the AB Mutual Funds. Previously, he served as Executive Managing Director of ABI from December 2006 to June 2008. Prior to joining ABI in 2006, Executive Managing Director of Bernstein Global Wealth Management, and prior thereto, Senior Managing Director and Global Head of Client Service and Sales of the Adviser’s institutional investment management business since 2004. Prior thereto, he was Managing Director and Head of North American Client Service and Sales in the Adviser’s institutional investment management business, with which he had been associated since prior to 2004. | 95 | None | |||||
| abfunds.com | AB FLEXFEE HIGH YIELD PORTFOLIO | 101 | |
MANAGEMENT OF THE FUND(continued)
NAME, ADDRESS*, AGE, (YEAR FIRST ELECTED**) | PRINCIPAL OCCUPATION(S) DURING PAST FIVE YEARS AND OTHER | PORTFOLIOS IN AB FUND COMPLEX OVERSEEN BY DIRECTOR | OTHER PUBLIC DIRECTORSHIPS CURRENTLY HELD BY DIRECTOR | |||||
| DISINTERESTED DIRECTORS | ||||||||
Marshall C. Turner, Jr.# Chairman of the Board 78 (2014) | Private Investor since prior to 2014. Former Chairman and CEO of Dupont Photomasks, Inc. (components of semi-conductor manufacturing). He has extensive operating leadership and venture capital investing experience, including five interim or full-time CEO roles, and prior service as general partner of institutional venture capital partnerships. He also has extensive non-profit board leadership experience, and currently serves on the boards of two education and science-related non-profit organizations. He has served as a director of one AB Fund since 1992, and director or trustee of multiple AB Funds since 2005. He has been Chairman of the AB Funds since January 2014, and the Chairman of the Independent Directors Committees of such AB Funds since February 2014. | 95 | Xilinx, Inc. (programmablelogic semi- conductors) since 2007 | |||||
Michael J. Downey,# 75 (2014) | Private Investor since prior to 2014. Formerly, managing partner of Lexington Capital, LLC (investment advisory firm) from December 1997 until December 2003. He served as a Director of Prospect Acquisition Corp. (financial services) from 2007 until 2009. From 1987 until 1993, Chairman and CEO of Prudential Mutual Fund Management, director of the Prudential mutual funds, and member of the Executive Committee of Prudential Securities Inc. He has served as a director or trustee of the AB Funds since 2005 and is a director and Chairman of one other registered investment company. | 95 | The Asia Pacific Fund, Inc. (registered investment company) since prior to 2014 | |||||
| 102 | AB FLEXFEE HIGH YIELD PORTFOLIO | abfunds.com | |
MANAGEMENT OF THE FUND(continued)
NAME, ADDRESS*, AGE, (YEAR FIRST ELECTED**) | PRINCIPAL OCCUPATION(S) DURING PAST FIVE YEARS AND OTHER | PORTFOLIOS IN AB FUND COMPLEX OVERSEEN BY DIRECTOR | OTHER PUBLIC DIRECTORSHIPS CURRENTLY HELD BY DIRECTOR | |||||
| DISINTERESTED DIRECTORS (continued) | ||||||||
Nancy P. Jacklin,# 70 (2014) | Private Investor since prior to 2014. Professorial Lecturer at the Johns Hopkins School of Advanced International Studies (2008-2015). U.S. Executive Director of the International Monetary Fund (which is responsible for ensuring the stability of the international monetary system), (December 2002-May 2006); Partner, Clifford Chance (1992-2002); Sector Counsel, International Banking and Finance, and Associate General Counsel, Citicorp (1985-1992); Assistant General Counsel (International), Federal Reserve Board of Governors (1982-1985); and Attorney Advisor, U.S. Department of the Treasury (1973-1982). Member of the Bar of the District of Columbia and of New York; and member of the Council on Foreign Relations. She has served as a director or trustee of the AB Funds since 2006 and has been Chair of the Governance and Nominating Committees of the AB Funds since August 2014. | 95 | None | |||||
| abfunds.com | AB FLEXFEE HIGH YIELD PORTFOLIO | 103 | |
MANAGEMENT OF THE FUND(continued)
NAME, ADDRESS*, AGE, (YEAR FIRST ELECTED**) | PRINCIPAL OCCUPATION(S) DURING PAST FIVE YEARS AND OTHER | PORTFOLIOS IN AB FUND COMPLEX OVERSEEN BY DIRECTOR | OTHER PUBLIC DIRECTORSHIPS CURRENTLY HELD BY DIRECTOR | |||||
| DISINTERESTED DIRECTORS (continued) | ||||||||
Carol C. McMullen,# 63 (2016) | Managing Director of Slalom Consulting (consulting) since 2014 and private investor; and member of the Partners Healthcare Investment Committee. Formerly, Director of Norfolk & Dedham Group (mutual property and casualty insurance) from 2011until November 2016; Director of Partners Community Physicians Organization (healthcare) from 2014 until December 2016; and Managing Director of The Crossland Group (consulting) from 2012 to 2013. She has held a number of senior positions in the asset and wealth management industries, including at Eastern Bank (where her roles included President of Eastern Wealth Management), Thomson Financial (Global Head of Sales for Investment Management), and Putnam Investments (where her roles included Head of Global Investment Research). She has served on a number of private company and non-profit boards, and as a director or trustee of the AB Funds since June 2016. | 95 | None | |||||
| 104 | AB FLEXFEE HIGH YIELD PORTFOLIO | abfunds.com | |
MANAGEMENT OF THE FUND(continued)
NAME, ADDRESS*, AGE, (YEAR FIRST ELECTED**) | PRINCIPAL OCCUPATION(S) DURING PAST FIVE YEARS AND OTHER INFORMATION*** | PORTFOLIOS IN AB FUND COMPLEX OVERSEEN BY DIRECTOR | OTHER PUBLIC DIRECTORSHIPS CURRENTLY HELD BY DIRECTOR | |||||
| DISINTERESTED DIRECTORS (continued) | ||||||||
Garry L. Moody,# 66 (2014) | Independent Consultant. Formerly, Partner, Deloitte & Touche LLP (1995-2008) where he held a number of senior positions, including Vice Chairman, and U.S. and Global Investment Management Practice Managing Partner; President, Fidelity Accounting and Custody Services Company (1993-1995) where he was responsible for accounting, pricing, custody and reporting for the Fidelity mutual funds; and Partner, Ernst & Young LLP (1975-1993), where he served as the National Director of Mutual Fund Tax Services and Managing Partner of its Chicago Office Tax department. He is a member of the Trustee Advisory Board of BoardIQ, a biweekly publication focused on issues and news affecting directors of mutual funds. He has served as a director or trustee, and as Chairman of the Audit Committees, of the AB Funds since 2008. | 95 | None | |||||
Earl D. Weiner,# 79 (2014) | Of Counsel, and Partner prior to January 2007, of the law firm Sullivan & Cromwell LLP and is a former member of the ABA Federal Regulation of Securities Committee Task Force to draft editions of the Fund Director’s Guidebook. He also serves as a director or trustee of various non-profit organizations and has served as Chairman or Vice Chairman of a number of them. He has served as a director or trustee of the AB Funds since 2007 and served as Chairman of the Governance and Nominating Committees of the AB Funds from 2007 until August 2014. | 95 | None | |||||
| abfunds.com | AB FLEXFEE HIGH YIELD PORTFOLIO | 105 | |
MANAGEMENT OF THE FUND(continued)
| * | The address for each of the Fund’s disinterested Directors is c/o AllianceBernstein L.P., Attention: Legal and Compliance Dept.—Mutual Fund Legal, 1345 Avenue of the Americas, New York, NY 10105. |
| ** | There is no stated term of office for the Fund’s Directors. |
| *** | The information above includes each Director’s principal occupation during the last five years and other information relating to the experience, attributes and skills relevant to each Director’s qualifications to serve as a Director, which led to the conclusion that each Director should serve as a Director for the Fund. |
| + | Mr. Keith is an “interested person” of the Portfolio as defined in the Investment Company Act of 1940, due to his position as a Senior Vice President of the Adviser. |
| # | Member of the Audit Committee, the Governance and Nominating Committee and the Independent Directors Committee. |
| 106 | AB FLEXFEE HIGH YIELD PORTFOLIO | abfunds.com | |
MANAGEMENT OF THE FUND(continued)
Officer Information
Certain information concerning the Fund’s Officers is listed below.
| NAME, ADDRESS*, AND AGE | POSITION(S) HELD WITH FUND | PRINCIPAL OCCUPATION DURING PAST 5 YEARS | ||
Robert M. Keith 58 | President and Chief Executive Officer | See biography above. | ||
Gershon M. Distenfeld 43 | Vice President | Senior Vice President of the Adviser**, with which he has been associated since prior to 2014. He is also Co-Head of Fixed-Income. | ||
William Smith 31 | Vice President | Vice President of the Adviser**, with which he has been associated since prior to 2014. He is a member of the High Yield Credit portfolio-management team, focusing on US and global multi-sector portfolios as well as a member of the High Income portfolio-management team. | ||
Jacqueline Pincus 32 | Vice President | Vice President of the Adviser**, with which she has been associated since 2014. | ||
Emilie D. Wrapp 63 | Secretary | Senior Vice President, Assistant General Counsel and Assistant Secretary of ABI**, with which she has been associated since prior to 2014. | ||
Michael B. Reyes 42 | Senior Analyst | Vice President of the Adviser**, with which has been associated since prior to 2014. | ||
Joseph J. Mantineo 59 | Treasurer and Chief Financial Officer | Senior Vice President of ABIS**, with which he has been associated since prior to 2014. | ||
Stephen M. Woetzel 47 | Controller | Senior Vice President of ABIS**, with which he has been associated since prior to 2014. | ||
Vincent S. Noto 54 | Chief Compliance Officer | Senior Vice President since 2015 and Mutual Fund Chief Compliance Officer of the Adviser** since 2014. Prior thereto, he was Vice President and Director of Mutual Fund Compliance of the Adviser** since 2012. |
| * | The address for each of the Fund’s officers is 1345 Avenue of the Americas, New York, NY 10105. |
| ** | The Adviser, ABI and ABIS are affiliates of the Fund. |
The Fund’s statement of Additional Information (“SAI”) has additional information about the Fund’s Directors and Officers and is available without charge upon request. Contact your financial representative or AB 1 (800) 227-4618, or visit www.abfunds.com for a free prospectus or SAI.
| abfunds.com | AB FLEXFEE HIGH YIELD PORTFOLIO | 107 | |
Information Regarding the Review and Approval of the Fund’s Proposed New Advisory Agreement and Interim Advisory Agreement in the Context of Potential Assignments
As described in more detail in the Proxy Statement for the AB Funds dated August 20, 2018, the Boards of the AB Funds, at a meeting held onJuly 31-August 2, 2018, approved new advisory agreements with the Adviser (the “Proposed Agreements”) for the AB Funds, including AB Bond Fund, Inc. in respect of AB FlexFeeTM High Yield Portfolio (the “Fund”), in connection with the planned disposition by AXA S.A. of its remaining shares of AXA Equitable Holdings, Inc. (the indirect holder of a majority of the partnership interests in the Adviser and the indirect parent of AllianceBernstein Corporation, the general partner of the Adviser) in one or more transactions and the related potential for one or more “assignments” (within the meaning of section 2(a)(4) of the Investment Company Act) of the advisory agreements for the AB Funds, including the Fund’s Advisory Agreement, resulting in the automatic termination of such advisory agreements.
At the same meeting, the AB Boards also considered and approved interim advisory agreements with the Adviser (the “Interim Advisory Agreements”) for the AB Funds, including the Fund, to be effective only in the event that stockholder approval of a Proposed Agreement had not been obtained as of the date of one or more transactions resulting in an “assignment” of the Adviser’s advisory agreements, resulting in the automatic termination of such advisory agreements.
The shareholders of the Fund subsequently approved the Proposed Agreements at an annual meeting of shareholders called for the purpose of electing Directors and voting on the Proposed Agreements.
A discussion regarding the basis for the Boards’ approvals at the meeting held onJuly 31-August 2, 2018 is set forth below.
At a meeting of the AB Boards held on July31-August 2, 2018, the Adviser presented its recommendation that the Boards consider and approve the Proposed Agreements. Section 15(c) of the 1940 Act provides that, after an initial period, a Fund’s Current Agreement and currentsub-advisory agreement, as applicable, will remain in effect only if the Board, including a majority of the Independent Directors, annually reviews and approves them. Each of the Current Agreements had been approved by a Board within theone-year period prior to approval of its related Proposed Agreement, except that the Current Agreements for certain FlexFee funds were approved in February 2017. In connection with their approval of the Proposed Agreements, the Boards considered their conclusions in connection with their most recent approvals of the Current Agreements, in particular in cases where the last approval of a Current Agreement was relatively recent, including the Boards’ general satisfaction with the nature and quality of services being provided and, as applicable, in the case of
| 108 | AB FLEXFEE HIGH YIELD PORTFOLIO | abfunds.com | |
certain Funds, actions taken or to be taken in an effort to improve investment performance or reduce expense ratios. The Directors also reviewed updated information provided by the Adviser in respect of each Fund. Also in connection with their approval of the Proposed Agreements, the Boards considered a representation made to them at that time by the Adviser that there were no additional developments not already disclosed to the Boards since their most recent approvals of the Current Agreements that would be a material consideration to the Boards in connection with their consideration of the Proposed Agreements, except for matters disclosed to the Boards by the Adviser. The Directors considered the fact that each Proposed Agreement would have corresponding terms and conditions identical to those of the corresponding Current Agreement with the exception of the effective date and initial term under the Proposed Agreement.
The Directors considered their knowledge of the nature and quality of the services provided by the Adviser to each Fund gained from their experience as directors or trustees of registered investment companies advised by the Adviser, their overall confidence in the Adviser’s integrity and competence they have gained from that experience, the Adviser’s initiative in identifying and raising potential issues with the Directors and its responsiveness, frankness and attention to concerns raised by the Directors in the past, including the Adviser’s willingness to consider and implement organizational and operational changes designed to improve investment results and the services provided to the Funds. The Directors noted that they have four regular meetings each year, at each of which they review extensive materials and information from the Adviser, including information on the investment performance of each Fund.
The Directors also considered all factors they believed relevant, including the specific matters discussed below. During the course of their deliberations, the Directors evaluated, among other things, the reasonableness of the management fees of the Funds they oversee. The Directors did not identify any particular information that wasall-important or controlling, and different Directors may have attributed different weights to the various factors. The Directors determined that the selection of the Adviser to manage the Funds, and the overall arrangements between the Funds and the Adviser, as provided in the Proposed Agreements, including the management fees, were fair and reasonable in light of the services performed under the Current Agreements and to be performed under the Proposed Agreements, expenses incurred and to be incurred and such other matters as the Directors considered relevant in the exercise of their business judgment. The material factors and conclusions that formed the basis for the Directors’ determinations included the following:
Nature, Extent and Quality of Services Provided
The Directors considered the scope and quality of services to be provided by the Adviser under the Proposed Agreements, including the quality of
| abfunds.com | AB FLEXFEE HIGH YIELD PORTFOLIO | 109 | |
the investment research capabilities of the Adviser and the other resources it has dedicated to performing services for the Funds. They also considered the information that had been provided to them by the Adviser concerning the anticipated implementation of the Plan and the Adviser’s representation that it did not anticipate that such implementation would affect the management or structure of the Adviser, have a material adverse effect on the Adviser, or adversely affect the quality of the services provided to the Funds by the Adviser and its affiliates. The Directors noted that the Adviser from time to time reviews each Fund’s investment strategies and from time to time proposes changes intended to improve the Fund’s relative or absolute performance for the Directors’ consideration. They also noted the professional experience and qualifications of each Fund’s portfolio management team and other senior personnel of the Adviser. The Directors also considered that certain Proposed Agreements, similar to the corresponding Current Agreements, provide that the Funds will reimburse the Adviser for the cost to it of providing certain clerical, accounting, administrative and other services to the Funds by employees of the Adviser or its affiliates. Requests for these reimbursements are made on a quarterly basis and subject to approval by the Directors. The Directors noted that the Adviser did not request any reimbursements from certain Funds in the Fund’s latest fiscal year reviewed. The Directors noted that the methodology to be used to determine the reimbursement amounts had been reviewed by an independent consultant retained by the Funds’ former Senior Officer/Independent Compliance Officer. The quality of administrative and other services, including the Adviser’s role in coordinating the activities of the Funds’ other service providers, also was considered. The Directors of each Fund concluded that, overall, they were satisfied with the nature, extent and quality of services to be provided to the Funds under the Proposed Agreement for the Fund.
Costs of Services to be Provided and Profitability
The Directors reviewed a schedule of the revenues and expenses and related notes indicating the profitability of each Fund to the Adviser for calendar years 2016 and 2017, as applicable, that had been prepared with an expense allocation methodology arrived at in consultation with an independent consultant retained by the Funds’ former Senior Officer/Independent Compliance Officer. The Directors noted the assumptions and methods of allocation used by the Adviser in preparing fund-specific profitability data and understood that there are a number of potentially acceptable allocation methodologies for information of this type. The Directors noted that the profitability information reflected all revenues and expenses of the Adviser’s relationship with a Fund, including those relating to its subsidiaries that provide transfer agency, distribution and brokerage services to the Fund, as applicable. The Directors recognized that it is difficult to make comparisons of the profitability of the Proposed Agreements with the profitability of fund advisory contracts for unaffiliated funds because comparative information is not generally publicly available and is
| 110 | AB FLEXFEE HIGH YIELD PORTFOLIO | abfunds.com | |
affected by numerous factors. The Directors focused on the profitability of the Adviser’s relationship with each Fund before taxes and distribution expenses, as applicable. The Directors noted that certain Funds were not profitable to the Adviser in one or more periods reviewed. The Directors concluded that the Adviser’s level of profitability from its relationship with the other Funds was not unreasonable. The Directors were unable to consider historical information about the profitability of certain Funds that had recently commenced operations and for which historical profitability information was not available. The Adviser agreed to provide the Directors with profitability information in connection with future proposed continuances of the Proposed Agreements.
Fall-Out Benefits
The Directors considered the other benefits to the Adviser and its affiliates from their relationships with the Funds, including, but not limited to, as applicable, benefits relating to soft dollar arrangements (whereby investment advisers receive brokerage and research services from brokers that execute agency transactions for their clients) in the case of certain Funds;12b-1 fees and sales charges received by the principal underwriter (which is a wholly owned subsidiary of the Adviser) in respect of certain classes of the shares of most of the Funds; brokerage commissions paid by certain Funds to brokers affiliated with the Adviser; and transfer agency fees paid by most of the Funds to a wholly owned subsidiary of the Adviser. The Directors recognized that the Adviser’s profitability would be somewhat lower, and that a Fund’s unprofitability to the Adviser would be exacerbated, without these benefits. The Directors understood that the Adviser also might derive reputational and other benefits from its association with the Funds.
Investment Results
In addition to the information reviewed by the Directors in connection with the Board meeting at which the Proposed Agreements were approved, the Directors receive detailed performance information for the Funds at each regular Board meeting during the year.
The Boards’ consideration of each Proposed Agreement was informed by their most recent approval of the related Current Agreement, and, in the case of certain Funds, their discussion with the Adviser of the reasons for those Funds’ underperformance in certain periods. The Directors also reviewed updated performance information and, in some cases, discussed with the Adviser the reasons for changes in performance or continued underperformance. On the basis of this review, the Directors concluded that each Fund’s investment performance was acceptable.
Management Fees and Other Expenses
The Directors considered the management fee rate payable by each Fund to the Adviser and information prepared by an independent service provider
| abfunds.com | AB FLEXFEE HIGH YIELD PORTFOLIO | 111 | |
(the “15(c) provider”) concerning management fee rates payable by other funds in the same category as the Fund. The Directors recognized that it is difficult to make comparisons of management fees because there are variations in the services that are included in the fees paid by other funds. The Directors compared each Fund’s contractual management fee rate with a peer group median, and where applicable, took into account the impact on the management fee rate of the administrative expense reimbursement paid to the Adviser in the latest fiscal year. In the case of the ACS Funds, the Directors noted that the management fee rate is zero but also were cognizant that the Adviser is indirectly compensated by the wrap fee program sponsors that use the ACS Funds as an investment vehicle for their clients.
The Directors also considered the Adviser’s fee schedule for other clients pursuing a similar investment style to each Fund. For this purpose, they reviewed the relevant advisory fee information from the Adviser’s Form ADV and in a report from the Funds’ Senior Analyst and noted the differences between a Fund’s fee schedule, on the one hand, and the Adviser’s institutional fee schedule and the schedule of fees charged by the Adviser to any offshore funds and for services to anysub-advised funds pursuing a similar investment strategy as the Fund, on the other, as applicable. The Directors noted that the Adviser may, in some cases, agree to fee rates with large institutional clients that are lower than those reviewed by the Directors and that they had previously discussed with the Adviser its policies in respect of such arrangements. The Adviser also informed the Directors that, in the case of certain Funds, there were no institutional products managed by the Adviser that have a substantially similar investment style. The Directors also discussed these matters with their independent fee consultant.
The Adviser reviewed with the Directors the significantly greater scope of the services it provides to each Fund relative to institutional, offshore fund andsub-advised fund clients, as applicable. In this regard, the Adviser noted, among other things, that, compared to institutional and offshore orsub-advisory accounts, each Fund, as applicable, (i) demands considerably more portfolio management, research and trading resources due to significantly higher daily cash flows (in the case ofopen-end Funds); (ii) has more tax and regulatory restrictions and compliance obligations; (iii) must prepare and file or distribute regulatory and other communications about fund operations; and (iv) must provide shareholder servicing to retail investors. The Adviser also reviewed the greater legal risks presented by the large and changing population of Fund shareholders who may assert claims against the Adviser in individual or class actions, and the greater entrepreneurial risk in offering new fund products, which require substantial investment to launch, may not succeed, and generally must be priced to compete with larger, more established funds resulting in lack of profitability to the Adviser until a new fund achieves scale. In light of the substantial differences in services rendered by the Adviser to institutional, offshore fund andsub-advised fund clients as compared to the Funds, and
| 112 | AB FLEXFEE HIGH YIELD PORTFOLIO | abfunds.com | |
the different risk profile, the Directors considered these fee comparisons inapt and did not place significant weight on them in their deliberations.
The Directors noted that many of the Funds may invest in shares of exchange-traded funds (“ETFs”), subject to the restrictions and limitations of the 1940 Act as these may be varied as a result of exemptive orders issued by the SEC. The Directors also noted that ETFs pay advisory fees pursuant to their advisory contracts. The Directors concluded, based on the Adviser’s explanation of how it uses ETFs when they are the most cost-effective way to obtain desired exposures, in some cases pending purchases of underlying securities, that each Fund’s management fee would be for services that would be in addition to, rather than duplicative of, the services provided under the advisory contracts of the ETFs.
With respect to each Fund’s management fee, the Directors considered the total expense ratio of the Fund in comparison to a peer group and peer universe selected by the 15(c) service provider. The Directors also considered the Adviser’s expense caps for certain Funds. The Directors view expense ratio information as relevant to their evaluation of the Adviser’s services because the Adviser is responsible for coordinating services provided to a Fund by others.
The Boards’ consideration of each Proposed Agreement was informed by their most recent approval of the related Current Agreement, and, in the case of certain Funds, their discussion with the Adviser of the reasons for those Funds’ expense ratios in certain periods. The Directors also reviewed updated expense ratio information and, in some cases, discussed with the Adviser the reasons for the expense ratios of certain Funds. On the basis of this review, the Directors concluded that each Fund’s expense ratio was acceptable.
The Directors did not consider comparative expense information for the ACS Funds because those Funds do not bear ordinary expenses.
Economies of Scale
The Directors noted that the management fee schedules for certain Funds do not contain breakpoints and that they had discussed their strong preference for breakpoints in advisory contracts with the Adviser. The Directors took into consideration prior presentations by an independent consultant on economies of scale in the mutual fund industry and for the Funds, and by the Adviser concerning certain of its views on economies of scale. The Directors also had requested and received from the Adviser certain updates on economies of scale in advance of the Board meeting. The Directors believe that economies of scale may be realized (if at all) by the Adviser across a variety of products and services, and not only in respect of a single fund. The Directors noted that there is no established methodology for setting breakpoints that give effect to the fund-specific services provided by a fund’s adviser and to the economies of scale that
| abfunds.com | AB FLEXFEE HIGH YIELD PORTFOLIO | 113 | |
an adviser may realize in its overall mutual fund business or those components of it which directly or indirectly affect a fund’s operations. The Directors observed that in the mutual fund industry as a whole, as well as among funds similar to each Fund, there is no uniformity or pattern in the fees and asset levels at which breakpoints (if any) apply. The Directors also noted that the advisory agreements for many funds do not have breakpoints at all. The Directors informed the Adviser that they would monitor the asset levels of the Funds without breakpoints and their profitability to the Adviser and anticipated revisiting the question of breakpoints in the future if circumstances warrant doing so.
The Directors did not consider the extent to which fee levels in the Advisory Agreement for the ACS Funds reflect economies of scale because that Advisory Agreement does not provide for any compensation to be paid to the Adviser by the ACS Funds and the expense ratio of each of those Funds is zero.
Interim Advisory Agreements
In approving the Interim Advisory Agreements, the Boards, with the assistance of independent counsel, considered similar factors to those considered in approving the Proposed Agreements. The Interim Advisory Agreements approved by the Boards are identical to the Proposed Agreements, as well as the Current Agreements, in all material respects except for their proposed effective and termination dates and provisions intended to comply with the requirements of the relevant SEC rule, such as provisions requiring escrow of advisory fees. Under the Interim Advisory Agreements, the Adviser would continue to manage a Fund pursuant to an Interim Advisory Agreement until a new advisory agreement was approved by stockholders or until the end of the150-day period, whichever would occur earlier. All fees earned by the Adviser under an Interim Advisory Agreement would be held in escrow pending shareholder approval of the Proposed Agreement. Upon approval of a new advisory agreement by stockholders, the escrowed management fees would be paid to the Adviser, and the Interim Advisory Agreement would terminate.
Information Regarding the Review and Approval of the Fund’s Current Advisory Agreement
The disinterested directors (the “directors”) of AB Bond Fund, Inc. (the “Company”) unanimously approved the continuance of the Company’s Advisory Agreement with the Adviser in respect of AB FlexFeeTM High Yield Portfolio (formerly named AB Bond Fund, Inc.—AB High Yield Portfolio) (the “Fund”) at a meeting held onNovember 6-8, 2018 (the “Meeting”).
Prior to approval of the continuance of the Advisory Agreement, the directors had requested from the Adviser, and received and evaluated, extensive materials. They reviewed the proposed continuance of the Advisory Agreement with the Adviser and with experienced counsel who are
| 114 | AB FLEXFEE HIGH YIELD PORTFOLIO | abfunds.com | |
independent of the Adviser, who advised on the relevant legal standards. The directors also reviewed additional materials, including materials from an outside consultant, who acted as their independent fee consultant, and comparative analytical data prepared by the Senior Analyst for the Fund. The directors also discussed the proposed continuance in private sessions with counsel.
The directors considered their knowledge of the nature and quality of the services provided by the Adviser to the Fund gained from their experience as directors or trustees of most of the registered investment companies advised by the Adviser, their overall confidence in the Adviser’s integrity and competence they have gained from that experience, the Adviser’s initiative in identifying and raising potential issues with the directors and its responsiveness, frankness and attention to concerns raised by the directors in the past, including the Adviser’s willingness to consider and implement organizational and operational changes designed to improve investment results and the services provided to the AB Funds. The directors noted that they have four regular meetings each year, at each of which they review extensive materials and information from the Adviser, including information on the investment performance of the Fund.
The directors also considered all factors they believed relevant, including the specific matters discussed below. During the course of their deliberations, the directors evaluated, among other things, the reasonableness of the performance-based advisory fee (which consists of a base fee plus or minus a performance adjustment) and considered materials presented to them concerning the SEC’s published guidance on factors that should be considered in connection with fulcrum fee arrangements, including the following factors: (1) the fairness of the fulcrum fee; (2) selection of an appropriate index against which fund performance should be measured; (3) variations in periods used for computing average asset values and performance; (4) length of period over which performance is computed; (5) computation of performance over a rolling period; (6) performance for transitional periods; (7) computation of the performance of the fund and the index with respect to payment of dividends and capital gains distributions; and (8) avoidance of basing significant fee adjustments upon random or insignificant differences. The directors did not identify any particular information that wasall-important or controlling, and different directors may have attributed different weights to the various factors. The directors determined that the selection of the Adviser to manage the Fund and the overall arrangements between the Fund and the Adviser, as provided in the Advisory Agreement, including the performance-based advisory fee, were fair and reasonable in light of the services performed, expenses incurred and such other matters as the directors considered relevant in the exercise of their business judgment. The material factors and conclusions that formed the basis for the directors’ determinations included the following:
| abfunds.com | AB FLEXFEE HIGH YIELD PORTFOLIO | 115 | |
Nature, Extent and Quality of Services Provided
The directors considered the scope and quality of services provided by the Adviser under the Advisory Agreement, including the quality of the investment research capabilities of the Adviser and the other resources it has dedicated to performing services for the Fund. The directors noted that the Adviser from time to time reviews the Fund’s investment strategies and from time to time proposes changes intended to improve the Fund’s relative or absolute performance for the directors’ consideration. They also noted the professional experience and qualifications of the Fund’s portfolio management team and other senior personnel of the Adviser. The directors also considered that the Advisory Agreement provides that the Fund will reimburse the Adviser for the cost to it of providing certain clerical, accounting, administrative and other services to the Fund by employees of the Adviser or its affiliates. Requests for these reimbursements will be subject to the directors’ approval on a quarterly basis and, to the extent requested and paid, result in a higher rate of total compensation from the Fund to the Adviser than the fee rate stated in the Advisory Agreement. The directors noted that the methodology to be used to determine the reimbursement amounts had been reviewed by an independent consultant retained by the Fund’s former Senior Officer/Independent Compliance Officer. The quality of administrative and other services, including the Adviser’s role in coordinating the activities of the Fund’s other service providers, also was considered. The directors concluded that, overall, they were satisfied with the nature, extent and quality of services provided to the Fund under the Advisory Agreement.
Costs of Services Provided and Profitability
The directors reviewed a schedule of the revenues and expenses and related notes indicating the profitability of the Fund to the Adviser for the period ended December 31, 2016 and calendar year 2017 that had been prepared with an expense allocation methodology arrived at in consultation with an independent consultant retained by the Fund’s former Senior Officer/Independent Compliance Officer. The directors noted the assumptions and methods of allocation used by the Adviser in preparing fund-specific profitability data and understood that there are a number of potentially acceptable allocation methodologies for information of this type. The directors noted that the profitability information reflected all revenues and expenses of the Adviser’s relationship with the Fund, including those relating to its subsidiaries that provide transfer agency and distribution services to the Fund. The directors recognized that it is difficult to make comparisons of the profitability of the Advisory Agreement with the profitability of fund advisory contracts for unaffiliated funds because comparative information is not generally publicly available and is affected by numerous factors. The directors focused on the profitability of the Adviser’s relationship with the Fund before taxes and distribution expenses. The directors noted that the Fund was not profitable to the Adviser in the periods reviewed. The directors noted that, due to the performance fee component of the advisory fee, profitability would tend to be
| 116 | AB FLEXFEE HIGH YIELD PORTFOLIO | abfunds.com | |
higher with better performance relative to the Fund’s benchmark index, which they considered to create an appropriate alignment of incentives.
Fall-Out Benefits
The directors considered the other benefits to the Adviser and its affiliates from their proposed relationships with the Fund, including, but not limited to, benefits relating to12b-1 fees and sales charges to be received by the Fund’s principal underwriter (which is a wholly owned subsidiary of the Adviser) in respect of certain classes of the Fund’s shares; and transfer agency fees paid by the Fund to a wholly owned subsidiary of the Adviser. The directors recognized that the Adviser’s profitability would be exacerbated without these benefits. The directors understood that the Adviser also might derive reputational and other benefits from its association with the Fund.
Investment Results
In addition to the information reviewed by the directors in connection with the Meeting, the directors receive detailed performance information for the Fund at each regular Board meeting during the year.
At the Meeting, the directors reviewed performance information prepared by an independent service provider (the “15(c) service provider”), showing the performance of the Advisor Class shares of the Fund against a group of similar funds (“peer group”) and a larger group of similar funds (“peer universe”), each selected by the 15(c) service provider, and information prepared by the Adviser showing performance of the Advisor Class shares against a broad-based securities market index, in each case for the1-,3-,5- and10-year periods ended July 31, 2018. Based on their review, the directors concluded that the Fund’s investment performance was acceptable.
Advisory Fees and Other Expenses
The directors considered the advisory fee rate payable by the Fund to the Adviser and information prepared by the 15(c) service provider concerning advisory fee rates payable by other funds in the same category as the Fund. The directors recognized that it is difficult to make comparisons of advisory fees because there are variations in the services that are included in the fees payable by other funds. The directors considered the Fund’s contractual effective advisory fee rate against a peer group median and took into account the impact on the advisory fee rate of the administrative expense reimbursement paid to the Adviser in the latest fiscal year.
The directors also considered the Adviser’s fee schedule for other clients pursuing a similar investment style to the Fund. For this purpose, they reviewed the relevant advisory fee information from the Adviser’s Form ADV and in a report from the Fund’s Senior Analyst and noted the differences between the Fund’s fee schedule, on the one hand, and the Adviser’s institutional fee schedule and the schedule of fees charged by
| abfunds.com | AB FLEXFEE HIGH YIELD PORTFOLIO | 117 | |
the Adviser to any offshore funds and for services to anysub-advised funds pursuing a similar investment strategy as the Fund, on the other. The directors noted that the Adviser may, in some cases, agree to fee rates with large institutional clients that are lower than those reviewed by the directors and that they had previously discussed with the Adviser its policies in respect of such arrangements. The directors also discussed these matters with their independent fee consultant.
The Adviser reviewed with the directors the significantly greater scope of the services it provides to the Fund relative to institutional, offshore fund andsub-advised fund clients. In this regard, the Adviser noted, among other things, that, compared to institutional and offshore orsub-advisory accounts, the Fund (i) demands considerably more portfolio management, research and trading resources due to significantly higher daily cash flows; (ii) has more tax and regulatory restrictions and compliance obligations; (iii) must prepare and file or distribute regulatory and other communications about fund operations; and (iv) must provide shareholder servicing to retail investors. The Adviser also reviewed the greater legal risks presented by the large and changing population of Fund shareholders who may assert claims against the Adviser in individual or class actions, and the greater entrepreneurial risk in offering new fund products, which require substantial investment to launch, may not succeed, and generally must be priced to compete with larger, more established funds resulting in lack of profitability to the Adviser until a new fund achieves scale. In light of the substantial differences in services rendered by the Adviser to institutional, offshore fund andsub-advised fund clients as compared to the Fund, the directors considered these fee comparisons inapt and did not place significant weight on them in their deliberations.
The directors noted that the Fund invests in shares of exchange-traded funds (“ETFs”), subject to the restrictions and limitations of the Investment Company Act of 1940 as these may be varied as a result of exemptive orders issued by the SEC. The directors also noted that ETFs pay advisory fees pursuant to their advisory contracts. The directors concluded, based on the Adviser’s explanation of how it uses ETFs when they are the most cost-effective way to obtain desired exposures, in some cases pending purchases of underlying securities, that the advisory fee for the Fund is for services that are in addition to, rather than duplicative of, the services provided under the advisory contracts of the ETFs.
In connection with their review of the Fund’s advisory fee, the directors also considered the total expense ratio of the Advisor Class shares of the Fund in comparison to a peer group and a peer universe selected by each 15(c) service provider. The Advisor Class expense ratio of the Fund was based on the Fund’s latest fiscal year and the information included the pro forma expense ratio to reflect the impact of recent total expense ratio changes. The directors considered the Adviser’s expense cap for the Fund
| 118 | AB FLEXFEE HIGH YIELD PORTFOLIO | abfunds.com | |
and noted that it was likely that the expense ratios of some of the other funds in the Fund’s category were lowered by waivers or reimbursements by those funds’ investment advisers, which in some cases might be voluntary or temporary. The directors view the expense ratio information as relevant to their evaluation of the Adviser’s services because the Adviser is responsible for coordinating services provided to the Fund by others. Based on their review, the directors concluded that the Fund’s pro forma expense ratio was acceptable.
Economies of Scale
The directors noted that the advisory fee schedule for the Fund does not contain breakpoints and that they had previously discussed their strong preference for breakpoints in advisory contracts with the Adviser. The directors took into consideration presentations by an independent consultant on economies of scale in the mutual fund industry and for the AB Funds, and presentations from time to time by the Adviser concerning certain of its views on economies of scale. The directors also discussed economies of scale with their independent fee consultant. The directors also had requested and received from the Adviser certain updates on economies of scale in advance of the Meeting. The directors believe that economies of scale may be realized (if at all) by the Adviser across a variety of products and services, and not only in respect of a single fund. The directors noted that there is no established methodology for setting breakpoints that give effect to the fund-specific services provided by a fund’s adviser and to the economies of scale that an adviser may realize in its overall mutual fund business or those components of it which directly or indirectly affect a fund’s operations. The directors observed that in the mutual fund industry as a whole, as well as among funds similar to the Fund, there is no uniformity or pattern in the fees and asset levels at which breakpoints (if any) apply. The directors also noted that the advisory agreements for many funds do not have breakpoints at all. The directors informed the Adviser that they would monitor the Fund’s asset levels (which were well below the level at which they would anticipate adding an initial breakpoint) and its profitability (currently unprofitable) to the Adviser and anticipated revisiting the question of breakpoints in the future if circumstances warranted doing so.
| abfunds.com | AB FLEXFEE HIGH YIELD PORTFOLIO | 119 | |
This page is not part of the Shareholder Report or the Financial Statements.
AB FAMILY OF FUNDS
US EQUITY
US CORE
Core Opportunities Fund
FlexFee™ US Thematic Portfolio
Select US Equity Portfolio
US GROWTH
Concentrated Growth Fund
Discovery Growth Fund
FlexFee™ Large Cap Growth Portfolio
Growth Fund
Large Cap Growth Fund
Small Cap Growth Portfolio
US VALUE
Discovery Value Fund
Equity Income Fund
Relative Value Fund
Small Cap Value Portfolio
Value Fund
INTERNATIONAL/ GLOBAL EQUITY
INTERNATIONAL/ GLOBAL CORE
FlexFee™ International Strategic Core Portfolio
Global Core Equity Portfolio
International Portfolio
International Strategic Core Portfolio
Sustainable Global Thematic Fund
Tax-Managed International Portfolio
Tax-Managed Wealth Appreciation Strategy
Wealth Appreciation Strategy
INTERNATIONAL/ GLOBAL GROWTH
Concentrated International Growth Portfolio
FlexFee™ Emerging Markets Growth Portfolio
INTERNATIONAL/ GLOBAL EQUITY(continued)
Sustainable International Thematic Fund
INTERNATIONAL/ GLOBAL VALUE
All China Equity Portfolio
International Value Fund
FIXED INCOME
MUNICIPAL
High Income Municipal Portfolio
Intermediate California Municipal Portfolio
Intermediate Diversified Municipal Portfolio
Intermediate New York Municipal Portfolio
Municipal Bond Inflation Strategy
Tax-Aware Fixed Income Portfolio
National Portfolio
Arizona Portfolio
California Portfolio
Massachusetts Portfolio
Minnesota Portfolio
New Jersey Portfolio
New York Portfolio
Ohio Portfolio
Pennsylvania Portfolio
Virginia Portfolio
TAXABLE
Bond Inflation Strategy
FlexFee™ High Yield Portfolio1
FlexFee™ International Bond Portfolio
Global Bond Fund
High Income Fund
Income Fund
Intermediate Bond Portfolio
Limited Duration High Income Portfolio
Short Duration Portfolio
ALTERNATIVES
All Market Real Return Portfolio
Global Real Estate Investment Fund
Select US Long/Short Portfolio
Unconstrained Bond Fund
MULTI-ASSET
All Market Income Portfolio
All Market Total Return Portfolio
Conservative Wealth Strategy
Emerging Markets Multi-Asset Portfolio
Global Risk Allocation Fund
Tax-Managed All Market Income Portfolio
TARGET-DATE
Multi-Manager Select Retirement Allocation Fund
Multi-Manager Select 2010 Fund
Multi-Manager Select 2015 Fund
Multi-Manager Select 2020 Fund
Multi-Manager Select 2025 Fund
Multi-Manager Select 2030 Fund
Multi-Manager Select 2035 Fund
Multi-Manager Select 2040 Fund
Multi-Manager Select 2045 Fund
Multi-Manager Select 2050 Fund
Multi-Manager Select 2055 Fund
Multi-Manager Select 2060 Fund
CLOSED-END FUNDS
Alliance California Municipal Income Fund
AllianceBernstein Global High Income Fund
AllianceBernstein National Municipal Income Fund
We also offer Government Money Market Portfolio, which serves as the money market fund exchange vehicle for the AB mutual funds. You could lose money by investing in the Fund. Although the Fund seeks to preserve the value of your investment at $1.00 per share, it cannot guarantee it will do so. The Fund may impose a fee upon sale of your shares or may temporarily suspend your ability to sell shares if the Fund’s liquidity falls below required minimums because of market conditions or other factors. An investment in the Fund is not insured or guaranteed by the Federal Deposit Insurance Corporation or any other government agency. The Fund’s sponsor has no legal obligation to provide financial support to the Fund, and you should not expect that the sponsor will provide financial support to the Fund at any time.
Investors should consider the investment objectives, risks, charges and expenses of the Fund carefully before investing. For copies of our prospectus or summary prospectus, which contain this and other information, visit us online at www.abfunds.com or contact your AB representative. Please read the prospectus and/or summary prospectus carefully before investing.
| 1 | Prior to February 23, 2018, FlexFee High Yield Portfolio was named High Yield Portfolio. |
| 120 | AB FLEXFEE HIGH YIELD PORTFOLIO | abfunds.com | |
NOTES
| abfunds.com | AB FLEXFEE HIGH YIELD PORTFOLIO | 121 | |
NOTES
| 122 | AB FLEXFEE HIGH YIELD PORTFOLIO | abfunds.com | |
NOTES
| abfunds.com | AB FLEXFEE HIGH YIELD PORTFOLIO | 123 | |
NOTES
| 124 | AB FLEXFEE HIGH YIELD PORTFOLIO | abfunds.com | |
AB FLEXFEE HIGH YIELD PORTFOLIO
1345 Avenue of the Americas
New York, NY 10105
800 221 5672
FFHY-0151-1218 
DEC 12.31.18

ANNUAL REPORT
AB FLEXFEETM INTERNATIONAL BOND PORTFOLIO

Beginning January 1, 2021, as permitted by new regulations adopted by the Securities and Exchange Commission, the Fund’s annual and semi-annual shareholder reports will no longer be sent by mail, unless you specifically request paper copies of the reports. Instead, the reports will be made available on a website, and you will be notified by mail each time a report is posted and provided with a website address to access the report.
If you already elected to receive shareholder reports electronically, you will not be affected by this change and you need not take any action. You may elect to receive shareholder reports and other communications from the Fund electronically at any time by contacting your financial intermediary (such as a broker-dealer or bank) or, if you are a direct investor, by calling the Fund at (800) 221 5672.
You may elect to receive all future reports in paper form free of charge. If you invest through a financial intermediary, you can contact your financial intermediary to request that you continue to receive paper copies of your shareholder reports; if you invest directly with the Fund, you can call the Fund at (800) 221 5672. Your election to receive reports in paper form will apply to all funds held in your account with your financial intermediary or, if you invest directly, to all AB Mutual Funds you hold.
| Investment Products Offered | • Are Not FDIC Insured• May Lose Value• Are Not Bank Guaranteed | |
Investors should consider the investment objectives, risks, charges and expenses of the Fund carefully before investing. For copies of our prospectus or summary prospectus, which contain this and other information, visit us online at www.abfunds.com or contact your AB representative. Please read the prospectus and/or summary prospectus carefully before investing.
This shareholder report must be preceded or accompanied by the Fund’s prospectus for individuals who are not current shareholders of the Fund.
You may obtain a description of the Fund’s proxy voting policies and procedures, and information regarding how the Fund voted proxies relating to portfolio securities during the most recent12-month period ended June 30, without charge. Simply visit AB’s website at www.abfunds.com, or go to the Securities and Exchange Commission’s (the “Commission”) website at www.sec.gov, or call AB at (800) 227 4618.
The Fund files its complete schedule of portfolio holdings with the Commission for the first and third quarters of each fiscal year. The Fund’s portfolio holdings reports are available on the Commission’s website at www.sec.gov. The Fund’s portfolio holdings reports may also be reviewed and copied at the Commission’s Public Reference Room in Washington, DC; information on the operation of the Public Reference Room may be obtained by calling (800) SEC 0330. AB publishes full portfolio holdings for the Fund monthly at www.abfunds.com.
AllianceBernstein Investments, Inc. (ABI) is the distributor of the AB family of mutual funds. ABI is a member of FINRA and is an affiliate of AllianceBernstein L.P., the Adviser of the funds.
The [A/B] logo is a registered service mark of AllianceBernstein and AllianceBernstein® is a registered service mark used by permission of the owner, AllianceBernstein L.P.
| FROM THE PRESIDENT |  |
Dear Shareholder,
We are pleased to provide this report for AB FlexFee International Bond Portfolio (the “Fund”). Please review the discussion of Fund performance, the market conditions during the reporting period and the Fund’s investment strategy.
As always, AB strives to keep clients ahead of what’s next by:
| + | Transforming uncommon insights into uncommon knowledge with a global research scope |
| + | Navigating markets with seasoned investment experience and sophisticated solutions |
| + | Providing thoughtful investment insights and actionable ideas |
Whether you’re an individual investor or a multi-billion-dollar institution, we put knowledge and experience to work for you.
AB’s global research organization connects and collaborates across platforms and teams to deliver impactful insights and innovative products. Better insights lead to better opportunities—anywhere in the world.
For additional information about AB’s range of products and shareholder resources, please log on to www.abfunds.com.
Thank you for your investment in the AB Mutual Funds.
Sincerely,

Robert M. Keith
President and Chief Executive Officer, AB Mutual Funds
| abfunds.com | AB FLEXFEE INTERNATIONAL BOND PORTFOLIO | 1 | |
ANNUAL REPORT
February 13, 2019
This report provides management’s discussion of fund performance for AB FlexFee International Bond Portfolio for the annual reporting period ended December 31, 2018.
The Fund’s investment objective is to generate current income consistent with preservation of capital.
NAV RETURNS AS OF DECEMBER 31, 2018(unaudited)
| 6 Months | 12 Months | |||||||
| AB FLEXFEE INTERNATIONAL BOND PORTFOLIO | ||||||||
| Advisor Class Shares | 1.41% | 2.16% | ||||||
| Bloomberg Barclays Global Aggregateex-USD Index (USD hedged) | 1.72% | 3.17% | ||||||
INVESTMENT RESULTS
The table above shows the Fund’s performance compared to its benchmark, the Bloomberg Barclays Global Aggregateex-USD Index (USD hedged), for thesix- and12-month periods ended December 31, 2018.
The Fund underperformed the benchmark for both periods. The Fund’s performance-based advisory fee for the performance period from June 28, 2017 through December 31, 2018 was accrued at its minimum rate.
In the12-month period, country and yield-curve positioning detracted from performance, relative to the benchmark. An exposure to the US and an underweight to South Korea detracted, while eurozone yield-curve positioning contributed. Sector allocation also weighed on performance, primarily the result of an overweight to eurozone high-yield corporates, and exposure to inflation-linked securities in Japan and investment-grade corporates in the US. The Fund’sout-of-index allocations to US agency risk-sharing transactions and US commercial mortgage-backed securities were positive. Active currency positions detracted, as gains from a short position in the Turkish lira were more than offset by a detrimental long position in the euro. Security decisions contributed, primarily because of strong selection within eurozone treasuries and Canadian provincial bonds.
In thesix-month period, country and yield-curve positioning detracted due to an underweight to South Korea and anoff-benchmark exposure to the US, while a modestout-of-index allocation to Turkey was positive. Sector selection was also negative, as gains from exposure to US agencyrisk-sharing transactions were more than offset by losses from a position in high-yield corporates and exposure to Japanese inflation-linked securities. Security decisions contributed, helped most by selection within eurozone treasuries and Canadian provincial bonds. Currency investments did not
| 2 | AB FLEXFEE INTERNATIONAL BOND PORTFOLIO | abfunds.com | |
have a material impact on overall performance, as positive returns from a short position in the Turkish lira were offset by several modest detractors across a range of currency positions.
During both periods, the Fund utilized derivatives in the form of interest rate swaps, futures and interest rate swaptions to manage and hedge duration risk and/or take active yield-curve positioning. Currency forwards and currency options, both written and purchased, were used to hedge foreign currency exposure and to achieve active exposure. Credit default swaps were used to hedge credit risk and as a tool to effectively gain exposure to specific sectors. Variance swaps were used to hedge corporate credit risk.
MARKET REVIEW AND INVESTMENT STRATEGY
Fixed-income markets had mixed performance over the12-month period ended December 31, 2018, amid concerns over tighter monetary policy, global trade tensions and geopolitical uncertainty. Developed-market treasuries rallied, while investment-grade securities posted neutral returns, and high-yield and emerging-market debt sectors sold off. The US Federal Reserve raised interest rates four times in 2018 and began to formally reduce its balance sheet, as widely anticipated, but at the very end of the period signaled a possible slowdown in its pace of rate hikes, leading markets to discount anticipated 2019 hikes that had previously been reflected in bond prices. Meanwhile, as announced earlier in the year, the European Central Bank ended its bond buying program in December. Over the period, US yields rose dramatically, with10- and30-year Treasury yields touching multiyear highs, on the back of higher inflation forecasts and a robust US labor market. Meanwhile, the US administration announced tariffs on imports from China, the European Union, Mexico and Canada, all of which reciprocated with tariffs on the US, triggering a global trade war. An upsurge in geopolitical uncertainty regarding Brexit and budget discussions between Italy and its European Union partners sparked a flight to quality.
The Fund’s Senior Investment Management Team (the “Team”) continues to utilize a core fixed-income strategy with a globalex-US, multi-sector approach, and continues to pursue an attractive risk/return profile by managing currency exposure. The Team invests in fixed-income securities, including US dollar- and local currency-denominated debt securities, as well as select below investment-grade securities (“junk bonds”).
INVESTMENT POLICIES
The Fund invests primarily in fixed-income securities ofnon-US companies and governments. Under normal circumstances, the Fund invests at least 80% of its net assets in fixed-income securities and related derivatives. In addition, the Fund invests, under normal
(continued on next page)
| abfunds.com | AB FLEXFEE INTERNATIONAL BOND PORTFOLIO | 3 | |
circumstances, in the fixed-income securities of companies located in at least three countries other than the United States. The Fund invests in a broad range of fixed-income securities in both developed and emerging markets and across all fixed-income sectors, includingnon-US government and corporate debt securities. Under normal circumstances, the Fund invests at least 75% of its net assets in fixed-income securities rated investment-grade at the time of investment and may invest up to 25% of its net assets in below investment-grade fixed-income securities (commonly known as “junk bonds”).
The Fund’s investments may be denominated in local currency or be US dollar-denominated. The Fund may invest in debt securities with a range of maturities from short- to long-term. The Fund may at times invest in mortgage-related securities.
The Adviser selects securities for purchase or sale by the Fund based on its assessment of the securities’ risk and return characteristics as well as the securities’ impact on the overall risk and return characteristics of the Fund. In making this assessment, the Adviser takes into account various factors, including the credit quality and sensitivity to interest rates of the securities under consideration and of the Fund’s other holdings.
The Adviser seeks to actively manage the Fund’s assets in relation to market conditions and general economic conditions and adjust the Fund’s investments in an effort to best enable the Fund to achieve its investment objective. Thus, the percentage of the Fund’s assets invested in a particular country or denominated in a particular currency will vary in accordance with the Adviser’s assessment of the relative yield and appreciation potential of such securities and the relationship of the country’s currency to the US dollar.
In order to reduce the Fund’s volatility, the Adviser expects under normal circumstances to hedge the majority of the Fund’s foreign currency exposure to the US dollar through the use of foreign currency forward contracts and similar derivatives, although it will not be required to do so. The Fund may take a long position in one currency and a short position in another when it believes that the first currency will appreciate relative to the other.
The Fund expects to use derivatives, such as options, futures contracts, forwards or swaps. Derivatives may provide a more efficient and economical exposure to market segments than direct investments, and may also be a more efficient way to alter the Fund’s exposure. The Fund may, for example, use interest rate futures contracts to gain exposure to the fixed-income markets and, as noted above, may use currency derivatives to hedge foreign currency exposure.
| 4 | AB FLEXFEE INTERNATIONAL BOND PORTFOLIO | abfunds.com | |
DISCLOSURES AND RISKS
Benchmark Disclosure
The Bloomberg Barclays Global Aggregateex-USD Index (USD hedged) is unmanaged and does not reflect fees and expenses associated with the active management of a mutual fund portfolio.The Bloomberg Barclays Global Aggregateex-USD Index (USD hedged) represents the performance of the global investment-grade developed fixed-income markets, excluding the United States. An investor cannot invest directly in an index, and its results are not indicative of the performance for any specific investment, including the Fund.
A Word About Risk
Market Risk: The value of the Fund’s assets will fluctuate as the bond or stock market fluctuates. The value of its investments may decline, sometimes rapidly and unpredictably, simply because of economic changes or other events that affect large portions of the market.
Interest-Rate Risk: Changes in interest rates will affect the value of investments in fixed-income securities. When interest rates rise, the value of existing investments in fixed-income securities tends to fall and this decrease in value may not be offset by higher income from new investments. Interest-rate risk is generally greater for fixed-income securities with longer maturities or durations.
Credit Risk:An issuer or guarantor of a fixed-income security, or the counterparty to a derivatives or other contract, may be unable or unwilling to make timely payments of interest or principal, or to otherwise honor its obligations. The issuer or guarantor may default, causing a loss of the full principal amount of a security and accrued interest. The degree of risk for a particular security may be reflected in its credit rating. There is the possibility that the credit rating of a fixed-income security may be downgraded after purchase, which may adversely affect the value of the security.
Below Investment-Grade Securities Risk: Investments in fixed-income securities with lower ratings (commonly known as “junk bonds”) are subject to a higher probability that an issuer will default or fail to meet its payment obligations. These securities may be subject to greater price volatility, due to such factors as specific corporate developments, negative perceptions of the junk bond market generally and less secondary market liquidity.
Duration Risk: Duration is a measure that relates the expected price volatility of a fixed-income security to changes in interest rates. The duration of a fixed-income security may be shorter than or equal to full maturity of a fixed-income security. Fixed-income securities with longer durations have more risk and will decrease in price as interest rates rise.
| abfunds.com | AB FLEXFEE INTERNATIONAL BOND PORTFOLIO | 5 | |
DISCLOSURES AND RISKS(continued)
Inflation Risk: This is the risk that the value of assets or income from investments will be less in the future as inflation decreases the value of money. As inflation increases, the value of the Fund’s assets can decline as can the value of the Fund’s distributions. This risk is significantly greater if the Fund invests a significant portion of its assets in fixed-income securities with longer maturities.
Mortgage-Related Securities Risk: Investments in mortgage-related securities are subject to certain additional risks. The value of these securities may be particularly sensitive to changes in interest rates. These risks include “extension risk”, which is the risk that, in periods of rising interest rates, issuers may delay the payment of principal, and “prepayment risk”, which is the risk that in periods of falling interest rates, issuers may pay principal sooner than expected, exposing the Fund to a lower rate of return upon reinvestment of principal. Mortgage-backed securities offered by non-governmental issuers may be subject to other risks, such as higher rates of default in the mortgages or risks associated with the nature and servicing of mortgages backing the securities.
Foreign(Non-US) Risk: Investments in securities ofnon-US issuers may involve more risk than those of US issuers. These securities may fluctuate more widely in price and may be less liquid due to adverse market, economic, political, regulatory or other factors.
Emerging-Market Risk: Investments in emerging-market countries may have more risk because the markets are less developed and less liquid, and because these investments may be subject to increased economic, political, regulatory or other uncertainties.
Currency Risk: Fluctuations in currency exchange rates may negatively affect the value of the Fund’s investments in fixed-income securities denominated in foreign currencies or reduce the Fund’s returns.
Derivatives Risk: Derivatives may be illiquid, difficult to price, and leveraged so that small changes may produce disproportionate losses for the Fund, and may be subject to counterparty risk to a greater degree than more traditional investments.
Liquidity Risk: Liquidity risk occurs when certain investments become difficult to purchase or sell. Difficulty in selling less liquid securities may result in sales at disadvantageous prices affecting the value of your investment in the Fund. Causes of liquidity risk may include low trading volumes, large positions and heavy redemptions of Fund shares. Over recent years liquidity risk has also increased because the capacity of dealers in the secondary market for fixed-income securities to make markets in these securities has decreased, even as the overall bond market has
| 6 | AB FLEXFEE INTERNATIONAL BOND PORTFOLIO | abfunds.com | |
DISCLOSURES AND RISKS(continued)
grown significantly, due to, among other things, structural changes, additional regulatory requirements and capital and risk restraints that have led to reduced inventories. Liquidity risk may be higher in a rising interest-rate environment, when the value and liquidity of fixed-income securities generally decline.
Management Risk: The Fund is subject to management risk because it is an actively managed investment fund. The Adviser will apply its investment techniques and risk analyses in making investment decisions, but there is no guarantee that its techniques will produce the intended results.
These risks are fully discussed in the Fund’s prospectus. As with all investments, you may lose money by investing in the Fund.
An Important Note About Historical Performance
The investment return and principal value of an investment in the Fund will fluctuate, so that shares, when redeemed, may be worth more or less than their original cost. Performance shown in this report represents past performance and does not guarantee future results. Current performance may be lower or higher than the performance information shown. You may obtain performance information current to the most recentmonth-end by visiting www.abfunds.com. The Fund has been in operation only for a short period of time, and therefore has a very limited historical performance period. This limited performance period is unlikely to be representative of the performance the Fund will achieve over a longer period.
All fees and expenses related to the operation of the Fund have been deducted. Net asset value (“NAV”) returns do not reflect sales charges; if sales charges were reflected, the Fund’s quoted performance would be lower. SEC returns reflect the applicable sales charges for each share class. Returns for the different share classes will vary due to different expenses associated with each class. Performance assumes reinvestment of distributions and does not account for taxes.
| abfunds.com | AB FLEXFEE INTERNATIONAL BOND PORTFOLIO | 7 | |
HISTORICAL PERFORMANCE
GROWTH OF A $10,000 INVESTMENT IN THE FUND(unaudited)
6/28/20171 TO 12/31/2018
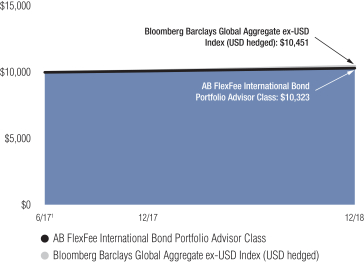
This chart illustrates the total value of an assumed $10,000 investment in AB FlexFee International Bond Portfolio Advisor Class shares (from 6/28/20171 to 12/31/2018) as compared to the performance of the Fund’s benchmark.
| 1 | Inception date: 6/28/2017. |
| 8 | AB FLEXFEE INTERNATIONAL BOND PORTFOLIO | abfunds.com | |
HISTORICAL PERFORMANCE(continued)
AVERAGE ANNUAL RETURNS AS OF DECEMBER 31, 2018(unaudited)
| NAV Returns | SEC Returns (reflects applicable sales charges) | |||||||
| ADVISOR CLASS SHARES1 | ||||||||
| 1 Year | 2.16% | 2.16% | ||||||
| Since Inception2 | 2.13% | 2.13% | ||||||
SEC AVERAGE ANNUAL RETURNS
AS OF THE MOST RECENT CALENDARQUARTER-END
DECEMBER 31, 2018(unaudited)
SEC Returns (reflects applicable sales charges) | ||||
| ADVISOR CLASS SHARES | ||||
| 1 Year | 2.16% | |||
| Since Inception2 | 2.13% | |||
The Fund’s current prospectus fee table shows the Fund’s total annual operating expense ratio as 2.22% for Advisor Class shares, gross of any fee waivers or expense reimbursements. Contractual fee waivers and/or expense reimbursements limit the Fund’s annual operating expense ratio exclusive of the Fund’s advisory fees, acquired fund fees and expenses other than the advisory fees of any AB mutual funds in which the Fund may invest, interest expense, taxes, extraordinary expenses, and brokerage commissions and other transaction costs to 0.10% for Advisor Class shares. These waivers/reimbursements may not be terminated before April 30, 2020. Any fees waived and expenses borne by the Adviser through December 31, 2018 may be reimbursed by the Fund until the end of the third fiscal year after the fiscal period in which the fee was waived or the expense was borne, provided that no reimbursement payment will be made that would cause the Fund’s total annual operating expenses to exceed these expense limitations. Absent reimbursements or waivers, performance would have been lower. The Financial Highlights section of this report sets forth expense ratio data for the current reporting period; the expense ratio shown above may differ from the expense ratio in the Financial Highlights section since they are based on different time periods.
| 1 | This share class is offered at NAV to eligible investors and the SEC returns are the same as the NAV returns. |
| 2 | Inception date: 6/28/2017. |
| abfunds.com | AB FLEXFEE INTERNATIONAL BOND PORTFOLIO | 9 | |
EXPENSE EXAMPLE
(unaudited)
As a shareholder of the Fund, you incur two types of costs: (1) transaction costs, including sales charges (loads) on purchase payments, contingent deferred sales charges on redemptions and (2) ongoing costs, including advisory fees; distribution(12b-1) fees; and other Fund expenses. This example is intended to help you understand your ongoing costs (in dollars) of investing in the Fund and to compare these costs with the ongoing costs of investing in other mutual funds.
The Example is based on an investment of $1,000 invested at the beginning of the period and held for the entire period as indicated below.
Actual Expenses
The table below provides information about actual account values and actual expenses. You may use the information in this line, together with the amount you invested, to estimate the expenses that you paid over the period. Simply divide your account value by $1,000 (for example, an $8,600 account value divided by $1,000 = 8.6), then multiply the result by the number in the first line under the heading entitled “Expenses Paid During Period” to estimate the expenses you paid on your account during this period.
Hypothetical Example for Comparison Purposes
The table below provides information about hypothetical account values and hypothetical expenses based on the Fund’s actual expense ratio and an assumed annual rate of return of 5% before expenses, which is not the Fund’s actual return. The hypothetical account values and expenses may not be used to estimate the actual ending account balance or expenses you paid for the period. You may use this information to compare the ongoing costs of investing in the Fund and other funds by comparing this 5% hypothetical example with the 5% hypothetical examples that appear in the shareholder reports of other funds.
Please note that the expenses shown in the table are meant to highlight your ongoing costs only and do not reflect any transactional costs, such as sales charges (loads), or contingent deferred sales charges on redemptions. Therefore, the hypothetical example is useful in comparing ongoing costs only, and will not help you determine the relative total costs of owning different funds. In addition, if these transactional costs were included, your costs would have been higher.
| 10 | AB FLEXFEE INTERNATIONAL BOND PORTFOLIO | abfunds.com | |
EXPENSE EXAMPLE(continued)
| Beginning Account Value 7/01/2018 | Ending Account Value 12/31/2018 | Expenses Paid During Period* | Annualized Expense Ratio* | |||||||||||||
| Advisor Class | ||||||||||||||||
Actual | $ | 1,000 | $ | 1,014.10 | $ | 1.02 | 0.20 | % | ||||||||
Hypothetical** | $ | 1,000 | $ | 1,024.20 | $ | 1.02 | 0.20 | % | ||||||||
| * | Expenses are equal to the classes’ annualized expense ratios multiplied by the average account value over the period, multiplied by 184/365 (to reflect the one-half year period). |
| ** | Assumes 5% annual return before expenses. |
| abfunds.com | AB FLEXFEE INTERNATIONAL BOND PORTFOLIO | 11 | |
PORTFOLIO SUMMARY
December 31, 2018(unaudited)
PORTFOLIO STATISTICS
Net Assets ($mil): $45.9
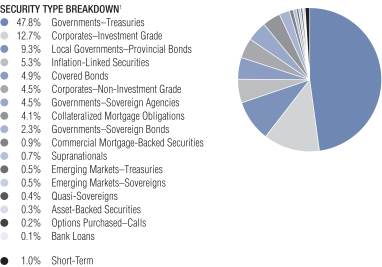
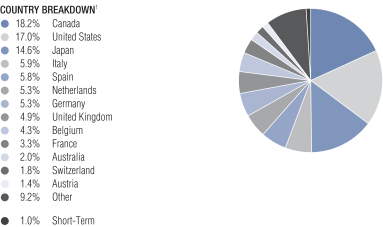
| 1 | All data are as of December 31, 2018. The Fund’s security type and country breakdowns are expressed as a percentage of total investments and may vary over time. The Fund also enters into derivative transactions, which may be used for hedging or investment purposes (see “Portfolio of Investments” section of the report for additional details). “Other” country weightings represent 1.3% or less in the following countries or classifications: Argentina, Brazil, China, Costa Rica, Denmark, Indonesia, Ireland, Malaysia, New Zealand, Norway, Qatar, Singapore, South Korea, Supranational, Sweden, Turkey and Uruguay. |
| 12 | AB FLEXFEE INTERNATIONAL BOND PORTFOLIO | abfunds.com | |
PORTFOLIO OF INVESTMENTS
December 31, 2018
| Principal Amount (000) | U.S. $ Value | |||||||||||
| ||||||||||||
GOVERNMENTS – TREASURIES – 47.2% | ||||||||||||
Australia – 1.7% | ||||||||||||
Australia Government Bond | AUD | 1,069 | $ | 781,407 | ||||||||
|
| |||||||||||
Austria – 1.4% | ||||||||||||
Republic of Austria Government Bond | EUR | 470 | 556,980 | |||||||||
2.40%, 5/23/34(a) | 45 | 62,181 | ||||||||||
|
| |||||||||||
| 619,161 | ||||||||||||
|
| |||||||||||
Belgium – 4.2% | ||||||||||||
Kingdom of Belgium Government Bond | 170 | 299,515 | ||||||||||
Series 58 | 1,329 | 1,637,397 | ||||||||||
|
| |||||||||||
| 1,936,912 | ||||||||||||
|
| |||||||||||
Canada – 3.4% | ||||||||||||
Canadian Government Bond | CAD | 447 | 313,664 | |||||||||
1.75%, 9/01/19 | 1,315 | 963,019 | ||||||||||
2.00%, 6/01/28 | 365 | 268,173 | ||||||||||
|
| |||||||||||
| 1,544,856 | ||||||||||||
|
| |||||||||||
France – 2.5% | ||||||||||||
French Republic Government Bond OAT | EUR | 930 | 1,148,864 | |||||||||
|
| |||||||||||
Germany – 4.4% | ||||||||||||
Bundesrepublik Deutschland Bundesanleihe | 440 | 519,010 | ||||||||||
2.50%,7/04/44-8/15/46(a) | 866 | 1,384,213 | ||||||||||
Series 3 | 72 | 134,476 | ||||||||||
|
| |||||||||||
| 2,037,699 | ||||||||||||
|
| |||||||||||
Ireland – 0.7% | ||||||||||||
Ireland Government Bond | 278 | 328,065 | ||||||||||
|
| |||||||||||
Italy – 5.1% | ||||||||||||
Italy Buoni Poliennali Del Tesoro | 125 | 142,629 | ||||||||||
2.05%, 8/01/27 | 101 | 111,453 | ||||||||||
2.20%, 6/01/27 | 1,070 | 1,197,211 | ||||||||||
5.50%, 11/01/22(a) | 675 | 887,642 | ||||||||||
|
| |||||||||||
| 2,338,935 | ||||||||||||
|
| |||||||||||
| abfunds.com | AB FLEXFEE INTERNATIONAL BOND PORTFOLIO | 13 | |
PORTFOLIO OF INVESTMENTS(continued)
| Principal Amount (000) | U.S. $ Value | |||||||||||
| ||||||||||||
Japan – 9.4% | ||||||||||||
Japan Government Twenty Year Bond | JPY | 158,050 | $ | 1,752,412 | ||||||||
Series 143 | 42,450 | 461,613 | ||||||||||
Series 144 | 34,350 | 369,164 | ||||||||||
Series 150 | 126,300 | 1,345,506 | ||||||||||
Series 158 | 44,200 | 409,346 | ||||||||||
|
| |||||||||||
| 4,338,041 | ||||||||||||
|
| |||||||||||
Malaysia – 1.2% | ||||||||||||
Malaysia Government Bond | MYR | 1,830 | 436,350 | |||||||||
Series 3/04 | 482 | 118,143 | ||||||||||
|
| |||||||||||
| 554,493 | ||||||||||||
|
| |||||||||||
Netherlands – 4.7% | ||||||||||||
Netherlands Government Bond | EUR | 771 | 918,370 | |||||||||
3.25%, 7/15/21(a) | 987 | 1,242,041 | ||||||||||
|
| |||||||||||
| 2,160,411 | ||||||||||||
|
| |||||||||||
Singapore – 0.7% | ||||||||||||
Singapore Government Bond | SGD | 325 | 252,474 | |||||||||
3.375%, 9/01/33 | 90 | 74,697 | ||||||||||
|
| |||||||||||
| 327,171 | ||||||||||||
|
| |||||||||||
Spain – 5.0% | ||||||||||||
Spain Government Bond | EUR | 793 | 969,665 | |||||||||
2.35%, 7/30/33(a) | 240 | 288,756 | ||||||||||
4.40%, 10/31/23(a) | 755 | 1,029,899 | ||||||||||
|
| |||||||||||
| 2,288,320 | ||||||||||||
|
| |||||||||||
United Kingdom – 2.1% | ||||||||||||
United Kingdom Gilt | GBP | 145 | 171,824 | |||||||||
2.50%, 7/22/65(a) | 46 | 73,526 | ||||||||||
3.25%, 1/22/44(a) | 42 | 68,650 | ||||||||||
4.25%, 12/07/40(a) | 91 | 168,073 | ||||||||||
4.50%, 12/07/42(a) | 227 | 441,083 | ||||||||||
4.75%, 12/07/30(a) | 21 | 36,651 | ||||||||||
|
| |||||||||||
| 959,807 | ||||||||||||
|
| |||||||||||
| 14 | AB FLEXFEE INTERNATIONAL BOND PORTFOLIO | abfunds.com | |
PORTFOLIO OF INVESTMENTS(continued)
| Principal Amount (000) | U.S. $ Value | |||||||||||
| ||||||||||||
United States – 0.5% | ||||||||||||
U.S. Treasury Bonds | U.S.$ | 43 | $ | 42,673 | ||||||||
U.S. Treasury Notes | 220 | 205,906 | ||||||||||
|
| |||||||||||
| 248,579 | ||||||||||||
|
| |||||||||||
Uruguay – 0.2% | ||||||||||||
Uruguay Government International Bond | UYU | 1,198 | �� | 31,322 | ||||||||
9.875%, 6/20/22(a) | 1,225 | 37,319 | ||||||||||
|
| |||||||||||
| 68,641 | ||||||||||||
|
| |||||||||||
Total Governments – Treasuries | 21,681,362 | |||||||||||
|
| |||||||||||
CORPORATES – INVESTMENT GRADE – 12.6% | ||||||||||||
Financial Institutions – 8.2% | ||||||||||||
Banking – 6.9% | ||||||||||||
Bank of America Corp. | EUR | 100 | 121,957 | |||||||||
3.824%, 1/20/28 | U.S.$ | 135 | 130,626 | |||||||||
Series B | 315 | 389,719 | ||||||||||
Series DD | 29 | 29,476 | ||||||||||
Series Z | 49 | 50,272 | ||||||||||
Bank of Scotland PLC | GBP | 90 | 131,668 | |||||||||
Barclays Bank PLC | EUR | 81 | 104,087 | |||||||||
BNP Paribas SA | U.S.$ | 205 | 208,668 | |||||||||
CaixaBank SA | EUR | 100 | 112,197 | |||||||||
Citigroup, Inc. | U.S.$ | 165 | 165,144 | |||||||||
Cooperatieve Rabobank UA | EUR | 90 | 118,761 | |||||||||
Credit Agricole SA | 135 | 159,486 | ||||||||||
Goldman Sachs Group, Inc. (The) | 180 | 199,966 | ||||||||||
2.905%, 7/24/23 | U.S.$ | 51 | 48,541 | |||||||||
HSBC Bank Capital Funding Sterling 2 LP | GBP | 91 | 118,331 | |||||||||
| abfunds.com | AB FLEXFEE INTERNATIONAL BOND PORTFOLIO | 15 | |
PORTFOLIO OF INVESTMENTS(continued)
| Principal Amount (000) | U.S. $ Value | |||||||||||
| ||||||||||||
HSBC Holdings PLC | EUR | 200 | $ | 242,582 | ||||||||
Intesa Sanpaolo SpA | U.S.$ | 200 | 184,480 | |||||||||
JPMorgan Chase & Co. | 135 | 130,898 | ||||||||||
Morgan Stanley | EUR | 100 | 118,926 | |||||||||
Series G | 100 | 117,179 | ||||||||||
Rabobank Capital Funding Trust IV | GBP | 90 | 117,574 | |||||||||
Santander Holdings USA, Inc. | U.S.$ | 110 | 103,838 | |||||||||
US Bancorp | 90 | 84,561 | ||||||||||
|
| |||||||||||
| 3,188,937 | ||||||||||||
|
| |||||||||||
Finance – 0.2% | ||||||||||||
Synchrony Financial | 81 | 73,521 | ||||||||||
|
| |||||||||||
Insurance – 0.7% | ||||||||||||
Assicurazioni Generali SpA | EUR | 112 | 133,692 | |||||||||
MetLife Capital Trust IV | U.S.$ | 100 | 113,731 | |||||||||
Nationwide Mutual Insurance Co. | 45 | 67,429 | ||||||||||
|
| |||||||||||
| 314,852 | ||||||||||||
|
| |||||||||||
REITS – 0.4% | ||||||||||||
American Tower Corp. | 10 | 10,270 | ||||||||||
5.05%, 9/01/20 | 10 | 10,245 | ||||||||||
Healthcare Trust of America Holdings LP | 38 | 37,753 | ||||||||||
Spirit Realty LP | 3 | 2,908 | ||||||||||
VEREIT Operating Partnership LP | 7 | 7,064 | ||||||||||
WPC Eurobond BV | EUR | 110 | 120,693 | |||||||||
|
| |||||||||||
| 188,933 | ||||||||||||
|
| |||||||||||
| 3,766,243 | ||||||||||||
|
| |||||||||||
| 16 | AB FLEXFEE INTERNATIONAL BOND PORTFOLIO | abfunds.com | |
PORTFOLIO OF INVESTMENTS(continued)
| Principal Amount (000) | U.S. $ Value | |||||||||||
| ||||||||||||
Industrial – 4.4% | ||||||||||||
Basic – 0.5% | ||||||||||||
Glencore Finance Europe Ltd. | EUR | 100 | $ | 109,734 | ||||||||
1.875%, 9/13/23(a) | 100 | 114,262 | ||||||||||
Glencore Funding LLC | U.S.$ | 10 | 9,967 | |||||||||
Yamana Gold, Inc. | 10 | 9,755 | ||||||||||
|
| |||||||||||
| 243,718 | ||||||||||||
|
| |||||||||||
Communications - Media – 0.3% | ||||||||||||
Charter Communications Operating LLC/Charter Communications Operating Capital | 10 | 9,987 | ||||||||||
4.908%, 7/23/25 | 90 | 89,335 | ||||||||||
Warner Media LLC | 45 | 43,576 | ||||||||||
|
| |||||||||||
| 142,898 | ||||||||||||
|
| |||||||||||
Communications - Telecommunications – 0.6% | ||||||||||||
AT&T, Inc. | 229 | 215,725 | ||||||||||
Bell Canada, Inc. | CAD | 45 | 32,963 | |||||||||
Rogers Communications, Inc. | 10 | 7,506 | ||||||||||
TELUS Corp. | 10 | 7,572 | ||||||||||
|
| |||||||||||
| 263,766 | ||||||||||||
|
| |||||||||||
Consumer Cyclical - Automotive – 0.3% | ||||||||||||
General Motors Co. | U.S.$ | 35 | 31,682 | |||||||||
General Motors Financial Co., Inc. | 17 | 16,271 | ||||||||||
Volkswagen Leasing GmbH | EUR | 55 | 65,496 | |||||||||
|
| |||||||||||
| 113,449 | ||||||||||||
|
| |||||||||||
Consumer Cyclical - Entertainment – 0.5% | ||||||||||||
Carnival Corp. | 180 | 211,753 | ||||||||||
|
| |||||||||||
| abfunds.com | AB FLEXFEE INTERNATIONAL BOND PORTFOLIO | 17 | |
PORTFOLIO OF INVESTMENTS(continued)
| Principal Amount (000) | U.S. $ Value | |||||||||||
| ||||||||||||
ConsumerNon-Cyclical – 1.1% | ||||||||||||
Celgene Corp. | U.S.$ | 78 | $ | 74,843 | ||||||||
3.25%, 2/20/23 | 80 | 78,270 | ||||||||||
3.45%, 11/15/27 | 92 | 83,754 | ||||||||||
Leisureworld Senior Care LP | CAD | 150 | 110,825 | |||||||||
Philip Morris International, Inc. | EUR | 100 | 110,667 | |||||||||
Reynolds American, Inc. | U.S.$ | 45 | 43,283 | |||||||||
|
| |||||||||||
| 501,642 | ||||||||||||
|
| |||||||||||
Energy – 0.3% | ||||||||||||
Enbridge Energy Partners LP | 20 | 20,195 | ||||||||||
Energy Transfer Partners LP | 10 | 10,140 | ||||||||||
4.90%, 2/01/24 | 10 | 10,059 | ||||||||||
Noble Energy, Inc. | 20 | 19,294 | ||||||||||
Plains All American Pipeline LP/PAA Finance Corp. | 20 | 18,965 | ||||||||||
3.85%, 10/15/23 | 10 | 9,671 | ||||||||||
Williams Cos., Inc. (The) | 45 | 43,672 | ||||||||||
|
| |||||||||||
| 131,996 | ||||||||||||
|
| |||||||||||
Services – 0.0% | ||||||||||||
Expedia Group, Inc. | 13 | 11,800 | ||||||||||
|
| |||||||||||
Technology – 0.8% | ||||||||||||
Apple, Inc. | CAD | 120 | 85,424 | |||||||||
Broadcom Corp./Broadcom Cayman Finance Ltd. | U.S.$ | 10 | 8,966 | |||||||||
Dell International LLC/EMC Corp. | 12 | 12,228 | ||||||||||
6.02%, 6/15/26(a) | 45 | 45,213 | ||||||||||
Fidelity National Information Services, Inc. | EUR | 100 | 114,798 | |||||||||
KLA-Tencor Corp. | U.S.$ | 20 | 20,482 | |||||||||
| 18 | AB FLEXFEE INTERNATIONAL BOND PORTFOLIO | abfunds.com | |
PORTFOLIO OF INVESTMENTS(continued)
| Principal Amount (000) | U.S. $ Value | |||||||||||
| ||||||||||||
Seagate HDD Cayman | U.S.$ | 10 | $ | 8,900 | ||||||||
4.875%, 3/01/24 | 80 | 72,794 | ||||||||||
|
| |||||||||||
| 368,805 | ||||||||||||
|
| |||||||||||
| 1,989,827 | ||||||||||||
|
| |||||||||||
Utility – 0.0% | ||||||||||||
Electric – 0.0% | ||||||||||||
Union Electric Co. | 10 | 10,025 | ||||||||||
|
| |||||||||||
Total Corporates – Investment Grade | 5,766,095 | |||||||||||
|
| |||||||||||
LOCAL GOVERNMENTS – PROVINCIAL BONDS – 9.1% | ||||||||||||
Canada – 9.1% | ||||||||||||
Province of British Columbia Canada | CAD | 325 | 235,562 | |||||||||
Series T | 912 | 892,099 | ||||||||||
Province of Manitoba Canada | 345 | 263,974 | ||||||||||
Province of Ontario Canada | 135 | 96,814 | ||||||||||
2.60%,6/02/25-6/02/27 | 655 | 476,650 | ||||||||||
3.15%, 6/02/22 | 316 | 237,623 | ||||||||||
Province of Quebec Canada | 280 | 206,862 | ||||||||||
4.50%, 12/01/19 | 2,385 | 1,787,216 | ||||||||||
|
| |||||||||||
Total Local Governments – Provincial Bonds | 4,196,800 | |||||||||||
|
| |||||||||||
INFLATION-LINKED SECURITIES – 5.2% | ||||||||||||
Japan – 5.0% | ||||||||||||
Japanese Government CPI Linked Bond | JPY | 12,396 | 116,319 | |||||||||
Series 21 | 169,620 | 1,598,094 | ||||||||||
Series 23 | 62,453 | 588,048 | ||||||||||
|
| |||||||||||
| 2,302,461 | ||||||||||||
|
| |||||||||||
| abfunds.com | AB FLEXFEE INTERNATIONAL BOND PORTFOLIO | 19 | |
PORTFOLIO OF INVESTMENTS(continued)
| Principal Amount (000) | U.S. $ Value | |||||||||||
| ||||||||||||
New Zealand – 0.2% | ||||||||||||
New Zealand Government Inflation Linked Bond | NZD | 136 | $ | 103,460 | ||||||||
|
| |||||||||||
Total Inflation-Linked Securities | 2,405,921 | |||||||||||
|
| |||||||||||
COVERED BONDS – 4.8% | ||||||||||||
Australia & New Zealand Banking Group Ltd. | EUR | 100 | 128,516 | |||||||||
Bank of Montreal | 155 | 181,649 | ||||||||||
Credit Suisse AG/Guernsey | 160 | 187,150 | ||||||||||
Danske Bank A/S | 160 | 183,695 | ||||||||||
DNB Boligkreditt AS | 145 | 180,483 | ||||||||||
National Bank of Canada | 100 | 118,584 | ||||||||||
Nationwide Building Society | 250 | 324,452 | ||||||||||
Santander UK PLC | 250 | 313,874 | ||||||||||
Stadshypotek AB | 260 | 303,541 | ||||||||||
Turkiye Vakiflar Bankasi TAO | 100 | 109,701 | ||||||||||
UBS AG/London | 65 | 77,000 | ||||||||||
4.00%, 4/08/22(a) | 75 | 96,991 | ||||||||||
|
| |||||||||||
Total Covered Bonds | 2,205,636 | |||||||||||
|
| |||||||||||
CORPORATES –NON-INVESTMENT GRADE – 4.5% | ||||||||||||
Financial Institutions – 2.3% | ||||||||||||
Banking – 2.0% | ||||||||||||
Allied Irish Banks PLC | 200 | 238,316 | ||||||||||
American Express Co. | U.S.$ | 115 | 110,472 | |||||||||
| 20 | AB FLEXFEE INTERNATIONAL BOND PORTFOLIO | abfunds.com | |
PORTFOLIO OF INVESTMENTS(continued)
| Principal Amount (000) | U.S. $ Value | |||||||||||
| ||||||||||||
Banco Bilbao Vizcaya Argentaria SA | EUR | 200 | $ | 217,608 | ||||||||
Goldman Sachs Group, Inc. (The) | U.S.$ | 115 | 112,539 | |||||||||
Series P | 59 | 49,701 | ||||||||||
UBS Group Funding Switzerland AG | 200 | 203,180 | ||||||||||
|
| |||||||||||
| 931,816 | ||||||||||||
|
| |||||||||||
Finance – 0.1% | ||||||||||||
Navient Corp. | 45 | 43,465 | ||||||||||
|
| |||||||||||
Insurance – 0.2% | ||||||||||||
Voya Financial, Inc. | 70 | 65,728 | ||||||||||
|
| |||||||||||
| 1,041,009 | ||||||||||||
|
| |||||||||||
Industrial – 2.1% | ||||||||||||
Basic – 0.1% | ||||||||||||
Novelis Corp. | 45 | 42,404 | ||||||||||
|
| |||||||||||
Communications - Telecommunications – 0.2% | ||||||||||||
CenturyLink, Inc. | 45 | 44,821 | ||||||||||
Series T | 51 | 48,980 | ||||||||||
|
| |||||||||||
| 93,801 | ||||||||||||
|
| |||||||||||
ConsumerNon-Cyclical – 0.4% | ||||||||||||
HCA, Inc. | 33 | 32,103 | ||||||||||
5.625%, 9/01/28 | 35 | 33,833 | ||||||||||
Spectrum Brands, Inc. | 62 | 58,898 | ||||||||||
Tenet Healthcare Corp. | 39 | 37,760 | ||||||||||
4.50%, 4/01/21 | 25 | 24,472 | ||||||||||
|
| |||||||||||
| 187,066 | ||||||||||||
|
| |||||||||||
Energy – 0.9% | ||||||||||||
Antero Resources Corp. | 65 | 61,097 | ||||||||||
| abfunds.com | AB FLEXFEE INTERNATIONAL BOND PORTFOLIO | 21 | |
PORTFOLIO OF INVESTMENTS(continued)
| Principal Amount (000) | U.S. $ Value | |||||||||||
| ||||||||||||
Diamond Offshore Drilling, Inc. | U.S.$ | 10 | $ | 5,584 | ||||||||
Energy Transfer LP | 15 | 14,466 | ||||||||||
EnLink Midstream Partners LP | 90 | 81,003 | ||||||||||
Hess Infrastructure Partners LP/Hess Infrastructure Partners Finance Corp. | 35 | 34,029 | ||||||||||
PDC Energy, Inc. | 50 | 44,315 | ||||||||||
QEP Resources, Inc. | 68 | 60,423 | ||||||||||
SM Energy Co. | 31 | 27,435 | ||||||||||
Southern Star Central Corp. | 10 | 9,600 | ||||||||||
Sunoco LP/Sunoco Finance Corp. | 59 | 57,640 | ||||||||||
|
| |||||||||||
| 395,592 | ||||||||||||
|
| |||||||||||
Other Industrial – 0.2% | ||||||||||||
Belden, Inc. | EUR | 100 | 104,266 | |||||||||
|
| |||||||||||
Services – 0.1% | ||||||||||||
Aramark Services, Inc. | U.S.$ | 38 | 35,538 | |||||||||
|
| |||||||||||
Technology – 0.1% | ||||||||||||
Western Digital Corp. | 68 | 58,989 | ||||||||||
|
| |||||||||||
Transportation - Services – 0.1% | ||||||||||||
Hertz Corp. (The) | 45 | 32,969 | ||||||||||
|
| |||||||||||
| 950,625 | ||||||||||||
|
| |||||||||||
Utility – 0.1% | ||||||||||||
Electric – 0.1% | ||||||||||||
AES Corp./VA | 65 | 63,896 | ||||||||||
|
| |||||||||||
Total Corporates –Non-Investment Grade | 2,055,530 | |||||||||||
|
| |||||||||||
| 22 | AB FLEXFEE INTERNATIONAL BOND PORTFOLIO | abfunds.com | |
PORTFOLIO OF INVESTMENTS(continued)
| Principal Amount (000) | U.S. $ Value | |||||||||||
| ||||||||||||
GOVERNMENTS – SOVEREIGN AGENCIES – 4.4% | ||||||||||||
Canada – 4.4% | ||||||||||||
Canada Housing Trust No. 1 | CAD | 1,190 | $ | 855,243 | ||||||||
2.00%, 12/15/19(a) | 480 | 351,984 | ||||||||||
3.80%, 6/15/21(a) | 1,085 | 827,883 | ||||||||||
|
| |||||||||||
Total Governments – Sovereign Agencies | 2,035,110 | |||||||||||
|
| |||||||||||
COLLATERALIZED MORTGAGE OBLIGATIONS – 4.1% | ||||||||||||
Risk Share Floating Rate – 4.1% | ||||||||||||
Bellemeade Re Ltd. | U.S.$ | 150 | 150,756 | |||||||||
Eagle RE Ltd. | 160 | 159,778 | ||||||||||
Federal Home Loan Mortgage Corp. Structured Agency Credit Risk Debt Notes | 350 | 393,563 | ||||||||||
Federal National Mortgage Association Connecticut Avenue Securities | 204 | 218,540 | ||||||||||
Series2015-C02, Class 2M2 | 61 | 64,980 | ||||||||||
Series2015-C04, Class 2M2 | 258 | 287,178 | ||||||||||
Series2016-C01, Class 1M2 | 100 | 116,457 | ||||||||||
Series2016-C05, Class 2M2 | 350 | 381,893 | ||||||||||
| abfunds.com | AB FLEXFEE INTERNATIONAL BOND PORTFOLIO | 23 | |
PORTFOLIO OF INVESTMENTS(continued)
| Principal Amount (000) | U.S. $ Value | |||||||||||
| ||||||||||||
Series2017-C01, Class 1M2 | U.S.$ | 85 | $ | 90,083 | ||||||||
|
| |||||||||||
Total Collateralized Mortgage Obligations | 1,863,228 | |||||||||||
|
| |||||||||||
GOVERNMENTS – SOVEREIGN BONDS – 2.3% | ||||||||||||
Germany – 0.6% | ||||||||||||
Kreditanstalt fuer Wiederaufbau | EUR | 251 | 290,231 | |||||||||
|
| |||||||||||
Indonesia – 1.2% | ||||||||||||
Indonesia Government International Bond | U.S.$ | 510 | 541,237 | |||||||||
|
| |||||||||||
Qatar – 0.5% | ||||||||||||
Qatar Government International Bond | 200 | 202,422 | ||||||||||
|
| |||||||||||
Total Governments – Sovereign Bonds | 1,033,890 | |||||||||||
|
| |||||||||||
COMMERCIAL MORTGAGE-BACKED SECURITIES – 0.9% | ||||||||||||
Non-Agency Fixed Rate CMBS – 0.6% | ||||||||||||
Commercial Mortgage Trust | 200 | 207,767 | ||||||||||
GS Mortgage Securities Trust | 20 | 19,562 | ||||||||||
LB-UBS Commercial Mortgage Trust | 85 | 58,668 | ||||||||||
|
| |||||||||||
| 285,997 | ||||||||||||
|
| |||||||||||
Non-Agency Floating Rate CMBS – 0.3% | ||||||||||||
Invitation Homes Trust | 115 | 115,022 | ||||||||||
|
| |||||||||||
Total Commercial Mortgage-Backed Securities | 401,019 | |||||||||||
|
| |||||||||||
| 24 | AB FLEXFEE INTERNATIONAL BOND PORTFOLIO | abfunds.com | |
PORTFOLIO OF INVESTMENTS(continued)
| Principal Amount (000) | U.S. $ Value | |||||||||||
| ||||||||||||
SUPRANATIONALS – 0.6% | ||||||||||||
Supranational – 0.6% | ||||||||||||
European Financial Stability Facility | EUR | 259 | $ | 297,687 | ||||||||
|
| |||||||||||
EMERGING MARKETS – TREASURIES – 0.5% | ||||||||||||
Argentina – 0.5% | ||||||||||||
Argentina POM Politica Monetaria | ARS | 7,883 | 222,683 | |||||||||
Argentine Bonos del Tesoro | 567 | 12,598 | ||||||||||
|
| |||||||||||
Total Emerging Markets – Treasuries | 235,281 | |||||||||||
|
| |||||||||||
EMERGING MARKETS – SOVEREIGNS – 0.5% | ||||||||||||
Brazil – 0.4% | ||||||||||||
Brazilian Government International Bond | U.S.$ | 200 | 192,371 | |||||||||
|
| |||||||||||
Costa Rica – 0.1% | ||||||||||||
Costa Rica Government International Bond | 34 | 33,511 | ||||||||||
|
| |||||||||||
Total Emerging Markets – Sovereigns | 225,882 | |||||||||||
|
| |||||||||||
QUASI-SOVEREIGNS – 0.4% | ||||||||||||
Quasi-Sovereign Bonds – 0.4% | ||||||||||||
South Korea – 0.4% | ||||||||||||
Export-Import Bank of Korea | AUD | 270 | 192,621 | |||||||||
|
| |||||||||||
ASSET-BACKED SECURITIES – 0.2% | ||||||||||||
Other ABS - Fixed Rate – 0.2% | ||||||||||||
SoFi Consumer Loan Program Trust | U.S.$ | 115 | 114,340 | |||||||||
|
| |||||||||||
| abfunds.com | AB FLEXFEE INTERNATIONAL BOND PORTFOLIO | 25 | |
PORTFOLIO OF INVESTMENTS(continued)
| Notional Amount | U.S. $ Value | |||||||||||
| ||||||||||||
OPTIONS PURCHASED – CALLS – 0.2% | ||||||||||||
Options on Forward Contracts – 0.2% | ||||||||||||
GBP/USD | GBP | 350,000 | $ | 129 | ||||||||
GBP/USD | 355,000 | 130 | ||||||||||
TRY/EUR | TRY | 2,571,450 | 29,726 | |||||||||
TRY/USD | 2,629,900 | 38,799 | ||||||||||
|
| |||||||||||
Total Options Purchased – Calls | 68,784 | |||||||||||
|
| |||||||||||
| Principal Amount (000) | ||||||||||||
BANK LOANS – 0.1% | ||||||||||||
Industrial – 0.1% | ||||||||||||
ConsumerNon-Cyclical – 0.1% | ||||||||||||
Regionalcare Hospital Partners Holdings, Inc. | U.S.$ | 50 | 47,311 | |||||||||
|
| |||||||||||
EMERGING MARKETS – CORPORATE BONDS – 0.0% | ||||||||||||
Utility – 0.0% | ||||||||||||
Electric – 0.0% | ||||||||||||
Terraform Global Operating LLC | 18 | 16,649 | ||||||||||
|
| |||||||||||
| Notional Amount | ||||||||||||
OPTIONS PURCHASED – PUTS – 0.0% | ||||||||||||
Options on Forward Contracts – 0.0% | ||||||||||||
CNH/USD | CNH | 12,867,400 | 184 | |||||||||
|
| |||||||||||
| 26 | AB FLEXFEE INTERNATIONAL BOND PORTFOLIO | abfunds.com | |
PORTFOLIO OF INVESTMENTS(continued)
| Notional Amount | U.S. $ Value | |||||||||||
| ||||||||||||
Swaptions – 0.0% | ||||||||||||
IRS Swaption | USD | 2,100,000 | $ | 115 | ||||||||
IRS Swaption | 1,370,000 | 721 | ||||||||||
|
| |||||||||||
| 836 | ||||||||||||
|
| |||||||||||
Total Options Purchased – Puts | 1,020 | |||||||||||
|
| |||||||||||
| Shares | ||||||||||||
SHORT-TERM INVESTMENTS – 1.0% | ||||||||||||
Investment Companies – 1.0% | ||||||||||||
AB Fixed Income Shares, Inc. – Government Money Market Portfolio – Class AB, 2.31%(g)(h)(i) | 465,081 | 465,081 | ||||||||||
|
| |||||||||||
Total Investments – 98.6% | 45,309,247 | |||||||||||
Other assets less liabilities – 1.4% | 633,985 | |||||||||||
|
| |||||||||||
Net Assets – 100.0% | $ | 45,943,232 | ||||||||||
|
| |||||||||||
FUTURES (see Note C)
| Description | Number of Contracts | Expiration Month | Notional (000) | Original Value | Value at December 31, 2018 | Unrealized Appreciation/ (Depreciation) | ||||||||||||||||||||||
Purchased Contracts |
| |||||||||||||||||||||||||||
3 Yr Australian Bond Futures | 13 | March 2019 | AUD | 1,300 | $ | 1,022,603 | $ | 1,027,479 | $ | 4,876 | ||||||||||||||||||
Euro-BOBL Futures | 4 | March 2019 | EUR | 400 | 605,827 | 607,339 | 1,512 | |||||||||||||||||||||
Euro-BTP Futures | 3 | March 2019 | EUR | 300 | 423,125 | 439,349 | 16,224 | |||||||||||||||||||||
Euro-Bund Futures | 6 | March 2019 | EUR | 600 | 1,117,862 | 1,124,256 | 6,394 | |||||||||||||||||||||
Euro-OAT Futures | 3 | March 2019 | EUR | 300 | 518,509 | 518,337 | (172 | ) | ||||||||||||||||||||
Long Gilt Futures | 3 | March 2019 | GBP | 300 | 467,460 | 470,977 | 3,517 | |||||||||||||||||||||
U.S.T-Note 2 Yr (CBT) Futures | 47 | March 2019 | USD | 9,400 | 9,913,313 | 9,978,687 | 65,374 | |||||||||||||||||||||
| abfunds.com | AB FLEXFEE INTERNATIONAL BOND PORTFOLIO | 27 | |
PORTFOLIO OF INVESTMENTS(continued)
| Description | Number of Contracts | Expiration Month | Notional (000) | Original Value | Value at December 31, 2018 | Unrealized Appreciation/ (Depreciation) | ||||||||||||||||||||||
U.S.T-Note 10 Yr (CBT) Futures | 17 | March 2019 | USD | 1,700 | $ | 2,048,500 | $ | 2,074,266 | $ | 25,766 | ||||||||||||||||||
Sold Contracts |
| |||||||||||||||||||||||||||
Euro Buxl 30 Yr Bond Futures | 14 | March 2019 | EUR | 1,400 | 2,855,049 | 2,897,234 | (42,185 | ) | ||||||||||||||||||||
U.S. 10 Yr Ultra Futures | 21 | March 2019 | USD | 2,100 | 2,647,094 | 2,731,641 | (84,547 | ) | ||||||||||||||||||||
U.S.T-Note 5 Yr (CBT) Futures | 28 | March 2019 | USD | 2,800 | 3,156,523 | 3,211,250 | (54,727 | ) | ||||||||||||||||||||
U.S. Ultra Bond (CBT) Futures | 2 | March 2019 | USD | 200 | 306,375 | 321,313 | (14,938 | ) | ||||||||||||||||||||
|
| |||||||||||||||||||||||||||
| $ | (72,906 | ) | ||||||||||||||||||||||||||
|
| |||||||||||||||||||||||||||
FORWARD CURRENCY EXCHANGE CONTRACTS (see Note C)
| Counterparty | Contracts to Deliver (000) | In Exchange For (000) | Settlement Date | Unrealized Appreciation/ (Depreciation) | ||||||||||||||||
Bank of America, NA | MXN | 11,646 | USD | 573 | 1/25/19 | $ | (17,927 | ) | ||||||||||||
Barclays Bank PLC | TRY | 1,313 | USD | 212 | 1/15/19 | (34,293 | ) | |||||||||||||
Barclays Bank PLC | USD | 208 | KRW | 230,899 | 2/20/19 | (711 | ) | |||||||||||||
Barclays Bank PLC | USD | 462 | TWD | 14,161 | 3/14/19 | 4,067 | ||||||||||||||
Barclays Bank PLC | CNH | 289 | USD | 42 | 3/20/19 | (289 | ) | |||||||||||||
Brown Brothers Harriman & Co. | EUR | 640 | USD | 740 | 1/09/19 | 6,647 | ||||||||||||||
Brown Brothers Harriman & Co. | EUR | 1,259 | USD | 1,432 | 1/09/19 | (10,626 | ) | |||||||||||||
Brown Brothers Harriman & Co. | USD | 1,283 | EUR | 1,110 | 1/09/19 | (10,730 | ) | |||||||||||||
Brown Brothers Harriman & Co. | USD | 858 | EUR | 753 | 1/09/19 | 5,338 | ||||||||||||||
Brown Brothers Harriman & Co. | CAD | 1,087 | USD | 821 | 1/17/19 | 32,573 | ||||||||||||||
Brown Brothers Harriman & Co. | CHF | 814 | USD | 820 | 1/17/19 | (8,965 | ) | |||||||||||||
Brown Brothers Harriman & Co. | USD | 58 | CHF | 57 | 1/17/19 | (279 | ) | |||||||||||||
Brown Brothers Harriman & Co. | USD | 362 | CAD | 481 | 1/17/19 | (9,321 | ) | |||||||||||||
Brown Brothers Harriman & Co. | PLN | 428 | USD | 116 | 1/18/19 | 1,732 | ||||||||||||||
Brown Brothers Harriman & Co. | USD | 295 | SEK | 2,658 | 1/23/19 | 5,402 | ||||||||||||||
Brown Brothers Harriman & Co. | USD | 336 | NOK | 2,842 | 1/23/19 | (7,280 | ) | |||||||||||||
Brown Brothers Harriman & Co. | SGD | 421 | USD | 306 | 1/24/19 | (3,057 | ) | |||||||||||||
Brown Brothers Harriman & Co. | TRY | 1,002 | USD | 183 | 1/24/19 | (3,596 | ) | |||||||||||||
Brown Brothers Harriman & Co. | USD | 110 | MXN | 2,231 | 1/25/19 | 3,019 | ||||||||||||||
Brown Brothers Harriman & Co. | USD | 395 | ZAR | 5,506 | 1/30/19 | (13,155 | ) | |||||||||||||
Brown Brothers Harriman & Co. | ZAR | 3,281 | USD | 228 | 1/30/19 | 833 | ||||||||||||||
Brown Brothers Harriman & Co. | ZAR | 2,289 | USD | 158 | 1/30/19 | (459 | ) | |||||||||||||
Brown Brothers Harriman & Co. | USD | 397 | JPY | 44,306 | 2/15/19 | 8,382 | ||||||||||||||
Brown Brothers Harriman & Co. | TRY | 911 | USD | 135 | 2/28/19 | (31,573 | ) | |||||||||||||
Brown Brothers Harriman & Co. | NZD | 144 | USD | 100 | 2/20/19 | 3,090 | ||||||||||||||
Brown Brothers Harriman & Co. | USD | 42 | TRY | 282 | 2/26/19 | 9,155 | ||||||||||||||
Brown Brothers Harriman & Co. | CHF | 128 | USD | 135 | 2/28/19 | 3,888 | ||||||||||||||
Brown Brothers Harriman & Co. | CHF | 46 | USD | 47 | 2/28/19 | (11 | ) | |||||||||||||
Brown Brothers Harriman & Co. | GBP | 1 | USD | 1 | 2/28/19 | (9 | ) | |||||||||||||
Brown Brothers Harriman & Co. | USD | 80 | TRY | 549 | 2/28/19 | 21,133 | ||||||||||||||
| 28 | AB FLEXFEE INTERNATIONAL BOND PORTFOLIO | abfunds.com | |
PORTFOLIO OF INVESTMENTS(continued)
| Counterparty | Contracts to Deliver (000) | In Exchange For (000) | Settlement Date | Unrealized Appreciation/ (Depreciation) | ||||||||||||||||||||
Citibank, NA | ARS | 3,879 | USD | 100 | 1/09/19 | $ | (1,976 | ) | ||||||||||||||||
Citibank, NA | GBP | 123 | USD | 159 | 1/15/19 | 3,032 | ||||||||||||||||||
Citibank, NA | UYU | 2,341 | USD | 71 | 1/22/19 | (1,021 | ) | |||||||||||||||||
Citibank, NA | USD | 337 | CLP | 229,874 | 1/25/19 | (5,845 | ) | |||||||||||||||||
Citibank, NA | USD | 252 | KRW | 278,918 | 2/20/19 | (1,624 | ) | |||||||||||||||||
Citibank, NA | USD | 47 | CHF | 46 | 2/28/19 | (96 | ) | |||||||||||||||||
Citibank, NA | USD | 223 | TWD | 6,826 | 3/14/19 | 1,306 | ||||||||||||||||||
Credit Suisse International | CNH | 2,329 | USD | 337 | 1/09/19 | (2,464 | ) | |||||||||||||||||
Credit Suisse International | USD | 212 | TRY | 1,312 | 1/15/19 | 34,080 | ||||||||||||||||||
Credit Suisse International | USD | 213 | TRY | 1,296 | 1/17/19 | 29,373 | ||||||||||||||||||
Credit Suisse International | USD | 246 | JPY | 27,340 | 2/15/19 | 4,594 | ||||||||||||||||||
Credit Suisse International | TRY | 317 | USD | 43 | 2/28/19 | (15,178 | ) | |||||||||||||||||
Credit Suisse International | USD | 47 | CHF | 46 | 2/28/19 | (205 | ) | |||||||||||||||||
Deutsche Bank AG | TRY | 1,344 | EUR | 196 | 1/17/19 | (26,629 | ) | |||||||||||||||||
Deutsche Bank AG | INR | 15,378 | USD | 211 | 3/18/19 | (8,644 | ) | |||||||||||||||||
Deutsche Bank AG | USD | 225 | INR | 16,031 | 3/18/19 | 3,975 | ||||||||||||||||||
Goldman Sachs Bank USA | JPY | 802,165 | USD | 7,123 | 2/15/19 | (220,608 | ) | |||||||||||||||||
Goldman Sachs Bank USA | AUD | 1,524 | USD | 1,113 | 2/20/19 | 38,710 | ||||||||||||||||||
Goldman Sachs Bank USA | GBP | 1,070 | USD | 1,358 | 2/28/19 | (9,749 | ) | |||||||||||||||||
JPMorgan Chase Bank, NA | USD | 337 | CNH | 2,329 | 1/09/19 | 2,464 | ||||||||||||||||||
JPMorgan Chase Bank, NA | USD | 159 | GBP | 123 | 1/15/19 | (3,032 | ) | |||||||||||||||||
JPMorgan Chase Bank, NA | CHF | 802 | USD | 800 | 1/17/19 | (17,275 | ) | |||||||||||||||||
JPMorgan Chase Bank, NA | USD | 109 | TRY | 600 | 1/24/19 | 2,683 | ||||||||||||||||||
Morgan Stanley Capital Services LLC | BRL | 617 | USD | 159 | 1/03/19 | 39 | ||||||||||||||||||
Morgan Stanley Capital Services LLC | BRL | 617 | USD | 157 | 1/03/19 | (2,236 | ) | |||||||||||||||||
Morgan Stanley Capital Services LLC | USD | 158 | BRL | 617 | 1/03/19 | 843 | ||||||||||||||||||
Morgan Stanley Capital Services LLC | USD | 159 | BRL | 617 | 1/03/19 | (39 | ) | |||||||||||||||||
Morgan Stanley Capital Services LLC | CAD | 784 | USD | 591 | 1/17/19 | 16,655 | ||||||||||||||||||
Morgan Stanley Capital Services LLC | USD | 157 | BRL | 617 | 2/04/19 | 2,201 | ||||||||||||||||||
Royal Bank of Scotland PLC | TRY | 238 | USD | 41 | 2/28/19 | (2,895 | ) | |||||||||||||||||
Royal Bank of Scotland PLC | USD | 275 | TWD | 8,388 | 3/14/19 | 550 | ||||||||||||||||||
Standard Chartered Bank | USD | 198 | IDR | 3,018,458 | 1/29/19 | 11,257 | ||||||||||||||||||
Standard Chartered Bank | USD | 231 | KRW | 256,969 | 2/20/19 | 564 | ||||||||||||||||||
Standard Chartered Bank | TWD | 15,263 | USD | 501 | 3/14/19 | (1,625 | ) | |||||||||||||||||
UBS AG | EUR | 16,095 | USD | 18,605 | 1/09/19 | 155,798 | ||||||||||||||||||
UBS AG | CAD | 10,220 | USD | 7,742 | 1/17/19 | 252,311 | ||||||||||||||||||
UBS AG | USD | 215 | JPY | 23,917 | 1/18/19 | 3,557 | ||||||||||||||||||
UBS AG | ZAR | 6,482 | USD | 455 | 1/30/19 | 5,757 | ||||||||||||||||||
|
| |||||||||||||||||||||||
| $ | 201,586 | |||||||||||||||||||||||
|
| |||||||||||||||||||||||
| abfunds.com | AB FLEXFEE INTERNATIONAL BOND PORTFOLIO | 29 | |
PORTFOLIO OF INVESTMENTS(continued)
INTEREST RATE SWAPTIONS WRITTEN (see Note C)
| Description | Index | Counter- Party | Strike Rate | Expiration Date | Notional Amount (000) | Premiums Received | Market Value | |||||||||||||||||||||||||
Call | ||||||||||||||||||||||||||||||||
OTC – 1 Year Interest Rate Swap (j) | | 3 Month LIBOR | | | Morgan Stanley Capital Services LLC | | 2.94 | % | 1/29/19 | USD | 2,100 | $ | 7,245 | $ | (43,979 | ) | ||||||||||||||||
Put | ||||||||||||||||||||||||||||||||
OTC – 1 Year Interest Rate Swap (j) | | 3 Month LIBOR | | | Bank of America, NA | | 3.33 | 2/28/19 | USD | 1,370 | 3,631 | (298 | ) | |||||||||||||||||||
OTC – 1 Year Interest Rate Swap (j) | | 3 Month LIBOR | | | Morgan Stanley Capital Services LLC | | 3.44 | 1/29/19 | USD | 2,100 | 7,245 | (40 | ) | |||||||||||||||||||
|
|
|
| |||||||||||||||||||||||||||||
| $ | 18,121 | $ | (44,317 | ) | ||||||||||||||||||||||||||||
|
|
|
| |||||||||||||||||||||||||||||
CURRENCY OPTIONS WRITTEN (see Note C)
Description/ Counterparty | Exercise Price | Expiration Month | Contracts | Notional Amount (000) | Premiums Received | U.S. $ Value | ||||||||||||||||||||||||||
Put |
| |||||||||||||||||||||||||||||||
BRL vs. USD/ | BRL | 4.170 | 02/2019 | 479,550 | BRL | 480 | $ | 1,110 | $ | (664 | ) | |||||||||||||||||||||
INR vs. USD/ | INR | 71.320 | 02/2019 | 7,132,000 | INR | 7,132 | 926 | (526 | ) | |||||||||||||||||||||||
MXN vs. USD/ | MXN | 23.820 | 02/2019 | 2,382,000 | MXN | 2,382 | 1,332 | (42 | ) | |||||||||||||||||||||||
SGD vs. CHF/ | SGD | 1.550 | 06/2019 | 155,000 | SGD | 155 | 469 | (244 | ) | |||||||||||||||||||||||
TRY vs. CHF/ | TRY | 5.900 | 02/2019 | 590,000 | TRY | 590 | 1,079 | (1,558 | ) | |||||||||||||||||||||||
TRY vs. EUR/ | TRY | 7.510 | 01/2019 | 2,966,450 | TRY | 2,966 | 7,913 | (517 | ) | |||||||||||||||||||||||
TRY vs. USD/ | TRY | 6.900 | 01/2019 | 3,140,000 | TRY | 3,140 | 10,178 | (194 | ) | |||||||||||||||||||||||
|
|
|
| |||||||||||||||||||||||||||||
| $ | 23,007 | $ | (3,745 | ) | ||||||||||||||||||||||||||||
|
|
|
| |||||||||||||||||||||||||||||
| 30 | AB FLEXFEE INTERNATIONAL BOND PORTFOLIO | abfunds.com | |
PORTFOLIO OF INVESTMENTS(continued)
CENTRALLY CLEARED CREDIT DEFAULT SWAPS (see Note C)
| Description | Fixed Rate (Pay) Receive | Payment Frequency | Implied Credit Spread at December 31, 2018 | Notional Amount (000) | Market Value | Upfront Premiums Paid (Received) | Unrealized Appreciation/ (Depreciation) | |||||||||||||||||||||||||
Buy Contracts |
| |||||||||||||||||||||||||||||||
iTraxx Australia Series 30, 5 Year Index, 12/20/23* | (1.00 | )% | Quarterly | 0.95 | % | USD | 4,500 | $ | (11,518 | ) | $ | (42,974 | ) | $ | 31,456 | |||||||||||||||||
Sale Contracts |
| |||||||||||||||||||||||||||||||
CDX-NAHY Series 31, 5 Year Index, 12/20/23* | 5.00 | Quarterly | 4.50 | USD | 870 | 19,097 | 45,300 | (26,203 | ) | |||||||||||||||||||||||
CDX-NAIG Series 31, 5 Year Index, 12/20/23* | 1.00 | Quarterly | 0.88 | USD | 4,500 | 26,784 | 81,125 | (54,341 | ) | |||||||||||||||||||||||
|
|
|
|
|
| |||||||||||||||||||||||||||
| $ | 34,363 | $ | 83,451 | $ | (49,088 | ) | ||||||||||||||||||||||||||
|
|
|
|
|
| |||||||||||||||||||||||||||
| * | Termination date |
CENTRALLY CLEARED INTEREST RATE SWAPS (see Note C)
Rate Type | ||||||||||||||||||||||||||
Notional | Termination Date | Payments made by the Fund | Payments received by the Fund | Payment Frequency Paid/ Received | Market Value | Upfront Premiums Paid (Received) | Unrealized Appreciation/ (Depreciation) | |||||||||||||||||||
USD | 4,710 | 9/10/20 | 3 Month LIBOR | 2.824% | Quarterly/ Semi-Annual | $ | 43,618 | $ | — | $ | 43,618 | |||||||||||||||
USD | 1,960 | 9/10/23 | 3 Month LIBOR | 2.883% | Quarterly/ Semi-Annual | 41,095 | — | 41,095 | ||||||||||||||||||
GBP | 130 | 12/27/47 | 1.419% | 6 Month LIBOR | Semi-Annual/ Semi-Annual | 5,106 | — | 5,106 | ||||||||||||||||||
EUR | 1,550 | 6/08/48 | 6 Month EURIBOR | 1.545% | Semi-Annual/ Annual | 88,965 | — | 88,965 | ||||||||||||||||||
USD | 890 | 9/10/48 | 2.980% | 3 Month LIBOR | Semi-Annual/ Quarterly | (33,532 | ) | — | (33,532 | ) | ||||||||||||||||
|
|
|
|
|
| |||||||||||||||||||||
| $ | 145,252 | $ | — | $ | 145,252 | |||||||||||||||||||||
|
|
|
|
|
| |||||||||||||||||||||
| abfunds.com | AB FLEXFEE INTERNATIONAL BOND PORTFOLIO | 31 | |
PORTFOLIO OF INVESTMENTS(continued)
CREDIT DEFAULT SWAPS (see Note C)
| Swap Counterparty & Referenced Obligation | Fixed Rate (Pay) Receive | Payment Frequency | Implied Credit Spread at December 31, 2018 | Notional Amount (000) | Market Value | Upfront Premiums Paid (Received) | Unrealized Appreciation/ (Depreciation) | |||||||||||||||||||||||||
Sale Contracts | ||||||||||||||||||||||||||||||||
Credit Suisse International | ||||||||||||||||||||||||||||||||
CDX-CMBX.NA.A Series 6, 5/11/63* | 2.00 | % | Monthly | 3.37 | % | USD | 932 | $ | (40,325 | ) | $ | (18,010 | ) | $ | (22,315 | ) | ||||||||||||||||
Deutsche Bank AG | ||||||||||||||||||||||||||||||||
CDX-CMBX.NA.A Series 6, 5/11/63* | 2.00 | Monthly | 3.37 | USD | 100 | (4,321 | ) | (3,969 | ) | (352 | ) | |||||||||||||||||||||
Morgan Stanley & Co. International PLC | ||||||||||||||||||||||||||||||||
CDX-CMBX.NA.A Series 6, 5/11/63* | 2.00 | Monthly | 3.37 | USD | 360 | (15,576 | ) | (18,320 | ) | 2,744 | ||||||||||||||||||||||
CDX-CMBX.NA.A Series 6, 5/11/63* | 2.00 | Monthly | 3.37 | USD | 470 | (20,336 | ) | (22,869 | ) | 2,533 | ||||||||||||||||||||||
CDX-CMBX.NA.A Series 6, 5/11/63* | 2.00 | Monthly | 3.37 | USD | 3 | (130 | ) | (57 | ) | (73 | ) | |||||||||||||||||||||
|
|
|
|
|
| |||||||||||||||||||||||||||
| $ | (80,688 | ) | $ | (63,225 | ) | $ | (17,463 | ) | ||||||||||||||||||||||||
|
|
|
|
|
| |||||||||||||||||||||||||||
| * | Termination date |
VARIANCE SWAPS (see Note C)
| Swap Counterparty & Referenced Obligation | Volatility Strike Rate | Payment Frequency | Notional Amount (000) | Market Value | Upfront Premiums (Paid) Received | Unrealized Appreciation/ (Depreciation) | ||||||||||||||||||||||
Buy Contracts | ||||||||||||||||||||||||||||
Deutsche Bank AG | ||||||||||||||||||||||||||||
AUD/JPY 1/14/20* | 11.12 | % | Maturity | AUD | 6 | $ | 1,208 | $ | – 0 | – | $ | 1,208 | ||||||||||||||||
AUD/JPY 3/03/20* | 12.75 | Maturity | AUD | 3 | (561 | ) | – 0 | – | (561 | ) | ||||||||||||||||||
AUD/JPY 4/16/20* | 12.25 | Maturity | AUD | 7 | (245 | ) | – 0 | – | (245 | ) | ||||||||||||||||||
AUD/JPY 5/07/20* | 12.22 | Maturity | AUD | 5 | (27 | ) | – 0 | – | (27 | ) | ||||||||||||||||||
Goldman Sachs Bank USA | ||||||||||||||||||||||||||||
AUD/JPY 3/10/20* | 12.90 | Maturity | AUD | 1 | (225 | ) | – 0 | – | (225 | ) | ||||||||||||||||||
AUD/JPY 3/11/20* | 12.80 | Maturity | AUD | 2 | (386 | ) | – 0 | – | (386 | ) | ||||||||||||||||||
|
|
|
|
|
| |||||||||||||||||||||||
| $ | (236 | ) | $ | – 0 | – | $ | (236 | ) | ||||||||||||||||||||
|
|
|
|
|
| |||||||||||||||||||||||
| * | Termination date |
| (a) | Security is exempt from registration under Rule 144A of the Securities Act of 1933. These securities are considered restricted, but liquid and may be resold in transactions exempt from registration, normally to qualified institutional buyers. At December 31, 2018, the aggregate market value of these securities amounted to $22,806,991 or 49.6% of net assets. |
| 32 | AB FLEXFEE INTERNATIONAL BOND PORTFOLIO | abfunds.com | |
PORTFOLIO OF INVESTMENTS(continued)
| (b) | Securities are perpetual and, thus, do not have a predetermined maturity date. The date shown, if applicable, reflects the next call date. |
| (c) | Floating Rate Security. Stated interest/floor/ceiling rate was in effect at December 31, 2018. |
| (d) | Security in which significant unobservable inputs (Level 3) were used in determining fair value. |
| (e) | Non-income producing security. |
| (f) | This position or a portion of this position represents an unsettled loan purchase. The coupon rate will be determined at the time of settlement and will be based upon the London-Interbank Offered Rate (“LIBOR”) plus a premium which was determined at the time of purchase. |
| (g) | Affiliated investments. |
| (h) | The rate shown represents the7-day yield as of period end. |
| (i) | To obtain a copy of the fund’s shareholder report, please go to the Securities and Exchange Commission’s website at www.sec.gov, or call AB at (800)227-4618. |
| (j) | One contract relates to 1 share. |
Currency Abbreviations:
ARS – Argentine Peso AUD – Australian Dollar BRL – Brazilian Real CAD – Canadian Dollar CHF – Swiss Franc CLP – Chilean Peso CNH – Chinese Yuan Renminbi (Offshore) EUR – Euro GBP – Great British Pound IDR – Indonesian Rupiah INR – Indian Rupee JPY – Japanese Yen | KRW – South Korean Won MXN – Mexican Peso MYR – Malaysian Ringgit NOK – Norwegian Krone NZD – New Zealand Dollar PLN – Polish Zloty SEK – Swedish Krona SGD – Singapore Dollar TRY – Turkish Lira TWD – New Taiwan Dollar USD – United States Dollar UYU – Uruguayan Peso ZAR – South African Rand |
Glossary:
ABS – Asset-Backed Securities
ARLLMONP – Argentina Blended Policy Rate
BOBL – Bundesobligationen
BTP – Buoni del Tesoro Poliennali
CBT – Chicago Board of Trade
CDX-CMBX.NA – North American Commercial Mortgage-Backed Index
CDX-NAHY – North American High Yield Credit Default Swap Index
CDX-NAIG – North American Investment Grade Credit Default Swap Index
CMBS – Commercial Mortgage-Backed Securities
CPI – Consumer Price Index
EURIBOR – Euro Interbank Offered Rate
IRS – Interest Rate Swaption
LIBOR – London Interbank Offered Rates
OAT – Obligations Assimilables du Trésor
REIT – Real Estate Investment Trust
See notes to financial statements.
| abfunds.com | AB FLEXFEE INTERNATIONAL BOND PORTFOLIO | 33 | |
STATEMENT OF ASSETS & LIABILITIES
December 31, 2018
| Assets | ||||
Investments in securities, at value | ||||
Unaffiliated issuers (cost $45,872,828) | $ | 44,844,166 | ||
Affiliated issuers (cost $465,081) | 465,081 | |||
Cash | 9,990 | |||
Cash collateral due from broker | 412,657 | |||
Foreign currencies, at value (cost $100,019) | 100,188 | |||
Unrealized appreciation on forward currency exchange contracts | 675,008 | |||
Unaffiliated interest receivable | 351,758 | |||
Receivable from Adviser | 49,556 | |||
Receivable for investment securities sold | 10,558 | |||
Receivable for capital stock sold | 2,527 | |||
Unrealized appreciation on variance swaps | 1,208 | |||
Affiliated dividends receivable | 750 | |||
|
| |||
Total assets | 46,923,447 | |||
|
| |||
| Liabilities | ||||
Swaptions written, at value (premiums received $18,121) | 44,317 | |||
Options written, at value (premiums received $23,007) | 3,745 | |||
Unrealized depreciation on forward currency exchange contracts | 473,422 | |||
Payable for investment securities purchased | 256,779 | |||
Market value of credit default swaps (net premiums received $63,225) | 80,688 | |||
Transfer Agent fee payable | 3,000 | |||
Unrealized depreciation on variance swaps | 1,444 | |||
Payable for variation margin on futures | 1,017 | |||
Payable for variation margin on centrally cleared swaps | 208 | |||
Accrued expenses and other liabilities | 115,595 | |||
|
| |||
Total liabilities | 980,215 | |||
|
| |||
Net Assets | $ | 45,943,232 | ||
|
| |||
| Composition of Net Assets | ||||
Capital stock, at par | $ | 4,758 | ||
Additionalpaid-in capital | 47,378,415 | |||
Accumulated loss | (1,439,941 | ) | ||
|
| |||
Net Assets | $ | 45,943,232 | ||
|
|
Net Asset Value Per Share—33 billion shares of capital stock authorized, $.001 par value
| Class | Net Assets | Shares Outstanding | Net Asset Value | |||||||||
| ||||||||||||
| Advisor | $ | 45,943,232 | 4,757,875 | $ | 9.66 | |||||||
| ||||||||||||
See notes to financial statements.
| 34 | AB FLEXFEE INTERNATIONAL BOND PORTFOLIO | abfunds.com | |
STATEMENT OF OPERATIONS
Year Ended December 31, 2018
| Investment Income | ||||||||
Interest (net of foreign taxes withheld of $11,041) | $ | 922,737 | ||||||
Dividends | ||||||||
Affiliated issuers | 7,025 | $ | 929,762 | |||||
|
| |||||||
| Expenses | ||||||||
Advisory fee (see Note B) | 45,311 | |||||||
Transfer agency-Advisor Class | 19,039 | |||||||
Custodian | 124,221 | |||||||
Legal | 75,586 | |||||||
Administrative | 67,975 | |||||||
Audit and tax | 62,972 | |||||||
Amortization of offering expenses | 46,188 | |||||||
Registration fees | 37,500 | |||||||
Directors’ fees | 17,560 | |||||||
Printing | 12,650 | |||||||
Miscellaneous | 38,293 | |||||||
|
| |||||||
Total expenses | 547,295 | |||||||
Less: expenses waived and reimbursed by the Adviser (see Note B) | (457,127 | ) | ||||||
|
| |||||||
Net expenses | 90,168 | |||||||
|
| |||||||
Net investment income | 839,594 | |||||||
|
| |||||||
| Realized and Unrealized Gain (Loss) on Investment and Foreign Currency Transactions | ||||||||
Net realized gain (loss) on: | ||||||||
Investment transactions | (276,687 | )(a) | ||||||
Forward currency exchange contracts | 1,827,791 | |||||||
Futures | 198,088 | |||||||
Options written | 47,985 | |||||||
Swaps | 50,145 | |||||||
Swaptions written | 17,603 | |||||||
Foreign currency transactions | (641,437 | ) | ||||||
Net change in unrealized appreciation/depreciation on: | ||||||||
Investments | (1,553,588 | ) | ||||||
Forward currency exchange contracts | 526,532 | |||||||
Futures | (109,705 | ) | ||||||
Options written | 19,601 | |||||||
Swaps | 63,326 | |||||||
Swaptions written | (26,196 | ) | ||||||
Foreign currency denominated assets and liabilities | (12,753 | ) | ||||||
|
| |||||||
Net gain on investment and foreign currency transactions | 130,705 | |||||||
|
| |||||||
Net Increase in Net Assets from Operations | $ | 970,299 | ||||||
|
|
| (a) | Includes foreign capital gains taxes of $14. |
See notes to financial statements.
| abfunds.com | AB FLEXFEE INTERNATIONAL BOND PORTFOLIO | 35 | |
STATEMENT OF CHANGES IN NET ASSETS
| Year Ended December 31, 2018 | June 28, 2017(a) to December 31, 2017 | |||||||
| Increase (Decrease) in Net Assets from Operations | ||||||||
Net investment income | $ | 839,594 | $ | 262,955 | ||||
Net realized gain (loss) on investment and foreign currency transactions | 1,223,488 | (142,515 | ) | |||||
Net change in unrealized appreciation/depreciation on investments and foreign currency denominated assets and liabilities | (1,092,783 | ) | 262,222 | |||||
|
|
|
| |||||
Net increase in net assets from operations | 970,299 | 382,662 | ||||||
Distributions to Shareholders | ||||||||
Advisor Class | (2,305,754 | ) | (501,767 | ) | ||||
Return of Capital | ||||||||
Advisor Class | (77,538 | ) | – 0 | – | ||||
| Capital Stock Transactions | ||||||||
Net increase | 2,475,327 | 45,000,003 | ||||||
|
|
|
| |||||
Total increase | 1,062,334 | 44,880,898 | ||||||
| Net Assets | ||||||||
Beginning of period | 44,880,898 | – 0 | – | |||||
|
|
|
| |||||
End of period | $ | 45,943,232 | $ | 44,880,898 | ||||
|
|
|
| |||||
| (a) | Commencement of operations. |
See notes to financial statements.
| 36 | AB FLEXFEE INTERNATIONAL BOND PORTFOLIO | abfunds.com | |
NOTES TO FINANCIAL STATEMENTS
December 31, 2018
NOTE A
Significant Accounting Policies
AB Bond Fund, Inc. (the “Company”) is registered under the Investment Company Act of 1940 as anopen-end management investment company. The Company, which is a Maryland corporation, operates as a series company comprised of 10 portfolios currently in operation. Each portfolio is considered to be a separate entity for financial reporting and tax purposes. This report relates only to the AB FlexFee International Bond Portfolio (the “Fund”), a diversified portfolio. The Fund commenced operations on June 28, 2017. The Fund has authorized issuance of Class A, Class B, Class C, Advisor Class, Class R, Class K, Class I, Class Z, Class T, Class 1, and Class 2 shares. Class A, Class B, Class C, Class R, Class K, Class I, Class Z, Class T, Class 1 and Class 2 shares have not been issued. Advisor Class shares are sold without an initial or contingent deferred sales charge and are not subject to ongoing distribution expenses. All eleven classes of shares have identical voting, dividend, liquidation and other rights, except that the classes bear different distribution and transfer agency expenses. Each class has exclusive voting rights with respect to its distribution plan. The financial statements have been prepared in conformity with U.S. generally accepted accounting principles (“U.S. GAAP”), which require management to make certain estimates and assumptions that affect the reported amounts of assets and liabilities in the financial statements and amounts of income and expenses during the reporting period. Actual results could differ from those estimates. The Fund is an investment company under U.S. GAAP and follows the accounting and reporting guidance applicable to investment companies. The following is a summary of significant accounting policies followed by the Fund.
1. Security Valuation
Portfolio securities are valued at their current market value determined on the basis of market quotations or, if market quotations are not readily available or are deemed unreliable, at “fair value” as determined in accordance with procedures established by and under the general supervision of the Fund’s Board of Directors (the “Board”).
In general, the market values of securities which are readily available and deemed reliable are determined as follows: securities listed on a national securities exchange (other than securities listed on the NASDAQ Stock Market, Inc. (“NASDAQ”)) or on a foreign securities exchange are valued at the last sale price at the close of the exchange or foreign securities exchange. If there has been no sale on such day, the securities are valued at the last traded price from the previous day. Securities listed on more than one exchange are valued by reference to the principal exchange on
| abfunds.com | AB FLEXFEE INTERNATIONAL BOND PORTFOLIO | 37 | |
NOTES TO FINANCIAL STATEMENTS(continued)
which the securities are traded; securities listed only on NASDAQ are valued in accordance with the NASDAQ Official Closing Price; listed or over the counter (“OTC”) market put or call options are valued at the mid level between the current bid and ask prices. If either a current bid or current ask price is unavailable, the Adviser will have discretion to determine the best valuation (e.g., last trade price in the case of listed options); open futures are valued using the closing settlement price or, in the absence of such a price, the most recent quoted bid price. If there are no quotations available for the day of valuation, the last available closing settlement price is used; U.S. Government securities and any other debt instruments having 60 days or less remaining until maturity are generally valued at market by an independent pricing vendor, if a market price is available. If a market price is not available, the securities are valued at amortized cost. This methodology is commonly used for short term securities that have an original maturity of 60 days or less, as well as short term securities that had an original term to maturity that exceeded 60 days. In instances when amortized cost is utilized, the Valuation Committee (the “Committee”) must reasonably conclude that the utilization of amortized cost is approximately the same as the fair value of the security. Such factors the Committee will consider include, but are not limited to, an impairment of the creditworthiness of the issuer or material changes in interest rates. Fixed-income securities, including mortgage-backed and asset-backed securities, may be valued on the basis of prices provided by a pricing service or at a price obtained from one or more of the major broker-dealers. In cases where broker-dealer quotes are obtained, the Adviser may establish procedures whereby changes in market yields or spreads are used to adjust, on a daily basis, a recently obtained quoted price on a security. Swaps and other derivatives are valued daily, primarily using independent pricing services, independent pricing models using market inputs, as well as third party broker-dealers or counterparties. Open end mutual funds are valued at the closing net asset value per share, while exchange traded funds are valued at the closing market price per share.
Securities for which market quotations are not readily available (including restricted securities) or are deemed unreliable are valued at fair value as deemed appropriate by the Adviser. Factors considered in making this determination may include, but are not limited to, information obtained by contacting the issuer, analysts, analysis of the issuer’s financial statements or other available documents. In addition, the Fund may use fair value pricing for securities primarily traded innon-U.S. markets because most foreign markets close well before the Fund values its securities at 4:00 p.m., Eastern Time. The earlier close of these foreign markets gives rise to the possibility that significant events, including broad market moves, may have occurred in the interim and may materially affect the value of those securities. To account for this, the Fund generally values many of its foreign equity securities using fair value prices based on third party vendor modeling tools to the extent available.
| 38 | AB FLEXFEE INTERNATIONAL BOND PORTFOLIO | abfunds.com | |
NOTES TO FINANCIAL STATEMENTS(continued)
2. Fair Value Measurements
In accordance with U.S. GAAP regarding fair value measurements, fair value is defined as the price that the Fund would receive to sell an asset or pay to transfer a liability in an orderly transaction between market participants at the measurement date. U.S. GAAP establishes a framework for measuring fair value, and a three-level hierarchy for fair value measurements based upon the transparency of inputs to the valuation of an asset or liability (including those valued based on their market values as described in Note A.1 above). Inputs may be observable or unobservable and refer broadly to the assumptions that market participants would use in pricing the asset or liability. Observable inputs reflect the assumptions market participants would use in pricing the asset or liability based on market data obtained from sources independent of the Fund. Unobservable inputs reflect the Fund’s own assumptions about the assumptions that market participants would use in pricing the asset or liability based on the best information available in the circumstances. Each investment is assigned a level based upon the observability of the inputs which are significant to the overall valuation. The three-tier hierarchy of inputs is summarized below.
| • | Level 1—quoted prices in active markets for identical investments |
| • | Level 2—other significant observable inputs (including quoted prices for similar investments, interest rates, prepayment speeds, credit risk, etc.) |
| • | Level 3—significant unobservable inputs (including the Fund’s own assumptions in determining the fair value of investments) |
The fair value of debt instruments, such as bonds, andover-the-counter derivatives is generally based on market price quotations, recently executed market transactions (where observable) or industry recognized modeling techniques and are generally classified as Level 2. Pricing vendor inputs to Level 2 valuations may include quoted prices for similar investments in active markets, interest rate curves, coupon rates, currency rates, yield curves, option adjusted spreads, default rates, credit spreads and other unique security features in order to estimate the relevant cash flows which is then discounted to calculate fair values. If these inputs are unobservable and significant to the fair value, these investments will be classified as Level 3. In addition,non-agency rated investments are classified as Level 3.
Where readily available market prices or relevant bid prices are not available for certain equity investments, such investments may be valued based on similar publicly traded investments, movements in relevant indices since last available prices or based upon underlying company fundamentals and comparable company data (such as multiples to earnings or other multiples
| abfunds.com | AB FLEXFEE INTERNATIONAL BOND PORTFOLIO | 39 | |
NOTES TO FINANCIAL STATEMENTS(continued)
to equity). Where an investment is valued using an observable input, such as another publicly traded security, the investment will be classified as Level 2. If management determines that an adjustment is appropriate based on restrictions on resale, illiquidity or uncertainty, and such adjustment is a significant component of the valuation, the investment will be classified as Level 3. An investment will also be classified as Level 3 where management uses company fundamentals and other significant inputs to determine the valuation.
Options are valued using market-based inputs to models, broker or dealer quotations, or alternative pricing sources with reasonable levels of price transparency, where such inputs and models are available. Alternatively the values may be obtained through unobservable management determined inputs and/or management’s proprietary models. Where models are used, the selection of a particular model to value an option depends upon the contractual terms of, and specific risks inherent in, the option as well as the availability of pricing information in the market. Valuation models require a variety of inputs, including contractual terms, market prices, measures of volatility and correlations of such inputs. Exchange-traded options generally will be classified as Level 2. For options that do not trade on exchange but trade in liquid markets, inputs can generally be verified and model selection does not involve significant management judgment. Options are classified within Level 2 on the fair value hierarchy when all of the significant inputs can be corroborated to market evidence. Otherwise such instruments are classified as Level 3.
Valuations of mortgage-backed or other asset-backed securities, by pricing vendors, are based on both proprietary and industry recognized models and discounted cash flow techniques. Significant inputs to the valuation of these instruments are value of the collateral, the rates and timing of delinquencies, the rates and timing of prepayments, and default and loss expectations, which are driven in part by housing prices for residential mortgages. Significant inputs are determined based on relative value analyses, which incorporate comparisons to instruments with similar collateral and risk profiles, including relevant indices. Mortgage and asset-backed securities for which management has collected current observable data through pricing services are generally categorized within Level 2. Those investments for which current observable data has not been provided are classified as Level 3.
Bank loan prices are provided by third party pricing services and consist of a composite of the quotes received by the vendor into a consensus price. Certain bank loans are classified as Level 3, as significant input used in the fair value measurement of these instruments is the market quotes that are received by the vendor and these inputs are not observable.
| 40 | AB FLEXFEE INTERNATIONAL BOND PORTFOLIO | abfunds.com | |
NOTES TO FINANCIAL STATEMENTS(continued)
Other fixed income investments, includingnon-U.S. government and corporate debt, are generally valued using quoted market prices, if available, which are typically impacted by current interest rates, maturity dates and any perceived credit risk of the issuer. Additionally, in the absence of quoted market prices, these inputs are used by pricing vendors to derive a valuation based upon industry or proprietary models which incorporate issuer specific data with relevant yield/spread comparisons with more widely quoted bonds with similar key characteristics. Those investments for which there are observable inputs are classified as Level 2. Where the inputs are not observable, the investments are classified as Level 3.
The following table summarizes the valuation of the Fund’s investments by the above fair value hierarchy levels as of December 31, 2018:
Investments in Securities | Level 1 | Level 2 | Level 3 | Total | ||||||||||||
Assets: | ||||||||||||||||
Governments—Treasuries | $ | – 0 | – | $ | 21,681,362 | $ | – 0 | – | $ | 21,681,362 | ||||||
Corporates—Investment Grade | – 0 | – | 5,766,095 | – 0 | – | 5,766,095 | ||||||||||
Local Governments—Provincial Bonds | – 0 | – | 4,196,800 | – 0 | – | 4,196,800 | ||||||||||
Inflation-Linked Securities | – 0 | – | 2,405,921 | – 0 | – | 2,405,921 | ||||||||||
Covered Bonds | – 0 | – | 2,205,636 | – 0 | – | 2,205,636 | ||||||||||
Corporates—Non-Investment Grade | – 0 | – | 2,055,530 | – 0 | – | 2,055,530 | ||||||||||
Governments—Sovereign Agencies | – 0 | – | 2,035,110 | – 0 | – | 2,035,110 | ||||||||||
Collateralized Mortgage Obligations | – 0 | – | 1,863,228 | – 0 | – | 1,863,228 | ||||||||||
Governments—Sovereign Bonds | – 0 | – | 1,033,890 | – 0 | – | 1,033,890 | ||||||||||
Commercial Mortgage-Backed Securities | – 0 | – | 207,767 | 193,252 | 401,019 | |||||||||||
Supranationals | – 0 | – | 297,687 | – 0 | – | 297,687 | ||||||||||
Emerging Markets—Treasuries | – 0 | – | 235,281 | – 0 | – | 235,281 | ||||||||||
Emerging Markets—Sovereigns | – 0 | – | 225,882 | – 0 | – | 225,882 | ||||||||||
Quasi-Sovereigns | – 0 | – | 192,621 | – 0 | – | 192,621 | ||||||||||
Asset-Backed Securities | – 0 | – | – 0 | – | 114,340 | 114,340 | ||||||||||
Options Purchased—Calls | – 0 | – | 68,784 | – 0 | – | 68,784 | ||||||||||
Bank Loans | – 0 | – | 47,311 | – 0 | – | 47,311 | ||||||||||
Emerging Markets—Corporate Bonds | – 0 | – | 16,649 | – 0 | – | 16,649 | ||||||||||
Option Purchased—Puts | – 0 | – | 1,020 | – 0 | – | 1,020 | ||||||||||
Short-Term Investments: | ||||||||||||||||
Investment Companies | 465,081 | – 0 | – | – 0 | – | 465,081 | ||||||||||
|
|
|
|
|
|
|
| |||||||||
Total Investments in Securities | 465,081 | 44,536,574 | 307,592 | 45,309,247 | ||||||||||||
| abfunds.com | AB FLEXFEE INTERNATIONAL BOND PORTFOLIO | 41 | |
NOTES TO FINANCIAL STATEMENTS(continued)
Investments in Securities | Level 1 | Level 2 | Level 3 | Total | ||||||||||||
Other Financial Instruments*: | ||||||||||||||||
Assets | ||||||||||||||||
Futures | $ | 123,663 | $ | – 0 | – | $ | – 0 | – | $ | 123,663 | † | |||||
Forward Currency Exchange Contracts | – 0 | – | 675,008 | – 0 | – | 675,008 | ||||||||||
Centrally Cleared Credit Default Swaps | – 0 | – | 45,881 | – 0 | – | 45,881 | † | |||||||||
Centrally Cleared Interest Rate Swaps | – 0 | – | 178,784 | – 0 | – | 178,784 | † | |||||||||
Variance Swaps | – 0 | – | 1,208 | – 0 | – | 1,208 | ||||||||||
Liabilities | ||||||||||||||||
Futures | (196,569 | ) | – 0 | – | – 0 | – | (196,569 | )† | ||||||||
Forward Currency Exchange Contracts | – 0 | – | (473,422 | ) | – 0 | – | (473,422 | ) | ||||||||
Interest Rate Swaptions Written | – 0 | – | (44,317 | ) | – 0 | – | (44,317 | ) | ||||||||
Currency Options Written | – 0 | – | (3,745 | ) | – 0 | – | (3,745 | ) | ||||||||
Centrally Cleared Credit Default Swaps | – 0 | – | (11,518 | ) | – 0 | – | (11,518 | )† | ||||||||
Centrally Cleared Interest Rate Swaps | – 0 | – | (33,532 | ) | – 0 | – | (33,532 | )† | ||||||||
Credit Default Swaps | – 0 | – | (80,688 | ) | – 0 | – | (80,688 | ) | ||||||||
Variance Swaps | – 0 | – | (1,444 | ) | – 0 | – | (1,444 | ) | ||||||||
|
|
|
|
|
|
|
| |||||||||
Total^ | $ | 392,175 | $ | 44,788,789 | $ | 307,592 | $ | 45,488,556 | ||||||||
|
|
|
|
|
|
|
| |||||||||
| * | Other financial instruments are derivative instruments, such as futures, forwards and swaps, which are valued at the unrealized appreciation/(depreciation) on the instrument. Other financial instruments may also include swaps with upfront premiums, options written and swaptions written which are valued at market value. |
| † | Only variation margin receivable/payable at period end is reported within the statement of assets and liabilities. This amount reflects cumulative unrealized appreciation/(depreciation) on futures and centrally cleared swaps as reported in the portfolio of investments. Centrally cleared swaps with upfront premiums are presented here at market value. |
| ^ | There were no transfers between any levels during the reporting period. |
The Fund recognizes all transfers between levels of the fair value hierarchy assuming the financial instrument was transferred at the beginning of the reporting period.
Following is a reconciliation of investments in which significant unobservable inputs (Level 3) were used in determining fair value.
| Commercial Mortgage- Backed Securities | Asset- Backed Securities | Total | ||||||||||
Balance as of 12/31/17 | $ | 19,769 | $ | – 0 | – | $ | 19,769 | |||||
Accrued discounts/(premiums) | 360 | 15 | 375 | |||||||||
Realized gain (loss) | 138 | – 0 | – | 138 | ||||||||
Change in unrealized appreciation/depreciation | (537 | ) | (660 | ) | (1,197 | ) | ||||||
| 42 | AB FLEXFEE INTERNATIONAL BOND PORTFOLIO | abfunds.com | |
NOTES TO FINANCIAL STATEMENTS(continued)
| Commercial Mortgage- Backed Securities | Asset- Backed Securities | Total | ||||||||||
Purchases | $ | 174,164 | $ | 114,985 | $ | 289,149 | ||||||
Sales/Paydowns | (642 | ) | – 0 | – | (642 | ) | ||||||
Transfers into Level 3 | – 0 | – | – 0 | – | – 0 | – | ||||||
Transfers out of Level 3 | – 0 | – | – 0 | – | – 0 | – | ||||||
|
|
|
|
|
| |||||||
Balance as of 12/31/18 | $ | 193,252 | $ | 114,340 | $ | 307,592 | ||||||
|
|
|
|
|
| |||||||
Net change in unrealized appreciation/depreciation from investments held as of 12/31/18** | $ | (537 | ) | $ | (660 | ) | $ | (1,197 | ) | |||
|
|
|
|
|
| |||||||
| ** | The unrealized appreciation/depreciation is included in net change in unrealized appreciation/depreciation of investments and other financial instruments in the accompanying statement of operations. |
The Adviser established the Committee to oversee the pricing and valuation of all securities held in the Fund. The Committee operates under pricing and valuation policies and procedures established by the Adviser and approved by the Board, including pricing policies which set forth the mechanisms and processes to be employed on a daily basis to implement these policies and procedures. In particular, the pricing policies describe how to determine market quotations for securities and other instruments. The Committee’s responsibilities include: 1) fair value and liquidity determinations (and oversight of any third parties to whom any responsibility for fair value and liquidity determinations is delegated), and 2) regular monitoring of the Adviser’s pricing and valuation policies and procedures and modification or enhancement of these policies and procedures (or recommendation of the modification of these policies and procedures) as the Committee believes appropriate.
The Committee is also responsible for monitoring the implementation of the pricing policies by the Adviser’s Pricing Group (the “Pricing Group”) and any third party which performs certain pricing functions in accordance with the pricing policies. The Pricing Group is responsible for the oversight of the third party on aday-to-day basis. The Committee and the Pricing Group perform a series of activities to provide reasonable assurance of the accuracy of prices including: 1) periodic vendor due diligence meetings, review of methodologies, new developments and process at vendors, 2) daily comparison of security valuation versus prior day for all securities that exceeded established thresholds, and 3) daily review of unpriced, stale, and variance reports with exceptions reviewed by senior management and the Committee.
In addition, several processes outside of the pricing process are used to monitor valuation issues including: 1) performance and performance attribution reports are monitored for anomalous impacts based upon benchmark performance, and 2) portfolio managers review all portfolios for performance and analytics (which are generated using the Adviser’s prices).
| abfunds.com | AB FLEXFEE INTERNATIONAL BOND PORTFOLIO | 43 | |
NOTES TO FINANCIAL STATEMENTS(continued)
3. Currency Translation
Assets and liabilities denominated in foreign currencies and commitments under forward currency exchange contracts are translated into U.S. dollars at the mean of the quoted bid and ask prices of such currencies against the U.S. dollar. Purchases and sales of portfolio securities are translated into U.S. dollars at the rates of exchange prevailing when such securities were acquired or sold. Income and expenses are translated into U.S. dollars at the rates of exchange prevailing when accrued.
Net realized gain or loss on foreign currency transactions represents foreign exchange gains and losses from sales and maturities of foreign fixed income investments, holding of foreign currencies, currency gains or losses realized between the trade and settlement dates on foreign investment transactions, and the difference between the amounts of dividends, interest and foreign withholding taxes recorded on the Fund’s books and the U.S. dollar equivalent amounts actually received or paid. Net unrealized currency gains and losses from valuing foreign currency denominated assets and liabilities at period end exchange rates are reflected as a component of net unrealized appreciation and depreciation of foreign currency denominated assets and liabilities.
4. Taxes
It is the Fund’s policy to meet the requirements of the Internal Revenue Code applicable to regulated investment companies and to distribute all of its investment company taxable income and net realized gains, if any, to shareholders. Therefore, no provisions for federal income or excise taxes are required. The Fund may be subject to taxes imposed by countries in which it invests. Such taxes are generally based on income and/or capital gains earned or repatriated. Taxes are accrued and applied to net investment income, net realized gains and net unrealized appreciation/depreciation as such income and/or gains are earned.
In accordance with U.S. GAAP requirements regarding accounting for uncertainties in income taxes, management has analyzed the Fund’s tax positions taken or expected to be taken on federal and state income tax returns for all open tax years (all years since inception of the Fund) and has concluded that no provision for income tax is required in the Fund’s financial statements.
5. Investment Income and Investment Transactions
Dividend income is recorded on theex-dividend date or as soon as the Fund is informed of the dividend. Interest income is accrued daily. Investment transactions are accounted for on the date securities are purchased or sold. Investment gains or losses are determined on the identified cost basis. The Fund amortizes premiums and accretes discounts as adjustments to interest income.
| 44 | AB FLEXFEE INTERNATIONAL BOND PORTFOLIO | abfunds.com | |
NOTES TO FINANCIAL STATEMENTS(continued)
6. Expense Allocations
Expenses of the Company are charged proportionately to each portfolio or based on other appropriate methods.
7. Dividends and Distributions
Dividends and distributions to shareholders, if any, are recorded on theex-dividend date. Income dividends and capital gains distributions are determined in accordance with federal tax regulations and may differ from those determined in accordance with U.S. GAAP. To the extent these differences are permanent, such amounts are reclassified within the capital accounts based on their federal tax basis treatment; temporary differences do not require such reclassification.
8. Offering Expenses
Offering expenses of $94,183 were deferred and amortized on a straight line basis over a one year period starting from June 28, 2017 (commencement of operations).
NOTE B
Advisory Fee and Other Transactions with Affiliates
Under the terms of the investment advisory agreement, the Fund pays the Adviser an advisory fee at an annual rate of .40% of the Fund’s average daily net assets (“Base Fee”). The advisory fee is increased or decreased from the Base Fee by a performance adjustment (“Performance Adjustment”) that depends on whether, and to what extent, the investment performance of the Advisor Class shares of the Fund (“Measuring Class”) exceeds, or is exceeded by, the performance of the Bloomberg Barclays Global Aggregateex-USD (USD Hedged) Index (“Index”) plus .70% (“Index Hurdle”) over the Performance Period (as defined below). The Performance Adjustment is calculated and accrued daily, according to a schedule that adds or subtracts .00429% of the Fund’s average daily net assets for each .01% of absolute performance by which the performance of the Measuring Class exceeds or lags the Index Hurdle for the period from the beginning of the Performance Period through the prior business day or, if the performance of the Index is made available to the Fund on a daily basis at a time sufficient to permit the calculation of the Performance Adjustment on acurrent-day basis while maintaining the Fund’s ability to meet applicable deadlines for publishing its daily net asset value per share, within a reasonable time after the commencement of such availability, through the current business day. The maximum Performance Adjustment (positive or negative) will not exceed an annualized rate of +/- .30% (“Maximum Performance Adjustment”) of the Fund’s average daily net assets, which would occur when the performance of the Measuring Class exceeds, or is exceeded by, the Index Hurdle by .70% or more for the Performance Period. On a monthly basis, the Fund will pay the Adviser the minimum fee
| abfunds.com | AB FLEXFEE INTERNATIONAL BOND PORTFOLIO | 45 | |
NOTES TO FINANCIAL STATEMENTS(continued)
rate of .10% on an annualized basis (Base Fee minus the Maximum Performance Adjustment) applied to the average daily net assets for the month. At the end of the Performance Period, the Fund will pay to the Adviser the total advisory fee, less the amount of any minimum fees paid during the Performance Period and any waivers described below. The period over which performance is measured (“Performance Period”) was initially from the commencement of operations to December 31, 2018 and thereafter is each12-month period beginning on the first day in the month of January through December 31 of the same year. In addition, the Adviser has agreed to waive its advisory fee by limiting the Fund’s accrual of the advisory fee (Base Fee plus Performance Adjustment) on any day to the amount corresponding to the maximum fee rate multiplied by the Fund’s current net assets if such amount is less than the amount that would have been accrued based on the Fund’s average daily net assets for the Performance Period. For the year ended December 31, 2018, the Fund accrued advisory fees of $45,311, as reflected in the statement of operations, at an annual effective rate (excluding the impact from any expense waivers in effect) of .10% of the Fund’s average net assets, which reflected a (.30)% Performance Adjustment of $(135,931). For the Performance Period from June 28, 2017 to December 31, 2018, the Fund accrued advisory fees of $58,777, at an annual effective rate (excluding the impact from any expense waivers in effect) of .10% of the Fund’s average net assets, which reflected a (.30)% Performance Adjustment of $(176,332).
The Adviser has agreed to waive its fees and bear certain expenses through April 30, 2020 to the extent necessary to limit total expenses (other than the advisory fee, acquired fund fees and expenses other than the advisory fees of any AB mutual funds in which the Fund may invest, interest expense, taxes, extraordinary expenses, and brokerage commissions and other transaction costs) on an annual basis from exceeding .10% of average daily net assets. For the year ended December 31, 2018, such reimbursements/waivers amounted to $388,433. Any fees waived and expenses borne by the Adviser through December 31, 2018 are subject to repayment by the Fund until the end of the third fiscal year after the fiscal period in which the fees were waived or the expenses were borne; such waivers/expenses borne that are subject to repayment amount to $262,859 for the fiscal period ended December 31, 2017 and $388,433 for the year ended December 31, 2018. In any case, no repayment will be made that would cause the Fund’s total annual expenses (subject to the exclusions set forth above) to exceed .10%.
During 2017, AXA S.A. (“AXA”), a French holding company for the AXA Group, a worldwide leader in life, property and casualty and health insurance and asset management, announced its intention to pursue the sale of a minority stake in its subsidiary, AXA Equitable Holdings, Inc.
| 46 | AB FLEXFEE INTERNATIONAL BOND PORTFOLIO | abfunds.com | |
NOTES TO FINANCIAL STATEMENTS(continued)
(“AXA Equitable”), the holding company for a diversified financial services organization, through an initial public offering (“IPO”). AXA Equitable is the holding company for a diverse group of financial services companies, including AllianceBernstein L.P., the investment adviser to the Funds (“the Adviser”). During the second quarter of 2018, AXA Equitable completed the IPO, and, as a result, AXA held approximately 72.2% of the outstanding common stock of AXA Equitable as of September 30, 2018. Contemporaneously with the IPO, AXA sold $862.5 million aggregate principal amount of its 7.25% mandatorily exchangeable notes (the “MxB Notes”) due May 15, 2021 and exchangeable into up to 43,125,000 shares of common stock (or approximately 7% of the outstanding shares of common stock of AXA Equitable). AXA retains ownership (including voting rights) of such shares of common stock until the MxB Notes are exchanged, which may be on a date that is earlier than the maturity date at AXA’s option upon the occurrence of certain events.
In March 2018, AXA announced its intention to sell its entire interest in AXA Equitable over time, subject to market conditions and other factors (the “Plan”). It is anticipated that one or more of the transactions contemplated by the Plan may ultimately result in the indirect transfer of a “controlling block” of voting securities of the Adviser (a “Change of Control Event”) and therefore may be deemed an “assignment” causing a termination of each Fund’s current investment advisory agreement. In order to ensure that the existing investment advisory services could continue uninterrupted, at meetings held in late July through early August 2018, the Boards of Directors/Trustees (each a “Board” and collectively, the “Boards”) approved new investment advisory agreements with the Adviser, in connection with the Plan. The Boards also agreed to call and hold a joint meeting of shareholders on October 11, 2018 for shareholders of each Fund to (1) approve the new investment advisory agreement with the Adviser that would be effective after the first Change of Control Event and (2) approve any future advisory agreement approved by the Board and that has terms not materially different from the current agreement, in the event there are subsequent Change of Control Events arising from completion of the Plan that terminate the advisory agreement after the first Change of Control Event. Approval of a future advisory agreement means that shareholders may not have another opportunity to vote on a new agreement with the Adviser even upon a change of control, as long as no single person or group of persons acting together gains “control” (as defined in the 1940 Act) of AXA Equitable.
At the October 11, 2018 meeting, shareholders approved the new and future investment advisory agreements.
| abfunds.com | AB FLEXFEE INTERNATIONAL BOND PORTFOLIO | 47 | |
NOTES TO FINANCIAL STATEMENTS(continued)
On November 20, 2018, AXA completed a public offering of 60,000,000 shares of AXA Equitable’s common stock and simultaneously sold 30,000,000 of such shares to AXA Equitable pursuant to a separate agreement with it. As a result AXA currently owns approximately 59.2% of the shares of common stock of AXA Equitable.
Pursuant to the investment advisory agreement, the Fund may reimburse the Adviser for certain legal and accounting services provided to the Fund by the Adviser. For the year ended December 31, 2018, the Adviser voluntarily agreed to waive such fees in the amount of $67,975.
The Fund compensates AllianceBernstein Investor Services, Inc. (“ABIS”), a wholly-owned subsidiary of the Adviser, under a Transfer Agency Agreement for providing personnel and facilities to perform transfer agency services for the Fund. ABIS may make payments to intermediaries that provide omnibus account services,sub-accounting services and/or networking services. The compensation retained by ABIS amounted to $18,000 for year ended December 31, 2018.
The Fund may invest in AB Government Money Market Portfolio (the “Government Money Market Portfolio”) which has a contractual annual advisory fee rate of ..20% of the portfolio’s average daily net assets and bears its own expenses. Effective August 1, 2018, the Adviser has contractually agreed to waive .10% of the advisory fee of Government Money Market Portfolio until August 31, 2019. In connection with the investment by the Fund in Government Money Market Portfolio, the Adviser has contractually agreed to waive its advisory fee from the Fund in an amount equal to the Fund’s pro rata share of the effective advisory fees of Government Money Market Portfolio, as borne indirectly by the Fund as an acquired fund fee and expense. For year ended December 31, 2018, such waiver amounted to $719.
A summary of the Fund’s transactions in AB mutual funds for the year ended December 31, 2018 is as follows:
Fund | Market Value 12/31/17 (000) | Purchases at Cost (000) | Sales Proceeds (000) | Market Value 12/31/18 (000) | Dividend Income (000) | |||||||||||||||
Government Money Market Portfolio | $ | 1,145 | $ | 14,794 | $ | 15,474 | $ | 465 | $ | 7 | ||||||||||
Brokerage commissions paid on investment transactions for the year ended December 31, 2018 amounted to $2,581, of which $0 and $0, respectively, was paid to Sanford C. Bernstein & Co. LLC and Sanford C. Bernstein Limited, affiliates of the Adviser.
| 48 | AB FLEXFEE INTERNATIONAL BOND PORTFOLIO | abfunds.com | |
NOTES TO FINANCIAL STATEMENTS(continued)
NOTE C
Investment Transactions
Purchases and sales of investment securities (excluding short-term investments) for the year ended December 31, 2018, were as follows:
| Purchases | Sales | |||||||
Investment securities (excluding U.S. government securities) | $ | 36,950,279 | $ | 32,640,843 | ||||
U.S. government securities | 3,757,302 | 4,302,496 | ||||||
The cost of investments for federal income tax purposes, gross unrealized appreciation and unrealized depreciation are as follows:
Cost | $ | 46,354,179 | ||
|
| |||
Gross unrealized appreciation | $ | 1,500,787 | ||
Gross unrealized depreciation | (2,448,104 | ) | ||
|
| |||
Net unrealized depreciation | $ | (947,317 | ) | |
|
|
1. Derivative Financial Instruments
The Fund may use derivatives in an effort to earn income and enhance returns, to replace more traditional direct investments, to obtain exposure to otherwise inaccessible markets (collectively, “investment purposes”), or to hedge or adjust the risk profile of its portfolio.
The principal types of derivatives utilized by the Fund, as well as the methods in which they may be used are:
| • | Forward Currency Exchange Contracts |
The Fund may enter into forward currency exchange contracts in order to hedge its exposure to changes in foreign currency exchange rates on its foreign portfolio holdings, to hedge certain firm purchase and sales commitments denominated in foreign currencies and fornon-hedging purposes as a means of making direct investments in foreign currencies, as described below under “Currency Transactions”.
A forward currency exchange contract is a commitment to purchase or sell a foreign currency at a future date at a negotiated forward rate. The gain or loss arising from the difference between the original contract and the closing of such contract would be included in net realized gain or loss on forward currency exchange contracts. Fluctuations in the value of open forward currency exchange contracts are recorded for financial reporting purposes as unrealized appreciation and/or depreciation by the Fund. Risks may arise from the potential inability of a counterparty to meet the terms of a contract and from unanticipated movements in the value of a foreign currency relative to the U.S. dollar.
| abfunds.com | AB FLEXFEE INTERNATIONAL BOND PORTFOLIO | 49 | |
NOTES TO FINANCIAL STATEMENTS(continued)
During the year ended December 31, 2018, the Fund held forward currency exchange contracts for hedging and non-hedging purposes.
| • | Futures |
The Fund may buy or sell futures for investment purposes or for the purpose of hedging its portfolio against adverse effects of potential movements in the market. The Fund bears the market risk that arises from changes in the value of these instruments and the imperfect correlation between movements in the price of the futures and movements in the price of the assets, reference rates or indices which they are designed to track. Among other things, the Fund may purchase or sell futures for foreign currencies or options thereon fornon-hedging purposes as a means of making direct investment in foreign currencies, as described below under “Currency Transactions”.
At the time the Fund enters into a future, the Fund deposits and maintains as collateral an initial margin with the broker, as required by the exchange on which the transaction is effected. Such amount of shown as due from broker on the statement of assets and liabilities. Pursuant to the contract, the Fund agrees to receive from or pay to the broker an amount of cash equal to the daily fluctuation in the value of the contract. Such receipts or payments are known as variation margin and are recorded by the Fund as unrealized gains or losses. Risks may arise from the potential inability of a counter party to meet the terms of the contract. The credit/counterparty risk for exchange-traded futures is generally less than privately negotiated futures, since the clearinghouse, which is the issuer or counterparty to each exchange-traded future, has robust risk mitigation standards, including the requirement to provide initial and variation margin. When the contract is closed, the Fund records realized gain or loss equal to the difference between the value of the contract at the time it was opened and the time it was closed.
Use of long futures subjects the Fund to risk of loss in excess of the amounts shown on the statement of assets and liabilities, up to the notional value of the future. Use of short futures subjects the Fund to unlimited risk of loss. Under some circumstances, futures exchanges may establish daily limits on the amount that the price of a future can vary from the previous day’s settlement price, which could effectively prevent liquidation of unfavorable positions.
During the year ended December 31, 2018, the Fund held futures for hedging and non-hedging purposes.
| • | Option Transactions |
For hedging and investment purposes, the Fund may purchase and write (sell) put and call options on U.S. and foreign securities,
| 50 | AB FLEXFEE INTERNATIONAL BOND PORTFOLIO | abfunds.com | |
NOTES TO FINANCIAL STATEMENTS(continued)
including government securities, and foreign currencies that are traded on U.S. and foreign securities exchanges andover-the-counter markets. Among other things, the Fund may use options transactions fornon-hedging purposes as a means of making direct investments in foreign currencies, as described below under “Currency Transactions” and may use options strategies involving the purchase and/or writing of various combinations of call and/or put options, for hedging and investment purposes.
The risk associated with purchasing an option is that the Fund pays a premium whether or not the option is exercised. Additionally, the Fund bears the risk of loss of the premium and change in market value should the counterparty not perform under the contract. If a put or call option purchased by the Fund were permitted to expire without being sold or exercised, its premium would represent a loss to the Fund. Put and call options purchased are accounted for in the same manner as portfolio securities. The cost of securities acquired through the exercise of call options is increased by premiums paid. The proceeds from securities sold through the exercise of put options are decreased by the premiums paid.
When the Fund writes an option, the premium received by the Fund is recorded as a liability and is subsequently adjusted to the current market value of the option written. Premiums received from written options which expire unexercised are recorded by the Fund on the expiration date as realized gains from options written. The fund’s maximum payment for written put options equates to the number of shares multiplied by the strike price, as included on the Portfolio of Investments. In certain circumstances maximum payout amounts may be partially offset by recovery values of the respective referenced assets and upfront premium received upon entering into the contract. The difference between the premium received and the amount paid on effecting a closing purchase transaction, including brokerage commissions, is also treated as a realized gain, or if the premium received is less than the amount paid for the closing purchase transaction, as a realized loss. If a call option is exercised, the premium received is added to the proceeds from the sale of the underlying security or currency in determining whether the Fund has realized a gain or loss. If a put option is exercised, the premium received reduces the cost basis of the security or currency purchased by the Fund. In writing an option, the Fund bears the market risk of an unfavorable change in the price of the security or currency underlying the written option. Exercise of an option written by the Fund could result in the Fund selling or buying a security or currency at a price different from the current market value.
| abfunds.com | AB FLEXFEE INTERNATIONAL BOND PORTFOLIO | 51 | |
NOTES TO FINANCIAL STATEMENTS(continued)
The Fund may also invest in options on swaps, also called “swaptions”. A swaption is an option that gives the buyer the right, but not the obligation, to enter into a swap on a future date in exchange for paying a market-based “premium”. A receiver swaption gives the owner the right to receive the total return of a specified asset, reference rate, or index. A payer swaption gives the owner the right to pay the total return of a specified asset, reference rate, or index. Swaptions also include options that allow an existing swap to be terminated or extended by one of the counterparties. The fund’s maximum payment for written put swaptions equates to the notional amount of the underlying swap. In certain circumstances maximum payout amounts may be partially offset by recovery values of the respective referenced assets and upfront premium received upon entering into the contract.
During the year ended December 31, 2018, the Fund held purchased options for non-hedging purposes.
During the year ended December 31, 2018, the Fund held written options for non-hedging purposes.
During the year ended December 31, 2018, the Fund held purchased swaptions for non-hedging purposes.
During the year ended December 31, 2018, the Fund held written swaptions for non-hedging purposes.
| • | Swaps |
The Fund may enter into swaps to hedge its exposure to interest rates, credit risk, or currencies. The Fund may also enter into swaps fornon-hedging purposes as a means of gaining market exposures including by making direct investments in foreign currencies, as described below under “Currency Transactions” or in order to take a “long” or “short” position with respect to an underlying referenced asset described below under “Total Return Swaps”. A swap is an agreement that obligates two parties to exchange a series of cash flows at specified intervals based upon or calculated by reference to changes in specified prices or rates for a specified amount of an underlying asset. The payment flows are usually netted against each other, with the difference being paid by one party to the other. In addition, collateral may be pledged or received by the Fund in accordance with the terms of the respective swaps to provide value and recourse to the Fund or its counterparties in the event of default, bankruptcy or insolvency by one of the parties to the swap.
Risks may arise as a result of the failure of the counterparty to the swap to comply with the terms of the swap. The loss incurred by the failure of a counterparty is generally limited to the net interim payment to be received by the Fund, and/or the termination value at the end of the contract. Therefore, the Fund considers the creditworthiness of
| 52 | AB FLEXFEE INTERNATIONAL BOND PORTFOLIO | abfunds.com | |
NOTES TO FINANCIAL STATEMENTS(continued)
each counterparty to a swap in evaluating potential counterparty risk. This risk is mitigated by having a netting arrangement between the Fund and the counterparty and by the posting of collateral by the counterparty to the Fund to cover the Fund’s exposure to the counterparty. Additionally, risks may arise from unanticipated movements in interest rates or in the value of the underlying securities. The Fund accrues for the interim payments on swaps on a daily basis, with the net amount recorded within unrealized appreciation/depreciation of swaps on the statement of assets and liabilities, where applicable. Once the interim payments are settled in cash, the net amount is recorded as realized gain/(loss) on swaps on the statement of operations, in addition to any realized gain/(loss) recorded upon the termination of swaps. Upfront premiums paid or received for OTC swaps are recognized as cost or proceeds on the statement of assets and liabilities and are amortized on a straight line basis over the life of the contract. Amortized upfront premiums are included in net realized gain/(loss) from swaps on the statement of operations. Fluctuations in the value of swaps are recorded as a component of net change in unrealized appreciation/depreciation of swaps on the statement of operations.
Certain standardized swaps, including certain interest rate swaps and credit default swaps, are (or soon will be) subject to mandatory central clearing. Cleared swaps are transacted through futures commission merchants (“FCMs”) that are members of central clearinghouses, with the clearinghouse serving as central counterparty, similar to transactions in futures contracts. Centralized clearing will be required for additional categories of swaps on aphased-in basis based on requirements published by the Securities and Exchange Commission and Commodity Futures Trading Commission.
At the time the Fund enters into a centrally cleared swap, the Fund deposits and maintains as collateral an initial margin with the broker, as required by the clearinghouse on which the transaction is effected. Such amount is shown as cash collateral due from broker on the statement of assets and liabilities. Pursuant to the contract, the Fund agrees to receive from or pay to the broker an amount of cash equal to the daily fluctuation in the value of the contract. Such receipts or payments are known as variation margin and are recorded by the Fund as unrealized gains or losses. Risks may arise from the potential inability of a counterparty to meet the terms of the contract. The credit/counterparty risk for centrally cleared swaps is generally less thannon-centrally cleared swaps, since the clearinghouse, which is the issuer or counterparty to each centrally cleared swap, has robust risk mitigation standards, including the requirement to provide initial and variation margin. When the contract is closed, the Fund records a
| abfunds.com | AB FLEXFEE INTERNATIONAL BOND PORTFOLIO | 53 | |
NOTES TO FINANCIAL STATEMENTS(continued)
realized gain or loss equal to the difference between the value of the contract at the time it was opened and the time it was closed.
Interest Rate Swaps:
The Fund is subject to interest rate risk exposure in the normal course of pursuing its investment objectives. Because the Fund holds fixed rate bonds, the value of these bonds may decrease if interest rates rise. To help hedge against this risk and to maintain its ability to generate income at prevailing market rates, the Fund may enter into interest rate swaps. Interest rate swaps are agreements between two parties to exchange cash flows based on a notional amount. The Fund may elect to pay a fixed rate and receive a floating rate, or, receive a fixed rate and pay a floating rate on a notional amount. In addition, the Fund may also enter into interest rate swap transactions to preserve a return or spread on a particular investment or portion of its portfolio, or protecting against an increase in the price of securities the Fund anticipates purchasing at a later date. Interest rate swaps involve the exchange by a Fund with another party of their respective commitments to pay or receive interest (e.g., an exchange of floating rate payments for fixed rate payments) computed based on a contractually-based principal (or “notional”) amount. Interest rate swaps are entered into on a net basis (i.e., the two payment streams are netted out, with the Fund receiving or paying, as the case may be, only the net amount of the two payments).
During the year ended December 31, 2018, the Fund held interest rate swaps for hedging and non-hedging purposes.
Credit Default Swaps:
The Fund may enter into credit default swaps, including to manage its exposure to the market or certain sectors of the market, to reduce its risk exposure to defaults by corporate and sovereign issuers held by the Fund, or to create exposure to corporate or sovereign issuers to which it is not otherwise exposed. The Fund may purchase credit protection (“Buy Contract”) or provide credit protection (“Sale Contract”) on the referenced obligation of the credit default swap. During the term of the swap, the Fund receives/(pays) fixed payments from/(to) the respective counterparty, calculated at the agreed upon rate applied to the notional amount. If the Fund is a buyer/(seller) of protection and a credit event occurs, as defined under the terms of the swap, the Fund will either (i) receive from the seller/(pay to the buyer) of protection an amount equal to the notional amount of the swap (the “Maximum Payout Amount”) and deliver/(take delivery of) the referenced obligation or (ii) receive/(pay) a net settlement amount in the form of cash or securities equal to the notional amount of the swap less the recovery value of the referenced obligation.
| 54 | AB FLEXFEE INTERNATIONAL BOND PORTFOLIO | abfunds.com | |
NOTES TO FINANCIAL STATEMENTS(continued)
In certain circumstances Maximum Payout Amounts may be partially offset by recovery values of the respective referenced obligations, upfront premium received upon entering into the agreement, or net amounts received from settlement of buy protection credit default swaps entered into by the Fund for the same reference obligation with the same counterparty.
Credit default swaps may involve greater risks than if the Fund had invested in the referenced obligation directly. Credit default swaps are subject to general market risk, liquidity risk, counterparty risk and credit risk. If the Fund is a buyer of protection and no credit event occurs, it will lose the payments it made to its counterpart. If the Fund is a seller of protection and a credit event occurs, the value of the referenced obligation received by the Fund coupled with the periodic payments previously received may be less than the Maximum Payout Amount it pays to the buyer, resulting in a net loss to the Fund.
Implied credit spreads over Treasuries of comparable maturity utilized in determining the market value of credit default swaps on issuers as of period end are disclosed in the portfolio of investments. The implied spreads serve as an indicator of the current status of the payment/performance risk and typically reflect the market’s assessment of the likelihood of default by the issuer on the referenced obligation. The implied credit spread of a particular reference entity reflects the cost of buying/selling protection and may include upfront payments required to be made to enter into the agreement. Widening credit spreads typically represent a deterioration of the referenced entity’s credit soundness and greater likelihood of default or other credit event occurring as defined under the terms of the agreement. A credit spread identified as “Defaulted” indicates a credit event has occurred for the referenced entity or obligation.
During the year ended December 31, 2018, the Fund held credit default swaps for hedging and non-hedging purposes.
Variance Swaps:
The Fund may enter into variance swaps to hedge equity market risk or adjust exposure to the equity markets. Variance swaps are contracts in which two parties agree to exchange cash payments based on the difference between the stated level of variance and the actual variance realized on underlying asset(s) or index(es). Actual “variance” as used here is defined as the sum of the square of the returns on the reference asset(s) or index(es) (which in effect is a measure of its “volatility”) over the length of the contract term. So the parties to a variance swap can be said to exchange actual volatility for a contractually stated rate of volatility.
| abfunds.com | AB FLEXFEE INTERNATIONAL BOND PORTFOLIO | 55 | |
NOTES TO FINANCIAL STATEMENTS(continued)
During the year ended December 31, 2018, the Fund held variance swaps for non-hedging purposes.
The Fund typically enters into International Swaps and Derivatives Association, Inc. Master Agreements (“ISDA Master Agreement”) with its OTC derivative contract counterparties in order to, among other things, reduce its credit risk to OTC counterparties. ISDA Master Agreements include provisions for general obligations, representations, collateral and events of default or termination. Under an ISDA Master Agreement, the Fund typically may offset with the OTC counterparty certain derivative financial instruments’ payables and/or receivables with collateral held and/or posted and create one single net payment(close-out netting) in the event of default or termination. In the event of a default by an OTC counterparty, the return of collateral with market value in excess of the Fund’s net liability, held by the defaulting party, may be delayed or denied.
The Fund’s ISDA Master Agreements may contain provisions for early termination of OTC derivative transactions in the event the net assets of the Fund decline below specific levels (“net asset contingent features”). If these levels are triggered, the Fund’s OTC counterparty has the right to terminate such transaction and require the Fund to pay or receive a settlement amount in connection with the terminated transaction. If OTC derivatives were held at period end, please refer to netting arrangements by the OTC counterparty table below for additional details.
During the year ended December 31, 2018, the Fund had entered into the following derivatives:
Asset Derivatives | Liability Derivatives | |||||||||||
Derivative Type | Statement of | Fair Value | Statement of | Fair Value | ||||||||
Interest rate contracts | Receivable/Payable for variation margin on futures | $ | 123,663 | * | Receivable/Payable for variation margin on futures | $ | 196,569 | * | ||||
Interest rate contracts | Receivable/Payable for variation margin on centrally cleared swaps | 178,784 | * | Receivable/Payable for variation margin on centrally cleared swaps | 33,532 | * | ||||||
Interest rate contracts | Investments in securities, at value | 836 | ||||||||||
| 56 | AB FLEXFEE INTERNATIONAL BOND PORTFOLIO | abfunds.com | |
NOTES TO FINANCIAL STATEMENTS(continued)
Asset Derivatives | Liability Derivatives | |||||||||||
Derivative Type | Statement of | Fair Value | Statement of | Fair Value | ||||||||
Interest rate contracts | Swaptions written, at value | $ | 44,317 | |||||||||
Foreign currency contracts | Unrealized appreciation on forward currency exchange contracts | $ | 675,008 |
| Unrealized depreciation on forward currency exchange contracts |
| 473,422 |
| ||||
Foreign currency contracts | Investments in securities, at value |
| 68,968 |
| ||||||||
Foreign currency contracts | Options written, at value |
| 3,745 |
| ||||||||
Foreign currency contracts | Unrealized appreciation on variance swaps |
| 1,208 |
| Unrealized depreciation on variance swaps |
| 1,444 |
| ||||
Credit contracts | Market value of credit default swaps | 80,688 | ||||||||||
Credit contracts | Receivable/ Payable for variation margin on centrally cleared swaps | 31,456 | * | Receivable/ Payable for variation margin on centrally cleared swaps | 80,544 | * | ||||||
|
|
|
| |||||||||
Total | $ | 1,079,923 | $ | 914,261 | ||||||||
|
|
|
| |||||||||
| * | Only variation margin receivable/payable at period end is reported within the statement of assets and liabilities. This amount reflects cumulative unrealized appreciation/depreciation on futures and centrally cleared swaps as reported in the portfolio of investments. |
Derivative Type | Location of Gain or (Loss) on Derivatives Within Statement of Operations | Realized Gain or (Loss) on Derivatives | Change in Unrealized Appreciation or (Depreciation) | |||||||
Interest rate contracts | Net realized gain/(loss) on swaps; Net change in unrealized appreciation/depreciation on swaps | $ | 15,138 | $ | 135,218 | |||||
Interest rate contracts | Net realized gain/(loss) on futures; Net change in unrealized appreciation/depreciation on futures | 198,088 | (109,705 | ) | ||||||
| abfunds.com | AB FLEXFEE INTERNATIONAL BOND PORTFOLIO | 57 | |
NOTES TO FINANCIAL STATEMENTS(continued)
Derivative Type | Location of Gain or (Loss) on Derivatives Within Statement of Operations | Realized Gain or (Loss) on Derivatives | Change in Unrealized Appreciation or (Depreciation) | |||||||
Interest rate contracts | Net realized gain/(loss) on investment transactions; Net change in unrealized appreciation/depreciation on investments | $ | 4,899 | $ | (22,011 | ) | ||||
Interest rate contracts | Net realized gain/(loss) on swaptions written; Net change in unrealized appreciation/depreciation on swaptions written | 17,603 | (26,196 | ) | ||||||
Foreign currency contracts | Net realized gain/(loss) on forward currency exchange contracts; Net change in unrealized appreciation/depreciation on forward currency exchange contracts | 1,827,791 | 526,532 | |||||||
Foreign currency contracts | Net realized gain/(loss) on investment transactions; Net change in unrealized appreciation/depreciation on investments | (27,880 | ) | 32,180 | ||||||
Foreign currency contracts | Net realized gain/(loss) on options written; Net change in unrealized appreciation/depreciation on options written | 47,985 | 19,601 | |||||||
Foreign currency | Net realized gain/(loss) on swaps; Net change in unrealized appreciation/depreciation on swaps | – 0 | – | (236 | ) | |||||
Credit contracts | Net realized gain/(loss) on swaps; Net change in unrealized appreciation/depreciation on swaps | 35,007 | (71,656 | ) | ||||||
|
|
|
| |||||||
Total | $ | 2,118,631 | $ | 483,727 | ||||||
|
|
|
| |||||||
| 58 | AB FLEXFEE INTERNATIONAL BOND PORTFOLIO | abfunds.com | |
NOTES TO FINANCIAL STATEMENTS(continued)
The following table represents the average monthly volume of the Fund’s derivative transactions during the year ended December 31, 2018.
Centrally Cleared Credit Default Swaps: | ||||
Average notional amount of buy contracts | $ | 4,500,000 | (a) | |
Average notional amount of sale contracts | $ | 4,748,571 | (a) | |
Centrally Cleared Interest Rate Swaps: | ||||
Average notional amount | $ | 20,578,123 | ||
Credit Default Swaps: | ||||
Average notional amount of sale contracts | $ | 1,145,769 | ||
Forward Currency Exchange Contracts: | ||||
Average principal amount on buy contracts | $ | 9,388,336 | ||
Average principal amount on sale contracts | $ | 46,538,467 | ||
Futures: | ||||
Average original value on buy contracts | $ | 10,397,381 | ||
Average original value on sale contracts | $ | 8,250,590 | ||
Variance Swaps: | ||||
Average notional amount | $ | 14,052 | ||
Purchased Swaptions: | ||||
Average notional amount | $ | 4,224,900 | (b) | |
Purchased Options: | ||||
Average notional amount | $ | 1,402,649 | ||
Options Written: | ||||
Average notional amount | $ | 2,931,777 | ||
Swaptions Written: | ||||
Average notional amount | $ | 9,457,334 | (b) | |
| (a) | Positions were open for seven month during the period. |
| (b) | Positions were open for ten months during the period. |
For financial reporting purposes, the Fund does not offset derivative assets and derivative liabilities that are subject to netting arrangements in the statement of assets and liabilities.
All OTC derivatives held at period end were subject to netting arrangements. The following table presents the Fund’s derivative assets and liabilities by OTC counterparty net of amounts available for offset under ISDA Master Agreements (“MA”) and net of the related collateral received/pledged by the Fund as of December 31, 2018. Exchange-traded derivatives and centrally cleared swaps are not subject to netting arrangements and as such are excluded from the table.
| abfunds.com | AB FLEXFEE INTERNATIONAL BOND PORTFOLIO | 59 | |
NOTES TO FINANCIAL STATEMENTS(continued)
Counterparty | Derivative Assets Subject to a MA | Derivatives Available for Offset | Cash Collateral Received* | Security Collateral Received* | Net Amount of Derivatives Assets | |||||||||||||||
Bank of America, NA. | $ | 721 | $ | (721 | ) | $ | – 0 | – | $ | – 0 | – | $ | – 0 | – | ||||||
Barclays Bank PLC | 42,866 | (35,487 | ) | – 0 | – | – 0 | – | 7,379 | ||||||||||||
Brown Brothers Harriman & Co. | 101,192 | (99,061 | ) | – 0 | – | – 0 | – | 2,131 | ||||||||||||
Citibank, NA. | 4,467 | (4,467 | ) | – 0 | – | – 0 | – | – 0 | – | |||||||||||
Credit Suisse International | 68,047 | (58,172 | ) | – 0 | – | – 0 | – | 9,875 | ||||||||||||
Deutsche Bank AG | 34,909 | (34,909 | ) | – 0 | – | – 0 | – | – 0 | – | |||||||||||
Goldman Sachs Bank USA | 38,710 | (38,710 | ) | – 0 | – | – 0 | – | – 0 | – | |||||||||||
JPMorgan Chase Bank, NA | 5,331 | (5,331 | ) | – 0 | – | – 0 | – | – 0 | – | |||||||||||
Morgan Stanley Capital Services LLC/ Morgan Stanley & Co. International PLC . | 19,853 | (19,853 | ) | – 0 | – | – 0 | – | – 0 | – | |||||||||||
Natwest Markets PLC. | 130 | – 0 | – | – 0 | – | – 0 | – | 130 | ||||||||||||
Royal Bank of Scotland PLC | 550 | (550 | ) | – 0 | – | – 0 | – | – 0 | – | |||||||||||
Standard Chartered Bank. | 11,821 | (1,625 | ) | – 0 | – | – 0 | – | 10,196 | ||||||||||||
UBS AG | 417,423 | (1,802 | ) | – 0 | – | – 0 | – | 415,621 | ||||||||||||
|
|
|
|
|
|
|
|
|
| |||||||||||
Total | $ | 746,020 | $ | (300,688 | ) | $ | – 0 | – | $ | – 0 | – | $ | 445,332 | ^ | ||||||
|
|
|
|
|
|
|
|
|
| |||||||||||
Counterparty | Derivative Liabilities Subject to a MA | Derivatives Available for Offset | Cash Collateral Pledged* | Security Collateral Pledged* | Net Amount of Derivatives Liabilities | |||||||||||||||
Bank of America, NA. | $ | 18,225 | $ | (721 | ) | $ | – 0 | – | $ | – 0 | – | $ | 17,504 | |||||||
Barclays Bank PLC | 35,487 | (35,487 | ) | – 0 | – | – 0 | – | – 0 | – | |||||||||||
Brown Brothers Harriman & Co. | 99,061 | (99,061 | ) | – 0 | – | – 0 | – | – 0 | – | |||||||||||
Citibank, NA. | 10,562 | (4,467 | ) | – 0 | – | – 0 | – | 6,095 | ||||||||||||
Credit Suisse International | 58,172 | (58,172 | ) | – 0 | – | – 0 | – | – 0 | – | |||||||||||
Deutsche Bank AG | 40,944 | (34,909 | ) | – 0 | – | – 0 | – | 6,035 | ||||||||||||
Goldman Sachs Bank USA | 230,968 | (38,710 | ) | – 0 | – | – 0 | – | 192,258 | ||||||||||||
| 60 | AB FLEXFEE INTERNATIONAL BOND PORTFOLIO | abfunds.com | |
NOTES TO FINANCIAL STATEMENTS(continued)
Counterparty | Derivative Liabilities Subject to a MA | Derivatives Available for Offset | Cash Collateral Pledged* | Security Collateral Pledged* | Net Amount of Derivatives Liabilities | |||||||||||||||
JPMorgan Chase Bank, NA | $ | 20,833 | $ | (5,331 | ) | $ | – 0 | – | $ | – 0 | – | $ | 15,502 | |||||||
Morgan Stanley Capital Services LLC/ Morgan Stanley & Co. International PLC. . | 83,042 | (19,853 | ) | – 0 | – | – 0 | – | 63,189 | ||||||||||||
Royal Bank of Scotland PLC | 2,895 | (550 | ) | – 0 | – | – 0 | – | 2,345 | ||||||||||||
Standard Chartered Bank. | 1,625 | (1,625 | ) | – 0 | – | – 0 | – | – 0 | – | |||||||||||
UBS AG | 1,802 | (1,802 | ) | – 0 | – | – 0 | – | – 0 | – | |||||||||||
|
|
|
|
|
|
|
|
|
| |||||||||||
Total | $ | 603,616 | $ | (300,688 | ) | $ | – 0 | – | $ | – 0 | – | $ | 302,928 | ^ | ||||||
|
|
|
|
|
|
|
|
|
| |||||||||||
| * | The actual collateral received/pledged may be more than the amount reported due to overcollateralization. |
| ^ | Net amount represents the net receivable/payable that would be due from/to the counterparty in the event of default or termination. The net from OTC financial derivative instruments can only be netted across transactions governed under the same master agreement with the same counterparty. |
2. Currency Transactions
The Fund may invest innon-U.S. Dollar-denominated securities on a currency hedged or unhedged basis. The Fund may seek investment opportunities by taking long or short positions in currencies through the use of currency-related derivatives, including forward currency exchange contracts, futures and options on futures, swaps, and other options. The Fund may enter into transactions for investment opportunities when it anticipates that a foreign currency will appreciate or depreciate in value but securities denominated in that currency are not held by the Fund and do not present attractive investment opportunities. Such transactions may also be used when the Adviser believes that it may be more efficient than a direct investment in a foreign currency-denominated security. The Fund may also conduct currency exchange contracts on a spot basis (i.e., for cash at the spot rate prevailing in the currency exchange market for buying or selling currencies).
| abfunds.com | AB FLEXFEE INTERNATIONAL BOND PORTFOLIO | 61 | |
NOTES TO FINANCIAL STATEMENTS(continued)
NOTE D
Capital Stock
Each class consists of 3,000,000,000 authorized shares. Transactions in capital shares for each class were as follows:
| Shares | Amount | |||||||||||||||||||||||
| Year Ended December 31, 2018 | June 28, 2017* to December 31, 2017 | Year Ended December 31, 2018 | June 28, 2017* to December 31, 2017 | |||||||||||||||||||||
|
| |||||||||||||||||||||||
| Advisor Class | ||||||||||||||||||||||||
Shares sold | 86,184 | 4,503,504 | $ | 860,414 | $ | 45,000,003 | ||||||||||||||||||
| ||||||||||||||||||||||||
Shares issued in reinvestment of dividends and distributions | 187,697 | 0 | (a) | 1,809,461 | 0 | (b) | ||||||||||||||||||
| ||||||||||||||||||||||||
Shares redeemed | (19,510 | ) | – 0 | – | (194,548 | ) | – 0 | – | ||||||||||||||||
| ||||||||||||||||||||||||
Net increase | 254,371 | 4,503,504 | $ | 2,475,327 | $ | 45,000,003 | ||||||||||||||||||
| ||||||||||||||||||||||||
| * | Commencement of operations. |
| (a) | less than 0.5 shares. |
| (b) | less than $0.5. |
At December 31, 2018, the Adviser owned 99% of the Fund’s outstanding shares. Significant transactions by such shareholder, if any, may impact the Fund’s performance.
NOTE E
Risks Involved in Investing in the Fund
Interest Rate Risk and Credit Risk—Interest rate risk is the risk that changes in interest rates will affect the value of the Fund’s investments in fixed-income debt securities such as bonds or notes. Increases in interest rates may cause the value of the Fund’s investments to decline. Credit risk is the risk that the issuer or guarantor of a debt security, or the counterparty to a derivative contract, will be unable or unwilling to make timely principal and/or interest payments, or to otherwise honor its obligations. The degree of risk for a particular security may be reflected in its credit rating. Credit risk is greater for medium quality and lower-rated securities. Lower-rated debt securities and similar unrated securities (commonly known as “junk bonds”) have speculative elements or are predominantly speculative risks.
Below Investment Grade Securities Risk—Investments in fixed-income securities with lower ratings (commonly known as “junk bonds”) tend to have a higher probability that an issuer will default or fail to meet its payment obligations. These securities may be subject to greater price volatility due to such factors as specific corporate developments, negative perceptions of the junk bond market generally and less secondary market liquidity.
| 62 | AB FLEXFEE INTERNATIONAL BOND PORTFOLIO | abfunds.com | |
NOTES TO FINANCIAL STATEMENTS(continued)
Duration Risk—Duration is a measure that relates the expected price volatility of a fixed-income security to changes in interest rates. The duration of a fixed-income security may be shorter than or equal to full maturity of a fixed-income security. Fixed-income securities with longer durations have more risk and will decrease in price as interest rates rise. For example, generally a fixed-income security with a duration of three years will decrease in value by approximately 3% if interest rates increase by 1%.
Inflation Risk—This is the risk that the value of assets or income from investments will be less in the future as inflation decreases the value of money. As inflation increases, the value of the Fund’s assets can decline as can the value of the Fund’s distributions. This risk is significantly greater if the Fund invests a significant portion of its assets in fixed-income securities with longer maturities.
Mortgage-Related Securities Risk—Investments in mortgage-related securities are subject to certain additional risks. The value of these securities may be particularly sensitive to changes in interest rates. These risks include “extension risk”, which is the risk that, in periods of rising interest rates, issuers may delay the payment of principal, and “prepayment risk”, which is the risk that in periods of falling interest rates, issuers may pay principal sooner than expected, exposing the Fund to a lower rate of return upon reinvestment of principal. Mortgage-backed securities offered bynon-governmental issuers may be subject to other risks, such as higher rates of default in the mortgages or risks associated with the nature and servicing of mortgages backing the securities.
Foreign(Non-U.S.) Risk—Investments in securities ofnon-U.S. issuers may involve more risk than those of U.S. issuers. These securities may fluctuate more widely in price and may be less liquid due to adverse market, economic, political, regulatory or other factors.
Emerging Market Risk—Investments in emerging market countries may have more risk because the markets are less developed and less liquid, and because these investments may be subject to increased economic, political, regulatory or other uncertainties.
Currency Risk—Fluctuations in currency exchange rates may negatively affect the value of the Fund’s investments in fixed-income securities denominated in foreign currencies or reduce its returns.
Derivatives Risk—The Fund may enter into derivative transactions such as forwards, options, futures and swaps. Derivatives may be illiquid, difficult to price, and leveraged so that small changes may produce disproportionate losses for the Fund, and subject to counterparty risk to a greater degree than more traditional investments. Derivatives may result in significant losses, including losses that are far greater than the value of the derivatives reflected on the statement of assets and liabilities.
| abfunds.com | AB FLEXFEE INTERNATIONAL BOND PORTFOLIO | 63 | |
NOTES TO FINANCIAL STATEMENTS(continued)
Liquidity Risk—Liquidity risk occurs when certain investments become difficult to purchase or sell. Difficulty in selling less liquid securities may result in sales at disadvantageous prices affecting the value of your investment in the Fund. Causes of liquidity risk may include low trading volumes, large positions and heavy redemptions of Fund shares. Over recent years, liquidity risk has also increased because the capacity of dealers in the secondary market for fixed-income securities to make markets in these securities has decreased, even as the overall bond market has grown significantly, due to, among other things, structural changes, additional regulatory requirements and capital and risk restraints that have led to reduced inventories. Liquidity risk may be higher in a rising interest rate environment, when the value and liquidity of fixed-income securities generally decline.
Indemnification Risk—In the ordinary course of business, the Fund enters into contracts that contain a variety of indemnifications. The Fund’s maximum exposure under these arrangements is unknown. However, the Fund has not had prior claims or losses pursuant to these indemnification provisions and expects the risk of loss thereunder to be remote. Therefore, the Fund has not accrued any liability in connection with these indemnification provisions.
NOTE F
Distributions to Shareholders
The tax character of distributions paid during the fiscal year ended December 31, 2018 and fiscal period ended December 31, 2017 were as follows:
| 2018 | 2017 | |||||||
Distributions paid from: | ||||||||
Ordinary income | $ | 2,225,195 | $ | 501,767 | ||||
Net long-term capital gains | 80,559 | – 0 | – | |||||
|
|
|
| |||||
Total taxable distributions paid | 2,305,754 | 501,767 | ||||||
Return of Capital | 77,538 | – 0 | – | |||||
|
|
|
| |||||
Total distributions paid | $ | 2,383,292 | $ | 501,767 | ||||
|
|
|
| |||||
As of December 31, 2018, the components of accumulated earnings/(deficit) on a tax basis were as follows:
Accumulated capital losses | $ | (235,553 | )(a) | |
Other losses | (254,948 | )(b) | ||
Unrealized appreciation/(depreciation) | (949,427 | )(c) | ||
|
| |||
Total accumulated earnings/(deficit) | $ | (1,439,928 | )(d) | |
|
|
| (a) | As of December 31, 2018, the cumulative deferred loss on straddles was $69. As of December 31, 2018, the Fund had a post-October short term capital loss deferral of $37,587, and a post-October long term capital loss deferral of $197,897. |
| (b) | As of December 31, 2018, the Fund had a qualified late-year ordinary loss deferral of $254,948. |
| 64 | AB FLEXFEE INTERNATIONAL BOND PORTFOLIO | abfunds.com | |
NOTES TO FINANCIAL STATEMENTS(continued)
| (c) | The differences between book-basis and tax-basis unrealized appreciation/(depreciation) are attributable primarily to the tax deferral of losses on wash sales, the tax treatment of swaps, and the recognition for tax purposes of unrealized gains/losses on certain derivative instruments. |
| (d) | The difference between book-basis and tax-basis components of accumulated earnings/(deficit) is attributable primarily to the accrual of foreign capital gains tax. |
For tax purposes, net realized capital losses may be carried over to offset future capital gains, if any. Funds are permitted to carry forward capital losses for an indefinite period, and such losses will retain their character as either short-term or long-term capital losses. As of December 31, 2018, the Fund did not have any capital loss carryforwards.
During the current fiscal year, permanent differences primarily due to the tax treatment of offering costs resulted in a net decrease in accumulated loss and a net decrease in additional paid-in capital. These reclassifications had no effect on net assets.
NOTE G
Recent Accounting Pronouncements
In March 2017, the Financial Accounting Standards Board issued an Accounting Standards Update, ASU2017-08, Receivables – Nonrefundable Fees and Other Costs (Subtopic310-20), Premium Amortization on Purchased Callable Debt Securities (the “ASU”) which amends the amortization period for certain purchased callable debt securities held at a premium, shortening such period to the earliest call date. The ASU does not require any accounting change for debt securities held at a discount; the discount continues to be amortized to maturity. The ASU is effective for fiscal years, and interim periods within those fiscal years, beginning after December 15, 2018. At this time, management is evaluating the implications of these changes on the financial statements.
In August 2018, the Financial Accounting Standards Board issued an Accounting Standards Update, ASU2018-13, Fair Value Measurement (Topic 820), Disclosure Framework-Changes to the Disclosure Requirements for Fair Value Measurement which removes, modifies and adds disclosures to Topic 820. The amendments in this ASU2018-13 apply to all entities that are required, under existing U.S. GAAP, to make disclosures about recurring or nonrecurring fair value measurements. The amendments in this ASU2018-13 are effective for all entities for fiscal years, and interim periods within those fiscal years, beginning after December 15, 2019. At this time, management is evaluating the implications of these changes on the financial statements.
In October 2018, the U.S. Securities and Exchange Commission adopted amendments to certain disclosure requirements that had become “redundant, duplicative, overlapping, outdated or superseded, in light of the
| abfunds.com | AB FLEXFEE INTERNATIONAL BOND PORTFOLIO | 65 | |
NOTES TO FINANCIAL STATEMENTS(continued)
other Commission disclosure requirements, GAAP or changes in the information environment.” The compliance date for the amendments to RegulationS-X was November 5, 2018 (for reporting period end dates of September 30, 2018 or after). Management has adopted the amendments which simplified certain disclosure requirements on the financial statements.
NOTE H
Subsequent Events
Management has evaluated subsequent events for possible recognition or disclosure in the financial statements through the date the financial statements are issued. Management has determined that there are no material events that would require disclosure in the Fund’s financial statements through this date.
| 66 | AB FLEXFEE INTERNATIONAL BOND PORTFOLIO | abfunds.com | |
FINANCIAL HIGHLIGHTS
Selected Data For A Share Of Capital Stock Outstanding Throughout Each Period
| Advisor Class | ||||||||
| Year Ended December 31, 2018 | June 28, 2017(a) to December 31, 2017 | |||||||
|
|
|
| |||||
Net asset value, beginning of period | $ 9.97 | $ 10.00 | ||||||
|
| |||||||
Income From Investment Operations | ||||||||
Net investment income(b)(c) | .18 | .10 | ||||||
Net realized and unrealized gain on investment and foreign currency transactions | .03 | .00 | (d) | |||||
|
| |||||||
Net increase in net asset value from operations | .21 | .10 | ||||||
|
| |||||||
Less: Dividends and Distributions | ||||||||
Dividends from net investment income | (.48 | ) | (.13 | ) | ||||
Distributions from net realized gain on investment and foreign currency transactions | (.02 | ) | – 0 | – | ||||
Return of capital | (.02 | ) | – 0 | – | ||||
|
| |||||||
Total dividends and distributions | (.52 | ) | (.13 | ) | ||||
|
| |||||||
Net asset value, end of period | $ 9.66 | $ 9.97 | ||||||
|
| |||||||
Total Return | ||||||||
Total investment return based on net asset value(e) | 2.16 | % | 1.05 | % | ||||
Ratios/Supplemental Data | ||||||||
Net assets, end of period (000’s omitted) | $45,943 | $44,881 | ||||||
Ratio to average net assets of: | ||||||||
Expenses, net of waivers/reimbursements(f)† | .20 | %(g) | .19 | %(h) | ||||
Expenses, before waivers/reimbursements(f)† | 1.21 | %(g) | 2.39 | %(h) | ||||
Net investment income(c) | 1.85 | % | 1.95 | %(h) | ||||
Portfolio turnover rate | 85 | % | 30 | % | ||||
† Expense ratios exclude the estimated acquired fund fees of affiliated/unaffiliated underlying |
| |||||||
portfolios | .00 | % | .01 | % | ||||
| (a) | Commencement of operations. |
| (b) | Based on average shares outstanding. |
| (c) | Net of expenses waived/reimbursed by the Adviser. |
| (d) | Amount is less than $0.005. |
| (e) | Total investment return is calculated assuming an initial investment made at the net asset value at the beginning of the period, reinvestment of all dividends and distributions at net asset value during the period, and redemption on the last day of the period. Total investment return does not reflect the deduction of taxes that a shareholder would pay on fund distributions or the redemption of fund shares. Total investment return for a period of less than one year is not annualized. |
| (f) | In connection with the Fund’s investments in affiliated underlying portfolios, the Fund incurs no direct expenses but bears proportionate shares of the fund fees and expenses (i.e. operating, administrative and investment advisory fees) of the affiliated underlying portfolios. The Adviser has contractually agreed to waive its fees from the Fund in an amount equal to the Fund’s pro rata share of certain acquired fund fees and expenses, and for the year ended December 31, 2018 and for the period ended December 31, 2017, such waiver amounted to less than 0.005% and 0.01% (annualized), respectively. |
| (g) | The advisory fee reflected in the Fund’s expense ratio may be higher or lower than the Base Fee plus Performance Adjustment due to the different time periods over which the fee is calculated (i.e., the financial reporting period vs. the Performance Period). |
| (h) | Annualized. |
See notes to financial statements.
| abfunds.com | AB FLEXFEE INTERNATIONAL BOND PORTFOLIO | 67 | |
REPORT OF INDEPENDENT REGISTERED
PUBLIC ACCOUNTING FIRM
To the Shareholders and the Board of Directors of
AB FlexFee International Bond Portfolio:
Opinion on the Financial Statements:
We have audited the accompanying statement of assets and liabilities of AB FlexFee International Bond Portfolio (the “Fund”) (one of the portfolios constituting AB Bond Fund, Inc. (the “Company”)), including the portfolio of investments, as of December 31, 2018, and the related statement of operations for the year then ended and the statements of changes in net assets and the financial highlights for the year then ended and the period June 28, 2017 (commencement of operations) to December 31, 2017 and the related notes (collectively referred to as the “financial statements”). In our opinion, the financial statements present fairly, in all material respects, the financial position of the Fund (one of the portfolios constituting AB Bond Fund, Inc.) at December 31, 2018, the results of its operations for the year then ended and the changes in its net assets and its financial highlights for the year then ended and the period June 28, 2017 (commencement of operations) to December 31, 2017, in conformity with U.S. generally accepted accounting principles.
Basis for Opinion
These financial statements are the responsibility of the Company’s management. Our responsibility is to express an opinion on the Fund’s financial statements based on our audits. We are a public accounting firm registered with the Public Company Accounting Oversight Board (United States) (“PCAOB”) and are required to be independent with respect to the Company in accordance with the U.S. federal securities laws and the applicable rules and regulations of the Securities and Exchange Commission and the PCAOB.
We conducted our audits in accordance with the standards of the PCAOB. Those standards require that we plan and perform the audit to obtain reasonable assurance about whether the financial statements are free of material misstatement, whether due to error or fraud. The Company is not required to have, nor were we engaged to perform, an audit of the Company’s internal control over financial reporting. As part of our audits, we are required to obtain an understanding of internal control over financial reporting, but not for the purpose of expressing an opinion on the effectiveness of the Company’s internal control over financial reporting. Accordingly, we express no such opinion.
Our audits included performing procedures to assess the risks of material misstatement of the financial statements, whether due to error or fraud, and performing procedures that respond to those risks. Such procedures included examining, on a test basis, evidence regarding the amounts and disclosures in the financial statements. Our procedures included confirmation of securities owned as of December 31, 2018, by correspondence with the custodian and others or by other appropriate auditing procedures where replies from others were not received. Our audits also included evaluating the accounting principles used and significant estimates made by management, as well as evaluating the overall presentation of the financial statements. We believe that our audits provide a reasonable basis for our opinion.

We have served as the auditor of one or more of the AB investment companies since 1968.
New York, New York
February 26, 2019
| 68 | AB FLEXFEE INTERNATIONAL BOND PORTFOLIO | abfunds.com | |
2018 FEDERAL TAX INFORMATION
(unaudited)
For Federal income tax purposes, the following information is furnished with respect to the distributions paid by the Fund for the calendar year ended December 31, 2018. For foreign shareholders, 25.74% of ordinary dividends paid may be considered to be qualifying to be taxed as interest-related dividends.
| abfunds.com | AB FLEXFEE INTERNATIONAL BOND PORTFOLIO | 69 | |
RESULTS OF SHAREHOLDERS MEETING
(unaudited)
A Special Meeting of Shareholders of AB Bond Fund, Inc. (the “Company”)—AB FlexFee International Bond Portfolio (the “Fund”) was held on October 11, 2018. A description of each proposal and number of shares voted at the Meeting are as follows (the proposal numbers shown below correspond to the proposal numbers in the Fund’s proxy statement):
| 1: | To approve and vote upon the election of the Directors of the Company, each such Director to serve a term of indefinite duration and until his or her successor is duly elected and qualifies: |
Director: | Voted For | Withheld Authority | ||||||
Michael J. Downey | 568,159,897 | 6,636,404 | ||||||
William H. Foulk, Jr.* | 567,840,093 | 6,956,208 | ||||||
Nancy P. Jacklin | 568,944,215 | 5,852,087 | ||||||
Robert M. Keith | 569,042,667 | 5,753,635 | ||||||
Carol C. McMullen | 569,162,511 | 5,633,791 | ||||||
Garry L. Moody | 568,383,443 | 6,412,859 | ||||||
Marshall C. Turner, Jr. | 568,160,864 | 6,635,437 | ||||||
Earl D. Weiner | 567,806,291 | 6,990,010 | ||||||
| 2: | To vote upon the approval of the new advisory agreement for the Fund with AllianceBernstein L.P. |
| Voted For | Voted Against | Abstained | Broker- Non Votes | |||||||||||
| 4,545,116 | – 0 | – | – 0 | – | – 0 | – | ||||||||
| * | Mr. Foulk retired on December 31, 2018. |
| 70 | AB FLEXFEE INTERNATIONAL BOND PORTFOLIO | abfunds.com | |
BOARD OF DIRECTORS
Marshall C. Turner, Jr(1), Chairman Michael J. Downey(1) Nancy P. Jacklin(1) | Robert M. Keith,President and Chief Executive Officer Carol C. McMullen(1) Garry L. Moody(1) Earl D. Weiner(1) |
OFFICERS Paul J. DeNoon(2),Vice President Scott A. DiMaggio(2),Vice President Douglas J. Peebles(2),Vice President Matthew S. Sheridan(2), Vice President | Emilie D. Wrapp,Secretary Michael B. Reyes,Senior Analyst Joseph J. Mantineo,Treasurer and Chief Financial Officer Phyllis J. Clarke,Controller Vincent S. Noto,Chief Compliance Officer |
Custodian and Accounting Agent Brown Brothers Harriman & Co. 50 Post Office Square Boston, MA 02110
| Independent Registered Public Accounting Firm Ernst & Young LLP 5 Times Square New York, NY 10036
| |
Principal Underwriter AllianceBernstein Investments, Inc. 1345 Avenue of the Americas New York, NY 10105
| Legal Counsel Seward & Kissel LLP One Battery Park Plaza New York, NY 10004
| |
Transfer Agent AllianceBernstein Investor Services, Inc. P.O. Box 786003 San Antonio, TX 78278-6003 Toll-Free (800)221-6003 |
| 1 | Member of the Audit Committee, the Governance and Nominating Committee and the Independent Directors Committee. |
| 2 | Theday-to-day management of, and investment decisions for, the portfolio is made by the Adviser. Messrs. DeNoon, DiMaggio, Peebles and Sheridan are the investment professionals with the most significant responsibility for theday-to-day management of the Fund’s portfolio. |
| abfunds.com | AB FLEXFEE INTERNATIONAL BOND PORTFOLIO | 71 | |
MANAGEMENT OF THE FUND
Board of Directors Information
The business and affairs of the Fund are managed under the direction of the Board of Directors. Certain information concerning the Fund’s Directors is set forth below.
| NAME, ADDRESS*, AGE, (YEAR FIRST ELECTED**) | PRINCIPAL OCCUPATION(S) DURING PAST FIVE YEARS AND OTHER INFORMATION*** | PORTFOLIOS COMPLEX | OTHER PUBLIC COMPANY DIRECTORSHIPS CURRENTLY HELD BY DIRECTOR | |||||
| INTERESTED DIRECTOR | ||||||||
Robert M. Keith,# 1345 Avenue of the Americas New York, NY 10105 58 (2015) | Senior Vice President of AllianceBernstein L.P. (the “Adviser”) and the head of AllianceBernstein Investments, Inc. (“ABI”) since July 2008; Director of ABI and President of the AB Mutual Funds. Previously, he served as Executive Managing Director of ABI from December 2006 to June 2008. Prior to joining ABI in 2006, Executive Managing Director of Bernstein Global Wealth Management, and prior thereto, Senior Managing Director and Global Head of Client Service and Sales of the Adviser’s institutional investment management business since 2004. Prior thereto, he was Managing Director and Head of North American Client Service and Sales in the Adviser’s institutional investment management business, with which he had been associated since prior to 2004. | 95 | None | |||||
| 72 | AB FLEXFEE INTERNATIONAL BOND PORTFOLIO | abfunds.com | |
MANAGEMENT OF THE FUND(continued)
| NAME, ADDRESS*, AGE, (YEAR FIRST ELECTED**) | PRINCIPAL OCCUPATION(S) DURING PAST FIVE YEARS AND OTHER INFORMATION*** | PORTFOLIOS COMPLEX | OTHER PUBLIC COMPANY DIRECTORSHIPS CURRENTLY HELD BY DIRECTOR | |||||
| DISINTERESTED DIRECTORS | ||||||||
Marshall C. Turner, Jr.,## Chairman of the Board 77 (2015) | Private Investor since prior to 2014. Former Chairman and CEO of Dupont Photomasks, Inc. (components of semi-conductor manufacturing). He has extensive operating leadership, and venture capital investing experience, including five interim or full-time CEO roles, and prior service as general partner of institutional venture capital partnerships. He also has extensive non-profit board leadership experience, and currently serves on the boards of two education and science-related non-profit organizations. He has served as a director of one AB Fund since 1992, and director or trustee of multiple AB funds since 2005. He has been Chairman of the AB Funds since January 2014, and the Chairman of the Independent Directors Committees of such AB Funds since February 2014. | 95 | Xilinx, Inc. (programmable logicsemi-conductors) since 2007 | |||||
Michael J. Downey,## 75 (2015) | Private Investor since prior to 2014. Formerly, managing partner of Lexington Capital, LLC (investment advisory firm) from December 1997 until December 2003. He also served as a Director of Prospect Acquisition Corp. (financial services) from 2007 until 2009. From 1987 until 1993, Chairman and CEO of Prudential Mutual Fund Management, director of the Prudential mutual funds, and member of the Executive Committee of Prudential Securities Inc. He has served as a director or trustee of the AB Funds since 2005 and is a director and Chairman of one other registered investment company. | 95 | The Asia Pacific Fund, Inc. (registered investment company) since prior to 2014 | |||||
| abfunds.com | AB FLEXFEE INTERNATIONAL BOND PORTFOLIO | 73 | |
MANAGEMENT OF THE FUND(continued)
| NAME, ADDRESS*, AGE, (YEAR FIRST ELECTED**) | PRINCIPAL OCCUPATION(S) DURING PAST FIVE YEARS AND OTHER INFORMATION*** | PORTFOLIOS IN AB FUND COMPLEX OVERSEEN BY DIRECTOR | OTHER PUBLIC COMPANY DIRECTORSHIPS CURRENTLY HELD BY DIRECTOR | |||||
| DISINTERESTED DIRECTORS (continued) | ||||||||
Nancy P. Jacklin,## 70 (2015) | Private Investor since prior to 2014. Professorial Lecturer at the Johns Hopkins School of Advanced International Studies (2008-2015). U.S. Executive Director of the International Monetary Fund (which is responsible for ensuring the stability of the international monetary system), (December 2002-May 2006); Partner, Clifford Chance (1992-2002); Sector Counsel, International Banking and Finance, and Associate General Counsel, Citicorp (1985-1992); Assistant General Counsel (International), Federal Reserve Board of Governors (1982-1985); and Attorney Advisor, U.S. Department of the Treasury (1973-1982). Member of the Bar of the District of Columbia and of New York; and member of the Council on Foreign Relations. She has served as a director or trustee of the AB Funds since 2006 and has been Chair of the Governance and Nominating Committees of the AB Funds since August 2014. | 95 | None | |||||
| 74 | AB FLEXFEE INTERNATIONAL BOND PORTFOLIO | abfunds.com | |
MANAGEMENT OF THE FUND(continued)
| NAME, ADDRESS*, AGE, (YEAR FIRST ELECTED**) | PRINCIPAL OCCUPATION(S) DURING PAST FIVE YEARS AND OTHER INFORMATION*** | PORTFOLIOS IN AB FUND COMPLEX OVERSEEN BY DIRECTOR | OTHER PUBLIC COMPANY DIRECTORSHIPS CURRENTLY HELD BY DIRECTOR | |||||
| DISINTERESTED DIRECTORS (continued) | ||||||||
Carol C. McMullen,## 63 (2016) | Managing Director of Slalom Consulting (consulting) since 2014 and private investor and member of the Partners Healthcare Investment Committee. Formerly, Director of Norfolk & Dedham Group (mutual property and casualty insurance) from 2011 until November 2016; Director of Partners Community Physicians Organization (healthcare) from 2014 until December 2016; and Managing Director of The Crossland Group (consulting) from 2012 until 2013. She has held a number of senior positions in the asset and wealth management industries, including at Eastern Bank (where her roles included President of Eastern Wealth Management), Thomson Financial (Global Head of Sales for Investment Management), and Putnam Investments (where her roles included Head of Global Investment Research). She has served on a number of private company and non-profit boards, and as a director or trustee of the AB Funds since June 2016. | 95 | None | |||||
| abfunds.com | AB FLEXFEE INTERNATIONAL BOND PORTFOLIO | 75 | |
MANAGEMENT OF THE FUND(continued)
| NAME, ADDRESS*, AGE, (YEAR FIRST ELECTED**) | PRINCIPAL OCCUPATION(S) DURING PAST FIVE YEARS AND OTHER INFORMATION*** | PORTFOLIOS IN AB FUND COMPLEX OVERSEEN BY DIRECTOR | OTHER PUBLIC COMPANY DIRECTORSHIPS CURRENTLY HELD BY DIRECTOR | |||||
| DISINTERESTED DIRECTORS (continued) | ||||||||
Garry L. Moody,## 66 (2015) | Independent Consultant. Formerly, Partner, Deloitte & Touche LLP (1995-2008) where he held a number of senior positions, including Vice Chairman, and U.S. and Global Investment Management Practice Managing Partner; President, Fidelity Accounting and Custody Services Company (1993-1995), where he was responsible for the accounting, pricing, custody and reporting for the Fidelity mutual funds; and Partner, Ernst & Young LLP (1975-1993), where he served as the National Director of Mutual Fund Tax Services and Managing Partner of its Chicago Office Tax department. He is a member of the Trustee Advisory Board of BoardIQ, a biweekly publication focused on issues and news affecting directors of mutual funds. He has served as a director or trustee and as Chairman of the Audit Committees of the AB Funds since 2008. | 95 | None | |||||
Earl D. Weiner,## 79 (2015) | Of Counsel, and Partner prior to January 2007, of the law firm Sullivan & Cromwell LLP and is a former member of the ABA Federal Regulation of Securities Committee Task Force to draft editions of the Fund Director’s Guidebook. He also serves as a director or trustee of various non-profit organizations and has served as Chairman or Vice Chairman of a number of them. He has served as a director or trustee of the AB Funds since 2007 and served as Chairman of the Governance and Nominating Committees of the AB Funds from 2007 until August 2014. | 95 | None | |||||
| 76 | AB FLEXFEE INTERNATIONAL BOND PORTFOLIO | abfunds.com | |
MANAGEMENT OF THE FUND(continued)
| * | The address for each of the Fund’s disinterested Directors is c/o AllianceBernstein L.P., Attention: Legal & Compliance Department – Mutual Fund Legal, 1345 Avenue of the Americas, New York, NY 10105. |
| ** | There is no stated term of office for the Fund’s Directors. |
| *** | The information above includes each Director’s principal occupation during the last five years and other information relating to the experience, attributes and skills relevant to each Director’s qualifications to serve as a Director, which led to the conclusion that each Director should serve as a Director for the Fund. |
| # | Mr. Keith is an “interested person” of the Fund, as defined in the 1940 Act, due to his position as a Senior Vice President of the Adviser. |
| ## | Member of the Audit Committee, the Governance and Nominating Committee and the Independent Directors Committee. |
| abfunds.com | AB FLEXFEE INTERNATIONAL BOND PORTFOLIO | 77 | |
MANAGEMENT OF THE FUND(continued)
Officer Information
Robert M. Keith, 58 | President and Chief Executive Officer | See biography above. | ||
Paul J. DeNoon, 56 | Vice President | Senior Vice President of the Adviser**, with which he has been associated since prior to 2014. He is also Director of Income Strategies. | ||
Scott A. DiMaggio, 47 | Vice President | Senior Vice President of the Adviser**, with which he has been associated since prior to 2014. He is also Director of Global Fixed Income and Canada Fixed Income. | ||
Douglas J. Peebles, 53 | Vice President | Senior Vice President of the Adviser**, with which he has been associated since prior to 2014. He is also Chief investment Officer of AB Fixed Income. | ||
Matthew Sheridan 43 | Vice President | Senior Vice President of the Adviser**, with which he has been associated since prior to 2014. | ||
Emilie D. Wrapp, 63 | Secretary | Senior Vice President, Assistant General Counsel and Assistant Secretary of ABI**, with which she has been associated since prior to 2014. | ||
Michael B. Reyes 42 | Senior Analyst | Vice President of the Adviser**, with which he has been associated since prior to 2014. | ||
Joseph J. Mantineo, 59 | Treasurer and Chief Financial Officer | Senior Vice President of AllianceBernstein Investor Services (“ABIS”)**, with which he has been associated since prior to 2014. | ||
Phyllis J. Clarke, 58 | Controller | Vice President of ABIS**, with which she has been associated since prior to 2014. | ||
Vince S. Noto, 54 | Chief Compliance Officer | Senior Vice President since 2015 and Mutual Fund Chief Compliance Officer of the Adviser** since 2014. Prior thereto, he was Vice President and Director of Mutual Fund Compliance of the Adviser** since 2012. |
| * | The address for each of the Fund’s Officers is 1345 Avenue of the Americas, New York, NY 10105. |
| ** | The Adviser, ABI and ABIS are affiliates of the Fund. |
The Fund’s Statement of Additional Information (“SAI”) has additional information about the Fund’s Directors and Officers and is available without charge upon request. Contact your financial representative or AB at(800) 227-4618, or visit www.abfunds.com, for a free prospectus or SAI.
| 78 | AB FLEXFEE INTERNATIONAL BOND PORTFOLIO | abfunds.com | |
Information Regarding the Review and Approval of the Fund’s Proposed New Advisory Agreement and Interim Advisory Agreement in the Context of Potential Assignments
As described in more detail in the Proxy Statement for the AB Funds dated August 20, 2018, the Boards of the AB Funds, at a meeting held onJuly 31-August 2, 2018, approved new advisory agreements with the Adviser (the “Proposed Agreements”) for the AB Funds, including AB Bond Fund, Inc. in respect of AB FlexFeeTM International Bond Portfolio (the “Fund”), in connection with the planned disposition by AXA S.A. of its remaining shares of AXA Equitable Holdings, Inc. (the indirect holder of a majority of the partnership interests in the Adviser and the indirect parent of AllianceBernstein Corporation, the general partner of the Adviser) in one or more transactions and the related potential for one or more “assignments” (within the meaning of section 2(a)(4) of the Investment Company Act) of the advisory agreements for the AB Funds, including the Fund’s Advisory Agreement, resulting in the automatic termination of such advisory agreements.
At the same meeting, the AB Boards also considered and approved interim advisory agreements with the Adviser (the “Interim Advisory Agreements”) for the AB Funds, including the Fund, to be effective only in the event that stockholder approval of a Proposed Agreement had not been obtained as of the date of one or more transactions resulting in an “assignment” of the Adviser’s advisory agreements, resulting in the automatic termination of such advisory agreements.
The shareholders of the Fund subsequently approved the Proposed Agreements at an annual meeting of shareholders called for the purpose of electing Directors and voting on the Proposed Agreements.
A discussion regarding the basis for the Boards’ approvals at the meeting held onJuly 31-August 2, 2018 is set forth below.
At a meeting of the AB Boards held on July31-August 2, 2018, the Adviser presented its recommendation that the Boards consider and approve the Proposed Agreements. Section 15(c) of the 1940 Act provides that, after an initial period, a Fund’s Current Agreement and currentsub-advisory agreement, as applicable, will remain in effect only if the Board, including a majority of the Independent Directors, annually reviews and approves them. Each of the Current Agreements had been approved by a Board within theone-year period prior to approval of its related Proposed Agreement, except that the Current Agreements for certain FlexFee funds were approved in February 2017. In connection with their approval of the Proposed Agreements, the Boards considered their conclusions in connection with their most recent approvals of the Current Agreements, in particular in cases where the last approval of a Current Agreement was relatively recent, including the Boards’ general satisfaction with the nature and quality of services being provided and, as applicable, in the case of
| abfunds.com | AB FLEXFEE INTERNATIONAL BOND PORTFOLIO | 79 | |
certain Funds, actions taken or to be taken in an effort to improve investment performance or reduce expense ratios. The Directors also reviewed updated information provided by the Adviser in respect of each Fund. Also in connection with their approval of the Proposed Agreements, the Boards considered a representation made to them at that time by the Adviser that there were no additional developments not already disclosed to the Boards since their most recent approvals of the Current Agreements that would be a material consideration to the Boards in connection with their consideration of the Proposed Agreements, except for matters disclosed to the Boards by the Adviser. The Directors considered the fact that each Proposed Agreement would have corresponding terms and conditions identical to those of the corresponding Current Agreement with the exception of the effective date and initial term under the Proposed Agreement.
The Directors considered their knowledge of the nature and quality of the services provided by the Adviser to each Fund gained from their experience as directors or trustees of registered investment companies advised by the Adviser, their overall confidence in the Adviser’s integrity and competence they have gained from that experience, the Adviser’s initiative in identifying and raising potential issues with the Directors and its responsiveness, frankness and attention to concerns raised by the Directors in the past, including the Adviser’s willingness to consider and implement organizational and operational changes designed to improve investment results and the services provided to the Funds. The Directors noted that they have four regular meetings each year, at each of which they review extensive materials and information from the Adviser, including information on the investment performance of each Fund.
The Directors also considered all factors they believed relevant, including the specific matters discussed below. During the course of their deliberations, the Directors evaluated, among other things, the reasonableness of the management fees of the Funds they oversee. The Directors did not identify any particular information that wasall-important or controlling, and different Directors may have attributed different weights to the various factors. The Directors determined that the selection of the Adviser to manage the Funds, and the overall arrangements between the Funds and the Adviser, as provided in the Proposed Agreements, including the management fees, were fair and reasonable in light of the services performed under the Current Agreements and to be performed under the Proposed Agreements, expenses incurred and to be incurred and such other matters as the Directors considered relevant in the exercise of their business judgment. The material factors and conclusions that formed the basis for the Directors’ determinations included the following:
Nature, Extent and Quality of Services Provided
The Directors considered the scope and quality of services to be provided by the Adviser under the Proposed Agreements, including the quality of
| 80 | AB FLEXFEE INTERNATIONAL BOND PORTFOLIO | abfunds.com | |
the investment research capabilities of the Adviser and the other resources it has dedicated to performing services for the Funds. They also considered the information that had been provided to them by the Adviser concerning the anticipated implementation of the Plan and the Adviser’s representation that it did not anticipate that such implementation would affect the management or structure of the Adviser, have a material adverse effect on the Adviser, or adversely affect the quality of the services provided to the Funds by the Adviser and its affiliates. The Directors noted that the Adviser from time to time reviews each Fund’s investment strategies and from time to time proposes changes intended to improve the Fund’s relative or absolute performance for the Directors’ consideration. They also noted the professional experience and qualifications of each Fund’s portfolio management team and other senior personnel of the Adviser. The Directors also considered that certain Proposed Agreements, similar to the corresponding Current Agreements, provide that the Funds will reimburse the Adviser for the cost to it of providing certain clerical, accounting, administrative and other services to the Funds by employees of the Adviser or its affiliates. Requests for these reimbursements are made on a quarterly basis and subject to approval by the Directors. The Directors noted that the Adviser did not request any reimbursements from certain Funds in the Fund’s latest fiscal year reviewed. The Directors noted that the methodology to be used to determine the reimbursement amounts had been reviewed by an independent consultant retained by the Funds’ former Senior Officer/Independent Compliance Officer. The quality of administrative and other services, including the Adviser’s role in coordinating the activities of the Funds’ other service providers, also was considered. The Directors of each Fund concluded that, overall, they were satisfied with the nature, extent and quality of services to be provided to the Funds under the Proposed Agreement for the Fund.
Costs of Services to be Provided and Profitability
The Directors reviewed a schedule of the revenues and expenses and related notes indicating the profitability of each Fund to the Adviser for calendar years 2016 and 2017, as applicable, that had been prepared with an expense allocation methodology arrived at in consultation with an independent consultant retained by the Funds’ former Senior Officer/Independent Compliance Officer. The Directors noted the assumptions and methods of allocation used by the Adviser in preparing fund-specific profitability data and understood that there are a number of potentially acceptable allocation methodologies for information of this type. The Directors noted that the profitability information reflected all revenues and expenses of the Adviser’s relationship with a Fund, including those relating to its subsidiaries that provide transfer agency, distribution and brokerage services to the Fund, as applicable. The Directors recognized that it is difficult to make comparisons of the profitability of the Proposed Agreements with the profitability of fund advisory contracts for unaffiliated funds because comparative information is not generally publicly available and is
| abfunds.com | AB FLEXFEE INTERNATIONAL BOND PORTFOLIO | 81 | |
affected by numerous factors. The Directors focused on the profitability of the Adviser’s relationship with each Fund before taxes and distribution expenses, as applicable. The Directors noted that certain Funds were not profitable to the Adviser in one or more periods reviewed. The Directors concluded that the Adviser’s level of profitability from its relationship with the other Funds was not unreasonable. The Directors were unable to consider historical information about the profitability of certain Funds that had recently commenced operations and for which historical profitability information was not available. The Adviser agreed to provide the Directors with profitability information in connection with future proposed continuances of the Proposed Agreements.
Fall-Out Benefits
The Directors considered the other benefits to the Adviser and its affiliates from their relationships with the Funds, including, but not limited to, as applicable, benefits relating to soft dollar arrangements (whereby investment advisers receive brokerage and research services from brokers that execute agency transactions for their clients) in the case of certain Funds;12b-1 fees and sales charges received by the principal underwriter (which is a wholly owned subsidiary of the Adviser) in respect of certain classes of the shares of most of the Funds; brokerage commissions paid by certain Funds to brokers affiliated with the Adviser; and transfer agency fees paid by most of the Funds to a wholly owned subsidiary of the Adviser. The Directors recognized that the Adviser’s profitability would be somewhat lower, and that a Fund’s unprofitability to the Adviser would be exacerbated, without these benefits. The Directors understood that the Adviser also might derive reputational and other benefits from its association with the Funds.
Investment Results
In addition to the information reviewed by the Directors in connection with the Board meeting at which the Proposed Agreements were approved, the Directors receive detailed performance information for the Funds at each regular Board meeting during the year.
The Boards’ consideration of each Proposed Agreement was informed by their most recent approval of the related Current Agreement, and, in the case of certain Funds, their discussion with the Adviser of the reasons for those Funds’ underperformance in certain periods. The Directors also reviewed updated performance information and, in some cases, discussed with the Adviser the reasons for changes in performance or continued underperformance. On the basis of this review, the Directors concluded that each Fund’s investment performance was acceptable.
Management Fees and Other Expenses
The Directors considered the management fee rate payable by each Fund to the Adviser and information prepared by an independent service provider
| 82 | AB FLEXFEE INTERNATIONAL BOND PORTFOLIO | abfunds.com | |
(the “15(c) provider”) concerning management fee rates payable by other funds in the same category as the Fund. The Directors recognized that it is difficult to make comparisons of management fees because there are variations in the services that are included in the fees paid by other funds. The Directors compared each Fund’s contractual management fee rate with a peer group median, and where applicable, took into account the impact on the management fee rate of the administrative expense reimbursement paid to the Adviser in the latest fiscal year. In the case of the ACS Funds, the Directors noted that the management fee rate is zero but also were cognizant that the Adviser is indirectly compensated by the wrap fee program sponsors that use the ACS Funds as an investment vehicle for their clients.
The Directors also considered the Adviser’s fee schedule for other clients pursuing a similar investment style to each Fund. For this purpose, they reviewed the relevant advisory fee information from the Adviser’s Form ADV and in a report from the Funds’ Senior Analyst and noted the differences between a Fund’s fee schedule, on the one hand, and the Adviser’s institutional fee schedule and the schedule of fees charged by the Adviser to any offshore funds and for services to anysub-advised funds pursuing a similar investment strategy as the Fund, on the other, as applicable. The Directors noted that the Adviser may, in some cases, agree to fee rates with large institutional clients that are lower than those reviewed by the Directors and that they had previously discussed with the Adviser its policies in respect of such arrangements. The Adviser also informed the Directors that, in the case of certain Funds, there were no institutional products managed by the Adviser that have a substantially similar investment style. The Directors also discussed these matters with their independent fee consultant.
The Adviser reviewed with the Directors the significantly greater scope of the services it provides to each Fund relative to institutional, offshore fund andsub-advised fund clients, as applicable. In this regard, the Adviser noted, among other things, that, compared to institutional and offshore orsub-advisory accounts, each Fund, as applicable, (i) demands considerably more portfolio management, research and trading resources due to significantly higher daily cash flows (in the case ofopen-end Funds); (ii) has more tax and regulatory restrictions and compliance obligations; (iii) must prepare and file or distribute regulatory and other communications about fund operations; and (iv) must provide shareholder servicing to retail investors. The Adviser also reviewed the greater legal risks presented by the large and changing population of Fund shareholders who may assert claims against the Adviser in individual or class actions, and the greater entrepreneurial risk in offering new fund products, which require substantial investment to launch, may not succeed, and generally must be priced to compete with larger, more established funds resulting in lack of profitability to the Adviser until a new fund achieves scale. In light of the substantial differences in services rendered by the Adviser to institutional, offshore fund andsub-advised fund clients as compared to the Funds, and
| abfunds.com | AB FLEXFEE INTERNATIONAL BOND PORTFOLIO | 83 | |
the different risk profile, the Directors considered these fee comparisons inapt and did not place significant weight on them in their deliberations.
The Directors noted that many of the Funds may invest in shares of exchange-traded funds (“ETFs”), subject to the restrictions and limitations of the 1940 Act as these may be varied as a result of exemptive orders issued by the SEC. The Directors also noted that ETFs pay advisory fees pursuant to their advisory contracts. The Directors concluded, based on the Adviser’s explanation of how it uses ETFs when they are the most cost-effective way to obtain desired exposures, in some cases pending purchases of underlying securities, that each Fund’s management fee would be for services that would be in addition to, rather than duplicative of, the services provided under the advisory contracts of the ETFs.
With respect to each Fund’s management fee, the Directors considered the total expense ratio of the Fund in comparison to a peer group and peer universe selected by the 15(c) service provider. The Directors also considered the Adviser’s expense caps for certain Funds. The Directors view expense ratio information as relevant to their evaluation of the Adviser’s services because the Adviser is responsible for coordinating services provided to a Fund by others.
The Boards’ consideration of each Proposed Agreement was informed by their most recent approval of the related Current Agreement, and, in the case of certain Funds, their discussion with the Adviser of the reasons for those Funds’ expense ratios in certain periods. The Directors also reviewed updated expense ratio information and, in some cases, discussed with the Adviser the reasons for the expense ratios of certain Funds. On the basis of this review, the Directors concluded that each Fund’s expense ratio was acceptable.
The Directors did not consider comparative expense information for the ACS Funds because those Funds do not bear ordinary expenses.
Economies of Scale
The Directors noted that the management fee schedules for certain Funds do not contain breakpoints and that they had discussed their strong preference for breakpoints in advisory contracts with the Adviser. The Directors took into consideration prior presentations by an independent consultant on economies of scale in the mutual fund industry and for the Funds, and by the Adviser concerning certain of its views on economies of scale. The Directors also had requested and received from the Adviser certain updates on economies of scale in advance of the Board meeting. The Directors believe that economies of scale may be realized (if at all) by the Adviser across a variety of products and services, and not only in respect of a single fund. The Directors noted that there is no established methodology for setting breakpoints that give effect to the fund-specific services provided by a fund’s adviser and to the economies of scale that
| 84 | AB FLEXFEE INTERNATIONAL BOND PORTFOLIO | abfunds.com | |
an adviser may realize in its overall mutual fund business or those components of it which directly or indirectly affect a fund’s operations. The Directors observed that in the mutual fund industry as a whole, as well as among funds similar to each Fund, there is no uniformity or pattern in the fees and asset levels at which breakpoints (if any) apply. The Directors also noted that the advisory agreements for many funds do not have breakpoints at all. The Directors informed the Adviser that they would monitor the asset levels of the Funds without breakpoints and their profitability to the Adviser and anticipated revisiting the question of breakpoints in the future if circumstances warrant doing so.
The Directors did not consider the extent to which fee levels in the Advisory Agreement for the ACS Funds reflect economies of scale because that Advisory Agreement does not provide for any compensation to be paid to the Adviser by the ACS Funds and the expense ratio of each of those Funds is zero.
Interim Advisory Agreements
In approving the Interim Advisory Agreements, the Boards, with the assistance of independent counsel, considered similar factors to those considered in approving the Proposed Agreements. The Interim Advisory Agreements approved by the Boards are identical to the Proposed Agreements, as well as the Current Agreements, in all material respects except for their proposed effective and termination dates and provisions intended to comply with the requirements of the relevant SEC rule, such as provisions requiring escrow of advisory fees. Under the Interim Advisory Agreements, the Adviser would continue to manage a Fund pursuant to an Interim Advisory Agreement until a new advisory agreement was approved by stockholders or until the end of the150-day period, whichever would occur earlier. All fees earned by the Adviser under an Interim Advisory Agreement would be held in escrow pending shareholder approval of the Proposed Agreement. Upon approval of a new advisory agreement by stockholders, the escrowed management fees would be paid to the Adviser, and the Interim Advisory Agreement would terminate.
Information Regarding the Review and Approval of the Fund’s Current Advisory Agreement
The disinterested directors (the “directors”) of AB Bond Fund, Inc. (the “Company”) unanimously approved the continuance of the Company’s Advisory Agreement with the Adviser in respect of AB FlexFeeTM International Bond Portfolio (the “Fund”) at a meeting held onNovember 6-8, 2018 (the “Meeting”).
Prior to approval of the continuance of the Advisory Agreement, the directors had requested from the Adviser, and received and evaluated, extensive materials. They reviewed the proposed continuance of the Advisory Agreement with the Adviser and with experienced counsel who are independent of the Adviser, who advised on the relevant legal standards.
| abfunds.com | AB FLEXFEE INTERNATIONAL BOND PORTFOLIO | 85 | |
The directors also reviewed additional materials, including materials from an outside consultant, who acted as their independent fee consultant, and comparative analytical data prepared by the Senior Analyst for the Fund. The directors also discussed the proposed continuance in private sessions with counsel.
The directors considered their knowledge of the nature and quality of the services provided by the Adviser to the Fund gained from their experience as directors or trustees of most of the registered investment companies advised by the Adviser, their overall confidence in the Adviser’s integrity and competence they have gained from that experience, the Adviser’s initiative in identifying and raising potential issues with the directors and its responsiveness, frankness and attention to concerns raised by the directors in the past, including the Adviser’s willingness to consider and implement organizational and operational changes designed to improve investment results and the services provided to the AB Funds. The directors noted that they have four regular meetings each year, at each of which they review extensive materials and information from the Adviser, including information on the investment performance of the Fund.
The directors also considered all factors they believed relevant, including the specific matters discussed below. During the course of their deliberations, the directors evaluated, among other things, the reasonableness of the performance-based advisory fee (which consists of a base fee plus or minus a performance adjustment) and considered materials presented to them concerning the SEC’s published guidance on factors that should be considered in connection with fulcrum fee arrangements, including the following factors: (1) the fairness of the fulcrum fee; (2) selection of an appropriate index against which fund performance should be measured; (3) variations in periods used for computing average asset values and performance; (4) length of period over which performance is computed; (5) computation of performance over a rolling period; (6) performance for transitional periods; (7) computation of the performance of the fund and the index with respect to payment of dividends and capital gains distributions; and (8) avoidance of basing significant fee adjustments upon random or insignificant differences. The directors did not identify any particular information that wasall-important or controlling, and different directors may have attributed different weights to the various factors. The directors determined that the selection of the Adviser to manage the Fund and the overall arrangements between the Fund and the Adviser, as provided in the Advisory Agreement, including the performance-based advisory fee, were fair and reasonable in light of the services performed, expenses incurred and such other matters as the directors considered relevant in the exercise of their business judgment. The material factors and conclusions that formed the basis for the directors’ determinations included the following:
Nature, Extent and Quality of Services Provided
The directors considered the scope and quality of services provided by the Adviser under the Advisory Agreement, including the quality of the investment
| 86 | AB FLEXFEE INTERNATIONAL BOND PORTFOLIO | abfunds.com | |
research capabilities of the Adviser and the other resources it has dedicated to performing services for the Fund. The directors noted that the Adviser from time to time reviews the Fund’s investment strategies and from time to time proposes changes intended to improve the Fund’s relative or absolute performance for the directors’ consideration. They also noted the professional experience and qualifications of the Fund’s portfolio management team and other senior personnel of the Adviser. The directors also considered that the Advisory Agreement provides that the Fund will reimburse the Adviser for the cost to it of providing certain clerical, accounting, administrative and other services to the Fund by employees of the Adviser or its affiliates. Requests for these reimbursements are made on a quarterly basis and subject to approval by the directors. The Adviser did not request any reimbursements from the Fund in the Fund’s latest fiscal year. The quality of administrative and other services, including the Adviser’s role in coordinating the activities of the Fund’s other service providers, also was considered. The directors concluded that, overall, they were satisfied with the nature, extent and quality of services provided to the Fund under the Advisory Agreement.
Costs of Services Provided and Profitability
The directors reviewed a schedule of the revenues and expenses and related notes indicating the profitability of the Fund to the Adviser for the period ended December 31, 2017 that had been prepared with an expense allocation methodology arrived at in consultation with an independent consultant retained by the Fund’s former Senior Officer/Independent Compliance Officer. The directors noted the assumptions and methods of allocation used by the Adviser in preparing fund-specific profitability data and understood that there are a number of potentially acceptable allocation methodologies for information of this type. The directors noted that the profitability information reflected all revenues and expenses of the Adviser’s relationship with the Fund, including those relating to its subsidiaries that provide transfer agency and distribution services to the Fund. The directors recognized that it is difficult to make comparisons of the profitability of the Advisory Agreement with the profitability of fund advisory contracts for unaffiliated funds because comparative information is not generally publicly available and is affected by numerous factors. The directors focused on the profitability of the Adviser’s relationship with the Fund before taxes and distribution expenses. The directors noted that the Fund was not profitable to the Adviser in the period reviewed. The directors noted that, due to the performance fee component of the advisory fee, profitability would tend to be higher with better performance relative to the Fund’s benchmark index, which they considered to create an appropriate alignment of incentives.
Fall-Out Benefits
The directors considered the other benefits to the Adviser and its affiliates from their proposed relationships with the Fund, including, but not limited to, benefits relating to12b-1 fees and sales charges to be received by the
| abfunds.com | AB FLEXFEE INTERNATIONAL BOND PORTFOLIO | 87 | |
Fund’s principal underwriter (which is a wholly owned subsidiary of the Adviser) in respect of certain classes of the Fund’s shares; and transfer agency fees paid by the Fund to a wholly owned subsidiary of the Adviser. The directors recognized that the Adviser’s profitability would be exacerbated without these benefits. The directors understood that the Adviser also might derive reputational and other benefits from its association with the Fund.
Investment Results
In addition to the information reviewed by the directors in connection with the Meeting, the directors receive detailed performance information for the Fund at each regular Board meeting during the year.
At the Meeting, the directors reviewed performance information prepared by an independent service provider (the “15(c) service provider”), showing the performance of the Advisor Class shares of the Fund against a group of similar funds (“peer group”) and a larger group of similar funds (“peer universe”), each selected by the 15(c) service provider, and information prepared by the Adviser showing performance of the Advisor Class shares against a broad-based securities market index, in each case for the1-year period ended July 31, 2018 and (in the case of comparisons with the broad-based securities market index) for the period from inception. Based on their review, the directors concluded that the Fund’s investment performance was acceptable.
Advisory Fees and Other Expenses
The directors considered the advisory fee rate payable by the Fund to the Adviser and information prepared by the 15(c) service provider concerning advisory fee rates payable by other funds in the same category as the Fund. The directors recognized that it is difficult to make comparisons of advisory fees because there are variations in the services that are included in the fees payable by other funds. The directors considered the Fund’s contractual effective advisory fee rate against a peer group median.
The directors also considered the Adviser’s fee schedule for other clients pursuing a similar investment style to the Fund. For this purpose, they reviewed the relevant advisory fee information from the Adviser’s Form ADV and in a report from the Fund’s Senior Analyst and noted the differences between the Fund’s fee schedule, on the one hand, and the Adviser’s institutional fee schedule and the schedule of fees charged by the Adviser to any offshore funds and for services to anysub-advised funds pursuing a similar investment strategy as the Fund, on the other. The directors noted that the Adviser may, in some cases, agree to fee rates with large institutional clients that are lower than those reviewed by the directors and that they had previously discussed with the Adviser its policies in respect of such arrangements. The directors also discussed these matters with their independent fee consultant.
| 88 | AB FLEXFEE INTERNATIONAL BOND PORTFOLIO | abfunds.com | |
The Adviser reviewed with the directors the significantly greater scope of the services it provides to the Fund relative to institutional, offshore fund andsub-advised fund clients. In this regard, the Adviser noted, among other things, that, compared to institutional and offshore or sub-advisory accounts, the Fund (i) demands considerably more portfolio management, research and trading resources due to significantly higher daily cash flows; (ii) has more tax and regulatory restrictions and compliance obligations; (iii) must prepare and file or distribute regulatory and other communications about fund operations; and (iv) must provide shareholder servicing to retail investors. The Adviser also reviewed the greater legal risks presented by the large and changing population of Fund shareholders who may assert claims against the Adviser in individual or class actions, and the greater entrepreneurial risk in offering new fund products, which require substantial investment to launch, may not succeed, and generally must be priced to compete with larger, more established funds resulting in lack of profitability to the Adviser until a new fund achieves scale. In light of the substantial differences in services rendered by the Adviser to institutional, offshore fund andsub-advised fund clients as compared to the Fund, the directors considered these fee comparisons inapt and did not place significant weight on them in their deliberations.
The directors noted that the Fund may invest in shares of exchange-traded funds (“ETFs”), subject to the restrictions and limitations of the Investment Company Act of 1940 as these may be varied as a result of exemptive orders issued by the SEC. The directors also noted that ETFs pay advisory fees pursuant to their advisory contracts. The directors concluded, based on the Adviser’s explanation of how it may use ETFs when they are the most cost-effective way to obtain desired exposures, in some cases pending purchases of underlying securities, that the advisory fee for the Fund would be for services in addition to, rather than duplicative of, the services provided under the advisory contracts of the ETFs.
In connection with their review of the Fund’s advisory fee, the directors also considered the total expense ratio of the Advisor Class shares of the Fund in comparison to a peer group and a peer universe selected by each 15(c) service provider. The Advisor Class expense ratio of the Fund was based on the Fund’s latest fiscal year and the directors considered the Adviser’s expense cap. The directors noted that it was likely that the expense ratios of some of the other funds in the Fund’s category were lowered by waivers or reimbursements by those funds’ investment advisers, which in some cases might be voluntary or temporary. The directors view the expense ratio information as relevant to their evaluation of the Adviser’s services because the Adviser is responsible for coordinating services provided to the Fund by others. Based on their review, the directors concluded that the Fund’s expense ratio was acceptable.
Economies of Scale
The directors noted that the advisory fee schedule for the Fund does not contain breakpoints and that they had previously discussed their strong
| abfunds.com | AB FLEXFEE INTERNATIONAL BOND PORTFOLIO | 89 | |
preference for breakpoints in advisory contracts with the Adviser. The directors took into consideration presentations by an independent consultant on economies of scale in the mutual fund industry and for the AB Funds, and presentations from time to time by the Adviser concerning certain of its views on economies of scale. The directors also discussed economies of scale with their independent fee consultant. The directors also had requested and received from the Adviser certain updates on economies of scale in advance of the Meeting. The directors believe that economies of scale may be realized (if at all) by the Adviser across a variety of products and services, and not only in respect of a single fund. The directors noted that there is no established methodology for setting breakpoints that give effect to the fund-specific services provided by a fund’s adviser and to the economies of scale that an adviser may realize in its overall mutual fund business or those components of it which directly or indirectly affect a fund’s operations. The directors observed that in the mutual fund industry as a whole, as well as among funds similar to the Fund, there is no uniformity or pattern in the fees and asset levels at which breakpoints (if any) apply. The directors also noted that the advisory agreements for many funds do not have breakpoints at all. The directors informed the Adviser that they would monitor the Fund’s asset levels (which were well below the level at which they would anticipate adding an initial breakpoint) and its profitability (currently unprofitable) to the Adviser and anticipated revisiting the question of breakpoints in the future if circumstances warranted doing so.
| 90 | AB FLEXFEE INTERNATIONAL BOND PORTFOLIO | abfunds.com | |
This page is not part of the Shareholder Report or the Financial Statements.
AB FAMILY OF FUNDS
US EQUITY
US CORE
Core Opportunities Fund
FlexFee™ US Thematic Portfolio
Select US Equity Portfolio
US GROWTH
Concentrated Growth Fund
Discovery Growth Fund
FlexFee™ Large Cap Growth Portfolio
Growth Fund
Large Cap Growth Fund
Small Cap Growth Portfolio
US VALUE
Discovery Value Fund
Equity Income Fund
Relative Value Fund
Small Cap Value Portfolio
Value Fund
INTERNATIONAL/ GLOBAL EQUITY
INTERNATIONAL/ GLOBAL CORE
FlexFee™ International Strategic Core Portfolio
Global Core Equity Portfolio
International Portfolio
International Strategic Core Portfolio
Sustainable Global Thematic Fund
Tax-Managed International Portfolio
Tax-Managed Wealth Appreciation Strategy
Wealth Appreciation Strategy
INTERNATIONAL/ GLOBAL GROWTH
Concentrated International Growth Portfolio
FlexFee™ Emerging Markets Growth Portfolio
INTERNATIONAL/ GLOBAL EQUITY(continued)
Sustainable International Thematic Fund
INTERNATIONAL/ GLOBAL VALUE
All China Equity Portfolio
International Value Fund
FIXED INCOME
MUNICIPAL
High Income Municipal Portfolio
Intermediate California Municipal Portfolio
Intermediate Diversified Municipal Portfolio
Intermediate New York Municipal Portfolio
Municipal Bond Inflation Strategy
Tax-Aware Fixed Income Portfolio
National Portfolio
Arizona Portfolio
California Portfolio
Massachusetts Portfolio
Minnesota Portfolio
New Jersey Portfolio
New York Portfolio
Ohio Portfolio
Pennsylvania Portfolio
Virginia Portfolio
TAXABLE
Bond Inflation Strategy
FlexFee™ High Yield Portfolio1
FlexFee™ International Bond Portfolio
Global Bond Fund
High Income Fund
Income Fund
Intermediate Bond Portfolio
Limited Duration High Income Portfolio
Short Duration Portfolio
ALTERNATIVES
All Market Real Return Portfolio
Global Real Estate Investment Fund
Select US Long/Short Portfolio
Unconstrained Bond Fund
MULTI-ASSET
All Market Income Portfolio
All Market Total Return Portfolio
Conservative Wealth Strategy
Emerging Markets Multi-Asset Portfolio
Global Risk Allocation Fund
Tax-Managed All Market Income Portfolio
TARGET-DATE
Multi-Manager Select Retirement Allocation Fund
Multi-Manager Select 2010 Fund
Multi-Manager Select 2015 Fund
Multi-Manager Select 2020 Fund
Multi-Manager Select 2025 Fund
Multi-Manager Select 2030 Fund
Multi-Manager Select 2035 Fund
Multi-Manager Select 2040 Fund
Multi-Manager Select 2045 Fund
Multi-Manager Select 2050 Fund
Multi-Manager Select 2055 Fund
Multi-Manager Select 2060 Fund
CLOSED-END FUNDS
Alliance California Municipal Income Fund
AllianceBernstein Global High Income Fund
AllianceBernstein National Municipal Income Fund
We also offer Government Money Market Portfolio, which serves as the money market fund exchange vehicle for the AB mutual funds. You could lose money by investing in the Fund. Although the Fund seeks to preserve the value of your investment at $1.00 per share, it cannot guarantee it will do so. The Fund may impose a fee upon sale of your shares or may temporarily suspend your ability to sell shares if the Fund’s liquidity falls below required minimums because of market conditions or other factors. An investment in the Fund is not insured or guaranteed by the Federal Deposit Insurance Corporation or any other government agency. The Fund’s sponsor has no legal obligation to provide financial support to the Fund, and you should not expect that the sponsor will provide financial support to the Fund at any time.
Investors should consider the investment objectives, risks, charges and expenses of the Fund carefully before investing. For copies of our prospectus or summary prospectus, which contain this and other information, visit us online at www.abfunds.com or contact your AB representative. Please read the prospectus and/or summary prospectus carefully before investing.
| 1 | Prior to February 23, 2018, FlexFee High Yield Portfolio was named High Yield Portfolio. |
| abfunds.com | AB FLEXFEE INTERNATIONAL BOND PORTFOLIO | 91 | |
NOTES
| 92 | AB FLEXFEE INTERNATIONAL BOND PORTFOLIO | abfunds.com | |
AB FLEXFEE INTERNATIONAL BOND PORTFOLIO
1345 Avenue of the Americas
New York, NY 10105
800 221 5672
FFIB-0151-1218 
ITEM 2. CODE OF ETHICS.
(a) The registrant has adopted a code of ethics that applies to its principal executive officer, principal financial officer and principal accounting officer. A copy of the registrant’s code of ethics is filed herewith as Exhibit 12(a)(1).
(b) During the period covered by this report, no material amendments were made to the provisions of the code of ethics adopted in 2(a) above.
(c) During the period covered by this report, no implicit or explicit waivers to the provisions of the code of ethics adopted in 2(a) above were granted.
ITEM 3. AUDIT COMMITTEE FINANCIAL EXPERT.
The registrant’s Board of Directors has determined that independent directors Garry L. Moody, William H. Foulk, Jr. and Marshall C. Turner, Jr. qualify as audit committee financial experts.
ITEM 4. PRINCIPAL ACCOUNTANT FEES AND SERVICES.
(a) - (c) The following table sets forth the aggregate fees billed by the independent registered public accounting firm Ernst & Young LLP, for the Fund’s last two fiscal years for professional services rendered for: (i) the audit of the Fund’s annual financial statements included in the Fund’s annual report to stockholders; (ii) assurance and related services that are reasonably related to the performance of the audit of the Fund’s financial statements and are not reported under (i), which include advice and education related to accounting and auditing issues and quarterly press release review (for those Funds which issue press releases), and preferred stock maintenance testing (for those Funds that issue preferred stock); and (iii) tax compliance, tax advice and tax return preparation.
| Audit Fees | Audit-Related Fees | Tax Fees | ||||||||||||||
AB FlexFee International Bond | �� | 2017 | $ | 26,722 | $ | — | $ | 18,003 | ||||||||
| 2018 | $ | 33,879 | $ | 2,000 | $ | 24,350 | ||||||||||
AB FlexFee High Yield | 2017 | $ | 114,071 | $ | — | $ | 35,656 | |||||||||
| 2018 | * | $ | 112,671 | $ | 41,164 | |||||||||||
| 2018 | ** | $ | 95,158 | $ | — | $ | 18,512 | |||||||||
| * | Year Ended October 2018 |
| ** | Year Ended December 2018 |
(d) Not applicable.
(e) (1) Beginning with audit andnon-audit service contracts entered into on or after May 6, 2003, the Fund’s Audit Committee policies and procedures require thepre-approval of all audit andnon-audit services provided to the Fund by the Fund’s independent registered public accounting firm. The Fund’s Audit Committee policies and procedures also requirepre-approval of all audit andnon-audit services provided to the Adviser and Service Affiliates to the extent that these services are directly related to the operations or financial reporting of the Fund.
(e) (2) All of the amounts for Audit Fees, Audit-Related Fees and Tax Fees in the table under Item 4 (a) – (c) are for servicespre-approved by the Fund’s Audit Committee.
(f) Not applicable.
(g) The following table sets forth the aggregatenon-audit services provided to the Fund, the Fund’s Adviser and entities that control, are controlled by or under common control with the Adviser that provide ongoing services to the Fund:
| All Fees for Non-Audit Services Provided to the Portfolio, the Adviser and Service Affiliates | Total Amount of Foregoing Column Pre- approved by the Audit Committee (Portion Comprised of Audit Related Fees) (Portion Comprised of Tax Fees) | |||||||||||
AB FlexFee International Bond | 2017 | $ | 741,118 | $ | 18,003 | |||||||
| $ | — | |||||||||||
| $ | (18,003 | ) | ||||||||||
| 2018 | $ | 790,948 | $ | 26,350 | ||||||||
| $ | (2,000 | ) | ||||||||||
| $ | (24,350 | ) | ||||||||||
AB FlexFee High Yield | 2017 | $ | 758,771 | $ | 35,656 | |||||||
| $ | — | |||||||||||
| $ | (35,656 | ) | ||||||||||
| 2018 | * | $ | 598,743 | $ | 41,164 | |||||||
| $ | — | |||||||||||
| $ | (41,164 | ) | ||||||||||
| 2018 | ** | $ | 783,110 | $ | 18,512 | |||||||
| $ | — | |||||||||||
| $ | (18,512 | ) | ||||||||||
| * | Year Ended October 2018 |
| ** | Year Ended December 2018 |
(h) The Audit Committee of the Fund has considered whether the provision of anynon-audit services notpre-approved by the Audit Committee provided by the Fund’s independent registered public accounting firm to the Adviser and Service Affiliates is compatible with maintaining the auditor’s independence.
| ITEM 5. | AUDIT COMMITTEE OF LISTED REGISTRANTS. |
Not applicable to the registrant.
ITEM 6. SCHEDULE OF INVESTMENTS.
Please see Schedule of Investments contained in the Report to Shareholders included under Item 1 of this FormN-CSR.
ITEM 7. DISCLOSURE OF PROXY VOTING POLICIES AND PROCEDURES FORCLOSED-END MANAGEMENT INVESTMENT COMPANIES.
Not applicable to the registrant.
ITEM 8. PORTFOLIO MANAGERS OFCLOSED-END MANAGEMENT INVESTMENT COMPANIES.
Not applicable to the registrant.
ITEM 9. PURCHASES OF EQUITY SECURITIES BYCLOSED-END MANAGEMENT INVESTMENT COMPANY AND AFFILIATED PURCHASERS.
Not applicable to the registrant.
ITEM 10. SUBMISSION OF MATTERS TO A VOTE OF SECURITY HOLDERS.
There have been no material changes to the procedures by which shareholders may recommend nominees to the Fund’s Board of Directors since the Fund last provided disclosure in response to this item.
ITEM 11. CONTROLS AND PROCEDURES.
(a) The registrant’s principal executive officer and principal financial officer have concluded that the registrant’s disclosure controls and procedures (as defined in Rule30a-3 (c) under the Investment Company Act of 1940, as amended) are effective at the reasonable assurance level based on their evaluation of these controls and procedures as of a date within 90 days of the filing date of this document.
(b) There were no changes in the registrant’s internal controls over financial reporting that occurred during the second fiscal quarter of the period that has materially affected, or is reasonably likely to materially affect, the registrant’s internal control over financial reporting.
ITEM 12. EXHIBITS.
The following exhibits are attached to this FormN-CSR:
EXHIBIT NO. | DESCRIPTION OF EXHIBIT | |
| 12 (a) (1) | Code of Ethics that is subject to the disclosure of Item 2 hereof | |
| 12 (b) (1) | Certification of Principal Executive Officer Pursuant to Section 302 of the Sarbanes-Oxley Act of 2002 | |
| 12 (b) (2) | Certification of Principal Financial Officer Pursuant to Section 302 of the Sarbanes-Oxley Act of 2002 | |
| 12 (c) | Certification of Principal Executive Officer and Principal Financial Officer Pursuant to Section 906 of theSarbanes-Oxley Act of 2002 | |
SIGNATURES
Pursuant to the requirements of the Securities Exchange Act of 1934 and the Investment Company Act of 1940, the registrant has duly caused this report to be signed on its behalf by the undersigned, thereunto duly authorized.
| (Registrant): AB Bond Fund, Inc. | ||
| By: | /s/ Robert M. Keith | |
| Robert M. Keith | ||
| President | ||
| Date: | February 28, 2019 | |
Pursuant to the requirements of the Securities Exchange Act of 1934 and the Investment Company Act of 1940, this report has been signed below by the following persons on behalf of the registrant and in the capacities and on the dates indicated.
| By: | /s/ Robert M. Keith | |
| Robert M. Keith | ||
| President | ||
| Date: | February 28, 2019 | |
| By: | /s/ Joseph J. Mantineo | |
| Joseph J. Mantineo | ||
| Treasurer and Chief Financial Officer | ||
| Date: | February 28, 2019 | |