SECURITIES AND EXCHANGE COMMISSION
Washington, D. C. 20549
FORM 8-K
CURRENT REPORT
Pursuant to Section 13 or 15(d) of the
Securities Exchange Act of 1934
Date of Report January 22, 2004
(Date of earliest event reported)
FORD MOTOR COMPANY
(Exact name of registrant as specified in its charter)
Delaware
(State or other jurisdiction of incorporation)
| | | |
| 1-3950 | | 38-0549190 |
| (Commission File Number) | | (IRS Employer Identification No.) |
| | | |
| One American Road, Dearborn, Michigan | | 48126 |
| (Address of principal executive offices) | | (Zip Code) |
Registrant’s telephone number, including area code 313-322-3000
TABLE OF CONTENTS
-2-
Item 7. Financial Statements, Pro Forma Financial Information and Exhibits.
EXHIBITS
| | | | | |
| Designation | | Description | | Method of Filing |
| |
| |
|
| Exhibit 99.1 | | News Release dated | | |
| | | January 22, 2004 | | Filed with this Report |
| | | | | |
| Exhibit 99.2 | | Sector Statement of Income | | Filed with this Report |
| | | | | |
| Exhibit 99.3 | | Consolidated Statement of Income | | Filed with this Report |
| | | | | |
| Exhibit 99.4 | | Sector Balance Sheet | | Filed with this Report |
| | | | | |
| Exhibit 99.5 | | Consolidated Balance Sheet | | Filed with this Report |
| | | | | |
| Exhibit 99.6 | | Condensed Sector Statement | | |
| | | of Cash Flows | | Filed with this Report |
| | | | | |
| Exhibit 99.7 | | Condensed Consolidated | | |
| | | Statement of Cash Flows | | Filed with this Report |
| | | | | |
| Exhibit 99.8 | | Investor Presentation | | Filed with this Report |
| | | | | |
| Exhibit 99.9 | | Fixed Income Presentation | | Filed with this Report |
Item 12. Results of Operations and Financial Condition.
Our news release dated January 22, 2004 and supplemental financial information, concerning fourth quarter and full year 2003 financial results, filed as Exhibits 99.1 through 99.9, respectively, to this report, are incorporated by reference herein.
Ford Motor Company will conduct two conference calls on January 22, 2004 to review fourth quarter and full year 2003 results.
Don Leclair, Ford’s Group Vice President and Chief Financial Officer, will host a conference call with investors and the news media that will begin at 9:00 a.m. to review our fourth quarter and full year 2003 results. Investors can hear this conference call by dialing 800-299-7098 (617-801-9715 for international dial-in) or on the Internet atwww.shareholder.ford.com. The passcode for both numbers is a verbal response of “Ford Earnings Call”.
Malcolm Macdonald, Ford’s Vice President and Treasurer, Jim Gouin, Ford’s Vice President and Controller, and David Cosper, Ford Motor Credit Company’s Chief Financial Officer, will host a second conference call with fixed income investors beginning at 11:00 a.m. Investors can access this conference call by dialing 800-299-7098 (617-801-9715 for
-3-
international dial-in). The passcode for both numbers is a verbal response of “Ford Fixed Income”.
Investors can access replays of these calls by visiting one of the following web sites:www.shareholder.ford.comorwww.streetevents.comor by dialing 888-286-8010 (617-801-6888 for international dial-in), passcode 44456529 for the 9:00 a.m. call and passcode 33675945 for the 11:00 a.m. call. The times referenced above are Eastern Standard Time.
Exhibits 99.1, 99.8 and 99.9 to this report contain certain “non-GAAP financial measures” as defined in Item 10 of Regulation S-K of the Securities Exchange Act of 1934, as amended. The non-GAAP financial measures include financial results excluding special items, net pricing and operating cash flows in respect of our Automotive sector, and managed leverage and credit loss ratios in respect of our subsidiary, Ford Motor Credit Company (“Ford Credit”). Each of these non-GAAP financial measures is discussed below, including the most directly comparable financial measure calculated and presented in accordance with Generally Accepted Accounting Principles in the United States (“GAAP”) and the reasons why we believe the presentation of the non-GAAP financial measure provides useful information to our investors.
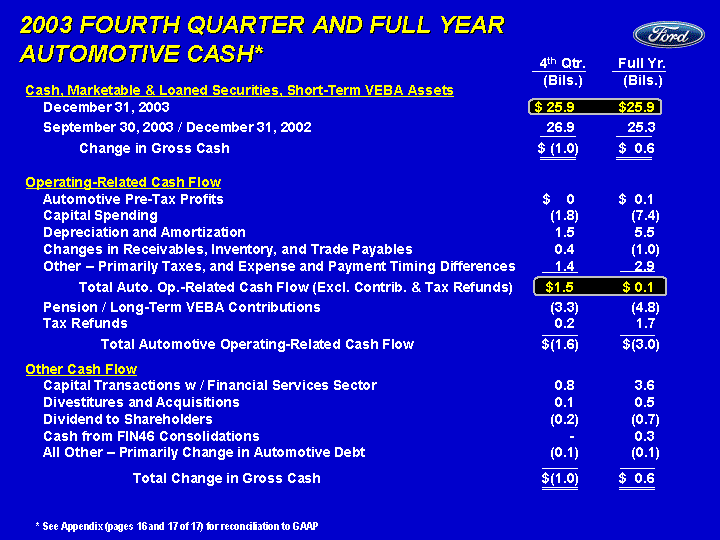
Operating Cash Flows.The exhibits discuss our operating-related cash flows before contributions to trusts to fund pension and health care obligations and before tax refunds for the fourth quarter and full year 2003 and our milestone for operating-related cash flow for 2004. The exhibits indicate that we had positive operating cash flow before contributions and tax refunds of $1.5 billion for the fourth quarter and about $100 million for the full year 2003. The most directly comparable financial measure calculated and presented in accordance with GAAP to this cash flow measure is Cash Flows from Operating Activities Before Securities Trading. Slide 22 of Exhibit 99.8 and the appendix (page 17 of 17) to Exhibit 99.8 combine to provide a reconciliation of our non-GAAP operating cash flow measure and Cash Flows from Operating Activities Before Securities Trading. Cash Flows from Operating Activities Before Securities Trading was negative $3.5 billion for fourth quarter and positive $1.3 billion for the full year 2003. We believe the non-GAAP operating cash flow before contributions and tax refunds measure is useful to investors because it includes cash flow elements not included in Cash Flows from Operating Activities Before Securities Trading that we consider to be related to our operating activities (for example, capital spending). As a result, our operating cash flow measure provides investors with a more relevant measure of the cash generated by our operations.
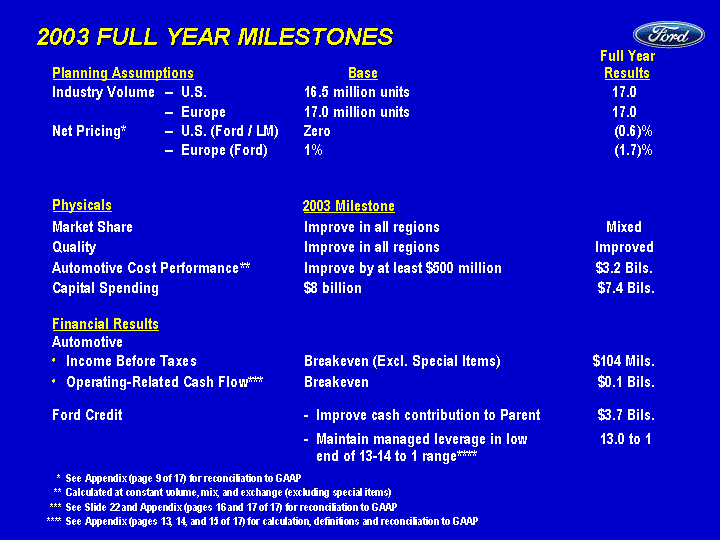
Net Pricing.The exhibits indicate that our 2003 milestones were based, in part, on net pricing planning assumptions for 2003 of zero in the United States (for Ford, Lincoln and Mercury brand vehicles) and 1% in Europe (for Ford brand vehicles), in each case at constant volume, mix and exchange rates, compared to 2002. The exhibits further indicate changes in net pricing for the full year 2003 were negative 0.6% and negative 1.7% in the United States and Europe, respectively. The most directly comparable financial measure calculated and presented in accordance with GAAP to this net pricing measure is the period-over-period change in Automotive Sales. The period-over-period change in Automotive Sales is affected by changes in unit sales volume, product mix, foreign exchange rates, wholesale prices for vehicles sold and marketing incentives. The net pricing measure (which measures the combined effect of changes in wholesale prices and marketing incentives, while excluding the effects of changes in unit sales volumes, product mix, and foreign exchange rates) is useful to
-4-
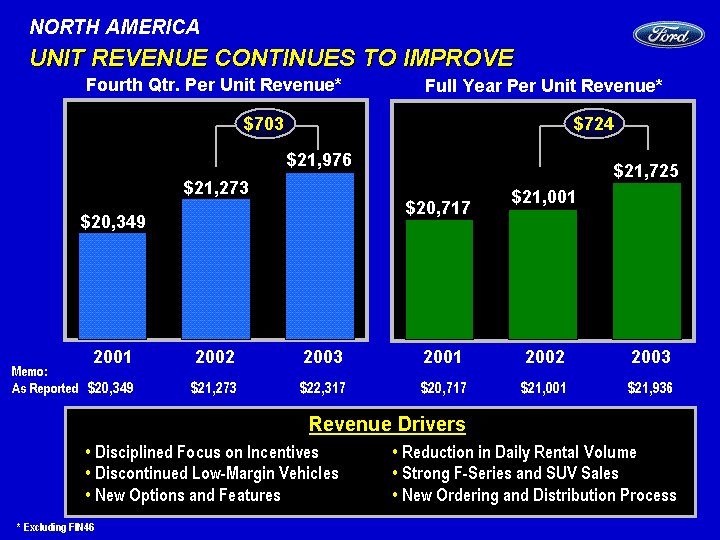
investors because it provides an indication of the underlying direction of changes in revenue in one performance measure. The change in Automotive Sales on a per unit basis for the full year 2003 compared with 2002 was an increase of 4.4% for North America and an increase of 15.0% for Europe. The appendix (page 9 of 17) to Exhibit 99.8 contains a reconciliation of the change in net pricing in 2003 compared with 2002 to the change in Automotive Sales for the same periods.
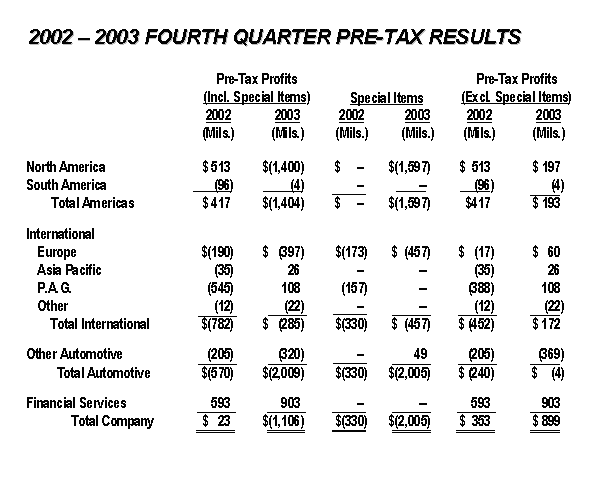
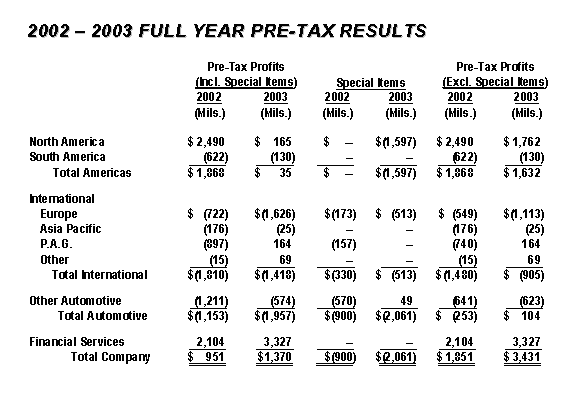
Financial Results Excluding Special Items.The exhibits discuss the fourth quarter and full year 2003 pre-tax profits excluding special items for our Automotive Sector and each of our primary operating segments within the Automotive sector. The most directly comparable financial measure calculated and presented in accordance with GAAP to this measure is pre-tax profits including the special items. We believe that pre-tax profits excluding special items is useful to investors because it excludes elements that we do not consider to be indicative of our on-going operating activities (for example, the effect of recent agreements with Visteon Corporation). As a result, pre-tax profits excluding special items provides investors with a more relevant measure of the results generated by our operations. Slide 4 of Exhibit 99.8 includes a list of the special items and the impact of each on our fourth quarter and full year 2003 results. The tables below set forth the pre-tax profits for our Automotive Sector and each of our operating segments within the Automotive sector both excluding and including the special items for the fourth quarter and full year, respectively.
-5-
Managed Leverage.The exhibits discuss Ford Credit’s leverage (i.e., debt-to-equity ratio) on both a financial statement and managed basis. Financial statement leverage is the most directly comparable financial measure calculated and presented in accordance with GAAP to our non-GAAP managed leverage financial measure. The appendices to the exhibits contain a reconciliation of Ford Credit’s non-GAAP managed leverage measure to its financial statement leverage. The exhibits indicate that Ford Credit’s financial statement and managed leverage at December 31, 2003 were 12.0 and 13.0 to 1, respectively. We believe that the use of the non-GAAP managed leverage measure, which is the result of several adjustments to Ford Credit’s financial statement leverage, is useful to our investors because it reflects the way Ford Credit manages its business. Ford Credit retains interests in receivables sold in off-balance sheet securitization transactions, and, with respect to subordinated retained interests, has credit risk. Accordingly, it considers securitization as an alternative source of funding and evaluates credit losses, receivables and leverage on a managed as well as a financial statement basis. As a result, the managed leverage measure provides our investors with meaningful information regarding management’s decision-making processes.
In calculating its managed leverage ratio, Ford Credit adds the total amount of receivables sold in off-balance sheet securitizations, net of retained interests, to its debt. It also deducts cash and cash equivalents because these generally correspond to excess debt beyond the amount required to support Ford Credit’s financing operations. It adds minority interests to equity because all of the debt of such consolidated entities is included in total debt. It excludes the impact of Statement of Financial Accounting Standards No. 133 in both the numerator and the denominator in order to exclude the interim effects of changes in market rates because Ford Credit generally repays its debt funding obligations as they mature.
-6-
Loss-to-Receivables Ratio. The exhibits discuss Ford Credit’s loss to receivables ratios on an “on-balance sheet” and a managed basis. The exhibits indicate that Ford Credit’s total on-balance sheet credit loss ratio was 1.67% (including credit losses on reacquired receivables) and was 1.60% (excluding credit losses on reacquired receivables) for the full year 2003. The exhibits further indicate that Ford Credit’s on-balance sheet credit loss ratio for its U.S. retail and lease business was 2.18% (including credit losses on reacquired receivables) and was 1.98% (excluding credit losses on reacquired receivables) for the fourth quarter 2003. A loss-to-receivables ratio equals net credit losses divided by the average amount of net receivables outstanding for the period. The receivables that were reacquired in the second quarter of 2003 are those of FCAR Owner Trust (“FCAR”), an entity integral to a Ford Credit asset-backed commercial paper program. FCAR was consolidated for financial statement purposes with Ford Credit in the second quarter of 2003. The financial measure that is most directly comparable to these loss-to-receivables ratios and that is calculated and presented in accordance with GAAP is the on-balance sheet credit loss ratio excluding losses on the reacquired FCAR receivables. We believe that the use of the non-GAAP on-balance sheet credit loss ratio is useful to our investors because it provides a more complete representation of our actual on-balance sheet credit loss experience.
SIGNATURE
Pursuant to the requirements of the Securities Exchange Act of 1934, the registrant has duly caused this report to be signed on its behalf by the undersigned thereunto duly authorized on the date indicated.
| | | | | | | |
| | | FORD MOTOR COMPANY |
| | |
| | | | |
| | | (Registrant) | | | | |
| | | | | | | |
| Date: January 22, 2004 | | By: /s/ Kathryn S. Lamping | | | | |
| | |
| | | | |
| | | Kathryn S. Lamping | | | | |
| | | Assistant Secretary | | | | |
-7-
EXHIBIT INDEX
| | | |
| Designation | | Description |
| |
|
| Exhibit 99.1 | | News Release dated |
| | | January 22, 2004 |
| | | |
| Exhibit 99.2 | | Sector Statement of Income |
| | | |
| Exhibit 99.3 | | Consolidated Statement of Income |
| | | |
| Exhibit 99.4 | | Sector Balance Sheet |
| | | |
| Exhibit 99.5 | | Consolidated Balance Sheet |
| | | |
| Exhibit 99.6 | | Condensed Sector Statement |
| | | of Cash Flows |
| | | |
| Exhibit 99.7 | | Condensed Consolidated |
| | | Statement of Cash Flows |
| | | |
| Exhibit 99.8 | | Investor Presentation |
| | | |
| Exhibit 99.9 | | Fixed Income Presentation |
EXHIBIT 99.1
NEWS
| | | | | | | | | |
| Contact: | | Media: | | Investment Community: | | Shareholder Inquiries: | | Media Information Center: |
| |
| |
| |
| |
|
| | | Becky Bach | | Terry Huch
| | 1.800.555.5259 or
| | 1.800.665.1515 or |
| | | 1.313.594.4410 | | 1.313.594.0613
| | 1.313.845.8540
| | 1.313.621.0504 |
| | | bbach1@ford.com | | fordir@ford.com
| | stockinfo@ford.com
| | media@ford.com |
IMMEDIATE RELEASE
FORD EARNS 2003 NET INCOME OF $495 MILLION, OR
27 CENTS PER SHARE
| | • | | Full-year net income of $495 million, or 27 cents per share. |
| | • | | Full-year income from continuing operations, excluding special items, more than doubled to $1.14 per share compared with a year ago, exceeding the company’s full-year guidance of $1.05 — $1.10 per share. |
| | • | | Achieved pre-tax profitability in the automotive sector, excluding special items. |
| | • | | Posted full-year record Ford Credit pre-tax profit of $3.0 billion. |
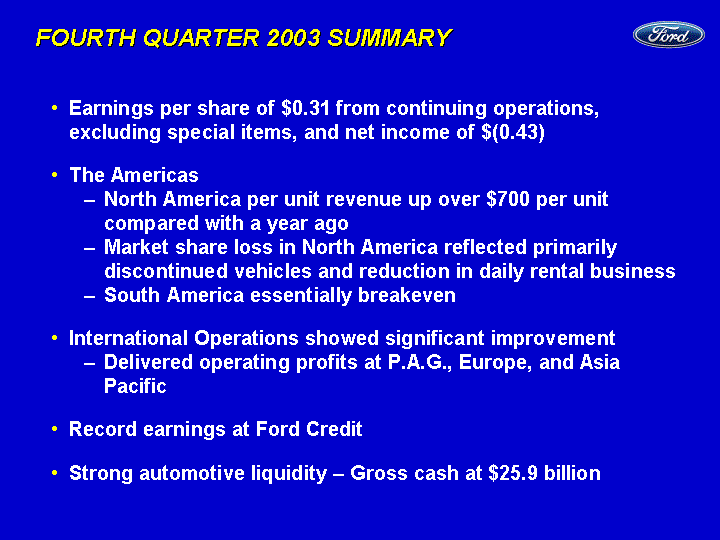
| | • | | Fourth-quarter income from continuing operations of 31 cents per share, excluding special items, up 20 cents per share from a year ago. |
| | • | | Significant fourth-quarter improvements in operating results for Premier Automotive Group, South America, Ford Europe and Asia Pacific. |
DEARBORN, Mich., Jan. 22 — Ford Motor Company [NYSE: F] today reported full-year 2003 net income of $495 million, or 27 cents per share. This compares with a net loss of $980 million, or 55 cents per share, for full-year 2002.
Excluding special items, Ford’s full-year earnings per share from continuing operations were $1.14. This result exceeded the full-year guidance of $1.05 to $1.10 per share and the comparable year-ago result of 56 cents per share.
“We have dramatically improved our profitability, beaten Wall Street’s expectations for eight consecutive quarters, and moved closer to achieving our mid-decade goals,” said Chairman and Chief Executive Officer Bill Ford. “As this month’s North American International Auto Show demonstrated, we have the right products and strategy to achieve our 2004 milestones.”
1
2
The following table reconciles the impact of special items, changes in accounting principle and discontinued operations for fourth-quarter and full-year earnings.
| | | | | | | | | | |
| | | | 2003 | |
| | | |
| |
| | | | Fourth Quarter | | | Full Year | |
| | | | EPS | | | EPS | |
| | | |
| | |
| |
| Income from Continuing Operations Excluding Special Items | | $ | 0.31 | | | $ | 1.14 | |
| |
| Special Items | | | | | | | | |
| | Europe Restructuring | | $ | (0.14 | ) | | $ | (0.16 | ) |
| | Visteon Agreement | | | (0.47 | ) | | | (0.47 | ) |
| | Non-Core Businesses | | | 0.02 | | | | 0.02 | |
| Dilution Effect of Special Items | | | (0.07 | ) | | | (0.03 | ) |
| | |
| | |
| |
| Income from Continuing Operations | | $ | (0.35 | ) | | $ | 0.50 | |
| |
| Cumulative Effect of Change in Accounting Principle | | | 0 | | | | (0.14 | ) |
| Discontinued Operations | | | (0.08 | ) | | | (0.09 | ) |
| | |
| | |
| |
| | Net Income | | $ | (0.43 | ) | | $ | 0.27 | |
| | |
| | |
| |
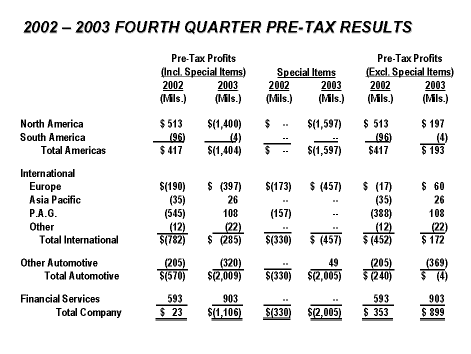
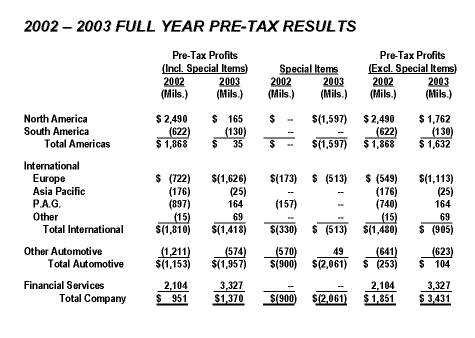
Including special items, Ford’s 2003 pre-tax profit totaled $1.4 billion, an increase from $951 million in 2002. Ford’s 2003 pre-tax profit, excluding special items, increased to $3.4 billion from $1.9 billion in 2002. Following are 2003 special items, presented on a pre-tax basis:
| | | | | | | | | | | | | | |
| | | | Third Quarter | | | Fourth Quarter | | | Full Year | |
| | | |
| | |
| | |
| |
| | | | (Mils.) | | | (Mils.) | | | (Mils.) | |
| | | |
| | |
| | |
| |
| Europe Restructuring | | $ | (56 | ) | | $ | (457 | ) | | $ | (513 | ) |
| Visteon Agreement | | | — | | | | (1,597 | ) | | | (1,597 | ) |
| Non-Core Businesses | | | — | | | | 49 | | | | 49 | |
| | |
| | | |
| | |
| |
| | Total Special Items | | $ | (56 | ) | | $ | (2,005 | ) | | $ | (2,061 | ) |
| | |
| | |
| | |
| |
Total sales and revenue for full-year 2003 was $164.2 billion, up from $162.3 billion a year ago. Vehicle unit sales were 6,720,000, down slightly from 6,973,000 in 2002.
3
Ford’s 2003 accomplishments included:
| | • | | Better-than-breakeven worldwide automotive profits.* |
| | • | | Cost reductions of $3.2 billion.** |
| | • | | Successful vehicle launches, including the Ford Focus C-MAX in Europe; Jaguar XJ and Volvo S40 worldwide; and the Ford F-150, Ford Freestar and Mercury Monterey in North America. |
| | • | | A year-over-year increase in North America per unit revenue of $724, on a comparable basis. |
| | • | | A record pre-tax profit of $3.0 billion at Ford Credit. |
| | • | | Strong automotive cash position with $25.9 billion of cash, marketable and loaned securities and short-term VEBA. |
| | • | | Agreements with the United Auto Workers and Visteon Corp. |
| | • | | Ford Division’s 17th consecutive year as the best-selling vehicle brand in America. |
| | • | | More than 20 awards honoring the all-new F-150, including Truck of the Year awards from the North American Auto Writers,Motor Trendand Texas Auto Writers Association. |
* Pre-tax profits, excluding special items.
** At constant volume, mix and exchange; excluding special items.
Looking ahead, Ford Motor Company will introduce 40 new products worldwide in 2004. Key introductions include Ford Freestyle, Five Hundred and Mustang; Mercury Montego; Jaguar S-TYPE; Aston Martin DB9 coupe; Volvo V50; and the world’s first, no-compromise, full hybrid, the Ford Escape Hybrid.
FOURTH QUARTER
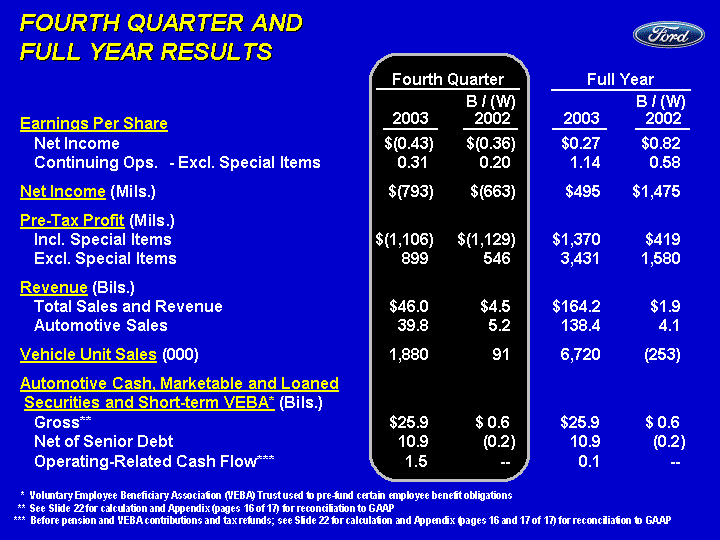
Ford reported a net loss of $793 million, or 43 cents per share, for the fourth quarter of 2003. This compares with a net loss of $130 million, or 7 cents per share, for the fourth quarter of 2002.
In the fourth quarter, Ford earned 31 cents per share from continuing operations, excluding special items, up from a comparable year-ago result of 11 cents per share.
Total sales and revenue in the fourth quarter was $46 billion, up from $41.5 billion a year ago. Worldwide vehicle unit sales rose in the fourth quarter to 1,880,000 from 1,789,000 a year ago.
4
AUTOMOTIVE SECTOR
The following is a discussion of fourth-quarter and full-year pre-tax results by our automotive operations excluding special items. Reconciliation to pre-tax U.S. GAAP results follows at the end of this document.
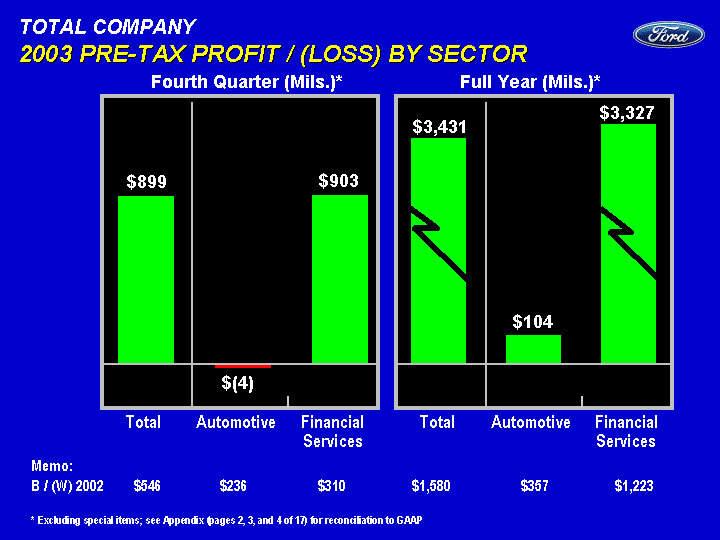
For the full year, Ford’s worldwide automotive sector earned a pre-tax profit of $104 million in 2003, a $357 million improvement from a loss of $253 million a year ago.
For the fourth quarter, Ford’s worldwide automotive operations reported a pre-tax loss of $4 million, a $236 million improvement from a year-ago loss of $240 million.
Automotive revenue for full-year 2003 was $138.4 billion, up three percent from $134.3 billion a year ago. Automotive revenue for the fourth quarter was $39.8 billion, up from $34.6 billion a year ago.
Automotive gross cash at Dec. 31, 2003 totaled $25.9 billion of cash, marketable and loaned securities and short-term VEBA.
THE AMERICAS
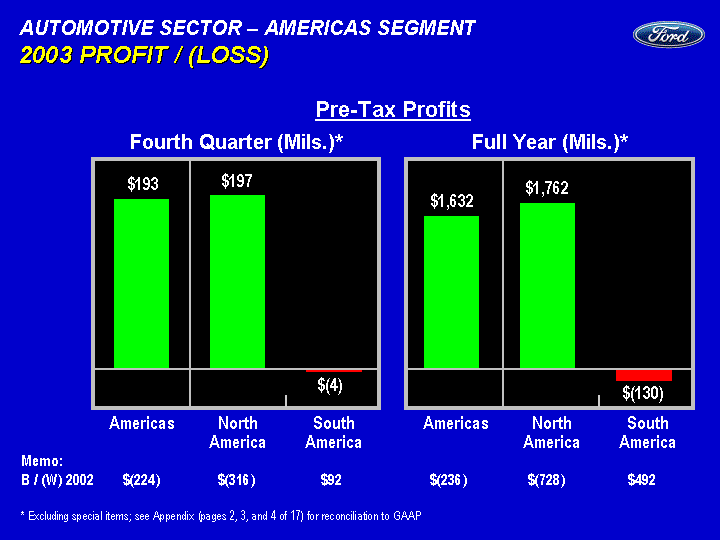
The Americas, which includes the company’s automotive operations in North and South America, reported a 2003 pre-tax profit of $1.6 billion, down $236 million from 2002.
For the fourth quarter, the Americas reported a pre-tax profit of $193 million, compared with a pre-tax profit of $417 million in 2002.
North America:Ford’s North America operations posted a full-year 2003 pre-tax profit of $1.8 billion, compared with $2.5 billion last year. The decline was primarily due to the absence of an increase in dealer stocks in 2002, unfavorable net pricing, lower market share and unfavorable exchange rates, partially offset by cost savings and favorable mix. Full-year revenue totaled $83.6 billion, down from $87.1 billion a year ago.
5
The North America automotive pre-tax profit for the fourth quarter was $197 million, down from $513 million a year ago. The decrease primarily reflected higher costs related to the introduction of new vehicles, higher pension and healthcare expenses, and unfavorable exchange rates, partially offset by cost reductions in other areas, improved mix and favorable net pricing. Revenue increased to $22.8 billion from $21.2 billion in the year-ago period.
South America:Ford’s South America operations reported a 2003 pre-tax loss of $130 million, a $492 million improvement from 2002. The improvement reflected the non-recurrence of currency devaluations in 2002, favorable mix, higher market share, improved net pricing and lower costs. Revenue was $1.9 billion, up $328 million from 2002.
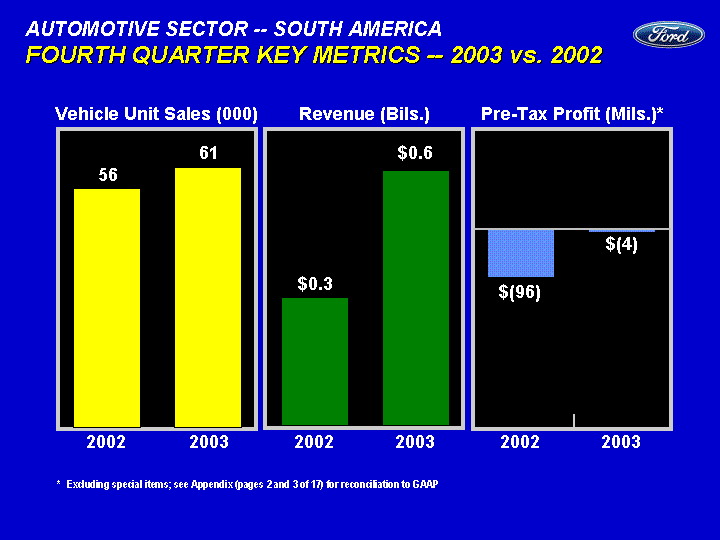
For the fourth quarter, South America’s automotive pre-tax loss totaled $4 million, a $92 million improvement from 2002. The improvement primarily reflected lower costs, favorable mix, higher market share and improved net pricing. Revenue increased to $623 million, compared to $335 million in the 2002 fourth quarter.
INTERNATIONAL AUTOMOTIVE
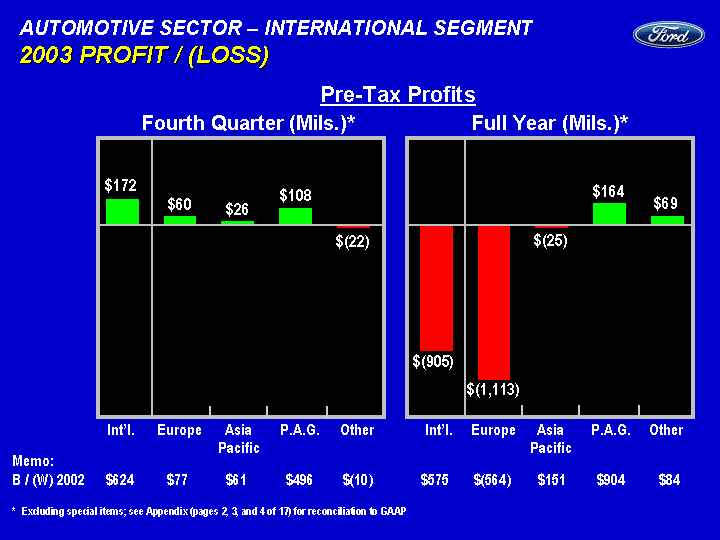
International automotive operations reported a full-year pre-tax loss of $905 million, a $575 million improvement from a 2002 loss of $1,480 million.
For the fourth quarter, International Automotive pre-tax profit totaled $172 million, an improvement of $624 million from a year-ago loss of $452 million.
Europe:Ford Europe’s automotive operations reported a pre-tax loss of $1.1 billion for 2003, compared with a loss of $549 million a year ago. The decline primarily reflected unfavorable net pricing, adverse mix, unfavorable exchange rates, and a reduction in dealer stocks, partially offset by cost reductions. Full-year revenue totaled $22.2 billion, up from $18.9 billion a year ago.
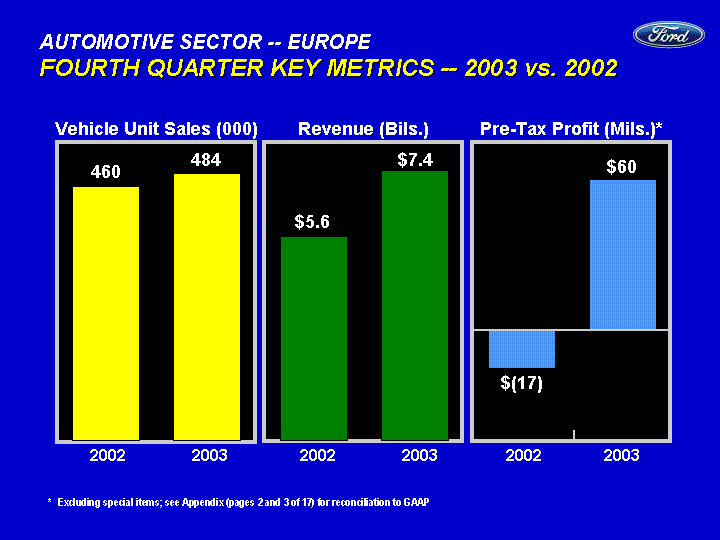
For the fourth quarter, Ford Europe reported a pre-tax profit of $60 million, an improvement of $77 million from a loss of $17 million a year ago. The improvement primarily reflected lower costs, improved results at Otosan, a joint venture in Turkey, and higher dealer stocks. These were offset by lower pricing, lower market share and unfavorable exchange. Fourth quarter revenue totaled $7.4 billion, an improvement of $1.8 billion over the year-ago period.
6
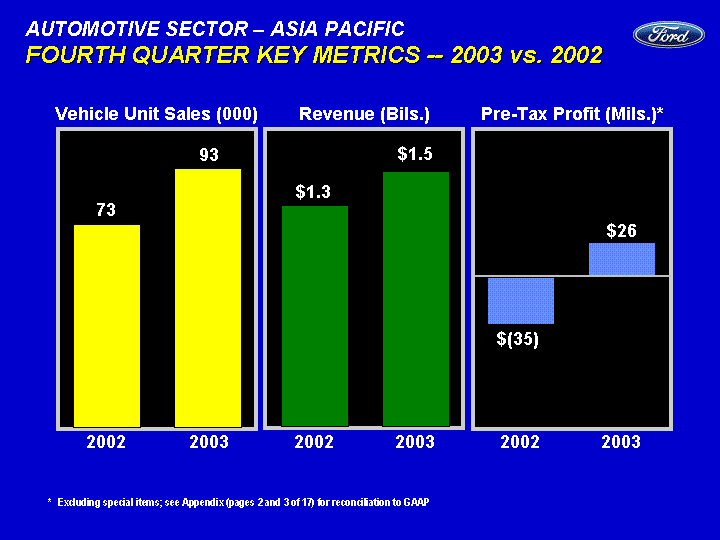
Ford Asia Pacific:Ford’s Asia Pacific automotive operations posted a loss of $25 million, an improvement of $151 million from a loss of $176 million in 2002. The improvement primarily reflected favorable exchange rates, improved net pricing, higher industry volumes in the region and improved market share. Revenue increased to $5.8 billion from $4.4 billion in 2002.
Asia Pacific’s fourth-quarter pre-tax profit totaled $26 million, a $61 million improvement from a loss of $35 million in the year-ago period. The increase in profitability is primarily explained by favorable exchange rates and lower costs, partially offset by unfavorable net pricing. Revenue increased to $1.5 billion, compared with $1.3 billion in the 2002 fourth quarter.
Premier Automotive Group:PAG reported a pre-tax profit of $164 million for 2003, compared with a loss of $740 million last year. The improvement of $904 million primarily reflected cost reductions and improved mix, partially offset by unfavorable exchange rates. Revenue increased to $24.9 billion from $21.3 billion a year ago.
PAG’s fourth-quarter pre-tax profit totaled $108 million, a $496 million improvement from a year-earlier loss of $388 million. The improvement primarily reflected cost efficiencies and favorable volume and mix, partially offset by unfavorable exchange rates. Revenue increased to $7.5 billion from $6 billion in the year-ago period.
FORD CREDIT
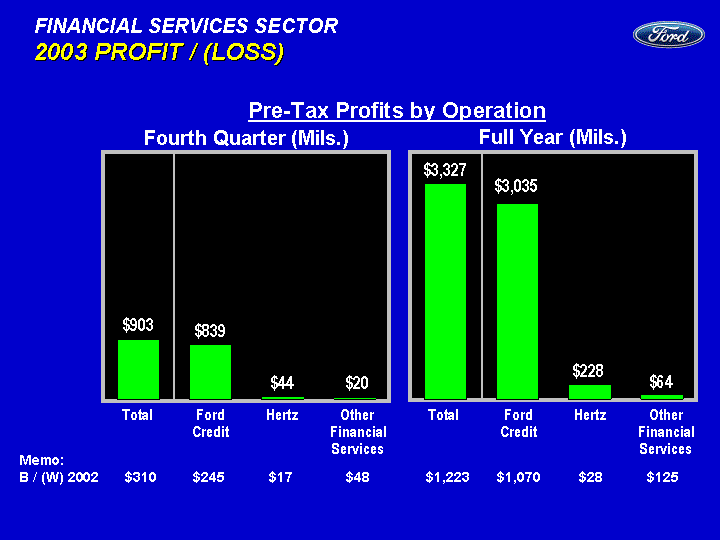
Ford Motor Credit Company reported record net income of $1.8 billion in 2003, up $583 million from earnings of $1.2 billion a year earlier. On a pre-tax basis, Ford Credit earned $3.0 billion in 2003 compared with $2.0 billion in 2002. The increase in earnings primarily reflected a lower provision for credit losses and the favorable market valuation of derivative instruments and associated exposures, partially offset by the impact of lower average net receivables.
7
In the fourth quarter of 2003, Ford Credit’s net income was $470 million, up $116 million from $354 million in the same period a year earlier. On a pre-tax basis, Ford Credit earned $839 million in the fourth quarter of 2003 compared with $594 million in 2002. The increase in earnings primarily reflected a lower provision for credit losses, the favorable market valuation of derivative instruments and associated exposures, offset partially by lower sales of receivables.
HERTZ
Hertz reported a full-year 2003 pre-tax profit of $228 million, up from $200 million in 2002. Hertz earned $44 million in the 2003 fourth quarter, up from a year-ago pre-tax profit of $27 million. The year-over-year improvements reflected strong cost performance and improved leisure demand, partially offset by lower pricing.
OUTLOOK
“Through sound execution of our plans, we have cut costs, introduced a variety of new products, significantly improved our international operations and improved overall quality,” said Chief Financial Officer Don Leclair. “This gives us increasing confidence in our ability to achieve the bottom-line goals we’ve set for 2004.”
Based on operational metrics that include continued quality improvements, regional market-share stability or gains, and continued cost reductions, the company expects full-year 2004 earnings per share of $1.20 to $1.30 from continuing operations, excluding special items. This outlook assumes 2004 industry sales of 17 million vehicles in the U.S. and 16.9 million vehicles in Europe.
Ford’s first-quarter earnings guidance is a range of 40 to 45 cents per share, based on income from continuing operations, excluding special items.
Investors and media can hear a review of the company’s full-year and fourth-quarter results by Don Leclair via conference call at 800-299-7098 (617-801-9715 for international dial-in) or on the Internet at http://www.shareholder.ford.com. The passcode for the conference call is the verbal response of “Ford Earnings Call.” Supporting presentation material will be available at the same Internet address. The presentation will begin at 9:00 a.m. EST, Jan. 22.
8
Ford Motor Company, headquartered in Dearborn, Mich., is the world’s second largest automaker, with approximately 335,000 employees in 200 markets on six continents. Its automotive brands include Aston Martin, Ford, Jaguar, Land Rover, Lincoln, Mazda, Mercury and Volvo. Its automotive-related services include Ford Credit, Quality Care and Hertz. Ford Motor Company celebrated its 100th anniversary on June 16, 2003.
9
- # # # -
Statements included herein may constitute “forward looking statements” within the meaning of the Private Securities Litigation Reform Act of 1995. These statements involve a number of risks, uncertainties, and other factors that could cause actual results to differ materially from those stated, including, without limitation:
| | • | | greater price competition in the U.S. and Europe resulting from currency fluctuations, industry overcapacity or other factors; |
| | • | | a significant decline in industry sales, particularly in the U.S. or Europe, resulting from slowing economic growth, geo-political events or other factors; |
| | • | | lower-than-anticipated market acceptance of new or existing products; |
| | • | | work stoppages at key Ford or supplier facilities or other interruptions of supplies; |
| | • | | the discovery of defects in vehicles resulting in delays in new model launches, recall campaigns or increased warranty costs; |
| | • | | increased safety, emissions, fuel economy or other regulation resulting in higher costs and/or sales restrictions; |
| | • | | unusual or significant litigation or governmental investigations arising out of alleged defects in our products or otherwise; |
| | • | | worse-than-assumed economic and demographic experience for our post-retirement benefit plans (e.g., investment returns, interest rates, health care cost trends, benefit improvements); |
| | • | | currency or commodity price fluctuations; |
| | • | | a market shift from truck sales in the U.S.; |
| | • | | economic difficulties in South America or Asia; |
| | • | | reduced availability of or higher prices for fuel; |
| | • | | labor or other constraints on our ability to restructure our business; |
| | • | | a change in our requirements under long-term supply arrangements under which we are obligated to purchase minimum quantities or pay minimum amounts; |
| | • | | a further credit rating downgrade; |
| | • | | inability to access debt or securitization markets around the world at competitive rates or in sufficient amounts; |
| | • | | higher-than-expected credit losses; |
| | • | | lower-than-anticipated residual values for leased vehicles; |
| | • | | increased price competition in the rental car industry and/or a general decline in business or leisure travel due to terrorist attacks, act of war or measures taken by governments in response thereto that negatively affect the travel industry; and |
| | • | | our inability to implement the Revitalization Plan. |
Exhibit 99.2
Ford Motor Company and Subsidiaries
SECTOR STATEMENT OF INCOME
For the Periods Ended December 31, 2003 and 2002
(in millions, except per share amounts)
| | | | | | | | | | | | | | | | | | | |
| | | | | Fourth Quarter | | | Full Year | |
| | | | |
| | |
| |
| | | | | 2003 | | | 2002 | | | 2003 | | | 2002 | |
| | | | |
| | |
| | |
| | |
| |
| | | | | (unaudited) | | | (unaudited) | | | | | |
AUTOMOTIVE | | | | | | | | | | | | | | | | |
Sales | | $ | 39,849 | | | $ | 34,615 | | | $ | 138,442 | | | $ | 134,273 | |
Costs and expenses | | | | | | | | | | | | | | | | |
| Cost of sales | | | 38,694 | | | | 32,373 | | | | 129,821 | | | | 125,043 | |
| Selling, administrative and other expenses | | | 2,878 | | | | 2,660 | | | | 10,152 | | | | 9,758 | |
| | |
| | |
| | |
| | |
| |
| | | Total costs and expenses | | | 41,572 | | | | 35,033 | | | | 139,973 | | | | 134,801 | |
| | |
| | |
| | |
| | |
| |
Operating income/(loss) | | | (1,723 | ) | | | (418 | ) | | | (1,531 | ) | | | (528 | ) |
| |
| Interest income | | | 143 | | | | 173 | | | | 870 | | | | 834 | |
| Interest expense | | | 455 | | | | 331 | | | | 1,370 | | | | 1,368 | |
| | |
| | |
| | |
| | |
| |
| | | Net interest income/(expense) | | | (312 | ) | | | (158 | ) | | | (500 | ) | | | (534 | ) |
| Equity in net income/(loss) of affiliated companies | | | 26 | | | | 6 | | | | 74 | | | | (91 | ) |
| | |
| | |
| | |
| | |
| |
Income/(loss) before income taxes — Automotive | | | (2,009 | ) | | | (570 | ) | | | (1,957 | ) | | | (1,153 | ) |
FINANCIAL SERVICES | | | | | | | | | | | | | | | | |
Revenues | | | 6,159 | | | | 6,859 | | | | 25,754 | | | | 27,983 | |
Costs and expenses | | | | | | | | | | | | | | | | |
| Interest expense | | | 1,526 | | | | 1,726 | | | | 6,320 | | | | 7,468 | |
| Depreciation | | | 1,899 | | | | 2,582 | | | | 8,779 | | | | 10,162 | |
| Operating and other expenses | | | 1,275 | | | | 1,205 | | | | 4,971 | | | | 4,974 | |
| Provision for credit and insurance losses | | | 556 | | | | 753 | | | | 2,357 | | | | 3,275 | |
| | |
| | |
| | |
| | |
| |
| | | Total costs and expenses | | | 5,256 | | | | 6,266 | | | | 22,427 | | | | 25,879 | |
| | |
| | |
| | |
| | |
| |
Income/(loss) before income taxes — Financial Services | | | 903 | | | | 593 | | | | 3,327 | | | | 2,104 | |
| | |
| | |
| | |
| | |
| |
TOTAL COMPANY | | | | | | | | | | | | | | | | |
Income/(loss) before income taxes | | | (1,106 | ) | | | 23 | | | | 1,370 | | | | 951 | |
| Provision for/(benefit from) income taxes | | | (532 | ) | | | (47 | ) | | | 135 | | | | 301 | |
| | |
| | |
| | |
| | |
| |
Income/(loss) before minority interests | | | (574 | ) | | | 70 | | | | 1,235 | | | | 650 | |
| Minority interests in net income/(loss) of subsidiaries | | | 69 | | | | 82 | | | | 314 | | | | 367 | |
| | |
| | |
| | |
| | |
| |
Income/(loss) from continuing operations | | | (643 | ) | | | (12 | ) | | | 921 | | | | 283 | |
| Income/(loss) from discontinued/held-for-sale operations | | | (1 | ) | | | (14 | ) | | | (8 | ) | | | (62 | ) |
| Loss on disposal of discontinued/held-for-sale operations | | | (149 | ) | | | (104 | ) | | | (154 | ) | | | (199 | ) |
| Cumulative effect of change in accounting principle | | | — | | | | — | | | | (264 | ) | | | (1,002 | ) |
| | |
| | |
| | |
| | |
| |
Net income/(loss) | | $ | (793 | ) | | $ | (130 | ) | | $ | 495 | | | $ | (980 | ) |
| | |
| | |
| | |
| | |
| |
| Income/(loss) attributable to Common and Class B Stock after Preferred Stock dividends | | $ | (793 | ) | | $ | (134 | ) | | $ | 495 | | | $ | (995 | ) |
| Average number of shares of Common and Class B Stock outstanding | | | 1,833 | | | | 1,833 | | | | 1,832 | | | | 1,819 | |
AMOUNTS PER SHARE OF COMMON AND CLASS B STOCK | | | | | | | | | | | | | | | | |
Basic income/(loss) | | | | | | | | | | | | | | | | |
| | Income/(loss) from continuing operations | | $ | (0.35 | ) | | $ | (0.01 | ) | | $ | 0.50 | | | $ | 0.15 | |
| | Income/(loss) from discontinued/held-for-sale operations | | | — | | | | (0.01 | ) | | | — | | | | (0.04 | ) |
| | Loss on disposal of discontinued/held-for-sale operations | | | (0.08 | ) | | | (0.05 | ) | | | (0.09 | ) | | | (0.11 | ) |
| | Cumulative effect of change in accounting principle | | | — | | | | — | | | | (0.14 | ) | | | (0.55 | ) |
| | |
| | |
| | |
| | |
| |
| | Net income/(loss) | | $ | (0.43 | ) | | $ | (0.07 | ) | | $ | 0.27 | | | $ | (0.55 | ) |
| | |
| | |
| | |
| | |
| |
Diluted income/(loss) | | | | | | | | | | | | | | | | |
| | Income/(loss) from continuing operations | | $ | (0.35 | ) | | $ | (0.01 | ) | | $ | 0.50 | | | $ | 0.15 | |
| | Income/(loss) from discontinued/held-for-sale operations | | | — | | | | (0.01 | ) | | | — | | | | (0.03 | ) |
| | Loss on disposal of discontinued/held-for-sale operations | | | (0.08 | ) | | | (0.05 | ) | | | (0.09 | ) | | | (0.11 | ) |
| | Cumulative effect of change in accounting principle | | | — | | | | — | | | | (0.14 | ) | | | (0.55 | ) |
| | |
| | |
| | |
| | |
| |
| | Net income/(loss) | | $ | (0.43 | ) | | $ | (0.07 | ) | | $ | 0.27 | | | $ | (0.54 | ) |
| | |
| | |
| | |
| | |
| |
Cash dividends | | $ | 0.10 | | | $ | 0.10 | | | $ | 0.40 | | | $ | 0.40 | |
Exhibit 99.3
Ford Motor Company and Subsidiaries
CONSOLIDATED STATEMENT OF INCOME
For the Periods Ended December 31, 2003 and 2002
(in millions, except per share amounts)
| | | | | | | | | | | | | | | | | | | |
| | | | | Fourth Quarter | | | Full Year | |
| | | | |
| | |
| |
| | | | | 2003 | | | 2002 | | | 2003 | | | 2002 | |
| | | | |
| | |
| | |
| | |
| |
| | | | | (unaudited) | | | (unaudited) | | | | | |
Sales and revenues | | | | | | | | | | | | | | | | |
| Automotive sales | | $ | 39,849 | | | $ | 34,615 | | | $ | 138,442 | | | $ | 134,273 | |
| Financial Services revenue | | | 6,159 | | | | 6,859 | | | | 25,754 | | | | 27,983 | |
| | |
| | |
| | |
| | |
| |
| | | Total sales and revenues | | | 46,008 | | | | 41,474 | | | | 164,196 | | | | 162,256 | |
| Automotive interest income | | | 143 | | | | 173 | | | | 870 | | | | 834 | |
Costs and expenses | | | | | | | | | | | | | | | | |
| Cost of sales | | | 38,694 | | | | 32,373 | | | | 129,821 | | | | 125,043 | |
| Selling, administrative and other expenses | | | 6,052 | | | | 6,447 | | | | 23,902 | | | | 24,894 | |
| Interest expense | | | 1,981 | | | | 2,057 | | | | 7,690 | | | | 8,836 | |
| Provision for credit and insurance losses | | | 556 | | | | 753 | | | | 2,357 | | | | 3,275 | |
| | |
| | |
| | |
| | |
| |
| | | Total costs and expenses | | | 47,283 | | | | 41,630 | | | | 163,770 | | | | 162,048 | |
| Automotive equity in net income/(loss) of affiliated companies | | | 26 | | | | 6 | | | | 74 | | | | (91 | ) |
| | |
| | |
| | |
| | |
| |
Income/(loss) before income taxes | | | (1,106 | ) | | | 23 | | | | 1,370 | | | | 951 | |
| Provision for/(benefit from) income taxes | | | (532 | ) | | | (47 | ) | | | 135 | | | | 301 | |
| | |
| | |
| | |
| | |
| |
Income/(loss) before minority interests | | | (574 | ) | | | 70 | | | | 1,235 | | | | 650 | |
| Minority interests in net income/(loss) of subsidiaries | | | 69 | | | | 82 | | | | 314 | | | | 367 | |
| | |
| | |
| | |
| | |
| |
Income/(loss) from continuing operations | | | (643 | ) | | | (12 | ) | | | 921 | | | | 283 | |
| Income/(loss) from discontinued/held-for-sale operations | | | (1 | ) | | | (14 | ) | | | (8 | ) | | | (62 | ) |
| Loss on disposal of discontinued/held-for-sale operations | | | (149 | ) | | | (104 | ) | | | (154 | ) | | | (199 | ) |
| Cumulative effect of change in accounting principle | | | — | | | | — | | | | (264 | ) | | | (1,002 | ) |
| | |
| | |
| | |
| | |
| |
Net income/(loss) | | $ | (793 | ) | | $ | (130 | ) | | $ | 495 | | | $ | (980 | ) |
| | |
| | |
| | |
| | |
| |
| Income/(loss) attributable to Common and Class B Stock after Preferred Stock dividends | | $ | (793 | ) | | $ | (134 | ) | | $ | 495 | | | $ | (995 | ) |
| Average number of shares of Common and Class B Stock outstanding | | | 1,833 | | | | 1,833 | | | | 1,832 | | | | 1,819 | |
AMOUNTS PER SHARE OF COMMON AND CLASS B STOCK | | | | | | | | | | | | | | | | |
Basic income/(loss) | | | | | | | | | | | | | | | | |
| | Income/(loss) from continuing operations | | $ | (0.35 | ) | | $ | (0.01 | ) | | $ | 0.50 | | | $ | 0.15 | |
| | Income/(loss) from discontinued/held-for-sale operations | | | — | | | | (0.01 | ) | | | — | | | | (0.04 | ) |
| | Loss on disposal of discontinued/held-for-sale operations | | | (0.08 | ) | | | (0.05 | ) | | | (0.09 | ) | | | (0.11 | ) |
| | Cumulative effect of change in accounting principle | | | — | | | | — | | | | (0.14 | ) | | | (0.55 | ) |
| | |
| | |
| | |
| | |
| |
| | Net income/(loss) | | $ | (0.43 | ) | | $ | (0.07 | ) | | $ | 0.27 | | | $ | (0.55 | ) |
| | |
| | |
| | |
| | |
| |
Diluted income/(loss) | | | | | | | | | | | | | | | | |
| | Income/(loss) from continuing operations | | $ | (0.35 | ) | | $ | (0.01 | ) | | $ | 0.50 | | | $ | 0.15 | |
| | Income/(loss) from discontinued/held-for-sale operations | | | — | | | | (0.01 | ) | | | — | | | | (0.03 | ) |
| | Loss on disposal of discontinued/held-for-sale operations | | | (0.08 | ) | | | (0.05 | ) | | | (0.09 | ) | | | (0.11 | ) |
| | Cumulative effect of change in accounting principle | | | — | | | | — | | | | (0.14 | ) | | | (0.55 | ) |
| | |
| | |
| | |
| | |
| |
| | Net income/(loss) | | $ | (0.43 | ) | | $ | (0.07 | ) | | $ | 0.27 | | | $ | (0.54 | ) |
| | |
| | |
| | |
| | |
| |
Cash dividends | | $ | 0.10 | | | $ | 0.10 | | | $ | 0.40 | | | $ | 0.40 | |
Exhibit 99.4
Ford Motor Company and Subsidiaries
SECTOR BALANCE SHEET
(in millions)
| | | | | | | | | | | | |
| | | | | | December 31, | | | December 31, | |
| | | | | | 2003 | | | 2002 | |
| | | | | |
| | |
| |
| | | | | | (unaudited) | | | | | |
ASSETS | | | | | | | | |
Automotive | | | | | | | | |
| Cash and cash equivalents | | $ | 5,427 | | | $ | 5,157 | |
| Marketable securities | | | 10,749 | | | | 17,464 | |
| Loaned securities | | | 5,667 | | | | — | |
| | |
| | |
| |
| | | | Total cash, marketable and loaned securities | | | 21,843 | | | | 22,621 | |
| Receivables, net | | | 2,721 | | | | 2,047 | |
| Inventories | | | 9,181 | | | | 6,977 | |
| Deferred income taxes | | | 3,225 | | | | 3,462 | |
| Other current assets | | | 6,052 | | | | 4,547 | |
| Current receivable from Financial Services | | | — | | | | 1,062 | |
| | |
| | |
| |
| | | | Total current assets | | | 43,022 | | | | 40,716 | |
| Equity in net assets of affiliated companies | | | 1,930 | | | | 2,470 | |
| Net property | | | 41,993 | | | | 36,352 | |
| Deferred income taxes | | | 12,092 | | | | 11,694 | |
| Goodwill | | | 5,378 | | | | 4,719 | |
| Other intangible assets | | | 876 | | | | 812 | |
| Assets of discontinued/held-for-sale operations | | | 68 | | | | 246 | |
| Other assets | | | 15,282 | | | | 10,781 | |
| | |
| | |
| |
| | | | Total Automotive assets | | | 120,641 | | | | 107,790 | |
Financial Services | | | | | | | | |
| Cash and cash equivalents | | | 16,343 | | | | 7,064 | |
| Investments in securities | | | 1,123 | | | | 807 | |
| Finance receivables, net | | | 110,893 | | | | 97,007 | |
| Net investment in operating leases | | | 31,859 | | | | 39,727 | |
| Retained interest in sold receivables | | | 13,017 | | | | 17,618 | |
| Goodwill | | | 769 | | | | 749 | |
| Other intangible assets | | | 239 | | | | 248 | |
| Assets of discontinued/held-for-sale operations | | | 388 | | | | 2,783 | |
| Other assets | | | 17,292 | | | | 16,626 | |
| Receivable from Automotive | | | 3,356 | | | | 4,803 | |
| | |
| | |
| |
| | | | Total Financial Services assets | | | 195,279 | | | | 187,432 | |
| | |
| | |
| |
| | | | Total assets | | $ | 315,920 | | | $ | 295,222 | |
| | |
| | |
| |
LIABILITIES AND STOCKHOLDERS’ EQUITY | | | | | | | | |
Automotive | | | | | | | | |
| Trade payables | | $ | 15,289 | | | $ | 14,579 | |
| Other payables | | | 2,942 | | | | 2,471 | |
| Accrued liabilities | | | 32,171 | | | | 27,615 | |
| Debt payable within one year | | | 1,806 | | | | 551 | |
| Current payable to Financial Services | | | 124 | | | | — | |
| | |
| | |
| |
| | | | Total current liabilities | | | 52,332 | | | | 45,216 | |
| |
| Senior debt | | | 13,832 | | | | 13,607 | |
| Subordinated debt | | | 5,155 | | | | — | |
| | |
| | |
| |
| | | Total long-term debt | | | 18,987 | | | | 13,607 | |
| Other liabilities | | | 45,104 | | | | 46,887 | |
| Deferred income taxes | | | 2,352 | | | | 303 | |
| Liabilities of discontinued/held-for-sale operations | | | 94 | | | | 213 | |
| Payable to Financial Services | | | 3,232 | | | | 4,803 | |
| | |
| | |
| |
| | | | Total Automotive liabilities | | | 122,101 | | | | 111,029 | |
Financial Services | | | | | | | | |
| Payables | | | 2,189 | | | | 1,886 | |
| Debt | | | 159,011 | | | | 148,054 | |
| Deferred income taxes | | | 11,061 | | | | 11,629 | |
| Other liabilities and deferred income | | | 9,211 | | | | 9,441 | |
| Liabilities of discontinued/held-for-sale operations | | | 37 | | | | 861 | |
| Payable to Automotive | | | — | | | | 1,062 | |
| | |
| | |
| |
| | | | Total Financial Services liabilities | | | 181,509 | | | | 172,933 | |
| Company-obligated mandatorily redeemable preferred securities of subsidiary trusts holding solely junior subordinated debentures of the Company | | | — | | | | 5,670 | |
| Minority interests | | | 659 | | | | — | |
Stockholders’ equity | | | | | | | | |
| Capital stock | | | | | | | | |
| | | Common Stock, par value $0.01 per share (1,837 million shares issued) | | 18 | | | | 18 | |
| | | Class B Stock, par value $0.01 per share (71 million shares issued) | | 1 | | | | 1 | |
| Capital in excess of par value of stock | | | 5,374 | | | | 5,420 | |
| Accumulated other comprehensive income/(loss) | | | (414 | ) | | | (6,531 | ) |
| Treasury stock | | | (1,749 | ) | | | (1,977 | ) |
| Earnings retained for use in business | | | 8,421 | | | | 8,659 | |
| | |
| | |
| |
| | | | Total stockholders’ equity | | | 11,651 | | | | 5,590 | |
| | |
| | |
| |
| | | | Total liabilities and stockholders’ equity | | $ | 315,920 | | | $ | 295,222 | |
| | |
| | |
| |
Exhibit 99.5
Ford Motor Company and Subsidiaries
CONSOLIDATED BALANCE SHEET
(in millions)
| | | | | | | | | | | | |
| | | | | | December 31, | | | December 31, | |
| | | | | | 2003 | | | 2002 | |
| | | | | |
| | |
| |
| | | | | | (unaudited) | | | | | |
ASSETS | | | | | | | | |
| Cash and cash equivalents | | $ | 21,770 | | | $ | 12,221 | |
| Marketable securities | | | 11,872 | | | | 18,271 | |
| Loaned securities | | | 5,667 | | | | — | |
| Receivables, net | | | 2,721 | | | | 2,047 | |
| Finance receivables, net | | | 110,893 | | | | 97,007 | |
| Net investment in operating leases | | | 31,859 | | | | 39,727 | |
| Retained interest in sold receivables | | | 13,017 | | | | 17,618 | |
| Inventories | | | 9,181 | | | | 6,977 | |
| Equity in net assets of affiliated companies | | | 2,959 | | | | 3,569 | |
| Net property | | | 43,598 | | | | 37,923 | |
| Deferred income taxes | | | 15,359 | | | | 15,213 | |
| Goodwill | | | 6,147 | | | | 5,468 | |
| Other intangible assets | | | 1,115 | | | | 1,060 | |
| Assets of discontinued/held-for-sale operations | | | 456 | | | | 3,029 | |
| Other assets | | | 35,950 | | | | 29,227 | |
| | |
| | |
| |
| | | Total assets | | $ | 312,564 | | | $ | 289,357 | |
| | |
| | |
| |
LIABILITIES AND STOCKHOLDERS’ EQUITY | | | | | | | | |
| Payables | | $ | 20,420 | | | $ | 18,936 | |
| Accrued liabilities | | | 29,591 | | | | 25,059 | |
| Debt | | | 179,804 | | | | 162,212 | |
| Other liabilities and deferred income | | | 53,899 | | | | 56,270 | |
| Deferred income taxes | | | 16,409 | | | | 14,546 | |
| Liabilities of discontinued/held-for-sale operations | | | 131 | | | | 1,074 | |
| | |
| | |
| |
| | | Total liabilities | | | 300,254 | | | | 278,097 | |
| Company-obligated mandatorily redeemable preferred securities of subsidiary trusts holding solely junior subordinated debentures of the Company | | | — | | | | 5,670 | |
| Minority interests | | | 659 | | | | — | |
Stockholders’ equity | | | | | | | | |
| Capital stock | | | | | | | | |
| | Common Stock, par value $0.01 per share (1,837 million shares issued) | | | 18 | | | | 18 | |
| | Class B Stock, par value $0.01 per share (71 million shares issued) | | | 1 | | | | 1 | |
| Capital in excess of par value of stock | | | 5,374 | | | | 5,420 | |
| Accumulated other comprehensive income/(loss) | | | (414 | ) | | | (6,531 | ) |
| Treasury stock | | | (1,749 | ) | | | (1,977 | ) |
| Earnings retained for use in business | | | 8,421 | | | | 8,659 | |
| | |
| | |
| |
| | | | Total stockholders’ equity | | | 11,651 | | | | 5,590 | |
| | |
| | |
| |
| | | | Total liabilities and stockholders’ equity | | $ | 312,564 | | | $ | 289,357 | |
| | |
| | |
| |
Exhibit 99.6
Ford Motor Company and Subsidiaries
CONDENSED SECTOR STATEMENT OF CASH FLOWS
For the Periods Ended December 31, 2003 and 2002
(in millions)
| | | | | | | | | | | | | | | | | | | |
| | | | | Full Year 2003 | | | Full Year 2002 | |
| | | | |
| | |
| |
| | | | | | | | | Financial | | | | | | | Financial | |
| | | | | Automotive | | | Services | | | Automotive | | | Services | |
| | | | |
| | |
| | |
| | |
| |
| | | | | (unaudited) | | | | | | | | | |
Cash and cash equivalents at January 1 | | $ | 5,157 | | | $ | 7,064 | | | $ | 4,053 | | | $ | 3,131 | |
| | | | | | | | | | | | | | |
| Cash flows from operating activities before securities trading | | | 1,336 | | | | 17,052 | | | | 9,479 | | | | 15,261 | |
| Net sales/(purchases) of trading securities | | | 1,282 | | | | 525 | | | | (6,206 | ) | | | (23 | ) |
| | |
| | |
| | |
| | |
| |
| | | Net cash flows from operating activities | | | 2,618 | | | | 17,577 | | | | 3,273 | | | | 15,238 | |
Cash flows from investing activities | | | | | | | | | | | | | | | | |
| | Capital expenditures | | | (7,370 | ) | | | (379 | ) | | | (6,774 | ) | | | (502 | ) |
| | Acquisitions of receivables and lease investments | | | — | | | | (62,980 | ) | | | — | | | | (81,690 | ) |
| | Collections of receivables and lease investments | | | — | | | | 42,727 | | | | — | | | | 45,767 | |
| | Net acquisitions of daily rental vehicles | | | — | | | | (1,505 | ) | | | — | | | | (1,846 | ) |
| | Purchases of securities | | | (8,925 | ) | | | (1,149 | ) | | | (3,446 | ) | | | (609 | ) |
| | Sales and maturities of securities | | | 8,673 | | | | 709 | | | | 3,445 | | | | 479 | |
| | Proceeds from sales of receivables and lease investments | | | — | | | | 21,145 | | | | — | | | | 41,289 | |
| | Proceeds from sale of businesses | | | 77 | | | | 204 | | | | 257 | | | | — | |
| | Repayment of debt from discontinued operations | | | — | | | | 1,421 | | | | — | | | | — | |
| | Net investing activity with Financial Services | | | 3,708 | | | | — | | | | 1,053 | | | | — | |
| | Cash paid for acquisitions | | | — | | | | — | | | | (289 | ) | | | — | |
| | Cash recognized on initial consolidation of joint ventures | | | 256 | | | | — | | | | — | | | | — | |
| | Other | | | 716 | | | | 55 | | | | — | | | | 407 | |
| | |
| | |
| | |
| | |
| |
| | | Net cash (used in)/provided by investing activities | | | (2,865 | ) | | | 248 | | | | (5,754 | ) | | | 3,295 | |
Cash flows from financing activities | | | | | | | | | | | | | | | | |
| | Cash dividends | | | (733 | ) | | | — | | | | (743 | ) | | | — | |
| | Net sales/(purchases) of Common Stock | | | 9 | | | | — | | | | 287 | | | | — | |
| | Proceeds from mandatorily redeemable convertible preferred securities | | | — | | | | — | | | | 4,900 | | | | — | |
| | Preferred Stock — Series B redemption | | | — | | | | — | | | | (177 | ) | | | — | |
| | Changes in short-term debt | | | (237 | ) | | | 1,542 | | | | (31 | ) | | | (14,140 | ) |
| | Proceeds from issuance of other debt | | | 1,144 | | | | 21,942 | | | | 318 | | | | 15,524 | |
| | Principal payments on other debt | | | (1,097 | ) | | | (27,683 | ) | | | (859 | ) | | | (15,760 | ) |
| | Net financing activity with Automotive | | | — | | | | (3,708 | ) | | | — | | | | (1,053 | ) |
| | Other | | | (15 | ) | | | (4 | ) | | | (23 | ) | | | 369 | |
| | |
| | |
| | |
| | |
| |
| | | Net cash (used in)/provided by financing activities | | | (929 | ) | | | (7,911 | ) | | | 3,672 | | | | (15,060 | ) |
| Effect of exchange rate changes on cash | | | 260 | | | | 551 | | | | 37 | | | | 336 | |
| Net transactions with Automotive/Financial Services | | | 1,186 | | | | (1,186 | ) | | | (124 | ) | | | 124 | |
| | |
| | |
| | |
| | |
| |
| | | Net increase/(decrease) in cash and cash equivalents | | | 270 | | | | 9,279 | | | | 1,104 | | | | 3,933 | |
| | |
| | |
| | |
| | |
| |
Cash and cash equivalents at December 31 | | $ | 5,427 | | | $ | 16,343 | | | $ | 5,157 | | | $ | 7,064 | |
| | |
| | |
| | |
| | |
| |
Exhibit 99.7
Ford Motor Company and Subsidiaries
CONDENSED CONSOLIDATED STATEMENT OF CASH FLOWS
For the Periods Ended December 31, 2003 and 2002
(in millions)
| | | | | | | | | | | |
| | | | | Full Year | |
| | | | |
| |
| | | | | 2003 | | | 2002 | |
| | | | |
| | |
| |
| | | | | (unaudited) | | | | | |
Cash and cash equivalents at January 1 | | $ | 12,221 | | | $ | 7,184 | |
| |
| Cash flows from operating activities before securities trading | | | 18,388 | | | | 24,740 | |
| Net sales/(purchases) of trading securities | | | 1,807 | | | | (6,229 | ) |
| | |
| | |
| |
| | | Net cash flows from operating activities | | | 20,195 | | | | 18,511 | |
Cash flows from investing activities | | | | | | | | |
| | Capital expenditures | | | (7,749 | ) | | | (7,276 | ) |
| | Acquisitions of receivables and lease investments | | | (62,980 | ) | | | (81,690 | ) |
| | Collections of receivables and lease investments | | | 42,727 | | | | 45,767 | |
| | Net acquisitions of daily rental vehicles | | | (1,505 | ) | | | (1,846 | ) |
| | Purchases of securities | | | (10,074 | ) | | | (4,055 | ) |
| | Sales and maturities of securities | | | 9,382 | | | | 3,924 | |
| | Proceeds from sales of receivables and lease investments | | | 21,145 | | | | 41,289 | |
| | Proceeds from sale of businesses | | | 281 | | | | 257 | |
| | Repayment of debt from discontinued operations | | | 1,421 | | | | — | |
| | Cash paid for acquisitions | | | — | | | | (289 | ) |
| | Cash recognized on initial consolidation of joint ventures | | | 256 | | | | — | |
| | Other | | | 771 | | | | 407 | |
| | |
| | |
| |
| | | Net cash (used in)/provided by investing activities | | | (6,325 | ) | | | (3,512 | ) |
Cash flows from financing activities | | | | | | | | |
| | Cash dividends | | | (733 | ) | | | (743 | ) |
| | Net sales/(purchases) of Common Stock | | | 9 | | | | 287 | |
| | Proceeds from mandatorily redeemable convertible preferred securities | | | — | | | | 4,900 | |
| | Preferred Stock — Series B redemption | | | — | | | | (177 | ) |
| | Changes in short-term debt | | | 1,305 | | | | (14,171 | ) |
| | Proceeds from issuance of other debt | | | 23,086 | | | | 15,842 | |
| | Principal payments on other debt | | | (28,780 | ) | | | (16,619 | ) |
| | Other | | | (19 | ) | | | 346 | |
| | |
| | |
| |
| | | Net cash (used in)/provided by financing activities | | | (5,132 | ) | | | (10,335 | ) |
| Effect of exchange rate changes on cash | | | 811 | | | | 373 | |
| | |
| | |
| |
| | | Net increase/(decrease) in cash and cash equivalents | | | 9,549 | | | | 5,037 | |
| | |
| | |
| |
Cash and cash equivalents at December 31 | | $ | 21,770 | | | $ | 12,221 | |
| | |
| | |
| |
Exhibit 99.8

| FOURTH QUARTER AND FULL YEAR 2003 EARNINGS REVIEW JANUARY 22, 2004 |

| 2003 YEAR IN REVIEW Achieved pre-tax automotive breakeven* Exceeded expectations for cost savings Improved quality Successful vehicle launches, including F-150 and Focus C-Max Continued progress on unit revenues in North America P.A.G. profitable Substantial improvement in South America and Asia Pacific Record earnings at Ford Credit Maintained strong liquidity position Completed agreements with UAW and Visteon Global net pricing pressure Market share performance Cost pressures Product cost Pension and Healthcare costs Need to improve results in Europe Accomplishments Continuing Challenges * Excluding special items |
SLIDE 1
| FOURTH QUARTER 2003 SUMMARY Earnings per share of $0.31 from continuing operations, excluding special items, and net income of $(0.43) The Americas North America per unit revenue up over $700 per unit compared with a year ago Market share loss in North America reflected primarily discontinued vehicles and reduction in daily rental business South America essentially breakeven International Operations showed significant improvement Delivered operating profits at P.A.G., Europe, and Asia Pacific Record earnings at Ford Credit Strong automotive liquidity - Gross cash at $25.9 billion |
SLIDE 2
| Earnings Per Share Net Income $(0.43 ) $(0.36 ) $0.27 $0.82 Continuing Ops. - Excl. Special Items 0.31 0.20 1.14 0.58 Net Income (Mils.) $(793 ) $(663 ) $495 $1,475 Pre-Tax Profit (Mils.) Incl. Special Items $(1,106 ) $(1,129 ) $1,370 $419 Excl. Special Items 899 546 3,431 1,580 Revenue (Bils.) Total Sales and Revenue $46.0 $4.5 $164.2 $1.9 Automotive Sales 39.8 5.2 138.4 4.1 Vehicle Unit Sales (000) 1,880 91 6,720 (253) Automotive Cash, Marketable and Loaned Securities and Short-term VEBA* (Bils.) Gross** $25.9 $ 0.6 $25.9 $ 0.6 Net of Senior Debt 10.9 (0.2 ) 10.9 (0.2 ) Operating-Related Cash Flow*** 1.5 -- 0.1 -- FOURTH QUARTER AND FULL YEAR RESULTS 2003 B / (W) 2002 Fourth Quarter 2003 B / (W) 2002 Full Year * Voluntary Employee Beneficiary Association (VEBA) Trust used to pre-fund certain employee benefit obligations ** See Slide 22 for calculation and Appendix (pages 16 of 17) for reconciliation to GAAP *** Before pension and VEBA contributions and tax refunds; see Slide 22 for calculation and Appendix (pages 16 and 17 of 17) for reconciliation to GAAP |
SLIDE 3

| INCOME FROM CONTINUING OPERATIONS EXCLUDING SPECIAL ITEMS COMPARED WITH NET INCOME Memo: Pre-Tax Profit (Mils.) Earnings Per Share* Memo: Pre-Tax Profit (Mils.) Fourth Quarter Full Year Earnings Per Share* * Earnings per share from continuing operations is calculated on a basis that includes pre-tax profit, provision for taxes, and minority interest Income from Continuing Operations Excluding Special Items $ 0.31 $ 899 $ 1.14 $ 3,431 Special Items - European Restructuring $(0.14 ) $ (457 ) $(0.16 ) $ (513 ) - Visteon Agreement (0.47 ) (1,597 ) (0.47 ) (1,597 ) - Other Non-Core Businesses 0.02 49 0.02 49 Dilution Effect of Special Items (0.07 ) -- (0.03 ) -- Total Special Items $(0.66 ) $(2,005 ) $(0.64 ) $(2,061 ) Income from Continuing Operations $(0.35 ) $(1,106 ) $0.50 $ 1,370 Cumul. Effect of Change in Accounting Principle 0 (0.14 ) Discontinued Operations (0.08 ) (0.09 ) Net Income $(0.43 ) $0.27 |
SLIDE 4
| 2003 FULL YEAR MILESTONES Planning Assumptions Industry Volume -- U.S. 16.5 million units 17.0 -- Europe 17.0 million units 17.0 Net Pricing* -- U.S. (Ford / LM) Zero (0.6)% -- Europe (Ford) 1% (1.7)% Physicals Market Share Improve in all regions Mixed Quality Improve in all regions Improved Automotive Cost Performance** Improve by at least $500 million $3.2 Bils. Capital Spending $8 billion $7.4 Bils. Financial Results Automotive Income Before Taxes Breakeven (Excl. Special Items) $104 Mils. Operating-Related Cash Flow*** Breakeven $0.1 Bils. Ford Credit - Improve cash contribution to Parent $3.7 Bils. - Maintain managed leverage in low 13.0 to 1 end of 13-14 to 1 range**** 2003 Milestone * See Appendix (page 9 of 17) for reconciliation to GAAP ** Calculated at constant volume, mix, and exchange (excluding special items) *** See Slide 22 and Appendix (pages 16 and 17 of 17) for reconciliation to GAAP **** See Appendix (pages 13, 14, and 15 of 17) for calculation, definitions and reconciliation to GAAP Base Full Year Results |
SLIDE 5
| TOTAL COMPANY 2003 PRE-TAX PROFIT / (LOSS) BY SECTOR Full Year (Mils.)* Financial Services Total Automotive Total Automotive Fin Svcs 2Q 800 104 850 $3,431 $104 $3,327 * Excluding special items; see Appendix (pages 2, 3, and 4 of 17) for reconciliation to GAAP Total Auto Fin Svcs 2Q 899 -20 903 Financial Services Automotive $(4) $903 Memo: B / (W) 2002 $546 $236 $310 $1,580 $357 $1,223 Fourth Quarter (Mils.)* $899 Total |
SLIDE 6

| 2003 AUTOMOTIVE PRE-TAX PROFIT COMPARED WITH 2002 Fourth Quarter (Bils.)* * Excluding special items; see Appendix (pages 2, 3 and 4 of 17) for reconciliation to GAAP Full Year (Bils.)* 2002 2003 Volume Revenue Cost Other -300 100 -1500 -1000 3200 -300 $(1.0) $(1.5) 2002 Net Pricing Cost Perf. $3.2 Volume / Mix $(0.3) 2003 $0.1 $0.4 2002 2003 Volume Revenue Cost Other -200 3 100 0 500 -400 $0 $0.1 Net Pricing Cost Perf. $0.5 Volume / Mix 2003 $0 $(0.4) Other 2002 $(0.2) $0.2 Other $(0.3) |
SLIDE 7
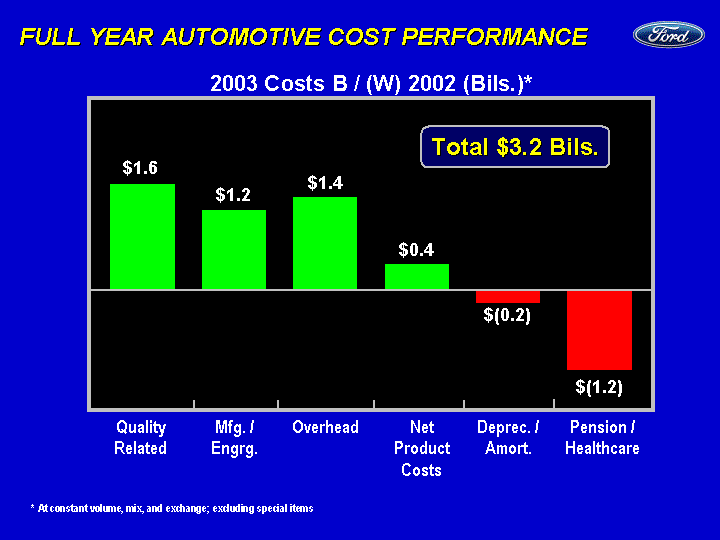
| FULL YEAR AUTOMOTIVE COST PERFORMANCE Quality Mfg. Eng Overhead Net Product D&A Pension 1.6 1.2 1.4 0.4 -0.2 -1.2 $0.4 $1.6 $(1.2) $(0.2) $1.2 $1.4 2003 Costs B / (W) 2002 (Bils.)* Net Product Costs Quality Related Pension / Healthcare Deprec. / Amort. Mfg. / Engrg. Overhead * At constant volume, mix, and exchange; excluding special items Total $3.2 Bils. |
SLIDE 8
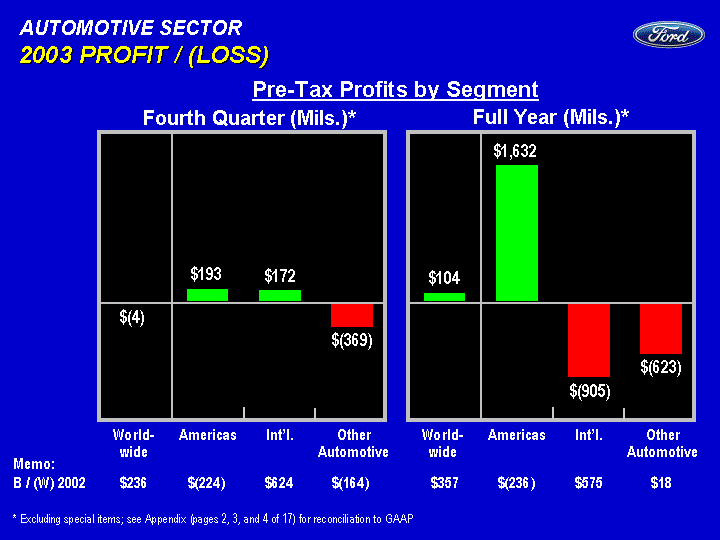
| AUTOMOTIVE SECTOR 2003 PROFIT / (LOSS) WW Americas Int'l Other 2Q -4 193 172 -369 World- wide Other Automotive Fourth Quarter (Mils.)* Americas $(4) $(369) $193 Pre-Tax Profits by Segment Full Year (Mils.)* Memo: B / (W) 2002 $236 $(224) $624 $(164) $357 $(236) $575 $18 * Excluding special items; see Appendix (pages 2, 3, and 4 of 17) for reconciliation to GAAP $172 Int'l. WW Americas Int'l Other 2Q 104 1632 -905 -623 World- wide Other Automotive Americas $104 $(623) $1,632 $(905) Int'l. |
SLIDE 9
| AUTOMOTIVE SECTOR - AMERICAS SEGMENT 2003 PROFIT / (LOSS) Americas N.A. S. A. 2Q 193 197 -4 Americas South America Fourth Quarter (Mils.)* North America $193 $(4) $197 Pre-Tax Profits Total Auto Fin Svcs 2Q 1632 1762 -130 Americas South America Full Year (Mils.)* North America $1,632 $1,762 $(130) Memo: B / (W) 2002 $(224) $(316) $92 $(236) $(728) $492 * Excluding special items; see Appendix (pages 2, 3, and 4 of 17) for reconciliation to GAAP |
SLIDE 10
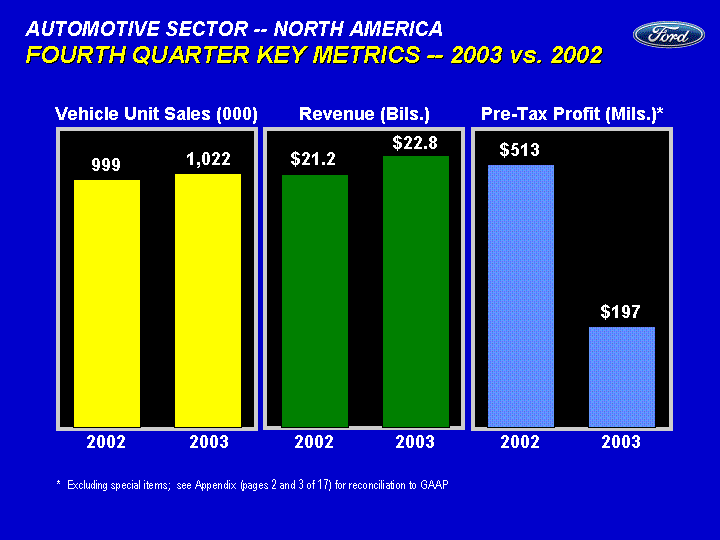
| AUTOMOTIVE SECTOR -- NORTH AMERICA FOURTH QUARTER KEY METRICS -- 2003 vs. 2002 2002 2003 Revenue 21.2 22.8 2003 2002 $22.8 $21.2 Revenue (Bils.) 2002 2003 Vehicle Unit Sales 999 1022 2003 2002 1,022 999 Vehicle Unit Sales (000) 2002 2003 PBT 513 197 $513 2003 2002 Pre-Tax Profit (Mils.)* * Excluding special items; see Appendix (pages 2 and 3 of 17) for reconciliation to GAAP $197 |
SLIDE 11
| NORTH AMERICA UNIT REVENUE CONTINUES TO IMPROVE 4Q 01 4Q 02 4Q 03 Net Rev 20717 21001 21725 2001 Full Year Per Unit Revenue* 2002 2003 * Excluding FIN46 $21,001 $20,717 2001 4Q 01 4Q 02 4Q 03 Net Rev 20349 21273 21976 2002 2003 Fourth Qtr. Per Unit Revenue* $21,273 $20,349 Revenue Drivers • Disciplined Focus on Incentives • Reduction in Daily Rental Volume • Discontinued Low-Margin Vehicles • Strong F-Series and SUV Sales • New Options and Features • New Ordering and Distribution Process $21,725 $21,976 Memo: As Reported $20,349 $21,273 $22,317 $20,717 $21,001 $21,936 $703 $724 |
SLIDE 12
| AUTOMOTIVE SECTOR -- SOUTH AMERICA FOURTH QUARTER KEY METRICS -- 2003 vs. 2002 2002 2003 Revenue 0.3 0.6 2003 2002 $0.6 $0.3 Revenue (Bils.) 2002 2003 Vehicle Unit Sales 56 61 2003 2002 61 56 Vehicle Unit Sales (000) 2002 2003 PBT -96 -8 $(96) 2003 2002 Pre-Tax Profit (Mils.)* * Excluding special items; see Appendix (pages 2 and 3 of 17) for reconciliation to GAAP $(4) |
SLIDE 13
| AUTOMOTIVE SECTOR - INTERNATIONAL SEGMENT 2003 PROFIT / (LOSS) Intl Europe AP PAG Other 2Q 172 60 26 108 -22 Fourth Quarter (Mils.)* $172 $(22) $26 Pre-Tax Profits Full Year (Mils.)* Memo: B / (W) 2002 $624 $77 $61 $496 $(10) $575 $(564) $151 $904 $84 $108 Itnl Europe AP PAG Other 2Q -905 -1113 -25 164 69 Int'l. P.A.G. Europe $(905) $(1,113) $164 $(25) Asia Pacific $69 Other Int'l. P.A.G. Europe Asia Pacific Other $60 * Excluding special items; see Appendix (pages 2, 3, and 4 of 17) for reconciliation to GAAP |
SLIDE 14
| AUTOMOTIVE SECTOR -- EUROPE FOURTH QUARTER KEY METRICS -- 2003 vs. 2002 1st Qtr 2nd Qtr East 5.6 7.4 2003 2002 $7.4 $5.6 Revenue (Bils.) 2002 2003 461 484 2003 2002 484 460 Vehicle Unit Sales (000) 1st Qtr 2nd Qtr East -17 64 $(17) 2003 2002 Pre-Tax Profit (Mils.)* $60 * Excluding special items; see Appendix (pages 2 and 3 of 17) for reconciliation to GAAP |
SLIDE 15

| Third Quarter 2003 500 $ (56 ) U.K. Salaried Personnel Reductions Fourth Quarter 2003 4,600 (457 ) Removal of Third Shift at Genk Germany Salaried Personnel Reductions Other Manufacturing Efficiencies First Half 2004 1,600 (162 ) U.K. and Germany Sal. Personnel Reductions Other Manufacturing Efficiencies Total Restructuring Actions 6,700 $(675 ) Personnel Reductions Pre-Tax Charge (Mils.) EUROPE RESTRUCTURING ACTIONS ONGOING SAVINGS OF $550 MILLION -- $450 MILLION IN 2004 |
SLIDE 16

| FORD EUROPE 2004 IMPROVEMENT PLAN 1st Qtr. (Mils.) Actual Results $(247 ) $(525 ) $(401 ) $60 $(772) $(341) 2003 Second Half Annualized $ (680 ) - - 2004 Benefit of Restructuring Actions 450 - - Cost Reductions and Other Improvements 30 - 130 2004 Milestone $(100) - $(200 ) * Excluding special items 2nd Qtr. (Mils.) 3rd Qtr. (Mils.) 4th Qtr. (Mils.) 2004 Full Year* (Mils.) Pre-Tax Profit* 2003 |
SLIDE 17
| AUTOMOTIVE SECTOR - ASIA PACIFIC FOURTH QUARTER KEY METRICS -- 2003 vs. 2002 2002 2003 Revenue 1.3 1.5 2003 2002 $1.5 $1.3 Revenue (Bils.) 2002 2003 Vehicle Unit Sales 73 93 2003 2002 93 73 Vehicle Unit Sales (000) 2002 2003 PBT -35 26 $26 2003 2002 Pre-Tax Profit (Mils.)* $(35) * Excluding special items; see Appendix (pages 2 and 3 of 17) for reconciliation to GAAP |
SLIDE 18

| AUTOMOTIVE SECTOR -- P.A.G. FOURTH QUARTER KEY METRICS -- 2003 vs. 2002 1st Qtr 2nd Qtr East 6 7.5 2003 2002 $7.5 $6.0 Revenue (Bils.) 2002 2003 200 220 2003 2002 220 201 Vehicle Unit Sales (000) 1st Qtr 2nd Qtr East -388 108 $(388) 2003 2002 Pre-Tax Profit (Mils.)* $108 * Excluding special items; see Appendix (pages 2 and 3 of 17) for reconciliation to GAAP |
SLIDE 19
| PENSION UPDATE PENSION FUNDING NOT AN ISSUE U.S. pension fund returns Actual 26.1 % Long-term assumption 8.75 % U.S. discount rate 6.75 % 6.25 % Worldwide pre-tax expense (Bils.) $0.9 $0.9 European restructuring costs included above 0.1 Worldwide pension contributions (Bils.) $2.8 $0.7 Funded status as of 12/31 (Bils.) - U.S. Hourly & Salaried funded plans $ (2.0 ) $ (1.9 ) - Worldwide plans (11.7 ) (11.2 ) No U.S. ERISA funding obligations or PBGC penalty premiums projected until 2009 2003 Proj. 2004 |
SLIDE 20

| POST-RETIREMENT HEALTH CARE AND LIFE INSURANCE Worldwide OPEB expense (Bils.) $4.2 $2.7 - - Visteon Agreement included above 1.6 Worldwide Retiree Benefit payments (Bils.) 1.4 1.5 U.S. Assumptions Cost trend assumptions at 12/31 Initial trend rate 11 % 9 % Steady state trend rate - 5% reached by 2008 2010 Discount Rate 6.75 % 6.25 % 2003 Proj. 2004 |
SLIDE 21
| 2003 FOURTH QUARTER AND FULL YEAR AUTOMOTIVE CASH* 4th Qtr. (Bils.) Full Yr. (Bils.) Cash, Marketable & Loaned Securities, Short-Term VEBA Assets December 31, 2003 $ 25.9 $25.9 September 30, 2003 / December 31, 2002 26.9 25.3 Change in Gross Cash $ (1.0 ) $ 0.6 Operating-Related Cash Flow Automotive Pre-Tax Profits $ 0 $ 0.1 Capital Spending (1.8 ) (7.4 ) Depreciation and Amortization 1.5 5.5 Changes in Receivables, Inventory, and Trade Payables 0.4 (1.0 ) Other -- Primarily Taxes, and Expense and Payment Timing Differences 1.4 2.9 Total Auto. Op.-Related Cash Flow (Excl. Contrib. & Tax Refunds) $1.5 $ 0.1 Pension / Long-Term VEBA Contributions (3.3 ) (4.8 ) Tax Refunds 0.2 1.7 Total Automotive Operating-Related Cash Flow $(1.6 ) $(3.0 ) Other Cash Flow Capital Transactions w / Financial Services Sector 0.8 3.6 Divestitures and Acquisitions 0.1 0.5 Dividend to Shareholders (0.2 ) (0.7 ) Cash from FIN46 Consolidations - 0.3 All Other - Primarily Change in Automotive Debt (0.1 ) (0.1 ) Total Change in Gross Cash $(1.0 ) $ 0.6 * See Appendix (pages 16 and 17 of 17) for reconciliation to GAAP |
SLIDE 22
| FINANCIAL SERVICES SECTOR 2003 PROFIT / (LOSS) Pre-Tax Profits by Operation Total Credit Hertz Other 903 839 44 20 Fourth Quarter (Mils.) $903 Total Credit Hert Other 3327 3035 228 64 Full Year (Mils.) $228 Total Hertz Ford Credit $3,327 Other Financial Services Memo: B / (W) 2002 $310 $245 $17 $48 $1,223 $1,070 $28 $125 $3,035 $64 Total Hertz Ford Credit Other Financial Services $839 $44 $20 |
SLIDE 23

| FINANCIAL SERVICES SECTOR - FORD CREDIT 2003 RESULTS Record Fourth Quarter and full year pre-tax earnings of $839 million and $3.0 billion, respectively Improvement in earnings primarily reflects Lower provision for credit losses Favorable market valuation of derivative instruments and associated exposures Offset partially by lower receivable sales (Q4) and impact of lower average net receivables (FY) Paid $800 million dividend in the Fourth Quarter, resulting in full year dividends totaling $3.7 billion and maintained managed leverage at 13 to 1 |
SLIDE 24
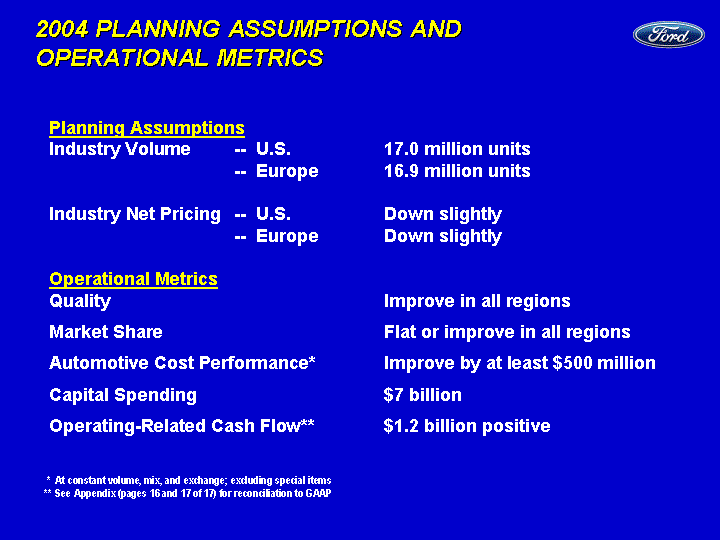
| 2004 PLANNING ASSUMPTIONS AND OPERATIONAL METRICS Planning Assumptions Industry Volume -- U.S. 17.0 million units -- Europe 16.9 million units Industry Net Pricing -- U.S. Down slightly -- Europe Down slightly Operational Metrics Quality Improve in all regions Market Share Flat or improve in all regions Automotive Cost Performance* Improve by at least $500 million Capital Spending $7 billion Operating-Related Cash Flow** $1.2 billion positive * At constant volume, mix, and exchange; excluding special items ** See Appendix (pages 16 and 17 of 17) for reconciliation to GAAP |
SLIDE 25
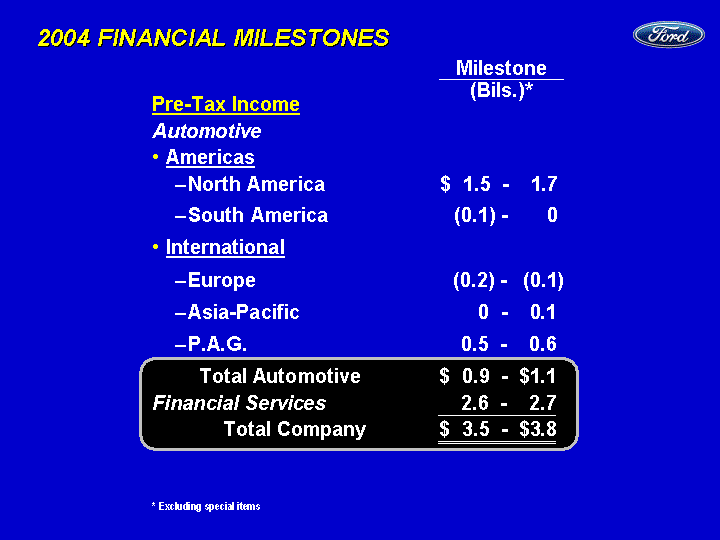
| 2004 FINANCIAL MILESTONES Pre-Tax Income Automotive Americas North America $ 1.5 - 1.7 South America (0.1) - 0 International Europe (0.2) - (0.1 ) Asia-Pacific 0 - 0.1 P.A.G. 0.5 - 0.6 Total Automotive $ 0.9 - $1.1 Financial Services 2.6 - 2.7 Total Company $ 3.5 - $3.8 * Excluding special items Milestone (Bils.)* |
SLIDE 26
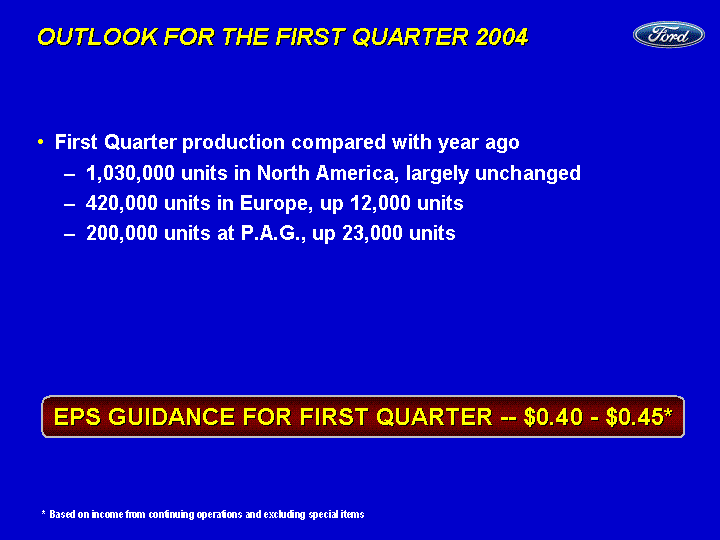
| OUTLOOK FOR THE FIRST QUARTER 2004 First Quarter production compared with year ago 1,030,000 units in North America, largely unchanged 420,000 units in Europe, up 12,000 units 200,000 units at P.A.G., up 23,000 units Remaining restructuring action in Europe will be concluded in First Half Pricing pressure likely to continue in U.S. and Europe EPS GUIDANCE FOR FIRST QUARTER -- $0.40 - $0.45* * Based on income from continuing operations and excluding special items |
SLIDE 27

| SAFE HARBOR Greater price competition in the U.S. and Europe resulting from currency fluctuations, industry overcapacity or other factors; A significant decline in industry sales, particularly in the U.S. or Europe, resulting from slowing economic growth, geo-political events or other factors; Lower-than-anticipated market acceptance of new or existing products; Work stoppages at key Ford or supplier facilities or other interruptions of supplies; The discovery of defects in vehicles resulting in delays in new model launches, recall campaigns or increased warranty costs; Increased safety, emissions, fuel economy or other regulation resulting in higher costs and/or sales restrictions; Unusual or significant litigation or governmental investigations arising out of alleged defects in our products or otherwise; Worse-than-assumed economic and demographic experience for our post-retirement benefit plans (e.g., investment returns, interest rates, health care cost trends, benefit improvements); Currency or commodity price fluctuations; A market shift from truck sales in the U.S.; Economic difficulties in South America or Asia; Reduced availability of or higher prices for fuel; Labor or other constraints on our ability to restructure our business; A change in our requirements under long-term supply arrangements under which we are obligated to purchase minimum quantities or pay minimum amounts; A further credit rating downgrade; Inability to access debt or securitization markets around the world at competitive rates or in sufficient amounts; Higher-than-expected credit losses; Lower-than-anticipated residual values for leased vehicles; Increased price competition in the rental car industry and/or a general decline in business or leisure travel due to terrorist attacks, act of war or measures taken by governments in response thereto that negatively affect the travel industry; and Our inability to implement the Revitalization Plan. Statements included herein may constitute "forward looking statements" within the meaning of the Private Securities Litigation Reform Act of 1995. These statements involve a number of risks, uncertainties, and other factors that could cause actual results to differ materially from those stated, including, without limitation: |
SLIDE 28

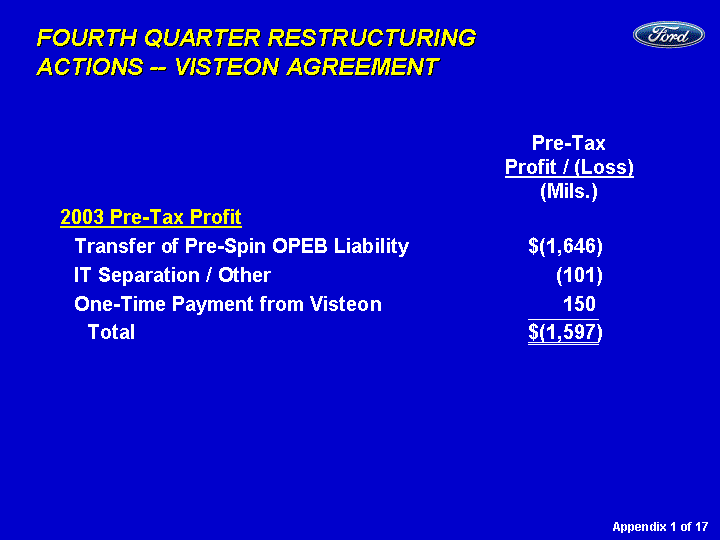
| FOURTH QUARTER RESTRUCTURING ACTIONS -- VISTEON AGREEMENT Pre-Tax Profit / (Loss) (Mils.) 2003 Pre-Tax Profit Transfer of Pre-Spin OPEB Liability $(1,646 ) IT Separation / Other (101 ) One-Time Payment from Visteon 150 Total $(1,597 ) Appendix 1 of 17 |
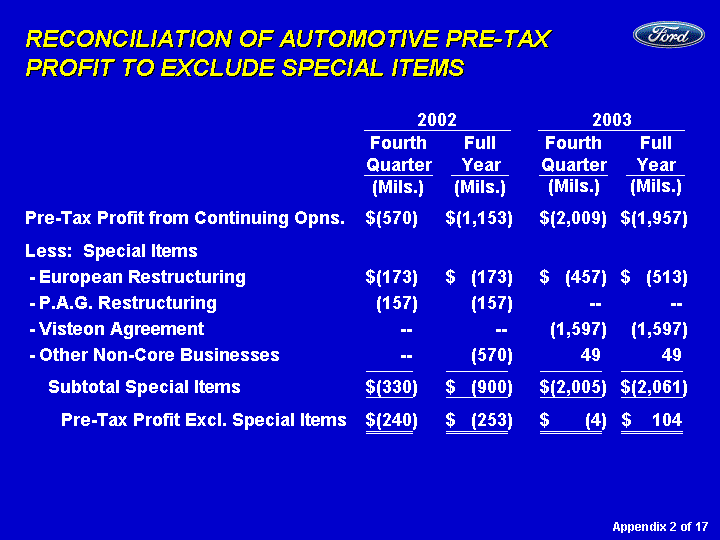
| RECONCILIATION OF AUTOMOTIVE PRE-TAX PROFIT TO EXCLUDE SPECIAL ITEMS Fourth Quarter (Mils.) Full Year (Mils.) Pre-Tax Profit from Continuing Opns. $(570 ) $(1,153 ) $(2,009 ) $(1,957 ) Less: Special Items - European Restructuring $(173 ) $ (173 ) $ (457 ) $ (513 ) - P.A.G. Restructuring (157 ) (157 ) -- -- - Visteon Agreement -- -- (1,597 ) (1,597 ) - Other Non-Core Businesses -- (570 ) 49 49 Subtotal Special Items $(330 ) $ (900 ) $(2,005 ) $(2,061 ) Pre-Tax Profit Excl. Special Items $(240 ) $ (253 ) $ (4 ) $ 104 Fourth Quarter (Mils.) Full Year (Mils.) 2002 2003 Appendix 2 of 17 |

| 2002 - 2003 FOURTH QUARTER PRE-TAX RESULTS North America $ 513 $(1,400 ) $ -- $(1,597 ) $ 513 $ 197 South America (96 ) (4 ) -- -- (96 ) (4 ) Total Americas $ 417 $(1,404 ) $ -- $(1,597 ) $417 $ 193 International Europe $(190 ) $ (397 ) $(173 ) $ (457 ) $ (17 ) $ 60 Asia Pacific (35 ) 26 -- -- (35 ) 26 P.A.G. (545 ) 108 (157 ) -- (388 ) 108 Other (12 ) (22 ) -- -- (12 ) (22 ) Total International $(782 ) $ (285 ) $(330 ) $ (457 ) $ (452 ) $ 172 Other Automotive (205 ) (320 ) -- 49 (205 ) (369 ) Total Automotive $(570 ) $(2,009 ) $(330 ) $(2,005 ) $ (240 ) $ (4 ) Financial Services 593 903 -- -- 593 903 Total Company $ 23 $(1,106 ) $(330 ) $(2,005 ) $ 353 $ 899 2002 (Mils.) 2003 (Mils.) Pre-Tax Profits (Incl. Special Items) Special Items Pre-Tax Profits (Excl. Special Items) 2002 (Mils.) 2003 (Mils.) 2002 (Mils.) 2003 (Mils.) Appendix 3 of 17 |
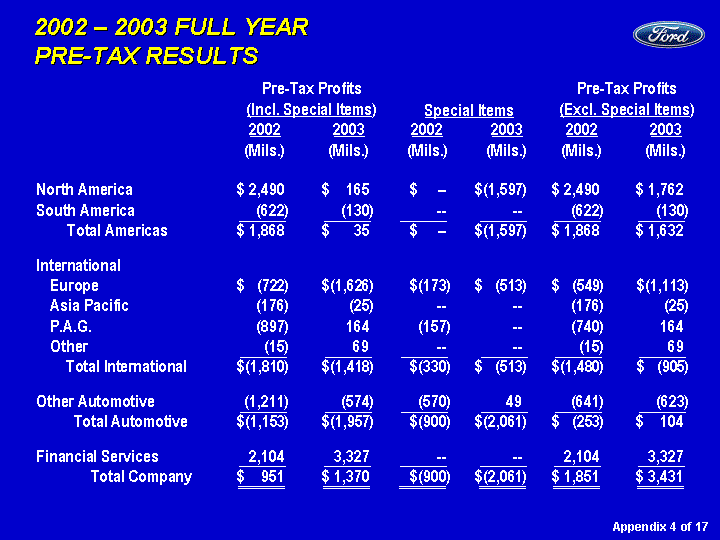
| 2002 - 2003 FULL YEAR PRE-TAX RESULTS North America $ 2,490 $ 165 $ -- $(1,597 ) $ 2,490 $ 1,762 South America (622 ) (130 ) -- -- (622 ) (130 ) Total Americas $ 1,868 $ 35 $ -- $(1,597 ) $ 1,868 $ 1,632 International Europe $ (722 ) $(1,626 ) $(173 ) $ (513 ) $ (549 ) $(1,113 ) Asia Pacific (176 ) (25 ) -- -- (176 ) (25 ) P.A.G. (897 ) 164 (157 ) -- (740 ) 164 Other (15 ) 69 -- -- (15 ) 69 Total International $(1,810 ) $(1,418 ) $(330 ) $ (513 ) $(1,480 ) $ (905 ) Other Automotive (1,211 ) (574 ) (570 ) 49 (641 ) (623 ) Total Automotive $(1,153 ) $(1,957 ) $(900 ) $(2,061 ) $ (253 ) $ 104 Financial Services 2,104 3,327 -- -- 2,104 3,327 Total Company $ 951 $ 1,370 $(900 ) $(2,061 ) $ 1,851 $ 3,431 2002 (Mils.) 2003 (Mils.) Pre-Tax Profits (Incl. Special Items) Special Items Pre-Tax Profits (Excl. Special Items) 2002 (Mils.) 2003 (Mils.) 2002 (Mils.) 2003 (Mils.) Appendix 4 of 17 |

| FOURTH QUARTER AUTOMOTIVE SUMMARY Americas North America 999 1,022 $21,252 $22,808 $ 513 $ 197 South America 56 61 335 623 (96 ) (4 ) Total Americas 1,055 1,083 $21,587 $23,431 $ 417 $ 193 International Europe 460 484 $ 5,573 $ 7,412 $ (17 ) $ 60 Asia Pacific 73 93 1,262 1,548 (35 ) 26 P.A.G. 201 220 6,022 7,458 (388 ) 108 Other -- -- -- -- (12 ) (22 ) Total International 734 797 $12,857 $16,418 $(452 ) $ 172 Other Automotive -- -- 171 -- (205 ) (369 ) Total Automotive 1,789 1,880 $34,615 $39,849 $(240 ) $ (4 ) 2002 (000) 2003 (000) 2002 (Mils.) 2003 (Mils.) 2002 (Mils.) 2003 (Mils.) Vehicle Unit Sales Revenue Pre-Tax Profits* Appendix 5 of 17 * Excluding special items; see Appendix (pages 2 and 3 of 17) for reconciliation to GAAP |
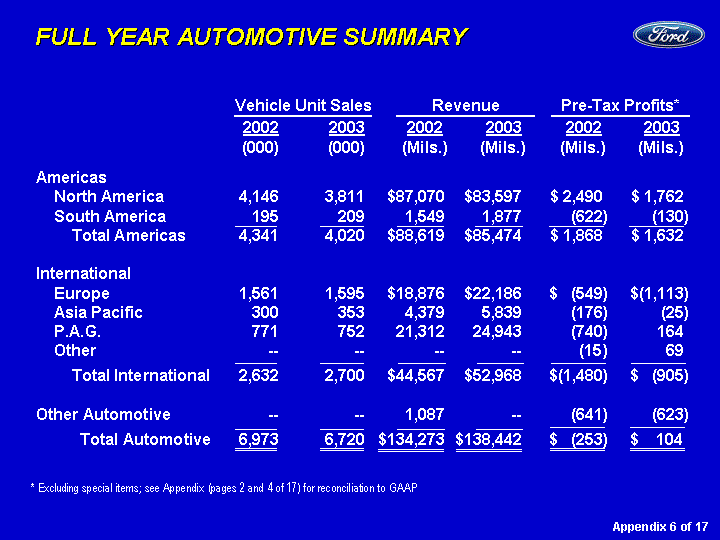
| FULL YEAR AUTOMOTIVE SUMMARY Americas North America 4,146 3,811 $87,070 $83,597 $ 2,490 $ 1,762 South America 195 209 1,549 1,877 (622 ) (130 ) Total Americas 4,341 4,020 $88,619 $85,474 $ 1,868 $ 1,632 International Europe 1,561 1,595 $18,876 $22,186 $ (549 ) $(1,113 ) Asia Pacific 300 353 4,379 5,839 (176 ) (25 ) P.A.G. 771 752 21,312 24,943 (740 ) 164 Other -- -- -- -- (15 ) 69 Total International 2,632 2,700 $44,567 $52,968 $(1,480 ) $ (905 ) Other Automotive -- -- 1,087 -- (641 ) (623 ) Total Automotive 6,973 6,720 $134,273 $138,442 $ (253 ) $ 104 2002 (000) 2003 (000) 2002 (Mils.) 2003 (Mils.) 2002 (Mils.) 2003 (Mils.) Vehicle Unit Sales Revenue Pre-Tax Profits* Appendix 6 of 17 * Excluding special items; see Appendix (pages 2 and 4 of 17) for reconciliation to GAAP |
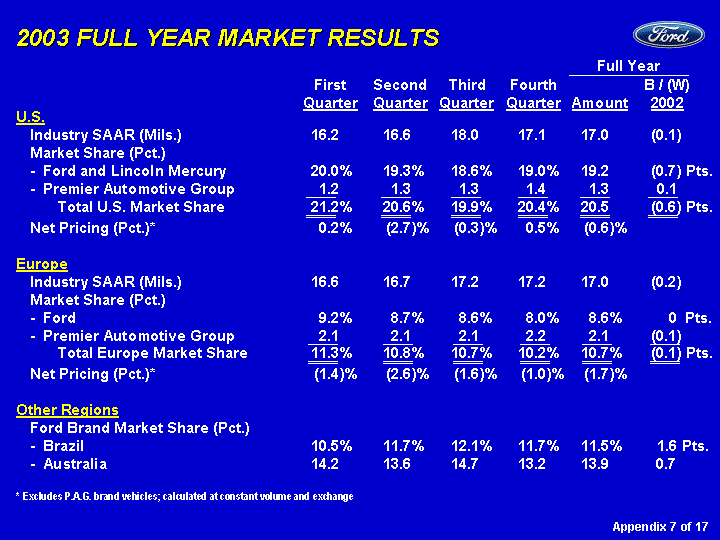
| 2003 FULL YEAR MARKET RESULTS U.S. Industry SAAR (Mils.) 16.2 16.6 18.0 17.1 17.0 (0.1 ) Market Share (Pct.) - Ford and Lincoln Mercury 20.0 % 19.3 % 18.6 % 19.0 % 19.2 (0.7 ) Pts. - Premier Automotive Group 1.2 1.3 1.3 1.4 1.3 0.1 Total U.S. Market Share 21.2 % 20.6 % 19.9 % 20.4 % 20.5 (0.6 ) Pts. Net Pricing (Pct.)* 0.2 % (2.7 )% (0.3 )% 0.5 % (0.6 )% Europe Industry SAAR (Mils.) 16.6 16.7 17.2 17.2 17.0 (0.2 ) Market Share (Pct.) - Ford 9.2 % 8.7 % 8.6 % 8.0 % 8.6 % 0 Pts. - Premier Automotive Group 2.1 2.1 2.1 2.2 2.1 (0.1 ) Total Europe Market Share 11.3 % 10.8 % 10.7 % 10.2 % 10.7 % (0.1 ) Pts. Net Pricing (Pct.)* (1.4 )% (2.6 )% (1.6 )% (1.0 )% (1.7 )% Other Regions Ford Brand Market Share (Pct.) - Brazil 10.5 % 11.7 % 12.1 % 11.7 % 11.5 % 1.6 Pts. - Australia 14.2 13.6 14.7 13.2 13.9 0.7 * Excludes P.A.G. brand vehicles; calculated at constant volume and exchange First Quarter Second Quarter Third Quarter Amount B / (W) 2002 Full Year Fourth Quarter Appendix 7 of 17 |

| PRODUCTION VOLUMES North America 900 (51 ) 1,030 (2 ) Europe 438 (4 ) 420 12 P.A.G. 200 30 200 23 Units (000) 2003 Actual Fourth Quarter B / (W) 2002 (000) Units (000) First Quarter 2004 Forecast B / (W) 2003 (000) Appendix 8 of 17 |

| RECONCILIATION OF NET PRICING TO CHANGE IN AUTOMOTIVE SALES Automotive Sales 2003 $22,808 $22,317 $7,412 $15,314 $83,597 $21,936 $22,186 $13,910 2002 21,252 21,273 5,573 12,115 87,070 21,001 18,876 12,092 2003 B / (W) $ 1,556 $ 1,044 $1,839 $ 3,199 $ (3,473 ) $ 935 $ 3,310 $ 1,818 Than 2002 Memo: Change in 4.9 % 26.4 % 4.4 % 15.0 % Automotive Sales Explanation of Change (Pct.) Mix, Exchange, Other 2.8 % 20.2 % 4.0 % 13.3 % Net Pricing 0.5 (1.0 ) (0.6 ) (1.7 ) Effect of FIN46* 1.6 7.2 1.0 3.4 Total 4.9 % 26.4 % 4.4 % 15.0 % North America (Mils.) (Per Unit) Fourth Quarter Europe (Per Unit) (Mils.) North America (Mils.) (Per Unit) Full Year Europe (Per Unit) (Mils.) Appendix 9 of 17 * North America revenue includes effect of FIN46 -- $341 per unit in Fourth Quarter and $210 per unit for full year |
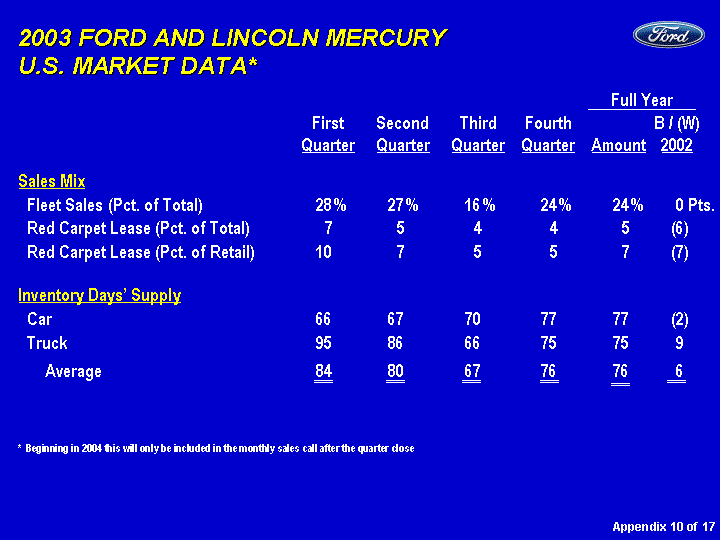
| 2003 FORD AND LINCOLN MERCURY U.S. MARKET DATA* Sales Mix Fleet Sales (Pct. of Total) 28 % 27 % 16 % 24 % 24 % 0 Pts. Red Carpet Lease (Pct. of Total) 7 5 4 4 5 (6 ) Red Carpet Lease (Pct. of Retail) 10 7 5 5 7 (7 ) Inventory Days' Supply Car 66 67 70 77 77 (2 ) Truck 95 86 66 75 75 9 Average 84 80 67 76 76 6 * Beginning in 2004 this will only be included in the monthly sales call after the quarter close First Quarter Third Quarter Amount Second Quarter B / (W) 2002 Full Year Fourth Quarter Appendix 10 of 17 |

| COSTS AND EXPENSES AUTOMOTIVE SECTOR Total Cost and Expenses $35,033 $41,572 $(6,539 ) $134,801 $139,973 $(5,172 ) Select Cost Items Included Above: Depreciation $ 572 $ 755 $ (183 ) $2,435 $2,814 $ (379 ) Amortization 658 726 (68 ) 2,461 2,658 (197 ) Post-Retirement Expense* 554 2,616 (2,062 ) 2,115 5,019 (2,904 ) 2002 (Mils.) 2003 (Mils.) 2003 B / (W) 2002 (Mils.) Fourth Quarter 2002 (Mils.) 2003 (Mils.) 2003 B / (W) 2002 (Mils.) Full Year Appendix 11 of 17 * Includes Special Items of $1.6 billion in 2003 |

| 2002 2003 East 1371 2196 4Q 594 839 Receivables (Bils.) On-Balance Sheet $126 $132 * Securitized Off-Balance Sheet 71 50 Managed $197 $182 Credit Losses (Mils.) On-Balance Sheet $2,362 $2,044 Managed 2,816 2,813 Loss-to-Receivables Ratio On-Balance Sheet 1.72 % 1.67% Managed - U.S. Retail and Lease 1.50 1.89 - Worldwide Total 1.39 1.50 Allow. for Credit Losses - Worldwide Amount (Bils.) $3.2 $3.0 - Pct. Of EOP Receivables 2.51 % 2.28 % Leverage (To 1)*** Financial Statement 10.3 12.0 Managed 12.8 13.0 2002 2003 Key Metrics ** FORD CREDIT RESULTS AND METRICS -- FULL YEAR Appendix 12 of 17 $1,965 $3,035 Pre-Tax Profit* (Mils.) 2002 2003 $594 $839 Fourth Quarter First Nine Months Net Income (Mils.) $1,234 $1,817 ROE 9 % 14 % * From continuing operations * Includes receivables sold in certain securitizations; see Appendix (pages 13, 14, 15 of 17) ** Includes credit losses on reacquired receivables; 1.6% excluding credit losses on reacquired receivables *** See Appendix (pages 13, 14, 15 of 17) for calculation, definitions and reconciliation |
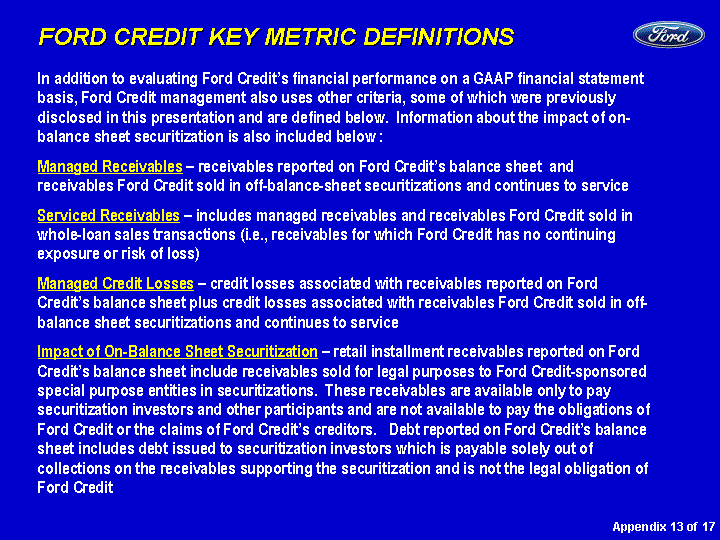
| FORD CREDIT KEY METRIC DEFINITIONS Appendix 13 of 17 In addition to evaluating Ford Credit's financial performance on a GAAP financial statement basis, Ford Credit management also uses other criteria, some of which were previously disclosed in this presentation and are defined below. Information about the impact of on- balance sheet securitization is also included below : Managed Receivables - receivables reported on Ford Credit's balance sheet and receivables Ford Credit sold in off-balance-sheet securitizations and continues to service Serviced Receivables - includes managed receivables and receivables Ford Credit sold in whole-loan sales transactions (i.e., receivables for which Ford Credit has no continuing exposure or risk of loss) Managed Credit Losses - credit losses associated with receivables reported on Ford Credit's balance sheet plus credit losses associated with receivables Ford Credit sold in off- balance sheet securitizations and continues to service Impact of On-Balance Sheet Securitization - retail installment receivables reported on Ford Credit's balance sheet include receivables sold for legal purposes to Ford Credit-sponsored special purpose entities in securitizations. These receivables are available only to pay securitization investors and other participants and are not available to pay the obligations of Ford Credit or the claims of Ford Credit's creditors. Debt reported on Ford Credit's balance sheet includes debt issued to securitization investors which is payable solely out of collections on the receivables supporting the securitization and is not the legal obligation of Ford Credit |
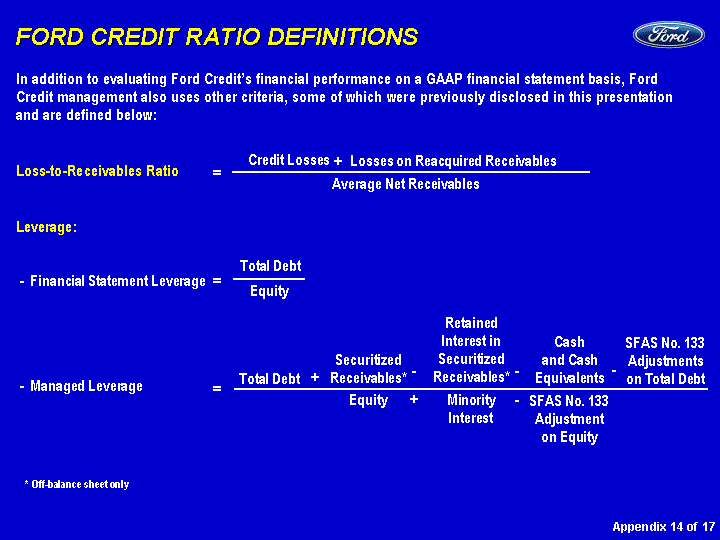
| FORD CREDIT RATIO DEFINITIONS In addition to evaluating Ford Credit's financial performance on a GAAP financial statement basis, Ford Credit management also uses other criteria, some of which were previously disclosed in this presentation and are defined below: Leverage: Total Debt - - Financial Statement Leverage = Equity Total Debt Securitized Receivables* Cash and Cash Equivalents SFAS No. 133 Adjustments on Total Debt Equity Minority Interest SFAS No. 133 Adjustment on Equity - - Managed Leverage + - - - - - - = + - - Retained Interest in Securitized Receivables* Credit Losses = + Losses on Reacquired Receivables Average Net Receivables Loss-to-Receivables Ratio Appendix 14 of 17 * Off-balance sheet only |
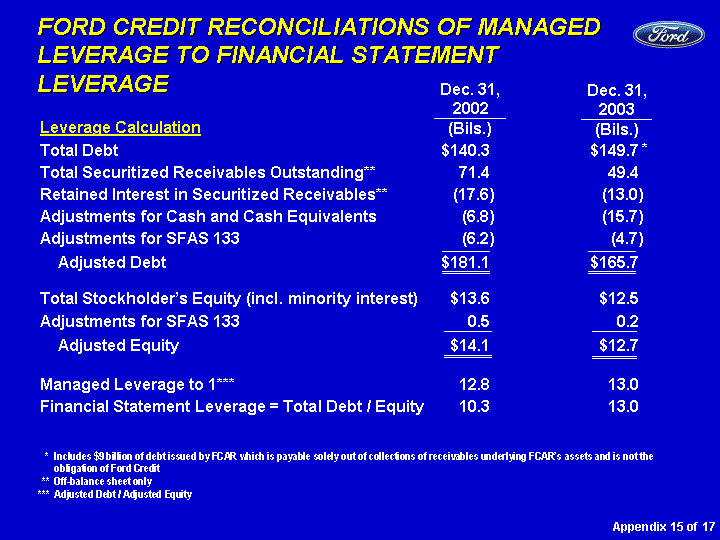
| FORD CREDIT RECONCILIATIONS OF MANAGED LEVERAGE TO FINANCIAL STATEMENT LEVERAGE Dec. 31, 2002 (Bils.) Dec. 31, 2003 (Bils.) Leverage Calculation * Total Debt $140.3 $149.7 Total Securitized Receivables Outstanding** 71.4 49.4 Retained Interest in Securitized Receivables** (17.6 ) (13.0 ) Adjustments for Cash and Cash Equivalents (6.8 ) (15.7 ) Adjustments for SFAS 133 (6.2 ) (4.7 ) Adjusted Debt $181.1 $165.7 Total Stockholder's Equity (incl. minority interest) $13.6 $12.5 Adjustments for SFAS 133 0.5 0.2 Adjusted Equity $14.1 $12.7 Managed Leverage to 1*** 12.8 13.0 Financial Statement Leverage = Total Debt / Equity 10.3 13.0 Appendix 15 of 17 * Includes $9 billion of debt issued by FCAR which is payable solely out of collections of receivables underlying FCAR's assets and is not the obligation of Ford Credit ** Off-balance sheet only *** Adjusted Debt / Adjusted Equity |
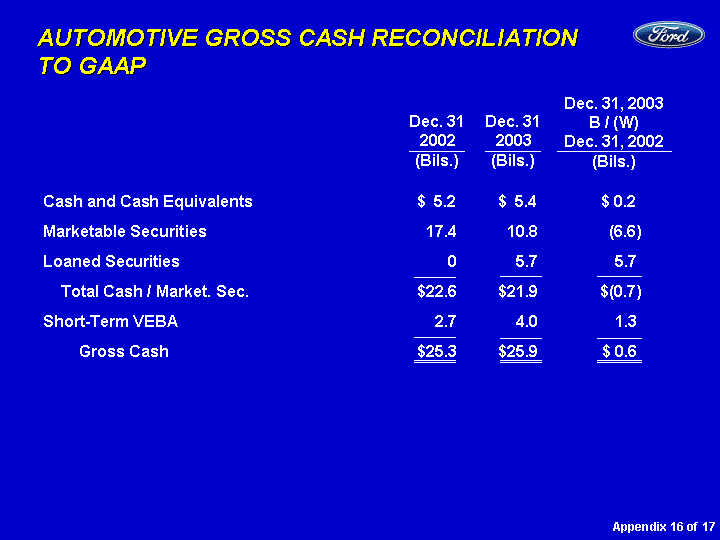
| AUTOMOTIVE GROSS CASH RECONCILIATION TO GAAP Appendix 16 of 17 Cash and Cash Equivalents $ 5.2 $ 5.4 $ 0.2 Marketable Securities 17.4 10.8 (6.6 ) Loaned Securities 0 5.7 5.7 Total Cash / Market. Sec. $22.6 $21.9 $(0.7 ) Short-Term VEBA 2.7 4.0 1.3 Gross Cash $25.3 $25.9 $ 0.6 Dec. 31, 2003 B / (W) Dec. 31, 2002 (Bils.) Dec. 31 2003 (Bils.) Dec. 31 2002 (Bils.) |
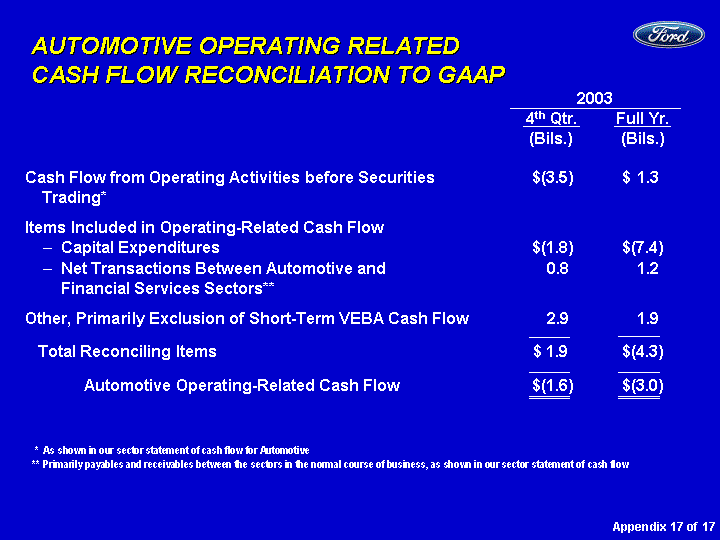
| Appendix 17 of 17 AUTOMOTIVE OPERATING RELATED CASH FLOW RECONCILIATION TO GAAP Cash Flow from Operating Activities before Securities $(3.5 ) $ 1.3 Trading* Items Included in Operating-Related Cash Flow Capital Expenditures $(1.8 ) $(7.4 ) Net Transactions Between Automotive and 0.8 1.2 Financial Services Sectors** Other, Primarily Exclusion of Short-Term VEBA Cash Flow 2.9 1.9 Total Reconciling Items $ 1.9 $(4.3 ) Automotive Operating-Related Cash Flow $(1.6 ) $(3.0 ) Full Yr. (Bils.) 4th Qtr. (Bils.) 2003 * As shown in our sector statement of cash flow for Automotive ** Primarily payables and receivables between the sectors in the normal course of business, as shown in our sector statement of cash flow |
Exhibit 99.9

| FOURTH QUARTER 2003 FIXED INCOME PRESENTATION January 22, 2004 |
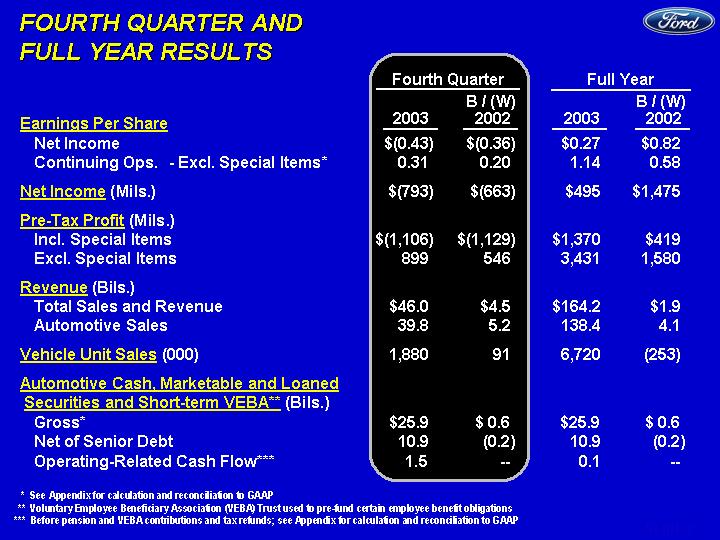
| Earnings Per Share Net Income $(0.43 ) $(0.36 ) $0.27 $0.82 Continuing Ops. - Excl. Special Items* 0.31 0.20 1.14 0.58 Net Income (Mils.) $(793 ) $(663 ) $495 $1,475 Pre-Tax Profit (Mils.) Incl. Special Items $(1,106 ) $(1,129 ) $1,370 $419 Excl. Special Items 899 546 3,431 1,580 Revenue (Bils.) Total Sales and Revenue $46.0 $4.5 $164.2 $1.9 Automotive Sales 39.8 5.2 138.4 4.1 Vehicle Unit Sales (000) 1,880 91 6,720 (253) Automotive Cash, Marketable and Loaned Securities and Short-term VEBA** (Bils.) Gross* $25.9 $ 0.6 $25.9 $ 0.6 Net of Senior Debt 10.9 (0.2 ) 10.9 (0.2 ) Operating-Related Cash Flow*** 1.5 -- 0.1 -- FOURTH QUARTER AND FULL YEAR RESULTS 2003 B / (W) 2002 Fourth Quarter 2003 B / (W) 2002 Full Year * See Appendix for calculation and reconciliation to GAAP ** Voluntary Employee Beneficiary Association (VEBA) Trust used to pre-fund certain employee benefit obligations *** Before pension and VEBA contributions and tax refunds; see Appendix for calculation and reconciliation to GAAP |
SLIDE 1
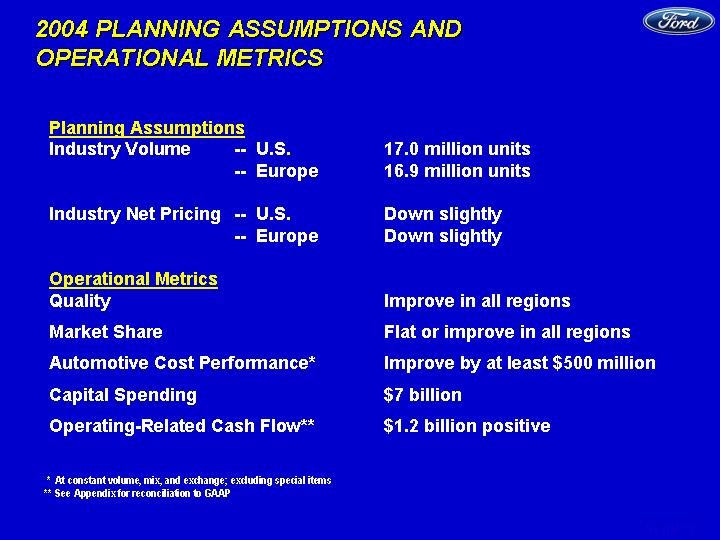
| 2004 PLANNING ASSUMPTIONS AND OPERATIONAL METRICS Planning Assumptions Industry Volume -- U.S. 17.0 million units -- Europe 16.9 million units Industry Net Pricing -- U.S. Down slightly -- Europe Down slightly Operational Metrics Quality Improve in all regions Market Share Flat or improve in all regions Automotive Cost Performance* Improve by at least $500 million Capital Spending $7 billion Operating-Related Cash Flow** $1.2 billion positive * At constant volume, mix, and exchange; excluding special items ** See Appendix for reconciliation to GAAP |
SLIDE 2
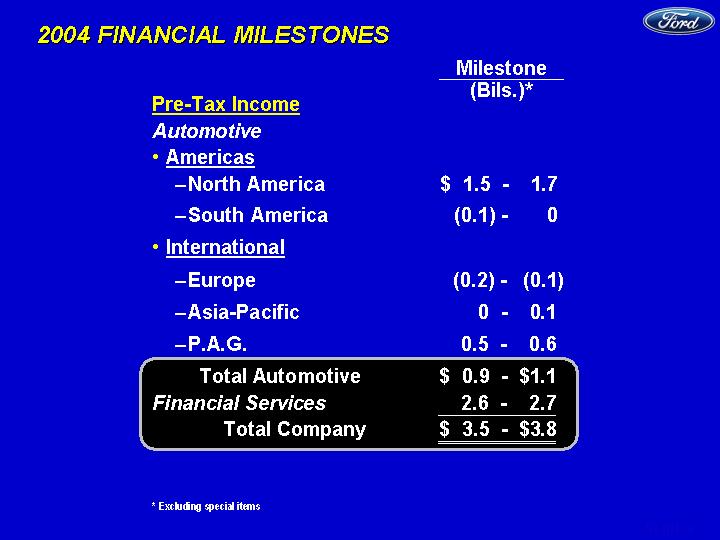
| 2004 FINANCIAL MILESTONES Pre-Tax Income Automotive Americas North America $ 1.5 - 1.7 South America (0.1) - 0 International Europe (0.2) - (0.1 ) Asia-Pacific 0 - 0.1 P.A.G. 0.5 - 0.6 Total Automotive $ 0.9 - $1.1 Financial Services 2.6 - 2.7 Total Company $ 3.5 - $3.8 * Excluding special items Milestone (Bils.)* |
SLIDE 3
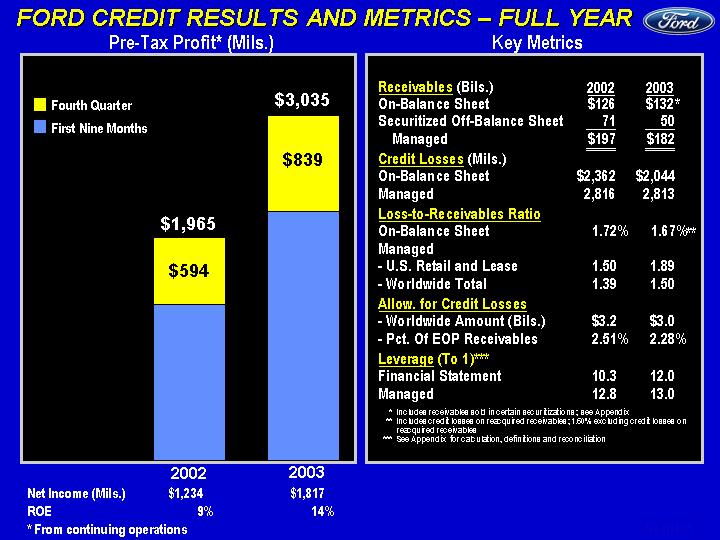
| FORD CREDIT RESULTS AND METRICS - FULL YEAR Receivables (Bils.) On-Balance Sheet $126 $132 Securitized Off-Balance Sheet 71 50 Managed $197 $182 Credit Losses (Mils.) On-Balance Sheet $2,362 $2,044 Managed 2,816 2,813 Loss-to-Receivables Ratio On-Balance Sheet 1.72 % 1.67 % Managed - U.S. Retail and Lease 1.50 1.89 - Worldwide Total 1.39 1.50 Allow. for Credit Losses - Worldwide Amount (Bils.) $3.2 $3.0 - Pct. Of EOP Receivables 2.51 % 2.28 % Leverage (To 1)*** Financial Statement 10.3 12.0 Managed 12.8 13.0 * Includes receivables sold in certain securitizations; see Appendix ** Includes credit losses on reacquired receivables; 1.60% excluding credit losses on reacquired receivables *** See Appendix for calculation, definitions and reconciliation 2002 2003 Key Metrics Net Income (Mils.) $1,234 $1,817 ROE 9 % 14 % * From continuing operations 2002 2003 East 1371 2196 4Q 594 839 $1,965 $3,035 Pre-Tax Profit* (Mils.) 2002 2003 ** * $594 $839 Fourth Quarter First Nine Months |
SLIDE 4
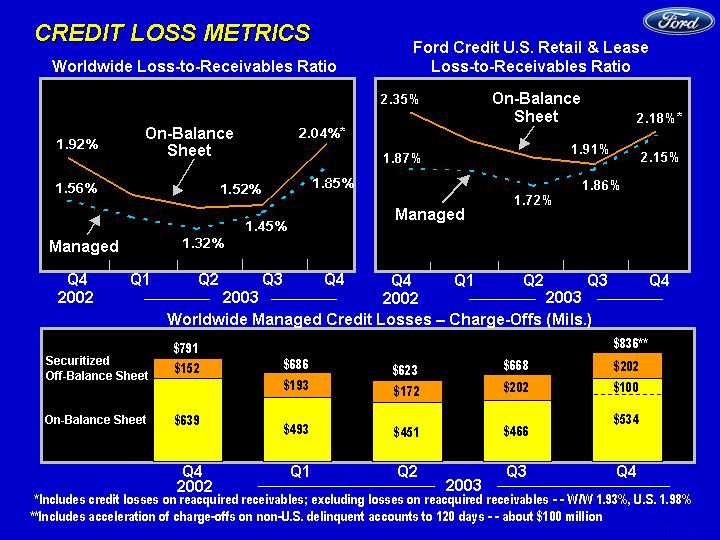
| Q4 Q1 Q2 Q3 Q4 Worldwide Managed 0.0156 0.0142 0.0132 0.0145 0.0185 Worldwide Owned 0.0192 0.0161 0.015 0.0152 0.0204 Managed Reserves as Pct. Of EOP Receivables 0.019 0.0195 Q4 Q1 Q2 Q3 Q4 Ford Credit U.S. Managed LTR 0.0187 0.0185 0.0172 0.0186 0.0215 Ford Credit U.S. Owned 0.0235 0.021 0.0196 0.0191 0.0218 Managed Reserves as Pct. Of EOP Receivables 0.019 0.0195 CREDIT LOSS METRICS Managed Q4 Q1 Q2 Q3 Q4 Owned 639 493 451 466 634 Securitized 152 193 172 202 202 Worldwide Managed Credit Losses - Charge-Offs (Mils.) On-Balance Sheet Securitized Off-Balance Sheet $791 $686 Q4 Q1 Q2 Q3 2002 Q4 Q4 Q1 Q2 Q3 2002 Ford Credit U.S. Retail & Lease Loss-to-Receivables Ratio On-Balance Sheet Managed Worldwide Loss-to-Receivables Ratio On-Balance Sheet Q4 2003 2003 $623 * Includes credit losses on reacquired receivables; excluding losses on reacquired receivables - - W/W 1.93%, U.S. 1.98% **Includes acceleration of charge-offs on non-U.S. delinquent accounts to 120 days - - about $100 million $668 Q4 Q1 Q2 Q3 2002 Q4 $836** 2003 * * $100 $534 |
SLIDE 5

| Q4 Q1 Q2 Q3 Q4 Worldwide Owned 53 51 45 51 53 CREDIT LOSS DRIVERS - FORD CREDIT U.S. RETAIL & LEASE* Q4 Q1 Q2 Q3 Q4 Q1 Q2 Q3 Q4 NON-BANKRUPT 0.0048 0.0043 0.0029 0.0038 0.0035 0.0042 0.0033 0.0038 0.0027 Over-60-Day Delinquencies Repossessions (000) Q4 Q1 Q2 Q3 Q4 Worldwide Owned 7500 7500 7500 7200 7300 Q4 Q1 Q2 Q3 Loss Severity Q4 Q3 Q4 Q1 Q2 Q3 Q4 Q1 Q2 2001 2002 Q4 3.09% 3.12% 2.91% 3.44% 3.68% 2002 2003 Repo. Ratio Memo: New Bankruptcy Filings (000) 23 31 30 29 28 28 29 27 23 * On a serviced basis Q4 Q1 Q2 Q3 Q4 Worldwide Owned 3.09 3.12 2.91 3.44 3.68 2002 2003 Q4 Q1 Q2 Q3 Q4 2003 |
SLIDE 6
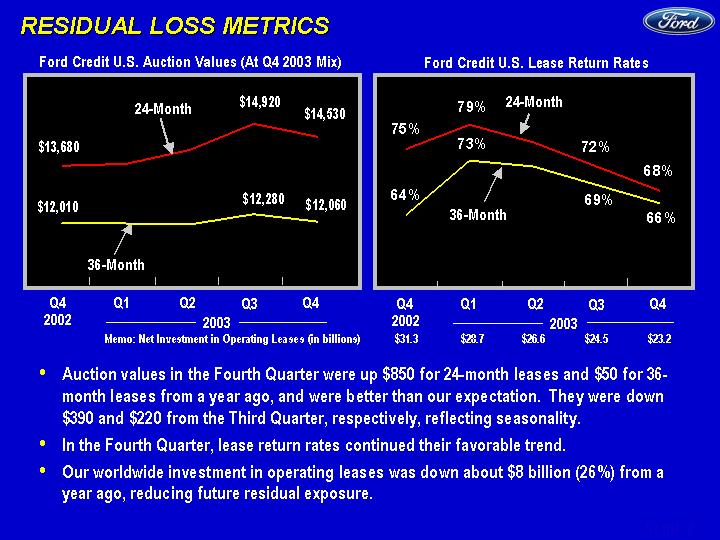
| Q4 2002 Q1 2003 Q2 2003 Q3 2003 Q4 2003 RR 24-Month 0.75 0.79 0.76 0.72 0.68 RR 36-Month 0.64 0.73 0.72 0.69 0.66 RESIDUAL LOSS METRICS Auction values in the Fourth Quarter were up $850 for 24-month leases and $50 for 36- month leases from a year ago, and were better than our expectation. They were down $390 and $220 from the Third Quarter, respectively, reflecting seasonality. In the Fourth Quarter, lease return rates continued their favorable trend. Our worldwide investment in operating leases was down about $8 billion (26%) from a year ago, reducing future residual exposure. Q4 2002 Q1 2003 Q2 2003 Q3 2003 Q4 2003 AV 24-Month 13680 13760 14160 14920 14530 AV 36-Month 12010 12010 11990 12280 12060 Ford Credit U.S. Auction Values (At Q4 2003 Mix) Ford Credit U.S. Lease Return Rates 36-Month 24-Month Q3 Q4 Q4 Q1 Q2 2002 2003 36-Month 24-Month Memo: Net Investment in Operating Leases (in billions) $31.3 $28.7 $26.6 $24.5 $23.2 Q3 Q4 Q4 Q1 Q2 2002 2003 |
SLIDE 7

| FORD CREDIT IS A VITAL COMPONENT OF FORD MOTOR COMPANY 1997 1998 1999 2000 2001 2002 2003 East 595 500 2317 120 400 1150 3700 North 1815 1789 2085 2507 1494 1965 3035 Dividends Paid (Mils.) 1998 1999 2001 2003 $1,494 $500 $2,317 $120 $400 $1150** $2,507 $3,035 $3,700 $1,789 $2,085 $1,965 Pre-Tax Profit* (Mils.) Memo: Managed Leverage 11.4 13.0 13.9 14.8 12.8 13.0 Return on Equity 10% 11% 13% 7% 9% 14% 2000 2002 * From continuing operations ** Excludes $700 million capital contribution from parent |
SLIDE 8
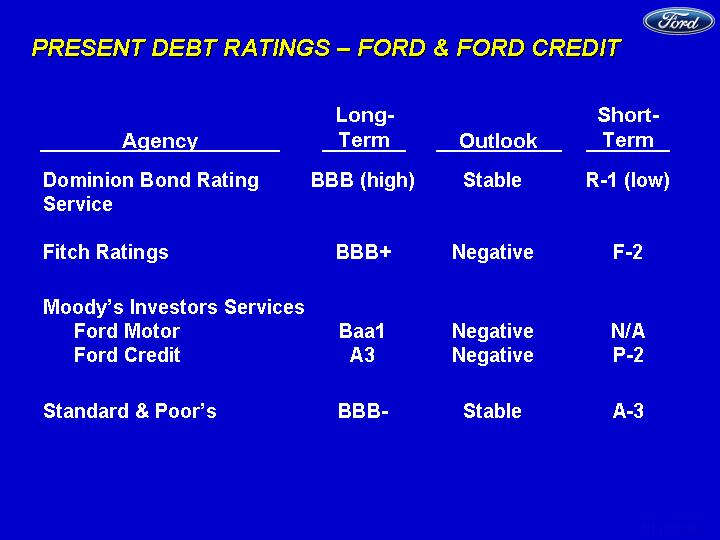
| PRESENT DEBT RATINGS - FORD & FORD CREDIT Agency Long- Term Outlook Short- Term Dominion Bond Rating BBB (high) Stable R-1 (low) Service Fitch Ratings BBB+ Negative F-2 Moody's Investors Services Ford Motor Baa1 Negative N/A Ford Credit A3 Negative P-2 Standard & Poor's BBB- Stable A-3 |
SLIDE 9
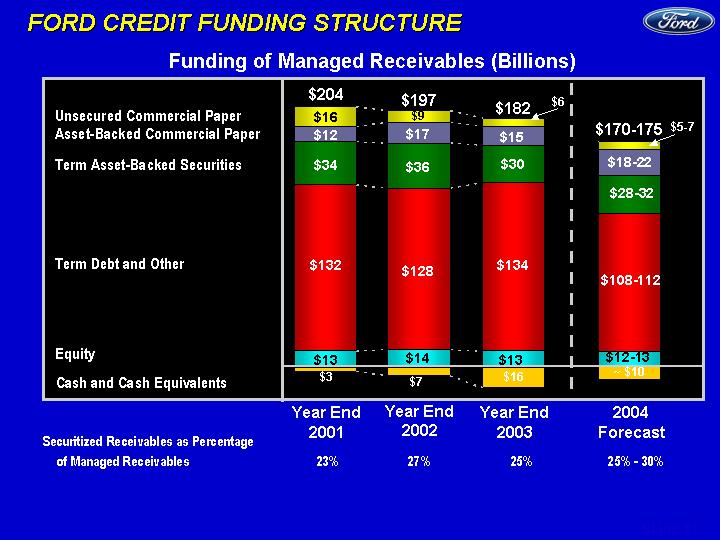
| 2004 Equity 12 Term Debt/Other 110 Securitization 30 ABS CP 21 Commercial Paper 6 Overborr -10 FORD CREDIT FUNDING STRUCTURE 2001 2002 2003 Equity 13 14 12.7 Term Debt/Other 132 128 134 Securitization 34 36 30 ABS CP 12 17 15 Commercial Paper 16 9 6 Overborrow -3 -7 -16 Equity Unsecured Commercial Paper Asset-Backed Commercial Paper $204 $197 $170-175 $16 $34 $12 $28-32 $132 $128 $108-112 $13 $14 $12-13 Year End 2001 Year End 2002 2004 Forecast $17 $36 Funding of Managed Receivables (Billions) Securitized Receivables as Percentage of Managed Receivables 23% 27% 25% 25% - 30% Year End 2003 $5-7 $15 $30 $134 $13 Term Asset-Backed Securities Term Debt and Other $3 $16 Cash and Cash Equivalents ~ $10 $9 $6 $7 $18-22 $182 |
SLIDE 10
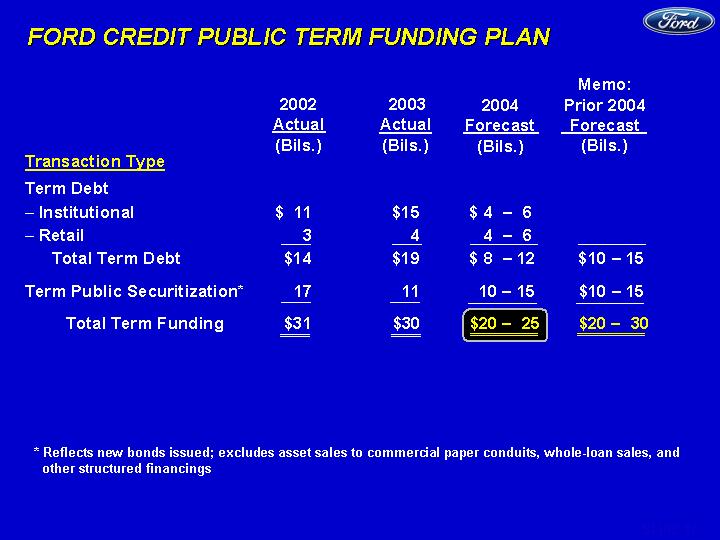
| Term Debt Institutional $ 11 $15 $ 4 - 6 Retail 3 4 4 - 6 Total Term Debt $14 $19 $ 8 - 12 $ 10 - 15 Term Public Securitization* 17 11 10 - 15 $ 10 - 15 Total Term Funding $31 $30 $ 20 - 25 $ 20 - 30 FORD CREDIT PUBLIC TERM FUNDING PLAN 2002 Actual (Bils.) Transaction Type * Reflects new bonds issued; excludes asset sales to commercial paper conduits, whole-loan sales, and other structured financings 2004 Forecast (Bils.) Actual (Bils.) 2003 Memo: Prior 2004 Forecast (Bils.) |
SLIDE 11
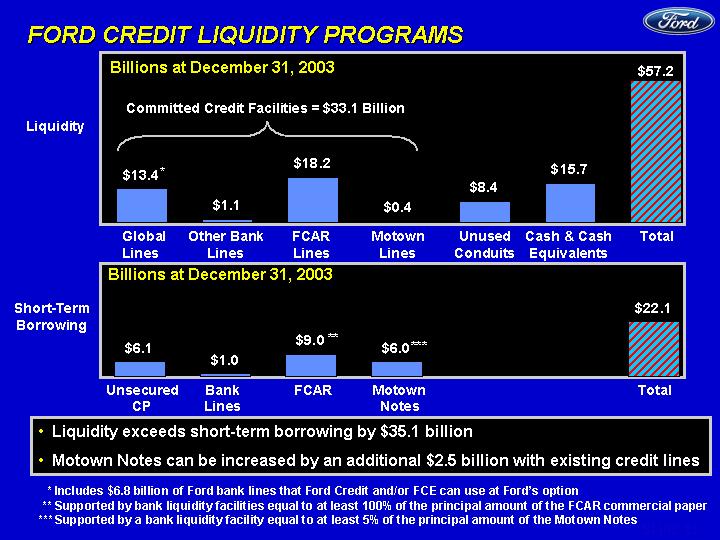
| Unsecured CP FCAR Motown Other Lines Conduits Total Back-up liquidity 6.1 1 9 6 22.1 Global Bank Lines Other FCAR Motown Unused Conduits Cash Total Back-up liquidity 13.4 1.1 18.2 0.4 8.4 15.7 57.2 FORD CREDIT LIQUIDITY PROGRAMS Liquidity Global Other Bank FCAR Motown Unused Cash & Cash Total Lines Lines Lines Lines Conduits Equivalents Short-Term Borrowing Unsecured Bank FCAR Motown Total CP Lines Notes Liquidity exceeds short-term borrowing by $35.1 billion Motown Notes can be increased by an additional $2.5 billion with existing credit lines Billions at December 31, 2003 Billions at December 31, 2003 Committed Credit Facilities = $33.1 Billion * * Includes $6.8 billion of Ford bank lines that Ford Credit and/or FCE can use at Ford's option ** Supported by bank liquidity facilities equal to at least 100% of the principal amount of the FCAR commercial paper *** Supported by a bank liquidity facility equal to at least 5% of the principal amount of the Motown Notes $57.2 *** ** |
SLIDE 12
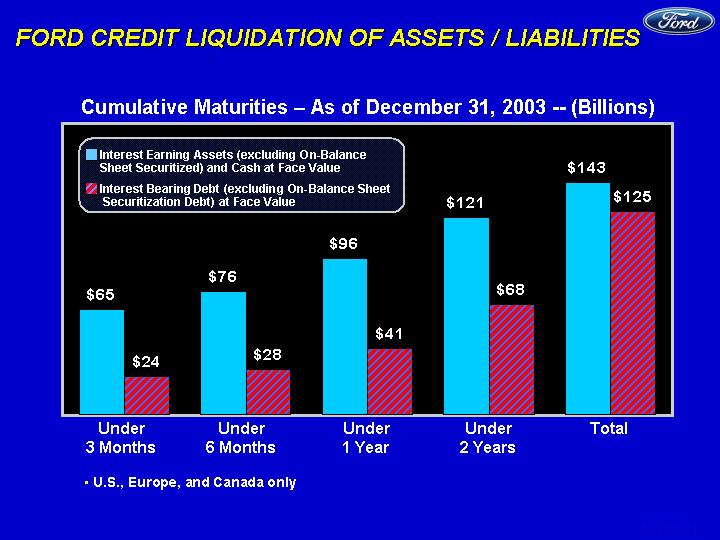
| Under 3 Months Under 6 Months Under 1 Year Under 2 Years Total Assets 65 76 96 121 143 Liabilities 24 28 41 68 125 FORD CREDIT LIQUIDATION OF ASSETS / LIABILITIES Cumulative Maturities - As of December 31, 2003 -- (Billions) U.S., Europe, and Canada only Under 3 Months Under 6 Months Under 1 Year Under 2 Years Total Interest Earning Assets (excluding On-Balance Sheet Securitized) and Cash at Face Value Interest Bearing Debt (excluding On-Balance Sheet Securitization Debt) at Face Value |
SLIDE 13
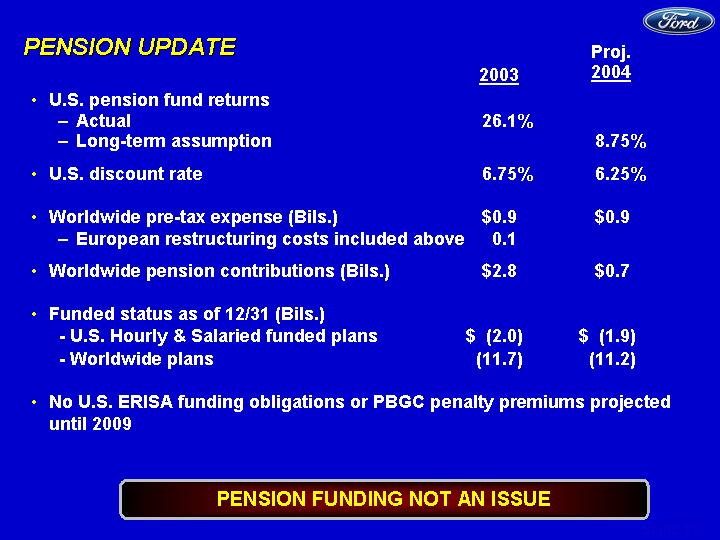
| PENSION UPDATE PENSION FUNDING NOT AN ISSUE U.S. pension fund returns Actual 26.1 % Long-term assumption 8.75 % U.S. discount rate 6.75 % 6.25 % Worldwide pre-tax expense (Bils.) $0.9 $0.9 European restructuring costs included above 0.1 Worldwide pension contributions (Bils.) $2.8 $0.7 Funded status as of 12/31 (Bils.) - U.S. Hourly & Salaried funded plans $ (2.0 ) $ (1.9 ) - Worldwide plans (11.7 ) (11.2 ) No U.S. ERISA funding obligations or PBGC penalty premiums projected until 2009 2003 Proj. 2004 |
SLIDE 14

| SUMMARY Ford Achieved good progress on key financial and operating metrics in 2003 Building on the basics in 2004 Accelerating flow of new, high-quality products into the market 2004 EPS of $1.20 - $1.30 from continuing operations, excluding special items Ford Credit Ford Credit had record earnings in 2003 Year-end 2004 managed receivables of $170-$175 billion Credit losses expected to be down Managed leverage to continue at 13-14 to 1 Liquidity is strong, with ample access to unsecured and asset-backed funding sources |
SLIDE 15

| SAFE HARBOR Greater price competition in the U.S. and Europe resulting from currency fluctuations, industry overcapacity or other factors; A significant decline in industry sales, particularly in the U.S. or Europe, resulting from slowing economic growth, geo-political events or other factors; Lower-than-anticipated market acceptance of new or existing products; Work stoppages at key Ford or supplier facilities or other interruptions of supplies; The discovery of defects in vehicles resulting in delays in new model launches, recall campaigns or increased warranty costs; Increased safety, emissions, fuel economy or other regulation resulting in higher costs and/or sales restrictions; Unusual or significant litigation or governmental investigations arising out of alleged defects in our products or otherwise; Worse-than-assumed economic and demographic experience for our post-retirement benefit plans (e.g., investment returns, interest rates, health care cost trends, benefit improvements); Currency or commodity price fluctuations; A market shift from truck sales in the U.S.; Economic difficulties in South America or Asia; Reduced availability of or higher prices for fuel; Labor or other constraints on our ability to restructure our business; A change in our requirements under long-term supply arrangements under which we are obligated to purchase minimum quantities or pay minimum amounts; A further credit rating downgrade; Inability to access debt or securitization markets around the world at competitive rates or in sufficient amounts; Higher-than-expected credit losses; Lower-than-anticipated residual values for leased vehicles; Increased price competition in the rental car industry and/or a general decline in business or leisure travel due to terrorist attacks, act of war or measures taken by governments in response thereto that negatively affect the travel industry; and Our inability to implement the Revitalization Plan. Statements included herein may constitute "forward looking statements" within the meaning of the Private Securities Litigation Reform Act of 1995. These statements involve a number of risks, uncertainties, and other factors that could cause actual results to differ materially from those stated, including, without limitation: |
SLIDE 16

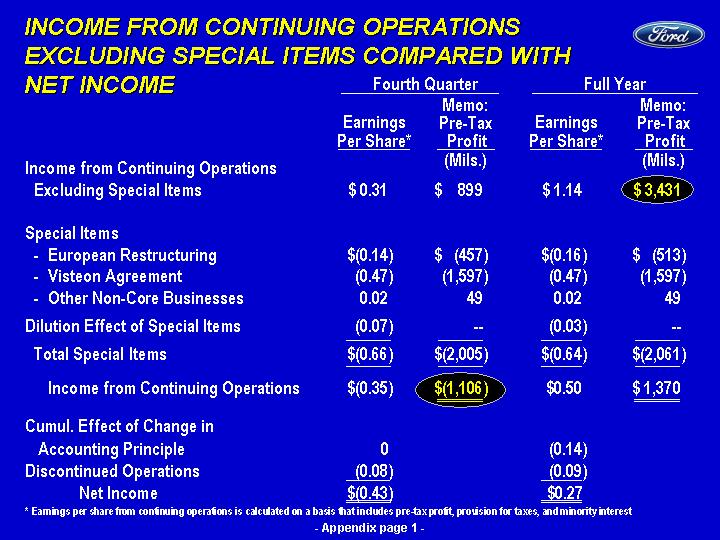
| INCOME FROM CONTINUING OPERATIONS EXCLUDING SPECIAL ITEMS COMPARED WITH NET INCOME Memo: Pre-Tax Profit (Mils.) Earnings Per Share* Memo: Pre-Tax Profit (Mils.) Fourth Quarter Full Year Earnings Per Share* * Earnings per share from continuing operations is calculated on a basis that includes pre-tax profit, provision for taxes, and minority interest Income from Continuing Operations Excluding Special Items $ 0.31 $ 899 $ 1.14 $ 3,431 Special Items - European Restructuring $(0.14 ) $ (457 ) $(0.16 ) $ (513 ) - Visteon Agreement (0.47 ) (1,597 ) (0.47 ) (1,597 ) - Other Non-Core Businesses 0.02 49 0.02 49 Dilution Effect of Special Items (0.07 ) -- (0.03 ) -- Total Special Items $(0.66 ) $(2,005 ) $(0.64 ) $(2,061 ) Income from Continuing Operations $(0.35 ) $(1,106 ) $0.50 $ 1,370 Cumul. Effect of Change in Accounting Principle 0 (0.14 ) Discontinued Operations (0.08 ) (0.09 ) Net Income $(0.43 ) $0.27 - - Appendix page 1 - |
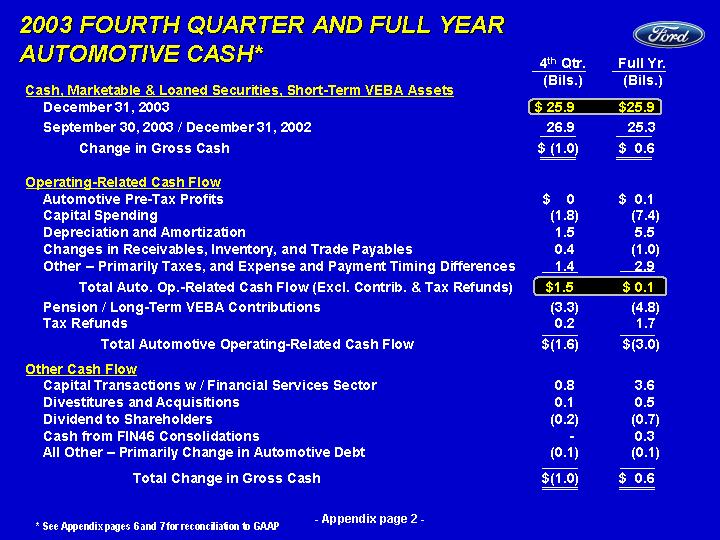
| 2003 FOURTH QUARTER AND FULL YEAR AUTOMOTIVE CASH* 4th Qtr. (Bils.) Full Yr. (Bils.) Cash, Marketable & Loaned Securities, Short-Term VEBA Assets December 31, 2003 $ 25.9 $25.9 September 30, 2003 / December 31, 2002 26.9 25.3 Change in Gross Cash $ (1.0 ) $ 0.6 Operating-Related Cash Flow Automotive Pre-Tax Profits $ 0 $ 0.1 Capital Spending (1.8 ) (7.4 ) Depreciation and Amortization 1.5 5.5 Changes in Receivables, Inventory, and Trade Payables 0.4 (1.0 ) Other -- Primarily Taxes, and Expense and Payment Timing Differences 1.4 2.9 Total Auto. Op.-Related Cash Flow (Excl. Contrib. & Tax Refunds) $1.5 $ 0.1 Pension / Long-Term VEBA Contributions (3.3 ) (4.8 ) Tax Refunds 0.2 1.7 Total Automotive Operating-Related Cash Flow $(1.6 ) $(3.0 ) Other Cash Flow Capital Transactions w / Financial Services Sector 0.8 3.6 Divestitures and Acquisitions 0.1 0.5 Dividend to Shareholders (0.2 ) (0.7 ) Cash from FIN46 Consolidations - 0.3 All Other - Primarily Change in Automotive Debt (0.1 ) (0.1 ) Total Change in Gross Cash $(1.0 ) $ 0.6 * See Appendix pages 6 and 7 for reconciliation to GAAP - - Appendix page 2 - |
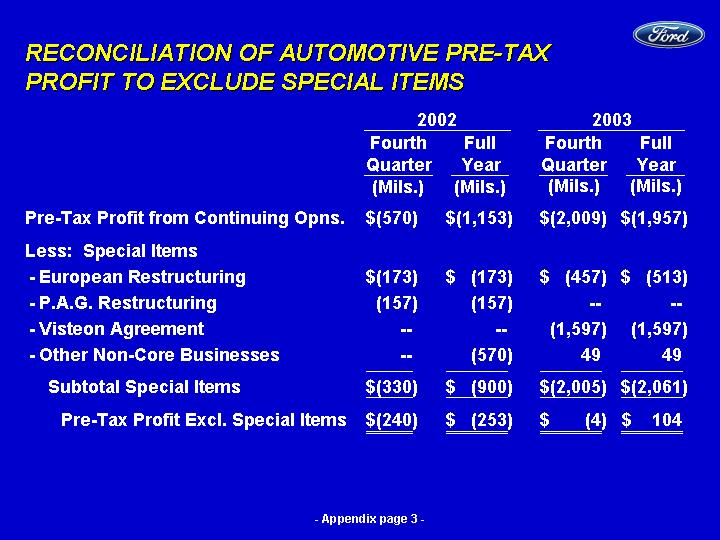
| RECONCILIATION OF AUTOMOTIVE PRE-TAX PROFIT TO EXCLUDE SPECIAL ITEMS Fourth Quarter (Mils.) Full Year (Mils.) Pre-Tax Profit from Continuing Opns. $(570 ) $(1,153 ) $(2,009 ) $(1,957 ) Less: Special Items - European Restructuring $(173 ) $ (173 ) $ (457 ) $ (513 ) - P.A.G. Restructuring (157 ) (157 ) -- -- - Visteon Agreement -- -- (1,597 ) (1,597 ) - Other Non-Core Businesses -- (570 ) 49 49 Subtotal Special Items $(330 ) $ (900 ) $(2,005 ) $(2,061 ) Pre-Tax Profit Excl. Special Items $(240 ) $ (253 ) $ (4 ) $ 104 Fourth Quarter (Mils.) Full Year (Mils.) 2002 2003 - - Appendix page 3 - |
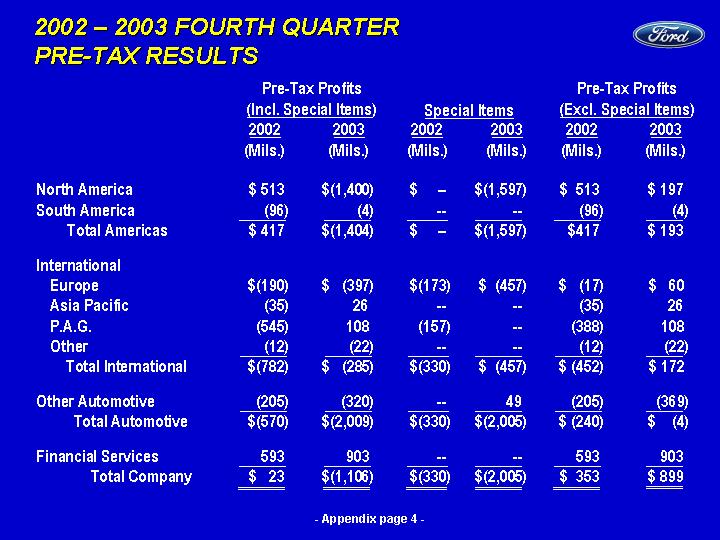
| 2002 - 2003 FOURTH QUARTER PRE-TAX RESULTS North America $ 513 $(1,400 ) $ -- $(1,597 ) $ 513 $ 197 South America (96 ) (4 ) -- -- (96 ) (4 ) Total Americas $ 417 $(1,404 ) $ -- $(1,597 ) $417 $ 193 International Europe $(190 ) $ (397 ) $(173 ) $ (457 ) $ (17 ) $ 60 Asia Pacific (35 ) 26 -- -- (35 ) 26 P.A.G. (545 ) 108 (157 ) -- (388 ) 108 Other (12 ) (22 ) -- -- (12 ) (22 ) Total International $(782 ) $ (285 ) $(330 ) $ (457 ) $ (452 ) $ 172 Other Automotive (205 ) (320 ) -- 49 (205 ) (369 ) Total Automotive $(570 ) $(2,009 ) $(330 ) $(2,005 ) $ (240 ) $ (4 ) Financial Services 593 903 -- -- 593 903 Total Company $ 23 $(1,106 ) $(330 ) $(2,005 ) $ 353 $ 899 2002 (Mils.) 2003 (Mils.) Pre-Tax Profits (Incl. Special Items) Special Items Pre-Tax Profits (Excl. Special Items) 2002 (Mils.) 2003 (Mils.) 2002 (Mils.) 2003 (Mils.) - - Appendix page 4 - |

| 2002 - 2003 FULL YEAR PRE-TAX RESULTS North America $ 2,490 $ 165 $ -- $(1,597 ) $ 2,490 $ 1,762 South America (622 ) (130 ) -- -- (622 ) (130 ) Total Americas $ 1,868 $ 35 $ -- $(1,597 ) $ 1,868 $ 1,632 International Europe $ (722 ) $(1,626 ) $(173 ) $ (513 ) $ (549 ) $(1,113 ) Asia Pacific (176 ) (25 ) -- -- (176 ) (25 ) P.A.G. (897 ) 164 (157 ) -- (740 ) 164 Other (15 ) 69 -- -- (15 ) 69 Total International $(1,810 ) $(1,418 ) $(330 ) $ (513 ) $(1,480 ) $ (905 ) Other Automotive (1,211 ) (574 ) (570 ) 49 (641 ) (623 ) Total Automotive $(1,153 ) $(1,957 ) $(900 ) $(2,061 ) $ (253 ) $ 104 Financial Services 2,104 3,327 -- -- 2,104 3,327 Total Company $ 951 $ 1,370 $(900 ) $(2,061 ) $ 1,851 $ 3,431 2002 (Mils.) 2003 (Mils.) Pre-Tax Profits (Incl. Special Items) Special Items Pre-Tax Profits (Excl. Special Items) 2002 (Mils.) 2003 (Mils.) 2002 (Mils.) 2003 (Mils.) - - Appendix page 5 - |
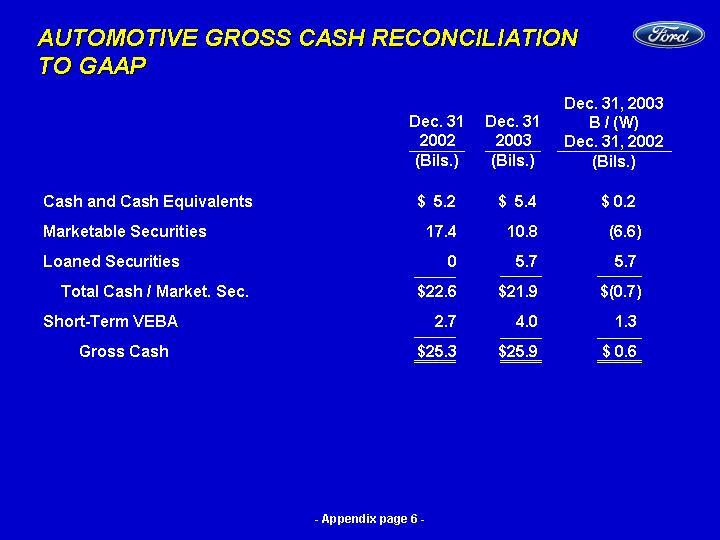
| AUTOMOTIVE GROSS CASH RECONCILIATION TO GAAP Cash and Cash Equivalents $ 5.2 $ 5.4 $ 0.2 Marketable Securities 17.4 10.8 (6.6 ) Loaned Securities 0 5.7 5.7 Total Cash / Market. Sec. $22.6 $21.9 $(0.7 ) Short-Term VEBA 2.7 4.0 1.3 Gross Cash $25.3 $25.9 $ 0.6 Dec. 31, 2003 B / (W) Dec. 31, 2002 (Bils.) Dec. 31 2003 (Bils.) Dec. 31 2002 (Bils.) - - Appendix page 6 - |
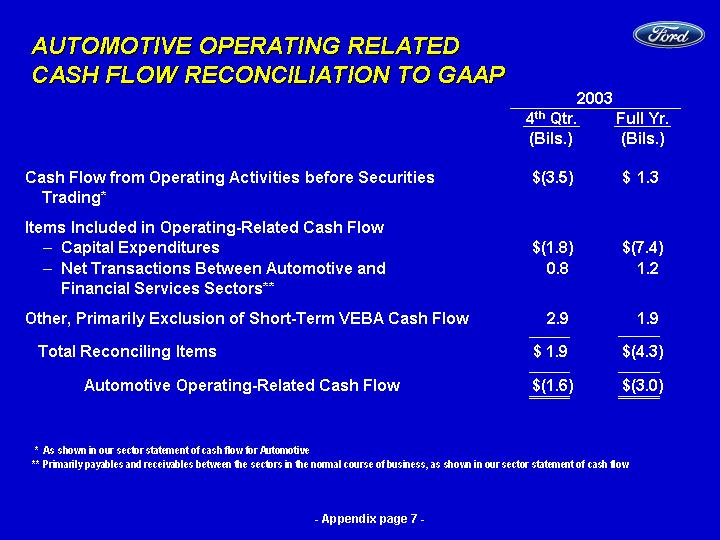
| AUTOMOTIVE OPERATING RELATED CASH FLOW RECONCILIATION TO GAAP Cash Flow from Operating Activities before Securities $(3.5 ) $ 1.3 Trading* Items Included in Operating-Related Cash Flow Capital Expenditures $(1.8 ) $(7.4 ) Net Transactions Between Automotive and 0.8 1.2 Financial Services Sectors** Other, Primarily Exclusion of Short-Term VEBA Cash Flow 2.9 1.9 Total Reconciling Items $ 1.9 $(4.3 ) Automotive Operating-Related Cash Flow $(1.6 ) $(3.0 ) Full Yr. (Bils.) 4th Qtr. (Bils.) 2003 * As shown in our sector statement of cash flow for Automotive ** Primarily payables and receivables between the sectors in the normal course of business, as shown in our sector statement of cash flow - - Appendix page 7 - |

| FORD CREDIT KEY METRIC DEFINITIONS In addition to evaluating Ford Credit's financial performance on a GAAP financial statement basis, Ford Credit management also uses other criteria, some of which were previously disclosed in this presentation and are defined below. Information about the impact of on-balance sheet securitization is also included below : Managed Receivables - receivables reported on Ford Credit's balance sheet and receivables Ford Credit sold in off-balance-sheet securitizations and continues to service Serviced Receivables - includes managed receivables and receivables Ford Credit sold in whole-loan sale transactions (i.e., receivables for which Ford Credit has no continuing exposure or risk of loss) Managed Credit Losses - credit losses associated with receivables reported on Ford Credit's balance sheet plus credit losses associated with receivables Ford Credit sold in off-balance sheet securitizations and continues to service Impact of On-Balance Sheet Securitization - retail installment receivables reported on Ford Credit's balance sheet include receivables sold for legal purposes to Ford Credit-sponsored special purpose entities in securitizations. These receivables are available only to pay securitization investors and other participants and are not available to pay the obligations of Ford Credit or the claims of Ford Credit's creditors. Debt reported on Ford Credit's balance sheet includes debt issued to securitization investors which is payable solely out of collections on the receivables supporting the securitization and is not the legal obligation of Ford Credit - - Appendix page 8 - |
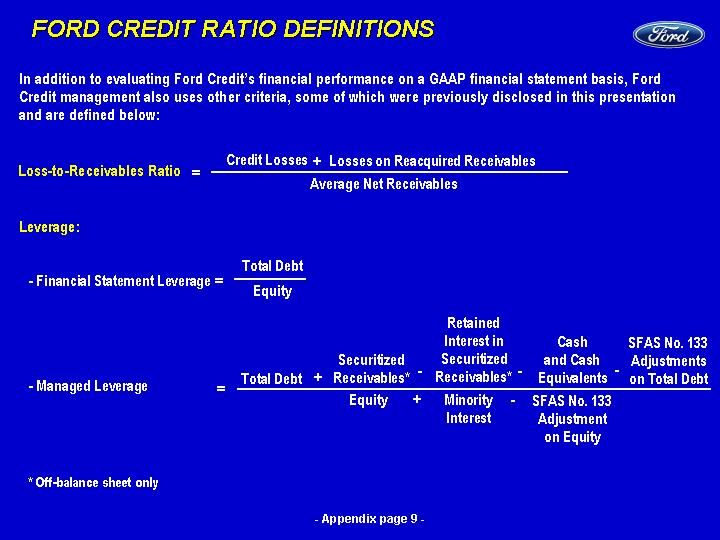
| FORD CREDIT RATIO DEFINITIONS In addition to evaluating Ford Credit's financial performance on a GAAP financial statement basis, Ford Credit management also uses other criteria, some of which were previously disclosed in this presentation and are defined below: Leverage: Total Debt - - Financial Statement Leverage = Equity Total Debt Securitized Receivables* Cash and Cash Equivalents SFAS No. 133 Adjustments on Total Debt Equity Minority Interest SFAS No. 133 Adjustment on Equity - - Managed Leverage + - - - - - - = + - - Retained Interest in Securitized Receivables* Credit Losses = + Losses on Reacquired Receivables Average Net Receivables Loss-to-Receivables Ratio - - Appendix page 9 - * Off-balance sheet only |
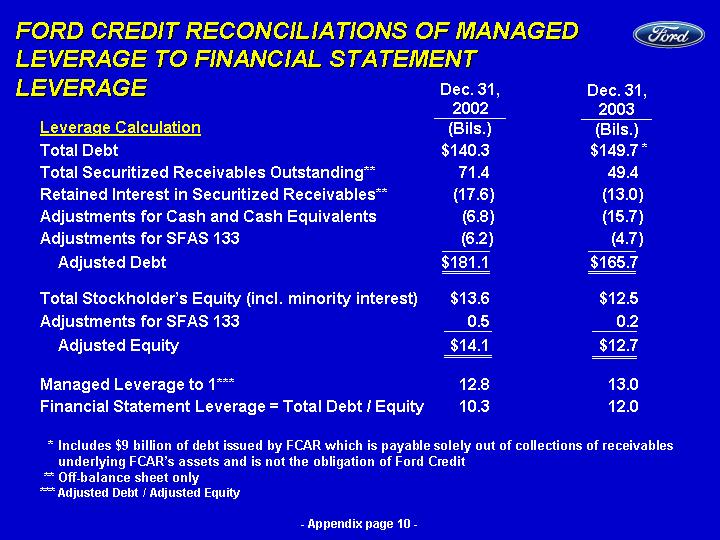
| FORD CREDIT RECONCILIATIONS OF MANAGED LEVERAGE TO FINANCIAL STATEMENT LEVERAGE Total Debt $140.3 $149.7 Total Securitized Receivables Outstanding** 71.4 49.4 Retained Interest in Securitized Receivables** (17.6 ) (13.0 ) Adjustments for Cash and Cash Equivalents (6.8 ) (15.7 ) Adjustments for SFAS 133 (6.2 ) (4.7 ) Adjusted Debt $181.1 $165.7 Total Stockholder's Equity (incl. minority interest) $13.6 $12.5 Adjustments for SFAS 133 0.5 0.2 Adjusted Equity $14.1 $12.7 Managed Leverage to 1*** 12.8 13.0 Financial Statement Leverage = Total Debt / Equity 10.3 12.0 * Includes $9 billion of debt issued by FCAR which is payable solely out of collections of receivables underlying FCAR's assets and is not the obligation of Ford Credit ** Off-balance sheet only *** Adjusted Debt / Adjusted Equity Dec. 31, 2002 (Bils.) Dec. 31, 2003 (Bils.) Leverage Calculation * - - Appendix page 10 - |


