Exhibit 99.1
Forest City Enterprises, Inc.
Supplemental Package
Years Ended January 31, 2012 and 2011
Forest City Enterprises, Inc. and Subsidiaries
Years Ended January 31, 2012 and 2011
Supplemental Package
NYSE: FCEA, FCEB
Index
| | | | |
Corporate Overview | | | 2-3 | |
| |
Selected Financial Information | | | | |
Forest City Enterprises, Inc. | | | | |
Consolidated Balance Sheet Information | | | 4-7 | |
Consolidated Earnings Information | | | 8-11 | |
Net Asset Value Components | | | 12-13 | |
| |
Supplemental Operating Information | | | | |
Occupancy Data | | | 14 | |
Retail Sales Data | | | 15 | |
Leasing Summary | | | 16 | |
Comparable Net Operating Income (NOI) | | | 17 | |
Comparable NOI Detail | | | 18-19 | |
NOI By Product Type | | | 20 | |
NOI By Core Market | | | 21 | |
Reconciliation of NOI to Net Earnings (Loss) | | | 22-23 | |
Results of Operations Discussion | | | 24-27 | |
EBDT Bridge | | | 28-29 | |
Reconciliation of Net Earnings (Loss) to EBDT | | | 30-31 | |
Schedules of Lease Expirations | | | 32-33 | |
Schedules of Significant Tenants | | | 34-35 | |
Development Pipeline | | | 36-42 | |
| |
Supplemental Financial Information | | | | |
Common Stock Data/Covenants | | | 43 | |
Projects under Construction and Development Debt and Nonrecourse Debt | | | 44 | |
Scheduled Maturities Table | | | 45-46 | |
Investments in and Advances to Affiliates | | | 47-49 | |
Forest City Rental Properties Corporation | | | | |
Consolidated Balance Sheet Information | | | 50 | |
Consolidated Earnings Information | | | 51 | |
Summary of EBDT | | | 52-63 | |
Property Listing | | | 64-75 | |
This Supplemental Package, together with other statements and information publicly disseminated by us, contains “forward-looking statements” within the meaning of Section 27A of the Securities Act of 1933, as amended, and Section 21E of the Securities Exchange Act of 1934, as amended. Such statements reflect management’s current views with respect to financial results related to future events and are based on assumptions and expectations that may not be realized and are inherently subject to risks and uncertainties, many of which cannot be predicted with accuracy and some of which might not even be anticipated. Future events and actual results, financial or otherwise, may differ from the results discussed in the forward-looking statements. Risk factors discussed in Item 1A of our Form 10-K for the year ended January 31, 2011, as such risk factors shall be updated in our Form 10-K for the year ended January 31, 2012 and other factors that might cause differences, some of which could be material, include, but are not limited to, the impact of current lending and capital market conditions on our liquidity, ability to finance or refinance projects and repay our debt, the impact of the current economic environment on the ownership, development and management of our real estate portfolio, general real estate investment and development risks, vacancies in our properties, the strategic decision to reposition or divest portions of our land business, further downturns in the housing market, competition, illiquidity of real estate investments, bankruptcy or defaults of tenants, anchor store consolidations or closings, international activities, the impact of terrorist acts, risks associated with an investment in a professional sports team, our substantial debt leverage and the ability to obtain and service debt, the impact of restrictions imposed by our credit facility and senior debt, exposure to hedging agreements, the level and volatility of interest rates, the continued availability of tax-exempt government financing, the impact of credit rating downgrades, effects of uninsured or underinsured losses, effects of a downgrade or failure of our insurance carriers, environmental liabilities, conflicts of interest, risks associated with the sale of tax credits, risks associated with developing and managing properties in partnership with others, the ability to maintain effective internal controls, compliance with governmental regulations, increased legislative and regulatory scrutiny of the financial services industry, volatility in the market price of our publicly traded securities, inflation risks, litigation risks, cybersecurity risks and cyber incidents as well as other risks listed from time to time in our reports filed with the Securities and Exchange Commission. We have no obligation to revise or update any forward-looking statements, other than imposed by law, as a result of future events or new information. Readers are cautioned not to place undue reliance on such forward-looking statements.
1
Forest City Enterprises, Inc. and Subsidiaries
Supplemental Financial and Operating Information
Corporate Overview
We principally engage in the ownership, development, management and acquisition of commercial and residential real estate and land throughout the United States. We operate through three strategic business units and five reportable segments. TheCommercial Group, our largest strategic business unit, owns, develops, acquires and operates regional malls, specialty/urban retail centers, office and life science buildings, hotels and mixed-use projects. TheResidential Group owns, develops, acquires and operates residential rental properties, including upscale and middle-market apartments and adaptive re-use developments. Additionally, the Residential Group develops for-sale condominium projects and also owns interests in entities that develop and manage military family housing. The Land Development Group acquires and sells both land and developed lots to residential, commercial and industrial customers. It also owns and develops land into master-planned communities and mixed-use projects. As of January 31, 2012, our Board of Directors approved a strategic decision by senior management to reposition or divest significant portions of our Land Development Group and are actively reviewing alternatives to do so.Real Estate Groups are the combined Commercial, Residential and Land Development Groups.Corporate Activities and theNets, a member of the National Basketball Association (“NBA”) in which we account for our investment on the equity method of accounting, are other reportable segments of the Company.
We have approximately $10.5 billion of assets in 28 states and the District of Columbia at January 31, 2012. Our core markets include Boston, Chicago, Dallas, Denver, Los Angeles, New York, Philadelphia, the Greater San Francisco metropolitan area and the Greater Washington D.C. metropolitan area. Our core markets account for approximately 77 percent of the cost of our real estate portfolio at January 31, 2012. We have offices in Albuquerque, Boston, Chicago, Dallas, Denver, London (England), Los Angeles, New York City, San Francisco, Washington, D.C. and our corporate headquarters in Cleveland, Ohio.
SUPPLEMENTAL FINANCIAL AND OPERATING INFORMATION
We recommend that this supplemental package be read in conjunction with our Form 10-K for the year ended January 31, 2012 expected to be filed with the Securities and Exchange Commission (“SEC”) on April 2, 2012. This supplemental package contains certain measures prepared in accordance with generally accepted accounting principles (“GAAP”) under the full consolidation accounting method and certain measures prepared under the pro-rata consolidation method, a non-GAAP measure. Along with net earnings, we use an additional measure, Earnings Before Depreciation, Amortization and Deferred Taxes (“EBDT”), to report operating results. EBDT is a non-GAAP measure and may not be directly comparable to similarly-titled measures reported by other companies. The non-GAAP financial measures presented under the pro-rata consolidation method, comparable net operating income (“NOI”) and EBDT, provide supplemental information about our operations. Although these measures are not presented in accordance with GAAP, we believe they are necessary to understand our business and operating results, along with net earnings and other GAAP measures. Our investors can use these non-GAAP measures as supplementary information to evaluate our business. Our non-GAAP measures are not intended to be performance measures that should be regarded as alternatives to, or more meaningful than, our GAAP measures.
Revision of Prior Period Financial Statements
Historically, we have recorded an allowance for projects under development (the “Allowance”) that have not been abandoned at each balance sheet date. During the three months ended January 31, 2012, we determined that the recording of the Allowance was not in accordance with ASC 970-360-40. The impact of this error (the “Allowance Revision”) was an understatement of operating expenses of $1,000,000 ($612,000 after tax) for the year ended January 31, 2011, and a $13,949,000 understatement of retained earnings as of January 31, 2010. We assessed the materiality of this error on prior periods’ financial statements in accordance with ASC 250-10 (SEC’s Staff Accounting Bulletin No. 99, Materiality), and concluded that the error was not material to any prior annual or interim periods but would be material if the entire correction was recorded during the year ended January 31, 2012. Accordingly, the financial statements as of January 31, 2011 and the year then ended presented herein have been revised to correct for the error.
Consolidation Methods
We present certain financial amounts under the pro-rata consolidation method because we believe this information is useful to investors as this method reflects the manner in which we operate our business. In line with industry practice, we have made a large number of investments in which our economic ownership is less than 100% as a means of procuring opportunities and sharing risk. Under the pro-rata consolidation method, we generally present our investments proportionate to our economic share of ownership. Under GAAP, the full consolidation method is used to report partnership assets and liabilities consolidated at 100% if deemed to be under our control or if we are deemed to be the primary beneficiary of the variable interest entity (“VIE”), even if our ownership is not 100%. We provide reconciliations from the full consolidation method to the pro-rata consolidation method throughout our supplemental package. Please refer to our property listing for the detail of our consolidated and unconsolidated properties in this supplemental package.
EBDT
We believe that EBDT, along with net earnings, provides additional information about our core operations. While property dispositions, acquisitions or other factors can affect net earnings in the short-term, we believe EBDT presents a more consistent view of the overall financial performance of our business from period-to-period. EBDT is used by the chief operating decision maker and management to assess performance and resource allocations by strategic business unit and on a consolidated basis. EBDT is similar to Funds From Operations, a measure of performance used by publicly traded Real Estate Investment Trusts, but may not be directly comparable to similarly titled measures reported by other companies.
2
Forest City Enterprises, Inc. and Subsidiaries
Supplemental Financial and Operating Information
Supplemental Operating Information
The operating information contained in this document includes: occupancy data, retail sales data, leasing summaries, comparable NOI, NOI by product type and core market, reconciliation of NOI to net earnings, results of operations discussion, EBDT bridge, reconciliation of net earnings to EBDT, retail and office lease expirations, significant retail and office tenants, and our development pipeline. We believe this information will give interested parties a better understanding and more information about our operating performance. The term “comparable,” which is used throughout this document, is generally defined as including properties that were open and operated in both the years ended January 31, 2012 and 2011.
We believe occupancy rates, retail and office lease expirations, base rent, significant retail and office tenant listings, mall sales per square foot, and leasing spreads represent meaningful operating statistics about us.
Comparable NOI is useful because it measures the performance of the same properties on a period-to-period basis and, along with EBDT, is used to assess operating performance and resource allocation of our strategic business units. While property dispositions, acquisitions or other factors can impact net earnings in the short term, we believe comparable NOI gives a more consistent view of our overall performance from quarter-to-quarter and year-to-year. A reconciliation of NOI to net earnings, the most comparable financial measure calculated in accordance with GAAP, a reconciliation of NOI to net earnings for each strategic business unit and a reconciliation from NOI to comparable NOI are included in this supplemental package.
Corporate Headquarters
Forest City Enterprises, Inc.
Terminal Tower
50 Public Square, Suite 1100
Cleveland, Ohio 44113
Annual Report on Form 10-K
A copy of the Annual Report on Form 10-K as filed with the Securities and Exchange Commission for the fiscal year ended January 31, 2012 is expected to be filed with the SEC on April 2, 2012 and, at the time, can be found on our website under SEC Filings or may be obtained without charge upon written request to:
Jeffrey B. Linton
Senior Vice President, Corporate Communication
jefflinton@forestcity.net
Website
www.forestcity.net
The information contained on this website is not incorporated herein by reference and does not constitute a part of this supplemental package.
Investor Relations
Robert G. O’Brien
Executive Vice President and Chief Financial Officer
Transfer Agent and Registrar
Wells Fargo
Shareowner Services
P.O. Box 64854
St. Paul, MN 55164-9440
(800) 468-9716
www.shareowneronline.com
Stock Exchange Listing
NYSE: FCEA and FCEB
Dividend Reinvestment and Stock Purchase Plan
We offer our shareholders the opportunity to purchase additional shares of common stock through the Forest City Enterprises, Inc. Dividend Reinvestment and Stock Purchase Plan (the “Plan”) at 97% of current market value. You may obtain a copy of the Plan prospectus and an enrollment card by contacting Wells Fargo Shareowner Services at (800) 468-9716 or by visiting www.shareowneronline.com.
3
(THIS PAGE INTENTIONALLY LEFT BLANK)
Forest City Enterprises, Inc. and Subsidiaries
Selected Financial Information
As discussed earlier, we present certain financial amounts under the pro-rata consolidation method (a non-GAAP measure). This information is useful to our investors because we believe that it more accurately reflects the manner in which we operate our business. This is because, in line with industry practice, we have a large number of investments in which our economic ownership is less than 100% as a means of procuring opportunities and sharing risk. The tables below present amounts for both full consolidation, a GAAP measure, and pro-rata consolidation, providing a reconciliation of the difference between the two methods. Under the pro-rata consolidation method, we present our partnership investments proportionate to our share of ownership for each line item of our consolidated financial statements. Under full consolidation, partnership assets and liabilities are reported as consolidated at 100% if deemed to be under our control or if we are deemed to be the primary beneficiary for our investments in a VIE. Partnership assets and liabilities are reported on the equity or cost method of accounting if we do not have control, or, in the case of investments in VIEs, we are not deemed the primary beneficiary.
Consolidated Balance Sheet Information – January 31, 2012 (Unaudited)
| | | | | | | | | | | | | | | | |
| | | Full
Consolidation
(GAAP) | | | Less
Noncontrolling
Interest | | | Plus
Unconsolidated
Investments at
Pro-Rata | | | Pro-Rata
Consolidation
(Non-GAAP) | |
| | | (in thousands) | |
Assets | | | | | | | | | | | | | | | | |
Real Estate | | | | | | | | | | | | | | | | |
Completed rental properties | | | | | | | | | | | | | | | | |
Residential | | $ | 1,584,403 | | | $ | 27,003 | | | $ | 1,229,109 | | | $ | 2,786,509 | |
Commercial | | | | | | | | | | | | | | | | |
Retail centers | | | 2,638,954 | | | | 74,012 | | | | 1,203,459 | | | | 3,768,401 | |
Office and other buildings | | | 2,949,699 | | | | 94,310 | | | | 387,543 | | | | 3,242,932 | |
Corporate and other equipment | | | 10,392 | | | | – | | | | – | | | | 10,392 | |
Total completed rental properties | | | 7,183,448 | | | | 195,325 | | | | 2,820,111 | | | | 9,808,234 | |
| | | | |
Projects under construction | | | | | | | | | | | | | | | | |
Residential | | | 56,496 | | | | 988 | | | | 95,404 | | | | 150,912 | |
Commercial | | | | | | | | | | | | | | | | |
Retail centers | | | 595,011 | | | | 309 | | | | 7,945 | | | | 602,647 | |
Office and other buildings | | | 606,304 | | | | 370,626 | | | | 2,302 | | | | 237,980 | |
Total projects under construction | | | 1,257,811 | | | | 371,923 | | | | 105,651 | | | | 991,539 | |
Projects under development | | | | | | | | | | | | | | | | |
Residential | | | 776,817 | | | | 170,423 | | | | 17,693 | | | | 624,087 | |
Commercial | | | | | | | | | | | | | | | | |
Retail centers | | | 39,495 | | | | 99 | | | | 10,481 | | | | 49,877 | |
Office and other buildings | | | 254,856 | | | | 25,712 | | | | 2,670 | | | | 231,814 | |
Total projects under development | | | 1,071,168 | | | | 196,234 | | | | 30,844 | | | | 905,778 | |
Total projects under construction and development | | | 2,328,979 | | | | 568,157 | | | | 136,495 | | | | 1,897,317 | |
Land held for development and sale | | | 77,298 | | | | 7,451 | | | | 24,851 | | | | 94,698 | |
Total Real Estate | | | 9,589,725 | | | | 770,933 | | | | 2,981,457 | | | | 11,800,249 | |
Less accumulated depreciation | | | (1,526,503 | ) | | | (46,085 | ) | | | (557,613 | ) | | | (2,038,031 | ) |
Real Estate, net | | | 8,063,222 | | | | 724,848 | | | | 2,423,844 | | | | 9,762,218 | |
| | | | |
Cash and equivalents | | | 217,486 | | | | 9,324 | | | | 60,689 | | | | 268,851 | |
Restricted cash and escrowed funds | | | 542,566 | | | | 98,001 | | | | 109,282 | | | | 553,847 | |
Notes and accounts receivable, net | | | 406,244 | | | | 19,542 | | | | 36,684 | | | | 423,386 | |
Investments in and advances to unconsolidated entities | | | 609,079 | | | | (160,470 | ) | | | (542,772 | ) | | | 226,777 | |
Lease and mortgage procurement costs, net | | | 273,995 | | | | 8,760 | | | | 58,512 | | | | 323,747 | |
Prepaid expenses and other deferred costs, net | | | 227,354 | | | | 34,626 | | | | 20,708 | | | | 213,436 | |
Intangible assets, net | | | 107,192 | | | | 3 | | | | 11,076 | | | | 118,265 | |
Land held for divestiture | | | 57,145 | | | | 14,141 | | | | 45,257 | | | | 88,261 | |
Total Assets | | $ | 10,504,283 | | | $ | 748,775 | | | $ | 2,223,280 | | | $ | 11,978,788 | |
4
Forest City Enterprises, Inc. and Subsidiaries
Selected Financial Information
Consolidated Balance Sheet Information – January 31, 2012 (Unaudited)
| | | $0000000000 | | | | $0000000000 | | | | $0000000000 | | | | $0000000000 | |
| | | Full Consolidation (GAAP) | | | Less Noncontrolling Interest | | | Plus Unconsolidated Investments at Pro-Rata | | | Pro-Rata Consolidation (Non-GAAP) | |
| | | (in thousands) | |
Liabilities and Equity | | | | | | | | | | | | | | | | |
Liabilities | | | | | | | | | | | | | | | | |
Mortgage debt and notes payable, nonrecourse | | | | | | | | | | | | | | | | |
Completed rental properties | | | | | | | | | | | | | | | | |
Residential | | $ | 1,008,576 | | | $ | 18,844 | | | $ | 949,015 | | | $ | 1,938,747 | |
Commercial | | | | | | | | | | | | | | | | |
Retail centers | | | 1,735,148 | | | | 67,371 | | | | 971,035 | | | | 2,638,812 | |
Office and other buildings | | | 2,064,588 | | | | 73,056 | | | | 301,910 | | | | 2,293,442 | |
| | | | |
Total completed rental properties | | | 4,808,312 | | | | 159,271 | | | | 2,221,960 | | | | 6,871,001 | |
Projects under construction | | | | | | | | | | | | | | | | |
Residential | | | 6,596 | | | | – | | | | 56,737 | | | | 63,333 | |
Commercial | | | | | | | | | | | | | | | | |
Retail centers | | | 330,533 | | | | – | | | | – | | | | 330,533 | |
Office and other buildings | | | 207,028 | | | | 127,685 | | | | – | | | | 79,343 | |
| | | | |
Total projects under construction | | | 544,157 | | | | 127,685 | | | | 56,737 | | | | 473,209 | |
Projects under development | | | | | | | | | | | | | | | | |
Residential | | | 272,195 | | | | 66,027 | | | | – | | | | 206,168 | |
Commercial | | | | | | | | | | | | | | | | |
Retail centers | | | – | | | | – | | | | – | | | | – | |
Office and other buildings | | | – | | | | – | | | | 2,887 | | | | 2,887 | |
| | | | |
Total projects under development | | | 272,195 | | | | 66,027 | | | | 2,887 | | | | 209,055 | |
| | | | |
Total projects under construction and development | | | 816,352 | | | | 193,712 | | | | 59,624 | | | | 682,264 | |
Land held for development and sale | | | 15,775 | | | | 1,578 | | | | 12,655 | | | | 26,852 | |
| | | | |
Total Mortgage debt and notes payable, nonrecourse | | | 5,640,439 | | | | 354,561 | | | | 2,294,239 | | | | 7,580,117 | |
Bank revolving credit facility | | | – | | | | – | | | | – | | | | – | |
Senior and subordinated debt | | | 1,038,529 | | | | – | | | | – | | | | 1,038,529 | |
| | | | |
Construction payables | | | 202,395 | | | | 61,564 | | | | 18,564 | | | | 159,395 | |
Operating accounts payable and accrued expenses | | | 621,582 | | | | 27,798 | | | | 161,323 | | | | 755,107 | |
Accrued derivative liability | | | 174,020 | | | | – | | | | 19,033 | | | | 193,053 | |
Deferred profit on NY retail joint venture transaction | | | 114,465 | | | | – | | | | – | | | | 114,465 | |
| | | | |
Total Accounts payable, accrued expenses and other liabilities | | | 1,112,462 | | | | 89,362 | | | | 198,920 | | | | 1,220,020 | |
Cash distributions and losses in excess of investments in unconsolidated entities | | | 279,708 | | | | (24,803 | ) | | | (282,105 | ) | | | 22,406 | |
Deferred income taxes | | | 433,040 | | | | – | | | | – | | | | 433,040 | |
Mortgage debt and notes payable, nonrecourse on land held for divestiture | | | 19,084 | | | | 1,721 | | | | 12,226 | | | | 29,589 | |
| | | | |
Total Liabilities | | | 8,523,262 | | | | 420,841 | | | | 2,223,280 | | | | 10,325,701 | |
| | | | |
Redeemable Noncontrolling Interest | | | 229,149 | | | | 229,149 | | | | – | | | | – | |
| | | | |
Equity | | | | | | | | | | | | | | | | |
Shareholders’ Equity | | | | | | | | | | | | | | | | |
Shareholders’ equity before accumulated other comprehensive loss | | | 1,587,526 | | | | – | | | | – | | | | 1,587,526 | |
Accumulated other comprehensive loss | | | (120,460 | ) | | | – | | | | – | | | | (120,460 | ) |
| | | | |
Total Shareholders’ Equity | | | 1,467,066 | | | | – | | | | – | | | | 1,467,066 | |
Noncontrolling interest | | | 284,806 | | | | 98,785 | | | | – | | | | 186,021 | |
| | | | |
Total Equity | | | 1,751,872 | | | | 98,785 | | | | – | | | | 1,653,087 | |
| | | | |
Total Liabilities and Equity | | $ | 10,504,283 | | | $ | 748,775 | | | $ | 2,223,280 | | | $ | 11,978,788 | |
| | | | |
5
Forest City Enterprises, Inc. and Subsidiaries
Selected Financial Information
Consolidated Balance Sheet Information – January 31, 2011 (Unaudited)
| | | $0000000000 | | | | $0000000000 | | | | $0000000000 | | | | $0000000000 | |
| | | Full Consolidation (GAAP) | | | Less Noncontrolling Interest | | | Plus Unconsolidated Investments at Pro-Rata | | | Pro-Rata Consolidation (Non-GAAP) | |
| | | (in thousands) | |
Assets | | | | | | | | | | | | | | | | |
Real Estate | | | | | | | | | | | | | | | | |
Completed rental properties | | | | | | | | | | | | | | | | |
Residential | | $ | 1,664,490 | | | $ | 26,028 | | | $ | 826,356 | | | $ | 2,464,818 | |
Commercial | | | | | | | | | | | | | | | | |
Retail centers | | | 3,226,717 | | | | 113,193 | | | | 718,593 | | | | 3,832,117 | |
Office and other buildings | | | 3,314,371 | | | | 253,604 | | | | 378,863 | | | | 3,439,630 | |
Corporate and other equipment | | | 9,847 | | | | – | | | | 1 | | | | 9,848 | |
| | | | |
Total completed rental properties | | | 8,215,425 | | | | 392,825 | | | | 1,923,813 | | | | 9,746,413 | |
Projects under construction | | | | | | | | | | | | | | | | |
Residential | | | 771,245 | | | | 213,988 | | | | 3,642 | | | | 560,899 | |
Commercial | | | | | | | | | | | | | | | | |
Retail centers | | | 703,397 | | | | 532 | | | | 50,220 | | | | 753,085 | |
Office and other buildings | | | 297,069 | | | | 199,241 | | | | 1,981 | | | | 99,809 | |
| | | | |
Total projects under construction | | | 1,771,711 | | | | 413,761 | | | | 55,843 | | | | 1,413,793 | |
Projects under development | | | | | | | | | | | | | | | | |
Residential | | | 687,125 | | | | 222,514 | | | | 6,063 | | | | 470,674 | |
Commercial | | | | | | | | | | | | | | | | |
Retail centers | | | 17,837 | | | | 99 | | | | 10,890 | | | | 28,628 | |
Office and other buildings | | | 229,562 | | | | 58,830 | | | | 6,807 | | | | 177,539 | |
| | | | |
Total projects under development | | | 934,524 | | | | 281,443 | | | | 23,760 | | | | 676,841 | |
| | | | |
Total projects under construction and development | | | 2,706,235 | | | | 695,204 | | | | 79,603 | | | | 2,090,634 | |
Land held for development and sale | | | 244,879 | | | | 18,683 | | | | 115,607 | | | | 341,803 | |
| | | | |
Total Real Estate | | | 11,166,539 | | | | 1,106,712 | | | | 2,119,023 | | | | 12,178,850 | |
Less accumulated depreciation | | | (1,614,399 | ) | | | (63,987 | ) | | | (424,331 | ) | | | (1,974,743 | ) |
| | | | |
Real Estate, net | | | 9,552,140 | | | | 1,042,725 | | | | 1,694,692 | | | | 10,204,107 | |
Cash and equivalents | | | 193,372 | | | | 13,979 | | | | 48,583 | | | | 227,976 | |
Restricted cash and escrowed funds | | | 720,180 | | | | 240,709 | | | | 78,890 | | | | 558,361 | |
Notes and accounts receivable, net | | | 403,101 | | | | 20,329 | | | | 86,729 | | | | 469,501 | |
Investments in and advances to unconsolidated entities | | | 431,509 | | | | (278,671 | ) | | | (323,995 | ) | | | 386,185 | |
Lease and mortgage procurement costs, net | | | 356,804 | | | | 30,171 | | | | 33,025 | | | | 359,658 | |
Prepaid expenses and other deferred costs, net | | | 266,689 | | | | 44,536 | | | | 10,443 | | | | 232,596 | |
Intangible assets, net | | | 135,906 | | | | 5 | | | | 1,289 | | | | 137,190 | |
| | | | |
Total Assets | | $ | 12,059,701 | | | $ | 1,113,783 | | | $ | 1,629,656 | | | $ | 12,575,574 | |
| | | | |
6
Forest City Enterprises, Inc. and Subsidiaries
Selected Financial Information
Consolidated Balance Sheet Information – January 31, 2011 (Unaudited)
| | | $000000000 | | | | $000000000 | | | | $000000000 | | | | $000000000 | |
| | | Full
Consolidation
(GAAP) | | | Less
Noncontrolling
Interest | | | Plus
Unconsolidated
Investments at
Pro-Rata | | | Pro-Rata
Consolidation
(Non-GAAP) | |
| | | (in thousands) | |
Liabilities and Equity | | | | | | | | | | | | | | | | |
Liabilities | | | | | | | | | | | | | | | | |
Mortgage debt and notes payable, nonrecourse | | | | | | | | | | | | | | | | |
Completed rental properties | | | | | | | | | | | | | | | | |
Residential | | $ | 1,110,095 | | | $ | 18,998 | | | $ | 709,846 | | | $ | 1,800,943 | |
Commercial | | | | | | | | | | | | | | | | |
Retail centers | | | 2,322,539 | | | | 120,042 | | | | 655,162 | | | | 2,857,659 | |
Office and other buildings | | | 2,346,189 | | | | 219,327 | | | | 295,641 | | | | 2,422,503 | |
| | | | |
Total completed rental properties | | | 5,778,823 | | | | 358,367 | | | | 1,660,649 | | | | 7,081,105 | |
| | | | |
Projects under construction | | | | | | | | | | | | | | | | |
Residential | | | 717,700 | | | | 203,681 | | | | – | | | | 514,019 | |
Commercial | | | | | | | | | | | | | | | | |
Retail centers | | | 379,363 | | | | – | | | | – | | | | 379,363 | |
Office and other buildings | | | 82,157 | | | | 60,108 | | | | – | | | | 22,049 | |
| | | | |
Total projects under construction | | | 1,179,220 | | | | 263,789 | | | | – | | | | 915,431 | |
Projects under development | | | | | | | | | | | | | | | | |
Residential | | | 155,890 | | | | 61,760 | | | | – | | | | 94,130 | |
Commercial | | | | | | | | | | | | | | | | |
Retail centers | | | – | | | | – | | | | – | | | | – | |
Office and other buildings | | | 42,200 | | | | 16,880 | | | | 2,887 | | | | 28,207 | |
| | | | |
Total projects under development | | | 198,090 | | | | 78,640 | | | | 2,887 | | | | 122,337 | |
| | | | |
Total projects under construction and development | | | 1,377,310 | | | | 342,429 | | | | 2,887 | | | | 1,037,768 | |
Land held for development and sale | | | 51,085 | | | | 3,500 | | | | 49,831 | | | | 97,416 | |
| | | | |
Total Mortgage debt and notes payable, nonrecourse | | | 7,207,218 | | | | 704,296 | | | | 1,713,367 | | | | 8,216,289 | |
Bank revolving credit facility | | | 137,152 | | | | – | | | | – | | | | 137,152 | |
Senior and subordinated debt | | | 773,683 | | | | – | | | | – | | | | 773,683 | |
| | | | |
Construction payables | | | 179,601 | | | | 44,490 | | | | 4,670 | | | | 139,781 | |
Operating accounts payable and accrued expenses | | | 715,068 | | | | 28,443 | | | | 105,075 | | | | 791,700 | |
Accrued derivative liability | | | 156,587 | | | | 3,327 | | | | 15,163 | | | | 168,423 | |
| | | | |
Total Accounts payable, accrued expenses and other liabilities | | | 1,051,256 | | | | 76,260 | | | | 124,908 | | | | 1,099,904 | |
Cash distributions and losses in excess of investments in unconsolidated entities | | | 290,492 | | | | (38,493 | ) | | | (208,619 | ) | | | 120,366 | |
Deferred income taxes | | | 498,811 | | | | – | | | | – | | | | 498,811 | |
| | | | |
Total Liabilities | | | 9,958,612 | | | | 742,063 | | | | 1,629,656 | | | | 10,846,205 | |
| | | | |
Redeemable Noncontrolling Interest | | | 226,829 | | | | 226,829 | | | | – | | | | – | |
Equity | | | | | | | | | | | | | | | | |
Shareholders’ Equity | | | | | | | | | | | | | | | | |
Shareholders’ equity before accumulated other comprehensive loss | | | 1,637,777 | | | | – | | | | – | | | | 1,637,777 | |
Accumulated other comprehensive loss | | | (94,429 | ) | | | – | | | | – | | | | (94,429 | ) |
| | | | |
Total Shareholders’ Equity | | | 1,543,348 | | | | – | | | | – | | | | 1,543,348 | |
Noncontrolling interest | | | 330,912 | | | | 144,891 | | | | – | | | | 186,021 | |
| | | | |
Total Equity | | | 1,874,260 | | | | 144,891 | | | | – | | | | 1,729,369 | |
| | | | |
Total Liabilities and Equity | | $ | 12,059,701 | | | $ | 1,113,783 | | | $ | 1,629,656 | | | $ | 12,575,574 | |
| | | | |
7
Forest City Enterprises, Inc. and Subsidiaries
Selected Financial Information
Consolidated Earnings Information – Three Months Ended January 31, 2012 (Unaudited)
| | | $0000000000 | | | | $0000000000 | | | | $0000000000 | | | | $0000000000 | | | | $0000000000 | |
| | | Full Consolidation (GAAP) | | | Less Noncontrolling Interest | | | Plus Unconsolidated Investments at Pro-Rata | | | Plus Discontinued Operations | | | Pro-Rata Consolidation (Non-GAAP) | |
| | | (in thousands) | |
Revenues from real estate operations | | $ | 281,249 | | | $ | 17,675 | | | $ | 106,313 | | | $ | 2,481 | | | $ | 372,368 | |
| | | | | |
Expenses | | | | | | | | | | | | | | | | | | | | |
Operating expenses | | | 191,427 | | | | 13,600 | | | | 49,895 | | | | 2,828 | | | | 230,550 | |
Depreciation and amortization | | | 53,850 | | | | 707 | | | | 20,131 | | | | 215 | | | | 73,489 | |
Impairment of real estate | | | 113,804 | | | | 243 | | | | 40,897 | | | | – | | | | 154,458 | |
| | | | |
| | | 359,081 | | | | 14,550 | | | | 110,923 | | | | 3,043 | | | | 458,497 | |
| | | | |
Interest expense | | | (64,128 | ) | | | (2,823 | ) | | | (26,457 | ) | | | (106 | ) | | | (87,868 | ) |
Amortization of mortgage procurement costs | | | (2,797 | ) | | | (86 | ) | | | (858 | ) | | | (2 | ) | | | (3,571 | ) |
Gain on early extinguishment of debt | | | 256 | | | | 134 | | | | 114 | | | | – | | | | 236 | |
Interest and other income | | | 10,001 | | | | 458 | | | | 342 | | | | (1 | ) | | | 9,884 | |
Net gain on disposition of full or partial interests in rental properties | | | 2,255 | | | | – | | | | – | | | | 11,859 | | | | 14,114 | |
| | | | |
Earnings (loss) before income taxes | | | (132,245 | ) | | | 808 | | | | (31,469 | ) | | | 11,188 | | | | (153,334 | ) |
| | | | |
| | | | | |
Income tax expense (benefit) | | | | | | | | | | | | | | | | | | | | |
Current | | | (11,340 | ) | | | – | | | | – | | | | 8,994 | | | | (2,346 | ) |
Deferred | | | (52,839 | ) | | | – | | | | – | | | | (4,283 | ) | | | (57,122 | ) |
| | | | |
| | | (64,179 | ) | | | – | | | | – | | | | 4,711 | | | | (59,468 | ) |
| | | | |
Equity in earnings (loss) of unconsolidated entities, including impairment | | | (43,402 | ) | | | (413 | ) | | | 31,469 | | | | – | | | | (11,520 | ) |
| | | | |
Earnings (loss) from continuing operations | | | (111,468 | ) | | | 395 | | | | – | | | | 6,477 | | | | (105,386 | ) |
| | | | | |
Discontinued operations, net of tax: | | | | | | | | | | | | | | | | | | | | |
Operating loss from rental properties | | | (1,091 | ) | | | (573 | ) | | | – | | | | 518 | | | | – | |
Impairment of real estate | | | (6,279 | ) | | | – | | | | – | | | | 6,279 | | | | – | |
Gain on disposition of rental properties | | | 13,274 | | | | – | | | | – | | | | (13,274 | ) | | | – | |
| | | | |
| | | 5,904 | | | | (573 | ) | | | – | | | | (6,477 | ) | | | – | |
| | | | |
Net loss | | | (105,564 | ) | | | (178 | ) | | | – | | | | – | | | | (105,386 | ) |
| | | | | |
Noncontrolling Interests | | | | | | | | | | | | | | | | | | | | |
Earnings from continuing operations attributable to noncontrolling interests | | | (395 | ) | | | (395 | ) | | | – | | | | – | | | | – | |
Loss from discontinued operations attributable to noncontrolling interests | | | 573 | | | | 573 | | | | – | | | | – | | | | – | |
| | | | |
| | | 178 | | | | 178 | | | | – | | | | – | | | | – | |
| | | | |
Net loss attributable to Forest City Enterprises, Inc. | | $ | (105,386 | ) | | $ | – | | | $ | – | | | $ | – | | | $ | (105,386 | ) |
| | | | |
Preferred dividends | | | (3,850 | ) | | | – | | | | – | | | | – | | | | (3,850 | ) |
| | | | |
| | | | | |
Net loss attributable to Forest City Enterprises, Inc. common shareholders | | $ | (109,236 | ) | | $ | – | | | $ | – | | | $ | – | | | $ | (109,236 | ) |
| | | | |
8
Forest City Enterprises, Inc. and Subsidiaries
Selected Financial Information
Consolidated Earnings Information – Year Ended January 31, 2012 (Unaudited)
| | | $0000000000 | | | | $0000000000 | | | | $0000000000 | | | | $0000000000 | | | | $0000000000 | |
| | | Full Consolidation (GAAP) | | | Less Noncontrolling Interest | | | Plus Unconsolidated Investments at Pro-Rata | | | Plus Discontinued Operations | | | Pro-Rata Consolidation (Non-GAAP) | |
| | | (in thousands) | |
Revenues from real estate operations | | $ | 1,089,977 | | | $ | 56,108 | | | $ | 385,521 | | | $ | 23,173 | | | $ | 1,442,563 | |
| | | | | |
Expenses | | | | | | | | | | | | | | | | | | | | |
Operating expenses | | | 668,959 | | | | 38,794 | | | | 179,242 | | | | 18,074 | | | | 827,481 | |
Depreciation and amortization | | | 218,601 | | | | 4,659 | | | | 67,855 | | | | 3,154 | | | | 284,951 | |
Impairment of real estate | | | 119,324 | | | | 243 | | | | 82,186 | | | | 10,257 | | | | 211,524 | |
| | | | |
| | | 1,006,884 | | | | 43,696 | | | | 329,283 | | | | 31,485 | | | | 1,323,956 | |
| | | | |
Interest expense | | | (261,037 | ) | | | (11,989 | ) | | | (100,958 | ) | | | (2,123 | ) | | | (352,129 | ) |
Amortization of mortgage procurement costs | | | (11,812 | ) | | | (513 | ) | | | (3,015 | ) | | | (356 | ) | | | (14,670 | ) |
Gain (loss) on early extinguishment of debt | | | 9,590 | | | | 1,641 | | | | (366 | ) | | | – | | | | 7,583 | |
| | | | | |
Interest and other income | | | 52,114 | | | | 1,370 | | | | 989 | | | | 2 | | | | 51,735 | |
Net gain on disposition of full or partial interests in rental properties | | | 17,665 | | | | – | | | | 12,567 | | | | 51,796 | | | | 82,028 | |
| | | | |
Earnings (loss) before income taxes | | | (110,387 | ) | | | 2,921 | | | | (34,545 | ) | | | 41,007 | | | | (106,846 | ) |
| | | | |
| | | | | |
Income tax expense (benefit) | | | | | | | | | | | | | | | | | | | | |
Current | | | (9,300 | ) | | | – | | | | – | | | | 11,139 | | | | 1,839 | |
Deferred | | | 55,044 | | | | – | | | | – | | | | 6,536 | | | | (48,508 | ) |
| | | | |
| | | (64,344 | ) | | | – | | | | – | | | | 17,675 | | | | (46,669 | ) |
| | | | |
Equity in earnings (loss) of unconsolidated entities, including impairment | | | (61,039 | ) | | | (185 | ) | | | 34,545 | | | | – | | | | (26,309 | ) |
| | | | |
Earnings (loss) from continuing operations | | | (107,082 | ) | | | 2,736 | | | | – | | | | 23,332 | | | | (86,486 | ) |
| | | | | |
Discontinued operations, net of tax: | | | | | | | | | | | | | | | | | | | | |
Operating earnings from rental properties | | | 992 | | | | 1,424 | | | | – | | | | 432 | | | | – | |
Impairment of real estate | | | (6,279 | ) | | | – | | | | – | | | | 6,279 | | | | – | |
Gain on disposition of rental properties | | | 111,801 | | | | 81,758 | | | | – | | | | (30,043 | ) | | | – | |
| | | | |
| | | 106,514 | | | | 83,182 | | | | – | | | | (23,332 | ) | | | – | |
| | | | |
Net earnings (loss) | | | (568 | ) | | | 85,918 | | | | – | | | | – | | | | (86,486 | ) |
| | | | | |
Noncontrolling Interests | | | | | | | | | | | | | | | | | | | | |
Earnings from continuing operations attributable to noncontrolling interests | | | (2,736 | ) | | | (2,736 | ) | | | – | | | | – | | | | – | |
Earnings from discontinued operations attributable to noncontrolling interests | | | (83,182 | ) | | | (83,182 | ) | | | – | | | | – | | | | – | |
| | | | |
| | | (85,918 | ) | | | (85,918 | ) | | | – | | | | – | | | | – | |
| | | | |
Net loss attributable to Forest City Enterprises, Inc. | | $ | (86,486 | ) | | $ | – | | | $ | – | | | $ | – | | | $ | (86,486 | ) |
| | | | |
Preferred dividends | | | (15,400 | ) | | | – | | | | – | | | | – | | | | (15,400 | ) |
| | | | |
Net loss attributable to Forest City Enterprises, Inc. common shareholders | | $ | (101,886 | ) | | $ | – | | | $ | – | | | $ | – | | | $ | (101,886 | ) |
| | | | |
9
Forest City Enterprises, Inc. and Subsidiaries
Selected Financial Information
Consolidated Earnings Information – Three Months Ended January 31, 2011 (Unaudited)
| | | | | | | | | | | | | | | | | | | | |
| | | Full Consolidation (GAAP) | | | Less Noncontrolling Interest | | | Plus
Unconsolidated Investments at Pro-Rata | | | Plus Discontinued Operations | | | Pro-Rata Consolidation (Non-GAAP) | |
| |
| | | (in thousands) | |
Revenues from real estate operations | | $ | 280,147 | | | $ | 14,172 | | | $ | 80,167 | | | $ | 14,978 | | | $ | 361,120 | |
| | | | | |
Expenses | | | | | | | | | | | | | | | | | | | | |
Operating expenses | | | 172,078 | | | | 8,309 | | | | 39,254 | | | | 10,457 | | | | 213,480 | |
Depreciation and amortization | | | 59,044 | | | | 1,575 | | | | 15,237 | | | | 1,764 | | | | 74,470 | |
Impairment of real estate | | | – | | | | – | | | | 35,714 | | | | – | | | | 35,714 | |
| | | | |
| | | 231,122 | | | | 9,884 | | | | 90,205 | | | | 12,221 | | | | 323,664 | |
| | | | |
Interest expense | | | (69,387 | ) | | | (3,047 | ) | | | (22,228 | ) | | | (1,848 | ) | | | (90,416 | ) |
Amortization of mortgage procurement costs | | | (2,849 | ) | | | (117 | ) | | | (614 | ) | | | (271 | ) | | | (3,617 | ) |
Gain (loss) on extinguishment of debt | | | (31,688 | ) | | | – | | | | 2,785 | | | | – | | | | (28,903 | ) |
| | | | | |
Interest and other income | | | 17,859 | | | | 611 | | | | 381 | | | | 2 | | | | 17,631 | |
Net gain on disposition of full or partial interests in rental properties | | | – | | | | – | | | | 15,633 | | | | 46,527 | | | | 62,160 | |
| | | | |
Earnings (loss) before income taxes | | | (37,040 | ) | | | 1,735 | | | | (14,081 | ) | | | 47,167 | | | | (5,689 | ) |
| | | | |
| | | | | |
Income tax expense (benefit) | | | | | | | | | | | | | | | | | | | | |
Current | | | (5,044 | ) | | | – | | | | – | | | | 4,298 | | | | (746 | ) |
Deferred | | | (18,310 | ) | | | – | | | | – | | | | 14,820 | | | | (3,490 | ) |
| | | | |
| | | (23,354 | ) | | | – | | | | – | | | | 19,118 | | | | (4,236 | ) |
| | | | |
Equity in earnings (loss) of unconsolidated entities,including impairment | | | (12,742 | ) | | | 1,719 | | | | 14,081 | | | | – | | | | (380 | ) |
| | | | |
| | | | | |
Earnings (loss) from continuing operations | | | (26,428 | ) | | | 3,454 | | | | – | | | | 28,049 | | | | (1,833 | ) |
| | | | | |
Discontinued operations, net of tax: | | | | | | | | | | | | | | | | | | | | |
Operating earnings from rental properties | | | 2,373 | | | | 1,981 | | | | – | | | | (392 | ) | | | – | |
Gain on disposition of rental properties | | | 27,657 | | | | – | | | | – | | | | (27,657 | ) | | | – | |
| | | | |
| | | 30,030 | | | | 1,981 | | | | – | | | | (28,049 | ) | | | – | |
| | | | |
Net earnings (loss) | | | 3,602 | | | | 5,435 | | | | – | | | | – | | | | (1,833 | ) |
| | | | | |
Noncontrolling Interests | | | | | | | | | | | | | | | | | | | | |
Earnings from continuing operations attributable to noncontrolling interests | | | (3,454 | ) | | | (3,454 | ) | | | – | | | | – | | | | – | |
Earnings from discontinued operations attributable to noncontrolling interests | | | (1,981 | ) | | | (1,981 | ) | | | – | | | | – | | | | – | |
| | | | |
| | | (5,435 | ) | | | (5,435 | ) | | | – | | | | – | | | | – | |
| | | | |
Net loss attributable to Forest City Enterprises, Inc. | | $ | (1,833 | ) | | $ | – | | | $ | – | | | $ | – | | | $ | (1,833 | ) |
| | | | |
Preferred dividends | | | (3,850 | ) | | | – | | | | – | | | | – | | | | (3,850 | ) |
| | | | |
Net loss attributable to Forest City Enterprises, Inc. common shareholders | | $ | (5,683 | ) | | $ | – | | | $ | – | | | $ | – | | | $ | (5,683 | ) |
| | | | |
10
Forest City Enterprises, Inc. and Subsidiaries
Selected Financial Information
Consolidated Earnings Information – Year Ended January 31, 2011 (Unaudited)
| | | | | | | | | | | | | | | | | | | | |
| | | Full
Consolidation
(GAAP) | | | Less
Noncontrolling
Interest | | | Plus
Unconsolidated
Investments at
Pro-Rata | | | Plus
Discontinued
Operations | | | Pro-Rata
Consolidation
(Non-GAAP) | |
| |
| | | (in thousands) | |
Revenues from real estate operations | | $ | 1,117,649 | | | $ | 54,119 | | | $ | 316,900 | | | $ | 63,560 | | | $ | 1,443,990 | |
| | | | | |
Expenses | | | | | | | | | | | | | | | | | | | | |
Operating expenses | | | 647,199 | | | | 31,713 | | | | 169,265 | | | | 42,356 | | | | 827,107 | |
Depreciation and amortization | | | 234,728 | | | | 6,384 | | | | 53,072 | | | | 10,532 | | | | 291,948 | |
Impairment of real estate | | | 4,763 | | | | 1,526 | | | | 72,459 | | | | 81,643 | | | | 157,339 | |
| | | | |
| | | 886,690 | | | | 39,623 | | | | 294,796 | | | | 134,531 | | | | 1,276,394 | |
| | | | |
Interest expense | | | (309,766 | ) | | | (16,774 | ) | | | (81,184 | ) | | | (9,482 | ) | | | (383,658 | ) |
Amortization of mortgage procurement costs | | | (11,484 | ) | | | (444 | ) | | | (2,314 | ) | | | (1,056 | ) | | | (14,410 | ) |
Gain (loss) on extinguishment of debt | | | (21,035 | ) | | | 247 | | | | 2,760 | | | | – | | | | (18,522 | ) |
| | | | | |
Interest and other income | | | 52,818 | | | | 2,635 | | | | 15,666 | | | | 14 | | | | 65,863 | |
| | | | | |
Net gain on disposition of full or partial interests in rental properties | | | 202,878 | | | | – | | | | 23,461 | | | | 47,092 | | | | 273,431 | |
Net gain on disposition of partial interests in other investment | | | 55,112 | | | | 23,675 | | | | – | | | | – | | | | 31,437 | |
| | | | |
| | | | | |
Earnings (loss) before income taxes | | | 199,482 | | | | 23,835 | | | | (19,507 | ) | | | (34,403 | ) | | | 121,737 | |
| | | | |
| | | | | |
Income tax expense (benefit) | | | | | | | | | | | | | | | | | | | | |
Current | | | 602 | | | | – | | | | – | | | | 2,491 | | | | 3,093 | |
Deferred | | | 69,524 | | | | – | | | | – | | | | (15,002 | ) | | | 54,522 | |
| | | | |
| | | 70,126 | | | | – | | | | – | | | | (12,511 | ) | | | 57,615 | |
| | | | |
Equity in earnings (loss) of unconsolidated entities, including impairment | | | (30,194 | ) | | | (4,613 | ) | | | 19,507 | | | | – | | | | (6,074 | ) |
| | | | |
| | | | | |
Earnings (loss) from continuing operations | | | 99,162 | | | | 19,222 | | | | – | | | | (21,892 | ) | | | 58,048 | |
| | | | | |
Discontinued operations, net of tax: | | | | | | | | | | | | | | | | | | | | |
Operating earnings from rental properties | | | 4,007 | | | | 3,917 | | | | – | | | | (90 | ) | | | – | |
Impairment of real estate | | | (49,980 | ) | | | – | | | | – | | | | 49,980 | | | | – | |
Gain on disposition of rental properties | | | 32,209 | | | | 4,211 | | | | – | | | | (27,998 | ) | | | – | |
| | | | |
| | | (13,764 | ) | | | 8,128 | | | | – | | | | 21,892 | | | | – | |
| | | | |
Net earnings | | | 85,398 | | | | 27,350 | | | | – | | | | – | | | | 58,048 | |
| | | | | |
Noncontrolling Interests | | | | | | | | | | | | | | | | | | | | |
Earnings from continuing operations attributable to noncontrolling interests | | | (19,222 | ) | | | (19,222 | ) | | | – | | | | – | | | | – | |
Earnings from discontinued operations attributable to noncontrolling interests | | | (8,128 | ) | | | (8,128 | ) | | | – | | | | – | | | | – | |
| | | | |
| | | (27,350 | ) | | | (27,350 | ) | | | – | | | | – | | | | – | |
| | | | |
Net earnings attributable to Forest City Enterprises, Inc. | | $ | 58,048 | | | $ | – | | | $ | – | | | $ | – | | | $ | 58,048 | |
| | | | |
Preferred dividends | | | (11,807 | ) | | | – | | | | – | | | | – | | | | (11,807 | ) |
| | | | |
Net earnings attributable to Forest City Enterprises, Inc. common shareholders | | $ | 46,241 | | | $ | – | | | $ | – | | | $ | – | | | $ | 46,241 | |
| | | | |
11
Forest City Enterprises, Inc. and Subsidiaries
Selected Financial Information
Net Asset Value Components – January 31, 2012
The “Net Asset Value Components” table below represents components of our business relevant to calculate Net Asset Value (“NAV”), a non-GAAP measure. There is no directly comparable GAAP financial measure to NAV. We consider NAV to be a useful supplemental measure which assists both management and investors to estimate the fair value of our Company. The calculation of the net asset value involves significant estimates and can be calculated using various methods. Each individual investor must determine the specific methodology, assumptions and estimates to use to arrive at an estimated NAV of the Company.
The components of NAV do not consider the potential changes in rental and fee income streams, or development platform. The components include non-GAAP financial measures, such as NOI and information related to our rental properties business prepared using the pro-rata consolidation method. Although these measures are not presented in accordance with GAAP, investors can use these non-GAAP measures as supplementary information to evaluate our business. The non-GAAP measures presented are not intended to be performance measures that should be regarded as alternatives to, or more meaningful than, our GAAP measures.
| | | | | | | | | | | | | | | | | | | | |
Net Asset Value Components - January 31, 2012 | |
Completed Rental Properties (“CRP”) | |
| (Dollars in millions at pro-rata) | | Q4 2011
NOI(1) | | | Annualized
NOI(2) | | | Net Stabilized
Adjustments (3) | | | Annualized
Stabilized NOI | | | Nonrecourse
Debt(4) | |
| | | | | | A | | | B | | | =A + B | | | | |
| | | | | | |
Commercial Real Estate | | | | | | | | | | | | | | | | | | | | |
Retail | | $ | 56.9 | | | | 227.6 | | | $ | 9.8 | | | $ | 237.4 | | | $ | (2,638.8 | ) |
Office | | | 59.8 | | | | 239.2 | | | | (0.4 | ) | | | 238.8 | | | | (2,293.4 | ) |
Other | | | (3.3 | ) | | | (13.2 | ) | | | 9.5 | | | | (3.7 | ) | | | | |
Total Commercial Real Estate | | $ | 113.4 | | | $ | 453.6 | | | $ | 18.9 | | | $ | 472.5 | | | $ | (4,932.2 | ) |
Residential Real Estate | | | | | | | | | | | | | | | | | | | | |
Apartments | | $ | 34.5 | | | $ | 138.0 | | | $ | 0.9 | | | $ | 138.9 | | | $ | (1,938.8 | ) |
Senior Housing | | | 2.6 | | | | 10.4 | | | | – | | | | 10.4 | | | | | |
Military Housing | | | 8.9 | | | | 35.6 | | | | (20.6 | ) | | | 15.0 | | | | | |
Other | | | (1.4 | ) | | | (5.6 | ) | | | – | | | | (5.6 | ) | | | | |
Total Residential Real Estate | | $ | 44.6 | | | $ | 178.4 | | | $ | (19.7 | ) | | $ | 158.7 | | | $ | (1,938.8 | ) |
Total Rental Properties | | $ | 158.0 | | | $ | 632.0 | | | $ | (0.8 | ) | | $ | 631.2 | | | $ | (6,871.0 | ) |
Development Pipeline Debt Adj. NET(5) | | | | | | | | | | | | | | | | | | | 423.1 | |
Adjusted Total Rental Properties | | $ | 158.0 | | | $ | 632.0 | | | $ | (0.8 | ) | | $ | 631.2 | | | $ | (6,447.9 | ) |
Development Pipeline | |
| | | | | | | | | | | | | | | | |
| | | | | | | | | | | | Book Value | | | Nonrecourse
Debt(4) | |
Westchester’s Ridge Hill(Adjusted for amounts included in CRP)(5) | | | | | | | | | | | | | | $ | 270.0 | | | $ | (157.2 | ) |
8 Spruce Street(Adjusted for amounts included in CRP)(5) | | | | | | | | | | | | | | | 351.9 | | | | (218.2 | ) |
Foundry Lofts(Adjusted for amounts included in CRP)(5) | | | | | | | | | | | | | | | 54.9 | | | | (47.7 | ) |
Projects under construction(4) | | | | | | | | | | | | | | | 991.5 | | | | (473.2 | ) |
Adjusted projects under construction | | | | | | | | | | | | | | $ | 1,668.3 | | | $ | (896.3 | ) |
Projects under development(4) | | | | | | | | | | | | | | $ | 905.8 | | | $ | (209.1 | ) |
Land held for development and sale(4) | | | | | | | | | | | | | | $ | 94.7 | | | $ | (26.9 | ) |
Other Tangible Assets | |
| | | | | | | | | | | | Book Value(4) | | | Nonrecourse
Debt(4) | |
Cash and equivalents | | | | | | | | | | | | | | $ | 268.9 | | | | | |
Restricted cash and escrowed funds | | | | | | | | | | | | | | $ | 553.8 | | | | | |
Notes and accounts receivable, net(6) | | | | | | | | | | | | | | $ | 423.4 | | | | | |
Net investments and advances to unconsolidated entities | | | | | | | | | | | | | | $ | 204.4 | | | | | |
Prepaid expenses and other deferred costs, net | | | | | | | | | | | | | | $ | 213.4 | | | | | |
Land held for divestiture | | | | | | | | | | | | | | $ | 88.3 | | | $ | (29.6 | ) |
Recourse Debt and Other Liabilities | |
| | | | | | | | | | | | Book Value(4) | | | | |
Bank revolving credit facility | | | | | | | | | | | | | | $ | – | | | | | |
Senior and subordinated debt | | | | | | | | | | | | | | $ | (1,038.5 | ) | | | | |
Less: convertible debt | | | | | | | | | | | | | | $ | 599.1 | | | | | |
Construction payables | | | | | | | | | | | | | | $ | (159.4 | ) | | | | |
Operating accounts payable and accrued expenses(7) | | | | | | | | | | | | | | $ | (755.1 | ) | | | | |
Weighted Average Shares Outstanding—Diluted | |
Number of shares for the three months ended January 31, 2012 (In millions) | | | | | | | | | | | | | | | 221.5 | | | | | |
12
Forest City Enterprises, Inc. and Subsidiaries
Selected Financial Information
Net Asset Value Components – January 31, 2012 (continued)
| | (1) | Pro-rata Q4 2011 NOI is reconciled to NOI at full consolidation by Product Group for the three months ended January 31, 2012 in the Supplemental Operating Information section of this supplemental package. |
| | (2) | The pro-rata annualized NOI is calculated by taking the Q4 2011 NOI times a multiple of four. |
| | (3) | The net stabilized adjustments column represents net adjustments required to arrive at a fully stabilized NOI for those properties currently in initial lease up periods, net of the removal of partial period NOI for recently sold properties. For those properties currently in initial lease up periods we have included stabilization adjustments as follows: |
| | a) | NOI for phased and new openings is removed until the property has been open for one year or achieves 80% lease commitment, whichever comes first. |
| | b) | NOI for the properties in lease up that have met the requirements of a) are reflected at 5% of the pro-rata cost disclosed in our Development Pipeline disclosure (Prior Two Year Openings). This assumption does not reflect Forest City’s anticipated NOI, but rather is used in order to establish a hypothetical basis for valuation of lease up properties. |
| | c) | At the conclusion of the initial development period at each of our military housing communities, we estimate the ongoing property management fees, net of operating expenses, to be $15.0 million. |
The net stabilized adjustments are not comparable to any GAAP measure and therefore do not have a reconciliation to its nearest comparable GAAP measure.
| | (4) | Amounts are derived from the respective pro-rata balance sheet line item as of January 31, 2012 and are reconciled to their GAAP equivalents in the Selected Financial Information section of this supplemental package. |
| | (5) | Phased and new property openings that have not achieved the parameters of 3(a) will have their assets shown in the Development Pipeline section of the model.Westchester’s Ridge Hill, as of January 31, 2012, had $270.0 million of costs incurred at pro-rata consolidation and $157.2 million of mortgage debt at pro-rata consolidation which were transferred to CRP.8 Spruce Street, as of January 31, 2012, had $351.9 million of costs incurred at pro-rata consolidation and $218.2 million of mortgage debt at pro-rata consolidation which were transferred to CRP.Foundry Lofts, as of January 31, 2012, had $54.9 million of costs incurred at pro-rata consolidation and $47.7 million of mortgage debt at pro-rata consolidation which were transferred to CRP. In order to account for the phased openings ofWestchester’s Ridge Hill,8 Spruce StreetandFoundry Lofts as NAV components we have made the following adjustments: |
| | • | | All costs and associated debt forWestchester’s Ridge Hill,8 Spruce StreetandFoundry Lofts, for purposes exclusive to this disclosure, are accounted for as a component of “Adjusted Projects Under Construction” in the Development Pipeline section of this schedule. Accordingly, all NOI, through the net stabilized adjustments column, and debt have been removed from the CRP section of the NAV schedule. |
| | (6) | Includes $152.8 million of straight-line rent receivable (net of $15.6 million of allowance for doubtful accounts). |
| | (7) | Includes $41.2 million of straight-line rent payable. |
13
Forest City Enterprises, Inc. and Subsidiaries
Supplemental Operating Information
Occupancy Data - January 31, 2012 and 2011
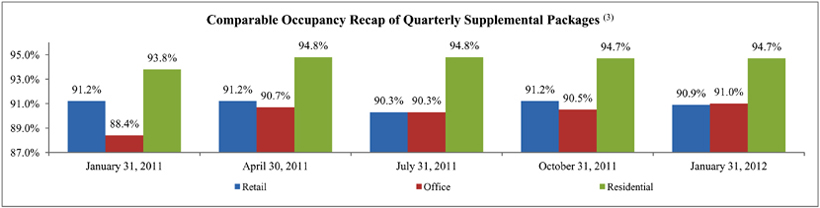
Retail and office occupancy is based on square feet leased at the end of the fiscal quarter. Average Occupancy Year-to-Date for retail and office is calculated by dividing the sum of leased square feet at the beginning and end of the period by two. Residential occupancy represents total units occupied divided by total units available. Average Occupancy for residential is calculated by dividing gross potential rent less vacancy by gross potential rent. Average Daily Rate (“ADR”) is calculated by dividing revenue by the number of rooms sold.
We analyze our occupancy percentages by each of our major product lines as follows:
| | | | | | | | |
| | | | | Average | | | | Average |
| | | Occupancy | | Occupancy | | Occupancy | | Occupancy |
| | | As of | | Year-to-Date | | As of | | Year-to-Date |
| | | January 31, 2012 | | January 31, 2012 | | January 31, 2011 | | January 31, 2011 |
Retail | | | | | | | | |
Comparable | | 90.9% | | 91.1% | | 91.2% | | 90.7% |
Total | | 89.0% | | 90.0% | | 91.2% | | 90.0% |
Office | | | | | | | | |
Comparable | | 91.0% | | 90.2% | | 89.5% | | 90.3% |
Total | | 89.1% | | 88.4% | | 87.8% | | 88.7% |
Residential(1) (2) | | | | | | | | |
Comparable | | 93.4% | | 94.7% | | 93.8% | | 93.8% |
Total | | 92.1% | | 92.4% | | 92.7% | | 89.6% |
Hotels | | | | | | | | |
Comparable and Total | | | | 69.1% | | | | 69.0% |
Comparable and Total ADR | | | | $141.91 | | | | $140.03 |
The graph below provides comparable occupancy as reported in previous quarters. These amounts may differ from above because the properties that qualify as comparable change from period to period.
| (1) | Excludes military and subsidized senior housing units. |
| (2) | Prior periods have been recast to exclude subsidized senior housing. The Company believes this change will improve disclosure by allowing investors to see results for the conventional apartment portfolio separated from those of the limited-dividend senior-housing properties. |
| (3) | Represents Comparable Occupancy for Retail and Office as of the applicable date and Comparable Average Occupancy Year-to-Date for Residential. |
14
Forest City Enterprises, Inc. and Subsidiaries
Supplemental Operating Information
Retail Sales Data
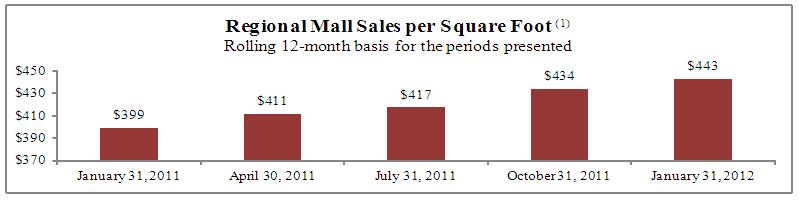
The following graphs provide current and historical retail sales for small shop inline tenants at our regional malls. We believe this data allows investors to better understand the productivity of our tenants.
The graph below represents regional mall sales for tenants that are open and operating for the entire rolling 12-months presented. Those tenants that have begun and/or ceased operations in the periods shown are not included.
The graph below represents regional mall sales for all tenants that are open and operating for the entire comparable periods presented. Those tenants that have begun and/or ceased operations in the periods shown are not included.
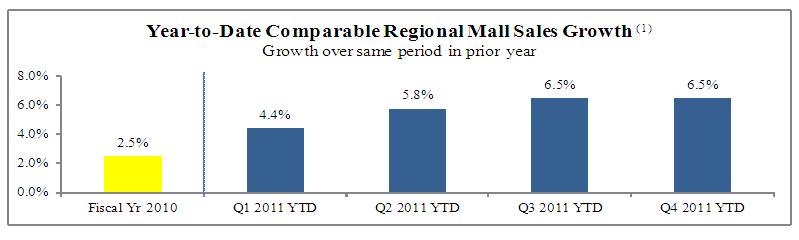
| (1) | All sales data is derived from schedules provided by our tenants and is not subject to the same internal control and verification procedures that are applied to the other data supplied in the Company’s supplemental package. In addition, the data is presented on a one-month lag to be consistent with the calendar year end of our tenants. |
15
Forest City Enterprises, Inc. and Subsidiaries
Supplemental Operating Information
Leasing Summary
Retail Centers
The following tables represent those new leases and gross leasable area (“GLA”) signed on the same space in which there was a former tenant and existing tenant renewals.
| | | | | | | | | | | | | | | | | | | | |
| Regional Malls - Quarterly | | | | | | | | | | | | | |
| Quarter | | Number
of Leases
Signed | | | GLA
Signed | | | Contractual Rent Per Square Foot (1)(2) | | | Prior Rent Per
Square Foot (1)(2) | | | Cash Basis %
Change over
Prior Rent | |
1st Quarter 2011 | | | 29 | | | | 64,008 | | | $ | 60.70 | | | $ | 58.14 | | | | 4 | % |
2nd Quarter 2011 | | | 30 | | | | 66,897 | | | $ | 79.63 | | | $ | 72.72 | | | | 10 | % |
3rd Quarter 2011 | | | 48 | | | | 162,170 | | | $ | 49.53 | | | $ | 45.43 | | | | 9 | % |
4th Quarter 2011 | | | 59 | | | | 149,030 | | | $ | 60.95 | | | $ | 55.35 | | | | 10 | % |
Total - 12 months | | | 166 | | | | 442,105 | | | $ | 59.55 | | | $ | 54.75 | | | | 9 | % |
| | | | | | | | | | | | | | | | | |
| | | | | | | | | | | | | | | | | | | | |
| Specialty Retail Centers - Quarterly | | | | | | | | | | |
| Quarter | | Number
of Leases
Signed | | | GLA
Signed | | | Contractual
Rent Per
Square Foot (1)(2) | | | Prior Rent Per
Square Foot (1)(2) | | | Cash Basis %
Change over
Prior Rent | |
1st Quarter 2011 | | | 5 | | | | 11,900 | | | $ | 48.92 | | | $ | 41.22 | | | | 19 | % |
2nd Quarter 2011 | | | 4 | | | | 15,522 | | | $ | 21.04 | | | $ | 21.43 | | | | (2 | %) |
3rd Quarter 2011 | | | 10 | | | | 34,385 | | | $ | 62.29 | | | $ | 56.11 | | | | 11 | % |
4th Quarter 2011 | | | 10 | | | | 84,952 | | | $ | 30.97 | | | $ | 27.80 | | | | 11 | % |
Total - 12 months | | | 29 | | | | 146,759 | | | $ | 38.71 | | | $ | 34.85 | | | | 11 | % |
| | | | | | | | | | | | | | | | | |
Office Buildings
The following table represents all new leases compared to terms of all expired leases in our office portfolio over the past 12 months.
| | | | | | | | | | | | | | | | | | | | | | | | | | | | |
| Quarterly | | | | | | | | | | | | | | | | | | | | | |
| Quarter | | Number
of Leases
Signed | | | Number
of Leases
Expired | | | GLA
Signed | | | GLA
Expired | | | Contractual
Rent Per
Square Foot (2) | | | Expiring
Rent Per
Square Foot (2) | | | Cash Basis %
Change over
Prior Rent | |
1st Quarter 2011 | | | 38 | | | | 24 | | | | 649,323 | | | | 327,228 | | | $ | 32.56 | | | $ | 29.57 | | | | 10 | % |
2nd Quarter 2011 | | | 19 | | | | 19 | | | | 127,285 | | | | 110,492 | | | $ | 19.22 | | | $ | 18.37 | | | | 5 | % |
3rd Quarter 2011 | | | 33 | | | | 27 | | | | 178,838 | | | | 178,598 | | | $ | 26.20 | | | $ | 29.22 | | | | (10 | %) |
4th Quarter 2011 | | | 46 | | | | 33 | | | | 703,488 | | | | 683,121 | | | $ | 30.13 | | | $ | 27.86 | | | | 8 | % |
Total - 12 months | | | 136 | | | | 103 | | | | 1,658,934 | | | | 1,299,439 | | | $ | 29.82 | | | $ | 27.67 | | | | 8 | % |
| | | | | | | | | | | | | | | | | |
| (1) | Retail contractual rent per square foot includes fixed minimum rent and fixed additional charges for marketing/promotional charges and common area maintenance. |
| (2) | For all new leases, contractual rent per square foot is the new annualized rental rate as of rental commencement. For all expiring leases, contractual rent per square foot is the annualized rental rate at the time of expiration, which includes any applicable escalations. |
16
Forest City Enterprises, Inc. and Subsidiaries
Supplemental Operating Information
We use NOI, along with EBDT, to assess operating performance. Comparable NOI is defined as NOI from properties opened and operated in the three months and years ended January 31, 2012 and 2011. The schedules below present Pro-Rata Comparable NOI for the three months and year ended January 31, 2012.
Comparable Net Operating Income (% change over same period prior year)
| | | | | | | | |
| | | Three Months Ended
January 31, 2012 | | | Year Ended
January 31, 2012 | |
| | |
Retail | | | 4.7 | % | | | 2.6 | % |
| | |
Office | | | 0.5 | % | | | (2.6 | %) |
| | |
Residential(1) | | | 11.9 | % | | | 7.3 | % |
| | |
Hotel | | | (0.6 | %) | | | 0.1 | % |
| | |
Total | | | 4.5 | % | | | 1.4 | % |
The tables below provide the percentage change of Comparable NOI as reported in previous quarters. GAAP reconciliations for previous quarters can be found in prior supplemental packages.
| | | | | | | | | | | | | | | | | | | | | | | | | | | | | | | | | | | | |
| Quarterly Historical Trends | | | | | | | | | | | | | | Annual Historical Trends | | | | |
| | | Three Months Ended | | | | | | | Years Ended | |
| | | January 31, 2012 | | | October 31, 2011 | | | July 31, 2011 | | | April 30, 2011 | | | January 31, 2011 | | | | | | | January 31, 2012 | | | January 31, 2011 | | | January 31, 2010 | |
| | | | | | | | | | | | | | | | | | | | | | | | | | | | | | | | | | | | | |
Retail | | | 4.7 | % | | | (1.5 | %) | | | 1.6 | % | | | 2.6 | % | | | 3.4 | % | | | | Retail | | | 2.6 | % | | | 2.2 | % | | | (3.9 | %) |
Office | | | 0.5 | % | | | (7.6 | %) | | | 3.1 | % | | | (2.5 | %) | | | 0.2 | % | | | | Office | | | (2.6 | %) | | | 2.1 | % | | | 5.4 | % |
Residential(1) | | | 11.9 | % | | | 12.0 | % | | | 3.1 | % | | | 4.8 | % | | | 2.0 | % | | | | Residential (1) | | | 7.3 | % | | | 4.3 | % | | | (3.9 | %) |
Hotel | | | (0.6 | %) | | | (6.7 | %) | | | 1.6 | % | | | (54.2 | %) | | | (13.4 | %) | | | | Hotel | | | 0.1 | % | | | (3.9 | %) | | | (9.9 | %) |
Total | | | 4.5 | % | | | (1.5 | %) | | | 2.5 | % | | | 0.5 | % | | | 1.6 | % | | | | Total | | | 1.4 | % | | | 2.4 | % | | | (0.9 | %) |
| | (1) | Prior periods have been recast to exclude subsidized senior housing. The Company believes this change will improve disclosure by allowing investors to see results for the conventional apartment portfolio separated from those of the limited-dividend senior-housing properties. |
17
Forest City Enterprises, Inc. and Subsidiaries
Supplemental Operating Information
| | | | | | | | | | | | | | | | | | | | | | | | | | | | | | | | | | | | | | | | |
| | | Net Operating Income(dollars in thousands) | |
| | | Three Months Ended January 31, 2012 | | | Three Months Ended January 31, 2011 | | | % Change | |
| | | Full | | | Less | | | Plus | | | Pro-Rata | | | Full | | | Less | | | Plus | | | Pro-Rata | | | Full | | | Pro-Rata | |
| | | Consolidation | | | Noncontrolling | | | Discontinued | | | Consolidation | | | Consolidation | | | Noncontrolling | | | Discontinued | | | Consolidation | | | Consolidation | | | Consolidation | |
| | | (GAAP) | | | Interest | | | Operations | | | (Non-GAAP) | | | (GAAP)(2) | | | Interest | | | Operations | | | (Non-GAAP) | | | (GAAP) | | | (Non-GAAP) | |
Commercial Group | | | | | | | | | | | | | | | | | | | | | | | | | | | | | | | | | | | | | | | | |
Retail | | | | | | | | | | | | | | | | | | | | | | | | | | | | | | | | | | | | | | | | |
Comparable | | $ | 59,429 | | | $ | 1,853 | | | $ | – | | | $ | 57,576 | | | $ | 56,967 | | | $ | 1,982 | | | $ | – | | | $ | 54,985 | | | | 4.3 | % | | | 4.7 | % |
Total | | | 58,778 | | | | 1,918 | | | | – | | | | 56,860 | | | | 67,109 | | | | 2,915 | | | | 1,132 | | | | 65,326 | | | | | | | | | |
Office Buildings | | | | | | | | | | | | | | | | | | | | | | | | | | | | | | | | | | | | | | | | |
Comparable | | | 57,548 | | | | 1,791 | | | | – | | | | 55,757 | | | | 57,895 | | | | 2,435 | | | | – | | | | 55,460 | | | | (0.6 | %) | | | 0.5 | % |
Total | | | 62,505 | | | | 2,369 | | | | (333 | ) | | | 59,803 | | | | 59,735 | | | | 2,435 | | | | 2,413 | | | | 59,713 | | | | | | | | | |
Hotels | | | | | | | | | | | | | | | | | | | | | | | | | | | | | | | | | | | | | | | | |
Comparable | | | 1,979 | | | | – | | | | – | | | | 1,979 | | | | 1,990 | | | | – | | | | – | | | | 1,990 | | | | (0.6 | %) | | | (0.6 | %) |
Total | | | 1,979 | | | | – | | | | (15 | ) | | | 1,964 | | | | 1,990 | | | | – | | | | 351 | | | | 2,341 | | | | | | | | | |
Earnings from Commercial | | | | | | | | | | | | | | | | | | | | | | | | | | | | | | | | | | | | | | | | |
LandSales | | | 690 | | | | – | | | | – | | | | 690 | | | | 282 | | | | – | | | | – | | | | 282 | | | | | | | | | |
Other(1) | | | (7,627 | ) | | | (1,715 | ) | | | – | | | | (5,912 | ) | | | 4,493 | | | | (26 | ) | | | – | | | | 4,519 | | | | | | | | | |
Total Commercial Group | | | | | | | | | | | | | | | | | | | | | | | | | | | | | | | | | | | | | | | | |
Comparable | | | 118,956 | | | | 3,644 | | | | – | | | | 115,312 | | | | 116,852 | | | | 4,417 | | | | – | | | | 112,435 | | | | 1.8 | % | | | 2.6 | % |
Total | | | 116,325 | | | | 2,572 | | | | (348 | ) | | | 113,405 | | | | 133,609 | | | | 5,324 | | | | 3,896 | | | | 132,181 | | | | | | | | | |
Residential Group | | | | | | | | | | | | | | | | | | | | | | | | | | | | | | | | | | | | | | | | |
Apartments | | | | | | | | | | | | | | | | | | | | | | | | | | | | | | | | | | | | | | | | |
Comparable | | | 34,022 | | | | 421 | | | | – | | | | 33,601 | | | | 30,378 | | | | 359 | | | | – | | | | 30,019 | | | | 12.0 | % | | | 11.9 | % |
Total | | | 35,041 | | | | 558 | | | | – | | | | 34,483 | | | | 34,537 | | | | 2,255 | | | | – | | | | 32,282 | | | | | | | | | |
Subsidized Senior Housing | | | 2,120 | | | | (416 | ) | | | – | | | | 2,536 | | | | 3,351 | | | | 60 | | | | – | | | | 3,291 | | | | | | | | | |
Military Housing | | | 9,521 | | | | 585 | | | | – | | | | 8,936 | | | | 7,520 | | | | – | | | | – | | | | 7,520 | | | | | | | | | |
Other(1) | | | (1,282 | ) | | | 114 | | | | – | | | | (1,396 | ) | | | (3,009 | ) | | | 170 | | | | – | | | | (3,179 | ) | | | | | | | | |
Total Residential Group | | | | | | | | | | | | | | | | | | | | | | | | | | | | | | | | | | | | | | | | |
Comparable | | | 34,022 | | | | 421 | | | | – | | | | 33,601 | | | | 30,378 | | | | 359 | | | | – | | | | 30, 019 | | | | 12.0 | % | | | 11.9 | % |
Total | | | 45,400 | | | | 841 | | | | – | | | | 44,559 | | | | 42,399 | | | | 2,485 | | | | – | | | | 39,914 | | | | | | | | | |
Total Rental Properties | | | | | | | | | | | | | | | | | | | | | | | | | | | | | | | | | | | | | | | | |
Comparable | | | 152,978 | | | | 4,065 | | | | – | | | | 148,913 | | | | 147,230 | | | | 4,776 | | | | – | | | | 142,454 | | | | 3.9 | % | | | 4.5 | % |
Total | | | 161,725 | | | | 3,413 | | | | (348 | ) | | | 157,964 | | | | 176,008 | | | | 7,809 | | | | 3,896 | | | | 172,095 | | | | | | | | | |
Land Development Group | | | 6,071 | | | | 707 | | | | – | | | | 5,364 | | | | 3,077 | | | | 384 | | | | – | | | | 2,693 | | | | | | | | | |
The Nets | | | (11,845 | ) | | | – | | | | – | | | | (11,845 | ) | | | (312 | ) | | | – | | | | – | | | | (312 | ) | | | | | | | | |
Corporate Activities | | | (16,385 | ) | | | – | | | | – | | | | (16,385 | ) | | | (18,004 | ) | | | – | | | | – | | | | (18,004 | ) | | | | | | | | |
Grand Total | | $ | 139,566 | | | $ | 4,120 | | | $ | (348 | ) | | $ | 135,098 | | | $ | 160,769 | | | $ | 8,193 | | | $ | 3,896 | | | $ | 156,472 | | | | | | | | | |
| (1) | Includes write-offs of abandoned development projects, non-capitalizable development costs, non-capitalizable marketing/promotional costs associated withBarclays Center and unallocated management and service company overhead, net of tax credit income. |
| (2) | Amounts have been recast to add back interest expense and gain (loss) on early extinguishment of debt for unconsolidated entities to NOI at full consolidation to conform to current period presentation. |
18
Forest City Enterprises, Inc. and Subsidiaries
Supplemental Operating Information
| | | | | | | | | | | | | | | | | | | | | | | | | | | | | | | | | | | | | | | | |
| | | Net Operating Income(dollars in thousands) | |
| | | Year Ended January 31, 2012 | | | Year Ended January 31, 2011 | | | % Change | |
| | | Full | | | Less | | | Plus | | | Pro-Rata | | | Full | | | Less | | | Plus | | | Pro-Rata | | | Full | | | Pro-Rata | |
| | | Consolidation | | | Noncontrolling | | | Discontinued | | | Consolidation | | | Consolidation | | | Noncontrolling | | | Discontinued | | | Consolidation | | | Consolidation | | | Consolidation | |
| | | (GAAP) | | | Interest | | | Operations | | | (Non-GAAP) | | | (GAAP)(3) | | | Interest | | | Operations | | | (Non-GAAP) | | | (GAAP) | | | (Non-GAAP) | |
Commercial Group | | | | | | | | | | | | | | | | | | | | | | | | | | | | | | | | | | | | | | | | |
Retail | | | | | | | | | | | | | | | | | | | | | | | | | | | | | | | | | | | | | | | | |
Comparable | | $ | 229,288 | | | $ | 7,457 | | | $ | – | | | $ | 221,831 | | | $ | 223,633 | | | $ | 7,483 | | | $ | – | | | $ | 216,150 | | | | 2.5 | % | | | 2.6 | % |
Total | | | 246,126 | | | | 9,392 | | | | – | | | | 236,734 | | | | 274,793 | | | | 11,379 | | | | 8,894 | | | | 272,308 | | | | | | | | | |
Office Buildings | | | | | | | | | | | | | | | | | | | | | | | | | | | | | | | | | | | | | | | | |
Comparable | | | 231,117 | | | | 6,633 | | | | – | | | | 224,484 | | | | 240,748 | | | | 10,383 | | | | – | | | | 230,365 | | | | (4.0 | %) | | | (2.6 | %) |
Total | | | 253,108 | | | | 7,269 | | | | 2,645 | | | | 248,484 | | | | 255,846 | | | | 10,887 | | | | 6,613 | | | | 251,572 | | | | | | | | | |
Hotels | | | | | | | | | | | | | | | | | | | | | | | | | | | | | | | | | | | | | | | | |
Comparable | | | 9,977 | | | | – | | | | – | | | | 9,977 | | | | 9,965 | | | | – | | | | – | | | | 9,965 | | | | 0.1 | % | | | 0.1 | % |
Total | | | 9,977 | | | | – | | | | 1,885 | | | | 11,862 | | | | 9,965 | | | | – | | | | 3,016 | | | | 12,981 | | | | | | | | | |
Earnings from Commercial | | | | | | | | | | | | | | | | | | | | | | | | | | | | | | | | | | | | | | | | |
Land Sales (1) | | | 44,175 | | | | (782 | ) | | | – | | | | 44,957 | | | | 4,652 | | | | 14 | | | | – | | | | 4,638 | | | | | | | | | |
Other(2) | | | (12,867 | ) | | | (2,608 | ) | | | – | | | | (10,259 | ) | | | (134 | ) | | | (762 | ) | | | – | | | | 628 | | | | | | | | | |
Total Commercial Group | | | | | | | | | | | | | | | | | | | | | | | | | | | | | | | | | | | | | | | | |
Comparable | | | 470,382 | | | | 14,090 | | | | – | | | | 456,292 | | | | 474,346 | | | | 17,866 | | | | – | | | | 456,480 | | | | (0.8 | %) | | | 0.0 | % |
Total | | | 540,519 | | | | 13,271 | | | | 4,530 | | | | 531,778 | | | | 545,122 | | | | 21,518 | | | | 18,523 | | | | 542,127 | | | | | | | | | |
Residential Group | | | | | | | | | | | | | | | | | | | | | | | | | | | | | | | | | | | | | | | | |
Apartments | | | | | | | | | | | | | | | | | | | | | | | | | | | | | | | | | | | | | | | | |
Comparable | | | 121,487 | | | | 1,701 | | | | – | | | | 119,786 | | | | 112,912 | | | | 1,313 | | | | – | | | | 111,599 | | | | 7.6 | % | | | 7.3 | % |
Total | | | 134,327 | | | | 2,355 | | | | – | | | | 131,972 | | | | 126,203 | | | | 3,691 | | | | 900 | | | | 123,412 | | | | | | | | | |
Subsidized Senior Housing | | | 14,531 | | | | (65 | ) | | | – | | | | 14,596 | | | | 19,378 | | | | 480 | | | | – | | | | 18,898 | | | | | | | | | |
Military Housing | | | 29,314 | | | | 920 | | | | – | | | | 28,394 | | | | 28,469 | | | | (37 | ) | | | – | | | | 28,506 | | | | | | | | | |
Land Sales | | | 204 | | | | 16 | | | | – | | | | 188 | | | | – | | | | – | | | | – | | | | – | | | | | | | | | |
Other(2) | | | (3,788 | ) | | | 541 | | | | – | | | | (4,329 | ) | | | (3,377 | ) | | | 287 | | | | – | | | | (3,664 | ) | | | | | | | | |
Total Residential Group | | | | | | | | | | | | | | | | | | | | | | | | | | | | | | | | | | | | | | | | |
Comparable | | | 121,487 | | | | 1,701 | | | | – | | | | 119,786 | | | | 112,912 | | | | 1,313 | | | | – | | | | 111,599 | | | | 7.6 | % | | | 7.3 | % |
Total | | | 174,588 | | | | 3,767 | | | | – | | | | 170,821 | | | | 170,673 | | | | 4,421 | | | | 900 | | | | 167,152 | | | | | | | | | |
Total Rental Properties | | | | | | | | | | | | | | | | | | | | | | | | | | | | | | | | | | | | | | | | |
Comparable | | | 591,869 | | | | 15,791 | | | | – | | | | 576,078 | | | | 587,258 | | | | 19,179 | | | | – | | | | 568,079 | | | | 0.8 | % | | | 1.4 | % |
Total | | | 715,107 | | | | 17,038 | | | | 4,530 | | | | 702,599 | | | | 715,795 | | | | 25,939 | | | | 19,423 | | | | 709,279 | | | | | | | | | |
Land Development Group | | | 11,298 | | | | 1,461 | | | | – | | | | 9,837 | | | | 5,617 | | | | 732 | | | | – | | | | 4,885 | | | | | | | | | |
The Nets | | | | | | | | | | | | | | | | | | | | | | | | | | | | | | | | | | | | | | | | |
Operations | | | (26,814 | ) | | | – | | | | – | | | | (26,814 | ) | | | (17,172 | ) | | | (6,243 | ) | | | – | | | | (10,929 | ) | | | | | | | | |
Gain on disposition of partial interest | | | – | | | | – | | | | – | | | | – | | | | 55,112 | | | | 23,675 | | | | – | | | | 31,437 | | | | | | | | | |
Total | | | (26,814 | ) | | | – | | | | – | | | | (26,814 | ) | | | 37,940 | | | | 17,432 | | | | – | | | | 20,508 | | | | | | | | | |
Corporate Activities | | | (53,837 | ) | | | – | | | | – | | | | (53,837 | ) | | | (48,357 | ) | | | – | | | | – | | | | (48,357 | ) | | | | | | | | |
Grand Total | | $ | 645,754 | | | $ | 18,499 | | | $ | 4,530 | | | $ | 631,785 | | | $ | 710,995 | | | $ | 44,103 | | | $ | 19,423 | | | $ | 686,315 | | | | | | | | | |
| (1) | Includes $42,622 of NOI generated from the casino land sale at full and pro-rata consolidation. |
| (2) | Includes write-offs of abandoned development projects, non-capitalizable development costs, non-capitalizable marketing/promotional costs associated withBarclays Center and unallocated management and service company overhead, net of tax credit income. |
| (3) | Amounts have been recast to add back interest expense and gain (loss) on early extinguishment of debt for unconsolidated entities to NOI at full consolidation to conform to current period presentation. |
19
Forest City Enterprises, Inc. and Subsidiaries
Supplemental Operating Information
Net Operating Income by Product Type
Pro-Rata Consolidation (dollars in thousands)
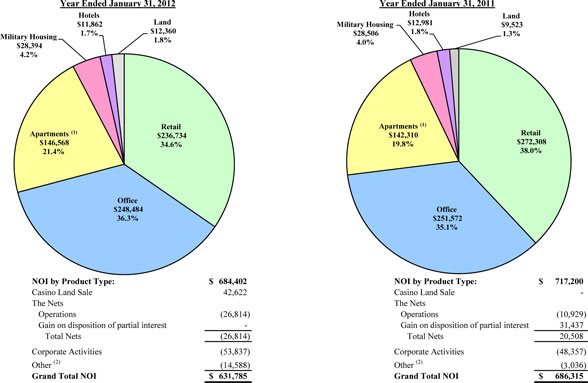
| (1) | Includes subsidized senior housing. |
| (2) | Includes write-offs of abandoned development projects, non-capitalizable development costs, non-capitalizable marketing/promotional costs associated withBarclays Center and unallocated management and service company overhead, net of tax credit income. |
20
Forest City Enterprises, Inc. and Subsidiaries
Supplemental Operating Information
Net Operating Income by Core Market
Pro-Rata Consolidation (dollars in thousands)
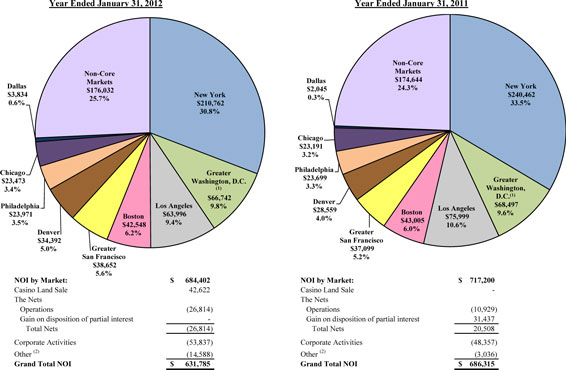
| (1) | Includes Richmond, Virginia. |
| (2) | Includes write-offs of abandoned development projects, non-capitalizable development costs, non-capitalizable marketing/promotional costs associated withBarclays Center and unallocated management and service company overhead, net of tax credit income. |
21
Forest City Enterprises, Inc. and Subsidiaries
Supplemental Operating Information
Reconciliation of Net Operating Income (non-GAAP) to Net Loss (GAAP)(in thousands)
| | | | | | | | | | | | | | | | | | | | | | | | | | | | | | | | | | | | | | | | |
| | | Three Months Ended January 31, 2012 | | | Three Months Ended January 31, 2011 | |
| | | | | | | | | Plus | | | | | | | | | | | | | | | Plus | | | | | | | |
| | | Full | | | Less | | | Unconsolidated | | | Plus | | | Pro-Rata | | | Full | | | Less | | | Unconsolidated | | | Plus | | | Pro-Rata | |
| | | Consolidation | | | Noncontrolling | | | Investments at | | | Discontinued | | | Consolidation | | | Consolidation | | | Noncontrolling | | | Investments at | | | Discontinued | | | Consolidation | |
| | | (GAAP) | | | Interest | | | Pro-Rata | | | Operations | | | (Non-GAAP) | | | (GAAP) | | | Interest | | | Pro-Rata | | | Operations | | | (Non-GAAP) | |
Revenues from real estate operations | | $ | 281,249 | | | $ | 17,675 | | | $ | 106,313 | | | $ | 2,481 | | | $ | 372,368 | | | $ | 280,147 | | | $ | 14,172 | | | $ | 80,167 | | | $ | 14,978 | | | $ | 361,120 | |
Exclude straight-line rent adjustment (1) | | | (5,308 | ) | | | – | | | | – | | | | – | | | | (5,308 | ) | | | (8,532 | ) | | | – | | | | – | | | | (627 | ) | | | (9,159 | ) |
Adjusted revenues | | | 275,941 | | | | 17,675 | | | | 106,313 | | | | 2,481 | | | | 367,060 | | | | 271,615 | | | | 14,172 | | | | 80,167 | | | | 14,351 | | | | 351,961 | |
Add interest and other income | | | 10,001 | | | | 458 | | | | 342 | | | | (1 | ) | | | 9,884 | | | | 17,859 | | | | 611 | | | | 381 | | | | 2 | | | | 17,631 | |
Add equity in earnings (loss) of unconsolidated entities, including impairment | | | (43,402 | ) | | | (413 | ) | | | 31,469 | | | | – | | | | (11,520 | ) | | | (12,742 | ) | | | 1,719 | | | | 14,081 | | | | – | | | | (380 | ) |
Excludes gain on disposition of unconsolidated entities | | | – | | | | – | | | | – | | | | – | | | | – | | | | (15,633 | ) | | | – | | | | 15,633 | | | | – | | | | – | |
Exclude impairment of unconsolidated real estate | | | 40,897 | | | | – | | | | (40,897 | ) | | | – | | | | – | | | | 35,714 | | | | – | | | | (35,714 | ) | | | – | | | | – | |
Exclude depreciation and amortization of unconsolidated entities (see below) | | | 20,989 | | | | – | | | | (20,989 | ) | | | – | | | | – | | | | 15,851 | | | | – | | | | (15,851 | ) | | | – | | | | – | |
Exclude interest expense of unconsolidated entities | | | 26,457 | | | | – | | | | (26,457 | ) | | | – | | | | – | | | | 22,228 | | | | – | | | | (22,228 | ) | | | – | | | | – | |
Exclude (gain) loss on early extinguishment of debt of unconsolidated entities | | | (114 | ) | | | – | | | | 114 | | | | – | | | | – | | | | (2,785 | ) | | | – | | | | 2,785 | | | | – | | | | – | |
Adjusted total income | | | 330,769 | | | | 17,720 | | | | 49,895 | | | | 2,480 | | | | 365,424 | | | | 332,107 | | | | 16,502 | | | | 39,254 | | | | 14,353 | | | | 369,212 | |
Operating expenses | | | 191,427 | | | | 13,600 | | | | 49,895 | | | | 2,828 | | | | 230,550 | | | | 172,078 | | | | 8,309 | | | | 39,254 | | | | 10,457 | | | | 213,480 | |
Add back non-Real Estate depreciation and amortization (b) | | | 847 | | | | – | | | | – | | | | – | | | | 847 | | | | 1,091 | | | | – | | | | – | | | | – | | | | 1,091 | |
Exclude straight-line rent adjustment (2) | | | (1,095 | ) | | | – | | | | – | | | | – | | | | (1,095 | ) | | | (1,246 | ) | | | – | | | | – | | | | – | | | | (1,246 | ) |
Exclude preference payment | | | 24 | | | | – | | | | – | | | | – | | | | 24 | | | | (585 | ) | | | – | | | | – | | | | – | | | | (585 | ) |
Adjusted operating expenses | | | 191,203 | | | | 13,600 | | | | 49,895 | | | | 2,828 | | | | 230,326 | | | | 171,338 | | | | 8,309 | | | | 39,254 | | | | 10,457 | | | | 212,740 | |
Net operating income | | | 139,566 | | | | 4,120 | | | | – | | | | (348 | ) | | | 135,098 | | | | 160,769 | | | | 8,193 | | | | – | | | | 3,896 | | | | 156,472 | |
Interest expense | | | (64,128 | ) | | | (2,823 | ) | | | (26,457 | ) | | | (106 | ) | | | (87,868 | ) | | | (69,387 | ) | | | (3,047 | ) | | | (22,228 | ) | | | (1,848 | ) | | | (90,416 | ) |
Gain (loss) on early extinguishment of debt | | | 256 | | | | 134 | | | | 114 | | | | – | | | | 236 | | | | (31,688 | ) | | | – | | | | 2,785 | | | | – | | | | (28,903 | ) |
Equity in (earnings) loss of unconsolidated entities, including impairment | | | 43,402 | | | | 413 | | | | (31,469 | ) | | | – | | | | 11,520 | | | | 12,742 | | | | (1,719 | ) | | | (14,081 | ) | | | – | | | | 380 | |
Gain on disposition of unconsolidated entities | | | – | | | | – | | | | – | | | | – | | | | – | | | | 15,633 | | | | – | | | | – | | | | – | | | | 15,633 | |
Impairment of unconsolidated real estate | | | (40,897 | ) | | | – | | | | – | | | | – | | | | (40,897 | ) | | | (35,714 | ) | | | – | | | | – | | | | – | | | | (35,714 | ) |
Depreciation and amortization of unconsolidated entities (see above) | | | (20,989 | ) | | | – | | | | 20,989 | | | | – | | | | – | | | | (15,851 | ) | | | – | | | | 15,851 | | | | – | | | | – | |
Interest expense of unconsolidated entities (see above) | | | (26,457 | ) | | | – | | | | 26,457 | | | | – | | | | – | | | | (22,228 | ) | | | – | | | | 22,228 | | | | – | | | | – | |
Gain (loss) on early extinguishment of debt of unconsolidated entities (see above) | | | 114 | | | | – | | | | (114 | ) | | | – | | | | – | | | | 2,785 | | | | – | | | | (2,785 | ) | | | – | | | | – | |
Net gain (loss) on disposition of rental properties and partial interests in rental properties | | | 2,255 | | | | – | | | | – | | | | 11,859 | | | | 14,114 | | | | – | | | | – | | | | – | | | | 46,527 | | | | 46,527 | |
Impairment of consolidated real estate | | | (113,804 | ) | | | (243 | ) | | | – | | | | – | | | | (113,561 | ) | | | – | | | | – | | | | – | | | | – | | | | – | |
Depreciation and amortization –Real Estate Groups (a) | | | (53,003 | ) | | | (707 | ) | | | (20,131 | ) | | | (215 | ) | | | (72,642 | ) | | | (57,953 | ) | | | (1,575 | ) | | | (15,237 | ) | | | (1,764 | ) | | | (73,379 | ) |
Amortization of mortgage procurement costs –Real Estate Groups (c) | | | (2,797 | ) | | | (86 | ) | | | (858 | ) | | | (2 | ) | | | (3,571 | ) | | | (2,849 | ) | | | (117 | ) | | | (614 | ) | | | (271 | ) | | | (3,617 | ) |
Straight-line rent adjustment (1) + (2) | | | 4,213 | | | | – | | | | – | | | | – | | | | 4,213 | | | | 7,286 | | | | – | | | | – | | | | 627 | | | | 7,913 | |
Preference payment | | | 24 | | | | – | | | | – | | | | – | | | | 24 | | | | (585 | ) | | | – | | | | – | | | | – | | | | (585 | ) |
Earnings (loss) before income taxes | | | (132,245 | ) | | | 808 | | | | (31,469 | ) | | | 11,188 | | | | (153,334 | ) | | | (37,040 | ) | | | 1,735 | | | | (14,081 | ) | | | 47,167 | | | | (5,689 | ) |
Income tax provision | | | 64,179 | | | | – | | | | – | | | | (4,711 | ) | | | 59,468 | | | | 23,354 | | | | – | | | | – | | | | (19,118 | ) | | | 4,236 | |
Equity in earnings (loss) of unconsolidated entities, including impairment | | | (43,402 | ) | | | (413 | ) | | | 31,469 | | | | – | | | | (11,520 | ) | | | (12,742 | ) | | | 1,719 | | | | 14,081 | | | | – | | | | (380 | ) |
Earnings (loss) from continuing operations | | | (111,468 | ) | | | 395 | | | | – | | | | 6,477 | | | | (105,386 | ) | | | (26,428 | ) | | | 3,454 | | | | – | | | | 28,049 | | | | (1,833 | ) |
Discontinued operations, net of tax | | | 5,904 | | | | (573 | ) | | | – | | | | (6,477 | ) | | | – | | | | 30,030 | | | | 1,981 | | | | – | | | | (28,049 | ) | | | – | |
Net earnings (loss) | | | (105,564 | ) | | | (178 | ) | | | – | | | | – | | | | (105,386 | ) | | | 3,602 | | | | 5,435 | | | | – | | | | – | | | | (1,833 | ) |
Noncontrolling interests | | | | | | | | | | | | | | | | | | | | | | | | | | | | | | | | | | | | | | | | |
Earnings from continuing operations attributable to noncontrolling interests | | | (395 | ) | | | (395 | ) | | | – | | | | – | | | | – | | | | (3,454 | ) | | | (3,454 | ) | | | – | | | | – | | | | – | |
(Earnings) loss from discontinued operations attributable to noncontrolling interests | | | 573 | | | | 573 | | | | – | | | | – | | | | – | | | | (1,981 | ) | | | (1,981 | ) | | | – | | | | – | | | | – | |
Noncontrolling interests | | | 178 | | | | 178 | | | | – | | | | – | | | | – | | | | (5,435 | ) | | | (5,435 | ) | | | – | | | | – | | | | – | |
Net loss attributable to Forest City Enterprises, Inc. | | $ | (105,386 | ) | | $ | – | | | $ | – | | | $ | – | | | $ | (105,386 | ) | | $ | (1,833 | ) | | $ | – | | | $ | – | | | $ | – | | | $ | (1,833 | ) |
Preferred dividends | | | (3,850 | ) | | | – | | | | – | | | | – | | | | (3,850 | ) | | | (3,850 | ) | | | – | | | | – | | | | – | | | | (3,850 | ) |
Net loss attributable to Forest City Enterprises, Inc. common shareholders | | $ | (109,236 | ) | | $ | – | | | $ | – | | | $ | – | | | $ | (109,236 | ) | | $ | (5,683 | ) | | $ | – | | | $ | – | | | $ | – | | | $ | (5,683 | ) |
(a) Depreciation and amortization –Real Estate Groups | | $ | 53,003 | | | $ | 707 | | | $ | 20,131 | | | $ | 215 | | | $ | 72,642 | | | $ | 57,953 | | | $ | 1,575 | | | $ | 15,237 | | | $ | 1,764 | | | $ | 73,379 | |
(b) Depreciation and amortization –Non-Real Estate | | | 847 | | | | – | | | | – | | | | – | | | | 847 | | | | 1,091 | | | | – | | | | – | | | | – | | | | 1,091 | |
Total depreciation and amortization | | $ | 53,850 | | | $ | 707 | | | $ | 20,131 | | | $ | 215 | | | $ | 73,489 | | | $ | 59,044 | | | $ | 1,575 | | | $ | 15,237 | | | $ | 1,764 | | | $ | 74,470 | |
(c) Amortization of mortgage procurement costs –Real Estate Groups | | $ | 2,797 | | | $ | 86 | | | $ | 858 | | | $ | 2 | | | $ | 3,571 | | | $ | 2,849 | | | $ | 117 | | | $ | 614 | | | $ | 271 | | | $ | 3,617 | |
(d) Amortization of mortgage procurement costs –Non-Real Estate | | | – | | | | – | | | | – | | | | – | | | | – | | | | – | | | | – | | | | – | | | | – | | | | – | |
Total amortization of mortgage procurement costs | | $ | 2,797 | | | $ | 86 | | | $ | 858 | | | $ | 2 | | | $ | 3,571 | | | $ | 2,849 | | | $ | 117 | | | $ | 614 | | | $ | 271 | | | $ | 3,617 | |
22
Forest City Enterprises, Inc. and Subsidiaries
Supplemental Operating Information
Reconciliation of Net Operating Income (non-GAAP) to Net Earnings (Loss) (GAAP) (in thousands) (continued)
| | | | | | | | | | | | | | | | | | | | | | | | | | | | | | | | | | | | | | | | |
| | | Year Ended January 31, 2012 | | | Year Ended January 31, 2011 | |
| | | | | | | | | Plus | | | | | | | | | | | | | | | Plus | | | | | | | |
| | | Full | | | Less | | | Unconsolidated | | | Plus | | | Pro-Rata | | | Full | | | Less | | | Unconsolidated | | | Plus | | | Pro-Rata | |
| | | Consolidation | | | Noncontrolling | | | Investments at | | | Discontinued | | | Consolidation | | | Consolidation | | | Noncontrolling | | | Investments at | | | Discontinued | | | Consolidation | |
| | | (GAAP) | | | Interest | | | Pro-Rata | | | Operations | | | (Non-GAAP) | | | (GAAP) | | | Interest | | | Pro-Rata | | | Operations | | | (Non-GAAP) | |
Revenues from real estate operations | | $ | 1,089,977 | | | $ | 56,108 | | | $ | 385,521 | | | $ | 23,173 | | | $ | 1,442,563 | | | $ | 1,117,649 | | | $ | 54,119 | | | $ | 316,900 | | | $ | 63,560 | | | $ | 1,443,990 | |
Exclude straight-line rent adjustment (1) | | | (11,134 | ) | | | – | | | | – | | | | (571 | ) | | | (11,705) | | | | (21,697 | ) | | | – | | | | – | | | | (1,795 | ) | | | (23,492 | ) |
Adjusted revenues | | | 1,078,843 | | | | 56,108 | | | | 385,521 | | | | 22,602 | | | | 1,430,858 | | | | 1,095,952 | | | | 54,119 | | | | 316,900 | | | | 61,765 | | | | 1,420,498 | |
Add interest and other income | | | 52,114 | | | | 1,370 | | | | 989 | | | | 2 | | | | 51,735 | | | | 52,818 | | | | 2,635 | | | | 15,666 | | | | 14 | | | | 65,863 | |
Add gain on disposition of partial interests in other investment -Nets | | | – | | | | – | | | | – | | | | – | | | | – | | | | 55,112 | | | | 23,675 | | | | – | | | | – | | | | 31,437 | |
Add equity in earnings (loss) of unconsolidated entities, including impairment | | | (61,039 | ) | | | (185 | ) | | | 34,545 | | | | – | | | | (26,309) | | | | (30,194 | ) | | | (4,613 | ) | | | 19,507 | | | | – | | | | (6,074 | ) |
Excludes gain on disposition of unconsolidated entities | | | (12,567 | ) | | | – | | | | 12,567 | | | | – | | | | – | | | | (23,461 | ) | | | – | | | | 23,461 | | | | – | | | | – | |
Exclude impairment of unconsolidated real estate | | | 82,186 | | | | – | | | | (82,186 | ) | | | – | | | | – | | | | 72,459 | | | | – | | | | (72,459 | ) | | | – | | | | – | |
Exclude depreciation and amortization of unconsolidated entities (see below) | | | 70,870 | | | | – | | | | (70,870 | ) | | | – | | | | – | | | | 54,439 | | | | – | | | | (54,439 | ) | | | – | | | | – | |
Exclude interest expense of unconsolidated entities | | | 100,958 | | | | – | | | | (100,958 | ) | | | – | | | | – | | | | 81,184 | | | | – | | | | (81,184 | ) | | | – | | | | – | |
Exclude (gain) loss on early extinguishment of debt of unconsolidated entities | | | 366 | | | | – | | | | (366 | ) | | | – | | | | – | | | | (2,760 | ) | | | – | | | | 2,760 | | | | – | | | | – | |
Adjusted total income | | | 1,311,731 | | | | 57,293 | | | | 179,242 | | | | 22,604 | | | | 1,456,284 | | | | 1,355,549 | | | | 75,816 | | | | 170,212 | | | | 61,779 | | | | 1,511,724 | |
Operating expenses | | | 668,959 | | | | 38,794 | | | | 179,242 | | | | 18,074 | | | | 827,481 | | | | 647,199 | | | | 31,713 | | | | 169,265 | | | | 42,356 | | | | 827,107 | |
Add back non-Real Estate depreciation and amortization (b) | | | 3,247 | | | | – | | | | – | | | | – | | | | 3,247 | | | | 5,028 | | | | – | | | | 878 | | | | – | | | | 5,906 | |
Add back amortization of mortgage procurement costs for non-Real Estate Groups (d) | | | – | | | | – | | | | – | | | | – | | | | – | | | | – | | | | – | | | | 69 | | | | – | | | | 69 | |
Exclude straight-line rent adjustment (2) | | | (4,497 | ) | | | – | | | | – | | | | – | | | | (4,497) | | | | (5,332 | ) | | | – | | | | – | | | | – | | | | (5,332 | ) |
Exclude preference payment | | | (1,732 | ) | | | – | | | | – | | | | – | | | | (1,732) | | | | (2,341 | ) | | | – | | | | – | | | | – | | | | (2,341 | ) |
Adjusted operating expenses | | | 665,977 | | | | 38,794 | | | | 179,242 | | | | 18,074 | | | | 824,499 | | | | 644,554 | | | | 31,713 | | | | 170,212 | | | | 42,356 | | | | 825,409 | |
Net operating income | | | 645,754 | | | | 18,499 | | | | – | | | | 4,530 | | | | 631,785 | | | | 710,995 | | | | 44,103 | | | | – | | | | 19,423 | | | | 686,315 | |
Interest expense | | | (261,037 | ) | | | (11,989 | ) | | | (100,958 | ) | | | (2,123 | ) | | | (352,129) | | | | (309,766 | ) | | | (16,774 | ) | | | (81,184 | ) | | | (9,482 | ) | | | (383,658 | ) |
Gain (loss) on early extinguishment of debt | | | 9,590 | | | | 1,641 | | | | (366 | ) | | | – | | | | 7,583 | | | | (21,035 | ) | | | 247 | | | | 2,760 | | | | – | | | | (18,522 | ) |
Equity in (earnings) loss of unconsolidated entities, including impairment | | | 61,039 | | | | 185 | | | | (34,545 | ) | | | – | | | | 26,309 | | | | 30,194 | | | | 4,613 | | | | (19,507 | ) | | | – | | | | 6,074 | |
Gain on disposition of unconsolidated entities | | | 12,567 | | | | – | | | | – | | | | – | | | | 12,567 | | | | 23,461 | | | | – | | | | – | | | | – | | | | 23,461 | |
Impairment of unconsolidated real estate | | | (82,186 | ) | | | – | | | | – | | | | – | | | | (82,186) | | | | (72,459 | ) | | | – | | | | – | | | | – | | | | (72,459 | ) |
Depreciation and amortization of unconsolidated entities (see above) | | | (70,870 | ) | | | – | | | | 70,870 | | | | – | | | | – | | | | (54,439 | ) | | | – | | | | 54,439 | | | | – | | | | – | |
Interest expense of unconsolidated entities (see above) | | | (100,958 | ) | | | – | | | | 100,958 | | | | – | | | | – | | | | (81,184 | ) | | | – | | | | 81,184 | | | | – | | | | – | |
Gain (loss) on early extinguishment of debt of unconsolidated entities (see above) | | | (366 | ) | | | – | | | | 366 | | | | – | | | | – | | | | 2,760 | | | | – | | | | (2,760 | ) | | | – | | | | – | |
Net gain on disposition of rental properties and partial interests in rental properties | | | 17,665 | | | | – | | | | – | | | | 51,796 | | | | 69,461 | | | | 202,878 | | | | – | | | | – | | | | 47,092 | | | | 249,970 | |
Impairment of consolidated real estate | | | (119,324 | ) | | | (243 | ) | | | – | | | | (10,257 | ) | | | (129,338) | | | | (4,763 | ) | | | (1,526 | ) | | | – | | | | (81,643 | ) | | | (84,880 | ) |
Depreciation and amortization –Real Estate Groups (a) | | | (215,354 | ) | | | (4,659 | ) | | | (67,855 | ) | | | (3,154 | ) | | | (281,704) | | | | (229,700 | ) | | | (6,384 | ) | | | (52,194 | ) | | | (10,532 | ) | | | (286,042 | ) |
Amortization of mortgage procurement costs –Real Estate Groups (c) | | | (11,812 | ) | | | (513 | ) | | | (3,015 | ) | | | (356 | ) | | | (14,670) | | | | (11,484 | ) | | | (444 | ) | | | (2,245 | ) | | | (1,056 | ) | | | (14,341 | ) |
Straight-line rent adjustment (1) + (2) | | | 6,637 | | | | – | | | | – | | | | 571 | | | | 7,208 | | | | 16,365 | | | | – | | | | – | | | | 1,795 | | | | 18,160 | |
Preference payment | | | (1,732 | ) | | | – | | | | – | | | | – | | | | (1,732) | | | | (2,341 | ) | | | – | | | | – | | | | – | | | | (2,341 | ) |
Earnings (loss) before income taxes | | | (110,387 | ) | | | 2,921 | | | | (34,545 | ) | | | 41,007 | | | | (106,846) | | | | 199,482 | | | | 23,835 | | | | (19,507 | ) | | | (34,403 | ) | | | 121,737 | |
Income tax provision | | | 64,344 | | | | – | | | | – | | | | (17,675 | ) | | | 46,669 | | | | (70,126 | ) | | | – | | | | – | | | | 12,511 | | | | (57,615 | ) |
Equity in earnings (loss) of unconsolidated entities, including impairment | | | (61,039 | ) | | | (185 | ) | | | 34,545 | | | | – | | | | (26,309) | | | | (30,194 | ) | | | (4,613 | ) | | | 19,507 | | | | – | | | | (6,074 | ) |
Earnings (loss) from continuing operations | | | (107,082 | ) | | | 2,736 | | | | – | | | | 23,332 | | | | (86,486) | | | | 99,162 | | | | 19,222 | | | | – | | | | (21,892 | ) | | | 58,048 | |
Discontinued operations, net of tax | | | 106,514 | | | | 83,182 | | | | – | | | | (23,332 | ) | | | – | | | | (13,764 | ) | | | 8,128 | | | | – | | | | 21,892 | | | | – | |
Net earnings (loss) | | | (568 | ) | | | 85,918 | | | | – | | | | – | | | | (86,486) | | | | 85,298 | | | | 27,350 | | | | – | | | | – | | | | 58,048 | |
Noncontrolling interests | | | | | | | | | | | | | | | | | | | | | | | | | | | | | | | | | | | | | | | | |
Earnings from continuing operations attributable to noncontrolling interests | | | (2,736 | ) | | | (2,736 | ) | | | – | | | | – | | | | – | | | | (19,222 | ) | | | (19,222 | ) | | | – | | | | – | | | | – | |
Earnings from discontinued operations attributable to noncontrolling interests | | | (83,182 | ) | | | (83,182 | ) | | | – | | | | – | | | | – | | | | (8,128 | ) | | | (8,128 | ) | | | – | | | | – | | | | – | |
Noncontrolling interests | | | (85,918 | ) | | | (85,918 | ) | | | – | | | | – | | | | – | | | | (27,350 | ) | | | (27,350 | ) | | | – | | | | – | | | | – | |
Net earnings (loss) attributable to Forest City Enterprises, Inc. | | $ | (86,486 | ) | | $ | – | | | $ | – | | | $ | – | | | $ | (86,486) | | | $ | 58,048 | | | $ | – | | | $ | – | | | $ | – | | | $ | 58,048 | |
Preferred dividends | | | (15,400 | ) | | | – | | | | – | | | | – | | | | (15,400) | | | | (11,807 | ) | | | – | | | | – | | | | – | | | | (11,807 | ) |
Net earnings (loss) attributable to Forest City Enterprises, Inc. common shareholders | | $ | (101,886 | ) | | $ | – | | | $ | – | | | $ | – | | | $ | (101,886) | | | $ | 46,241 | | | $ | – | | | $ | – | | | $ | – | | | $ | 46,241 | |
(a) Depreciation and amortization –Real Estate Groups | | $ | 215,354 | | | $ | 4,659 | | | $ | 67,855 | | | $ | 3,154 | | | $ | 281,704 | | | $ | 229,700 | | | $ | 6,384 | | | $ | 52,194 | | | $ | 10,532 | | | $ | 286,042 | |
(b) Depreciation and amortization –Non-Real Estate | | | 3,247 | | | | – | | | | – | | | | – | | | | 3,247 | | | | 5,028 | | | | – | | | | 878 | | | | – | | | | 5,906 | |
Total depreciation and amortization | | $ | 218,601 | | | $ | 4,659 | | | $ | 67,855 | | | $ | 3,154 | | | $ | 284,951 | | | $ | 234,728 | | | $ | 6,384 | | | $ | 53,072 | | | $ | 10,532 | | | $ | 291,948 | |
(c) Amortization of mortgage procurement costs –Real Estate Groups | | $ | 11,812 | | | $ | 513 | | | $ | 3,015 | | | $ | 356 | | | $ | 14,670 | | | $ | 11,484 | | | $ | 444 | | | $ | 2,245 | | | $ | 1,056 | | | $ | 14,341 | |
(d) Amortization of mortgage procurement costs –Non-Real Estate | | | – | | | | – | | | | – | | | | – | | | | – | | | | – | | | | – | | | | 69 | | | | – | | | | 69 | |
Total amortization of mortgage procurement costs | | $ | 11,812 | | | $ | 513 | | | $ | 3,015 | | | $ | 356 | | | $ | 14,670 | | | $ | 11,484 | | | $ | 444 | | | $ | 2,314 | | | $ | 1,056 | | | $ | 14,410 | |
23
Forest City Enterprises, Inc. and Subsidiaries
Supplemental Operating Information
Results of Operations
Net Earnings (Loss) Attributable to Forest City Enterprises, Inc. –Net loss attributable to Forest City Enterprises, Inc. for the year ended January 31, 2012 was $86,486,000 versus net earnings of $58,048,000 for the year ended January 31, 2011. Although we have substantial recurring revenue sources from our properties, we also enter into significant transactions, which create substantial variances in net earnings (loss) between periods. This variance to the prior year is primarily attributable to the following decreases, which are net of noncontrolling interest:
| | • | | $176,192,000 related to the 2010 gain on disposition of partial interest in seven mixed-useUniversity Park life science properties in Cambridge, Massachusetts, related to the formation of a new joint venture with an outside partner; |
| | • | | $54,185,000 related to the 2011 increase in impairment charges of consolidated (including discontinued operations) and unconsolidated entities; |
| | • | | $31,437,000 related to the 2010 gain on disposition of partial interest in The Nets; |
| | • | | $29,342,000 related to the 2010 gain on disposition of partial interest inThe Grand,Lenox Club andLenox Park, apartment communities in the Washington D.C. metropolitan area, related to the formation of a new joint venture with an outside partner; |
| | • | | $14,739,000 related to a 2011 increase in allocated losses from our equity investment in The Nets; |
| | • | | $10,894,000 related to the 2010 gains on disposition of our unconsolidated investments exceeding 2011. The 2011 gains related toMetropolitan Lofts andTwin Lake Towers, apartment communities in Los Angeles, California and Denver, Colorado, respectively, while the 2010 gains primarily related toMillender Center, a mixed-use property in Detroit, Michigan, andWoodbridge Crossing, a specialty retail center in Woodbridge, New Jersey; |
| | • | | $9,649,000 related to the lease up losses of8 Spruce Street, an apartment community in Manhattan, New York, currently being opened in phases. This property was consolidated until a recapitalization transaction in July 2011 which resulted in joint control of the investment; |
| | • | | $4,683,000 related to a decrease in income recognized on the sale of state and federal Historic Preservation Tax Credits and New Market Tax Credits in 2011 compared to 2010; and |
| | • | | $4,200,000 related to increases in professional fees associated with strategic planning and process improvement initiatives in 2011 compared to 2010. |
These decreases were partially offset by the following increases, net of noncontrolling interest:
| | • | | $42,622,000 related to the 2011 sale of land and air rights for development of a casino in downtown Cleveland, Ohio; |
| | • | | $26,105,000 (which includes $3,126,000 for unconsolidated entities) related to gains on extinguishment of debt in 2011 compared to losses on extinguishment of debt in 2010; |
| | • | | $9,561,000 due to the 2011 gain on disposition of partial interests in 15 retail properties in the New York City metropolitan area, related to the formation of new joint venture agreements with an outside partner; |
| | • | | $6,359,000 related to a decrease in interest expense on our corporate debt due primarily to decreased borrowings on our revolving credit facility and lower interest attributable to our senior and subordinated debt; |
| | • | | $5,849,000 related to the 2011 gain on disposition of partial interest in theMall at Stonecrest, a regional mall in Atlanta, Georgia, related to the formation of a new joint venture with an outside partner; |
| | • | | $4,704,000 related to the 2011 gains on disposition of rental properties exceeding 2010 gains. The 2011 gains related toWaterfront Station – East 4th & West 4th Buildings, office buildings in Washington, D.C.,Charleston Marriott, a hotel in Charleston, West Virginia,250 Huron, an office building in Cleveland, Ohio, andRitz-Carlton, a hotel in Cleveland, Ohio. The 2010 gains related toSimi Valley Town Center, a regional mall in Simi Valley, California,Saddle Rock Village, a specialty retail center in Aurora, Colorado,101 San Fernando, an apartment community in San Jose, California, and an investment in a triple net lease retail property located in Pueblo, Colorado; |
24
Forest City Enterprises, Inc. and Subsidiaries
Supplemental Operating Information
| | • | | $2,656,000 related to transaction costs expensed during 2010 that were incurred in connection with a potential partial disposition of certain rental properties that did not occur; |
| | • | | $2,255,000 related to the 2011 gain on the sale of an annex building containing 8 units adjacent to ourDallas Wilson Building, an apartment building in Dallas, Texas; and |
| | • | | $104,284,000 due to decreased income tax expense attributable to both continuing and discontinued operations primarily related to the fluctuations in earnings (loss) before income taxes and pre-tax earnings (loss) including gains included in discontinued operations. These fluctuations are primarily due to the various transactions discussed herein. |
Net Operating Income (NOI) from Real Estate Groups– NOI, a non-GAAP measure, is defined as revenues (excluding straight-line rent adjustments) less operating expenses (including depreciation and amortization and amortization of mortgage procurement costs for non-real estate groups) plus interest income plus equity in earnings (loss) of unconsolidated entities (excluding gain on disposition and impairment of unconsolidated entities) plus interest expense, gain (loss) on early extinguishment of debt, depreciation and amortization of unconsolidated entities. We believe NOI provides us, as well as our investors, additional information about our core business operations and, along with earnings, is necessary to understand our business and operating results.
Full Consolidation – Under the full consolidation method (GAAP), NOI from the combination of the Commercial Group and the Residential Group (“Rental Properties”) for the three months ended January 31, 2012 was $161,725,000 compared to $176,008,000 for the three months ended January 31, 2011, a 8.1% decrease. NOI for the year ended January 31, 2012 was $715,107,000, remaining flat compared to $715,795,000 for the year ended January 31, 2011.
Pro-Rata Consolidation – Management also analyzes property NOI using the pro-rata consolidation method because it provides operating data at our ownership share, and we publicly disclose and discuss our performance using this method of consolidation to complement our GAAP disclosures. Under the pro-rata consolidation method, NOI from Rental Properties for the three months ended January 31, 2012 was $157,964,000 compared to $172,095,000 for the three months ended January 31, 2011, a 8.2% decrease. NOI for the year ended January 31, 2012 was $702,599,000 compared to $709,279,000 for the year ended January 31, 2011, a 0.9% decrease. The primary drivers of the fiscal year change were the NOI generated from the casino land sale within the Commercial Group of $42,622,000 offset by reduced NOI from our joint venture transactions.
Comparable NOI increased 4.5% for the three months ended January 31, 2012 compared to the prior year. Retail, office and our residential portfolio comparable NOI increased 4.7%, 0.5% and 11.9%, respectively, and hotel comparable NOI decreased 0.6%. Comparable NOI increased 1.4% for the year ended January 31, 2012 compared to the prior year. Retail, residential and hotel comparable NOI increased 2.6%, 7.3%, and 0.1%, respectively, while office comparable NOI decreased 2.6%.
Capital Expenditures for our Operating Portfolio –Our diversified real estate portfolio requires certain capital expenditures, including tenant improvements, to maintain and improve its operating performance. During the year ended January 31, 2012 we invested $80,152,000 at pro-rata consolidation ($51,799,000 at full consolidation) in capital expenditures for our operating portfolio as compared to $84,020,000 at pro-rata consolidation ($69,984,000 at full consolidation) during the year ended January 31, 2011.
25
Forest City Enterprises, Inc. and Subsidiaries
Supplemental Operating Information
EBDT –We use an additional measure, along with net earnings, to report our operating results. This non-GAAP measure, referred to as EBDT, is not a measure of operating results or cash flows from operations as defined by GAAP and may not be directly comparable to similarly-titled measures reported by other companies.
We believe that EBDT provides additional information about our core operations and, along with net earnings, is necessary to understand our operating results. EBDT is used by the chief operating decision maker and management in assessing operating performance and to consider capital requirements and allocation of resources by segment and on a consolidated basis. We believe EBDT is important to investors because it provides another method for the investor to measure our long-term operating performance as net earnings can vary from year to year due to property dispositions, acquisitions and other factors that have a short-term impact.
EBDT is defined as net earnings excluding the following items: i) gain (loss) on disposition of rental properties, divisions and other investments (net of tax); ii) the adjustment to recognize rental revenues and rental expense using the straight-line method; iii) non-cash charges for real estate depreciation, amortization, and amortization of mortgage procurement costs; iv) deferred income taxes; v) preferred payment which is classified as noncontrolling interest expense on our Consolidated Statement of Operations; vi) impairment of real estate (net of tax); vii) extraordinary items (net of tax); viii) cumulative or retrospective effect of change in accounting principle (net of tax); and ix) revisions of prior period financial statements.
We reconcile EBDT to net earnings (loss), the most comparable financial measure calculated in accordance with GAAP. The adjustment to recognize rental revenues and rental expenses on the straight-line method is excluded because it is management’s opinion that rental revenues and expenses should be recognized when due from the tenants or due to the landlord. We exclude depreciation and amortization expense related to real estate operations from EBDT because we believe the values of our properties, in general, have appreciated over time in excess of their original cost. Deferred income taxes, which are the result of timing differences of certain income and expense items which are to be realized in a future year for federal income tax purposes, are excluded until the year in which they are reflected in our current tax provision. The impairment of real estate is excluded from EBDT because it varies from year to year based on factors unrelated to our overall financial performance and is related to the ultimate gain on dispositions of operating properties. Our EBDT may not be directly comparable to similarly-titled measures reported by other companies.
Effective during the year ended January 31, 2012, under the direction of the Company’s chief operating decision maker, EBDT which is provided in order to assess performance for the Real Estate Groups and The Nets was on a pre-tax basis. The Corporate Activity segment controls the tax strategies and evaluates results on a consolidated basis. As a result, beginning February 1, 2011, the Company no longer allocates income tax expense (benefit) to the Real Estate Groups or The Nets. In addition, based on the consolidated evaluation of income taxes, it was determined that EBDT would exclude all deferred income taxes instead of just those attributable to the Real Estate Groups.
Our EBDT for the three months ended January 31, 2012 increased by $15,676,000 or 36.3% to $58,825,000 from $43,149,000 for the three months ended January 31, 2011. The fluctuations in EBDT by Segment are as follows:
| | • | | Our Commercial and Residential Segments combined provided a pre-tax EBDT decrease of $14,351,000. This is primarily related to reduced EBDT from properties sold of $8,617,000, decreased income recognized from state and federal Historic Preservation and New Market tax credits of $7,826,000, decreased EBDT from the change in fair market value of derivatives between the comparable periods which were marked to market through interest expense of $4,706,000, reduced EBDT from new property openings of $3,037,000 primarily due to lease up losses atWestchester’s Ridge Hill andFoundry Loftspartially offset by the ramp up of other new property openings, decreased gains on early extinguishment of nonrecourse mortgage debt of $2,550,000, and increased operating expenses due to an unfavorable judgment from litigation atEasthaven at the Village arising from a building fire in 2007 of $2,400,000. These decreases in the portfolio were partially offset by decreased write-offs of abandoned development projects of $7,507,000, increased NOI on our mature portfolio of $6,459,000, and decreased interest expense on our mature portfolio of $5,427,000; |
| | • | | Our Land Segment provided a pre-tax EBDT increase of $2,700,000, primarily due to an increase in sales activity from the previous comparable quarter; |
| | • | | The Nets provided a pre-tax EBDT decrease of $11,533,000 due to the increase in our allocated losses; |
| | • | | Corporate pre-tax EBDT increased $34,497,000 primarily due to the nonrecurring 2010 loss on early extinguishment of debt on the exchange of a portion of our Senior Notes for Class A common stock of $31,689,000; and |
| | • | | EBDT was favorably impacted by a larger tax benefit of $4,363,000 compared to prior year. |
26
Forest City Enterprises, Inc. and Subsidiaries
Supplemental Operating Information
Our EBDT for the year ended January 31, 2012 increased by $24,509,000 or 7.9% to $334,384,000 from $309,875,000 for the year ended January 31, 2011. The fluctuations in EBDT by Segment are as follows:
| | • | | Our Commercial and Residential Segments combined provided a pre-tax EBDT increase of $26,320,000. This is primarily related to the 2011 sale of land and air rights to Rock Ohio of $42,622,000, increased gains on early extinguishment of nonrecourse mortgage debt of $11,483,000, decreased interest expense on our mature portfolio of $8,618,000, and increased NOI on our mature portfolio of $7,999,000. These increases in the portfolio were partially offset by reduced EBDT from properties sold of $27,057,000, reduced EBDT from new property openings of $5,138,000 primarily due to lease up losses at8 Spruce Street, Westchester’s Ridge Hill, Presidio Landmarkand Foundry Lofts and partially offset by the ramp up of other new property openings, and reduced EBDT from subsidized senior housing of $3,872,000 primarily due to the 2010 income from Housing and Urban Development (HUD) replacement reserve; |
| | • | | Our Land Segment provided a pre-tax EBDT increase of $6,698,000, partially due to the 2011 gain on early extinguishment of nonrecourse mortgage debt of $1,926,000. The remaining EBDT increase of $4,772,000 was from an increase in sales activity from the previous comparable period; |
| | • | | The Nets provided a pre-tax EBDT decrease of $46,176,000, primarily due to the nonrecurring 2010 gain on disposition of partial interest of $31,437,000. The remaining EBDT decrease is due to the increase in our allocated losses of $14,739,000; |
| | • | | Corporate pre-tax EBDT increased $14,262,000. This pre-tax EBDT increase is primarily due to decreased losses on early extinguishment of debt on exchanges of portions of our Senior Notes of $12,696,000; and |
| | • | | EBDT was favorably impacted by a larger tax benefit of $23,405,000 compared to prior year. |
27
Forest City Enterprises, Inc. and Subsidiaries
Supplemental Operating Information
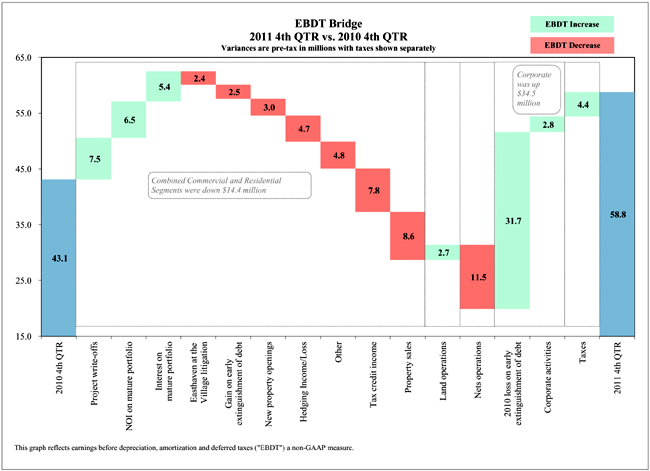
28
Forest City Enterprises, Inc. and Subsidiaries
Supplemental Operating Information
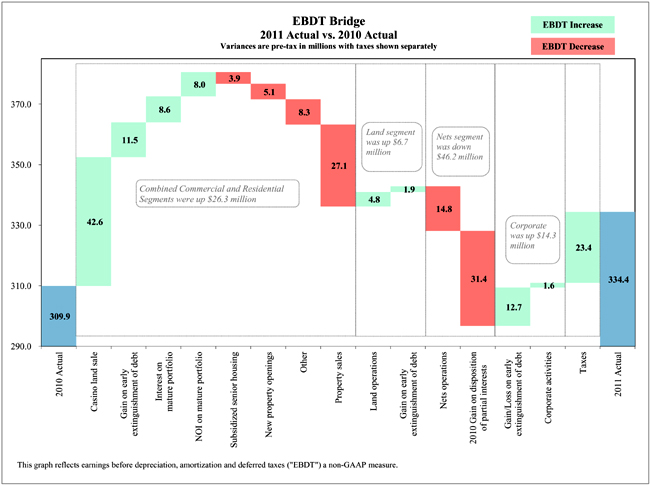
29
Forest City Enterprises, Inc. and Subsidiaries
Supplemental Operating Information
Summary of EBDT –The information in the following tables present amounts for both full consolidation and pro-rata consolidation, providing a reconciliation of the difference between the two methods, as well as a reconciliation from NOI to EBDT to net earnings (loss). Under the pro-rata consolidation method, we present our partnership investments proportionate to our pro-rata share for each line item of our consolidated financial statements. Under full consolidation, partnership assets and liabilities are reported as consolidated at 100% if deemed under our control or if we are deemed to be the primary beneficiary for investments in VIEs, or on the equity method of accounting if we do not have control or are not the primary beneficiary for investments in VIEs.
Reconciliation of Net Earnings (Loss) to Earnings Before Depreciation, Amortization and Deferred Taxes (EBDT)
| | | | | | | | | | | | | | | | |
| | | Three Months Ended January 31, | | | Years Ended January 31, | |
| | | | | | | | |
| | | 2012 | | | 2011 | | | 2012 | | | 2011 | |
| | | | | |
| | | (in thousands) | | | (in thousands) | |
Net earnings (loss) attributable to Forest City Enterprises, Inc. | | $ | (105,386 | ) | | $ | (1,833 | ) | | $ | (86,486 | ) | | $ | 58,048 | |
Depreciation and amortization – Real Estate Groups (4) | | | 72,642 | | | | 73,379 | | | | 281,704 | | | | 286,042 | |
Amortization of mortgage procurement costs – Real Estate Groups(4) | | | 3,571 | | | | 3,617 | | | | 14,670 | | | | 14,341 | |
Deferred income tax expense (benefit)(5) | | | (57,122 | ) | | | (3,490 | ) | | | (48,508 | ) | | | 54,522 | |
Remove non-Real Estate deferred taxes for 2010 only (5) | | | – | | | | (5,282 | ) | | | – | | | | (18,478 | ) |
| | | | |
Current income tax expense (benefit) on non-operating earnings:(5) | | | | | | | | | | | | | | | | |
Gain on disposition of rental properties and partial interest in rental properties | | | (935 | ) | | | 5,532 | | | | 38,244 | | | | 41,409 | |
Gain on disposition included in discontinued operations | | | 8,948 | | | | 5,000 | | | | 11,740 | | | | 4,902 | |
| | | | |
Straight-line rent adjustment(2) | | | (4,213 | ) | | | (7,913 | ) | | | (7,208 | ) | | | (18,160 | ) |
Preference payment(3) | | | (24 | ) | | | 585 | | | | 1,732 | | | | 2,341 | |
Impairment of consolidated real estate, net of noncontrolling interest | | | 113,561 | | | | – | | | | 119,081 | | | | 3,237 | |
Impairment of unconsolidated real estate | | | 40,897 | | | | 35,714 | | | | 82,186 | | | | 72,459 | |
Gain on disposition of rental properties and partial interest in rental properties | | | (2,255 | ) | | | – | | | | (17,665 | ) | | | (202,878 | ) |
Gain on disposition of unconsolidated entities | | | – | | | | (15,633 | ) | | | (12,567 | ) | | | (23,461 | ) |
Allowance for projects under development revision | | | 1,000 | | | | – | | | | (1,000 | ) | | | 1,000 | |
Discontinued operations:(1) | | | | | | | | | | | | | | | | |
Gain on disposition of rental properties | | | (11,859 | ) | | | (46,527 | ) | | | (133,554 | ) | | | (51,303 | ) |
Impairment of real estate | | | – | | | | – | | | | 10,257 | | | | 81,643 | |
Noncontrolling interest – Gain on disposition | | | – | | | | – | | | | 81,758 | | | | 4,211 | |
| | | | |
Earnings Before Depreciation, Amortization and Deferred Taxes (EBDT) | | $ | 58,825 | | | $ | 43,149 | | | $ | 334,384 | | | $ | 309,875 | |
| | | | |
|
| |
EBDT Per Share | | | | | | | | | | | | | | | | |
Numerator(in thousands): | | | | | | | | | | | | | | | | |
EBDT | | $ | 58,825 | | | $ | 43,149 | | | $ | 334,384 | | | $ | 309,875 | |
If-Converted Method (Pro forma numerator adjustment for interest, net of tax): | | | | | | | | | | | | | | | | |
3.625% Puttable Senior Notes due 2014 | | | 1,110 | | | | 1,110 | | | | 4,438 | | | | 4,438 | |
5% Convertible Senior Notes due 2016 | | | 382 | | | | 1,521 | | | | 1,867 | | | | 6,113 | |
4.25% Convertible Senior Notes due 2018 | | | 2,277 | | | | – | | | | 4,882 | | | | – | |
| | | | |
EBDT for per share data | | $ | 62,594 | | | $ | 45,780 | | | $ | 345,571 | | | $ | 320,426 | |
| | | | |
| | | | |
Denominator | | | | | | | | | | | | | | | | |
Weighted average shares outstanding – Basic | | | 169,157,392 | | | | 155,643,554 | | | | 168,170,650 | | | | 155,485,243 | |
Effect of stock options and restricted stock | | | 646,943 | | | | 803,779 | | | | 821,739 | | | | 550,730 | |
Effect of convertible preferred stock | | | 14,550,257 | | | | 14,550,257 | | | | 14,550,257 | | | | 13,115,165 | |
Effect of convertible debt | | | 33,499,503 | | | | 28,047,083 | | | | 26,838,208 | | | | 28,111,373 | |
Effect of convertible Class A Common Units | | | 3,646,755 | | | | 3,646,755 | | | | 3,646,755 | | | | 3,646,755 | |
| | | | |
Weighted average shares outstanding – Diluted | | | 221,500,850 | | | | 202,691,428 | | | | 214,027,609 | | | | 200,909,266 | |
| | | | |
EBDT Per Share | | $ | 0.28 | | | $ | 0.23 | | | $ | 1.61 | | | $ | 1.59 | |
| | | | | | | | | | | | | | | | | | | | |
EBDT Per Share | | | | | | | | | | | | | | | | | | | | |
Quarterly Historical Trends | | | Three Months Ended | |
| | | January 31, 2012 | | | October 31, 2011 | | | July 31, 2011 | | | April 30, 2011 | | | January 31, 2011 | |
Numerator(in thousands): | | | | | | | | | | | | | | | | | | | | |
EBDT | | $ | 58,825 | | | $ | 77,477 | | | $ | 70,706 | | | $ | 127,376 | | | $ | 43,149 | |
If-Converted Method (Pro forma numerator adjustment for interest, net of tax): | | | | | | | | | | | | | | | | | | | | |
3.625% Puttable Senior Notes due 2014 | | | 1,110 | | | | 1,110 | | | | 1,110 | | | | 1,110 | | | | 1,110 | |
5% Convertible Senior Notes due 2016 | | | 382 | | | | 382 | | | | 413 | | | | 688 | | | | 1,521 | |
4.25% Convertible Senior Notes due 2018 | | | 2,277 | | | | 2,277 | | | | 329 | | | | – | | | | – | |
EBDT for per share data | | $ | 62,594 | | | $ | 81,246 | | | $ | 72,558 | | | $ | 129,174 | | | $ | 45,780 | |
Denominator | | | | | | | | | | | | | | | | | | | | |
Weighted average shares outstanding – Basic | | | 169,157,392 | | | | 169,150,429 | | | | 168,788,754 | | | | 165,498,904 | | | | 155,643,554 | |
Effect of stock options and restricted stock | | | 646,943 | | | | 566,701 | | | | 1,019,210 | | | | 1,054,102 | | | | 803,779 | |
Effect of convertible preferred stock | | | 14,550,257 | | | | 14,550,257 | | | | 14,550,257 | | | | 14,550,257 | | | | 14,550,257 | |
Effect of convertible debt | | | 33,499,503 | | | | 33,499,503 | | | | 19,912,982 | | | | 20,225,204 | | | | 28,047,083 | |
Effect of convertible Class A Common Units | | | 3,646,755 | | | | 3,646,755 | | | | 3,646,755 | | | | 3,646,755 | | | | 3,646,755 | |
Weighted average shares outstanding -Diluted | | | 221,500,850 | | | | 221,413,645 | | | | 207,917,958 | | | | 204,975,222 | | | | 202,691,428 | |
EBDT Per Share | | $ | 0.28 | | | $ | 0.37 | | | $ | 0.35 | | | $ | 0.63 | | | $ | 0.23 | |
| | | | | |
30
Forest City Enterprises, Inc. and Subsidiaries
Supplemental Operating Information
Reconciliation of Net Earnings to Earnings Before Depreciation, Amortization and Deferred Taxes (EBDT)(continued)
| | (1) | All earnings of properties which have been sold or are held for sale are reported as discontinued operations assuming no significant continuing involvement. |
| | (2) | The Company recognizes minimum rents on a straight-line basis over the term of the related lease pursuant to accounting for leases. The straight-line rent adjustment is recorded as an increase or decrease to revenue or operating expense, with the applicable offset to either accounts receivable or accounts payable. |
| | (3) | The preference payment represents the respective period’s share of the annual preferred payment in connection with the issuance of Class A Common Units in exchange for Bruce C. Ratner’s noncontrolling interest in the Forest City Ratner Companies portfolio. |
| | (4) | The following table provides detail of depreciation and amortization and amortization of mortgage procurement costs presented in thousands. |
| | | | | | | | | | | | | | | | | | | | | | | | | | | | | | | | | | |
| | | Depreciation and Amortization | | | | | Amortization of Mortgage Procurement Costs | |
| | | Three Months Ended January 31, | | | Years Ended January 31, | | | | | Three Months Ended January 31, | | | Years Ended January 31, | |
| | | 2012 | | | 2011 | | | 2012 | | | 2011 | | | | | 2012 | | | 2011 | | | 2012 | | | 2011 | |
Full Consolidation | | $ | 53,850 | | | $ | 59,044 | | | $ | 218,601 | | | $ | 234,728 | | | | | $ | 2,797 | | | $ | 2,849 | | | $ | 11,812 | | | $ | 11,484 | |
Non-Real Estate | | | (847 | ) | | | (1,091 | ) | | | (3,247 | ) | | | (5,028 | ) | | | | | – | | | | – | | | | – | | | | – | |
Real Estate Groups Full Consolidation | | | 53,003 | | | | 57,953 | | | | 215,354 | | | | 229,700 | | | | | | 2,797 | | | | 2,849 | | | | 11,812 | | | | 11,484 | |
Real Estate Groups related to noncontrolling interest | | | (707 | ) | | | (1,575 | ) | | | (4,659 | ) | | | (6,384 | ) | | | | | (86 | ) | | | (117 | ) | | | (513 | ) | | | (444 | ) |
Real Estate Groups Unconsolidated | | | 20,131 | | | | 15,237 | | | | 67,855 | | | | 52,194 | | | | | | 858 | | | | 614 | | | | 3,015 | | | | 2,245 | |
Real Estate Groups Discontinued Operations | | | 215 | | | | 1,764 | | | | 3,154 | | | | 10,532 | | | | | | 2 | | | | 271 | | | | 356 | | | | 1,056 | |
Real Estate Groups Pro-Rata Consolidation | | $ | 72,642 | | | $ | 73,379 | | | $ | 281,704 | | | $ | 286,042 | | | | | $ | 3,571 | | | $ | 3,617 | | | $ | 14,670 | | | $ | 14,341 | |
| | (5) | The following table provides detail of Income Tax Expense (Benefit): |
| | | 0000000 | | | | 0000000 | | | | 0000000 | | | | 0000000 | |
| | | | | | | | |
| | | Three Months Ended January 31, | | | Years Ended January 31, | |
| | | | | | | | |
| | | 2012 | | | 2011 | | | 2012 | | | 2011 | |
| | | | | | | | |
| | | (in thousands) | | | (in thousands) | |
Current taxes | | | | | | | | | | | | | | | | |
Operating earnings | | $ | (10,405 | ) | | $ | (10,576 | ) | | $ | (47,544 | ) | | $ | (40,807 | ) |
Gain on disposition of rental properties and partial interest in rental properties | | | (935 | ) | | | 5,532 | | | | 38,244 | | | | 41,409 | |
| | | | | | | | |
Subtotal | | | (11,340 | ) | | | (5,044 | ) | | | (9,300 | ) | | | 602 | |
| | | | | | | | |
| | | | |
Discontinued operations | | | | | | | | | | | | | | | | |
Operating earnings | | | 46 | | | | (702 | ) | | | (601 | ) | | | (2,411 | ) |
Gain on disposition of rental properties and partial interest in rental properties | | | 8,948 | | | | 5,000 | | | | 11,740 | | | | 4,902 | |
| | | | | | | | |
Subtotal | | | 8,994 | | | | 4,298 | | | | 11,139 | | | | 2,491 | |
| | | | | | | | |
| | | | |
Total Current taxes | | | (2,346 | ) | | | (746 | ) | | | 1,839 | | | | 3,093 | |
| | | | | | | | |
| | | | |
Deferred taxes | | | | | | | | | | | | | | | | |
Continuing operations | | | (52,839 | ) | | | (18,310 | ) | | | (55,044 | ) | | | 69,524 | |
Discontinued operations | | | (4,283 | ) | | | 14,820 | | | | 6,536 | | | | (15,002 | ) |
| | | | | | | | |
| | | | |
Total Deferred taxes | | | (57,122 | ) | | | (3,490 | ) | | | (48,508 | ) | | | 54,522 | |
| | | | | | | | |
| | | | |
Grand Total | | $ | (59,468 | ) | | $ | (4,236 | ) | | $ | (46,669 | ) | | $ | 57,615 | |
| | | | | | | | |
| | | | |
2010 Recap of Grand Total: | | | | | | | | | | | | | | | | |
Real Estate Groups | | | | | | | | | | | | | | | | |
Current | | | $ | 2,629 | | | | | | | $ | 23,593 | |
Deferred | | | | (8,772 | ) | | | | | | | 36,044 | |
| | | | | | | | | | | | | | | | |
| | | | | | | (6,143 | ) | | | | | | | 59,637 | |
| | | | | | | | | | | | | | | | |
| | | | |
Non-Real Estate Groups | | | | | | | | | | | | | | | | |
Current | | | | (3,375 | ) | | | | | | | (20,500 | ) |
Deferred | | | | 5,282 | | | | | | | | 18,478 | |
| | | | | | | | | | | | | | | | |
| | | | | | | 1,907 | | | | | | | | (2,022 | ) |
| | | | | | | | | | | | | | | | |
| | | |
Grand Total | | | $ | (4,236 | ) | | | | | | $ | 57,615 | |
| | | | | | | | | | | | | | | | |
31
Forest City Enterprises, Inc. and Subsidiaries
Supplemental Operating Information
Schedule of Retail Lease Expirations as of January 31, 2012
| | | | | | | | | | | | | | | | | | | | | | | | |
EXPIRATION YEAR | | NUMBER OF
EXPIRING
LEASES | | | SQUARE FEET
OF EXPIRING
LEASES(3) | | | PERCENTAGE
OF TOTAL
LEASED
GLA (1) | | | NET BASE RENT
EXPIRING(2) | | | PERCENTAGE
OF TOTAL
BASE RENT | | | AVERAGE
BASE
RENT PER
SQUARE FEET
EXPIRING(3) | |
2012 | | | 275 | | | | 909,858 | | | | 7.05 % | | | $ | 18,848,095 | | | | 7.36 % | | | $ | 27.01 | |
2013 | | | 343 | | | | 1,254,649 | | | | 9.73 | | | | 26,797,228 | | | | 10.47 | | | | 26.94 | |
2014 | | | 292 | | | | 1,159,467 | | | | 8.99 | | | | 22,305,708 | | | | 8.72 | | | | 28.14 | |
2015 | | | 208 | | | | 836,163 | | | | 6.48 | | | | 18,776,849 | | | | 7.34 | | | | 29.59 | |
2016 | | | 270 | | | | 1,436,411 | | | | 11.14 | | | | 31,815,105 | | | | 12.43 | | | | 35.65 | |
2017 | | | 163 | | | | 1,151,190 | | | | 8.93 | | | | 22,727,546 | | | | 8.88 | | | | 26.49 | |
2018 | | | 160 | | | | 738,457 | | | | 5.72 | | | | 18,814,575 | | | | 7.35 | | | | 28.16 | |
2019 | | | 121 | | | | 1,056,906 | | | | 8.20 | | | | 20,306,946 | | | | 7.94 | | | | 25.13 | |
2020 | | | 107 | | | | 837,916 | | | | 6.50 | | | | 16,970,522 | | | | 6.63 | | | | 30.40 | |
2021 | | | 130 | | | | 1,323,344 | | | | 10.26 | | | | 26,225,658 | | | | 10.25 | | | | 30.15 | |
Thereafter | | | 74 | | | | 2,192,356 | | | | 17.00 | | | | 32,334,403 | | | | 12.63 | | | | 20.65 | |
| | | | | | | | |
Total | | | 2,143 | | | | 12,896,717 | | | | 100.00 % | | | $ | 255,922,635 | | | | 100.00 % | | | $ | 27.56 | |
| | | | | | | | |
| (1) | GLA = Gross Leasable Area. |
| (2) | Net base rent expiring is an operating statistic and is not comparable to rental revenue, a GAAP financial measure. The primary differences arise because net base rent is determined using the tenant’s contractual rental agreements at our ownership share of the base rental income from expiring leases as determined within the rent agreement and it does not include adjustments such as the impact of straight-line rent, amortization of intangible assets related to in-place leases, above and below market leases, and contingent rental payments (which are not reasonably estimable). |
| (3) | Square feet of expiring leases and average base rent per square feet are operating statistics that represent 100% of the square footage and base rental income per square foot from expiring leases. |
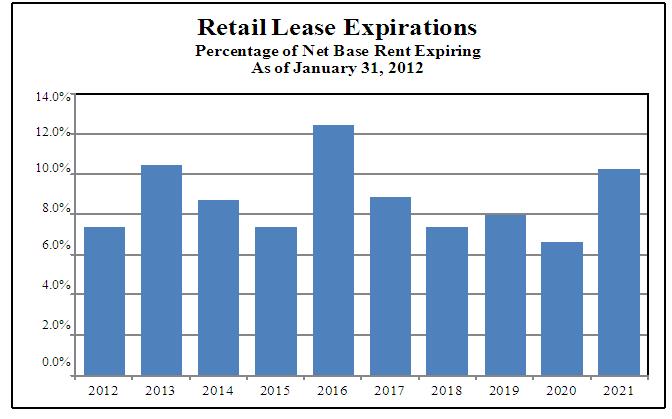
32
Forest City Enterprises, Inc. and Subsidiaries
Supplemental Operating Information
Schedule of Office Lease Expirations as of January 31, 2012
| | | | | | | | | | | | | | | | | | | | | | | | |
EXPIRATION YEAR | | NUMBER OF
EXPIRING
LEASES | | | SQUARE FEET
OF EXPIRING
LEASES(3) | | | PERCENTAGE
OF TOTAL
LEASED GLA (1) | | | NET BASE RENT
EXPIRING (2) | | | PERCENTAGE
OF TOTAL
BASE RENT | | | AVERAGE
BASE
RENT PER
SQUARE FEET
EXPIRING(3) | |
2012 | | | 102 | | | | 980,801 | | | | 8.77 % | | | $ | 25,144,510 | | | | 8.38 % | | | $ | 31.48 | |
2013 | | | 95 | | | | 1,136,706 | | | | 10.17 | | | | 25,084,388 | | | | 8.36 | | | | 22.73 | |
2014 | | | 73 | | | | 759,301 | | | | 6.79 | | | | 15,743,907 | | | | 5.25 | | | | 32.38 | |
2015 | | | 44 | | | | 461,184 | | | | 4.13 | | | | 8,850,686 | | | | 2.95 | | | | 22.16 | |
2016 | | | 61 | | | | 983,434 | | | | 8.80 | | | | 22,746,109 | | | | 7.58 | | | | 30.00 | |
2017 | | | 29 | | | | 464,444 | | | | 4.15 | | | | 11,097,049 | | | | 3.70 | | | | 25.66 | |
2018 | | | 27 | | | | 1,253,718 | | | | 11.21 | | | | 34,646,554 | | | | 11.54 | | | | 32.07 | |
2019 | | | 25 | | | | 896,768 | | | | 8.02 | | | | 16,013,570 | | | | 5.34 | | | | 25.11 | |
2020 | | | 14 | | | | 1,044,824 | | | | 9.34 | | | | 27,856,087 | | | | 9.28 | | | | 33.06 | |
2021 | | | 11 | | | | 663,981 | | | | 5.94 | | | | 10,389,551 | | | | 3.46 | | | | 20.42 | |
Thereafter | | | 35 | | | | 2,535,635 | | | | 22.68 | | | | 102,502,355 | | | | 34.16 | | | | 42.08 | |
| | | | | | | | |
Total | | | 516 | | | | 11,180,796 | | | | 100.00 % | | | $ | 300,074,766 | | | | 100.00% | | | $ | 31.34 | |
| | | | | | | | |
| (1) | GLA = Gross Leasable Area. |
| (2) | Net base rent expiring is an operating statistic and is not comparable to rental revenue, a GAAP financial measure. The primary differences arise because net base rent is determined using the tenant’s contractual rental agreements at our ownership share of the base rental income from expiring leases as determined within the rent agreement and it does not include adjustments such as the impact of straight-line rent, amortization of intangible assets related to in-place leases, above and below market leases, and contingent rental payments (which are not reasonably estimable). |
| (3) | Square feet of expiring leases and average base rent per square feet are operating statistics that represent 100% of the square footage and base rental income per square foot from expiring leases. |
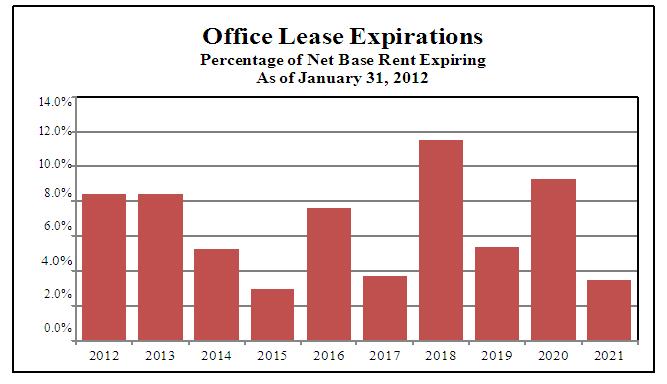
33
Forest City Enterprises, Inc. and Subsidiaries
Supplemental Operating Information
Schedule of Significant Retail Tenants as of January 31, 2012
(Based on net base rent 1% or greater of the Company’s ownership share)
| | | | | | | | | | | | |
| TENANT | | NUMBER OF
LEASES | | | LEASED
SQUARE
FEET | | | PERCENTAGE OF
TOTAL RETAIL
SQUARE FEET | |
Bass Pro Shops, Inc. | | | 3 | | | | 510,855 | | | | 3.96 % | |
Regal Entertainment Group | | | 5 | | | | 381,461 | | | | 2.96 | |
AMC Entertainment, Inc. | | | 5 | | | | 377,797 | | | | 2.93 | |
TJX Companies | | | 11 | | | | 347,457 | | | | 2.70 | |
The Gap | | | 27 | | | | 344,944 | | | | 2.67 | |
Dick’s Sporting Goods | | | 6 | | | | 326,866 | | | | 2.53 | |
Best Buy | | | 7 | | | | 208,977 | | | | 1.62 | |
Abercrombie & Fitch Stores, Inc. | | | 27 | | | | 194,549 | | | | 1.51 | |
The Limited | | | 31 | | | | 192,602 | | | | 1.49 | |
H&M Hennes & Mauritz AB | | | 8 | | | | 141,507 | | | | 1.10 | |
Footlocker, Inc. | | | 34 | | | | 131,878 | | | | 1.02 | |
Forever 21, Inc. | | | 8 | | | | 112,661 | | | | 0.87 | |
American Eagle Outfitters, Inc. | | | 15 | | | | 85,972 | | | | 0.67 | |
| | | | |
| | | |
Subtotal | | | 187 | | | | 3,357,526 | | | | 26.03 | |
| | | | |
| | | |
All Others | | | 1,956 | | | | 9,539,191 | | | | 73.97 | |
| | | | |
| | | |
Total | | | 2,143 | | | | 12,896,717 | | | | 100.00 % | |
| | | | |
34
Forest City Enterprises, Inc. and Subsidiaries
Supplemental Operating Information
Schedule of Significant Office Tenants as of January 31, 2012
(Based on net base rent 2% or greater of the Company’s ownership share)
| | | | | | | | |
| TENANT | | LEASED
SQUARE FEET | | | PERCENTAGE OF
TOTAL OFFICE
SQUARE FEET | |
City of New York | | | 1,046,101 | | | | 9.36 % | |
Millennium Pharmaceuticals, Inc. | | | 698,066 | | | | 6.24 | |
U.S. Government | | | 670,925 | | | | 6.00 | |
WellPoint, Inc. | | | 392,514 | | | | 3.51 | |
JP Morgan Chase & Co. | | | 383,341 | | | | 3.43 | |
Morgan Stanley & Co. | | | 377,304 | | | | 3.37 | |
Forest City Enterprises, Inc.(1) | | | 358,310 | | | | 3.20 | |
Bank of New York | | | 323,043 | | | | 2.89 | |
National Grid | | | 254,034 | | | | 2.27 | |
Clearbridge Advisors, LLC, a Legg Mason Company | | | 193,249 | | | | 1.73 | |
Covington & Burling, LLP | | | 160,565 | | | | 1.44 | |
Seyfarth Shaw, LLP | | | 96,909 | | | | 0.87 | |
| | | | |
| | |
Subtotal | | | 4,954,361 | | | | 44.31 | |
| | | | |
| | |
All Others | | | 6,226,435 | | | | 55.69 | |
| | | | |
| | |
Total | | | 11,180,796 | | | | 100.00 % | |
| | | | |
| | (1) | All intercompany rental income is eliminated in consolidation. |
35
(THIS PAGE INTENTIONALLY LEFT BLANK)
Forest City Enterprises, Inc. and Subsidiaries
Supplemental Operating Information
Openings and Acquisitions
as of January 31, 2012
| | | | | | | | | | | | | | | | | | | | | | | | | | | | | | | | | | | | | | | | |
| Property | | Location | | Dev (D)
Acq (A) | | | Date Opened / Acquired | | FCE Legal Ownership % (a) | | | Pro-Rata FCE % (a)
(1) | | | Cost at Full Consolidation (GAAP) (b) | | | Total Cost
at 100%
(2) | | | Cost at FCE Pro-Rata Share (Non-GAAP) (c) (1) X (2) | | | Sq. ft./ No. of Units | | | Gross Leasable Area | | | Lease Commitment % | |
2011 (3) | | | | | | | | | | | | | | | | | | | (in millions) | | | | | | | | | | | | | |
| | | | | | | | | | | |
Retail Centers: (m) | | | | | | | | | | | | | | | | | | | | | | | | | | | | | | | | | | | | | | | | |
Westchester’s Ridge Hill (e) | | Yonkers, NY | | | D | | | Q2-11/12 | | | 70.0 | % | | | 100.0 | % | | $ | 868.2 | | | $ | 868.2 | | | $ | 868.2 | | | | 1,336,000 | (d) | | | 1,336,000 | | | | 59 | % |
| | | | | | | | | | | | | | | | | | | | | | | | | | | | | | | | |
| | | | | | | | | | | |
Residential: (m) | | | | | | | | | | | | | | | | | | | | | | | | | | | | | | | | | | | | | | | | |
8 Spruce Street (f) (g) | | Manhattan, NY | | | D | | | Q1-11/12 | | | 35.7 | % | | | 51.0 | % | | $ | 0.0 | | | $ | 875.7 | | | $ | 446.6 | | | | 899 | | | | | | | | 73 | % |
Foundry Lofts | | Washington, D.C. | | | D | | | Q4-11 | | | 100.0 | % | | | 100.0 | % | | | 61.4 | | | | 61.4 | | | | 61.4 | | | | 170 | | | | | | | | 79 | % |
| | | | | | | | | | | | | | | | | | | | | | | | | | | | |
| | | | | | | | | | | | | | | | | | $ | 61.4 | | | $ | 937.1 | | | $ | 508.0 | | | | 1,069 | | | | | | | | | |
| | | | | | | | | | | | | | | | | | | | | | | | | | | | | | | | |
Total 2011 (h) | | | | | | | | | | | | | | | | | | $ | 929.6 | | | $ | 1,805.3 | | | $ | 1,376.2 | | | | | | | | | | | | | |
| | | | | | | | | | | | | | | | | | | | | | | | | | | | | | | | | | | | | | | | |
| | | | | | | | | | | | | | | | | | | | | | | | | | | | | | | | | | | | | | | | | |
Prior Two Years Openings (7) as of January 31, 2012 | | | | | | | | | | | | | | | | | | | | | | | | | | | | | | | | | | | | | | | | |
Retail Centers:(i) | | | | | | | | | | | | | | | | | | | | | | | | | | | | | | | | | | | | | | | | |
Village at Gulfstream Park (g) (j) | | Hallandale
Beach, FL | | | D | | | Q1-10 | | | 50.0 | % | | | 50.0 | % | | $ | 0.0 | | | $ | 139.2 | | | $ | 69.6 | | | | 511,000 | | | | 511,000 | | | | 76 | % |
East River Plaza (g) | | Manhattan, NY | | | D | | | Q4-09/Q2-10 | | | 35.0 | % | | | 50.0 | % | | | 0.0 | | | | 390.6 | | | | 195.3 | | | | 527,000 | | | | 527,000 | | | | 94 | % |
Promenade in Temecula Expansion | | Temecula, CA | | | D | | | Q1-09 | | | 75.0 | % | | | 100.0 | % | | | 113.4 | | | | 113.4 | | | | 113.4 | | | | 127,000 | | | | 127,000 | | | | 91 | % |
| | | | | | | | | | | | | | | | | | | | | | | | | | | | |
| | | | | | | | | | | | | | | | | | $ | 113.4 | | | $ | 643.2 | | | $ | 378.3 | | | | 1,165,000 | | | | 1,165,000 | | | | | |
| | | | | | | | | | | | | | | | | | | | | | | | | | | | | | | | |
Office: | | | | | | | | | | | | | | | | | | | | | | | | | | | | | | | | | | | | | | | | |
Waterfront Station | | | | | | | | | | | | | | | | | | | | | | | | | | | | | | | | | | | | | | | | |
–East 4th & West 4th Bldgs (Sold Q2-11) (k) | | Washington, D.C. | | | D | | | Q1-10 | | | 45.0 | % | | | 45.0 | % | | $ | 245.9 | | | $ | 245.9 | | | $ | 110.7 | | | | 631,000 | | | | | | | | 99 | % |
| | | | | | | | | | | | | | | | | | | | | | | | | | | | | | | | |
Residential: (i) | | | | | | | | | | | | | | | | | | | | | | | | | | | | | | | | | | | |
Presidio Landmark | | San Francisco,
CA | | | D | | | Q3-10 | | | 100.0 | % | | | 100.0 | % | | $ | 96.6 | | | $ | 96.6 | | | $ | 96.6 | | | | 161 | | | | | | | | 89 | % |
North Church Towers | | Parma Heights,
OH | | | A | | | Q3-09 | | | 100.0 | % | | | 100.0 | % | | | 5.2 | | | | 5.2 | | | | 5.2 | | | | 399 | | | | | | | | 92 | % |
DKLB BKLN (g) | | Brooklyn, NY | | | D | | | Q4-09/Q2-10 | | | 40.8 | % | | | 51.0 | % | | | 0.0 | | | | 160.0 | | | | 81.6 | | | | 365 | | | | | | | | 99 | % |
| | | | | | | | | | | | | | | | | | | | | | | | | | | | |
| | | | | | | | | | | | | | | | | | $ | 101.8 | | | $ | 261.8 | | | $ | 183.4 | | | | 925 | | | | | | | | | |
| | | | | | | | | | | | | | | | | | | | | | | | | | | | | | | | |
Total Prior Two Years Openings (l) | | | | | | | | | | | | | | | | $ | 461.1 | | | $ | 1,150.9 | | | $ | 672.4 | | | | | | | | | | | | | |
| | | | | | | | | | | | | | | | | | | | | | | | | | | |
Recap of Total Prior Two Years Openings | | | | | | | | | | | | | | | | | | | | | | | | | | | | | | | | | | | | | | |
Total 2010 | | | | | | | | | | | | | | | | $ | 342.5 | | | $ | 872.3 | | | $ | 472.2 | | | | | | | | | | | | | |
Total 2009 | | | | | | | | | | | | | | | | | 118.6 | | | | 278.6 | | | | 200.2 | | | | | | | | | | | | | |
| | | | | | | | | | | | | | | | | | | | | | | | | | | | | | |
Total Prior Two Years Openings (l) | | | | | | | | | | | | | | | | $ | 461.1 | | | $ | 1,150.9 | | | $ | 672.4 | | | | | | | | | | | | | |
| | | | | | | | | | | | | | | | | |
See footnotes on the following pages.
36
Forest City Enterprises, Inc. and Subsidiaries
Supplemental Operating Information
Projects Under Construction (6)
as of January 31, 2012
| | | | | | | | | | | | | | | | | | | | | | | | | | | | | | | | | | | | | | | | | | |
| Property | | Location | | Anticipated Opening | | | FCE Legal Ownership % (a) | | | | | Pro-Rata FCE % (a)
(1) | | | | | Cost at Full Consolidation (GAAP) (b) | | | Total Cost at 100% (2) | | | Cost at FCE Pro-Rata Share (Non-GAAP) (c) (1) X (2) | | | Sq. ft./ No. of Units | | | Gross Leasable Area | | | Lease Commitment % | |
| | | | | | | | | | | | | | | | | | | | | (in millions) | | | | | | | | | | | | | |
Retail Centers:(m) | | | | | | | | | | | | | | | | | | | | | | | | | | | | | | | | | | | | | | | | | | |
The Yards-Boilermaker Shops | | Washington, D.C. | | | Q3-12 | | | | 100.0 | % | | | | | 100.0 | % | | | | $ | 19.2 | | | $ | 19.2 | | | $ | 19.2 | | | | 40,000 | | | | 40,000 | | | | 74 | % |
| | | | | | | | | | | | | | | | | | | | | | | | | | | | | | | | | | |
| | | | | | | | | | | | |
Office: | | | | | | | | | | | | | | | | | | | | | | | | | | | | | | | | | | | | | | | | | | |
Johns Hopkins Parking Garage | | Baltimore, MD | | | Q3-12 | | | | 85.0 | % | | | | | 100.0 | % | | | | $ | 30.1 | | | $ | 30.1 | | | $ | 30.1 | | | | 492,000 | | | | | | | | | |
| | | | | | | | | | | | | | | | | | | | | | | | | | | | | | | | | | |
| | | | | | | | | | | | |
Residential: | | | | | | | | | | | | | | | | | | | | | | | | | | | | | | | | | | | | | | | | | | |
The Aster Town Center (formerly Novella) | | Denver, CO | | | Q1-12 | | | | 90.0 | % | | | | | 90.0 | % | | | | $ | 10.9 | | | $ | 10.9 | | | $ | 9.8 | | | | 85 | | | | | | | | | |
Botanica Eastbridge | | Denver, CO | | | Q2-12 | | | | 90.0 | % | | | | | 90.0 | % | | | | | 15.4 | | | | 15.4 | | | | 13.9 | | | | 118 | | | | | | | | | |
Continental Building | | Dallas, TX | | | Q1-13 | | | | 100.0 | % | | | | | 100.0 | % | | | | | 54.3 | | | | 54.3 | | | | 54.3 | | | | 203 | | | | | | | | | |
| | | | | | | | | | | | | | | | | | | | | | | | | | | | | | | | | | |
| | | | | | | | | | | | | | | | | | | | $ | 80.6 | | | $ | 80.6 | | | $ | 78.0 | | | | 406 | | | | | | | | | |
| | | | | | | | | | | | | | | | | | | | | | | | | | | | | | | | | | |
| | | | | | | | | | | | |
Arena: | | | | | | | | | | | | | | | | | | | | | | | | | | | | | | | | | | | | | | | | | | |
Barclays Center | | Brooklyn, NY | | | Q3-12 | | | | 34.0 | % | | | | | 34.0 | % | | | | $ | 904.3 | | | $ | 904.3 | | | $ | 307.5 | | | | 670,000 | | | | 18,000 seats | (o) | | | 64 | %(p) |
| | | | | | | | | | | | | | | | | | | | | | | | | | | | | | | | | | |
Total Under Construction (n) | | | | | | | | | | | | | | | | | | | | $ | 1,034.2 | | | $ | 1,034.2 | | | $ | 434.8 | | | | | | | | | | | | | |
| | | | | | | | | | | | | | | | | | | | | | | | | | | | | | | | | | |
| | | | | | | | | | | | |
Fee Development Projects (2) | | | | | | | | | | | | | | | | | | | | | | | | | | | | | | | | | | | | | | | | | | |
Las Vegas City Hall | | Las Vegas, NV | | | Q1-12 | | | | - | | | (q) | | | - | | | (q) | | $ | 0.0 | | | $ | 146.2 | | | $ | 0.0 | | | | 270,000 | | | | | | | | | |
Dept. of Health & Mental Hygiene (DHMH) | | Baltimore, MD | | | Q2-14 | | | | - | | | (q) | | | - | | | (q) | | | 0.0 | | | | 135.0 | | | | 0.0 | | | | 234,000 | | | | | | | | | |
| | | | | | | | | | | | | | | | | | | | | | | | | | | | | | |
| | | | | | | | | | | | |
| | | | | | | | | | | | | | | | | | | | $ | 0.0 | | | $ | 281.2 | | | $ | 0.0 | | | | 504,000 | | | | | | | | | |
| | | | | | | | | | | | | | | | | | | | | | | | | | | | | | |
FOOTNOTES
| | (a) | As is customary within the real estate industry, the Company invests in certain real estate projects through joint ventures. For some of these projects, the Company provides funding at percentages that differ from the Company’s legal ownership. |
| | (b) | Amounts are presented on the full consolidation method of accounting, a GAAP measure. Under full consolidation, costs are reported as consolidated at 100 percent if we are deemed to have control or to be the primary beneficiary of our investments in the variable interest entity (“VIE”). |
| | (c) | Cost at pro-rata share represents Forest City’s share of cost, based on the Company’s pro-rata ownership of each property (a non-GAAP measure). Under the pro-rata consolidation method of accounting the Company determines its pro-rata share by multiplying its pro-rata ownership by the total cost of the applicable property. |
| | (d) | Includes 156,000 square feet of office space. |
| | (e) | Phased-in opening. Costs are representative of the total project cost, including 432,000 square feet opened as of March 12, 2012. As of January 31, 2012, $270.0 million of costs incurred at pro-rata consolidation and $157.2 million of mortgage debt at pro-rata consolidation were transferred to completed rental properties. As of January 31, 2012, projects under construction include $567.9 million of costs incurred at pro-rata consolidation and $330.6 million of mortgage debt at pro-rata consolidation. |
| | (f) | Phased-in opening. Costs are representative of the total project cost, including 787 units opened as of March 12, 2012. As of January 31, 2012, $351.9 million of costs incurred at pro-rata consolidation and $218.2 million of mortgage debt at pro-rata consolidation were transferred to completed rental properties. As of January 31, 2012, projects under construction include $91.5 million of costs incurred at pro-rata consolidation and $56.7 million of mortgage debt at pro-rata consolidation. As of March 12, 2012, 655 leases have been signed, representing 73% of the total 899 units after construction is complete. |
| | (g) | Reported under the equity method of accounting. This method represents a GAAP measure for investments in which the Company is not deemed to have control or to be the primary beneficiary of our investments in a VIE. |
| | (h) | The difference between the full consolidation cost amount (GAAP) of $929.6 million to the Company’s pro-rata share (a non-GAAP measure) of $1,376.2 million consists of the addition of its share of cost for unconsolidated investments of $446.6 million. |
37
Forest City Enterprises, Inc. and Subsidiaries
Supplemental Operating Information
FOOTNOTES (continued)
| | (i) | The lease percentage represents occupancy as of March 12, 2012. |
| | (j) | Costs reflect the impairment charge of $35.0 million recorded during the three months ended January 31, 2011 and the additional impairment charge of $34.6 million recorded during the three months ended October 31, 2011. |
| | (k) | Property was sold on May 10, 2011 and was 99% leased at time of sale. |
| | (l) | The difference between the full consolidation cost amount (GAAP) of $461.1 million to the Company’s pro-rata share (a non-GAAP measure) of $672.4 million consists of a reduction to full consolidation for noncontrolling interest of $135.2 million of cost and the addition of its share of cost for unconsolidated investments of $346.5 million. |
| | (m) | Updated lease commitments as of March 12, 2012. |
| | (n) | The difference between the full consolidation cost amount (GAAP) of $1,034.2 million to the Company’s pro-rata share (a non-GAAP measure) of $434.8 million consists of a reduction to full consolidation for noncontrolling interest of $599.4 million of cost. |
| | (o) | The Nets, a member of the NBA, has a 37 year license agreement to use the arena. |
| | (p) | Represents the percentage of forecasted contractually obligated arena income that is under contract. Contractually obligated income, which includes revenue from naming rights, sponsorships, suite licenses, Nets minimum rent and food concession agreements, accounts for 72% of total forecasted revenues for the arena. |
| | (q) | These are fee development projects. Therefore, these costs are not included on the full consolidation or pro-rata balance sheet. In March 2012, the Las Vegas City Hall, which we developed for the City of Las Vegas on a fee basis as part of a public-private partnership, was completed. |
Equity Requirements for Projects Under Construction(a)
as of January 31, 2012
| | | | | | | | | | | | | | | | | | | | | | | | |
| | | 100% | | | Less Unconsolidated Investments at 100% | | | Full Consolidation (GAAP)(b) | | | Less Noncontrolling Interest | | | Plus Unconsolidated Investments at Pro-Rata | | | Pro-Rata Consolidation (Non-GAAP) (c) | |
| | | | |
| | | (dollars in millions) | |
Total Cost Under Construction | | $ | 1,034.2 | | | $ | – | | | $ | 1,034.2 | | | $ | 599.4 | | | $ | – | | | $ | 434.8 | |
Total Loan Draws and Other Sources at Completion(d) | | | 620.7 | | | | – | | | | 620.7 | | | | 376.6 | | | | – | | | | 244.1 | |
| | | | |
Net Equity at Completion | | | 413.5 | | | | – | | | | 413.5 | | | | 222.8 | | | | – | | | | 190.7 | |
| | | | |
| | | | | | |
Net Costs Incurred to Date | | | 657.0 | | | | – | | | | 657.0 | | | | 392.7 | | | | – | | | | 264.3 | |
Loan Draws and Other Sources to Date | | | 272.0 | | | | – | | | | 272.0 | | | | 169.9 | | | | – | | | | 102.1 | |
| | | | |
Net Equity to Date | | | 385.0 | | | | – | | | | 385.0 | | | | 222.8 | | | | – | | | | 162.2 | |
| | | | |
| | | | | | |
% of Total Equity | | | 93% | | | | | | | | 93% | | | | | | | | | | | | 85% | |
| | | | | | |
Remaining Costs | | | 377.2 | | | | – | | | | 377.2 | | | | 206.7 | | | | – | | | | 170.5 | |
Remaining Loan Draws and Other Sources | | | 348.7 | | | | – | | | | 348.7 | | | | 206.7 | | | | – | | | | 142.0 | |
| | | | |
Remaining Equity | | $ | 28.5 | | | $ | – | | | $ | 28.5 | | | $ | – | | | $ | – | | | $ | 28.5 | |
| | | | |
| | | | | | |
% of Total Equity | | | 7% | | | | | | | | 7% | | | | | | | | | | | | 15% | |
| | (a) | This schedule includes only the six projects under construction listed on the previous page. This does not include costs associated with phased-in units, operating property renovations and military housing. |
| | (b) | Amounts are presented on the full consolidation method of accounting, a GAAP measure. Under full consolidation, costs are reported as consolidated at 100 percent if we are deemed to have control or to be the primary beneficiary of our investments in the variable interest entity (“VIE”). |
| | (c) | Cost at pro-rata share represents Forest City’s share of cost, based on the Company’s pro-rata ownership of each property (a non-GAAP measure). Under the pro-rata consolidation method of accounting the Company determines its pro-rata share by multiplying its pro-rata ownership by the total cost of the applicable property. |
| | (d) | “Other Sources” includes estimates of third party subsidies and tax credit proceeds. The timing and the amounts may differ from our estimates. |
38
Forest City Enterprises, Inc. and Subsidiaries
Supplemental Operating Information
Projects Under Development
as of January 31, 2012
Below is a summary of our active large scale development projects, which have yet to commence construction, often referred to as our “shadow pipeline” which are crucial to our long-term growth. While we cannot make any assurances on the timing or delivery of these projects, our track record speaks to our ability to bring large, complex projects to fruition when there is demand and available construction financing. The projects listed below represent pro-rata costs of $769.0 million ($965.1 million at full consolidation) of Projects Under Development (“PUD”) on our balance sheet and pro-rata mortgage debt of $194.6 million ($260.6 million at full consolidation).
1) Atlantic Yards –Brooklyn, NY
Atlantic Yards is adjacent to the state-of-the-art arena, Barclays Center, which was designed by the award-winning firms Ellerbe Becket and SHoP Architects and is currently under construction. Atlantic Yards is expected to feature more than 6,400 units of housing, including over 2,200 affordable units, approximately 250,000 square feet of retail space, and more than 8 acres of landscaped open space.
2) LiveWork Las Vegas –Las Vegas, NV
LiveWork Las Vegas is a mixed-use project on a 13.5 acre parcel in downtown Las Vegas. At full build-out, the project will have the new 260,000 square-foot City Hall and is also expected to include up to 1 million square feet of office space and approximately 300,000 square feet of retail. The City Hall is owned by the city of Las Vegas which held its dedication ceremony on March 5, 2012.
3) The Yards –Washington, D.C.
The Yards is a 42 acre mixed-use project, located in the neighborhood of the Washington Nationals baseball park in the Capitol Riverfront District. The full project is expected to include up to 2,700 residential units, 1.8 million square feet of office space, and 300,000 square feet of retail and dining space. The Yards features a 5.5 acre publicly funded public park that is a gathering place and recreational focus for the community. The first residential building, Foundry Lofts, opened in November 2011. Two restaurants in the building, Potbelly Sandwich and Kruba Thai & Sushi, are on track for spring 2012 openings.
4) The Science + Technology Park at Johns Hopkins –Baltimore, MD
The 31 acre Science + Technology Park at Johns Hopkins is a new center for collaborative research directly adjacent to the world-renowned Johns Hopkins medical and research complex. Initial plans call for 1.1 million square feet in five buildings, with future phases that could support additional expansion. In 2008, the Company opened the first of those buildings, 855 North Wolfe Street, a 279,000 square-foot office building anchored by the Johns Hopkins School of Medicine’s Institute for Basic Biomedical Sciences. Construction of a 492,000 square-foot parking garage at 901 N. Washington Street is currently underway and will provide approximately 1,450 parking spaces for Johns Hopkins and the active buildings at the Science + Technology Park when it is completed in Q3-12. Construction of a second commercial building totaling 234,000 square-feet commenced in January 2012. The new building is being developed on a fee basis and will be fully leased to the Department of Health & Mental Hygiene (DHMH) when it is expected to open in Q2-14.
5) Colorado Science + Technology Park at Fitzsimons –Aurora, CO
The 184 acre Colorado Science + Technology Park at Fitzsimons is becoming a hub for the biotechnology industry in the Rocky Mountain region. Anchored by the University of Colorado at Denver Health Science Center, the University of Colorado Hospital and The Denver Children’s Hospital, the park will offer cost-effective lease rates, build-to-suit office and research sites, and flexible lab and office layouts in a cutting-edge research park. The park is also adjacent to Forest City’s 4,700 acre Stapleton mixed-used development.
6) Waterfront Station –Washington, D.C.
Located in Southwest Washington, D.C., Waterfront Station is adjacent to the Waterfront/Southeastern University MetroRail station. Waterfront Station is expected to include 660,000 square feet of office space, an estimated 400 residential units and 40,000 square feet of stores and restaurants.
7) 300 Massachusetts Avenue – Cambridge, MA
Located in the science and technology hub of Cambridge, MA, the 300 Massachusetts Avenue block represents an expansion of University Park @ MIT. In a 50/50 partnership with MIT, Forest City is presently focused on a project that reflects a development program of approximately 260,000 square feet of lab and office space. Potential redevelopment of the entire block is possible with the acquisition of adjacent parcels in future phases, and would result in an approximately 400,000 square foot project.
39
Forest City Enterprises, Inc. and Subsidiaries
Supplemental Operating Information
Military Housing
as of January 31, 2012
Below is a summary of our Military Housing development projects. The Company provides development, construction and management services for these projects and receives agreed upon fees for these services. The following phases still have a percentage of units opened and under construction:
| | | | | | | | | | | | | | | | | | | | |
| Property | | Location | | Opening/ Anticipated
Opening | | | FCE
Pro-Rata % | | Cost at Full
Consolidation | | | Total Cost
at 100% | | | No. of Units | |
| | | | | | | | | | (in millions) | | | | |
Military Housing- Recent Openings (6) | | | | | | | | | | | | | | | | | | | | |
Navy, Hawaii Increment III | | Honolulu, HI | | | 2007-Q1-11 | | | * | | $ | 0.0 | | | $ | 443.1 | | | | 2,520 | |
Marines, Hawaii Increment II | | Honolulu, HI | | | 2007-Q2-11 | | | * | | | 0.0 | | | | 289.1 | | | | 1,175 | |
Navy Midwest | | Chicago, IL | | | 2006-Q4-11 | | | * | | | 0.0 | | | | 200.3 | | | | 1,401 | |
Air Force Academy | | Colorado Springs, CO | | | 2007-Q4-11 | | | 50.0% | | | 0.0 | | | | 69.5 | | | | 427 | |
Pacific Northwest Communities | | Seattle, WA | | | 2007-Q4-11 | | | * | | | 0.0 | | | | 280.5 | | | | 2,985 | |
Midwest Millington | | Memphis, TN | | | 2008-Q4-11 | | | * | | | 0.0 | | | | 33.1 | | | | 318 | |
| | | | | | | | | | | | |
Total Recent Openings | | | | | | | | | | $ | 0.0 | | | $ | 1,315.6 | | | | 8,826 | |
| | | | | | |
Military Housing -Under Construction (5) | | | | | | | | | | | | | | | | | | | | |
Hawaii Phase IV | | Kaneohe, HI | | | 2007-2014 | | | * | | $ | 0.0 | | | $ | 476.7 | | | | 1,141 | |
Air Force – Southern Group: | | | | | | | | | | | | | | | | | | | | |
Keesler Air Force Base | | Biloxi, MS | | | 2011-2012 | | | 0.0% | | | 0.0 | | | | 5.0 | | | | 1,188 | |
Joint Base Charleston | | Charleston, SC | | | 2011-2013 | | | 0.0% | | | 0.0 | | | | 72.0 | | | | 345 | |
Arnold Air Force Base | | Tullahoma, TN | | | 2011-2013 | | | 0.0% | | | 0.0 | | | | 10.1 | | | | 22 | |
Shaw Air Force Base | | Sumter, SC | | | 2011-2015 | | | 0.0% | | | 0.0 | | | | 156.5 | | | | 630 | |
| | | | | | | | | | | | |
Subtotal Air Force – Southern Group | | | | | | | | | | $ | 0.0 | | | $ | 243.6 | | | | 2,185 | |
| | | | | | |
Total Under Construction | | | | | | | | | | $ | 0.0 | | | $ | 720.3 | | | | 3,326 | |
| | | | | | | | | | | | |
| * | The Company’s share of residual cash flow ranges from 0-20% during the life cycle of the project. |
Commitment Executed
Air Force – Southern Group was awarded on August 30, 2010. This project is expected to include 2,185 end state units at four Air Force bases in Sumter, SC, Tullahoma, TN, Charleston, SC and Biloxi, MS. There are 330 financially excluded units that will not be encumbered by debt and which may be removed from the end state at the sole discretion of the Air Force. The financial closing of the project was executed on September 30, 2011 with property management and construction beginning on October 1, 2011.
Summary of Military Housing Net Operating Income (14,104 end-state units)
Development fees related to our military housing projects are earned based on a contractual percentage of the actual development costs incurred. We also recognize additional development incentive fees upon successful completion of certain criteria, such as incentives to realize development cost savings, encourage small and local business participation, comply with specified safety standards and other project management incentives as specified in the development agreements. NOI from development and development incentive fees was $1,390,000 and $5,615,000 for the three months and year ended January 31, 2012, respectively, and $746,000 and $5,883,000 for the three months and year ended January 31, 2011, respectively.
Construction management fees are earned based on a contractual percentage of the actual construction costs incurred. We also recognize certain construction incentive fees based upon successful completion of certain criteria as set forth in the construction contracts. NOI from construction and incentive fees was $1,221,000 and $4,158,000 for the three months and year ended January 31, 2012, respectively, and $880,000 and $5,634,000 recognized during the three months and year ended January 31, 2011, respectively.
Property management and asset management fees are earned based on a contractual percentage of the annual net rental income and annual operating income, respectively, that is generated by the military housing privatization projects as defined in the agreements. We also recognize certain property management incentive fees based upon successful completion of certain criteria as set forth in the property management agreements. Property management, management incentive and asset management fees generated NOI of $4,724,000 and $14,276,000 during the three months and year ended January 31, 2012, respectively, and $3,060,000 and $12,865,000 during the three months and year ended January 31, 2011, respectively.
40
Forest City Enterprises, Inc. and Subsidiaries
Supplemental Operating Information
Land Held for Development and Sale
as of January 31, 2012
The Land Development Group acquires and sells raw land and fully-entitled developed lots to residential, commercial, and industrial customers. The Land Development Group also owns and develops raw land into master-planned communities, mixed-use projects and other residential developments. Below is a summary of our Land Development Group projects.
| | | | | | | | | | | | |
| Location | | Gross Acres (1) | | | Saleable Acres (2) | | | Option Acres (3) | |
| | | |
Stapleton – Denver, CO | | | 207 | | | | 128 | | | | 1,323 | |
Central Station – Chicago, IL | | | 30 | | | | 30 | | | | – | |
| | | | |
Total | | | 237 | | | | 158 | | | | 1,323 | |
| | | | |
| | (1) | Represent all acres currently owned including those used for roadways, open spaces and parks. |
| | (2) | Saleable acres represent the total of all acres owned and available for sales. The Land Development Group may choose to further develop some of the acres into completed sublots prior to sale. |
| | (3) | Option acres are those acres that the Land Development Group has a formal option to acquire. Typically these options are in the form of purchase agreements with contingencies for the satisfaction of due diligence reviews. |
Stapleton –Denver, CO
Stapleton represents one of the nation’s largest urban redevelopments. At full build-out of 4,700 acres or 7.5 square miles, Stapleton is planned for more than 12,000 homes and apartments, a projected 3 million square-feet of retail and 10 million square-feet of office/research and development/industrial space. Centrally located 10 minutes east of Downtown Denver and 20 minutes from Denver International Airport, Stapleton is expected to be home to 30,000 residents and 35,000 workers when complete.
Central Station –Chicago, IL
Located adjacent to the city’s Museum Campus, and just minutes from the heart of Chicago’s Loop, the 80 acre Central Station is a residential community with 3,727 residential units completed, of which 3,156 are occupied and 571 units are listed for sale, and another 4,000 units in development. Central Station, a 14 million-square-foot development, is being developed in partnership with The Fogelson Companies.
41
Forest City Enterprises, Inc. and Subsidiaries
Supplemental Operating Information
Land Held for Divestiture
as of January 31, 2012
As of January 31, 2012, our Board of Directors approved a strategic decision by our senior management to reposition or divest portions of our Land Development Group and are actively reviewing alternatives to do so. Below is a summary of land projects that are considered held for divestiture at January 31, 2012.
| | | | | | | | | | | | |
| Location | | Gross Acres | | | Saleable Acres | | | Option Acres | |
| | | |
Mesa del Sol - Albuquerque, NM | | | 3,011 | | | | 1,647 | | | | 5,731 | |
Texas | | | 2,720 | | | | 1,480 | | | | – | |
North Carolina | | | 1,220 | | | | 996 | | | | – | |
Ohio | | | 952 | | | | 641 | | | | 200 | |
Arizona | | | 657 | | | | 483 | | | | – | |
Other | | | 878 | | | | 691 | | | | – | |
| | | | |
Total | | | 9,438 | | | | 5,938 | | | | 5,931 | |
| | | | |
Mesa del Sol –Albuquerque, NM
Mesa del Sol is a 20 square mile, mixed-use community on the south mesa of Albuquerque, N.M., five minutes from the Albuquerque International Airport. Mesa del Sol’s master plan calls for mixed-use development that will include 1,400 acres for industrial/commercial and office development use, 4,400 acres for residential and supporting retail use, 3,200 acres for open space and parks and 800 acres for schools and universities.
Three Stones – Prosper, TX
Three Stones is a master-planned community of 2,031 acres located in the growth corridor north of Dallas in the town of Prosper. The community is fully entitled and the plan includes approximately 3,090 single family lots, 600 units of attached housing, over 600 acres of parks and open space and 250 acres for commercial/retail use. A variety of single family lot sizes will be offered, as well as a complete amenity center. The development of Phase 1 is expected to be completed in late 2013.
San Antonio Portfolio– San Antonio, TX
Forest City owns four multi-phase communities and finished lots in three additional locations in the San Antonio area, predominantly on the west side. As of January 31, 2012, over 1,300 of the total 2,563 lots have been sold. The remaining portfolio is comprised of 356 finished lots and 870 undeveloped “paper” lots. Our San Antonio communities serve several different price ranges, and all lots are under option contract to one of five different builders.
Legacy Lakes –Aberdeen, NC
Legacy Lakes is a master-planned community located in the Pinehurst area. This community is surrounding the Nicklaus-designed Legacy Golf Course. Legacy Lakes is 406 acres and includes 718 residential lots. Of the 406 total acres, 265 are saleable acres and 20 acres have been sold to date.
Timberlake– Oak Point (Dallas), TX
Timberlake is a planned community of approximately 250 acres located in Denton County, north of Dallas. Forest City entered into this project earlier in 2011 through the formation of a new partnership with Taylor Duncan Interests, Inc. with Forest City providing capital for financing and development. The project is zoned for over 800 single family lots, and development of Phase 1 is expected to begin in 2012.
Tangerine Crossing –Tucson, AZ
Tangerine Crossing is a master-planned gated residential community with a major retail component on the exterior in a desirable region of the Tucson metropolitan area. This community includes open space, trails and recreation. Tangerine Crossing is 309 acres and includes 396 residential lots and a 25 acre retail center. As of January 31, 2012, 250 lots and the 25 commercial acres have been sold. Of the 309 total acres, 98 are saleable acres and 73 acres have been sold to date.
42
Forest City Enterprises, Inc. and Subsidiaries
Supplemental Financial Information
Common Stock Data (NYSE: FCE A and FCE B)
The following summarizes information related to the Company’s Class A and Class B Common Stock based on information reported by the New York Stock Exchange:
| | | | | | | | | | | | | | | | | | | | |
| | | Quarter Ended | |
| | | January 31, 2012 | | | October 31, 2011 | | | July 31, 2011 | | | April 30, 2011 | | | January 31, 2011 | |
| | | | | |
Class A Common Stock | | | | | | | | | | | | | | | | | | | | |
Closing Price, end of quarter | | $ | 13.13 | | | $ | 13.68 | | | $ | 18.01 | | | $ | 19.21 | | | $ | 16.91 | |
High Closing Price | | $ | 14.00 | | | $ | 17.82 | | | $ | 19.24 | | | $ | 19.26 | | | $ | 16.98 | |
Low Closing Price | | $ | 10.88 | | | $ | 9.76 | | | $ | 17.78 | | | $ | 17.30 | | | $ | 14.78 | |
Average Closing Price | | $ | 12.32 | | | $ | 12.72 | | | $ | 18.55 | | | $ | 18.48 | | | $ | 15.98 | |
Total Volume | | | 56,114,430 | | | | 101,588,513 | | | | 60,938,097 | | | | 49,003,190 | | | | 47,217,359 | |
Average Volume | | | 905,071 | | | | 1,562,900 | | | | 967,271 | | | | 790,374 | | | | 749,482 | |
Common shares outstanding, end of quarter | | | 148,227,849 | | | | 148,192,446 | | | | 148,162,038 | | | | 144,653,100 | | | | 144,230,310 | |
| | | | | |
Class B Common Stock | | | | | | | | | | | | | | | | | | | | |
Closing Price, end of quarter | | $ | 13.17 | | | $ | 13.57 | | | $ | 17.90 | | | $ | 18.99 | | | $ | 16.77 | |
High Closing Price | | $ | 13.92 | | | $ | 17.77 | | | $ | 19.17 | | | $ | 19.26 | | | $ | 16.95 | |
Low Closing Price | | $ | 10.85 | | | $ | 9.78 | | | $ | 17.66 | | | $ | 17.27 | | | $ | 14.70 | |
Average Closing Price | | $ | 12.50 | | | $ | 12.71 | | | $ | 18.50 | | | $ | 18.52 | | | $ | 16.02 | |
Total Volume | | | 75,255 | | | | 46,562 | | | | 58,335 | | | | 38,821 | | | | 41,554 | |
Average Volume | | | 1,636 | | | | 776 | | | | 1,423 | | | | 776 | | | | 866 | |
Common shares outstanding, end of quarter | | | 20,934,335 | | | | 20,964,181 | | | | 20,987,364 | | | | 21,006,188 | | | | 21,218,753 | |
| | | | | |
Common Equity Market Capitalization | | $ | 2,221,936,849 | | | $ | 2,311,756,597 | | | $ | 3,044,072,120 | | | $ | 3,177,693,561 | | | $ | 2,794,773,030 | |
| | | | | |
Quarterly dividends declared per common share Class A and Class B | | $ | – | | | $ | – | | | $ | – | | | $ | – | | | $ | – | |
| | | | | | | | | | | | | | | | | | | | |
Financial Covenants
The Company’s Credit Facility and indenture dated May 19, 2003 (“2003 Indenture”) contain certain restrictive financial covenants. A summary of the key financial covenants as defined in each agreement, all of which the Company is compliant with at January 31, 2012, follows:
| | | | | | | | | | | | | | | | | | | | |
| | | Requirement
Per Agreement | | | As of
January 31, 2012 | | | As of
October 31, 2011 | | | As of
July 31, 2011 | | | As of
April 30, 2011 | |
| | | | |
| | | | | | | | | (dollars in thousands) | | | | | | | |
Credit Facility Financial Covenants | | | | | | | | | | | | | | | | | | | | |
| | | | | |
Debt Service Coverage Ratio | | | 1.35x | | | | 1.93x | | | | 1.92x | | | | 1.95x | | | | 1.92x | |
Cash Flow Coverage Ratio | | | 2.50x | | | | 3.86x | | | | 3.94x | | | | 4.37x | | | | 4.32x | |
Total Development Ratio | | | <17% | | | | 10.64% | | | | 11.59% | | | | 10.99% | | | | 9.89% | |
Minimum Consolidated Shareholders’ Equity, as defined | | $ | 2,320,175 | | | $ | 3,505,097 | | | $ | 3,584,782 | | | $ | 3,586,466 | | | $ | 3,490,034 | |
| | | | | |
2003 Indenture Financial Covenants(1) | | | | | | | | | | | | | | | | | | | | |
| | | | | |
Ratio of Consolidated EBITDA to Interest | | | >1.30x | | | | 1.82x | | | | 1.84x | | | | 1.95x | | | | 1.97x | |
Minimum Net Worth, as defined(2) | | $ | 999,434 | | | $ | 4,061,179 | | | $ | 4,105,717 | | | $ | 4,100,853 | | | $ | 4,003,711 | |
| | (1) | Violation of these financial covenants alone would not automatically cause the notes issued under the 2003 Indenture to become due and payable, but would prevent the Company from incurring or permitting a subsidiary from incurring additional debt, as defined in the 2003 Indenture, unless otherwise permitted by the 2003 Indenture. |
| | (2) | Represents the minimum net worth, as defined requirement at January 31, 2012. This requirement fluctuates each quarter based on actual financial results of each applicable period. |
43
Forest City Enterprises, Inc. and Subsidiaries
Supplemental Financial Information
Debt for Projects under Construction and Development
We use nonrecourse mortgage debt and nonrecourse notes payable for the financing of our projects under construction and development. We draw on these financings to partially fund the cost incurred with the development of our real estate. As of January 31, 2012, the amounts outstanding compared to the total commitment under the financings are as follows:
| | | | | | | | | | | | | | | | |
| | | Full
Consolidation
(GAAP) | | | Less
Noncontrolling
Interest | | | Plus
Unconsolidated
Investments at
Pro-Rata | | | Pro-Rata
Consolidation
(Non-GAAP) | |
| | | (in thousands) | |
Outstanding | | | | | | | | | | | | | | | | |
Fixed | | $ | 406,619 | | | $ | 173,175 | | | $ | 887 | | | $ | 234,331 | |
Variable | | | | | | | | | | | | | | | | |
Taxable | | | 409,733 | | | | 20,537 | | | | 37,274 | | | | 426,470 | |
Tax-Exempt | | | – | | | | – | | | | 21,463 | | | | 21,463 | |
| | | | |
Total outstanding on projects under construction and development(1) | | $ | 816,352 | | | $ | 193,712 | | | $ | 59,624 | | | $ | 682,264 | |
| | | | |
| | | | |
Commitment | | | | | | | | | | | | | | | | |
Fixed | | $ | 834,412 | | | $ | 401,747 | | | $ | 887 | | | $ | 433,552 | |
Variable | | | | | | | | | | | | | | | | |
Taxable | | | 503,769 | | | | 22,326 | | | | 37,274 | | | | 518,717 | |
Tax-Exempt | | | – | | | | – | | | | 21,463 | | | | 21,463 | |
| | | | |
Total commitment | | $ | 1,338,181 | | | $ | 424,073 | | | $ | 59,624 | | | $ | 973,732 | |
| | | | |
| | (1) | Proceeds from outstanding debt of $1,646 and $15,703, at full and pro-rata consolidation, respectively, described above is recorded as restricted cash and escrowed funds in our Consolidated Balance Sheet. For bonds issued in conjunction with development, the full amount of the bonds is issued at the beginning of construction and must remain in escrow until costs are incurred. |
Nonrecourse Debt
Our primary capital strategy seeks to isolate the operating and financial risk at the property level to maximize returns and reduce risk on and of our equity capital. As such, substantially all of our operating and development properties are separately encumbered with nonrecourse mortgage debt which in some limited circumstances is supplemented by nonrecourse notes payable (collectively “nonrecourse debt”).
We use taxable and tax-exempt nonrecourse debt for our real estate projects. For real estate projects financed with tax-exempt debt, we generally utilize variable-rate debt. For construction loans, we generally pursue variable-rate financings with maturities ranging from two to five years. For those real estate projects financed with taxable debt, we generally seek long-term, fixed-rate financing for those operating projects whose loans mature or are projected to open and achieve stabilized operations. The availability of nonrecourse mortgage capital is improving, especially in strong markets, but is still not at the levels before the economic downturn. For those assets that cannot be refinanced at attractive terms, we attempt to extend the maturities with existing lenders.
We are actively working to refinance and/or extend the maturities of the nonrecourse debt that are coming due in the next 24 months. During the year ended January 31, 2012, we completed the following financings:
| | | | | | | | | | | | | | | | |
| | | | | | | | | Plus | | | | |
| | | | | | Less | | | Unconsolidated | | | | |
| | | Full | | | Noncontrolling | | | Investments at | | | Pro-Rata | |
| Purpose of Financing | | Consolidation | | | Interest | | | Pro-Rata | | | Consolidation | |
| | | (in thousands) | |
| | | | |
Refinancings | | $ | 339,154 | | | $ | 11,675 | | | $ | 160,391 | | | $ | 487,870 | |
Construction and development projects (1) | | | 347,237 | | | | 68,664 | | | | – | | | | 278,573 | |
Loan extensions/additional fundings | | | 535,411 | | | | 67,223 | | | | 442,620 | | | | 910,808 | |
| | | | |
| | $ | 1,221,802 | | | $ | 147,562 | | | $ | 603,011 | | | $ | 1,677,251 | |
| | | | |
| | (1) | Represents the full amount available to be drawn on the loans. |
44
Forest City Enterprises, Inc. and Subsidiaries
Supplemental Financial Information
Scheduled Maturities Table: Nonrecourse Debt(dollars in thousands)
As of January 31, 2012
| | | 000000.00 | | | | 000000.00 | | | | 000000.00 | | | | 000000.00 | | | | 000000.00 | | | | 000000.00 | | | | 000000.00 | | | | 000000.00 | |
| | | Period Ending January 31, 2013 | | | Fiscal Year Ending January 31, 2014 | |
| | | | | | | | | Plus | | | | | | | | | | | | Plus | | | | |
| | | | | | Less | | | Unconsolidated | | | | | | | | | Less | | | Unconsolidated | | | | |
| | | Full | | | Noncontrolling | | | Investments at | | | Pro-Rata | | | Full | | | Noncontrolling | | | Investments at | | | Pro-Rata | |
| | | Consolidation | | | Interest | | | Pro-Rata | | | Consolidation | | | Consolidation | | | Interest | | | Pro-Rata | | | Consolidation | |
Fixed: | | | | | | | | | | | | | | | | | | | | | | | | | | | | | | | | |
Fixed-rate debt | | $ | 294,235 | | | $ | 17,567 | | | $ | 79,934 | | | $ | 356,602 | | | $ | 602,745 | | | $ | 75,780 | | | $ | 142,279 | | | $ | 669,244 | |
Weighted average rate | | | 5.96 | % | | | 7.04 | % | | | 6.33 | % | | | 5.99 | % | | | 6.46 | % | | | 9.92 | % | | | 6.33 | % | | | 6.04 | % |
Variable: | | | | | | | | | | | | | | | | | | | | | | | | | | | | | | | | |
Variable-rate debt | | | 1,039,618 | | | | 13,300 | | | | 100,521 | | | | 1,126,839 | | | | 93,969 | | | | 9,069 | | | | 50,809 | | | | 135,709 | |
Weighted average rate | | | 3.53 | % | | | 8.18 | % | | | 3.94 | % | | | 3.51 | % | | | 6.59 | % | | | 8.63 | % | | | 3.16 | % | | | 5.17 | % |
Tax-Exempt | | | 237 | | | | 24 | | | | 27,204 | | | | 27,417 | | | | 91,055 | | | | 26 | | | | 53,040 | | | | 144,069 | |
Weighted average rate | | | 1.58 | | | | 1.56 | % | | | 1.96 | % | | | 1.96 | % | | | 2.56 | % | | | 1.55 | % | | | 2.92 | % | | | 2.69 | % |
Total variable-rate debt | | | 1,039,855 | | | | 13,324 | | | | 127,725 | | | | 1,154,256 | | | | 185,024 | | | | 9,095 | | | | 103,849 | | | | 279,778 | |
Total Nonrecourse Debt | | $ | 1,334,090 | | | $ | 30,891 | | | $ | 207,659 | | | $ | 1,510,858 | | | $ | 787,769 | | | $ | 84,875 | | | $ | 246,128 | | | $ | 949,022 | |
Weighted Average Rate | | | 4.06 | % | | | 7.53 | % | | | 4.60 | % | | | 4.07 | % | | | 6.02 | % | | | 9.78 | % | | | 4.94 | % | | | 5.41 | % |
| | | | | | | | | | | | | | | | | | | | | | | | | |
| | | Fiscal Year Ending January 31, 2015 | | | Fiscal Year Ending January 31, 2016 | |
| | | | | | | | | Plus | | | | | | | | | | | | Plus | | | | |
| | | | | | Less | | | Unconsolidated | | | | | | | | | Less | | | Unconsolidated | | | | |
| | | Full | | | Noncontrolling | | | Investments at | | | Pro-Rata | | | Full | | | Noncontrolling | | | Investments at | | | Pro-Rata | |
| | | Consolidation | | | Interest | | | Pro-Rata | | | Consolidation | | | Consolidation | | | Interest | | | Pro-Rata | | | Consolidation | |
Fixed: | | | | | | | | | | | | | | | | | | | | | | | | | | | | | | | | |
Fixed-rate debt | | $ | 291,315 | | | $ | 34,076 | | | $ | 242,491 | | | $ | 499,730 | | | $ | 346,320 | | | $ | 29,223 | | | $ | 122,383 | | | $ | 439,480 | |
Weighted average rate | | | 6.04 | % | | | 5.93 | % | | | 5.52 | % | | | 5.80 | % | | | 5.57 | % | | | 5.83 | % | | | 5.31 | % | | | 5.48 | % |
Variable: | | | | | | | | | | | | | | | | | | | | | | | | | | | | | | | | |
Variable-rate debt | | | 24,607 | | | | – | | | | 30,489 | | | | 55,096 | | | | – | | | | – | | | | 31,583 | | | | 31,583 | |
Weighted average rate | | | 3.85 | % | | | – | % | | | 4.27 | % | | | 4.08 | % | | | – | % | | | – | % | | | 2.04 | % | | | 2.04 | % |
Tax-Exempt | | | 272 | | | | 27 | | | | – | | | | 245 | | | | 290 | | | | 29 | | | | – | | | | 261 | |
Weighted average rate | | | 1.58 | % | | | 1.59 | % | | | – | % | | | 1.58 | % | | | 1.58 | % | | | 1.58 | % | | | – | % | | | 1.58 | % |
Total variable-rate debt | | | 24,879 | | | | 27 | | | | 30,489 | | | | 55,341 | | | | 290 | | | | 29 | | | | 31,583 | | | | 31,844 | |
Total Nonrecourse Debt | | $ | 316,194 | | | $ | 34,103 | | | $ | 272,980 | | | $ | 555,071 | | | $ | 346,610 | | | $ | 29,252 | | | $ | 153,966 | | | $ | 471,324 | |
Weighted Average Rate | | | 5.87 | % | | | 5.93 | % | | | 5.38 | % | | | 5.62 | % | | | 5.57 | % | | | 5.83 | % | | | 4.64 | % | | | 5.25 | % |
45
Forest City Enterprises, Inc. and Subsidiaries
Supplemental Financial Information
Scheduled Maturities Table: Nonrecourse Debt(dollars in thousands) (continued)
As of January 31, 2012
| | | | | | | | | | | | | | | | | | | | | | | | | | | | | | | | |
| | | Fiscal Year Ending January 31, 2017 | | | Thereafter | |
| | | | | | | | | Plus | | | | | | | | | | | | Plus | | | | |
| | | | | | Less | | | Unconsolidated | | | | | | | | | Less | | | Unconsolidated | | | | |
| | | Full | | | Noncontrolling | | | Investments at | | | Pro-Rata | | | Full | | | Noncontrolling | | | Investments at | | | Pro-Rata | |
| | | Consolidation | | | Interest | | | Pro-Rata | | | Consolidation | | | Consolidation | | | Interest | | | Pro-Rata | | | Consolidation | |
Fixed: | | | | | | | | | | | | | | | | | | | | | | | | | | | | | | | | |
Fixed-rate debt | | $ | 420,637 | | | $ | 6,583 | | | $ | 89,598 | | | $ | 503,652 | | | $ | 1,464,433 | | | $ | 162,484 | | | $ | 796,610 | | | $ | 2,098,559 | |
Weighted average rate | | | 5.75 | % | | | 6.01 | % | | | 6.48 | % | | | 5.88 | % | | | 5.16 | % | | | 5.88 | % | | | 5.61 | % | | | 5.27 | % |
Variable: | | | | | | | | | | | | | | | | | | | | | | | | | | | | | | | | |
Variable-rate debt | | | – | | | | – | | | | 183,037 | | | | 183,037 | | | | 644,435 | | | | 2,785 | | | | 112,213 | | | | 753,863 | |
Weighted average rate | | | – | % | | | – | % | | | 2.38 | % | | | 2.38 | % | | | 6.52 | % | | | 3.25 | % | | | 3.97 | % | | | 6.15 | % |
Tax-Exempt | | | 309 | | | | 31 | | | | 103,989 | | | | 104,267 | | | | 345,046 | | | | 5,278 | | | | 140,285 | | | | 480,053 | |
Weighted average rate | | | 1.58 | % | | | 1.57 | % | | | 2.33 | % | | | 2.33 | % | | | 1.29 | % | | | 0.98 | % | | | 1.50 | % | | | 1.35 | % |
Total variable-rate debt | | | 309 | | | | 31 | | | | 287,026 | | | | 287,304 | | | | 989,481 | | | | 8,063 | | | | 252,498 | | | | 1,233,916 | |
Total Nonrecourse Debt | | $ | 420,946 | | | $ | 6,614 | | | $ | 376,624 | | | $ | 790,956 | | | $ | 2,453,914 | | | $ | 170,547 | | | $ | 1,049,108 | | | $ | 3,332,475 | |
Weighted Average Rate | | | 5.75 | % | | | 5.99 | % | | | 3.34 | % | | | 4.60 | % | | | 4.97 | % | | | 5.69 | % | | | 4.88 | % | | | 4.91 | % |
| | | | | | | | | | | | | | | | | | | | | | | | | |
| | | Total | | | | |
| | | Full Consolidation | | | Less Noncontrolling Interest | | | Plus Unconsolidated Investments at Pro-Rata | | | Pro-Rata Consolidation | | | | | | | | | | | | | |
| | | | | | | | |
| | | | | | | | |
| | | | | | | | |
Fixed: | | | | | | | | | | | | | | | | | | | | | | | | | | | | | | | | |
Fixed-rate debt | | $ | 3,419,685 | | | $ | 325,713 | | | $ | 1,473,295 | | | $ | 4,567,267 | | | | | | | | | | | | | | | | | |
Weighted average rate | | | 5.65 | % | | | 6.89 | % | | | 5.73 % | | | | 5.59 % | | | | | | | | | | | | | | | | | |
Variable: | | | | | | | | | | | | | | | | | | | | | | | | | | | | | | | | |
Variable-rate debt | | | 1,802,629 | | | | 25,154 | | | | 508,652 | | | | 2,286,127 | | | | | | | | | | | | | | | | | |
Weighted average rate | | | 4.76 | % | | | 7.80 | % | | | 3.21 | % | | | 4.38 | % | | | | | | | | | | | | | | | | |
Tax-Exempt | | | 437,209 | | | | 5,415 | | | | 324,518 | | | | 756,312 | | | | | | | | | | | | | | | | | |
Weighted average rate | | | 1.55 | % | | | 1.00 | % | | | 2.04 | % | | | 1.76 | % | | | | | | | | | | | | | | | | |
Total variable-rate debt | | | 2,239,838 | | | | 30,569 | | | | 833,170 | | | | 3,042,439 | | | | | | | | | | | | | | | | | |
Total Nonrecourse Debt | | $ | 5,659,523 | | | $ | 356,282 | | | $ | 2,306,465 | | | $ | 7,609,706 | | | | | | | | | | | | | | | | | |
Weighted Average Rate | | | 5.05 | % | | | 6.86 | % | | | 4.65 | % | | | 4.84 | % | | | | | | | | | | | | | | | | |
46
Forest City Enterprises, Inc. and Subsidiaries
Supplemental Financial Information
Investments in Unconsolidated Entities
Investments in unconsolidated entities include investments in and advances to unconsolidated entities and cash distributions and losses in excess of investments in unconsolidated entities that the Company does not control and/or is not deemed to be the primary beneficiary, which are accounted for under the equity method of accounting.
The following is a reconciliation of members’ and partners’ equity to the Company’s carrying value:
| | | | | | | | |
| | | January 31, 2012 | | | January 31, 2011 | |
| | | (in thousands) | |
Members’ and partners’ equity, as below | | $ | 945,129 | | | $ | 587,164 | |
Equity of other members and partners | | | 790,618 | | | | 616,640 | |
| | |
Company’s investment in partnerships | | | 154,511 | | | | (29,476 | ) |
Basis differences | | | 79,913 | | | | 76,634 | |
Advances to and on behalf of affiliates | | | 94,947 | | | | 93,859 | |
Total Investments in Unconsolidated Entities | | $ | 329,371 | | | $ | 141,017 | |
| | |
Assets-Investments in and advances to unconsolidated entities | | $ | 609,079 | | | $ | 431,509 | |
Liabilities-Cash distributions and losses in excess of investments in unconsolidated entities | | | (279,708 | ) | | | (290,492 | ) |
Total Investments in Unconsolidated Entities | | $ | 329,371 | | | $ | 141,017 | |
Summarized financial information for the equity method investments is as follows:
| | | | | | | | | | | | | | | | |
| | | Combined (100%) | | | Pro-Rata Share | |
| | | (GAAP) | | | (Non-GAAP) | |
| | | January 31, 2012 | | | January 31, 2011 | | | January 31, 2012 | | | January 31, 2011 | |
| | | (in thousands) | |
Balance Sheet: | | | | | | | | | | | | | | | | |
Real Estate | | | | | | | | | | | | | | | | |
Completed rental properties | | $ | 7,287,539 | | | $ | 5,514,041 | | | $ | 2,820,111 | | | $ | 1,923,813 | |
Projects under construction and development | | | 287,738 | | | | 174,106 | | | | 136,495 | | | | 79,603 | |
Land held for development and sale(1) | | | 224,224 | | | | 272,930 | | | | 24,851 | | | | 115,607 | |
| | | | |
Total Real Estate | | | 7,799,501 | | | | 5,961,077 | | | | 2,981,457 | | | | 2,119,023 | |
Less accumulated depreciation | | | (1,257,091 | ) | | | (944,968 | ) | | | (557,613 | ) | | | (424,331 | ) |
| | | | |
Real Estate, net | | | 6,542,410 | | | | 5,016,109 | | | | 2,423,844 | | | | 1,694,692 | |
Cash and equivalents | | | 149,702 | | | | 109,246 | | | | 60,689 | | | | 48,583 | |
Restricted cash–military housing bond funds | | | 284,641 | | | | 384,584 | | | | 5,588 | | | | 5,161 | |
Other restricted cash and escrowed funds | | | 274,201 | | | | 206,778 | | | | 103,694 | | | | 73,729 | |
Other assets | | | 756,564 | | | | 536,246 | | | | 126,980 | | | | 131,486 | |
Land held for divestiture(3) | | | – | | | | – | | | | 45,257 | | | | – | |
Operating property assets held for sale(4) | | | – | | | | 67,190 | | | | – | | | | – | |
| | | | |
Total Assets | | $ | 8,007,518 | | | $ | 6,320,153 | | | $ | 2,766,052 | | | $ | 1,953,651 | |
| | | | |
Mortgage debt and notes payable, nonrecourse(2) | | $ | 6,551,891 | | | $ | 5,301,900 | | | $ | 2,294,239 | | | $ | 1,713,367 | |
Other liabilities | | | 510,498 | | | | 369,871 | | | | 198,920 | | | | 124,908 | |
Mortgage debt and notes payable, nonrecourse on land held for divestiture(3) | | | – | | | | – | | | | 12,226 | | | | – | |
Liabilities of operating property held for sale(4) | | | – | | | | 61,218 | | | | – | | | | – | |
Members’ and partners’ equity | | | 945,129 | | | | 587,164 | | | | 260,667 | | | | 115,376 | |
| | | | |
| | | | |
Total Liabilities and Members’ and Partners’ Equity | | $ | 8,007,518 | | | $ | 6,320,153 | | | $ | 2,766,052 | | | $ | 1,953,651 | |
| | | | |
| | (1) | The combined (100%) amount at January 31, 2012 includes $181,749 of land held by unconsolidated entities in which the Company is currently reviewing its options to divest its portion of land held by these unconsolidated entities. |
| | (2) | The combined (100%) amount at January 31, 2012 includes $35,551 of mortgage debt and notes payable, nonrecourse related to the land held by the unconsolidated entities discussed in footnote (1). |
| | (3) | Represents our portion of land held and related mortgage debt and notes payable, nonrecourse of our land group which qualifies to be reclassified as held for sale as of January 31, 2012. |
| | (4) | Represents assets and liabilities ofMetropolitan Lofts, an unconsolidated apartment community in Los Angeles, California, which was disposed on February 1, 2011. |
47
Forest City Enterprises, Inc. and Subsidiaries
Supplemental Financial Information
Investments in Unconsolidated Entities (continued)
| | | | | | | | | | | | | | | | |
| | | Combined (100%) | | | Pro-Rata Share | |
| | | (GAAP) | | | (Non-GAAP) | |
| Years Ended January 31, | | 2012 | | | 2011 | | | 2012 | | | 2011 | |
| | | (in thousands) | |
Operations: | | | | | | | | | | | | | | | | |
Revenues | | $ | 1,051,766 | | | $ | 916,942 | | | $ | 385,521 | | | $ | 316,900 | |
Equity in earnings (loss) of unconsolidated entities on a pro-rata basis | | | – | | | | – | | | | (26,309 | ) | | | (6,074 | ) |
Operating expenses | | | (573,060 | ) | | | (529,975 | ) | | | (179,242 | ) | | | (169,265 | ) |
Interest expense including early extinguishment of debt | | | (323,667 | ) | | | (264,548 | ) | | | (101,324 | ) | | | (78,424 | ) |
Impairment of real estate(1) | | | – | | | | (1,457 | ) | | | – | | | | (743 | ) |
Depreciation and amortization | | | (203,319 | ) | | | (167,731 | ) | | | (70,870 | ) | | | (55,386 | ) |
Interest and other income | | | 14,757 | | | | 15,782 | | | | 989 | | | | 15,666 | |
Noncontrolling interest | | | – | | | | – | | | | (185 | ) | | | (4,613 | ) |
| | | | |
Earnings (loss) from continuing operations | | $ | (33,523 | ) | | $ | (30,987 | ) | | $ | 8,580 | | | $ | 18,061 | |
| | | | |
Discontinued operations: | | | | | | | | | | | | | | | | |
Operating loss from rental properties | | | – | | | | 1,842 | | | | – | | | | – | |
Gain on disposition of rental properties(2) | | | – | | | | 28,289 | | | | – | | | | 24,291 | |
| | | | |
Discontinued operations subtotal | | | – | | | | 30,131 | | | | – | | | | 24,291 | |
| | | | |
Net earnings (loss) (pre-tax) | | | (33,523 | ) | | | (856 | ) | | | 8,580 | | | | 42,352 | |
| | | | |
Impairment of investments in unconsolidated entities(1) | | | (82,186 | ) | | | (71,716 | ) | | | (82,186 | ) | | | (71,716 | ) |
Gain (loss) on disposition of equity method investments(2) | | | 12,567 | | | | (830 | ) | | | 12,567 | | | | (830 | ) |
| | | | |
Net earnings (loss) (pre-tax) from unconsolidated entities | | $ | (103,142 | ) | | $ | (73,402 | ) | | $ | (61,039 | ) | | $ | (30,194 | ) |
| | | | |
| | (1) | The following tables show the detail of impairment of unconsolidated entities: |
| | | | | | | | | | | | | | | | | | |
| | | | | Combined (100%) | | | Pro-Rata Share | |
| | | | | (GAAP) | | | (Non-GAAP) | |
| | | | | Years Ended January 31, | |
| | | | | 2012 | | | 2011 | | | 2012 | | | 2011 | |
| | | | | (in thousands) | |
Impairment of real estate: | | | | | | | | | | | | | | | | | | |
Old Stone Crossing at Caldwell Creek (Mixed-Use Land Development) | | Charlotte, North Carolina | | $ | – | | | $ | 1,457 | | | $ | – | | | $ | 743 | |
| | | | | | |
Total impairment of real estate | | $ | – | | | $ | 1,457 | | | $ | – | | | $ | 743 | |
| | | | | | |
| | | | | |
Impairment of investments in unconsolidated entities: | | | | | | | | | | | | | | | | | | |
Equity method investments in land entities | | Various | | $ | 41,902 | | | $ | – | | | $ | 41,902 | | | $ | – | |
Specialty Retail Centers: | | | | | | | | | | | | | | | | | | |
Village at Gulfstream Park | | Hallandale Beach, Florida | | | 35,674 | | | | 35,000 | | | | 35,674 | | | | 35,000 | |
Metreon | | San Francisco, California | | | – | | | | 4,595 | | | | – | | | | 4,595 | |
Commercial development property | | Cleveland, Ohio | | | 4,610 | | | | – | | | | 4,610 | | | | – | |
Four Museum Park properties at Central Station | | Chicago, Illinois | | | – | | | | 18,311 | | | | – | | | | 18,311 | |
Office Buildings: | | | | | | | | | | | | | | | | | | |
818 Mission Street | | San Francisco, California | | | – | | | | 4,018 | | | | – | | | | 4,018 | |
Bulletin Building | | San Francisco, California | | | – | | | | 3,543 | | | | – | | | | 3,543 | |
Other | | | | | – | | | | 6,249 | | | | – | | | | 6,249 | |
| | | | | | |
Total impairment of investments in unconsolidated entities | | $ | 82,186 | | | $ | 71,716 | | | $ | 82,186 | | | $ | 71,716 | |
| | | | | | |
| | | | |
Total impairment of unconsolidated entities | | $ | 82,186 | | | $ | 73,173 | | | $ | 82,186 | | | $ | 72,459 | |
| | | | | | |
48
Forest City Enterprises, Inc. and Subsidiaries
Supplemental Financial Information
Investments in Unconsolidated Entities (continued)
| | (2) | Upon disposition, investments accounted for on the equity method are not classified as discontinued operations; therefore, gains or losses on the disposition of these properties are reported in continuing operations. The following table shows the detail of gains and losses on disposition of unconsolidated entities: |
| | | | | | | | | | | | | | | | | | |
| | | | | Combined (100%) | | | Pro-Rata Share | |
| | | | | (GAAP) | | | (Non-GAAP) | |
| | | | | Years Ended January 31, | |
| | | | | 2012 | | | 2011 | | | 2012 | | | 2011 | |
| | | | | (in thousands) | |
Gain (loss) on disposition of rental properties: | | | | | | | | | | | | | | | | | | |
Millender Center (hotel, parking, office and retail) | | Detroit, Michigan | | $ | – | | | $ | 17,291 | | | $ | – | | | $ | 15,633 | |
Woodbridge Crossing (Specialty Retail Centers) | | Woodbridge, New Jersey | | | – | | | | 6,443 | | | | – | | | | 6,443 | |
Pebble Creek (Apartment Communities) | | Twinsburg, Ohio | | | – | | | | 4,555 | | | | – | | | | 2,215 | |
| | | | | | |
Total loss on disposition of equity method investments | | $ | – | | | $ | 28,289 | | | $ | – | | | $ | 24,291 | |
| | | | | | |
Gain (loss) on disposition of equity method investments: | | | | | | | | | | | | | | | | | | |
Apartment Communities: | | | | | | | | | | | | | | | | | | |
Metropolitan Lofts | | Los Angeles, California | | | 9,964 | | | | – | | | | 9,964 | | | | – | |
Twin Lake Towers | | Denver, Colorado | | | 2,603 | | | | – | | | | 2,603 | | | | – | |
Other | | | | | – | | | | (830 | ) | | | – | | | | (830 | ) |
| | | | | | |
Gain (loss) on disposition of equity method investments | | $ | 12,567 | | | $ | (830 | ) | | $ | 12,567 | | | $ | (830 | ) |
| | | | | | |
49
Forest City Enterprises, Inc. and Subsidiaries
Supplemental Financial Information
Forest City Rental Properties Corporation (“FCRPC”) is a wholly-owned subsidiary of Forest City Enterprises, Inc. engaged in the ownership, development, management and acquisition of real estate projects, including regional malls, specialty/urban retail centers, office and life science buildings, hotels, mixed-use projects, as well as large land development projects, residential rental properties, development of for-sale condominium projects and also owns interests in entities that develop and manage military family housing.
Forest City Rental Properties Corporation and Subsidiaries
Consolidated Balance Sheet Information – January 31, 2012 (Unaudited)
| | | | | | | | | | | | | | | | |
| | | Full
Consolidation
(GAAP) | | | Less
Noncontrolling
Interest | | | Plus
Unconsolidated
Investments at
Pro-Rata | | | Pro-Rata
Consolidation
(Non-GAAP) | |
| | | (in thousands) | |
| | | | |
Assets | | | | | | | | | | | | | | | | |
Real Estate | | | | | | | | | | | | | | | | |
Completed rental properties | | $ | 7,173,056 | | | $ | 195,325 | | | $ | 2,820,111 | | | $ | 9,797,842 | |
Projects under construction and development | | | 2,328,979 | | | | 568,157 | | | | 136,495 | | | | 1,897,317 | |
Land held for development and sale | | | 77,298 | | | | 7,451 | | | | 24,851 | | | | 94,698 | |
Total Real Estate | | | 9,579,333 | | | | 770,933 | | | | 2,981,457 | | | | 11,789,857 | |
Less accumulated depreciation | | | (1,518,427 | ) | | | (46,085 | ) | | | (557,613 | ) | | | (2,029,955 | ) |
Real Estate, net | | | 8,060,906 | | | | 724,848 | | | | 2,423,844 | | | | 9,759,902 | |
| | | | |
Cash and equivalents | | | 137,619 | | | | 9,286 | | | | 56,400 | | | | 184,733 | |
Restricted cash and escrowed funds | | | 541,487 | | | | 97,978 | | | | 109,271 | | | | 552,780 | |
Notes and accounts receivable, net | | | 379,301 | | | | 17,646 | | | | 36,644 | | | | 398,299 | |
Investments in and advances to unconsolidated entities | | | 574,889 | | | | (163,374 | ) | | | (522,480 | ) | | | 215,783 | |
Other assets | | | 549,625 | | | | 43,389 | | | | 90,265 | | | | 596,501 | |
Land held for divestiture | | | 3,618 | | | | – | | | | 22,645 | | | | 26,263 | |
| | | | |
Total Assets | | $ | 10,247,445 | | | $ | 729,773 | | | $ | 2,216,589 | | | $ | 11,734,261 | |
| | | | |
Liabilities and Shareholders’ Equity | | | | | | | | | | | | | | | | |
Liabilities | | | | | | | | | | | | | | | | |
Mortgage debt and notes payable, nonrecourse | | $ | 5,640,439 | | | $ | 354,561 | | | $ | 2,294,239 | | | $ | 7,580,117 | |
Bank revolving credit facility | | | – | | | | – | | | | – | | | | – | |
Accounts payable, accrued expenses and other liabilities | | | 978,454 | | | | 89,372 | | | | 194,268 | | | | 1,083,350 | |
Accounts payable to Forest City Enterprises, Inc. | | | 578,344 | | | | (337 | ) | | | – | | | | 578,681 | |
Cash distributions and losses in excess of investments in unconsolidated entities | | | 279,708 | | | | (24,803 | ) | | | (282,105 | ) | | | 22,406 | |
Deferred income taxes | | | 533,432 | | | | – | | | | – | | | | 533,432 | |
Mortgage debt and notes payable, nonrecourse on land held for divestiture | | | – | | | | – | | | | 10,187 | | | | 10,187 | |
Total Liabilities | | | 8,010,377 | | | | 418,793 | | | | 2,216,589 | | | | 9,808,173 | |
| | | | |
Redeemable Noncontrolling Interest | | | 229,149 | | | | 229,149 | | | | – | | | | – | |
| | | | |
Equity | | | | | | | | | | | | | | | | |
Shareholders’ Equity | | | | | | | | | | | | | | | | |
Shareholders’ equity before accumulated other comprehensive loss | | | 1,853,891 | | | | – | | | | – | | | | 1,853,891 | |
Accumulated other comprehensive loss | | | (113,824 | ) | | | – | | | | – | | | | (113,824 | ) |
Total Shareholders’ Equity | | | 1,740,067 | | | | – | | | | – | | | | 1,740,067 | |
| | | | |
Noncontrolling interest | | | 267,852 | | | | 81,831 | | | | – | | | | 186,021 | |
| | | | |
Total Equity | | | 2,007,919 | | | | 81,831 | | | | – | | | | 1,926,088 | |
| | | | |
Total Liabilities and Equity | | $ | 10,247,445 | | | $ | 729,773 | | | $ | 2,216,589 | | | $ | 11,734,261 | |
50
Forest City Enterprises, Inc. and Subsidiaries
Supplemental Financial Information
Forest City Rental Properties Corporation and Subsidiaries
Consolidated Earnings Information – Year Ended January 31, 2012 (Unaudited)
| | | | | | | | | | | | | | | | | | | | |
| | | | | | | | | Plus | | | | | | | |
| | | Full
Consolidation
(GAAP) | | | Less
Noncontrolling
Interest | | | Unconsolidated
Investments at
Pro-Rata | | | Plus
Discontinued
Operations | | | Pro-Rata
Consolidation
(Non-GAAP) | |
| | | (in thousands) | |
Revenues from real estate operations | | $ | 1,080,532 | | | $ | 56,108 | | | $ | 374,742 | | | $ | 23,173 | | | $ | 1,422,339 | |
| | | | | |
Expenses | | | | | | | | | | | | | | | | | | | | |
Operating expenses | | | 597,334 | | | | 38,617 | | | | 171,025 | | | | 18,074 | | | | 747,816 | |
Depreciation and amortization | | | 216,973 | | | | 4,659 | | | | 67,830 | | | | 3,154 | | | | 283,298 | |
Impairment of real estate | | | 3,670 | | | | – | | | | 71,720 | | | | 10,257 | | | | 85,647 | |
| | | 817,977 | | | | 43,276 | | | | 310,575 | | | | 31,485 | | | | 1,116,761 | |
| | | | | |
Interest expense | | | (253,551 | ) | | | (11,439 | ) | | | (100,725 | ) | | | (2,123 | ) | | | (344,960 | ) |
Amortization of mortgage procurement costs | | | (11,658 | ) | | | (513 | ) | | | (2,935 | ) | | | (356 | ) | | | (14,436 | ) |
Gain (loss) on early extinguishment of debt | | | 20,390 | | | | 1,641 | | | | (2,292 | ) | | | – | | | | 16,457 | |
| | | | | |
Interest and other income | | | 49,035 | | | | 1,293 | | | | 1,055 | | | | 2 | | | | 48,799 | |
Net gain on disposition of full or partial interests in rental properties | | | 17,665 | | | | – | | | | 12,567 | | | | 51,796 | | | | 82,028 | |
| | | | | |
Earnings (loss) before income taxes | | | 84,436 | | | | 3,814 | | | | (28,163 | ) | | | 41,007 | | | | 93,466 | |
| | | | | |
Income tax expense (benefit) | | | | | | | | | | | | | | | | | | | | |
Current | | | 17,118 | | | | – | | | | – | | | | 11,139 | | | | 28,257 | |
Deferred | | | (11,233 | ) | | | – | | | | – | | | | 6,536 | | | | (4,697 | ) |
| | | 5,885 | | | | – | | | | – | | | | 17,675 | | | | 23,560 | |
| | | | | |
Equity in earnings (loss) of unconsolidated entities, including impairment | | | (54,477 | ) | | | (185 | ) | | | 28,163 | | | | – | | | | (26,129 | ) |
| | | | | |
Earnings from continuing operations | | | 24,074 | | | | 3,629 | | | | – | | | | 23,332 | | | | 43,777 | |
| | | | | |
Discontinued operations, net of tax: | | | | | | | | | | | | | | | | | | | | |
Operating earnings from rental properties | | | 992 | | | | 1,424 | | | | – | | | | 432 | | | | – | |
Impairment of real estate | | | (6,279 | ) | | | – | | | | – | | | | 6,279 | | | | – | |
Gain on disposition of rental properties | | | 111,801 | | | | 81,758 | | | | – | | | | (30,043 | ) | | | – | |
| | | 106,514 | | | | 83,182 | | | | – | | | | (23,332 | ) | | | – | |
Net earnings | | | 130,588 | | | | 86,811 | | | | – | | | | – | | | | 43,777 | |
| | | | | |
Noncontrolling Interests | | | | | | | | | | | | | | | | | | | | |
Earnings from continuing operations attributable to noncontrolling interests | | | (3,629 | ) | | | (3,629 | ) | | | – | | | | – | | | | – | |
Earnings from discontinued operations attributable to noncontrolling interests | | | (83,182 | ) | | | (83,182 | ) | | | – | | | | – | | | | – | |
| | | (86,811 | ) | | | (86,811 | ) | | | – | | | | – | | | | – | |
Net earnings attributable to Forest City Enterprises, Inc. | | $ | 43,777 | | | $ | – | | | $ | – | | | $ | – | | | $ | 43,777 | |
51
Forest City Enterprises, Inc. and Subsidiaries
Supplemental Financial Information
Summary of Earnings Before Depreciation, Amortization and Deferred Taxes (EBDT) — Three Months Ended January 31, 2012(in thousands)
| | | | | | | | | | | | | | | | | | | | | | | | | | | | | | | | | | | | | | | | | | |
| | | Commercial Group 2011 | | | | | Residential Group 2011 | |
| | | | | | | | | Plus | | | | | | | | | | | | | | | | | Plus | | | | | | | |
| | | Full
Consolidation
(GAAP) | | | Less
Noncontrolling
Interest | | | Unconsolidated
Investments at
Pro-Rata | | | Plus
Discontinued
Operations | | | Pro-Rata
Consolidation
(Non-GAAP) | | | | | Full
Consolidation
(GAAP) | | | Less
Noncontrolling
Interest | | | Unconsolidated
Investments at
Pro-Rata | | | Plus
Discontinued
Operations | | | Pro-Rata
Consolidation
(Non-GAAP) | |
Revenues from real estate operations | | $ | 185,306 | | | $ | 7,758 | | | $ | 59,849 | | | $ | 2,481 | | | $ | 239,878 | | | | | $ | 75,595 | | | $ | 8,145 | | | $ | 41,654 | | | $ | – | | | $ | 109,104 | |
Exclude straight-line rent adjustment | | | (5,408 | ) | | | – | | | | – | | | | – | | | | (5,408 | ) | | | | | 100 | | | | – | | | | – | | | | – | | | | 100 | |
Adjusted revenues | | | 179,898 | | | | 7,758 | | | | 59,849 | | | | 2,481 | | | | 234,470 | | | | | | 75,695 | | | | 8,145 | | | | 41,654 | | | | – | | | | 109,204 | |
Add interest and other income | | | 2,691 | | | | 117 | | | | 47 | | | | (1 | ) | | | 2,620 | | | | | | 4,454 | | | | 115 | | | | 295 | | | | – | | | | 4,634 | |
Add equity in earnings (loss) of unconsolidated entities, including impairment | | | 5,131 | | | | – | | | | (5,131 | ) | | | – | | | | – | | | | | | 1,820 | | | | (413 | ) | | | (1,918 | ) | | | – | | | | 315 | |
Exclude impairment of unconsolidated real estate | | | 1,095 | | | | – | | | | (1,095 | ) | | | – | | | | – | | | | | | – | | | | – | | | | – | | | | – | | | | – | |
Exclude depreciation and amortization of unconsolidated entities | | | 11,568 | | | | – | | | | (11,568 | ) | | | – | | | | – | | | | | | 9,357 | | | | – | | | | (9,357 | ) | | | – | | | | – | |
Exclude interest expense of unconsolidated entities | | | 16,652 | | | | – | | | | (16,652 | ) | | | – | | | | – | | | | | | 9,774 | | | | – | | | | (9,774 | ) | | | – | | | | – | |
Exclude (gain) loss on early extinguishment of debt of unconsolidated entities | | | 1 | | | | – | | | | (1 | ) | | | – | | | | – | | | | | | (115 | ) | | | – | | | | 115 | | | | – | | | | – | |
Adjusted total income | | | 217,036 | | | | 7,875 | | | | 25,449 | | | | 2,480 | | | | 237,090 | | | | | | 100,985 | | | | 7,847 | | | | 21,015 | | | | – | | | | 114,153 | |
Operating expenses | | | 101,511 | | | | 5,303 | | | | 25,449 | | | | 2,828 | | | | 124,485 | | | | | | 55,432 | | | | 7,006 | | | | 21,015 | | | | – | | | | 69,441 | |
Non-Real Estate depreciation and amortization and amortization of mortgage procurement costs | | | 271 | | | | – | | | | – | | | | – | | | | 271 | | | | | | 153 | | | | – | | | | – | | | | – | | | | 153 | |
Exclude straight-line rent adjustment | | | (1,095 | ) | | | – | | | | – | | | | – | | | | (1,095 | ) | | | | | – | | | | – | | | | – | | | | – | | | | – | |
Exclude preference payment | | | 24 | | | | – | | | | – | | | | – | | | | 24 | | | | | | – | | | | – | | | | – | | | | – | | | | – | |
Adjusted operating expenses | | | 100,711 | | | | 5,303 | | | | 25,449 | | | | 2,828 | | | | 123,685 | | | | | | 55,585 | | | | 7,006 | | | | 21,015 | | | | – | | | | 69,594 | |
Net operating income | | | 116,325 | | | | 2,572 | | | | – | | | | (348 | ) | | | 113,405 | | | | | | 45,400 | | | | 841 | | | | – | | | | – | | | | 44,559 | |
Interest expense | | | 41,830 | | | | 2,328 | | | | 16,652 | | | | 106 | | | | 56,260 | | | | | | 6,677 | | | | 332 | | | | 9,774 | | | | – | | | | 16,119 | |
Interest expense of unconsolidated entities | | | 16,652 | | | | – | | | | (16,652 | ) | | | – | | | | – | | | | | | 9,774 | | | | – | | | | (9,774 | ) | | | – | | | | – | |
(Gain) loss on early extinguishment of debt | | | (900 | ) | | | (134 | ) | | | 1 | | | | – | | | | (765 | ) | | | | | 644 | | | | – | | | | (115 | ) | | | – | | | | 529 | |
(Gain) loss on early extinguishment of debt of unconsolidated entities | | | 1 | | | | – | | | | (1 | ) | | | – | | | | – | | | | | | (115 | ) | | | – | | | | 115 | | | | – | | | | – | |
Noncontrolling interest in earnings before depreciation and amortization | | | 378 | | | | 378 | | | | – | | | | – | | | | – | | | | | | 509 | | | | 509 | | | | – | | | | – | | | | – | |
Allowance for projects under development revision | | | 700 | | | | – | | | | – | | | | – | | | | 700 | | | | | | 300 | | | | – | | | | – | | | | – | | | | 300 | |
Add: Pre-Tax EBDT from discontinued operations | | | (454 | ) | | | – | | | | – | | | | 454 | | | | – | | | | | | – | | | | – | | | | – | | | | – | | | | – | |
Pre-Tax EBDT | | | 58,610 | | | | – | | | | – | | | | – | | | | 58,610 | | | | | | 28,211 | | | | – | | | | – | | | | – | | | | 28,211 | |
Income tax expense (benefit) | | | – | | | | – | | | | – | | | | – | | | | – | | | | | | – | | | | – | | | | – | | | | – | | | | – | |
Earnings before depreciation, amortization and deferred taxes (EBDT) | | $ | 58,610 | | | $ | – | | | $ | – | | | $ | – | | | $ | 58,610 | | | | | $ | 28,211 | | | $ | – | | | $ | – | | | $ | – | | | $ | 28,211 | |
Reconciliation to net earnings: | | | | | | | | | | | | | | | | | | | | | | | | | | | | | | | | | | | | | | | | | | |
Earnings before depreciation, amortization and deferred taxes (EBDT) | | $ | 58,610 | | | $ | – | | | $ | – | | | $ | – | | | $ | 58,610 | | | | | $ | 28,211 | | | $ | – | | | $ | – | | | $ | – | | | $ | 28,211 | |
Depreciation and amortization-Real Estate Groups | | | (50,496 | ) | | | – | | | | – | | | | (215 | ) | | | (50,711 | ) | | | | | (21,876 | ) | | | – | | | | – | | | | – | | | | (21,876 | ) |
Amortization of mortgage procurement costs-Real Estate Groups | | | (2,699 | ) | | | – | | | | – | | | | (2 | ) | | | (2,701 | ) | | | | | (785 | ) | | | – | | | | – | | | | – | | | | (785 | ) |
Straight-line rent adjustment | | | 4,313 | | | | – | | | | – | | | | – | | | | 4,313 | | | | | | (100 | ) | | | – | | | | – | | | | – | | | | (100 | ) |
Preference payment | | | 24 | | | | – | | | | – | | | | – | | | | 24 | | | | | | – | | | | – | | | | – | | | | – | | | | – | |
Gain on disposition of rental properties and partial interests in rental properties, net of noncontrolling interest | | | – | | | | – | | | | – | | | | 11,859 | | | | 11,859 | | | | | | 2,255 | | | | – | | | | – | | | | – | | | | 2,255 | |
Impairment of consolidated and unconsolidated real estate | | | – | | | | – | | | | (1,095 | ) | | | – | | | | (1,095 | ) | | | | | – | | | | – | | | | – | | | | – | | | | – | |
Impairment of unconsolidated real estate | | | (1,095 | ) | | | – | | | | 1,095 | | | | – | | | | – | | | | | | – | | | | – | | | | – | | | | – | | | | – | |
Allowance for projects under development revision | | | (700 | ) | | | – | | | | – | | | | – | | | | (700 | ) | | | | | (300 | ) | | | — | | | | — | | | | — | | | | (300 | ) |
Discontinued operations: | | | | | | | | | | | | | | | | | | | | | | | | | | | | | | | | | | | | | | | | | | |
Depreciation and amortization-Real Estate Groups | | | (215 | ) | | | – | | | | – | | | | 215 | | | | – | | | | | | – | | | | – | | | | – | | | | – | | | | – | |
Amortization of mortgage procurement costs-Real Estate Groups | | | (2 | ) | | | – | | | | – | | | | 2 | | | | – | | | | | | – | | | | – | | | | – | | | | – | | | | – | |
Gain on disposition of rental properties | | | 11,859 | | | | – | | | | – | | | | (11,859 | ) | | | – | | | | | | – | | | | – | | | | – | | | | – | | | | – | |
Net earnings (loss) attributable to Forest City Enterprises, Inc. | | $ | 19,599 | | | $ | – | | | $ | – | | | $ | – | | | $ | 19,599 | | | | | $ | 7,405 | | | $ | – | | | $ | – | | | $ | – | | | $ | 7,405 | |
52
Forest City Enterprises, Inc. and Subsidiaries
Supplemental Financial Information
Summary of Earnings Before Depreciation, Amortization and Deferred Taxes (EBDT) — Three Months Ended January 31, 2012(in thousands) (continued)
| | | | | | | | | | | | | | | | | | | | | | | | | | | | | | | | | | | | | | | | | | | | |
| | | Land Development Group 2011 | | | | | | The Nets 2011 | |
| | | | | | | | | Plus | | | | | | | | | | | | | | | | | | Plus | | | | | | | |
| | | Full
Consolidation
(GAAP) | | | Less
Noncontrolling
Interest | | | Unconsolidated
Investments at
Pro-Rata | | | Plus
Discontinued
Operations | | | Pro-Rata
Consolidation
(Non-GAAP) | | | | | | Full
Consolidation
(GAAP) | | | Less
Noncontrolling
Interest | | | Unconsolidated
Investments at
Pro-Rata | | | Plus
Discontinued
Operations | | | Pro-Rata
Consolidation
(Non-GAAP) | |
Revenues from real estate operations | | $ | 20,348 | | | $ | 1,772 | | | $ | 4,810 | | | $ | - | | | $ | 23,386 | | | | | | | $ | - | | | $ | - | | | $ | - | | | $ | - | | | $ | - | |
Exclude straight-line rent adjustment | | | - | | | | - | | | | - | | | | - | | | | - | | | | | | | | - | | | | - | | | | - | | | | - | | | | - | |
Adjusted revenues | | | 20,348 | | | | 1,772 | | | | 4,810 | | | | - | | | | 23,386 | | | | | | | | - | | | | - | | | | - | | | | - | | | | - | |
Add interest and other income | | | 2,813 | | | | 226 | | | | - | | | | - | | | | 2,587 | | | | | | | | - | | | | - | | | | - | | | | - | | | | - | |
Add equity in earnings (loss) of unconsolidated entities, including impairment | | | (38,508 | ) | | | - | | | | 38,518 | | | | - | | | | 10 | | | | | | | | (11,845 | ) | | | - | | | | - | | | | - | | | | (11,845 | ) |
Exclude impairment of unconsolidated real estate | | | 39,802 | | | | - | | | | (39,802 | ) | | | - | | | | - | | | | | | | | - | | | | - | | | | - | | | | - | | | | - | |
Exclude depreciation and amortization of unconsolidated entities | | | 64 | | | | - | | | | (64 | ) | | | - | | | | - | | | | | | | | - | | | | - | | | | - | | | | - | | | | - | |
Exclude interest expense of unconsolidated entities | | | 31 | | | | - | | | | (31 | ) | | | - | | | | - | | | | | | | | - | | | | - | | | | - | | | | - | | | | - | |
Exclude (gain) loss on early extinguishment of debt of unconsolidated entities | | | - | | | | - | | | | - | | | | - | | | | - | | | | | | | | - | | | | - | | | | - | | | | - | | | | - | |
Adjusted total income | | | 24,550 | | | | 1,998 | | | | 3,431 | | | | - | | | | 25,983 | | | | | | | | (11,845 | ) | | | - | | | | - | | | | - | | | | (11,845 | ) |
Operating expenses | | | 18,457 | | | | 1,291 | | | | 3,431 | | | | - | | | | 20,597 | | | | | | | | - | | | | - | | | | - | | | | - | | | | - | |
Non-Real Estate depreciation and amortization and amortization of mortgage procurement costs | | | 22 | | | | - | | | | - | | | | - | | | | 22 | | | | | | | | - | | | | - | | | | - | | | | - | | | | - | |
Exclude straight-line rent adjustment | | | - | | | | - | | | | - | | | | - | | | | - | | | | | | | | - | | | | - | | | | - | | | | - | | | | - | |
Exclude preference payment | | | - | | | | - | | | | - | | | | - | | | | - | | | | | | | | - | | | | - | | | | - | | | | - | | | | - | |
Adjusted operating expenses | | | 18,479 | | | | 1,291 | | | | 3,431 | | | | - | | | | 20,619 | | | | | | | | - | | | | - | | | | - | | | | - | | | | - | |
Net operating income | | | 6,071 | | | | 707 | | | | - | | | | - | | | | 5,364 | | | | | | | | (11,845 | ) | | | - | | | | - | | | | - | | | | (11,845 | ) |
Interest expense | | | 978 | | | | 163 | | | | 31 | | | | - | | | | 846 | | | | | | | | - | | | | - | | | | - | | | | - | | | | - | |
Interest expense of unconsolidated entities | | | 31 | | | | - | | | | (31 | ) | | | - | | | | - | | | | | | | | - | | | | - | | | | - | | | | - | | | | - | |
(Gain) loss on early extinguishment of debt | | | - | | | | - | | | | - | | | | - | | | | - | | | | | | | | - | | | | - | | | | - | | | | - | | | | - | |
(Gain) loss on early extinguishment of debt of unconsolidated entities | | | - | | | | - | | | | - | | | | - | | | | - | | | | | | | | - | | | | - | | | | - | | | | - | | | | - | |
Noncontrolling interest in earnings before depreciation and amortization | | | 544 | | | | 544 | | | | - | | | | - | | | | - | | | | | | | | - | | | | - | | | | - | | | | - | | | | - | |
Allowance for projects under development revision | | | - | | | | - | | | | - | | | | - | | | | - | | | | - | | | | - | | | | - | | | | - | | | | - | | | | - | |
Add: Pre-Tax EBDT from discontinued operations | | | - | | | | - | | | | - | | | | - | | | | - | | | | | | | | - | | | | - | | | | - | | | | - | | | | - | |
Pre-Tax EBDT | | | 4,518 | | | | - | | | | - | | | | - | | | | 4,518 | | | | | | | | (11,845 | ) | | | - | | | | - | | | | - | | | | (11,845 | ) |
Income tax expense (benefit) | | | - | | | | - | | | | - | | | | - | | | | - | | | | | | | | - | | | | - | | | | - | | | | - | | | | - | |
Earnings before depreciation, amortization and deferred taxes (EBDT) | | $ | 4,518 | | | $ | - | | | $ | - | | | $ | - | | | $ | 4,518 | | | | | | | $ | (11,845 | ) | | $ | - | | | $ | - | | | $ | - | | | $ | (11,845 | ) |
Reconciliation to net earnings: | | | | | | | | | | | | | | | | | | | | | | | | | | | | | | | | | | | | | | | | | | | | |
Earnings before depreciation, amortization and deferred taxes (EBDT) | | $ | 4,518 | | | $ | - | | | $ | - | | | $ | - | | | $ | 4,518 | | | | | | | $ | (11,845 | ) | | $ | - | | | $ | - | | | $ | - | | | $ | (11,845 | ) |
Depreciation and amortization-Real Estate Groups | | | (55 | ) | | | - | | | | - | | | | - | | | | (55 | ) | | | | | | | - | | | | - | | | | - | | | | - | | | | - | |
Amortization of mortgage procurement costs-Real Estate Groups | | | (85 | ) | | | - | | | | - | | | | - | | | | (85 | ) | | | | | | | - | | | | - | | | | - | | | | - | | | | - | |
Straight-line rent adjustment | | | - | | | | - | | | | - | | | | - | | | | - | | | | | | | | - | | | | - | | | | - | | | | - | | | | - | |
Preference payment | | | - | | | | - | | | | - | | | | - | | | | - | | | | | | | | - | | | | - | | | | - | | | | - | | | | - | |
Gain on disposition of rental properties and partial interests in rental properties, net of noncontrolling interest | | | - | | | | - | | | | - | | | | - | | | | - | | | | | | | | - | | | | - | | | | - | | | | - | | | | - | |
Impairment of consolidated and unconsolidated real estate | | | (113,561 | ) | | | - | | | | (39,802 | ) | | | - | | | | (153,363 | ) | | | | | | | - | | | | - | | | | - | | | | - | | | | - | |
Impairment of unconsolidated real estate | | | (39,802 | ) | | | - | | | | 39,802 | | | | - | | | | - | | | | | | | | - | | | | - | | | | - | | | | - | | | | - | |
Allowance for projects under development revision | | | - | | | | - | | | | - | | | | - | | | | - | | | | - | | | | - | | | | - | | | | - | | | | - | | | | - | |
Discontinued operations: | | | | | | | | | | | | | | | | | | | | | | | | | | | | | | | | | | | | | | | | | | | | |
Depreciation and amortization-Real Estate Groups | | | - | | | | - | | | | - | | | | - | | | | - | | | | | | | | - | | | | - | | | | - | | | | - | | | | - | |
Amortization of mortgage procurement costs-Real Estate Groups | | | - | | | | - | | | | - | | | | - | | | | - | | | | | | | | - | | | | - | | | | - | | | | - | | | | - | |
Gain on disposition of rental properties | | | - | | | | - | | | | - | | | | - | | | | - | | | | | | | | - | | | | - | | | | - | | | | - | | | | - | |
Net earnings (loss) attributable to Forest City Enterprises, Inc. | | $ | (148,985 | ) | | $ | - | | | $ | - | | | $ | - | | | $ | (148,985 | ) | | | | | | $ | (11,845 | ) | | $ | - | | | $ | - | | | $ | - | | | $ | (11,845 | ) |
53
Forest City Enterprises, Inc. and Subsidiaries
Supplemental Financial Information
Summary of Earnings Before Depreciation, Amortization and Deferred Taxes (EBDT) –Three Months Ended January 31, 2012(in thousands) (continued)
| | | | | | | | | | | | | | | | | | | | | | | | | | | | | | | | | | | | | | | | | | |
| | | Corporate Activities 2011 | | | | | Total 2011 | |
| | | Full Consolidation (GAAP) | | | Less Noncontrolling Interest | | | Plus
Unconsolidated Investments at Pro-Rata | | | Plus Discontinued Operations | | | Pro-Rata Consolidation (Non-GAAP) | | | | | Full Consolidation (GAAP) | | | Less Noncontrolling Interest | | | Plus
Unconsolidated Investments at
Pro-Rata | | | Plus Discontinued Operations | | | Pro-Rata Consolidation (Non-GAAP) | |
Revenues from real estate operations | | $ | – | | | $ | – | | | $ | – | | | $ | – | | | $ | – | | | | | $ | 281,249 | | | $ | 17,675 | | | $ | 106,313 | | | $ | 2,481 | | | $ | 372,368 | |
Exclude straight-line rent adjustment | | | – | | | | – | | | | – | | | | – | | | | – | | | | | | (5,308 | ) | | | – | | | | – | | | | – | | | | (5,308 | ) |
Adjusted revenues | | | – | | | | – | | | | – | | | | – | | | | – | | | | | | 275,941 | | | | 17,675 | | | | 106,313 | | | | 2,481 | | | | 367,060 | |
Add interest and other income | | | 43 | | | | – | | | | – | | | | – | | | | 43 | | | | | | 10,001 | | | | 458 | | | | 342 | | | | (1 | ) | | | 9,884 | |
Add equity in earnings (loss) of unconsolidated entities, including impairment | | | – | | | | – | | | | – | | | | – | | | | – | | | | | | (43,402 | ) | | | (413 | ) | | | 31,469 | | | | – | | | | (11,520 | ) |
Exclude impairment of unconsolidated real estate | | | – | | | | – | | | | – | | | | – | | | | – | | | | | | 40,897 | | | | – | | | | (40,897 | ) | | | – | | | | – | |
Exclude depreciation and amortization of unconsolidated entities | | | – | | | | – | | | | – | | | | – | | | | – | | | | | | 20,989 | | | | – | | | | (20,989 | ) | | | – | | | | – | |
Exclude interest expense of unconsolidated entities | | | – | | | | – | | | | – | | | | – | | | | – | | | | | | 26,457 | | | | – | | | | (26,457 | ) | | | – | | | | – | |
Exclude (gain) loss on early extinguishment of debt of unconsolidated entities | | | – | | | | – | | | | – | | | | – | | | | – | | | | | | (114 | ) | | | – | | | | 114 | | | | – | | | | – | |
Adjusted total income | | | 43 | | | | – | | | | – | | | | – | | | | 43 | | | | | | 330,769 | | | | 17,720 | | | | 49,895 | | | | 2,480 | | | | 365,424 | |
Operating expenses | | | 16,027 | | | | – | | | | – | | | | – | | | | 16,027 | | | | | | 191,427 | | | | 13,600 | | | | 49,895 | | | | 2,828 | | | | 230,550 | |
Non-Real Estate depreciation and amortization and amortization of mortgage procurement costs | | | 401 | | | | – | | | | – | | | | – | | | | 401 | | | | | | 847 | | | | – | | | | – | | | | – | | | | 847 | |
Exclude straight-line rent adjustment | | | – | | | | – | | | | – | | | | – | | | | – | | | | | | (1,095 | ) | | | – | | | | – | | | | – | | | | (1,095 | ) |
Exclude preference payment | | | – | | | | – | | | | – | | | | – | | | | – | | | | | | 24 | | | | – | | | | – | | | | – | | | | 24 | |
Adjusted operating expenses | | | 16,428 | | | | – | | | | – | | | | – | | | | 16,428 | | | | | | 191,203 | | | | 13,600 | | | | 49,895 | | | | 2,828 | | | | 230,326 | |
Net operating income | | | (16,385 | ) | | | – | | | | – | | | | – | | | | (16,385 | ) | | | | | 139,566 | | | | 4,120 | | | | – | | | | (348 | ) | | | 135,098 | |
Interest expense | | | 14,643 | | | | – | | | | – | | | | – | | | | 14,643 | | | | | | 64,128 | | | | 2,823 | | | | 26,457 | | | | 106 | | | | 87,868 | |
Interest expense of unconsolidated entities | | | – | | | | – | | | | – | | | | – | | | | – | | | | | | 26,457 | | | | – | | | | (26,457 | ) | | | – | | | | – | |
(Gain) loss on early extinguishment of debt | | | – | | | | – | | | | – | | | | – | | | | – | | | | | | (256 | ) | | | (134 | ) | | | (114 | ) | | | – | | | | (236 | ) |
(Gain) loss on early extinguishment of debt of unconsolidated entities | | | – | | | | – | | | | – | | | | – | | | | – | | | | | | (114 | ) | | | – | | | | 114 | | | | – | | | | – | |
Noncontrolling interest in earnings before depreciation and amortization | | | – | | | | – | | | | – | | | | – | | | | – | | | | | | 1,431 | | | | 1,431 | | | | – | | | | – | | | | – | |
Allowance for projects under development revision | | | – | | | | – | | | | – | | | | – | | | | – | | | | | | 1,000 | | | | – | | | | – | | | | – | | | | 1,000 | |
Add: Pre-Tax EBDT from discontinued operations | | | – | | | | – | | | | – | | | | – | | | | – | | | | | | (454 | ) | | | – | | | | – | | | | 454 | | | | – | |
Pre-Tax EBDT | | | (31,028 | ) | | | – | | | | – | | | | – | | | | (31,028 | ) | | | | | 48,466 | | | | – | | | | – | | | | – | | | | 48,466 | |
Income tax expense (benefit) | | | (10,359 | ) | | | – | | | | – | | | | – | | | | (10,359 | ) | | | | | (10,359 | ) | | | – | | | | – | | | | – | | | | (10,359 | ) |
Earnings before depreciation, amortization and deferred taxes (EBDT) | | $ | (20,669 | ) | | $ | – | | | $ | – | | | $ | – | | | $ | (20,669 | ) | | | | $ | 58,825 | | | $ | – | | | $ | – | | | $ | – | | | $ | 58,825 | |
Reconciliation to net earnings: | | | | | | | | | | | | | | | | | | | | | | | | | | | | | | | | | | | | | | | | | | |
Earnings before depreciation, amortization and deferred taxes (EBDT) | | $ | (20,669 | ) | | $ | – | | | $ | – | | | $ | – | | | $ | (20,669 | ) | | | | $ | 58,825 | | | $ | – | | | $ | – | | | $ | – | | | $ | 58,825 | |
Depreciation and amortization-Real Estate Groups | | | – | | | | – | | | | – | | | | – | | | | – | | | | | | (72,427 | ) | | | – | | | | – | | | | (215 | ) | | | (72,642 | ) |
Amortization of mortgage procurement costs-Real Estate Groups | | | – | | | | – | | | | – | | | | – | | | | – | | | | | | (3,569 | ) | | | – | | | | – | | | | (2 | ) | | | (3,571 | ) |
Straight-line rent adjustment | | | – | | | | – | | | | – | | | | – | | | | – | | | | | | 4,213 | | | | – | | | | – | | | | – | | | | 4,213 | |
Preference payment | | | – | | | | – | | | | – | | | | – | | | | – | | | | | | 24 | | | | – | | | | – | | | | – | | | | 24 | |
Gain on disposition of rental properties and partial interests | | | | | | | | | | | | | | | | | | | | | | | | | | | | | | | | | | | | | – | | | | | |
in rental properties, net of noncontrolling interest | | | – | | | | – | | | | – | | | | – | | | | – | | | | | | 2,255 | | | | – | | | | – | | | | 11,859 | | | | 14,114 | |
Impairment of consolidated and unconsolidated real estate | | | – | | | | – | | | | – | | | | – | | | | – | | | | | | (113,561 | ) | | | – | | | | (40,897 | ) | | | – | | | | (154,458 | ) |
Impairment of unconsolidated real estate | | | – | | | | – | | | | – | | | | – | | | | – | | | | | | (40,897 | ) | | | – | | | | 40,897 | | | | – | | | | – | |
Allowance for projects under development revision | | | – | | | | – | | | | – | | | | – | | | | – | | | | | | (1,000 | ) | | | – | | | | – | | | | – | | | | (1,000 | ) |
Discontinued operations: | | | | | | | | | | | | | | | | | | | | | | | | | | | | | | | | | | | | | – | | | | | |
Depreciation and amortization-Real Estate Groups | | | – | | | | – | | | | – | | | | – | | | | – | | | | | | (215 | ) | | | – | | | | – | | | | 215 | | | | – | |
Amortization of mortgage procurement costs-Real Estate Groups | | | – | | | | – | | | | – | | | | – | | | | – | | | | | | (2 | ) | | | – | | | | – | | | | 2 | | | | – | |
Gain on disposition of rental properties | | | – | | | | – | | | | – | | | | – | | | | – | | | | | | 11,859 | | | | – | | | | – | | | | (11,859 | ) | | | – | |
Tax (expense) benefit: | | | | | | | | | | | | | | | | | | | | | | | | | | | | | | | | | | | | | | | | | | |
Deferred taxes | | | 57,122 | | | | – | | | | – | | | | – | | | | 57,122 | | | | | | 57,122 | | | | – | | | | – | | | | – | | | | 57,122 | |
Gain (loss) on disposition of rental properties and partial interest in rental properties | | | (8,013 | ) | | | – | | | | – | | | | – | | | | (8,013 | ) | | | | | (8,013 | ) | | | – | | | | – | | | | – | | | | (8,013 | ) |
Net earnings (loss) attributable to Forest City Enterprises, Inc. | | $ | 28,440 | | | $ | – | | | $ | – | | | $ | – | | | $ | 28,440 | | | | | $ | (105,386 | ) | | $ | – | | | $ | – | | | $ | – | | | $ | (105,386 | ) |
Preferred dividends | | | (3,850 | ) | | | – | | | | – | | | | – | | | | (3,850 | ) | | | | | (3,850 | ) | | | – | | | | – | | | | – | | | | (3,850 | ) |
Net earnings (loss) attributable to Forest City Enterprises, Inc. common shareholders | | $ | 24,590 | | | $ | – | | | $ | – | | | $ | – | | | $ | 24,590 | | | | | $ | (109,236 | ) | | $ | – | | | $ | – | | | $ | – | | | $ | (109,236 | ) |
54
Forest City Enterprises, Inc. and Subsidiaries
Supplemental Financial Information
Summary of Earnings Before Depreciation, Amortization and Deferred Taxes (EBDT) — Year Ended January 31, 2012(in thousands)
| | | | | | | | | | | | | | | | | | | | | | | | | | | | | | | | | | | | | | | | | | |
| | | Commercial Group 2011 | | | | | Residential Group 2011 | |
| | | Full Consolidation (GAAP) | | | Less Noncontrolling Interest | | | Plus Unconsolidated Investments at Pro-Rata | | | Plus Discontinued Operations | | | Pro-Rata Consolidation (Non-GAAP) | | | | | Full Consolidation (GAAP) | | | Less Noncontrolling Interest | | | Plus Unconsolidated Investments at Pro-Rata | | | Plus Discontinued Operations | | | Pro-Rata Consolidation (Non-GAAP) | |
Revenues from real estate operations | | $ | 790,430 | | | $ | 34,550 | | | $ | 218,438 | | | $ | 23,173 | | | $ | 997,491 | | | | | $ | 255,127 | | | $ | 18,124 | | | $ | 153,417 | | | $ | – | | | $ | 390,420 | |
Exclude straight-line rent adjustment | | | (10,942 | ) | | | – | | | | – | | | | (571 | ) | | | (11,513 | ) | | | | | (192 | ) | | | – | | | | – | | | | – | | | | (192 | ) |
Adjusted revenues | | | 779,488 | | | | 34,550 | | | | 218,438 | | | | 22,602 | | | | 985,978 | | | | | | 254,935 | | | | 18,124 | | | | 153,417 | | | | – | | | | 390,228 | |
Add interest and other income | | | 21,198 | | | | (62 | ) | | | 162 | | | | 2 | | | | 21,424 | | | | | | 19,816 | | | | 556 | | | | 894 | | | | – | | | | 20,154 | |
Add equity in earnings (loss) of unconsolidated entities, including impairment | | | (20,397 | ) | | | – | | | | 20,397 | | | | – | | | | – | | | | | | 23,049 | | | | (185 | ) | | | (22,633 | ) | | | – | | | | 601 | |
Exclude gain on disposition of unconsolidated entities | | | – | | | | – | | | | – | | | | – | | | | – | | | | | | (12,567 | ) | | | – | | | | 12,567 | | | | – | | | | – | |
Exclude impairment of unconsolidated real estate | | | 40,284 | | | | – | | | | (40,284 | ) | | | – | | | | – | | | | | | – | | | | – | | | | – | | | | – | | | | – | |
Exclude depreciation and amortization of unconsolidated entities | | | 41,071 | | | | – | | | | (41,071 | ) | | | – | | | | – | | | | | | 29,542 | | | | – | | | | (29,542 | ) | | | – | | | | – | |
Exclude interest expense of unconsolidated entities | | | 64,130 | | | | – | | | | (64,130 | ) | | | – | | | | – | | | | | | 36,499 | | | | – | | | | (36,499 | ) | | | – | | | | – | |
Exclude (gain) loss on early extinguishment of debt of unconsolidated entities | | | 71 | | | | – | | | | (71 | ) | | | – | | | | – | | | | | | 2,221 | | | | – | | | | (2,221 | ) | | | – | | | | – | |
Adjusted total income | | | 925,845 | | | | 34,488 | | | | 93,441 | | | | 22,604 | | | | 1,007,402 | | | | | | 353,495 | | | | 18,495 | | | | 75,983 | | | | – | | | | 410,983 | |
Operating expenses | | | 390,607 | | | | 21,217 | | | | 93,441 | | | | 18,074 | | | | 480,905 | | | | | | 178,224 | | | | 14,728 | | | | 75,983 | | | | – | | | | 239,479 | |
Non-Real Estate depreciation and amortization and amortization of mortgage procurement costs | | | 1,011 | | | | – | | | | – | | | | – | | | | 1,011 | | | | | | 620 | | | | – | | | | – | | | | – | | | | 620 | |
Exclude straight-line rent adjustment | | | (4,560 | ) | | | – | | | | – | | | | – | | | | (4,560 | ) | | | | | 63 | | | | – | | | | – | | | | – | | | | 63 | |
Exclude preference payment | | | (1,732 | ) | | | – | | | | – | | | | – | | | | (1,732 | ) | | | | | – | | | | – | | | | – | | | | – | | | | – | |
| | | | |
Adjusted operating expenses | | | 385,326 | | | | 21,217 | | | | 93,441 | | | | 18,074 | | | | 475,624 | | | | | | 178,907 | | | | 14,728 | | | | 75,983 | | | | – | | | | 240,162 | |
Net operating income | | | 540,519 | | | | 13,271 | | | | – | | | | 4,530 | | | | 531,778 | | | | | | 174,588 | | | | 3,767 | | | | – | | | | – | | | | 170,821 | |
Interest expense | | | 168,810 | | | | 9,726 | | | | 64,130 | | | | 2,123 | | | | 225,337 | | | | | | 31,946 | | | | 1,713 | | | | 36,499 | | | | – | | | | 66,732 | |
Interest expense of unconsolidated entities | | | 64,130 | | | | – | | | | (64,130 | ) | | | – | | | | – | | | | | | 36,499 | | | | – | | | | (36,499 | ) | | | – | | | | – | |
(Gain) loss on early extinguishment of debt | | | (21,034 | ) | | | (1,641 | ) | | | 71 | | | | – | | | | (19,322 | ) | | | | | 644 | | | | – | | | | 2,221 | | | | – | | | | 2,865 | |
(Gain) loss on early extinguishment of debt of unconsolidated entities | | | 71 | | | | – | | | | (71 | ) | | | – | | | | – | | | | | | 2,221 | | | | – | | | | (2,221 | ) | | | – | | | | – | |
Noncontrolling interest in earnings before depreciation and amortization | | | 5,186 | | | | 5,186 | | | | – | | | | – | | | | – | | | | | | 2,054 | | | | 2,054 | | | | – | | | | – | | | | – | |
Allowance for projects under development revision | | | (700 | ) | | | – | | | | – | | | | – | | | | (700 | ) | | | | | (300 | ) | | | – | | | | – | | | | – | | | | (300 | ) |
Add: Pre-Tax EBDT from discontinued operations | | | 2,407 | | | | – | | | | – | | | | (2,407 | ) | | | – | | | | | | – | | | | – | | | | – | | | | – | | | | – | |
Pre-Tax EBDT | | | 325,063 | | | | – | | | | – | | | | – | | | | 325,063 | | | | | | 100,924 | | | | – | | | | – | | | | – | | | | 100,924 | |
Income tax expense (benefit) | | | – | | | | – | | | | – | | | | – | | | | – | | | | | | – | | | | – | | | | – | | | | – | | | | – | |
Earnings before depreciation, amortization and deferred taxes (EBDT) | | $ | 325,063 | | | $ | – | | | $ | – | | | $ | – | | | $ | 325,063 | | | | | $ | 100,924 | | | $ | – | | | $ | – | | | $ | – | | | $ | 100,924 | |
Reconciliation to net earnings: | | | | | | | | | | | | | | | | | | | | | | | | | | | | | | | | | | | | | | | | | | |
Earnings before depreciation, amortization and deferred taxes (EBDT) | | $ | 325,063 | | | $ | – | | | $ | – | | | $ | – | | | $ | 325,063 | | | | | $ | 100,924 | | | $ | – | | | $ | – | | | $ | – | | | $ | 100,924 | |
Depreciation and amortization - Real Estate Groups | | | (198,063 | ) | | | – | | | | – | | | | (3,154 | ) | | | (201,217 | ) | | | | | (80,238 | ) | | | – | | | | – | | | | – | | | | (80,238 | ) |
Amortization of mortgage procurement costs - Real Estate Groups | | | (10,519 | ) | | | – | | | | – | | | | (356 | ) | | | (10,875 | ) | | | | | (3,506 | ) | | | – | | | | – | | | | – | | | | (3,506 | ) |
Straight-line rent adjustment | | | 6,382 | | | | – | | | | – | | | | 571 | | | | 6,953 | | | | | | 255 | | | | – | | | | – | | | | – | | | | 255 | |
Preference payment | | | (1,732 | ) | | | – | | | | – | | | | – | | | | (1,732 | ) | | | | | – | | | | – | | | | – | | | | – | | | | – | |
Gain on disposition of rental properties and partial interests in rental properties, net of noncontrolling interest | | | 15,410 | | | | – | | | | – | | | | 51,796 | | | | 67,206 | | | | | | 2,255 | | | | – | | | | 12,567 | | | | – | | | | 14,822 | |
Gain on disposition of unconsolidated entities | | | – | | | | – | | | | – | | | | – | | | | – | | | | | | 12,567 | | | | – | | | | (12,567 | ) | | | – | | | | – | |
Impairment of consolidated and unconsolidated real estate | | | (3,435 | ) | | | – | | | | (40,284 | ) | | | (10,257 | ) | | | (53,976 | ) | | | | | (235 | ) | | | – | | | | – | | | | – | | | | (235 | ) |
Impairment of unconsolidated real estate | | | (40,284 | ) | | | – | | | | 40,284 | | | | – | | | | – | | | | | | – | | | | – | | | | – | | | | – | | | | – | |
Allowance for projects under development revision | | | 700 | | | | – | | | | – | | | | – | | | | 700 | | | | | | 300 | | | | – | | | | – | | | | – | | | | 300 | |
Discontinued operations: | | | | | | | | | | | | | | | | | | | | | | | | | | | | | | | | | | | | | | | | | | |
Depreciation and amortization - Real Estate Groups | | | (3,154 | ) | | | – | | | | – | | | | 3,154 | | | | – | | | | | | – | | | | – | | | | – | | | | – | | | | – | |
Amortization of mortgage procurement costs - Real Estate Groups | | | (356 | ) | | | – | | | | – | | | | 356 | | | | – | | | | | | – | | | | – | | | | – | | | | – | | | | – | |
Straight-line rent adjustment | | | 571 | | | | – | | | | – | | | | (571 | ) | | | – | | | | | | – | | | | – | | | | – | | | | – | | | | – | |
Gain on disposition of rental properties | | | 51,796 | | | | – | | | | – | | | | (51,796 | ) | | | – | | | | | | – | | | | – | | | | – | | | | – | | | | – | |
Impairment of consolidated and unconsolidated real estate | | | (10,257 | ) | | | – | | | | – | | | | 10,257 | | | | – | | | | | | – | | | | – | | | | – | | | | – | | | | – | |
Net earnings (loss) attributable to Forest City Enterprises, Inc. | | $ | 132,122 | | | $ | – | | | $ | – | | | $ | – | | | $ | 132,122 | | | | | $ | 32,322 | | | $ | – | | | $ | – | | | $ | – | | | $ | 32,322 | |
55
Forest City Enterprises, Inc. and Subsidiaries
Supplemental Financial Information
Summary of Earnings Before Depreciation, Amortization and Deferred Taxes (EBDT) — Year Ended January 31, 2012(in thousands) (continued)
| | | | | | | | | | | | | | | | | | | | | | | | | | | | | | | | | | | | | | | | |
| | | Land Development Group 2011 | | | The Nets 2011 | |
| | | Full
Consolidation
(GAAP) | | | Less
Noncontrolling
Interest | | | Plus
Unconsolidated
Investments at
Pro-Rata | | | Plus
Discontinued
Operations | | | Pro-Rata
Consolidation
(Non-GAAP) | | | Full
Consolidation
(GAAP) | | | Less
Noncontrolling
Interest | | | Plus
Unconsolidated
Investments at
Pro-Rata | | | Plus
Discontinued
Operations | | | Pro-Rata
Consolidation
(Non-GAAP) | |
Revenues from real estate operations | | $ | 44,420 | | | $ | 3,434 | | | $ | 13,666 | | | $ | – | | | $ | 54,652 | | | $ | – | | | $ | – | | | $ | – | | | $ | – | | | $ | – | |
Exclude straight-line rent adjustment | | | – | | | | – | | | | – | | | | – | | | | – | | | | – | | | | – | | | | – | | | | – | | | | – | |
Adjusted revenues | | | 44,420 | | | | 3,434 | | | | 13,666 | | | | – | | | | 54,652 | | | | – | | | | – | | | | – | | | | – | | | | – | |
Add interest and other income | | | 10,838 | | | | 876 | | | | (67 | ) | | | – | | | | 9,895 | | | | – | | | | – | | | | – | | | | – | | | | – | |
Add equity in earnings (loss) of unconsolidated entities, including impairment | | | (36,877 | ) | | | – | | | | 36,781 | | | | – | | | | (96 | ) | | | (26,814 | ) | | | – | | | | – | | | | – | | | | (26,814 | ) |
Exclude gain on disposition of unconsolidated entities | | | – | | | | – | | | | – | | | | – | | | | – | | | | – | | | | – | | | | – | | | | – | | | | – | |
Exclude impairment of unconsolidated real estate | | | 41,902 | | | | – | | | | (41,902 | ) | | | – | | | | – | | | | – | | | | – | | | | – | | | | – | | | | – | |
Exclude depreciation and amortization of unconsolidated entities | | | 257 | | | | – | | | | (257 | ) | | | – | | | | – | | | | – | | | | – | | | | – | | | | – | | | | – | |
Exclude interest expense of unconsolidated entities | | | 329 | | | | – | | | | (329 | ) | | | – | | | | – | | | | – | | | | – | | | | – | | | | – | | | | – | |
Exclude (gain) loss on early extinguishment of debt of unconsolidated entities | | | (1,926 | ) | | | – | | | | 1,926 | | | | – | | | | – | | | | – | | | | – | | | | – | | | | – | | | | – | |
Adjusted total income | | | 58,943 | | | | 4,310 | | | | 9,818 | | | | – | | | | 64,451 | | | | (26,814 | ) | | | – | | | | – | | | | – | | | | (26,814 | ) |
Operating expenses | | | 47,543 | | | | 2,849 | | | | 9,818 | | | | – | | | | 54,512 | | | | – | | | | – | | | | – | | | | – | | | | – | |
Non-Real Estate depreciation and amortization and amortization of mortgage procurement costs | | | 102 | | | | – | | | | – | | | | – | | | | 102 | | | | – | | | | – | | | | – | | | | – | | | | – | |
Exclude straight-line rent adjustment | | | – | | | | – | | | | – | | | | – | | | | – | | | | – | | | | – | | | | – | | | | – | | | | – | |
Exclude preference payment | | | – | | | | – | | | | – | | | | – | | | | – | | | | – | | | | – | | | | – | | | | – | | | | – | |
Adjusted operating expenses | | | 47,645 | | | | 2,849 | | | | 9,818 | | | | – | | | | 54,614 | | | | – | | | | – | | | | – | | | | – | | | | – | |
Net operating income | | | 11,298 | | | | 1,461 | | | | – | | | | – | | | | 9,837 | | | | (26,814 | ) | | | – | | | | – | | | | – | | | | (26,814 | ) |
Interest expense | | | 3,443 | | | | 550 | | | | 329 | | | | – | | | | 3,222 | | | | – | | | | – | | | | – | | | | – | | | | – | |
Interest expense of unconsolidated entities | | | 329 | | | | – | | | | (329 | ) | | | – | | | | – | | | | – | | | | – | | | | – | | | | – | | | | – | |
(Gain) loss on early extinguishment of debt | | | – | | | | – | | | | (1,926 | ) | | | – | | | | (1,926 | ) | | | – | | | | – | | | | – | | | | – | | | | – | |
(Gain) loss on early extinguishment of debt of unconsolidated entities | | | (1,926 | ) | | | – | | | | 1,926 | | | | – | | | | – | | | | – | | | | – | | | | – | | | | – | | | | – | |
Noncontrolling interest in earnings before depreciation and amortization | | | 911 | | | | 911 | | | | – | | | | – | | | | – | | | | – | | | | – | | | | – | | | | – | | | | – | |
Allowance for projects under development revision | | | – | | | | – | | | | – | | | | – | | | | – | | | | – | | | | – | | | | – | | | | – | | | | – | |
Add: Pre-Tax EBDT from discontinued operations | | | – | | | | – | | | | – | | | | – | | | | – | | | | – | | | | – | | | | – | | | | – | | | | – | |
Pre-Tax EBDT | | | 8,541 | | | | – | | | | – | | | | – | | | | 8,541 | | | | (26,814 | ) | | | – | | | | – | | | | – | | | | (26,814 | ) |
Income tax expense (benefit) | | | – | | | | – | | | | – | | | | – | | | | – | | | | – | | | | – | | | | – | | | | – | | | | – | |
Earnings before depreciation, amortization and deferred taxes (EBDT) | | $ | 8,541 | | | $ | – | | | $ | – | | | $ | – | | | $ | 8,541 | | | $ | (26,814 | ) | | $ | – | | | $ | – | | | $ | – | | | $ | (26,814 | ) |
Reconciliation to net earnings: | | | | | | | | | | | | | | | | | | | | | | | | | | | | | | | | | | | | | | | | |
Earnings before depreciation, amortization and deferred taxes (EBDT) | | $ | 8,541 | | | $ | – | | | $ | – | | | $ | – | | | $ | 8,541 | | | $ | (26,814 | ) | | $ | – | | | $ | – | | | $ | – | | | $ | (26,814 | ) |
Depreciation and amortization - Real Estate Groups | | | (249 | ) | | | – | | | | – | | | | – | | | | (249 | ) | | | – | | | | – | | | | – | | | | – | | | | – | |
Amortization of mortgage procurement costs - Real Estate Groups | | | (289 | ) | | | – | | | | – | | | | – | | | | (289 | ) | | | – | | | | – | | | | – | | | | – | | | | – | |
Straight-line rent adjustment | | | – | | | | – | | | | – | | | | – | | | | – | | | | – | | | | – | | | | – | | | | – | | | | – | |
Preference payment | | | – | | | | – | | | | – | | | | – | | | | – | | | | – | | | | – | | | | – | | | | – | | | | – | |
Gain on disposition of rental properties and partial interests in rental properties, net of noncontrolling interest | | | – | | | | – | | | | – | | | | – | | | | – | | | | – | | | | – | | | | – | | | | – | | | | – | |
Gain on disposition of unconsolidated entities | | | – | | | | – | | | | – | | | | – | | | | – | | | | – | | | | – | | | | – | | | | – | | | | – | |
Impairment of consolidated and unconsolidated real estate | | | (115,411 | ) | | | – | | | | (41,902 | ) | | | – | | | | (157,313 | ) | | | – | | | | – | | | | – | | | | – | | | | – | |
Impairment of unconsolidated real estate | | | (41,902 | ) | | | – | | | | 41,902 | | | | – | | | | – | | | | – | | | | – | | | | – | | | | – | | | | – | |
Allowance for projects under development revision | | | – | | | | – | | | | – | | | | – | | | | – | | | | – | | | | – | | | | – | | | | – | | | | – | |
Discontinued operations: | | | | | | | | | | | | | | | | | | | | | | | | | | | | | | | | | | | | | | | | |
Depreciation and amortization - Real Estate Groups | | | – | | | | – | | | | – | | | | – | | | | – | | | | – | | | | – | | | | – | | | | – | | | | – | |
Amortization of mortgage procurement costs - Real Estate Groups | | | – | | | | – | | | | – | | | | – | | | | – | | | | – | | | | – | | | | – | | | | – | | | | – | |
Straight-line rent adjustment | | | – | | | | – | | | | – | | | | – | | | | – | | | | – | | | | – | | | | – | | | | – | | | | – | |
Gain on disposition of rental properties | | | – | | | | – | | | | – | | | | – | | | | – | | | | – | | | | – | | | | – | | | | – | | | | – | |
Impairment of consolidated and unconsolidated real estate | | | – | | | | – | | | | – | | | | – | | | | – | | | | – | | | | – | | | | – | | | | – | | | | – | |
Net earnings (loss) attributable to Forest City Enterprises, Inc. | | $ | (149,310 | ) | | $ | – | | | $ | – | | | $ | – | | | $ | (149,310 | ) | | $ | (26,814 | ) | | $ | – | | | $ | – | | | $ | – | | | $ | (26,814 | ) |
56
Forest City Enterprises, Inc. and Subsidiaries
Supplemental Financial Information
Summary of Earnings Before Depreciation, Amortization and Deferred Taxes (EBDT) — Year Ended January 31, 2012(in thousands) (continued)
| | | | | | | | | | | | | | | | | | | | | | | | | | | | | | | | | | | | | | | | | | |
| | | Corporate Activities 2011 | | | | | Total 2011 | |
| | | Full
Consolidation
(GAAP) | | | Less
Noncontrolling
Interest | | | Plus
Unconsolidated
Investments at
Pro–Rata | | | Plus
Discontinued
Operations | | | Pro–Rata
Consolidation
(Non–GAAP) | | | | | Full
Consolidation
(GAAP) | | | Less
Noncontrolling
Interest | | | Plus
Unconsolidated
Investments at
Pro–Rata | | | Plus
Discontinued
Operations | | | Pro–Rata
Consolidation
(Non–GAAP) | |
Revenues from real estate operations | | $ | – | | | $ | – | | | $ | – | | | $ | – | | | $ | – | | | | | $ | 1,089,977 | | | $ | 56,108 | | | $ | 385,521 | | | $ | 23,173 | | | $ | 1,442,563 | |
Exclude straight-line rent adjustment | | | – | | | | – | | | | – | | | | – | | | | – | | | | | | (11,134 | ) | | | – | | | | – | | | | (571 | ) | | | (11,705 | ) |
Adjusted revenues | | | – | | | | – | | | | – | | | | – | | | | – | | | | | | 1,078,843 | | | | 56,108 | | | | 385,521 | | | | 22,602 | | | | 1,430,858 | |
Add interest and other income | | | 262 | | | | – | | | | – | | | | – | | | | 262 | | | | | | 52,114 | | | | 1,370 | | | | 989 | | | | 2 | | | | 51,735 | |
Add equity in earnings (loss) of unconsolidated entities, including impairment | | | – | | | | – | | | | – | | | | – | | | | – | | | | | | (61,039 | ) | | | (185 | ) | | | 34,545 | | | | – | | | | (26,309 | ) |
Exclude gain on disposition of unconsolidated entities | | | – | | | | – | | | | – | | | | – | | | | – | | | | | | (12,567 | ) | | | – | | | | 12,567 | | | | – | | | | – | |
Exclude impairment of unconsolidated real estate | | | – | | | | – | | | | – | | | | – | | | | – | | | | | | 82,186 | | | | – | | | | (82,186 | ) | | | – | | | | – | |
Exclude depreciation and amortization of unconsolidated entities | | | – | | | | – | | | | – | | | | – | | | | – | | | | | | 70,870 | | | | – | | | | (70,870 | ) | | | – | | | | – | |
Exclude interest expense of unconsolidated entities | | | – | | | | – | | | | – | | | | – | | | | – | | | | | | 100,958 | | | | – | | | | (100,958 | ) | | | – | | | | – | |
Exclude (gain) loss on early extinguishment of debt of unconsolidated entities | | | – | | | | – | | | | – | | | | – | | | | – | | | | | | 366 | | | | – | | | | (366 | ) | | | – | | | | – | |
Adjusted total income | | | 262 | | | | – | | | | – | | | | – | | | | 262 | | | | | | 1,311,731 | | | | 57,293 | | | | 179,242 | | | | 22,604 | | | | 1,456,284 | |
Operating expenses | | | 52,585 | | | | – | | | | – | | | | – | | | | 52,585 | | | | | | 668,959 | | | | 38,794 | | | | 179,242 | | | | 18,074 | | | | 827,481 | |
Non-Real Estate depreciation and amortization and amortization of mortgage procurement costs | | | 1,514 | | | | – | | | | – | | | | – | | | | 1,514 | | | | | | 3,247 | | | | – | | | | – | | | | – | | | | 3,247 | |
Exclude straight-line rent adjustment | | | – | | | | – | | | | – | | | | – | | | | – | | | | | | (4,497 | ) | | | – | | | | – | | | | – | | | | (4,497 | ) |
Exclude preference payment | | | – | | | | – | | | | – | | | | – | | | | – | | | | | | (1,732 | ) | | | – | | | | – | | | | – | | | | (1,732 | ) |
Adjusted operating expenses | | | 54,099 | | | | – | | | | – | | | | – | | | | 54,099 | | | | | | 665,977 | | | | 38,794 | | | | 179,242 | | | | 18,074 | | | | 824,499 | |
Net operating income | | | (53,837 | ) | | | – | | | | – | | | | – | | | | (53,837 | ) | | | | | 645,754 | | | | 18,499 | | | | – | | | | 4,530 | | | | 631,785 | |
Interest expense | | | 56,838 | | | | – | | | | – | | | | – | | | | 56,838 | | | | | | 261,037 | | | | 11,989 | | | | 100,958 | | | | 2,123 | | | | 352,129 | |
Interest expense of unconsolidated entities | | | – | | | | – | | | | – | | | | – | | | | – | | | | | | 100,958 | | | | – | | | | (100,958 | ) | | | – | | | | – | |
(Gain) loss on early extinguishment of debt | | | 10,800 | | | | – | | | | – | | | | – | | | | 10,800 | | | | | | (9,590 | ) | | | (1,641 | ) | | | 366 | | | | – | | | | (7,583 | ) |
(Gain) loss on early extinguishment of debt of unconsolidated entities | | | – | | | | – | | | | – | | | | – | | | | – | | | | | | 366 | | | | – | | | | (366 | ) | | | – | | | | – | |
Noncontrolling interest in earnings before depreciation and amortization | | | – | | | | – | | | | – | | | | – | | | | – | | | | | | 8,151 | | | | 8,151 | | | | – | | | | – | | | | – | |
Allowance for projects under development revision | | | – | | | | – | | | | – | | | | – | | | | – | | | | | | (1,000 | ) | | | – | | | | – | | | | – | | | | (1,000 | ) |
Add: Pre-Tax EBDT from discontinued operations | | | – | | | | – | | | | – | | | | – | | | | – | | | | | | 2,407 | | | | – | | | | – | | | | (2,407 | ) | | | – | |
Pre-Tax EBDT | | | (121,475 | ) | | | – | | | | – | | | | – | | | | (121,475 | ) | | | | | 286,239 | | | | – | | | | – | | | | – | | | | 286,239 | |
Income tax expense (benefit) | | | (48,145 | ) | | | – | | | | – | | | | – | | | | (48,145 | ) | | | | | (48,145 | ) | | | – | | | | – | | | | – | | | | (48,145 | ) |
Earnings before depreciation, amortization and deferred taxes (EBDT) | | $ | (73,330 | ) | | $ | – | | | $ | – | | | $ | – | | | $ | (73,330 | ) | | | | $ | 334,384 | | | $ | – | | | $ | – | | | $ | – | | | $ | 334,384 | |
Reconciliation to net earnings: | | | | | | | | | | | | | | | | | | | | | | | | | | | | | | | | | | | | | | | | | | |
Earnings before depreciation, amortization and deferred taxes (EBDT) | | $ | (73,330 | ) | | $ | – | | | $ | – | | | $ | – | | | $ | (73,330 | ) | | | | $ | 334,384 | | | $ | – | | | $ | – | | | $ | – | | | $ | 334,384 | |
Depreciation and amortization - Real Estate Groups | | | – | | | | – | | | | – | | | | – | | | | – | | | | | | (278,550 | ) | | | – | | | | – | | | | (3,154 | ) | | | (281,704 | ) |
Amortization of mortgage procurement costs - Real Estate Groups | | | – | | | | – | | | | – | | | | – | | | | – | | | | | | (14,314 | ) | | | – | | | | – | | | | (356 | ) | | | (14,670 | ) |
Straight-line rent adjustment | | | – | | | | – | | | | – | | | | – | | | | – | | | | | | 6,637 | | | | – | | | | – | | | | 571 | | | | 7,208 | |
Preference payment | | | – | | | | – | | | | – | | | | – | | | | – | | | | | | (1,732 | ) | | | – | | | | – | | | | – | | | | (1,732 | ) |
Gain on disposition of rental properties and partial interests in rental properties, net of noncontrolling interest | | | – | | | | – | | | | – | | | | – | | | | – | | | | | | 17,665 | | | | – | | | | 12,567 | | | | 51,796 | | | | 82,028 | |
Gain on disposition of unconsolidated entities | | | – | | | | – | | | | – | | | | – | | | | – | | | | | | 12,567 | | | | – | | | | (12,567 | ) | | | – | | | | – | |
Impairment of consolidated and unconsolidated real estate | | | – | | | | – | | | | – | | | | – | | | | – | | | | | | (119,081 | ) | | | – | | | | (82,186 | ) | | | (10,257 | ) | | | (211,524 | ) |
Impairment of unconsolidated real estate | | | – | | | | – | | | | – | | | | – | | | | – | | | | | | (82,186 | ) | | | – | | | | 82,186 | | | | – | | | | – | |
Allowance for projects under development revision | | | – | | | | – | | | | – | | | | – | | | | – | | | | | | 1,000 | | | | – | | | | – | | | | – | | | | 1,000 | |
Discontinued operations: | | | | | | | | | | | | | | | | | | | | | | | | | | | | | | | | | | | | | | | | | | |
Depreciation and amortization - Real Estate Groups | | | – | | | | – | | | | – | | | | – | | | | – | | | | | | (3,154 | ) | | | – | | | | – | | | | 3,154 | | | | – | |
Amortization of mortgage procurement costs - Real Estate Groups | | | – | | | | – | | | | – | | | | – | | | | – | | | | | | (356 | ) | | | – | | | | – | | | | 356 | | | | – | |
Straight-line rent adjustment | | | – | | | | – | | | | – | | | | – | | | | – | | | | | | 571 | | | | – | | | | – | | | | (571 | ) | | | – | |
Gain on disposition of rental properties | | | – | | | | – | | | | – | | | | – | | | | – | | | | | | 51,796 | | | | – | | | | – | | | | (51,796 | ) | | | – | |
Impairment of consolidated and unconsolidated real estate | | | – | | | | – | | | | – | | | | – | | | | – | | | | | | (10,257 | ) | | | – | | | | – | | | | 10,257 | | | | – | |
Tax (expense) benefit: | | | | | | | | | | | | | | | | | | | | | | | | | | | | | | | | | | | | | | | | | | |
Deferred taxes | | | 48,508 | | | | – | | | | – | | | | – | | | | 48,508 | | | | | | 48,508 | | | | – | | | | – | | | | – | | | | 48,508 | |
Gain (loss) on disposition of rental properties and partial interest in rental properties | | | (49,984 | ) | | | – | | | | – | | | | – | | | | (49,984 | ) | | | | | (49,984 | ) | | | – | | | | – | | | | – | | | | (49,984 | ) |
Net earnings (loss) attributable to Forest City Enterprises, Inc. | | $ | (74,806 | ) | | $ | – | | | $ | – | | | $ | – | | | $ | (74,806 | ) | | | | $ | (86,486 | ) | | $ | – | | | $ | – | | | $ | – | | | $ | (86,486 | ) |
Preferred dividends | | | (15,400 | ) | | | – | | | | – | | | | – | | | | (15,400 | ) | | | | | (15,400 | ) | | | – | | | | – | | | | – | | | | (15,400 | ) |
Net loss attributable to Forest City Enterprises, Inc. common shareholders | | $ | (90,206 | ) | | $ | – | | | $ | – | | | $ | – | | | $ | (90,206 | ) | | | | $ | (101,886 | ) | | $ | – | | | $ | – | | | $ | – | | | $ | (101,886 | ) |
57
Forest City Enterprises, Inc. and Subsidiaries
Supplemental Financial Information
Summary of Earnings Before Depreciation, Amortization and Deferred Taxes (EBDT) — Three Months Ended January 31, 2011(in thousands)
| | | | | | | | | | | | | | | | | | | | | | | | | | | | | | | | | | | | | | | | | | |
| | | Commercial Group 2010 | | | | | Residential Group 2010 | |
| | | Full
Consolidation
(GAAP) | | | Less
Noncontrolling
Interest | | | Plus
Unconsolidated
Investments at
Pro–Rata | | | Plus
Discontinued
Operations | | | Pro–Rata
Consolidation
(Non–GAAP) | | | | | Full
Consolidation
(GAAP) | | | Less
Noncontrolling
Interest | | | Plus
Unconsolidated
Investments at
Pro–Rata | | | Plus
Discontinued
Operations | | | Pro–Rata
Consolidation
(Non–GAAP) | |
Revenues from real estate operations | | $ | 213,983 | | | $ | 12,219 | | | $ | 41,125 | | | $ | 14,978 | | | $ | 257,867 | | | | | $ | 53,597 | | | $ | 922 | | | $ | 37,102 | | | $ | – | | | $ | 89,777 | |
Exclude straight–line rent adjustment | | | (8,750 | ) | | | – | | | | – | | | | (627 | ) | | | (9,377 | ) | | | | | 215 | | | | – | | | | – | | | | – | | | | 215 | |
Adjusted revenues | | | 205,233 | | | | 12,219 | | | | 41,125 | | | | 14,351 | | | | 248,490 | | | | | | 53,812 | | | | 922 | | | | 37,102 | | | | – | | | | 89,992 | |
Add interest and other income | | | 9,951 | | | | 258 | | | | 39 | | | | 2 | | | | 9,734 | | | | | | 5,587 | | | | 151 | | | | 332 | | | | – | | | | 5,768 | |
Add equity in earnings (loss) of unconsolidated entities, including impairment | | | (32,514 | ) | | | – | | | | 32,514 | | | | – | | | | – | | | | | | 20,883 | | | | 1,719 | | | | (19,283 | ) | | | – | | | | (119 | ) |
Exclude gain on disposition of unconsolidated entities | | | – | | | | – | | | | – | | | | – | | | | – | | | | | | (15,633 | ) | | | – | | | | 15,633 | | | | – | | | | – | |
Exclude impairment of unconsolidated real estate | | | 35,000 | | | | – | | | | (35,000 | ) | | | – | | | | – | | | | | | – | | | | – | | | | – | | | | – | | | | – | |
Exclude depreciation and amortization of unconsolidated entities | | | 8,962 | | | | – | | | | (8,962 | ) | | | – | | | | – | | | | | | 6,830 | | | | – | | | | (6,830 | ) | | | – | | | | – | |
Exclude interest expense of unconsolidated entities | | | 13,464 | | | | – | | | | (13,464 | ) | | | – | | | | – | | | | | | 8,628 | | | | – | | | | (8,628 | ) | | | – | | | | – | |
Exclude (gain) loss on early extinguishment of debt of unconsolidated entities | | | (2,791 | ) | | | – | | | | 2,791 | | | | – | | | | – | | | | | | 6 | | | | – | | | | (6 | ) | | | – | | | | – | |
Adjusted total income | | | 237,305 | | | | 12,477 | | | | 19,043 | | | | 14,353 | | | | 258,224 | | | | | | 80,113 | | | | 2,792 | | | | 18,320 | | | | – | | | | 95,641 | |
Operating expenses | | | 105,134 | | | | 7,153 | | | | 19,043 | | | | 10,457 | | | | 127,481 | | | | | | 37,463 | | | | 307 | | | | 18,320 | | | | – | | | | 55,476 | |
Non–Real Estate depreciation and amortization and amortization of mortgage procurement costs | | | 395 | | | | – | | | | – | | | | – | | | | 395 | | | | | | 249 | | | | – | | | | – | | | | – | | | | 249 | |
Exclude straight–line rent adjustment | | | (1,248 | ) | | | – | | | | – | | | | – | | | | (1,248 | ) | | | | | 2 | | | | – | | | | – | | | | – | | | | 2 | |
Exclude preference payment | | | (585 | ) | | | – | | | | – | | | | – | | | | (585 | ) | | | | | – | | | | – | | | | – | | | | – | | | | – | |
Adjusted operating expenses | | | 103,696 | | | | 7,153 | | | | 19,043 | | | | 10,457 | | | | 126,043 | | | | | | 37,714 | | | | 307 | | | | 18,320 | | | | – | | | | 55,727 | |
Net operating income | | | 133,609 | | | | 5,324 | | | | – | | | | 3,896 | | | | 132,181 | | | | | | 42,399 | | | | 2,485 | | | | – | | | | – | | | | 39,914 | |
Interest expense | | | 48,811 | | | | 2,628 | | | | 13,464 | | | | 1,848 | | | | 61,495 | | | | | | 3,915 | | | | 329 | | | | 8,628 | | | | – | | | | 12,214 | |
Interest expense of unconsolidated entities | | | 13,464 | | | | – | | | | (13,464 | ) | | | – | | | | – | | | | | | 8,628 | | | | – | | | | (8,628 | ) | | | – | | | | – | |
(Gain) loss on early extinguishment of debt | | | – | | | | – | | | | (2,791 | ) | | | – | | | | (2,791 | ) | | | | | (1 | ) | | | – | | | | 6 | | | | – | | | | 5 | |
(Gain) loss on early extinguishment of debt of unconsolidated entities | | | (2,791 | ) | | | – | | | | 2,791 | | | | – | | | | – | | | | | | 6 | | | | – | | | | (6 | ) | | | – | | | | – | |
Noncontrolling interest in earnings before depreciation and amortization | | | 2,696 | | | | 2,696 | | | | – | | | | – | | | | – | | | | | | 2,156 | | | | 2,156 | | | | – | | | | – | | | | – | |
Add: Pre–Tax EBDT from discontinued operations | | | 2,048 | | | | – | | | | – | | | | (2,048 | ) | | | – | | | | | | – | | | | – | | | | – | | | | – | | | | – | |
Pre–Tax EBDT | | | 73,477 | | | | – | | | | – | | | | – | | | | 73,477 | | | | | | 27,695 | | | | – | | | | – | | | | – | | | | 27,695 | |
Income tax expense (benefit) | | | 2,138 | | | | – | | | | – | | | | – | | | | 2,138 | | | | | | 8,596 | | | | – | | | | – | | | | – | | | | 8,596 | |
Earnings before depreciation, amortization and deferred taxes (EBDT) | | $ | 71,339 | | | $ | – | | | $ | – | | | $ | – | | | $ | 71,339 | | | | | $ | 19,099 | | | $ | – | | | $ | – | | | $ | – | | | $ | 19,099 | |
Reconciliation to net earnings: | | | | | | | | | | | | | | | | | | | | | | | | | | | | | | | | | | | | | | | | | | |
Earnings before depreciation, amortization and deferred taxes (EBDT) | | $ | 71,339 | | | $ | – | | | $ | – | | | $ | – | | | $ | 71,339 | | | | | $ | 19,099 | | | $ | – | | | $ | – | | | $ | – | | | $ | 19,099 | |
Depreciation and amortization –Real Estate Groups | | | (51,683 | ) | | | – | | | | – | | | | (1,764 | ) | | | (53,447 | ) | | | | | (19,870 | ) | | | – | | | | – | | | | – | | | | (19,870 | ) |
Amortization of mortgage procurement costs – Real Estate Groups | | | (2,575 | ) | | | – | | | | – | | | | (271 | ) | | | (2,846 | ) | | | | | (709 | ) | | | – | | | | – | | | | – | | | | (709 | ) |
Deferred taxes –Real Estate Groups | | | 3,247 | | | | – | | | | – | | | | (950 | ) | | | 2,297 | | | | | | 8,225 | | | | – | | | | – | | | | – | | | | 8,225 | |
Straight–line rent adjustment | | | 7,502 | | | | – | | | | – | | | | 627 | | | | 8,129 | | | | | | (213 | ) | | | – | | | | – | | | | – | | | | (213 | ) |
Preference payment | | | (585 | ) | | | – | | | | – | | | | – | | | | (585 | ) | | | | | – | | | | – | | | | – | | | | – | | | | – | |
Gain on disposition of rental properties and partial interests in rental properties, net of tax | | | 825 | | | | – | | | | – | | | | 27,657 | | | | 28,482 | | | | | | – | | | | – | | | | 9,570 | | | | – | | | | 9,570 | |
Gain on disposition of unconsolidated entities, net of tax | | | – | | | | – | | | | – | | | | – | | | | – | | | | | | 9,570 | | | | – | | | | (9,570 | ) | | | – | | | | – | |
Impairment of consolidated and unconsolidated real estate, net of tax | | | – | | | | – | | | | (21,000 | ) | | | – | | | | (21,000 | ) | | | | | – | | | | – | | | | – | | | | – | | | | – | |
Impairment of unconsolidated real estate, net of tax | | | (21,000 | ) | | | – | | | | 21,000 | | | | – | | | | – | | | | | | – | | | | – | | | | – | | | | – | | | | – | |
Discontinued operations, net of tax: | | | | | | | | | | | | | | | | | | | | | | | | | | | | | | | | | | | | | | | | | | |
Depreciation and amortization – Real Estate Groups | | | (1,764 | ) | | | – | | | | – | | | | 1,764 | | | | – | | | | | | – | | | | – | | | | – | | | | – | | | | – | |
Amortization of mortgage procurement costs – Real Estate Groups | | | (271 | ) | | | – | | | | – | | | | 271 | | | | – | | | | | | – | | | | – | | | | – | | | | – | | | | – | |
Deferred taxes—Real Estate Groups | | | (950 | ) | | | – | | | | – | | | | 950 | | | | – | | | | | | – | | | | – | | | | – | | | | – | | | | – | |
Straight–line rent adjustment | | | 627 | | | | – | | | | – | | | | (627 | ) | | | – | | | | | | – | | | | – | | | | – | | | | – | | | | – | |
Gain on disposition of rental properties | | | 27,657 | | | | – | | | | – | | | | (27,657 | ) | | | – | | | | | | – | | | | – | | | | – | | | | – | | | | – | |
Net earnings (loss) attributable to Forest City Enterprises, Inc. | | $ | 32,369 | | | $ | – | | | $ | – | | | $ | – | | | $ | 32,369 | | | | | $ | 16,102 | | | $ | – | | | $ | – | | | $ | – | | | $ | 16,102 | |
58
Forest City Enterprises, Inc. and Subsidiaries
Supplemental Financial Information
Summary of Earnings Before Depreciation, Amortization and Deferred Taxes (EBDT) — Three Months Ended January 31, 2011(in thousands) (continued)
| | | | | | | | | | | | | | | | | | | | | | | | | | | | | | | | | | | | | | | | | | |
| | | Land Development Group 2010 | | | | | The Nets 2010 | |
| | | Full
Consolidation
(GAAP) | | | Less
Noncontrolling
Interest | | | Plus
Unconsolidated
Investments at
Pro-Rata | | | Plus
Discontinued
Operations | | | Pro-Rata
Consolidation
(Non-GAAP) | | | | | Full
Consolidation
(GAAP) | | | Less
Noncontrolling
Interest | | | Plus
Unconsolidated
Investments at
Pro–Rata | | | Plus
Discontinued
Operations | | | Pro-Rata
Consolidation
(Non-GAAP) | |
Revenues from real estate operations | | $ | 12,567 | | | $ | 1,031 | | | $ | 1,940 | | | $ | – | | | $ | 13,476 | | | | | $ | – | | | $ | – | | | $ | – | | | $ | – | | | $ | – | |
Exclude straight–line rent adjustment | | | 3 | | | | – | | | | – | | | | – | | | | 3 | | | | | | – | | | | – | | | | – | | | | – | | | | – | |
Adjusted revenues | | | 12,570 | | | | 1,031 | | | | 1,940 | | | | – | | | | 13,479 | | | | | | – | | | | – | | | | – | | | | – | | | | – | |
Add interest and other income | | | 2,216 | | | | 202 | | | | 10 | | | | – | | | | 2,024 | | | | | | – | | | | – | | | | – | | | | – | | | | – | |
Add equity in earnings (loss) of unconsolidated entities, including impairment | | | (799 | ) | | | – | | | | 850 | | | | – | | | | 51 | | | | | | (312 | ) | | | – | | | | – | | | | – | | | | (312 | ) |
Exclude gain on disposition of unconsolidated entities | | | – | | | | – | | | | – | | | | – | | | | – | | | | | | – | | | | – | | | | – | | | | – | | | | – | |
Exclude impairment of unconsolidated real estate | | | 714 | | | | – | | | | (714 | ) | | | – | | | | – | | | | | | – | | | | – | | | | – | | | | – | | | | – | |
Exclude depreciation and amortization of unconsolidated entities | | | 59 | | | | – | | | | (59 | ) | | | – | | | | – | | | | | | – | | | | – | | | | – | | | | – | | | | – | |
Exclude interest expense of unconsolidated entities | | | 136 | | | | – | | | | (136 | ) | | | – | | | | – | | | | | | – | | | | – | | | | – | | | | – | | | | – | |
Exclude (gain) loss on early extinguishment of debt of unconsolidated entities | | | – | | | | – | | | | – | | | | – | | | | – | | | | | | – | | | | – | | | | – | | | | – | | | | – | |
Adjusted total income | | | 14,896 | | | | 1,233 | | | | 1,891 | | | | – | | | | 15,554 | | | | | | (312 | ) | | | – | | | | – | | | | – | | | | (312 | ) |
Operating expenses | | | 11,776 | | | | 849 | | | | 1,891 | | | | – | | | | 12,818 | | | | | | – | | | | – | | | | – | | | | – | | | | – | |
Non–Real Estate depreciation and amortization and amortization of mortgage procurement costs | | | 43 | | | | – | | | | – | | | | – | | | | 43 | | | | | | – | | | | – | | | | – | | | | – | | | | – | |
Exclude straight–line rent adjustment | | | – | | | | – | | | | – | | | | – | | | | – | | | | | | – | | | | – | | | | – | | | | – | | | | – | |
Exclude preference payment | | | – | | | | – | | | | – | | | | – | | | | – | | | | | | – | | | | – | | | | – | | | | – | | | | – | |
Adjusted operating expenses | | | 11,819 | | | | 849 | | | | 1,891 | | | | – | | | | 12,861 | | | | | | – | | | | – | | | | – | | | | – | | | | – | |
Net operating income | | | 3,077 | | | | 384 | | | | – | | | | – | | | | 2,693 | | | | | | (312 | ) | | | – | | | | – | | | | – | | | | (312 | ) |
Interest expense | | | 829 | | | | 90 | | | | 136 | | | | – | | | | 875 | | | | | | – | | | | – | | | | – | | | | – | | | | – | |
Interest expense of unconsolidated entities | | | 136 | | | | – | | | | (136 | ) | | | – | | | | – | | | | | | – | | | | – | | | | – | | | | – | | | | – | |
(Gain) loss on early extinguishment of debt | | | – | | | | – | | | | – | | | | – | | | | – | | | | | | – | | | | – | | | | – | | | | – | | | | – | |
(Gain) loss on early extinguishment of debt of unconsolidated entities | | | – | | | | – | | | | – | | | | – | | | | – | | | | | | – | | | | – | | | | – | | | | – | | | | – | |
Noncontrolling interest in earnings before depreciation and amortization | | | 294 | | | | 294 | | | | – | | | | – | | | | – | | | | | | – | | | | – | | | | – | | | | – | | | | – | |
Add: Pre–Tax EBDT from discontinued operations | | | – | | | | – | | | | – | | | | – | | | | – | | | | | | – | | | | – | | | | – | | | | – | | | | – | |
Pre–Tax EBDT | | | 1,818 | | | | – | | | | – | | | | – | | | | 1,818 | | | | | | (312 | ) | | | – | | | | – | | | | – | | | | (312 | ) |
Income tax expense (benefit) | | | 449 | | | | – | | | | – | | | | – | | | | 449 | | | | | | 811 | | | | – | | | | – | | | | – | | | | 811 | |
Earnings before depreciation, amortization and deferred taxes (EBDT) | | $ | 1,369 | | | $ | – | | | $ | – | | | $ | – | | | $ | 1,369 | | | | | $ | (1,123 | ) | | $ | – | | | $ | – | | | $ | – | | | $ | (1,123 | ) |
Reconciliation to net earnings: | | | | | | | | | | | | | | | | | | | | | | | | | | | | | | | | | | | | | | | | | | |
Earnings before depreciation, amortization and deferred taxes (EBDT) | | $ | 1,369 | | | $ | – | | | $ | – | | | $ | – | | | $ | 1,369 | | | | | $ | (1,123 | ) | | $ | – | | | $ | – | | | $ | – | | | $ | (1,123 | ) |
Depreciation and amortization – Real Estate Groups | | | (62 | ) | | | – | | | | – | | | | – | | | | (62 | ) | | | | | – | | | | – | | | | – | | | | – | | | | – | |
Amortization of mortgage procurement costs – Real Estate Groups | | | (62 | ) | | | – | | | | – | | | | – | | | | (62 | ) | | | | | – | | | | – | | | | – | | | | – | | | | – | |
Deferred taxes – Real Estate Groups | | | 236 | | | | – | | | | – | | | | – | | | | 236 | | | | | | – | | | | – | | | | – | | | | – | | | | – | |
Straight–line rent adjustment | | | (3 | ) | | | – | | | | – | | | | – | | | | (3 | ) | | | | | – | | | | – | | | | – | | | | – | | | | – | |
Preference payment | | | – | | | | – | | | | – | | | | – | | | | – | | | | | | – | | | | – | | | | – | | | | – | | | | – | |
Gain on disposition of rental properties and partial interests in rental properties, net of tax | | | – | | | | – | | | | – | | | | – | | | | – | | | | | | – | | | | – | | | | – | | | | – | | | | – | |
Gain on disposition of unconsolidated entities, net of tax | | | – | | | | – | | | | – | | | | – | | | | – | | | | | | – | | | | – | | | | – | | | | – | | | | – | |
Impairment of consolidated and unconsolidated real estate, net of tax | | | – | | | | – | | | | (437 | ) | | | – | | | | (437 | ) | | | | | – | | | | – | | | | – | | | | – | | | | – | |
Impairment of unconsolidated real estate, net of tax | | | (437 | ) | | | – | | | | 437 | | | | – | | | | – | | | | | | – | | | | – | | | | – | | | | – | | | | – | |
Discontinued operations, net of tax: | | | | | | | | | | | | | | | | | | | | | | | | | | | | | | | | | | | | | | | | | | |
Depreciation and amortization – Real Estate Groups | | | – | | | | – | | | | – | | | | – | | | | – | | | | | | – | | | | – | | | | – | | | | – | | | | – | |
Amortization of mortgage procurement costs – Real Estate Groups | | | – | | | | – | | | | – | | | | – | | | | – | | | | | | – | | | | – | | | | – | | | | – | | | | – | |
Deferred taxes – Real Estate Groups | | | – | | | | – | | | | – | | | | – | | | | – | | | | | | – | | | | – | | | | – | | | | – | | | | – | |
Straight–line rent adjustment | | | – | | | | – | | | | – | | | | – | | | | – | | | | | | – | | | | – | | | | – | | | | – | | | | – | |
Gain on disposition of rental properties | | | – | | | | – | | | | – | | | | – | | | | – | | | | | | – | | | | – | | | | – | | | | – | | | | – | |
Net earnings (loss) attributable to Forest City Enterprises, Inc. | | $ | 1,041 | | | $ | – | | | $ | – | | | $ | – | | | $ | 1,041 | | | | | $ | (1,123 | ) | | $ | – | | | $ | – | | | $ | – | | | $ | (1,123 | ) |
59
Forest City Enterprises, Inc. and Subsidiaries
Supplemental Financial Information
Summary of Earnings Before Depreciation, Amortization and Deferred Taxes (EBDT) — Three Months Ended January 31, 2011(in thousands) (continued)
| | | | | | | | | | | | | | | | | | | | | | | | | | | | | | | | | | | | | | | | |
| | | Corporate Activities 2010 | | | Total 2010 | |
| | | Full
Consolidation
(GAAP) | | | Less
Noncontrolling
Interest | | | Plus
Unconsolidated
Investments at
Pro-Rata | | | Plus
Discontinued
Operations | | | Pro-Rata
Consolidation
(Non-GAAP) | | | Full
Consolidation
(GAAP) | | | Less
Noncontrolling
Interest | | | Plus
Unconsolidated
Investments at
Pro-Rata | | | Plus
Discontinued
Operations | | | Pro-Rata
Consolidation
(Non-GAAP) | |
Revenues from real estate operations | | $ | – | | | $ | – | | | $ | – | | | $ | – | | | $ | – | | | $ | 280,147 | | | $ | 14,172 | | | $ | 80,167 | | | $ | 14,978 | | | $ | 361,120 | |
Exclude straight–line rent adjustment | | | – | | | | – | | | | – | | | | – | | | | – | | | | (8,532 | ) | | | – | | | | – | | | | (627 | ) | | | (9,159 | ) |
Adjusted revenues | | | – | | | | – | | | | – | | | | – | | | | – | | | | 271,615 | | | | 14,172 | | | | 80,167 | | | | 14,351 | | | | 351,961 | |
Add interest and other income | | | 105 | | | | – | | | | – | | | | – | | | | 105 | | | | 17,859 | | | | 611 | | | | 381 | | | | 2 | | | | 17,631 | |
Add equity in earnings (loss) of unconsolidated entities, including impairment | | | – | | | | – | | | | – | | | | – | | | | – | | | | (12,742 | ) | | | 1,719 | | | | 14,081 | | | | – | | | | (380 | ) |
Exclude gain on disposition of unconsolidated entities | | | – | | | | – | | | | – | | | | – | | | | – | | | | (15,633 | ) | | | – | | | | 15,633 | | | | – | | | | – | |
Exclude impairment of unconsolidated real estate | | | – | | | | – | | | | – | | | | – | | | | – | | | | 35,714 | | | | – | | | | (35,714 | ) | | | – | | | | – | |
Exclude depreciation and amortization of unconsolidated entities | | | – | | | | – | | | | – | | | | – | | | | – | | | | 15,851 | | | | – | | | | (15,851 | ) | | | – | | | | – | |
Exclude interest expense of unconsolidated entities | | | – | | | | – | | | | – | | | | – | | | | – | | | | 22,228 | | | | – | | | | (22,228 | ) | | | – | | | | – | |
Exclude (gain) loss on early extinguishment of debt of unconsolidated entities | | | – | | | | – | | | | – | | | | – | | | | – | | | | (2,785 | ) | | | – | | | | 2,785 | | | | – | | | | – | |
Adjusted total income | | | 105 | | | | – | | | | – | | | | – | | | | 105 | | | | 332,107 | | | | 16,502 | | | | 39,254 | | | | 14,353 | | | | 369,212 | |
Operating expenses | | | 17,705 | | | | – | | | | – | | | | – | | | | 17,705 | | | | 172,078 | | | | 8,309 | | | | 39,254 | | | | 10,457 | | | | 213,480 | |
Non–Real Estate depreciation and amortization and amortization of mortgage procurement costs | | | 404 | | | | – | | | | – | | | | – | | | | 404 | | | | 1,091 | | | | – | | | | – | | | | – | | | | 1,091 | |
Exclude straight–line rent adjustment | | | – | | | | – | | | | – | | | | – | | | | – | | | | (1,246 | ) | | | – | | | | – | | | | – | | | | (1,246 | ) |
Exclude preference payment | | | – | | | | – | | | | – | | | | – | | | | – | | | | (585 | ) | | | – | | | | – | | | | – | | | | (585 | ) |
Adjusted operating expenses | | | 18,109 | | | | – | | | | – | | | | – | | | | 18,109 | | | | 171,338 | | | | 8,309 | | | | 39,254 | | | | 10,457 | | | | 212,740 | |
Net operating income | | | (18,004 | ) | | | – | | | | – | | | | – | | | | (18,004 | ) | | | 160,769 | | | | 8,193 | | | | – | | | | 3,896 | | | | 156,472 | |
Interest expense | | | 15,832 | | | | – | | | | – | | | | – | | | | 15,832 | | | | 69,387 | | | | 3,047 | | | | 22,228 | | | | 1,848 | | | | 90,416 | |
Interest expense of unconsolidated entities | | | – | | | | – | | | | – | | | | – | | | | – | | | | 22,228 | | | | – | | | | (22,228 | ) | | | – | | | | – | |
(Gain) loss on early extinguishment of debt | | | 31,689 | | | | – | | | | – | | | | – | | | | 31,689 | | | | 31,688 | | | | – | | | | (2,785 | ) | | | – | | | | 28,903 | |
(Gain) loss on early extinguishment of debt of unconsolidated entities | | | – | | | | – | | | | – | | | | – | | | | – | | | | (2,785 | ) | | | – | | | | 2,785 | | | | – | | | | – | |
Noncontrolling interest in earnings before depreciation and amortization | | | – | | | | – | | | | – | | | | – | | | | – | | | | 5,146 | | | | 5,146 | | | | – | | | | – | | | | – | |
Add: Pre–Tax EBDT from discontinued operations | | | – | | | | – | | | | – | | | | – | | | | – | | | | 2,048 | | | | – | | | | – | | | | (2,048 | ) | | | – | |
Pre–Tax EBDT | | | (65,525 | ) | | | – | | | | – | | | | – | | | | (65,525 | ) | | | 37,153 | | | | – | | | | – | | | | – | | | | 37,153 | |
Income tax expense (benefit) | | | (17,990 | ) | | | – | | | | – | | | | – | | | | (17,990 | ) | | | (5,996 | ) | | | – | | | | – | | | | – | | | | (5,996 | ) |
Earnings before depreciation, amortization and deferred taxes (EBDT) | | $ | (47,535 | ) | | $ | – | | | $ | – | | | $ | – | | | $ | (47,535 | ) | | $ | 43,149 | | | $ | – | | | $ | – | | | $ | – | | | $ | 43,149 | |
Reconciliation to net earnings: | | | | | | | | | | | | | | | | | | | | | | | | | | | | | | | | | | | | | | | | |
Earnings before depreciation, amortization and deferred taxes (EBDT) | | $ | (47,535 | ) | | $ | – | | | $ | – | | | $ | – | | | $ | (47,535 | ) | | $ | 43,149 | | | $ | – | | | $ | – | | | $ | – | | | $ | 43,149 | |
Depreciation and amortization – Real Estate Groups | | | – | | | | – | | | | – | | | | – | | | | – | | | | (71,615 | ) | | | – | | | | – | | | | (1,764 | ) | | | (73,379 | ) |
Amortization of mortgage procurement costs – Real Estate Groups | | | – | | | | – | | | | – | | | | – | | | | – | | | | (3,346 | ) | | | – | | | | – | | | | (271 | ) | | | (3,617 | ) |
Deferred taxes – Real Estate Groups | | | (2,687 | ) | | | – | | | | – | | | | – | | | | (2,687 | ) | | | 9,021 | | | | – | | | | – | | | | (950 | ) | | | 8,071 | |
Straight–line rent adjustment | | | – | | | | – | | | | – | | | | – | | | | – | | | | 7,286 | | | | – | | | | – | | | | 627 | | | | 7,913 | |
Preference payment | | | – | | | | – | | | | – | | | | – | | | | – | | | | (585 | ) | | | – | | | | – | | | | – | | | | (585 | ) |
Gain on disposition of rental properties and partial interests in rental properties, net of tax | | | – | | | | – | | | | – | | | | – | | | | – | | | | 825 | | | | – | | | | 9,570 | | | | 27,657 | | | | 38,052 | |
Gain on disposition of unconsolidated entities, net of tax | | | – | | | | – | | | | – | | | | – | | | | – | | | | 9,570 | | | | – | | | | (9,570 | ) | | | – | | | | – | |
Impairment of consolidated and unconsolidated real estate, net of tax | | | – | | | | – | | | | – | | | | – | | | | – | | | | – | | | | – | | | | (21,437 | ) | | | – | | | | (21,437 | ) |
Impairment of unconsolidated real estate, net of tax | | | – | | | | – | | | | – | | | | – | | | | – | | | | (21,437 | ) | | | – | | | | 21,437 | | | | – | | | | – | |
Discontinued operations, net of tax: | | | | | | | | | | | | | | | | | | | | | | | | | | | | | | | | | | | | | | | | |
Depreciation and amortization – Real Estate Groups | | | – | | | | – | | | | – | | | | – | | | | – | | | | (1,764 | ) | | | – | | | | – | | | | 1,764 | | | | – | |
Amortization of mortgage procurement costs – Real Estate Groups | | | – | | | | – | | | | – | | | | – | | | | – | | | | (271 | ) | | | – | | | | – | | | | 271 | | | | – | |
Deferred taxes – Real Estate Groups | | | – | | | | – | | | | – | | | | – | | | | – | | | | (950 | ) | | | – | | | | – | | | | 950 | | | | – | |
Straight–line rent adjustment | | | – | | | | – | | | | – | | | | – | | | | – | | | | 627 | | | | – | | | | – | | | | (627 | ) | | | – | |
Gain on disposition of rental properties | | | – | | | | – | | | | – | | | | – | | | | – | | | | 27,657 | | | | – | | | | – | | | | (27,657 | ) | | | – | |
Net earnings (loss) attributable to Forest City Enterprises, Inc. | | $ | (50,222 | ) | | $ | – | | | $ | – | | | $ | – | | | $ | (50,222 | ) | | $ | (1,833 | ) | | $ | – | | | $ | – | | | $ | – | | | $ | (1,833 | ) |
Preferred dividends | | | (3,850 | ) | | | – | | | | – | | | | – | | | | (3,850 | ) | | | (3,850 | ) | | | – | | | | – | | | | – | | | | (3,850 | ) |
Net loss attributable to Forest City Enterprises, Inc. common shareholders | | $ | (54,072 | ) | | $ | – | | | $ | – | | | $ | – | | | $ | (54,072 | ) | | $ | (5,683 | ) | | $ | – | | | $ | – | | | $ | – | | | $ | (5,683 | ) |
60
Forest City Enterprises, Inc. and Subsidiaries
Supplemental Financial Information
Summary of Earnings Before Depreciation, Amortization and Deferred Taxes (EBDT) — Year Ended January 31, 2011(in thousands)
| | | | | | | | | | | | | | | | | | | | | | | | | | | | | | | | | | | | | | | | |
| | | Commercial Group 2010 | | | Residential Group 2010 | |
| | | Full
Consolidation
(GAAP) | | | Less
Noncontrolling
Interest | | | Plus
Unconsolidated
Investments at
Pro-Rata | | | Plus
Discontinued
Operations | | | Pro-Rata
Consolidation
(Non-GAAP) | | | Full
Consolidation
(GAAP) | | | Less
Noncontrolling
Interest | | | Plus
Unconsolidated
Investments at
Pro-Rata | | | Plus
Discontinued
Operations | | | Pro-Rata
Consolidation
(Non-GAAP) | |
Revenues from real estate operations | | $ | 874,033 | | | $ | 48,272 | | | $ | 159,015 | | | $ | 61,054 | | | $ | 1,045,830 | | | $ | 211,485 | | | $ | 3,623 | | | $ | 147,786 | | | $ | 2,506 | | | $ | 358,154 | |
Exclude straight–line rent adjustment | | | (21,189 | ) | | | – | | | | – | | | | (1,795 | ) | | | (22,984 | ) | | | (516 | ) | | | – | | | | – | | | | – | | | | (516 | ) |
Adjusted revenues | | | 852,844 | | | | 48,272 | | | | 159,015 | | | | 59,259 | | | | 1,022,846 | | | | 210,969 | | | | 3,623 | | | | 147,786 | | | | 2,506 | | | | 357,638 | |
Add interest and other income | | | 23,384 | | | | 1,318 | | | | 357 | | | | 10 | | | | 22,433 | | | | 19,830 | | | | 551 | | | | 1,166 | | | | 4 | | | | 20,449 | |
Add gain on disposition of partial interests in other investments – Nets | | | – | | | | – | | | | – | | | | – | | | | – | | | | – | | | | – | | | | – | | | | – | | | | – | |
Add equity in earnings (loss) of unconsolidated entities, including impairment | | | (29,269 | ) | | | – | | | | 29,269 | | | | – | | | | – | | | | 37,415 | | | | 1,630 | | | | (35,350 | ) | | | – | | | | 435 | |
Exclude gain on disposition of unconsolidated entities | | | (5,613 | ) | | | – | | | | 5,613 | | | | – | | | | – | | | | (17,848 | ) | | | – | | | | 17,848 | | | | – | | | | – | |
Exclude impairment of unconsolidated real estate | | | 49,889 | | | | – | | | | (49,889 | ) | | | – | | | | – | | | | – | | | | – | | | | – | | | | – | | | | – | |
Exclude depreciation and amortization of unconsolidated entities | | | 29,581 | | | | – | | | | (29,581 | ) | | | – | | | | – | | | | 24,617 | | | | – | | | | (24,617 | ) | | | – | | | | – | |
Exclude interest expense of unconsolidated entities | | | 46,091 | | | | – | | | | (46,091 | ) | | | – | | | | – | | | | 33,608 | | | | – | | | | (33,608 | ) | | | – | | | | – | |
Exclude (gain) loss on early extinguishment of debt of unconsolidated entities | | | (2,791 | ) | | | – | | | | 2,791 | | | | – | | | | – | | | | 31 | | | | – | | | | (31 | ) | | | – | | | | – | |
Adjusted total income | | | 964,116 | | | | 49,590 | | | | 71,484 | | | | 59,269 | | | | 1,045,279 | | | | 308,622 | | | | 5,804 | | | | 73,194 | | | | 2,510 | | | | 378,522 | |
Operating expenses | | | 424,923 | | | | 28,072 | | | | 71,484 | | | | 40,746 | | | | 509,081 | | | | 136,596 | | | | 1,383 | | | | 73,194 | | | | 1,610 | | | | 210,017 | |
Non–Real Estate depreciation and amortization and amortization of mortgage procurement costs | | | 1,750 | | | | – | | | | – | | | | – | | | | 1,750 | | | | 1,347 | | | | – | | | | – | | | | – | | | | 1,347 | |
Exclude straight–line rent adjustment | | | (5,338 | ) | | | – | | | | – | | | | – | | | | (5,338 | ) | | | 6 | | | | – | | | | – | | | | – | | | | 6 | |
Exclude preference payment | | | (2,341 | ) | | | – | | | | – | | | | – | | | | (2,341 | ) | | | – | | | | – | | | | – | | | | – | | | | – | |
Adjusted operating expenses | | | 418,994 | | | | 28,072 | | | | 71,484 | | | | 40,746 | | | | 503,142 | | | | 137,949 | | | | 1,383 | | | | 73,194 | | | | 1,610 | | | | 211,370 | |
Net operating income | | | 545,122 | | | | 21,518 | | | | – | | | | 18,523 | | | | 542,127 | | | | 170,673 | | | | 4,421 | | | | – | | | | 900 | | | | 167,152 | |
Interest expense | | | 221,642 | | | | 15,495 | | | | 46,091 | | | | 9,364 | | | | 261,602 | | | | 21,233 | | | | 975 | | | | 33,608 | | | | 118 | | | | 53,984 | |
Interest expense of unconsolidated entities | | | 46,091 | | | | – | | | | (46,091 | ) | | | – | | | | – | | | | 33,608 | | | | – | | | | (33,608 | ) | | | – | | | | – | |
(Gain) loss on early extinguishment of debt | | | – | | | | – | | | | (2,791 | ) | | | – | | | | (2,791 | ) | | | (2,461 | ) | | | (247 | ) | | | 31 | | | | – | | | | (2,183 | ) |
(Gain) loss on early extinguishment of debt of unconsolidated entities | | | (2,791 | ) | | | – | | | | 2,791 | | | | – | | | | – | | | | 31 | | | | – | | | | (31 | ) | | | – | | | | – | |
Noncontrolling interest in earnings before depreciation and amortization | | | 6,023 | | | | 6,023 | | | | – | | | | – | | | | – | | | | 3,693 | | | | 3,693 | | | | – | | | | – | | | | – | |
Allowance for projects under development revision | | | 700 | | | | – | | | | – | | | | – | | | | 700 | | | | 300 | | | | – | | | | – | | | | – | | | | 300 | |
Add: Pre–Tax EBDT from discontinued operations | | | 9,159 | | | | – | | | | – | | | | (9,159 | ) | | | – | | | | 782 | | | | – | | | | – | | | | (782 | ) | | | – | |
Pre–Tax EBDT | | | 284,016 | | | | – | | | | – | | | | – | | | | 284,016 | | | | 115,651 | | | | – | | | | – | | | | – | | | | 115,651 | |
Income tax expense (benefit) | | | 6,536 | | | | – | | | | – | | | | – | | | | 6,536 | | | | 9,095 | | | | – | | | | – | | | | – | | | | 9,095 | |
Earnings before depreciation, amortization and deferred taxes (EBDT) | | $ | 277,480 | | | $ | – | | | $ | – | | | $ | – | | | $ | 277,480 | | | $ | 106,556 | | | $ | – | | | $ | – | | | $ | – | | | $ | 106,556 | |
Reconciliation to net earnings: | | | | | | | | | | | | | | | | | | | | | | | | | | | | | | | | | | | | | | | | |
Earnings before depreciation, amortization and deferred taxes (EBDT) | | $ | 277,480 | | | $ | – | | | $ | – | | | $ | – | | | $ | 277,480 | | | $ | 106,556 | | | $ | – | | | $ | – | | | $ | – | | | $ | 106,556 | |
Depreciation and amortization – Real Estate Groups | | | (199,640 | ) | | | – | | | | – | | | | (9,896 | ) | | | (209,536 | ) | | | (75,606 | ) | | | – | | | | – | | | | (636 | ) | | | (76,242 | ) |
Amortization of mortgage procurement costs – Real Estate Groups | | | (10,444 | ) | | | – | | | | – | | | | (1,043 | ) | | | (11,487 | ) | | | (2,568 | ) | | | – | | | | – | | | | (13 | ) | | | (2,581 | ) |
Deferred taxes – Real Estate Groups | | | (12,600 | ) | | | – | | | | – | | | | (2,069 | ) | | | (14,669 | ) | | | (3,002 | ) | | | – | | | | – | | | | (400 | ) | | | (3,402 | ) |
Straight–line rent adjustment | | | 15,851 | | | | – | | | | – | | | | 1,795 | | | | 17,646 | | | | 522 | | | | – | | | | – | | | | – | | | | 522 | |
Preference payment | | | (2,341 | ) | | | – | | | | – | | | | – | | | | (2,341 | ) | | | – | | | | – | | | | – | | | | – | | | | – | |
Gain on disposition of rental properties and partial interests in rental properties, net of tax | | | 106,943 | | | | – | | | | 3,436 | | | | 26,899 | | | | 137,278 | | | | 18,083 | | | | – | | | | 10,926 | | | | 1,099 | | | | 30,108 | |
Gain on disposition of unconsolidated entities, net of tax | | | 3,436 | | | | – | | | | (3,436 | ) | | | – | | | | – | | | | 10,926 | | | | – | | | | (10,926 | ) | | | – | | | | – | |
Impairment of consolidated and unconsolidated real estate, net of tax | | | (964 | ) | | | – | | | | (30,115 | ) | | | (49,980 | ) | | | (81,059 | ) | | | – | | | | – | | | | – | | | | – | | | | – | |
Impairment of unconsolidated real estate, net of tax | | | (30,115 | ) | | | – | | | | 30,115 | | | | – | | | | – | | | | – | | | | – | | | | – | | | | – | | | | – | |
Allowance for projects under development revision | | | (700 | ) | | | – | | | | – | | | | – | | | | (700 | ) | | | (300 | ) | | | – | | | | – | | | | – | | | | (300 | ) |
Discontinued operations, net of tax: | | | | | | | | | | | | | | | | | | | | | | | | | | | | | | | | | | | | | | | | |
Depreciation and amortization – Real Estate Groups | | | (9,896 | ) | | | – | | | | – | | | | 9,896 | | | | – | | | | (636 | ) | | | – | | | | – | | | | 636 | | | | – | |
Amortization of mortgage procurement costs – Real Estate Groups | | | (1,043 | ) | | | – | | | | – | | | | 1,043 | | | | – | | | | (13 | ) | | | – | | | | – | | | | 13 | | | | – | |
Deferred taxes – Real Estate Groups | | | (2,069 | ) | | | – | | | | – | | | | 2,069 | | | | – | | | | (400 | ) | | | – | | | | – | | | | 400 | | | | – | |
Straight–line rent adjustment | | | 1,795 | | | | – | | | | – | | | | (1,795 | ) | | | – | | | | – | | | | – | | | | – | | | | – | | | | – | |
Gain on disposition of rental properties | | | 26,899 | | | | – | | | | – | | | | (26,899 | ) | | | – | | | | 1,099 | | | | – | | | | – | | | | (1,099 | ) | | | – | |
Impairment of consolidated and unconsolidated real estate | | | (49,980 | ) | | | – | | | | – | | | | 49,980 | | | | – | | | | – | | | | – | | | | – | | | | – | | | | – | |
Net earnings (loss) attributable to Forest City Enterprises, Inc. | | $ | 112,612 | | | $ | – | | | $ | – | | | $ | – | | | $ | 112,612 | | | $ | 54,661 | | | $ | – | | | $ | – | | | $ | – | | | $ | 54,661 | |
61
Forest City Enterprises, Inc. and Subsidiaries
Supplemental Financial Information
Summary of Earnings Before Depreciation, Amortization and Deferred Taxes (EBDT) — Year Ended January 31, 2011(in thousands) (continued)
| | | | | | | | | | | | | | | | | | | | | | | | | | | | | | | | | | | | | | | | |
| | | Land Development Group 2010 | | | The Nets 2010 | |
| | | Full
Consolidation
(GAAP) | | | Less
Noncontrolling
Interest | | | Plus
Unconsolidated
Investments at
Pro-Rata | | | Plus
Discontinued
Operations | | | Pro–Rata
Consolidation
(Non-GAAP) | | | Full
Consolidation
(GAAP) | | | Less
Noncontrolling
Interest | | | Plus
Unconsolidated
Investments at
Pro-Rata | | | Plus
Discontinued
Operations | | | Pro-Rata
Consolidation
(Non-GAAP) | |
Revenues from real estate operations | | $ | 32,131 | | | $ | 2,224 | | | $ | 10,099 | | | $ | – | | | $ | 40,006 | | | $ | – | | | $ | – | | | $ | – | | | $ | – | | | $ | – | |
Exclude straight–line rent adjustment | | | 8 | | | | – | | | | – | | | | – | | | | 8 | | | | – | | | | – | | | | – | | | | – | | | | – | |
Adjusted revenues | | | 32,139 | | | | 2,224 | | | | 10,099 | | | | – | | | | 40,014 | | | | – | | | | – | | | | – | | | | – | | | | – | |
Add interest and other income | | | 9,162 | | | | 766 | | | | 106 | | | | – | | | | 8,502 | | | | – | | | | – | | | | 14,037 | | | | – | | | | 14,037 | |
Add gain on disposition of partial interests in other investments—Nets | | | – | | | | – | | | | – | | | | – | | | | – | | | | 55,112 | | | | 23,675 | | | | – | | | | – | | | | 31,437 | |
Add equity in earnings (loss) of unconsolidated entities, including impairment | | | (20,022 | ) | | | – | | | | 21,381 | | | | – | | | | 1,359 | | | | (18,318 | ) | | | (6,243 | ) | | | 4,207 | | | | – | | | | (7,868 | ) |
Exclude gain on disposition of unconsolidated entities | | | – | | | | – | | | | – | | | | – | | | | – | | | | – | | | | – | | | | – | | | | – | | | | – | |
Exclude impairment of unconsolidated real estate | | | 22,570 | | | | – | | | | (22,570 | ) | | | – | | | | – | | | | – | | | | – | | | | – | | | | – | | | | – | |
Exclude depreciation and amortization of unconsolidated entities | | | 241 | | | | – | | | | (241 | ) | | | – | | | | – | | | | – | | | | – | | | | – | | | | – | | | | – | |
Exclude interest expense of unconsolidated entities | | | 339 | | | | – | | | | (339 | ) | | | – | | | | – | | | | 1,146 | | | | – | | | | (1,146 | ) | | | – | | | | – | |
Exclude (gain) loss on early extinguishment of debt of unconsolidated entities | | | – | | | | – | | | | – | | | | – | | | | – | | | | – | | | | – | | | | – | | | | – | | | | – | |
Adjusted total income | | | 44,429 | | | | 2,990 | | | | 8,436 | | | | – | | | | 49,875 | | | | 37,940 | | | | 17,432 | | | | 17,098 | | | | – | | | | 37,606 | |
Operating expenses | | | 38,650 | | | | 2,258 | | | | 8,436 | | | | – | | | | 44,828 | | | | – | | | | – | | | | 16,151 | | | | – | | | | 16,151 | |
Non–Real Estate depreciation and amortization and amortization of mortgage procurement costs | | | 162 | | | | – | | | | – | | | | – | | | | 162 | | | | – | | | | – | | | | 947 | | | | – | | | | 947 | |
Exclude straight–line rent adjustment | | | – | | | | – | | | | – | | | | – | | | | – | | | | – | | | | – | | | | – | | | | – | | | | – | |
Exclude preference payment | | | – | | | | – | | | | – | | | | – | | | | – | | | | – | | | | – | | | | – | | | | – | | | | – | |
Adjusted operating expenses | | | 38,812 | | | | 2,258 | | | | 8,436 | | | | – | | | | 44,990 | | | | – | | | | – | | | | 17,098 | | | | – | | | | 17,098 | |
Net operating income | | | 5,617 | | | | 732 | | | | – | | | | – | | | | 4,885 | | | | 37,940 | | | | 17,432 | | | | – | | | | – | | | | 20,508 | |
Interest expense | | | 3,007 | | | | 304 | | | | 339 | | | | – | | | | 3,042 | | | | – | | | | – | | | | 1,146 | | | | – | | | | 1,146 | |
Interest expense of unconsolidated entities | | | 339 | | | | – | | | | (339 | ) | | | – | | | | – | | | | 1,146 | | | | – | | | | (1,146 | ) | | | – | | | | – | |
(Gain) loss on early extinguishment of debt | | | – | | | | – | | | | – | | | | – | | | | – | | | | – | | | | – | | | | – | | | | – | | | | – | |
(Gain) loss on early extinguishment of debt of unconsolidated entities | | | – | | | | – | | | | – | | | | – | | | | – | | | | – | | | | – | | | | – | | | | – | | | | – | |
Noncontrolling interest in earnings before depreciation and amortization | | | 428 | | | | 428 | | | | – | | | | – | | | | – | | | | 17,432 | | | | 17,432 | | | | – | | | | – | | | | – | |
Allowance for projects under development revision | | | – | | | | – | | | | – | | | | – | | | | – | | | | – | | | | – | | | | – | | | | – | | | | – | |
Add: Pre–Tax EBDT from discontinued operations | | | – | | | | – | | | | – | | | | – | | | | – | | | | – | | | | – | | | | – | | | | – | | | | – | |
Pre–Tax EBDT | | | 1,843 | | | | – | | | | – | | | | – | | | | 1,843 | | | | 19,362 | | | | – | | | | – | | | | – | | | | 19,362 | |
Income tax expense (benefit) | | | (533 | ) | | | – | | | | – | | | | – | | | | (533 | ) | | | 9,711 | | | | – | | | | – | | | | – | | | | 9,711 | |
Earnings before depreciation, amortization and deferred taxes (EBDT) | | $ | 2,376 | | | $ | – | | | $ | – | | | $ | – | | | $ | 2,376 | | | $ | 9,651 | | | $ | – | | | $ | – | | | $ | – | | | $ | 9,651 | |
Reconciliation to net earnings: | | | | | | | | | | | | | | | | | | | | | | | | | | | | | | | | | | | | | | | | |
Earnings before depreciation, amortization and deferred taxes (EBDT) | | $ | 2,376 | | | $ | – | | | $ | – | | | $ | – | | | $ | 2,376 | | | $ | 9,651 | | | $ | – | | | $ | – | | | $ | – | | | $ | 9,651 | |
Depreciation and amortization—Real Estate Groups | | | (264 | ) | | | – | | | | – | | | | – | | | | (264 | ) | | | – | | | | – | | | | – | | | | – | | | | – | |
Amortization of mortgage procurement costs—Real Estate Groups | | | (273 | ) | | | – | | | | – | | | | – | | | | (273 | ) | | | – | | | | – | | | | – | | | | – | | | | – | |
Deferred taxes—Real Estate Groups | | | (591 | ) | | | – | | | | – | | | | – | | | | (591 | ) | | | – | | | | – | | | | – | | | | – | | | | – | |
Straight–line rent adjustment | | | (8 | ) | | | – | | | | – | | | | – | | | | (8 | ) | | | – | | | | – | | | | – | | | | – | | | | – | |
Preference payment | | | – | | | | – | | | | – | | | | – | | | | – | | | | – | | | | – | | | | – | | | | – | | | | – | |
Gain on disposition of rental properties and partial interests in rental properties, net of tax | | | – | | | | – | | | | – | | | | – | | | | – | | | | – | | | | – | | | | – | | | | – | | | | – | |
Gain on disposition of unconsolidated entities, net of tax | | | – | | | | – | | | | – | | | | – | | | | – | | | | – | | | | – | | | | – | | | | – | | | | – | |
Impairment of consolidated and unconsolidated real estate, net of tax | | | (1,016 | ) | | | – | | | | (13,817 | ) | | | – | | | | (14,833 | ) | | | – | | | | – | | | | – | | | | – | | | | – | |
Impairment of unconsolidated real estate, net of tax | | | (13,817 | ) | | | – | | | | 13,817 | | | | – | | | | – | | | | – | | | | – | | | | – | | | | – | | | | – | |
Allowance for projects under development revision | | | – | | | | – | | | | – | | | | – | | | | – | | | | – | | | | – | | | | – | | | | – | | | | – | |
Discontinued operations, net of tax: | | | | | | | | | | | | | | | | | | | | | | | | | | | | | | | | | | | | | | | | |
Depreciation and amortization—Real Estate Groups | | | – | | | | – | | | | – | | | | – | | | | – | | | | – | | | | – | | | | – | | | | – | | | | – | |
Amortization of mortgage procurement costs—Real Estate Groups | | | – | | | | – | | | | – | | | | – | | | | – | | | | – | | | | – | | | | – | | | | – | | | | – | |
Deferred taxes—Real Estate Groups | | | – | | | | – | | | | – | | | | – | | | | – | | | | – | | | | – | | | | – | | | | – | | | | – | |
Straight–line rent adjustment | | | – | | | | – | | | | – | | | | – | | | | – | | | | – | | | | – | | | | – | | | | – | | | | – | |
Gain on disposition of rental properties | | | – | | | | – | | | | – | | | | – | | | | – | | | | – | | | | – | | | | – | | | | – | | | | – | |
Impairment of consolidated and unconsolidated real estate | | | – | | | | – | | | | – | | | | – | | | | – | | | | – | | | | – | | | | – | | | | – | | | | – | |
Net earnings (loss) attributable to Forest City Enterprises, Inc. | | $ | (13,593 | ) | | $ | – | | | $ | – | | | $ | – | | | $ | (13,593 | ) | | $ | 9,651 | | | $ | – | | | $ | – | | | $ | – | | | $ | 9,651 | |
62
Forest City Enterprises, Inc. and Subsidiaries
Supplemental Financial Information
Summary of Earnings Before Depreciation, Amortization and Deferred Taxes (EBDT) — Year Ended January 31, 2011(in thousands) (continued)
| | | | | | | | | | | | | | | | | | | | | | | | | | | | | | | | | | | | | | | | |
| | | Corporate Activities 2010 | | | Total 2010 | |
| | | Full
Consolidation
(GAAP) | | | Less
Noncontrolling
Interest | | | Plus
Unconsolidated
Investments at
Pro-Rata | | | Plus
Discontinued
Operations | | | Pro-Rata
Consolidation
(Non-GAAP) | | | Full
Consolidation
(GAAP) | | | Less
Noncontrolling
Interest | | | Plus
Unconsolidated
Investments at
Pro-Rata | | | Plus
Discontinued
Operations | | | Pro-Rata
Consolidation
(Non-GAAP) | |
Revenues from real estate operations | | $ | – | | | $ | – | | | $ | – | | | $ | – | | | $ | – | | | $ | 1,117,649 | | | $ | 54,119 | | | $ | 316,900 | | | $ | 63,560 | | | $ | 1,443,990 | |
Exclude straight–line rent adjustment | | | – | | | | – | | | | – | | | | – | | | | – | | | | (21,697 | ) | | | – | | | | – | | | | (1,795 | ) | | | (23,492 | ) |
| | | | |
Adjusted revenues | | | – | | | | – | | | | – | | | | – | | | | – | | | | 1,095,952 | | | | 54,119 | | | | 316,900 | | | | 61,765 | | | | 1,420,498 | |
Add interest and other income | | | 442 | | | | – | | | | – | | | | – | | | | 442 | | | | 52,818 | | | | 2,635 | | | | 15,666 | | | | 14 | | | | 65,863 | |
Add gain on disposition of partial interests in other investments – Nets | | | – | | | | – | | | | – | | | | – | | | | – | | | | 55,112 | | | | 23,675 | | | | – | | | | – | | | | 31,437 | |
Add equity in earnings (loss) of unconsolidated entities, including impairment | | | – | | | | – | | | | – | | | | – | | | | – | | | | (30,194 | ) | | | (4,613 | ) | | | 19,507 | | | | – | | | | (6,074 | ) |
Exclude gain on disposition of unconsolidated entities | | | – | | | | – | | | | – | | | | – | | | | – | | | | (23,461 | ) | | | – | | | | 23,461 | | | | – | | | | – | |
Exclude impairment of unconsolidated real estate | | | | | | | | | | | | | | | | | | | | | | | 72,459 | | | | – | | | | (72,459 | ) | | | – | | | | – | |
Exclude depreciation and amortization of unconsolidated entities | | | | | | | | | | | | | | | | | | | | | | | 54,439 | | | | – | | | | (54,439 | ) | | | – | | | | – | |
Exclude interest expense of unconsolidated entities | | | – | | | | – | | | | – | | | | – | | | | – | | | | 81,184 | | | | – | | | | (81,184 | ) | | | – | | | | – | |
Exclude (gain) loss on early extinguishment of debt of unconsolidated entities | | | – | | | | – | | | | – | | | | – | | | | – | | | | (2,760 | ) | | | – | | | | 2,760 | | | | – | | | | – | |
| | | | |
Adjusted total income | | | 442 | | | | – | | | | – | | | | – | | | | 442 | | | | 1,355,549 | | | | 75,816 | | | | 170,212 | | | | 61,779 | | | | 1,511,724 | |
Operating expenses | | | 47,030 | | | | – | | | | – | | | | – | | | | 47,030 | | | | 647,199 | | | | 31,713 | | | | 169,265 | | | | 42,356 | | | | 827,107 | |
Non–Real Estate depreciation and amortization and amortization of mortgage procurement costs | | | 1,769 | | | | – | | | | – | | | | – | | | | 1,769 | | | | 5,028 | | | | – | | | | 947 | | | | – | | | | 5,975 | |
Exclude straight–line rent adjustment | | | – | | | | – | | | | – | | | | – | | | | – | | | | (5,332 | ) | | | – | | | | – | | | | – | | | | (5,332 | ) |
Exclude preference payment | | | – | | | | – | | | | – | | | | – | | | | – | | | | (2,341 | ) | | | – | | | | – | | | | – | | | | (2,341 | ) |
| | | | |
Adjusted operating expenses | | | 48,799 | | | | – | | | | – | | | | – | | | | 48,799 | | | | 644,554 | | | | 31,713 | | | | 170,212 | | | | 42,356 | | | | 825,409 | |
Net operating income | | | (48,357 | ) | | | – | | | | – | | | | – | | | | (48,357 | ) | | | 710,995 | | | | 44,103 | | | | – | | | | 19,423 | | | | 686,315 | |
Interest expense | | | 63,884 | | | | – | | | | – | | | | – | | | | 63,884 | | | | 309,766 | | | | 16,774 | | | | 81,184 | | | | 9,482 | | | | 383,658 | |
Interest expense of unconsolidated entities | | | – | | | | – | | | | – | | | | – | | | | – | | | | 81,184 | | | | – | | | | (81,184 | ) | | | – | | | | – | |
(Gain) loss on early extinguishment of debt | | | 23,496 | | | | – | | | | – | | | | – | | | | 23,496 | | | | 21,035 | | | | (247 | ) | | | (2,760 | ) | | | – | | | | 18,522 | |
(Gain) loss on early extinguishment of debt of unconsolidated entities | | | – | | | | – | | | | – | | | | – | | | | – | | | | (2,760 | ) | | | – | | | | 2,760 | | | | – | | | | – | |
Noncontrolling interest in earnings before depreciation and amortization | | | – | | | | – | | | | – | | | | – | | | | – | | | | 27,576 | | | | 27,576 | | | | – | | | | – | | | | – | |
Allowance for projects under development revision | | | – | | | | – | | | | – | | | | – | | | | – | | | | 1,000 | | | | – | | | | – | | | | – | | | | 1,000 | |
Add: Pre–Tax EBDT from discontinued operations | | | – | | | | – | | | | – | | | | – | | | | – | | | | 9,941 | | | | – | | | | – | | | | (9,941 | ) | | | – | |
| | | | |
Pre–Tax EBDT | | | (135,737 | ) | | | – | | | | – | | | | – | | | | (135,737 | ) | | | 285,135 | | | | – | | | | – | | | | – | | | | 285,135 | |
Income tax expense (benefit) | | | (49,549 | ) | | | – | | | | – | | | | – | | | | (49,549 | ) | | | (24,740 | ) | | | – | | | | – | | | | – | | | | (24,740 | ) |
| | | | |
Earnings before depreciation, amortization and deferred taxes (EBDT) | | $ | (86,188 | ) | | $ | – | | | $ | – | | | $ | – | | | $ | (86,188 | ) | | $ | 309,875 | | | $ | – | | | $ | – | | | $ | – | | | $ | 309,875 | |
| | | | |
Reconciliation to net earnings: | | | | | | | | | | | | | | | | | | | | | | | | | | | | | | | | | | | | | | | | |
Earnings before depreciation, amortization and deferred taxes (EBDT) | | $ | (86,188 | ) | | $ | – | | | $ | – | | | $ | – | | | $ | (86,188 | ) | | $ | 309,875 | | | $ | – | | | $ | – | | | $ | – | | | $ | 309,875 | |
Depreciation and amortization – Real Estate Groups | | | – | | | | – | | | | – | | | | – | | | | – | | | | (275,510 | ) | | | – | | | | – | | | | (10,532 | ) | | | (286,042 | ) |
Amortization of mortgage procurement costs – Real Estate Groups | | | – | | | | – | | | | – | | | | – | | | | – | | | | (13,285 | ) | | | – | | | | – | | | | (1,056 | ) | | | (14,341 | ) |
Deferred taxes – Real Estate Groups | | | (19,095 | ) | | | – | | | | – | | | | – | | | | (19,095 | ) | | | (35,288 | ) | | | – | | | | – | | | | (2,469 | ) | | | (37,757 | ) |
Straight–line rent adjustment | | | – | | | | – | | | | – | | | | – | | | | – | | | | 16,365 | | | | – | | | | – | | | | 1,795 | | | | 18,160 | |
Preference payment | | | – | | | | – | | | | – | | | | – | | | | – | | | | (2,341 | ) | | | – | | | | – | | | | – | | | | (2,341 | ) |
Gain on disposition of rental properties and partial interests in rental properties, net of tax | | | – | | | | – | | | | – | | | | – | | | | – | | | | 125,026 | | | | – | | | | 14,362 | | | | 27,998 | | | | 167,386 | |
Gain on disposition of unconsolidated entities, net of tax | | | – | | | | – | | | | – | | | | – | | | | – | | | | 14,362 | | | | – | | | | (14,362 | ) | | | – | | | | – | |
Impairment of consolidated and unconsolidated real estate, net of tax | | | – | | | | – | | | | – | | | | – | | | | – | | | | (1,980 | ) | | | – | | | | (43,932 | ) | | | (49,980 | ) | | | (95,892 | ) |
Impairment of unconsolidated real estate, net of tax | | | – | | | | – | | | | – | | | | – | | | | – | | | | (43,932 | ) | | | – | | | | 43,932 | | | | – | | | | – | |
Allowance for projects under development revision | | | – | | | | – | | | | – | | | | – | | | | – | | | | (1,000 | ) | | | – | | | | – | | | | – | | | | (1,000 | ) |
Discontinued operations, net of tax: | | | | | | | | | | | | | | | | | | | | | | | | | | | | | | | | | | | | | | | | |
Depreciation and amortization – Real Estate Groups | | | – | | | | – | | | | – | | | | – | | | | – | | | | (10,532 | ) | | | – | | | | – | | | | 10,532 | | | | – | |
Amortization of mortgage procurement costs – Real Estate Groups | | | – | | | | – | | | | – | | | | – | | | | – | | | | (1,056 | ) | | | – | | | | – | | | | 1,056 | | | | – | |
Deferred taxes – Real Estate Groups | | | – | | | | – | | | | – | | | | – | | | | – | | | | (2,469 | ) | | | – | | | | – | | | | 2,469 | | | | – | |
Straight–line rent adjustment | | | – | | | | – | | | | – | | | | – | | | | – | | | | 1,795 | | | | – | | | | – | | | | (1,795 | ) | | | – | |
Gain on disposition of rental properties | | | – | | | | – | | | | – | | | | – | | | | – | | | | 27,998 | | | | – | | | | – | | | | (27,998 | ) | | | – | |
Impairment of consolidated and unconsolidated real estate | | | – | | | | – | | | | – | | | | – | | | | – | | | | (49,980 | ) | | | – | | | | – | | | | 49,980 | | | | – | |
| | | | |
Net earnings (loss) attributable to Forest City Enterprises, Inc. | | $ | (105,283 | ) | | $ | – | | | $ | – | | | $ | – | | | $ | (105,283 | ) | | $ | 58,048 | | | $ | – | | | $ | – | | | $ | – | | | $ | 58,048 | |
| | | | |
Preferred dividends | | | (11,807 | ) | | | – | | | | – | | | | – | | | | (11,807 | ) | | | (11,807 | ) | | | – | | | | – | | | | – | | | | (11,807 | ) |
| | | | |
Net earnings (loss) attributable to Forest City Enterprises, Inc. common shareholders | | $ | (117,090 | ) | | $ | – | | | $ | – | | | $ | – | | | $ | (117,090 | ) | | $ | 46,241 | | | $ | – | | | $ | – | | | $ | – | | | $ | 46,241 | |
| | | | |
63
Forest City Enterprises, Inc. and Subsidiaries
Supplemental Financial Information
Forest City Enterprises, Inc. Real Estate Portfolio as of January 31, 2012
COMMERCIAL GROUP-OFFICE BUILDINGS
| | | | | | | | | | | | | | | | | | | | | | | | |
| Name | | Date of
Opening/
Acquisition/
Expansion | | | Legal
Ownership (1) | | | Pro-Rata
Ownership (2) | | | Location | | Major Tenants | | Leasable
Square
Feet | | | Leasable
Square
Feet at
Pro-
Rata % | |
Consolidated Office Buildings | | | | | | | | | | | | | | | | | | | | | | | | |
2 Hanson Place | | | 2004 | | | | 100.00 | % | | | 100.00 | % | | Brooklyn, NY | | Bank of New York, HSBC | | | 399,000 | | | | 399,000 | |
4930 Oakton | | | 2006 | | | | 100.00 | % | | | 100.00 | % | | Skokie, IL | | Sanford Brown College | | | 40,000 | | | | 40,000 | |
Ballston Common Office Center | | | 2005 | | | | 100.00 | % | | | 100.00 | % | | Arlington, VA | | US Coast Guard; Better Business Bureau | | | 174,000 | | | | 174,000 | |
Colorado Studios | | | 2007 | | | | 90.00 | % | | | 90.00 | % | | Denver, CO | | Colorado Studios | | | 75,000 | | | | 68,000 | |
Commerce Court | | | 2007 | | | | 100.00 | % | | | 100.00 | % | | Pittsburgh, PA | | US Bank; Wesco Distributors; Cardworks Services; Marc USA | | | 379,000 | | | | 379,000 | |
Edgeworth Building | | | 2006 | | | | 100.00 | % | | | 100.00 | % | | Richmond, VA | | Hirschler Fleischer; Ernst & Young | | | 137,000 | | | | 137,000 | |
Eleven MetroTech Center | | | 1995 | | | | 85.00 | % | | | 85.00 | % | | Brooklyn, NY | | City of New York - DoITT; E-911 | | | 216,000 | | | | 184,000 | |
Fairmont Plaza | | | 1998 | | | | 100.00 | % | | | 100.00 | % | | San Jose, CA | | Littler Mendelson; Merrill Lynch; UBS Financial; Camera 12 Cinemas; Accenture | | | 405,000 | | | | 405,000 | |
Fifteen MetroTech Center | | | 2003 | | | | 95.00 | % | | | 95.00 | % | | Brooklyn, NY | | Wellpoint, Inc.; City of New York - HRA | | | 650,000 | | | | 618,000 | |
Halle Building | | | 1986 | | | | 100.00 | % | | | 100.00 | % | | Cleveland, OH | | Case Western Reserve University; Grant Thornton; CEOGC | | | 409,000 | | | | 409,000 | |
Harlem Center | | | 2003 | | | | 100.00 | % | | | 100.00 | % | | Manhattan, NY | | Office of General Services-Temporary Disability & Assistance; State Liquor Authority | | | 147,000 | | | | 147,000 | |
Higbee Building | | | 1990 | | | | 100.00 | % | | | 100.00 | % | | Cleveland, OH | | Key Bank; Horseshoe Casino | | | 815,000 | | | | 815,000 | |
Illinois Science and Technology Park | | | | | | | | | | | | | | | | | | | | | | | | |
- 4901 Searle (A) | | | 2006 | | | | 100.00 | % | | | 100.00 | % | | Skokie, IL | | Northshore University Health System | | | 224,000 | | | | 224,000 | |
- 8025 Lamon (P) | | | 2006 | | | | 100.00 | % | | | 100.00 | % | | Skokie, IL | | NanoInk, Inc.; Midwest Bio Research; Vetter Development Services | | | 128,000 | | | | 128,000 | |
- 8030 Lamon (J) | | | 2010 | | | | 100.00 | % | | | 100.00 | % | | Skokie, IL | | Leasing in progress | | | 147,000 | | | | 147,000 | |
- 8045 Lamon (Q) | | | 2007 | | | | 100.00 | % | | | 100.00 | % | | Skokie, IL | | Astellas; Polyera; APP Pharmaceuticals, LLC | | | 161,000 | | | | 161,000 | |
Johns Hopkins – 855 North Wolfe Street | | | 2008 | | | | 83.99 | % | | | 98.81 | % | | East Baltimore, MD | | Johns Hopkins; Brain Institute; Howard Hughes Institute; Lieber Institute | | | 279,000 | | | | 276,000 | |
New York Times | | | 2007 | | | | 100.00 | % | | | 100.00 | % | | Manhattan, NY | | ClearBridge Advisors, LLC, a Legg Mason Co.; Covington & Burling; Osler Hoskin & Harcourt; Seyfarth Shaw | | | 738,000 | | | | 738,000 | |
Nine MetroTech Center North | | | 1997 | | | | 85.00 | % | | | 85.00 | % | | Brooklyn, NY | | City of New York - Fire Department | | | 317,000 | | | | 269,000 | |
One MetroTech Center | | | 1991 | | | | 82.50 | % | | | 82.50 | % | | Brooklyn, NY | | JP Morgan Chase; National Grid | | | 937,000 | | | | 773,000 | |
One Pierrepont Plaza | | | 1988 | | | | 100.00 | % | | | 100.00 | % | | Brooklyn, NY | | Morgan Stanley; U.S. Probation | | | 659,000 | | | | 659,000 | |
Post Office Plaza (MK Ferguson) | | | 1990 | | | | 100.00 | % | | | 100.00 | % | | Cleveland, OH | | Washington Group; Chase Manhattan Mortgage Corp; Quicken Loans; Squire Sanders | | | 476,000 | | | | 476,000 | |
Richmond Office Park | | | 2007 | | | | 100.00 | % | | | 100.00 | % | | Richmond, VA | | The Brinks Co.; Wachovia Bank; Bon Secours Virginia HealthSource | | | 568,000 | | | | 568,000 | |
Skylight Office Tower | | | 1991 | | | | 92.50 | % | | | 100.00 | % | | Cleveland, OH | | Cap Gemini; Ulmer & Berne, LLP | | | 321,000 | | | | 321,000 | |
Stapleton – 3055 Roslyn | | | 2006 | | | | 90.00 | % | | | 90.00 | % | | Denver, CO | | University of Colorado Hospital | | | 45,000 | | | | 41,000 | |
Ten MetroTech Center | | | 1992 | | | | 100.00 | % | | | 100.00 | % | | Brooklyn, NY | | Internal Revenue Service | | | 365,000 | | | | 365,000 | |
Terminal Tower | | | 1983 | | | | 100.00 | % | | | 100.00 | % | | Cleveland, OH | | Forest City Enterprises, Inc.; Falls Communications; Riverside Company | | | 597,000 | | | | 597,000 | |
Twelve MetroTech Center | | | 2004 | | | | 100.00 | % | | | 100.00 | % | | Brooklyn, NY | | National Union Fire Insurance Co. | | | 177,000 | | | | 177,000 | |
Two MetroTech Center | | | 1990 | | | | 82.50 | % | | | 82.50 | % | | Brooklyn, NY | | City of New York - Board of Education; City of New York - DoITT | | | 522,000 | | | | 431,000 | |
University of Pennsylvania | | | 2004 | | | | 100.00 | % | | | 100.00 | % | | Philadelphia, PA | | University of Pennsylvania | | | 122,000 | | | | 122,000 | |
Consolidated Office Buildings Subtotal | | | 10,629,000 | | | | 10,248,000 | |
64
Forest City Enterprises, Inc. and Subsidiaries
Supplemental Financial Information
Forest City Enterprises, Inc. Real Estate Portfolio as of January 31, 2012
COMMERCIAL GROUP-OFFICE BUILDINGS (continued)
| | | | | | | | | | | | | | | | | | | | | | | | |
| Name | | Date of
Opening/
Acquisition/
Expansion | | �� | Legal
Ownership (1) | | | Pro-Rata
Ownership (2) | | | Location | | Major Tenants | | Leasable
Square
Feet | | | Leasable
Square
Feet at
Pro-Rata
% | |
Unconsolidated Office Buildings | | | | | | | | | | | | | | | | | | | | | | | | |
35 Landsdowne Street | | | 2002 | | | | 51.00 | % | | | 51.00 | % | | Cambridge, MA | | Millennium Pharmaceuticals | | | 202,000 | | | | 103,000 | |
350 Massachusetts Ave | | | 1998 | | | | 50.00 | % | | | 50.00 | % | | Cambridge, MA | | Star Market; Tofias; Novartis | | | 169,000 | | | | 85,000 | |
40 Landsdowne Street | | | 2003 | | | | 51.00 | % | | | 51.00 | % | | Cambridge, MA | | Millennium Pharmaceuticals | | | 215,000 | | | | 110,000 | |
45/75 Sidney Street | | | 1999 | | | | 51.00 | % | | | 51.00 | % | | Cambridge, MA | | Millennium Pharmaceuticals; Novartis | | | 277,000 | | | | 141,000 | |
65/80 Landsdowne Street | | | 2001 | | | | 51.00 | % | | | 51.00 | % | | Cambridge, MA | | Partners HealthCare System | | | 122,000 | | | | 62,000 | |
818 Mission Street | | | 2008 | | | | 50.00 | % | | | 50.00 | % | | San Francisco, CA | | Denny’s; Community Vocational Enterprises | | | 28,000 | | | | 14,000 | |
88 Sidney Street | | | 2002 | | | | 51.00 | % | | | 51.00 | % | | Cambridge, MA | | Vertex Pharmaceuticals | | | 145,000 | | | | 74,000 | |
Bulletin Building | | | 2006 | | | | 50.00 | % | | | 50.00 | % | | San Francisco, CA | | Great West Life and Annuity; Corinthian School | | | 78,000 | | | | 39,000 | |
Chagrin Plaza I & II | | | 1969 | | | | 66.67 | % | | | 66.67 | % | | Beachwood, OH | | Nine Sigma; Benihana; H&R Block | | | 113,000 | | | | 75,000 | |
Clark Building | | | 1989 | | | | 50.00 | % | | | 50.00 | % | | Cambridge, MA | | Sanofi Pasteur Biologics; Agios Pharmaceuticals | | | 122,000 | | | | 61,000 | |
Enterprise Place | | | 1998 | | | | 50.00 | % | | | 50.00 | % | | Beachwood, OH | | University of Phoenix; Advance Payroll; PS Executive Centers; Retina Assoc. of Cleveland | | | 132,000 | | | | 66,000 | |
Jackson Building | | | 1987 | | | | 51.00 | % | | | 51.00 | % | | Cambridge, MA | | Ariad Pharmaceuticals | | | 99,000 | | | | 50,000 | |
Liberty Center | | | 1986 | | | | 50.00 | % | | | 50.00 | % | | Pittsburgh, PA | | Federated Investors; Direct Energy Business | | | 526,000 | | | | 263,000 | |
Mesa del Sol – 5600 University SE | | | 2006 | | | | 47.50 | % | | | 47.50 | % | | Albuquerque, NM | | MSR-FSR, LLC; CFV Solar | | | 87,000 | | | | 41,000 | |
Mesa del Sol – Aperture Center | | | 2008 | | | | 47.50 | % | | | 47.50 | % | | Albuquerque, NM | | Forest City Covington NM, LLC | | | 76,000 | | | | 36,000 | |
Mesa del Sol – Fidelity | | | 2008/2009 | | | | 47.50 | % | | | 47.50 | % | | Albuquerque, NM | | Fidelity Investments | | | 210,000 | | | | 100,000 | |
Richards Building | | | 1990 | | | | 51.00 | % | | | 51.00 | % | | Cambridge, MA | | Genzyme Biosurgery; Alkermes, Inc. | | | 126,000 | | | | 64,000 | |
Signature Square I | | | 1986 | | | | 50.00 | % | | | 50.00 | % | | Beachwood, OH | | Ciuni & Panichi; PCC Airfoils; Liberty Bank | | | 79,000 | | | | 40,000 | |
Signature Square II | | | 1989 | | | | 50.00 | % | | | 50.00 | % | | Beachwood, OH | | Pro Ed Communications; Goldberg Co.; Resilience Mgt. | | | 82,000 | | | | 41,000 | |
Unconsolidated Office Buildings Subtotal | | | 2,888,000 | | | | 1,465,000 | |
| | |
Total Office Buildings at January 31, 2012 | | | 13,517,000 | | | | 11,713,000 | |
Total Office Buildings at January 31, 2011 | | | 14,259,000 | | | | 11,985,000 | |
65
Forest City Enterprises, Inc. and Subsidiaries
Supplemental Financial Information
Forest City Enterprises, Inc. Real Estate Portfolio as of January 31, 2012
COMMERCIAL GROUP-RETAIL CENTERS
| | | | | | | | | | | | | | | | | | | | | | | | | | | | | | | | |
| | | Date of | | | | | | | | | | | | | | | | Total | | | | | | Gross | |
| | | Opening/ | | | | | | | | | | | | | Total | | | Square | | | Gross | | | Leasable | |
| | | Acquisition/ | | | Legal | | | Pro-Rata | | | | | | | Square | | | Feet at Pro- | | | Leasable | | | Area at Pro- | |
| Name | | Expansion | | | Ownership (1) | | | Ownership (2) | | | Location | | Major Tenants | | Feet | | | Rata % | | | Area | | | Rata % | |
Consolidated Regional Malls | | | | | | | | | | | | | | | | | | | | | | | | | | | | | | | | |
Antelope Valley Mall | | | 1990/1999 | | | | 78.00 | % | | | 78.00 | % | | Palmdale, CA | | Macy’s; Sears; JCPenney; Dillard’s; Forever 21; Cinemark Theatre | | | 1,196,000 | | | | 933,000 | | | | 478,000 | | | | 373,000 | |
Ballston Common Mall | | | 1986/1999 | | | | 100.00 | % | | | 100.00 | % | | Arlington, VA | | Macy’s; Sport & Health; Regal Cinemas | | | 579,000 | | | | 579,000 | | | | 311,000 | | | | 311,000 | |
Galleria at Sunset | | | 1996/2002 | | | | 100.00 | % | | | 100.00 | % | | Henderson, NV | | Dillard’s; Macy’s; JCPenney; Dick’s Sporting Goods; Kohl’s | | | 1,048,000 | | | | 1,048,000 | | | | 412,000 | | | | 412,000 | |
Mall at Robinson | | | 2001 | | | | 56.67 | % | | | 100.00 | % | | Pittsburgh, PA | | Macy’s; Sears; JCPenney; Dick’s Sporting Goods | | | 880,000 | | | | 880,000 | | | | 384,000 | | | | 384,000 | |
Northfield at Stapleton | | | 2005/2006 | | | | 100.00 | % | | | 100.00 | % | | Denver, CO | | Bass Pro Shops; Target; Harkins Theatre; JCPenney; Macy’s | | | 1,127,000 | | | | 1,127,000 | | | | 664,000 | | | | 664,000 | |
Orchard Town Center | | | 2008/2012 | | | | 100.00 | % | | | 100.00 | % | | Westminster, CO | | JCPenney; Macy’s; Target; AMC Theatres | | | 1,043,000 | | | | 1,043,000 | | | | 507,000 | | | | 507,000 | |
Promenade Bolingbrook | | | 2007 | | | | 100.00 | % | | | 100.00 | % | | Bolingbrook, IL | | Bass Pro Shops; Macy’s; Gold Class Cinemas; Barnes & Noble; Designer Shoe Warehouse | | | 771,000 | | | | 771,000 | | | | 575,000 | | | | 575,000 | |
Promenade in Temecula | | | 1999/2002/2009 | | | | 75.00 | % | | | 100.00 | % | | Temecula, CA | | JCPenney; Sears; Macy’s; Edwards Cinema | | | 1,279,000 | | | | 1,279,000 | | | | 544,000 | | | | 544,000 | |
Shops at Wiregrass | | | 2008 | | | | 50.00 | % | | | 100.00 | % | | Tampa, FL | | JCPenney; Dillard’s; Macy’s; Barnes & Noble | | | 734,000 | | | | 734,000 | | | | 349,000 | | | | 349,000 | |
Short Pump Town Center | | | 2003/2005 | | | | 50.00 | % | | | 100.00 | % | | Richmond, VA | | Nordstrom; Macy’s; Dillard’s; Dick’s Sporting Goods | | | 1,303,000 | | | | 1,303,000 | | | | 591,000 | | | | 591,000 | |
South Bay Galleria | | | 1985/2001 | | | | 100.00 | % | | | 100.00 | % | | Redondo Beach, CA | | Nordstrom; Macy’s; Kohl’s; AMC Theatres | | | 956,000 | | | | 956,000 | | | | 389,000 | | | | 389,000 | |
Victoria Gardens | | | 2004/2007 | | | | 80.00 | % | | | 80.00 | % | | Rancho Cucamonga, CA | | Bass Pro Shops; Macy’s; JCPenney; AMC Theatres | | | 1,401,000 | | | | 1,121,000 | | | | 829,000 | | | | 663,000 | |
^ Westchester’s Ridge Hill | | | 2011/2012 | | | | 70.00 | % | | | 100.00 | % | | Yonkers, NY | | Lord & Taylor; WESTMED Medical Group; LA Fitness; National Amusements’ Cinema de Lux; Whole Foods; Dick’s Sporting Goods | | | 1,336,000 | | | | 1,336,000 | | | | 1,336,000 | | | | 1,336,000 | |
| | | | | | | | | | | | | | | | | | | | |
Consolidated Regional Malls Subtotal | | | 13,653,000 | | | | 13,110,000 | | | | 7,369,000 | | | | 7,098,000 | |
| | | | | | | | | | | | | | | | | | | | |
66
Forest City Enterprises, Inc. and Subsidiaries
Supplemental Financial Information
Forest City Enterprises, Inc. Real Estate Portfolio as of January 31, 2012
COMMERCIAL GROUP-RETAIL CENTERS (continued)
| | | | | | | | | | | | | | | | | | | | | | | | | | | | | | | | |
| | | Date of | | | | | | | | | | | | | | | | Total | | | | | | Gross | |
| | | Opening/ | | | | | | | | | | | | | Total | | | Square | | | Gross | | | Leasable | |
| | | Acquisition/ | | | Legal | | | Pro-Rata | | | | | | | Square | | | Feet at Pro- | | | Leasable | | | Area at Pro- | |
| Name | | Expansion | | | Ownership (1) | | | Ownership (2) | | | Location | | Major Tenants | | Feet | | | Rata % | | | Area | | | Rata % | |
Consolidated Specialty Retail Centers | | | | | | | | | | | | | | | | | | | | | | | | | | | | | | | | |
Atlantic Center Site V | | | 1998 | | | | 100.00 | % | | | 100.00 | % | | Brooklyn, NY | | Modell’s | | | 17,000 | | | | 17,000 | | | | 17,000 | | | | 17,000 | |
Avenue at Tower City Center | | | 1990 | | | | 100.00 | % | | | 100.00 | % | | Cleveland, OH | | Hard Rock Café; Morton’s of Chicago; Cleveland Cinemas; Horseshoe Casino (located in Higbee Building) | | | 365,000 | | | | 365,000 | | | | 365,000 | | | | 365,000 | |
Brooklyn Commons | | | 2004 | | | | 100.00 | % | | | 100.00 | % | | Brooklyn, NY | | Lowe’s | | | 151,000 | | | | 151,000 | | | | 151,000 | | | | 151,000 | |
Market at Tobacco Row | | | 2002 | | | | 100.00 | % | | | 100.00 | % | | Richmond, VA | | Rich Foods; CVS/Pharmacy | | | 43,000 | | | | 43,000 | | | | 43,000 | | | | 43,000 | |
Quartermaster Plaza | | | 2004 | | | | 100.00 | % | | | 100.00 | % | | Philadelphia, PA | | Home Depot; BJ’s Wholesale Club; Staples; PetSmart; Walgreen’s | | | 456,000 | | | | 456,000 | | | | 456,000 | | | | 456,000 | |
++ Quebec Square | | | 2002 | | | | 90.00 | % | | | 90.00 | % | | Denver, CO | | Walmart; Home Depot; Sam’s Club; Ross Dress for Less; Office Depot; PetSmart | | | 739,000 | | | | 665,000 | | | | 217,000 | | | | 195,000 | |
Station Square | | | 1994/2002 | | | | 100.00 | % | | | 100.00 | % | | Pittsburgh, PA | | Hard Rock Café; Grand Concourse Restaurant; Buca Di Beppo | | | 291,000 | | | | 291,000 | | | | 291,000 | | | | 291,000 | |
* The Yards – Boilermaker Shops | | | 2012 | | | | 100.00 | % | | | 100.00 | % | | Washington, D.C. | | Forest City Enterprises; Buzz Bakery; Huey’s 24/7 Diner; Willie’s Brew & Que; Well’s Cleaners; Smith & Union Brewery | | | 40,000 | | | | 40,000 | | | | 40,000 | | | | 40,000 | |
Town Center (East 29th Avenue) | | | 2004 | | | | 90.00 | % | | | 90.00 | % | | Denver, CO | | King Soopers; Walgreen’s; Casey’s Pub; Chipotle; | | | 181,000 | | | | 163,000 | | | | 98,000 | | | | 88,000 | |
| | | | | | | | | | | | | | | | SDC Services Corp.; Exempla, Inc. | | | | | | | | | | | | | | | | |
White Oak Village | | | 2008 | | | | 50.00 | % | | | 100.00 | % | | Richmond, VA | | Target; Lowe’s; Sam’s Club; JCPenney; OfficeMax; PetSmart; Martin’s | | | 843,000 | | | | 843,000 | | | | 295,000 | | | | 295,000 | |
| | | | | | | | | | | | | | | | | | | | |
Consolidated Specialty Retail Centers Subtotal | | | 3,126,000 | | | | 3,034,000 | | | | 1,973,000 | | | | 1,941,000 | |
| | | | | | | | | | | | | | | | | | | | |
Consolidated Retail Centers Total | | | 16,779,000 | | | | 16,144,000 | | | | 9,342,000 | | | | 9,039,000 | |
| | | | | | | | | | | | | | | | | | | | |
67
Forest City Enterprises, Inc. and Subsidiaries
Supplemental Financial Information
Forest City Enterprises, Inc. Real Estate Portfolio as of January 31, 2012
COMMERCIAL GROUP-RETAIL CENTERS (continued)
| | | | | | | | | | | | | | | | | | | | | | | | | | | | | | | | |
| Name | | Date of
Opening/
Acquisition/
Expansion | | | Legal
Ownership (1) | | | Pro-Rata
Ownership (2) | | | Location | | Major Tenants | | Total Square
Feet | | | Total Square
Feet at
Pro- Rata % | | | Gross
Leasable
Area | | | Gross
Leasable
Area at Pro-
Rata % | |
| | | | | | | | | |
Unconsolidated Regional Malls | | | | | | | | | | | | | | | | | | | | | | | | | | | | | | | | |
Boulevard Mall | | | 1996/2000 | | | | 50.00 | % | | | 50.00 | % | | Amherst, NY | | JCPenney; Macy’s; Sears; Michael’s | | | 912,000 | | | | 456,000 | | | | 336,000 | | | | 168,000 | |
Charleston Town Center | | | 1983 | | | | 50.00 | % | | | 50.00 | % | | Charleston, WV | | Macy’s; JCPenney; Sears; Brickstreet Insurance | | | 897,000 | | | | 449,000 | | | | 363,000 | | | | 182,000 | |
Mall at Stonecrest | | | 2001 | | | | 51.00 | % | | | 51.00 | % | | Atlanta, GA | | Kohl’s; Sears; JCPenney; Dillard’s; AMC Theatres; Macy’s | | | 1,226,000 | | | | 625,000 | | | | 397,000 | | | | 202,000 | |
San Francisco Centre | | | 2006 | | | | 50.00 | % | | | 50.00 | % | | San Francisco, CA | | Nordstrom; Bloomingdale’s; Century Theaters; San Francisco State University; Microsoft | | | 1,462,000 | | | | 731,000 | | | | 788,000 | | | | 394,000 | |
| | | | | | | | | | | | | | | | | | | | |
Unconsolidated Regional Malls Subtotal | | | 4,497,000 | | | | 2,261,000 | | | | 1,884,000 | | | | 946,000 | |
| | | | | | | | | | | | | | | | | | | | |
|
Unconsolidated Specialty Retail Centers | |
42nd Street | | | 1999 | | | | 51.00 | % | | | 51.00 | % | | Manhattan, NY | | AMC Theatres; Madame Tussaud’s Wax Museum; Modell’s; Dave & Buster’s; Ripley’s Believe It or Not!; Famous Dave’s BBQ | | | 309,000 | | | | 158,000 | | | | 309,000 | | | | 158,000 | |
Atlantic Center | | | 1996 | | | | 51.00 | % | | | 51.00 | % | | Brooklyn, NY | | Pathmark; OfficeMax; Old Navy; Marshall’s; NYC - Dept of Motor Vehicles; Best Buy | | | 395,000 | | | | 201,000 | | | | 395,000 | | | | 201,000 | |
Atlantic Terminal | | | 2004 | | | | 51.00 | % | | | 51.00 | % | | Brooklyn, NY | | Target; Designer Shoe Warehouse; Chuck E. Cheese’s; Daffy’s; Guitar Center | | | 371,000 | | | | 189,000 | | | | 371,000 | | | | 189,000 | |
Bruckner Boulevard | | | 1996 | | | | 51.00 | % | | | 51.00 | % | | Bronx, NY | | Conway; Old Navy; Marshall’s | | | 113,000 | | | | 58,000 | | | | 113,000 | | | | 58,000 | |
Columbia Park Center | | | 1999 | | | | 38.25 | % | | | 38.25 | % | | North Bergen, NJ | | Shop Rite; Old Navy; Staples; Bally’s; Shopper’s World; Phoenix Theatres | | | 351,000 | | | | 134,000 | | | | 351,000 | | | | 134,000 | |
Court Street | | | 2000 | | | | 51.00 | % | | | 51.00 | % | | Brooklyn, NY | | United Artists Theatres; Barnes & Noble | | | 102,000 | | | | 52,000 | | | | 102,000 | | | | 52,000 | |
Eastchester | | | 2000 | | | | 51.00 | % | | | 51.00 | % | | Bronx, NY | | Pathmark | | | 63,000 | | | | 32,000 | | | | 63,000 | | | | 32,000 | |
East River Plaza | | | 2009/2010 | | | | 35.00 | % | | | 50.00 | % | | Manhattan, NY | | Costco; Target; Best Buy; Marshall’s; PetSmart; Bob’s Furniture; Old Navy | | | 527,000 | | | | 264,000 | | | | 527,000 | | | | 264,000 | |
Forest Avenue | | | 2000 | | | | 51.00 | % | | | 51.00 | % | | Staten Island, NY | | United Artists Theatres | | | 70,000 | | | | 36,000 | | | | 70,000 | | | | 36,000 | |
Golden Gate | | | 1958 | | | | 50.00 | % | | | 50.00 | % | | Mayfield Heights, OH | | OfficeMax; JoAnn Fabrics; Marshall’s; World Market; HH Gregg; PetSmart | | | 361,000 | | | | 181,000 | | | | 361,000 | | | | 181,000 | |
Gun Hill Road | | | 1997 | | | | 51.00 | % | | | 51.00 | % | | Bronx, NY | | Home Depot; Chuck E. Cheese’s | | | 147,000 | | | | 75,000 | | | | 147,000 | | | | 75,000 | |
Harlem Center | | | 2002 | | | | 51.00 | % | | | 51.00 | % | | Manhattan, NY | | Marshall’s; CVS/Pharmacy; Staples; H&M; Planet Fitness | | | 126,000 | | | | 64,000 | | | | 126,000 | | | | 64,000 | |
Kaufman Studios | | | 1999 | | | | 51.00 | % | | | 51.00 | % | | Queens, NY | | United Artists Theatres | | | 84,000 | | | | 43,000 | | | | 84,000 | | | | 43,000 | |
Marketplace at Riverpark | | | 1996 | | | | 50.00 | % | | | 50.00 | % | | Fresno, CA | | JCPenney; Best Buy; Marshall’s; OfficeMax; Old Navy; Target; Sports Authority | | | 471,000 | | | | 236,000 | | | | 296,000 | | | | 148,000 | |
Northern Boulevard | | | 1997 | | | | 51.00 | % | | | 51.00 | % | | Queens, NY | | Stop & Shop; Marshall’s; Old Navy; AJ Wright; Guitar Center | | | 218,000 | | | | 111,000 | | | | 218,000 | | | | 111,000 | |
Plaza at Robinson Town Center | | | 1989 | | | | 50.00 | % | | | 50.00 | % | | Pittsburgh, PA | | T.J. Maxx; Marshall’s; IKEA; Value City; JoAnn Fabrics; HomeGoods | | | 507,000 | | | | 254,000 | | | | 507,000 | | | | 254,000 | |
Queens Place | | | 2001 | | | | 51.00 | % | | | 51.00 | % | | Queens, NY | | Target; Best Buy; Macy’s Furniture; Designer Shoe Warehouse | | | 455,000 | | | | 232,000 | | | | 221,000 | | | | 113,000 | |
Richmond Avenue | | | 1998 | | | | 51.00 | % | | | 51.00 | % | | Staten Island, NY | | Staples; Dick’s Sporting Goods | | | 76,000 | | | | 39,000 | | | | 76,000 | | | | 39,000 | |
Village at Gulfstream Park | | | 2010 | | | | 50.00 | % | | | 50.00 | % | | Hallandale Beach, FL | | Crate & Barrel; The Container Store; Texas de Brazil; Yard House | | | 511,000 | | | | 256,000 | | | | 511,000 | | | | 256,000 | |
| | | | | | | | | | | | | | | | | | | | |
Unconsolidated Specialty Retail Centers Subtotal | | | 5,257,000 | | | | 2,615,000 | | | | 4,848,000 | | | | 2,408,000 | |
| | | | | | | | | | | | | | | | | | | | |
| | | | |
Unconsolidated Retail Centers Total | | | 9,754,000 | | | | 4,876,000 | | | | 6,732,000 | | | | 3,354,000 | |
| | | | | | | | | | | | | | | | | | | | |
| | | | |
Total Retail Centers at January 31, 2012 | | | 26,533,000 | | | | 21,020,000 | | | | 16,074,000 | | | | 12,393,000 | |
| | | | | | | | | | | | | | | | | | | | |
Total Retail Centers at January 31, 2011 | | | 26,464,000 | | | | 22,511,000 | | | | 16,005,000 | | | | 13,640,000 | |
| | | | | | | | | | | | | | | | | | | | |
68
Forest City Enterprises, Inc. and Subsidiaries
Supplemental Financial Information
Forest City Enterprises, Inc. Real Estate Portfolio as of January 31, 2012
COMMERCIAL GROUP – HOTELS
| | | | | | | | | | | | | | | | | | | | | | |
| Name | | Date of
Opening/
Acquisition/
Expansion | | | Legal
Ownership (1) | | | Pro-Rata
Ownership (2) | | | Location | | Rooms | | | Hotel Rooms at
Pro-Rata % | |
Consolidated Hotels | | | | | | | | | | | | | | | | | | | | | | |
Sheraton Station Square | | | 1998/2001 | | | | 100.00 | % | | | 100.00 | % | | Pittsburgh, PA | | | 399 | | | | 399 | |
| | | | | | | | | | | | | | | | | | |
| | | | | | |
Unconsolidated Hotels | | | | | | | | | | | | | | | | | | | | | | |
Westin Convention Center | | | 1986 | | | | 50.00 | % | | | 50.00 | % | | Pittsburgh, PA | | | 616 | | | | 308 | |
| | | | | | | | | | | | | | | | | | |
| | |
Total Hotel Rooms at January 31, 2012 | | | 1,015 | | | | 707 | |
| | | | | | | | | | | | | | | | | | |
Total Hotel Rooms at January 31, 2011 | | | 1,573 | | | | 1,265 | |
| | | | | | | | | | | | | | | | | | |
| | | | | | | | | | | | | | | | | | | | | | | | | | | | | | | | |
| COMMERCIAL GROUP - ARENA | | | | | | | | | | | | | Major Tenants | | Total
Square
Feet | | | Total Square
Feet at Pro-Rata
% | | | Est. Seating
Capacity for
NBA
Basketball
Event | | | Est. Seating
Capacity
for NBA
Basketball
Event at
Pro-Rata % | |
| | | | | | | | | |
* Barclays Center | | | 2012 | | | | 34.01 | % | | | 34.01 | % | | Brooklyn, NY | | The Nets NBA Team | | | 670,000 | | | | 228,000 | | | | 18,000 | | | | 6,122 | |
| | | | | | | | | | | | | | | | | | | | |
69
Forest City Enterprises, Inc. and Subsidiaries
Supplemental Financial Information
Forest City Enterprises, Inc. Real Estate Portfolio as of January 31, 2012
RESIDENTIAL GROUP – APARTMENTS
| | | | | | | | | | | | | | | | | | | | |
| Name | | Date of
Opening/
Acquisition/
Expansion | | Legal
Ownership (1) | | | Pro-Rata
Ownership (2) | | | Location | | Leasable
Units(3) | | | Leasable Units
at Pro-Rata % (3) | |
Consolidated Apartment Communities | | | | | | | | | | | | | | | | | | | | |
100 Landsdowne Street | | 2005 | | | 100.00 | % | | | 100.00 | % | | Cambridge, MA | | | 203 | | | | 203 | |
1251 S. Michigan | | 2006 | | | 0.01 | % | | | 100.00 | % | | Chicago, IL | | | 91 | | | | 91 | |
American Cigar Company | | 2000 | | | 100.00 | % | | | 100.00 | % | | Richmond, VA | | | 171 | | | | 171 | |
Ashton Mill | | 2005 | | | 100.00 | % | | | 100.00 | % | | Cumberland, RI | | | 193 | | | | 193 | |
* Botanica Eastbridge | | 2012 | | | 90.00 | % | | | 90.00 | % | | Denver, CO | | | 118 | | | | 106 | |
Brookview Place | | 1979 | | | 3.00 | % | | | 3.00 | % | | Dayton, OH | | | 232 | | | | 7 | |
Cameron Kinney | | 2007 | | | 100.00 | % | | | 100.00 | % | | Richmond, VA | | | 259 | | | | 259 | |
Cedar Place | | 1974 | | | 2.39 | % | | | 100.00 | % | | Lansing, MI | | | 220 | | | | 220 | |
Consolidated-Carolina | | 2003 | | | 89.99 | % | | | 100.00 | % | | Richmond, VA | | | 158 | | | | 158 | |
* Continental Building | | 2013 | | | 100.00 | % | | | 100.00 | % | | Dallas, TX | | | 203 | | | | 203 | |
Cutter’s Ridge at Tobacco Row | | 2006 | | | 100.00 | % | | | 100.00 | % | | Richmond, VA | | | 12 | | | | 12 | |
Drake | | 1998 | | | 95.05 | % | | | 95.05 | % | | Philadelphia, PA | | | 284 | | | | 270 | |
Easthaven at the Village | | 1994/1995 | | | 100.00 | % | | | 100.00 | % | | Beachwood, OH | | | 360 | | | | 360 | |
Emerald Palms | | 1996/2004 | | | 100.00 | % | | | 100.00 | % | | Miami, FL | | | 505 | | | | 505 | |
Foundry Lofts | | 2011 | | | 100.00 | % | | | 100.00 | % | | Washington, D.C. | | | 170 | | | | 170 | |
Grand Lowry Lofts | | 2000 | | | 100.00 | % | | | 100.00 | % | | Denver, CO | | | 261 | | | | 261 | |
Hamel Mill Lofts | | 2008/2010 | | | 90.00 | % | | | 100.00 | % | | Haverhill, MA | | | 305 | | | | 305 | |
Heritage | | 2002 | | | 100.00 | % | | | 100.00 | % | | San Diego, CA | | | 230 | | | | 230 | |
Independence Place I | | 1973 | | | 50.00 | % | | | 50.00 | % | | Parma Heights, OH | | | 202 | | | | 101 | |
Independence Place II | | 2003 | | | 100.00 | % | | | 100.00 | % | | Parma Heights, OH | | | 201 | | | | 201 | |
Kennedy Biscuit Lofts | | 1990 | | | 3.00 | % | | | 100.00 | % | | Cambridge, MA | | | 142 | | | | 142 | |
Knolls | | 1995 | | | 1.00 | % | | | 95.00 | % | | Orange, CA | | | 260 | | | | 247 | |
Lofts 23 | | 2005 | | | 100.00 | % | | | 100.00 | % | | Cambridge, MA | | | 51 | | | | 51 | |
Lofts at 1835 Arch | | 2001 | | | 95.05 | % | | | 95.05 | % | | Philadelphia, PA | | | 191 | | | | 182 | |
Lucky Strike | | 2008 | | | 88.98 | % | | | 100.00 | % | | Richmond, VA | | | 131 | | | | 131 | |
Mercantile Place on Main | | 2008 | | | 100.00 | % | | | 100.00 | % | | Dallas, TX | | | 366 | | | | 366 | |
Metro 417 | | 2005 | | | 100.00 | % | | | 100.00 | % | | Los Angeles, CA | | | 277 | | | | 277 | |
Metropolitan | | 1989 | | | 100.00 | % | | | 100.00 | % | | Los Angeles, CA | | | 270 | | | | 270 | |
Midtown Towers | | 1969 | | | 100.00 | % | | | 100.00 | % | | Parma, OH | | | 635 | | | | 635 | |
70
Forest City Enterprises, Inc. and Subsidiaries
Supplemental Financial Information
Forest City Enterprises, Inc. Real Estate Portfolio as of January 31, 2012
RESIDENTIAL GROUP—APARTMENTS (continued)
| | | | | | | | | | | | | | | | | | | | |
| Name | | Date of
Opening/
Acquisition/ Expansion | | Legal
Ownership (1) | | | Pro-Rata
Ownership (2) | | | Location | | Leasable
Units(3) | | | Leasable Units at Pro-Rata % (3) | |
| | | | | | |
Consolidated Apartment Communities (continued) | | | | | | | | | | | | | | | | | | | | |
Millender Center | | 1985 | | | 5.57% | | | | 90.56% | | | Detroit, MI | | | 339 | | | | 307 | |
Museum Towers | | 1997 | | | 100.00% | | | | 100.00% | | | Philadelphia, PA | | | 286 | | | | 286 | |
North Church Towers | | 2009 | | | 100.00% | | | | 100.00% | | | Parma Heights, OH | | | 399 | | | | 399 | |
One Franklintown | | 1988 | | | 100.00% | | | | 100.00% | | | Philadelphia, PA | | | 335 | | | | 335 | |
Parmatown Towers and Gardens | | 1972-1973 | | | 100.00% | | | | 100.00% | | | Parma, OH | | | 406 | | | | 406 | |
Pavilion | | 1992 | | | 95.00% | | | | 95.00% | | | Chicago, IL | | | 1,114 | | | | 1,058 | |
Perrytown Place | | 1973 | | | 8.12% | | | | 100.00% | | | Pittsburgh, PA | | | 231 | | | | 231 | |
Presidio Landmark | | 2010 | | | 1.00% | | | | 100.00% | | | San Francisco, CA | | | 161 | | | | 161 | |
Queenswood | | 1990 | | | 93.36% | | | | 93.36% | | | Corona, NY | | | 296 | | | | 276 | |
Sky55 | | 2006 | | | 100.00% | | | | 100.00% | | | Chicago, IL | | | 411 | | | | 411 | |
Southfield | | 2002 | | | 100.00% | | | | 100.00% | | | Whitemarsh, MD | | | 212 | | | | 212 | |
* The Aster Town Center | | 2012 | | | 90.00% | | | | 90.00% | | | Denver, CO | | | 85 | | | | 77 | |
Town Center (Botanica on the Green & Crescent Flats) | | 2004/2007 | | | 90.00% | | | | 90.00% | | | Denver, CO | | | 298 | | | | 268 | |
Wilson Building | | 2007 | | | 100.00% | | | | 100.00% | | | Dallas, TX | | | 135 | | | | 135 | |
Consolidated Apartment Communities Subtotal | | | 11,409 | | | | 10,889 | |
| | | | | | |
Consolidated Supported-Living Apartments | | | | | | | | | | | | | | | | | | | | |
Forest Trace | | 2000 | | | 100.00% | | | | 100.00% | | | Lauderhill, FL | | | 322 | | | | 322 | |
| | |
Consolidated Apartments Total | | | 11,731 | | | | 11,211 | |
71
Forest City Enterprises, Inc. and Subsidiaries
Supplemental Financial Information
Forest City Enterprises, Inc. Real Estate Portfolio as of January 31, 2012
RESIDENTIAL GROUP – APARTMENTS (continued)
| | | | | | | | | | | | | | | | |
| Name | | Date of
Opening/
Acquisition/ Expansion | | Legal
Ownership (1) | | Pro-Rata
Ownership (2) | | Location | | Leasable
Units(3) | | | Leasable Units at Pro-Rata % (3) | |
| | | | | | |
Unconsolidated Apartment Communities | | | | | | | | | | | | | | | | |
^ 8 Spruce Street | | 2011/2012 | | 35.70% | | 51.00% | | Manhattan, NY | | | 899 | | | | 458 | |
Arbor Glen | | 2001-2007 | | 50.00% | | 50.00% | | Twinsburg, OH | | | 288 | | | | 144 | |
Barrington Place | | 2008 | | 49.00% | | 49.00% | | Raleigh, NC | | | 274 | | | | 134 | |
Bayside Village | | 1988-1989 | | 50.00% | | 50.00% | | San Francisco, CA | | | 862 | | | | 431 | |
Big Creek | | 1996-2001 | | 50.00% | | 50.00% | | Parma Heights, OH | | | 516 | | | | 258 | |
Camelot | | 1967 | | 50.00% | | 50.00% | | Parma Heights, OH | | | 151 | | | | 76 | |
Cherry Tree | | 1996-2000 | | 50.00% | | 50.00% | | Strongsville, OH | | | 442 | | | | 221 | |
Chestnut Lake | | 1969 | | 50.00% | | 50.00% | | Strongsville, OH | | | 789 | | | | 395 | |
Cobblestone Court Apartments | | 2006-2009 | | 50.00% | | 50.00% | | Painesville, OH | | | 400 | | | | 200 | |
Colonial Grand | | 2003 | | 50.00% | | 50.00% | | Tampa, FL | | | 176 | | | | 88 | |
Coppertree | | 1998 | | 50.00% | | 50.00% | | Mayfield Heights, OH | | | 342 | | | | 171 | |
Deer Run | | 1987-1990 | | 46.00% | | 46.00% | | Twinsburg, OH | | | 562 | | | | 259 | |
DKLB BKLN | | 2009/2010 | | 40.80% | | 51.00% | | Brooklyn, NY | | | 365 | | | | 186 | |
Eaton Ridge | | 2002-2004 | | 50.00% | | 50.00% | | Sagamore Hills, OH | | | 260 | | | | 130 | |
Fenimore Court | | 1982 | | 7.06% | | 50.00% | | Detroit, MI | | | 144 | | | | 72 | |
Fort Lincoln II | | 1979 | | 45.00% | | 45.00% | | Washington, D.C. | | | 176 | | | | 79 | |
Fort Lincoln III & IV | | 1981 | | 24.90% | | 24.90% | | Washington, D.C. | | | 306 | | | | 76 | |
Grand | | 1999 | | 42.75% | | 42.75% | | North Bethesda, MD | | | 549 | | | | 235 | |
Hamptons | | 1969 | | 50.00% | | 50.00% | | Beachwood, OH | | | 651 | | | | 326 | |
Hunter’s Hollow | | 1990 | | 50.00% | | 50.00% | | Strongsville, OH | | | 208 | | | | 104 | |
Legacy Arboretum | | 2008 | | 49.00% | | 49.00% | | Charlotte, NC | | | 266 | | | | 130 | |
Legacy Crossroads | | 2008-2009 | | 50.00% | | 50.00% | | Cary, NC | | | 344 | | | | 172 | |
Lenox Club | | 1991 | | 47.50% | | 47.50% | | Arlington, VA | | | 385 | | | | 183 | |
Lenox Park | | 1992 | | 47.50% | | 47.50% | | Silver Spring, MD | | | 406 | | | | 193 | |
Liberty Hills | | 1979-1986 | | 50.00% | | 50.00% | | Solon, OH | | | 396 | | | | 198 | |
Newport Landing | | 2002-2005 | | 50.00% | | 50.00% | | Coventry Township, OH | | | 336 | | | | 168 | |
Noble Towers | | 1979 | | 50.00% | | 50.00% | | Pittsburgh, PA | | | 133 | | | | 67 | |
Parkwood Village | | 2001-2002 | | 50.00% | | 50.00% | | Brunswick, OH | | | 204 | | | | 102 | |
72
Forest City Enterprises, Inc. and Subsidiaries
Supplemental Financial Information
Forest City Enterprises, Inc. Real Estate Portfolio as of January 31, 2012
RESIDENTIAL GROUP - APARTMENTS (continued)
| | | | | | | | | | | | | | | | | | | | |
| Name | | Date of
Opening/
Acquisition/ Expansion | | Legal
Ownership (1) | | | Pro-Rata
Ownership (2) | | | Location | | Leasable
Units(3) | | | Leasable Units at Pro-Rata % (3) | |
| | | | | | |
Unconsolidated Apartment Communities (continued) | | | | | | | | | | | | | | | | | | | | |
Pine Ridge Valley | | 1967-1974,
2005-2007 | | | 50.00 | % | | | 50.00 | % | | Willoughby Hills, OH | | | 1,309 | | | | 655 | |
Residences at University Park | | 2002 | | | 40.00 | % | | | 40.00 | % | | Cambridge, MA | | | 135 | | | | 54 | |
Settler’s Landing at Greentree | | 2000-2004 | | | 50.00 | % | | | 50.00 | % | | Streetsboro, OH | | | 408 | | | | 204 | |
Stratford Crossing | | 2007-2010 | | | 50.00 | % | | | 50.00 | % | | Wadsworth, OH | | | 348 | | | | 174 | |
Surfside Towers | | 1970 | | | 50.00 | % | | | 50.00 | % | | Eastlake, OH | | | 246 | | | | 123 | |
Sutton Landing | | 2007-2009 | | | 50.00 | % | | | 50.00 | % | | Brimfield, OH | | | 216 | | | | 108 | |
Tamarac | | 1990-2001 | | | 50.00 | % | | | 50.00 | % | | Willoughby, OH | | | 642 | | | | 321 | |
Uptown Apartments | | 2008 | | | 50.00 | % | | | 50.00 | % | | Oakland, CA | | | 665 | | | | 333 | |
Westwood Reserve | | 2002 | | | 50.00 | % | | | 50.00 | % | | Tampa, FL | | | 340 | | | | 170 | |
Woodgate / Evergreen Farms | | 2004-2006 | | | 33.33 | % | | | 33.33 | % | | Olmsted Township, OH | | | 348 | | | | 116 | |
Worth Street | | 2003 | | | 50.00 | % | | | 50.00 | % | | Manhattan, NY | | | 330 | | | | 165 | |
Unconsolidated Apartment Communities Subtotal | | | | | | | | | | | | | | | 15,817 | | | | 7,679 | |
| | | | | | |
Unconsolidated Senior Housing Apartments | | | | | | | | | | | | | | | | | | | | |
Autumn Ridge | | 2002 | | | 100.00 | % | | | 100.00 | % | | Sterling Heights, MI | | | 251 | | | | 251 | |
Bowin | | 1998 | | | 95.05 | % | | | 95.05 | % | | Detroit, MI | | | 193 | | | | 183 | |
Brookpark Place | | 1976 | | | 100.00 | % | | | 100.00 | % | | Wheeling, WV | | | 152 | | | | 152 | |
Buckeye Towers | | 1976 | | | 8.94 | % | | | 8.94 | % | | New Boston, OH | | | 120 | | | | 11 | |
Burton Place | | 2000 | | | 90.00 | % | | | 90.00 | % | | Burton, MI | | | 200 | | | | 180 | |
Cambridge Towers | | 2002 | | | 100.00 | % | | | 100.00 | % | | Detroit, MI | | | 250 | | | | 250 | |
Canton Towers | | 1978 | | | 8.94 | % | | | 8.94 | % | | Canton, OH | | | 199 | | | | 18 | |
Carl D. Perkins | | 2002 | | | 100.00 | % | | | 100.00 | % | | Pikeville, KY | | | 150 | | | | 150 | |
Connellsville Towers | | 1981 | | | 9.59 | % | | | 9.59 | % | | Connellsville, PA | | | 111 | | | | 11 | |
Coraopolis Towers | | 2002 | | | 80.00 | % | | | 80.00 | % | | Coraopolis, PA | | | 200 | | | | 160 | |
Donora Towers | | 2002 | | | 100.00 | % | | | 100.00 | % | | Donora, PA | | | 103 | | | | 103 | |
Farmington Place | | 1980 | | | 100.00 | % | | | 100.00 | % | | Farmington, MI | | | 153 | | | | 153 | |
Frenchtown Place | | 1975 | | | 8.12 | % | | | 100.00 | % | | Monroe, MI | | | 151 | | | | 151 | |
Glendora Gardens | | 1983 | | | 1.99 | % | | | 45.51 | % | | Glendora, CA | | | 105 | | | | 48 | |
73
Forest City Enterprises, Inc. and Subsidiaries
Supplemental Financial Information
Forest City Enterprises, Inc. Real Estate Portfolio as of January 31, 2012
RESIDENTIAL GROUP - APARTMENTS (continued)
| | | | | | | | | | | | | | | | | | | | | | |
| Name | | Date of Opening/ Acquisition/ Expansion | | | Legal Ownership (1) | | | Pro-Rata Ownership (2) | | | Location | | Leasable
Units(3) | | | Leasable Units at Pro-Rata % (3) | |
| | | | | | |
Unconsolidated Senior Housing Apartments (continued) | | | | | | | | | | | | | | | | | | | | | | |
Grove | | | 2003 | | | | 100.00 | % | | | 100.00 | % | | Ontario, CA | | | 101 | | | | 101 | |
Lakeland | | | 1998 | | | | 95.10 | % | | | 95.10 | % | | Waterford, MI | | | 200 | | | | 190 | |
Lima Towers | | | 1977 | | | | 8.94 | % | | | 8.94 | % | | Lima, OH | | | 200 | | | | 18 | |
Miramar Towers | | | 1980 | | | | 7.98 | % | | | 100.00 | % | | Los Angeles, CA | | | 157 | | | | 157 | |
North Port Village | | | 1981 | | | | 30.60 | % | | | 30.60 | % | | Port Huron, MI | | | 251 | | | | 77 | |
Nu Ken Tower (Citizen’s Plaza) | | | 1981 | | | | 8.84 | % | | | 50.00 | % | | New Kensington, PA | | | 101 | | | | 51 | |
Oceanpointe Towers | | | 1980 | | | | 7.98 | % | | | 100.00 | % | | Long Branch, NJ | | | 151 | | | | 151 | |
Panorama Towers | | | 1978 | | | | 99.00 | % | | | 99.00 | % | | Panorama City, CA | | | 154 | | | | 152 | |
Park Place Towers | | | 1975 | | | | 21.79 | % | | | 100.00 | % | | Mt. Clemens, MI | | | 187 | | | | 187 | |
Pine Grove Manor | | | 1973 | | | | 9.76 | % | | | 100.00 | % | | Muskegon Township, MI | | | 172 | | | | 172 | |
Plymouth Square | | | 2003 | | | | 100.00 | % | | | 100.00 | % | | Detroit, MI | | | 280 | | | | 280 | |
Potomac Heights Village | | | 1981 | | | | 7.98 | % | | | 100.00 | % | | Keyser, WV | | | 141 | | | | 141 | |
Riverside Towers | | | 1977 | | | | 9.63 | % | | | 100.00 | % | | Coshocton, OH | | | 100 | | | | 100 | |
Shippan Avenue | | | 1980 | | | | 100.00 | % | | | 100.00 | % | | Stamford, CT | | | 148 | | | | 148 | |
St. Mary’s Villa | | | 2002 | | | | 40.07 | % | | | 40.07 | % | | Newark, NJ | | | 360 | | | | 144 | |
The Springs | | | 1981 | | | | 7.98 | % | | | 100.00 | % | | La Mesa, CA | | | 129 | | | | 129 | |
Tower 43 | | | 2002 | | | | 100.00 | % | | | 100.00 | % | | Kent, OH | | | 101 | | | | 101 | |
Towne Centre Place | | | 1975 | | | | 8.31 | % | | | 100.00 | % | | Ypsilanti, MI | | | 170 | | | | 170 | |
Village Center | | | 1983 | | | | 100.00 | % | | | 100.00 | % | | Detroit, MI | | | 254 | | | | 254 | |
Village Square | | | 1978 | | | | 100.00 | % | | | 100.00 | % | | Williamsville, NY | | | 100 | | | | 100 | |
Ziegler Place | | | 1978 | | | | 100.00 | % | | | 100.00 | % | | Livonia, MI | | | 141 | | | | 141 | |
| | |
Unconsolidated Senior Housing Apartments Subtotal | | | 5,936 | | | | 4,785 | |
| | |
Unconsolidated Apartments Total | | | 21,753 | | | | 12,464 | |
| | |
Combined Apartments Total | | | 33,484 | | | | 23,675 | |
| | |
Federally Subsidized Housing (Total of 5 Buildings) | | | 741 | | | | | |
| | |
Total Apartment Units at January 31, 2012 | | | 34,225 | | | | | |
| | |
Total Apartment Units at January 31, 2011 | | | 34,355 | | | | | |
74
Forest City Enterprises, Inc. and Subsidiaries
Supplemental Financial Information
Forest City Enterprises, Inc. Real Estate Portfolio as of January 31, 2012
RESIDENTIAL GROUP - MILITARY HOUSING
| | | | | | | | | | | | | | | | | | |
| Name | | Date of
Opening/
Acquisition/ Expansion | | | Legal
Ownership (1) | | | Pro-Rata
Ownership (2) | | | Location | | Leasable
Units(3) | |
Unconsolidated Military Housing^ | | | | | | | | | | | | | | | | | | |
Air Force Academy | | | 2007-2011 | | | | 50.00% | | | | 50.00% | | | Colorado Springs, CO | | | 427 | |
* Hawaii Phase IV | | | 2007-2014 | | | | 1.00% | | | | ^^ | | | Kaneohe, HI | | | 1,141 | |
Marines, Hawaii Increment II | | | 2007-2011 | | | | 1.00% | | | | ^^ | | | Honolulu, HI | | | 1,175 | |
Midwest Millington | | | 2008-2011 | | | | 1.00% | | | | ^^ | | | Memphis, TN | | | 318 | |
Navy, Hawaii Increment III | | | 2007-2011 | | | | 1.00% | | | | ^^ | | | Honolulu, HI | | | 2,520 | |
Navy Midwest | | | 2006-2011 | | | | 1.00% | | | | ^^ | | | Chicago, IL | | | 1,401 | |
Ohana Military Communities, Hawaii Increment I | | | 2005-2008 | | | | 1.00% | | | | ^^ | | | Honolulu, HI | | | 1,952 | |
Pacific Northwest Communities | | | 2007-2011 | | | | 20.00% | | | | ^^ | | | Seattle, WA | | | 2,985 | |
Southern Group: | | | | | | | | | | | | | | | | | | |
* Arnold Air Force Base | | | 2011-2013 | | | | 100.00% | | | | ^^^ | | | Tullahoma, TN | | | 22 | |
* Joint Base Charleston | | | 2011-2013 | | | | 100.00% | | | | ^^^ | | | Charleston, SC | | | 345 | |
* Keesler Air Force Base | | | 2011-2012 | | | | 100.00% | | | | ^^^ | | | Biloxi, MS | | | 1,188 | |
* Shaw Air Force Base | | | 2011-2015 | | | | 100.00% | | | | ^^^ | | | Sumter, SC | | | 630 | |
Unconsolidated Military Housing Total | | | 14,104 | |
| |
Total Military Housing Units at January 31, 2012 | | | 14,104 | |
Total Military Housing Units at January 31, 2011 | | | 11,919 | |
| (1) | Legal ownership percentage represents our actual equity ownership percentage and reflects the percentage of income or loss allocation we expect to receive after settlement of any preferred returns which we or our partners may be entitled to in accordance with the applicable agreements. |
| (2) | Pro-Rata ownership percentage represents the percentage of income or loss allocation we expect to receive prior to the settlement of any preferred returns which we or our partners may be entitled to in accordance with the applicable agreements. After settlement of the preferred returns, it is expected that our capital balance would be proportionate to our legal ownership. |
| (3) | Leaseable units represent 100% of the leasable units in the apartment community. Leasable units at Pro-Rata % represents the total leasable units multiplied by the Pro-Rata ownership percent. |
| * | Property under construction as of January 31, 2012. |
| ++ | Property sold subsequent to January 31, 2012. |
| ^ | Property to open in phases. |
| ^^ | Our share of residual cash flow ranges from 0-20% during the life cycle of the project. |
| ^^^ | We do not share in any cash flow from operations. However, we are entitled to the return of our equity at the end of the 50-year lease term. |
75