UNITED STATES
SECURITIES AND EXCHANGE COMMISSION
Washington, D.C. 20549
FORM N-CSR
CERTIFIED SHAREHOLDER REPORT OF REGISTERED MANAGEMENT
INVESTMENT COMPANIES
Investment Company Act file number | 811- 1018 |
| |
| Dreyfus Funds, Inc. | |
| (Exact name of Registrant as specified in charter) | |
| | |
| c/o The Dreyfus Corporation 200 Park Avenue New York, New York 10166 | |
| (Address of principal executive offices) (Zip code) | |
| | |
| John Pak, Esq. 200 Park Avenue New York, New York 10166 | |
| (Name and address of agent for service) | |
|
Registrant's telephone number, including area code: | (212) 922-6000 |
| |
Date of fiscal year end: | 12/31 | |
Date of reporting period: | 12/31/13 | |
| | | | | | | |
FORM N-CSR
Item 1. Reports to Stockholders.
|
| Dreyfus |
| Mid-Cap Growth Fund |
ANNUAL REPORT December 31, 2013

Save time. Save paper. View your next shareholder report online as soon as it’s available. Log into www.dreyfus.com and sign up for Dreyfus eCommunications. It’s simple and only takes a few minutes.
The views expressed in this report reflect those of the portfolio manager only through the end of the period covered and do not necessarily represent the views of Dreyfus or any other person in the Dreyfus organization. Any such views are subject to change at any time based upon market or other conditions and Dreyfus disclaims any responsibility to update such views.These views may not be relied on as investment advice and, because investment decisions for a Dreyfus fund are based on numerous factors, may not be relied on as an indication of trading intent on behalf of any Dreyfus fund.
| | Contents |
| | THE FUND |
| 2 | A Letter from the President |
| 3 | Discussion of Fund Performance |
| 6 | Fund Performance |
| 8 | Understanding Your Fund’s Expenses |
| 8 | Comparing Your Fund’s Expenses With Those of Other Funds |
| 9 | Statement of Investments |
| 13 | Statement of Assets and Liabilities |
| 14 | Statement of Operations |
| 15 | Statement of Changes in Net Assets |
| 17 | Financial Highlights |
| 21 | Notes to Financial Statements |
| 32 | Report of Independent Registered Public Accounting Firm |
| 33 | Board Members Information |
| 35 | Officers of the Fund |
| | FOR MORE INFORMATION |
| | Back Cover |
Dreyfus
Mid-Cap Growth Fund
The Fund
A LETTER FROM THE PRESIDENT
Dear Shareholder:
We are pleased to present this annual report for Dreyfus Mid-Cap Growth Fund, covering the 12-month period from January 1, 2013, through December 31, 2013. For information about how the fund performed during the reporting period, as well as general market perspectives, we provide a Discussion of Fund Performance on the pages that follow.
The year 2013 proved to be outstanding for U.S. equities. Large-cap stocks delivered their strongest calendar-year performance in well over a decade, and small- and midcap stocks fared even better in an environment of low short-term interest rates, rising corporate earnings, sustained economic growth, and low inflation. In our view, 2013 provided ample evidence of the value of patience and discipline in equity investing, as those who favored a long-term perspective over a focus on news headlines and short-term volatility reaped the rewards provided by rising markets.
Will stocks continue to rally in 2014? We believe that they can. We expect the domestic economy to continue to strengthen over the next year, particularly if U.S. fiscal policy is less restrictive and short-term interest rates remain near historical lows. Stronger growth could convince businesses and consumers to spend more freely, unleashing pent up demand as economic uncertainty wanes. However, we caution that gains in 2014 are unlikely to match those of the past year, and a highly selective approach to security selection could be key to greater relative investment success in the months ahead. As always, we urge you to speak with your financial adviser to identify the investment strategies that are right for you.
Thank you for your continued confidence and support.

J. Charles Cardona
President
The Dreyfus Corporation
January 15, 2014
2
DISCUSSION OF FUND PERFORMANCE
For the period of January 1, 2013, through December 31, 2013, as provided by Todd Wakefield, CFA, and Robert C. Zeuthen, CFA, Primary Portfolio Managers
Fund and Market Performance Overview
For the 12-month period ended December 31, 2013, Dreyfus Mid-Cap Growth Fund’s Class A shares produced a total return of 36.52%, Class C shares returned 35.46%, Class F shares returned 36.79%, and Class I shares returned 36.69%.1 In comparison, the fund’s benchmark, the Russell Midcap® Growth Index (the “Index”), produced a total return of 35.74% for the same period.2
U.S. stocks responded positively during the reporting period to a recovering U.S. economy.The fund’s Class A, Class F and Class I shares outperformed the benchmark, while the fund’s Class C shares performed in line with the benchmark, mainly due to successful security selections in the health care, financials, and materials sectors.
The Fund’s Investment Approach
The fund seeks capital appreciation.The fund will normally invest at least 80% of its net assets in equity securities of companies within the market capitalization range of companies comprising the Russell Midcap® Growth Index. The fund also may invest in larger or smaller companies if they represent better prospects for capital appreciation. We look for companies whose fundamental strengths suggest the potential for superior earnings growth over time.We go beyond Wall Street analysis and perform intensive qualitative and quantitative in-house research to determine whether companies meet our investment criteria.
Economic Growth Fueled Market Gains
The year 2013 began during a sustained stock market rally driven by improved U.S. employment and housing markets. Investors were particularly encouraged by an open-ended round of quantitative easing from the Federal Reserve Board (the “Fed”). Improving conditions in overseas markets also contributed to better investor sentiment.
Economic data continued to improve, and stocks rallied, through the spring of 2013. However, in late May remarks by Fed Chairman Ben Bernanke were widely interpreted as a signal that U.S. monetary policymakers would soon back away from
The Fund 3
DISCUSSION OF FUND PERFORMANCE (continued)
quantitative easing, sparking market declines in June. Stocks generally stabilized over the summer and advanced strongly in September when the Fed refrained from tapering its bond purchasing program. Even a 16-day government shutdown in October failed to derail the rally.
Stocks continued to climb over the final two months of the year amid new releases of encouraging economic data. A modest reduction in the Fed’s bond buying program in mid-December had little impact on stock prices, enabling several broad measures of market performance to end the year near record highs. In this constructive environment, midcap stocks generally produced higher returns than large-cap stocks, and growth-oriented stocks outpaced value-oriented stocks.
Health Care Stocks Buoyed Relative Performance
Our security selection strategy proved particularly effective in the health care sector, where a number of midsize pharmaceutical developers fared well: Alkermes reported higher earnings stemming from strong sales of key products; Onyx Pharmaceuticals was acquired by a larger rival; and Salix Pharmaceuticals solidified its leadership position in the treatment of gastrointestinal disorders.
In the financials sector, commercial banks such as First Republic Bank benefited from strong loan growth, and Prosperity Bancshares gained value after an accretive acquisition solidified its presence in South Texas. Investment manager Affiliated Managers Group advanced along with the rallying stock market.The fund also outperformed the benchmark in the materials sector and avoided most metals and mining companies hurt by sluggish demand from the emerging markets. Instead, we favored companies, such as Reliance Steel & Aluminum, that we regarded as well positioned for rising domestic demand for the steel used in nonresidential construction. In other areas, wellness products retailer GNC Holdings reported strong quarterly results and benefited from the launch of a new customer loyalty discount program, and health care distributor AmerisourceBergen reported solid earnings results driven by strong sales of generic drugs and its distribution relationship with a major retail pharmacy chain.
Disappointments during 2013 included the energy sector, where oil services provider Cameron International reported disappointing quarterly results and guidance. Investors also responded negatively when offshore drilling specialist McDermott International announced a quarterly loss and exploration-and-production company QEP Resources
4
reported weaker-than-expected oil production volumes.The fund’s investments in the information technology sector lagged those of the Index, as network infrastructure developer Juniper Networks was hurt by concerns about its telecommunications customers’ spending trends, application delivery provider F5 Networks was impacted by concerns surrounding its virtualization technology and positioning within the overall industry, and cloud computing specialist Rackspace Hosting faced intensifying competitive pressures stemming from a rival’s acquisition by a global consulting services provider.
Finding Opportunities in Cyclical and Secular Trends
Despite the magnitude of 2013’s stock market gains, we believe that strengthening consumer and business confidence could serve as a catalyst for higher corporate earnings and rising stock prices as the economic recovery continues. In addition, our research analysts have identified a number of secular trends with the potential to fuel gains in well-positioned midcap companies, including opportunities related to improving residential and commercial construction activity, health care reform, the recent boom in domestic energy production, and the use of innovative technologies by a growing U.S. manufacturing base.
January 15, 2014
Please note, the position in any security highlighted with italicized typeface was sold during the reporting period. Equity funds are subject generally to market, market sector, market liquidity, issuer and investment style risks, among other factors, to varying degrees, all of which are more fully described in the fund’s prospectus.
Midsize companies carry additional risks because their earnings and revenues tend to be less predictable and their share prices more volatile than those of larger, more established companies.The shares of midsize companies tend to trade less frequently than those of larger, more established companies.
|
| 1 Total return includes reinvestment of dividends and any capital gains paid, and does not take into consideration the |
| maximum initial sales charge in the case of Class A shares, or the applicable contingent deferred sales charge imposed |
| on redemptions in the case of Class C shares. Had these charges been reflected, returns would have been lower. Past |
| performance is no guarantee of future results. Share price and investment return fluctuate such that upon redemption |
| fund shares may be worth more or less than their original cost. |
| 2 SOURCE: LIPPER INC. — The Russell Midcap® Growth Index measures the performance of the 800 smallest |
| companies in the Russell 1000® Index with higher price-to-book ratios and higher forecasted growth values.The total |
| return figure cited for this index assumes change in security prices and reinvestment of dividends, but does not reflect |
| the costs of managing a mutual fund.The Russell 1000® Index measures the performance of the largest 1,000 |
| publicly traded U.S. companies. Investors cannot invest directly in any index. |
The Fund 5
FUND PERFORMANCE
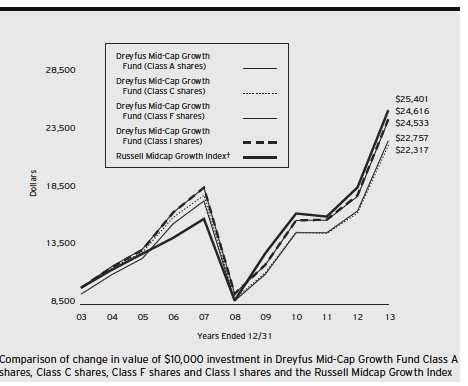
† Source: Lipper Inc.
Past performance is not predictive of future performance.
The above graph compares a $10,000 investment made in each of the Class A, Class C, Class F and Class I shares of Dreyfus Mid-Cap Growth Fund on 12/31/03 to a $10,000 investment made in the Russell Midcap Growth Index (the “Index”) on that date. All dividends and capital gain distributions are reinvested.
The fund’s performance shown in the line graph above takes into account the maximum initial sales charge on Class A shares and all other applicable fees and expenses on all classes (after any expense reimbursements).The Index measures the performance of those companies among the 800 smallest companies in the Russell 1000 Index with higher price-to-book ratios and higher forecasted growth values.The Russell 1000 Index measures the performance of the largest 1,000 publicly traded U.S. companies. Unlike a mutual fund, the Index is not subject to charges, fees and other expenses. Investors cannot invest directly in any index. Further information relating to fund performance, including expense reimbursements, if applicable, is contained in the Financial Highlights section of the prospectus and elsewhere in this report.
6
| | | | | | |
| Average Annual Total Returns as of 12/31/13 | | | | | | |
| |
| | 1 | Year | 5 Years | | 10 Years | |
| Class A shares | | | | | | |
| with maximum sales charge (5.75%) | 28.75 | % | 19.39 | % | 8.57 | % |
| without sales charge | 36.52 | % | 20.79 | % | 9.20 | % |
| Class C shares | | | | | | |
| with applicable redemption charge † | 34.46 | % | 19.85 | % | 8.36 | % |
| without redemption | 35.46 | % | 19.85 | % | 8.36 | % |
| Class F shares | 36.79 | % | 20.96 | % | 9.39 | % |
| Class I shares | 36.69 | % | 21.05 | % | 9.43 | % |
| Russell Midcap Growth Index | 35.74 | % | 23.37 | % | 9.77 | % |
Past performance is not predictive of future performance.The fund’s performance shown in the graph and table does not reflect the deduction of taxes that a shareholder would pay on fund distributions or the redemption of fund shares.
|
| † The maximum contingent deferred sales charge for Class C shares is 1% for shares redeemed within one year of the |
| date of purchase. |
The Fund 7
UNDERSTANDING YOUR FUND’S EXPENSES (Unaudited)
As a mutual fund investor, you pay ongoing expenses, such as management fees and other expenses. Using the information below, you can estimate how these expenses affect your investment and compare them with the expenses of other funds.You also may pay one-time transaction expenses, including sales charges (loads) and redemption fees, which are not shown in this section and would have resulted in higher total expenses. For more information, see your fund’s prospectus or talk to your financial adviser.
Review your fund’s expenses
The table below shows the expenses you would have paid on a $1,000 investment in Dreyfus Mid-Cap Growth Fund from July 1, 2013 to December 31, 2013. It also shows how much a $1,000 investment would be worth at the close of the period, assuming actual returns and expenses.
Expenses and Value of a $1,000 Investment
assuming actual returns for the six months ended December 31, 2013
| | | | | | | | |
| | | Class A | | Class C | | Class F | | Class I |
| Expenses paid per $1,000† | $ | 7.55 | $ | 11.95 | $ | 6.61 | $ | 6.49 |
| Ending value (after expenses) | $ | 1,220.10 | $ | 1,215.50 | $ | 1,221.40 | $ | 1,220.30 |
COMPARING YOUR FUND’S EXPENSES
WITH THOSE OF OTHER FUNDS (Unaudited)
Using the SEC’s method to compare expenses
The Securities and Exchange Commission (SEC) has established guidelines to help investors assess fund expenses. Per these guidelines, the table below shows your fund’s expenses based on a $1,000 investment, assuming a hypothetical 5% annualized return. You can use this information to compare the ongoing expenses (but not transaction expenses or total cost) of investing in the fund with those of other funds.All mutual fund shareholder reports will provide this information to help you make this comparison. Please note that you cannot use this information to estimate your actual ending account balance and expenses paid during the period.
Expenses and Value of a $1,000 Investment
assuming a hypothetical 5% annualized return for the six months ended December 31, 2013
| | | | | | | | |
| | | Class A | | Class C | | Class F | | Class I |
| Expenses paid per $1,000† | $ | 6.87 | $ | 10.87 | $ | 6.01 | $ | 5.90 |
| Ending value (after expenses) | $ | 1,018.40 | $ | 1,014.42 | $ | 1,019.26 | $ | 1,019.36 |
|
| † Expenses are equal to the fund’s annualized expense ratio of 1.35% for Class A, 2.14% for Class C, 1.18% for |
| Class F and 1.16% for Class I, multiplied by the average account value over the period, multiplied by 184/365 (to |
| reflect the one-half year period). |
8
STATEMENT OF INVESTMENTS
December 31, 2013
| | | | |
| Common Stocks—98.5% | Shares | | | Value ($) |
| Automobiles & Components—1.7% | | | | |
| BorgWarner | 45,820 | | | 2,561,796 |
| Banks—3.7% | | | | |
| First Republic Bank | 41,420 | | | 2,168,337 |
| Prosperity Bancshares | 52,650 | | | 3,337,483 |
| | | | | 5,505,820 |
| Capital Goods—15.3% | | | | |
| AMETEK | 61,124 | | | 3,219,401 |
| Donaldson | 72,360 | | | 3,144,766 |
| Fortune Brands Home & Security | 51,330 | | | 2,345,781 |
| Hexcel | 51,980 | a | | 2,322,986 |
| ITT | 72,290 | | | 3,138,832 |
| Jacobs Engineering Group | 37,920 | a | | 2,388,581 |
| Parker Hannifin | 25,020 | | | 3,218,573 |
| Sensata Technologies Holding | 78,460 | a | | 3,041,894 |
| | | | | 22,820,814 |
| Commercial & Professional Services—3.3% | | | | |
| IHS, Cl. A | 22,580 | a | | 2,702,826 |
| Towers Watson & Co., Cl. A | 17,870 | | | 2,280,391 |
| | | | | 4,983,217 |
| Consumer Durables & Apparel—5.7% | | | | |
| Jarden | 41,750 | a | | 2,561,363 |
| Michael Kors Holdings | 26,800 | a | | 2,175,892 |
| PVH | 27,540 | | | 3,745,991 |
| | | | | 8,483,246 |
| Consumer Services—1.7% | | | | |
| Starwood Hotels & Resorts Worldwide | 32,670 | b | | 2,595,631 |
| Diversified Financials—3.2% | | | | |
| Affiliated Managers Group | 10,400 | a | | 2,255,552 |
| Waddell & Reed Financial, Cl. A | 39,150 | | | 2,549,448 |
| | | | | 4,805,000 |
| Energy—6.5% | | | | |
| Antero Resources | 44,509 | | | 2,823,651 |
| Concho Resources | 19,450 | a | | 2,100,600 |
| Dresser-Rand Group | 39,960 | a | | 2,382,815 |
| Helmerich & Payne | 28,430 | | | 2,390,394 |
| | | | | 9,697,460 |
The Fund 9
STATEMENT OF INVESTMENTS (continued)
| | | | |
| Common Stocks (continued) | Shares | | | Value ($) |
| Exchange-Traded Funds—1.2% | | | | |
| iShares Russell Mid-Cap Growth ETF | 21,520 | c | | 1,815,427 |
| Food & Staples Retailing—2.1% | | | | |
| Whole Foods Market | 54,320 | | | 3,141,326 |
| Food, Beverage & Tobacco—3.8% | | | | |
| Molson Coors Brewing, Cl. B | 36,220 | | | 2,033,753 |
| WhiteWave Foods, Cl. A | 159,110 | a | | 3,649,983 |
| | | | | 5,683,736 |
| Health Care Equipment & Services—9.0% | | | | |
| AmerisourceBergen | 42,040 | | | 2,955,832 |
| Catamaran | 62,218 | a | | 2,954,111 |
| Cooper | 23,790 | | | 2,946,154 |
| MEDNAX | 41,600 | a | | 2,220,608 |
| Universal Health Services, Cl. B | 28,270 | | | 2,297,220 |
| | | | | 13,373,925 |
| Materials—5.0% | | | | |
| Airgas | 26,150 | | | 2,924,878 |
| Owens Corning | 56,740 | a | | 2,310,453 |
| Reliance Steel & Aluminum | 28,590 | | | 2,168,266 |
| | | | | 7,403,597 |
| Media—3.2% | | | | |
| IMAX | 76,510 | a,c | | 2,255,515 |
| Interpublic Group of Cos. | 145,070 | | | 2,567,739 |
| | | | | 4,823,254 |
| Pharmaceuticals, Biotech & Life Sciences—8.2% | | | | |
| Alexion Pharmaceuticals | 16,240 | a | | 2,160,894 |
| Jazz Pharmaceuticals | 17,670 | a | | 2,236,315 |
| Medivation | 35,420 | a | | 2,260,504 |
| Perrigo Company | 13,730 | | | 2,107,006 |
| Salix Pharmaceuticals | 37,850 | a | | 3,404,229 |
| | | | | 12,168,948 |
| Real Estate—2.0% | | | | |
| CBRE Group, Cl. A | 115,450 | a | | 3,036,335 |
10
| | | |
| Common Stocks (continued) | Shares | | Value ($) |
| Retailing—5.6% | | | |
| GNC Holdings, Cl. A | 37,200 | | 2,174,340 |
| LKQ | 98,280 | a | 3,233,412 |
| Tiffany & Co. | 24,810 | | 2,301,872 |
| Williams-Sonoma | 11,210 | | 653,319 |
| | | | 8,362,943 |
| Semiconductors & Semiconductor | | | |
| Equipment—3.4% | | | |
| Microchip Technology | 67,780 | c | 3,033,155 |
| Xilinx | 43,050 | | 1,976,856 |
| | | | 5,010,011 |
| Software & Services—9.3% | | | |
| Cognizant Technology Solutions, Cl. A | 32,330 | a | 3,264,683 |
| Informatica | 73,980 | a | 3,070,170 |
| Synopsys | 74,400 | a | 3,018,408 |
| Vantiv, Cl. A | 65,790 | a | 2,145,412 |
| VeriSign | 39,800 | a | 2,379,244 |
| | | | 13,877,917 |
| Technology Hardware & | | | |
| Equipment—2.6% | | | |
| IPG Photonics | 28,310 | a,c | 2,197,139 |
| JDS Uniphase | 135,800 | a | 1,762,684 |
| | | | 3,959,823 |
| Transportation—2.0% | | | |
| J.B. Hunt Transport Services | 38,210 | | 2,953,633 |
| Total Common Stocks | | | |
| (cost $120,347,979) | | | 147,063,859 |
| |
| Other Investment—1.7% | | | |
| Registered Investment Company; | | | |
| Dreyfus Institutional Preferred | | | |
| Plus Money Market Fund | | | |
| (cost $2,521,068) | 2,521,068 | d | 2,521,068 |
The Fund 11
STATEMENT OF INVESTMENTS (continued)
| | | | |
| Investment of Cash Collateral | | | | |
| for Securities Loaned—4.6% | Shares | | Value ($) | |
| Registered Investment Company; | | | | |
| Dreyfus Institutional Cash Advantage Fund | | | | |
| (cost $6,829,692) | 6,829,692 | d | 6,829,692 | |
| Total Investments (cost $129,698,739) | 104.8 | % | 156,414,619 | |
| Liabilities, Less Cash and Receivables | (4.8 | %) | (7,206,445 | ) |
| Net Assets | 100.0 | % | 149,208,174 | |
ETF—Exchange Traded Fund
|
| a Non-income producing security. |
| b Investment in real estate investment trust. |
| c Security, or portion thereof, on loan.At December 31, 2013, the value of the fund’s securities on loan was |
| $6,072,073 and the value of the collateral held by the fund was $6,864,620, consisting of cash collateral of |
| $6,829,692 and U.S. Government & Agency securities valued at $34,928. |
| d Investment in affiliated money market mutual fund. |
| | | |
| Portfolio Summary (Unaudited)† | | |
| |
| | Value (%) | | Value (%) |
| Capital Goods | 15.3 | Semiconductors & | |
| Software & Services | 9.3 | Semiconductor Equipment | 3.4 |
| Health Care | | Commercial & Professional Services | 3.3 |
| Equipment & Services | 9.0 | Diversified Financials | 3.2 |
| Pharmaceuticals, | | Media | 3.2 |
| Biotech & Life Sciences | 8.2 | Technology Hardware & Equipment | 2.6 |
| Energy | 6.5 | Food & Staples Retailing | 2.1 |
| Money Market Investments | 6.3 | Transportation | 2.0 |
| Consumer Durables & Apparel | 5.7 | Real Estate | 2.0 |
| Retailing | 5.6 | Automobiles & Components | 1.7 |
| Materials | 5.0 | Consumer Services | 1.7 |
| Food, Beverage & Tobacco | 3.8 | Exchange-Traded Funds | 1.2 |
| Banks | 3.7 | | 104.8 |
| |
| † Based on net assets. | | | |
| See notes to financial statements. | | | |
12
STATEMENT OF ASSETS AND LIABILITIES
December 31, 2013
| | | |
| | Cost | Value | |
| Assets ($): | | | |
| Investments in securities—See Statement of Investments (including | | | |
| securities on loan, valued at $6,072,073)—Note 1(b): | | | |
| Unaffiliated issuers | 120,347,979 | 147,063,859 | |
| Affiliated issuers | 9,350,760 | 9,350,760 | |
| Cash | | 8,282 | |
| Receivable for investment securities sold | | 821,506 | |
| Receivable for shares of Common Stock subscribed | | 74,647 | |
| Dividends and securities lending income receivable | | 35,827 | |
| Prepaid expenses | | 35,099 | |
| | | 157,389,980 | |
| Liabilities ($): | | | |
| Due to The Dreyfus Corporation and affiliates—Note 3(c) | | 162,139 | |
| Liability for securities on loan—Note 1(b) | | 6,829,692 | |
| Payable for investment securities purchased | | 800,275 | |
| Payable for shares of Common Stock redeemed | | 305,745 | |
| Accrued expenses | | 83,955 | |
| | | 8,181,806 | |
| Net Assets ($) | | 149,208,174 | |
| Composition of Net Assets ($): | | | |
| Paid-in capital | | 134,774,876 | |
| Accumulated net realized gain (loss) on investments | | (12,282,582 | ) |
| Accumulated net unrealized appreciation | | | |
| (depreciation) on investments | | 26,715,880 | |
| Net Assets ($) | | 149,208,174 | |
| | | | |
| Net Asset Value Per Share | | | | |
| | Class A | Class C | Class F | Class I |
| Net Assets ($) | 26,964,650 | 12,878,344 | 100,630,906 | 8,734,274 |
| Shares Outstanding | 3,310,465 | 1,783,727 | 11,922,369 | 1,036,901 |
| Net Asset Value Per Share ($) | 8.15 | 7.22 | 8.44 | 8.42 |
| |
| See notes to financial statements. | | | | |
The Fund 13
STATEMENT OF OPERATIONS
Year Ended December 31, 2013
| | |
| Investment Income ($): | | |
| Income: | | |
| Cash dividends: | | |
| Unaffiliated issuers | 879,336 | |
| Affiliated issuers | 2,920 | |
| Income from securities lending—Note 1(b) | 24,260 | |
| Total Income | 906,516 | |
| Expenses: | | |
| Investment advisory fee—Note 3(a) | 1,067,316 | |
| Shareholder servicing costs—Note 3(c) | 244,544 | |
| Distribution fees—Note 3(b) | 155,303 | |
| Accounting and administration fees—Note 3(c) | 80,605 | |
| Registration fees | 55,852 | |
| Professional fees | 46,428 | |
| Prospectus and shareholders’ reports | 22,482 | |
| Custodian fees—Note 3(c) | 13,088 | |
| Directors’ fees and expenses—Note 3(d) | 6,676 | |
| Interest expense—Note 2 | 970 | |
| Miscellaneous | 20,240 | |
| Total Expenses | 1,713,504 | |
| Less—reduction in fees due to earnings credits—Note 3(c) | (399 | ) |
| Net Expenses | 1,713,105 | |
| Investment (Loss)—Net | (806,589 | ) |
| Realized and Unrealized Gain (Loss) on Investments—Note 4 ($): | | |
| Net realized gain (loss) on investments | 25,327,637 | |
| Net unrealized appreciation (depreciation) on investments | 16,639,458 | |
| Net Realized and Unrealized Gain (Loss) on Investments | 41,967,095 | |
| Net Increase in Net Assets Resulting from Operations | 41,160,506 | |
| |
| See notes to financial statements. | | |
14
STATEMENT OF CHANGES IN NET ASSETS
| | | | |
| | Year Ended December 31, | |
| | 2013 | | 2012 | a |
| Operations ($): | | | | |
| Investment (loss)–net | (806,589 | ) | (398,733 | ) |
| Net realized gain (loss) on investments | 25,327,637 | | 16,532,945 | |
| Net unrealized appreciation | | | | |
| (depreciation) on investments | 16,639,458 | | (375,081 | ) |
| Net Increase (Decrease) in Net Assets | | | | |
| Resulting from Operations | 41,160,506 | | 15,759,131 | |
| Capital Stock Transactions ($): | | | | |
| Net proceeds from shares sold: | | | | |
| Class A | 17,809,743 | | 6,543,822 | |
| Class B | — | | 389 | |
| Class C | 2,071,481 | | 920,058 | |
| Class F | 849,404 | | 956,428 | |
| Class I | 3,860,050 | | 6,591,823 | |
| Cost of shares redeemed: | | | | |
| Class A | (19,467,368 | ) | (15,711,699 | ) |
| Class B | — | | (226,579 | ) |
| Class C | (2,324,333 | ) | (2,837,887 | ) |
| Class F | (9,723,549 | ) | (12,057,719 | ) |
| Class I | (5,790,784 | ) | (3,584,634 | ) |
| Increase (Decrease) in Net Assets | | | | |
| from Capital Stock Transactions | (12,715,356 | ) | (19,405,998 | ) |
| Total Increase (Decrease) in Net Assets | 28,445,150 | | (3,646,867 | ) |
| Net Assets ($): | | | | |
| Beginning of Period | 120,763,024 | | 124,409,891 | |
| End of Period | 149,208,174 | | 120,763,024 | |
| Undistributed investment income–net | — | | 11,268 | |
The Fund 15
STATEMENT OF CHANGES IN NET ASSETS (continued)
| | | | |
| | Year Ended December 31, | |
| | 2013 | | 2012 | a |
| Capital Share Transactions: | | | | |
| Class Ab,c | | | | |
| Shares sold | 2,395,179 | | 1,123,342 | |
| Shares redeemed | (2,689,685 | ) | (2,687,550 | ) |
| Net Increase (Decrease) in Shares Outstanding | (294,506 | ) | (1,564,208 | ) |
| Class Bc | | | | |
| Shares sold | — | | 73 | |
| Shares redeemed | — | | (42,249 | ) |
| Net Increase (Decrease) in Shares Outstanding | — | | (42,176 | ) |
| Class Cb | | | | |
| Shares sold | 330,911 | | 175,031 | |
| Shares redeemed | (378,723 | ) | (546,064 | ) |
| Net Increase (Decrease) in Shares Outstanding | (47,812 | ) | (371,033 | ) |
| Class F | | | | |
| Shares sold | 119,607 | | 158,808 | |
| Shares redeemed | (1,366,962 | ) | (1,994,780 | ) |
| Net Increase (Decrease) in Shares Outstanding | (1,247,355 | ) | (1,835,972 | ) |
| Class I | | | | |
| Shares sold | 540,916 | | 1,094,318 | |
| Shares redeemed | (835,420 | ) | (594,243 | ) |
| Net Increase (Decrease) in Shares Outstanding | (294,504 | ) | 500,075 | |
|
| a Effective as of the close of business on March 13, 2012, the fund no longer offers Class B shares. |
| b During the period ended December 31, 2013, 17,108 Class C shares representing $104,530 were exchanged for |
| 15,238 Class A shares. |
| c During the period ended December 31, 2012, 11,580 Class B shares representing $61,979 were automatically |
| converted to 10,519 Class A shares. |
See notes to financial statements.
16
FINANCIAL HIGHLIGHTS
The following tables describe the performance for each share class for the fiscal periods indicated.All information (except portfolio turnover rate) reflects financial results for a single fund share.Total return shows how much your investment in the fund would have increased (or decreased) during each period, assuming you had reinvested all dividends and distributions.These figures have been derived from the fund’s financial statements.
| | | | | | | | | | |
| | | | Year Ended December 31, | | | |
| Class A | 2013 | | 2012 | | 2011 | | 2010 | | 2009 | † |
| Per Share Data ($): | | | | | | | | | | |
| Net asset value, beginning of period | 5.97 | | 5.29 | | 5.29 | | 4.00 | | 3.17 | |
| Investment Operations: | | | | | | | | | | |
| Investment (loss)—neta | (.05 | ) | (.02 | ) | (.04 | ) | (.02 | ) | (.03 | ) |
| Net realized and unrealized | | | | | | | | | | |
| gain (loss) on investments | 2.23 | | .70 | | .04 | | 1.31 | | .86 | |
| Total from Investment Operations | 2.18 | | .68 | | — | | 1.29 | | .83 | |
| Net asset value, end of period | 8.15 | | 5.97 | | 5.29 | | 5.29 | | 4.00 | |
| Total Return (%)b | 36.52 | | 12.85 | | .00 | c | 32.25 | | 26.18 | |
| Ratios/Supplemental Data (%): | | | | | | | | | | |
| Ratio of total expenses | | | | | | | | | | |
| to average net assets | 1.36 | | 1.53 | | 1.51 | | 1.56 | | 1.77 | |
| Ratio of net expenses | | | | | | | | | | |
| to average net assets | 1.36 | | 1.50 | | 1.37 | | 1.36 | | 1.75 | |
| Ratio of net investment (loss) | | | | | | | | | | |
| to average net assets | (.68 | ) | (.42 | ) | (.74 | ) | (.55 | ) | (.86 | ) |
| Portfolio Turnover Rate | 166.09 | | 164.34 | | 232.19 | | 204.97 | | 59.66 | |
| Net Assets, end of period ($ x 1,000) | 26,965 | | 21,511 | | 27,324 | | 38,099 | | 23,448 | |
|
| † Effective September 1, 2009,The Dreyfus Corporation replaced Founders Asset Management LLC as the fund’s |
| investment adviser. |
| a Based on average shares outstanding at each month end. |
| b Exclusive of sales charge. |
| c Amount represents less than .01%. |
See notes to financial statements.
The Fund 17
FINANCIAL HIGHLIGHTS (continued)
| | | | | | | | | | |
| | | | Year Ended December 31, | | | |
| Class C | 2013 | | 2012 | | 2011 | | 2010 | | 2009 | † |
| Per Share Data ($): | | | | | | | | | | |
| Net asset value, beginning of period | 5.33 | | 4.76 | | 4.79 | | 3.66 | | 2.92 | |
| Investment Operations: | | | | | | | | | | |
| Investment (loss)—neta | (.09 | ) | (.06 | ) | (.07 | ) | (.05 | ) | (.05 | ) |
| Net realized and unrealized | | | | | | | | | | |
| gain (loss) on investments | 1.98 | | .63 | | .04 | | 1.18 | | .79 | |
| Total from Investment Operations | 1.89 | | .57 | | (.03 | ) | 1.13 | | .74 | |
| Net asset value, end of period | 7.22 | | 5.33 | | 4.76 | | 4.79 | | 3.66 | |
| Total Return (%)b | 35.46 | | 11.98 | | (.63 | ) | 30.87 | | 25.34 | |
| Ratios/Supplemental Data (%): | | | | | | | | | | |
| Ratio of total expenses | | | | | | | | | | |
| to average net assets | 2.14 | | 2.27 | | 2.25 | | 2.36 | | 2.61 | |
| Ratio of net expenses | | | | | | | | | | |
| to average net assets | 2.14 | | 2.24 | | 2.12 | | 2.14 | | 2.60 | |
| Ratio of net investment (loss) | | | | | | | | | | |
| to average net assets | (1.46 | ) | (1.16 | ) | (1.49 | ) | (1.34 | ) | (1.70 | ) |
| Portfolio Turnover Rate | 166.09 | | 164.34 | | 232.19 | | 204.97 | | 59.66 | |
| Net Assets, end of period ($ x 1,000) | 12,878 | | 9,762 | | 10,477 | | 12,661 | | 11,678 | |
|
| † Effective September 1, 2009,The Dreyfus Corporation replaced Founders Asset Management LLC as the fund’s |
| investment adviser. |
| a Based on average shares outstanding at each month end. |
| b Exclusive of sales charge. |
See notes to financial statements.
18
| | | | | | | | | | |
| | | | Year Ended December 31, | | | |
| Class F | 2013 | | 2012 | | 2011 | | 2010 | | 2009 | † |
| Per Share Data ($): | | | | | | | | | | |
| Net asset value, beginning of period | 6.17 | | 5.46 | | 5.45 | | 4.12 | | 3.26 | |
| Investment Operations: | | | | | | | | | | |
| Investment (loss)—neta | (.04 | ) | (.01 | ) | (.03 | ) | (.02 | ) | (.02 | ) |
| Net realized and unrealized | | | | | | | | | | |
| gain (loss) on investments | 2.31 | | .72 | | .04 | | 1.35 | | .88 | |
| Total from Investment Operations | 2.27 | | .71 | | .01 | | 1.33 | | .86 | |
| Distributions: | | | | | | | | | | |
| Net asset value, end of period | 8.44 | | 6.17 | | 5.46 | | 5.45 | | 4.12 | |
| Total Return (%) | 36.79 | | 13.00 | | .18 | | 32.28 | | 26.38 | |
| Ratios/Supplemental Data (%): | | | | | | | | | | |
| Ratio of total expenses | | | | | | | | | | |
| to average net assets | 1.19 | | 1.30 | | 1.25 | | 1.32 | | 1.38 | |
| Ratio of net expenses | | | | | | | | | | |
| to average net assets | 1.19 | | 1.30 | | 1.20 | | 1.30 | | 1.36 | |
| Ratio of net investment (loss) | | | | | | | | | | |
| to average net assets | (.50 | ) | (.20 | ) | (.57 | ) | (.50 | ) | (.47 | ) |
| Portfolio Turnover Rate | 166.09 | | 164.34 | | 232.19 | | 204.97 | | 59.66 | |
| Net Assets, end of period ($ x 1,000) | 100,631 | | 81,291 | | 81,886 | | 89,828 | | 78,218 | |
|
| † Effective September 1, 2009,The Dreyfus Corporation replaced Founders Asset Management LLC as the fund’s |
| investment adviser. |
| a Based on average shares outstanding at each month end. |
See notes to financial statements.
The Fund 19
FINANCIAL HIGHLIGHTS (continued)
| | | | | | | | | | |
| | | | Year Ended December 31, | | | |
| Class I | 2013 | | 2012 | | 2011 | | 2010 | | 2009 | † |
| Per Share Data ($): | | | | | | | | | | |
| Net asset value, beginning of period | 6.16 | | 5.44 | | 5.42 | | 4.10 | | 3.24 | |
| Investment Operations: | | | | | | | | | | |
| Investment income (loss)—neta | (.03 | ) | .00 | b | (.03 | ) | (.02 | ) | (.02 | ) |
| Net realized and unrealized | | | | | | | | | | |
| gain (loss) on investments | 2.29 | | .72 | | .05 | | 1.34 | | .88 | |
| Total from Investment Operations | 2.26 | | .72 | | .02 | | 1.32 | | .86 | |
| Net asset value, end of period | 8.42 | | 6.16 | | 5.44 | | 5.42 | | 4.10 | |
| Total Return (%) | 36.69 | | 13.24 | | .37 | | 32.20 | | 26.54 | |
| Ratios/Supplemental Data (%): | | | | | | | | | | |
| Ratio of total expenses | | | | | | | | | | |
| to average net assets | 1.13 | | 1.20 | | 1.23 | | 1.34 | | 1.49 | |
| Ratio of net expenses | | | | | | | | | | |
| to average net assets | 1.13 | | 1.18 | | 1.10 | | 1.14 | | 1.47 | |
| Ratio of net investment income | | | | | | | | | | |
| (loss) to average net assets | (.44 | ) | .00 | c | (.46 | ) | (.33 | ) | (.58 | ) |
| Portfolio Turnover Rate | 166.09 | | 164.34 | | 232.19 | | 204.97 | | 59.66 | |
| Net Assets, end of period ($ x 1,000) | 8,734 | | 8,198 | | 4,521 | | 7,575 | | 4,098 | |
|
| † Effective September 1, 2009,The Dreyfus Corporation replaced Founders Asset Management LLC as the fund’s |
| investment adviser. |
| a Based on average shares outstanding at each month end. |
| b Amount represents less than $.01 per share. |
| c Amount represents less than .01%. |
See notes to financial statements.
20
NOTES TO FINANCIAL STATEMENTS
NOTE 1—Significant Accounting Policies:
Dreyfus Mid-Cap Growth Fund (the “fund”) is the sole series of Dreyfus Funds, Inc. (the “Company”), which is registered under the Investment Company Act of 1940, as amended (the “Act”), as diversified open-end management investment company. The fund’s investment objective is to seek capital appreciation.The Dreyfus Corporation (the “Manager” or “Dreyfus”), a wholly-owned subsidiary of The Bank of New York Mellon Corporation (“BNY Mellon”), serves as the fund’s investment adviser.
MBSC Securities Corporation (the “Distributor”), a wholly-owned subsidiary of the Manager, is the distributor of the fund’s shares. The fund is authorized to issue 1.05 billion shares of $.001 par value Common Stock.The fund currently offers four classes of shares: Class A (350 million shares authorized), Class C (100 million shares authorized), Class F (500 million shares authorized) and Class I (100 million shares authorized). Class A and Class C shares are sold primarily to retail investors through intermediaries and bear a Distribution Plan fee and/or Shareholder Services Plan fee. Class A shares generally are subject to a sales charge imposed at the time of purchase. Class C shares are subject to a contingent deferred sales charge (“CDSC”) imposed on Class C shares redeemed within one year of purchase. Class F and Class I shares are offered at net asset value. Class F shares are sold only to Class F grandfathered investors, bear a Distribution Plan fee and have a shareholder services agreement with the Distributor. Class I shares are sold primarily to bank trust departments and other financial service providers (including The Bank of New York Mellon, a subsidiary of BNY Mellon and an affiliate of Dreyfus and its affiliates ), acting on behalf of customers having a qualified trust or investment account or relationship at such institution, and bear no Distribution or
The Fund 21
NOTES TO FINANCIAL STATEMENTS (continued)
Shareholder Services Plan fees. Class I shares are offered without a front-end sales charge or CDSC. Other differences between the classes include the services offered to and the expenses borne by each class, the allocation of certain transfer agency costs, and certain voting rights. Income, expenses (other than expenses attributable to a specific class), and realized and unrealized gains or losses on investments are allocated to each class of shares based on its relative net assets.
The Financial Accounting Standards Board (“FASB”) Accounting Standards Codification is the exclusive reference of authoritative U.S. generally accepted accounting principles (“GAAP”) recognized by the FASB to be applied by nongovernmental entities. Rules and interpretive releases of the Securities and Exchange Commission (“SEC”) under authority of federal laws are also sources of authoritative GAAP for SEC registrants. The fund’s financial statements are prepared in accordance with GAAP, which may require the use of management estimates and assumptions.Actual results could differ from those estimates.
(a) Portfolio valuation: The fair value of a financial instrument is the amount that would be received to sell an asset or paid to transfer a liability in an orderly transaction between market participants at the measurement date (i.e., the exit price). GAAP establishes a fair value hierarchy that prioritizes the inputs of valuation techniques used to measure fair value. This hierarchy gives the highest priority to unadjusted quoted prices in active markets for identical assets or liabilities (Level 1 measurements) and the lowest priority to unobservable inputs (Level 3 measurements).
Additionally, GAAP provides guidance on determining whether the volume and activity in a market has decreased significantly and whether such a decrease in activity results in transactions that are not orderly. GAAP requires enhanced disclosures around valuation inputs and techniques used during annual and interim periods.
22
Various inputs are used in determining the value of the fund’s investments relating to fair value measurements.These inputs are summarized in the three broad levels listed below:
Level 1—unadjusted quoted prices in active markets for identical investments.
Level 2—other significant observable inputs (including quoted prices for similar investments, interest rates, prepayment speeds, credit risk, etc.).
Level 3—significant unobservable inputs (including the fund’s own assumptions in determining the fair value of investments).
The inputs or methodology used for valuing securities are not necessarily an indication of the risk associated with investing in those securities.
Changes in valuation techniques may result in transfers in or out of an assigned level within the disclosure hierarchy. Valuation techniques used to value the fund’s investments are as follows:
Investments in securities are valued at the last sales price on the securities exchange or national securities market on which such securities are primarily traded. Securities listed on the National Market System for which market quotations are available are valued at the official closing price or, if there is no official closing price that day, at the last sales price. Securities not listed on an exchange or the national securities market, or securities for which there were no transactions, are valued at the average of the most recent bid and asked prices, except for open short positions, where the asked price is used for valuation purposes. Bid price is used when no asked price is available. Registered investment companies that are not traded on an exchange are valued at their net asset value. All of the preceding securities are categorized within Level 1 of the fair value hierarchy.
The Fund 23
NOTES TO FINANCIAL STATEMENTS (continued)
Fair valuing of securities may be determined with the assistance of a pricing service using calculations based on indices of domestic securities and other appropriate indicators, such as prices of relevant American Depository Receipts and financial futures. Utilizing these techniques may result in transfers between Level 1 and Level 2 of the fair value hierarchy.
When market quotations or official closing prices are not readily available, or are determined not to reflect accurately fair value, such as when the value of a security has been significantly affected by events after the close of the exchange or market on which the security is principally traded (for example, a foreign exchange or market), but before the fund calculates its net asset value, the fund may value these investments at fair value as determined in accordance with the procedures approved by the Company’s Board of Directors (the “Board”). Certain factors may be considered when fair valuing investments such as: fundamental analytical data, the nature and duration of restrictions on disposition, an evaluation of the forces that influence the market in which the securities are purchased and sold, and public trading in similar securities of the issuer or comparable issuers. These securities are either categorized within Level 2 or 3 of the fair value hierarchy depending on the relevant inputs used.
For restricted securities where observable inputs are limited, assumptions about market activity and risk are used and are categorized within Level 3 of the fair value hierarchy.
The following is a summary of the inputs used as of December 31, 2013 in valuing the fund’s investments:
| | | |
| | Level 2—Other | Level 3— | |
| Level 1— | Significant | Significant | |
| Unadjusted | Observable | Unobservable | |
| Quoted Prices | Inputs | Inputs | Total |
| Assets ($) | | | |
| Investments in Securities: | | | |
| Equity Securities— | | | |
| Domestic | | | |
| Common Stocks† 140,817,025 | — | — | 140,817,025 |
24
| | | | |
| | | Level 2—Other | Level 3— | |
| | Level 1— | Significant | Significant | |
| | Unadjusted | Observable | Unobservable | |
| | Quoted Prices | Inputs | Inputs | Total |
| Assets ($) (continued) | | | | |
| Investments in | | | | |
| Securities (continued): | | | |
| Equity Securities— | | | | |
| Foreign | | | | |
| Common Stocks† | 4,431,407 | — | — | 4,431,407 |
| Exchange-Traded | | | | |
| Funds | 1,815,427 | — | — | 1,815,427 |
| Mutual Funds | 9,350,760 | — | — | 9,350,760 |
| |
| † See Statement of Investments for additional detailed categorizations. | |
At December 31, 2013, there were no transfers between Level 1 and Level 2 of the fair value hierarchy.
(b) Securities transactions and investment income: Securities transactions are recorded on a trade date basis. Realized gains and losses from securities transactions are recorded on the identified cost basis. Dividend income is recognized on the ex-dividend date and interest income, including, where applicable, accretion of discount and amortization of premium on investments, is recognized on the accrual basis.
Pursuant to a securities lending agreement with The Bank of New York Mellon, the fund may lend securities to qualified institutions. It is the fund’s policy that, at origination, all loans are secured by collateral of at least 102% of the value of U.S. securities loaned and 105% of the value of foreign securities loaned. Collateral equivalent to at least 100% of the market value of securities on loan is maintained at all times. Collateral is either in the form of cash, which can be invested in certain money market mutual funds managed by the Manager or U.S. Government and Agency securities.The fund is entitled to receive all dividends, interest and distributions on securities loaned, in addition to income earned as a result of the lending transaction. Should a borrower fail to return the securities in a timely manner,The Bank of NewYork
The Fund 25
NOTES TO FINANCIAL STATEMENTS (continued)
Mellon is required to replace the securities for the benefit of the fund or credit the fund with the market value of the unreturned securities and is subrogated to the fund’s rights against the borrower and the collateral. During the period ended December 31, 2013,The Bank of New York Mellon earned $4,708 from lending portfolio securities, pursuant to the securities lending agreement.
(c) Affiliated issuers: Investments in other investment companies advised by Dreyfus are defined as “affiliated” under the Act. Investments in affiliated investment companies during the period ended December 31, 2013 were as follows:
| | | | | |
| Affiliated | | | | | |
| Investment | Value | | | Value | Net |
| Company | 12/31/2012($) | Purchases ($) | Sales($) | 12/31/2013 ($) | Assets (%) |
| Dreyfus | | | | | |
| Institutional | | | | | |
| Preferred | | | | | |
| Plus Money | | | | | |
| Market Fund | 3,544,993 | 71,192,924 | 72,216,849 | 2,521,068 | 1.7 |
| Dreyfus | | | | | |
| Institutional | | | | | |
| Cash | | | | | |
| Advantage | | | | | |
| Fund | 3,052,087 | 80,234,115 | 76,456,510 | 6,829,692 | 4.6 |
| Total | 6,597,080 | 151,427,039 | 148,673,359 | 9,350,760 | 6.3 |
(d) Dividends to shareholders: Dividends are recorded on the ex-dividend date. Dividends from investment income-net and dividends from net realized capital gains, if any, are normally declared and paid annually, but the fund may make distributions on a more frequent basis to comply with the distribution requirements of the Internal Revenue Code of 1986, as amended (the “Code”).To the extent that net realized capital gains can be offset by capital loss carryovers, it is the policy of the fund not to distribute such gains. Income and capital gain distributions are determined in accordance with income tax regulations, which may differ from GAAP.
(e) Federal income taxes: It is the policy of the fund to continue to qualify as a regulated investment company, if such qualification is in the best interests of its shareholders, by complying with the applicable pro-
26
visions of the Code, and to make distributions of taxable income sufficient to relieve it from substantially all federal income and excise taxes.
As of and during the period ended December 31, 2013, the fund did not have any liabilities for any uncertain tax positions.The fund recognizes interest and penalties, if any, related to uncertain tax positions as income tax expense in the Statement of Operations. During the period ended December 31, 2013, the fund did not incur any interest or penalties.
Each tax year in the four-year period ended December 31, 2013 remains subject to examination by the Internal Revenue Service and state taxing authorities.
At December 31, 2013, the components of accumulated earnings on a tax basis were as follows: accumulated capital losses $12,214,306 and unrealized appreciation $26,647,604.
Under the Regulated Investment Company Modernization Act of 2010 (the “2010 Act”), the fund is permitted to carry forward capital losses incurred in taxable years beginning after December 22, 2010 (“post-enactment losses”) for an unlimited period. Furthermore, post-enactment capital loss carryovers retain their character as either short-term or long-term capital losses rather than short-term as they were under previous statute.The 2010 Act requires post-enactment losses to be utilized before the utilization of losses incurred in taxable years prior to the effective date of the 2010 Act (“pre-enactment losses”).As a result of this ordering rule, pre-enactment losses may be more likely to expire unused.
The accumulated capital loss carryover is available for federal income tax purposes to be applied against future net realized capital gains, if any, realized subsequent to December 31, 2013. If not applied, the carryover expires in fiscal year 2017.
During the period ended December 31, 2013, as a result of permanent book to tax differences, primarily due to the tax treatment for net operating losses and real estate investment trusts, the fund increased accu-
The Fund 27
NOTES TO FINANCIAL STATEMENTS (continued)
mulated undistributed investment income-net by $795,321, increased accumulated net realized gain (loss) on investments by $67,568 and decreased paid-in capital by $862,889. Net assets and net asset value per share were not affected by this reclassification.
NOTE 2—Bank Lines of Credit:
The fund participates with other Dreyfus-managed funds in a $265 million unsecured credit facility led by Citibank, N.A. and a $300 million unsecured credit facility provided by The Bank of New York Mellon (each, a “Facility”), each to be utilized primarily for temporary or emergency purposes, including the financing of redemptions. Prior to October 9, 2013, the unsecured credit facility with Citibank, N.A. was $210 million. In connection therewith, the fund has agreed to pay its pro rata portion of commitment fees for each Facility. Interest is charged to the fund based on rates determined pursuant to the terms of the respective Facility at the time of borrowing.
The average amount of borrowings outstanding under the Facilities during the period ended December 31, 2013 was approximately $87,950 with a related weighted average annualized interest rate of 1.10%.
NOTE 3—Investment Advisory Fee and Other Transactions With Affiliates:
(a) Pursuant to an investment advisory agreement with the Manager, the investment advisory fee is based on the fund’s average daily net assets and is computed at the following annual rates: 1% of the first $30 million, .75% of the next $270 million, .70% of the next $200 million, and .65% in excess of $500 million.The fee is payable monthly.The effective management fee rate during the period ended December 31, 2013 was .81%.
The fund has agreed to compensate the Manager for providing accounting services, administration, compliance monitoring, regulatory and shareholder reporting, as well as related facilities, equipment and clerical help.The fee is based on the fund’s average daily net assets and computed at the following annual rates: .06% of the first $500 million, .04% of the next $500 million and .02% in excess of $1 billion, plus
28
reasonable out-of-pocket expenses.The effective administrative fee rate during the period ended December 31, 2013 was .06%.
During the period ended December 31, 2013, the Distributor retained $9,490 from commissions earned on sales of the fund’s Class A shares and $1,750 from CDSCs on redemptions of Class C shares.
(b) Under the Distribution Plan adopted pursuant to Rule 12b-1 under the Act, Class C shares pay the Distributor for distributing its shares at an annual rate of .75% of the value of its average daily net assets. During the period ended December 31, 2013, Class C shares were charged $83,235, pursuant to the Distribution Plan.
The fund also adopted a Distribution Plan pursuant to Rule 12b-1 under the Act applicable to its Class F shares (the “Class F Plan”). Under the Class F Plan, the fund is authorized to reimburse the Distributor for expenses paid for distributing or servicing its Class F shares at an annual rate of up to .25% of the value of the average daily net assets of the fund’s Class F shares.The Distributor has agreed not to seek reimbursement of any expenses under the Class F Plan other than reimbursements for payments made to brokers and other intermediaries whose customers hold Class F shares (“Third Party Payments”). This commitment applies to any such expenses (other than Third Party Payments).This commitment will continue indefinitely and will not terminate without the prior approval of the Board. During the period ended December 31, 2013, Class F shares were charged $72,068 pursuant to the Class F Plan.
(c) Under the Shareholder Services Plan, Class A and Class C shares pay the Distributor at an annual rate of .25% of the value of their average daily net assets for the provision of certain services.The services provided may include personal services relating to shareholder accounts, such as answering shareholder inquiries regarding the fund and providing reports and other information, and services related to the maintenance of shareholder accounts.The Distributor may make payments to Service Agents (securities dealers, financial institutions or other industry professionals) with respect to these services.The Distributor determines the amounts
The Fund 29
NOTES TO FINANCIAL STATEMENTS (continued)
to be paid to Service Agents. During the period ended December 31, 2013, Class A and Class C shares were charged $58,159 and $27,745, respectively, pursuant to the Shareholder Services Plan.
The Company has a shareholder services agreement with the Distributor, whereby the fund agrees to compensate the Distributor for providing certain shareholder servicing functions to holders of Class F shares. On an annual basis, the fund pays the Distributor a monthly fee of $24.00 per Class F shareholder account considered to be an open account at any time during a given month. During the period ended December 31, 2013, Class F shares were charged $69,316 pursuant to the shareholder services agreement.
Under its terms, the Distribution Plan, Class F Plan and Shareholder Services Plan shall remain in effect from year to year, provided such continuance is approved annually by a vote of a majority of those Directors who are “interested persons” of the Company and who have no direct or indirect financial interest in the operation of or in any agreement related to the Distribution Plan, Class F Plan or Shareholder Services Plan.
The fund has arrangements with the transfer agent and the custodian whereby the fund may receive earnings credits when positive cash balances are maintained, which are used to offset transfer agency and custody fees. For financial reporting purposes, the fund includes net earnings credits as an expense offset in the Statement of Operations.
The fund compensates DreyfusTransfer, Inc., a wholly-owned subsidiary of the Manager, under a transfer agency agreement for providing transfer agency and cash management services for the fund. The majority of transfer agency fees are comprised of amounts paid on a per account basis, while cash management fees are related to fund subscriptions and redemptions. During the period ended December 31, 2013, the fund was charged $25,602 for transfer agency services and $3,743 for cash management services.These fees are included in Shareholder servicing costs in the Statement of Operations. Cash management fees were partially offset by earnings credits of $397.
30
The fund compensates The Bank of NewYork Mellon under a custody agreement for providing custodial services for the fund.These fees are determined based on net assets, geographic region and transaction activity. During the period ended December 31, 2013, the fund was charged $13,088 pursuant to the custody agreement.
The fund compensated The Bank of New York Mellon under a cash management agreement that was in effect until September 30, 2013 for performing certain cash management services related to fund subscriptions and redemptions. During the period ended December 31, 2013, the fund was charged $1,321 pursuant to the cash management agreement, which is included in Shareholder servicing costs in the Statement of Operations.These fees were partially offset by earnings credits of $2.
During the period ended December 31, 2013, the fund was charged $9,093 for services performed by the Chief Compliance Officer and his staff.
The components of “Due to The Dreyfus Corporation and affiliates” in the Statement of Assets and Liabilities consist of: investment advisory fees $99,053, Distribution Plan fees $28,288, Shareholder Services Plan fees $20,912, custodian fees $7,000, Chief Compliance Officer fees $2,299 and transfer agency fees $4,587.
(d) Each Board member also serves as a Board member of other funds within the Dreyfus complex. Annual retainer fees and attendance fees are allocated to each fund based on net assets.
NOTE 4—Securities Transactions:
The aggregate amount of purchases and sales of investment securities, excluding short-term securities, during the period ended December 31, 2013, amounted to $214,105,261 and $225,962,684, respectively.
At December 31, 2013, the cost of investments for federal income tax purposes was $129,767,015; accordingly, accumulated net unrealized appreciation on investments was $26,647,604, consisting of $27,209,024 gross unrealized appreciation and $561,420 gross unrealized depreciation.
The Fund 31
REPORT OF INDEPENDENT REGISTERED
PUBLIC ACCOUNTING FIRM
The Board of Directors and Shareholders of Dreyfus Funds Inc.
We have audited the accompanying statement of assets and liabilities of Dreyfus Mid-Cap Growth Fund (the “Fund”), a series of Dreyfus Funds Inc., including the statement of investments as of December 31, 2013, and the related statement of operations for the year then ended, the statements of changes in net assets for each of the years in the two-year period then ended, and the financial highlights for each of the years in the four-year period then ended.These financial statements and financial highlights are the responsibility of the Fund’s management. Our responsibility is to express an opinion on these financial statements and financial highlights based on our audits.The financial highlights for the year ended December 31, 2009 were audited by other independent registered public accountants whose report thereon, dated February 25, 2010, expressed an unqualified opinion on those financial highlights.
We conducted our audit in accordance with the standards of the Public Company Accounting Oversight Board (United States).Those standards require that we plan and perform the audit to obtain reasonable assurance about whether the financial statements and financial highlights are free of material misstatement. An audit includes examining, on a test basis, evidence supporting the amounts and disclosures in the financial statements. Our procedures included confirmation of securities owned as of December 31, 2013, by correspondence with the custodian and brokers or by other appropriate auditing procedures where replies from brokers were not received.An audit also includes assessing the accounting principles used and significant estimates made by management, as well as evaluating the overall financial statement presentation.We believe that our audits provide a reasonable basis for our opinion.
In our opinion, the financial statements and financial highlights referred to above present fairly, in all material respects, the financial position of Dreyfus Mid-Cap Growth Fund as of December 31, 2013, and the results of its operations for the year then ended, the changes in its net assets for each of the years in the two-year period then ended, and the financial highlights for each of the years in the four-year period then ended, in conformity with U.S. generally accepted accounting principles.

New York, New York
February 21, 2014
32
|
| BOARD MEMBERS INFORMATION (Unaudited) |
| INDEPENDENT BOARD MEMBERS |
| |
| |
| Joseph S. DiMartino (70) |
| Chairman of the Board (2009) |
| Principal Occupation During Past 5Years: |
| • Corporate Director and Trustee |
| Other Public Company Board Memberships During Past 5Years: |
| • CBIZ (formerly, Century Business Services, Inc.), a provider of outsourcing functions for small |
| and medium size companies, Director (1997-present) |
| • The Newark Group, a provider of a national market of paper recovery facilities, paperboard |
| mills and paperboard converting plants, Director (2000-2010) |
| • Sunair Services Corporation, a provider of certain outdoor-related services to homes and |
| businesses, Director (2005-2009) |
| No. of Portfolios for which Board Member Serves: 141 |
| ——————— |
| Francine J. Bovich (62) |
| Board Member (2011) |
| Principal Occupation During Past 5Years: |
| • Trustee,The Bradley Trusts, private trust funds (2011-present) |
| • Managing Director, Morgan Stanley Investment Management (1993-2010) |
| No. of Portfolios for which Board Member Serves: 40 |
| ——————— |
| James M. Fitzgibbons (79) |
| Board Member (2009) |
| Principal Occupation During Past 5Years: |
| • Corporate Director and Trustee |
| Other Public Company Board Memberships During Past 5Years: |
| • Bill Barrett Corporation, an oil and natural gas exploration company, Director (2004-2012) |
| No. of Portfolios for which Board Member Serves: 26 |
| ——————— |
| Kenneth A. Himmel (67) |
| Board Member (2009) |
| Principal Occupation During Past 5Years: |
| • President and CEO, Related Urban Development, a real estate development company (1996-present) |
| • President and CEO, Himmel & Company, a real estate development company (1980-present) |
| • CEO,American Food Management, a restaurant company (1983-present) |
| No. of Portfolios for which Board Member Serves: 26 |
The Fund 33
|
| BOARD MEMBERS INFORMATION (Unaudited) (continued) |
| INDEPENDENT BOARD MEMBERS |
| |
| |
| |
| Stephen J. Lockwood (66) |
| Board Member (2009) |
| Principal Occupation During Past 5Years: |
| • Chairman of the Board, Stephen J. Lockwood and Company LLC, a real estate investment |
| company (2000-present) |
| No. of Portfolios for which Board Member Serves: 26 |
| ——————— |
| Roslyn M. Watson (64) |
| Board Member (2009) |
| Principal Occupation During Past 5Years: |
| • Principal,Watson Ventures, Inc., a real estate investment company (1993-present) |
| No. of Portfolios for which Board Member Serves: 36 |
| ——————— |
| Benaree Pratt Wiley (67) |
| Board Member (2009) |
| Principal Occupation During Past 5Years: |
| • Principal,TheWiley Group, a firm specializing in strategy and business development (2005-present) |
| Other Public Company Board Memberships During Past 5Years: |
| • CBIZ (formerly, Century Business Services, Inc.), a provider of outsourcing functions for small |
| and medium size companies, Director (2008-present) |
| No. of Portfolios for which Board Member Serves: 61 |
| ——————— |
| Once elected all Board Members serve for an indefinite term, but achieve Emeritus status upon reaching age 80.The |
| address of the Board Members and Officers is c/o The Dreyfus Corporation, 200 Park Avenue, NewYork, NewYork |
| 10166.Additional information about the Board Members is available in the fund’s Statement of Additional Information |
| which can be obtained from Dreyfus free of charge by calling this toll free number: 1-800-DREYFUS. |
34
OFFICERS OF THE FUND (Unaudited)
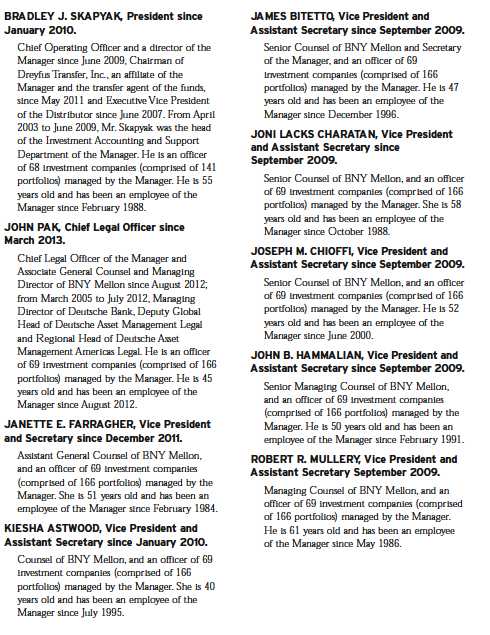
The Fund 35
OFFICERS OF THE FUND (Unaudited) (continued)
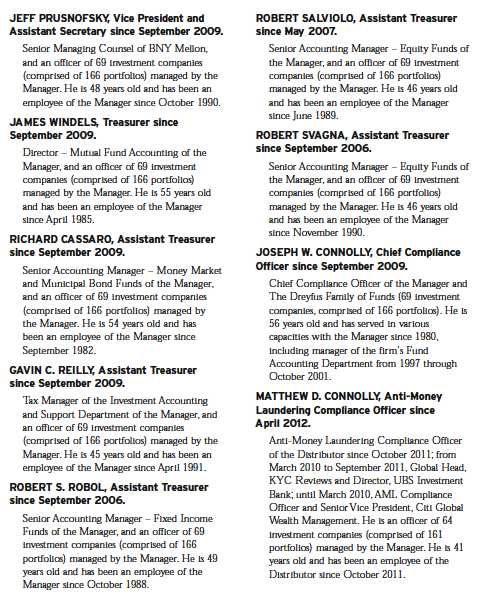
36
Item 2. Code of Ethics.
The Registrant has adopted a code of ethics that applies to the Registrant's principal executive officer, principal financial officer, principal accounting officer or controller, or persons performing similar functions. There have been no amendments to, or waivers in connection with, the Code of Ethics during the period covered by this Report.
Item 3. Audit Committee Financial Expert.
The Registrant's Board has determined that Joseph S. DiMartino, a member of the Audit Committee of the Board, is an audit committee financial expert as defined by the Securities and Exchange Commission (the "SEC"). Joseph S. DiMartino is "independent" as defined by the SEC for purposes of audit committee financial expert determinations.
Item 4. Principal Accountant Fees and Services.
(a) Audit Fees. The aggregate fees billed for each of the last two fiscal years (the "Reporting Periods") for professional services rendered by the Registrant's principal accountant (the "Auditor") for the audit of the Registrant's annual financial statements or services that are normally provided by the Auditor in connection with the statutory and regulatory filings or engagements for the Reporting Periods, were $25,160 in 2012 and $25,490 in 2013.
(b) Audit-Related Fees. The aggregate fees billed in the Reporting Periods for assurance and related services by the Auditor that are reasonably related to the performance of the audit of the Registrant's financial statements and are not reported under paragraph (a) of this Item 4 were $4,460 in 2012 and $4,725 in 2013. These services consisted of one or more of the following: (i) agreed upon procedures related to compliance with Internal Revenue Code section 817(h), (ii) security counts required by Rule 17f-2 under the Investment Company Act of 1940, as amended, (iii) advisory services as to the accounting or disclosure treatment of Registrant transactions or events and (iv) advisory services to the accounting or disclosure treatment of the actual or potential impact to the Registrant of final or proposed rules, standards or interpretations by the Securities and Exchange Commission, the Financial Accounting Standards Boards or other regulatory or standard-setting bodies.
The aggregate fees billed in the Reporting Periods for non-audit assurance and related services by the Auditor to the Registrant's investment adviser (not including any sub-investment adviser whose role is primarily portfolio management and is subcontracted with or overseen by another investment adviser), and any entity controlling, controlled by or under common control with the investment adviser that provides ongoing services to the Registrant ("Service Affiliates"), that were reasonably related to the performance of the annual audit of the Service Affiliate, which required pre-approval by the Audit Committee were $0 in 2012 and $0 in 2013.
(c) Tax Fees. The aggregate fees billed in the Reporting Periods for professional services rendered by the Auditor for tax compliance, tax advice, and tax planning ("Tax Services") were $2,590 in 2012 and 2,640 in 2013. These services consisted of review or preparation of U.S. federal, state, local and excise tax returns. The aggregate fees billed in the Reporting Periods for Tax Services by the Auditor to Service Affiliates, which required pre-approval by the Audit Committee were $0 in 2012 and $0 in 2013.
(d) All Other Fees. The aggregate fees billed in the Reporting Periods for products and services provided by the Auditor, other than the services reported in paragraphs (a) through (c) of this Item, were $0 in 2012 and $0 in 2013.
The aggregate fees billed in the Reporting Periods for Non-Audit Services by the Auditor to Service Affiliates, other than the services reported in paragraphs (b) through (c) of this Item, which required pre-approval by the Audit Committee, were $0 in 2012 and $0 in 2013.
(e)(1) Audit Committee Pre-Approval Policies and Procedures. The Registrant's Audit Committee has established policies and procedures (the "Policy") for pre-approval (within specified fee limits) of the Auditor's engagements for non-audit services to the Registrant and Service Affiliates without specific case-by-case consideration. The pre-approved services in the Policy can include pre-approved audit services, pre-approved audit-related services, pre-approved tax services and pre-approved all other services. Pre-approval considerations include whether the proposed services are compatible with maintaining the Auditor's independence. Pre-approvals pursuant to the Policy are considered annually.
(e)(2) Note: None of the services described in paragraphs (b) through (d) of this Item 4 were approved by the Audit Committee pursuant to paragraph (c)(7)(i)(C) of Rule 2-01 of Regulation S-X.
(f) None of the hours expended on the principal accountant's engagement to audit the registrant's financial statements for the most recent fiscal year were attributed to work performed by persons other than the principal account's full-time, permanent employees.
Non-Audit Fees. The aggregate non-audit fees billed by the Auditor for services rendered to the Registrant, and rendered to Service Affiliates, for the Reporting Periods were $12,372,510 in 2012 and $13,916,529 in 2013.
Auditor Independence. The Registrant's Audit Committee has considered whether the provision of non-audit services that were rendered to Service Affiliates, which were not pre-approved (not requiring pre-approval), is compatible with maintaining the Auditor's independence.
Item 5. Audit Committee of Listed Registrants.
Not applicable.
Item 6. Investments.
(a) Not applicable.
Item 7. Disclosure of Proxy Voting Policies and Procedures for Closed-End Management Investment Companies.
Not applicable.
Item 8. Portfolio Managers of Closed-End Management Investment Companies.
Not applicable.
Item 9. Purchases of Equity Securities by Closed-End Management Investment Companies and Affiliated Purchasers.
Not applicable.
Item 10. Submission of Matters to a Vote of Security Holders.
There have been no material changes to the procedures applicable to Item 10.
Item 11. Controls and Procedures.
(a) The Registrant's principal executive and principal financial officers have concluded, based on their evaluation of the Registrant's disclosure controls and procedures as of a date within 90 days of the filing date of this report, that the Registrant's disclosure controls and procedures are reasonably designed to ensure that information required to be disclosed by the Registrant on Form N-CSR is recorded, processed, summarized and reported within the required time periods and that information required to be disclosed by the Registrant in the reports that it files or submits on Form N-CSR is accumulated and communicated to the Registrant's management, including its principal executive and principal financial officers, as appropriate to allow timely decisions regarding required disclosure.
(b) There were no changes to the Registrant's internal control over financial reporting that occurred during the second fiscal quarter of the period covered by this report that have materially affected, or are reasonably likely to materially affect, the Registrant's internal control over financial reporting.
Item 12. Exhibits.
(a)(1) Code of ethics referred to in Item 2.
(a)(2) Certifications of principal executive and principal financial officers as required by Rule 30a-2(a) under the Investment Company Act of 1940.
(a)(3) Not applicable.
(b) Certification of principal executive and principal financial officers as required by Rule 30a-2(b) under the Investment Company Act of 1940.
SIGNATURES
Pursuant to the requirements of the Securities Exchange Act of 1934 and the Investment Company Act of 1940, the Registrant has duly caused this Report to be signed on its behalf by the undersigned, thereunto duly authorized.
Dreyfus Funds, Inc.
By: /s/ Bradley J. Skapyak |
Bradley J. Skapyak President |
Date: | February 21, 2014 |
|
Pursuant to the requirements of the Securities Exchange Act of 1934 and the Investment Company Act of 1940, this Report has been signed below by the following persons on behalf of the Registrant and in the capacities and on the dates indicated. |
|
By: /s/ Bradley J. Skapyak |
Bradley J. Skapyak President |
Date: | February 21, 2014 |
|
By: /s/ James Windels |
James Windels Treasurer |
Date: | February 21, 2014 |
|
EXHIBIT INDEX
(a)(1) Code of ethics referred to in Item 2.
(a)(2) Certifications of principal executive and principal financial officers as required by Rule 30a-2(a) under the Investment Company Act of 1940. (EX-99.CERT)
(b) Certification of principal executive and principal financial officers as required by Rule 30a-2(b) under the Investment Company Act of 1940. (EX-99.906CERT)
Exhibit A
Persons Covered by the Code of Ethics
Bradley J. Skapyak | President | (Principal Executive Officer) |
| | |
James Windels | Treasurer | (Principal Financial and Accounting Officer) |
Revised as of January 1, 2010