UNITED STATES
SECURITIES AND EXCHANGE COMMISSION
Washington, D.C. 20549
FORM N-CSR
CERTIFIED SHAREHOLDER REPORT OF REGISTERED MANAGEMENT
INVESTMENT COMPANIES
Investment Company Act file number | 811- 1018 |
| |
| Dreyfus Funds, Inc. | |
| (Exact name of Registrant as specified in charter) | |
| | |
| c/o The Dreyfus Corporation 200 Park Avenue New York, New York 10166 | |
| (Address of principal executive offices) (Zip code) | |
| | |
| Michael A. Rosenberg, Esq. 200 Park Avenue New York, New York 10166 | |
| (Name and address of agent for service) | |
|
Registrant's telephone number, including area code: | (212) 922-6000 |
| |
Date of fiscal year end: | 12/31 | |
Date of reporting period: | 12/31/10 | |
| | | | | | |
FORM N-CSR
Item 1. Reports to Stockholders.
Save time. Save paper. View your next shareholder report online as soon as it’s available. Log into www.dreyfus.com and sign up for Dreyfus eCommunications. It’s simple and only takes a few minutes.
The views expressed in this report reflect those of the portfolio manager only through the end of the period covered and do not necessarily represent the views of Dreyfus or any other person in the Dreyfus organization. Any such views are subject to change at any time based upon market or other conditions and Dreyfus disclaims any responsibility to update such views.These views may not be relied on as investment advice and, because investment decisions for a Dreyfus fund are based on numerous factors, may not be relied on as an indication of trading intent on behalf of any Dreyfus fund.
Not FDIC-Insured • Not Bank-Guaranteed • May Lose Value
| | Contents |
| | THE FUND |
| 2 | A Letter from the Chairman and CEO |
| 3 | Discussion of Fund Performance |
| 6 | Fund Performance |
| 8 | Understanding Your Fund’s Expenses |
| 8 | Comparing Your Fund’s Expenses With Those of Other Funds |
| 9 | Statement of Investments |
| 13 | Statement of Assets and Liabilities |
| 14 | Statement of Operations |
| 15 | Statement of Changes in Net Assets |
| 17 | Financial Highlights |
| 22 | Notes to Financial Statements |
| 34 | Report of Independent Registered Public Accounting Firm |
| 35 | Important Tax Information |
| 36 | Board Members Information |
| 38 | Officers of the Fund |
| | FOR MORE INFORMATION |
| | Back Cover |
Dreyfus
Equity Growth Fund
The Fund

A LETTER FROM THE CHAIRMAN AND CEO
Dear Shareholder:
We are pleased to present this annual report for Dreyfus Equity Growth Fund, covering the 12-month period from January 1, 2010, through December 31, 2010.
Although 2010 proved to be a volatile year for stocks, the reporting period ended with a sustained market rally that produced above-average returns across most market-cap segments for the calendar year. Investors’ early concerns regarding sovereign debt issues in Europe and stubbornly high unemployment in the United States later gave way to optimism that massive economic stimulus programs, robust growth in the world’s emerging markets, a strong holiday retail season and rising corporate earnings signaled better economic times ahead.
We are aware that stocks have recently reached higher valuations, and that any new economic setbacks could result in market volatility as investors adjust their expectations. Nonetheless, we see value in many segments of the equity market. For example, investors in volatile markets may turn to high-quality stocks of U.S. companies with track records of consistent growth in a variety of economic climates, and international equities could benefit from a declining U.S. dollar and potentially higher growth opportunities abroad. With 2011 now upon us, we suggest talking to your financial advisor, who can help you identify potential opportunities and suggest strategies suitable for your individual needs in today’s market environment.
For information about how the fund performed during the reporting period, as well as general market perspectives, we provide a Discussion of Fund Performance on the pages that follow.
Thank you for your continued confidence and support.

Jonathan R. Baum
Chairman and Chief Executive Officer
The Dreyfus Corporation
January 18, 2011
2

DISCUSSION OF FUND PERFORMANCE
For the period of January 1, 2010, through December 31, 2010, as provided by Elizabeth Slover, Portfolio Manager
Fund and Market Performance Overview
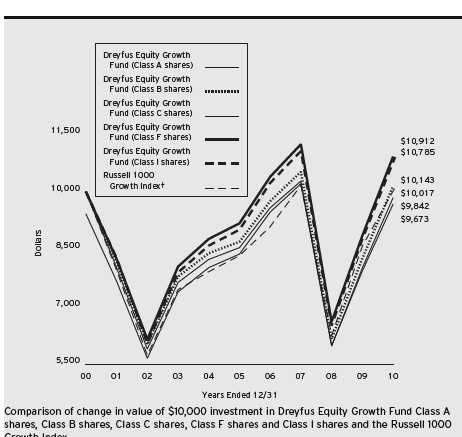
For the 12-month period ended December 31, 2010, Dreyfus Equity Growth Fund’s Class A shares produced a total return of 22.82%, Class B shares returned 21.02%, Class C shares returned 21.88%, Class F shares returned 23.18% and Class I shares returned 23.09%.1 In comparison, the Russell 1000 Growth Index produced a total return of 16.71% over the same period.2
Although stocks encountered heightened volatility in 2010, a rally in the fall enabled equities to end the year with double-digit gains.The fund produced higher returns than its benchmark, as our stock selection strategy produced above-average returns in eight of the benchmark’s 10 economic sectors.
The Fund’s Investment Approach
To pursue the fund’s goal of long-term growth of capital and income, we invest primarily in the common stocks of large, well-established companies with records of profitability, dividend payments and a reputation for high-quality management, products and services.The fund normally invests at least 80% of its net assets in stocks that are included in a widely recognized index of stock market performance, such as the Dow Jones Industrial Average, the Standard & Poor’s 500 Index, or the NASDAQ Composite Index. Using a “bottom-up” approach, we focus on individual stock selection instead of broad economic or industry trends. We look mainly for companies whose fundamental strengths suggest the potential to provide superior earnings growth over time. The fund may also invest in non-dividend-paying companies, and it may invest up to 30% of its total assets in foreign securities.
Waning Economic Concerns Fueled a Market Rally
Although much of the world had emerged from recession by the start of 2010, a number of new developments shook investors’ confidence.
DISCUSSION OF FUND PERFORMANCE (continued)
Europe was roiled by a sovereign debt crisis when Greece and, later, Ireland found themselves unable to finance heavy debt loads, leading to fiscal austerity measures that threatened the region’s sluggish economic rebound. Meanwhile, disappointing housing and employment data in the United States weighed on already mild growth. As a result, U.S. stocks generally declined amid heightened volatility over the first half of the year.
However, it became clearer over the summer that investors’ economic concerns may have been overblown. Corporate earnings exceeded analysts’ expectations, commodity prices climbed amid robust demand from the world’s emerging markets, and the U.S. and global economies remained on upward trajectories. New stimulative efforts by the Federal Reserve Board also boosted investor sentiment. Growth-oriented stocks generally produced higher returns than value-oriented stocks during the year.
Security Selections Successful in Most Sectors
Our security selection process proved effective in this market environment. Our stock picks in the information technology sector emphasized companies engaged in the emerging trend of “cloud computing,” in which businesses maintain data and applications over the Internet. Holdings such as virtualization software developer VMWare, data integration specialist Informatica and enterprise software developer Sybase advanced as this trend gained traction. Global positioning systems maker Trimble Navigation gained value after obtaining a foothold in India through a major acquisition. The f und also avoided relative weakness in Hewlett-Packard.
In the consumer staples sector, income growth among high earners supported the stocks of organic grocery chain Whole Foods Market, cosmetics maker The Estee Lauder Companies and other premium brands. Among industrial companies, engine manufacturer Cummins and heavy equipment maker Caterpillar saw robust demand from the emerging markets.
4
Although disappointments in 2010 proved to be relatively mild, shortfalls in the financials sector weighed on the fund’s relative performance, as
Genworth Financial and Prudential Financial struggled with delinquent loans and troubled housing markets.
Positioned for a More Selective Market Environment
While a number of economic headwinds remain, fears of a double-dip recession have receded. Corporations have record amounts of cash on their balance sheets, profits in some industries have returned to pre-recession levels, and several domestic political uncertainties were resolved following the midterm elections. Nonetheless, stubbornly high U.S. unemployment and geopolitical turmoil could challenge investor sentiment, and it remains to be seen whether the increased activity in the private sector will offset the end of some of the U.S. government’s fiscal stimulus programs.
We believe that investors will become more selective in such an environment, favoring companies that can grow in a sluggish economy and avoiding those with weaker underlying business fundamentals.
January 18, 2011
| |
| | Please note, the position in any security highlighted in italicized typeface was sold during the |
| | reporting period. |
| | Equity funds are subject generally to market, market sector, market liquidity, issuer and investment |
| | style risks, among other factors, to varying degrees, all of which are more fully described in the |
| | fund’s prospectus. |
| 1 | Total return includes reinvestment of dividends and any capital gains paid, and does not take into |
| | consideration the maximum initial sales charge in the case of Class A shares, or the applicable |
| | contingent deferred sales charges imposed on redemptions in the case of Class B and Class C |
| | shares. Had these charges been reflected, returns would have been lower. Past performance is no |
| | guarantee of future results. Share price and investment return fluctuate such that upon redemption, |
| | fund shares may be worth more or less than their original cost. |
| 2 | SOURCE: LIPPER INC. — The Russell 1000 Growth Index is a widely accepted, |
| | unmanaged large-cap index that measures the performance of those Russell 1000 Index |
| | companies with higher price-to-book ratios and higher forecasted growth values.The total return |
| | figure cited for this index assumes change in security prices and reinvestment of dividends, but does |
| | not reflect the costs of managing a mutual fund. Investors cannot invest directly in any index. |
FUND PERFORMANCE
|
| † Source: Lipper Inc. |
| Past performance is not predictive of future performance. |
| The above graph compares a $10,000 investment made in Class A, Class B, Class C, Class F and Class I shares of |
| Dreyfus Equity Growth Fund on 12/31/00 to a $10,000 investment made in the Russell 1000 Growth Index (the |
| “Index”) on that date.All dividends and capital gain distributions are reinvested. |
| The fund’s performance shown in the line graph takes into account the maximum initial sales charge on Class A shares |
| and all other applicable fees and expenses on all classes. Performance for Class B shares assumes the conversion of Class |
| B shares to Class A shares at the end of the sixth year following the date of purchase.The Index is an unmanaged index |
| which measures the performance of those Russell 1000 companies with higher price-to-book ratios and higher forecasted |
| growth values. Unlike a mutual fund, the Index is not subject to charges, fees and other expenses. Investors cannot invest |
| directly in any index. Further information relating to fund performance, including expense reimbursements, if applicable, is |
| contained in the Financial Highlights section of the prospectus and elsewhere in this report. |
6
| | | |
| Average Annual Total Returns as of 12/31/10 | | | |
| |
| | 1 Year | 5 Years | 10 Years |
| Class A shares | | | |
| with maximum sales charge (5.75%) | 15.85% | 2.06% | –0.16% |
| without sales charge | 22.82% | 3.28% | 0.44% |
| Class B shares | | | |
| with applicable redemption charge † | 17.02% | 1.81% | 0.14% |
| without redemption | 21.02% | 2.18% | 0.14% |
| Class C shares | | | |
| with applicable redemption charge †† | 20.88% | 2.53% | –0.33% |
| without redemption | 21.88% | 2.53% | –0.33% |
| Class F shares | 23.18% | 3.53% | 0.88% |
| Class I shares | 23.09% | 3.67% | 0.76% |
| Russell 1000 Growth Index | 16.71% | 3.75% | 0.02% |
|
| Past performance is not predictive of future performance.The fund’s performance shown in the graph and table does not |
| reflect the deduction of taxes that a shareholder would pay on fund distributions or the redemption of fund shares, but |
| does reflect expense reimbursements for certain share classes. Part of the fund’s historical performance is due to amounts |
| received from class action settlements regarding prior fund holdings.There is no guarantee that these settlement |
| distributions will occur in the future or have a similar impact on performance. |
| |
| † | The maximum contingent deferred sales charge for Class B shares is 4%.After six years Class B shares convert to |
| | Class A shares. |
| †† The maximum contingent deferred sales charge for Class C shares is 1% for shares redeemed within one year of the |
| | date of purchase. |
UNDERSTANDING YOUR FUND’S EXPENSES (Unaudited)
As a mutual fund investor, you pay ongoing expenses, such as management fees and other expenses. Using the information below, you can estimate how these expenses affect your investment and compare them with the expenses of other funds.You also may pay one-time transaction expenses, including sales charges (loads) and redemption fees, which are not shown in this section and would have resulted in higher total expenses. For more information, see your fund’s prospectus or talk to your financial adviser.
Review your fund’s expenses
The table below shows the expenses you would have paid on a $1,000 investment in Dreyfus Equity Growth Fund from July 1, 2010 to December 31, 2010. It also shows how much a $1,000 investment would be worth at the close of the period, assuming actual returns and expenses.
| | | | | |
| Expenses and Value of a $1,000 Investment | | | |
| assuming actual returns for the six months ended December 31, 2010 | | |
| | Class A | Class B | Class C | Class F | Class I |
| Expenses paid per $1,000† | $ 6.95 | $ 12.61 | $ 11.47 | $ 5.43 | $ 5.20 |
| Ending value (after expenses) | $1,315.60 | $1,305.50 | $1,309.40 | $1,315.70 | $1,316.60 |
|
| COMPARING YOUR FUND’S EXPENSES |
| WITH THOSE OF OTHER FUNDS (Unaudited) |
Using the SEC’s method to compare expenses
The Securities and Exchange Commission (SEC) has established guidelines to help investors assess fund expenses. Per these guidelines, the table below shows your fund’s expenses based on a $1,000 investment, assuming a hypothetical 5% annualized return. You can use this information to compare the ongoing expenses (but not transaction expenses or total cost) of investing in the fund with those of other funds.All mutual fund shareholder reports will provide this information to help you make this comparison. Please note that you cannot use this information to estimate your actual ending account balance and expenses paid during the period.
| | | | | |
| Expenses and Value of a $1,000 Investment | | | |
| assuming a hypothetical 5% annualized return for the six months ended December 31, 2010 |
| | Class A | Class B | Class C | Class F | Class I |
| Expenses paid per $1,000† | $ 6.06 | $ 11.02 | $ 10.01 | $ 4.74 | $ 4.53 |
| Ending value (after expenses) | $1,019.21 | $1,014.27 | $1,015.27 | $1,020.52 | $1,020.72 |
† Expenses are equal to the fund’s annualized expense ratio of 1.19% for Class A, 2.17% for Class B, 1.97% for Class C, .93% for Class F and .89% for Class I, multiplied by the average account value over the period, multiplied by 184/365 (to reflect the one-half year period).
8
|
| STATEMENT OF INVESTMENTS |
| December 31, 2010 |
| | |
| Common Stocks—99.5% | Shares | Value ($) |
| Consumer Discretionary—17.8% | | |
| Abercrombie & Fitch, Cl. A | 44,300 | 2,553,009 |
| Amazon.com | 53,800 a | 9,684,000 |
| Autoliv | 42,080 b | 3,321,795 |
| Carnival | 67,964 | 3,133,820 |
| Dick’s Sporting Goods | 67,970 a | 2,548,875 |
| DIRECTV, Cl. A | 96,380 a | 3,848,453 |
| General Motors | 48,580 | 1,790,659 |
| Guess? | 47,240 | 2,235,397 |
| Las Vegas Sands | 48,290 a,b | 2,218,926 |
| Limited Brands | 101,300 | 3,112,949 |
| Lowe’s | 95,160 | 2,386,613 |
| Macy’s | 132,830 | 3,360,599 |
| Netflix | 14,160 a,b | 2,487,912 |
| Newell Rubbermaid | 181,490 | 3,299,488 |
| News, Cl. A | 144,130 | 2,098,533 |
| Nordstrom | 84,880 | 3,597,214 |
| Omnicom Group | 76,670 | 3,511,486 |
| Staples | 160,520 | 3,655,040 |
| Target | 100,670 | 6,053,287 |
| | | 64,898,055 |
| Consumer Staples—9.6% | | |
| Clorox | 11,650 | 737,212 |
| Dr. Pepper Snapple Group | 51,990 | 1,827,968 |
| Energizer Holdings | 37,870 a | 2,760,723 |
| Estee Lauder, Cl. A | 31,630 | 2,552,541 |
| PepsiCo | 93,950 | 6,137,754 |
| Philip Morris International | 142,870 | 8,362,181 |
| Procter & Gamble | 80,520 | 5,179,852 |
| Walgreen | 79,860 | 3,111,346 |
| Whole Foods Market | 83,410 | 4,219,712 |
| | | 34,889,289 |
| Energy—11.2% | | |
| Cameron International | 66,090 a | 3,352,746 |
| Exxon Mobil | 265,580 | 19,419,210 |
| Halliburton | 78,090 | 3,188,415 |
STATEMENT OF INVESTMENTS (continued)
| | |
| Common Stocks (continued) | Shares | Value ($) |
| Energy (continued) | | |
| Newfield Exploration | 33,340 a | 2,404,147 |
| Occidental Petroleum | 38,860 | 3,812,166 |
| Schlumberger | 105,560 | 8,814,260 |
| | | 40,990,944 |
| Financial—3.3% | | |
| Aflac | 47,780 | 2,696,225 |
| American Express | 90,170 | 3,870,096 |
| Charles Schwab | 107,850 b | 1,845,314 |
| Janus Capital Group | 145,430 | 1,886,227 |
| Morgan Stanley | 67,980 | 1,849,736 |
| | | 12,147,598 |
| Health Care—10.4% | | |
| Agilent Technologies | 61,200 a | 2,535,516 |
| Alexion Pharmaceuticals | 25,160 a | 2,026,638 |
| Allergan | 44,980 | 3,088,777 |
| Allscripts Healthcare Solutions | 115,970 a | 2,234,742 |
| Celgene | 50,200 a | 2,968,828 |
| Covidien | 75,650 | 3,454,179 |
| Express Scripts | 55,940 a | 3,023,557 |
| Hospira | 40,280 a | 2,243,193 |
| McKesson | 39,750 | 2,797,605 |
| Merck & Co. | 50,040 | 1,803,442 |
| Pfizer | 179,204 | 3,137,862 |
| Sanofi-Aventis, ADR | 56,650 | 1,825,830 |
| St. Jude Medical | 72,380 a | 3,094,245 |
| Vertex Pharmaceuticals | 53,760 a | 1,883,213 |
| Warner Chilcott, Cl. A | 83,690 | 1,888,046 |
| | | 38,005,673 |
| Industrial—12.3% | | |
| Caterpillar | 111,850 | 10,475,871 |
| Cooper Industries | 84,210 | 4,908,601 |
| Cummins | 50,670 | 5,574,207 |
| Dover | 69,871 | 4,083,960 |
| General Electric | 295,450 | 5,403,780 |
| Ingersoll-Rand | 147,650 b | 6,952,838 |
10
| | |
| Common Stocks (continued) | Shares | Value ($) |
| Industrial (continued) | | |
| United Technologies | 94,310 | 7,424,083 |
| | | 44,823,340 |
| Information Technology—29.8% | | |
| Akamai Technologies | 68,180 a | 3,207,869 |
| Amphenol, Cl. A | 72,800 | 3,842,384 |
| Apple | 66,904 a | 21,580,554 |
| BMC Software | 82,210 a | 3,875,379 |
| Cree | 70,230 a,b | 4,627,455 |
| F5 Networks | 26,870 a | 3,497,399 |
| Google, Cl. A | 20,846 a | 12,381,899 |
| Informatica | 55,660 a | 2,450,710 |
| International Business Machines | 79,730 | 11,701,175 |
| NetApp | 73,240 a | 4,025,270 |
| Oracle | 351,610 | 11,005,393 |
| Paychex | 121,200 | 3,746,292 |
| QUALCOMM | 177,640 | 8,791,404 |
| Salesforce.com | 21,100 a | 2,785,200 |
| Teradata | 97,520 a | 4,013,923 |
| Trimble Navigation | 98,560 a | 3,935,501 |
| VMware, Cl. A | 38,720 a | 3,442,595 |
| | | 108,910,402 |
| Materials—5.1% | | |
| Air Products & Chemicals | 51,750 | 4,706,662 |
| Crown Holdings | 79,070 a | 2,639,357 |
| Freeport-McMoRan Copper & Gold | 57,970 | 6,961,617 |
| Mosaic | 56,990 | 4,351,756 |
| | | 18,659,392 |
| Total Common Stocks | | |
| (cost $274,929,935) | | 363,324,693 |
| |
| Other Investment—.5% | | |
| Registered Investment Company; | | |
| Dreyfus Institutional Preferred | | |
| Plus Money Market Fund | | |
| (cost $1,931,000) | 1,931,000 c | 1,931,000 |
STATEMENT OF INVESTMENTS (continued)
| | |
| Investment of Cash Collateral | | |
| for Securities Loaned—3.4% | Shares | Value ($) |
| Registered Investment Company; | | |
| Dreyfus Institutional Cash Advantage Fund | | |
| (cost $12,254,495) | 12,254,495 c | 12,254,495 |
| Total Investments (cost $289,115,430) | 103.4% | 377,510,188 |
| Liabilities, Less Cash and Receivables | (3.4%) | (12,393,087) |
| Net Assets | 100.0% | 365,117,101 |
|
| ADR—American Depository Receipts |
| a Non-income producing security. |
| b Security, or portion thereof, on loan.At December 31, 2010, the market value of the fund’s securities on loan was |
| $11,911,046 and the market value of the collateral held by the fund was $12,254,495. |
| c Investment in affiliated money market mutual fund. |
| | | |
| Portfolio Summary (Unaudited)† | | |
| |
| | Value (%) | | Value (%) |
| Information Technology | 29.8 | Consumer Staples | 9.6 |
| Consumer Discretionary | 17.8 | Materials | 5.1 |
| Industrial | 12.3 | Money Market Investments | 3.9 |
| Energy | 11.2 | Financial | 3.3 |
| Health Care | 10.4 | | 103.4 |
| |
| † Based on net assets. | | | |
| See notes to financial statements. | | | |
12
|
| STATEMENT OF ASSETS AND LIABILITIES |
| December 31, 2010 |
| | | | | |
| | | | | Cost | Value |
| Assets ($): | | | | | |
| Investments in securities—See Statement of Investments (including | | |
| securities on loan, valued at $11,911,046)—Note 1(b): | | | |
| Unaffiliated issuers | | | | 274,929,935 | 363,324,693 |
| Affiliated issuers | | | | 14,185,495 | 14,185,495 |
| Cash | | | | | 67,873 |
| Receivable for investment securities sold | | | | 2,321,350 |
| Dividends and interest receivable | | | | 330,483 |
| Receivable for shares of Common Stock subscribed | | | 27,605 |
| Prepaid expenses | | | | | 43,710 |
| | | | | | 380,301,209 |
| Liabilities ($): | | | | | |
| Due to The Dreyfus Corporation and affiliates—Note 3(c) | | | 313,444 |
| Liability for securities on loan—Note 1(b) | | | | 12,254,495 |
| Payable for investment securities purchased | | | | 2,138,900 |
| Payable for shares of Common Stock redeemed | | | 156,202 |
| Accrued expenses | | | | | 321,067 |
| | | | | | 15,184,108 |
| Net Assets ($) | | | | | 365,117,101 |
| Composition of Net Assets ($): | | | | |
| Paid-in capital | | | | | 391,485,759 |
| Accumulated undistributed investment income—net | | | 938,433 |
| Accumulated net realized gain (loss) on investments | | | (115,701,849) |
| Accumulated net unrealized appreciation | | | | |
| (depreciation) on investments | | | | 88,394,758 |
| Net Assets ($) | | | | | 365,117,101 |
| |
| |
| Net Asset Value Per Share | | | | |
| | Class A | Class B | Class C | Class F | Class I |
| Net Assets ($) | 197,752,344 | 207,197 | 3,268,234 | 161,110,008 | 2,779,318 |
| Shares Outstanding | 33,416,278 | 37,848 | 598,152 | 26,569,768 | 462,555 |
| Net Asset Value | | | | | |
| Per Share ($) | 5.92 | 5.47 | 5.46 | 6.06 | 6.01 |
| |
| See notes to financial statements. | | | | |
|
| STATEMENT OF OPERATIONS |
| Year Ended December 31, 2010 |
| |
| Investment Income ($): | |
| Income: | |
| Cash dividends: | |
| Unaffiliated issuers | 4,841,441 |
| Affiliated issuers | 7,895 |
| Income from securities lending—Note 1(b) | 5,349 |
| Total Income | 4,854,685 |
| Expenses: | |
| Investment advisory fee—Note 3(a) | 2,086,038 |
| Shareholder servicing costs—Note 3(c) | 987,200 |
| Accounting fees—Note 3(c) | 196,039 |
| Prospectus and shareholders’ reports | 147,500 |
| Registration fees | 79,020 |
| Professional fees | 75,551 |
| Directors’ fees and expenses—Note 3(d) | 72,426 |
| Distribution fees—Note 3(b) | 60,878 |
| Custodian fees—Note 3(c) | 7,862 |
| Loan commitment fees—Note 2 | 1,088 |
| Interest expense—Note 2 | 153 |
| Miscellaneous | 52,319 |
| Total Expenses | 3,766,074 |
| Less—reduction in fees due to earnings credits—Note 3(c) | (2,338) |
| Net Expenses | 3,763,736 |
| Investment Income—Net | 1,090,949 |
| Realized and Unrealized Gain (Loss) on Investments—Note 4 ($): | |
| Net realized gain (loss) on investments | 36,383,515 |
| Net unrealized appreciation (depreciation) on investments | 32,362,020 |
| Net Realized and Unrealized Gain (Loss) on Investments | 68,745,535 |
| Net Increase in Net Assets Resulting from Operations | 69,836,484 |
| |
| See notes to financial statements. | |
14
STATEMENT OF CHANGES IN NET ASSETS
| | |
| | Year Ended December 31, |
| | 2010 | 2009a |
| Operations ($): | | |
| Investment income—net | 1,090,949 | 771,255 |
| Net realized gain (loss) on investments | 36,383,515 | (49,298,470) |
| Net unrealized appreciation | | |
| (depreciation) on investments | 32,362,020 | 137,374,652 |
| Net Increase (Decrease) in Net Assets | | |
| Resulting from Operations | 69,836,484 | 88,847,437 |
| Dividends to Shareholders from ($): | | |
| Investment income—net: | | |
| Class A Shares | — | (110,755) |
| Class F Shares | (326,267) | (680,875) |
| Class I Shares | (10,023) | (12,613) |
| Total Dividends | (336,290) | (804,243) |
| Capital Stock Transactions ($): | | |
| Net proceeds from shares sold: | | |
| Class A Shares | 9,431,354 | 7,601,144 |
| Class B Shares | — | 1,834 |
| Class C Shares | 356,450 | 315,444 |
| Class F Shares | 1,487,303 | 1,779,617 |
| Class I Shares | 1,195,994 | 640,328 |
| Class T Shares | — | 2,500 |
| Dividends reinvested: | | |
| Class A Shares | — | 105,531 |
| Class F Shares | 286,882 | 601,276 |
| Class I Shares | 9,417 | 11,530 |
| Cost of shares redeemed: | | |
| Class A Shares | (26,933,190) | (34,966,953) |
| Class B Shares | (151,724) | (281,302) |
| Class C Shares | (765,689) | (966,649) |
| Class F Shares | (14,062,935) | (19,895,195) |
| Class I Shares | (961,287) | (352,939) |
| Class T Shares | — | (45,740) |
| Increase (Decrease) in Net Assets | | |
| from Capital Stock Transactions | (30,107,425) | (45,449,574) |
| Total Increase (Decrease) in Net Assets | 39,392,769 | 42,593,620 |
| Net Assets ($): | | |
| Beginning of Period | 325,724,332 | 283,130,712 |
| End of Period | 365,117,101 | 325,724,332 |
| Undistributed investment income—net | 938,433 | 183,774 |
STATEMENT OF CHANGES IN NET ASSETS (continued)
| | |
| | Year Ended December 31, |
| | 2010 | 2009a |
| Capital Share Transactions: | | |
| Class Ab,c | | |
| Shares sold | 1,869,621 | 1,987,119 |
| Shares issued for dividends reinvested | — | 21,759 |
| Shares redeemed | (5,283,453) | (8,533,785) |
| Net Increase (Decrease) in Shares Outstanding | (3,413,832) | (6,524,907) |
| Class Bb | | |
| Shares sold | — | 451 |
| Shares redeemed | (33,059) | (79,207) |
| Net Increase (Decrease) in Shares Outstanding | (33,059) | (78,756) |
| Class C | | |
| Shares sold | 72,089 | 95,045 |
| Shares redeemed | (163,693) | (249,847) |
| Net Increase (Decrease) in Shares Outstanding | (91,604) | (154,802) |
| Class F | | |
| Shares sold | 277,934 | 443,473 |
| Shares issued for dividends reinvested | 51,986 | 138,897 |
| Shares redeemed | (2,694,314) | (4,659,408) |
| Net Increase (Decrease) in Shares Outstanding | (2,364,394) | (4,077,038) |
| Class I | | |
| Shares sold | 228,505 | 149,599 |
| Shares issued for dividends reinvested | 1,762 | 2,701 |
| Shares redeemed | (196,734) | (94,856) |
| Net Increase (Decrease) in Shares Outstanding | 33,533 | 57,444 |
| Class Tc | | |
| Shares sold | — | 799 |
| Shares redeemed | — | (14,253) |
| Net Increase (Decrease) in Shares Outstanding | — | (13,454) |
| |
| a | Effective as of the close of business on February 4, 2009, the fund no longer offers Class T shares. |
| b | During the period ended December 31, 2010, 16,432 Class B shares representing $75,219 were automatically |
| | converted to 15,380 Class A shares and during the period ended December 31, 2009, 25,581 Class B shares |
| | representing $95,932 were automatically converted to 24,116 Class A shares. |
| c | On the close of business on February 4, 2009, 13,911 Class T shares representing $44,654 were converted to |
| | 12,943 Class A shares. |
| See notes to financial statements. |
16
FINANCIAL HIGHLIGHTS
The following tables describe the performance for each share class for the fiscal periods indicated.All information (except portfolio turnover rate) reflects financial results for a single fund share.Total return shows how much your investment in the fund would have increased (or decreased) during each period, assuming you had reinvested all dividends and distributions.These figures have been derived from the fund’s financial statements.
| | | | | |
| | | Year Ended December 31, | |
| Class A Shares | 2010 | 2009† | 2008 | 2007 | 2006 |
| Per Share Data ($): | | | | | |
| Net asset value, beginning of period | 4.82 | 3.60 | 6.15 | 5.72 | 5.07 |
| Investment Operations: | | | | | |
| Investment income—neta | .01 | .01 | .01 | .01 | .00b |
| Net realized and unrealized | | | | | |
| gain (loss) on investments | 1.09 | 1.21 | (2.55) | .44 | .66 |
| Total from Investment Operations | 1.10 | 1.22 | (2.54) | .45 | .66 |
| Distributions: | | | | | |
| Dividends from investment income—net | — | (.00)b | (.01) | (.02) | (.01) |
| Net asset value, end of period | 5.92 | 4.82 | 3.60 | 6.15 | 5.72 |
| Total Return (%)c | 22.82 | 33.97 | (41.39) | 7.81 | 13.02 |
| Ratios/Supplemental Data (%): | | | | | |
| Ratio of total expenses | | | | | |
| to average net assets | 1.25 | 1.32 | 1.25 | 1.19 | 1.34 |
| Ratio of net expenses | | | | | |
| to average net assets | 1.25 | 1.31 | 1.23 | 1.19 | 1.34 |
| Ratio of net investment income | | | | | |
| to average net assets | .24 | .16 | .12 | .14 | .00d |
| Portfolio Turnover Rate | 97.93 | 162.04 | 112 | 68 | 110 |
| Net Assets, end of period ($ x 1,000) | 197,752 | 177,424 | 156,236 | 317,753 | 4,399 |
| |
| † | Effective September 1, 2009,The Dreyfus Corporation replaced Founders Asset Management LLC as the fund’s |
| | investment adviser. |
| a | Based on average shares outstanding at each month end. |
| b | Amount represents less than $.01 per share. |
| c | Exclusive of sales charge. |
| d | Amount represents less than .01%. |
| See notes to financial statements. |
FINANCIAL HIGHLIGHTS (continued)
| | | | | |
| | | Year Ended December 31, | |
| Class B Shares | 2010 | 2009† | 2008 | 2007 | 2006 |
| Per Share Data ($): | | | | | |
| Net asset value, beginning of period | 4.52 | 3.42 | 5.88 | 5.51 | 4.91 |
| Investment Operations: | | | | | |
| Investment (loss)—neta | (.06) | (.04) | (.04) | (.04) | (.05) |
| Net realized and unrealized | | | | | |
| gain (loss) on investments | 1.01 | 1.14 | (2.42) | .41 | .65 |
| Total from Investment Operations | .95 | 1.10 | (2.46) | .37 | .60 |
| Net asset value, end of period | 5.47 | 4.52 | 3.42 | 5.88 | 5.51 |
| Total Return (%)b | 21.02 | 32.16 | (41.84) | 6.72 | 12.22 |
| Ratios/Supplemental Data (%): | | | | | |
| Ratio of total expenses | | | | | |
| to average net assets | 2.72 | 2.50 | 2.12 | 2.24 | 2.21 |
| Ratio of net expenses | | | | | |
| to average net assets | 2.72 | 2.48 | 2.10 | 2.24 | 2.21 |
| Ratio of net investment (loss) | | | | | |
| to average net assets | (1.29) | (.97) | (.78) | (.76) | (.93) |
| Portfolio Turnover Rate | 97.93 | 162.04 | 112 | 68 | 110 |
| Net Assets, end of period ($ x 1,000) | 207 | 321 | 512 | 1,855 | 1,046 |
| |
| † | Effective September 1, 2009,The Dreyfus Corporation replaced Founders Asset Management LLC as the fund’s |
| | investment adviser. |
| a | Based on average shares outstanding at each month end. |
| b | Exclusive of sales charge. |
| See notes to financial statements. |
18
| | | | | |
| | | Year Ended December 31, | |
| Class C Shares | 2010 | 2009† | 2008 | 2007 | 2006 |
| Per Share Data ($): | | | | | |
| Net asset value, beginning of period | 4.48 | 3.38 | 5.80 | 5.41 | 4.82 |
| Investment Operations: | | | | | |
| Investment (loss)—neta | (.03) | (.02) | (.03) | (.03) | (.03) |
| Net realized and unrealized | | | | | |
| gain (loss) on investments | 1.01 | 1.12 | (2.39) | .42 | .62 |
| Total from Investment Operations | .98 | 1.10 | (2.42) | .39 | .59 |
| Net asset value, end of period | 5.46 | 4.48 | 3.38 | 5.80 | 5.41 |
| Total Return (%)b | 21.88 | 32.54 | (41.72) | 7.21 | 12.24 |
| Ratios/Supplemental Data (%): | | | | | |
| Ratio of total expenses | | | | | |
| to average net assets | 2.05 | 2.12 | 1.99 | 1.97 | 2.01 |
| Ratio of net expenses | | | | | |
| to average net assets | 2.05 | 2.10 | 1.97 | 1.97 | 2.01 |
| Ratio of net investment (loss) | | | | | |
| to average net assets | (.58) | (.63) | (.64) | (.45) | (.69) |
| Portfolio Turnover Rate | 97.93 | 162.04 | 112 | 68 | 110 |
| Net Assets, end of period ($ x 1,000) | 3,268 | 3,092 | 2,853 | 8,628 | 3,759 |
| |
| † | Effective September 1, 2009,The Dreyfus Corporation replaced Founders Asset Management LLC as the fund’s |
| | investment adviser. |
| a | Based on average shares outstanding at each month end. |
| b | Exclusive of sales charge. |
| See notes to financial statements. |
FINANCIAL HIGHLIGHTS (continued)
| | | | | |
| | | Year Ended December 31, | |
| Class F Shares | 2010 | 2009† | 2008 | 2007 | 2006 |
| Per Share Data ($): | | | | | |
| Net asset value, beginning of period | 4.93 | 3.70 | 6.32 | 5.86 | 5.18 |
| Investment Operations: | | | | | |
| Investment income—neta | .02 | .02 | .02 | .03 | .01 |
| Net realized and unrealized | | | | | |
| gain (loss) on investments | 1.12 | 1.23 | (2.62) | .45 | .68 |
| Total from Investment Operations | 1.14 | 1.25 | (2.60) | .48 | .69 |
| Distributions: | | | | | |
| Dividends from investment income—net | (.01) | (.02) | (.02) | (.02) | (.01) |
| Net asset value, end of period | 6.06 | 4.93 | 3.70 | 6.32 | 5.86 |
| Total Return (%) | 23.18 | 33.94 | (41.13) | 8.14 | 13.25 |
| Ratios/Supplemental Data (%): | | | | | |
| Ratio of total expenses | | | | | |
| to average net assets | 1.01 | 1.08 | .96 | 1.04 | 1.10 |
| Ratio of net expenses | | | | | |
| to average net assets | 1.01 | 1.06 | .94 | 1.04 | 1.10 |
| Ratio of net investment income | | | | | |
| to average net assets | .46 | .41 | .41 | .54 | .20 |
| Portfolio Turnover Rate | 97.93 | 162.04 | 112 | 68 | 110 |
| Net Assets, end of period ($ x 1,000) | 161,110 | 142,787 | 122,119 | 231,030 | 220,502 |
| |
| † | Effective September 1, 2009,The Dreyfus Corporation replaced Founders Asset Management LLC as the fund’s |
| | investment adviser. |
| a | Based on average shares outstanding at each month end. |
| See notes to financial statements. |
20
| | | | | |
| | | Year Ended December 31, | |
| Class I Shares | 2010 | 2009† | 2008 | 2007a | 2006 |
| Per Share Data ($): | | | | | |
| Net asset value, beginning of period | 4.90 | 3.67 | 6.28 | 5.82 | 5.13 |
| Investment Operations: | | | | | |
| Investment income—netb | .02 | .02 | .03 | .03 | .01 |
| Net realized and unrealized | | | | | |
| gain (loss) on investments | 1.11 | 1.24 | (2.62) | .45 | .69 |
| Total from Investment Operations | 1.13 | 1.26 | (2.59) | .48 | .70 |
| Distributions: | | | | | |
| Dividends from investment income—net | (.02) | (.03) | (.02) | (.02) | (.01) |
| Net asset value, end of period | 6.01 | 4.90 | 3.67 | 6.28 | 5.82 |
| Total Return (%) | 23.09 | 34.54 | (41.08) | 8.09 | 13.55 |
| Ratios/Supplemental Data (%): | | | | | |
| Ratio of total expenses | | | | | |
| to average net assets | 1.00 | .96 | .89 | 1.09 | 1.04 |
| Ratio of net expenses | | | | | |
| to average net assets | 1.00 | .94 | .81 | .96 | 1.04 |
| Ratio of net investment income | | | | | |
| to average net assets | .47 | .53 | .54 | .48 | .21 |
| Portfolio Turnover Rate | 97.93 | 162.04 | 112 | 68 | 110 |
| Net Assets, end of period ($ x 1,000) | 2,779 | 2,101 | 1,365 | 3,434 | 97 |
| |
| † | Effective September 1, 2009,The Dreyfus Corporation replaced Founders Asset Management LLC as the fund’s |
| | investment adviser. |
| a | Effective June 1, 2007, Class R shares were redesignated as Class I shares. |
| b | Based on average shares outstanding at each month end. |
| See notes to financial statements. |
NOTES TO FINANCIAL STATEMENTS
NOTE 1—Significant Accounting Policies:
Dreyfus Equity Growth Fund (the “fund”) is a separate diversified series of Dreyfus Funds, Inc. (the “Company”), which is registered under the Investment Company Act of 1940, as amended (the “Act”), as an open-end management investment company and operates as a series company currently offering two series, including the fund.The fund’s investment objective is to seek long-term growth of capital and income. The Dreyfus Corporation (the “Manager” or “Dreyfus”), a wholly-owned subsidiary of The Bank of New York Mellon Corporation (“BNY Mellon”), serves as the fund’s investment adviser.
MBSC Securities Corporation (the “Distributor”), a wholly-owned subsidiary of the Manager, is the distributor of the fund’s shares.The fund is authorized to issue 2.15 billion shares of $.001 par value Common Stock.The fund currently offers five classes of shares: Class A (1 billion shares authorized), Class B (50 million shares authorized), Class C (250 million shares authorized), Class F (700 million shares authorized) and Class I (150 million shares authorized). Class A shares are subject to a sales charge imposed at the time of purchase. Class B shares are subject to a contingent deferred sales charge (“CDSC”) imposed on Class B share redemptions made within six years of purchase and automatically convert to Class A shares after six years.The fund no longer offers Class B shares, except in connection with dividend reinvestment and permitted exchanges of Class B shares. Class C sha res are subject to a CDSC imposed on Class C shares redeemed within one year of purchase. Class F and Class I shares are sold at net asset value per share. Class F shares are sold only to Class F grandfathered investors, and Class I shares are sold only to institutional investors. Other differences between the classes include the services offered to and the expenses borne by each class, the allocation of certain transfer agency costs and certain voting rights. Income, expenses (other than expenses attributable to a specific class), and realized and unrealized gains or losses on investments are allocated to each class of shares based on its relative net assets.
22
The Company accounts separately for the assets, liabilities and operations of each series. Expenses directly attributable to each series are charged to that series’ operations; expenses which are applicable to all series are allocated among them on a pro rata basis.
The Financial Accounting Standards Board (“FASB”) Accounting Standards Codification (“ASC”) is the exclusive reference of authoritative U.S. generally accepted accounting principles (“GAAP”) recognized by the FASB to be applied by nongovernmental entities. Rules and interpretive releases of the Securities and Exchange Commission (“SEC”) under authority of federal laws are also sources of authoritative GAAP for SEC registrants. The fund’s financial statements are prepared in accordance with GAAP, which may require the use of management estimates and assumptions.Actual results could differ from those estimates.
(a) Portfolio valuation: Investments in securities are valued at the last sales price on the securities exchange or national securities market on which such securities are primarily traded. Securities listed on the National Market System for which market quotations are available are valued at the official closing price or, if there is no official closing price that day, at the last sales price. Securities not listed on an exchange or the national securities market, or securities for which there were no transactions, are valued at the average of the most recent bid and asked prices, except for open short positions, where the asked price is used for valuation purposes. Bid price is used when no asked price is available. Registered investment companies that are not traded on an exchange are valued at their net asset value.When market quotations or official closing prices are not readily available, or are determined not to reflect accurately fair value, such as when the value of a security has been significantly affected by events after the close of the exchange or market on which the security is principally traded (for example, a foreign exchange or market), but before the fund calculates its net asset value, the fund may value these investments at fair value as determined in accordance with the procedures approved by the Board of Directors.
NOTES TO FINANCIAL STATEMENTS (continued)
Fair valuing of securities may be determined with the assistance of a pricing service using calculations based on indices of domestic securities and other appropriate indicators, such as prices of relevant ADRs and futures contracts. For other securities that are fair valued by the Board of Directors, certain factors may be considered such as: fundamental analytical data, the nature and duration of restrictions on disposition, an evaluation of the forces that influence the market in which the securities are purchased and sold, and public trading in similar securities of the issuer or comparable issuers.
The fair value of a financial instrument is the amount that would be received to sell an asset or paid to transfer a liability in an orderly transaction between market participants at the measurement date (i.e. the exit price). GAAP establishes a fair value hierarchy that prioritizes the inputs of valuation techniques used to measure fair value.This hierarchy gives the highest priority to unadjusted quoted prices in active markets for identical assets or liabilities (Level 1 measurements) and the lowest priority to unobservable inputs (Level 3 measurements).
Additionally, GAAP provides guidance on determining whether the volume and activity in a market has decreased significantly and whether such a decrease in activity results in transactions that are not orderly. GAAP requires enhanced disclosures around valuation inputs and techniques used during annual and interim periods.
Various inputs are used in determining the value of the fund’s investments relating to fair value measurements.These inputs are summarized in the three broad levels listed below:
Level 1—unadjusted quoted prices in active markets for identical investments.
Level 2—other significant observable inputs (including quoted prices for similar investments, interest rates, prepayment speeds, credit risk, etc.).
Level 3—significant unobservable inputs (including the fund’s own assumptions in determining the fair value of investments).
The inputs or methodology used for valuing securities are not necessarily an indication of the risk associated with investing in those securities.
24
The following is a summary of the inputs used as of December 31, 2010 in valuing the fund’s investments:
| | | | |
| | | Level 2—Other | Level 3— | |
| | Level 1— | Significant | Significant | |
| | Unadjusted | Observable | Unobservable | |
| | Quoted Prices | Inputs | Inputs | Total |
| Assets ($) | | | | |
| Investments in Securities: | | | |
| Equity Securities— | | | | |
| Domestic† | 358,177,068 | — | — | 358,177,068 |
| Equity Securities— | | | | |
| Foreign† | 5,147,625 | — | — | 5,147,625 |
| Mutual Funds | 14,185,495 | — | — | 14,185,495 |
| + See Statement of Investments for additional detailed categorizations. | |
In January 2010, FASB issued Accounting Standards Update (“ASU”) No. 2010-06 “Improving Disclosures about FairValue Measurements”. The portions of ASU No. 2010-06 which require reporting entities to prepare new disclosures surrounding amounts and reasons for significant transfers in and out of Level 1 and Level 2 fair value measurements as well as inputs and valuation techniques used to measure fair value for both recurring and nonrecurring fair value measurements that fall in either Level 2 or Level 3 have been adopted by the fund. No significant transfers between Level 1 or Level 2 fair value measurements occurred at December 31, 2010. The remaining portion of ASU No. 2010-06 requires reporting entities to make new disclosures about information on purchases, sales, issuances and settlements on a gross basis in the reconciliation of activity in Level 3 fair value measurements. These new an d revised disclosures are required to be implemented for fiscal years beginning after December 15, 2010. Management is currently evaluating the impact that the adoption of this remaining portion of ASU No. 2010-06 may have on the fund’s financial statement disclosures.
(b) Securities transactions and investment income: Securities transactions are recorded on a trade date basis. Realized gains and losses from securities transactions are recorded on the identified cost basis. Dividend income is recognized on the ex-dividend date and interest income, including, where applicable, accretion of discount and amortization of premium on investments, is recognized on the accrual basis.
NOTES TO FINANCIAL STATEMENTS (continued)
Pursuant to a securities lending agreement with The Bank of New York Mellon, a subsidiary of BNY Mellon and an affiliate of Dreyfus, the fund may lend securities to qualified institutions. It is the fund’s policy that, at origination, all loans are secured by collateral of at least 102% of the value of U.S. securities loaned and 105% of the value of foreign securities loaned. Collateral equivalent to at least 100% of the market value of securities on loan is maintained at all times. Collateral is either in the form of cash, which can be invested in certain money market mutual funds managed by the Manager, U.S. Government and Agency securities or letters of credit.The fund is entitled to receive all income on securities loaned, in addition to income earned as a result of the lending transaction. Although each security loaned is fully collateralized, the fund bears the risk of delay in recovery of, or loss of rights in, the securities loaned should a borrower fail to return the securities in a timely manner. During the period ended December 31, 2010, The Bank of New York Mellon earned $2,292 from lending portfolio securities, pursuant to the securities lending agreement.
(c) Affiliated issuers: Investments in other investment companies advised by Dreyfus are defined as “affiliated” in the Act.
The fund may invest in shares of certain affiliated investment companies also advised or managed by Dreyfus. Investments in affiliated investment companies for the period ended December 31, 2010 were as follows:
| | | | | |
| Affiliated | | | | | |
| Investment | Value | | | Value | Net |
| Company | 12/31/2009 ($) | Purchases ($) | Sales ($) | 12/31/2010 ($) Assets (%) |
| Dreyfus | | | | | |
| Institutional | | | | | |
| Preferred | | | | | |
| Plus Money | | | | | |
| Market Fund | 2,734,000 | 78,284,000 | 79,087,000 | 1,931,000 | .5 |
| Dreyfus | | | | | |
| Institutional | | | | | |
| Cash | | | | | |
| Advantage | | | | | |
| Fund | 8,250,076 | 109,258,132 | 105,253,713 | 12,254,495 | 3.4 |
| Total | 10,984,076 | 187,542,132 184,340,713 | 14,185,495 | 3.9 |
26
(d) Dividends to shareholders: Dividends are recorded on the ex-dividend date. Dividends from investment income-net and dividends from net realized capital gains, if any, are normally declared and paid annually, but the fund may make distributions on a more frequent basis to comply with the distribution requirements of the Internal Revenue Code of 1986, as amended (the “Code”).To the extent that net realized capital gains can be offset by capital loss carryovers, it is the policy of the fund not to distribute such gains. Income and capital gain distributions are determined in accordance with income tax regulations, which may differ from GAAP.
(e) Federal income taxes: It is the policy of the fund to continue to qualify as a regulated investment company, if such qualification is in the best interests of its shareholders, by complying with the applicable provisions of the Code, and to make distributions of taxable income sufficient to relieve it from substantially all federal income and excise taxes.
As of and during the period ended December 31, 2010, the fund did not have any liabilities for any uncertain tax positions.The fund recognizes interest and penalties, if any, related to uncertain tax positions as income tax expense in the Statement of Operations. During the period, the fund did not incur any interest or penalties.
Each of the tax years in the four-year period ended December 31, 2010 remains subject to examination by the Internal Revenue Service and state taxing authorities.
At December 31, 2010, the components of accumulated earnings on a tax basis were as follows: undistributed ordinary income $938,433, accumulated capital losses $115,608,515 and unrealized appreciation $88,301,424.
The accumulated capital loss carryover is available for federal income tax purposes to be applied against future net securities profits, if any, realized subsequent to December 31, 2010. If not applied, $37,347,074 of the carryover expires in fiscal 2016 and $78,261,441 expires in fiscal 2017.
NOTES TO FINANCIAL STATEMENTS (continued)
Under the recently enacted Regulated Investment Company Modernization Act of 2010, the fund will be permitted to carry forward capital losses incurred in taxable years beginning after December 22, 2010 for an unlimited period. However, any losses incurred during those future taxable years will be required to be utilized prior to the losses incurred in pre-enactment taxable years. As a result of this ordering rule, pre-enactment capital loss carryovers may be more likely to expire unused.
The tax character of distributions paid to shareholders during the fiscal periods ended December 31, 2010 and December 31, 2009 were as follows: ordinary income $336,290 and $804,243, respectively.
During the period ended December 31, 2010, as a result of permanent book to tax differences, primarily due to the tax treatment for a capital loss carryover expiration, the fund increased accumulated net realized gain (loss) on investments by $19,179,218 and decreased paid-in capital by the same amount. Net assets and net asset value per share were not affected by this reclassification.
NOTE 2—Bank Lines of Credit:
The fund participates with other Dreyfus-managed funds in a $225 million unsecured credit facility led by Citibank, N.A. and a $300 million unsecured credit facility provided by The Bank of New York Mellon (each, a “Facility”), each to be utilized primarily for temporary or emergency purposes, including the financing of redemptions. In connection therewith, the fund has agreed to pay its pro rata portion of commitment fees for each Facility. Interest is charged to the fund based on rates determined pursuant to the terms of the respective Facility at the time of borrowing.
The average amount of borrowings outstanding under the Facilities during the period ended December 31, 2010, was approximately $11,000 with a related weighted average annualized interest rate of 1.40%.
28
NOTE 3—Investment Advisory Fee and Other Transactions With Affiliates:
(a) Pursuant to an investment advisory agreement with the Manager, the investment advisory fee is based on the value of the fund’s average daily net assets and is computed at the following annual rates: .65% of the first $250 million, .60% of the next $250 million, .55% of the next $250 million; and .50% in excess of $750 million.The fee is payable monthly.
During the period ended December 31, 2010, the Distributor retained $2,417 from commissions earned on sales of the fund’s Class A shares and $802 and $293 from CDSCs on redemptions of the fund’s Class B and Class C shares, respectively.
(b) Under a Distribution Plan (the “Class B and C Plan”) adopted pursuant to Rule 12b-1 under the Act, Class B and Class C shares pay the Distributor for distributing their shares at an annual rate of .75% of the value of the average daily net assets of Class B and Class C shares. During the period ended December 31, 2010, Class B and Class C shares were charged $1,581 and $22,417, respectively, pursuant to the Class B and C Plan.
The fund also adopted a Distribution Plan pursuant to Rule 12b-1 under the Act applicable to its Class F shares (the “Class F Plan”). Under the Class F Plan, the fund is authorized to reimburse the Distributor for expenses paid for distributing or servicing its Class F shares at an annual rate of up to .25% of the value of the average daily net assets of the fund’s Class F shares.The Distributor has agreed not to seek reimbursement of any expenses under the Class F Plan other than reimbursements for payments made to brokers and other intermediaries whose customers hold Class F shares (“Third Party Payments”).This commitment applies to any such expenses (other than Third Party Payments).This commitment will continue indefinitely and will not terminate without the prior approval
NOTES TO FINANCIAL STATEMENTS (continued)
of the fund’s Board of Directors. During the period ended December 31, 2010, Class F shares were charged $36,880 pursuant to the Class F Plan.
(c) Under the Shareholder Services Plan, Class A, Class B and Class C shares pay the Distributor at an annual rate of .25% of the value of their average daily net assets for the provision of certain services.The services provided may include personal services relating to shareholder accounts, such as answering shareholder inquiries regarding Class A, Class B and Class C shares and providing reports and other information, and services related to the maintenance of shareholder accounts. The Distributor may make payments to Service Agents (a securities dealer, financial institution or other industry professional) in respect of these services.The Distributor determines the amounts to be paid to Service Agents. During the period ended December 31, 2010, Class A, Class B and Class C shares were charged $442,533, $527 and $7,472, r espectively, pursuant to the Shareholder Services Plan.
The Company has a shareholder services agreement with the Distributor, whereby the fund agrees to compensate the Distributor for providing certain shareholder servicing functions to holders of Class F shares. On an annual basis, the fund pays the Distributor a monthly fee of $24.00 per Class F shareholder account considered to be an open account at any time during a given month. During the period ended December 31, 2010, Class F shares were charged $157,033 pursuant to the shareholder services agreement.
Under its terms, the Class B and C Plan, Class F Plan and Shareholder Services Plan shall remain in effect from year to year, provided such continuance is approved annually by a vote of a majority of those Directors who are not “interested persons” of the Company and who have no direct or indirect financial interest in the operation of or in any agreement related to the Class B and C Plan, F Plan or Shareholder Services Plan.
The fund compensates Dreyfus Transfer, Inc., a wholly-owned subsidiary of the Manager, under a transfer agency agreement for providing personnel and facilities to perform transfer agency services for the
30
fund. During the period ended December 31, 2010, the fund was charged $149,947 pursuant to the transfer agency agreement, which is included in Shareholder servicing costs in the Statement of Operations.
The fund has arrangements with the custodian and cash management bank whereby the fund may receive earnings credits when positive cash balances are maintained, which are used to offset custody and cash management fees. For financial reporting purposes, the fund includes net earnings credits as an expense offset in the Statement of Operations.
The fund compensates The Bank of New York Mellon under cash management agreements for performing cash management services related to fund subscriptions and redemptions. During the period ended December 31, 2010, the fund was charged $45,193 pursuant to the cash management agreements, which is included in Shareholder servicing costs in the Statement of Operations. These fees were partially offset by earnings credits of $2,338.
The fund also compensates The Bank of New York Mellon under a custody agreement for providing custodial services for the fund. During the period ended December 31, 2010, the fund was charged $7,862 pursuant to the custody agreement.
The fund has agreed to compensate the Manager for providing accounting services, administration, compliance monitoring, regulatory and shareholder reporting, as well as related facilities, equipment and clerical help.The fee is based on the fund’s average daily net assets and computed at the following annual rates: .06% of the first $500 million, .04% of the next $500 million and .02% in excess of $1 billion, plus reasonable out-of-pocket expenses.The Manager has contractually agreed in writing to waive any fees received for these services to the extent they exceed its costs in providing the services and a reasonable allocation of the costs incurred by the Manager and its affiliates related to the support and oversight of these services.
During the period ended December 31, 2010, the fund was charged $6,243 for services performed by the Chief Compliance Officer.
NOTES TO FINANCIAL STATEMENTS (continued)
The components of “Due to The Dreyfus Corporation and affiliates” in the Statement of Assets and Liabilities consist of: investment advisory fees $196,122, Rule 12b-1 distribution plan fees $5,991, shareholder services plan fees $66,663, custodian fees $2,100, chief compliance officer fees $1,728, accounting fees $16,540 and transfer agency per account fees $24,300.
(d) Effective January 1, 2010, each Director who is not an “interested person” of the Company (as defined in the Act) received $60,000 per annum, plus $7,000 per joint Board meeting of the Company, The Dreyfus/Laurel Funds, Inc., The Dreyfus/Laurel Funds Trust, The Dreyfus/Laurel Tax-Free Municipal Funds and Dreyfus Investment Funds (collectively, the “Board Group Open-End Funds”) attended, $2,500 for separate in-person committee meetings attended which are not held in conjunction with a regularly scheduled Board meeting and $2,000 for Board meetings and separate committee meetings attended that are conducted by telephone.The Board Group Open-End Funds also reimburse each Director who is not an “interested person” of the Company (as defined in the Act) for travel and out-of-pocket expenses .With respect to Board meetings, the Chairman of the Board receives an additional 25% of such compensation (with the exception of reimbursable amounts). Effective January 1, 2010, the Chair of each of the Board’s committees, unless the Chair also serves as Chair of the Board, receives $1,350 per applicable committee meeting. In the event that there is an in-person joint committee meeting or a joint telephone meeting of the Board Group Open-End Funds and Dreyfus High Yield Strategies Fund, the $2,500 or $2,000 fee, as applicable, is allocated between the Board Group Open-End Funds and Dreyfus High Yield Strategies Fund.These fees and expenses are charged and allocated to each series based on net assets.
NOTE 4—Securities Transactions:
The aggregate amount of purchases and sales of investment securities, excluding short-term securities, during the period ended December 31, 2010, amounted to $314,154,152 and $342,577,895, respectively.
32
The provisions of ASC Topic 815 “Derivatives and Hedging” require qualitative disclosures about objectives and strategies for using derivatives, quantitative disclosures about fair value amounts of gains and losses on derivative instruments and disclosures about credit-risk-related contingent features in derivative agreements.The fund held no derivatives during the period ended December 31, 2010.
At December 31, 2010, the cost of investments for federal income tax purposes was $289,208,764; accordingly, accumulated net unrealized appreciation on investments was $88,301,424, consisting of $89,011,216 gross unrealized appreciation and $709,792 gross unrealized depreciation.
NOTE 5—Change in Independent Registered Public Accounting Firm:
Ernst &Young LLP (“E&Y”), an independent registered public accounting firm, was the independent registered public accounting firm for the fund for the fiscal years ended December 31, 2009 and 2008. At the meeting held on February 9, 2010, the Audit Committee and the Board of Directors of the Company engaged KPMG LLP to replace E&Y as the independent registered public accounting firm for the Company.
During the fund’s two fiscal years ended December 31, 2009 and 2008: (i) no report on the fund’s financial statements contained an adverse opinion or a disclaimer of opinion, or was qualified or modified as to uncertainty, audit scope, or accounting principles; and (ii) there were no “disagreements” (as such term is used in Item 304 of Regulation S-K) with E&Y on any matter of accounting principles or practices, financial statement disclosure, or auditing scope or procedure, which disagree-ment(s), if not resolved to the satisfaction of E&Y, would have caused it to make reference to the subject matter of the disagreement(s) in connection with its report.
|
| REPORT OF INDEPENDENT REGISTERED |
| PUBLIC ACCOUNTING FIRM |
The Board of Directors and Shareholders of Dreyfus Funds Inc.
We have audited the accompanying statement of assets and liabilities of Dreyfus Equity Growth Fund (the “Fund”), a series of Dreyfus Funds Inc., including the statements of investments as of December 31, 2010, and the related statement of operations, the statement of changes in net assets and financial highlights for the year then ended. These financial statements and financial highlights are the responsibility of the Fund’s management. Our responsibility is to express an opinion on these financial statements and financial highlights based on our audit.The statement of changes in net assets for the year ended December 31, 2009 and the financial highlights for each of the years in the four-year period ended December 31, 2009 were audited by other independent registered public accountants whose report thereon, dated February 25, 2010, expressed an unqualified opinion on that statement of changes in net assets and those financial highlights.
We conducted our audit in accordance with the standards of the Public Company Accounting Oversight Board (United States).Those standards require that we plan and perform the audit to obtain reasonable assurance about whether the financial statements and financial highlights are free of material misstatement.An audit includes examining, on a test basis, evidence supporting the amounts and disclosures in the financial statements. Our procedures included confirmation of securities owned as of December 31, 2010, by correspondence with the custodian and brokers or by other appropriate auditing procedures where replies from brokers were not received. An audit also includes assessing the accounting principles used and significant estimates made by management, as well as evaluating the overall financial statement presentation.We believe that our audit provides a reasonable basis for our opinion.
In our opinion, the financial statements and financial highlights referred to above present fairly, in all material respects, the financial position of Dreyfus Equity Growth Fund as of December 31, 2010, and the results of its operations, the changes in its net assets, and the financial highlights for the year then ended, in conformity with U.S. generally accepted accounting principles.

New York, New York
February 25, 2011
34
IMPORTANT TAX INFORMATION (Unaudited)
For federal tax purposes, the fund designates the maximum amount allowable, but not less than $336,290 as ordinary income dividends paid during the year ended December 31, 2010 as qualified dividend income in accordance with Section 854(b)(1)(B) of the Internal Revenue Code. Also, the fund designates the maximum amount allowable but not less than 100% of ordinary income dividends paid during the year ended December 31, 2010 as eligible for the corporate dividends received deduction provided under Section 243 of the Internal Revenue Code in accordance with Section 854(b)(1)(A) of the Internal Revenue Code. Shareholders will receive notification in early 2011 of the percentage applicable to the preparation of their 2010 income tax returns.
OFFICERS OF THE FUND (Unaudited)
BRADLEY J. SKAPYAK, President since January 2010.
Chief Operating Officer and a director of the Manager since June 2009. From April 2003 to June 2009, Mr. Skapyak was the head of the Investment Accounting and Support Department of the Manager. He is an officer of 76 investment companies (comprised of 169 portfolios) managed by the Manager. He is 52 years old and has been an employee of the Manager since February 1988.
PHILLIP N. MAISANO, Executive Vice President since September 2009.
Chief Investment Officer,Vice Chair and a director of the Manager, and an officer of 76 investment companies (comprised of 169 portfolios) managed by the Manager. Mr. Maisano also is an officer and/or Board member of certain other investment management subsidiaries of The Bank of New York Mellon Corporation, each of which is an affiliate of the Manager. He is 63 years old and has been an employee of the Manager since November 2006. Prior to joining the Manager, Mr. Maisano served as Chairman and Chief Executive Officer of EACM Advisors, an affiliate of the Manager, since August 2004.
MICHAEL A. ROSENBERG, Vice President and Secretary since September 2009.
Assistant General Counsel of BNY Mellon, and an officer of 77 investment companies (comprised of 194 portfolios) managed by the Manager. He is 50 years old and has been an employee of the Manager since October 1991.
KIESHA ASTWOOD, Vice President and Assistant Secretary since January 2010.
Counsel of BNY Mellon, and an officer of 77 investment companies (comprised of 194 portfolios) managed by the Manager. She is 37 years old and has been an employee of the Manager since July 1995.
JAMES BITETTO, Vice President and Assistant Secretary since September 2009.
Senior Counsel of BNY Mellon and Secretary of the Manager, and an officer of 77 investment companies (comprised of 194 portfolios) managed by the Manager. He is 44 years old and has been an employee of the Manager since December 1996.
JONI LACKS CHARATAN, Vice President and Assistant Secretary since September 2009.
Senior Counsel of BNY Mellon, and an officer of 77 investment companies (comprised of 194 portfolios) managed by the Manager. She is 55 years old and has been an employee of the Manager since October 1988.
JOSEPH M. CHIOFFI, Vice President and Assistant Secretary since September 2009.
Senior Counsel of BNY Mellon, and an officer of 77 investment companies (comprised of 194 portfolios) managed by the Manager. He is 49 years old and has been an employee of the Manager since June 2000.
KATHLEEN DENICHOLAS, Vice President and Assistant Secretary since January 2010.
Senior Counsel of BNY Mellon, and an officer of 77 investment companies (comprised of 194 portfolios) managed by the Manager. She is 36 years old and has been an employee of the Manager since February 2001.
JANETTE E. FARRAGHER, Vice President and Assistant Secretary since September 2009.
Assistant General Counsel of BNY Mellon, and an officer of 77 investment companies (comprised of 194 portfolios) managed by the Manager. She is 48 years old and has been an employee of the Manager since February 1984.
38
JOHN B. HAMMALIAN, Vice President and Assistant Secretary since September 2009.
Managing Counsel of BNY Mellon, and an officer of 77 investment companies (comprised of 194 portfolios) managed by the Manager. He is 47 years old and has been an employee of the Manager since February 1991.
M. CRISTINA MEISER, Vice President and Assistant Secretary since January 2010.
Senior Counsel of BNY Mellon, and an officer of 77 investment companies (comprised of 194 portfolios) managed by the Manager. She is 40 years old and has been an employee of the Manager since August 2001.
ROBERT R. MULLERY, Vice President and Assistant Secretary since September 2009.
Managing Counsel of BNY Mellon, and an officer of 77 investment companies (comprised of 194 portfolios) managed by the Manager. He is 58 years old and has been an employee of the Manager since May 1986.
JEFF PRUSNOFSKY, Vice President and Assistant Secretary since September 2009.
Managing Counsel of BNY Mellon, and an officer of 77 investment companies (comprised of 194 portfolios) managed by the Manager. He is 45 years old and has been an employee of the Manager since October 1990.
JAMES WINDELS, Treasurer since September 2009.
Director – Mutual Fund Accounting of the Manager, and an officer of 77 investment companies (comprised of 194 portfolios) managed by the Manager. He is 52 years old and has been an employee of the Manager since April 1985.
RICHARD CASSARO, Assistant Treasurer since September 2009.
Senior Accounting Manager – Money Market and Municipal Bond Funds of the Manager, and an officer of 77 investment companies (comprised of 194 portfolios) managed by the Manager. He is 51 years old and has been an employee of the Manager since September 1982.
GAVIN C. REILLY, Assistant Treasurer since September 2009.
Tax Manager of the Investment Accounting and Support Department of the Manager, and an officer of 77 investment companies (comprised of 194 portfolios) managed by the Manager. He is 42 years old and has been an employee of the Manager since April 1991.
ROBERT ROBOL, Assistant Treasurer since September 2006.
Senior Accounting Manager – Fixed Income Funds of the Manager, and an officer of 77 investment companies (comprised of 194 portfolios) managed by the Manager. He is 46 years old and has been an employee of the Manager since October 1988.
ROBERT SALVIOLO, Assistant Treasurer since May 2007.
Senior Accounting Manager – Equity Funds of the Manager, and an officer of 77 investment companies (comprised of 194 portfolios) managed by the Manager. He is 43 years old and has been an employee of the Manager since June 1989.
OFFICERS OF THE FUND (Unaudited) (continued)
ROBERT SVAGNA, Assistant Treasurer since September 2006.
Senior Accounting Manager – Equity Funds of the Manager, and an officer of 77 investment companies (comprised of 194 portfolios) managed by the Manager. He is 43 years old and has been an employee of the Manager since November 1990.
JOSEPH W. CONNOLLY, Chief Compliance Officer since September 2009.
Chief Compliance Officer of the Manager and The Dreyfus Family of Funds (77 investment companies, comprised of 194 portfolios). From November 2001 through March 2004, Mr. Connolly was first Vice-President, Mutual Fund Servicing for Mellon Global Securities Services. In that capacity, Mr. Connolly was responsible for managing Mellon’s Custody, Fund Accounting and Fund Administration services to third-party mutual fund clients. He is 53 years old and has served in various capacities with the Manager since 1980, including manager of the firm’s Fund Accounting Department from 1997 through October 2001.
NATALIA GRIBAS, Anti-Money Laundering Compliance Officer since July 2010.
Anti-Money Laundering Compliance Officer of the Distributor, and the Anti-Money Laundering Compliance Officer of 73 investment companies (comprised of 190 portfolios) managed by the Manager. She is 40 years old and has been an employee of the Distributor since September 2008.
40
Save time. Save paper. View your next shareholder report online as soon as it’s available. Log into www.dreyfus.com and sign up for Dreyfus eCommunications. It’s simple and only takes a few minutes.
The views expressed in this report reflect those of the portfolio manager only through the end of the period covered and do not necessarily represent the views of Dreyfus or any other person in the Dreyfus organization. Any such views are subject to change at any time based upon market or other conditions and Dreyfus disclaims any responsibility to update such views.These views may not be relied on as investment advice and, because investment decisions for a Dreyfus fund are based on numerous factors, may not be relied on as an indication of trading intent on behalf of any Dreyfus fund.
Not FDIC-Insured • Not Bank-Guaranteed • May Lose Value
| | Contents |
| | THE FUND |
| 2 | A Letter from the Chairman and CEO |
| 3 | Discussion of Fund Performance |
| 6 | Fund Performance |
| 8 | Understanding Your Fund’s Expenses |
| 8 | Comparing Your Fund’s Expenses With Those of Other Funds |
| 9 | Statement of Investments |
| 12 | Statement of Assets and Liabilities |
| 13 | Statement of Operations |
| 14 | Statement of Changes in Net Assets |
| 16 | Financial Highlights |
| 21 | Notes to Financial Statements |
| 33 | Report of Independent Registered Public Accounting Firm |
| 34 | Board Members Information |
| 36 | Officers of the Fund |
| | FOR MORE INFORMATION |
| | Back Cover |
Dreyfus
Mid-Cap Growth Fund
The Fund

A LETTER FROM THE CHAIRMAN AND CEO
Dear Shareholder:
We are pleased to present this annual report for Dreyfus Mid-Cap Growth Fund, covering the 12-month period from January 1, 2010, through December 31, 2010.
Although 2010 proved to be a volatile year for stocks, the reporting period ended with a sustained market rally that produced above-average returns across most market-cap segments for the calendar year. Investors’ early concerns regarding sovereign debt issues in Europe and stubbornly high unemployment in the United States later gave way to optimism that massive economic stimulus programs, robust growth in the world’s emerging markets, a strong holiday retail season and rising corporate earnings signaled better economic times ahead.
We are aware that stocks have recently reached higher valuations, and that any new economic setbacks could result in market volatility as investors adjust their expectations. Nonetheless, we see value in many segments of the equity market. For example, investors in volatile markets may turn to high-quality stocks of U.S. companies with track records of consistent growth in a variety of economic climates, and international equities could benefit from a declining U.S. dollar and potentially higher growth opportunities abroad. With 2011 now upon us, we suggest talking to your financial advisor, who can help you identify potential opportunities and suggest strategies suitable for your individual needs in today’s market environment.
For information about how the fund performed during the reporting period, as well as general market perspectives, we provide a Discussion of Fund Performance on the pages that follow.
Thank you for your continued confidence and support.

Jonathan R. Baum
Chairman and Chief Executive Officer
The Dreyfus Corporation
January 18, 2011
2

DISCUSSION OF FUND PERFORMANCE
For the period of January 1, 2010, through December 31, 2010, as provided by B. Randall Watts, Jr., CFA, and Robert C. Zeuthen, CFA, Primary Portfolio Managers
Fund and Market Performance Overview
For the 12-month period ended December 31, 2010, Dreyfus Mid-Cap Growth Fund’s Class A shares produced a total return of 32.25%, Class B shares returned 31.17%, Class C shares returned 30.87%, Class F shares returned 32.28% and Class I shares returned 32.20%.1 In comparison, the fund’s benchmark, the Russell Midcap Growth Index (the “Index”), produced a total return of 26.38% for the same period.2
Although stocks encountered heightened volatility in 2010, a rally in the fall enabled equities to end the year with strong gains. The fund produced higher returns than its benchmark, primarily due to strong stock selections in the information technology, consumer discretionary and health care sectors.
The Fund’s Investment Approach
The fund seeks capital appreciation.The fund will normally invest at least 80% of its assets in equity securities of companies within the market capitalization range of companies comprising the Russell Midcap Growth Index.The fund also may invest in larger or smaller companies if they represent better prospects for capital appreciation. We look for companies whose fundamental strengths suggest the potential for superior earnings growth over time.We go beyond Wall Street analysis and perform intensive qualitative and quantitative in-house research to determine whether companies meet our investment criteria.
Waning Economic Concerns Fueled a Market Rally
Although much of the world had emerged from recession by the start of 2010, a number of new developments shook investors’ confidence. Europe was roiled by a sovereign debt crisis when Greece and, later, Ireland found themselves unable to finance heavy debt loads, leading to fiscal austerity measures that threatened the region’s sluggish economic rebound. Meanwhile, disappointing housing and employment data in the
DISCUSSION OF FUND PERFORMANCE (continued)
United States weighed on already mild domestic growth. Consequently, U.S. stocks generally declined over the first half of the year.
However, it became clearer over the summer that investors’ economic concerns may have been overblown. Corporate earnings exceeded analysts’ expectations, commodity prices climbed amid robust demand from the world’s emerging markets, and the U.S. and global economies remained on upward trajectories. New stimulative efforts by the Federal Reserve Board also boosted investor sentiment. Stocks rallied in the fall, and midcap stocks, on average, produced higher returns than large-cap stocks, and growth outperformed value.
Security Selections Successful in Most Sectors
Our security selection process proved effective in this market environment. Our stock picks in the information technology sector emphasized companies engaged in growth trends such as the modernization of emerging markets, Internet innovation and increasingly connected consumers. For example, Chinese search engine Baidu.com demonstrated a competitive advantage that boosted online traffic. Akamai Technologies encountered strong demand for video streaming on the Internet.Teradata and Cognizant Technology Solutions benefited from the widespread adoption of “cloud computing,” in which businesses maintain data and applications over the Internet.
In the consumer discretionary sector, movie rental company Netflix advanced due to a growing subscriber base and international expansion plans. Among health care companies, Varian Medical Systems gained value as the company implemented a stock repurchase program and hospitals spent more on cancer therapy equipment.
Although disappointments in 2010 proved to be relatively mild, shortfalls in the energy sector weighed on the fund’s relative performance amid intensifying regulatory pressures. CONSOL Energy and Southwestern Energy lagged when natural gas prices fell sharply. In the industrials sector, underweighted exposure to engine maker Cummins prevented the fund from participating more fully in its gains. Among financial companies, regulatory pressures undermined regional banks KeyCorp and Huntington Bancshares, and an underweighted position in real estate investment trusts also dampened results compared to the benchmark.
4
Positioned for a More Selective Market Environment
While a number of economic headwinds remain, fears of a double-dip recession have receded. Corporations have record amounts of cash on their balance sheets, profits in some industries have returned to pre-recession levels, and several domestic political uncertainties were resolved in the weeks following the midterm elections. Nonetheless, stubbornly high U.S. unemployment and geopolitical turmoil could challenge investor sentiment, and it remains to be seen whether the increased activity in the private sector will offset the end of some of the U.S. government’s fiscal stimulus programs.
We believe that investors will become more selective in such an environment, favoring companies that can grow in a sluggish economy and avoiding those with weaker underlying business fundamentals. Consequently, we have increased the fund’s exposure to the financials sector, where we expect loan delinquencies to moderate and capital ratios to increase.We have maintained underweighted exposure to the industrials sector, where we have found fewer growth opportunities.
January 18, 2011
| |
| | Please note, the position in any security highlighted in italicized typeface was sold during the |
| | reporting period. |
| | Equity funds are subject generally to market, market sector, market liquidity, issuer and investment |
| | style risks, among other factors, to varying degrees, all of which are more fully described in the |
| | fund’s prospectus. |
| | Midsize companies carry additional risks because their earnings and revenues tend to be less |
| | predictable and their share prices more volatile than those of larger, more established companies.The |
| | shares of midsize companies tend to trade less frequently than those of larger, more established |
| | companies. |
| 1 | Total return includes reinvestment of dividends and any capital gains paid, and does not take into |
| | consideration the maximum initial sales charges in the case of Class A shares, or the applicable |
| | contingent deferred sales charges imposed on redemptions in the case of Class B and Class C |
| | shares. Had these charges been reflected, returns would have been lower. Past performance is no |
| | guarantee of future results. Share price and investment return fluctuate such that upon redemption, |
| | fund shares may be worth more or less than their original cost. Return figures provided reflect the |
| | absorption of certain fund expenses by The Dreyfus Corporation pursuant to an agreement |
| | through February 28, 2011, at which time it may be extended, terminated or modified. Had |
| | these expenses not been absorbed, the fund’s returns would have been lower. |
| 2 | SOURCE: LIPPER INC. — The Russell Midcap Growth Index measures the performance of |
| | the 800 smallest companies in the Russell 1000 Index with higher price-to-book ratios and |
| | higher forecasted growth values.The total return figure cited for this index assumes change in |
| | security prices and reinvestment of dividends, but does not reflect the costs of managing a mutual |
| | fund.The Russell 1000 Index measures the performance of the largest 1,000 publicly traded |
| | U.S. companies. Investors cannot invest directly in any index. |
FUND PERFORMANCE

|
| † Source: Lipper Inc. |
| Past performance is not predictive of future performance. |
| The above graph compares a $10,000 investment made in Class A, Class B, Class C, Class F and Class I shares of |
| Dreyfus Mid-Cap Growth Fund on 12/31/00 to a $10,000 investment made in the Russell Midcap Growth Index |
| (the “Index”) on that date.All dividends and capital gain distributions are reinvested. |
| The fund’s performance shown in the line graph takes into account the maximum initial sales charge on Class A shares |
| and all other applicable fees and expenses on all classes (after any expense reimbursements). Performance for Class B |
| shares assumes the conversion of Class B shares to Class A shares at the end of the sixth year following the date of |
| purchase.The Index measures the performance of those companies among the 800 smallest companies in the Russell |
| 1000 Index with higher price-to-book ratios and higher forecasted growth values.The Russell 1000 Index measures the |
| performance of the largest 1,000 publicly traded U.S. companies. Unlike a mutual fund, the Index is not subject to |
| charges, fees and other expenses. Investors cannot invest directly in any index. Further information relating to fund |
| performance, including expense reimbursements, if applicable, is contained in the Financial Highlights section of the |
| prospectus and elsewhere in this report. |
6
| | | |
| Average Annual Total Returns as of 12/31/10 | | | |
| |
| | 1 Year | 5 Years | 10 Years |
| Class A shares | | | |
| with maximum sales charge (5.75%) | 24.76% | 2.08% | 1.71% |
| without sales charge | 32.25% | 3.32% | 2.32% |
| Class B shares | | | |
| with applicable redemption charge † | 27.17% | 2.08% | 1.92% |
| without redemption | 31.17% | 2.44% | 1.92% |
| Class C shares | | | |
| with applicable redemption charge †† | 29.87% | 2.51% | 1.48% |
| without redemption | 30.87% | 2.51% | 1.48% |
| Class F shares | 32.28% | 3.48% | 2.66% |
| Class I shares | 32.20% | 3.59% | 2.54% |
| Russell Midcap Growth Index | 26.38% | 4.88% | 3.12% |
|
| Past performance is not predictive of future performance.The fund’s performance shown in the graph and table does not |
| reflect the deduction of taxes that a shareholder would pay on fund distributions or the redemption of fund shares. |
| † The maximum contingent deferred sales charge for Class B shares is 4%.After six years Class B shares convert to |
| Class A shares. |
| †† The maximum contingent deferred sales charge for Class C shares is 1% for shares redeemed within one year of the |
| date of purchase. |
UNDERSTANDING YOUR FUND’S EXPENSES (Unaudited)
As a mutual fund investor, you pay ongoing expenses, such as management fees and other expenses. Using the information below, you can estimate how these expenses affect your investment and compare them with the expenses of other funds.You also may pay one-time transaction expenses, including sales charges (loads) and redemption fees, which are not shown in this section and would have resulted in higher total expenses. For more information, see your fund’s prospectus or talk to your financial adviser.
Review your fund’s expenses
The table below shows the expenses you would have paid on a $1,000 investment in Dreyfus Mid-Cap Growth Fund from July 1, 2010 to December 31, 2010. It also shows how much a $1,000 investment would be worth at the close of the period, assuming actual returns and expenses.
| | | | | |
| Expenses and Value of a $1,000 Investment | | | |
| assuming actual returns for the six months ended December 31, 2010 | | |
| | Class A | Class B | Class C | Class F | Class I |
| Expenses paid per $1,000† | $ 7.61 | $ 11.39 | $ 12.19 | $ 7.37 | $ 6.46 |
| Ending value (after expenses) | $1,268.60 | $1,260.40 | $1,260.50 | $1,267.40 | $1,266.40 |
|
| COMPARING YOUR FUND’S EXPENSES |
| WITH THOSE OF OTHER FUNDS (Unaudited) |
Using the SEC’s method to compare expenses
The Securities and Exchange Commission (SEC) has established guidelines to help investors assess fund expenses. Per these guidelines, the table below shows your fund’s expenses based on a $1,000 investment, assuming a hypothetical 5% annualized return. You can use this information to compare the ongoing expenses (but not transaction expenses or total cost) of investing in the fund with those of other funds.All mutual fund shareholder reports will provide this information to help you make this comparison. Please note that you cannot use this information to estimate your actual ending account balance and expenses paid during the period.
| | | | | |
| Expenses and Value of a $1,000 Investment | | | |
| assuming a hypothetical 5% annualized return for the six months ended December 31, 2010 |
| | Class A | Class B | Class C | Class F | Class I |
| Expenses paid per $1,000† | $ 6.77 | $ 10.16 | $ 10.87 | $ 6.56 | $ 5.75 |
| Ending value (after expenses) | $1,018.50 | $1,015.12 | $1,014.42 | $1,018.70 | $1,019.51 |
† Expenses are equal to the fund’s annualized expense ratio of 1.33% for Class A, 2.00% for Class B, 2.14% for Class C, 1.29% for Class F and 1.13% for Class I, multiplied by the average account value over the period, multiplied by 184/365 (to reflect the one-half year period).
8
|
| STATEMENT OF INVESTMENTS |
| December 31, 2010 |
| | |
| Common Stocks—97.7% | Shares | Value ($) |
| Consumer Discretionary—15.8% | | |
| Abercrombie & Fitch, Cl. A | 39,370 a | 2,268,893 |
| Coach | 37,190 | 2,056,979 |
| DreamWorks Animation SKG, Cl. A | 64,220 a,b | 1,892,563 |
| Guess? | 47,420 | 2,243,914 |
| Nordstrom | 64,850 | 2,748,343 |
| PetSmart | 56,252 | 2,239,955 |
| Tractor Supply | 45,150 | 2,189,324 |
| Ulta Salon, Cosmetics & Fragrance | 60,790 b | 2,066,860 |
| Warnaco Group | 51,610 b | 2,842,163 |
| Williams-Sonoma | 83,790 | 2,990,465 |
| | | 23,539,459 |
| Consumer Staples—7.4% | | |
| Estee Lauder, Cl. A | 28,850 | 2,328,195 |
| Green Mountain Coffee Roasters | 65,280 a,b | 2,145,101 |
| Hansen Natural | 39,630 b | 2,071,856 |
| Mead Johnson Nutrition | 35,530 | 2,211,743 |
| Whole Foods Market | 43,720 | 2,211,795 |
| | | 10,968,690 |
| Energy—7.9% | | |
| Concho Resources | 27,060 b | 2,372,350 |
| Consol Energy | 68,340 | 3,330,892 |
| Continental Resources | 39,740 a,b | 2,338,699 |
| Denbury Resources | 193,860 b | 3,700,787 |
| | | 11,742,728 |
| Exchange Traded Funds—3.1% | | |
| IShares Russell 2000 Index Fund | 81,310 a | 4,602,959 |
| Financial—9.8% | | |
| Arch Capital Group | 24,310 b | 2,140,495 |
| Huntington Bancshares | 577,790 | 3,969,417 |
| KeyCorp | 406,680 | 3,599,118 |
| New York Community Bancorp | 149,360 | 2,815,436 |
| Och-Ziff Capital Management Group, Cl. A | 127,240 | 1,982,399 |
| | | 14,506,865 |
| Health Care—14.0% | | |
| Alexion Pharmaceuticals | 30,140 b | 2,427,777 |
| Allscripts Healthcare Solutions | 129,750 b | 2,500,282 |
STATEMENT OF INVESTMENTS (continued)
| | |
| Common Stocks (continued) | Shares | Value ($) |
| Health Care (continued) | | |
| AmerisourceBergen | 56,290 | 1,920,615 |
| Amylin Pharmaceuticals | 149,150 a,b | 2,193,997 |
| Resmed | 57,940 a,b | 2,007,042 |
| SXC Health Solutions | 51,460 b | 2,205,576 |
| United Therapeutics | 35,400 a,b | 2,237,988 |
| Universal Health Services, Cl. B | 47,570 | 2,065,489 |
| Varian Medical Systems | 46,300 b | 3,207,664 |
| | | 20,766,430 |
| Industrial—10.3% | | |
| AMETEK | 58,353 | 2,290,355 |
| Cummins | 20,310 | 2,234,303 |
| IDEX | 84,360 | 3,300,163 |
| Jacobs Engineering Group | 50,220 b | 2,302,587 |
| Roper Industries | 38,549 | 2,946,300 |
| Stericycle | 28,240 a,b | 2,285,181 |
| | | 15,358,889 |
| Information Technology—23.9% | | |
| Analog Devices | 63,310 | 2,384,888 |
| Avago Technologies | 78,600 | 2,237,742 |
| Baidu, ADR | 19,660 b | 1,897,780 |
| BMC Software | 74,700 b | 3,521,358 |
| Broadcom, Cl. A | 110,190 | 4,798,775 |
| Cree | 40,830 a,b | 2,690,289 |
| Cypress Semiconductor | 165,260 b | 3,070,531 |
| Dolby Laboratories, Cl. A | 30,770 b | 2,052,359 |
| Harris | 43,370 | 1,964,661 |
| LSI | 367,160 b | 2,199,288 |
| PMC-Sierra | 262,950 b | 2,258,741 |
| QLogic | 113,910 b | 1,938,748 |
| Salesforce.com | 18,160 b | 2,397,120 |
| Teradata | 51,980 b | 2,139,497 |
| | | 35,551,777 |
| Materials—3.9% | | |
| CF Industries Holdings | 22,090 | 2,985,463 |
| Royal Gold | 51,740 a | 2,826,556 |
| | | 5,812,019 |
10
| | |
| Common Stocks (continued) | Shares | Value ($) |
| Telecommunication Services—1.6% | | |
| American Tower, Cl. A | 46,280 b | 2,389,899 |
| Total Common Stocks | | |
| (cost $122,398,125) | | 145,239,715 |
| |
| Other Investment—2.9% | | |
| Registered Investment Company; | | |
| Dreyfus Institutional Preferred | | |
| Plus Money Market Fund | | |
| (cost $4,363,000) | 4,363,000 c | 4,363,000 |
| |
| Investment of Cash Collateral | | |
| for Securities Loaned—9.9% | | |
| Registered Investment Company; | | |
| Dreyfus Institutional Cash Advantage Fund | | |
| (cost $14,688,252) | 14,688,252 c | 14,688,252 |
| Total Investments (cost $141,449,377) | 110.5% | 164,290,967 |
| Liabilities, Less Cash and Receivables | (10.5%) | (15,651,668) |
| Net Assets | 100.0% | 148,639,299 |
|
| ADR—American Depository Receipts |
| a Security, or portion thereof, on loan.At December 31, 2010, the market value of the fund’s securities on loan was |
| $14,267,006 and the market value of the collateral held by the fund was $14,688,252. |
| b Non-income producing security. |
| c Investment in affiliated money market mutual fund. |
| | | |
| Portfolio Summary (Unaudited)† | | |
| |
| | Value (%) | | Value (%) |
| Information Technology | 23.9 | Energy | 7.9 |
| Consumer Discretionary | 15.8 | Consumer Staples | 7.4 |
| Health Care | 14.0 | Materials | 3.9 |
| Money Market Investments | 12.8 | Exchange Traded Funds | 3.1 |
| Industrial | 10.3 | Telecommunication Services | 1.6 |
| Financial | 9.8 | | 110.5 |
| |
| † Based on net assets. | | | |
| See notes to financial statements. | | | |
|
| STATEMENT OF ASSETS AND LIABILITIES |
| December 31, 2010 |
| | | | | |
| | | | | Cost | Value |
| Assets ($): | | | | | |
| Investments in securities—See Statement of Investments (including | | |
| securities on loan, valued at $14,267,006)—Note 1(b): | | |
| Unaffiliated issuers | | | 122,398,125 | 145,239,715 |
| Affiliated issuers | | | | 19,051,252 | 19,051,252 |
| Cash | | | | | 57,480 |
| Receivable for shares of Common Stock subscribed | | | 147,071 |
| Dividends and interest receivable | | | | 21,136 |
| Prepaid expenses | | | | | 51,451 |
| | | | | | 164,568,105 |
| Liabilities ($): | | | | | |
| Due to The Dreyfus Corporation and affiliates—Note 3(c) | | | 144,828 |
| Liability for securities on loan—Note 1(b) | | | | 14,688,252 |
| Payable for shares of Common Stock redeemed | | | 968,950 |
| Accrued expenses | | | | | 126,776 |
| | | | | | 15,928,806 |
| Net Assets ($) | | | | | 148,639,299 |
| Composition of Net Assets ($): | | | | |
| Paid-in capital | | | | | 193,765,864 |
| Accumulated net realized gain (loss) on investments | | | (67,968,155) |
| Accumulated net unrealized appreciation | | | | |
| (depreciation) on investments | | | | 22,841,590 |
| Net Assets ($) | | | | | 148,639,299 |
| |
| |
| Net Asset Value Per Share | | | | |
| | Class A | Class B | Class C | Class F | Class I |
| Net Assets ($) | 38,098,541 | 476,257 | 12,661,391 | 89,827,677 | 7,575,433 |
| Shares Outstanding | 7,208,027 | 98,358 | 2,642,584 | 16,492,033 | 1,396,917 |
| Net Asset Value | | | | | |
| Per Share ($) | 5.29 | 4.84 | 4.79 | 5.45 | 5.42 |
| |
| See notes to financial statements. | | | | | |
12
|
| STATEMENT OF OPERATIONS |
| Year Ended December 31, 2010 |
| |
| Investment Income ($): | |
| Income: | |
| Cash dividends: | |
| Unaffiliated issuers | 942,471 |
| Affiliated issuers | 5,861 |
| Income from securities lending—Note 1(b) | 46,297 |
| Total Income | 994,629 |
| Expenses: | |
| Investment advisory fee—Note 3(a) | 1,005,680 |
| Shareholder servicing costs—Note 3(c) | 358,125 |
| Distribution fees—Note 3(b) | 145,517 |
| Prospectus and shareholders’ reports | 96,330 |
| Accounting fees—Note 3(c) | 74,403 |
| Registration fees | 62,823 |
| Professional fees | 37,165 |
| Directors’ fees and expenses—Note 3(d) | 35,961 |
| Custodian fees—Note 3(c) | 4,547 |
| Miscellaneous | 5,092 |
| Total Expenses | 1,825,643 |
| Less—reduction in investment advisory fee due to undertaking—Note 3(a) | (106,176) |
| Less—reduction in fees due to earnings credits—Note 3(c) | (794) |
| Net Expenses | 1,718,673 |
| Investment (Loss)—Net | (724,044) |
| Realized and Unrealized Gain (Loss) on Investments—Note 4 ($): | |
| Net realized gain (loss) on investments | 30,011,875 |
| Net unrealized appreciation (depreciation) on investments | 5,935,031 |
| Net Realized and Unrealized Gain (Loss) on Investments | 35,946,906 |
| Net Increase in Net Assets Resulting from Operations | 35,222,862 |
| |
| See notes to financial statements. | |
STATEMENT OF CHANGES IN NET ASSETS
| | |
| | Year Ended December 31, |
| | 2010 | 2009a |
| Operations ($): | | |
| Investment (loss)—net | (724,044) | (817,177) |
| Net realized gain (loss) on investments | 30,011,875 | (43,666,398) |
| Net unrealized appreciation | | |
| (depreciation) on investments | 5,935,031 | 71,449,490 |
| Net Increase (Decrease) in Net Assets | | |
| Resulting from Operations | 35,222,862 | 26,965,915 |
| Capital Stock Transactions ($): | | |
| Net proceeds from shares sold: | | |
| Class A Shares | 21,101,049 | 6,489,918 |
| Class B Shares | 194,728 | 2,998 |
| Class C Shares | 1,810,693 | 527,471 |
| Class F Shares | 5,996,490 | 1,696,620 |
| Class I Shares | 4,537,747 | 1,376,339 |
| Class T Shares | — | 18,200 |
| Cost of shares redeemed: | | |
| Class A Shares | (13,900,958) | (18,663,153) |
| Class B Shares | (396,363) | (293,334) |
| Class C Shares | (3,981,795) | (5,469,772) |
| Class F Shares | (17,462,853) | (16,013,985) |
| Class I Shares | (2,483,142) | (2,025,820) |
| Class T Shares | — | (972,785) |
| Increase (Decrease) in Net Assets | | |
| from Capital Stock Transactions | (4,584,404) | (33,327,303) |
| Total Increase (Decrease) in Net Assets | 30,638,458 | (6,361,388) |
| Net Assets ($): | | |
| Beginning of Period | 118,000,841 | 124,362,229 |
| End of Period | 148,639,299 | 118,000,841 |
14
| | |
| | Year Ended December 31, |
| | 2010 | 2009a |
| Capital Share Transactions: | | |
| Class Ab,c | | |
| Shares sold | 4,430,756 | 1,961,128 |
| Shares redeemed | (3,082,186) | (5,403,462) |
| Net Increase (Decrease) in Shares Outstanding | 1,348,570 | (3,442,334) |
| Class Bb | | |
| Shares sold | 44,247 | 1,177 |
| Shares redeemed | (97,310) | (96,448) |
| Net Increase (Decrease) in Shares Outstanding | (53,063) | (95,271) |
| Class C | | |
| Shares sold | 427,086 | 169,408 |
| Shares redeemed | (978,854) | (1,773,198) |
| Net Increase (Decrease) in Shares Outstanding | (551,768) | (1,603,790) |
| Class F | | |
| Shares sold | 1,277,058 | 489,863 |
| Shares redeemed | (3,764,222) | (4,609,615) |
| Net Increase (Decrease) in Shares Outstanding | (2,487,164) | (4,119,752) |
| Class I | | |
| Shares sold | 922,698 | 375,603 |
| Shares redeemed | (526,142) | (563,472) |
| Net Increase (Decrease) in Shares Outstanding | 396,556 | (187,869) |
| Class Tc | | |
| Shares sold | — | 6,416 |
| Shares redeemed | — | (346,191) |
| Net Increase (Decrease) in Shares Outstanding | — | (339,755) |
| |
| a | Effective as of the close of business on February 4, 2009, the fund no longer offers Class T shares. |
| b | During the period ended December 31, 2010, 13,669 Class B shares representing $57,317 were automatically |
| | converted to 12,564 Class A shares and during the period ended December 31, 2009, 8,986 Class B shares |
| | representing $27,399 were automatically converted to 8,348 Class A shares. |
| c | On the close of business on February 4, 2009, 335,018 Class T shares representing $941,401 were converted to |
| | 311,722 Class A shares. |
| See notes to financial statements. |
FINANCIAL HIGHLIGHTS
The following tables describe the performance for each share class for the fiscal periods indicated.All information (except portfolio turnover rate) reflects financial results for a single fund share.Total return shows how much your investment in the fund would have increased (or decreased) during each period, assuming you had reinvested all dividends and distributions.These figures have been derived from the fund’s financial statements.
| | | | | |
| | | Year Ended December 31, | |
| Class A Shares | 2010 | 2009† | 2008 | 2007 | 2006 |
| Per Share Data ($): | | | | | |
| Net asset value, beginning of period | 4.00 | 3.17 | 6.28 | 5.80 | 4.68 |
| Investment Operations: | | | | | |
| Investment (loss)—neta | (.02) | (.03) | (.05) | (.02) | (.04) |
| Net realized and unrealized | | | | | |
| gain (loss) on investments | 1.31 | .86 | (3.06) | .76 | 1.16 |
| Total from Investment Operations | 1.29 | .83 | (3.11) | .74 | 1.12 |
| Distributions: | | | | | |
| Dividends from net realized | | | | | |
| gain on investments | — | — | — | (.26) | — |
| Net asset value, end of period | 5.29 | 4.00 | 3.17 | 6.28 | 5.80 |
| Total Return (%)b | 32.25 | 26.18 | (49.52) | 12.77 | 23.93 |
| Ratios/Supplemental Data (%): | | | | | |
| Ratio of total expenses | | | | | |
| to average net assets | 1.56 | 1.77 | 1.45 | 1.43 | 1.40 |
| Ratio of net expenses | | | | | |
| to average net assets | 1.36 | 1.75 | 1.45 | 1.43 | 1.39 |
| Ratio of net investment (loss) | | | | | |
| to average net assets | (.55) | (.86) | (.89) | (.32) | (.68) |
| Portfolio Turnover Rate | 204.97 | 59.66 | 119 | 165 | 104 |
| Net Assets, end of period ($ x 1,000) | 38,099 | 23,448 | 29,525 | 97,331 | 21,146 |
| |
| † | Effective September 1, 2009,The Dreyfus Corporation replaced Founders Asset Management LLC as the fund’s |
| | investment adviser. |
| a | Based on average shares outstanding at each month end. |
| b | Exclusive of sales charge. |
| See notes to financial statements. |
16
| | | | | |
| | | Year Ended December 31, | |
| Class B Shares | 2010 | 2009† | 2008 | 2007 | 2006 |
| Per Share Data ($): | | | | | |
| Net asset value, beginning of period | 3.69 | 2.96 | 5.89 | 5.50 | 4.48 |
| Investment Operations: | | | | | |
| Investment (loss)—neta | (.05) | (.06) | (.08) | (.06) | (.08) |
| Net realized and unrealized | | | | | |
| gain (loss) on investments | 1.20 | .79 | (2.85) | .71 | 1.10 |
| Total from Investment Operations | 1.15 | .73 | (2.93) | .65 | 1.02 |
| Distributions: | | | | | |
| Dividends from net realized | | | | | |
| gain on investments | — | — | — | (.26) | — |
| Net asset value, end of period | 4.84 | 3.69 | 2.96 | 5.89 | 5.50 |
| Total Return (%)b | 31.17 | 24.66 | (49.75) | 11.84 | 22.77 |
| Ratios/Supplemental Data (%): | | | | | |
| Ratio of total expenses | | | | | |
| to average net assets | 2.45 | 2.68 | 2.21 | 2.26 | 2.29 |
| Ratio of net expenses | | | | | |
| to average net assets | 2.05 | 2.66 | 2.20 | 2.26 | 2.29 |
| Ratio of net investment (loss) | | | | | |
| to average net assets | (1.27) | (1.77) | (1.66) | (1.02) | (1.60) |
| Portfolio Turnover Rate | 204.97 | 59.66 | 119 | 165 | 104 |
| Net Assets, end of period ($ x 1,000) | 476 | 559 | 729 | 2,200 | 1,929 |
| |
| † | Effective September 1, 2009,The Dreyfus Corporation replaced Founders Asset Management LLC as the fund’s |
| | investment adviser. |
| a | Based on average shares outstanding at each month end. |
| b | Exclusive of sales charge. |
| See notes to financial statements. |
FINANCIAL HIGHLIGHTS (continued)
| | | | | |
| | | Year Ended December 31, | |
| Class C Shares | 2010 | 2009† | 2008 | 2007 | 2006 |
| Per Share Data ($): | | | | | |
| Net asset value, beginning of period | 3.66 | 2.92 | 5.83 | 5.44 | 4.42 |
| Investment Operations: | | | | | |
| Investment (loss)—neta | (.05) | (.05) | (.08) | (.06) | (.06) |
| Net realized and unrealized | | | | | |
| gain (loss) on investments | 1.18 | .79 | (2.83) | .71 | 1.08 |
| Total from Investment Operations | 1.13 | .74 | (2.91) | .65 | 1.02 |
| Distributions: | | | | | |
| Dividends from net realized | | | | | |
| gain on investments | — | — | — | (.26) | — |
| Net asset value, end of period | 4.79 | 3.66 | 2.92 | 5.83 | 5.44 |
| Total Return (%)b | 30.87 | 25.34 | (49.91) | 11.96 | 23.08 |
| Ratios/Supplemental Data (%): | | | | | |
| Ratio of total expenses | | | | | |
| to average net assets | 2.36 | 2.61 | 2.20 | 2.13 | 2.19 |
| Ratio of net expenses | | | | | |
| to average net assets | 2.14 | 2.60 | 2.19 | 2.13 | 2.18 |
| Ratio of net investment (loss) | | | | | |
| to average net assets | (1.34) | (1.70) | (1.66) | (1.04) | (1.27) |
| Portfolio Turnover Rate | 204.97 | 59.66 | 119 | 165 | 104 |
| Net Assets, end of period ($ x 1,000) | 12,661 | 11,678 | 14,033 | 43,825 | 9,641 |
| |
| † | Effective September 1, 2009,The Dreyfus Corporation replaced Founders Asset Management LLC as the fund’s |
| | investment adviser. |
| a | Based on average shares outstanding at each month end. |
| b | Exclusive of sales charge. |
| See notes to financial statements. |
18
| | | | | |
| | | Year Ended December 31, | |
| Class F Shares | 2010 | 2009† | 2008 | 2007 | 2006 |
| Per Share Data ($): | | | | | |
| Net asset value, beginning of period | 4.12 | 3.26 | 6.43 | 5.92 | 4.78 |
| Investment Operations: | | | | | |
| Investment (loss)—neta | (.02) | (.02) | (.04) | (.00)b | (.03) |
| Net realized and unrealized | | | | | |
| gain (loss) on investments | 1.35 | .88 | (3.13) | .77 | 1.17 |
| Total from Investment Operations | 1.33 | .86 | (3.17) | .77 | 1.14 |
| Distributions: | | | | | |
| Dividends from net realized | | | | | |
| gain on investments | — | — | — | (.26) | — |
| Net asset value, end of period | 5.45 | 4.12 | 3.26 | 6.43 | 5.92 |
| Total Return (%) | 32.28 | 26.38 | (49.30) | 13.03 | 23.85 |
| Ratios/Supplemental Data (%): | | | | | |
| Ratio of total expenses | | | | | |
| to average net assets | 1.32 | 1.38 | 1.23 | 1.30 | 1.33 |
| Ratio of net expenses | | | | | |
| to average net assets | 1.30 | 1.36 | 1.22 | 1.30 | 1.33 |
| Ratio of net investment (loss) | | | | | |
| to average net assets | (.50) | (.47) | (.68) | (.03) | (.62) |
| Portfolio Turnover Rate | 204.97 | 59.66 | 119 | 165 | 104 |
| Net Assets, end of period ($ x 1,000) | 89,828 | 78,218 | 75,224 | 182,336 | 147,410 |
| |
| † | Effective September 1, 2009,The Dreyfus Corporation replaced Founders Asset Management LLC as the fund’s |
| | investment adviser. |
| a | Based on average shares outstanding at each month end. |
| b | Amount represents less than $.01 per share. |
| See notes to financial statements. |
FINANCIAL HIGHLIGHTS (continued)
| | | | | |
| | | Year Ended December 31, | |
| Class I Shares | 2010 | 2009† | 2008 | 2007a | 2006 |
| Per Share Data ($): | | | | | |
| Net asset value, beginning of period | 4.10 | 3.24 | 6.39 | 5.88 | 4.73 |
| Investment Operations: | | | | | |
| Investment income (loss)—netb | (.02) | (.02) | (.03) | .00c | (.02) |
| Net realized and unrealized | | | | | |
| gain (loss) on investments | 1.34 | .88 | (3.12) | .77 | 1.17 |
| Total from Investment Operations | 1.32 | .86 | (3.15) | .77 | 1.15 |
| Distributions: | | | | | |
| Dividends from net realized | | | | | |
| gain on investments | — | — | — | (.26) | — |
| Net asset value, end of period | 5.42 | 4.10 | 3.24 | 6.39 | 5.88 |
| Total Return (%) | 32.20 | 26.54 | (49.30) | 13.11 | 24.31 |
| Ratios/Supplemental Data (%): | | | | | |
| Ratio of total expenses | | | | | |
| to average net assets | 1.34 | 1.49 | 1.20 | 1.12 | 1.14 |
| Ratio of net expenses | | | | | |
| to average net assets | 1.14 | 1.47 | 1.19 | 1.11 | 1.12 |
| Ratio of net investment income | | | | | |
| (loss) to average net assets | (.33) | (.58) | (.65) | .06 | (.28) |
| Portfolio Turnover Rate | 204.97 | 59.66 | 119 | 165 | 104 |
| Net Assets, end of period ($ x 1,000) | 7,575 | 4,098 | 3,849 | 10,266 | 4,279 |
| |
| † | Effective September 1, 2009,The Dreyfus Corporation replaced Founders Asset Management LLC as the fund’s |
| | investment adviser. |
| a | Effective June 1, 2007, Class R shares were redesignated as Class I shares. |
| b | Based on average shares outstanding at each month end. |
| c | Amount represents less than $.01 per share. |
| See notes to financial statements. |
20
NOTES TO FINANCIAL STATEMENTS
NOTE 1—Significant Accounting Policies:
Dreyfus Mid-Cap Growth Fund (the “fund”) is a separate diversified series of Dreyfus Funds, Inc. (the “Company”), which is registered under the Investment Company Act of 1940, as amended (the “Act”), as an open-end management investment company and operates as a series company currently offering two series, including the fund.The fund’s investment objective is to seek capital appreciation.The Dreyfus Corporation (the “Manager” or “Dreyfus”), a wholly-owned subsidiary of The Bank of New York Mellon Corporation (‘BNY Mellon”), serves as the fund’s investment adviser.
MBSC Securities Corporation (the “Distributor”), a wholly-owned subsidiary of the Manager, is the distributor of the fund’s shares. The fund is authorized to issue 1.05 billion shares of $.001 par value Common Stock.The fund currently offers five classes of shares: Class A (300 million shares authorized), Class B (50 million shares authorized), Class C (100 million shares authorized), Class F (500 million shares authorized) and Class I (100 million shares authorized). Class A shares are subject to a sales charge imposed at the time of purchase. Class B shares are subject to a contingent deferred sales charge (“CDSC”) imposed on Class B share redemptions made within six years of purchase and automatically convert to Class A shares after six years. The fund no longer offers Class B shares, except in connection with dividend reinvestment and permitted exchanges of Class B shares. Class C shares are subject to a CDSC imposed on Class C shares redeemed within one year of purchase. Class F and Class I shares are sold at net asset value per share. Class F shares are sold only to Class F grandfathered investors, and Class I shares are sold only to institutional investors. Other differences between the classes include the services offered to and the expenses borne by each class, the allocation of certain transfer agency costs and certain voting rights. Income, expenses (other than expenses attributable to a specific class), and realized and unrealized gains or losses on investments are allocated to each class of shares based on its relative net assets.
NOTES TO FINANCIAL STATEMENTS (continued)
The Company accounts separately for the assets, liabilities and operations of each series. Expenses directly attributable to each series are charged to that series’ operations; expenses which are applicable to all series are allocated among them on a pro rata basis.
The Financial Accounting Standards Board (“FASB”) Accounting Standards Codification (“ASC”) is the exclusive reference of authoritative U.S. generally accepted accounting principles (“GAAP”) recognized by the FASB to be applied by nongovernmental entities. Rules and interpretive releases of the Securities and Exchange Commission (“SEC”) under authority of federal laws are also sources of authoritative GAAP for SEC registrants. The fund’s financial statements are prepared in accordance with GAAP, which may require the use of management estimates and assumptions.Actual results could differ from those estimates.
(a) Portfolio valuation: Investments in securities are valued at the last sales price on the securities exchange or national securities market on which such securities are primarily traded. Securities listed on the National Market System for which market quotations are available are valued at the official closing price or, if there is no official closing price that day, at the last sales price. Securities not listed on an exchange or the national securities market, or securities for which there were no transactions, are valued at the average of the most recent bid and asked prices, except for open short positions, where the asked price is used for valuation purposes. Bid price is used when no asked price is available. Registered investment companies that are not traded on an exchange are valued at their net asset value.When market quotations or official closing prices are not readily available, or are determined not to reflect accurately fair value, such as when the value of a security has been significantly affected by events after the close of the exchange or market on which the security is principally traded (for example, a foreign exchange or market), but before the fund calculates its net asset value, the fund may value these investments at fair value as determined in accordance with the procedures approved by the Board of Directors. Fair valuing of securities may be determined with the assistance of a
22
pricing service using calculations based on indices of domestic securities and other appropriate indicators, such as prices of relevant ADRs and futures contracts. For other securities that are fair valued by the Board of Directors, certain factors may be considered such as: fundamental analytical data, the nature and duration of restrictions on disposition, an evaluation of the forces that influence the market in which the securities are purchased and sold, and public trading in similar securities of the issuer or comparable issuers.
The fair value of a financial instrument is the amount that would be received to sell an asset or paid to transfer a liability in an orderly transaction between market participants at the measurement date (i.e. the exit price). GAAP establishes a fair value hierarchy that prioritizes the inputs of valuation techniques used to measure fair value.This hierarchy gives the highest priority to unadjusted quoted prices in active markets for identical assets or liabilities (Level 1 measurements) and the lowest priority to unobservable inputs (Level 3 measurements).
Additionally, GAAP provides guidance on determining whether the volume and activity in a market has decreased significantly and whether such a decrease in activity results in transactions that are not orderly. GAAP requires enhanced disclosures around valuation inputs and techniques used during annual and interim periods.
Various inputs are used in determining the value of the fund’s investments relating to fair value measurements.These inputs are summarized in the three broad levels listed below:
Level 1—unadjusted quoted prices in active markets for identical investments.
Level 2—other significant observable inputs (including quoted prices for similar investments, interest rates, prepayment speeds, credit risk, etc.).
Level 3—significant unobservable inputs (including the fund’s own assumptions in determining the fair value of investments).
NOTES TO FINANCIAL STATEMENTS (continued)
The inputs or methodology used for valuing securities are not necessarily an indication of the risk associated with investing in those securities.
The following is a summary of the inputs used as of December 31, 2010 in valuing the fund’s investments:
| | | | |
| | | Level 2—Other | Level 3— | |
| | Level 1— | Significant | Significant | |
| | Unadjusted | Observable | Unobservable | |
| | Quoted Prices | Inputs | Inputs | Total |
| Investments in Securities: | | | |
| Equity Securities— | | | | |
| Domestic† | 138,738,976 | — | — | 138,738,976 |
| Equity Securities— | | | | |
| Foreign† | 1,897,780 | — | — | 1,897,780 |
| Mutual Funds/ | | | | |
| Exchange Traded | | | | |
| Funds | 23,654,211 | — | — | 23,654,211 |
| |
| † See Statement of Investments for additional detailed categorizations. | |
In January 2010, FASB issued Accounting Standards Update (“ASU”) No. 2010-06 “Improving Disclosures about FairValue Measurements”. The portions of ASU No. 2010-06 which require reporting entities to prepare new disclosures surrounding amounts and reasons for significant transfers in and out of Level 1 and Level 2 fair value measurements as well as inputs and valuation techniques used to measure fair value for both recurring and nonrecurring fair value measurements that fall in either Level 2 or Level 3 have been adopted by the fund. No significant transfers between Level 1 or Level 2 fair value measurements occurred at December 31, 2010. The remaining portion of ASU No. 2010-06 requires reporting entities to make new disclosures about information on purchases, sales, issuances and settlements on a gross basis in the reconciliation of activity in Level 3 fair value measurements. These new an d revised disclosures are required to be implemented for fiscal years
24
beginning after December 15, 2010. Management is currently evaluating the impact that the adoption of this remaining portion of ASU No. 2010-06 may have on the fund’s financial statement disclosures.
(b) Securities transactions and investment income: Securities transactions are recorded on a trade date basis. Realized gains and losses from securities transactions are recorded on the identified cost basis. Dividend income is recognized on the ex-dividend date and interest income, including, where applicable, accretion of discount and amortization of premium on investments, is recognized on the accrual basis.
Pursuant to a securities lending agreement with The Bank of New York Mellon, a subsidiary of BNY Mellon and an affiliate of Dreyfus, the fund may lend securities to qualified institutions. It is the fund’s policy that, at origination, all loans are secured by collateral of at least 102% of the value of U.S. securities loaned and 105% of the value of foreign securities loaned. Collateral equivalent to at least 100% of the market value of securities on loan is maintained at all times. Collateral is either in the form of cash, which can be invested in certain money market mutual funds managed by the Manager, U.S. Government and Agency securities or letters of credit.The fund is entitled to receive all income on securities loaned, in addition to income earned as a result of the lending transaction. Although each security loaned is fully collateralized, the fund bears the risk of delay in recovery of, or loss of rights in, the securities loaned should a borrower fail to return the securities in a timely manner. During the period ended December 31, 2010, The Bank of New York Mellon earned $19,842 from lending portfolio securities, pursuant to the securities lending agreement.
(c) Affiliated issuers: Investments in other investment companies advised by Dreyfus are defined as “affiliated” in the Act.
NOTES TO FINANCIAL STATEMENTS (continued)
The fund may invest in shares of certain affiliated investment companies also advised or managed by Dreyfus. Investments in affiliated investment companies for the period ended December 31, 2010 were as follows:
| | | | | |
| Affiliated | | | | | |
| Investment | Value | | | Value | Net |
| Company | 12/31/2009 ($) | Purchases ($) | Sales ($) | 12/31/2010 ($) Assets (%) |
| Dreyfus | | | | | |
| Institutional | | | | | |
| Preferred | | | | | |
| Plus Money | | | | | |
| Market Fund | 1,109,000 | 82,450,000 | 79,196,000 | 4,363,000 | 2.9 |
| Dreyfus | | | | | |
| Institutional | | | | | |
| Cash | | | | | |
| Advantage | | | | | |
| Fund | 15,392,634 | 92,378,092 | 93,082,474 | 14,688,252 | 9.9 |
| Total | 16,501,634 | 174,828,092 172,278,474 | 19,051,252 | 12.8 |
(d) Dividends to shareholders: Dividends are recorded on the ex-dividend date. Dividends from investment income-net and dividends from net realized capital gains, if any, are normally declared and paid annually, but the fund may make distributions on a more frequent basis to comply with the distribution requirements of the Internal Revenue Code of 1986, as amended (the “Code”).To the extent that net realized capital gains can be offset by capital loss carryovers, it is the policy of the fund not to distribute such gains. Income and capital gain distributions are determined in accordance with income tax regulations, which may differ from GAAP.
(e) Federal income taxes: It is the policy of the fund to continue to qualify as a regulated investment company, if such qualification is in the best interests of its shareholders, by complying with the applicable provisions of the Code, and to make distributions of taxable income sufficient to relieve it from substantially all federal income and excise taxes.
As of and during the period ended December 31, 2010, the fund did not have any liabilities for any uncertain tax positions.The fund recognizes interest and penalties, if any, related to uncertain tax positions as income tax expense in the Statement of Operations. During the period, the fund did not incur any interest or penalties.
26
Each of the tax years in the four-year period ended December 31, 2010 remains subject to examination by the Internal Revenue Service and state taxing authorities.
At December 31, 2010, the components of accumulated earnings on a tax basis were as follows: accumulated capital losses $67,940,046 and unrealized appreciation $22,813,481.
The accumulated capital loss carryover is available for federal income tax purposes to be applied against future net securities profits, if any, realized subsequent to December 31, 2010. If not applied, the carryover expires in fiscal 2017.
Under the recently enacted Regulated Investment Company Modernization Act of 2010, the fund will be permitted to carry forward capital losses incurred in taxable years beginning after December 22, 2010 for an unlimited period. However, any losses incurred during those future taxable years will be required to be utilized prior to the losses incurred in pre-enactment taxable years. As a result of this ordering rule, pre-enactment capital loss carryovers may be more likely to expire unused.
During the period ended December 31, 2010, as a result of permanent book to tax differences, primarily due to the tax treatment for net operating losses, the fund increased accumulated undistributed investment income-net by $724,044 and decreased paid-in capital by the same amount. Net assets and net asset value per share were not affected by this reclassification.
NOTE 2—Bank Lines of Credit:
The fund participates with other Dreyfus-managed funds in a $225 million unsecured credit facility led by Citibank, N.A. and a $300 million unsecured credit facility provided by The Bank of New York Mellon (each, a “Facility”), each to be utilized primarily for temporary or emergency purposes, including the financing of redemptions. In connection therewith, the fund has agreed to pay its pro rata portion of commitment fees for each Facility. Interest is charged to the fund based on rates determined pursuant to the terms of the respective Facility at
NOTES TO FINANCIAL STATEMENTS (continued)
the time of borrowing. During the period ended December 31, 2010, the fund did not borrow under the Facilities.
NOTE 3—Investment Advisory Fee and Other Transactions With Affiliates:
(a) Pursuant to an investment advisory agreement with the Manager, the investment advisory fee is based on the fund’s average daily net assets and is computed at the following annual rates: 1% of the first $30 million, .75% of the next $270 million, .70% of the next $200 million and .65% in excess of $500 million.The fee is payable monthly.
The Manager has agreed to waive receipt of its fees and/or assume the expenses of the fund, until February 28, 2011, so that the annual direct expenses of the fund (excluding Rule 12b-1 fees, shareholder services fees, taxes, interest, brokerage commissions, acquired fund fees and extraordinary expenses) do not exceed 1.15% of the value of the fund’s average daily net assets.The reduction in investment advisory fee, pursuant to the undertaking, amounted to $106,176 during the period ended December 31, 2010.
During the period ended December 31, 2010, the Distributor retained $5,951 from commissions earned on sales of the fund’s Class A shares and $2,898 and $2,290 from CDSCs on redemptions of the fund’s Class B and Class C shares, respectively.
(b) Under a Distribution Plan (the “Class B and C Plan”) adopted pursuant to Rule 12b-1 under the Act, Class B and Class C shares pay the Distributor for distributing their shares at an annual rate of .75% of the value of the average daily net assets of Class B and Class C shares. During the period ended December 31, 2010, Class B and Class C shares were charged $3,581 and $86,084, respectively, pursuant to the Class B and C Plan.
The fund also adopted a Distribution Plan pursuant to Rule 12b-1 under the Act applicable to its Class F shares (the “Class F Plan”). Under the Class F Plan, the fund is authorized to reimburse the Distributor for expenses paid for distributing or servicing its Class F shares at an annual rate of up to .25% of the value of the average daily net assets of the fund’s
28
Class F shares.The Distributor has agreed not to seek reimbursement of any expenses under the Class F Plan other than reimbursements for payments made to brokers and other intermediaries whose customers hold Class F shares (“Third Party Payments”).This commitment applies to any such expenses (other than Third Party Payments).This commitment will continue indefinitely and will not terminate without the prior approval of the fund’s Board of Directors. During the period ended December 31, 2010, Class F shares were charged $55,852 pursuant to the Class F Plan.
(c) Under the Shareholder Services Plan, Class A, Class B and Class C shares pay the Distributor at an annual rate of .25% of the value of their average daily net assets for the provision of certain services.The services provided may include personal services relating to shareholder accounts, such as answering shareholder inquiries regarding Class A, Class B and Class C shares and providing reports and other information, and services related to the maintenance of shareholder accounts. The Distributor may make payments to Service Agents (a securities dealer, financial institution or other industry professional) in respect of these services.The Distributor determines the amounts to be paid to Service Agents. During the period ended December 31, 2010, Class A, Class B and Class C shares were charged $62,838, $1,193 and $28,695, respectively, pursuant to the Shareholder Services Plan.
The Company has a shareholder services agreement with the Distributor, whereby the fund agrees to compensate the Distributor for providing certain shareholder servicing functions to holders of Class F shares. On an annual basis, the fund pays the Distributor a monthly fee of $24.00 per Class F shareholder account considered to be an open account at any time during a given month. During the period ended December 31, 2010, Class F shares were charged $100,376 pursuant to the shareholder services agreement.
Under its terms, the Class B and C Plan, Class F Plan and Shareholder Services Plan shall remain in effect from year to year, provided such continuance is approved annually by a vote of a majority of those Directors who are not “interested persons” of the Company and who
NOTES TO FINANCIAL STATEMENTS (continued)
have no direct or indirect financial interest in the operation of or in any agreement related to the Class B and C Plan, Class F Plan or Shareholder Services Plan.
The fund compensates Dreyfus Transfer, Inc., a wholly-owned subsidiary of the Manager, under a transfer agency agreement for providing personnel and facilities to perform transfer agency services for the fund. During the period ended December 31, 2010, the fund was charged $42,204 pursuant to the transfer agency agreement, which is included in Shareholder servicing costs in the Statement of Operations.
The fund has arrangements with the custodian and cash management bank whereby the fund may receive earnings credits when positive cash balances are maintained, which are used to offset custody and cash management fees. For financial reporting purposes, the fund includes net earnings credits as an expense offset in the Statement of Operations.
The fund compensates The Bank of New York Mellon under cash management agreements for performing cash management services related to fund subscriptions and redemptions. During the period ended December 31, 2010, the fund was charged $15,448 pursuant to the cash management agreements, which is included in Shareholder servicing costs in the Statement of Operations. These fees were partially offset by earnings credits of $794.
The fund also compensates The Bank of New York Mellon under a custody agreement for providing custodial services for the fund. During the period ended December 31, 2010, the fund was charged $4,547 pursuant to the custody agreement.
The fund has agreed to compensate the Manager for providing accounting services, administration, compliance monitoring, regulatory and shareholder reporting, as well as related facilities, equipment and clerical help.The fee is based on the fund’s average daily net assets and computed at the following annual rates: .06% of the first $500 million, .04% of the next $500 million and .02% in excess of $1 billion, plus reasonable out-of-pocket expenses.The Manager has contractually agreed in writing to waive any fees received for these services to the extent they exceed its costs in providing the services and a reasonable alloca-
30
tion of the costs incurred by the Manager and its affiliates related to the support and oversight of these services.
During the period ended December 31, 2010, the fund was charged $6,243 for services performed by the Chief Compliance Officer.
The components of “Due to The Dreyfus Corporation and affiliates” in the Statement of Assets and Liabilities consist of: investment advisory fees $100,119, Rule 12b-1 distribution plan fees $21,998, shareholder services plan fees $18,532, custodian fees $1,404, chief compliance officer fees $1,728, accounting fees $6,444 and transfer agency per account fees $4,720, which are offset against expense reimbursement currently in effect in the amount of $10,117.
(d) Effective January 1, 2010, each Director who is not an “interested person” of the Company (as defined in the Act) received $60,000 per annum, plus $7,000 per joint Board meeting of the Company, The Dreyfus/Laurel Funds, Inc., The Dreyfus/Laurel Funds Trust, The Dreyfus/Laurel Tax-Free Municipal Funds and Dreyfus Investment Funds (collectively, the “Board Group Open-End Funds”) attended, $2,500 for separate in-person committee meetings attended which are not held in conjunction with a regularly scheduled Board meeting and $2,000 for Board meetings and separate committee meetings attended that are conducted by telephone.The Board Group Open-End Funds also reimburse each Director who is not an “interested person” of the Company (as defined in the Act) for travel and out-of-pocket expenses .With respect to Board meetings, the Chairman of the Board receives an additional 25% of such compensation (with the exception of reimbursable amounts). Effective January 1, 2010, the Chair of each of the Board’s committees, unless the Chair also serves as Chair of the Board, receives $1,350 per applicable committee meeting. In the event that there is an in-person joint committee meeting or a joint telephone meeting of the Board Group Open-End Funds and Dreyfus High Yield Strategies Fund, the $2,500 or $2,000 fee, as applicable, is allocated between the Board Group Open-End Funds and Dreyfus High Yield Strategies Fund.These fees and expenses are charged and allocated to each series based on net assets.
NOTES TO FINANCIAL STATEMENTS (continued)
NOTE 4—Securities Transactions:
The aggregate amount of purchases and sales of investment securities, excluding short-term securities, during the period ended December 31, 2010, amounted to $246,981,191 and $255,008,401, respectively.
The provisions of ASC Topic 815 “Derivatives and Hedging” require qualitative disclosures about objectives and strategies for using derivatives, quantitative disclosures about fair value amounts of gains and losses on derivative instruments and disclosures about credit-risk-related contingent features in derivative agreements.The fund held no derivatives during the period ended December 31, 2010.
At December 31, 2010, the cost of investments for federal income tax purposes was $141,477,486; accordingly, accumulated net unrealized appreciation on investments was $22,813,481, consisting of $23,207,752 gross unrealized appreciation and $394,271 gross unrealized depreciation.
NOTE 5—Change in Independent Registered Public Accounting Firm:
Ernst &Young LLP (“E&Y”), an independent registered public accounting firm, was the independent registered public accounting firm for the fund for the fiscal years ended December 31, 2009 and 2008. At the meeting held on February 9, 2010, the Audit Committee and the Board of Directors of the Company engaged KPMG LLP to replace E&Y as the independent registered public accounting firm for the Company.
During the fund’s two fiscal years ended December 31, 2009 and 2008: (i) no report on the fund’s financial statements contained an adverse opinion or a disclaimer of opinion, or was qualified or modified as to uncertainty, audit scope, or accounting principles; and (ii) there were no “disagreements” (as such term is used in Item 304 of Regulation S-K) with E&Y on any matter of accounting principles or practices, financial statement disclosure, or auditing scope or procedure, which disagree-ment(s), if not resolved to the satisfaction of E&Y, would have caused it to make reference to the subject matter of the disagreement(s) in connection with its report.
32
|
| REPORT OF INDEPENDENT REGISTERED |
| PUBLIC ACCOUNTING FIRM |
The Board of Directors and Shareholders of Dreyfus Funds Inc.
We have audited the accompanying statement of assets and liabilities of Dreyfus Mid-Cap Growth Fund (the “Fund”), a series of Dreyfus Funds Inc., including the statements of investments as of December 31, 2010, and the related statement of operations, the statement of changes in net assets and financial highlights for the year then ended. These financial statements and financial highlights are the responsibility of the Fund’s management. Our responsibility is to express an opinion on these financial statements and financial highlights based on our audit.The statement of changes in net assets for the year ended December 31, 2009 and the financial highlights for each of the years in the four-year period ended December 31, 2009 were audited by other independent registered public accountants whose report thereon, dated February 25, 2010, expressed an unqualified opinion on that statement of changes i n net assets and those financial highlights.
We conducted our audit in accordance with the standards of the Public Company Accounting Oversight Board (United States).Those standards require that we plan and perform the audit to obtain reasonable assurance about whether the financial statements and financial highlights are free of material misstatement. An audit includes examining, on a test basis, evidence supporting the amounts and disclosures in the financial statements. Our procedures included confirmation of securities owned as of December 31, 2010, by correspondence with the custodian and brokers or by other appropriate auditing procedures where replies from brokers were not received.An audit also includes assessing the accounting principles used and significant estimates made by management, as well as evaluating the overall financial statement presentation.We believe that our audit provides a reasonable basis for our opinion.
In our opinion, the financial statements and financial highlights referred to above present fairly, in all material respects, the financial position of Dreyfus Mid-Cap Growth Fund as of December 31, 2010, and the results of its operations, the changes in its net assets, and the financial highlights for the year then ended, in conformity with U.S. generally accepted accounting principles.

New York, New York
February 25, 2011

OFFICERS OF THE FUND (Unaudited)
BRADLEY J. SKAPYAK, President since January 2010.
Chief Operating Officer and a director of the Manager since June 2009. From April 2003 to June 2009, Mr. Skapyak was the head of the Investment Accounting and Support Department of the Manager. He is an officer of 76 investment companies (comprised of 169 portfolios) managed by the Manager. He is 52 years old and has been an employee of the Manager since February 1988.
PHILLIP N. MAISANO, Executive Vice President since September 2009.
Chief Investment Officer,Vice Chair and a director of the Manager, and an officer of 76 investment companies (comprised of 169 portfolios) managed by the Manager. Mr. Maisano also is an officer and/or Board member of certain other investment management subsidiaries of The Bank of New York Mellon Corporation, each of which is an affiliate of the Manager. He is 63 years old and has been an employee of the Manager since November 2006. Prior to joining the Manager, Mr. Maisano served as Chairman and Chief Executive Officer of EACM Advisors, an affiliate of the Manager, since August 2004.
MICHAEL A. ROSENBERG, Vice President and Secretary since September 2009.
Assistant General Counsel of BNY Mellon, and an officer of 77 investment companies (comprised of 194 portfolios) managed by the Manager. He is 50 years old and has been an employee of the Manager since October 1991.
KIESHA ASTWOOD, Vice President and Assistant Secretary since January 2010.
Counsel of BNY Mellon, and an officer of 77 investment companies (comprised of 194 portfolios) managed by the Manager. She is 37 years old and has been an employee of the Manager since July 1995.
JAMES BITETTO, Vice President and Assistant Secretary since September 2009.
Senior Counsel of BNY Mellon and Secretary of the Manager, and an officer of 77 investment companies (comprised of 194 portfolios) managed by the Manager. He is 44 years old and has been an employee of the Manager since December 1996.
JONI LACKS CHARATAN, Vice President and Assistant Secretary since September 2009.
Senior Counsel of BNY Mellon, and an officer of 77 investment companies (comprised of 194 portfolios) managed by the Manager. She is 55 years old and has been an employee of the Manager since October 1988.
JOSEPH M. CHIOFFI, Vice President and Assistant Secretary since September 2009.
Senior Counsel of BNY Mellon, and an officer of 77 investment companies (comprised of 194 portfolios) managed by the Manager. He is 49 years old and has been an employee of the Manager since June 2000.
KATHLEEN DENICHOLAS, Vice President and Assistant Secretary since January 2010.
Senior Counsel of BNY Mellon, and an officer of 77 investment companies (comprised of 194 portfolios) managed by the Manager. She is 36 years old and has been an employee of the Manager since February 2001.
JANETTE E. FARRAGHER, Vice President and Assistant Secretary since September 2009.
Assistant General Counsel of BNY Mellon, and an officer of 77 investment companies (comprised of 194 portfolios) managed by the Manager. She is 48 years old and has been an employee of the Manager since February 1984.
36
JOHN B. HAMMALIAN, Vice President and Assistant Secretary since September 2009.
Managing Counsel of BNY Mellon, and an officer of 77 investment companies (comprised of 194 portfolios) managed by the Manager. He is 47 years old and has been an employee of the Manager since February 1991.
M. CRISTINA MEISER, Vice President and Assistant Secretary since January 2010.
Senior Counsel of BNY Mellon, and an officer of 77 investment companies (comprised of 194 portfolios) managed by the Manager. She is 40 years old and has been an employee of the Manager since August 2001.
ROBERT R. MULLERY, Vice President and Assistant Secretary since September 2009.
Managing Counsel of BNY Mellon, and an officer of 77 investment companies (comprised of 194 portfolios) managed by the Manager. He is 58 years old and has been an employee of the Manager since May 1986.
JEFF PRUSNOFSKY, Vice President and Assistant Secretary since September 2009.
Managing Counsel of BNY Mellon, and an officer of 77 investment companies (comprised of 194 portfolios) managed by the Manager. He is 45 years old and has been an employee of the Manager since October 1990.
JAMES WINDELS, Treasurer since September 2009.
Director – Mutual Fund Accounting of the Manager, and an officer of 77 investment companies (comprised of 194 portfolios) managed by the Manager. He is 52 years old and has been an employee of the Manager since April 1985.
RICHARD CASSARO, Assistant Treasurer since September 2009.
Senior Accounting Manager – Money Market and Municipal Bond Funds of the Manager, and an officer of 77 investment companies (comprised of 194 portfolios) managed by the Manager. He is 51 years old and has been an employee of the Manager since September 1982.
GAVIN C. REILLY, Assistant Treasurer since September 2009.
Tax Manager of the Investment Accounting and Support Department of the Manager, and an officer of 77 investment companies (comprised of 194 portfolios) managed by the Manager. He is 42 years old and has been an employee of the Manager since April 1991.
ROBERT ROBOL, Assistant Treasurer since September 2006.
Senior Accounting Manager – Fixed Income Funds of the Manager, and an officer of 77 investment companies (comprised of 194 portfolios) managed by the Manager. He is 46 years old and has been an employee of the Manager since October 1988.
ROBERT SALVIOLO, Assistant Treasurer since May 2007.
Senior Accounting Manager – Equity Funds of the Manager, and an officer of 77 investment companies (comprised of 194 portfolios) managed by the Manager. He is 43 years old and has been an employee of the Manager since June 1989.
OFFICERS OF THE FUND (Unaudited) (continued)
ROBERT SVAGNA, Assistant Treasurer since September 2006.
Senior Accounting Manager – Equity Funds of the Manager, and an officer of 77 investment companies (comprised of 194 portfolios) managed by the Manager. He is 43 years old and has been an employee of the Manager since November 1990.
JOSEPH W. CONNOLLY, Chief Compliance Officer since September 2009.
Chief Compliance Officer of the Manager and The Dreyfus Family of Funds (77 investment companies, comprised of 194 portfolios). From November 2001 through March 2004, Mr. Connolly was first Vice-President, Mutual Fund Servicing for Mellon Global Securities Services. In that capacity, Mr. Connolly was responsible for managing Mellon’s Custody, Fund Accounting and Fund Administration services to third-party mutual fund clients. He is 53 years old and has served in various capacities with the Manager since 1980, including manager of the firm’s Fund Accounting Department from 1997 through October 2001.
NATALIA GRIBAS, Anti-Money Laundering Compliance Officer since July 2010.
Anti-Money Laundering Compliance Officer of the Distributor, and the Anti-Money Laundering Compliance Officer of 73 investment companies (comprised of 190 portfolios) managed by the Manager. She is 40 years old and has been an employee of the Distributor since September 2008.
38
Item 2. Code of Ethics.
The Registrant has adopted a code of ethics that applies to the Registrant's principal executive officer, principal financial officer, principal accounting officer or controller, or persons performing similar functions. There have been no amendments to, or waivers in connection with, the Code of Ethics during the period covered by this Report.
Item 3. Audit Committee Financial Expert.
The Registrant's Board has determined that Joseph S. DiMartino, a member of the Audit Committee of the Board, is an audit committee financial expert as defined by the Securities and Exchange Commission (the "SEC"). Joseph S. DiMartino is "independent" as defined by the SEC for purposes of audit committee financial expert determinations.
Item 4. Principal Accountant Fees and Services.
(a) Audit Fees. The aggregate fees billed for each of the last two fiscal years (the "Reporting Periods") for professional services rendered by the Registrant's principal accountant (the "Auditor") for the audit of the Registrant's annual financial statements or services that are normally provided by the Auditor in connection with the statutory and regulatory filings or engagements for the Reporting Periods, were $94,368 in 2009 and $48,600 in 2010.
(b) Audit-Related Fees. The aggregate fees billed in the Reporting Periods for assurance and related services by the Auditor that are reasonably related to the performance of the audit of the Registrant's financial statements and are not reported under paragraph (a) of this Item 4 were $23,175 in 2009 and $8,600 in 2010. These services consisted of one or more of the following: (i) agreed upon procedures related to compliance with Internal Revenue Code section 817(h), (ii) security counts required by Rule 17f-2 under the Investment Company Act of 1940, as amended, (iii) advisory services as to the accounting or disclosure treatment of Registrant transactions or events and (iv) advisory services to the accounting or disclosur e treatment of the actual or potential impact to the Registrant of final or proposed rules, standards or interpretations by the Securities and Exchange Commission, the Financial Accounting Standards Boards or other regulatory or standard-setting bodies.
The aggregate fees billed in the Reporting Periods for non-audit assurance and related services by the Auditor to the Registrant's investment adviser (not including any sub-investment adviser whose role is primarily portfolio management and is subcontracted with or overseen by another investment adviser), and any entity controlling, controlled by or under common control with the investment adviser that provides ongoing services to the Registrant ("Service Affiliates"), that were reasonably related to the performance of the annual audit of the Service Affiliate, which required pre-approval by the Audit Committee were $0 in 2009 and $0 in 2010.
(c) Tax Fees. The aggregate fees billed in the Reporting Periods for professional services rendered by the Auditor for tax compliance, tax advice, and tax planning ("Tax Services") were $1,826 in 2009 and $5,000 in 2010. These services consisted of: (i) review or preparation of U.S. federal, state, local and excise tax returns; (ii) U.S. federal, state and local tax planning, advice and assistance regarding statutory, regulatory or administrative developments; (iii) tax advice regarding tax qualification matters and/or treatment of various financial instruments held or proposed to be acquired or held, and (iv) determination of Passive Foreign Investment Companies. The aggregate fees billed in the Reporting Periods for Tax Services by the Auditor to Service Affiliates, which required pre-approval by the Audit Committee were $0 in 2009 and $0 in 2010.
(d) All Other Fees. The aggregate fees billed in the Reporting Periods for products and services provided by the Auditor, other than the services reported in paragraphs (a) through (c) of this Item, were $158 in 2009 and $0 in 2010. [These services consisted of a review of the Registrant's anti-money laundering program].
The aggregate fees billed in the Reporting Periods for Non-Audit Services by the Auditor to Service Affiliates, other than the services reported in paragraphs (b) through (c) of this Item, which required pre-approval by the Audit Committee, were $0 in 2009 and $0 in 2010.
(e)(1) Audit Committee Pre-Approval Policies and Procedures. The Registrant's Audit Committee has established policies and procedures (the "Policy") for pre-approval (within specified fee limits) of the Auditor's engagements for non-audit services to the Registrant and Service Affiliates without specific case-by-case consideration. The pre-approved services in the Policy can include pre-approved audit services, pre-approved audit-related services, pre-approved tax services and pre-approved all other services. Pre-approval considerations include whether the proposed services are compatible with maintaining the Auditor's independence. Pre-approvals pursuant to the Policy are considered annually.
(e)(2) Note: None of the services described in paragraphs (b) through (d) of this Item 4 were approved by the Audit Committee pursuant to paragraph (c)(7)(i)(C) of Rule 2-01 of Regulation S-X.
(f) None of the hours expended on the principal accountant's engagement to audit the registrant's financial statements for the most recent fiscal year were attributed to work performed by persons other than the principal account's full-time, permanent employees.
Non-Audit Fees. The aggregate non-audit fees billed by the Auditor for services rendered to the Registrant, and rendered to Service Affiliates, for the Reporting Periods were $24,975,296 in 2009 and $3,693,000 in 2010.
Auditor Independence. The Registrant's Audit Committee has considered whether the provision of non-audit services that were rendered to Service Affiliates, which were not pre-approved (not requiring pre-approval), is compatible with maintaining the Auditor's independence.
Item 5. Audit Committee of Listed Registrants.
Not applicable. [CLOSED-END FUNDS ONLY]
Item 6. Investments.
(a) Not applicable.
Item 7. Disclosure of Proxy Voting Policies and Procedures for Closed-End Management Investment Companies.
Not applicable. [CLOSED-END FUNDS ONLY]
Item 8. Portfolio Managers of Closed-End Management Investment Companies.
Not applicable. [CLOSED-END FUNDS ONLY, beginning with reports for periods ended on and after December 31, 2005]
Item 9. Purchases of Equity Securities by Closed-End Management Investment Companies and Affiliated Purchasers.
Not applicable. [CLOSED-END FUNDS ONLY]
Item 10. Submission of Matters to a Vote of Security Holders.
There have been no material changes to the procedures applicable to Item 10.
Item 11. Controls and Procedures.
(a) The Registrant's principal executive and principal financial officers have concluded, based on their evaluation of the Registrant's disclosure controls and procedures as of a date within 90 days of the filing date of this report, that the Registrant's disclosure controls and procedures are reasonably designed to ensure that information required to be disclosed by the Registrant on Form N-CSR is recorded, processed, summarized and reported within the required time periods and that information required to be disclosed by the Registrant in the reports that it files or submits on Form N-CSR is accumulated and communicated to the Registrant's management, including its principal executive and principal financial officers, as appropriate to allow timely decisions regarding required disclosure.
(b) There were no changes to the Registrant's internal control over financial reporting that occurred during the second fiscal quarter of the period covered by this report that have materially affected, or are reasonably likely to materially affect, the Registrant's internal control over financial reporting.
Item 12. Exhibits.
(a)(1) Code of ethics referred to in Item 2.
(a)(2) Certifications of principal executive and principal financial officers as required by Rule 30a-2(a) under the Investment Company Act of 1940.
(a)(3) Not applicable.
(b) Certification of principal executive and principal financial officers as required by Rule 30a-2(b) under the Investment Company Act of 1940.
SIGNATURES
Pursuant to the requirements of the Securities Exchange Act of 1934 and the Investment Company Act of 1940, the Registrant has duly caused this Report to be signed on its behalf by the undersigned, thereunto duly authorized.
Dreyfus Funds, Inc.
By: /s/ Bradley J. Skapyak |
Bradley J. Skapyak, President |
Date: February 23, 2011 |
|
Pursuant to the requirements of the Securities Exchange Act of 1934 and the Investment Company Act of 1940, this Report has been signed below by the following persons on behalf of the Registrant and in the capacities and on the dates indicated. |
|
By: /s/ Bradley J. Skapyak |
Bradley J. Skapyak, President |
Date: February 23, 2011 |
|
By: /s/ James Windels |
James Windels, Treasurer |
Date: February 23, 2011 |
|
EXHIBIT INDEX
(a)(1) Code of ethics referred to in Item 2.
(a)(2) Certifications of principal executive and principal financial officers as required by Rule 30a-2(a) under the Investment Company Act of 1940. (EX-99.CERT)
(b) Certification of principal executive and principal financial officers as required by Rule 30a-2(b) under the Investment Company Act of 1940. (EX-99.906CERT)