UNITED STATES
SECURITIES AND EXCHANGE COMMISSION
Washington, D.C. 20549 |
CERTIFIED SHAREHOLDER REPORT OF REGISTERED MANAGEMENT
INVESTMENT COMPANIES |
Investment Company Act file number: 811-1018
Dreyfus Funds, Inc.
---------------------------------------------------------------
(Exact name of registrant as specified in charter) |
210 University Boulevard, Suite 800, Denver, Colorado 80206
---------------------------------------------------------------
(Address of principal executive offices) (Zip code) |
Kenneth R. Christoffersen, Esq.
210 University Boulevard, Suite 800, Denver, Colorado 80206
---------------------------------------------------------------
(Name and address of agent for service) |
Registrant's telephone number, including area code: 303-394-4404
Date of fiscal year end: December 31
Date of reporting period: December 31, 2008
ITEM 1. REPORTS TO STOCKHOLDERS |
| | Discovery Fund is closed to new investors.
Please see the prospectus for additional information. |
| | ANNUAL REPORT December 31, 2008 |

Save time. Save paper. View your next shareholder report online as soon as it’s available. Log into www.dreyfus.com and sign up for Dreyfus eCommunications. It’s simple and only takes a few minutes.
The views expressed in this report reflect those of the portfolio manager only through the end of the period covered and do not necessarily represent the views of Dreyfus, Founders or any other person in our organization. Any such views are subject to change at any time based upon market or other conditions and we disclaim any responsibility to update such views. These views may not be relied on as investment advice and, because investment decisions for a Dreyfus fund are based on numerous factors, may not be relied on as an indication of trading intent on behalf of any Dreyfus fund.

| | Contents |
| |
| | THE FUND |
| |
| 2 | A Letter from the Chairman |
| |
| 3 | Discussion of Fund Performance |
| |
| 6 | Fund Performance |
| |
| 8 | Understanding Your Fund’s Expenses |
| |
| 8 | Comparing Your Fund’s Expenses With Those of Other Funds |
| |
| 9 | Statement of Investments |
| |
| 15 | Statement of Assets and Liabilities |
| |
| 16 | Statement of Operations |
| |
| 17 | Statement of Changes in Net Assets |
| |
| 19 | Financial Highlights |
| |
| 25 | Notes to Financial Statements |
| |
| 37 | Report of Independent Registered Public Accounting Firm |
| |
| 38 | Factors Considered in Renewing the Advisory Agreement |
| |
| 46 | Your Board Representatives |
| |
| | FOR MORE INFORMATION |
| |
| | Back Cover |
| |
The Fund

A LETTER FROM THE CHAIRMAN
Dear Shareholder: |
We present to you this annual report for Dreyfus Discovery Fund, covering the 12-month period from January 1, 2008, through December 31, 2008.
2008 was the most difficult year in decades for the economy and stock market.A credit crunch that originated in 2007 in the U.S. sub-prime mortgage market exploded in mid-2008 into a global financial crisis, resulting in the failures of major financial institutions, a deep and prolonged recession and lower investment values across a broad range of asset classes. Governments and regulators throughout the world moved aggressively to curtail the damage, implementing unprecedented reductions of short-term interest rates, massive injections of liquidity into the banking system, government bailouts of struggling companies and plans for massive economic stimulus programs. After several years of strong relative returns, international stocks generally declined more sharply than their U.S. counterparts.
Although we expect the U.S. and global economies to remain weak until longstanding imbalances have worked their way out of the system, the financial markets currently appear to have priced in investors’ generally low expectations. In previous recessions, however, the markets have tended to anticipate economic improvement before it occurs, potentially leading to major rallies when few expected them. That’s why it makes sense to remain disciplined, maintain a long-term perspective and adopt a consistent asset allocation strategy that reflects one’s future goals and attitudes toward risk. As always, we urge you to consult with your financial advisor, who can recommend the course of action that is right for you. For information about how the fund performed during the reporting period, as well as market perspectives, we have provided a Discussion of Fund Performance given by the fund’s Portfolio Manager.
Thank you for your continued confidence and support.
J. David Officer
Chairman, President and Chief Executive Officer
Founders Asset Management LLC
January 15, 2009 |
2

DISCUSSION OF FUND PERFORMANCE
For the period of January 1, 2008, through December 31, 2008, as provided by B. Randall Watts, Jr., CFA, Portfolio Manager
Fund and Market Performance Overview
For the 12-month period ended December 31, 2008, Dreyfus Discovery Fund’s Class A shares produced a total return of –38.41%, Class B shares returned –38.95%, Class C shares returned –38.93%, Class F shares returned –38.22%, Class I shares returned –38.32% and Class T shares returned –38.68% .1 In comparison, the Russell 2000 Growth Index, the fund’s benchmark, produced a total return of –38.54% for the reporting period.2
Like other capitalizations ranges, small-cap stocks fell sharply in 2008, particularly over the second half of the year, amid an intensifying economic downturn and a global financial crisis.The fund produced returns that were roughly in line with its benchmark, as strong stock selections in the consumer discretionary, industrials and financials sectors offset disappointments in the health care and energy sectors.
The Fund’s Investment Approach
The fund invests primarily in small U.S.-based companies that we believe possess high-growth potential. The fund may also invest in larger companies if, in our opinion, they represent better prospects for capital appreciation.We use a “growth style” of investing, searching for companies whose fundamental strengths suggest the potential to provide superior earnings growth over time. Our “bottom-up” approach emphasizes individual stock selection.We go beyond Wall Street analysis and perform intensive qualitative and quantitative in-house research to determine whether companies meet our investment criteria.
Extreme Volatility Roiled the Financial Markets
After producing relatively modest declines over the first half of 2008, small-cap stocks tumbled during the second half.The bear market was triggered by the intensification of a credit crisis that began in 2007 and mushroomed in September 2008 with the failures of several major financial institutions. These developments exacerbated an ongoing economic slowdown, as lenders grew reluctant to extend credit even to
The Fund 3
| DISCUSSION OF FUND PERFORMANCE (continued) |
some of their most trusted customers, causing consumer spending and business investment to decline sharply, unemployment to rise and commodity prices to retreat from previous record levels. In late November, the National Bureau of Economic Research confirmed that the U.S. economy was mired its first recession since 2001.
Mixed Results Across Economic Sectors
Not surprisingly, the credit crisis was particularly hard on financial stocks. Because the fund held underweighted exposure to the financials sector, it was sheltered from the full brunt of volatility. In addition, our security selection strategy focused on companies that were relatively insulated from the banking crisis, including insurers such as Arch Capital Group, RLI Corp. and ProAssurance.
Traditionally economically sensitive consumer discretionary stocks also comprised one of the poorer performing sectors for the benchmark, but comprised one of the better areas for the fund.The fund achieved strongly positive absolute returns from specialty retailer Panera Bread, which was able to pass along higher food costs to its customers through frequent menu changes. Gaming companies WMS Industries and Bally Technologies bucked sagging industry trends as state governments expanded the availability of video lottery terminals to raise revenues. The fund’s holdings of luxury goods purveyors also held up relatively well, as consumer demand remained strong for specialty retailers including footwear and apparel chains Steve Madden,Volcom and True Religion Apparel, among others. We subsequently sold Volcom and True Religion Apparel to lock in gains. In the industrials sector, the fund received positive contributions to relative performance from business and legal services provider Huron Consulting Group, which we sold before it encountered greater weakness.
Although the health care sector historically has been considered a defensive haven during downturns, it produced returns in 2008 that, on average, lagged the overall small-cap market.The fund’s health care holdings fared somewhat worse than the sector overall, due mainly to our focus on several biotechnology companies that, in our judgment, have strong long-term prospects but suffered over the near term when large pharmaceutical companies cut their research-and-development budgets. Lifescience tools maker Covance, which was sold during the reporting period, also was hurt due to budget pressures.
4
The fund generated mixed results in the energy sector, where exploration-and-production companies fared relatively well but equipment-and-services firms disappointed. We focused on the latter industry group, which historically has been less sensitive to changing commodity prices. However, reduced spending by major integrated oil producers and reduced access to credit produced weakness in holdings such as Hornbeck Offshore Services, ION Geophysical, ENGlobal and Union Drilling, all of which were eliminated from the fund. NATCO Group and Dril-Quip also declined but were retained through year-end.
Managing Risks Through Diversification
As 2009 begins, the economic climate remains bleak.Therefore, we have maintained a generally defensive investment posture, reducing the fund’s exposure to consumer-oriented companies and maintaining an underweighted position in the industrials sector and, to a lesser extent, the information technology sector. Instead, we have found more opportunities among financial companies, where we have focused on insurers and avoided commercial banks, and the health care sector, where certain positive, long-term trends remain intact. In our view, these strategies and a well diversified portfolio will help the fund weather the current storm.
January 15, 2009
Small companies carry additional risks because their earnings and revenues tend to be less
predictable, and their share prices more volatile than those of larger, more established
companies. The shares of smaller companies tend to trade less frequently than those of
larger, more established companies.
Part of the fund’s recent performance is attributable to positive returns from its initial public
offering (IPO) investments. There can be no guarantee that IPOs will have or continue to
have a positive effect on fund performance.
Part of the fund’s historical performance is due to amounts received from class action
settlements regarding prior fund holdings. There is no guarantee that these settlement
distributions will occur in the future or have a similar impact on performance. |
| 1 | Total return includes reinvestment of dividends and any capital gains paid, and does not take into consideration the maximum initial sales charges in the case of Class A and Class T shares, or the applicable contingent deferred sales charges imposed on redemptions in the case of Class B and Class C shares. Had these charges been reflected, returns would have been lower. Past performance is no guarantee of future results. Share price and investment return fluctuate such that upon redemption, fund shares may be worth more or less than their original cost. |
| |
| 2 | SOURCE: LIPPER INC. – Reflects reinvestment of dividends and, where applicable, capital gains distributions.The Russell 2000 Growth Index is an unmanaged index, which measures the performance of those Russell 2000 companies with higher price-to-book ratios and higher forecasted growth values.The total return figure cited for this index assumes change in security prices and reinvestment of dividends, but does not reflect the costs of managing a mutual fund. |
| |
The Fund 5
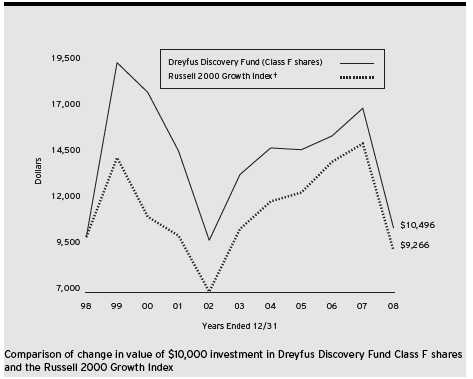
† Source: Lipper Inc.
Past performance is not predictive of future performance.
Part of the fund’s recent performance is attributable to positive returns from its initial public offering (IPO) investments. There can be no guarantee that IPOs will have or continue to have a positive effect on fund performance.
The above graph compares a $10,000 investment made in Class F shares of Dreyfus Discovery Fund on 12/31/98 to a $10,000 investment made in the Russell 2000 Growth Index (the “Index”) on that date. All dividends and capital gain distributions are reinvested. Performance for Class A, Class B, Class C, Class I and Class T shares will vary from the performance of Class F shares shown above due to differences in charges and expenses.
The fund’s performance shown in the line graph takes into account all applicable Class F fees and expenses (after any expense reimbursements).The Index is an unmanaged index, which measures the performance of those Russell 2000 companies with higher price-to-book ratios and higher forecasted growth values. Unlike a mutual fund, the Index is not subject to charges, fees and other expenses. Investors cannot invest directly in any index. Further information relating to fund performance, including expense reimbursements, if applicable, is contained in the Financial Highlights section of the prospectus and elsewhere in this report.
6
| Average Annual Total Returns as of 12/31/08 | | | | | | |
| |
| | | Inception | | | | | | | | From |
| | | Date | | 1 Year | | 5 Years | | 10 Years | | Inception |
| |
| |
| |
| |
| |
|
| Class A shares | | | | | | | | | | |
| with maximum sales charge (5.75%) | | 12/31/99 | | (41.95)% | | (6.07)% | | — | | (7.32)% |
| without sales charge | | 12/31/99 | | (38.41)% | | (4.95)% | | — | | (6.71)% |
| Class B shares | | | | | | | | | | |
| with applicable redemption charge † | | 12/31/99 | | (41.39)% | | (6.25)% | | — | | (7.27)%†† |
| without redemption | | 12/31/99 | | (38.95)% | | (5.87)% | | — | | (7.27)%†† |
| Class C shares | | | | | | | | | | |
| with applicable redemption charge ††† | | 12/31/99 | | (39.54)% | | (5.72)% | | — | | (7.49)% |
| without redemption | | 12/31/99 | | (38.93)% | | (5.72)% | | — | | (7.49)% |
| Class F shares | | 12/29/89 | | (38.22)% | | (4.77)% | | 0.49% | | N/A |
| Class I shares | | 12/31/99 | | (38.32)% | | (4.64)% | | — | | (6.44)% |
| Class T shares | | | | | | | | | | |
| with applicable sales charge (4.5%) | | 12/31/99 | | (41.44)% | | (6.16)% | | — | | (7.57)% |
| without sales charge | | 12/31/99 | | (38.68)% | | (5.29)% | | — | | (7.09)% |
Past performance is not predictive of future performance.The fund’s performance shown in the graph and table does not reflect the deduction of taxes that a shareholder would pay on fund distributions or the redemption of fund shares. Part of the fund’s historical performance is due to amounts received from class action settlements regarding prior fund holdings. There is no guarantee that these settlement distributions will occur in the future or have a similar impact on performance.
| † The maximum contingent deferred sales charge for Class B shares is 4%. After six years Class B shares convert to |
| Class A shares. |
| †† | | Assumes the conversion of Class B shares to Class A shares at the end of the sixth year following the date |
| | | of purchase. |
| ††† | | The maximum contingent deferred sales charge for Class C shares is 1% for shares redeemed within one year of the |
| | | date of purchase. |
The Fund 7
UNDERSTANDING YOUR FUND’S EXPENSES (Unaudited)
As a mutual fund investor, you pay ongoing expenses, such as management fees and other expenses. Using the information below, you can estimate how these expenses affect your investment and compare them with the expenses of other funds.You also may pay one-time transaction expenses, including sales charges (loads) and redemption fees, which are not shown in this section and would have resulted in higher total expenses. For more information, see your fund's prospectus or talk to your financial advisor.
Review your fund’s expenses
The table below shows the expenses you would have paid on a $1,000 investment in Dreyfus Discovery Fund from July 1, 2008 to December 31, 2008. It also shows how much a $1,000 investment would be worth at the close of the period, assuming actual returns and expenses.To estimate the expenses you paid on your account over this period, simply divide your account value by $1,000 (for example, an $8,600 account value divided by $1,000 = 8.60), then multiply the results by the number in the Expenses paid per $1,000 line for the class of shares you own.
| | Expenses and Value of a $1,000 Investment
assuming actual returns for the six months ended December 31, 2008 |
| | | Class A | | Class B | | Class C | | Class F | | Class I | | Class T |
| |
| |
| |
| |
| |
| |
|
| Expenses paid | | | | | | | | | | | | |
| per $1,000† | | $ 8.06 | | $ 11.16 | | $ 11.29 | | $ 6.37 | | $ 7.17 | | $ 9.48 |
| Ending value | | | | | | | | | | | | |
| (after expenses) | | $678.10 | | $675.90 | | $675.20 | | $679.50 | | $678.50 | | $676.70 |
COMPARING YOUR FUND’S EXPENSES
WITH THOSE OF OTHER FUNDS (Unaudited) |
Using the SEC’s method to compare expenses
The Securities and Exchange Commission (SEC) has established guidelines to help investors assess fund expenses. Per these guidelines, the table below shows your fund’s expenses based on a $1,000 investment, assuming a hypothetical 5% annualized return. You can use this information to compare the ongoing expenses (but not transaction expenses or total cost) of investing in the fund with those of other funds.All mutual fund shareholder reports will provide this information to help you make this comparison. Please note that you cannot use this information to estimate your actual ending account balance and expenses paid during the period.
| | Expenses and Value of a $1,000 Investment
assuming a hypothetical 5% annualized return for the six months ended December 31, 2008 |
| | | Class A | | Class B | | Class C | | Class F | | Class I | | Class T |
| |
| |
| |
| |
| |
| |
|
| Expenses paid | | | | | | | | | | | | |
| per $1,000† | | $ 9.68 | | $ 13.40 | | $ 13.55 | | $ 7.66 | | $ 8.62 | | $ 11.39 |
| Ending value | | | | | | | | | | | | |
| (after expenses) | | $1,015.53 | | $1,011.81 | | $1,011.66 | | $1,017.55 | | $1,016.59 | | $1,013.83 |
| † Expenses are equal to the fund’s annualized expense ratio of 1.91% for Class A shares, 2.65% for Class B shares, |
| 2.68% for Class C shares, 1.51% for Class F shares, 1.70% for Class I shares and 2.25% for Class T shares; |
| multiplied by the average account value over the period, multiplied by 184/366 (to reflect the one-half year period). |
8
STATEMENT OF INVESTMENTS
December 31, 2008 |
| Common Stocks—97.6% | | Shares | | Value ($) |
| |
| |
|
| Aerospace & Defense—2.6% | | | | |
| ManTech International, Cl. A | | 52,990 a | | 2,871,528 |
| Orbital Sciences | | 10,780 a | | 210,533 |
| | | | | 3,082,061 |
| Air Freight & Logistics—3.0% | | | | |
| Forward Air | | 43,140 | | 1,047,008 |
| UTi Worldwide | | 176,980 | | 2,537,893 |
| | | | | 3,584,901 |
| Apparel Retail—1.1% | | | | |
| Bebe Stores | | 84,570 | | 631,738 |
| Chico's FAS | | 172,160 a | | 719,629 |
| | | | | 1,351,367 |
| Apparel, Accessories & Luxury Goods—1.2% | | | | |
| Carter's | | 72,540 a | | 1,397,120 |
| Application Software—1.3% | | | | |
| Concur Technologies | | 46,970 a | | 1,541,555 |
| Biotechnology—7.2% | | | | |
| Acorda Therapeutics | | 32,500 a | | 666,575 |
| Alexion Pharmaceuticals | | 41,540 a | | 1,503,333 |
| Alnylam Pharmaceuticals | | 57,020 a | | 1,410,105 |
| BioMarin Pharmaceutical | | 59,780 a | | 1,064,084 |
| Celera | | 53,170 a | | 591,782 |
| Enzon Pharmaceuticals | | 102,720 a | | 598,858 |
| Kendle International | | 13,310 a | | 342,333 |
| OSI Pharmaceuticals | | 29,630 a | | 1,157,051 |
| Regeneron Pharmaceuticals | | 32,310 a | | 593,212 |
| United Therapeutics | | 11,750 a | | 734,963 |
| | | | | 8,662,296 |
| Casinos & Gaming—2.5% | | | | |
| Bally Technologies | | 52,608 a | | 1,264,170 |
| WMS Industries | | 64,910 a | | 1,746,079 |
| | | | | 3,010,249 |
| Communications Equipment—3.3% | | | | |
| Arris Group | | 165,160 a | | 1,313,022 |
| BigBand Networks | | 102,740 a | | 567,125 |
| Neutral Tandem | | 126,656 a | | 2,054,360 |
| | | | | 3,934,507 |
The Fund 9
| STATEMENT OF INVESTMENTS (continued) |
| Common Stocks (continued) | | Shares | | Value ($) |
| |
| |
|
| Construction & Engineering—1.4% | | | | |
| Quanta Services | | 84,950 a | | 1,682,010 |
| Consumer Finance—.7% | | | | |
| EZCORP, Cl. A | | 54,100 a | | 822,861 |
| Data Processing & Outsourced Services—2.2% | | | | |
| Metavante Technologies | | 82,529 a | | 1,329,542 |
| NeuStar, Cl. A | | 69,760 a | | 1,334,509 |
| | | | | 2,664,051 |
| Electric Utilities—.5% | | | | |
| UniSource Energy | | 22,110 | | 649,150 |
| Electronic Equipment & Instruments—1.6% | | | | |
| Cogent | | 98,400 a | | 1,335,288 |
| II-VI | | 33,960 a | | 648,296 |
| | | | | 1,983,584 |
| Electronic Manufacturing Services—.7% | | | | |
| IPG Photonics | | 67,110 a | | 884,510 |
| Environmental & Facilities Services—1.8% | | | | |
| Clean Harbors | | 33,300 a | | 2,112,552 |
| Food Distributors—1.6% | | | | |
| Spartan Stores | | 83,820 | | 1,948,815 |
| Food Retail—1.3% | | | | |
| Ruddick | | 54,940 | | 1,519,091 |
| Footwear—1.0% | | | | |
| Skechers USA, Cl. A | | 44,500 a | | 570,490 |
| Steven Madden | | 26,760 a | | 570,523 |
| | | | | 1,141,013 |
| Gas Utilities—.5% | | | | |
| Energen | | 21,920 | | 642,914 |
| Health Care Distributors—1.9% | | | | |
| Owens & Minor | | 18,140 | | 682,971 |
| PSS World Medical | | 83,380 a | | 1,569,212 |
| | | | | 2,252,183 |
| Health Care Equipment—10.3% | | | | |
| CONMED | | 73,580 a | | 1,761,505 |
| Exactech | | 30,310 a | | 510,420 |
| Integra LifeSciences Holdings | | 50,220 a | | 1,786,325 |
| Natus Medical | | 50,550 a | | 654,622 |
| NuVasive | | 27,200 a | | 942,480 |
10
| Common Stocks (continued) | | Shares | | Value ($) |
| |
| |
|
| Health Care Equipment (continued) | | | | |
| Resmed | | 75,270 a | | 2,821,120 |
| Thoratec | | 23,000 a | | 747,270 |
| Volcano | | 90,773 a | | 1,361,595 |
| Wright Medical Group | | 92,650 a | | 1,892,840 |
| | | | | 12,478,177 |
| Health Care Facilities—1.1% | | | | |
| Psychiatric Solutions | | 45,410 a | | 1,264,668 |
| Health Care Services—1.5% | | | | |
| Catalyst Health Solutions | | 39,000 a | | 949,650 |
| Emergency Medical Services, Cl. A | | 22,628 a | | 828,411 |
| | | | | 1,778,061 |
| Health Care Supplies—.9% | | | | |
| West Pharmaceutical Services | | 28,240 | | 1,066,625 |
| Health Care Technology—.4% | | | | |
| Phase Forward | | 34,600 a | | 433,192 |
| Industrial Machinery—1.2% | | | | |
| Actuant, Cl. A | | 78,580 | | 1,494,592 |
| Internet Software & Services—3.9% | | | | |
| j2 Global Communications | | 90,320 a | | 1,810,013 |
| Marchex, Cl. B | | 62,430 | | 363,967 |
| SkillSoft, ADR | | 344,110 a | | 2,456,945 |
| | | | | 4,630,925 |
| IT Consulting & Other Services—2.7% | | | | |
| CACI International, Cl. A | | 62,080 a | | 2,799,187 |
| Ness Technologies | | 108,760 a | | 465,493 |
| | | | | 3,264,680 |
| Life Sciences Tools & Services—2.6% | | | | |
| Bio-Rad Laboratories, Cl. A | | 14,950 a | | 1,125,885 |
| Bruker | | 107,887 a | | 435,863 |
| Thermo Fisher Scientific | | 29,380 a | | 1,000,977 |
| Varian | | 16,430 a | | 550,569 |
| | | | | 3,113,294 |
| Movies & Entertainment—1.4% | | | | |
| Lions Gate Entertainment | | 230,430 a | | 1,267,365 |
| RHI Entertainment | | 49,330 a | | 400,560 |
| | | | | 1,667,925 |
The Fund 11
| STATEMENT OF INVESTMENTS (continued) |
| Common Stocks (continued) | | Shares | | Value ($) |
| |
| |
|
| Multi-Line Insurance—2.7% | | | | |
| Arch Capital Group | | 45,580 a | | 3,195,158 |
| Oil & Gas Equipment & | | | | |
| Services—2.7% | | | | |
| Cal Dive International | | 130,141 a | | 847,218 |
| Dril-Quip | | 75,580 a | | 1,550,146 |
| NATCO Group, Cl. A | | 52,850 a | | 802,263 |
| | | | | 3,199,627 |
| Oil & Gas Exploration & | | | | |
| Production—4.3% | | | | |
| Arena Resources | | 59,050 a | | 1,658,714 |
| Concho Resources | | 53,613 a | | 1,223,449 |
| Penn Virginia | | 52,960 | | 1,375,901 |
| Whiting Petroleum | | 27,240 a | | 911,450 |
| | | | | 5,169,514 |
| Packaged Foods & Meats—1.1% | | | | |
| Hain Celestial Group | | 70,180 a | | 1,339,736 |
| Personal Products—2.4% | | | | |
| Alberto-Culver | | 85,660 | | 2,099,527 |
| Nu Skin Enterprises, Cl. A | | 79,300 | | 827,099 |
| | | | | 2,926,626 |
| Pharmaceuticals—1.2% | | | | |
| Medarex | | 86,380 a | | 482,000 |
| Onyx Pharmaceuticals | | 29,650 a | | 1,012,844 |
| | | | | 1,494,844 |
| Property & Casualty Insurance—3.2% | | | | |
| ProAssurance | | 36,850 a | | 1,944,943 |
| RLI | | 31,870 | | 1,949,169 |
| | | | | 3,894,112 |
| Publishing—1.1% | | | | |
| Interactive Data | | 53,120 | | 1,309,939 |
| Regional Banks—.8% | | | | |
| IBERIABANK | | 20,040 | | 961,920 |
| Research & Consulting Services—3.5% | | | | |
| Exponent | | 56,950 a | | 1,713,056 |
12
| Common Stocks (continued) | | Shares | | Value ($) |
| |
| |
|
| Research & Consulting Services (continued) | | | | |
| Huron Consulting Group | | 42,680 a | | 2,444,284 |
| | | | | 4,157,340 |
| Restaurants—2.2% | | | | |
| P.F. Chang's China Bistro | | 27,590 a | | 577,735 |
| Panera Bread, Cl. A | | 13,320 a | | 695,837 |
| Papa John's International | | 72,390 a | | 1,334,148 |
| | | | | 2,607,720 |
| Security & Alarm Services—1.2% | | | | |
| Cornell | | 75,460 a | | 1,402,801 |
| Semiconductor Equipment—.9% | | | | |
| ATMI | | 27,460 a | | 423,708 |
| Lam Research | | 31,180 a | | 663,510 |
| | | | | 1,087,218 |
| Semiconductors—.6% | | | | |
| PMC-Sierra | | 151,840 a | | 737,942 |
| Specialty Stores—.6% | | | | |
| Hibbett Sports | | 46,492 a | | 730,389 |
| Technology Distributors—.8% | | | | |
| Mellanox Technologies | | 115,280 a | | 906,101 |
| Trading Companies & Distributors—1.5% | | | | |
| MSC Industrial Direct, Cl. A | | 47,380 | | 1,745,005 |
| Trucking—3.4% | | | | |
| Knight Transportation | | 59,550 | | 959,946 |
| Landstar System | | 56,530 | | 2,172,448 |
| Werner Enterprises | | 55,230 | | 957,688 |
| | | | | 4,090,082 |
| Total Common Stocks | | | | |
| (cost $137,818,922) | | | | 117,015,003 |
| |
| |
|
| |
| Exchange Traded Funds—1.4% | | | | |
| |
| |
|
| iShares Russell 2000 Growth Index Fund | | 31,070 | | 1,580,220 |
| iShares Russell 2000 Index Fund | | 2,940 | | 144,766 |
| (cost $1,745,803) | | | | 1,724,986 |
The Fund 13
STATEMENT OF INVESTMENTS (continued)
| Other Investment—1.0% | | Shares | | Value ($) |
| |
| |
|
| Registered Investment Company; | | | | |
| Dreyfus Institutional Preferred | | | | |
| Plus Money Market Fund | | | | |
| (cost $1,210,000) | | 1,210,000 b | | 1,210,000 |
| |
| |
|
| |
| Total Investments (cost $140,774,725) | | 100.0% | | 119,949,989 |
| Cash and Receivables (Net) | | .0% | | 14,290 |
| Net Assets | | 100.0% | | 119,964,279 |
| |
| ADR—American Depository Receipts | | | | |
| a Non-income producing security. | | | | |
| b Investment in affiliated money market mutual fund. | | | | |
| Portfolio Summary (Unaudited)† | | | | |
| |
| | | Value (%) | | | | Value (%) |
| |
| |
| |
|
| Health Care | | 27.1 | | Consumer Staples | | 6.5 |
| Information Technology | | 19.9 | | Exchange Traded Funds | | 1.4 |
| Industrials | | 17.6 | | Utilities | | 1.1 |
| Consumer Discretionary | | 11.0 | | Money Market Investment | | 1.0 |
| Financials | | 7.4 | | | | |
| Energy | | 7.0 | | | | 100.0 |
| |
| † Based on net assets. | | | | | | |
| See notes to financial statements. | | | | | | |
14
| | STATEMENT OF ASSETS AND LIABILITIES
December 31, 2008 |
| | | Cost | | Value |
| |
| |
|
| Assets ($): | | | | |
| Investments in securities—See Statement of Investments: | | | | |
| Unaffiliated issuers | | 139,564,725 | | 118,739,989 |
| Affiliated issuers | | 1,210,000 | | 1,210,000 |
| Cash | | | | 211,659 |
| Receivable for investment securities sold | | | | 2,854,415 |
| Dividends and interest receivable | | | | 24,427 |
| Receivable for shares of Common Stock subscribed | | | | 9,878 |
| Prepaid expenses | | | | 72,349 |
| Other assets | | | | 68,857 |
| | | | | 123,191,574 |
| |
| |
|
| Liabilities ($): | | | | |
| Due to Founders Asset Management LLC and affiliates—Note 3(c) | | | | 168,862 |
| Payable for investment securities purchased | | | | 2,642,994 |
| Payable for shares of Common Stock redeemed | | | | 201,278 |
| Directors’ deferred compensation | | | | 68,857 |
| Accrued expenses | | | | 145,304 |
| | | | | 3,227,295 |
| |
| |
|
| Net Assets ($) | | | | 119,964,279 |
| |
| |
|
| Composition of Net Assets ($): | | | | |
| Paid-in capital | | | | 417,459,118 |
| Accumulated distributions in excess of investment income—net | | | | (127,770) |
| Accumulated net realized gain (loss) on investments | | | | (276,500,666) |
| Accumulated net unrealized appreciation | | | | |
| (depreciation) on investments | | | | (20,866,403) |
| |
| |
|
| Net Assets ($) | | | | 119,964,279 |
| Net Asset Value Per Share | | | | | | | | | | |
| | | Class A | | Class B | | Class C | | Class F | | Class I | | Class T |
| |
| |
| |
| |
| |
| |
|
| Net Assets ($) | | 5,424,559 | | 346,095 | | 1,235,334 | | 103,638,910 | | 9,240,228 | | 79,153 |
| Shares Outstanding | | 268,593 | | 18,651 | | 65,944 | | 5,092,735 | | 445,296 | | 4,065 |
| |
| |
| |
| |
| |
| |
|
| Net Asset Value | | | | | | | | | | | | |
| Per Share ($) | | 20.20 | | 18.56 | | 18.73 | | 20.35 | | 20.75 | | 19.47 |
| |
| See notes to financial statements. | | | | | | | | | | |
The Fund 15
| STATEMENT OF OPERATIONS | | |
| Year Ended December 31, 2008 | | |
| |
|
| |
| |
| |
| |
| Investment Income ($): | | |
| Income: | | |
| Cash dividends: | | |
| Unaffiliated issuers | | 706,213 |
| Affiliated issuers | | 109,019 |
| Total Income | | 815,232 |
| Expenses: | | |
| Investment advisory fee—Note 3(a) | | 1,756,041 |
| Shareholder servicing costs—Note 3(c) | | 353,133 |
| Distribution fees—Note 3(b) | | 189,255 |
| Accounting fees—Note 3(c) | | 112,617 |
| Professional fees | | 67,858 |
| Registration fees | | 66,108 |
| Prospectus and shareholders’ reports | | 55,775 |
| Custodian fees—Note 3(c) | | 24,355 |
| Directors’ fees and expenses—Note 3(d) | | 22,101 |
| Loan commitment fees—Note 2 | | 7,189 |
| Interest expense—Note 2 | | 598 |
| Miscellaneous | | 31,741 |
| Total Expenses | | 2,686,771 |
| Less—reduction in accounting fees—Note 3(c) | | (7,129) |
| Less—reduction in fees due to earnings credits—Note 1(c) | | (30,630) |
| Net Expenses | | 2,649,012 |
| Investment (Loss)—Net | | (1,833,780) |
| |
|
| Realized and Unrealized Gain (Loss) on Investments—Note 4 ($): | | |
| Net realized gain (loss) on investments | | (43,009,047) |
| Net unrealized appreciation (depreciation) on investments | | (34,809,802) |
| Net Realized and Unrealized Gain (Loss) on Investments | | (77,818,849) |
| Net (Decrease) in Net Assets Resulting from Operations | | (79,652,629) |
| |
| See notes to financial statements. | | |
16
STATEMENT OF CHANGES IN NET ASSETS
| | | Year Ended December 31, |
| | |
|
| | | 2008 | | 2007a |
| |
| |
|
| Operations ($): | | | | |
| Investment (loss)—net | | (1,833,780) | | (2,730,266) |
| Net realized gain (loss) on investments | | (43,009,047) | | 39,744,942 |
| Net unrealized appreciation | | | | |
| (depreciation) on investments | | (34,809,802) | | (12,738,584) |
| Net Increase (Decrease) in Net Assets | | | | |
| Resulting from Operations | | (79,652,629) | | 24,276,092 |
| |
| |
|
| Capital Stock Transactions ($): | | | | |
| Net proceeds from shares sold: | | | | |
| Class A Shares | | 678,427 | | 940,650 |
| Class B Shares | | 30,853 | | 32,730 |
| Class C Shares | | 248,924 | | 138,400 |
| Class F Shares | | 4,845,191 | | 7,011,491 |
| Class I Shares | | 3,037,366 | | 24,982,780 |
| Class T Shares | | 67,912 | | 47,348 |
| Cost of shares redeemed: | | | | |
| Class A Shares | | (2,473,778) | | (27,506,640) |
| Class B Shares | | (210,161) | | (688,450) |
| Class C Shares | | (493,414) | | (1,048,474) |
| Class F Shares | | (28,433,576) | | (70,053,374) |
| Class I Shares | | (6,440,640) | | (16,095,549) |
| Class T Shares | | (41,378) | | (124,423) |
| Increase (Decrease) in Net Assets | | | | |
| from Capital Stock Transactions | | (29,184,274) | | (82,363,511) |
| Total Increase (Decrease) in Net Assets | | (108,836,903) | | (58,087,419) |
| |
| |
|
| Net Assets ($): | | | | |
| Beginning of Period | | 228,801,182 | | 286,888,601 |
| End of Period | | 119,964,279 | | 228,801,182 |
| Accumulated distributions in excess of | | | | |
| investment income—net | | (127,770) | | (179,066) |
The Fund 17
STATEMENT OF CHANGES IN NET ASSETS (continued)
| | | Year Ended December 31, |
| | |
|
| | | 2008 | | 2007a |
| |
| |
|
| Capital Share Transactions: | | | | |
| Class Ab | | | | |
| Shares sold | | 24,094 | | 29,689 |
| Shares redeemed | | (91,626) | | (880,815) |
| Net Increase (Decrease) in Shares Outstanding | | (67,532) | | (851,126) |
| |
| |
|
| Class Bb | | | | |
| Shares sold | | 1,064 | | 1,036 |
| Shares redeemed | | (7,968) | | (23,427) |
| Net Increase (Decrease) in Shares Outstanding | | (6,904) | | (22,391) |
| |
| |
|
| Class C | | | | |
| Shares sold | | 9,469 | | 4,882 |
| Shares redeemed | | (18,574) | | (35,209) |
| Net Increase (Decrease) in Shares Outstanding | | (9,105) | | (30,327) |
| |
| |
|
| Class F | | | | |
| Shares sold | | 175,364 | | 222,651 |
| Shares redeemed | | (1,018,054) | | (2,212,860) |
| Net Increase (Decrease) in Shares Outstanding | | (842,690) | | (1,990,209) |
| |
| |
|
| Class I | | | | |
| Shares sold | | 100,083 | | 779,085 |
| Shares redeemed | | (222,125) | | (494,171) |
| Net Increase (Decrease) in Shares Outstanding | | (122,042) | | 284,914 |
| |
| |
|
| Class T | | | | |
| Shares sold | | 2,287 | | 1,509 |
| Shares redeemed | | (1,433) | | (4,062) |
| Net Increase (Decrease) in Shares Outstanding | | 854 | | (2,553) |
| a | | Effective June 1, 2007, Class R shares were redesignated as Class I shares. |
| b | | During the period ended December 31, 2008, 5,625 Class B shares representing $149,695, were automatically |
| | | converted to 5,194 Class A shares and during the period ended December 31, 2007, 14,074 Class B shares |
| | | representing $413,834 were automatically converted to 13,130 Class A shares. |
| See notes to financial statements. |
18
FINANCIAL HIGHLIGHTS
The following tables describe the performance for each share class for the fiscal periods indicated.All information (except portfolio turnover rate) reflects financial results for a single fund share.Total return shows how much your investment in the fund would have increased (or decreased) during each period, assuming you had reinvested all dividends and distributions.These figures have been derived from the fund’s financial statements.
| | | | | Year Ended December 31, | | |
| | |
| |
| |
|
| Class A Shares | | 2008 | | 2007 | | 2006 | | 2005 | | 2004 |
| |
| |
| |
| |
| |
|
| Per Share Data ($): | | | | | | | | | | |
| Net asset value, beginning of period | | 32.80 | | 30.09 | | 28.63 | | 28.82 | | 26.04 |
| Investment Operations: | | | | | | | | | | |
| Investment (loss)—net | | (.37)a | | (.50)a | | (.35)a | | (.28)a | | (.64) |
| Net realized and unrealized | | | | | | | | | | |
| gain (loss) on investments | | (12.23) | | 3.21 | | 1.81 | | .09 | | 3.42 |
| Total from Investment Operations | | (12.60) | | 2.71 | | 1.46 | | (.19) | | 2.78 |
| Net asset value, end of period | | 20.20 | | 32.80 | | 30.09 | | 28.63 | | 28.82 |
| |
| |
| |
| |
| |
|
| Total Return (%)b | | (38.41) | | 9.01 | | 5.10 | | (.66) | | 10.68 |
| |
| |
| |
| |
| |
|
| Ratios/Supplemental Data (%): | | | | | | | | | | |
| Ratio of total expenses | | | | | | | | | | |
| to average net assets | | 1.77 | | 2.02 | | 1.51 | | 1.47 | | 1.38 |
| Ratio of net expenses | | | | | | | | | | |
| to average net assets | | 1.77 | | 2.01 | | 1.51 | | 1.45 | | 1.37 |
| Ratio of net investment | | | | | | | | | | |
| (loss) to average net assets | | (1.30) | | (1.58) | | (1.15) | | (1.09) | | (1.11) |
| Portfolio Turnover Rate | | 234 | | 215 | | 202 | | 160 | | 98 |
| |
| |
| |
| |
| |
|
| Net Assets, end of period ($ x 1,000) | | 5,425 | | 11,024 | | 35,719 | | 45,092 | | 65,763 |
| a | | Based on average shares outstanding at each month end. |
| b | | Exclusive of sales charge. |
| See notes to financial statements. |
The Fund 19
| | FINANCIAL HIGHLIGHTS (continued) |
| | | | | Year Ended December 31, | | |
| | |
| |
| |
|
| Class B Shares | | 2008 | | 2007 | | 2006 | | 2005 | | 2004 |
| |
| |
| |
| |
| |
|
| Per Share Data ($): | | | | | | | | | | |
| Net asset value, beginning of period | | 30.40 | | 28.04 | | 27.10 | | 27.55 | | 25.12 |
| Investment Operations: | | | | | | | | | | |
| Investment (loss)—net | | (.58)a | | (.60)a | | (.61)a | | (.54)a | | (1.07) |
| Net realized and unrealized | | | | | | | | | | |
| gain (loss) on investments | | (11.26) | | 2.96 | | 1.55 | | .09 | | 3.50 |
| Total from Investment Operations | | (11.84) | | 2.36 | | .94 | | (.45) | | 2.43 |
| Net asset value, end of period | | 18.56 | | 30.40 | | 28.04 | | 27.10 | | 27.55 |
| |
| |
| |
| |
| |
|
| Total Return (%)b | | (38.95) | | 8.38 | | 3.51 | | (1.63) | | 9.67 |
| |
| |
| |
| |
| |
|
| Ratios/Supplemental Data (%): | | | | | | | | | | |
| Ratio of total expenses | | | | | | | | | | |
| to average net assets | | 2.76 | | 2.55 | | 2.64 | | 2.44 | | 2.30 |
| Ratio of net expenses | | | | | | | | | | |
| to average net assets | | 2.75 | | 2.54 | | 2.64 | | 2.43 | | 2.29 |
| Ratio of net investment | | | | | | | | | | |
| (loss) to average net assets | | (2.29) | | (2.08) | | (2.28) | | (2.06) | | (2.03) |
| Portfolio Turnover Rate | | 234 | | 215 | | 202 | | 160 | | 98 |
| |
| |
| |
| |
| |
|
| Net Assets, end of period ($ x 1,000) | | 346 | | 777 | | 1,344 | | 13,964 | | 18,795 |
| a | | Based on average shares outstanding at each month end. |
| b | | Exclusive of sales charge. |
| See notes to financial statements. |
20
| | | | | Year Ended December 31, | | |
| | |
| |
| |
|
| Class C Shares | | 2008 | | 2007 | | 2006 | | 2005 | | 2004 |
| |
| |
| |
| |
| |
|
| Per Share Data ($): | | | | | | | | | | |
| Net asset value, beginning of period | | 30.67 | | 28.29 | | 27.14 | | 27.57 | | 25.14 |
| Investment Operations: | | | | | | | | | | |
| Investment (loss)—net | | (.55)a | | (.64)a | | (.56)a | | (.50)a | | (1.53) |
| Net realized and unrealized | | | | | | | | | | |
| gain (loss) on investments | | (11.39) | | 3.02 | | 1.71 | | .07 | | 3.96 |
| Total from Investment Operations | | (11.94) | | 2.38 | | 1.15 | | (.43) | | 2.43 |
| Net asset value, end of period | | 18.73 | | 30.67 | | 28.29 | | 27.14 | | 27.57 |
| |
| |
| |
| |
| |
|
| Total Return (%)b | | (38.93) | | 8.41 | | 4.24 | | (1.56) | | 9.67 |
| |
| |
| |
| |
| |
|
| Ratios/Supplemental Data (%): | | | | | | | | | | |
| Ratio of total expenses | | | | | �� | | | | | |
| to average net assets | | 2.60 | | 2.64 | | 2.36 | | 2.36 | | 2.28 |
| Ratio of net expenses | | | | | | | | | | |
| to average net assets | | 2.60 | | 2.63 | | 2.36 | | 2.35 | | 2.27 |
| Ratio of net investment | | | | | | | | | | |
| (loss) to average net assets | | (2.13) | | (2.16) | | (2.01) | | (1.98) | | (2.01) |
| Portfolio Turnover Rate | | 234 | | 215 | | 202 | | 160 | | 98 |
| |
| |
| |
| |
| |
|
| Net Assets, end of period ($ x 1,000) | | 1,235 | | 2,302 | | 2,981 | | 4,391 | | 6,668 |
| a | | Based on average shares outstanding at each month end. |
| b | | Exclusive of sales charge. |
| See notes to financial statements. |
The Fund 21
| FINANCIAL HIGHLIGHTS (continued) |
| | | | | Year Ended December 31, | | |
| | |
| |
| |
|
| Class F Shares | | 2008 | | 2007 | | 2006 | | 2005 | | 2004 |
| |
| |
| |
| |
| |
|
| Per Share Data ($): | | | | | | | | | | |
| Net asset value, beginning of period | | 32.94 | | 30.03 | | 28.58 | | 28.77 | | 25.98 |
| Investment Operations: | | | | | | | | | | |
| Investment (loss)—net | | (.28)a | | (.32)a | | (.34)a | | (.30)a | | (.69) |
| Net realized and unrealized | | | | | | | | | | |
| gain (loss) on investments | | (12.31) | | 3.23 | | 1.79 | | .11 | | 3.48 |
| Total from Investment Operations | | (12.59) | | 2.91 | | 1.45 | | (.19) | | 2.79 |
| Net asset value, end of period | | 20.35 | | 32.94 | | 30.03 | | 28.58 | | 28.77 |
| |
| |
| |
| |
| |
|
| Total Return (%) | | (38.22) | | 9.69 | | 5.08 | | (.66) | | 10.74 |
| |
| |
| |
| |
| |
|
| Ratios/Supplemental Data (%): | | | | | | | | | | |
| Ratio of total expenses | | | | | | | | | | |
| to average net assets | | 1.48 | | 1.49 | | 1.53 | | 1.46 | | 1.35 |
| Ratio of net expenses | | | | | | | | | | |
| to average net assets | | 1.47 | | 1.48 | | 1.52 | | 1.45 | | 1.34 |
| Ratio of net investment | | | | | | | | | | |
| (loss) to average net assets | | (1.00) | | (1.01) | | (1.16) | | (1.09) | | (1.08) |
| Portfolio Turnover Rate | | 234 | | 215 | | 202 | | 160 | | 98 |
| |
| |
| |
| |
| |
|
| Net Assets, end of period ($ x 1,000) | | 103,639 | | 195,510 | | 238,015 | | 351,087 | | 550,622 |
| |
| a Based on average shares outstanding at each month end. | | | | | | | | |
| See notes to financial statements. | | | | | | | | | | |
22
| | | | | Year Ended December 31, | | |
| | |
| |
| |
|
| Class I Shares | | 2008 | | 2007a | | 2006 | | 2005 | | 2004 |
| |
| |
| |
| |
| |
|
| Per Share Data ($): | | | | | | | | | | |
| Net asset value, beginning of period | | 33.64 | | 30.67 | | 29.11 | | 29.22 | | 26.32 |
| Investment Operations: | | | | | | | | | | |
| Investment (loss)—net | | (.33)b | | (.32)b | | (.27)b | | (.24)b | | (.24) |
| Net realized and unrealized | | | | | | | | | | |
| gain (loss) on investments | | (12.56) | | 3.29 | | 1.83 | | .13 | | 3.14 |
| Total from Investment Operations | | (12.89) | | 2.97 | | 1.56 | | (.11) | | 2.90 |
| Net asset value, end of period | | 20.75 | | 33.64 | | 30.67 | | 29.11 | | 29.22 |
| |
| |
| |
| |
| |
|
| Total Return (%) | | (38.32) | | 9.68 | | 5.36 | | (.38) | | 11.02 |
| |
| |
| |
| |
| |
|
| Ratios/Supplemental Data (%): | | | | | | | | | | |
| Ratio of total expenses | | | | | | | | | | |
| to average net assets | | 1.62 | | 1.49 | | 1.26 | | 1.18 | | 1.11 |
| Ratio of net expenses | | | | | | | | | | |
| to average net assets | | 1.61 | | 1.48 | | 1.26 | | 1.17 | | 1.10 |
| Ratio of net investment | | | | | | | | | | |
| (loss) to average net assets | | (1.14) | | (.98) | | (.91) | | (.80) | | (.83) |
| Portfolio Turnover Rate | | 234 | | 215 | | 202 | | 160 | | 98 |
| |
| |
| |
| |
| |
|
| Net Assets, end of period ($ x 1,000) | | 9,240 | | 19,086 | | 8,662 | | 8,315 | | 72,317 |
| a | | Effective June 1, 2007, Class R shares were redesignated as Class I shares. |
| b | | Based on average shares outstanding at each month end. |
| See notes to financial statements. |
The Fund 23
| | FINANCIAL HIGHLIGHTS (continued) |
| | | | | Year Ended December 31, | | |
| | |
| |
| |
|
| Class T Shares | | 2008 | | 2007 | | 2006 | | 2005 | | 2004 |
| |
| |
| |
| |
| |
|
| Per Share Data ($): | | | | | | | | | | |
| Net asset value, beginning of period | | 31.75 | | 29.21 | | 27.91 | | 28.18 | | 25.55 |
| Investment Operations: | | | | | | | | | | |
| Investment (loss)—net | | (.46)a | | (.57)a | | (.45)a | | (.38)a | | (.65) |
| Net realized and unrealized | | | | | | | | | | |
| gain (loss) on investments | | (11.82) | | 3.11 | | 1.75 | | .11 | | 3.28 |
| Total from Investment Operations | | (12.28) | | 2.54 | | 1.30 | | (.27) | | 2.63 |
| Net asset value, end of period | | 19.47 | | 31.75 | | 29.21 | | 27.91 | | 28.18 |
| |
| |
| |
| |
| |
|
| Total Return (%)b | | (38.68) | | 8.70 | | 4.66 | | (.96) | | 10.29 |
| |
| |
| |
| |
| |
|
| Ratios/Supplemental Data (%): | | | | | | | | | | |
| Ratio of total expenses | | | | | | | | | | |
| to average net assets | | 2.19 | | 2.33 | | 1.84 | | 1.77 | | 1.71 |
| Ratio of net expenses | | | | | | | | | | |
| to average net assets | | 2.18 | | 2.32 | | 1.84 | | 1.76 | | 1.70 |
| Ratio of net investment | | | | | | | | | | |
| (loss) to average net assets | | (1.71) | | (1.85) | | (1.51) | | (1.40) | | (1.44) |
| Portfolio Turnover Rate | | 234 | | 215 | | 202 | | 160 | | 98 |
| |
| |
| |
| |
| |
|
| Net Assets, end of period ($ x 1,000) | | 79 | | 102 | | 168 | | 1,187 | | 1,648 |
| a | | Based on average shares outstanding at each month end. |
| b | | Exclusive of sales charge. |
| See notes to financial statements. |
24
NOTES TO FINANCIAL STATEMENTS
NOTE 1—Significant Accounting Policies:
Dreyfus Discovery Fund (the “fund”) is a separate diversified series of Dreyfus Funds, Inc. (the “Company”), which is registered under the Investment Company Act of 1940, as amended (the “Act”), as an open-end management investment company and operates as a series company currently offering five series, including the fund.The fund’s investment objective is to seek capital appreciation. Founders Asset Management LLC (“Founders”) serves as the fund’s investment adviser. Founders is an indirect, wholly-owned subsidiary of The Bank of New York Mellon Corporation (“BNY Mellon”).
At a meeting of the Company’s Board of Directors held on September 22, 2008, the Board approved, effective December 1, 2008, a proposal to change the names of the Company and the fund from “Dreyfus Founders Funds, Inc.” and “Dreyfus Founders Discovery Fund” to “Dreyfus Funds, Inc.” and “Dreyfus Discovery Fund,” respectively.
Effective July 1, 2008, BNY Mellon reorganized and consolidated a number of its banking and trust company subsidiaries.As a result of the reorganization, any services previously provided to the fund by Mellon Bank, N.A. or Mellon Trust of New England, N.A. are now provided by The Bank of NewYork Mellon (formerly,The Bank of NewYork).
MBSC Securities Corporation (the “Distributor”), the direct owner of Founders and a wholly-owned subsidiary of The Dreyfus Corporation (“Dreyfus”), an affiliate of Founders, is the Distributor of the fund’s shares. The fund is authorized to issue up to 550 million shares of Common Stock, par value $.01 per share, in the following classes of shares: Class A, Class B, Class C, Class F, Class I and Class T shares. Class A and Class T shares are subject to a sales charge imposed at the time of purchase, although the shares may be purchased at net asset value (“NAV”) without a sales charge by certain categories of investors. Class B shares are subject to a contingent deferred sales charge (“CDSC”) imposed on Class B share redemptions made within six years of purchase and automatically convert to Class A shares after six years. The fund does not offer Class B shares, except in connection
The Fund 25
| NOTES TO FINANCIAL STATEMENTS (continued) |
with dividend reinvestment and permitted exchanges of Class B shares. Class C shares are subject to a CDSC imposed on Class C shares redeemed within one year of purchase. Class F and Class I shares are sold at NAV per share. Class F shares are sold only to Class F grandfathered investors, and Class I shares are sold only to eligible institutional investors. Effective December 3, 2008, investments for new accounts were no longer permitted in Class T of the fund, except that participants in certain group retirement plans were able to open a new account in Class T of the fund, provided that the fund was established as an investment option under the plans before December 3, 2008. Other differences between the classes include the services offered to and the expenses borne by each class. Income and realized and unrealized gains or losses on investments are allocated to each class of shares based on its relative net assets.
Each class of the fund bears expenses incurred specifically on its behalf and, in addition, each class bears a portion of general expenses based on the relative net assets or the number of shareholder accounts of the class.The type of expense determines the allocation method.
The fund’s financial statements are prepared in accordance with U.S. generally accepted accounting principles, which require the use of management estimates and assumptions. Actual results could differ from those estimates.
The fund enters into contracts that contain a variety of indemnifications. The fund’s maximum exposure under these arrangements is unknown.The fund does not anticipate recognizing any loss related to these arrangements.
(a) Portfolio valuation: A domestic equity security listed or traded on a securities exchange or in the over-the-counter market is valued at its last sale price on the exchange or market where it is principally traded or, in the case of a security traded on NASDAQ, at its official closing price. Lacking any sales on that day, the security is valued at the current closing bid price, or by quotes from dealers making a market in the security if the closing bid price is not available.
26
A foreign equity security traded on a foreign exchange is valued at the last quoted official closing price available before the time when the fund’s assets are valued, or at the last quoted sales price if the exchange does not provide an official closing price or if the foreign market has not yet closed. Lacking any sales that day, the security is valued at the current closing bid price. NewYork closing exchange rates are used to convert foreign currencies to U.S. dollars.
A debt security with a remaining maturity greater than 60 days at the time of purchase is valued in accordance with the evaluated bid price supplied by a pricing service approved by the Company’s Board of Directors or, if such price is not available, at the mean between the highest bid and lowest asked quotations obtained from at least two securities dealers.A debt security with a remaining maturity of 60 days or less at the time of purchase is valued at amortized cost, which approximates market value, unless it is determined that amortized cost would not represent market value, in which case the securities would be marked to market.
Registered investment companies that are not traded on an exchange are valued at their NAV.
If market quotations or official closing prices are not readily available or are determined not to reflect accurately fair value, securities will be valued at their fair value as determined in good faith by the Board of Directors or pursuant to procedures approved by the Board of Directors. These situations may include instances where an event occurs after the close of the market on which a security is traded but before the fund calculates its NAV, and it is determined that the event has materially affected the value of the security. Fair value of foreign equity securities may be determined with the assistance of a pricing service using calculations based on indexes of domestic securities and other appropriate indicators, such as prices of relevant ADRs and futures contracts.
The Fund 27
| NOTES TO FINANCIAL STATEMENTS (continued) |
The fund adopted Statement of Financial Accounting Standards No. 157 “FairValue Measurements” (“FAS 157”). FAS 157 establishes an authoritative definition of fair value, sets out a framework for measuring fair value, and requires additional disclosures about fair value measurements.
Various inputs are used in determining the value of the fund’s investments relating to FAS 157.These inputs are summarized in the three broad levels listed below.
| | Level 1—quoted prices in active markets for identical securities.
Level 2—other significant observable inputs (including quoted
prices for similar securities, interest rates, prepayment speeds,
credit risk, etc.).
Level 3—significant unobservable inputs (including the fund’s own
assumptions in determining the fair value of investments). |
The inputs or methodology used for valuing securities are not necessarily an indication of the risk associated with investing in those securities.
The following is a summary of the inputs used as of December 31, 2008 in valuing the fund’s investments carried at fair value:
| | | Investments in | | Other Financial |
| Valuation Inputs | | Securities ($) | | Instruments ($)† |
| |
| |
|
| Level 1—Quoted Prices | | 119,949,989 | | 0 |
| Level 2—Other Significant | | | | |
| Observable Inputs | | 0 | | 0 |
| Level 3—Significant | | | | |
| Unobservable Inputs | | 0 | | 0 |
| Total | | 119,949,989 | | 0 |
| † | | Other financial instruments include derivative instruments such as futures, forward currency |
| | | exchange contracts and swap contracts, which are valued at the unrealized appreciation |
| | | (depreciation) on the instrument and written options contracts which are shown at value. |
(b) Foreign Securities and Currency Transactions: The fund may invest at least a portion of its assets in foreign securities. Foreign securities carry more risk than U.S. securities, such as political and currency risks. In the event the fund executes a foreign security transaction, the fund may enter into a foreign currency contract to settle the foreign security transaction.The fund could be exposed to risk if counterpar-
28
ties are unable to meet the terms of the contracts or if the value of the currency changes unfavorably to the U.S. dollar.The resultant foreign currency gain or loss from the contract is recorded as foreign currency gain or loss and is presented as such in the Statement of Operations.
The accounting records of the fund are maintained in U.S. dollars.The market values of foreign securities, currency holdings and other assets and liabilities are translated into U.S. dollars based on the current exchange rates each business day. Purchases and sales of investment securities and income and expense items denominated in foreign currencies are translated into U.S. dollar amounts on the respective dates of such transactions.
The fund does not isolate that portion of the results of operations resulting from changes in foreign exchange rates on investments from the fluctuations arising from changes in market prices of securities held. Such fluctuations are included with the net unrealized appreciation (depreciation) on investments and foreign currency translations in the Statement of Operations.
Reported net realized foreign exchange gains or losses arise from sales of foreign currencies, currency gains or losses realized between the trade and settlement dates on securities transactions, and the difference between the amounts of dividends, interest, and foreign withholding taxes recorded on the fund’s books and the U.S. dollar equivalent of the amounts actually received or paid. Net unrealized appreciation or depreciation on investments and foreign currency translation arises from changes in the values of assets and liabilities, including investments in securities held at the date of the financial statements, resulting from changes in the exchange rates and changes in market prices of securities held.
(c) Securities transactions and investment income: Securities transactions are recorded on a trade date basis. Realized gains and losses from securities transactions are recorded on the identified cost basis. Dividend income is recognized on the ex-dividend date and interest
The Fund 29
| NOTES TO FINANCIAL STATEMENTS (continued) |
income, including, where applicable, accretion of discount and amortization of premium on investments, is recognized on the accrual basis.
The fund has arrangements with the custodian and cash management bank whereby the fund may receive earnings credits when positive cash balances are maintained, which are used to offset custody and cash management fees. For financial reporting purposes, the fund includes net earnings credits as an expense offset in the Statement of Operations.
(d) Affiliated issuers: Investments in other investment companies advised by Founders or its affiliates are defined as “affiliated” in the Act.
(e) Dividends to shareholders: Dividends are recorded on the ex-dividend date. Dividends from investment income-net and dividends from net realized capital gains, if any, are normally declared and paid annually, but the fund may make distributions on a more frequent basis to comply with the distribution requirements of the Internal Revenue Code of 1986, as amended (the “Code”).To the extent that net realized capital gains can be offset by capital loss carryovers, it is the policy of the fund not to distribute such gains. Income and capital gain distributions are determined in accordance with income tax regulations, which may differ from U.S. generally accepted accounting principles.
(f) Federal income taxes: No provision has been made for federal income taxes since it is the policy of the fund to comply with the requirements of Subchapter M of the Code that are applicable to regulated investment companies and to make distributions of income and capital gains sufficient to relieve it from all income taxes.The fund is treated as a separate tax entity for federal income tax purposes.
As of and during the period ended December 31, 2008, the fund did not have any liabilities for any unrecognized tax positions. The fund recognizes interest and penalties, if any, related to unrecognized tax positions as income tax expense in the Statement of Operations. During the period, the fund did not incur any interest or penalties.
Each of the tax years in the four-year period ended December 31, 2008 remains subject to examination by the Internal Revenue Service and state taxing authorities.
30
At December 31, 2008, the components of accumulated earnings on a tax basis were as follows: accumulated capital losses $252,605,739 and unrealized depreciation $26,604,111. In addition, the fund had $18,115,552 of capital losses realized after October 31, 2008, which were deferred for tax purposes to the first day of the following fiscal year.
The accumulated capital loss carryover is available for federal income tax purposes to be applied against future net securities profits, if any, realized subsequent to December 31, 2008. If not applied, $218,607,732 of the carryover expires in fiscal 2010, $14,100,467 expires in fiscal 2011 and $19,897,540 expires in fiscal 2016.
During the period ended December 31, 2008, as a result of permanent book to tax differences, primarily due to the tax treatment for net operating losses, the fund increased accumulated undistributed investment income-net by $1,885,076, and decreased paid-in-capital by the same amount. Net assets and net asset value per share were not affected by this reclassification.
NOTE 2—Bank Line of Credit:
The Company has a line of credit arrangement (“LOC”) with State Street Bank and Trust Company, to be used for temporary or emergency purposes, primarily for financing redemption payments. The borrowings by each series of the Company are limited to the lesser of (a) $25 million, or (b) the lesser of 25% of the series’ total net assets or the maximum amount which the series is permitted to borrow pursuant to the prospectus, any law or any other agreement. Combined borrowings are subject to the $25 million cap on the total LOC. Each series agrees to pay annual fees and interest on the unpaid balance based on prevailing market rates as defined in the LOC.
The average daily amount of borrowings outstanding under the LOC during the period ended December 31,2008,was approximately $14,700 with a related weighted average annualized interest rate of 4.07% .
The Fund 31
| NOTES TO FINANCIAL STATEMENTS (continued) |
NOTE 3—Investment Advisory Fee and Other Transactions With Affiliates:
(a) In accordance with an investment advisory agreement between the Company and Founders, the fund compensates Founders for its services as investment adviser by the payment of fees computed daily and paid monthly at an annual rate equal to a percentage of the average daily value of the fund’s net assets.The fee is 1% of the first $250 million of net assets, .80% of the next $250 million of net assets and .70% of net assets in excess of $500 million.
During the period ended December 31, 2008, the Distributor retained $628 and $374 from sales commissions earned on sales of the fund’s Class A and ClassT shares, respectively, and $324 and $459 from CDSCs on redemptions of the fund’s Class B and Class C shares, respectively.
(b) Under a Distribution Plan (the “Class B, C and T Plan”) adopted pursuant to Rule 12b-1 under the Act, Class B, Class C and Class T shares pay the Distributor for distributing the shares at an annual rate of .75% of the value of the average daily net assets of Class B and Class C shares and .25% of the value of the average daily net assets of Class T shares. During the period ended December 31, 2008, Class B, Class C and Class T shares were charged $4,037, $13,460 and $250, respectively, pursuant to the Class B, C and T Plan.
The fund also has adopted a Distribution Plan pursuant to Rule 12b-1 under the Act applicable to its Class F shares (the “Class F Plan”).Under the Class F Plan, the fund is authorized to reimburse the Distributor for expenses paid for distributing or servicing its Class F shares at an annual rate of up to .25% of the value of the average daily net assets of the Fund’s Class F shares. During the period ended December 31, 2008, Class F shares were charged $171,508 pursuant to the Class F Plan.
(c) Under the Shareholder Services Plan, Class A, Class B, Class C and ClassT shares pay the Distributor at an annual rate of .25% of the value of their average daily net assets for the provision of certain services. The services provided may include personal services relating to shareholder accounts, such as answering shareholder inquiries regarding the
32
fund and providing reports and other information, and services related to the maintenance of shareholder accounts. The Distributor may make payments to Service Agents (a securities dealer, financial institution or other industry professional) in respect of these services. The Distributor determines the amounts to be paid to Service Agents. During the period ended December 31, 2008, Class A, Class B, Class C and Class T shares were charged $20,678, $1,346, $4,487 and $250, respectively, pursuant to the Shareholder Services Plan.
The Company has a shareholder services agreement with the Distributor, whereby the fund has agreed to compensate the Distributor for providing certain shareholder servicing functions to holders of Class F shares. The fund paid the Distributor a monthly fee equal, on an annual basis, to $24.00 per Class F shareholder account considered to be an open account at any time during a given month. During the period ended December 31, 2008, Class F shares were charged $120,805 pursuant to this shareholder services agreement.
Dreyfus Transfer, Inc. (“DTI”), a wholly-owned subsidiary of Dreyfus, is the transfer and dividend disbursing agent for all of the fund’s share classes.The Distributor pays the transfer and dividend agent fees, other than out-of-pocket charges, for Class F only.
The fees charged by DTI with respect to the fund’s Class A,B,C, I and T shares are paid by the fund. These transfer agency fees, including both the per account fees paid to DTI and out-of-pocket charges, during the period ended December 31, 2008 were $28,465.
The fund compensates The Bank of New York Mellon, a subsidiary of BNY Mellon and an affiliate of Founders, under two cash management agreements for performing cash management services related to fund subscriptions and redemptions. During the period ended December 31, 2008, the fund was charged $23,768 for these services, which were partially offset by earnings credits pursuant to the cash management agreements.
The Fund 33
| NOTES TO FINANCIAL STATEMENTS (continued) |
The fund compensates The Bank of New York Mellon under a custody agreement for providing custodial services for the fund. During the period ended December 31, 2008, the fund was charged $24,355 for these services. These fees were partially offset by earnings credits pursuant to the custody agreement.
The fund has agreed to compensate Dreyfus for providing accounting services, administration, compliance monitoring, regulatory and shareholder reporting, as well as related facilities, equipment and clerical help. The fee is computed at the annual rate of .06% of the average daily net assets of the fund on the first $500 million, .04% of the average daily net assets of the fund on the next $500 million and .02% of the average daily net assets of the fund in excess of $1 billion, plus reasonable out-of pocket expenses. Dreyfus has contractually agreed in writing to waive any fees received for these services to the extent they exceed its costs in providing the services and a reasonable allocation of the costs incurred by Founders and its affiliates related to the support and oversight of these services. During the period ended December 31, 2008, Dreyfus waived $7,129.
The components of “Due to Founders Asset Management LLC and affiliates” in the Statement of Assets and Liabilities consist of: investment advisory fees $95,375, Rule 12b-1 distribution plan fees $13,853, shareholder services plan fees $42,835, custodian fees $4,451, compliance support fees $1,833, transfer agency per account fees $4,638 and accounting fees $5,877.
(d) Annual retainer fees and attendance fees for the Company’s Board of Directors are allocated to each series of the Company based on net assets. During the period ended December 31, 2008, the fund paid $63,768 in directors’ fees. The Company’s Board of Directors has adopted a deferred compensation plan for Company directors that enables directors to elect to defer receipt of all or a portion of the annual compensation that they are entitled to receive from the Company. Under the plan, the compensation deferred is invested in shares of one or more of the Company’s series.The amount paid to
34
the director under the plan will be determined based upon the performance of the selected series.The current value of these amounts is included in Other Assets and Directors’ Deferred Compensation in the Statement of Assets and Liabilities. Increases in the market value of the deferred compensation accounts are added to the directors’ fees and expenses paid by the fund in the directors fees and expenses in the Statement of Operations, and decreases in the market value of the accounts are subtracted from such fees. During the period ended December 31, 2008, depreciation in the value of the accounts totaled $41,667. This depreciation also is included in the net unrealized appreciation (depreciation) on investments in the Statement of Operations. Deferral of directors’ fees under the plan does not affect the net assets of the fund.
Certain officers of the Company are also officers and/or directors of Founders or its affiliates, which pay their compensation. However, the fund pays a portion of the cost of the services performed by the Company’s Chief Compliance Officer and her staff. During the period ended December 31, 2008, the fund was charged $1,833 for these services, which is included in miscellaneous expenses. The affairs of the fund, including services provided by Founders, are subject to the supervision and general oversight of the Company’s Board of Directors.
NOTE 4—Securities Transactions:
The aggregate amount of purchases and sales of investment securities, excluding short-term securities, during the period ended December 31, 2008, amounted to $407,546,641 and $437,243,656, respectively.
At December 31, 2008, the cost of investments for federal income tax purposes was $146,554,100; accordingly, accumulated net unrealized depreciation on investments was $26,604,111, consisting of $3,266,956 gross unrealized appreciation and $29,871,067 gross unrealized depreciation.
The Fund 35
| NOTES TO FINANCIAL STATEMENTS (continued) |
In March 2008, the Financial Accounting Standards Board released Statement of Financial Accounting Standards No. 161 “Disclosures about Derivative Instruments and Hedging Activities” (“FAS 161”). FAS 161 requires qualitative disclosures about objectives and strategies for using derivatives, quantitative disclosures about fair value amounts of gains and losses on derivative instruments and disclosures about credit-risk-related contingent features in derivative agreements. The application of FAS 161 is required for fiscal years and interim periods beginning after November 15, 2008.At this time, management is evaluating the implications of FAS 161 and its impact on the financial statements and the accompanying notes has not yet been determined.
NOTE 5—Subsequent Event:
On February 4, 2009, the fund issued to each holder of its Class T shares, in exchange for said shares, Class A shares of the fund having an aggregate net asset value equal to the aggregate net asset value of the shareholder’s Class T shares. Subsequent investments in the fund’s Class A shares made by prior holders of the fund’s ClassT shares who received Class A shares of the fund in exchange for their Class T shares are subject to the front-end sales load schedule that was in effect for Class T shares at the time of the exchange. Otherwise, all other Class A share attributes will be in effect.
36
REPORT OF INDEPENDENT REGISTERED
PUBLIC ACCOUNTING FIRM |
| | Shareholders and Board of Directors
Dreyfus Discovery Fund |
We have audited the accompanying statement of assets and liabilities, including the statement of investments, of Dreyfus Discovery Fund (formerly, Dreyfus Founders Discovery Fund) (one of the series comprising Dreyfus Funds, Inc.) as of December 31, 2008, and the related statement of operations for the year then ended, and the statement of changes in net assets and financial highlights for each of the two years in the period then ended. These financial statements and financial highlights are the responsibility of the Fund’s management. Our responsibility is to express an opinion on these financial statements and financial highlights based on our audits. The financial highlights for the years ended December 31, 2006, 2005 and 2004 were audited by other auditors whose report dated February 23, 2007, expressed an unqualified opinion on such financial highlights.
We conducted our audits in accordance with the standards of the Public Company Accounting Oversight Board (United States).Those standards require that we plan and perform the audit to obtain reasonable assurance about whether the financial statements and financial highlights are free of material misstatement.We were not engaged to perform an audit of the Fund’s internal control over financial reporting. Our audits included consideration of internal control over financial reporting as a basis for designing audit procedures that are appropriate in the circumstances, but not for the purpose of expressing an opinion on the effectiveness of the Fund’s internal control over financial reporting. Accordingly, we express no such opinion.An audit also includes examining, on a test basis, evidence supporting the amounts and disclosures in the financial statements and financial highlights, assessing the accounting principles used and significant estimates made by management, and evaluating the overall financial statement presentation. Our procedures included confirmation of securities owned as of December 31, 2008 by correspondence with the custodian and others. We believe that our audits provide a reasonable basis for our opinion.
In our opinion, the 2008 and 2007 financial statements and financial highlights referred to above present fairly, in all material respects, the financial position of Dreyfus Discovery Fund at December 31, 2008, the results of its operations for the year then ended, and the changes in its net assets and the financial highlights for each of the two years in the period then ended, in conformity with U.S. generally accepted accounting principles.

New York, New York
February 23, 2009 |
The Fund 37
FACTORS CONSIDERED IN RENEWING
THE ADVISORY AGREEMENT (Unaudited) |
At a meeting of the board of directors of Dreyfus Funds, Inc. (the “Funds” and, in reference to any one of the Funds’ portfolios, a “Fund”) held on August 20 and 21, 2008, the Funds’ directors unanimously approved the continuation of the Investment Advisory Agreement (“management agreement”) between each of the Funds and Founders Asset Management LLC, the Funds’ investment adviser (“Founders”), for a one-year term ending August 31, 2009.The board of directors of the Funds (“board”) is comprised entirely of individuals who have no affiliation with Founders or any affiliates of Founders (the “directors”).
Prior to the directors’ August 2008 meeting, Founders had provided the directors with extensive materials related to the renewal of the management agreement, including performance and expense information for other investment companies with similar investment objectives to each Fund derived from data compiled by Lipper Inc., an independent third party (“Lipper”).
During their meeting, the directors discussed the proposed continuance of the management agreement with the senior management personnel of Founders. At the conclusion of these discussions, the directors and their independent counsel met in a private session at which no representatives of Founders were present, to continue their discussion of continuance of the agreement. In determining to continue the management agreement, the directors considered all factors which they believed to be relevant, including the following:
Nature, Extent and Quality of Services Provided and to be Provided by Founders
The directors recognized that they have had the opportunity to evaluate the investment and non-investment related services which Founders and its affiliates provide to the Funds primarily through their quarterly review of all of the operations of the Funds during Fund committee and Fund board meetings held throughout the past twelve months. At each such meeting, extensive discussions of Fund operations are held with senior management personnel of Founders and a large volume of documentation with respect to these operations is
38
provided to and reviewed by the directors. Such discussions and documentation afford the directors the continual opportunity to evaluate the nature, extent, and quality of the services provided by Founders and its affiliates to the Funds.
The directors were satisfied that Founders is managing the investment of the assets of the Funds in accordance with each Fund’s respective investment objective, policies and restrictions, subject to the directors’ overall supervision.
The directors considered that Founders also provides many non-investment related services to the Funds in fulfilling its responsibilities under the management agreement.
Following their discussion and review, the directors reached the following conclusions:
- That the breadth and quality of investment advisory and other ser- vices being provided to the Funds are satisfactory, as evidenced in part by the performance records of the Funds, to which the direc- tors gave significant attention as indicated below; and
- That the directors are satisfied not only with the research, long-term portfolio management, and trading services being provided to the Funds, but also recognize that Founders or its affiliates have provided the highest quality accounting, compliance and regulatory, adminis- trative, underwriting, custody, shareholder, transfer agent and cash management services to the Funds, while charging fair, reasonable and competitive fees.
Investment Performance
On a quarterly basis, the directors hold meetings with representatives of the portfolio management team for each Fund (usually a portfolio manager), during which each representative reviews, among other items, performance information, attribution analyses, and the portfolio manager’s investment outlook. The directors also receive written monthly and quarterly performance information for each Fund. The
The Fund 39
FACTORS CONSIDERED IN RENEWING THE
ADVISORY AGREEMENT (Unaudited) (continued) |
written quarterly reports included comparisons of each Fund’s performance with its respective Lipper category and one or more benchmark indexes, as well as a comparable exchange-traded fund, for the most recent quarter and one-, three-, five-, and ten-year periods, as well as for the portfolio manager’s tenure.
In conjunction with their consideration of renewal of the management agreement, the directors received a more detailed performance report about each Fund from Lipper.These reports compared each Fund’s performance to both a relatively small group of similar funds selected by Lipper (the “Lipper performance group”), as well as to all funds in the applicable Lipper category (the “Lipper performance universe”).
The performance of Discovery Fund’s Class F shares placed in the third quintile of both its Lipper performance group and the Lipper small-cap growth fund performance universe for the one-year period ended December 31, 2007, placed in the lowest two quintiles of its Lipper performance group and universe for the three- and five-year periods ended December 31, 2007, and underperformed its benchmark index for the three- and five-year periods ended June 30, 2008. The directors recognized that in its efforts to improve the prior unsatisfactory performance results of Discovery Fund, Founders had changed the portfolio managers of the Fund in August 2006, and that the Fund’s relative performance since that date had improved significantly. The Fund outperformed its benchmark index for the year ended June 30, 2008 and for the period from August 1, 2006 (the commencement of the new portfolio manager’s tenure) through June 30, 2008, and its performance placed it in the second quintile of its Lipper universe for the latter period.The directors were hopeful that the steps Founders has taken in an effort to improve the Fund’s performance would continue to show relative performance progress.
After consideration of all relevant information and data, the directors concluded that although past performance cannot be a guaranty of future performance, each Fund and its shareholders would continue to
40
benefit from Founders’ investment management of the Fund. The directors further determined:
- That although certain of the Funds have experienced performance difficulties, Founders has focused its efforts upon improving the per- formance records of the Funds and will continue to seek improve- ment; and
- That the materials provided by Lipper demonstrated that most of the Funds maintained satisfactory long-term performance quintile rank- ings in their respective comparison universes, with three of five Funds placing in the top three quintiles of their respective Lipper perfor- mance universes for the three-year period ended December 31, 2007, and four of five Funds placing in the top three quintiles of their respective Lipper performance universes for the five-year period ended December 31, 2007.
Costs of the Services to be Provided and Profits to be
Realized by Founders and Its Affiliates from Founders’
Relationship With the Funds |
The directors recognized that on a quarterly basis, they received information with respect to each Fund’s expenses. The directors carefully reviewed and discussed the expense ratios for all classes of shares of each Fund at each of their quarterly meetings throughout the year.
In conjunction with their annual consideration of renewal of the Funds’ management agreement and other service arrangements, the directors received detailed information from Lipper which compared each Fund’s management fees and other expenses with those of a group of similar funds selected by Lipper (the “Lipper expense group”), as well as summary information comparing each Fund’s management fees and expenses with those of the funds in its Lipper performance universe with load structures similar to that of the Funds (the “Lipper expense universe”).
The Fund 41
FACTORS CONSIDERED IN RENEWING THE
ADVISORY AGREEMENT (Unaudited) (continued) |
The directors noted that for the period ended December 31, 2007, Discovery Fund’s management fees ranked in the fourth quintile of its Lipper expense group, with the Fund’s fees the twelfth lowest of 18 “peer funds.” The Fund’s contractual management fees at a common asset level were determined by Lipper to be lower than ten of the 18 funds in its group. The Fund’s management fees were in the fourth quintile of its Lipper expense universe.
The directors also considered information provided by Lipper with respect to the profitability of the investment management activities conducted by a number of publicly-held corporations. Lipper also prepared an analysis providing detailed information with respect to the types of services rendered to various mutual fund complexes under their respective investment advisory contracts, including the services provided by Founders to the Funds under the management agreement.
The directors had been provided with extensive materials with respect to the profitability derived by Founders from providing investment advisory services to the Funds as a group and to each Fund individually.
The directors further considered certain indirect benefits received by Founders and its affiliates as a result of Founders’ provision of investment advisory services to the Funds.These included the following:
- Since Founders manages a non-Fund account in a style that is sim- ilar to that used for one of the Funds (and for a portion of another Fund), and employees of Founders manage other non-Fund accounts in their capacities as employees of the affiliates, Founders and its affiliates realize efficiencies in performing the portfolio management, trading and operational functions related to those non-Fund accounts;
- The Funds’ brokerage transactions may be executed with brokers that provide research and brokerage services to Founders and its affiliates. These research and brokerage services may be useful to Founders and its affiliates in providing investment advisory services to any of the clients they advise, including the Funds; and
42
- Affiliates of Founders receive various fees for providing accounting, underwriting, shareholder, transfer agency, custody and cash man- agement services to the Funds.
After deliberation and discussion of Fund fees and expenses, the directors determined:
- That upon review of the advisory fee structures of the Funds in comparison with the competitive expense groups and expense uni- verses selected by Lipper, the levels of investment advisory fees paid by the Funds were deemed to be competitive;
- That the expense ratios of the Funds are competitive and that Founders continually reviews each Fund’s total expense ratio in an effort to maintain Fund expense ratios at reasonable and compet- itive levels;
- That three of the five Funds’ expense ratios decreased or remained substantially the same for all or most of their share classes in 2007 as compared to those experienced in 2006; and
- That the comparative fee and expense information included in the materials provided by Lipper supports the determination that the advisory and other fees payable by the Funds to Founders and its affiliates are essentially fees which would be similar to those that would have resulted solely from “arm’s-length” bargaining.
With respect to profitability to Founders, the directors reviewed the adviser profitability analysis provided by Lipper, which demonstrated that Founders’ 2007 profitability from providing management services to the Funds was reasonable in comparison to the entities included in the Lipper analysis.
The directors were also advised by independent counsel of the profitability percentage ranges which court cases have found acceptable and determined that Founders’ profitability percentage for providing management services to the Funds was reasonable.
The Fund 43
FACTORS CONSIDERED IN RENEWING THE
ADVISORY AGREEMENT (Unaudited) (continued) |
The directors concluded that Founders’ profits from providing management services to the Funds were reasonable in relationship to the overall services which Founders provides.
Economies of Scale
The directors reviewed information provided by Founders which summarized the extent, if any, that both Founders and the Funds would achieve certain economies of scale if the assets of the Funds were to increase.
After review and discussion, the directors considered the extent to which economies of scale and common management are shared with each Fund, including the economies that would be realized from the growth of each Fund’s assets. After such consideration, the directors determined that all of the Funds have structured breakpoints in their advisory fees, which result in fee reductions as the assets of each Fund reach defined levels, and that such fee reductions, when implemented, would benefit all of the applicable Fund’s shareholders through decreases in the Fund’s expense ratio.
Dedication to Regulatory Requirements and Restrictions
An important factor in the directors’ consideration of renewal of the Funds’ management agreement with Founders included the directors’ recognition of the dedication by Founders of stringent adherence to regulatory requirements and restrictions.The directors determined that Founders is dedicated to compliance with all applicable rules and regulations and that the systems of controls which are in place to ensure that the service providers to the Funds, including Founders, and the Funds themselves, maintain strict adherence to the law are excellent.
44
Overall Conclusions
The directors determined that they are generally satisfied with the performance of the Funds and with the quality of the advisory and other services being provided by Founders and its affiliates to the Funds. The directors recognized that efforts are being and will continue to be made to improve the Fund’s performance and to maintain Fund expense ratios at reasonable and competitive levels.
The directors concluded that continuation of the current management agreement between each Fund and Founders, which would enable each Fund to continue to receive investment advisory services from Founders, is in the best interests of each Fund and its shareholders, the services to be performed under the management agreement are services required for the operations of the Funds, Founders has provided satisfactory investment management services to the Funds in the past, and the fees for the management services which Founders will perform will be within the range of what would have been negotiated at arm’s length in light of the circumstances.
The Fund 45
YOUR BOARD REPRESENTATIVES (Unaudited)
The Board of Directors of the Company oversees the Company’s five series portfolios (the “Funds”). The business and affairs of the Company are managed under the direction of the Board.The directors serving on the Board perform their responsibilities in the manner which they reasonably believe to be in the best interests of the Funds and their shareholders.
All of the directors, as listed below, are independent directors.They are not affiliated with the Fund’s adviser, its parent company, or its affiliates. The directors have no official term of office and generally serve until they retire (normally at age 75, but subject to extension to age 80), resign, or are not re-elected. As you can see from their backgrounds, the directors have broad experience as active or former business and community leaders.
Directors
Alan S. Danson, 69.Year elected to the Board: 1991
Board Chairman.Private investor.Formerly,President and Director,D.H.Management, Inc., the general partner of a limited partnership with technology company holdings (1996 to 2003). Director, Gore Range Natural Science School and The Les Streeter Program, Inc., both of which are non-profit organizations.
Robert P. Mastrovita, 64.Year elected to the Board: 1998
Private investor. Chairman of a private charitable foundation (1997 to present). Formerly, Chairman and Director, Hagler, Mastrovita & Hewitt, Inc., a registered investment adviser (1982 to 1997). Member, Boston Society of Security Analysts. Trustee, Partridge Academy. Director, King Caesar Foundation.
Trygve E. Myhren, 72.Year elected to the Board: 1996
President, Myhren Media, Inc., a firm that invests in and advises media, telecommunications, Internet and software companies. Special Limited Partner and member of Investment Committee, Megunticook Funds, a venture capital firm (1998 to present). Director, AdPay, Inc. Trustee, Executive Committee and Chairman of Faculty Education Affairs Committee, the University of Denver.Trustee, Denver Art Museum. Member, Colorado FORUM and Cable Television Hall of Fame. Formerly, President (1990 to 1996) and Director (1992 to 2001) of the Providence Journal Company, a diversified media and communications company. Formerly, Chairman and Chief Executive Officer of American Television and Communications Corporation (now Time Warner Cable) (1981 to 1988). Formerly, Chairman of the National Cable
46
Television Association (1986-1987). U.S. Chief of Mission, 2006 Paralympic Games, Torino/Sestrierre, Italy.
George W. Phillips, 70.Year elected to the Board: 1998
Retired.Vice Chairman of the Board and Chairman of the Investment Committee, Children’s Medical Center of Boston. Formerly, President and Chief Executive Officer (1992 to 1997) and Director (1992 to 2002) of Warren Bancorp, Inc. Formerly, President, Chief Executive Officer and Director of Warren Five Cents Savings Bank (1992 to 1997).
Martha A. Solis-Turner, 48.Year elected to the Board: 2005
Formerly, Telecommunications Director, Wholesale Markets (1995 to 2001), and Manager (1990 to 1995), Qwest Communications International Inc. Formerly, Board member and Treasurer, Mile High Montessori Early Learning Centers (2002 to 2008), Board member (1995 to 2004) and Vice President (2002 to 2004), Curtis Park Community Center, both of which are non-profit organizations.
Principal Officers
J. David Officer, 60. President and Principal Executive Officer of the Funds since 2007. Chairman, President and Chief Executive Office of Founders since 2008. Chief Operating Officer,Vice Chairman and a Director of Dreyfus, and an officer of 77 investment companies (comprised of 180 portfolios) managed by Dreyfus. He has been an employee of Dreyfus since 1998.
Kenneth R. Christoffersen, 53. Vice President of the Funds since 2008, and Secretary since 2000 (and from 1996 to 1998). Founders’ Senior Vice President -Legal, General Counsel and Secretary. Assistant Secretary of the Distributor since 2003. Employed by Founders and its predecessor company since 1996.
Steven M. Anderson, 43.Treasurer and Principal Financial and Accounting Officer of the Funds since 2007.Vice President,BNY Mellon Asset Management (since 2003). Vice President, Treasurer and Chief Financial Officer, Mellon Optima L/S Strategy Fund, LLC (since 2005). Treasurer and Chief Financial Officer BNY/IVY Multi-Strategy Hedge Fund, LLC (since 2008). Formerly,Vice President (1999 to 2008), Treasurer and Chief Financial Officer of Mellon Institutional Funds Investment Trust (2002 to 2008).AssistantVice President and Mutual Funds Controller,Standish Mellon Asset Management Company, LLC (2000 to 2003).
The Fund 47
YOUR BOARD REPRESENTATIVES (Unaudited) (continued)
Janelle E. Belcher, 50. Chief Compliance Officer of the Funds since 2004. Founders’ Vice President - Compliance since 2002. Formerly, Founders’ Manager of Compliance (2000 to 2002) and Securities Compliance Examiner, Staff Accountant and Team Leader for the U.S. Securities and Exchange Commission (1990 to 2000).
Robert S. Robol, 44. Assistant Treasurer since 2006. Senior Accounting Manager -Taxable Fixed Income Funds of Dreyfus, and an officer of 78 investment companies (comprised of 201 portfolios) managed by Dreyfus. Employed by Dreyfus since 1988.
Robert Salviolo, 41. Assistant Treasurer since 2007. Senior Accounting Manager -Foreign Equity Funds of Dreyfus, and an officer of 78 investment companies (comprised of 201 portfolios) managed by Dreyfus. Employed by Dreyfus since 1989.
Robert Svagna, 41. Assistant Treasurer since 2006. Senior Accounting Manager -Equity Funds of Dreyfus, and an officer of 78 investment companies (comprised of 201 portfolios) managed by Dreyfus. Employed by Dreyfus since 1990.
William G. Germenis, 38. Anti-Money Laundering Compliance Officer (“AMLCO”) for the Class A, Class B, Class C and Class I shares of the Funds since 2002 and for the Class F shares of the Funds since 2003.Vice President and AMLCO of the Distributor and AMLCO of 74 investment companies (comprised of 197 portfolios) managed by Dreyfus. Employed by the Distributor since 1998.
The directors and officers may be contacted at Founders’ address appearing on the back cover, except for Messrs. Officer, Robol, Salviolo, Svagna and Germenis, who can be contacted at The Dreyfus Corporation, 200 Park Avenue, NewYork, NewYork 10166, and Mr. Anderson, who can be contacted at BNY Mellon Asset Management, One Boston Place, Boston, Massachusetts 02108. Additional information about the Company’s directors is available in the Statement of Additional Information, which can be obtained free of charge by calling 1-800-645-6561 (Class F shareholders) or 1-800-554-4611 (all other shareholders).
48
For More Information
The fund files its complete schedule of portfolio holdings with the Securities and Exchange Commission (“SEC”) for the first and third quarters of each fiscal year on Form N-Q. The fund’s Forms N-Q are available on the SEC’s website at http://www.sec.gov and may be reviewed and copied at the SEC’s Public Reference Room in Washington, DC. Information on the operation of the Public Reference Room may be obtained by calling 1-800-SEC-0330.
A description of the policies and procedures that the fund uses to determine how to vote proxies relating to portfolio securities, and information regarding how the fund voted these proxies for the most recent 12-month period ended June 30 is available at http://www.dreyfus.com and on the SEC’s website at http://www.sec.gov.
The description of the policies and procedures is also available without charge, upon request, by calling 1-800-645-6561.
This report and the statements it contains are submitted for the general information
of our shareholders. The report is not authorized for distribution to prospective
investors unless preceded or accompanied by an effective prospectus. |
© 2009 MBSC Securities Corporation

Dreyfus
Equity Growth Fund
| | ANNUAL REPORT December 31, 2008 |

Save time. Save paper. View your next shareholder report online as soon as it’s available. Log into www.dreyfus.com and sign up for Dreyfus eCommunications. It’s simple and only takes a few minutes.
The views expressed in this report reflect those of the portfolio manager only through the end of the period covered and do not necessarily represent the views of Dreyfus, Founders or any other person in our organization. Any such views are subject to change at any time based upon market or other conditions and we disclaim any responsibility to update such views. These views may not be relied on as investment advice and, because investment decisions for a Dreyfus fund are based on numerous factors, may not be relied on as an indication of trading intent on behalf of any Dreyfus fund.
| | Contents |
| |
| | THE FUND |
| |
| 2 | A Letter from the Chairman |
| |
| 3 | Discussion of Fund Performance |
| |
| 6 | Fund Performance |
| |
| 8 | Understanding Your Fund’s Expenses |
| |
| 8 | Comparing Your Fund’s Expenses With Those of Other Funds |
| |
| 9 | Statement of Investments |
| |
| 14 | Statement of Assets and Liabilities |
| |
| 15 | Statement of Operations |
| |
| 16 | Statement of Changes in Net Assets |
| |
| 18 | Financial Highlights |
| |
| 24 | Notes to Financial Statements |
| |
| 37 | Report of Independent Registered Public Accounting Firm |
| |
| 38 | Important Tax Information |
| |
| 39 | Factors Considered in Renewing the Advisory Agreement |
| |
| 47 | Your Board Representatives |
| |
| | FOR MORE INFORMATION |
| |
| | Back Cover |
| |
Dreyfus
Equity Growth Fund |

A LETTER FROM THE CHAIRMAN
Dear Shareholder: |
We present to you this annual report for Dreyfus Equity Growth Fund, covering the 12-month period from January 1, 2008, through December 31, 2008.
2008 was the most difficult year in decades for the economy and stock market.A credit crunch that originated in 2007 in the U.S. sub-prime mortgage market exploded in mid-2008 into a global financial crisis, resulting in the failures of major financial institutions, a deep and prolonged recession and lower investment values across a broad range of asset classes. Governments and regulators throughout the world moved aggressively to curtail the damage, implementing unprecedented reductions of short-term interest rates, massive injections of liquidity into the banking system, government bailouts of struggling companies and plans for massive economic stimulus programs. After several years of strong relative returns, international stocks generally declined more sharply than their U.S. counterparts.
Although we expect the U.S. and global economies to remain weak until longstanding imbalances have worked their way out of the system, the financial markets currently appear to have priced in investors’ generally low expectations. In previous recessions, however, the markets have tended to anticipate economic improvement before it occurs, potentially leading to major rallies when few expected them. That’s why it makes sense to remain disciplined, maintain a long-term perspective and adopt a consistent asset allocation strategy that reflects one’s future goals and attitudes toward risk.As always, we urge you to consult with your financial advisor, who can recommend the course of action that is right for you.
For information about how the fund performed during the reporting period, as well as market perspectives, we have provided a Discussion of Fund Performance.
Thank you for your continued confidence and support.

J. David Officer
Chairman, President and Chief Executive Officer
Founders Asset Management LLC
January 15, 2009 |
2

D I S C U S S I O N O F F U N D P E R F O R M A N C E
For the period of January 1, 2008, through December 31, 2008. |
Fund and Market Performance Overview
For the 12-month period ended December 31, 2008, Dreyfus Equity Growth Fund’s Class A shares produced a total return of –41.39%, Class B shares returned–41.84%, Class C shares returned –41.72%, Class F shares returned –41.13%, Class I shares returned –41.08% and Class T shares returned –42.14% .1 In comparison, the Russell 1000 Growth Index, the fund’s benchmark, returned –38.44% over the same period.2
Intensifying economic deterioration and a global financial crisis led to sharp declines among large-cap growth stocks during 2008. The fund produced lower returns than its benchmark, mainly due to disappointing security selections in the information technology, health care and materials sectors.
The Fund’s Investment Approach
To pursue the fund’s goal of long-term growth of capital and income, we invest primarily in the common stocks of large, well-established companies with records of profitability, dividend payments and a reputation for high-quality management, products and services. Using a “bottom-up” approach, we focus on individual stock selection instead of broad economic or industry trends. We look mainly for companies whose fundamental strengths suggest the potential to provide superior earnings growth over time.The fund may also invest in non-dividend-paying companies, and it may invest up to 30% of its total assets in foreign securities.
Economic Recession Led to Substantial Market Losses
After producing relatively modest declines over the first half of 2008,stocks tumbled during the second half of the year, triggered by the intensification of a credit crisis that began in 2007 and mushroomed in September 2008 with the failures of several major financial institutions.These developments exacerbated an ongoing economic slowdown, as lenders grew reluctant to extend credit even to some of their more creditworthy customers, causing consumer spending and business investment to drop off sharply. In turn, waning industrial demand caused commodity prices to retreat from
The Fund 3
| DISCUSSION OF FUND PERFORMANCE (continued) |
previous record highs. In late November, the National Bureau of Economic Research confirmed that the U.S. economy was mired in its first recession since 2001.
Security Selections Produced Sub-Par Results
In this challenging environment, our stock selection strategy generally detracted from the fund’s relative performance, especially in the information technology sector. Steep declines by industry giants Microsoft, Apple, Google and Cisco Systems were mirrored by MEMC Electronic Materials and Electronic Arts, all of which encountered softer demand from consumers and businesses. Silicon wafer producer MEMC Electronic Materials also suffered from ongoing operating problems and concerns surrounding customers’ ability to finance future projects, while video game maker Electronic Arts was hurt by restructuring efforts, new product delays and currency devaluation. Apple was also adversely affected by rumors regarding the health of its CEO.
Despite a strong contribution to relative performance from biotechnol-ogy company Gilead Sciences, the fund’s health care holdings generally lagged market averages, primarily due to poor results from specialty health care company Allergan and contract-research organization Pharmaceutical Product Development (PPD). PPD’s stock slid amid concerns regarding future orders and current backlogs in clinical trials. In the materials sector, unfavorable timing in increasing the fund’s exposure to materials producers detracted from the fund’s relative performance. By the end of the reporting period, we had eliminated all of the fund’s positions in materials stocks, with the exceptions of Praxair and Monsanto, due to substantial losses and deteriorating business fundamentals.
Although larger integrated oil companies such as Chevron and Exxon Mobil weighed on the fund during the first half of 2008, these stocks performed better than market averages by year-end. Our focus on some of the better-performing consumer discretionary stocks also bolstered the fund’s relative performance, as Wal-Mart Stores and Family Dollar Stores advanced when cost-conscious consumers increasingly turned to low-priced goods. Our position in Family Dollar Stores was sold during the reporting period. Positions in for-profit education companies Apollo Group and DeVry also supported the fund’s returns, as concerns regarding the availability of student loans weighed on the market price of these securities and provided the fund with attractive
4
buying opportunities. Fortunate timing in the purchase of AT&T and the sale of Potash Corporation of Saskatchewan also helped bolster the fund’s relative performance.
Maintaining a Focus on Quality
At the end of the reporting period, rising unemployment, declining industrial production and slumping housing markets have continued to weigh on the U.S. economy. However, lower energy prices, expectations of a meaningful economic stimulus package from the federal government and news that large lenders might begin working with homeowners to prevent further foreclosures may soon provide a foundation for rebuilding consumer confidence and reinvigorating economic growth.
As 2009 begins, the fund’s new management team does not anticipate major changes to the portfolio’s composition and has continued to focus on companies whose fundamentals remain strong despite reduced growth expectations.We intend to continue our emphasis on higher-quality stocks that, in our judgment, are attractively priced, positioned to weather the current storm and poised to participate in an eventual market rebound.
January 15, 2009
On January 6, 2009, Elizabeth Slover assumed portfolio management responsibilities for the fund. For more information about Ms. Slover, please see the fund’s prospectus or talk to your financial advisor.
Part of the fund’s historical performance is due to amounts received from class action settlements regarding prior fund holdings. There is no guarantee that these settlement distributions will occur in the future or have a similar impact on performance.
| 1 | Total return includes reinvestment of dividends and any capital gains paid, and does not take into consideration the maximum initial sales charges in the case of Class A and Class T shares, or the applicable contingent deferred sales charges imposed on redemptions in the case of Class B and Class C shares. Had these charges been reflected, returns would have been lower. Past performance is no guarantee of future results. Share price and investment return fluctuate such that upon redemption, fund shares may be worth more or less than their original cost.The return figure provided for the fund’s Class I shares reflects the absorption of certain fund expenses by Founders pursuant to an agreement that terminated on August 31, 2008. Had these expenses not been absorbed, Class I share returns would have been lower. |
| |
| 2 | SOURCE: LIPPER INC. — The Russell 1000 Growth Index is a widely accepted, unmanaged large-cap index that measures the performance of those Russell 1000 Index companies with higher price-to-book ratios and higher forecasted growth values.The total return figure cited for this index assumes change in security prices and reinvestment of dividends, but does not reflect the costs of managing a mutual fund. |
| |
The Fund 5
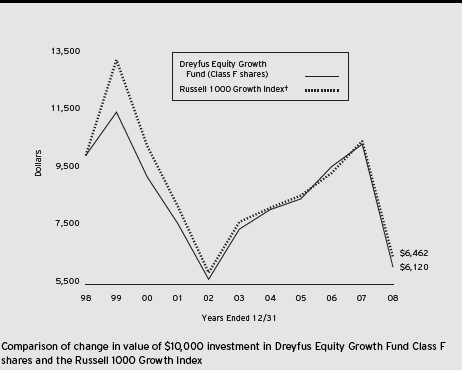
† Source: Lipper Inc.
Past performance is not predictive of future performance.
The above graph compares a $10,000 investment made in Class F shares of Dreyfus Equity Growth Fund on 12/31/98 to a $10,000 investment made in the Russell 1000 Growth Index (the “Index”) on that date. All dividends and capital gain distributions are reinvested. Performance for Class A, Class B, Class C, Class I and Class T shares will vary from the performance of Class F shares shown above due to differences in charges and expenses.
The fund’s performance shown in the line graph takes into account all applicable Class F fees and expenses (after any expense reimbursements).The Index is an unmanaged index which measures the performance of those Russell 1000 companies with higher price-to-book ratios and higher forecasted growth values. Unlike a mutual fund, the Index is not subject to charges, fees and other expenses. Investors cannot invest directly in any index. Further information relating to fund performance, including expense reimbursements, if applicable, is contained in the Financial Highlights section of the prospectus and elsewhere in this report.
6
| Average Annual Total Returns as of 12/31/08 | | | | | | |
| |
| | | Inception | | | | | | | | From |
| | | Date | | 1 Year | | 5 Years | | 10 Years | | Inception |
| |
| |
| |
| |
| |
|
| Class A shares | | | | | | | | | | |
| with maximum sales charge (5.75%) | | 12/31/99 | | (44.80)% | | (5.25)% | | — | | (7.74)% |
| without sales charge | | 12/31/99 | | (41.39)% | | (4.13)% | | — | | (7.13)% |
| Class B shares | | | | | | | | | | |
| with applicable redemption charge † | | 12/31/99 | | (44.16)% | | (5.30)% | | — | | (7.49)%†† |
| without redemption | | 12/31/99 | | (41.84)% | | (4.91)% | | — | | (7.49)%†† |
| Class C shares | | | | | | | | | | |
| with applicable redemption charge ††† | | 12/31/99 | | (42.31)% | | (4.74)% | | — | | (7.85)% |
| without redemption | | 12/31/99 | | (41.72)% | | (4.74)% | | — | | (7.85)% |
| Class F shares | | 7/5/38 | | (41.13)% | | (3.84)% | | (4.79)% | | N/A |
| Class I shares | | 12/31/99 | | (41.08)% | | (3.78)% | | — | | (6.85)% |
| Class T shares | | | | | | | | | | |
| with applicable sales charge (4.5%) | | 12/31/99 | | (44.72)% | | (6.10)% | | — | | (8.44)% |
| without sales charge | | 12/31/99 | | (42.14)% | | (5.22)% | | — | | (7.96)% |
Past performance is not predictive of future performance.The fund’s performance shown in the graph and table does not reflect the deduction of taxes that a shareholder would pay on fund distributions or the redemption of fund shares, but does reflect expense reimbursements for certain share classes. Part of the fund’s historical performance is due to amounts received from class action settlements regarding prior fund holdings.There is no guarantee that these settlement distributions will occur in the future or have a similar impact on performance.
| † | | The maximum contingent deferred sales charge for Class B shares is 4%. After six years Class B shares convert to |
| | | Class A shares. |
| †† | | Assumes the conversion of Class B shares to Class A shares at the end of the sixth year following the date |
| | | of purchase. |
| ††† | | The maximum contingent deferred sales charge for Class C shares is 1% for shares redeemed within one year of the |
| | | date of purchase. |
The Fund 7
UNDERSTANDING YOUR FUND’S EXPENSES (Unaudited)
As a mutual fund investor, you pay ongoing expenses, such as management fees and other expenses. Using the information below, you can estimate how these expenses affect your investment and compare them with the expenses of other funds.You also may pay one-time transaction expenses, including sales charges (loads) and redemption fees, which are not shown in this section and would have resulted in higher total expenses. For more information, see your fund's prospectus or talk to your financial advisor.
Review your fund’s expenses
The table below shows the expenses you would have paid on a $1,000 investment in Dreyfus Equity Growth Fund from July 1, 2008 to December 31, 2008. It also shows how much a $1,000 investment would be worth at the close of the period, assuming actual returns and expenses.To estimate the expenses you paid on your account over this period, simply divide your account value by $1,000 (for example, an $8,600 account value divided by $1,000 = 8.60), then multiply the results by the number in the Expenses paid per $1,000 line for the class of shares you own.
| | Expenses and Value of a $1,000 Investment
assuming actual returns for the six months ended December 31, 2008 |
| | | Class A | | Class B | | Class C | | Class F | | Class I | | Class T |
| |
| |
| |
| |
| |
| |
|
| Expenses paid | | | | | | | | | | | | |
| per $1,000† | | $ 5.17 | | $ 9.17 | | $ 8.34 | | $ 3.80 | | $ 3.68 | | $ 9.95 |
| Ending value | | | | | | | | | | | | |
| (after expenses) | | $659.80 | | $657.70 | | $658.90 | | $662.80 | | $661.90 | | $656.90 |
COMPARING YOUR FUND’S EXPENSES
WITH THOSE OF OTHER FUNDS (Unaudited) |
Using the SEC’s method to compare expenses
The Securities and Exchange Commission (SEC) has established guidelines to help investors assess fund expenses. Per these guidelines, the table below shows your fund’s expenses based on a $1,000 investment, assuming a hypothetical 5% annualized return. You can use this information to compare the ongoing expenses (but not transaction expenses or total cost) of investing in the fund with those of other funds.All mutual fund shareholder reports will provide this information to help you make this comparison. Please note that you cannot use this information to estimate your actual ending account balance and expenses paid during the period.
| | Expenses and Value of a $1,000 Investment
assuming a hypothetical 5% annualized return for the six months ended December 31, 2008 |
| | | Class A | | Class B | | Class C | | Class F | | Class I | | Class T |
| |
| |
| |
| |
| |
| |
|
| Expenses paid | | | | | | | | | | | | |
| per $1,000† | | $ 6.29 | | $ 11.14 | | $ 10.13 | | $ 4.62 | | $ 4.47 | | $ 12.09 |
| Ending value | | | | | | | | | | | | |
| (after expenses) | | $1,018.90 | | $1,014.08 | | $1,015.08 | | $1,020.56 | | $1,020.71 | | $1,013.12 |
| † Expenses are equal to the fund’s annualized expense ratio of 1.24% for Class A shares, 2.20% for Class B shares, |
| 2.00% for Class C shares, .91% for Class F shares, .88% for Class I shares and 2.39% for Class T shares, |
| multiplied by the average account value over the period, multiplied by 184/366 (to reflect the one-half year period). |
8
STATEMENT OF INVESTMENTS
December 31, 2008 |
| Common Stocks—98.0% | | Shares | | Value ($) |
| |
| |
|
| Air Freight & Logistics—.9% | | | | |
| FedEx | | 38,727 | | 2,484,337 |
| Airlines—.4% | | | | |
| Delta Air Lines | | 102,116 a | | 1,170,249 |
| Apparel Retail—1.3% | | | | |
| Gap | | 281,885 | | 3,774,440 |
| Application Software—.3% | | | | |
| Autodesk | | 50,420 a | | 990,753 |
| Biotechnology—4.4% | | | | |
| BioMarin Pharmaceutical | | 233,628 a | | 4,158,578 |
| Genentech | | 33,410 a | | 2,770,023 |
| Gilead Sciences | | 108,396 a | | 5,543,371 |
| | | | | 12,471,972 |
| Communications Equipment—5.2% | | | | |
| Cisco Systems | | 458,388 a | | 7,471,724 |
| Juniper Networks | | 91,334 a | | 1,599,258 |
| QUALCOMM | | 156,622 | | 5,611,766 |
| | | | | 14,682,748 |
| Computer & Electronics Retail—1.9% | | | | |
| Best Buy | | 124,952 | | 3,512,401 |
| GameStop, Cl. A | | 83,845 a | | 1,816,083 |
| | | | | 5,328,484 |
| Computer Hardware—4.0% | | | | |
| Apple | | 56,914 a | | 4,857,610 |
| Hewlett-Packard | | 178,210 | | 6,467,241 |
| | | | | 11,324,851 |
| Computer Storage & Peripherals—1.5% | | | | |
| EMC | | 404,713 a | | 4,237,345 |
| Data Processing & Outsourced Services—1.5% | | | | |
| Visa, Cl. A | | 80,462 | | 4,220,232 |
| Department Stores—.3% | | | | |
| Nordstrom | | 61,092 | | 813,135 |
| Diversified Banks—.8% | | | | |
| Wells Fargo & Co. | | 76,933 | | 2,267,985 |
| Drug Retail—.9% | | | | |
| CVS Caremark | | 84,912 | | 2,440,371 |
The Fund 9
| STATEMENT OF INVESTMENTS (continued) |
| Common Stocks (continued) | | Shares | | Value ($) |
| |
| |
|
| Education Services—3.2% | | | | |
| Apollo Group, Cl. A | | 90,813 a | | 6,958,092 |
| DeVry | | 35,172 | | 2,019,225 |
| | | | | 8,977,317 |
| Electrical Components & Equipment—.3% | | | | |
| Energy Conversion Devices | | 34,806 a | | 877,459 |
| Environmental & Facilities Services—2.9% | | | | |
| Waste Management | | 248,380 | | 8,231,313 |
| Fertilizers & Agricultural Chemicals—1.3% | | | | |
| Monsanto | | 50,327 | | 3,540,504 |
| Food Retail—1.5% | | | | |
| Safeway | | 175,376 | | 4,168,688 |
| Health Care Equipment—1.4% | | | | |
| Covidien | | 110,047 | | 3,988,103 |
| Home Entertainment Software—1.3% | | | | |
| Activision Blizzard | | 148,977 a | | 1,287,161 |
| Electronic Arts | | 148,777 a | | 2,386,383 |
| | | | | 3,673,544 |
| Home Improvement Retail—1.5% | | | | |
| Home Depot | | 187,798 | | 4,323,110 |
| Homefurnishing Retail—.6% | | | | |
| Bed Bath & Beyond | | 66,020 a | | 1,678,228 |
| Hotels, Resorts & Cruise Lines—1.1% | | | | |
| Carnival | | 129,384 | | 3,146,619 |
| Household Products—2.6% | | | | |
| Colgate-Palmolive | | 41,857 | | 2,868,879 |
| Procter & Gamble | | 70,433 | | 4,354,168 |
| | | | | 7,223,047 |
| Hypermarkets & Super Centers—3.6% | | | | |
| Wal-Mart Stores | | 180,655 | | 10,127,519 |
| Industrial Gases—1.2% | | | | |
| Praxair | | 58,715 | | 3,485,322 |
| Industrial Machinery—.9% | | | | |
| Dover | | 81,151 | | 2,671,491 |
| Integrated Oil & Gas—5.4% | | | | |
| Chevron | | 75,654 | | 5,596,126 |
10
| Common Stocks (continued) | | Shares | | Value ($) |
| |
| |
|
| Integrated Oil & Gas (continued) | | | | |
| Exxon Mobil | | 107,648 | | 8,593,540 |
| Hess | | 20,045 | | 1,075,214 |
| | | | | 15,264,880 |
| Integrated Telecommunication Services—1.5% | | | | |
| AT & T | | 146,208 | | 4,166,928 |
| Internet Retail—.9% | | | | |
| Amazon.com | | 50,888 a | | 2,609,536 |
| Internet Software & Services—2.9% | | | | |
| Akamai Technologies | | 222,412 a | | 3,356,197 |
| Google, Cl. A | | 15,956 a | | 4,908,863 |
| | | | | 8,265,060 |
| Investment Banking & Brokerage—1.6% | | | | |
| Charles Schwab | | 287,641 | | 4,651,155 |
| Life & Health Insurance—1.5% | | | | |
| Unum Group | | 230,895 | | 4,294,647 |
| Life Sciences Tools & Services—2.3% | | | | |
| Life Technologies | | 144,056 a | | 3,357,945 |
| Pharmaceutical Product Development | | 106,379 | | 3,086,055 |
| | | | | 6,444,000 |
| Movies & Entertainment—1.0% | | | | |
| Walt Disney | | 123,633 | | 2,805,233 |
| Multi-Line Insurance—.7% | | | | |
| Assurant | | 62,257 | | 1,867,710 |
| Oil & Gas Equipment & Services—1.2% | | | | |
| Schlumberger | | 78,416 | | 3,319,349 |
| Oil & Gas Exploration & Production—1.9% | | | | |
| Apache | | 29,513 | | 2,199,604 |
| Ultra Petroleum | | 93,405 a | | 3,223,407 |
| | | | | 5,423,011 |
| Other Diversified Financial Services—.9% | | | | |
| JPMorgan Chase & Co. | | 83,973 | | 2,647,669 |
| Packaged Foods & Meats—3.0% | | | | |
| Dean Foods | | 145,041 a | | 2,606,387 |
| Kraft Foods, Cl. A | | 222,070 | | 5,962,580 |
| | | | | 8,568,967 |
The Fund 11
| STATEMENT OF INVESTMENTS (continued) |
| Common Stocks (continued) | | Shares | | Value ($) |
| |
| |
|
| Personal Products—2.2% | | | | |
| Avon Products | | 180,088 | | 4,327,515 |
| Estee Lauder, Cl. A | | 61,253 | | 1,896,393 |
| | | | | 6,223,908 |
| Pharmaceuticals—6.1% | | | | |
| Abbott Laboratories | | 79,211 | | 4,227,491 |
| Allergan | | 98,457 | | 3,969,786 |
| Johnson & Johnson | | 66,290 | | 3,966,131 |
| Pfizer | | 161,604 | | 2,862,007 |
| Shire, ADR | | 52,783 | | 2,363,623 |
| | | | | 17,389,038 |
| Railroads—1.6% | | | | |
| Union Pacific | | 97,495 | | 4,660,261 |
| Semiconductor Equipment—1.2% | | | | |
| KLA-Tencor | | 77,057 | | 1,679,072 |
| MEMC Electronic Materials | | 111,234 a | | 1,588,422 |
| | | | | 3,267,494 |
| Semiconductors—4.5% | | | | |
| Altera | | 262,932 | | 4,393,594 |
| Broadcom, Cl. A | | 152,195 a | | 2,582,749 |
| Intel | | 398,492 | | 5,841,893 |
| | | | | 12,818,236 |
| Soft Drinks—1.4% | | | | |
| PepsiCo | | 71,640 | | 3,923,723 |
| Specialty Stores—.5% | | | | |
| Tiffany & Co. | | 63,076 | | 1,490,486 |
| Systems Software—7.9% | | | | |
| Adobe Systems | | 163,835 a | | 3,488,047 |
| Microsoft | | 749,561 | | 14,571,466 |
| Oracle | | 244,850 a | | 4,341,191 |
| | | | | 22,400,704 |
| Tobacco—1.0% | | | | |
| Philip Morris International | | 62,710 | | 2,728,512 |
| Total Common Stocks | | | | |
| (cost $358,376,735) | | | | 277,549,673 |
12
| Exchange Traded Funds—.5% | | Shares | | Value ($) |
| |
| |
|
| Standard & Poor’s Depository | | | | |
| Receipts (cost $1,778,143) | | 14,388 | | 1,298,373 |
| |
| |
|
| |
| Other Investment—1.0% | | | | |
| |
| |
|
| Registered Investment Company; | | | | |
| Dreyfus Institutional Preferred | | | | |
| Plus Money Market Fund | | | | |
| (cost $2,852,000) | | 2,852,000 b | | 2,852,000 |
| |
| |
|
| |
| Total Investments (cost $363,006,878) | | 99.5% | | 281,700,046 |
| Cash and Receivables (Net) | | .5% | | 1,430,666 |
| Net Assets | | 100.0% | | 283,130,712 |
| ADR—American Depository Receipts |
| a | | Non-income producing security. |
| b | | Investment in affiliated money market mutual fund. |
| Portfolio Summary (Unaudited)† | | | | |
| |
| | | Value (%) | | | | Value (%) |
| |
| |
| |
|
| Information Technology | | 29.8 | | Financials | | 5.6 |
| Consumer Staples | | 16.0 | | Materials | | 2.5 |
| Health Care | | 14.2 | | Telecommunication Services | | 1.5 |
| Consumer Discretionary | | 12.3 | | Money Market Investments | | 1.0 |
| Energy | | 8.5 | | Exchange Traded Funds | | 0.5 |
| Industrials | | 7.6 | | | | 99.5 |
| |
| † Based on net assets. | | | | | | |
| See notes to financial statements. | | | | | | |
The Fund 13
STATEMENT OF ASSETS AND LIABILITIES
December 31, 2008 |
| | | Cost | | Value |
| |
| |
|
| Assets ($): | | | | |
| Investments in securities—See Statement of Investments: | | | | |
| Unaffiliated issuers | | 360,154,878 | | 278,848,046 |
| Affiliated issuers | | 2,852,000 | | 2,852,000 |
| Cash | | | | 682,830 |
| Receivable for investment securities sold | | | | 4,447,514 |
| Dividends and interest receivable | | | | 396,551 |
| Receivable for shares of Common Stock subscribed | | | | 70,757 |
| Prepaid expenses | | | | 102,107 |
| Other assets | | | | 56,655 |
| | | | | 287,456,460 |
| |
| |
|
| Liabilities ($): | | | | |
| Due to Founders Asset Management LLC and affiliates—Note 3(c) | | | | 297,464 |
| Payable for investment securities purchased | | | | 3,327,120 |
| Payable for shares of Common Stock redeemed | | | | 206,740 |
| Directors’ deferred compensation | | | | 56,655 |
| Accrued expenses | | | | 437,769 |
| | | | | 4,325,748 |
| |
| |
|
| Net Assets ($) | | | | 283,130,712 |
| |
| |
|
| Composition of Net Assets ($): | | | | |
| Paid-in capital | | | | 698,892,424 |
| Accumulated undistributed investment income—net | | | | 216,762 |
| Accumulated net realized gain (loss) on investments | | | | (334,636,560) |
| Accumulated net unrealized appreciation | | | | |
| (depreciation) on investments | | | | (81,341,914) |
| |
| |
|
| Net Assets ($) | | | | 283,130,712 |
| Net Asset Value Per Share | | | | | | | | | | |
| | | Class A | | Class B | | Class C | | Class F | | Class I | | Class T |
| |
| |
| |
| |
| |
| |
|
| Net Assets ($) | | 156,236,197 | | 511,862 | | 2,853,023 | | 122,119,273 | | 1,365,233 | | 45,124 |
| Shares Outstanding | | 43,355,017 | | 149,663 | | 844,558 | | 33,011,200 | | 371,578 | | 13,454 |
| |
| |
| |
| |
| |
| |
|
| Net Asset Value | | | | | | | | | | | | |
| Per Share ($) | | 3.60 | | 3.42 | | 3.38 | | 3.70 | | 3.67 | | 3.35 |
| |
| See notes to financial statements. | | | | | | | | | | |
14
| STATEMENT OF OPERATIONS | | |
| Year Ended December 31, 2008 | | |
| |
|
| |
| |
| |
| |
| Investment Income ($): | | |
| Income: | | |
| Dividends (net of $3,206 foreign taxes withheld at source): | | |
| Unaffiliated issuers | | 5,596,506 |
| Affiliated issuers | | 176,153 |
| Total Income | | 5,772,659 |
| Expenses: | | |
| Investment advisory fee—Note 3(a) | | 2,694,585 |
| Shareholder servicing costs—Note 3(c) | | 1,105,226 |
| Accounting fees—Note 3(c) | | 257,100 |
| Prospectus and shareholders’ reports | | 229,587 |
| Directors’ fees and expenses—Note 3(d) | | 138,144 |
| Distribution fees—Note 3(b) | | 157,107 |
| Professional fees | | 133,017 |
| Registration fees | | 87,890 |
| Custodian fees—Note 3(c) | | 12,206 |
| Loan commitment fees—Note 2 | | 11,411 |
| Miscellaneous | | 51,422 |
| Total Expenses | | 4,877,695 |
| Less—reimbursed/waived expenses—Note 3(a) | | (1,208) |
| Less—reduction in fees due to earnings credits—Note 1(c) | | (47,265) |
| Less—reduction in accounting fees—Note 3(c) | | (46,487) |
| Net Expenses | | 4,782,735 |
| Investment Income—Net | | 989,924 |
| |
|
| Realized and Unrealized Gain (Loss) on Investments—Note 4 ($): | | |
| Net realized gain (loss) on investments | | (69,677,039) |
| Net unrealized appreciation (depreciation) on investments | | (144,001,123) |
| Net Realized and Unrealized Gain (Loss) on Investments | | (213,678,162) |
| Net (Decrease) in Net Assets Resulting from Operations | | (212,688,238) |
| |
| See notes to financial statements. | | |
The Fund 15
STATEMENT OF CHANGES IN NET ASSETS
| | | Year Ended December 31, |
| | |
|
| | | 2008 | | 2007a |
| |
| |
|
| Operations ($): | | | | |
| Investment income—net | | 989,924 | | 1,374,292 |
| Net realized gain (loss) on investments | | (69,677,039) | | 25,187,025 |
| Net unrealized appreciation | | | | |
| (depreciation) on investments | | (144,001,123) | | 34,892,854 |
| Net Increase (Decrease) in Net Assets | | | | |
| Resulting from Operations | | (212,688,238) | | 61,454,171 |
| |
| |
|
| Dividends to Shareholders from ($): | | | | |
| Investment income—net: | | | | |
| Class A Shares | | (253,070) | | (878,882) |
| Class F Shares | | (694,566) | | (620,830) |
| Class I Shares | | (8,768) | | (17,203) |
| Total Dividends | | (956,404) | | (1,516,915) |
| |
| |
|
| Capital Stock Transactions ($): | | | | |
| Net proceeds from shares sold: | | | | |
| Class A Shares | | 13,581,804 | | 7,855,890 |
| Class B Shares | | 21,617 | | 762,769 |
| Class C Shares | | 690,704 | | 3,832,820 |
| Class F Shares | | 4,904,299 | | 33,401,508 |
| Class I Shares | | 516,988 | | 2,016,371 |
| Class T Shares | | 43,194 | | 18,827 |
| Net assets received in connection | | | | |
| with reorganization—Note 1 | | — | | 321,813,313 |
| Dividends reinvested: | | | | |
| Class A Shares | | 241,943 | | 842,144 |
| Class F Shares | | 615,939 | | 550,314 |
| Class I Shares | | 8,768 | | 17,203 |
| Cost of shares redeemed: | | | | |
| Class A Shares | | (56,638,264) | | (53,185,837) |
| Class B Shares | | (813,417) | | (1,998,605) |
| Class C Shares | | (3,653,876) | | (696,980) |
| Class F Shares | | (23,931,484) | | (40,033,176) |
| Class I Shares | | (1,546,766) | | (2,141,429) |
| Class T Shares | | (39,492) | | (33,690) |
| Increase (Decrease) in Net Assets | | | | |
| from Capital Stock Transactions | | (65,998,043) | | 273,021,442 |
| Total Increase (Decrease) in Net Assets | | (279,642,685) | | 332,958,698 |
| |
| |
|
| Net Assets ($): | | | | |
| Beginning of Period | | 562,773,397 | | 229,814,699 |
| End of Period | | 283,130,712 | | 562,773,397 |
| Undistributed investment income—net | | 216,762 | | 183,242 |
16
| | | Year Ended December 31, |
| | |
|
| | | 2008 | | 2007a |
| |
| |
|
| Capital Share Transactions: | | | | |
| Class Ab | | | | |
| Shares sold | | 2,708,902 | | 6,364,436 |
| Shares issued in connection with reorganization—Note 1 | | — | | 53,224,886 |
| Shares issued for dividends reinvested | | 55,288 | | 135,176 |
| Shares redeemed | | (11,085,799) | | (8,817,166) |
| Net Increase (Decrease) in Shares Outstanding | | (8,321,609) | | 50,907,332 |
| |
| |
|
| Class Bb | | | | |
| Shares sold | | 4,191 | | 44,281 |
| Shares issued in connection with reorganization—Note 1 | | — | | 214,494 |
| Shares redeemed | | (169,950) | | (133,263) |
| Net Increase (Decrease) in Shares Outstanding | | (165,759) | | 125,512 |
| |
| |
|
| Class C | | | | |
| Shares sold | | 152,046 | | 692,752 |
| Shares issued in connection with reorganization—Note 1 | | — | | 225,549 |
| Shares redeemed | | (796,147) | | (124,071) |
| Net Increase (Decrease) in Shares Outstanding | | (644,101) | | 794,230 |
| |
| |
|
| Class F | | | | |
| Shares sold | | 977,734 | | 5,386,838 |
| Shares issued for dividends reinvested | | 163,708 | | 85,998 |
| Shares redeemed | | (4,684,301) | | (6,521,388) |
| Net Increase (Decrease) in Shares Outstanding | | (3,542,859) | | (1,048,552) |
| |
| |
|
| Class I | | | | |
| Shares sold | | 99,593 | | 364,633 |
| Shares issued in connection with reorganization—Note 1 | | — | | 505,107 |
| Shares issued for dividends reinvested | | 2,436 | | 2,709 |
| Shares redeemed | | (277,684) | | (341,865) |
| Net Increase (Decrease) in Shares Outstanding | | (175,655) | | 530,584 |
| |
| |
|
| Class T | | | | |
| Shares sold | | 8,672 | | 4,200 |
| Shares issued in connection with reorganization—Note 1 | | — | | 11,934 |
| Shares redeemed | | (7,826) | | (5,765) |
| Net Increase (Decrease) in Shares Outstanding | | 846 | | 10,369 |
| a | | Effective June 1, 2007, Class R shares were redesignated as Class I shares. |
| b | | During the period ended December 31, 2008, 65,665 Class B shares representing $337,212 were automatically |
| | | converted to 62,632 Class A shares and during the period ended December 31, 2007, 87,792 Class B shares |
| | | representing $504,513 were automatically converted to 84,111 Class A shares. |
| See notes to financial statements. |
The Fund 17
FINANCIAL HIGHLIGHTS
The following tables describe the performance for each share class for the fiscal periods indicated.All information (except portfolio turnover rate) reflects financial results for a single fund share.Total return shows how much your investment in the fund would have increased (or decreased) during each period, assuming you had reinvested all dividends and distributions.These figures have been derived from the fund’s financial statements.
| | | | | Year Ended December 31, | | |
| | |
| |
| |
|
| Class A Shares | | 2008 | | 2007 | | 2006 | | 2005 | | 2004 |
| |
| |
| |
| |
| |
|
| Per Share Data ($): | | | | | | | | | | |
| Net asset value, beginning of period | | 6.15 | | 5.72 | | 5.07 | | 4.86 | | 4.49 |
| Investment Operations: | | | | | | | | | | |
| Investment income (loss)—net | | .01a | | .01a | | .00a,b | | (.00)a,b | | .02 |
| Net realized and unrealized | | | | | | | | | | |
| gain (loss) on investments | | (2.55) | | .44 | | .66 | | .22 | | .36 |
| Total from Investment Operations | | (2.54) | | .45 | | .66 | | .22 | | .38 |
| Distributions: | | | | | | | | | | |
| Dividends from investment income—net | | (.01) | | (.02) | | (.01) | | (.01) | | (.01) |
| Net asset value, end of period | | 3.60 | | 6.15 | | 5.72 | | 5.07 | | 4.86 |
| |
| |
| |
| |
| |
|
| Total Return (%)c | | (41.39) | | 7.81 | | 13.02 | | 4.46 | | 8.54 |
| |
| |
| |
| |
| |
|
| Ratios/Supplemental Data (%): | | | | | | | | | | |
| Ratio of total expenses | | | | | | | | | | |
| to average net assets | | 1.25 | | 1.19 | | 1.34 | | 1.35 | | 1.26 |
| Ratio of net expenses | | | | | | | | | | |
| to average net assets | | 1.23 | | 1.19d | | 1.34d | | 1.33 | | 1.25 |
| Ratio of net investment income | | | | | | | | | | |
| (loss) to average net assets | | .12 | | .14 | | .00e | | (.09) | | .38 |
| Portfolio Turnover Rate | | 112 | | 68 | | 110 | | 126 | | 115 |
| |
| |
| |
| |
| |
|
| Net Assets, end of period ($ x 1,000) | | 156,236 | | 317,753 | | 4,399 | | 1,266 | | 1,180 |
| a | | Based on average shares outstanding at each month end. |
| b | | Amount represents less than $.01 per share. |
| c | | Exclusive of sales charge. |
| d | | Expense waivers and/or reimbursements amounted to less than .01%. |
| e | | Amount represents less than .01%. |
| See notes to financial statements. |
18
| | | | | Year Ended December 31, | | |
| | |
| |
| |
|
| Class B Shares | | 2008 | | 2007 | | 2006 | | 2005 | | 2004 |
| |
| |
| |
| |
| |
|
| Per Share Data ($): | | | | | | | | | | |
| Net asset value, beginning of period | | 5.88 | | 5.51 | | 4.91 | | 4.74 | | 4.40 |
| Investment Operations: | | | | | | | | | | |
| Investment (loss)—net | | (.04)a | | (.04)a | | (.05)a | | (.04)a | | (.00)b |
| Net realized and unrealized | | | | | | | | | | |
| gain (loss) on investments | | (2.42) | | .41 | | .65 | | .21 | | .34 |
| Total from Investment Operations | | (2.46) | | .37 | | .60 | | .17 | | .34 |
| Net asset value, end of period | | 3.42 | | 5.88 | | 5.51 | | 4.91 | | 4.74 |
| |
| |
| |
| |
| |
|
| Total Return (%)c | | (41.84) | | 6.72 | | 12.22 | | 3.59 | | 7.73 |
| |
| |
| |
| |
| |
|
| Ratios/Supplemental Data (%): | | | | | | | | | | |
| Ratio of total expenses | | | | | | | | | | |
| to average net assets | | 2.12 | | 2.24 | | 2.21 | | 2.19 | | 2.01 |
| Ratio of net expenses | | | | | | | | | | |
| to average net assets | | 2.10 | | 2.24d | | 2.21d | | 2.18 | | 2.00 |
| Ratio of net investment (loss) | | | | | | | | | | |
| to average net assets | | (.78) | | (.76) | | (.93) | | (.97) | | (.34) |
| Portfolio Turnover Rate | | 112 | | 68 | | 110 | | 126 | | 115 |
| |
| |
| |
| |
| |
|
| Net Assets, end of period ($ x 1,000) | | 512 | | 1,855 | | 1,046 | | 1,453 | | 2,110 |
| a | | Based on average shares outstanding at each month end. |
| b | | Amount represents less than $.01 per share. |
| c | | Exclusive of sales charge. |
| d | | Expense waivers and/or reimbursements amounted to less than .01%. |
| See notes to financial statements. |
The Fund 19
| | FINANCIAL HIGHLIGHTS (continued) |
| | | | | Year Ended December 31, | | |
| | |
| |
| |
|
| Class C Shares | | 2008 | | 2007 | | 2006 | | 2005 | | 2004 |
| |
| |
| |
| |
| |
|
| Per Share Data ($): | | | | | | | | | | |
| Net asset value, beginning of period | | 5.80 | | 5.41 | | 4.82 | | 4.66 | | 4.32 |
| Investment Operations: | | | | | | | | | | |
| Investment income (loss)—net | | (.03)a | | (.03)a | | (.03)a | | (.03)a | | .04 |
| Net realized and unrealized | | | | | | | | | | |
| gain (loss) on investments | | (2.39) | | .42 | | .62 | | .20 | | .30 |
| Total from Investment Operations | | (2.42) | | .39 | | .59 | | .17 | | .34 |
| Distributions: | | | | | | | | | | |
| Dividends from investment income—net | | — | | — | | — | | (.01) | | — |
| Net asset value, end of period | | 3.38 | | 5.80 | | 5.41 | | 4.82 | | 4.66 |
| |
| |
| |
| |
| |
|
| Total Return (%)b | | (41.72) | | 7.21 | | 12.24 | | 3.68 | | 7.87 |
| |
| |
| |
| |
| |
|
| Ratios/Supplemental Data (%): | | | | | | | | | | |
| Ratio of total expenses | | | | | | | | | | |
| to average net assets | | 1.99 | | 1.97 | | 2.01 | | 1.98 | | 1.99 |
| Ratio of net expenses | | | | | | | | | | |
| to average net assets | | 1.97 | | 1.97c | | 2.01c | | 1.96 | | 1.99 |
| Ratio of net investment (loss) | | | | | | | | | | |
| to average net assets | | (.64) | | (.45) | | (.69) | | (.72) | | (.24) |
| Portfolio Turnover Rate | | 112 | | 68 | | 110 | | 126 | | 115 |
| |
| |
| |
| |
| |
|
| Net Assets, end of period ($ x 1,000) | | 2,853 | | 8,628 | | 3,759 | | 2,012 | | 571 |
| a | | Based on average shares outstanding at each month end. |
| b | | Exclusive of sales charge. |
| c | | Expense waivers and/or reimbursements amounted to less than .01%. |
| See notes to financial statements. |
20
| | | | | Year Ended December 31, | | |
| | |
| |
| |
|
| Class F Shares | | 2008 | | 2007 | | 2006 | | 2005 | | 2004 |
| |
| |
| |
| |
| |
|
| Per Share Data ($): | | | | | | | | | | |
| Net asset value, beginning of period | | 6.32 | | 5.86 | | 5.18 | | 4.96 | | 4.57 |
| Investment Operations: | | | | | | | | | | |
| Investment income—net | | .02a | | .03a | | .01a | | .00a,b | | .02 |
| Net realized and unrealized | | | | | | | | | | |
| gain (loss) on investments | | (2.62) | | .45 | | .68 | | .23 | | .39 |
| Total from Investment Operations | | (2.60) | | .48 | | .69 | | .23 | | .41 |
| Distributions: | | | | | | | | | | |
| Dividends from investment income—net | | (.02) | | (.02) | | (.01) | | (.01) | | (.02) |
| Net asset value, end of period | | 3.70 | | 6.32 | | 5.86 | | 5.18 | | 4.96 |
| |
| |
| |
| |
| |
|
| Total Return (%) | | (41.13) | | 8.14 | | 13.25 | | 4.64 | | 8.97 |
| |
| |
| |
| |
| |
|
| Ratios/Supplemental Data (%): | | | | | | | | | | |
| Ratio of total expenses | | | | | | | | | | |
| to average net assets | | .96 | | 1.04 | | 1.10 | | 1.13 | | 1.06 |
| Ratio of net expenses | | | | | | | | | | |
| to average net assets | | .94 | | 1.04c | | 1.10c | | 1.12 | | 1.06 |
| Ratio of net investment income | | | | | | | | | | |
| to average net assets | | .41 | | .54 | | .20 | | .11 | | .56 |
| Portfolio Turnover Rate | | 112 | | 68 | | 110 | | 126 | | 115 |
| |
| |
| |
| |
| |
|
| Net Assets, end of period ($ x 1,000) | | 122,119 | | 231,030 | | 220,502 | | 215,556 | | 233,410 |
| a | | Based on average shares outstanding at each month end. |
| b | | Amount represents less than $.01 per share. |
| c | | Expense waivers and/or reimbursements amounted to less than .01%. |
| See notes to financial statements. |
The Fund 21
| | FINANCIAL HIGHLIGHTS (continued) |
| | | | | Year Ended December 31, | | |
| | |
| |
| |
|
| Class I Shares | | 2008 | | 2007a | | 2006 | | 2005 | | 2004 |
| |
| |
| |
| |
| |
|
| Per Share Data ($): | | | | | | | | | | |
| Net asset value, beginning of period | | 6.28 | | 5.82 | | 5.13 | | 4.91 | | 4.53 |
| Investment Operations: | | | | | | | | | | |
| Investment income—net | | .03b | | .03b | | .01b | | .01b | | .03 |
| Net realized and unrealized | | | | | | | | | | |
| gain (loss) on investments | | (2.62) | | .45 | | .69 | | .22 | | .37 |
| Total from Investment Operations | | (2.59) | | .48 | | .70 | | .23 | | .40 |
| Distributions: | | | | | | | | | | |
| Dividends from investment income—net | | (.02) | | (.02) | | (.01) | | (.01) | | (.02) |
| Net asset value, end of period | | 3.67 | | 6.28 | | 5.82 | | 5.13 | | 4.91 |
| |
| |
| |
| |
| |
|
| Total Return (%) | | (41.08) | | 8.09 | | 13.55 | | 4.78 | | 8.88 |
| |
| |
| |
| |
| |
|
| Ratios/Supplemental Data (%): | | | | | | | | | | |
| Ratio of total expenses | | | | | | | | | | |
| to average net assets | | .89 | | 1.09 | | 1.04 | | 1.10 | | 1.00 |
| Ratio of net expenses | | | | | | | | | | |
| to average net assets | | .81 | | .96 | | 1.04c | | 1.09 | | 1.00 |
| Ratio of net investment income | | | | | | | | | | |
| to average net assets | | .54 | | .48 | | .21 | | .15 | | .54 |
| Portfolio Turnover Rate | | 112 | | 68 | | 110 | | 126 | | 115 |
| |
| |
| |
| |
| |
|
| Net Assets, end of period ($ x 1,000) | | 1,365 | | 3,434 | | 97 | | 270 | | 247 |
| a | | Effective June 1, 2007, Class R shares were redesignated as Class I shares. |
| b | | Based on average shares outstanding at each month end. |
| c | | Expense waivers and/or reimbursements amounted to less than .01%. |
| See notes to financial statements. |
22
| | | | | Year Ended December 31, | | |
| | |
| |
| |
|
| Class T Shares | | 2008 | | 2007 | | 2006 | | 2005 | | 2004 |
| |
| |
| |
| |
| |
|
| Per Share Data ($): | | | | | | | | | | |
| Net asset value, beginning of period | | 5.79 | | 5.45 | | 4.85 | | 4.72 | | 4.38 |
| Investment Operations: | | | | | | | | | | |
| Investment (loss)—net | | (.06)a | | (.06)a | | (.03)a | | (.05)a | | (.01) |
| Net realized and unrealized | | | | | | | | | | |
| gain (loss) on investments | | (2.38) | | .40 | | .63 | | .18 | | .25 |
| Total from Investment Operations | | (2.44) | | .34 | | .60 | | .13 | | .24 |
| Payment by Service Provider | | — | | — | | — | | — | | .10b |
| Net asset value, end of period | | 3.35 | | 5.79 | | 5.45 | | 4.85 | | 4.72 |
| |
| |
| |
| |
| |
|
| Total Return (%)c | | (42.14) | | 6.24 | | 12.37 | | 2.75 | | 7.76b |
| |
| |
| |
| |
| |
|
| Ratios/Supplemental Data (%): | | | | | | | | | | |
| Ratio of total expenses | | | | | | | | | | |
| to average net assets | | 2.62 | | 2.64 | | 2.46 | | 2.59 | | 1.90 |
| Ratio of net expenses | | | | | | | | | | |
| to average net assets | | 2.60 | | 2.47 | | 1.82 | | 2.15 | | 1.90 |
| Ratio of net investment (loss) | | | | | | | | | | |
| to average net assets | | (1.21) | | (1.06) | | (.48) | | (.98) | | (.29) |
| Portfolio Turnover Rate | | 112 | | 68 | | 110 | | 126 | | 115 |
| |
| |
| |
| |
| |
|
| Net Assets, end of period ($ x 1,000) | | 45 | | 73 | | 12 | | 8 | | 32 |
| a | | Based on average shares outstanding at each month end. |
| b | | A service provider reimbursed the fund’s Class T shares for losses resulting from certain shareholder adjustments which |
| | | otherwise would have reduced total return by 2.28%. |
| c | | Exclusive of sales charge. |
| See notes to financial statements. |
The Fund 23
NOTES TO FINANCIAL STATEMENTS
NOTE 1—Significant Accounting Policies:
Dreyfus Equity Growth Fund (the “fund”) is a separate diversified series of Dreyfus Funds, Inc. (the “Company”), which is registered under the Investment Company Act of 1940, as amended (the “Act”), as an open-end management investment company and operates as a series company currently offering five series, including the fund.The fund’s investment objective is to seek long-term growth of capital and income. Founders Asset Management LLC (“Founders”) serves as the fund’s investment adviser. Founders is an indirect, wholly-owned subsidiary of The Bank of NewYork Mellon Corporation (“BNY Mellon”).
At a meeting of the Company’s Board of Directors held on September 22, 2008, the Board approved, effective December 1, 2008, a proposal to change the names of the Company and the fund from “Dreyfus Founders Funds, Inc.” and “Dreyfus Founders Equity Growth Fund” to “Dreyfus Funds, Inc.” and “Dreyfus Equity Growth Fund,” respectively.
Effective July 1, 2008, BNY Mellon reorganized and consolidated a number of its banking and trust company subsidiaries.As a result of the reorganization, any services previously provided to the fund by Mellon Bank, N.A. or Mellon Trust of New England, N.A. are now provided by The Bank of NewYork Mellon (formerly,The Bank of NewYork).
As of the close of business on August 10, 2007, pursuant to an Agreement and Plan of Reorganization previously approved by Dreyfus Founders Growth Fund’s shareholders, all of the assets, subject to the liabilities, of Dreyfus Founders Growth Fund (the “Growth Fund”), another series of the Company, were transferred to the fund in exchange for shares of common stock of the fund of equal value. Shareholders of Class A, Class B, Class C, Class I and Class T shares of Growth Fund received Class A, Class B, Class C, Class I and Class T shares of the fund, respectively, in each case in an equal amount to the aggregate net asset value of their investment in Growth Fund at the time of the exchange. Shareholders of Class F of Growth Fund received Class A shares of the fund in an equal amount to the aggregate net asset value of their investment in Growth Fund at the time of exchange.The net asset value of the fund’s shares on the close of business August 10, 2007, after the reor-
24
ganization was $5.94 for Class A, $5.69 for Class B, $5.60 for Class C, $6.06 for Class I and $5.61 for Class T shares, and a total of 53,224,886 Class A shares, 214,494 Class B shares, 225,549 Class C shares, 505,107 Class I shares and 11,934 Class T shares, representing net assets of $321,813,313 (including $31,012,525 net unrealized appreciation on investments) were issued to Growth Fund shareholders in the exchange. The exchange was a tax-free event to Growth Fund shareholders.
MBSC Securities Corporation (the “Distributor”), the direct owner of Founders and a wholly-owned subsidiary of The Dreyfus Corporation (“Dreyfus”), an affiliate of Founders, is the distributor of the fund’s shares. The fund is authorized to issue up to 2.25 billion shares of Common Stock, par value $ .01 per share, in the following classes of shares: Class A, Class B, Class C, Class F, Class I and Class T shares. Class A and Class T shares are subject to a sales charge imposed at the time of purchase, although the shares may be purchased at net asset value (“NAV”) without a sales charge by certain categories of investors. Class B shares are subject to a contingent deferred sales charge (“CDSC”) imposed on Class B share redemptions made within six years of purchase and automatically convert to Class A shares after six years. The fund does not offer Class B shares, except in connection with dividend reinvestment and permitted exchanges of Class B shares. Class C shares are subject to a CDSC imposed on Class C shares redeemed within one year of purchase. Class F and Class I shares are sold at NAV per share. Class F shares are sold only to Class F grandfathered investors, and Class I shares are sold only to eligible institutional investors. Effective December 3, 2008, investments for new accounts were no longer permitted in Class T of the fund, except that participants in certain group retirement plans were able to open a new account in Class T of the fund, provided that the fund was established as an investment option under the plans before December 3, 2008. Other differences between the classes include the services offered to and the expenses borne by each class. Income and realized and unrealized gains or losses on investments are allocated to each class of shares based on its relative net assets.
The Fund 25
| NOTES TO FINANCIAL STATEMENTS (continued) |
Each class of the fund bears expenses incurred specifically on its behalf and, in addition, each class bears a portion of general expenses based on the relative net assets or the number of shareholder accounts of the class.The type of expense determines the allocation method.
The fund’s financial statements are prepared in accordance with U.S. generally accepted accounting principles, which require the use of management estimates and assumptions. Actual results could differ from those estimates.
The fund enters into contracts that contain a variety of indemnifications. The fund’s maximum exposure under these arrangements is unknown.The fund does not anticipate recognizing any loss related to these arrangements.
(a) Portfolio valuation: A domestic equity security listed or traded on a securities exchange or in the over-the-counter market is valued at its last sales price on the exchange or market where it is principally traded or, in the case of a security traded on NASDAQ, at its official closing price. Lacking any sales on that day, the security is valued at the current closing bid price, or by quotes from dealers making a market in the security if the closing bid price is not available.
A foreign equity security traded on a foreign exchange is valued at the last quoted official closing price available before the time when the fund’s assets are valued, or at the last quoted sales price if the exchange does not provide an official closing price or if the foreign market has not yet closed. Lacking any sales that day, the security is valued at the current closing bid price. NewYork closing exchange rates are used to convert foreign currencies to U.S. dollars.
A debt security with a remaining maturity greater than 60 days at the time of purchase is valued in accordance with the evaluated bid price supplied by a pricing service approved by the Company’s Board of Directors or, if such price is not available, at the mean between the highest bid and lowest asked quotations obtained from at least two securities dealers.A debt security with a remaining maturity of 60 days
26
or less at the time of purchase is valued at amortized cost, which approximates market value, unless it is determined that amortized cost would not represent market value, in which case the securities would be marked to market.
Registered investment companies that are not traded on an exchange are valued at their NAV.
If market quotations or official closing prices are not readily available or are determined not to reflect accurately fair value, securities will be valued at their fair value as determined in good faith by the Board of Directors or pursuant to procedures approved by the Board of Directors. These situations may include instances where an event occurs after the close of the market on which a security is traded but before the fund calculates its NAV, and it is determined that the event has materially affected the value of the security. Fair value of foreign equity securities may be determined with the assistance of a pricing service using calculations based on indexes of domestic securities and other appropriate indicators, such as prices of relevant ADRs and futures contracts.
The fund adopted Statement of Financial Accounting Standards No. 157 “FairValue Measurements” (“FAS 157”). FAS 157 establishes an authoritative definition of fair value, sets out a framework for measuring fair value, and requires additional disclosures about fair value measurements.
Various inputs are used in determining the value of the fund's investments relating to FAS 157.These inputs are summarized in the three broad levels listed below.
Level 1—quoted prices in active markets for identical securities.
Level 2—other significant observable inputs (including quoted
prices for similar securities, interest rates, prepayment speeds,
credit risk, etc.).
Level 3—significant unobservable inputs (including the fund's own
assumptions in determining the fair value of investments). |
The Fund 27
| NOTES TO FINANCIAL STATEMENTS (continued) |
The inputs or methodology used for valuing securities are not necessarily an indication of the risk associated with investing in those securities.
The following is a summary of the inputs used as of December 31, 2008 in valuing the fund's investments carried at fair value:
| | | Investments in | | Other Financial |
| Valuation Inputs | | Securities ($) | | Instruments ($)† |
| |
| |
|
| Level 1—Quoted Prices | | 281,700,046 | | 0 |
| Level 2—Other Significant | | | | |
| Observable Inputs | | 0 | | 0 |
| Level 3—Significant | | | | |
| Unobservable Inputs | | 0 | | 0 |
| Total | | 281,700,046 | | 0 |
| † | | Other financial instruments include derivative instruments, such as futures, forward currency |
| | | exchange contracts and swap contracts, which are valued at the unrealized appreciation |
| | | (depreciation) on the instrument and written options contracts which are shown at value. |
(b) Foreign Securities and Currency Transactions: The fund may invest at least a portion of its assets in foreign securities. Foreign securities carry more risk than U.S. securities, such as political and currency risks. In the event the fund executes a foreign security transaction, the fund may enter into a foreign currency contract to settle the foreign security transaction.The fund could be exposed to risk if counterpar-ties are unable to meet the terms of the contracts or if the value of the currency changes unfavorably to the U.S. dollar.The resultant foreign currency gain or loss from the contract is recorded as foreign currency gain or loss and is presented as such in the Statement of Operations.
The accounting records of the fund are maintained in U.S. dollars.The market values of foreign securities, currency holdings and other assets and liabilities are translated into U.S. dollars based on the current exchange rates each business day. Purchases and sales of investment securities and income and expense items denominated in foreign currencies are translated into U.S. dollar amounts on the respective dates of such transactions.
The fund does not isolate that portion of the results of operations resulting from changes in foreign exchange rates on investments from
28
the fluctuations arising from changes in market prices of securities held. Such fluctuations are included with the net unrealized appreciation (depreciation) on investments and foreign currency translations in the Statement of Operations.
Reported net realized foreign exchange gains or losses arise from sales of foreign currencies, currency gains or losses realized between the trade and settlement dates on securities transactions, and the difference between the amounts of dividends, interest, and foreign withholding taxes recorded on the fund’s books and the U.S. dollar equivalent of the amounts actually received or paid. Net unrealized appreciation or depreciation on investments and foreign currency translation arises from changes in the values of assets and liabilities, including investments in securities held at the date of the financial statements, resulting from changes in the exchange rates and changes in market prices of securities held.
(c) Securities transactions and investment income: Securities transactions are recorded on a trade date basis. Realized gains and losses from securities transactions are recorded on the identified cost basis. Dividend income is recognized on the ex-dividend date and interest income, including, where applicable, accretion of discount and amortization of premium on investments, is recognized on the accrual basis.
The fund has arrangements with the custodian and cash management bank whereby the fund may receive earnings credits when positive cash balances are maintained, which are used to offset custody and cash management fees. For financial reporting purposes, the fund includes net earnings credits as an expense offset in the Statement of Operations.
(d) Affiliated issuers: Investments in other investment companies advised by Founders or its affiliates are defined as “affiliated” in the Act.
(e) Dividends to shareholders: Dividends are recorded on the ex-dividend date. Dividends from investment income-net and dividends from net realized capital gains, if any, are normally declared and paid annu-
The Fund 29
| NOTES TO FINANCIAL STATEMENTS (continued) |
ally, but the fund may make distributions on a more frequent basis to comply with the distribution requirements of the Internal Revenue Code of 1986, as amended (the “Code”).To the extent that net realized capital gains can be offset by capital loss carryovers, it is the policy of the fund not to distribute such gains. Income and capital gain distributions are determined in accordance with income tax regulations, which may differ from U.S. generally accepted accounting principles.
(f) Federal income taxes: No provision has been made for federal income taxes since it is the policy of the fund to continue to comply with the requirements of Subchapter M of the Code that are applicable to regulated investment companies and to make distributions of income and capital gains sufficient to relieve it from all income taxes.The fund is treated as a separate tax entity for federal income tax purposes.
As of and during the period ended December 31, 2008, the fund did not have any liabilities for any unrecognized tax positions. The fund recognizes interest and penalties, if any, related to unrecognized tax positions as income tax expense in the Statement of Operations. During the period, the fund did not incur any interest or penalties.
Each of the tax years in the four-year period ended December 31, 2008 remains subject to examination by the Internal Revenue Service and state taxing authorities.
At December 31, 2008, the components of accumulated earnings on a tax basis were as follows: undistributed ordinary income $248,913, accumulated capital losses $300,101,158 and unrealized depreciation $83,872,264. In addition, the fund had $31,969,970 of capital losses realized after October 31, 2008, which were deferred for tax purposes to the first day of the following fiscal year.
The accumulated capital loss carryover is available for federal income tax purposes to be applied against future net securities profits, if any, realized subsequent to December 31, 2008. If not applied, $212,670,448 of the carryover expires in fiscal 2009, $50,083,636 expires in fiscal 2010 and $37,347,074 expires in fiscal 2016.
30
The tax character of distributions paid to shareholders during the fiscal periods ended December 31, 2008 and December 31, 2007 were as follows: ordinary income $956,404 and $1,516,915, respectively.
During the period ended December 31, 2008, as a result of permanent book to tax differences, primarily from capital loss carryover expiration, the fund increased accumulated net realized gain (loss) on investments by $427,430,092 and decreased paid-in capital by the same amount. Net assets and net asset value per share were not affected by this reclassification.
NOTE 2—Bank Line of Credit:
The Company has a line of credit arrangement (“LOC”) with State Street Bank and Trust Company, to be used for temporary or emergency purposes, primarily for financing redemption payments. The borrowings by each series of the Company are limited to the lesser of (a) $25 million, or (b) the lesser of 25% of the series’ total net assets or the maximum amount which the series is permitted to borrow pursuant to the prospectus, any law or any other agreement. Combined borrowings are subject to the $25 million cap on the total LOC. Each series agrees to pay annual fees and interest on the unpaid balance based on prevailing market rates as defined in the LOC. During the period ended December 31, 2008, the fund did not borrow under the LOC.
NOTE 3—Investment Advisory Fee and Other Transactions With Affiliates:
(a) In accordance with an investment advisory agreement between the Company and Founders, the fund compensates Founders for its services as investment adviser by the payment of fees computed daily and paid monthly at an annual rate equal to a percentage of the average daily value of the fund’s net assets. The fee is .65% of the first $250 million of net assets, .60% of the next $250 million of net assets, .55% of the next $250 million of net assets and .50% of net assets in excess of $750 million.
The Fund 31
| NOTES TO FINANCIAL STATEMENTS (continued) |
Founders agreed to limit the total annual fund operating expenses of the fund’s Class I Shares to .97% of the Class I average daily net assets from January 1, 2008 through August 31, 2008, at which time this commitment terminated. The reduction amounted to $1,208 during the period ended December 31, 2008.
During the period ended December 31, 2008, the Distributor retained $1,494 from commissions earned on sales of the fund’s Class A shares, and $1,561 and $1,100 from CDSCs on redemptions of the fund’s Class B and Class C shares, respectively.
(b) Under a Distribution Plan (the “Class B, C and T Plan”) adopted pursuant to Rule 12b-1 under the Act, Class B, Class C and Class T shares pay the Distributor for distributing their shares at an annual rate of .75% of the value of the average daily net assets of Class B and Class C shares and .25% of the value of the average daily net assets of Class T shares. During the period ended December 31, 2008, Class B, Class C and Class T shares were charged $8,328, $44,175 and $136, respectively, pursuant to the Class B, C and T Plan.
The fund also has adopted a Distribution Plan pursuant to Rule 12b-1 under the Act applicable to its Class F shares (the “Class F Plan”). Under the Class F Plan, the fund is authorized to reimburse the Distributor for expenses paid for distributing or servicing its Class F shares at an annual rate of up to .25% of the value of the average daily net assets of the fund’s Class F shares. During the period ended December 31, 2008, Class F shares were charged $104,468 pursuant to the Class F Plan.
(c) Under the Shareholder Services Plan, Class A, Class B, Class C and Class T shares pay the Distributor at an annual rate of .25% of the value of their average daily net assets for the provision of certain services.The services provided may include personal services relating to shareholder accounts, such as answering shareholder inquiries regarding the fund and providing reports and other information, and services related to the maintenance of shareholder accounts.The Distributor may make payments to Service Agents (a securities dealer, financial institution or
32
other industry professional) in respect of these services.The Distributor determines the amounts to be paid to Service Agents. During the period ended December 31, 2008, Class A, Class B, Class C and Class T shares were charged $596,013, $2,776, $14,725 and $136, respectively, pursuant to the Shareholder Services Plan.
The Company has a shareholder services agreement with the Distributor, whereby the fund has agreed to compensate the Distributor for providing certain shareholder servicing functions to holders of Class F shares. The fund paid the Distributor a monthly fee equal, on an annual basis, to $24.00 per Class F shareholder account considered to be an open account at any time during a given month. During the period ended December 31, 2008, Class F shares were charged $43,704 pursuant to this shareholder services agreement.
Dreyfus Transfer, Inc. (“DTI”), a wholly-owned subsidiary of Dreyfus, is the transfer and dividend disbursing agent for all of the fund’s share classes. The Distributor pays the transfer and dividend agent fees, other than out-of-pocket charges, for Class F only. During the period ended December 31, 2008, Class F shares were charged $9,280 for out-of-pocket transfer agent charges.
The fees charged by DTI with respect to the fund’s Class A, Class B, Class C, Class I and Class T shares are paid by the fund.These transfer agency fees, including both the per account fees paid to DTI and out-of-pocket charges, during the period ended December 31, 2008 were $187,511.
The fund compensates The Bank of New York Mellon, a subsidiary of BNY Mellon and an affiliate of Founders, under two cash management agreements for performing cash management services related to fund subscriptions and redemptions. During the period ended December 31, 2008, the fund was charged $43,891 for these services, which were partially offset by earnings credits pursuant to the cash management agreements.
The Fund 33
| NOTES TO FINANCIAL STATEMENTS (continued) |
The fund compensates The Bank of New York Mellon under a custody agreement for providing custodial services for the fund. During the period ended December 31, 2008, the fund was charged $12,206 for these services. These fees were partially offset by earnings credits pursuant to the custody agreement.
The fund has agreed to compensate Dreyfus for providing accounting services, administration, compliance monitoring, regulatory and shareholder reporting, as well as related facilities, equipment and clerical help.The fee is computed at the annual rate of .06% of the average daily net assets of the fund on the first $500 million, .04% of the average daily net assets of the fund on the next $500 million and .02% of the average daily net assets of the fund in excess of $1 billion, plus reasonable out-of-pocket expenses. Dreyfus has contractually agreed in writing to waive any fees received for these services to the extent they exceed its costs in providing the services and a reasonable allocation of the costs incurred by Founders and its affiliates related to the support and oversight of these services. During the period ended December 31, 2008, Dreyfus waived $46,487.
The components of “Due to Founders Asset Management LLC and affiliates” in the Statement of Assets and Liabilities consist of: investment advisory fees $151,645, Rule 12b-1 distribution plan fees $9,610, shareholder services plan fees $87,232, custodian fees $2,361, compliance support fees $1,833, transfer agency per account fees $31,230 and accounting fees $13,553.
(d) Annual retainer fees and attendance fees for the Company’s Board of Directors are allocated to each series of the Company based on net assets. During the period ended December 31, 2008, the fund paid $173,226 in directors’ fees.The Company’s Board of Directors has adopted a deferred compensation plan for Company directors that enables directors to elect to defer receipt of all or a portion of the annual compensation that they are entitled to receive from the Company. Under the plan, the compensation deferred is invested in shares of one
34
or more of the Company’s series.The amount paid to the director under the plan will be determined based upon the performance of the selected series.The current value of these amounts, if any, is included in Other Assets and Directors’ Deferred Compensation in the Statement of Assets and Liabilities. Increases in the market value of the deferred compensation accounts are added to the Directors fees and expenses paid by the fund in the Directors fees and expenses in the Statement of Operations, and decreases in the market value of the accounts are subtracted from such fees. During the period ended December 31, 2008, depreciation in the value of the accounts totaled $35,082. The depreciation also is included in the net unrealized appreciation (depreciation) on investments in the Statement of Operations. Deferral of directors’ fees under the plan does not affect the net assets of the fund.
Certain officers of the Company are also officers and/or directors of Founders or its affiliates, which pay their compensation. However, the fund pays a portion of the cost of the services performed by the Company’s Chief Compliance Officer and her staff. During the period ended December 31, 2008, the fund was charged $1,833 for these services, which is included in miscellaneous expenses. The affairs of the fund, including services provided by Founders, are subject to the supervision and general oversight of the Company’s Board of Directors.
NOTE 4—Securities Transactions:
The aggregate amount of purchases and sales of investment securities, excluding short-term securities, during the period ended December 31, 2008, amounted to $477,100,767 and $545,540,665, respectively.
At December 31, 2008, the cost of investments for federal income tax purposes was $365,572,310; accordingly, accumulated net unrealized depreciation on investments was $83,872,264, consisting of $8,047,649 gross unrealized appreciation and $91,919,913 gross unrealized depreciation.
The Fund 35
| NOTES TO FINANCIAL STATEMENTS (continued) |
In March 2008, the Financial Accounting Standards Board released Statement of Financial Accounting Standards No. 161 “Disclosures about Derivative Instruments and Hedging Activities” (“FAS 161”). FAS 161 requires qualitative disclosures about objectives and strategies for using derivatives, quantitative disclosures about fair value amounts of gains and losses on derivative instruments and disclosures about credit-risk-related contingent features in derivative agreements. The application of FAS 161 is required for fiscal years and interim periods beginning after November 15, 2008.At this time, management is evaluating the implications of FAS 161 and its impact on the financial statements and the accompanying notes has not yet been determined.
NOTE 5—Subsequent Event:
On February 4, 2009, the fund issued to each holder of its Class T shares, in exchange for said shares, Class A shares of the fund having an aggregate net asset value equal to the aggregate net asset value of the shareholder’s Class T shares. Subsequent investments in the fund’s Class A shares made by prior holders of the fund’s ClassT shares who received Class A shares of the fund in exchange for their Class T shares are subject to the front-end sales load schedule that was in effect for Class T shares at the time of the exchange. Otherwise, all other Class A share attributes will be in effect.
36
REPORT OF INDEPENDENT REGISTERED
PUBLIC ACCOUNTING FIRM |
| | Shareholders and Board of Directors
Dreyfus Equity Growth Fund |
We have audited the accompanying statement of assets and liabilities, including the statement of investments, of Dreyfus Equity Growth Fund (formerly, Dreyfus Founders Equity Growth Fund) (one of the series comprising Dreyfus Funds, Inc.) as of December 31, 2008, and the related statement of operations for the year then ended, and the statement of changes in net assets and financial highlights for each of the two years in the period then ended.These financial statements and financial highlights are the responsibility of the Fund’s management. Our responsibility is to express an opinion on these financial statements and financial highlights based on our audits.The financial highlights for the years ended December 31, 2006, 2005 and 2004 were audited by other auditors whose report dated February 23, 2007, expressed an unqualified opinion on such financial highlights.
We conducted our audits in accordance with the standards of the Public Company Accounting Oversight Board (United States).Those standards require that we plan and perform the audit to obtain reasonable assurance about whether the financial statements and financial highlights are free of material misstatement.We were not engaged to perform an audit of the Fund’s internal control over financial reporting. Our audits included consideration of internal control over financial reporting as a basis for designing audit procedures that are appropriate in the circumstances, but not for the purpose of expressing an opinion on the effectiveness of the Fund’s internal control over financial reporting. Accordingly, we express no such opinion.An audit also includes examining, on a test basis, evidence supporting the amounts and disclosures in the financial statements and financial highlights, assessing the accounting principles used and significant estimates made by management, and evaluating the overall financial statement presentation. Our procedures included confirmation of securities owned as of December 31, 2008 by correspondence with the custodian and others. We believe that our audits provide a reasonable basis for our opinion.
In our opinion, the 2008 and 2007 financial statements and financial highlights referred to above present fairly, in all material respects, the financial position of Dreyfus Equity Growth Fund at December 31, 2008, the results of its operations for the year then ended, and the changes in its net assets and the financial highlights for each of the two years in the period then ended, in conformity with U.S. generally accepted accounting principles.

New York, New York
February 23, 2009 |
The Fund 37
IMPORTANT TAX INFORMATION (Unaudited)
For federal tax purposes, the fund hereby designates 100% of the ordinary dividends paid during the fiscal year ended December 31, 2008 as qualifying for the corporate dividends received deduction. For the fiscal year ended December 31, 2008, certain dividends paid by the fund may be subject to a maximum tax rate of 15%, as provided for by the Jobs and Growth Tax Relief Reconciliation Act of 2003. Of the distributions paid during the fiscal year, $956,404 represents the maximum amount that may be considered qualified dividend income. Shareholders will receive notification in January 2009 of the percentage applicable to the preparation of their 2008 income tax returns.
38
FACTORS CONSIDERED IN RENEWING
THE ADVISORY AGREEMENT (Unaudited) |
At a meeting of the board of directors of Dreyfus Funds, Inc. (the “Funds” and, in reference to any one of the Funds’ portfolios, a “Fund”) held on August 20 and 21, 2008, the Funds’ directors unanimously approved the continuation of the Investment Advisory Agreement (“management agreement”) between each of the Funds and Founders Asset Management LLC, the Funds’ investment adviser (“Founders”), for a one-year term ending August 31, 2009.The board of directors of the Funds (“board”) is comprised entirely of individuals who have no affiliation with Founders or any affiliates of Founders (the “directors”).
Prior to the directors’August 2008 meeting, Founders had provided the directors with extensive materials related to the renewal of the management agreement, including performance and expense information for other investment companies with similar investment objectives to each Fund derived from data compiled by Lipper Inc., an independent third party (“Lipper”).
During their meeting, the directors discussed the proposed continuance of the management agreement with the senior management personnel of Founders. At the conclusion of these discussions, the directors and their independent counsel met in a private session at which no representatives of Founders were present, to continue their discussion of continuance of the agreement. In determining to continue the management agreement, the directors considered all factors which they believed to be relevant, including the following:
Nature, Extent and Quality of Services Provided and to be Provided by Founders
The directors recognized that they have had the opportunity to evaluate the investment and non-investment related services which Founders and its affiliates provide to the Funds primarily through their quarterly review of all of the operations of the Funds during Fund committee and Fund board meetings held throughout the past twelve months. At each such meeting, extensive discussions of Fund operations are held with senior management personnel of Founders and a large volume of documentation with respect to these operations is
The Fund 39
FACTORS CONSIDERED IN RENEWING THE
ADVISORY AGREEMENT (Unaudited) (continued) |
provided to and reviewed by the directors. Such discussions and documentation afford the directors the continual opportunity to evaluate the nature, extent, and quality of the services provided by Founders and its affiliates to the Funds.
The directors were satisfied that Founders is managing the investment of the assets of the Funds in accordance with each Fund’s respective investment objective, policies and restrictions, subject to the directors’ overall supervision.
The directors considered that Founders also provides many non-investment related services to the Funds in fulfilling its responsibilities under the management agreement.
Following their discussion and review, the directors reached the following conclusions:
- That the breadth and quality of investment advisory and other ser- vices being provided to the Funds are satisfactory, as evidenced in part by the performance records of the Funds, to which the directors gave significant attention as indicated below; and
- That the directors are satisfied not only with the research, long-term portfolio management, and trading services being provided to the Funds, but also recognize that Founders or its affiliates have provided the highest quality accounting, compliance and regulatory, adminis- trative, underwriting, custody, shareholder, transfer agent and cash management services to the Funds, while charging fair, reasonable and competitive fees.
Investment Performance
On a quarterly basis, the directors hold meetings with representatives of the portfolio management team for each Fund (usually a portfolio manager), during which each representative reviews, among other items, performance information, attribution analyses, and the portfolio manager’s investment outlook. The directors also receive written monthly and quarterly performance information for each Fund. The written quarterly reports included comparisons of each Fund’s performance with its respective Lipper category and one or more benchmark
40
indexes, as well as a comparable exchange-traded fund, for the most recent quarter and one-, three-, five-, and ten-year periods, as well as for the portfolio manager’s tenure.
In conjunction with their consideration of renewal of the management agreement, the directors received a more detailed performance report about each Fund from Lipper.These reports compared each Fund’s performance to both a relatively small group of similar funds selected by Lipper (the “Lipper performance group”), as well as to all funds in the applicable Lipper category (the “Lipper performance universe”).
The performance of Equity Growth Fund’s Class F shares placed in the bottom quintile of both its Lipper performance group and the Lipper large-cap growth fund performance universe for the one-year period ended December 31, 2007, placed in the fourth and third quintiles, respectively, of its Lipper performance group for the three- and five-year periods ended December 31, 2007, placed in the third and second quintiles, respectively, of its Lipper performance universe for the three- and five-year periods, and underperformed its benchmark index for the one-, three- and five-year periods ended June 30, 2008. The directors deemed the Fund’s recent relative performance results to be unsatisfactory, although the directors noted that the Fund’s relative performance in the past has been satisfactory.The directors stressed the importance to Founders of the need to seek to improve the Fund’s performance in an effort to reestablish the stronger relative performance record which the Fund has achieved in the past.
After consideration of all relevant information and data, the directors concluded that although past performance cannot be a guaranty of future performance, each Fund and its shareholders would continue to benefit from Founders’ investment management of the Fund. The directors further determined:
- That although certain of the Funds have experienced performance difficulties, Founders has focused its efforts upon improving the performance records of the Funds and will continue to seek improvement; and
The Fund 41
FACTORS CONSIDERED IN RENEWING THE
ADVISORY AGREEMENT (Unaudited) (continued) |
- That the materials provided by Lipper demonstrated that most of the Funds maintained satisfactory long-term performance quintile rankings in their respective comparison universes, with three of five Funds placing in the top three quintiles of their respective Lipper performance universes for the three-year period ended December 31, 2007, and four of five Funds placing in the top three quintiles of their respective Lipper performance universes for the five-year period ended December 31, 2007.
| | Costs of the Services to be Provided and Profits to be
Realized by Founders and Its Affiliates from Founders’
Relationship With the Funds |
The directors recognized that on a quarterly basis, they received information with respect to each Fund’s expenses. The directors carefully reviewed and discussed the expense ratios for all classes of shares of each Fund at each of their quarterly meetings throughout the year.
In conjunction with their annual consideration of renewal of the Funds’ management agreement and other service arrangements, the directors received detailed information from Lipper which compared each Fund’s management fees and other expenses with those of a group of similar funds selected by Lipper (the “Lipper expense group”), as well as summary information comparing each Fund’s management fees and expenses with those of the funds in its Lipper performance universe with load structures similar to that of the Funds (the “Lipper expense universe”).
The directors noted that for the period ended December 31, 2007, Equity Growth Fund’s management fees ranked in the second best quintile of its Lipper expense group, with the Fund’s fees the sixth lowest of 16 “peer funds.”The Fund’s contractual management fees at a common asset level were determined by Lipper to be the fifth lowest of the 16 funds in its group.The Fund’s management fees were in the second best quintile of its Lipper expense universe.
42
The directors also considered information provided by Lipper with respect to the profitability of the investment management activities conducted by a number of publicly-held corporations. Lipper also prepared an analysis providing detailed information with respect to the types of services rendered to various mutual fund complexes under their respective investment advisory contracts, including the services provided by Founders to the Funds under the management agreement.
The directors had been provided with extensive materials with respect to the profitability derived by Founders from providing investment advisory services to the Funds as a group and to each Fund individually.
The directors further considered certain indirect benefits received by Founders and its affiliates as a result of Founders’ provision of investment advisory services to the Funds.These included the following:
- Since Founders manages a non-Fund account in a style that is similar to that used for one of the Funds (and for a portion of another Fund), and employees of Founders manage other non-Fund accounts in their capacities as employees of the affiliates, Founders and its affiliates real- ize efficiencies in performing the portfolio management, trading and operational functions related to those non-Fund accounts;
- The Funds’ brokerage transactions may be executed with brokers that provide research and brokerage services to Founders and its affiliates. These research and brokerage services may be useful to Founders and its affiliates in providing investment advisory services to any of the clients they advise, including the Funds; and
- Affiliates of Founders receive various fees for providing accounting, underwriting, shareholder, transfer agency, custody and cash man- agement services to the Funds.
The directors also reviewed a table comparing the Equity Growth Fund and a similarly-managed sub-advisory account managed by Founders, and their respective fee schedules. In their review of this table, the direc-
The Fund 43
FACTORS CONSIDERED IN RENEWING THE
ADVISORY AGREEMENT (Unaudited) (continued) |
tors noted that Founders provides many services to the Fund in fulfilling its responsibilities under the management agreement that it does not provide to the sub-advised account.The directors concluded that the fees paid to Founders under the management agreement are reasonable in relation to the nature and extent of the services provided by Founders to the Fund under the agreement.
After deliberation and discussion of Fund fees and expenses, the directors determined:
- That upon review of the advisory fee structures of the Funds in comparison with the competitive expense groups and expense uni- verses selected by Lipper, the levels of investment advisory fees paid by the Funds were deemed to be competitive;
- That the expense ratios of the Funds are competitive and that Founders continually reviews each Fund’s total expense ratio in an effort to maintain Fund expense ratios at reasonable and com- petitive levels;
- That three of the five Funds’ expense ratios decreased or remained substantially the same for all or most of their share classes in 2007 as compared to those experienced in 2006; and
- That the comparative fee and expense information included in the materials provided by Lipper supports the determination that the advisory and other fees payable by the Funds to Founders and its affiliates are essentially fees which would be similar to those that would have resulted solely from “arm’s-length” bargaining.
With respect to profitability to Founders, the directors reviewed the adviser profitability analysis provided by Lipper, which demonstrated that Founders’ 2007 profitability from providing management services to the Funds was reasonable in comparison to the entities included in the Lipper analysis.
The directors were also advised by independent counsel of the profitability percentage ranges which court cases have found acceptable and determined that Founders’ profitability percentage for providing management services to the Funds was reasonable.
44
The directors concluded that Founders’ profits from providing management services to the Funds were reasonable in relationship to the overall services which Founders provides.
Economies of Scale
The directors reviewed information provided by Founders which summarized the extent, if any, that both Founders and the Funds would achieve certain economies of scale if the assets of the Funds were to increase.
After review and discussion, the directors considered the extent to which economies of scale and common management are shared with each Fund, including the economies that would be realized from the growth of each Fund’s assets. After such consideration, the directors determined that all of the Funds have structured breakpoints in their advisory fees, which result in fee reductions as the assets of each Fund reach defined levels, and that such fee reductions, when implemented, would benefit all of the applicable Fund’s shareholders through decreases in the Fund’s expense ratio.
Dedication to Regulatory Requirements and Restrictions
An important factor in the directors’ consideration of renewal of the Funds’ management agreement with Founders included the directors’ recognition of the dedication by Founders of stringent adherence to regulatory requirements and restrictions.The directors determined that Founders is dedicated to compliance with all applicable rules and regulations and that the systems of controls which are in place to ensure that the service providers to the Funds, including Founders, and the Funds themselves, maintain strict adherence to the law are excellent.
Overall Conclusions
The directors determined that they are generally satisfied with the performance of the Funds and with the quality of the advisory and other services being provided by Founders and its affiliates to the
The Fund 45
FACTORS CONSIDERED IN RENEWING THE
ADVISORY AGREEMENT (Unaudited) (continued) |
Funds. The directors recognized that efforts are being and will continue to be made to improve the Fund’s performance and to maintain Fund expense ratios at reasonable and competitive levels.
The directors concluded that continuation of the current management agreement between each Fund and Founders, which would enable each Fund to continue to receive investment advisory services from Founders, is in the best interests of each Fund and its shareholders, the services to be performed under the management agreement are services required for the operations of the Funds, Founders has provided satisfactory investment management services to the Funds in the past, and the fees for the management services which Founders will perform will be within the range of what would have been negotiated at arm’s length in light of the circumstances.
46
YOUR BOARD REPRESENTATIVES (Unaudited)
The Board of Directors of the Company oversees the Company’s five series portfolios (the “Funds”). The business and affairs of the Company are managed under the direction of the Board.The directors serving on the Board perform their responsibilities in the manner which they reasonably believe to be in the best interests of the Funds and their shareholders.
All of the directors, as listed below, are independent directors.They are not affiliated with the Fund’s adviser, its parent company, or its affiliates. The directors have no official term of office and generally serve until they retire (normally at age 75, but subject to extension to age 80), resign, or are not re-elected. As you can see from their backgrounds, the directors have broad experience as active or former business and community leaders.
Directors
Alan S. Danson, 69.Year elected to the Board: 1991
Board Chairman.Private investor.Formerly,President and Director,D.H.Management, Inc., the general partner of a limited partnership with technology company holdings (1996 to 2003). Director, Gore Range Natural Science School and The Les Streeter Program, Inc., both of which are non-profit organizations.
Robert P. Mastrovita, 64.Year elected to the Board: 1998
Private investor. Chairman of a private charitable foundation (1997 to present). Formerly, Chairman and Director, Hagler, Mastrovita & Hewitt, Inc., a registered investment adviser (1982 to 1997). Member, Boston Society of Security Analysts. Trustee, Partridge Academy. Director, King Caesar Foundation.
Trygve E. Myhren, 72.Year elected to the Board: 1996
President, Myhren Media, Inc., a firm that invests in and advises media, telecommunications, Internet and software companies. Special Limited Partner and member of Investment Committee, Megunticook Funds, a venture capital firm (1998 to present). Director, AdPay, Inc. Trustee, Executive Committee and Chairman of Faculty Education Affairs Committee, the University of Denver.Trustee, Denver Art Museum. Member, Colorado FORUM and Cable Television Hall of Fame. Formerly, President (1990 to 1996) and Director (1992 to 2001) of the Providence Journal Company, a diversified media and communications company. Formerly, Chairman and Chief Executive Officer of American Television and Communications Corporation (now
The Fund 47
YOUR BOARD REPRESENTATIVES (Unaudited) (continued)
Time Warner Cable) (1981 to 1988). Formerly, Chairman of the National Cable Television Association (1986-1987). U.S. Chief of Mission, 2006 Paralympic Games, Torino/Sestrierre, Italy.
George W. Phillips, 70.Year elected to the Board: 1998
Retired.Vice Chairman of the Board and Chairman of the Investment Committee, Children’s Medical Center of Boston. Formerly, President and Chief Executive Officer (1992 to 1997) and Director (1992 to 2002) of Warren Bancorp, Inc. Formerly, President, Chief Executive Officer and Director of Warren Five Cents Savings Bank (1992 to 1997).
Martha A. Solis-Turner, 48.Year elected to the Board: 2005
Formerly, Telecommunications Director, Wholesale Markets (1995 to 2001), and Manager (1990 to 1995), Qwest Communications International Inc. Formerly, Board member and Treasurer, Mile High Montessori Early Learning Centers (2002 to 2008), Board member (1995 to 2004) and Vice President (2002 to 2004), Curtis Park Community Center, both of which are non-profit organizations.
Principal Officers
J. David Officer, 60. President and Principal Executive Officer of the Funds since 2007. Chairman, President and Chief Executive Officer of Founders since 2008. Chief Operating Officer,Vice Chairman and a Director of Dreyfus, and an officer of 77 investment companies (comprised of 180 portfolios) managed by Dreyfus. He has been an employee of Dreyfus since 1998.
Kenneth R. Christoffersen, 53. Vice President of the Funds since 2008, and Secretary since 2000 (and from 1996 to 1998). Founders’ Senior Vice President -Legal, General Counsel and Secretary. Assistant Secretary of the Distributor since 2003. Employed by Founders and its predecessor company since 1996.
Steven M. Anderson, 43.Treasurer and Principal Financial and Accounting Officer of the Funds since 2007.Vice President, BNY Mellon Asset Management (since 2003). Vice President, Treasurer and Chief Financial Officer, Mellon Optima L/S Strategy Fund, LLC (since 2005). Treasurer and Chief Financial Officer BNY/IVY Multi-Strategy Hedge Fund, LLC (since 2008). Formerly,Vice President (1999 to 2008), Treasurer and Chief Financial Officer of Mellon Institutional Funds Investment Trust (2002 to 2008).AssistantVice President and Mutual Funds Controller,Standish Mellon Asset Management Company, LLC (2000 to 2003).
48
Janelle E. Belcher, 50. Chief Compliance Officer of the Funds since 2004. Founders’ Vice President - Compliance since 2002. Formerly, Founders’ Manager of Compliance (2000 to 2002) and Securities Compliance Examiner, Staff Accountant and Team Leader for the U.S. Securities and Exchange Commission (1990 to 2000).
Robert S. Robol, 44. Assistant Treasurer since 2006. Senior Accounting Manager -Taxable Fixed Income Funds of Dreyfus, and an officer of 78 investment companies (comprised of 201 portfolios) managed by Dreyfus. Employed by Dreyfus since 1988.
Robert Salviolo, 41. Assistant Treasurer since 2007. Senior Accounting Manager -Foreign Equity Funds of Dreyfus, and an officer of 78 investment companies (comprised of 201 portfolios) managed by Dreyfus. Employed by Dreyfus since 1989.
Robert Svagna, 41. Assistant Treasurer since 2006. Senior Accounting Manager -Equity Funds of Dreyfus, and an officer of 78 investment companies (comprised of 201 portfolios) managed by Dreyfus. Employed by Dreyfus since 1990.
William G. Germenis, 38. Anti-Money Laundering Compliance Officer (“AMLCO”) for the Class A, Class B, Class C and Class I shares of the Funds since 2002 and for the Class F shares of the Funds since 2003.Vice President and AMLCO of the Distributor and AMLCO of 74 investment companies (comprised of 197 portfolios) managed by Dreyfus. Employed by the Distributor since 1998.
The directors and officers may be contacted at Founders’ address appearing on the back cover, except for Messrs. Officer, Robol, Salviolo, Svagna and Germenis, who can be contacted at The Dreyfus Corporation, 200 Park Avenue, NewYork, NewYork 10166, and Mr. Anderson, who can be contacted at BNY Mellon Asset Management, One Boston Place, Boston, Massachusetts 02108. Additional information about the Company’s directors is available in the Statement of Additional Information, which can be obtained free of charge by calling 1-800-645-6561 (Class F shareholders) or 1-800-554-4611 (all other shareholders).
The Fund 49
For More Information

The fund files its complete schedule of portfolio holdings with the Securities and Exchange Commission (“SEC”) for the first and third quarters of each fiscal year on Form N-Q. The fund’s Forms N-Q are available on the SEC’s website at http://www.sec.gov and may be reviewed and copied at the SEC’s Public Reference Room in Washington, DC. Information on the operation of the Public Reference Room may be obtained by calling 1-800-SEC-0330.
A description of the policies and procedures that the fund uses to determine how to vote proxies relating to portfolio securities, and information regarding how the fund voted these proxies for the most recent 12-month period ended June 30 is available at http://www.dreyfus.com and on the SEC’s website at http://www.sec.gov.
The description of the policies and procedures is also available without charge, upon request, by calling 1-800-645-6561.
This report and the statements it contains are submitted for the general information
of our shareholders. The report is not authorized for distribution to prospective
investors unless preceded or accompanied by an effective prospectus. |
| © 2009 MBSC Securities Corporation |

| | Dreyfus
Global Growth Fund |
| | ANNUAL REPORT December 31, 2008 |

Save time. Save paper. View your next shareholder report online as soon as it’s available. Log into www.dreyfus.com and sign up for Dreyfus eCommunications. It’s simple and only takes a few minutes.
The views expressed in this report reflect those of the portfolio managers only through the end of the period covered and do not necessarily represent the views of Dreyfus, Founders or any other person in our organization. Any such views are subject to change at any time based upon market or other conditions and we disclaim any responsibility to update such views. These views may not be relied on as investment advice and, because investment decisions for a Dreyfus fund are based on numerous factors, may not be relied on as an indication of trading intent on behalf of any Dreyfus fund.

| | Contents |
| |
| | THE FUND |
| |
| 2 | A Letter from the Chairman |
| |
| 3 | Discussion of Fund Performance |
| |
| 6 | Fund Performance |
| |
| 8 | Understanding Your Fund’s Expenses |
| |
| 8 | Comparing Your Fund’s Expenses With Those of Other Funds |
| |
| 9 | Statement of Investments |
| |
| 15 | Statement of Assets and Liabilities |
| |
| 16 | Statement of Operations |
| |
| 17 | Statement of Changes in Net Assets |
| |
| 19 | Financial Highlights |
| |
| 25 | Notes to Financial Statements |
| |
| 39 | Report of Independent Registered Public Accounting Firm |
| |
| 40 | Factors Considered in Renewing the Advisory Agreement |
| |
| 48 | Your Board Representatives |
| |
| | FOR MORE INFORMATION |
| |
| | Back Cover |
| |
Dreyfus
Global Growth Fund |

A LETTER FROM THE CHAIRMAN
Dear Shareholder: |
We present to you this annual report for Dreyfus Global Growth Fund, covering the 12-month period from January 1, 2008, through December 31, 2008.
2008 was the most difficult year in decades for the economy and stock market.A credit crunch that originated in 2007 in the U.S. sub-prime mortgage market exploded in mid-2008 into a global financial crisis, resulting in the failures of major financial institutions, a deep and prolonged recession and lower investment values across a broad range of asset classes. Governments and regulators throughout the world moved aggressively to curtail the damage, implementing unprecedented reductions of short-term interest rates, massive injections of liquidity into the banking system, government bailouts of struggling companies and plans for massive economic stimulus programs. After several years of strong relative returns, international stocks generally declined more sharply than their U.S. counterparts.
Although we expect the U.S. and global economies to remain weak until longstanding imbalances have worked their way out of the system, the financial markets currently appear to have priced in investors’ generally low expectations. In previous recessions, however, the markets have tended to anticipate economic improvement before it occurs, potentially leading to major rallies when few expected them. That’s why it makes sense to remain disciplined, maintain a long-term perspective and adopt a consistent asset allocation strategy that reflects one’s future goals and attitudes toward risk. As always, we urge you to consult with your financial advisor, who can recommend the course of action that is right for you. For information about how the fund performed during the reporting period, as well as market perspectives, we have provided a Discussion of Fund Performance given by the fund’s Portfolio Managers.
Thank you for your continued confidence and support.

J. David Officer
Chairman, President and Chief Executive Officer
Founders Asset Management LLC
January 15, 2009 |
2

DISCUSSION OF FUND PERFORMANCE
For the period of January 1, 2008, through December 31, 2008, as provided byWilliam S. Patzer, CFA, and Sean P. Fitzgibbon, CFA, Portfolio Managers
Fund and Market Performance Overview
For the 12-month period ended December 31, 2008, Dreyfus Global Growth Fund’s Class A shares produced a total return of –45.94%, Class B shares returned –46.47%, Class C shares returned –46.38%, Class F shares returned –45.75%, Class I shares returned –45.87% and Class T shares returned –46.01% .1 In comparison, the fund’s benchmarks, the Morgan Stanley Capital International (MSCI) World Index produced a –40.71% total return, and the MSCI World Growth Index produced a –41.13% total return for the same period. 2,3 World stock markets fell precipitously during 2008 due to a global economic slowdown and an intensifying financial crisis. Changes in currency exchange rates also adversely affected returns for U.S. residents. The fund underperformed its benchmarks, primarily due to poor stock selections in the United States and Japan.
The Fund’s Investment Approach
The fund seeks long-term growth of capital by investing in the stocks of growth companies in markets throughout the world. The fund may purchase securities in any foreign country,as well as in the United States, emphasizing common stocks of both emerging and established growth companies that generally have strong performance records and market positions.We use a “growth style” of investing, searching for companies whose fundamental strengths suggest the potential to provide superior earnings growth over time.Our“bottom-up”approach emphasizes individual stock selection. We go beyond Wall Street analysis and perform intensive qualitative and quantitative in-house research to determine whether companies meet our investment criteria.
Global Economic Slowdown Mires Equity Markets
Unprecedented turmoil in financial and credit markets worldwide took their toll in 2008, sparking sharp slowdowns in developed and emerging economies. As the financial crisis intensified, lenders grew reluctant to extend credit even to their more creditworthy customers, causing consumer spending and business investment to decline sharply. Industrial demand waned, and commodity prices retreated from previous record highs. These developments sparked a “flight to safety” among global
The Fund 3
| DISCUSSION OF FUND PERFORMANCE (continued) |
investors, who fled risky assets, such as stocks, often without regard for underlying business fundamentals.
U.S. and Japanese Stocks Were Largest Detractors
From a regional perspective, U.S. stocks proved to be the greatest detractors from the fund’s relative performance. Holdings in the U.S. information technology sector were especially poor performers, as Apple, Google, Adobe Systems, MEMC Electronic Materials and Electronic Arts encountered softer customer demand and, in some cases, company-specific issues.
The fund’s Japanese holdings undermined the fund’s results when investors flocked toward domestic-oriented, slower-growth companies that historically have held their value in downturns. Plummeting global commodity prices and strengthening yen caused considerable damage in Japan’s industrials sector, where the fund was hurt by its emphasis on companies with a strong international presence over the domestically focused firms that generally fared better. For example, multinational conglomerates Mitsubishi Corp. and Marubeni, which were sold during the reporting period, were among the fund’s greater detractors from performance, declining sharply along with commodity prices and global industrial demand.Truck builder Isuzu Motors, which was sold during the reporting period, suffered from plunging sales volumes as demand in emerging markets waned.The fund’s positions in Japanese consumer discretionary stocks lost considerable value when consumer confidence and spending slowed.
Weak stock selections in the United Kingdom also produced disappointing results, led by industrial conglomerate, Charter International, which encountered slumping demand. German truck and parts supplier MAN, which was sold during the reporting period, suffered as infrastructure construction slowed in emerging markets.
Although the fund was hurt by the weakening worldwide economy, it cushioned the effects of the financial crisis through underweighted exposure to the financials sector, where the fund held none of the more troubled banks at the epicenter of the crisis. Similarly, lack of exposure to Australia’s financials and basic materials sectors proved beneficial, as did reduced positions in Belgium. Swiss food producer Nestlé fared relatively well, as the consumer staple giant’s diversified businesses, steady sales and pricing power enabled it to hold up better than market averages. Other notably positive contributions to performance came from retailers Wal-Mart Stores and Family Dollar Stores, which was sold
4
during the reporting period, and which advanced as cost-conscious consumers increasingly turned to low-priced goods. Positions in U.S. for-profit education company Apollo Group and Canadian gold miner IAMGOLD supported the fund’s return, as did fortunate timing in the purchase of telecommunications giant AT&T. An allocation to cash also bolstered the fund’s relative performance.
Positioned for a Market Rebound
As of year-end, the financial crisis has persisted and the economy has continued to weaken. However, it appears to us that the generally low expectations for 2009 already have been reflected in stock prices. In addition, the benefits of lower energy prices and an expected stimulus package from the U.S. government could boost demand for a variety of products and services, and we expect accommodative monetary policies to pump liquidity into the global financial system. Therefore, we have begun to consider establishing positions in companies that, in our judgment, are attractively priced, well positioned to weather the current economic storm and poised to participate in an eventual recovery.
January 15, 2009
On January 6, 2009, Sean Fitzgibbon assumed portfolio management responsibilities for the domestic portion of the fund. For more information about Mr. Fitzgibbon, please see the fund’s prospectus or talk to your financial advisor. Mr. Patzer continues to manage the foreign portion of the fund.
Investing in foreign companies involves special risks, including changes in currency rates, political, economic and social instability, a lack of comprehensive company information, differing auditing and legal standards and less market liquidity. An investment in this fund should be considered only as a supplement to an overall investment program.
Part of the fund’s historical performance is due to amounts received from class action settlements regarding prior fund holdings. There is no guarantee that these settlement distributions will occur in the future or have a similar impact on performance.
| 1 | Total return includes reinvestment of dividends and any capital gains paid, and does not take into consideration the maximum initial sales charges in the case of Class A and Class T shares, or the applicable contingent deferred sales charges imposed on redemptions in the case of Class B and Class C shares. Had these charges been reflected, returns would have been lower. Past performance is no guarantee of future results. Share price and investment return fluctuate such that upon redemption, fund shares may be worth more or less than their original cost. Return figures provided reflect Founders’ waiver of 12.5% of its management fee for the period from January 1, 2008, through September 13, 2008.This waiver ended on September 14, 2008. Had this waiver not been in effect, the fund’s returns would have been lower. |
| |
| 2 | SOURCE: LIPPER INC. – Reflects reinvestment of dividends and, where applicable, capital gains distributions.The MSCI World Index measures global developed market equity performance. |
| |
| | The total return figure cited for this index assumes change in security prices and reinvestment of dividends, but does not reflect the costs of managing a mutual fund. |
| |
| 3 | SOURCE: LIPPER INC. – Reflects reinvestment of net dividends and, where applicable, capital gains distributions.The MSCI World Growth Index measures global developed market equity performance of growth securities.The total return figure cited for this index assumes change in security prices and reinvestment of dividends, but does not reflect the costs of managing a mutual fund. |
| |
The Fund 5
† Source: Lipper Inc.
Past performance is not predictive of future performance.
The above graph compares a $10,000 investment made in Class F shares of Dreyfus Global Growth Fund on 12/31/98 to a $10,000 investment made in each of the Morgan Stanley Capital International World Index (the “MSCI World Index”) and the Morgan Stanley Capital International World Growth Index (the “MSCI World Growth Index”) on that date. All dividends and capital gain distributions are reinvested. Performance for Class A, Class B, Class C, Class I and Class T shares will vary from the performance of Class F shares shown above due to differences in charges and expenses.
The fund’s performance shown in the line graph takes into account all applicable Class F fees and expenses (after any expense reimbursements and fee waivers).The MSCI World Index is an unmanaged index of global stock market performance, including the United States, Canada,Australia, New Zealand and the Far East.The MSCI World Growth Index measures global developed market equity performance of growth securities. Unlike a mutual fund, the indices are not subject to charges, fees and other expenses. Investors cannot invest directly in any index. Further information relating to fund performance, including expense reimbursements, if applicable, is contained in the Financial Highlights section of the prospectus and elsewhere in this report.
6
| Average Annual Total Returns as of 12/31/08 | | | | | | |
| |
| | | Inception | | | | | | | | From |
| | | Date | | 1 Year | | 5 Years | | 10 Years | | Inception |
| |
| |
| |
| |
| |
|
| Class A shares | | | | | | | | | | |
| with maximum sales charge (5.75%) | | 12/31/99 | | (49.05)% | | (3.33)% | | — | | (7.92)% |
| without sales charge | | 12/31/99 | | (45.94)% | | (2.19)% | | — | | (7.31)% |
| Class B shares | | | | | | | | | | |
| with applicable redemption charge † | | 12/31/99 | | (48.61)% | | (3.38)% | | — | | (7.75)%†† |
| without redemption | | 12/31/99 | | (46.47)% | | (2.99)% | | — | | (7.75)%†† |
| Class C shares | | | | | | | | | | |
| with applicable redemption charge ††† | | 12/31/99 | | (46.91)% | | (2.92)% | | — | | (8.20)% |
| without redemption | | 12/31/99 | | (46.38)% | | (2.92)% | | — | | (8.20)% |
| Class F shares | | 12/29/89 | | (45.75)% | | (2.08)% | | (2.73)% | | N/A |
| Class I shares | | 12/31/99 | | (45.87)% | | (1.77)% | | — | | (6.89)% |
| Class T shares | | | | | | | | | | |
| with applicable sales charge (4.5%) | | 12/31/99 | | (48.45)% | | (3.35)% | | — | | (8.51)% |
| without sales charge | | 12/31/99 | | (46.01)% | | (2.45)% | | — | | (8.04)% |
Past performance is not predictive of future performance.The fund’s performance shown in the graph and table does not reflect the deduction of taxes that a shareholder would pay on fund distributions or the redemption of fund shares, but does reflect fee waivers. Part of the fund’s historical performance is due to amounts received from class action settlements regarding prior fund holdings.There is no guarantee that these settlement distributions will occur in the future or have a similar impact on performance.
| † The maximum contingent deferred sales charge for Class B shares is 4%.After six years Class B shares convert to |
| Class A shares. |
| †† | | Assumes the conversion of Class B shares to Class A shares at the end of the sixth year following the date |
| | | of purchase. |
| ††† | | The maximum contingent deferred sales charge for Class C shares is 1% for shares redeemed within one year of the |
| | | date of purchase. |
The Fund 7
UNDERSTANDING YOUR FUND’S EXPENSES (Unaudited)
As a mutual fund investor, you pay ongoing expenses, such as management fees and other expenses. Using the information below, you can estimate how these expenses affect your investment and compare them with the expenses of other funds.You also may pay one-time transaction expenses, including sales charges (loads) and redemption fees, which are not shown in this section and would have resulted in higher total expenses. For more information, see your fund's prospectus or talk to your financial advisor.
Review your fund’s expenses
The table below shows the expenses you would have paid on a $1,000 investment in Dreyfus Global Growth Fund from July 1, 2008 to December 31, 2008. It also shows how much a $1,000 investment would be worth at the close of the period, assuming actual returns and expenses.To estimate the expenses you paid on your account over this period, simply divide your account value by $1,000 (for example, an $8,600 account value divided by $1,000 = 8.60), then multiply the results by the number in the Expenses paid per $1,000 line for the class of shares you own.
Expenses and Value of a $1,000 Investment
assuming actual returns for the six months ended December 31, 2008 |
| | | Class A | | Class B | | Class C | | Class F | | Class I | | Class T |
| |
| |
| |
| |
| |
| |
|
| Expenses paid | | | | | | | | | | | | |
| per $1,000† | | $ 5.72 | | $ 9.63 | | $ 8.78 | | $ 4.22 | | $ 4.26 | | $ 6.16 |
| Ending value | | | | | | | | | | | | |
| (after expenses) | | $612.70 | | $609.80 | | $610.30 | | $614.60 | | $613.30 | | $612.80 |
COMPARING YOUR FUND’S EXPENSES
WITH THOSE OF OTHER FUNDS (Unaudited) |
Using the SEC’s method to compare expenses
The Securities and Exchange Commission (SEC) has established guidelines to help investors assess fund expenses. Per these guidelines, the table below shows your fund’s expenses based on a $1,000 investment, assuming a hypothetical 5% annualized return. You can use this information to compare the ongoing expenses (but not transaction expenses or total cost) of investing in the fund with those of other funds.All mutual fund shareholder reports will provide this information to help you make this comparison. Please note that you cannot use this information to estimate your actual ending account balance and expenses paid during the period.
Expenses and Value of a $1,000 Investment
assuming a hypothetical 5% annualized return for the six months ended December 31, 2008 |
| | | Class A | | Class B | | Class C | | Class F | | Class I | | Class T |
| |
| |
| |
| |
| |
| |
|
| Expenses paid | | | | | | | | | | | | |
| per $1,000† | | $ 7.15 | | $ 12.04 | | $ 10.99 | | $ 5.28 | | $ 5.33 | | $ 7.71 |
| Ending value | | | | | | | | | | | | |
| (after expenses) | | $1,018.05 | | $1,013.17 | | $1,014.23 | | $1,019.91 | | $1,019.86 | | $1,017.50 |
| † Expenses are equal to the fund’s annualized expense ratio of 1.41% for Class A shares, 2.38% for Class B shares, |
| 2.17% for Class C shares, 1.04% for Class F shares, 1.05% for Class I shares and 1.52% for Class T shares, |
| multiplied by the average account value over the period, multiplied by 184/366 (to reflect the one-half year period). |
8
STATEMENT OF INVESTMENTS
December 31, 2008 |
| Common Stocks—98.9% | | Shares | | Value ($) |
| |
| |
|
| Australia—1.9% | | | | |
| BHP Billiton | | 18,072 | | 380,511 |
| Computershare | | 12,572 | | 68,728 |
| Sonic Healthcare | | 9,050 | | 91,842 |
| | | | | 541,081 |
| Belgium—.5% | | | | |
| Colruyt | | 654 | | 139,757 |
| Canada—2.9% | | | | |
| Barrick Gold | | 3,400 | | 123,168 |
| Bombardier, Cl. B | | 16,350 | | 58,951 |
| EnCana | | 5,890 | | 271,831 |
| Fairfax Financial Holdings | | 484 | | 151,691 |
| Iamgold | | 20,700 | | 127,467 |
| TransCanada | | 3,040 | | 81,702 |
| | | | | 814,810 |
| Finland—1.3% | | | | |
| Nokia | | 19,130 | | 295,134 |
| UPM-Kymmene | | 6,100 | | 76,305 |
| | | | | 371,439 |
| France—4.5% | | | | |
| AXA | | 3,259 | | 71,772 |
| BNP Paribas | | 1,364 | | 57,348 |
| Cap Gemini | | 2,060 | | 78,737 |
| France Telecom | | 2,450 | | 67,969 |
| GDF SUEZ | | 4,344 | | 213,282 |
| Neopost | | 750 | | 67,580 |
| Nexans | | 1,240 | | 73,157 |
| Sanofi-Aventis | | 1,613 | | 101,782 |
| Technip | | 2,660 | | 80,421 |
| Teleperformance | | 3,230 | | 89,159 |
| Total | | 2,618 | | 141,583 |
| Vivendi | | 7,250 | | 234,435 |
| | | | | 1,277,225 |
| Germany—2.9% | | | | |
| Deutsche Telekom | | 4,797 | | 71,674 |
| E.ON | | 2,910 | | 115,028 |
| Hochtief | | 1,610 | | 79,976 |
The Fund 9
| STATEMENT OF INVESTMENTS (continued) |
| Common Stocks (continued) | | Shares | | Value ($) |
| |
| |
|
| Germany (continued) | | | | |
| Muenchener Rueckversicherungs-Gesellschaft | | 470 | | 72,511 |
| RWE | | 1,622 | | 143,606 |
| Salzgitter | | 1,680 | | 128,426 |
| Siemens | | 1,930 | | 141,314 |
| Software | | 1,310 | | 72,830 |
| | | | | 825,365 |
| Hong Kong—.4% | | | | |
| Cheung Kong Holdings | | 6,000 | | 57,205 |
| Hutchison Whampoa | | 11,000 | | 55,489 |
| | | | | 112,694 |
| Ireland—.4% | | | | |
| CRH | | 5,010 | | 126,038 |
| Italy—1.3% | | | | |
| ACEA | | 6,458 | | 86,483 |
| ENI | | 4,940 | | 114,938 |
| Finmeccanica | | 6,020 | | 91,118 |
| Fondiaria-SAI | | 3,710 | | 66,003 |
| | | | | 358,542 |
| Japan—10.7% | | | | |
| Air Water | | 9,000 | | 80,863 |
| Canon | | 1,800 | | 56,517 |
| Central Japan Railway | | 7 | | 60,513 |
| Chubu Electric Power | | 3,200 | | 97,278 |
| Daihatsu Motor | | 6,000 | | 53,575 |
| Daiichi Sankyo | | 5,200 | | 123,629 |
| Furukawa Electric | | 15,000 | | 73,030 |
| Hitachi | | 26,000 | | 100,853 |
| Honda Motor | | 6,600 | | 143,168 |
| JFE Holdings | | 2,700 | | 71,430 |
| KDDI | | 24 | | 170,975 |
| Kubota | | 11,000 | | 79,088 |
| Lawson | | 3,000 | | 173,054 |
| Leopalace21 | | 7,300 | | 74,035 |
| Mitsubishi UFJ Financial Group | | 17,600 | | 109,231 |
| Mitsumi Electric | | 5,300 | | 93,701 |
| Nintendo | | 300 | | 115,284 |
10
| Common Stocks (continued) | | Shares | | Value ($) |
| |
| |
|
| Japan (continued) | | | | |
| Nippon Express | | 26,000 | | 109,426 |
| Nippon Yusen | | 21,000 | | 129,540 |
| Nissin Foods Holdings | | 5,400 | | 189,436 |
| NTT Data | | 17 | | 68,256 |
| Promise | | 3,250 | | 82,395 |
| Rohm | | 1,500 | | 75,760 |
| Sega Sammy Holdings | | 9,200 | | 106,778 |
| Shin-Etsu Chemical | | 1,800 | | 82,577 |
| Sumitomo | | 8,100 | | 71,403 |
| Sumitomo Electric Industries | | 15,700 | | 120,740 |
| Sumitomo Heavy Industries | | 30,800 | | 122,640 |
| Tokyo Gas | | 13,000 | | 65,892 |
| Tokyo Tatemono | | 17,000 | | 77,765 |
| Tsumura & Co. | | 2,000 | | 74,205 |
| | | | | 3,053,037 |
| Netherlands—1.2% | | | | |
| Imtech | | 4,576 | | 76,322 |
| Koninklijke Ahold | | 13,180 | | 161,022 |
| Koninklijke Vopak | | 2,810 | | 105,451 |
| | | | | 342,795 |
| Norway—.5% | | | | |
| Prosafe | | 16,880 | | 62,718 |
| Tandberg | | 7,900 | | 85,122 |
| | | | | 147,840 |
| Singapore—.8% | | | | |
| CapitaLand | | 37,000 | | 81,314 |
| ComfortDelgro | | 132,000 | | 133,664 |
| | | | | 214,978 |
| Spain—1.5% | | | | |
| Iberdrola | | 10,390 | | 94,444 |
| Telefonica | | 14,960 | | 329,566 |
| | | | | 424,010 |
| Sweden—.7% | | | | |
| Elekta, Cl. B | | 8,970 | | 87,447 |
| Nordea Bank | | 17,200 | | 119,041 |
| | | | | 206,488 |
The Fund 11
| STATEMENT OF INVESTMENTS (continued) |
| Common Stocks (continued) | | Shares | | Value ($) |
| |
| |
|
| Switzerland—5.3% | | | | |
| Credit Suisse Group | | 3,100 | | 83,044 |
| Nestle | | 14,550 | | 568,926 |
| Novartis | | 8,618 | | 426,890 |
| Roche Holding | | 2,927 | | 447,070 |
| | | | | 1,525,930 |
| United Kingdom—10.3% | | | | |
| AstraZeneca | | 8,999 | | 363,090 |
| BAE Systems | | 13,720 | | 74,299 |
| Barclays | | 30,240 | | 66,678 |
| BG Group | | 6,550 | | 90,101 |
| BP | | 21,750 | | 164,446 |
| British American Tobacco | | 6,157 | | 159,301 |
| Carnival | | 5,590 | | 121,249 |
| Charter International | | 15,480 | | 73,428 |
| Drax Group | | 11,230 | | 90,557 |
| HSBC Holdings | | 7,580 | | 72,128 |
| Pearson | | 9,120 | | 84,029 |
| Reckitt Benckiser Group | | 5,960 | | 220,855 |
| Regus | | 68,180 | | 48,511 |
| Rexam | | 16,990 | | 85,719 |
| Royal Dutch Shell, Cl. B | | 10,230 | | 253,802 |
| Shire | | 4,930 | | 71,714 |
| Shire, ADR | | 5,133 | | 229,856 |
| Standard Life | | 24,090 | | 69,947 |
| Tesco | | 55,070 | | 284,968 |
| Thomas Cook Group | | 20,420 | | 51,982 |
| WPP | | 43,240 | | 250,167 |
| | | | | 2,926,827 |
| United States—51.8% | | | | |
| Abbott Laboratories | | 7,704 | | 411,163 |
| Adobe Systems | | 16,714 a | | 355,841 |
| Akamai Technologies | | 9,625 a | | 145,241 |
| Amazon.com | | 4,312 a | | 221,120 |
| Apollo Group, Cl. A | | 1,731 a | | 132,629 |
| Apple | | 5,715 a | | 487,775 |
| Assurant | | 5,761 | | 172,830 |
| AT & T | | 14,436 | | 411,426 |
12
| Common Stocks (continued) | | Shares | | Value ($) |
| |
| |
|
| United States (continued) | | | | |
| Autodesk | | 5,210 a | | 102,376 |
| Avon Products | | 14,946 | | 359,152 |
| Bed Bath & Beyond | | 6,643 a | | 168,865 |
| Best Buy | | 11,824 | | 332,373 |
| BioMarin Pharmaceutical | | 22,469 a | | 399,948 |
| Broadcom, Cl. A | | 8,704 a | | 147,707 |
| Carnival | | 13,105 | | 318,714 |
| Chevron | | 5,447 | | 402,915 |
| Cisco Systems | | 4,138 a | | 67,449 |
| Colgate-Palmolive | | 4,243 | | 290,815 |
| CVS Caremark | | 8,607 | | 247,365 |
| Dean Foods | | 14,232 a | | 255,749 |
| Delta Air Lines | | 9,766 a | | 111,918 |
| Dover | | 8,226 | | 270,800 |
| Electronic Arts | | 10,168 a | | 163,095 |
| EMC | | 40,153 a | | 420,402 |
| Energy Conversion Devices | | 3,503 a | | 88,311 |
| Estee Lauder, Cl. A | | 5,681 | | 175,884 |
| Exxon Mobil | | 7,036 | | 561,684 |
| GameStop, Cl. A | | 7,990 a | | 173,063 |
| Gap | | 26,833 | | 359,294 |
| Gilead Sciences | | 3,465 a | | 177,200 |
| Google, Cl. A | | 602 a | | 185,206 |
| Hess | | 1,892 | | 101,487 |
| Home Depot | | 19,905 | | 458,213 |
| JPMorgan Chase & Co. | | 8,727 | | 275,163 |
| KLA-Tencor | | 7,658 | | 166,868 |
| Kraft Foods, Cl. A | | 21,532 | | 578,134 |
| Life Technologies | | 13,978 a | | 325,827 |
| MEMC Electronic Materials | | 6,290 a | | 89,821 |
| Microsoft | | 20,492 | | 398,364 |
| Nordstrom | | 5,830 | | 77,597 |
| Oracle | | 13,538 a | | 240,029 |
| Pfizer | | 12,442 | | 220,348 |
| Pharmaceutical Product Development | | 6,979 | | 202,461 |
| Praxair | | 4,751 | | 282,019 |
| QUALCOMM | | 15,209 | | 544,938 |
The Fund 13
| | STATEMENT OF INVESTMENTS (continued) |
| Common Stocks (continued) | | Shares | | Value ($) |
| |
| |
|
| United States (continued) | | | | |
| Safeway | | 17,430 | | 414,311 |
| Schlumberger | | 2,505 | | 106,037 |
| Tiffany & Co. | | 6,090 | | 143,907 |
| Union Pacific | | 9,316 | | 445,305 |
| Unum Group | | 21,935 | | 407,991 |
| Visa, Cl. A | | 8,156 | | 427,782 |
| Wal-Mart Stores | | 11,204 | | 628,096 |
| Wells Fargo & Co. | | 5,258 | | 155,006 |
| | | | | 14,808,014 |
| Total Common Stocks | | | | |
| (cost $35,724,718) | | | | 28,216,870 |
| |
| |
|
| |
| Preferred Stocks—.5% | | | | |
| |
| |
|
| Germany | | | | |
| Fresenius | | | | |
| (cost $164,980) | | 2,533 | | 146,422 |
| |
| |
|
| |
| Total Investments (cost $35,889,698) | | 99.4% | | 28,363,292 |
| Cash and Receivables (Net) | | .6% | | 167,516 |
| Net Assets | | 100.0% | | 28,530,808 |
| |
| ADR—American Depository Receipts | | | | |
| a Non-income producing security. | | | | |
| Portfolio Summary (Unaudited)† | | | | |
| |
| | | Value (%) | | | | Value (%) |
| |
| |
| |
|
| Information Technology | | 17.9 | | Financials | | 8.1 |
| Consumer Staples | | 17.0 | | Materials | | 5.5 |
| Health Care | | 13.7 | | Telecommunication Services | | 3.7 |
| Consumer Discretionary | | 12.0 | | Utilities | | 3.2 |
| Industrials | | 9.8 | | | | |
| Energy | | 8.5 | | | | 99.4 |
| |
| † Based on net assets. | | | | | | |
| See notes to financial statements. | | | | | | |
14
| | STATEMENT OF ASSETS AND LIABILITIES
December 31, 2008 |
| | | Cost | | Value |
| |
| |
|
| Assets ($): | | | | |
| Investments in securities—See Statement of Investments | | 35,889,698 | | 28,363,292 |
| Cash | | | | 198,604 |
| Cash denominated in foreign currencies | | 172,691 | | 171,111 |
| Dividends and interest receivable | | | | 50,458 |
| Receivable for investment securities sold | | | | 36,065 |
| Receivable for shares of Common Stock subscribed | | | | 1,286 |
| Prepaid expenses | | | | 50,348 |
| Other assets | | | | 223,501 |
| | | | | 29,094,665 |
| |
| |
|
| Liabilities ($): | | | | |
| Due to Founders Asset Management LLC and affiliates—Note 3(c) | | | | 68,900 |
| Directors’ deferred compensation | | | | 223,501 |
| Payable for investment securities purchased | | | | 123,951 |
| Payable for shares of Common Stock redeemed | | | | 78,452 |
| Interest payable—Note 2 | | | | 53 |
| Unrealized depreciation on forward | | | | |
| currency exchange contracts—Note 4 | | | | 10 |
| Accrued expenses | | | | 68,990 |
| | | | | 563,857 |
| |
| |
|
| Net Assets ($) | | | | 28,530,808 |
| |
| |
|
| Composition of Net Assets ($): | | | | |
| Paid-in capital | | | | 86,322,773 |
| Accumulated undistributed investment income—net | | | | 167,721 |
| Accumulated net realized gain (loss) on investments | | | | (50,257,195) |
| Accumulated net unrealized appreciation (depreciation) | | | | |
| on investments and foreign currency transactions | | | | (7,702,491) |
| |
| |
|
| Net Assets ($) | �� | | | 28,530,808 |
| Net Asset Value Per Share | | | | | | | | | | |
| | | Class A | | Class B | | Class C | | Class F | | Class I | | Class T |
| |
| |
| |
| |
| |
| |
|
| Net Assets ($) | | 1,016,375 | | 153,258 | | 317,988 | | 26,150,931 | | 822,853 | | 69,403 |
| Shares Outstanding | | 99,685 | | 16,172 | | 34,120 | | 2,545,538 | | 77,509 | | 7,322 |
| |
| |
| |
| |
| |
| |
|
| Net Asset Value | | | | | | | | | | | | |
| Per Share ($) | | 10.20 | | 9.48 | | 9.32 | | 10.27 | | 10.62 | | 9.48 |
| |
| See notes to financial statements. | | | | | | | | | | |
The Fund 15
| STATEMENT OF OPERATIONS | | |
| Year Ended December 31, 2008 | | |
| |
|
| |
| |
| |
| |
| Investment Income ($): | | |
| Income: | | |
| Cash dividends (net of $73,389 foreign taxes withheld at source) | | 920,495 |
| Expenses: | | |
| Investment advisory fee—Note 3(a) | | 461,075 |
| Shareholder servicing costs—Note 3(c) | | 92,036 |
| Distribution fees—Note 3(b) | | 71,110 |
| Registration fees | | 66,631 |
| Auditing fees | | 59,017 |
| Custodian fees—Note 3(c) | | 52,799 |
| Accounting fees—Note 3(c) | | 36,501 |
| Prospectus and shareholders’ reports | | 16,595 |
| Legal fees | | 12,649 |
| Interest expense—Note 2 | | 530 |
| Loan commitment fees—Note 2 | | 309 |
| Miscellaneous | | 19,101 |
| Total Expenses | | 888,353 |
| Less—reduction in investment advisory fee—Note 3(a) | | (45,955) |
| Less—reduction in fees due to earnings credits—Note 1(c) | | (20,586) |
| Less—reduction in accounting fees—Note 3(c) | | (10,753) |
| Less—reduction in Directors’ fees and expenses | | |
| due to deferred compensation—Note 3(d) | | (154,936) |
| Net Expenses | | 656,123 |
| Investment Income—Net | | 264,372 |
| |
|
| Realized and Unrealized Gain (Loss) on Investments—Note 4 ($): | | |
| Net realized gain (loss) on investments and foreign currency transactions | | (10,519,438) |
| Net realized gain (loss) on forward currency exchange contracts | | 19,847 |
| Net Realized Gain (Loss) | | (10,499,591) |
| Net unrealized appreciation (depreciation) on | | |
| investments and foreign currency transactions | | (15,734,669) |
| Net Realized and Unrealized Gain (Loss) on Investments | | (26,234,260) |
| Net (Decrease) in Net Assets Resulting from Operations | | (25,969,888) |
| |
| See notes to financial statements. | | |
16
STATEMENT OF CHANGES IN NET ASSETS
| | | Year Ended December 31, |
| | |
|
| | | 2008 | | 2007a |
| |
| |
|
| Operations ($): | | | | |
| Investment income (loss)—net | | 264,372 | | (102,598) |
| Net realized gain (loss) on investments | | (10,499,591) | | 11,135,759 |
| Net unrealized appreciation | | | | |
| (depreciation) on investments | | (15,734,669) | | (3,881,641) |
| Net Increase (Decrease) in Net Assets | | | | |
| Resulting from Operations | | (25,969,888) | | 7,151,520 |
| |
| |
|
| Capital Stock Transactions ($): | | | | |
| Net proceeds from shares sold: | | | | |
| Class A Shares | | 606,519 | | 724,777 |
| Class B Shares | | 62,845 | | 140,383 |
| Class C Shares | | 201,536 | | 415,442 |
| Class F Shares | | 1,581,492 | | 9,650,997 |
| Class I Shares | | 415,801 | | 868,350 |
| Class T Shares | | — | | 164,133 |
| Cost of shares redeemed: | | | | |
| Class A Shares | | (642,490) | | (611,856) |
| Class B Shares | | (278,119) | | (478,611) |
| Class C Shares | | (320,706) | | (112,362) |
| Class F Shares | | (8,449,911) | | (13,444,416) |
| Class I Shares | | (346,366) | | (2,093,396) |
| Class T Shares | | (10) | | (75,238) |
| Increase (Decrease) in Net Assets | | | | |
| from Capital Stock Transactions | | (7,169,409) | | (4,851,797) |
| Total Increase (Decrease) in Net Assets | | (33,139,297) | | 2,299,723 |
| |
| |
|
| Net Assets ($): | | | | |
| Beginning of Period | | 61,670,105 | | 59,370,382 |
| End of Period | | 28,530,808 | | 61,670,105 |
| Undistributed (distributions in | | | | |
| excess of) investment income—net | | 167,721 | | (64,909) |
The Fund 17
STATEMENT OF CHANGES IN NET ASSETS (continued)
| | | Year Ended December 31, |
| | |
|
| | | 2008 | | 2007a |
| |
| |
|
| Capital Share Transactions: | | | | |
| Class Ab | | | | |
| Shares sold | | 37,762 | | 39,153 |
| Shares redeemed | | (40,857) | | (33,766) |
| Net Increase (Decrease) in Shares Outstanding | | (3,095) | | 5,387 |
| |
| |
|
| Class Bb | | | | |
| Shares sold | | 4,102 | | 7,967 |
| Shares redeemed | | (18,494) | | (28,571) |
| Net Increase (Decrease) in Shares Outstanding | | (14,392) | | (20,604) |
| |
| |
|
| Class C | | | | |
| Shares sold | | 13,990 | | 24,153 |
| Shares redeemed | | (21,895) | | (6,627) |
| Net Increase (Decrease) in Shares Outstanding | | (7,905) | | 17,526 |
| |
| |
|
| Class F | | | | |
| Shares sold | | 97,593 | | 558,552 |
| Shares redeemed | | (559,777) | | (744,216) |
| Net Increase (Decrease) in Shares Outstanding | | (462,184) | | (185,664) |
| |
| |
|
| Class I | | | | |
| Shares sold | | 27,039 | | 45,705 |
| Shares redeemed | | (20,393) | | (108,088) |
| Net Increase (Decrease) in Shares Outstanding | | 6,646 | | (62,383) |
| |
| |
|
| Class T | | | | |
| Shares sold | | — | | 9,814 |
| Shares redeemed | | (2) | | (4,088) |
| Net Increase (Decrease) in Shares Outstanding | | (2) | | 5,726 |
| a | | Effective June 1, 2007, Class R shares were redesignated as Class I shares. |
| b | | During the period ended December 31, 2008, 13,569 Class B shares representing $203,132, were automatically |
| | | converted to 12,684 Class A shares and during the period ended December 31, 2007, 14,394 Class B shares |
| | | representing $242,292 were automatically converted to 13,585 Class A shares. |
| See notes to financial statements. |
18
FINANCIAL HIGHLIGHTS
The following tables describe the performance for each share class for the fiscal periods indicated.All information (except portfolio turnover rate) reflects financial results for a single fund share.Total return shows how much your investment in the fund would have increased (or decreased) during each period, assuming you had reinvested all dividends and distributions.These figures have been derived from the fund’s financial statements.
| | | | | Year Ended December 31, | | |
| | |
| |
| |
|
| Class A Shares | | 2008 | | 2007 | | 2006 | | 2005 | | 2004 |
| |
| |
| |
| |
| |
|
| Per Share Data ($): | | | | | | | | | | |
| Net asset value, beginning of period | | 18.86 | | 16.91 | | 14.21 | | 12.82 | | 11.38 |
| Investment Operations: | | | | | | | | | | |
| Investment income (loss)—net | | .05a | | (.05)a | | (.06)a | | (.02)a | | (.21) |
| Net realized and unrealized | | | | | | | | | | |
| gain (loss) on investments | | (8.71) | | 2.00 | | 2.76 | | 1.41 | | 1.65 |
| Total from Investment Operations | | (8.66) | | 1.95 | | 2.70 | | 1.39 | | 1.44 |
| Net asset value, end of period | | 10.20 | | 18.86 | | 16.91 | | 14.21 | | 12.82 |
| |
| |
| |
| |
| |
|
| Total Return (%)b | | (45.94) | | 11.41 | | 19.07 | | 10.84 | | 12.65 |
| |
| |
| |
| |
| |
|
| Ratios/Supplemental Data (%): | | | | | | | | | | |
| Ratio of total expenses | | | | | | | | | | |
| to average net assets | | 2.13 | | 1.94 | | 1.97 | | 1.98 | | 1.83 |
| Ratio of net expenses | | | | | | | | | | |
| to average net assets | | 1.62 | | 1.86 | | 1.93 | | 1.92 | | 1.81 |
| Ratio of net investment income | | | | | | | | | | |
| (loss) to average net assets | | .35 | | (.28) | | (.39) | | (.19) | | (.18) |
| Portfolio Turnover Rate | | 161 | | 117 | | 114 | | 120 | | 130 |
| |
| |
| |
| |
| |
|
| Net Assets, end of period ($ x 1,000) | | 1,016 | | 1,938 | | 1,647 | | 619 | | 519 |
| a | | Based on average shares outstanding at each month end. |
| b | | Exclusive of sales charge. |
| See notes to financial statements. |
The Fund 19
| | FINANCIAL HIGHLIGHTS (continued) |
| | | | | Year Ended December 31, | | |
| | |
| |
| |
|
| Class B Shares | | 2008 | | 2007 | | 2006 | | 2005 | | 2004 |
| |
| |
| |
| |
| |
|
| Per Share Data ($): | | | | | | | | | | |
| Net asset value, beginning of period | | 17.69 | | 16.00 | | 13.58 | | 12.33 | | 11.02 |
| Investment Operations: | | | | | | | | | | |
| Investment (loss)—net | | (.08)a | | (.18)a | | (.16)a | | (.11)a | | (.09) |
| Net realized and unrealized | | | | | | | | | | |
| gain (loss) on investments | | (8.13) | | 1.87 | | 2.58 | | 1.36 | | 1.40 |
| Total from Investment Operations | | (8.21) | | 1.69 | | 2.42 | | 1.25 | | 1.31 |
| Net asset value, end of period | | 9.48 | | 17.69 | | 16.00 | | 13.58 | | 12.33 |
| |
| |
| |
| |
| |
|
| Total Return (%)b | | (46.47) | | 10.49 | | 17.89 | | 10.14 | | 11.89 |
| |
| |
| |
| |
| |
|
| Ratios/Supplemental Data (%): | | | | | | | | | | |
| Ratio of total expenses | | | | | | | | | | |
| to average net assets | | 3.10 | | 2.75 | | 2.84 | | 2.72 | | 2.54 |
| Ratio of net expenses | | | | | | | | | | |
| to average net assets | | 2.59 | | 2.68 | | 2.79 | | 2.66 | | 2.52 |
| Ratio of net investment (loss) | | | | | | | | | | |
| to average net assets | | (.60) | | (1.09) | | (1.13) | | (.93) | | (.87) |
| Portfolio Turnover Rate | | 161 | | 117 | | 114 | | 120 | | 130 |
| |
| |
| |
| |
| |
|
| Net Assets, end of period ($ x 1,000) | | 153 | | 541 | | 819 | | 1,803 | | 2,061 |
| a | | Based on average shares outstanding at each month end. |
| b | | Exclusive of sales charge. |
| See notes to financial statements. |
20
| | | | | Year Ended December 31, | | |
| | |
| |
| |
|
| Class C Shares | | 2008 | | 2007 | | 2006 | | 2005 | | 2004 |
| |
| |
| |
| |
| |
|
| Per Share Data ($): | | | | | | | | | | |
| Net asset value, beginning of period | | 17.38 | | 15.71 | | 13.31 | | 12.08 | | 10.81 |
| Investment Operations: | | | | | | | | | | |
| Investment (loss)—net | | (.06)a | | (.19)a | | (.15)a | | (.07)a | | (.20) |
| Net realized and unrealized | | | | | | | | | | |
| gain (loss) on investments | | (8.00) | | 1.86 | | 2.55 | | 1.30 | | 1.47 |
| Total from Investment Operations | | (8.06) | | 1.67 | | 2.40 | | 1.23 | | 1.27 |
| Net asset value, end of period | | 9.32 | | 17.38 | | 15.71 | | 13.31 | | 12.08 |
| |
| |
| |
| |
| |
|
| Total Return (%)b | | (46.38) | | 10.63 | | 18.03 | | 10.18 | | 11.75 |
| |
| |
| |
| |
| |
|
| Ratios/Supplemental Data (%): | | | | | | | | | | |
| Ratio of total expenses | | | | | | | | | | |
| to average net assets | | 2.93 | | 2.75 | | 2.76 | | 2.72 | | 2.62 |
| Ratio of net expenses | | | | | | | | | | |
| to average net assets | | 2.43 | | 2.63 | | 2.71 | | 2.66 | | 2.59 |
| Ratio of net investment (loss) | | | | | | | | | | |
| to average net assets | | (.41) | | (1.11) | | (1.10) | | (.93) | | (.97) |
| Portfolio Turnover Rate | | 161 | | 117 | | 114 | | 120 | | 130 |
| |
| |
| |
| |
| |
|
| Net Assets, end of period ($ x 1,000) | | 318 | | 730 | | 385 | | 308 | | 272 |
| a | | Based on average shares outstanding at each month end. |
| b | | Exclusive of sales charge. |
| See notes to financial statements. |
The Fund 21
| FINANCIAL HIGHLIGHTS (continued) |
| | | | | Year Ended December 31, | | |
| | |
| |
| |
|
| Class F Shares | | 2008 | | 2007 | | 2006 | | 2005 | | 2004 |
| |
| |
| |
| |
| |
|
| Per Share Data ($): | | | | | | | | | | |
| Net asset value, beginning of period | | 18.93 | | 16.96 | | 14.26 | | 12.86 | | 11.41 |
| Investment Operations: | | | | | | | | | | |
| Investment income (loss)—net | | .09a | | (.03)a | | (.05)a | | (.02)a | | (.21) |
| Net realized and unrealized | | | | | | | | | | |
| gain (loss) on investments | | (8.75) | | 2.00 | | 2.75 | | 1.42 | | 1.66 |
| Total from Investment Operations | | (8.66) | | 1.97 | | 2.70 | | 1.40 | | 1.45 |
| Net asset value, end of period | | 10.27 | | 18.93 | | 16.96 | | 14.26 | | 12.86 |
| |
| |
| |
| |
| |
|
| Total Return (%) | | (45.75) | | 11.62 | | 18.93 | | 10.89 | | 12.71 |
| |
| |
| |
| |
| |
|
| Ratios/Supplemental Data (%): | | | | | | | | | | |
| Ratio of total expenses | | | | | | | | | | |
| to average net assets | | 1.90 | | 1.80 | | 2.03 | | 1.96 | | 1.80 |
| Ratio of net expenses | | | | | | | | | | |
| to average net assets | | 1.40 | | 1.72 | | 1.98 | | 1.91 | | 1.77 |
| Ratio of net investment income | | | | | | | | | | |
| (loss) to average net assets | | .60 | | (.14) | | (.38) | | (.17) | | (.13) |
| Portfolio Turnover Rate | | 161 | | 117 | | 114 | | 120 | | 130 |
| |
| |
| |
| |
| |
|
| Net Assets, end of period ($ x 1,000) | | 26,151 | | 56,943 | | 54,158 | | 53,184 | | 61,038 |
| |
| a Based on average shares outstanding at each month end. | | | | | | | | |
| See notes to financial statements. | | | | | | | | | | |
22
| | | | | Year Ended December 31, | | |
| | |
| |
| |
|
| Class I Shares | | 2008 | | 2007a | | 2006 | | 2005 | | 2004 |
| |
| |
| |
| |
| |
|
| Per Share Data ($): | | | | | | | | | | |
| Net asset value, beginning of period | | 19.60 | | 17.54 | | 14.69 | | 13.13 | | 11.60 |
| Investment Operations: | | | | | | | | | | |
| Investment income (loss)—net | | .10b | | (.01)b | | .01b | | .05b | | .03 |
| Net realized and unrealized | | | | | | | | | | |
| gain (loss) on investments | | (9.08) | | 2.07 | | 2.84 | | 1.51 | | 1.50 |
| Total from Investment Operations | | (8.98) | | 2.06 | | 2.85 | | 1.56 | | 1.53 |
| Net asset value, end of period | | 10.62 | | 19.60 | | 17.54 | | 14.69 | | 13.13 |
| |
| |
| |
| |
| |
|
| Total Return (%) | | (45.87) | | 11.75 | | 19.40 | | 11.88 | | 13.19 |
| |
| |
| |
| |
| |
|
| Ratios/Supplemental Data (%): | | | | | | | | | | |
| Ratio of total expenses | | | | | | | | | | |
| to average net assets | | 1.86 | | 1.69 | | 1.62 | | 1.47 | | 1.39 |
| Ratio of net expenses | | | | | | | | | | |
| to average net assets | | 1.36 | | 1.60 | | 1.58 | | 1.44 | | 1.37 |
| Ratio of net investment income | | | | | | | | | | |
| (loss) to average net assets | | .63 | | (.04) | | .02 | | .35 | | .28 |
| Portfolio Turnover Rate | | 161 | | 117 | | 114 | | 120 | | 130 |
| |
| |
| |
| |
| |
|
| Net Assets, end of period ($ x 1,000) | | 823 | | 1,389 | | 2,337 | | 1,701 | | 24,665 |
| a | | Effective June 1, 2007, Class R shares were redesignated as Class I shares. |
| b | | Based on average shares outstanding at each month end. |
| See notes to financial statements. |
The Fund 23
| | FINANCIAL HIGHLIGHTS (continued) |
| | | | | Year Ended December 31, | | |
| | |
| |
| |
|
| Class T Shares | | 2008 | | 2007 | | 2006 | | 2005 | | 2004 |
| |
| |
| |
| |
| |
|
| Per Share Data ($): | | | | | | | | | | |
| Net asset value, beginning of period | | 17.56 | | 15.79 | | 13.31 | | 12.05 | | 10.73 |
| Investment Operations: | | | | | | | | | | |
| Investment income (loss)—net | | .03a | | (.10)a | | (.08)a | | (.07)a | | (.36) |
| Net realized and unrealized | | | | | | | | | | |
| gain (loss) on investments | | (8.11) | | 1.87 | | 2.56 | | 1.33 | | 1.68 |
| Total from Investment Operations | | (8.08) | | 1.77 | | 2.48 | | 1.26 | | 1.32 |
| Net asset value, end of period | | 9.48 | | 17.56 | | 15.79 | | 13.31 | | 12.05 |
| |
| |
| |
| |
| |
|
| Total Return (%)b | | (46.01) | | 11.21 | | 18.63 | | 10.46 | | 12.30 |
| |
| |
| |
| |
| |
|
| Ratios/Supplemental Data (%): | | | | | | | | | | |
| Ratio of total expenses | | | | | | | | | | |
| to average net assets | | 2.30 | | 2.11 | | 2.23 | | 2.35 | | 2.16 |
| Ratio of net expenses | | | | | | | | | | |
| to average net assets | | 1.80 | | 2.02 | | 2.19 | | 2.30 | | 2.14 |
| Ratio of net investment income | | | | | | | | | | |
| (loss) to average net assets | | .19 | | (.55) | | (.57) | | (.56) | | (.50) |
| Portfolio Turnover Rate | | 161 | | 117 | | 114 | | 120 | | 130 |
| |
| |
| |
| |
| |
|
| Net Assets, end of period ($ x 1,000) | | 69 | | 129 | | 25 | | 30 | | 54 |
| a | | Based on average shares outstanding at each month end. |
| b | | Exclusive of sales charge. |
| See notes to financial statements. |
24
NOTES TO FINANCIAL STATEMENTS
NOTE 1—Significant Accounting Policies:
Dreyfus Global Growth Fund (the “fund”) is a separate diversified series of Dreyfus Funds, Inc. (the “Company”), which is registered under the Investment Company Act of 1940, as amended (the “Act”), as an open-end management investment company and operates as a series company currently offering five series, including the fund.The fund’s investment objective is to seek long-term growth of capital through investments in foreign and U.S. companies. Founders Asset Management LLC (“Founders”) serves as the fund’s investment adviser. Founders is an indirect, wholly-owned subsidiary of The Bank of New York Mellon Corporation (“BNY Mellon”).
At a meeting of the Company’s Board of Directors held on September 22, 2008, the Board approved, effective December 1, 2008, a proposal to change the names of the Company and fund from “Dreyfus Founders Funds, Inc.” and “Dreyfus Founders Worldwide Growth Fund” to “Dreyfus Funds, Inc.” and “Dreyfus Global Growth Fund,” respectively.
Effective July 1, 2008, BNY Mellon reorganized and consolidated a number of its banking and trust company subsidiaries.As a result of the reorganization, any services previously provided to the fund by Mellon Bank, N.A. or Mellon Trust of New England, N.A. are now provided by The Bank of NewYork Mellon (formerly,The Bank of NewYork).
MBSC Securities Corporation (the “Distributor”), the direct owner of Founders and a wholly-owned subsidiary of The Dreyfus Corporation (“Dreyfus”), an affiliate of Founders, is the distributor of the fund’s shares. The fund is authorized to issue up to 550 million shares of Common Stock, par value $ .01 per share, in the following classes of shares: Class A, Class B, Class C, Class F, Class I and Class T. Class A and Class T shares are subject to a sales charge imposed at the time of purchase, although the shares may be purchased at net asset value (“NAV”) without a sales charge by certain categories of investors. Class B shares are subject to a contingent deferred sales charge (“CDSC”) imposed on Class B share redemptions made within six
The Fund 25
| NOTES TO FINANCIAL STATEMENTS (continued) |
years of purchase and automatically convert to Class A shares after six years. The fund does not offer Class B shares, except in connection with dividend reinvestment and permitted exchanges of Class B shares. Class C shares are subject to a CDSC imposed on Class C shares redeemed within one year of purchase. Class F and Class I shares are sold at NAV per share. Class F shares are sold only to Class F grandfathered investors, and Class I shares are sold only to eligible institutional investors. Effective December 3, 2008, investments for new accounts were no longer permitted in Class T of the fund, except that participants in certain group retirement plans were able to open a new account in Class T of the fund, provided that the fund was established as an investment option under the plans before December 3, 2008. Other differences between the classes include the services offered to and the expenses borne by each class. Income and realized and unrealized gains or losses on investments are allocated to each class of shares based on its relative net assets.
Each class of the fund bears expenses incurred specifically on its behalf and, in addition, each class bears a portion of general expenses based on the relative net assets or the number of shareholder accounts of the class.The type of expense determines the allocation method.
The fund’s financial statements are prepared in accordance with U.S. generally accepted accounting principles, which may require the use of management estimates and assumptions. Actual results could differ from those estimates.
The fund enters into contracts that contain a variety of indemnifications. The fund’s maximum exposure under these arrangements is unknown.The fund does not anticipate recognizing any loss related to these arrangements.
(a) Portfolio valuation: A domestic equity security listed or traded on a securities exchange or in the over-the-counter market is valued at its last sales price on the exchange or market where it is principally traded
26
or, in the case of a security traded on NASDAQ, at its official closing price. Lacking any sales on that day, the security is valued at the current closing bid price, or by quotes from dealers making a market in the security if the closing bid price is not available.
A foreign equity security traded on a foreign exchange is valued at the last quoted official closing price available before the time when the fund’s assets are valued, or at the last quoted sales price if the exchange does not provide an official closing price or if the foreign market has not yet closed. Lacking any sales that day, the security is valued at the current closing bid price. NewYork closing exchange rates are used to convert foreign currencies to U.S. dollars.
A debt security with a remaining maturity greater than 60 days at the time of purchase is valued in accordance with the evaluated bid price supplied by a pricing service approved by the Company’s Board of Directors or, if such price is not available, at the mean between the highest bid and lowest asked quotations obtained from at least two securities dealers.A debt security with a remaining maturity of 60 days or less at the time of purchase is valued at amortized cost, which approximates market value, unless it is determined that amortized cost would not represent market value, in which case the securities would be marked to market.
Registered investment companies that are not traded on an exchange are valued at their NAV.
If market quotations or official closing prices are not readily available or are determined not to reflect accurately fair value, securities will be valued at their fair value as determined in good faith by the Company’s Board of Directors or pursuant to procedures approved by the Board of Directors.These situations may include instances where an event occurs after the close of the market on which a security is traded but before the fund calculates its NAV, and it is determined
The Fund 27
| NOTES TO FINANCIAL STATEMENTS (continued) |
that the event has materially affected the value of the security. Fair value of foreign equity securities may be determined with the assistance of a pricing service using calculations based on indices of domestic securities and other appropriate indicators, such as prices of relevant ADRs and futures contracts.
The fund adopted Statement of Financial Accounting Standards No. 157 “FairValue Measurements” (“FAS 157”). FAS 157 establishes an authoritative definition of fair value, sets out a framework for measuring fair value, and requires additional disclosures about fair value measurements.
Various inputs are used in determining the value of the fund’s investments relating to FAS 157.These inputs are summarized in the three broad levels listed below.
| | Level 1—quoted prices in active markets for identical securities.
Level 2—other significant observable inputs (including quoted
prices for similar securities, interest rates, prepayment speeds, credit
risk, etc.).
Level 3—significant unobservable inputs (including the fund’s own
assumptions in determining the fair value of investments). |
The inputs or methodology used for valuing securities are not necessarily an indication of the risk associated with investing in those securities.
The following is a summary of the inputs used as of December 31, 2008 in valuing the fund’s investments carried at fair value:
| | | Investments in | | Other Financial |
| Valuation Inputs | | Securities ($) | | Instruments ($)† |
| |
| |
|
| Level 1—Quoted Prices | | 24,533,344 | | 0 |
| Level 2—Other Significant | | | | |
| Observable Inputs | | 3,829,948 | | (10) |
| Level 3—Significant | | | | |
| Unobservable Inputs | | 0 | | 0 |
| Total | | 28,363,292 | | (10) |
| † | | Other financial instruments include derivative instruments, such as futures, forward currency |
| | | exchange contracts and swap contracts, which are valued at the unrealized appreciation |
| | | (depreciation) on the instrument and written options contracts which are shown at value. |
28
(b) Foreign securities and currency transactions: The fund normally will invest a significant portion of its assets in foreign securities. In the event the fund executes a foreign security transaction, the fund may enter into a foreign currency contract to settle the foreign security trans-action.The fund could be exposed to risk if counterparties are unable to meet the terms of the contracts or if the value of the currency changes unfavorably to the U.S. dollar.The resultant foreign currency gain or loss from the contract is recorded as foreign currency gain or loss and is presented as such in the Statement of Operations.
Investing in foreign markets may involve special risks and considerations not typically associated with investing in the U.S. These risks include revaluation of currencies, high rates of inflation, repatriation restrictions on income and capital, and adverse political and economic developments. Moreover, securities issued in these markets may be less liquid, subject to government ownership control and delayed settlements, and their prices may be more volatile than those of comparable securities in the U.S.
The accounting records of the fund are maintained in U.S. dollars.The market values of foreign securities, currency holdings and other assets and liabilities are translated into U.S. dollars based on the current exchange rates each business day. Purchases and sales of investment securities and income and expense items denominated in foreign currencies are translated into U.S. dollar amounts on the respective dates of such transactions.
The fund does not isolate that portion of the results of operations resulting from changes in foreign exchange rates on investments from the fluctuations arising from changes in market prices of securities held. Such fluctuations are included with net unrealized appreciation (depreciation) from investments and foreign currency transactions in the Statement of Operations.
The Fund 29
| NOTES TO FINANCIAL STATEMENTS (continued) |
Reported net realized foreign exchange gains or losses arise from sales of foreign currencies, currency gains or losses realized between the trade and settlement dates on securities transactions, and the difference between the amounts of dividends, interest, and foreign withholding taxes recorded on the fund’s books and the U.S. dollar equivalent of the amounts actually received or paid. Net unrealized appreciation or depreciation on investments and foreign currency translation arises from changes in the values of assets and liabilities, including investments in securities held at the date of the financial statements, resulting from changes in the exchange rates and changes in market prices of securities held.
(c) Securities transactions and investment income: Securities transactions are recorded on a trade date basis. Realized gains and losses from securities transactions are recorded on the identified cost basis. Dividend income is recognized on the ex-dividend date and interest income, including, where applicable, accretion of discount and amortization of premium on investments, is recognized on the accrual basis.
The fund has arrangements with the custodian and cash management bank whereby the fund may receive earnings credits when positive cash balances are maintained, which are used to offset custody and cash management fees. For financial reporting purposes, the fund includes net earnings credits as an expense offset in the Statement of Operations.
(d) Affiliated issuers: Investments in other investment companies advised by Founders or its affiliates are defined as “affiliated” in the Act.
(e) Dividends to shareholders: Dividends are recorded on the ex-dividend date. Dividends from investment income-net and dividends from net realized capital gains, if any, are normally declared and paid annually, but the fund may make distributions on a more frequent basis to comply with the distribution requirements of the Internal Revenue Code of 1986, as amended (the “Code”).To the extent that net realized capital gains can be offset by capital loss carryovers, it is the policy of
30
the fund not to distribute such gains. Income and capital gain distributions are determined in accordance with income tax regulations, which may differ from U.S. generally accepted accounting principles.
(f) Federal income taxes: No provision has been made for federal income taxes since it is the policy of the fund to continue to comply with the requirements of Subchapter M of the Code that are applicable to regulated investment companies and to make distributions of income and capital gains sufficient to relieve it from all income taxes.The fund is treated as a separate tax entity for federal income tax purposes.
As of and during the period ended December 31, 2008, the fund did not have any liabilities for any unrecognized tax positions. The fund recognizes interest and penalties, if any, related to unrecognized tax positions as income tax expense in the Statement of Operations. During the period, the fund did not incur any interest or penalties.
Each of the tax years in the four-year period ended December 31, 2008 remains subject to examination by the Internal Revenue Service and state taxing authorities.
At December 31, 2008, the components of accumulated earnings on a tax basis were as follows: undistributed ordinary income $23,677, accumulated capital losses $43,910,453 and unrealized depreciation $7,986,501. In addition, the fund had $5,893,958 of capital losses realized after October 31, 2008, which were deferred for tax purposes to the first day of the following fiscal year.
The accumulated capital loss carryover is available for federal income tax purposes to be applied against future net securities profits, if any, realized subsequent to December 31, 2008. If not applied, $14,296,069 of the carryover expires in fiscal 2009, $22,200,649 expires in fiscal 2010, $3,142,525 expires in fiscal 2011 and $4,271,210 expires in fiscal 2016.
The Fund 31
| NOTES TO FINANCIAL STATEMENTS (continued) |
During the period ended December 31, 2008, as a result of permanent book to tax differences, primarily due to the tax treatment for foreign currency transactions, the fund decreased accumulated undistributed investment income-net by $31,742 and increased accumulated net realized gain (loss) on investments by the same amount. Net assets and net asset value per share were not affected by this reclassification.
NOTE 2—Bank Line of Credit:
The Company has a line of credit arrangement (“LOC”) with State Street Bank and Trust Company, to be used for temporary or emergency purposes, primarily for financing redemption payments. The borrowings by each series of the Company are limited to the lesser of (a) $25 million, or (b) the lesser of 25% of the series’ total net assets or the maximum amount which the series is permitted to borrow pursuant to the prospectus, any law or any other agreement. Combined borrowings are subject to the $25 million cap on the total LOC. Each series agrees to pay annual fees and interest on the unpaid balance based on prevailing market rates as defined in the LOC.
The average daily amount of borrowings outstanding under the LOC during the period ended December 31, 2008, was approximately $13,700, with a related weighted average annualized interest rate of 3.86% .
NOTE 3—Investment Advisory Fee and Other Transactions With Affiliates:
(a) In accordance with an investment advisory agreement between the Company and Founders, the fund compensates Founders for its services as investment adviser by the payment of fees computed daily and paid monthly at the annual rate equal to a percentage of the average daily value of the fund’s net assets.The fee is 1% of the first $250 million of net assets, .80% of the next $250 million of net assets and .70% of net assets in excess of $500 million. For the period from January 1, 2008 through September 13, 2008, Founders waived 12.5% of its investment
32
advisory fee for the fund. This waiver ended on September 14, 2008, and on that date, the fund’s contractual investment advisory fee again became effective.The reduction in investment advisory fee amounted to $45,955 during the period ended December 31, 2008.
During the period ended December 31, 2008, the Distributor retained $210 and $18 from commissions earned on sales of the fund’s Class A and Class T shares, respectively, and $92 and $151 from CDSCs on redemptions of the fund’s Class B and Class C shares, respectively.
(b) Under a Distribution Plan (the “Class B, C and T Plan”) adopted pursuant to Rule 12b-1 under the Act, Class B, Class C and Class T shares pay the Distributor for distributing their shares at an annual rate of .75% of the value of the average daily net assets of Class B and Class C shares and .25% of the value of the average daily net assets of Class T shares. During the period ended December 31, 2008, Class B, Class C and Class T shares were charged $2,345, $3,991 and $257, respectively, pursuant to the Class B, C and T Plan.
The fund also has adopted a Distribution Plan pursuant to Rule 12b-1 under the Act applicable to its Class F shares (the “Class F Plan”). Under the Class F Plan, the fund is authorized to reimburse the Distributor for expenses paid for distributing or servicing its Class F shares at an annual rate of up to .25% of the value of the average daily net assets of the fund’s Class F shares. During the period ended December 31, 2008, Class F shares were charged $64,517 pursuant to the Class F Plan.
(c) Under the Shareholder Services Plan, Class A, Class B, Class C and Class T shares pay the Distributor at an annual rate of .25% of the value of their average daily net assets for the provision of certain services.The services provided may include personal services relating to shareholder accounts, such as answering shareholder inquiries regarding the fund and providing reports and other information, and services related to the maintenance of shareholder accounts.The Distributor may make pay-
The Fund 33
| NOTES TO FINANCIAL STATEMENTS (continued) |
ments to Service Agents (a securities dealer, financial institution or other industry professional) in respect of these services.The Distributor determines the amounts to be paid to Service Agents. During the period ended December 31, 2008, Class A, Class B, Class C and Class T shares were charged $3,814, $782, $1,330 and $257, respectively, pursuant to the Shareholder Services Plan.
The Company has a shareholder services agreement with the Distributor, whereby the fund has agreed to compensate the Distributor for providing certain shareholder servicing functions to holders of Class F shares. The fund paid the Distributor a monthly fee equal, on an annual basis, to $24.00 per Class F shareholder account considered to be an open account at any time during a given month. During the period ended December 31, 2008, Class F shares were charged $30,895 pursuant to this shareholder services agreement.
Dreyfus Transfer, Inc. (“DTI”), a wholly-owned subsidiary of Dreyfus, is the transfer and dividend disbursing agent for all of the fund’s share classes. The Distributor pays the transfer and dividend agent fees, other than out-of-pocket charges, for Class F only. During the period ended December 31, 2008, Class F shares were charged $104 for out-of-pocket transfer agent charges.
The fees charged by DTI with respect to the fund’s Class A, Class B, Class C, Class I and Class T shares are paid by the fund.These transfer agency fees, including both the per account fees paid to DTI and out-of-pocket charges, during the period ended December 31, 2008 were $5,896.
The fund compensates The Bank of New York Mellon, a subsidiary of BNY Mellon and an affiliate of Founders, under two cash management agreements for performing cash management services related to fund subscriptions and redemptions. During the period ended December 31, 2008, the fund was charged $7,126 for these services, which were partially offset by earnings credits pursuant to the cash management agreements.
34
The fund compensates The Bank of New York Mellon under a custody agreement for providing custodial services for the fund. During the period ended December 31, 2008, the fund was charged $52,799 for these services. These fees were at least partially offset by earnings credits pursuant to the custody agreement.
The fund has agreed to compensate Dreyfus for providing accounting services, administration, compliance monitoring, regulatory and shareholder reporting, as well as related facilities, equipment and clerical help.The fee is computed by applying the following rates, as applicable, to the domestic assets and foreign assets, with the proportions of domestic and foreign assets recalculated monthly, plus reasonable out-of-pocket expenses.
| On Assets in | | But Not | | | | |
| Excess of ($) | | Exceeding ($) | | Domestic Fee (%) | | Foreign Fee (%) |
| |
| |
| |
|
| 0 | | 500 million | | .06 | | .10 |
| 500 million | | 1 billion | | .04 | | .065 |
| 1 billion | | | | .02 | | .02 |
Dreyfus has contractually agreed in writing to waive any fees received for these services to the extent they exceed its costs in providing the services and a reasonable allocation of the costs incurred by Founders and its affiliates related to the support and oversight of these services. During the period ended December 31, 2008, Dreyfus waived $10,753.
The components of “Due to Founders Asset Management LLC and affiliates” in the Statement of Assets and Liabilities consist of: investment advisory fees $23,974, Rule 12b-1 distribution plan fees $4,795, shareholder services plan fees $13,817, custodian fees $21,770, compliance support fees $1,833, transfer agency per account fees $860 and accounting fees $1,851.
(d) Annual retainer fees and attendance fees for the Company’s Board of Directors are allocated to each series of the Company based on net assets. During the period ended December 31, 2008, the fund paid $20,869 in directors’ fees. The Company’s Board of Directors has adopted a deferred compensation plan for Company directors that
The Fund 35
| NOTES TO FINANCIAL STATEMENTS (continued) |
enables directors to elect to defer receipt of all or a portion of the annual compensation that they are entitled to receive from the Company. Under the plan, the compensation deferred is invested in shares of one or more of the Company’s series.The amount paid to the director under the plan will be determined based upon the performance of the selected series. The current value of these amounts is included in Other Assets and Directors’ Deferred Compensation in the Statement of Assets and Liabilities. Increases in the market value of the deferred compensation accounts are added to the Directors fees and expenses paid by the fund in the Directors fees and expenses in the Statement of Operations, and decreases in the market value of the accounts are subtracted from such fees. During the period ended December 31, 2008, depreciation in the value of the accounts totaled $175,805.The depreciation also is included in the net unrealized appreciation (depreciation) on investments in the Statement of Operations. Deferral of directors’ fees under the plan does not affect the net assets of the fund.
Certain officers of the Company are also officers and/or directors of Founders or its affiliates, which pay their compensation. However, the fund pays a portion of the cost of the services performed by the Company’s Chief Compliance Officer and her staff. During the period ended December 31, 2008, the fund was charged $1,833 for these services, which is included in miscellaneous expenses. The affairs of the fund, including services provided by Founders, are subject to the supervision and general oversight of the Company’s Board of Directors.
NOTE 4—Securities Transactions:
The aggregate amount of purchases and sales of investment securities, excluding short-term securities and forward currency exchange contracts, during the period ended December 31, 2008, amounted to $74,396,806 and $81,893,872, respectively.
The fund enters into forward currency exchange contracts in order to hedge its exposure to changes in foreign currency exchange rates on its foreign portfolio holdings and to settle foreign currency transac-
36
tions.When executing forward currency exchange contracts, the fund is obligated to buy or sell a foreign currency at a specified rate on a certain date in the future. With respect to sales of forward currency exchange contracts, the fund would incur a loss if the value of the contract increases between the date the forward contract is opened and the date the forward contract is closed.The fund realizes a gain if the value of the contract decreases between those dates. With respect to purchases of forward currency exchange contracts, the fund would incur a loss if the value of the contract decreases between the date the forward contract is opened and the date the forward contract is closed. The fund realizes a gain if the value of the contract increases between those dates. The fund is also exposed to credit risk associated with counterparty nonperformance on these forward currency exchange contracts, which is typically limited to the unrealized gain on each open contract. The following summarizes open forward currency exchange contracts at December 31, 2008:
| | | Foreign | | | | | | |
| Forward Currency | | Currency | | | | | | Unrealized |
| Exchange Contracts | | Amounts | | Proceeds ($) | | Value ($) (Depreciation) ($) |
| |
| |
| |
|
| Sales; | | | | | | | | |
| Euro, | | | | | | | | |
| expiring 1/2/2009 | | 25,947 | | 36,054 | | 36,064 | | (10) |
At December 31, 2008, the cost of investments for federal income tax purposes was $36,349,513; accordingly, accumulated net unrealized depreciation on investments was $7,986,221,consisting of $978,105 gross unrealized appreciation and $8,964,326 gross unrealized depreciation.
In March 2008, the Financial Accounting Standards Board released Statement of Financial Accounting Standards No. 161 “Disclosures about Derivative Instruments and Hedging Activities” (“FAS 161”). FAS 161 requires qualitative disclosures about objectives and strategies for using derivatives, quantitative disclosures about fair value amounts of gains and losses on derivative instruments and disclosures about credit-risk-related contingent features in derivative agreements. The
The Fund 37
| NOTES TO FINANCIAL STATEMENTS (continued) |
application of FAS 161 is required for fiscal years and interim periods beginning after November 15, 2008.At this time, management is evaluating the implications of FAS 161 and its impact on the financial statements and the accompanying notes has not yet been determined.
NOTE 5—Subsequent Event:
On February 4, 2009, the fund issued to each holder of its Class T shares, in exchange for said shares, Class A shares of the fund having an aggregate net asset value equal to the aggregate net asset value of the shareholder’s Class T shares. Subsequent investments in the fund’s Class A shares made by prior holders of the fund’s ClassT shares who received Class A shares of the fund in exchange for their Class T shares are subject to the front-end sales load schedule that was in effect for Class T shares at the time of the exchange. Otherwise, all other Class A share attributes will be in effect.
38
REPORT OF INDEPENDENT REGISTERED
PUBLIC ACCOUNTING FIRM |
| | Shareholders and Board of Directors
Dreyfus Global Growth Fund |
We have audited the accompanying statement of assets and liabilities, including the statement of investments, of Dreyfus Global Growth Fund (formerly Dreyfus FoundersWorldwide Growth Fund) (one of the series comprising Dreyfus Funds, Inc.), as of December 31, 2008, and the related statement of operations for the year then ended,and the statement of changes in net assets and financial highlights for each of the two years in the period then ended.These financial statements and financial highlights are the responsibility of the Fund’s management. Our responsibility is to express an opinion on these financial statements and financial highlights based on our audits. The financial highlights for the years ended December 31, 2006, 2005 and 2004 were audited by other auditors whose report dated February 23, 2007, expressed an unqualified opinion on such financial highlights.
We conducted our audits in accordance with the standards of the Public Company Accounting Oversight Board (United States).Those standards require that we plan and perform the audit to obtain reasonable assurance about whether the financial statements and financial highlights are free of material misstatement.We were not engaged to perform an audit of the Fund’s internal control over financial reporting. Our audits included consideration of internal control over financial reporting as a basis for designing audit procedures that are appropriate in the circumstances, but not for the purpose of expressing an opinion on the effectiveness of the Fund’s internal control over financial reporting. Accordingly, we express no such opinion.An audit also includes examining, on a test basis, evidence supporting the amounts and disclosures in the financial statements and financial highlights, assessing the accounting principles used and significant estimates made by management, and evaluating the overall financial statement presentation. Our procedures included confirmation of securities owned as of December 31, 2008 by correspondence with the custodian and others. We believe that our audits provide a reasonable basis for our opinion.
In our opinion, the 2008 and 2007 financial statements and financial highlights referred to above present fairly, in all material respects, the financial position of Dreyfus Global Growth Fund at December 31, 2008, the results of its operations for the year then ended, and the changes in its net assets and the financial highlights for each of the two years in the period then ended, in conformity with U.S. generally accepted accounting principles.
New York, New York
February 23, 2009 |
The Fund 39
FACTORS CONSIDERED IN RENEWING
THE ADVISORY AGREEMENT (Unaudited) |
At a meeting of the board of directors of Dreyfus Funds, Inc. (the “Funds” and, in reference to any one of the Funds’ portfolios, a “Fund”) held on August 20 and 21, 2008, the Funds’ directors unanimously approved the continuation of the Investment Advisory Agreement (“management agreement”) between each of the Funds and Founders Asset Management LLC, the Funds’ investment adviser (“Founders”), for a one-year term ending August 31, 2009.The board of directors of the Funds (“board”) is comprised entirely of individuals who have no affiliation with Founders or any affiliates of Founders (the “directors”).
Prior to the directors’ August 2008 meeting, Founders had provided the directors with extensive materials related to the renewal of the management agreement, including performance and expense information for other investment companies with similar investment objectives to each Fund derived from data compiled by Lipper Inc., an independent third party (“Lipper”).
During their meeting, the directors discussed the proposed continuance of the management agreement with the senior management personnel of Founders. At the conclusion of these discussions, the directors and their independent counsel met in a private session at which no representatives of Founders were present, to continue their discussion of continuance of the agreement. In determining to continue the management agreement, the directors considered all factors which they believed to be relevant, including the following:
Nature, Extent and Quality of Services Provided and to be Provided by Founders
The directors recognized that they have had the opportunity to evaluate the investment and non-investment related services which Founders and its affiliates provide to the Funds primarily through their quarterly review of all of the operations of the Funds during Fund committee and Fund board meetings held throughout the past twelve months. At each such meeting, extensive discussions of Fund opera-
40
tions are held with senior management personnel of Founders and a large volume of documentation with respect to these operations is provided to and reviewed by the directors. Such discussions and documentation afford the directors the continual opportunity to evaluate the nature, extent, and quality of the services provided by Founders and its affiliates to the Funds.
The directors were satisfied that Founders is managing the investment of the assets of the Funds in accordance with each Fund’s respective investment objective, policies and restrictions, subject to the directors’ overall supervision.
The directors considered that Founders also provides many non-investment related services to the Funds in fulfilling its responsibilities under the management agreement.
Following their discussion and review, the directors reached the following conclusions:
- That the breadth and quality of investment advisory and other ser- vices being provided to the Funds are satisfactory, as evidenced in part by the performance records of the Funds, to which the direc- tors gave significant attention as indicated below; and
- That the directors are satisfied not only with the research, long-term portfolio management, and trading services being provided to the Funds, but also recognize that Founders or its affiliates have pro- vided the highest quality accounting, compliance and regulatory, administrative, underwriting, custody, shareholder, transfer agent and cash management services to the Funds, while charging fair, reason- able and competitive fees.
Investment Performance
On a quarterly basis, the directors hold meetings with representatives of the portfolio management team for each Fund (usually a portfolio manager), during which each representative reviews, among other
The Fund 41
FACTORS CONSIDERED IN RENEWING THE
ADVISORY AGREEMENT (Unaudited) (continued) |
items, performance information, attribution analyses, and the portfolio manager’s investment outlook. The directors also receive written monthly and quarterly performance information for each Fund. The written quarterly reports included comparisons of each Fund’s performance with its respective Lipper category and one or more benchmark indexes, as well as a comparable exchange-traded fund, for the most recent quarter and one-, three-, five-, and ten-year periods, as well as for the portfolio manager’s tenure.
In conjunction with their consideration of renewal of the management agreement, the directors received a more detailed performance report about each Fund from Lipper.These reports compared each Fund’s performance to both a relatively small group of similar funds selected by Lipper (the “Lipper performance group”), as well as to all funds in the applicable Lipper category (the “Lipper performance universe”).
The performance of Global Growth Fund’s Class F shares placed in the fourth quintile of its Lipper performance group and in the third quin-tile of its Lipper global large-cap growth fund performance universe for the one-year period ended December 31, 2007, placed in the third and second quintiles, respectively, of its Lipper performance group for the three- and five-year periods ended December 31, 2007, and placed in the second and third quintiles, respectively, of its Lipper performance universe for these three- and five-year periods. The Fund’s Class F shares underperformed the MSCI World Growth Index for the one-and three-year periods ended June 30, 2008, but outperformed that index for the five-year period then ended. In addition, the Fund’s Class F shares outperformed the MSCI World Index for the one-, three- and five-year periods ended June 30, 2008.The directors deemed these relative performance results to be satisfactory, but stressed the importance to Founders of the need for the Fund to continue to seek to improve the Fund’s performance record.
42
After consideration of all relevant information and data, the directors concluded that although past performance cannot be a guaranty of future performance, each Fund and its shareholders would continue to benefit from Founders’ investment management of the Fund. The directors further determined:
- That although certain of the Funds have experienced performance difficulties, Founders has focused its efforts upon improving the per- formance records of the Funds and will continue to seek improve- ment; and
- That the materials provided by Lipper demonstrated that most of the Funds maintained satisfactory long-term performance quintile rankings in their respective comparison universes, with three of five Funds placing in the top three quintiles of their respective Lipper performance universes for the three-year period ended December 31, 2007, and four of five Funds placing in the top three quintiles of their respective Lipper performance universes for the five-year period ended December 31, 2007.
Costs of the Services to be Provided and Profits to be
Realized by Founders and Its Affiliates from Founders’
Relationship With the Funds |
The directors recognized that on a quarterly basis, they received information with respect to each Fund’s expenses. The directors carefully reviewed and discussed the expense ratios for all classes of shares of each Fund at each of their quarterly meetings throughout the year.
In conjunction with their annual consideration of renewal of the Funds’ management agreement and other service arrangements, the directors received detailed information from Lipper which compared each Fund’s management fees and other expenses with those of a group of similar funds selected by Lipper (the “Lipper expense
The Fund 43
FACTORS CONSIDERED IN RENEWING THE
ADVISORY AGREEMENT (Unaudited) (continued) |
group”), as well as summary information comparing each Fund’s management fees and expenses with those of the funds in its Lipper performance universe with load structures similar to that of the Funds (the “Lipper expense universe”).
The directors noted that for the period ended December 31, 2007, Global Growth Fund’s management fees ranked in the fourth quintile of its Lipper expense group, with the Fund’s fees the ninth lowest of 12 “peer funds.” The Fund’s contractual management fees at a common asset level were determined by Lipper to be lower than three of the 12 funds in its group. The Fund’s management fees were in the fourth quintile of its Lipper expense universe.
The directors also considered information provided by Lipper with respect to the profitability of the investment management activities conducted by a number of publicly-held corporations. Lipper also prepared an analysis providing detailed information with respect to the types of services rendered to various mutual fund complexes under their respective investment advisory contracts, including the services provided by Founders to the Funds under the management agreement.
The directors had been provided with extensive materials with respect to the profitability derived by Founders from providing investment advisory services to the Funds as a group and to each Fund individually.
The directors further considered certain indirect benefits received by Founders and its affiliates as a result of Founders’ provision of investment advisory services to the Funds.These included the following:
- Since Founders manages a non-Fund account in a style that is sim- ilar to that used for one of the Funds (and for a portion of another Fund), and employees of Founders manage other non-Fund accounts in their capacities as employees of the affiliates, Founders and its affiliates realize efficiencies in performing the portfolio management, trading and operational functions related to those non-Fund accounts;
44
- The Funds’ brokerage transactions may be executed with brokers that provide research and brokerage services to Founders and its affiliates. These research and brokerage services may be useful to Founders and its affiliates in providing investment advisory services to any of the clients they advise, including the Funds; and
- Affiliates of Founders receive various fees for providing accounting, underwriting, shareholder, transfer agency, custody and cash man- agement services to the Funds.
After deliberation and discussion of Fund fees and expenses, the directors determined:
- That upon review of the advisory fee structures of the Funds in comparison with the competitive expense groups and expense uni- verses selected by Lipper, the levels of investment advisory fees paid by the Funds were deemed to be competitive;
- That the expense ratios of the Funds are competitive and that Founders continually reviews each Fund’s total expense ratio in an effort to maintain Fund expense ratios at reasonable and competi- tive levels;
- That three of the five Funds’ expense ratios decreased or remained substantially the same for all or most of their share classes in 2007 as compared to those experienced in 2006; and
- That the comparative fee and expense information included in the materials provided by Lipper supports the determination that the advisory and other fees payable by the Funds to Founders and its affiliates are essentially fees which would be similar to those that would have resulted solely from “arm’s-length” bargaining.
With respect to profitability to Founders, the directors reviewed the adviser profitability analysis provided by Lipper, which demonstrated that Founders’ 2007 profitability from providing management services to the Funds was reasonable in comparison to the entities included in the Lipper analysis.
The Fund 45
FACTORS CONSIDERED IN RENEWING THE
ADVISORY AGREEMENT (Unaudited) (continued) |
The directors were also advised by independent counsel of the profitability percentage ranges which court cases have found acceptable and determined that Founders’ profitability percentage for providing management services to the Funds was reasonable.
The directors concluded that Founders’ profits from providing management services to the Funds were reasonable in relationship to the overall services which Founders provides.
Economies of Scale
The directors reviewed information provided by Founders which summarized the extent, if any, that both Founders and the Funds would achieve certain economies of scale if the assets of the Funds were to increase.
After review and discussion, the directors considered the extent to which economies of scale and common management are shared with each Fund, including the economies that would be realized from the growth of each Fund’s assets. After such consideration, the directors determined that all of the Funds have structured breakpoints in their advisory fees, which result in fee reductions as the assets of each Fund reach defined levels, and that such fee reductions, when implemented, would benefit all of the applicable Fund’s shareholders through decreases in the Fund’s expense ratio.
Dedication to Regulatory Requirements and Restrictions
An important factor in the directors’ consideration of renewal of the Funds’ management agreement with Founders included the directors’ recognition of the dedication by Founders of stringent adherence to regulatory requirements and restrictions.The directors determined that Founders is dedicated to compliance with all applicable rules and regulations and that the systems of controls which are in place to ensure that the service providers to the Funds, including Founders, and the Funds themselves, maintain strict adherence to the law are excellent.
46
Overall Conclusions
The directors determined that they are generally satisfied with the performance of the Funds and with the quality of the advisory and other services being provided by Founders and its affiliates to the Funds. The directors recognized that efforts are being and will continue to be made to improve the Fund’s performance and to maintain Fund expense ratios at reasonable and competitive levels.
The directors concluded that continuation of the current management agreement between each Fund and Founders, which would enable each Fund to continue to receive investment advisory services from Founders, is in the best interests of each Fund and its shareholders, the services to be performed under the management agreement are services required for the operations of the Funds, Founders has provided satisfactory investment management services to the Funds in the past, and the fees for the management services which Founders will perform will be within the range of what would have been negotiated at arm’s length in light of the circumstances.
The Fund 47
YOUR BOARD REPRESENTATIVES (Unaudited)
The Board of Directors of the Company oversees the Company’s five series portfolios (the “Funds”). The business and affairs of the Company are managed under the direction of the Board.The directors serving on the Board perform their responsibilities in the manner which they reasonably believe to be in the best interests of the Funds and their shareholders.
All of the directors, as listed below, are independent directors.They are not affiliated with the Fund’s adviser, its parent company, or its affiliates. The directors have no official term of office and generally serve until they retire (normally at age 75, but subject to extension to age 80), resign, or are not re-elected. As you can see from their backgrounds, the directors have broad experience as active or former business and community leaders.
Directors
Alan S. Danson, 69.Year elected to the Board: 1991
Board Chairman.Private investor.Formerly,President and Director,D.H.Management, Inc., the general partner of a limited partnership with technology company holdings (1996 to 2003). Director, Gore Range Natural Science School and The Les Streeter Program, Inc., both of which are non-profit organizations.
Robert P. Mastrovita, 64.Year elected to the Board: 1998
Private investor. Chairman of a private charitable foundation (1997 to present). Formerly, Chairman and Director, Hagler, Mastrovita & Hewitt, Inc., a registered investment adviser (1982 to 1997). Member, Boston Society of Security Analysts. Trustee, Partridge Academy. Director, King Caesar Foundation.
Trygve E. Myhren, 72.Year elected to the Board: 1996
President, Myhren Media, Inc., a firm that invests in and advises media, telecommunications, Internet and software companies. Special Limited Partner and member of Investment Committee, Megunticook Funds, a venture capital firm (1998 to present). Director, AdPay, Inc. Trustee, Executive Committee and Chairman of Faculty Education Affairs Committee, the University of Denver.Trustee, Denver Art Museum. Member, Colorado FORUM and Cable Television Hall of Fame. Formerly, President (1990 to 1996) and Director (1992 to 2001) of the Providence Journal Company, a diversified media and communications company. Formerly, Chairman and Chief Executive Officer of American Television and Communications Corporation (now
48
Time Warner Cable) (1981 to 1988). Formerly, Chairman of the National Cable Television Association (1986-1987). U.S. Chief of Mission, 2006 Paralympic Games, Torino/Sestrierre, Italy.
George W. Phillips, 70.Year elected to the Board: 1998
Retired.Vice Chairman of the Board and Chairman of the Investment Committee, Children’s Medical Center of Boston. Formerly, President and Chief Executive Officer (1992 to 1997) and Director (1992 to 2002) of Warren Bancorp, Inc. Formerly, President, Chief Executive Officer and Director of Warren Five Cents Savings Bank (1992 to 1997).
Martha A. Solis-Turner, 48.Year elected to the Board: 2005
Formerly, Telecommunications Director, Wholesale Markets (1995 to 2001), and Manager (1990 to 1995), Qwest Communications International Inc. Formerly, Board member and Treasurer, Mile High Montessori Early Learning Centers (2002 to 2008), Board member (1995 to 2004) and Vice President (2002 to 2004), Curtis Park Community Center, both of which are non-profit organizations.
Principal Officers
J. David Officer, 60. President and Principal Executive Officer of the Funds since 2007. Chairman, President and Chief Executive Officer of Founders since 2008. Chief Operating Officer,Vice Chairman and a Director of Dreyfus, and an officer of 77 investment companies (comprised of 180 portfolios) managed by Dreyfus. He has been an employee of Dreyfus since 1998.
Kenneth R. Christoffersen, 53. Vice President of the Funds since 2008, and Secretary since 2000 (and from 1996 to 1998). Founders’ Senior Vice President -Legal, General Counsel and Secretary. Assistant Secretary of the Distributor since 2003. Employed by Founders and its predecessor company since 1996.
Steven M. Anderson, 43.Treasurer and Principal Financial and Accounting Officer of the Funds since 2007.Vice President,BNY Mellon Asset Management (since 2003). Vice President, Treasurer and Chief Financial Officer, Mellon Optima L/S Strategy Fund, LLC (since 2005). Treasurer and Chief Financial Officer BNY/IVY Multi-Strategy Hedge Fund, LLC (since 2008). Formerly,Vice President (1999 to 2008), Treasurer and Chief Financial Officer of Mellon Institutional Funds Investment Trust (2002 to 2008).AssistantVice President and Mutual Funds Controller,Standish Mellon Asset Management Company, LLC (2000 to 2003).
The Fund 49
YOUR BOARD REPRESENTATIVES (Unaudited) (continued)
Janelle E. Belcher, 50. Chief Compliance Officer of the Funds since 2004. Founders’ Vice President - Compliance since 2002. Formerly, Founders’ Manager of Compliance (2000 to 2002) and Securities Compliance Examiner, Staff Accountant and Team Leader for the U.S. Securities and Exchange Commission (1990 to 2000).
Robert S. Robol, 44. Assistant Treasurer since 2006. Senior Accounting Manager -Taxable Fixed Income Funds of Dreyfus, and an officer of 78 investment companies (comprised of 201 portfolios) managed by Dreyfus. Employed by Dreyfus since 1988.
Robert Salviolo, 41. Assistant Treasurer since 2007. Senior Accounting Manager -Foreign Equity Funds of Dreyfus, and an officer of 78 investment companies (comprised of 201 portfolios) managed by Dreyfus. Employed by Dreyfus since 1989.
Robert Svagna, 41. Assistant Treasurer since 2006. Senior Accounting Manager -Equity Funds of Dreyfus, and an officer of 78 investment companies (comprised of 201 portfolios) managed by Dreyfus. Employed by Dreyfus since 1990.
William G. Germenis, 38. Anti-Money Laundering Compliance Officer (“AMLCO”) for the Class A, Class B, Class C and Class I shares of the Funds since 2002 and for the Class F shares of the Funds since 2003.Vice President and AMLCO of the Distributor and AMLCO of 74 investment companies (comprised of 197 portfolios) managed by Dreyfus. Employed by the Distributor since 1998.
The directors and officers may be contacted at Founders’ address appearing on the back cover, except for Messrs. Officer, Robol, Salviolo, Svagna and Germenis, who can be contacted at The Dreyfus Corporation, 200 Park Avenue, NewYork, NewYork 10166, and Mr. Anderson, who can be contacted at BNY Mellon Asset Management, One Boston Place, Boston, Massachusetts 02108.Additional information about the Company’s directors is available in the Statement of Additional Information, which can be obtained free of charge by calling 1-800-645-6561 (Class F shareholders) or 1-800-554-4611 (all other shareholders).
50
NOTE
For More Information
The fund files its complete schedule of portfolio holdings with the Securities and Exchange Commission (“SEC”) for the first and third quarters of each fiscal year on Form N-Q. The fund’s Forms N-Q are available on the SEC’s website at http://www.sec.gov and may be reviewed and copied at the SEC’s Public Reference Room in Washington, DC. Information on the operation of the Public Reference Room may be obtained by calling 1-800-SEC-0330.
A description of the policies and procedures that the fund uses to determine how to vote proxies relating to portfolio securities, and information regarding how the fund voted these proxies for the most recent 12-month period ended June 30 is available at http://www.dreyfus.com and on the SEC’s website at http://www.sec.gov.
The description of the policies and procedures is also available without charge, upon request, by calling 1-800-645-6561.
This report and the statements it contains are submitted for the general information
of our shareholders. The report is not authorized for distribution to prospective
investors unless preceded or accompanied by an effective prospectus. |

| © 2009 MBSC Securities Corporation |
| | Dreyfus
Mid-Cap Growth Fund |
| | ANNUAL REPORT December 31, 2008 |

Save time. Save paper. View your next shareholder report online as soon as it’s available. Log into www.dreyfus.com and sign up for Dreyfus eCommunications. It’s simple and only takes a few minutes.
The views expressed in this report reflect those of the portfolio manager only through the end of the period covered and do not necessarily represent the views of Dreyfus, Founders or any other person in our organization. Any such views are subject to change at any time based upon market or other conditions and we disclaim any responsibility to update such views. These views may not be relied on as investment advice and, because investment decisions for a Dreyfus fund are based on numerous factors, may not be relied on as an indication of trading intent on behalf of any Dreyfus fund.
| | Contents |
| |
| | THE FUND |
| |
| 2 | A Letter from the Chairman |
| |
| 3 | Discussion of Fund Performance |
| |
| 6 | Fund Performance |
| |
| 8 | Understanding Your Fund’s Expenses |
| |
| 8 | Comparing Your Fund’s Expenses With Those of Other Funds |
| |
| 9 | Statement of Investments |
| |
| 13 | Statement of Assets and Liabilities |
| |
| 14 | Statement of Operations |
| |
| 15 | Statement of Changes in Net Assets |
| |
| 18 | Financial Highlights |
| |
| 24 | Notes to Financial Statements |
| |
| 36 | Report of Independent Registered Public Accounting Firm |
| |
| 37 | Factors Considered in Renewing the Advisory Agreement |
| |
| 45 | Your Board Representatives |
| |
| | FOR MORE INFORMATION |
| |
| | Back Cover |
| |
Dreyfus
Mid-Cap Growth Fund |

A LETTER FROM THE CHAIRMAN
Dear Shareholder: |
We present to you this annual report for Dreyfus Mid-Cap Growth Fund, covering the 12-month period from January 1, 2008, through December 31, 2008.
2008 was the most difficult year in decades for the economy and stock market.A credit crunch that originated in 2007 in the U.S. sub-prime mortgage market exploded in mid-2008 into a global financial crisis, resulting in the failures of major financial institutions, a deep and prolonged recession and lower investment values across a broad range of asset classes. Governments and regulators throughout the world moved aggressively to curtail the damage, implementing unprecedented reductions of short-term interest rates, massive injections of liquidity into the banking system, government bailouts of struggling companies and plans for massive economic stimulus programs. After several years of strong relative returns, international stocks generally declined more sharply than their U.S. counterparts.
Although we expect the U.S. and global economies to remain weak until longstanding imbalances have worked their way out of the system, the financial markets currently appear to have priced in investors’ generally low expectations. In previous recessions, however, the markets have tended to anticipate economic improvement before it occurs, potentially leading to major rallies when few expected them. That’s why it makes sense to remain disciplined, maintain a long-term perspective and adopt a consistent asset allocation strategy that reflects one’s future goals and attitudes toward risk. As always, we urge you to consult with your financial advisor, who can recommend the course of action that is right for you.
For information about how the fund performed during the reporting period, as well as market perspectives, we have provided a Discussion of Fund Performance.
Thank you for your continued confidence and support.

J. David Officer
Chairman, President and Chief Executive Officer
Founders Asset Management LLC
January 15, 2009 |
2

DISCUSSION OF FUND PERFORMANCE
For the period of January 1, 2008, through December 31, 2008
Fund and Market Performance Overview
For the 12-month period ended December 31, 2008, Dreyfus Mid-Cap Growth Fund’s Class A shares produced a total return of –49.52%, Class B shares returned –49.75%, Class C shares returned –49.91%, Class F shares returned –49.30%, Class I shares returned –49.30% and Class T shares returned –49.66% .1 In comparison, the fund’s benchmark, the Russell Midcap Growth Index, produced a total return of –44.32% for the same period.2 An unprecedented financial crisis and a severe global economic slowdown contributed to steep declines in equity markets, including midcap stocks.This challenging investment environment weighed heavily on the fund, which produced lower returns than its benchmark primarily due to weakness among its industrial and consumer discretionary holdings.
The Fund’s Investment Approach
The fund seeks capital appreciation by emphasizing investments in the stocks of medium-size companies with favorable growth prospects.The fund also may invest in larger or smaller companies if, in our judgment, they represent better prospects for capital appreciation. We look for companies whose fundamental strengths suggest the potential for superior earnings growth over time.We go beyond Wall Street analysis and perform intensive qualitative and quantitative in-house research to determine whether companies meet our investment criteria.
Worldwide Economic Slowdown Takes Its Toll
The U.S. economy was pummeled by turmoil in the sub-prime mortgage sector, slowing consumer and business spending, rising unemployment, a collapsing housing market and skyrocketing commodities prices that reversed course mid-year. Both developed and emerging markets worldwide sustained heavy losses, leading most regional economies to follow the United States into a recession.
Industrials and Consumer Discretionary Sectors Lagged
One of the many casualties of 2008’s turbulent market environment was the idea that the forces of globalization had caused emerging overseas
The Fund 3
| DISCUSSION OF FUND PERFORMANCE (continued) |
economies to become less dependent on the United States and Europe for growth. The dramatic repudiation of this concept led to sharply lower valuations for stocks doing business in global markets, and was one of the forces behind the steep declines suffered by some of the fund’s industrial stocks. For example, restaurant supplier The Middleby Corporation and pump producer Flowserve declined sharply as orders from overseas economies slumped. Meanwhile, tighter lending standards stemming from the financial crisis undermined solar power equipment manufacturer Energy Conversion Devices, which depends heavily on project financing. GrafTech International, a supplier of graphite electronics to the steel industry, lost value as steel prices fell along with most other commodities and was sold during the reporting period. Despite our cautious approach to consumer-oriented companies during most of the reporting period, the fund’s selections of consumer discretionary stocks proved disappointing. Earnings of low-cost clothing manufacturer Gildan Activewear suffered from a double-digit decline in market share, which was compounded by the rising cost of cotton. Gains in parts of the information technology sector were more than offset by weakness among semiconductors manufacturers, including NVIDIA, MEMC Electronic Materials, Microsemi and Atmel, all of which stumbled as the deteriorating global economy dampened customer demand. In the materials sector, fertilizer producers, such as The Mosaic Company, also encountered earnings pressure when global demand waned. Our positions in MEMC, Microsemi and Mosaic were sold during the reporting period.
Notable laggards in other market sectors included BioMarin Pharmaceutical, which declined due to uncertainty regarding the sustainability of midcap pharmaceutical companies’ growth rates, and investment manager Janus Capital Group, which fell due to the volatile market environment. Janus was sold during the reporting period.
On the other hand, bright spots during 2008 included the traditionally defensive health care sector, where the fund enjoyed strong relative performance from specialty pharmaceutical company Alpharma, emergency care provider Emergency Medical Services and specialty healthcare equipment developer Masimo. Alpharma was sold during the reporting period.An underweighted position in the utilities sector,one of the worst performing sectors in the benchmark, also benefited the fund’s results compared to its benchmark. Despite weak performance during the second half of the year by oilfield services companies Weatherford
4
International and National Oilwell Varco, advantageous timing in the purchases and sales of other energy stocks—including exploration-and-production company Goodrich Petroleum and natural gas firm Chesapeake Energy—contributed positively to relative performance.The fund also held low-price retailer Family Dollar Stores, which benefited as cash-strapped consumers flocked to cheaper goods.Finally,the fund’s cash position also helped bolster its performance during the reporting period.
Monitoring Markets for Growth Opportunities
Currently muted earnings and growth expectations, damaged credit markets and cyclical reversals in once-skyrocketing industry groups have prompted us to refocus on companies that we believe represent the fund’s better growth prospects. More specifically, we anticipate that a sustained improvement in credit conditions may produce growth opportunities among fundamentally sound companies in the second half of the year, particularly among stocks that appear to have been punished more severely than warranted by their underlying business fundamentals. If lending begins to recover as 2009 unfolds, we may lean toward more credit-sensitive stocks, and we may increase the fund’s positions in companies likely to benefit from potentially stronger consumer spending.
January 15, 2009
On January 6, 2009, Fred A. Kuehndorf assumed portfolio management responsibilities for the fund. For more information about Mr. Kuehndorf, please see the fund’s prospectus or talk to your financial advisor.
Part of the fund’s recent performance is attributable to positive returns from its initial public offering (IPO) investments. There can be no guarantee that IPOs will have or continue to have a positive effect on fund performance.
Midsize companies carry additional risks because their earnings and revenues tend to be less predictable and their share prices more volatile than those of larger, more established companies. The shares of midsize companies tend to trade less frequently than those of larger, more established companies.
| 1 | Total return includes reinvestment of dividends and any capital gains paid, and does not take into consideration the maximum initial sales charges in the case of Class A and Class T shares, or the applicable contingent deferred sales charges imposed on redemptions in the case of Class B and Class C shares. Had these charges been reflected, returns would have been lower. Past performance is no guarantee of future results. Share price and investment return fluctuate such that upon redemption, fund shares may be worth more or less than their original cost. |
| |
| 2 | SOURCE: LIPPER INC. — The Russell Midcap Growth Index measures the performance of the 800 smallest companies in the Russell 1000 Index with higher price-to-book ratios and higher forecasted growth values.The total return figure cited for this index assumes change in security prices and reinvestment of dividends, but does not reflect the costs of managing a mutual fund.The Russell 1000 Index measures the performance of the largest 1,000 publicly traded U.S. companies. |
| |
The Fund 5
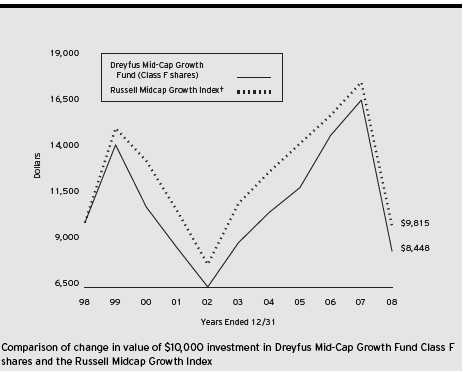
† Source: Lipper Inc.
Past performance is not predictive of future performance.
Part of the fund’s recent performance is attributable to positive returns from its initial public offering (IPO) investments. There can be no guarantee that IPOs will have or continue to have a positive effect on fund performance.
The above graph compares a $10,000 investment made in Class F shares of Dreyfus Mid-Cap Growth Fund on 12/31/98 to a $10,000 investment made in the Russell Midcap Growth Index (the “Index”) on that date. All dividends and capital gain distributions are reinvested. Performance for Class A, Class B, Class C, Class I and Class T shares will vary from the performance of Class F shares shown above due to differences in charges and expenses.
The fund’s performance shown in the line graph takes into account all applicable Class F fees and expenses (after any expense reimbursements).The Index measures the performance of those companies among the 800 smallest companies in the Russell 1000 Index with higher price-to-book ratios and higher forecasted growth values.The Russell 1000 Index measures the performance of the largest 1,000 publicly traded U.S. companies. Unlike a mutual fund, the Index is not subject to charges, fees and other expenses. Investors cannot invest directly in any index. Further information relating to fund performance, including expense reimbursements, if applicable, is contained in the Financial Highlights section of the prospectus and elsewhere in this report.
6
| Average Annual Total Returns as of 12/31/08 | | | | | | |
| |
| | | Inception | | | | | | | | From |
| | | Date | | 1 Year | | 5 Years | | 10 Years | | Inception |
| |
| |
| |
| |
| |
|
| Class A shares | | | | | | | | | | |
| with maximum sales charge (5.75%) | | 12/31/99 | | (52.40)% | | (2.41)% | | — | | (6.54)% |
| without sales charge | | 12/31/99 | | (49.52)% | | (1.27)% | | — | | (5.92)% |
| Class B shares | | | | | | | | | | |
| with applicable redemption charge † | | 12/31/99 | | (51.76)% | | (2.44)% | | — | | (6.33)%†† |
| without redemption | | 12/31/99 | | (49.75)% | | (2.06)% | | — | | (6.33)%†† |
| Class C shares | | | | | | | | | | |
| with applicable redemption charge ††† | | 12/31/99 | | (50.42)% | | (2.03)% | | — | | (6.70)% |
| without redemption | | 12/31/99 | | (49.91)% | | (2.03)% | | — | | (6.70)% |
| Class F shares | | 9/8/61 | | (49.30)% | | (1.07)% | | (1.67)% | | N/A |
| Class I shares | | 12/31/99 | | (49.30)% | | (1.08)% | | — | | (5.71)% |
| Class T shares | | | | | | | | | | |
| with applicable sales charge (4.5%) | | 12/31/99 | | (51.96)% | | (2.79)% | | — | | (7.10)% |
| without sales charge | | 12/31/99 | | (49.66)% | | (1.89)% | | — | | (6.62)% |
Past performance is not predictive of future performance.The fund’s performance shown in the graph and table does not reflect the deduction of taxes that a shareholder would pay on fund distributions or the redemption of fund shares.
| † The maximum contingent deferred sales charge for Class B shares is 4%. After six years Class B shares convert to |
| Class A shares. |
| †† | | Assumes the conversion of Class B shares to Class A shares at the end of the sixth year following the date |
| | | of purchase. |
| ††† | | The maximum contingent deferred sales charge for Class C shares is 1% for shares redeemed within one year of the |
| | | date of purchase. |
The Fund 7
UNDERSTANDING YOUR FUND’S EXPENSES (Unaudited)
As a mutual fund investor, you pay ongoing expenses, such as management fees and other expenses. Using the information below, you can estimate how these expenses affect your investment and compare them with the expenses of other funds.You also may pay one-time transaction expenses, including sales charges (loads) and redemption fees, which are not shown in this section and would have resulted in higher total expenses. For more information, see your fund's prospectus or talk to your financial advisor.
Review your fund’s expenses
The table below shows the expenses you would have paid on a $1,000 investment in Dreyfus Mid-Cap Growth Fund from July 1, 2008 to December 31, 2008. It also shows how much a $1,000 investment would be worth at the close of the period, assuming actual returns and expenses.To estimate the expenses you paid on your account over this period, simply divide your account value by $1,000 (for example, an $8,600 account value divided by $1,000 = 8.60), then multiply the results by the number in the Expenses paid per $1,000 line for the class of shares you own.
| | Expenses and Value of a $1,000 Investment
assuming actual returns for the six months ended December 31, 2008 |
| | | Class A | | Class B | | Class C | | Class F | | Class I | | Class T |
| |
| |
| |
| |
| |
| |
|
| Expenses paid | | | | | | | | | | | | |
| per $1,000† | | $ 5.94 | | $ 8.63 | | $ 8.82 | | $ 4.93 | | $ 4.97 | | $ 6.95 |
| Ending value | | | | | | | | | | | | |
| (after expenses) | | $554.20 | | $553.30 | | $552.00 | | $556.30 | | $555.70 | | $553.50 |
COMPARING YOUR FUND’S EXPENSES
WITH THOSE OF OTHER FUNDS (Unaudited) |
Using the SEC’s method to compare expenses
The Securities and Exchange Commission (SEC) has established guidelines to help investors assess fund expenses. Per these guidelines, the table below shows your fund’s expenses based on a $1,000 investment, assuming a hypothetical 5% annualized return. You can use this information to compare the ongoing expenses (but not transaction expenses or total cost) of investing in the fund with those of other funds.All mutual fund shareholder reports will provide this information to help you make this comparison. Please note that you cannot use this information to estimate your actual ending account balance and expenses paid during the period.
| | Expenses and Value of a $1,000 Investment
assuming a hypothetical 5% annualized return for the six months ended December 31, 2008 |
| | | Class A | | Class B | | Class C | | Class F | | Class I | | Class T |
| |
| |
| |
| |
| |
| |
|
| Expenses paid | | | | | | | | | | | | |
| per $1,000† | | $ 7.71 | | $ 11.19 | | $ 11.44 | | $ 6.39 | | $ 6.44 | | $ 9.02 |
| Ending value | | | | | | | | | | | | |
| (after expenses) | | $1,017.50 | | $1,014.03 | | $1,013.77 | | $1,018.80 | | $1,018.75 | | $1,016.19 |
| † Expenses are equal to the fund’s annualized expense ratio of 1.52% for Class A shares, 2.21% for Class B shares, |
| 2.26% for Class C shares, 1.26% for Class F shares, 1.27% for Class I shares and 1.78% for Class T shares; |
| multiplied by the average account value over the period, multiplied by 184/366 (to reflect the one-half year period). |
8
STATEMENT OF INVESTMENTS
December 31, 2008 |
| Common Stocks—97.6% | | Shares | | Value ($) |
| |
| |
|
| Aerospace & Defense—5.0% | | | | |
| Alliant Techsystems | | 56,000 a | | 4,802,560 |
| L-3 Communications Holdings | | 20,000 | | 1,475,600 |
| | | | | 6,278,160 |
| Air Freight & Logistics—2.6% | | | | |
| UTi Worldwide | | 224,000 | | 3,212,160 |
| Apparel Retail—.7% | | | | |
| Guess? | | 56,000 | | 859,600 |
| Apparel Accessories & Luxury Goods—2.6% | | | | |
| Gildan Activewear | | 273,200 a | | 3,212,832 |
| Application Software—.7% | | | | |
| FactSet Research Systems | | 19,000 | | 840,560 |
| Automotive Retail—.8% | | | | |
| Advance Auto Parts | | 29,000 | | 975,850 |
| Biotechnology—6.6% | | | | |
| Alexion Pharmaceuticals | | 46,000 a | | 1,664,740 |
| BioMarin Pharmaceutical | | 297,000 a | | 5,286,600 |
| Martek Biosciences | | 40,000 a | | 1,212,400 |
| | | | | 8,163,740 |
| Communications Equipment—1.0% | | | | |
| Juniper Networks | | 68,000 a | | 1,190,680 |
| Computer & Electronics Retail—2.0% | | | | |
| GameStop, Cl. A | | 112,000 a | | 2,425,920 |
| Construction & Engineering—.8% | | | | |
| Foster Wheeler | | 40,000 a | | 935,200 |
| Construction, Farm Machinery & | | | | |
| Heavy Trucks—1.5% | | | | |
| Cummins | | 43,000 | | 1,149,390 |
| Joy Global | | 30,000 | | 686,700 |
| | | | | 1,836,090 |
| Data Processing & Outsourced Services—6.6% | | | | |
| Lender Processing Services | | 47,000 | | 1,384,150 |
| MasterCard, Cl. A | | 33,000 | | 4,716,690 |
| NeuStar, Cl. A | | 117,000 a | | 2,238,210 |
| | | | | 8,339,050 |
| Department Stores—1.7% | | | | |
| Kohl’s | | 57,000 a | | 2,063,400 |
The Fund 9
| STATEMENT OF INVESTMENTS (continued) |
| Common Stocks (continued) | | Shares | | Value ($) |
| |
| |
|
| Electrical Components & Equipment—1.1% | | | | |
| Energy Conversion Devices | | 56,000 a | | 1,411,760 |
| Electronic Manufacturing Services—.9% | | | | |
| Trimble Navigation | | 53,000 a | | 1,145,330 |
| Gas Utilities—1.6% | | | | |
| Questar | | 62,000 | | 2,026,780 |
| General Merchandise Stores—2.3% | | | | |
| Family Dollar Stores | | 61,000 | | 1,590,270 |
| TJX Cos. | | 61,000 | | 1,254,770 |
| | | | | 2,845,040 |
| Health Care Equipment—7.7% | | | | |
| Covidien | | 97,000 | | 3,515,280 |
| Masimo | | 149,000 a | | 4,444,670 |
| St. Jude Medical | | 54,000 a | | 1,779,840 |
| | | | | 9,739,790 |
| Health Care Services—.6% | | | | |
| Emergency Medical Services, Cl. A | | 19,000 a | | 695,590 |
| Home Entertainment Software—.7% | | | | |
| Electronic Arts | | 58,000 a | | 930,320 |
| Homefurnishing Retail—1.7% | | | | |
| Bed Bath & Beyond | | 82,000 a | | 2,084,440 |
| Household Products—1.9% | | | | |
| Clorox | | 42,000 | | 2,333,520 |
| Industrial Machinery—1.7% | | | | |
| Flowserve | | 23,000 | | 1,184,500 |
| Middleby | | 33,000 a | | 899,910 |
| | | | | 2,084,410 |
| Insurance Brokers—1.4% | | | | |
| AON | | 37,000 | | 1,690,160 |
| Internet Software & Services—2.3% | | | | |
| Akamai Technologies | | 191,000 a | | 2,882,190 |
| Leisure Products—2.7% | | | | |
| Polaris Industries | | 82,000 | | 2,349,300 |
| Pool | | 57,000 | | 1,024,290 |
| | | | | 3,373,590 |
10
| Common Stocks (continued) | | Shares | | Value ($) |
| |
| |
|
| Metal & Glass Containers—3.0% | | | | |
| Pactiv | | 149,000 a | | 3,707,120 |
| Multi-Line Insurance—2.1% | | | | |
| Assurant | | 87,000 | | 2,610,000 |
| Oil & Gas Drilling—.7% | | | | |
| Noble | | 42,000 | | 927,780 |
| Oil & Gas Equipment & Services—3.9% | | | | |
| Cameron International | | 57,000 a | | 1,168,500 |
| National Oilwell Varco | | 65,000 a | | 1,588,600 |
| Smith International | | 25,082 | | 574,127 |
| Weatherford International | | 135,000 a | | 1,460,700 |
| | | | | 4,791,927 |
| Oil & Gas Exploration & Production—2.7% | | | | |
| Arena Resources | | 57,000 a | | 1,601,130 |
| Southwestern Energy | | 61,000 a | | 1,767,170 |
| | | | | 3,368,300 |
| Packaged Foods & Meats—.9% | | | | |
| Cadbury, ADR | | 32,000 | | 1,141,440 |
| Personal Products—1.4% | | | | |
| Alberto-Culver | | 30,000 | | 735,300 |
| Estee Lauder, Cl. A | | 31,000 | | 959,760 |
| | | | | 1,695,060 |
| Pharmaceuticals—3.6% | | | | |
| Allergan | | 21,000 | | 846,720 |
| Shire, ADR | | 82,000 | | 3,671,960 |
| | | | | 4,518,680 |
| Research & Consulting Services—.5% | | | | |
| FTI Consulting | | 14,801 a | | 661,309 |
| Restaurants—2.1% | | | | |
| Yum! Brands | | 81,000 | | 2,551,500 |
| Semiconductors—4.4% | | | | |
| Atmel | | 1,014,900 a | | 3,176,637 |
| Broadcom, Cl. A | | 135,000 a | | 2,290,950 |
| | | | | 5,467,587 |
The Fund 11
| STATEMENT OF INVESTMENTS (continued) | | | | |
| |
| |
|
| |
| |
| |
| |
| Common Stocks (continued) | | Shares | | Value ($) |
| |
| |
|
| Specialized Finance—3.2% | | | | |
| IntercontinentalExchange | | 49,000 a | | 4,039,560 |
| Systems Software—2.9% | | | | |
| BMC Software | | 63,000 a | | 1,695,330 |
| McAfee | | 56,000 a | | 1,935,920 |
| | | | | | | 3,631,250 |
| Thrifts & Mortgage Finance—2.5% | | | | |
| Hudson City Bancorp | | 194,000 | | 3,096,240 |
| Wireless Telecommunication Services—4.5% | | | | |
| American Tower, Cl. A | | 82,050 a | | 2,405,706 |
| Metropcs Communications | | 81,000 a | | 1,202,850 |
| NII Holdings | | 110,000 a | | 1,999,800 |
| | | | | | | 5,608,356 |
| Total Common Stocks | | | | |
| (cost $175,909,338) | | | | 121,392,271 |
| |
| |
|
| |
| Other Investment—2.5% | | | | |
| |
| |
|
| Registered Investment Company; | | | | |
| Dreyfus Institutional Preferred | | | | |
| Plus Money Market Fund | | | | |
| (cost $3,074,000) | | 3,074,000 b | | 3,074,000 |
| |
| |
|
| |
| Total Investments (cost $178,983,338) | | 100.1% | | 124,466,271 |
| Liabilities, Less Cash and Receivables | | (.1%) | | (104,042) |
| Net Assets | | 100.0% | | 124,362,229 |
| |
| ADR—American Depository Receipt | | | | |
| a | | Non-income producing security. | | | | |
| b | | Investment in affiliated money market mutual fund. | | | | |
| | | | |
| |
|
| Portfolio Summary (Unaudited)† | | | | |
| |
| | | Value (%) | | | | Value (%) |
| |
| |
| |
|
| Information Technology | | 19.6 | | Telecommunication Services | | 4.5 |
| Health Care | | 18.6 | | Consumer Staples | | 4.2 |
| Consumer Discretionary | | 16.4 | | Materials | | 3.0 |
| Industrials | | 13.2 | | Money Market Investment | | 2.5 |
| Financials | | 9.2 | | Utilities | | 1.6 |
| Energy | | 7.3 | | | | 100.1 |
| |
| † Based on net assets. | | | | | | |
| See notes to financial statements. | | | | | | |
12
| | STATEMENT OF ASSETS AND LIABILITIES
December 31, 2008 |
| | | Cost | | Value |
| |
| |
|
| Assets ($): | | | | |
| Investments in securities—See Statement of Investments: | | | | |
| Unaffiliated issuers | | 175,909,338 | | 121,392,271 |
| Affiliated issuers | | 3,074,000 | | 3,074,000 |
| Cash | | | | 230,972 |
| Receivable for investment securities sold | | | | 2,416,697 |
| Receivable for shares of Common Stock subscribed | | | | 276,594 |
| Dividends and interest receivable | | | | 34,640 |
| Other assets | | | | 26,638 |
| Prepaid expenses | | | | 71,959 |
| | | | | 127,523,771 |
| |
| |
|
| Liabilities ($): | | | | |
| Due to Founders Asset Management LLC and affiliates—Note 3(c) | | | | 203,164 |
| Payable for investment securities purchased | | | | 2,375,626 |
| Payable for shares of Common Stock redeemed | | | | 368,298 |
| Directors’ deferred compensation | | | | 26,638 |
| Accrued expenses | | | | 187,816 |
| | | | | 3,161,542 |
| |
| |
|
| Net Assets ($) | | | | 124,362,229 |
| |
| |
|
| Composition of Net Assets ($): | | | | |
| Paid-in capital | | | | 233,237,022 |
| Accumulated distributions in excess of investment income—net | | | | (18,230) |
| Accumulated net realized gain (loss) on investments | | | | (54,313,632) |
| Accumulated net unrealized appreciation | | | | |
| (depreciation) on investments | | | | (54,542,931) |
| |
| |
|
| Net Assets ($) | | | | 124,362,229 |
| Net Asset Value Per Share | | | | | | | | | | |
| | | Class A | | Class B | | Class C | | Class F | | Class I | | Class T |
| |
| |
| |
| |
| |
| |
|
| Net Assets ($) | | 29,525,366 | | 728,979 | | 14,032,694 | | 75,224,087 | | 3,849,130 | | 1,001,973 |
| Shares | | | | | | | | | | | | |
| Outstanding | | 9,301,791 | | 246,692 | | 4,798,142 | | 23,098,949 | | 1,188,230 | | 339,775 |
| |
| |
| |
| |
| |
| |
|
| Net Asset Value | | | | | | | | | | | | |
| Per Share ($) | | 3.17 | | 2.96 | | 2.92 | | 3.26 | | 3.24 | | 2.95 |
| |
| See notes to financial statements. | | | | | | | | | | |
The Fund 13
| STATEMENT OF OPERATIONS | | |
| Year Ended December 31, 2008 | | |
| |
|
| |
| |
| |
| |
| Investment Income ($): | | |
| Income: | | |
| Cash dividends (net of $5,607 foreign taxes withheld at source): | | |
| Unaffiliated issuers | | 1,073,994 |
| Affiliated issuers | | 181,559 |
| Total Income | | 1,255,553 |
| Expenses: | | |
| Investment advisory fee—Note 3(a) | | 1,820,615 |
| Shareholder servicing costs—Note 3(c) | | 604,846 |
| Distribution fees—Note 3(b) | | 427,103 |
| Accounting fees—Note 3(c) | | 140,003 |
| Registration fees | | 94,303 |
| Professional fees | | 75,154 |
| Directors’ fees and expenses—Note 3(d) | | 45,016 |
| Prospectus and shareholders’ reports | | 40,389 |
| Custodian fees—Note 3(c) | | 5,488 |
| Loan commitment fees—Note 2 | | 3,102 |
| Interest expense—Note 2 | | 161 |
| Miscellaneous | | 50,671 |
| Total Expenses | | 3,306,851 |
| Less—reduction in accounting fees—Note 3(c) | | (18,118) |
| Less—reduction in fees due to earnings credits—Note 1(c) | | (26,901) |
| Net Expenses | | 3,261,832 |
| Investment (Loss)—Net | | (2,006,279) |
| |
|
| Realized and Unrealized Gain (Loss) on Investments—Note 4 ($): | | |
| Net realized gain (loss) on investments | | (52,967,467) |
| Net unrealized appreciation (depreciation) on investments | | (83,838,100) |
| Net Realized and Unrealized Gain (Loss) on Investments | | (136,805,567) |
| Net (Decrease) in Net Assets Resulting from Operations | | (138,811,846) |
| |
| See notes to financial statements. | | |
14
STATEMENT OF CHANGES IN NET ASSETS
| | | Year Ended December 31, |
| | |
|
| | | 2008 | | 2007a |
| |
| |
|
| Operations ($): | �� | | | |
| Investment (loss)—net | | (2,006,279) | | (669,289) |
| Net realized gain (loss) on investments | | (52,967,467) | | 22,599,861 |
| Net unrealized appreciation | | | | |
| (depreciation) on investments | | (83,838,100) | | 7,939,103 |
| Net Increase (Decrease) in Net Assets | | | | |
| Resulting from Operations | | (138,811,846) | | 29,869,675 |
| |
| |
|
| Dividends to Shareholder from ($): | | | | |
| Net realized gain on investments: | | | | |
| Class A Shares | | — | | (3,931,014) |
| Class B Shares | | — | | (90,730) |
| Class C Shares | | — | | (1,917,287) |
| Class F Shares | | — | | (7,202,948) |
| Class I Shares | | — | | (419,265) |
| Class T Shares | | — | | (27,597) |
| Total Dividends | | | | (13,588,841) |
| |
| |
|
| Capital Stock Transactions ($): | | | | |
| Net proceeds from shares sold: | | | | |
| Class A Shares | | 21,794,218 | | 107,502,995 |
| Class B Shares | | 202,260 | | 998,575 |
| Class C Shares | | 3,955,723 | | 38,939,430 |
| Class F Shares | | 7,053,772 | | 48,898,562 |
| Class I Shares | | 3,738,726 | | 12,109,131 |
| Class T Shares | | 1,486,187 | | 777,078 |
| Dividends reinvested: | | | | |
| Class A Shares | | — | | 3,425,728 |
| Class B Shares | | — | | 83,159 |
| Class C Shares | | — | | 1,383,039 |
| Class F Shares | | — | | 6,901,667 |
| Class I Shares | | — | | 379,793 |
| Class T Shares | | — | | 13,748 |
The Fund 15
STATEMENT OF CHANGES IN NET ASSETS (continued)
| | | Year Ended December 31, |
| | |
|
| | | 2008 | | 2007a |
| |
| |
|
| Capital Stock Transactions ($) (continued): | | | | |
| Cost of shares redeemed: | | | | |
| Class A Shares | | (54,213,274) | | (36,607,936) |
| Class B Shares | | (821,032) | | (936,304) |
| Class C Shares | | (16,403,399) | | (6,603,790) |
| Class F Shares | | (33,815,076) | | (34,226,600) |
| Class I Shares | | (5,995,031) | | (6,960,515) |
| Class T Shares | | (404,666) | | (275,605) |
| Increase (Decrease) in Net Assets | | | | |
| from Capital Stock Transactions | | (73,421,592) | | 135,802,155 |
| Total Increase (Decrease) in Net Assets | | (212,233,438) | | 152,082,989 |
| |
| |
|
| Net Assets ($): | | | | |
| Beginning of Period | | 336,595,667 | | 184,512,678 |
| End of Period | | 124,362,229 | | 336,595,667 |
| Accumulated distributions in | | | | |
| excess of investment income—net | | (18,230) | | (49,931) |
16
| | | Year Ended December 31, |
| | |
|
| | | 2008 | | 2007a |
| |
| |
|
| Capital Share Transactions: | | | | |
| Class Ab | | | | |
| Shares sold | | 4,209,002 | | 17,029,336 |
| Shares issued for dividends reinvested | | — | | 540,173 |
| Shares redeemed | | (10,399,995) | | (5,725,288) |
| Net Increase (Decrease) in Shares Outstanding | | (6,190,993) | | 11,884,221 |
| |
| |
|
| Class Bb | | | | |
| Shares sold | | 37,586 | | 166,780 |
| Shares issued for dividends reinvested | | — | | 14,000 |
| Shares redeemed | | (164,270) | | (158,357) |
| Net Increase (Decrease) in Shares Outstanding | | (126,684) | | 22,423 |
| |
| |
|
| Class C | | | | |
| Shares sold | | 804,987 | | 6,607,852 |
| Shares issued for dividends reinvested | | — | | 235,211 |
| Shares redeemed | | (3,521,470) | | (1,102,096) |
| Net Increase (Decrease) in Shares Outstanding | | (2,716,483) | | 5,740,967 |
| |
| |
|
| Class F | | | | |
| Shares sold | | 1,317,273 | | 7,666,480 |
| Shares issued for dividends reinvested | | — | | 1,065,072 |
| Shares redeemed | | (6,583,095) | | (5,275,025) |
| Net Increase (Decrease) in Shares Outstanding | | (5,265,822) | | 3,456,527 |
| |
| |
|
| Class I | | | | |
| Shares sold | | 679,251 | | 1,897,374 |
| Shares issued for dividends reinvested | | — | | 58,882 |
| Shares redeemed | | (1,096,466) | | (1,078,755) |
| Net Increase (Decrease) in Shares Outstanding | | (417,215) | | 877,501 |
| |
| |
|
| Class T | | | | |
| Shares sold | | 317,418 | | 131,478 |
| Shares issued for dividends reinvested | | — | | 2,326 |
| Shares redeemed | | (86,423) | | (44,924) |
| Net Increase (Decrease) in Shares Outstanding | | 230,995 | | 88,880 |
| a | | Effective June 1, 2007, Class R shares were redesignated as Class I shares. |
| b | | During the period ended December 31, 2008, 57,149 Class B shares representing $299,563 were automatically |
| | | converted to 53,476 Class A shares and during the period ended December 31, 2007, 73,005 Class B shares |
| | | representing $432,266 were automatically converted to 68,997 Class A shares. |
| See notes to financial statements. |
The Fund 17
FINANCIAL HIGHLIGHTS
The following tables describe the performance for each share class for the fiscal periods indicated.All information (except portfolio turnover rate) reflects financial results for a single fund share.Total return shows how much your investment in the fund would have increased (or decreased) during each period, assuming you had reinvested all dividends and distributions.These figures have been derived from the fund’s financial statements.
| | | | | Year Ended December 31, | | |
| | |
| |
| |
|
| Class A Shares | | 2008 | | 2007 | | 2006 | | 2005 | | 2004 |
| |
| |
| |
| |
| |
|
| Per Share Data ($): | | | | | | | | | | |
| Net asset value, beginning of period | | 6.28 | | 5.80 | | 4.68 | | 4.15 | | 3.52 |
| Investment Operations: | | | | | | | | | | |
| Investment (loss)—net | | (.05)a | | (.02)a | | (.04)a | | (.05) | | (.03) |
| Net realized and unrealized | | | | | | | | | | |
| gain (loss) on investments | | (3.06) | | .76 | | 1.16 | | .58 | | .66 |
| Total from Investment Operations | | (3.11) | | .74 | | 1.12 | | .53 | | .63 |
| Distributions: | | | | | | | | | | |
| Dividends from net realized | | | | | | | | | | |
| gain on investments | | — | | (.26) | | — | | — | | — |
| Net asset value, end of period | | 3.17 | | 6.28 | | 5.80 | | 4.68 | | 4.15 |
| |
| |
| |
| |
| |
|
| Total Return (%)b | | (49.52) | | 12.77 | | 23.93 | | 12.77 | | 17.90 |
| |
| |
| |
| |
| |
|
| Ratios/Supplemental Data (%): | | | | | | | | | | |
| Ratio of total expenses | | | | | | | | | | |
| to average net assets | | 1.45 | | 1.43 | | 1.40 | | 1.58 | | 1.54 |
| Ratio of net expenses | | | | | | | | | | |
| to average net assets | | 1.44 | | 1.43c | | 1.39 | | 1.55 | | 1.53 |
| Ratio of net investment (loss) | | | | | | | | | | |
| to average net assets | | (.89) | | (.32) | | (.68) | | (.92) | | (1.07) |
| Portfolio Turnover Rate | | 119 | | 165 | | 104 | | 211 | | 147 |
| |
| |
| |
| |
| |
|
| Net Assets, end of period ($ x 1,000) | | 29,525 | | 97,331 | | 21,146 | | 1,656 | | 1,546 |
| a | | Based on average shares outstanding at each month end. |
| b | | Exclusive of sales charge. |
| c | | Expense waivers and/or reimbursements amounted to less than .01%. |
| See notes to financial statements. |
18
| | | | | Year Ended December 31, | | |
| | |
| |
| |
|
| Class B Shares | | 2008 | | 2007 | | 2006 | | 2005 | | 2004 |
| |
| |
| |
| |
| |
|
| Per Share Data ($): | | | | | | | | | | |
| Net asset value, beginning of period | | 5.89 | | 5.50 | | 4.48 | | 4.01 | | 3.43 |
| Investment Operations: | | | | | | | | | | |
| Investment (loss)—net | | (.08)a | | (.06)a | | (.08)a | | (.09) | | (.07) |
| Net realized and unrealized | | | | | | | | | | |
| gain (loss) on investments | | (2.85) | | .71 | | 1.10 | | .56 | | .65 |
| Total from Investment Operations | | (2.93) | | .65 | | 1.02 | | .47 | | .58 |
| Distributions: | | | | | | | | | | |
| Dividends from net realized | | | | | | | | | | |
| gain on investments | | — | | (.26) | | — | | — | | — |
| Net asset value, end of period | | 2.96 | | 5.89 | | 5.50 | | 4.48 | | 4.01 |
| |
| |
| |
| |
| |
|
| Total Return (%)b | | (49.75) | | 11.84 | | 22.77 | | 11.72 | | 16.91 |
| |
| |
| |
| |
| |
|
| Ratios/Supplemental Data (%): | | | | | | | | | | |
| Ratio of total expenses | | | | | | | | | | |
| to average net assets | | 2.21 | | 2.26 | | 2.29 | | 2.43 | | 2.37 |
| Ratio of net expenses | | | | | | | | | | |
| to average net assets | | 2.20 | | 2.26c | | 2.29 | | 2.41 | | 2.37 |
| Ratio of net investment (loss) | | | | | | | | | | |
| to average net assets | | (1.66) | | (1.02) | | (1.60) | | (1.78) | | (1.90) |
| Portfolio Turnover Rate | | 119 | | 165 | | 104 | | 211 | | 147 |
| |
| |
| |
| |
| |
|
| Net Assets, end of period ($ x 1,000) | | 729 | | 2,200 | | 1,929 | | 1,886 | | 1,823 |
| a | | Based on average shares outstanding at each month end. |
| b | | Exclusive of sales charge. |
| c | | Expense waivers and/or reimbursements amounted to less than .01%. |
| See notes to financial statements. |
The Fund 19
| | FINANCIAL HIGHLIGHTS (continued) |
| | | | | Year Ended December 31, | | |
| | |
| |
| |
|
| Class C Shares | | 2008 | | 2007 | | 2006 | | 2005 | | 2004 |
| |
| |
| |
| |
| |
|
| Per Share Data ($): | | | | | | | | | | |
| Net asset value, beginning of period | | 5.83 | | 5.44 | | 4.42 | | 3.96 | | 3.38 |
| Investment Operations: | | | | | | | | | | |
| Investment (loss)—net | | (.08)a | | (.06)a | | (.06)a | | (.02) | | (.06)a |
| Net realized and unrealized | | | | | | | | | | |
| gain (loss) on investments | | (2.83) | | .71 | | 1.08 | | .48 | | .64 |
| Total from Investment Operations | | (2.91) | | .65 | | 1.02 | | .46 | | .58 |
| Distributions: | | | | | | | | | | |
| Dividends from net realized | | | | | | | | | | |
| gain on investments | | — | | (.26) | | — | | — | | — |
| Net asset value, end of period | | 2.92 | | 5.83 | | 5.44 | | 4.42 | | 3.96 |
| |
| |
| |
| |
| |
|
| Total Return (%)b | | (49.91) | | 11.96 | | 23.08 | | 11.62 | | 17.16 |
| |
| |
| |
| |
| |
|
| Ratios/Supplemental Data (%): | | | | | | | | | | |
| Ratio of total expenses | | | | | | | | | | |
| to average net assets | | 2.20 | | 2.13 | | 2.19 | | 2.35 | | 2.32 |
| Ratio of net expenses | | | | | | | | | | |
| to average net assets | | 2.19 | | 2.13c | | 2.18 | | 2.32 | | 2.31 |
| Ratio of net investment | | | | | | | | | | |
| (loss) to average net assets | | (1.65) | | (1.04) | | (1.27) | | (1.69) | | (1.83) |
| Portfolio Turnover Rate | | 119 | | 165 | | 104 | | 211 | | 147 |
| |
| |
| |
| |
| |
|
| Net Assets, end of period ($ x 1,000) | | 14,033 | | 43,825 | | 9,641 | | 550 | | 428 |
| a | | Based on average shares outstanding at each month end. |
| b | | Exclusive of sales charge. |
| c | | Expense waivers and/or reimbursements amounted to less than .01%. |
| See notes to financial statements. |
20
| | | | | Year Ended December 31, | | |
| | |
| |
| |
|
| Class F Shares | | 2008 | | 2007 | | 2006 | | 2005 | | 2004 |
| |
| |
| |
| |
| |
|
| Per Share Data ($): | | | | | | | | | | |
| Net asset value, beginning of period | | 6.43 | | 5.92 | | 4.78 | | 4.24 | | 3.58 |
| Investment Operations: | | | | | | | | | | |
| Investment (loss)—net | | (.04)a | | (.00)a,b | | (.03)a | | (.12) | | (.03) |
| Net realized and unrealized | | | | | | | | | | |
| gain (loss) on investments | | (3.13) | | .77 | | 1.17 | | .66 | | .69 |
| Total from Investment Operations | | (3.17) | | .77 | | 1.14 | | .54 | | .66 |
| Distributions: | | | | | | | | | | |
| Dividends from net realized | | | | | | | | | | |
| gain on investments | | — | | (.26) | | — | | — | | — |
| Net asset value, end of period | | 3.26 | | 6.43 | | 5.92 | | 4.78 | | 4.24 |
| |
| |
| |
| |
| |
|
| Total Return (%) | | (49.30) | | 13.03 | | 23.85 | | 12.74 | | 18.44 |
| |
| |
| |
| |
| |
|
| Ratios/Supplemental Data (%): | | | | | | | | | | |
| Ratio of total expenses | | | | | | | | | | |
| to average net assets | | 1.23 | | 1.30 | | 1.33 | | 1.41 | | 1.33 |
| Ratio of net expenses | | | | | | | | | | |
| to average net assets | | 1.22 | | 1.30c | | 1.33 | | 1.39 | | 1.33 |
| Ratio of net investment (loss) | | | | | | | | | | |
| to average net assets | | (.68) | | (.03) | | (.62) | | (.77) | | (.87) |
| Portfolio Turnover Rate | | 119 | | 165 | | 104 | | 211 | | 147 |
| |
| |
| |
| |
| |
|
| Net Assets, end of period ($ x 1,000) | | 75,224 | | 182,336 147,410 | | 110,170 | | 119,273 |
| a | | Based on average shares outstanding at each month end. |
| b | | Amount represents less than $.01 per share. |
| c | | Expense waivers and/or reimbursements amounted to less than .01%. |
| See notes to financial statements. |
The Fund 21
| | FINANCIAL HIGHLIGHTS (continued) |
| | | | | Year Ended December 31, | | |
| | |
| |
| |
|
| Class I Shares | | 2008 | | 2007a | | 2006 | | 2005 | | 2004 |
| |
| |
| |
| |
| |
|
| Per Share Data ($): | | | | | | | | | | |
| Net asset value, beginning of period | | 6.39 | | 5.88 | | 4.73 | | 4.19 | | 3.56 |
| Investment Operations: | | | | | | | | | | |
| Investment income (loss)—net | | (.03)b | | .00b,c | | (.02)b,c | | (.02) | | (.04) |
| Net realized and unrealized | | | | | | | | | | |
| gain (loss) on investments | | (3.12) | | .77 | | 1.17 | | .56 | | .67 |
| Total from Investment Operations | | (3.15) | | .77 | | 1.15 | | .54 | | .63 |
| Distributions: | | | | | | | | | | |
| Dividends from net realized | | | | | | | | | | |
| gain on investments | | — | | (.26) | | — | | — | | — |
| Net asset value, end of period | | 3.24 | | 6.39 | | 5.88 | | 4.73 | | 4.19 |
| |
| |
| |
| |
| |
|
| Total Return (%) | | (49.30) | | 13.11 | | 24.31 | | 12.89 | | 17.70 |
| |
| |
| |
| |
| |
|
| Ratios/Supplemental Data (%): | | | | | | | | | | |
| Ratio of total expenses | | | | | | | | | | |
| to average net assets | | 1.20 | | 1.12 | | 1.14 | | 1.38 | | 1.48 |
| Ratio of net expenses | | | | | | | | | | |
| to average net assets | | 1.19 | | 1.11 | | 1.12 | | 1.34 | | 1.48 |
| Ratio of net investment income | | | | | | | | | | |
| (loss) to average net assets | | (.65) | | .06 | | (.28) | | (.70) | | (1.03) |
| Portfolio Turnover Rate | | 119 | | 165 | | 104 | | 211 | | 147 |
| |
| |
| |
| |
| |
|
| Net Assets, end of period ($ x 1,000) | | 3,849 | | 10,266 | | 4,279 | | 297 | | 71 |
| a | | Effective June 1, 2007, Class R shares were redesignated as Class I shares. |
| b | | Based on average shares outstanding at each month end. |
| c | | Amount represents less than $.01 per share. |
| See notes to financial statements. |
22
| | | | | Year Ended December 31, | | |
| | |
| |
| |
|
| Class T Shares | | 2008 | | 2007 | | 2006 | | 2005 | | 2004 |
| |
| |
| |
| |
| |
|
| Per Share Data ($): | | | | | | | | | | |
| Net asset value, beginning of period | | 5.86 | | 5.44 | | 4.43 | | 3.97 | | 3.39 |
| Investment Operations: | | | | | | | | | | |
| Investment (loss)—net | | (.06)a | | (.04)a | | (.07)a | | (.17) | | (.06) |
| Net realized and unrealized | | | | | | | | | | |
| gain (loss) on investments | | (2.85) | | .72 | | 1.08 | | .63 | | .64 |
| Total from Investment Operations | | (2.91) | | .68 | | 1.01 | | .46 | | .58 |
| Distributions: | | | | | | | | | | |
| Dividends from net realized | | | | | | | | | | |
| gain on investments | | — | | (.26) | | — | | — | | — |
| Net asset value, end of period | | 2.95 | | 5.86 | | 5.44 | | 4.43 | | 3.97 |
| |
| |
| |
| |
| |
|
| Total Return (%)b | | (49.66) | | 12.52 | | 22.80 | | 11.59 | | 17.11 |
| |
| |
| |
| |
| |
|
| Ratios/Supplemental Data (%): | | | | | | | | | | |
| Ratio of total expenses | | | | | | | | | | |
| to average net assets | | 1.85 | | 1.78 | | 2.13 | | 2.59 | | 2.26 |
| Ratio of net expenses | | | | | | | | | | |
| to average net assets | | 1.83 | | 1.78c | | 2.13 | | 2.57 | | 2.25 |
| Ratio of net investment (loss) | | | | | | | | | | |
| to average net assets | | (1.31) | | (.73) | | (1.39) | | (1.94) | | (1.78) |
| Portfolio Turnover Rate | | 119 | | 165 | | 104 | | 211 | | 147 |
| |
| |
| |
| |
| |
|
| Net Assets, end of period ($ x 1,000) | | 1,002 | | 638 | | 108 | | 33 | | 40 |
| a | | Based on average shares outstanding at each month end. |
| b | | Exclusive of sales charge. |
| c | | Expense waivers and/or reimbursements amounted to less than .01%. |
| See notes to financial statements. |
The Fund 23
NOTES TO FINANCIAL STATEMENTS
NOTE 1—Significant Accounting Policies:
Dreyfus Mid-Cap Growth Fund (the “fund”) is a separate diversified series of Dreyfus Funds, Inc. (the “Company”), which is registered under the Investment Company Act of 1940, as amended (the “Act”), as an open-end management investment company and operates as a series company currently offering five series, including the fund. The fund’s investment objective is to seek capital appreciation through investments in mid-cap growth companies. Founders Asset Management LLC (“Founders”) serves as the fund’s investment adviser. Founders is an indirect, wholly-owned subsidiary of The Bank of New York Mellon Corporation (“BNY Mellon”).
At a meeting of the Company’s Board of Directors held on September 22, 2008, the Board approved, effective December 1, 2008, a proposal to change the names of the Company and the fund from“Dreyfus Founders Funds, Inc.” and “Dreyfus Founders Mid-Cap Growth Fund” to “Dreyfus Funds, Inc.” and “Dreyfus Mid-Cap Growth Fund,” respectively.
Effective July 1, 2008, BNY Mellon reorganized and consolidated a number of its banking and trust company subsidiaries.As a result of the reorganization, any services previously provided to the fund by Mellon Bank, N.A. or Mellon Trust of New England, N.A. are now provided by The Bank of NewYork Mellon (formerly,The Bank of NewYork).
MBSC Securities Corporation (the “Distributor”), the direct owner of Founders and a wholly-owned subsidiary of The Dreyfus Corporation (“Dreyfus”), an affiliate of Founders, is the distributor of the fund’s shares. The fund is authorized to issue up to 1.15 billion shares of Common Stock, par value $.01 per share, in the following classes of shares: Class A, Class B, Class C, Class F, Class I and Class T. Class A and Class T shares are subject to a sales charge imposed at the time of purchase, although the shares may be purchased at net asset value (“NAV”) without a sales charge by certain categories of investors. Class B shares are subject to a contingent deferred sales charge (“CDSC”) imposed on Class B share redemptions made within six years of purchase and automatically convert to Class A shares after six years. The fund does not
24
offer Class B shares, except in connection with dividend reinvestment and permitted exchanges of Class B shares. Class C shares are subject to a CDSC imposed on Class C shares redeemed within one year of purchase. Class F and Class I shares are sold at NAV per share. Class F shares are sold only to Class F grandfathered investors, and Class I shares are sold only to eligible institutional investors. Effective December 3, 2008, investments for new accounts were no longer permitted in Class T of the fund, except that participants in certain group retirement plans were able to open a new account in Class T of the fund, provided that the fund was established as an investment option under the plans before December 3, 2008. Other differences between the classes include the services offered to and the expenses borne by each class. Income and realized and unrealized gains or losses on investments are allocated to each class of shares based on its relative net assets.
Each class of the fund bears expenses incurred specifically on its behalf and, in addition, each class bears a portion of general expenses based on the relative net assets or the number of shareholder accounts of the class.The type of expense determines the allocation method.
The fund’s financial statements are prepared in accordance with U.S. generally accepted accounting principles, which require the use of management estimates and assumptions. Actual results could differ from those estimates.
The fund enters into contracts that contain a variety of indemnifications. The fund’s maximum exposure under these arrangements is unknown.The fund does not anticipate recognizing any loss related to these arrangements.
(a) Portfolio valuation: A domestic equity security listed or traded on a securities exchange or in the over-the-counter market is valued at its last sale price on the exchange or market where it is principally traded or, in the case of a security traded on NASDAQ, at its official closing price. Lacking any sales on that day, the security is valued at the current closing bid price, or by quotes from dealers making a market in the security if the closing bid price is not available.
The Fund 25
| NOTES TO FINANCIAL STATEMENTS (continued) |
A foreign equity security traded on a foreign exchange is valued at the last quoted official closing price available before the time when the fund’s assets are valued, or at the last quoted sales price if the exchange does not provide an official closing price or if the foreign market has not yet closed. Lacking any sales that day, the security is valued at the current closing bid price. NewYork closing exchange rates are used to convert foreign currencies to U.S. dollars.
A debt security with a remaining maturity greater than 60 days at the time of purchase is valued in accordance with the evaluated bid price supplied by a pricing service approved by the Company’s Board of Directors or, if such price is not available, at the mean between the highest bid and lowest asked quotations obtained from at least two securities dealers.A debt security with a remaining maturity of 60 days or less at the time of purchase is valued at amortized cost, which approximates market value, unless it is determined that amortized cost would not represent market value, in which case the securities would be marked to market.
Registered investment companies that are not traded on an exchange are valued at their NAV.
If market quotations or official closing prices are not readily available or are determined not to reflect accurately fair value, securities will be valued at their fair value as determined in good faith by the Company’s Board of Directors or pursuant to procedures approved by the Board of Directors.These situations may include instances where an event occurs after the close of the market on which a security is traded but before the fund calculates its NAV, and it is determined that the event has materially affected the value of the security. Fair value of foreign equity securities may be determined with the assistance of a pricing service using calculations based on indexes of domestic securities and other appropriate indicators, such as prices of relevant ADRs and futures contracts.
26
The fund adopted Statement of Financial Accounting Standards No. 157 “FairValue Measurements” (“FAS 157”). FAS 157 establishes an authoritative definition of fair value, sets out a framework for measuring fair value, and requires additional disclosures about fair value measurements.
Various inputs are used in determining the value of the fund’s investments relating to FAS 157.These inputs are summarized in the three broad levels listed below.
Level 1—quoted prices in active markets for identical securities.
Level 2—other significant observable inputs (including quoted
prices for similar securities, interest rates, prepayment speeds, credit
risk, etc.).
Level 3—significant unobservable inputs (including the fund’s own
assumptions in determining the fair value of investments). |
The inputs or methodology used for valuing securities are not necessarily an indication of the risk associated with investing in those securities.
The following is a summary of the inputs used as of December 31, 2008 in valuing the fund’s investments carried at fair value:
| | | Investments in | | Other Financial |
| Valuation Inputs | | Securities ($) | | Instruments ($)† |
| |
| |
|
| Level 1—Quoted Prices | | 124,466,271 | | 0 |
| Level 2—Other Significant | | | | |
| Observable Inputs | | 0 | | 0 |
| Level 3—Significant | | | | |
| Unobservable Inputs | | 0 | | 0 |
| Total | | 124,466,271 | | 0 |
| † | | Other financial instruments include derivative instruments such as futures, forward currency |
| | | exchange contracts and swap contracts, which are valued at the unrealized appreciation |
| | | (depreciation) on the instrument and written options contracts which are shown at value. |
(b) Foreign securities and currency transactions: The fund may invest at least a portion of its assets in foreign securities. Foreign securities carry more risk than U.S. securities, such as political and currency
The Fund 27
| NOTES TO FINANCIAL STATEMENTS (continued) |
risks. In the event the fund executes a foreign security transaction, the fund may enter into a foreign currency contract to settle the foreign security transaction.The fund could be exposed to risk if counterpar-ties are unable to meet the terms of the contracts or if the value of the currency changes unfavorably to the U.S. dollar.The resultant foreign currency gain or loss from the contract is recorded as foreign currency gain or loss and is presented as such in the Statement of Operations.
The accounting records of the fund are maintained in U.S. dollars.The market values of foreign securities, currency holdings and other assets and liabilities are translated into U.S. dollars based on the current exchange rates each business day. Purchases and sales of investment securities and income and expense items denominated in foreign currencies are translated into U.S. dollar amounts on the respective dates of such transactions.
The fund does not isolate that portion of the results of operations resulting from changes in foreign exchange rates on investments from the fluctuations arising from changes in market prices of securities held. Such fluctuations are included with the net unrealized appreciation (depreciation) from investments and foreign currency translations in the Statement of Operations.
Reported net realized foreign exchange gains or losses arise from sales of foreign currencies, currency gains or losses realized between the trade and settlement dates on securities transactions, and the difference between the amounts of dividends, interest, and foreign withholding taxes recorded on the fund’s books and the U.S. dollar equivalent of the amounts actually received or paid. Net unrealized appreciation or depreciation on investments and foreign currency translation arises from changes in the values of assets and liabilities, including investments in securities held at the date of the financial statements, resulting from changes in the exchange rates and changes in market prices of securities held.
(c) Securities transactions and investment income: Securities transactions are recorded on a trade date basis. Realized gains and losses
28
from securities transactions are recorded on the identified cost basis. Dividend income is recognized on the ex-dividend date and interest income, including, where applicable, accretion of discount and amortization of premium on investments, is recognized on the accrual basis.
The fund has arrangements with the custodian and cash management bank whereby the fund may receive earnings credits when positive cash balances are maintained, which are used to offset custody and cash management fees. For financial reporting purposes, the fund includes net earnings credits as an expense offset in the Statement of Operations.
(d) Affiliated issuers: Investments in other investment companies advised by Founders or its affiliates are defined as “affiliated” in the Act.
(e) Dividends to shareholders: Dividends are recorded on the ex-dividend date. Dividends from investment income-net and dividends from net realized capital gains, if any, are normally declared and paid annually, but the fund may make distributions on a more frequent basis to comply with the distribution requirements of the Internal Revenue Code of 1986, as amended (the “Code”).To the extent that net realized capital gains can be offset by capital loss carryovers, it is the policy of the fund not to distribute such gains. Income and capital gain distributions are determined in accordance with income tax regulations, which may differ from U.S. generally accepted accounting principles.
(f) Federal income taxes: No provision has been made for federal income taxes since it is the policy of the fund to continue to comply with the requirements of Subchapter M of the Code that are applicable to regulated investment companies and to make distributions of income and capital gains sufficient to relieve it from all income taxes.The fund is treated as a separate tax entity for federal income tax purposes.
As of and during the period ended December 31, 2008, the fund did not have any liabilities for any unrecognized tax positions. The fund recognizes interest and penalties, if any, related to unrecognized tax positions as income tax expense in the Statement of Operations. During the period, the fund did not incur any interest or penalties.
The Fund 29
| NOTES TO FINANCIAL STATEMENTS (continued) |
Each of the tax years in the four-year period ended December 31, 2008 remains subject to examination by the Internal Revenue Service and state taxing authorities.
At December 31, 2008, the components of accumulated earnings on a tax basis were as follows: accumulated capital losses $29,443,355 and unrealized depreciation $56,301,724. In addition, the fund had $23,085,620 of capital losses realized after October 31, 2008 which were deferred for tax purposes to the first day of the following fiscal year.
The accumulated capital loss carryover is available for federal income tax purposes to be applied against future net securities profits, if any, realized subsequent to December 31, 2008. If not applied, the carryover expires in fiscal 2016.
The tax character of distributions paid to shareholders during the fiscal periods ended December 31, 2008 and December 31, 2007 were as follows: long-term capital gains $0 and $13,588,841, respectively.
During the period ended December 31, 2008, as a result of permanent book to tax differences, primarily due to the tax treatment for net operating losses, the fund increased accumulated undistributed investment income-net by $2,037,980 and decreased paid-in capital by the same amount. Net assets and net asset value per share were not affected by this reclassification.
NOTE 2—Bank Line of Credit:
The Company has a line of credit arrangement (“LOC”) with State Street Bank and Trust Company, to be used for temporary or emergency purposes, primarily for financing redemption payments. The borrowings by each series of the Company are limited to the lesser of (a) $25 million, or (b) the lesser of 25% of the series’ total net assets or the maximum amount which the series is permitted to borrow pursuant to the prospectus, any law or any other agreement. Combined borrowings are subject to the $25 million cap on the total LOC. Each series agrees to pay annual fees and interest on the unpaid balance based on prevailing market rates as defined in the LOC.
30
The average daily amount of borrowings outstanding under the LOC during the period ended December 31, 2008 was approximately $6,400 with a related weighted average annualized interest rate of 2.54% .
NOTE 3—Investment Advisory Fee and Other Transactions With Affiliates:
(a) In accordance with an investment advisory agreement between the Company and Founders, the fund compensates Founders for its services as investment adviser by the payment of fees computed daily and paid monthly at an annual rate equal to a percentage of the average daily value of the fund’s net assets.The fee is 1% of the first $30 million of net assets, .75% of the next $270 million of net assets, .70% of the next $200 million of net assets and .65% of net assets in excess of $500 million.
During the period ended December 31, 2008, the Distributor retained $11,453 and $63 from commissions earned on sales of the fund’s Class A and ClassT shares, respectively, and $2,143 and $20,478 from CDSCs on redemptions of the fund’s Class B and Class C shares, respectively.
(b) Under a Distribution Plan (the “Class B, C and T Plan”) adopted pursuant to Rule 12b-1 under the Act, Class B, Class C and Class T shares pay the Distributor for distributing their shares at an annual rate of .75% of the value of the average daily net assets of Class B and Class C shares and .25% of the value of the average daily net assets of Class T shares. During the period ended December 31, 2008, Class B, Class C and Class T shares were charged $10,644, $221,742 and $2,048 respectively, pursuant to the Class B, C and T Plan.
The fund also has adopted a Distribution Plan pursuant to Rule 12b-1 under the Act applicable to its Class F shares (the “Class F Plan”). Under the Class F Plan, the fund is authorized to reimburse the Distributor for expenses paid for distributing or servicing its Class F shares at an annual rate of up to .25% of the value of the average daily net assets of the fund’s Class F shares. During the period ended December 31, 2008, Class F shares were charged $192,669 pursuant to the Class F Plan.
The Fund 31
| NOTES TO FINANCIAL STATEMENTS (continued) |
(c) Under the Shareholder Services Plan, Class A, Class B, Class C and Class T shares pay the Distributor at an annual rate of .25% of the value of their average daily net assets for the provision of certain services.The services provided may include personal services relating to shareholder accounts, such as answering shareholder inquiries regarding the fund and providing reports and other information, and services related to the maintenance of shareholder accounts.The Distributor may make payments to Service Agents (a securities dealer, financial institution or other industry professional) in respect of these services.The Distributor determines the amounts to be paid to Service Agents. During the period ended December 31, 2008, Class A, Class B, Class C and Class T shares were charged $152,719, $3,548, $73,914 and $2,048, respectively, pursuant to the Shareholder Services Plan.
The Company has a shareholder services agreement with the Distributor, whereby the fund has agreed to compensate the Distributor for providing certain shareholder servicing functions to holders of Class F shares. The fund paid the Distributor a monthly fee equal, on an annual basis, to $24.00 per Class F shareholder account considered to be an open account at any time during a given month. During the period ended December 31, 2008, Class F shares were charged $51,990 pursuant to this shareholder services agreement.
Dreyfus Transfer, Inc. (“DTI”), a wholly-owned subsidiary of Dreyfus, is the transfer and dividend disbursing agent for all of the fund’s share classes. The Distributor pays the transfer and dividend agent fees, other than out-of-pocket charges, for Class F only. During the period ended December 31, 2008, Class F shares were charged $16,232 for out-of-pocket transfer agent charges.
The fees charged by DTI with respect to the fund’s Class A, Class B, Class C, Class I and Class T shares are paid by the fund.These transfer agency fees, including both the per account fees paid to DTI and out-of-pocket charges, during the period ended December 31, 2008 were $89,629.
32
The fund compensates The Bank of New York Mellon, a subsidiary of BNY Mellon and an affiliate of Founders, under two cash management agreements for performing cash management services related to fund subscriptions and redemptions. During the period ended December 31, 2008, the fund was charged $23,049 for these services, which were partially offset by earnings credits pursuant to the cash management agreements.
The fund compensates The Bank of New York Mellon under a custody agreement for providing custodial services for the fund. During the period ended December 31, 2008, the fund was charged $5,488 for these services. These fees were partially offset by earnings credits pursuant to the custody agreement.
The fund has agreed to compensate Dreyfus for providing accounting services, administration, compliance monitoring, regulatory and shareholder reporting, as well as related facilities, equipment and clerical help. The fee is computed at the annual rate of .06% of the average daily net assets of the fund on the first $500 million, .04% of the average daily net assets of the fund on the next $500 million and .02% of the average daily net assets of the fund in excess of $1 billion,plus reasonable out-of-pocket expenses. Dreyfus has contractually agreed in writing to waive any fees received for these services to the extent they exceed its costs in providing the services and a reasonable allocation of the costs incurred by Founders and its affiliates related to the support and oversight of these services. During the period ended December 31, 2008, Dreyfus waived $18,118.
The components of “Due to Founders Asset Management LLC and affiliates” in the Statement of Assets and Liabilities consist of: investment advisory fees $82,352, Rule 12b-1 distribution plan fees $24,849, shareholder services plan fees $81,857, custodian fees $1,883, compliance support fees $1,833, and transfer agency per account fees $10,390.
(d) Annual retainer fees and attendance fees for the Company’s Board of Directors are allocated to each series of the Company based on net
The Fund 33
| NOTES TO FINANCIAL STATEMENTS (continued) |
assets. During the period ended December 31, 2008, the fund paid $70,881 in directors’ fees. The Company’s Board of Directors has adopted a deferred compensation plan for Company directors that enables directors to elect to defer receipt of all or a portion of the annual compensation that they are entitled to receive from the Company. Under the plan, the compensation deferred is invested in shares of one or more of the Company’s series.The amount paid to the director under the plan will be determined based upon the performance of the selected series. The current value of these amounts is included in Other Assets and Directors’ Deferred Compensation in the Statement of Assets and Liabilities. Increases in the market value of the deferred compensation accounts are added to the directors’ fees and expenses paid by the fund in the directors’ fees and expenses in the Statement of Operations, and decreases in the market value of the accounts are subtracted from such fees. During the period ended December 31, 2008, depreciation in the value of the accounts totaled $25,864.This depreciation also is included in the net unrealized appreciation (depreciation) on investments in the Statement of Operations. Deferral of directors’ fees under the plan does not affect the net assets of the fund.
Certain officers of the Company are also officers and/or directors of Founders or its affiliates, which pay their compensation. However, the fund pays a portion of the cost of the services performed by the Company’s Chief Compliance Officer and her staff. During the period ended December 31, 2008, the fund was charged $1,833 for these services, which is included in miscellaneous expenses. The affairs of the fund, including services provided by Founders, are subject to the supervision and general oversight of the Company’s Board of Directors.
NOTE 4—Securities Transactions:
The aggregate amount of purchases and sales of investment securities, excluding short-term securities, during the period ended December 31, 2008, amounted to $272,755,807 and $346,153,137, respectively.
34
At December 31, 2008, the cost of investments for federal income tax purposes was $180,767,995; accordingly, accumulated net unrealized depreciation on investments was $56,301,724, consisting of $1,647,008 gross unrealized appreciation and $57,948,732 gross unrealized depreciation.
In March 2008, the Financial Accounting Standards Board released Statement of Financial Accounting Standards No. 161, “Disclosures about Derivative Instruments and Hedging Activities” (“FAS 161”). FAS 161 requires qualitative disclosures about objectives and strategies for using derivatives, quantitative disclosures about fair value amounts of gains and losses on derivative instruments, and disclosures about credit-risk-related contingent features in derivative agreements. The application of FAS 161 is required for fiscal years and interim periods beginning after November 15, 2008.At this time, management is evaluating the implications of FAS 161 and its impact on the financial statements and the accompanying notes has not yet been determined.
NOTE 5—Subsequent Event:
On February 4, 2009, the fund issued to each holder of its Class T shares, in exchange for said shares, Class A shares of the fund having an aggregate net asset value equal to the aggregate net asset value of the shareholder’s Class T shares. Subsequent investments in the fund’s Class A shares made by prior holders of the fund’s ClassT shares who received Class A shares of the fund in exchange for their Class T shares are subject to the front-end sales load schedule that was in effect for Class T shares at the time of the exchange. Otherwise, all other Class A share attributes will be in effect.
The Fund 35
REPORT OF INDEPENDENT REGISTERED
PUBLIC ACCOUNTING FIRM |
| | Shareholders and Board of Directors
Dreyfus Mid-Cap Growth Fund |
We have audited the accompanying statement of assets and liabilities, including the statement of investments, of Dreyfus Mid-Cap Growth Fund (formerly, Dreyfus Founders Mid-Cap Growth Fund) (one of the series comprising Dreyfus Funds, Inc.) as of December 31, 2008, and the related statement of operations for the year then ended and the statement of changes in net assets and financial highlights for each of the two years in the period then ended.These financial statements and financial highlights are the responsibility of the Fund’s management. Our responsibility is to express an opinion on these financial statements and financial highlights based on our audits.The financial highlights for the years ended December 31, 2006, 2005 and 2004 were audited by other auditors whose report dated February 23, 2007, expressed an unqualified opinion on such financial highlights.
We conducted our audits in accordance with the standards of the Public Company Accounting Oversight Board (United States).Those standards require that we plan and perform the audit to obtain reasonable assurance about whether the financial statements and financial highlights are free of material misstatement.We were not engaged to perform an audit of the Fund’s internal control over financial reporting. Our audits included consideration of internal control over financial reporting as a basis for designing audit procedures that are appropriate in the circumstances, but not for the purpose of expressing an opinion on the effectiveness of the Fund’s internal control over financial reporting.Accordingly, we express no such opinion. An audit also includes examining, on a test basis, evidence supporting the amounts and disclosures in the financial statements and financial highlights,assessing the accounting principles used and significant estimates made by management,and evaluating the overall financial statement presentation. Our procedures included confirmation of securities owned as of December 31, 2008 by correspondence with the custodian and oth-ers.We believe that our audits provide a reasonable basis for our opinion. In our opinion, the 2008 and 2007 financial statements and financial highlights referred to above present fairly, in all material respects, the financial position of Dreyfus Mid-Cap Growth Fund at December 31, 2008, the results of its operations for the year then ended and the changes in its net assets and the financial highlights for each of the two years in the period then ended, in conformity with U.S. generally accepted accounting principles.
New York, New York
February 23, 2009 |
FACTORS CONSIDERED IN RENEWING
THE ADVISORY AGREEMENT (Unaudited) |
At a meeting of the board of directors of Dreyfus Funds, Inc. (the “Funds” and, in reference to any one of the Funds’ portfolios, a “Fund”) held on August 20 and 21, 2008, the Funds’ directors unanimously approved the continuation of the Investment Advisory Agreement (“management agreement”) between each of the Funds and Founders Asset Management LLC, the Funds’ investment adviser (“Founders”), for a one-year term ending August 31, 2009.The board of directors of the Funds (“board”) is comprised entirely of individuals who have no affiliation with Founders or any affiliates of Founders (the “directors”).
Prior to the directors’ August 2008 meeting, Founders had provided the directors with extensive materials related to the renewal of the management agreement, including performance and expense information for other investment companies with similar investment objectives to each Fund derived from data compiled by Lipper Inc., an independent third party (“Lipper”).
During their meeting, the directors discussed the proposed continuance of the management agreement with the senior management personnel of Founders. At the conclusion of these discussions, the directors and their independent counsel met in a private session at which no representatives of Founders were present, to continue their discussion of continuance of the agreement. In determining to continue the management agreement, the directors considered all factors which they believed to be relevant, including the following:
Nature, Extent and Quality of Services Provided and to be Provided by Founders
The directors recognized that they have had the opportunity to evaluate the investment and non-investment related services which Founders and its affiliates provide to the Funds primarily through their quarterly review of all of the operations of the Funds during Fund committee and Fund board meetings held throughout the past twelve months.At each such meeting, extensive discussions of Fund operations are held with
The Fund 37
FACTORS CONSIDERED IN RENEWING THE
ADVISORY AGREEMENT (Unaudited) (continued) |
senior management personnel of Founders and a large volume of documentation with respect to these operations is provided to and reviewed by the directors. Such discussions and documentation afford the directors the continual opportunity to evaluate the nature, extent, and quality of the services provided by Founders and its affiliates to the Funds.
The directors were satisfied that Founders is managing the investment of the assets of the Funds in accordance with each Fund’s respective investment objective, policies and restrictions, subject to the directors’ overall supervision.
The directors considered that Founders also provides many non-investment related services to the Funds in fulfilling its responsibilities under the management agreement.
Following their discussion and review, the directors reached the following conclusions:
- That the breadth and quality of investment advisory and other ser- vices being provided to the Funds are satisfactory, as evidenced in part by the performance records of the Funds, to which the directors gave significant attention as indicated below; and
- That the directors are satisfied not only with the research, long-term portfolio management, and trading services being provided to the Funds, but also recognize that Founders or its affiliates have provided the highest quality accounting, compliance and regulatory, adminis- trative, underwriting, custody, shareholder, transfer agent and cash management services to the Funds, while charging fair, reasonable and competitive fees.
Investment Performance
On a quarterly basis, the directors hold meetings with representatives of the portfolio management team for each Fund (usually a portfolio manager), during which each representative reviews, among other items, performance information, attribution analyses, and the portfolio
38
manager’s investment outlook. The directors also receive written monthly and quarterly performance information for each Fund. The written quarterly reports included comparisons of each Fund’s performance with its respective Lipper category and one or more benchmark indexes, as well as a comparable exchange-traded fund, for the most recent quarter and one-, three-, five-, and ten-year periods, as well as for the portfolio manager’s tenure.
In conjunction with their consideration of renewal of the management agreement, the directors received a more detailed performance report about each Fund from Lipper.These reports compared each Fund’s performance to both a relatively small group of similar funds selected by Lipper (the “Lipper performance group”), as well as to all funds in the applicable Lipper category (the “Lipper performance universe”).
The performance of Mid-Cap Growth Fund’s Class F shares placed in the fourth quintile of both its Lipper performance group and the Lipper mid-cap growth fund performance universe for the one-year period ended December 31, 2007, but placed in the first quintiles of its Lipper performance group and universe for the three- and five-year periods ended December 31, 2007.The Fund’s Class F shares underper-formed the Fund’s benchmark index for the year ended June 30, 2008, but outperformed the index for the three- and five-year periods then ended. The directors deemed these longer term relative performance results to be very satisfactory, although the directors noted that the Fund’s relative performance in 2007 and early 2008 had deteriorated. The directors stressed the importance to Founders of the need to continue to seek to improve the Fund’s performance record in an effort to maintain the Fund’s strong long-term performance results.
After consideration of all relevant information and data, the directors concluded that although past performance cannot be a guaranty of future performance, each Fund and its shareholders would continue to
The Fund 39
FACTORS CONSIDERED IN RENEWING THE
ADVISORY AGREEMENT (Unaudited) (continued) |
benefit from Founders’ investment management of the Fund. The directors further determined:
- That although certain of the Funds have experienced performance difficulties, Founders has focused its efforts upon improving the performance records of the Funds and will continue to seek improvement; and
- That the materials provided by Lipper demonstrated that most of the Funds maintained satisfactory long-term performance quintile rankings in their respective comparison universes, with three of five Funds placing in the top three quintiles of their respective Lipper performance universes for the three-year period ended December 31, 2007, and four of five Funds placing in the top three quintiles of their respective Lipper performance universes for the five-year period ended December 31, 2007.
| | Costs of the Services to be Provided and Profits to be
Realized by Founders and Its Affiliates from Founders’
Relationship With the Funds |
The directors recognized that on a quarterly basis, they received information with respect to each Fund’s expenses. The directors carefully reviewed and discussed the expense ratios for all classes of shares of each Fund at each of their quarterly meetings throughout the year.
In conjunction with their annual consideration of renewal of the Funds’ management agreement and other service arrangements, the directors received detailed information from Lipper which compared each Fund’s management fees and other expenses with those of a group of similar funds selected by Lipper (the “Lipper expense group”), as well as summary information comparing each Fund’s management fees and expenses with those of the funds in its Lipper performance universe with load structures similar to that of the Funds (the “Lipper expense universe”).
The directors noted that for the period ended December 31, 2007, Mid-Cap Growth Fund’s management fees ranked in the second best
40
quintile of its Lipper expense group, with the Fund’s fees the sixth lowest of 16 “peer funds.”The Fund’s contractual management fees at a common asset level were determined by Lipper to be the sixth lowest of the 16 funds in its group.The Fund’s management fees were in the third quintile of its Lipper expense universe.
The directors also considered information provided by Lipper with respect to the profitability of the investment management activities conducted by a number of publicly-held corporations. Lipper also prepared an analysis providing detailed information with respect to the types of services rendered to various mutual fund complexes under their respective investment advisory contracts, including the services provided by Founders to the Funds under the management agreement.
The directors had been provided with extensive materials with respect to the profitability derived by Founders from providing investment advisory services to the Funds as a group and to each Fund individually.
The directors further considered certain indirect benefits received by Founders and its affiliates as a result of Founders’ provision of investment advisory services to the Funds.These included the following:
- Since Founders manages a non-Fund account in a style that is similar to that used for one of the Funds (and for a portion of another Fund), and employees of Founders manage other non-Fund accounts in their capacities as employees of the affiliates, Founders and its affiliates realize efficiencies in performing the portfolio management, trading and operational functions related to those non-Fund accounts;
- The Funds’ brokerage transactions may be executed with brokers that provide research and brokerage services to Founders and its affiliates. These research and brokerage services may be useful to Founders and its affiliates in providing investment advisory services to any of the clients they advise, including the Funds; and
- Affiliates of Founders receive various fees for providing accounting, underwriting, shareholder, transfer agency, custody and cash man- agement services to the Funds.
The Fund 41
FACTORS CONSIDERED IN RENEWING THE
ADVISORY AGREEMENT (Unaudited) (continued) |
After deliberation and discussion of Fund fees and expenses, the directors determined:
* That upon review of the advisory fee structures of the Funds in comparison with the comparative expense groups and expense universes selected by Lipper, the levels of investment advisory fees paid by the Funds were deemed to be competitive;
- That the expense ratios of the Funds are competitive and that Founders continually reviews each Fund’s total expense ratio in an effort to maintain Fund expense ratios at reasonable and com- petitive levels;
- That three of the five Funds’ expense ratios decreased or remained substantially the same for all or most of their share classes in 2007 as compared to those experienced in 2006; and
- That the comparative fee and expense information included in the materials provided by Lipper supports the determination that the advisory and other fees payable by the Funds to Founders and its affiliates are essentially fees which would be similar to those that would have resulted solely from “arm’s-length” bargaining.
With respect to profitability to Founders, the directors reviewed the adviser profitability analysis provided by Lipper, which demonstrated that Founders’ 2007 profitability from providing management services to the Funds was reasonable in comparison to the entities included in the Lipper analysis.
The directors were also advised by independent counsel of the profitability percentage ranges which court cases have found acceptable and determined that Founders’ profitability percentage for providing management services to the Funds was reasonable.
The directors concluded that Founders’ profits from providing management services to the Funds were reasonable in relationship to the overall services which Founders provides.
42
Economies of Scale
The directors reviewed information provided by Founders which summarized the extent, if any, that both Founders and the Funds would achieve certain economies of scale if the assets of the Funds were to increase.
After review and discussion, the directors considered the extent to which economies of scale and common management are shared with each Fund, including the economies that would be realized from the growth of each Fund’s assets. After such consideration, the directors determined that all of the Funds have structured breakpoints in their advisory fees, which result in fee reductions as the assets of each Fund reach defined levels, and that such fee reductions, when implemented, would benefit all of the applicable Fund’s shareholders through decreases in the Fund’s expense ratio.
Dedication to Regulatory Requirements and Restrictions
An important factor in the directors’ consideration of renewal of the Funds’ management agreement with Founders included the directors’ recognition of the dedication by Founders of stringent adherence to regulatory requirements and restrictions.The directors determined that Founders is dedicated to compliance with all applicable rules and regulations and that the systems of controls which are in place to ensure that the service providers to the Funds, including Founders, and the Funds themselves, maintain strict adherence to the law are excellent.
Overall Conclusions
The directors determined that they are generally satisfied with the performance of the Funds and with the quality of the advisory and other services being provided by Founders and its affiliates to the Funds. The directors recognized that efforts are being and will con-
The Fund 43
FACTORS CONSIDERED IN RENEWING THE
ADVISORY AGREEMENT (Unaudited) (continued) |
tinue to be made to improve the Fund’s performance and to maintain Fund expense ratios at reasonable and competitive levels.
The directors concluded that continuation of the current management agreement between each Fund and Founders, which would enable each Fund to continue to receive investment advisory services from Founders, is in the best interests of each Fund and its shareholders, the services to be performed under the management agreement are services required for the operations of the Funds, Founders has provided satisfactory investment management services to the Funds in the past, and the fees for the management services which Founders will perform will be within the range of what would have been negotiated at arm’s length in light of the circumstances.
44
YOUR BOARD REPRESENTATIVES (Unaudited)
The Board of Directors of the Company oversees the Company’s five series portfolios (the “Funds”). The business and affairs of the Company are managed under the direction of the Board.The directors serving on the Board perform their responsibilities in the manner which they reasonably believe to be in the best interests of the Funds and their shareholders.
All of the directors, as listed below, are independent directors.They are not affiliated with the Fund’s adviser, its parent company, or its affiliates. The directors have no official term of office and generally serve until they retire (normally at age 75, but subject to extension to age 80), resign, or are not re-elected. As you can see from their backgrounds, the directors have broad experience as active or former business and community leaders.
Directors
Alan S. Danson, 69.Year elected to the Board: 1991
Board Chairman.Private investor.Formerly,President and Director,D.H.Management, Inc., the general partner of a limited partnership with technology company holdings (1996 to 2003). Director, Gore Range Natural Science School and The Les Streeter Program, Inc., both of which are non-profit organizations.
Robert P. Mastrovita, 64.Year elected to the Board: 1998
Private investor. Chairman of a private charitable foundation (1997 to present). Formerly, Chairman and Director, Hagler, Mastrovita & Hewitt, Inc., a registered investment adviser (1982 to 1997). Member, Boston Society of Security Analysts. Trustee, Partridge Academy. Director, King Caesar Foundation.
Trygve E. Myhren, 72.Year elected to the Board: 1996
President, Myhren Media, Inc., a firm that invests in and advises media, telecommunications, Internet and software companies. Special Limited Partner and member of Investment Committee, Megunticook Funds, a venture capital firm (1998 to present). Director, AdPay, Inc. Trustee, Executive Committee and Chairman of Faculty Education Affairs Committee, the University of Denver.Trustee, Denver Art Museum. Member, Colorado FORUM and Cable Television Hall of Fame. Formerly, President (1990 to 1996) and Director (1992 to 2001) of the Providence Journal Company, a diversified media and communications company. Formerly, Chairman and Chief Executive Officer of American Television and Communications Corporation (now
The Fund 45
YOUR BOARD REPRESENTATIVES (Unaudited) (continued)
Time Warner Cable) (1981 to 1988). Formerly, Chairman of the National Cable Television Association (1986-1987). U.S. Chief of Mission, 2006 Paralympic Games, Torino/Sestrierre, Italy.
George W. Phillips, 70.Year elected to the Board: 1998
Retired.Vice Chairman of the Board and Chairman of the Investment Committee, Children’s Medical Center of Boston. Formerly, President and Chief Executive Officer (1992 to 1997) and Director (1992 to 2002) of Warren Bancorp, Inc. Formerly, President, Chief Executive Officer and Director of Warren Five Cents Savings Bank (1992 to 1997).
Martha A. Solis-Turner, 48.Year elected to the Board: 2005
Formerly, Telecommunications Director, Wholesale Markets (1995 to 2001), and Manager (1990 to 1995), Qwest Communications International Inc. Formerly, Board member and Treasurer, Mile High Montessori Early Learning Centers (2002 to 2008), Board member (1995 to 2004) and Vice President (2002 to 2004), Curtis Park Community Center, both of which are non-profit organizations.
Principal Officers
J. David Officer, 60. President and Principal Executive Officer of the Funds since 2007. Chairman, President and Chief Executive Officer of Founders since 2008. Chief Operating Officer,Vice Chairman and a Director of Dreyfus, and an officer of 77 investment companies (comprised of 180 portfolios) managed by Dreyfus. He has been an employee of Dreyfus since 1998.
Kenneth R. Christoffersen, 53. Vice President of the Funds since 2008, and Secretary since 2000 (and from 1996 to 1998). Founders’ Senior Vice President -Legal, General Counsel and Secretary. Assistant Secretary of the Distributor since 2003. Employed by Founders and its predecessor company since 1996.
Steven M. Anderson, 43.Treasurer and Principal Financial and Accounting Officer of the Funds since 2007.Vice President,BNY Mellon Asset Management (since 2003). Vice President, Treasurer and Chief Financial Officer, Mellon Optima L/S Strategy Fund, LLC (since 2005). Treasurer and Chief Financial Officer BNY/IVY Multi-Strategy Hedge Fund, LLC (since 2008). Formerly,Vice President (1999 to 2008), Treasurer and Chief Financial Officer of Mellon Institutional Funds Investment Trust (2002 to 2008).AssistantVice President and Mutual Funds Controller,Standish Mellon Asset Management Company, LLC (2000 to 2003).
46
Janelle E. Belcher, 50. Chief Compliance Officer of the Funds since 2004. Founders’ Vice President - Compliance since 2002. Formerly, Founders’ Manager of Compliance (2000 to 2002) and Securities Compliance Examiner, Staff Accountant and Team Leader for the U.S. Securities and Exchange Commission (1990 to 2000).
Robert S. Robol, 44. Assistant Treasurer since 2006. Senior Accounting Manager -Taxable Fixed Income Funds of Dreyfus, and an officer of 78 investment companies (comprised of 201 portfolios) managed by Dreyfus. Employed by Dreyfus since 1988.
Robert Salviolo, 41. Assistant Treasurer since 2007. Senior Accounting Manager -Foreign Equity Funds of Dreyfus, and an officer of 78 investment companies (comprised of 201 portfolios) managed by Dreyfus. Employed by Dreyfus since 1989.
Robert Svagna, 41. Assistant Treasurer since 2006. Senior Accounting Manager -Equity Funds of Dreyfus, and an officer of 78 investment companies (comprised of 201 portfolios) managed by Dreyfus. Employed by Dreyfus since 1990.
William G. Germenis, 38. Anti-Money Laundering Compliance Officer (“AMLCO”) for the Class A, Class B, Class C and Class I shares of the Funds since 2002 and for the Class F shares of the Funds since 2003.Vice President and AMLCO of the Distributor and AMLCO of 74 investment companies (comprised of 197 portfolios) managed by Dreyfus. Employed by the Distributor since 1998.
The directors and officers may be contacted at Founders’ address appearing on the back cover, except for Messrs. Officer, Robol, Salviolo, Svagna and Germenis, who can be contacted at The Dreyfus Corporation, 200 Park Avenue, NewYork, NewYork 10166, and Mr. Anderson, who can be contacted at BNY Mellon Asset Management, One Boston Place, Boston, Massachusetts 02108. Additional information about the Company’s directors is available in the Statement of Additional Information, which can be obtained free of charge by calling 1-800-645-6561 (Class F shareholders) or 1-800-554-4611 (all other shareholders).
The Fund 47
NOTES
For More Information
The fund files its complete schedule of portfolio holdings with the Securities and Exchange Commission (“SEC”) for the first and third quarters of each fiscal year on Form N-Q. The fund’s Forms N-Q are available on the SEC’s website at http://www.sec.gov and may be reviewed and copied at the SEC’s Public Reference Room in Washington, DC. Information on the operation of the Public Reference Room may be obtained by calling 1-800-SEC-0330.
A description of the policies and procedures that the fund uses to determine how to vote proxies relating to portfolio securities, and information regarding how the fund voted these proxies for the most recent 12-month period ended June 30 is available at http://www.dreyfus.com and on the SEC’s website at http://www.sec.gov.
The description of the policies and procedures is also available without charge, upon request, by calling 1-800-645-6561.
This report and the statements it contains are submitted for the general information
of our shareholders. The report is not authorized for distribution to prospective
investors unless preceded or accompanied by an effective prospectus. |

© 2009 MBSC Securities Corporation
| | Passport Fund is closed to new investors.
Please see the prospectus for additional information. |
| | ANNUAL REPORT December 31, 2008 |

Save time. Save paper. View your next shareholder report online as soon as it’s available. Log into www.dreyfus.com and sign up for Dreyfus eCommunications. It’s simple and only takes a few minutes.
The views expressed in this report reflect those of the portfolio managers only through the end of the period covered and do not necessarily represent the views of Dreyfus, Founders or any other person in our organization. Any such views are subject to change at any time based upon market or other conditions and we disclaim any responsibility to update such views. These views may not be relied on as investment advice and, because investment decisions for a Dreyfus fund are based on numerous factors, may not be relied on as an indication of trading intent on behalf of any Dreyfus fund.

| | Contents |
| |
| | THE FUND |
| |
| 2 | A Letter from the Chairman |
| |
| 3 | Discussion of Fund Performance |
| |
| 6 | Fund Performance |
| |
| 8 | Understanding Your Fund’s Expenses |
| |
| 8 | Comparing Your Fund’s Expenses With Those of Other Funds |
| |
| 9 | Statement of Investments |
| |
| 16 | Statement of Assets and Liabilities |
| |
| 17 | Statement of Operations |
| |
| 18 | Statement of Changes in Net Assets |
| |
| 20 | Financial Highlights |
| |
| 26 | Notes to Financial Statements |
| |
| 40 | Report of Independent Registered Public Accounting Firm |
| |
| 41 | Important Tax Information |
| |
| 42 | Factors Considered in Renewing the Advisory Agreement |
| |
| 50 | Your Board Representatives |
| |
| | FOR MORE INFORMATION |
| |
| | Back Cover |
| |
The Fund

A LETTER FROM THE CHAIRMAN
Dear Shareholder: |
We present to you this annual report for Dreyfus Passport Fund, covering the 12-month period from January 1, 2008, through December 31, 2008. 2008 was the most difficult year in decades for the economy and stock market.A credit crunch that originated in 2007 in the U.S. sub-prime mortgage market exploded in mid-2008 into a global financial crisis, resulting in the failures of major financial institutions, a deep and prolonged recession and lower investment values across a broad range of asset classes. Governments and regulators throughout the world moved aggressively to curtail the damage, implementing unprecedented reductions of short-term interest rates, massive injections of liquidity into the banking system, government bailouts of struggling companies and plans for massive economic stimulus programs. After several years of strong relative returns, international stocks generally declined more sharply than their U.S. counterparts.
Although we expect the U.S. and global economies to remain weak until longstanding imbalances have worked their way out of the system, the financial markets currently appear to have priced in investors’ generally low expectations. In previous recessions, however, the markets have tended to anticipate economic improvement before it occurs, potentially leading to major rallies when few expected them. That’s why it makes sense to remain disciplined, maintain a long-term perspective and adopt a consistent asset allocation strategy that reflects one’s future goals and attitudes toward risk. As always, we urge you to consult with your financial advisor, who can recommend the course of action that is right for you. For information about how the fund performed during the reporting period, as well as market perspectives, we have provided a Discussion of Fund Performance given by the fund’s Portfolio Managers.
Thank you for your continued confidence and support.

J. David Officer
Chairman, President and Chief Executive Officer
Founders Asset Management LLC
January 15, 2009 |
2

DISCUSSION OF FUND PERFORMANCE
For the period of January 1, 2008, through December 31, 2008, as provided by William S. Patzer, CFA, and Mark A. Bogar, CFA, Portfolio Managers
Fund and Market Performance Overview
For the 12-month period ended December 31, 2008, Dreyfus Passport Fund’s Class A shares produced a total return of –50.83%, Class B shares returned –51.33%, Class C shares returned –51.26%, Class F shares returned –50.71%, Class I shares returned –50.75% and Class T shares returned –51.06% .1 The fund’s benchmark, the Standard & Poor’s Developed ex U.S. Small Cap Index, returned –47.67% for the same period.2 Small-cap stocks throughout the world fell precipitously during 2008 due to a global economic slowdown, an intensifying financial crisis and adverse changes in currency exchange rates.The fund underperformed its benchmark, primarily due to poor stock selections in Japan, overweighted exposure to Greece and weakness in the industrials sector. Areas of relative strength were the utilities sector and the underweight in materials and financials in Australia.
The Fund’s Investment Approach
The fund seeks capital appreciation by investing at least 65% of its total assets in foreign small-cap companies from a minimum of three countries, in both developed and emerging economies. The fund may invest in larger foreign companies or in U.S.-based companies and may purchase securities of companies in initial public offerings. Our “bottom-up” investment approach emphasizes individual stock selection over broader economic and market trends. We use quantitative models and traditional qualitative analysis to construct a diversified portfolio of stocks with low price multiples and positive trends in earnings forecasts when compared to the benchmark.
Global Economic Meltdown Mired Equity Markets
Unprecedented turmoil in global financial and credit markets took their toll in 2008, sparking sharp slowdowns in developed and emerging economies. As the financial crisis intensified, lenders grew reluctant to extend credit even to their more creditworthy customers, causing consumer spending and business investment to decline sharply. Industrial demand waned, and commodity prices retreated from previous record
The Fund 3
| DISCUSSION OF FUND PERFORMANCE (continued) |
highs. These developments sparked a “flight to safety” among global investors, who fled riskier assets, such as small-cap stocks, often without regard for their underlying business fundamentals.
Japanese Stocks Drained Performance
From a regional perspective, our security selection strategy in Japan proved to be the greatest detractor from the fund’s relative performance. As the global economic climate deteriorated and the Japanese yen appreciated, investors flocked toward slower-growth, stable earning companies that historically have held up relatively well in downturns. In contrast, the fund had emphasized cheaper export-oriented stocks over more expensive, domestically oriented Japanese companies. Overweighted exposure to Greece also undermined the fund’s relative performance, as the household products companyThe Alapis Group,which was sold during the reporting period, plummeted due to uncertainty surrounding an acquisition, and cosmetic and household products manufacturer Sarantis fell amid slower consumer spending.
On a sector basis, the fund’s investments among industrial stocks fared relatively poorly when the sector encountered an abrupt end to years of price increases and earnings growth. Japanese auto-parts suppliers Nissin Kogyo and Keihin were hurt by slackening demand and a strengthening yen relative to most other currencies. British materials science firm Cookson Group, which was sold during the reporting period, and industrial conglomerate Charter International were drags on performance as commodity prices fell.
Other detractors from the fund’s relative performance in 2008 included Italy’s Prysmian (sold during the reporting period), a provider of cables and systems to the energy sector;Swedish automobile manufacturer Saab; and Australian travel consultant Flight Centre (which was also sold during the reporting period), all of which were negatively affected by slower consumer and business spending. Our stock selections in the traditionally defensive consumer staples sector also produced below-average results. On the other hand, an underweighted position in Canada’s materials sector produced positive contributions to the fund’s relative performance. The fund’s stock selection strategy in Canada’s materials sector also was relatively successful, as positions in gold miners IAMGOLD and Red Back Mining held up better than most other materials producers. The fund held no exposure to troubled Australian financial stocks, and the timely purchase of German electronic components maker EPCOS, which was sold during the reporting period, bolstered the fund’s returns compared to its benchmark.
4
Our investment in the Spanish utility company Union Fenosa, which was sold during the reporting period, fared relatively well after the firm received an acquisition offer.The other holding in utilities that also fared well due to a positive supply and demand dynamic was Emera in Canada. Overweighted exposure to domestically oriented health care stocks, such as Japan’s Hogy Medical and Hisamitsu Pharmaceutical, proved advantageous when business fundamentals improved for both companies due to the strength of their product lines. In Japan, chemical makerTokuyama benefited from falling coal prices,and Shimano cycling company gained value despite the deteriorating global economy. The fund’s allocation to cash also bolstered its relative performance.
Positioning for a Market Rebound
As of year-end, the financial crisis has persisted and the economy has continued to weaken. However, it appears to us that the generally low expectations for 2009 already have been reflected in stock prices. In addition, the benefits of lower energy prices and an expected stimulus package from the U.S. government could boost demand for a variety of products, and we expect accommodative monetary policies to pump liquidity into the global financial system.Therefore, we have begun to consider positions in companies that, in our judgment, are attractively priced, well positioned to weather the current economic storm and poised to participate in an eventual recovery.
January 15, 2009
Small companies carry additional risks because their earnings and revenues tend to be less predictable, and their share prices more volatile than those of larger, more established companies. The shares of smaller companies tend to trade less frequently than those of larger, more established companies.
Investing in foreign companies involves special risks, including changes in currency rates, political, economic and social instability, a lack of comprehensive company information, differing auditing and legal standards and less market liquidity. An investment in this fund should be considered only as a supplement to an overall investment program.
| 1 | Total return includes reinvestment of dividends and any capital gains paid, and does not take into consideration the maximum initial sales charges in the case of Class A and Class T shares, or the applicable contingent deferred sales charges imposed on redemptions in the case of Class B and Class C shares. Had these charges been reflected, returns would have been lower. Past performance is no guarantee of future results. Share price and investment return fluctuate such that upon redemption, fund shares may be worth more or less than their original cost. Return figures provided reflect Founders’ waiver of 25% of its management fee for the period from January 1, 2008, through September 13, 2008.This waiver ended on September 14, 2008. Had this waiver not been in effect, the fund’s returns would have been lower. |
| |
| 2 | SOURCE: LIPPER INC. – Reflects reinvestment of dividends and, where applicable, capital gains distributions.The S&P Developed ex U.S. Small Cap Index captures the bottom 15% of companies in the developed countries excluding the U.S. within the S&P Global Broad Market Index with a float adjusted market capitalization of US$100 million or greater and minimum annual trading liquidity of US$50 million. |
| |
The Fund 5
† Source: Standard and Poor’s, a subsidiary of The McGraw-Hill Companies, Inc.
Past performance is not predictive of future performance.
The above graph compares a $10,000 investment made in Class F shares of Dreyfus Passport Fund on 12/31/98 to a $10,000 investment made in the S&P Developed Ex U.S. Small Cap Index (the “Index”), formerly S&P/Citigroup Extended Market Index World ex U.S.SM, on that date. All dividends and capital gain distributions are reinvested. Performance for Class A, Class B, Class C, Class I and Class T shares will vary from the performance of Class F shares shown above due to differences in charges and expenses.
The fund’s performance shown in the line graph takes into account all applicable Class F fees and expenses (after any expense reimbursements and fee waivers).The Index captures the bottom 15% of companies in the developed countries excluding the U.S. within the S&P Global Broad Market Index (BMI) with a float-adjusted market capitalization of US$100 million or greater and a minimum annual trading liquidity of US$50 million. Unlike a mutual fund, the Index is not subject to charges, fees and other expenses. Investors cannot invest directly in any index. Further information relating to fund performance, including expense reimbursements, if applicable, is contained in the Financial Highlights section of the prospectus and elsewhere in this report.
6
| Average Annual Total Returns as of 12/31/08 | | | | | | |
| |
| | | Inception | | | | | | | | From |
| | | Date | | 1 Year | | 5 Years | | 10 Years | | Inception |
| |
| |
| |
| |
| |
|
| Class A shares | | | | | | | | | | |
| with maximum sales charge (5.75%) | | 12/31/99 | | (53.66)% | | (3.35)% | | — | | (5.59)% |
| without sales charge | | 12/31/99 | | (50.83)% | | (2.20)% | | — | | (4.96)% |
| Class B shares | | | | | | | | | | |
| with applicable redemption charge † | | 12/31/99 | | (53.27)% | | (3.54)% | | — | | (5.47)%†† |
| without redemption | | 12/31/99 | | (51.33)% | | (3.15)% | | — | | (5.47)%†† |
| Class C shares | | | | | | | | | | |
| with applicable redemption charge ††† | | 12/31/99 | | (51.74)% | | (2.96)% | | — | | (5.72)% |
| without redemption | | 12/31/99 | | (51.26)% | | (2.96)% | | — | | (5.72)% |
| Class F shares | | 11/16/93 | | (50.71)% | | (2.11)% | | 1.76% | | N/A |
| Class I shares | | 12/31/99 | | (50.75)% | | (2.01)% | | — | | (5.18)% |
| Class T shares | | | | | | | | | | |
| with applicable sales charge (4.5%) | | 12/31/99 | | (53.27)% | | (3.48)% | | — | | (6.05)% |
| without sales charge | | 12/31/99 | | (51.06)% | | (2.58)% | | — | | (5.57)% |
Past performance is not predictive of future performance.The fund’s performance shown in the graph and table does not reflect the deduction of taxes that a shareholder would pay on fund distributions or the redemption of fund shares, but does reflect fee waivers.
| † The maximum contingent deferred sales charge for Class B shares is 4%. After six years Class B shares convert to |
| Class A shares. |
| †† | | Assumes the conversion of Class B shares to Class A shares at the end of the sixth year following the date |
| | | of purchase. |
| ††† | | The maximum contingent deferred sales charge for Class C shares is 1% for shares redeemed within one year of the |
| | | date of purchase. |
The Fund 7
UNDERSTANDING YOUR FUND’S EXPENSES (Unaudited)
As a mutual fund investor, you pay ongoing expenses, such as management fees and other expenses. Using the information below, you can estimate how these expenses affect your investment and compare them with the expenses of other funds.You also may pay one-time transaction expenses, including sales charges (loads) and redemption fees, which are not shown in this section and would have resulted in higher total expenses. For more information, see your fund's prospectus or talk to your financial advisor.
Review your fund’s expenses
The table below shows the expenses you would have paid on a $1,000 investment in Dreyfus Passport Fund from July 1, 2008 to December 31, 2008. It also shows how much a $1,000 investment would be worth at the close of the period, assuming actual returns and expenses.To estimate the expenses you paid on your account over this period, simply divide your account value by $1,000 (for example, an $8,600 account value divided by $1,000 = 8.60), then multiply the results by the number in the Expenses paid per $1,000 line for the class of shares you own.
| | Expenses and Value of a $1,000 Investment
assuming actual returns for the six months ended December 31, 2008 |
| | | Class A | | Class B | | Class C | | Class F | | Class I | | Class T |
| |
| |
| |
| |
| |
| |
|
| Expenses paid | | | | | | | | | | | | |
| per $1,000† | | $ 7.09 | | $ 11.15 | | $ 10.37 | | $ 5.65 | | $ 6.00 | | $ 8.57 |
| Ending value | | | | | | | | | | | | |
| (after expenses) | | $558.80 | | $556.10 | | $556.10 | | $559.70 | | $559.40 | | $557.50 |
COMPARING YOUR FUND’S EXPENSES
WITH THOSE OF OTHER FUNDS (Unaudited) |
Using the SEC’s method to compare expenses
The Securities and Exchange Commission (SEC) has established guidelines to help investors assess fund expenses. Per these guidelines, the table below shows your fund’s expenses based on a $1,000 investment, assuming a hypothetical 5% annualized return. You can use this information to compare the ongoing expenses (but not transaction expenses or total cost) of investing in the fund with those of other funds.All mutual fund shareholder reports will provide this information to help you make this comparison. Please note that you cannot use this information to estimate your actual ending account balance and expenses paid during the period.
| | Expenses and Value of a $1,000 Investment
assuming a hypothetical 5% annualized return for the six months ended December 31, 2008 |
| | | Class A | | Class B | | Class C | | Class F | | Class I | | Class T |
| |
| |
| |
| |
| |
| |
|
| Expenses paid | | | | | | | | | | | | |
| per $1,000† | | $ 9.17 | | $ 14.41 | | $ 13.40 | | $ 7.30 | | $ 7.76 | | $ 11.09 |
| Ending value | | | | | | | | | | | | |
| (after expenses) | | $1,016.04 | | $1,010.81 | | $1,011.81 | | $1,017.90 | | $1,017.44 | | $1,014.13 |
| † Expenses are equal to the fund’s annualized expense ratio of 1.81% for Class A shares, 2.85% for Class B shares, |
| 2.65% for Class C shares, 1.44% for Class F shares, 1.53% for Class I shares and 2.19% for Class T shares, |
| multiplied by the average account value over the period, multiplied by 184/366 (to reflect the one-half year period). |
8
STATEMENT OF INVESTMENTS
December 31, 2008 |
| Common Stocks—96.1% | | Shares | | Value ($) |
| |
| |
|
| Australia—3.0% | | | | |
| Australian Worldwide Exploration | | 84,391 | | 152,846 |
| CFS Retail Property Trust | | 96,110 | | 126,031 |
| Computershare | | 40,648 | | 222,211 |
| Downer EDI | | 44,720 | | 120,329 |
| Goodman Fielder | | 272,640 | | 252,740 |
| Sonic Healthcare | | 12,876 | | 130,670 |
| | | | | 1,004,827 |
| Belgium—1.2% | | | | |
| Ackermans & Van Haaren | | 2,974 | | 150,461 |
| Cofinimmo | | 1,160 | | 152,392 |
| Mobistar | | 1,355 | | 97,254 |
| | | | | 400,107 |
| Canada—6.4% | | | | |
| Altagas Income Trust | | 8,290 | | 115,531 |
| Cogeco Cable | | 10,550 | | 294,993 |
| Crescent Point Energy Trust | | 12,422 | | 242,461 |
| Daylight Resources Trust | | 22,180 | | 140,355 |
| Emera | | 17,150 | | 308,483 |
| Gran Tierra Energy | | 46,267 a | | 123,334 |
| Iamgold | | 37,000 | | 227,840 |
| Laurentian Bank of Canada | | 8,070 | | 225,583 |
| Red Back Mining | | 24,900 a | | 173,303 |
| Sino-Forest | | 13,970 a | | 111,719 |
| Westjet Airlines | | 16,540 a | | 171,940 |
| | | | | 2,135,542 |
| China—.6% | | | | |
| Zhejiang Expressway, Cl. H | | 348,000 | | 206,049 |
| Denmark—.4% | | | | |
| East Asiatic | | 3,860 | | 127,977 |
| Finland—1.3% | | | | |
| Konecranes | | 13,970 | | 234,555 |
| Orion, Cl. B | | 6,589 | | 110,537 |
| Tietoenator | | 9,740 | | 105,187 |
| | | | | 450,279 |
| France—9.4% | | | | |
| Air France-KLM | | 12,280 | | 156,512 |
| Cap Gemini | | 10,854 | | 414,862 |
The Fund 9
| STATEMENT OF INVESTMENTS (continued) |
| Common Stocks (continued) | | Shares | | Value ($) |
| |
| |
|
| France (continued) | | | | |
| CNP Assurances | | 2,160 | | 155,317 |
| Fonciere des Regions | | 1,928 | | 130,837 |
| Havas | | 110,658 | | 225,475 |
| Ipsen | | 4,697 | | 182,401 |
| Ipsos | | 7,280 | | 195,033 |
| Neopost | | 2,750 | | 247,794 |
| Nexans | | 2,810 | | 165,783 |
| Publicis Groupe | | 13,920 | | 354,152 |
| Scor | | 12,530 | | 283,870 |
| Societe BIC | | 1,680 | | 96,168 |
| Technip | | 5,830 | | 176,262 |
| Teleperformance | | 7,844 | | 216,520 |
| Unibail-Rodamco | | 1,050 | | 155,425 |
| | | | | 3,156,411 |
| Germany—7.3% | | | | |
| Adidas | | 5,900 | | 222,558 |
| Demag Cranes | | 4,230 | | 110,530 |
| Deutsche Euroshop | | 5,089 | | 171,878 |
| Deutsche Lufthansa | | 13,041 | | 202,825 |
| Fielmann | | 2,700 | | 174,501 |
| Lanxess | | 9,190 | | 175,375 |
| MTU Aero Engines Holding | | 16,470 | | 448,216 |
| Puma | | 770 | | 150,151 |
| Salzgitter | | 3,888 | | 297,215 |
| Software | | 2,950 | | 164,007 |
| Vossloh | | 973 | | 107,500 |
| Wincor Nixdorf | | 4,680 | | 219,273 |
| | | | | 2,444,029 |
| Greece—.3% | | | | |
| Sarantis | | 16,480 | | 97,119 |
| Hong Kong—2.0% | | | | |
| Chaoda Modern Agriculture Holdings | | 346,320 | | 222,949 |
| China Agri-Industries Holdings | | 553,000 a | | 278,276 |
| Neo-China Land Group Holdings | | 493,500 b | | 66,861 |
| Pacific Basin Shipping | | 247,000 | | 113,544 |
| Peace Mark Holdings | | 586,000 b | | 0 |
| | | | | 681,630 |
10
| Common Stocks (continued) | | Shares | | Value ($) |
| |
| |
|
| Ireland—1.0% | | | | |
| DCC | | 16,649 | | 241,585 |
| United Drug | | 27,870 | | 86,382 |
| | | | | 327,967 |
| Italy—4.5% | | | | |
| ACEA | | 11,076 | | 148,326 |
| Banca Popolare di Milano Scarl | | 48,260 | | 280,546 |
| Benetton Group | | 33,865 | | 287,119 |
| Buzzi Unicem | | 12,174 | | 195,940 |
| Landi Renzo | | 21,780 | | 99,594 |
| Parmalat | | 119,300 | | 193,174 |
| Recordati | | 35,080 | | 188,447 |
| Unipol Gruppo Finanziario | | 85,822 | | 129,422 |
| | | | | 1,522,568 |
| Japan—25.8% | | | | |
| Air Water | | 25,400 | | 228,213 |
| Bank of Kyoto | | 16,000 | | 179,379 |
| Bank of Yokohama | | 18,000 | | 106,496 |
| Chiba Bank | | 19,000 | | 118,740 |
| Chiyoda | | 14,500 | | 272,550 |
| COMSYS Holdings | | 28,000 | | 260,291 |
| Credit Saison | | 6,000 | | 82,857 |
| Daifuku | | 29,000 | | 169,017 |
| Daito Trust Construction | | 2,000 | | 104,746 |
| F.C.C | | 14,300 | | 120,805 |
| Fukuoka Financial Group | | 36,000 | | 156,843 |
| Godo Steel | | 48,000 | | 134,497 |
| Hisamitsu Pharmaceutical | | 3,200 | | 130,675 |
| Hitachi Transport System | | 9,600 | | 143,989 |
| Hogy Medical | | 3,792 | | 261,315 |
| Hokuhoku Financial Group | | 77,000 | | 182,334 |
| House Foods | | 9,700 | | 172,881 |
| IT Holdings | | 11,200 a | | 174,569 |
| Japan Aviation Electronics Industry | | 22,000 | | 92,131 |
| Kansai Paint | | 33,000 | | 168,691 |
| Keihin | | 34,800 | | 253,067 |
| Kinden | | 33,000 | | 297,630 |
| Kuroda Electric | | 38,000 | | 356,701 |
The Fund 11
| STATEMENT OF INVESTMENTS (continued) |
| Common Stocks (continued) | | Shares | | Value ($) |
| |
| |
|
| Japan (continued) | | | | |
| Leopalace21 | | 10,700 | | 108,518 |
| Lintec | | 9,600 | | 133,208 |
| Matsumotokiyoshi Holdings | | 9,700 | | 201,076 |
| Mitsumi Electric | | 11,700 | | 206,849 |
| NET One Systems | | 96 | | 192,880 |
| Nichirei | | 41,000 | | 195,387 |
| Nihon Unisys | | 13,100 | | 107,603 |
| NSD | | 15,600 | | 122,743 |
| Pigeon | | 6,200 | | 185,465 |
| Point | | 2,510 | | 138,169 |
| Promise | | 4,250 | | 107,747 |
| Seino Holdings | | 46,000 | | 255,972 |
| Shimachu | | 9,400 | | 211,419 |
| Shimamura | | 1,700 | | 131,554 |
| Shimano | | 7,000 | | 280,527 |
| SKY Perfect JSAT Holdings | | 549 | | 267,304 |
| Star Micronics | | 14,200 | | 150,423 |
| Suruga Bank | | 21,000 | | 208,026 |
| Suzuken | | 5,900 | | 177,815 |
| Tokuyama | | 33,000 | | 278,605 |
| Tokyo Tatemono | | 31,000 | | 141,807 |
| Toyo Engineering | | 70,000 | | 218,041 |
| Yamaguchi Financial Group | | 21,000 | | 236,039 |
| Yokohama Rubber | | 43,000 | | 215,230 |
| | | | | 8,640,824 |
| Netherlands—2.3% | | | | |
| Gemalto | | 5,885 a | | 146,413 |
| Imtech | | 14,222 | | 237,205 |
| Koninklijke Vopak | | 5,920 | | 222,160 |
| Wereldhave | | 1,940 | | 169,873 |
| | | | | 775,651 |
| Norway—.7% | | | | |
| Tandberg | | 14,100 | | 151,927 |
| TGS Nopec Geophysical | | 17,400 a | | 86,158 |
| | | | | 238,085 |
12
| Common Stocks (continued) | | Shares | | Value ($) |
| |
| |
|
| Singapore—.6% | | | | |
| ComfortDelgro | | 138,000 | | 139,740 |
| Singapore Petroleum | | 36,000 | | 57,493 |
| | | | | 197,233 |
| South Korea—2.3% | | | | |
| CJ Home Shopping | | 7,074 a | | 217,307 |
| Honam Petrochemical | | 2,905 a | | 121,707 |
| LG Fashion | | 12,430 a | | 215,002 |
| Yuhan | | 1,298 a | | 226,701 |
| | | | | 780,717 |
| Spain—4.2% | | | | |
| Bankinter | | 19,250 | | 168,827 |
| Corporacion Financiera Alba | | 7,761 | | 293,945 |
| Enagas | | 10,991 | | 237,699 |
| Laboratorios Almirall | | 22,521 | | 172,160 |
| Mapfre | | 35,950 | | 119,920 |
| Prosegur Cia de Seguridad | | 9,340 | | 304,159 |
| Tubacex | | 31,700 | | 103,540 |
| | | | | 1,400,250 |
| Sweden—1.3% | | | | |
| Elekta, Cl. B | | 15,700 | | 153,057 |
| Peab | | 44,700 | | 122,164 |
| SAAB, Cl. B | | 18,100 | | 163,744 |
| | | | | 438,965 |
| Switzerland—5.5% | | | | |
| Actelion | | 5,070 a | | 283,070 |
| Adecco | | 12,483 | | 419,816 |
| Banque Cantonale Vaudoise | | 770 | | 229,972 |
| Clariant | | 38,032 a | | 254,881 |
| Kuoni Reisen Holding | | 1,035 | | 350,221 |
| PSP Swiss Property | | 5,840 a | | 289,283 |
| | | | | 1,827,243 |
| United Kingdom—16.0% | | | | |
| Aggreko | | 23,440 | | 150,185 |
| Amlin | | 32,830 | | 168,704 |
| Asos | | 44,230 a | | 157,192 |
The Fund 13
| STATEMENT OF INVESTMENTS (continued) |
| Common Stocks (continued) | | Shares | | Value ($) |
| |
| |
|
| United Kingdom (continued) | | | | |
| Balfour Beatty | | 65,000 | | 307,622 |
| Beazley Group | | 98,500 | | 191,846 |
| Brit Insurance Holdings | | 57,970 | | 183,318 |
| Catlin Group | | 35,370 | | 220,395 |
| Charter International | | 37,830 | | 179,444 |
| Close Brothers Group | | 23,646 | | 179,801 |
| Croda International | | 23,320 | | 174,137 |
| Dana Petroleum | | 13,602 a | | 193,951 |
| Davis Service Group | | 30,210 | | 118,004 |
| De La Rue | | 9,970 | | 129,838 |
| Domino’s Pizza UK & IRL | | 65,400 | | 156,520 |
| Drax Group | | 18,589 | | 149,898 |
| Electrocomponents | | 43,510 | | 88,340 |
| Halfords Group | | 34,520 | | 120,698 |
| Halma | | 44,700 | | 130,110 |
| Hiscox | | 35,050 | | 171,295 |
| IG Group Holdings | | 30,720 | | 113,152 |
| Interserve | | 36,607 | | 119,577 |
| Jardine Lloyd Thompson Group | | 24,578 | | 154,739 |
| John Wood Group | | 38,575 | | 104,380 |
| Keller Group | | 14,203 | | 117,389 |
| Mondi | | 36,125 | | 105,799 |
| QinetiQ Group | | 73,590 | | 167,923 |
| Regus | | 163,750 | | 116,510 |
| Rexam | | 36,210 | | 182,690 |
| Spectris | | 22,896 | | 176,072 |
| Spirent Communications | | 156,478 | | 81,534 |
| SSL International | | 19,790 | | 140,809 |
| Thomas Cook Group | | 121,600 | | 309,550 |
| Tui Travel | | 76,697 | | 257,421 |
| WSP Group | | 21,340 | | 62,269 |
| | | | | 5,381,112 |
| Total Common Stocks | | | | |
| (cost $42,546,415) | | | | 32,234,585 |
14
| Preferred Stocks—1.2% | | Shares | | Value ($) |
| |
| |
|
| Germany—.9% | | | | |
| Biotest | | 3,110 | | 197,844 |
| Fresenius | | 1,940 | | 112,143 |
| | | | | 309,987 |
| United Kingdom—.3% | | | | |
| Inmarsat | | 14,120 | | 95,696 |
| Total Preferred Stocks | | | | |
| (cost $395,777) | | | | 405,683 |
| |
| |
|
| |
| Exchange Traded Funds—.4% | | | | |
| |
| |
|
| Dow Jones EURO STOXX 50 | | | | |
| (cost $134,459) | | 3,920 | | 134,652 |
| |
| |
|
| |
| Total Investments (cost $43,076,651) | | 97.7% | | 32,774,920 |
| Cash and Receivables (Net) | | 2.3% | | 762,200 |
| Net Assets | | 100.0% | | 33,537,120 |
| a Non-income producing security. |
| b Illiquid securities. At the period end, the value of these securities amounted to $66,861 or .2% of net assets. |
| The valuation of these securities has been determined in good faith under the direction of the Board of Directors. |
| Portfolio Summary (Unaudited)† | | | | |
| |
| | | Value (%) | | | | Value (%) |
| |
| |
| |
|
| Industrials | | 22.0 | | Consumer Staples | | 5.8 |
| Financials | | 19.1 | | Energy | | 4.1 |
| Consumer Discretionary | | 16.9 | | Utilities | | 2.5 |
| Information Technology | | 9.5 | | Telecommunication Services | | .6 |
| Materials | | 9.2 | | Exchange Traded Funds | | .4 |
| Health Care | | 7.6 | | | | 97.7 |
| |
| † Based on net assets. | | | | | | |
| See notes to financial statements. | | | | | | |
The Fund 15
STATEMENT OF ASSETS AND LIABILITIES
December 31, 2008 |
| | | Cost | | Value |
| |
| |
|
| Assets ($): | | | | |
| Investments in securities—See Statement of Investments | | 43,076,651 | | 32,774,920 |
| Cash | | | | 402,135 |
| Cash denominated in foreign currencies | | 157,042 | | 157,593 |
| Dividends and interest receivable | | | | 367,584 |
| Receivable for investment securities sold | | | | 159,332 |
| Receivable for shares of Common Stock subscribed | | | | 11,544 |
| Other assets | | | | 72,590 |
| Prepaid expenses | | | | 38,607 |
| | | | | 33,984,305 |
| |
| |
|
| Liabilities ($): | | | | |
| Due to Founders Asset Management LLC and affiliates—Note 3(c) | | | | 76,888 |
| Directors’ deferred compensation | | | | 72,590 |
| Payable for investment securities purchased | | | | 170,282 |
| Payable for shares of Common Stock redeemed | | | | 25,879 |
| Payable for futures variation margin—Note 4 | | | | 7,203 |
| Interest payable—Note 2 | | | | 29 |
| Accrued expenses | | | | 94,314 |
| | | | | 447,185 |
| |
| |
|
| Net Assets ($) | | | | 33,537,120 |
| |
| |
|
| Composition of Net Assets ($): | | | | |
| Paid-in capital | | | | 152,558,819 |
| Accumulated undistributed investment income—net | | | | 557,493 |
| Accumulated net realized gain (loss) on investments | | | | (109,205,631) |
| Accumulated net unrealized appreciation | | | | |
| (depreciation) on investments | | | | (10,373,561) |
| |
| |
|
| Net Assets ($) | | | | 33,537,120 |
| Net Asset Value Per Share | | | | | | | | | | |
| | | Class A | | Class B | | Class C | | Class F | | Class I | | Class T |
| |
| |
| |
| |
| |
| |
|
| Net Assets ($) | | 8,503,621 | | 391,823 | | 1,513,863 | | 22,935,244 | | 70,525 | | 122,044 |
| Shares Outstanding | | 670,314 | | 33,338 | | 127,749 | | 1,804,692 | | 5,693 | | 10,146 |
| |
| |
| |
| |
| |
| |
|
| Net Asset Value | | | | | | | | | | | | |
| Per Share ($) | | 12.69 | | 11.75 | | 11.85 | | 12.71 | | 12.39 | | 12.03 |
| |
| See notes to financial statements. | | | | | | | | | | |
16
| STATEMENT OF OPERATIONS | | |
| Year Ended December 31, 2008 | | |
| |
|
| |
| |
| |
| |
| Investment Income ($): | | |
| Income: | | |
| Cash dividends (net of $197,525 foreign taxes withheld at source) | | 1,862,499 |
| Expenses: | | |
| Investment advisory fee—Note 3(a) | | 618,632 |
| Shareholder servicing costs—Note 3(c) | | 167,096 |
| Distribution fees—Note 3(b) | | 104,708 |
| Custodian fees—Note 3(c) | | 82,990 |
| Auditing fees | | 71,461 |
| Registration fees | | 62,714 |
| Accounting fees—Note 3(c) | | 61,863 |
| Prospectus and shareholders’ reports | | 40,531 |
| Legal fees | | 18,898 |
| Interest expense—Note 2 | | 561 |
| Loan commitment fees—Note 2 | | 425 |
| Miscellaneous | | 36,239 |
| Total Expenses | | 1,266,118 |
| Less—reduction in investment advisory fee—Note 3(a) | | (126,616) |
| Less—reduction in Directors’ fees and expenses—Note 3 (d) | | (70,228) |
| Less—reduction in accounting fees—Note 3(c) | | (27,683) |
| Less—reduction in fees due to earnings credits—Note 1(c) | | (23,584) |
| Net Expenses | | 1,018,007 |
| Investment Income—Net | | 844,492 |
| |
|
| Realized and Unrealized Gain (Loss) on Investments—Note 4 ($): | | |
| Net realized gain (loss) on investments and foreign currency transactions | | (24,075,692) |
| Net realized gain (loss) on financial futures | | (569,826) |
| Net realized gain (loss) on forward currency exchange contracts | | 56,823 |
| Net Realized Gain (Loss) | | (24,588,695) |
| Net unrealized appreciation (depreciation) on investments and | | |
| foreign currency transactions (including $9,856 net | | |
| unrealized appreciation on financial futures) | | (16,172,818) |
| Net Realized and Unrealized Gain (Loss) on Investments | | (40,761,513) |
| Net (Decrease) in Net Assets Resulting from Operations | | (39,917,021) |
| |
| See notes to financial statements. | | |
The Fund 17
STATEMENT OF CHANGES IN NET ASSETS
| | | Year Ended December 31, |
| | |
|
| | | 2008 | | 2007a |
| |
| |
|
| Operations ($): | | | | |
| Investment income—net | | 844,492 | | 2,662 |
| Net realized gain (loss) on investments | | (24,588,695) | | 22,586,818 |
| Net unrealized appreciation | | | | |
| (depreciation) on investments | | (16,172,818) | | (22,365,031) |
| Net Increase (Decrease) in Net Assets | | | | |
| Resulting from Operations | | (39,917,021) | | 224,449 |
| |
| |
|
| Dividends to Shareholders from ($): | | | | |
| Investment income—net: | | | | |
| Class A Shares | | — | | (110,276) |
| Class F Shares | | (126,599) | | (312,146) |
| Class I Shares | | (93) | | (1,150) |
| Total Dividends | | (126,692) | | (423,572) |
| |
| |
|
| Capital Stock Transactions ($): | | | | |
| Net proceeds from shares sold: | | | | |
| Class A Shares | | 563,487 | | 2,359,867 |
| Class B Shares | | 4,458 | | 57,708 |
| Class C Shares | | 21,053 | | 136,054 |
| Class F Shares | | 1,028,222 | | 2,179,451 |
| Class I Shares | | 24,570 | | 38,680 |
| Class T Shares | | — | | 225 |
| Dividends reinvested: | | | | |
| Class A Shares | | — | | 88,366 |
| Class F Shares | | 122,849 | | 300,765 |
| Class I Shares | | 87 | | 1,096 |
| Cost of shares redeemed: | | | | |
| Class A Shares | | (4,813,968) | | (9,670,277) |
| Class B Shares | | (409,740) | | (1,398,713) |
| Class C Shares | | (1,644,637) | | (2,247,031) |
| Class F Shares | | (11,603,374) | | (13,308,058) |
| Class I Shares | | (34,573) | | (85,982) |
| Class T Shares | | (70,385) | | (280,599) |
| Increase (Decrease) in Net Assets | | | | |
| from Capital Stock Transactions | | (16,811,951) | | (21,828,448) |
| Total Increase (Decrease) in Net Assets | | (56,855,664) | | (22,027,571) |
| |
| |
|
| Net Assets ($): | | | | |
| Beginning of Period | | 90,392,784 | | 112,420,355 |
| End of Period | | 33,537,120 | | 90,392,784 |
| Undistributed (distributions in excess of) | | | | |
| investment income—net | | 557,493 | | (240,574) |
18
| | | Year Ended December 31, |
| | |
|
| | | 2008 | | 2007a |
| |
| |
|
| Capital Share Transactions: | | | | |
| Class Ab | | | | |
| Shares sold | | 27,852 | | 84,664 |
| Shares issued for dividends reinvested | | — | | 3,480 |
| Shares redeemed | | (235,636) | | (347,430) |
| Net Increase (Decrease) in Shares Outstanding | | (207,784) | | (259,286) |
| |
| |
|
| Class Bb | | | | |
| Shares sold | | 200 | | 2,163 |
| Shares redeemed | | (19,981) | | (54,150) |
| Net Increase (Decrease) in Shares Outstanding | | (19,781) | | (51,987) |
| |
| |
|
| Class C | | | | |
| Shares sold | | 1,131 | | 5,275 |
| Shares redeemed | | (81,322) | | (87,181) |
| Net Increase (Decrease) in Shares Outstanding | | (80,191) | | (81,906) |
| |
| |
|
| Class F | | | | |
| Shares sold | | 52,898 | | 79,141 |
| Shares issued for dividends reinvested | | 5,239 | | 11,832 |
| Shares redeemed | | (611,154) | | (481,661) |
| Net Increase (Decrease) in Shares Outstanding | | (553,017) | | (390,688) |
| |
| |
|
| Class I | | | | |
| Shares sold | | 1,084 | | 1,393 |
| Shares issued for dividends reinvested | | 4 | | 44 |
| Shares redeemed | | (1,451) | | (3,191) |
| Net Increase (Decrease) in Shares Outstanding | | (363) | | (1,754) |
| |
| |
|
| Class T | | | | |
| Shares sold | | — | | 8 |
| Shares redeemed | | (3,468) | | (10,502) |
| Net Increase (Decrease) in Shares Outstanding | | (3,468) | | (10,494) |
| a | | Effective June 1, 2007, Class R shares were redesignated as Class I shares. |
| b | | During the period ended December 31, 2008, 6,499 Class B shares representing $135,000, were automatically |
| | | converted to 6,061 Class A shares and during the period ended December 31, 2007, 29,942 Class B shares |
| | | representing $771,552 were automatically converted to 28,062 Class A shares. |
| See notes to financial statements. |
The Fund 19
FINANCIAL HIGHLIGHTS
The following tables describe the performance for each share class for the fiscal periods indicated.All information (except portfolio turnover rate) reflects financial results for a single fund share.Total return shows how much your investment in the fund would have increased (or decreased) during each period, assuming you had reinvested all dividends and distributions.These figures have been derived from the fund’s financial statements.
| | | | | Year Ended December 31, | | |
| | |
| |
| |
|
| Class A Shares | | 2008 | | 2007 | | 2006 | | 2005 | | 2004 |
| |
| |
| |
| |
| |
|
| Per Share Data ($): | | | | | | | | | | |
| Net asset value, beginning of period | | 25.80 | | 26.22 | | 20.10 | | 16.76 | | 14.24 |
| Investment Operations: | | | | | | | | | | |
| Investment income (loss)—neta | | .25 | | (.01) | | (.01) | | (.14) | | (.11) |
| Net realized and unrealized | | | | | | | | | | |
| gain (loss) on investments | | (13.36) | | (.28) | | 6.13 | | 3.48 | | 2.63 |
| Total from Investment Operations | | (13.11) | | (.29) | | 6.12 | | 3.34 | | 2.52 |
| Distributions: | | | | | | | | | | |
| Dividends from investment income—net | | — | | (.13) | | — | | — | | — |
| Net asset value, end of period | | 12.69 | | 25.80 | | 26.22 | | 20.10 | | 16.76 |
| |
| |
| |
| |
| |
|
| Total Return (%)b | | (50.83) | | (1.15) | | 30.45 | | 19.93 | | 17.70 |
| |
| |
| |
| |
| |
|
| Ratios/Supplemental Data (%): | | | | | | | | | | |
| Ratio of total expenses | | | | | | | | | | |
| to average net assets | | 2.14 | | 2.00 | | 1.87 | | 2.29 | | 2.02 |
| Ratio of net expenses | | | | | | | | | | |
| to average net assets | | 1.74 | | 1.87 | | 1.78 | | 2.12 | | 1.92 |
| Ratio of net investment income | | | | | | | | | | |
| (loss) to average net assets | | 1.26 | | (.05) | | (.05) | | (.82) | | (.77) |
| Portfolio Turnover Rate | | 150 | | 93 | | 73 | | 729 | | 648 |
| |
| |
| |
| |
| |
|
| Net Assets, end of period ($ x 1,000) | | 8,504 | | 22,653 | | 29,817 | | 22,107 | | 19,726 |
| a | | Based on average shares outstanding at each month end. |
| b | | Exclusive of sales charge. |
| See notes to financial statements. |
20
| | | | | Year Ended December 31, | | |
| | |
| |
| |
|
| Class B Shares | | 2008 | | 2007 | | 2006 | | 2005 | | 2004 |
| |
| |
| |
| |
| |
|
| Per Share Data ($): | | | | | | | | | | |
| Net asset value, beginning of period | | 24.14 | | 24.65 | | 19.13 | | 16.09 | | 13.79 |
| Investment Operations: | | | | | | | | | | |
| Investment income (loss)—neta | | .03 | | (.26) | | (.22) | | (.28) | | (.23) |
| Net realized and unrealized | | | | | | | | | | |
| gain (loss) on investments | | (12.42) | | (.25) | | 5.74 | | 3.32 | | 2.53 |
| Total from Investment Operations | | (12.39) | | (.51) | | 5.52 | | 3.04 | | 2.30 |
| Net asset value, end of period | | 11.75 | | 24.14 | | 24.65 | | 19.13 | | 16.09 |
| |
| |
| |
| |
| |
|
| Total Return (%)b | | (51.33) | | (2.11) | | 28.91 | | 18.89 | | 16.68 |
| |
| |
| |
| |
| |
|
| Ratios/Supplemental Data (%): | | | | | | | | | | |
| Ratio of total expenses | | | | | | | | | | |
| to average net assets | | 3.20 | | 2.98 | | 2.85 | | 3.13 | | 2.89 |
| Ratio of net expenses | | | | | | | | | | |
| to average net assets | | 2.80 | | 2.87 | | 2.77 | | 2.97 | | 2.78 |
| Ratio of net investment income | | | | | | | | | | |
| (loss) to average net assets | | .17 | | (1.03) | | (1.17) | | (1.66) | | (1.63) |
| Portfolio Turnover Rate | | 150 | | 93 | | 73 | | 729 | | 648 |
| |
| |
| |
| |
| |
|
| Net Assets, end of period ($ x 1,000) | | 392 | | 1,283 | | 2,591 | | 16,421 | | 17,917 |
| a | | Based on average shares outstanding at each month end. |
| b | | Exclusive of sales charge. |
| See notes to financial statements. |
The Fund 21
| | FINANCIAL HIGHLIGHTS (continued) |
| | | | | Year Ended December 31, | | |
| | |
| |
| |
|
| Class C Shares | | 2008 | | 2007 | | 2006 | | 2005 | | 2004 |
| |
| |
| |
| |
| |
|
| Per Share Data ($): | | | | | | | | | | |
| Net asset value, beginning of period | | 24.30 | | 24.73 | | 19.12 | | 16.07 | | 13.76 |
| Investment Operations: | | | | | | | | | | |
| Investment income (loss)—neta | | .08 | | (.19) | | (.19) | | (.27) | | (.22) |
| Net realized and unrealized | | | | | | | | | | |
| gain (loss) on investments | | (12.53) | | (.24) | | 5.80 | | 3.32 | | 2.53 |
| Total from Investment Operations | | (12.45) | | (.43) | | 5.61 | | 3.05 | | 2.31 |
| Net asset value, end of period | | 11.85 | | 24.30 | | 24.73 | | 19.12 | | 16.07 |
| |
| |
| |
| |
| |
|
| Total Return (%)b | | (51.26) | | (1.82) | | 29.39 | | 18.98 | | 16.79 |
| |
| |
| |
| |
| |
|
| Ratios/Supplemental Data (%): | | | | | | | | | | |
| Ratio of total expenses | | | | | | | | | | |
| to average net assets | | 2.95 | | 2.68 | | 2.68 | | 3.08 | | 2.81 |
| Ratio of net expenses | | | | | | | | | | |
| to average net assets | | 2.55 | | 2.55 | | 2.60 | | 2.92 | | 2.70 |
| Ratio of net investment income | | | | | | | | | | |
| (loss) to average net assets | | .44 | | (.73) | | (.89) | | (1.60) | | (1.55) |
| Portfolio Turnover Rate | | 150 | | 93 | | 73 | | 729 | | 648 |
| |
| |
| |
| |
| |
|
| Net Assets, end of period ($ x 1,000) | | 1,514 | | 5,052 | | 7,169 | | 7,568 | | 10,249 |
| a | | Based on average shares outstanding at each month end. |
| b | | Exclusive of sales charge. |
| See notes to financial statements. |
22
| | | | | Year Ended December 31, | | |
| | |
| |
| |
|
| Class F Shares | | 2008 | | 2007 | | 2006 | | 2005 | | 2004 |
| |
| |
| |
| |
| |
|
| Per Share Data ($): | | | | | | | | | | |
| Net asset value, beginning of period | | 25.84 | | 26.21 | | 20.11 | | 16.76 | | 14.24 |
| Investment Operations: | | | | | | | | | | |
| Investment income (loss)—neta | | .30 | | .03 | | (.04) | | (.13) | | (.11) |
| Net realized and unrealized gain | | | | | | | | | | |
| (loss) on investments | | (13.37) | | (.27) | | 6.14 | | 3.48 | | 2.63 |
| Total from Investment Operations | | (13.07) | | (.24) | | 6.10 | | 3.35 | | 2.52 |
| Distributions: | | | | | | | | | | |
| Dividends from investment income—net | | (.06) | | (.13) | | — | | — | | — |
| Net asset value, end of period | | 12.71 | | 25.84 | | 26.21 | | 20.11 | | 16.76 |
| |
| |
| |
| |
| |
|
| Total Return (%) | | (50.71) | | (.94) | | 30.33 | | 19.99 | | 17.70 |
| |
| |
| |
| |
| |
|
| Ratios/Supplemental Data (%): | | | | | | | | | | |
| Ratio of total expenses | | | | | | | | | | |
| to average net assets | | 1.93 | | 1.82 | | 1.93 | | 2.24 | | 2.00 |
| Ratio of net expenses | | | | | | | | | | |
| to average net assets | | 1.53 | | 1.69 | | 1.85 | | 2.08 | | 1.89 |
| Ratio of net investment income | | | | | | | | | | |
| (loss) to average net assets | | 1.49 | | .12 | | (.20) | | (.76) | | (.75) |
| Portfolio Turnover Rate | | 150 | | 93 | | 73 | | 729 | | 648 |
| |
| |
| |
| |
| |
|
| Net Assets, end of period ($ x 1,000) | | 22,935 | | 60,918 | | 72,043 | | 64,112 | | 75,677 |
| |
| a Based on average shares outstanding at each month end. | | | | | | | | |
| See notes to financial statements. | | | | | | | | | | |
The Fund 23
| | FINANCIAL HIGHLIGHTS (continued) |
| | | | | Year Ended December 31, | | |
| | |
| |
| |
|
| Class I Shares | | 2008 | | 2007a | | 2006 | | 2005 | | 2004 |
| |
| |
| |
| |
| |
|
| Per Share Data ($): | | | | | | | | | | |
| Net asset value, beginning of period | | 25.17 | | 25.60 | | 19.60 | | 16.31 | | 13.82 |
| Investment Operations: | | | | | | | | | | |
| Investment income (loss)—netb | | .27 | | .04 | | .03 | | (.12) | | (.07) |
| Net realized and unrealized gain | | | | | | | | | | |
| (loss) on investments | | (13.03) | | (.28) | | 5.97 | | 3.41 | | 2.56 |
| Total from Investment Operations | | (12.76) | | (.24) | | 6.00 | | 3.29 | | 2.49 |
| Distributions: | | | | | | | | | | |
| Dividends from investment income—net | | (.02) | | (.19) | | — | | — | | — |
| Net asset value, end of period | | 12.39 | | 25.17 | | 25.60 | | 19.60 | | 16.31 |
| |
| |
| |
| |
| |
|
| Total Return (%) | | (50.75) | | (.98) | | 30.61 | | 20.17 | | 18.02 |
| |
| |
| |
| |
| |
|
| Ratios/Supplemental Data (%): | | | | | | | | | | |
| Ratio of total expenses | | | | | | | | | | |
| to average net assets | | 1.97 | | 1.83 | | 1.68 | | 2.08 | | 1.79 |
| Ratio of net expenses | | | | | | | | | | |
| to average net assets | | 1.56 | | 1.71 | | 1.61 | | 1.89 | | 1.68 |
| Ratio of net investment income | | | | | | | | | | |
| (loss) to average net assets | | 1.40 | | .13 | | .09 | | (.69) | | (.51) |
| Portfolio Turnover Rate | | 150 | | 93 | | 73 | | 729 | | 648 |
| |
| |
| |
| |
| |
|
| Net Assets, end of period ($ x 1,000) | | 71 | | 152 | | 200 | | 310 | | 190 |
| a | | Effective June 1, 2007, Class R shares were redesignated as Class I shares. |
| b | | Based on average shares outstanding at each month end. |
| See notes to financial statements. |
24
| | | | | Year Ended December 31, | | |
| | |
| |
| |
|
| Class T Shares | | 2008 | | 2007 | | 2006 | | 2005 | | 2004 |
| |
| |
| |
| |
| |
|
| Per Share Data ($): | | | | | | | | | | |
| Net asset value, beginning of period | | 24.56 | | 24.90 | | 19.16 | | 16.05 | | 13.70 |
| Investment Operations: | | | | | | | | | | |
| Investment income (loss)—neta | | .16 | | (.07) | | (.11) | | (.21) | | (.17) |
| Net realized and unrealized | | | | | | | | | | |
| gain (loss) on investments | | (12.69) | | (.27) | | 5.85 | | 3.32 | | 2.52 |
| Total from Investment Operations | | (12.53) | | (.34) | | 5.74 | | 3.11 | | 2.35 |
| Net asset value, end of period | | 12.03 | | 24.56 | | 24.90 | | 19.16 | | 16.05 |
| |
| |
| |
| |
| |
|
| Total Return (%)b | | (51.06) | | (1.37) | | 29.96 | | 19.38 | | 17.15 |
| |
| |
| |
| |
| |
|
| Ratios/Supplemental Data (%): | | | | | | | | | | |
| Ratio of total expenses | | | | | | | | | | |
| to average net assets | | 2.53 | | 2.21 | | 2.26 | | 2.70 | | 2.47 |
| Ratio of net expenses | | | | | | | | | | |
| to average net assets | | 2.13 | | 2.10 | | 2.18 | | 2.54 | | 2.36 |
| Ratio of net investment income | | | | | | | | | | |
| (loss) to average net assets | | .83 | | (.26) | | (.54) | | (1.24) | | (1.21) |
| Portfolio Turnover Rate | | 150 | | 93 | | 73 | | 729 | | 648 |
| |
| |
| |
| |
| |
|
| Net Assets, end of period ($ x 1,000) | | 122 | | 334 | | 600 | | 444 | | 510 |
| a | | Based on average shares outstanding at each month end. |
| b | | Exclusive of sales charge. |
| See notes to financial statements. |
The Fund 25
NOTES TO FINANCIAL STATEMENTS
NOTE 1—Significant Accounting Policies:
Dreyfus Passport Fund (the “fund”) is a separate diversified series of Dreyfus Funds, Inc. (the “Company”), which is registered under the Investment Company Act of 1940, as amended (the “Act”), as an open-end management investment company and operates as a series company currently offering five series, including the fund.The fund’s investment objective is to seek capital appreciation through investments in foreign small-cap companies. Founders Asset Management LLC (“Founders”) serves as the fund’s investment adviser. Founders is an indirect, wholly-owned subsidiary of The Bank of New York Mellon Corporation (“BNY Mellon”).
At a meeting of the Company’s Board of Directors held on September 22, 2008, the Board approved, effective December 1, 2008, a proposal to change the names of the Company and the fund from “Dreyfus Founders Funds, Inc.” and “Dreyfus Founders Passport Fund” to “Dreyfus Funds, Inc.” and “Dreyfus Passport Fund,” respectively.
Effective July 1, 2008, BNY Mellon reorganized and consolidated a number of its banking and trust company subsidiaries.As a result of the reorganization, any services previously provided to the fund by Mellon Bank, N.A. or Mellon Trust of New England, N.A. are now provided by The Bank of NewYork Mellon (formerly,The Bank of NewYork).
MBSC Securities Corporation (the “Distributor”), the direct owner of Founders and a wholly-owned subsidiary of The Dreyfus Corporation (“Dreyfus”), an affiliate of Founders, is the distributor of the fund’s shares. The fund is authorized to issue up to 600 million shares of Common Stock, par value $ .01 per share, in the following classes of shares: Class A, Class B, Class C, Class F, Class I and Class T shares. Class A and Class T shares are subject to a sales charge imposed at the time of purchase, although the shares may be purchased at net asset value (“NAV”) without a sales charge by certain categories of investors.
26
Class B shares are subject to a contingent deferred sales charge (“CDSC”) imposed on Class B share redemptions made within six years of purchase and automatically convert to Class A shares after six years. The fund does not offer Class B shares, except in connection with dividend reinvestment and permitted exchanges of Class B shares. Class C shares are subject to a CDSC imposed on Class C shares redeemed within one year of purchase. Class F and Class I shares are sold at NAV per share. Class F shares are sold only to Class F grandfathered investors, and Class I shares are sold only to eligible institutional investors. Effective December 3, 2008, investments for new accounts were no longer permitted in Class T of the fund, except that participants in certain group retirement plans were able to open a new account in Class T of the fund, provided that the fund was established as an investment option under the plans before December 3, 2008. Other differences between the classes include the services offered to and the expenses borne by each class. Income and realized and unrealized gains or losses on investments are allocated to each class of shares based on its relative net assets.
Each class of the fund bears expenses incurred specifically on its behalf and, in addition, each class bears a portion of general expenses based on the relative net assets or the number of shareholder accounts of the class.The type of expense determines the allocation method.
The fund’s financial statements are prepared in accordance with U.S. generally accepted accounting principles, which may require the use of management estimates and assumptions. Actual results could differ from those estimates.
The fund enters into contracts that contain a variety of indemnifications. The fund’s maximum exposure under these arrangements is unknown.The fund does not anticipate recognizing any loss related to these arrangements.
The Fund 27
| NOTES TO FINANCIAL STATEMENTS (continued) |
(a) Portfolio valuation: A domestic equity security listed or traded on a securities exchange or in the over-the-counter market is valued at its last sale price on the exchange or market where it is principally traded or, in the case of a security traded on NASDAQ, at its official closing price. Lacking any sales on that day, the security is valued at the current closing bid price, or by quotes from dealers making a market in the security if the closing bid price is not available.
A foreign equity security traded on a foreign exchange is valued at the last quoted official closing price available before the time when the fund’s assets are valued, or at the last quoted sales price if the exchange does not provide an official closing price or if the foreign market has not yet closed. Lacking any sales that day, the security is valued at the current closing bid price. NewYork closing exchange rates are used to convert foreign currencies to U.S. dollars.
A debt security with a remaining maturity greater than 60 days at the time of purchase is valued in accordance with the evaluated bid price supplied by a pricing service approved by the Company’s Board of Directors or, if such price is not available, at the mean between the highest bid and lowest asked quotations obtained from at least two securities dealers.A debt security with a remaining maturity of 60 days or less at the time of purchase is valued at amortized cost, which approximates market value, unless it is determined that amortized cost would not represent market value, in which case the securities would be marked to market.
Registered investment companies that are not traded on an exchange are valued at their NAV.
If market quotations or official closing prices are not readily available or are determined not to reflect accurately fair value, securities will be valued at their fair value as determined in good faith by the Company’s Board of Directors or pursuant to procedures approved by the Board of Directors.These situations may include instances where an event occurs after the close of the market on which a security is traded but before the fund calculates its NAV, and it is determined that the event has materially
28
affected the value of the security. Fair value of foreign equity securities may be determined with the assistance of a pricing service using calculations based on indices of domestic securities and other appropriate indicators, such as prices of relevant ADRs and futures contracts.
The fund adopted Statement of Financial Accounting Standards No. 157 “FairValue Measurements” (“FAS 157”). FAS 157 establishes an authoritative definition of fair value, sets out a framework for measuring fair value, and requires additional disclosures about fair value measurements.
Various inputs are used in determining the value of the fund’s investments relating to FAS 157.These inputs are summarized in the three broad levels listed below.
Level 1—quoted prices in active markets for identical securities.
Level 2—other significant observable inputs (including quoted
prices for similar securities, interest rates, prepayment speeds, credit
risk, etc.).
Level 3—significant unobservable inputs (including the fund’s own
assumptions in determining the fair value of investments). |
The inputs or methodology used for valuing securities are not necessarily an indication of the risk associated with investing in those securities.
The following is a summary of the inputs used as of December 31, 2008 in valuing the fund’s investments carried at fair value:
| | | Investments in | | Other Financial |
| Valuation Inputs | | Securities ($) | | Instruments ($)† |
| |
| |
|
| Level 1—Quoted Prices | | 21,873,752 | | 0 |
| Level 2—Other Significant | | | | |
| Observable Inputs | | 10,834,307 | | 0 |
| Level 3—Significant | | | | |
| Unobservable Inputs | | 66,861 | | 0 |
| Total | | 32,774,920 | | 0 |
| † | | Other financial instruments include derivative instruments such as futures, forward currency |
| | | exchange contracts and swap contracts, which are valued at the unrealized appreciation |
| | | (depreciation) on the instrument and written options contracts which are shown at value. |
The Fund 29
| NOTES TO FINANCIAL STATEMENTS (continued) |
The following is a reconciliation of Level 3 assets for which significant unobservable inputs were used to determine fair value:
| | | Investments in |
| Valuation Inputs | | Securities ($) |
| |
|
| Balance as of 12/31/2007 | | 0 |
| Realized gain (loss) | | 0 |
| Change in unrealized appreciation (depreciation) | | (368,019) |
| Net purchases (sales) | | 0 |
| Transfers in and/or out of Level 3 | | 434,880 |
| Balance as of 12/31/2008 | | 66,861 |
(b) Foreign securities and currency transactions: The fund normally will invest a large portion of its assets in foreign securities. In the event the fund executes a foreign security transaction, the fund may enter into a foreign currency contract to settle the foreign security transaction. The fund could be exposed to risk if counterparties are unable to meet the terms of the contracts or if the value of the currency changes unfavorably to the U.S. dollar.The resultant foreign currency gain or loss from the contract is recorded as foreign currency gain or loss and is presented as such in the Statement of Operations.
Investing in foreign markets may involve special risks and considerations not typically associated with investing in the U.S. These risks include revaluation of currencies, high rates of inflation, repatriation restrictions on income and capital, and adverse political and economic developments. Moreover, securities issued in these markets may be less liquid, subject to government ownership controls and delayed settlements, and their prices may be more volatile than those of comparable securities in the U.S.
The accounting records of the fund are maintained in U.S. dollars.The market values of foreign securities, currency holdings and other assets and liabilities are translated into U.S. dollars based on the current exchange rates each business day. Purchases and sales of investment securities and income and expense items denominated in foreign currencies are translated into U.S. dollar amounts on the respective dates of such transactions.
30
The fund does not isolate that portion of the results of operations resulting from changes in foreign exchange rates on investments from the fluctuations arising from changes in market prices of securities held. Such fluctuations are included with the net unrealized appreciation (depreciation) from investments and foreign currency transactions in the Statement of Operations.
Reported net realized foreign exchange gains or losses arise from sales of foreign currencies,currency gains or losses realized between the trade and settlement dates on securities transactions,and the difference between the amounts of dividends,interest,and foreign withholding taxes recorded on the fund’s books and the U.S. dollar equivalent of the amounts actually received or paid. Net unrealized appreciation or depreciation on investments and foreign currency translation arises from changes in the values of assets and liabilities, including investments in securities held at the date of the financial statements, resulting from changes in the exchange rates and changes in market prices of securities held.
(c) Securities transactions and investment income: Securities transactions are recorded on a trade date basis. Realized gains and losses from securities transactions are recorded on the identified cost basis. Dividend income is recognized on the ex-dividend date and interest income, including, where applicable, accretion of discount and amortization of premium on investments, is recognized on the accrual basis.
The fund has arrangements with the custodian and cash management bank whereby the fund may receive earnings credits when positive cash balances are maintained, which are used to offset custody and cash management fees. For financial reporting purposes, the fund includes net earnings credits as an expense offset in the Statement of Operations.
(d) Affiliated issuers: Investments in other investment companies advised by Founders or its affiliates are defined as “affiliated” in the Act.
(e) Dividends to shareholders: Dividends are recorded on the ex-dividend date. Dividends from investment income-net and dividends from net realized capital gains, if any, are normally declared and paid annu-
The Fund 31
| NOTES TO FINANCIAL STATEMENTS (continued) |
ally, but the fund may make distributions on a more frequent basis to comply with the distribution requirements of the Internal Revenue Code of 1986, as amended (the “Code”).To the extent that net realized capital gains can be offset by capital loss carryovers, it is the policy of the fund not to distribute such gains. Income and capital gain distributions are determined in accordance with income tax regulations, which may differ from U.S. generally accepted accounting principles.
(f) Federal income taxes: No provision has been made for federal income taxes since it is the policy of the fund to comply with the requirements of Subchapter M of the Code that are applicable to regulated investment companies and to make distributions of income and capital gains sufficient to relieve it from all income taxes.The fund is treated as a separate tax entity for federal income tax purposes.
As of and during the period ended December 31, 2008, the fund did not have any liabilities for any unrecognized tax positions. The fund recognizes interest and penalties, if any, related to unrecognized tax positions as income tax expense in the Statement of Operations. During the period, the fund did not incur any interest or penalties.
Each of the tax years in the four-year period ended December 31, 2008 remains subject to examination by the Internal Revenue Service and state taxing authorities.
At December 31, 2008, the components of accumulated earnings on a tax basis were as follows: undistributed ordinary income $551,395, accumulated capital losses $100,014,691 and unrealized depreciation $10,930,834. In addition, the fund had $8,593,283 of capital losses realized after October 31, 2008, which were deferred for tax purposes to the first day of the following fiscal year.
The accumulated capital loss carryover is available for federal income tax purposes to be applied against future net securities profits, if any, realized subsequent to December 31, 2008. If not applied, $72,594,825 of the carryover expires in fiscal 2009, $11,833,084 expires in fiscal 2010 and $15,586,782 expires in fiscal 2016.
32
The tax character of distributions paid to shareholders during the fiscal periods ended December 31, 2008 and December 31, 2007 were as follows: ordinary income $126,692 and $423,572, respectively.
During the period ended December 31, 2008, as a result of permanent book to tax differences, primarily due to the tax treatment for foreign currency transactions and passive foreign investment companies, the fund increased accumulated undistributed investment income-net by $80,267 and decreased accumulated net realized gain (loss) on investments by the same amount. Net assets and net asset value per share were not affected by this reclassification.
NOTE 2—Bank Line of Credit:
The Company has a line of credit arrangement (“LOC”) with State Street Bank and Trust Company, to be used for temporary or emergency purposes, primarily for financing redemption payments. The borrowings by each series of the Company are limited to the lesser of (a) $25 million, or (b) the lesser of 25% of the series’ total net assets or the maximum amount which the series is permitted to borrow pursuant to the prospectus, any law or any other agreement. Combined borrowings are subject to the $25 million cap on the total LOC. Each series agrees to pay annual fees and interest on the unpaid balance based on prevailing market rates as defined in the LOC.
The average daily amount of borrowings outstanding under the LOC during the period ended December 31,2008,was approximately $17,600 with a related weighted average annualized interest rate of 3.18% .
NOTE 3—Investment Advisory Fee and Other Transactions With Affiliates:
(a) In accordance with an investment advisory agreement between the Company and Founders, the fund compensates Founders for its services as investment adviser by the payment of fees computed daily and paid monthly at an annual rate equal to a percentage of the average daily
The Fund 33
| NOTES TO FINANCIAL STATEMENTS (continued) |
value of the fund’s net assets.The fee is 1% of the first $250 million of net assets, .80% of the next $250 million of net assets, and .70% of net assets in excess of $500 million. For the period from January 1, 2008 through September 13, 2008, Founders waived 25% of its investment advisory fee for the fund. The waiver ended on September 14, 2008, and on that date the fund’s contractual investment advisory fee again became effective.The reduction in investment advisory fee amounted to $126,616 during the period ended December 31, 2008.
During the period ended December 31, 2008, the Distributor retained $84 from commissions earned on sales of the fund’s Class A shares, and $4,194 and $393 from CDSCs on redemptions of the fund’s Class B and Class C shares, respectively.
(b) Under a Distribution Plan (the “Class B, C and T Plan”) adopted pursuant to Rule 12b-1 under the Act, Class B, Class C and Class T shares pay the Distributor for distributing their shares at an annual rate of .75% of the value of the average daily net assets of Class B and Class C shares and .25% of the value of the average daily net assets of Class T shares. During the period ended December 31, 2008, Class B, Class C and Class T shares were charged $5,580, $22,238 and $557, respectively, pursuant to the Class B, C and T Plan.
The fund also has adopted a Distribution Plan pursuant to Rule 12b-1 under the Act applicable to its Class F shares (the “Class F Plan”). Under the Class F Plan, the fund is authorized to reimburse the Distributor for expenses paid for distributing or servicing its Class F shares at an annual rate of up to .25% of the value of the average daily net assets of the Fund’s Class F shares. During the period ended December 31, 2008, Class F shares were charged $76,333 pursuant to the Class F Plan.
(c) Under the Shareholder Services Plan, Class A, Class B, Class C and ClassT shares pay the Distributor at an annual rate of .25% of the value of their average daily net assets for the provision of certain services. The services provided may include personal services relating to shareholder accounts, such as answering shareholder inquiries regarding the
34
fund and providing reports and other information, and services related to the maintenance of shareholder accounts. The Distributor may make payments to Service Agents (a securities dealer, financial institution or other industry professional) in respect of these services. The Distributor determines the amounts to be paid to Service Agents. During the period ended December 31, 2008, Class A, Class B, Class C and Class T shares were charged $38,133, $1,860, $7,413 and $557, respectively, pursuant to the Shareholder Services Plan.
The Company has a shareholder services agreement with the Distributor whereby the fund has agreed to compensate the Distributor for providing certain shareholder servicing functions to holders of Class F shares.The fund paid the Distributor a monthly fee equal, on an annual basis, to $24.00 per Class F shareholder account considered to be an open account at any time during a given month. During the period ended December 31, 2008, Class F shares were charged $23,275 pursuant to this shareholder services agreement.
Dreyfus Transfer, Inc. (“DTI”), a wholly-owned subsidiary of Dreyfus, is the transfer and dividend disbursing agent for all of the fund’s share classes. The Distributor pays the transfer and dividend agent fees, other than out-of-pocket charges, for Class F only. During the period ended December 31, 2008, Class F shares were charged $688 for out-of-pocket transfer agent charges.
The fees charged by DTI with respect to the fund’s Class A, Class B, Class C, Class I and Class T shares are paid by the fund.These transfer agency fees, including both the per account fees paid to DTI and out-of-pocket charges, during the period ended December 31, 2008 were $32,563.
The fund compensates The Bank of New York Mellon, a subsidiary of BNY Mellon and an affiliate of Founders, under two cash management agreements for performing cash management services related to fund subscriptions and redemptions. During the period ended December 31,
The Fund 35
| NOTES TO FINANCIAL STATEMENTS (continued) |
2008, the fund was charged $8,428 for these services. These fees were partially offset by earnings credits pursuant to the cash management agreements.
The fund compensates The Bank of New York Mellon under a custody agreement for providing custodial services for the fund. During the period ended December 31, 2008, the fund was charged $82,990 for these services, which were partially offset by earnings credits pursuant to the custody agreement.
The fund has agreed to compensate Dreyfus for providing accounting services, administration, compliance monitoring, regulatory and shareholder reporting, as well as related facilities, equipment and clerical help.The fee is computed at the annual rate of .10% of the average daily net assets of the fund on the first $500 million, .065% of the average daily net assets of the fund on the next $500 million and .02% of the average daily net assets of the fund in excess of $1 billion, plus reasonable out-of- pocket expenses. Dreyfus has contractually agreed in writing to waive any fees received for these services to the extent they exceed its costs in providing the services and a reasonable allocation of the costs incurred by Founders and its affiliates related to the support and oversight of these services. During the period ended December 31, 2008, Dreyfus waived $27,683.
The components of “Due to Founders Asset Management LLC and affiliates” in the Statement of Assets and Liabilities consist of: investment advisory fees $28,853, Rule 12b-1 distribution plan fees $5,879, shareholder services plan fees $12,206, custodian fees $20,198, compliance support fees $1,833, transfer agency per account fees $5,166 and accounting fees $2,753.
(d) Annual retainer fees and attendance fees for the Company’s Board of Directors are allocated to each series of the Company based on net assets. During the period ended December 31, 2008, the fund paid $4,347 in directors’ fees.The Company’s Board of Directors has adopted
36
a deferred compensation plan for Company directors that enables directors to elect to defer receipt of all or a portion of the annual compensation that they are entitled to receive from the Company. Under the plan, the compensation deferred is invested in shares of one or more of the Company’s series.The amount paid to the director under the plan will be determined based upon the performance of the selected series. The current value of these amounts is included in Other Assets and Directors’ Deferred Compensation in the Statement of Assets and Liabilities. Increases in the market value of the deferred compensation accounts are added to the directors’ fees and expenses paid by the fund in the directors’ fees and expenses in the Statement of Operations, and decreases in the market value of the accounts are subtracted from such fees. During the period ended December 31, 2008, depreciation in the value of the accounts totaled $74,575.This depreciation also is included in the net unrealized appreciation (depreciation) on investments in the Statement of Operations. Deferral of directors’ fees under the plan does not affect the net assets of the fund.
Certain officers of the Company are also officers and/or directors of Founders or its affiliates, which pay their compensation. However, the fund pays a portion of the cost of the services performed by the Company’s Chief Compliance Officer and her staff. During the period ended December 31, 2008, the fund was charged $1,833 for these services, which is included in miscellaneous expenses. The affairs of the fund, including services provided by Founders, are subject to the supervision and general oversight of the Company’s Board of Directors.
(e) Effective on December 1, 2007 a 1% redemption fee was implemented by the fund on certain shares redeemed within sixty days following the date of their issuance, including redemptions made through the use of the fund’s exchange privilege. During the period ended December 31, 2008, redemption fees charged and retained by the fund amounted to $74.
The Fund 37
| NOTES TO FINANCIAL STATEMENTS (continued) |
NOTE 4—Securities Transactions:
The aggregate amount of purchases and sales of investment securities, excluding short-term securities, financial futures and forward currency exchange contracts, during the period ended December 31, 2008, amounted to $92,128,304 and $131,611,599, respectively.
The fund may invest in financial futures contracts in order to gain exposure to or protect against changes in the market. The fund is exposed to market risk as a result of changes in the value of the underlying financial instruments. Investments in financial futures require the fund to “mark to market” on a daily basis, which reflects the change in market value of the contracts at the close of each day’s trading.Accordingly, variation margin payments are received or made to reflect daily unrealized appreciation or depreciation. When the contracts are closed, the fund recognizes a realized gain or loss.These investments require initial margin deposits with a broker, which consist of cash or cash equivalents.The amount of these deposits is determined by the exchange or Board of Trade on which the contract is traded and is subject to change. At December 31, 2008, there were no financial futures contracts outstanding.
The fund enters into forward currency exchange contracts in order to hedge its exposure to changes in foreign currency exchange rates on its foreign portfolio holdings and to settle foreign currency transactions. When executing forward currency exchange contracts, the fund is obligated to buy or sell a foreign currency at a specified rate on a certain date in the future. With respect to sales of forward currency exchange contracts, the fund would incur a loss if the value of the contract increases between the date the forward contract is opened and the date the forward contract is closed.The fund realizes a gain if the value of the contract decreases between those dates.With respect to purchases of forward currency exchange contracts, the fund would incur a loss if the value of the contract decreases between the date the forward contract is opened and the date the forward contract is closed. The fund realizes a gain if the value of the contract increases between those dates.
38
The fund is also exposed to credit risk associated with counterparty nonperformance on these forward currency exchange contracts which is typically limited to the unrealized gain on each open contract. At December 31, 2008, there were no forward currency exchange contracts outstanding.
At December 31, 2008, the cost of investments for federal income tax purposes was $43,708,499; accordingly, accumulated net unrealized depreciation on investments was $10,933,579, consisting of $1,325,479 gross unrealized appreciation and $12,259,058 gross unrealized depreciation.
In March 2008, the Financial Accounting Standards Board released Statement of Financial Accounting Standards No. 161 “Disclosures about Derivative Instruments and Hedging Activities” (“FAS 161”). FAS 161 requires qualitative disclosures about objectives and strategies for using derivatives, quantitative disclosures about fair value amounts of gains and losses on derivative instruments and disclosures about credit-risk-related contingent features in derivative agreements. The application of FAS 161 is required for fiscal years and interim periods beginning after November 15, 2008.At this time, management is evaluating the implications of FAS 161 and its impact on the financial statements and the accompanying notes has not yet been determined.
NOTE 5—Subsequent Event:
On February 4, 2009, the fund issued to each holder of its Class T shares, in exchange for said shares, Class A shares of the fund having an aggregate net asset value equal to the aggregate net asset value of the shareholder’s Class T shares. Subsequent investments in the fund’s Class A shares made by prior holders of the fund’s Class T shares who received Class A shares of the fund in exchange for their ClassT shares are subject to the front-end sales load schedule that was in effect for Class T shares at the time of the exchange. Otherwise, all other Class A share attributes will be in effect.
The Fund 39
REPORT OF INDEPENDENT REGISTERED
PUBLIC ACCOUNTING FIRM |
| | Shareholders and Board of Directors
Dreyfus Passport Fund |
We have audited the accompanying statement of assets and liabilities, including the statement of investments, of Dreyfus Passport Fund (formerly, Dreyfus Founders Passport Fund) (one of the series comprising Dreyfus Funds, Inc.) as of December 31, 2008, and the related statement of operations for the year then ended and the statement of changes in net assets and financial highlights for each of the two years in the period then ended. These financial statements and financial highlights are the responsibility of the Fund’s management. Our responsibility is to express an opinion on these financial statements and financial highlights based on our audits.The financial highlights for the years ended December 31, 2006, 2005 and 2004 were audited by other auditors whose report dated February 23, 2007, expressed an unqualified opinion on such financial highlights.
We conducted our audits in accordance with the standards of the Public Company Accounting Oversight Board (United States).Those standards require that we plan and perform the audit to obtain reasonable assurance about whether the financial statements and financial highlights are free of material misstatement.We were not engaged to perform an audit of the Fund’s internal control over financial reporting. Our audits included consideration of internal control over financial reporting as a basis for designing audit procedures that are appropriate in the circumstances, but not for the purpose of expressing an opinion on the effectiveness of the Fund’s internal control over financial reporting. Accordingly, we express no such opinion.An audit also includes examining, on a test basis, evidence supporting the amounts and disclosures in the financial statements and financial highlights, assessing the accounting principles used and significant estimates made by management, and evaluating the overall financial statement presentation. Our procedures included confirmation of securities owned as of December 31, 2008 by correspondence with the custodian and others.We believe that our audits provide a reasonable basis for our opinion.
In our opinion, the 2008 and 2007 financial statements and financial highlights referred to above present fairly, in all material respects, the financial position of Dreyfus Passport Fund at December 31, 2008, the results of its operations for the year then ended and the changes in its net assets and the financial highlights for each of the two years in the period then ended, in conformity with U.S. generally accepted accounting principles.

New York, New York
February 23, 2009 |
40
IMPORTANT TAX INFORMATION ( U n a u d i t e d )
In accordance with federal tax law, the fund elects to provide each shareholder with their portion of the fund’s foreign taxes paid and the income sourced from foreign countries. Accordingly, the fund hereby makes the following designations regarding its fiscal year ended December 31, 2008:
| — | | the total amount of taxes paid to foreign countries was $196,237. |
| — | | the total amount of income sourced from foreign countries was |
| | | $754,086. |
As required by federal tax law rules, shareholders will receive notification of their proportionate share of foreign taxes paid and foreign sourced income for the calendar year 2008 with Form 1099-DIV.
For the fiscal year ended December 31, 2008, certain dividends paid by the fund may be subject to a maximum tax rate of 15%, as provided for by the Jobs and Growth Tax Relief Reconciliation Act of 2003. Of the distributions paid during the fiscal year, $126,692 represents the maximum amount that may be considered qualified dividend income.
The Fund 41
FACTORS CONSIDERED IN RENEWING
THE ADVISORY AGREEMENT (Unaudited) |
At a meeting of the board of directors of Dreyfus Funds, Inc. (the “Funds” and, in reference to any one of the Funds’ portfolios, a “Fund”) held on August 20 and 21, 2008, the Funds’ directors unanimously approved the continuation of the Investment Advisory Agreement (“management agreement”) between each of the Funds and Founders Asset Management LLC, the Funds’ investment adviser (“Founders”), for a one-year term ending August 31, 2009.The board of directors of the Funds (“board”) is comprised entirely of individuals who have no affiliation with Founders or any affiliates of Founders (the “directors”).
Prior to the directors’ August 2008 meeting, Founders had provided the directors with extensive materials related to the renewal of the management agreement, including performance and expense information for other investment companies with similar investment objectives to each Fund derived from data compiled by Lipper Inc., an independent third party (“Lipper”).
During their meeting, the directors discussed the proposed continuance of the management agreement with the senior management personnel of Founders. At the conclusion of these discussions, the directors and their independent counsel met in a private session at which no representatives of Founders were present, to continue their discussion of continuance of the agreement. In determining to continue the management agreement, the directors considered all factors which they believed to be relevant, including the following:
Nature, Extent and Quality of Services Provided and to be Provided by Founders
The directors recognized that they have had the opportunity to evaluate the investment and non-investment related services which Founders and its affiliates provide to the Funds primarily through their quarterly review of all of the operations of the Funds during Fund committee and Fund board meetings held throughout the past twelve months. At each such meeting, extensive discussions of Fund opera-
42
tions are held with senior management personnel of Founders and a large volume of documentation with respect to these operations is provided to and reviewed by the directors. Such discussions and documentation afford the directors the continual opportunity to evaluate the nature, extent, and quality of the services provided by Founders and its affiliates to the Funds.
The directors were satisfied that Founders is managing the investment of the assets of the Funds in accordance with each Fund’s respective investment objective, policies and restrictions, subject to the directors’ overall supervision.
The directors considered that Founders also provides many non-investment related services to the Funds in fulfilling its responsibilities under the management agreement.
Following their discussion and review, the directors reached the following conclusions:
- That the breadth and quality of investment advisory and other ser- vices being provided to the Funds are satisfactory, as evidenced in part by the performance records of the Funds, to which the direc- tors gave significant attention as indicated below; and
- That the directors are satisfied not only with the research, long-term portfolio management, and trading services being provided to the Funds, but also recognize that Founders or its affiliates have provided the highest quality accounting, compliance and regulatory, adminis- trative, underwriting, custody, shareholder, transfer agent and cash management services to the Funds, while charging fair, reasonable and competitive fees.
Investment Performance
On a quarterly basis, the directors hold meetings with representatives of the portfolio management team for each Fund (usually a portfolio manager), during which each representative reviews, among other items, performance information, attribution analyses, and the portfolio
The Fund 43
FACTORS CONSIDERED IN RENEWING THE
ADVISORY AGREEMENT (Unaudited) (continued) |
manager’s investment outlook. The directors also receive written monthly and quarterly performance information for each Fund. The written quarterly reports included comparisons of each Fund’s performance with its respective Lipper category and one or more benchmark indexes, as well as a comparable exchange-traded fund, for the most recent quarter and one-, three-, five-, and ten-year periods, as well as for the portfolio manager’s tenure.
In conjunction with their consideration of renewal of the management agreement, the directors received a more detailed performance report about each Fund from Lipper.These reports compared each Fund’s performance to both a relatively small group of similar funds selected by Lipper (the “Lipper performance group”), as well as to all funds in the applicable Lipper category (the “Lipper performance universe”).
The performance of Passport Fund’s Class F shares placed in the bottom quartile of its Lipper performance group and the fifth quintile of its Lipper international small-/mid-cap growth fund performance universe for the one-year period ended December 31, 2007, in the fifth and third quintiles, respectively, of its Lipper performance universe for the three- and five-year periods ended December 31, 2007, and underperformed its benchmark index for the one-, three- and five-year periods ended June 30, 2008. The directors noted that year-to-date as of June 30, 2008, the Fund’s performance placed it in the third quintile of its Lipper competitive peer group.The directors noted that Passport Fund’s most recent performance had improved relative to the performance results which it experienced in calendar year 2007.The directors deemed these recent relative performance results to be satisfactory, but stressed the importance to Founders of the need to continue to seek to improve the Fund’s longer-term performance record.
After consideration of all relevant information and data, the directors concluded that although past performance cannot be a guaranty of future performance, each Fund and its shareholders would continue to
44
benefit from Founders’ investment management of the Fund. The directors further determined:
- That although certain of the Funds have experienced performance difficulties, Founders has focused its efforts upon improving the per- formance records of the Funds and will continue to seek improve- ment; and
- That the materials provided by Lipper demonstrated that most of the Funds maintained satisfactory long-term performance quintile rankings in their respective comparison universes, with three of five Funds placing in the top three quintiles of their respective Lipper performance universes for the three-year period ended December 31, 2007, and four of five Funds placing in the top three quintiles of their respective Lipper performance universes for the five-year period ended December 31, 2007.
Costs of the Services to be Provided and Profits to be
Realized by Founders and Its Affiliates from Founders’
Relationship With the Funds |
The directors recognized that on a quarterly basis, they received information with respect to each Fund’s expenses. The directors carefully reviewed and discussed the expense ratios for all classes of shares of each Fund at each of their quarterly meetings throughout the year.
In conjunction with their annual consideration of renewal of the Funds’ management agreement and other service arrangements, the directors received detailed information from Lipper which compared each Fund’s management fees and other expenses with those of a group of similar funds selected by Lipper (the “Lipper expense group”), as well as summary information comparing each Fund’s management fees and expenses with those of the funds in its Lipper performance universe with load structures similar to that of the Funds (the “Lipper expense universe”).
The Fund 45
FACTORS CONSIDERED IN RENEWING THE
ADVISORY AGREEMENT (Unaudited) (continued) |
The directors noted that for the period ended December 31, 2007, Passport Fund’s management fees ranked in the third quintile of its Lipper expense group, with the Fund’s fees the sixth lowest of 12 “peer funds.” The Fund’s contractual management fees at a common asset level were determined by Lipper to be the fourth lowest of the 12 funds in its group.The Fund’s management fees were in the third quin-tile of its Lipper expense universe.
The directors also considered information provided by Lipper with respect to the profitability of the investment management activities conducted by a number of publicly-held corporations. Lipper also prepared an analysis providing detailed information with respect to the types of services rendered to various mutual fund complexes under their respective investment advisory contracts, including the services provided by Founders to the Funds under the management agreement.
The directors had been provided with extensive materials with respect to the profitability derived by Founders from providing investment advisory services to the Funds as a group and to each Fund individually.
The directors further considered certain indirect benefits received by Founders and its affiliates as a result of Founders’ provision of investment advisory services to the Funds.These included the following:
- Since Founders manages a non-Fund account in a style that is sim- ilar to that used for one of the Funds (and for a portion of another Fund), and employees of Founders manage other non-Fund accounts in their capacities as employees of the affiliates, Founders and its affiliates realize efficiencies in performing the portfolio man- agement, trading and operational functions related to those non- Fund accounts;
- The Funds’ brokerage transactions may be executed with brokers that provide research and brokerage services to Founders and its affiliates. These research and brokerage services may be useful to Founders and its affiliates in providing investment advisory services to any of the clients they advise, including the Funds; and
46
- Affiliates of Founders receive various fees for providing accounting, underwriting, shareholder, transfer agency, custody and cash man- agement services to the Funds.
After deliberation and discussion of Fund fees and expenses, the directors determined:
- That upon review of the advisory fee structures of the Funds in comparison with the competitive expense groups and expense uni- verses selected by Lipper, the levels of investment advisory fees paid by the Funds were deemed to be competitive;
- That the expense ratios of the Funds are competitive and that Founders continually reviews each Fund’s total expense ratio in an effort to maintain Fund expense ratios at reasonable and competi- tive levels;
- That three of the five Funds’ expense ratios decreased or remained substantially the same for all or most of their share classes in 2007 as compared to those experienced in 2006; and
- That the comparative fee and expense information included in the materials provided by Lipper supports the determination that the advisory and other fees payable by the Funds to Founders and its affiliates are essentially fees which would be similar to those that would have resulted solely from “arm’s-length” bargaining.
With respect to profitability to Founders, the directors reviewed the adviser profitability analysis provided by Lipper, which demonstrated that Founders’ 2007 profitability from providing management services to the Funds was reasonable in comparison to the entities included in the Lipper analysis.
The directors were also advised by independent counsel of the profitability percentage ranges which court cases have found acceptable and determined that Founders’ profitability percentage for providing management services to the Funds was reasonable.
The Fund 47
FACTORS CONSIDERED IN RENEWING THE
ADVISORY AGREEMENT (Unaudited) (continued) |
The directors concluded that Founders’ profits from providing management services to the Funds were reasonable in relationship to the overall services which Founders provides.
Economies of Scale
The directors reviewed information provided by Founders which summarized the extent, if any, that both Founders and the Funds would achieve certain economies of scale if the assets of the Funds were to increase.
After review and discussion, the directors considered the extent to which economies of scale and common management are shared with each Fund, including the economies that would be realized from the growth of each Fund’s assets. After such consideration, the directors determined that all of the Funds have structured breakpoints in their advisory fees, which result in fee reductions as the assets of each Fund reach defined levels, and that such fee reductions, when implemented, would benefit all of the applicable Fund’s shareholders through decreases in the Fund’s expense ratio.
Dedication to Regulatory Requirements and Restrictions
An important factor in the directors’ consideration of renewal of the Funds’ management agreement with Founders included the directors’ recognition of the dedication by Founders of stringent adherence to regulatory requirements and restrictions.The directors determined that Founders is dedicated to compliance with all applicable rules and regulations and that the systems of controls which are in place to ensure that the service providers to the Funds, including Founders, and the Funds themselves, maintain strict adherence to the law are excellent.
Overall Conclusions
The directors determined that they are generally satisfied with the performance of the Funds and with the quality of the advisory and other services being provided by Founders and its affiliates to the Funds. The directors recognized that efforts are being and will con-
48
tinue to be made to improve the Fund’s performance and to maintain Fund expense ratios at reasonable and competitive levels.
The directors concluded that continuation of the current management agreement between each Fund and Founders, which would enable each Fund to continue to receive investment advisory services from Founders, is in the best interests of each Fund and its shareholders, the services to be performed under the management agreement are services required for the operations of the Funds, Founders has provided satisfactory investment management services to the Funds in the past, and the fees for the management services which Founders will perform will be within the range of what would have been negotiated at arm’s length in light of the circumstances.
The Fund 49
YOUR BOARD REPRESENTATIVES (Unaudited)
The Board of Directors of the Company oversees the Company’s five series portfolios (the “Funds”). The business and affairs of the Company are managed under the direction of the Board.The directors serving on the Board perform their responsibilities in the manner which they reasonably believe to be in the best interests of the Funds and their shareholders.
All of the directors, as listed below, are independent directors.They are not affiliated with the Fund’s adviser, its parent company, or its affiliates. The directors have no official term of office and generally serve until they retire (normally at age 75, but subject to extension to age 80), resign, or are not re-elected. As you can see from their backgrounds, the directors have broad experience as active or former business and community leaders.
Directors
Alan S. Danson, 69.Year elected to the Board: 1991
Board Chairman.Private investor.Formerly,President and Director,D.H.Management, Inc., the general partner of a limited partnership with technology company holdings (1996 to 2003). Director, Gore Range Natural Science School and The Les Streeter Program, Inc., both of which are non-profit organizations.
Robert P. Mastrovita, 64.Year elected to the Board: 1998
Private investor. Chairman of a private charitable foundation (1997 to present). Formerly, Chairman and Director, Hagler, Mastrovita & Hewitt, Inc., a registered investment adviser (1982 to 1997). Member, Boston Society of Security Analysts. Trustee, Partridge Academy. Director, King Caesar Foundation.
Trygve E. Myhren, 72.Year elected to the Board: 1996
President, Myhren Media, Inc., a firm that invests in and advises media, telecommunications, Internet and software companies. Special Limited Partner and member of Investment Committee, Megunticook Funds, a venture capital firm (1998 to present). Director, AdPay, Inc. Trustee, Executive Committee and Chairman of Faculty Education Affairs Committee, the University of Denver.Trustee, Denver Art Museum. Member, Colorado FORUM and Cable Television Hall of Fame. Formerly, President (1990 to 1996) and Director (1992 to 2001) of the Providence Journal Company, a diversified media and communications company. Formerly, Chairman and Chief Executive Officer of American Television and Communications Corporation (now
50
Time Warner Cable) (1981 to 1988). Formerly, Chairman of the National Cable Television Association (1986-1987). U.S. Chief of Mission, 2006 Paralympic Games, Torino/Sestrierre, Italy.
George W. Phillips, 70.Year elected to the Board: 1998
Retired.Vice Chairman of the Board and Chairman of the Investment Committee, Children’s Medical Center of Boston. Formerly, President and Chief Executive Officer (1992 to 1997) and Director (1992 to 2002) of Warren Bancorp, Inc. Formerly, President, Chief Executive Officer and Director of Warren Five Cents Savings Bank (1992 to 1997).
Martha A. Solis-Turner, 48.Year elected to the Board: 2005
Formerly, Telecommunications Director, Wholesale Markets (1995 to 2001), and Manager (1990 to 1995), Qwest Communications International Inc. Formerly, Board member and Treasurer, Mile High Montessori Early Learning Centers (2002 to 2008), Board member (1995 to 2004) and Vice President (2002 to 2004), Curtis Park Community Center, both of which are non-profit organizations.
Principal Officers
J. David Officer, 60. President and Principal Executive Officer of the Funds since 2007. Chairman, President and Chief Executive Officer of Founders since 2008. Chief Operating Officer,Vice Chairman and a Director of Dreyfus, and an officer of 77 investment companies (comprised of 180 portfolios) managed by Dreyfus. He has been an employee of Dreyfus since 1998.
Kenneth R. Christoffersen, 53. Vice President of the Funds since 2008, and Secretary since 2000 (and from 1996 to 1998). Founders’ Senior Vice President -Legal, General Counsel and Secretary. Assistant Secretary of the Distributor since 2003. Employed by Founders and its predecessor company since 1996.
Steven M. Anderson, 43.Treasurer and Principal Financial and Accounting Officer of the Funds since 2007.Vice President,BNY Mellon Asset Management (since 2003). Vice President, Treasurer and Chief Financial Officer, Mellon Optima L/S Strategy Fund, LLC (since 2005). Treasurer and Chief Financial Officer BNY/IVY Multi-Strategy Hedge Fund, LLC (since 2008). Formerly,Vice President (1999 to 2008), Treasurer and Chief Financial Officer of Mellon Institutional Funds Investment Trust (2002 to 2008).AssistantVice President and Mutual Funds Controller,Standish Mellon Asset Management Company, LLC (2000 to 2003).
The Fund 51
YOUR BOARD REPRESENTATIVES (Unaudited) (continued)
Janelle E. Belcher, 50. Chief Compliance Officer of the Funds since 2004. Founders’ Vice President - Compliance since 2002. Formerly, Founders’ Manager of Compliance (2000 to 2002) and Securities Compliance Examiner, Staff Accountant and Team Leader for the U.S. Securities and Exchange Commission (1990 to 2000).
Robert S. Robol, 44. Assistant Treasurer since 2006. Senior Accounting Manager -Taxable Fixed Income Funds of Dreyfus, and an officer of 78 investment companies (comprised of 201 portfolios) managed by Dreyfus. Employed by Dreyfus since 1988.
Robert Salviolo, 41. Assistant Treasurer since 2007. Senior Accounting Manager -Foreign Equity Funds of Dreyfus, and an officer of 78 investment companies (comprised of 201 portfolios) managed by Dreyfus. Employed by Dreyfus since 1989.
Robert Svagna, 41. Assistant Treasurer since 2006. Senior Accounting Manager -Equity Funds of Dreyfus, and an officer of 78 investment companies (comprised of 201 portfolios) managed by Dreyfus. Employed by Dreyfus since 1990.
William G. Germenis, 38. Anti-Money Laundering Compliance Officer (“AMLCO”) for the Class A, Class B, Class C and Class I shares of the Funds since 2002 and for the Class F shares of the Funds since 2003.Vice President and AMLCO of the Distributor and AMLCO of 74 investment companies (comprised of 197 portfolios) managed by Dreyfus. Employed by the Distributor since 1998.
The directors and officers may be contacted at Founders’ address appearing on the back cover, except for Messrs. Officer, Robol, Salviolo, Svagna and Germenis, who can be contacted at The Dreyfus Corporation, 200 Park Avenue, NewYork, NewYork 10166, and Mr. Anderson, who can be contacted at BNY Mellon Asset Management, One Boston Place, Boston, Massachusetts 02108. Additional information about the Company’s directors is available in the Statement of Additional Information, which can be obtained free of charge by calling 1-800-645-6561 (Class F shareholders) or 1-800-554-4611 (all other shareholders).
52
For More Information
The fund files its complete schedule of portfolio holdings with the Securities and Exchange Commission (“SEC”) for the first and third quarters of each fiscal year on Form N-Q. The fund’s Forms N-Q are available on the SEC’s website at http://www.sec.gov and may be reviewed and copied at the SEC’s Public Reference Room in Washington, DC. Information on the operation of the Public Reference Room may be obtained by calling 1-800-SEC-0330.
A description of the policies and procedures that the fund uses to determine how to vote proxies relating to portfolio securities, and information regarding how the fund voted these proxies for the most recent 12-month period ended June 30 is available at http://www.dreyfus.com and on the SEC’s website at http://www.sec.gov.
The description of the policies and procedures is also available without charge, upon request, by calling 1-800-645-6561.
This report and the statements it contains are submitted for the general information
of our shareholders. The report is not authorized for distribution to prospective
investors unless preceded or accompanied by an effective prospectus. |

| © 2009 MBSC Securities Corporation |
ITEM 2. CODE OF ETHICS
(a) As of the end of the period covered by this report, Dreyfus Funds, Inc. (the "Funds") has adopted a code of ethics that applies to the Funds' principal executive officer, principal financial officer, and principal accounting officer.
(c) During the period covered by this report, no amendments have been made to a provision of the code of ethics that applies to the Funds' principal executive officer, principal financial officer, or principal accounting officer, and that relates to any element of the code of ethics definition enumerated in paragraph (b) of Item 2 of Form N-CSR.
(d) During the period covered by this report, the Funds have not granted a waiver, including an implicit waiver, from a provision of the code of ethics to the Funds' principal executive officer, principal financial officer, or principal accounting officer that relates to one or more of the items set forth in paragraph (b) of Item 2 of Form N-CSR.
(f)(1) A copy of the code of ethics is filed as an exhibit to this report, pursuant to Item 12(a)(1) of Form N-CSR.
ITEM 3. AUDIT COMMITTEE FINANCIAL EXPERT
(a)(1) The board of directors of the Funds has determined that the Funds have an "audit committee financial expert" serving on its audit committee, as that term is defined in paragraph (b) of Item 3 of Form N-CSR.
(a)(2) The name of the audit committee financial expert is George W. Phillips. Mr. Phillips is an "independent" member of the audit committee as that term is defined in Item 3(a)(2) of Form N-CSR.
ITEM 4. PRINCIPAL ACCOUNTANT FEES AND SERVICES
(a) Audit Fees - The aggregate fees billed to the Funds by their principal accountant for professional services rendered for the audit of the Funds’ annual financial statements or services that are normally provided by the accountant in connection with statutory and regulatory filings or engagements for the fiscal years ending December 31, 2008 and December 31, 2007 were $182,600 and $219,800, respectively.
(b) Audit-Related Fees – The aggregate fees billed to the Funds by their principal accountant for assurance and related services that are reasonably related to the performance of the audit of the Funds’ financial statements and that are not reported under paragraph (a) of this Item 4 for the fiscal years ending December 31, 2008 and December 31, 2007 were $0 and $0, respectively.
The aggregate fees billed for assurance and related services by the Funds’ principal accountant to the Funds’ investment adviser, and any entity controlling, controlled by, or under common control with the adviser that provides ongoing services to the Funds (collectively, the “Service Providers”), that were reasonably related to the performance of the annual audit of the
| Service Provider, which required pre-approval by the Audit Committee for the fiscal years |
| ending December 31, 2008 and December 31, 2007 were $0 and $0, respectively. |
| |
| (c) | | Tax Fees – The aggregate fees billed to the Funds by their principal accountant for |
| professional services rendered by the accountant for tax compliance, tax advice, and tax planning |
| (“tax fees”) for the fiscal years ending December 31, 2008 and December 31, 2007 were $21,490 |
| and $26,400, respectively. These fees were for review of U.S. federal, state, local and excise tax |
| returns and determination of Passive Foreign Investment Companies. |
| |
| | | The aggregate tax fees billed by the Funds’ principal accountant to the Service Providers |
| for services which required pre-approval by the Audit Committee for the fiscal years ending |
| December 31, 2008 and December 31, 2007 were $0 and $0, respectively. |
| |
| (d) | | All Other Fees – The aggregate fees billed to the Funds by their principal accountant for |
| products and services provided by the accountant, other than the services reported in paragraphs |
| (a), (b), and (c) of this Item 4 (“all other fees”), for the fiscal years ending December 31, 2008 |
| and December 31, 2007 were $176 and $505, respectively. These fees were for reviews of the |
| Funds’ anti-money laundering program. |
| |
| | | The aggregate of all other fees billed by the Funds’ principal accountant for products and |
| services provided to the Service Providers which required pre-approval by the Audit Committee |
| for the fiscal years ending December 31, 2008 and December 31, 2007 were $0 and $0, |
| respectively. |
| |
| (e)(1) | | Approval is required of all audit and significant permitted non-audit engagements of the |
| Funds’ principal accountant, prior to the commencement of any such engagement, including pre- |
| approval not only of services provided directly to the Funds but also services provided to the |
| Service Providers where the nature of the services provided has a direct relationship to the |
| operations or financial reporting of the Funds; pre-approval may be given up to one year in |
| advance of the audit or non-audit activity for which pre-approval is sought. |
| |
| | | In any instance in which it may become necessary or desirable for the audit committee to |
| grant immediate pre-approval of a non-audit service to be provided either by the Funds’ principal |
| accountant or by another audit firm, such pre-approval may be procured in writing from the chair |
| of the Funds’ audit committee or, in the event of his or her unavailability, from the chair of the |
| Funds’ board of directors. Any such pre-approval shall be subject to consideration and review |
| by the audit committee at its next regularly scheduled quarterly meeting. |
| |
| (e)(2) | | None of the services described in paragraphs (b) through (d) of this Item 4 were approved |
| by the audit committee pursuant to paragraph (c)(7)(i)(C) of Rule 2-01 of Regulation S-X. |
| |
| (f) | | Not applicable. |
| |
| (g) | | For the fiscal years ending December 31, 2008 and December 31, 2007, the aggregate |
| non-audit fees billed by the Funds’ principal accountant to the Funds and the Service Providers |
| were $12,582,986 and $1,916,237, respectively. |
(h) The Funds’ Audit Committee has considered whether the provision of non-audit services that were rendered to the Service Providers which were not pre-approved (not requiring pre-approval) is compatible with maintaining the principal accountant’s independence.
ITEM 5. AUDIT COMMITTEE OF LISTED REGISTRANTS
Not applicable.
ITEM 6. INVESTMENTS
(a) Schedule I - Investments in securities of unaffiliated issuers is included as part of the reports to shareholders filed under Item 1 of this report on Form N-CSR.
(b) Not applicable.
ITEM 7. DISCLOSURE OF PROXY VOTING POLICIES AND PROCEDURES FOR CLOSED-END MANAGEMENT INVESTMENT COMPANIES
Not applicable.
ITEM 8. PORTFOLIO MANAGERS OF CLOSED-END MANAGEMENT INVESTMENT COMPANIES
Not applicable.
ITEM 9. PURCHASE OF EQUITY SECURITIES BY CLOSED-END MANAGEMENT INVESTMENT COMPANY AND AFFILIATED PURCHASERS
Not applicable.
ITEM 10. SUBMISSION OF MATTERS TO A VOTE OF SECURITY HOLDERS
No material changes have been made to the procedures by which shareholders may recommend nominees to the board of directors of the Funds, where those changes were implemented after the Funds last provided disclosure in response to the requirements of Item 407(c)(2)(iv) of Regulation S-K (as required by Item 22(b)(15) of Schedule 14A or this Item 10).
ITEM 11. CONTROLS AND PROCEDURES
(a) Based on an evaluation of the Funds' Disclosure Controls and Procedures as of a date within 90 days of the filing date of this report, the Funds' Principal Executive Officer ("PEO") and Principal Financial Officer ("PFO") have concluded that the Funds' Disclosure Controls and Procedures provide reasonable assurance that information required to be disclosed by the Funds in the report is recorded, processed, summarized, and reported within required time periods, and that information required to be disclosed in the report is accumulated and communicated to the
Funds' management, including the Funds' PEO and PFO, or persons performing similar functions, as appropriate to allow timely decisions regarding required disclosure.
(b) During the quarter ended December 31, 2008, there has been no change in the Funds' internal control over financial reporting that has materially affected, or that is reasonably likely to materially affect, the Funds' internal control over financial reporting.
ITEM 12. EXHIBITS
(a)(1) Attached hereto as Exhibit EX-99.CODE ETH.
(a)(2) Attached hereto as Exhibit EX-99.CERT.
(a)(3) Not applicable.
(b) Attached hereto as Exhibit EX-99.906CERT. |
Pursuant to the requirements of the Securities Exchange Act of 1934 and the Investment Company Act of 1940, the registrant has duly caused this report to be signed on its behalf by the undersigned, thereunto duly authorized.
DREYFUS FUNDS, INC.
| By: /s/ J. David Officer |
| J. David Officer, President |
| |
| Date: February 23, 2009 |
Pursuant to the requirements of the Securities Exchange Act of 1934 and the Investment Company Act of 1940, this report has been signed below by the following persons on behalf of the registrant and in the capacities and on the dates indicated.
| By: /s/ J. David Officer |
| J. David Officer, Principal Executive Officer |
|
| Date: February 23, 2009 |
|
| By: /s/ Steven M. Anderson |
| Steven M. Anderson, Principal Financial Officer |
|
| Date: February 23, 2009 |