UNITED STATES
SECURITIES AND EXCHANGE COMMISSION
Washington, D.C. 20549
FORM N-CSR
CERTIFIED SHAREHOLDER REPORT OF REGISTERED MANAGEMENT
INVESTMENT COMPANIES
Investment Company Act file number: 811-1018
Dreyfus Founders Funds, Inc.
---------------------------------------------------------------
(Exact name of registrant as specified in charter)
210 University Boulevard, Suite 800, Denver, Colorado 80206
---------------------------------------------------------------
(Address of principal executive offices) (Zip code)
Kenneth R. Christoffersen, Esq.
210 University Boulevard, Suite 800, Denver, Colorado 80206
---------------------------------------------------------------
(Name and address of agent for service)
Registrant's telephone number, including area code: 303-394-4404
Date of fiscal year end: December 31
Date of reporting period: December 31, 2007
ITEM 1. REPORTS TO STOCKHOLDERS
| Dreyfus Founders |
| Balanced Fund |
| | Balanced Fund is closed to new investors.
Please see the prospectus for additional information.
|
ANNUAL REPORT December 31, 2007

Save time. Save paper. View your next shareholder report online as soon as it’s available. Log into www.dreyfus.com and sign up for Dreyfus eCommunications. It’s simple and only takes a few minutes.
The views expressed in this report reflect those of the portfolio managers only through the end of the period covered and do not necessarily represent the views of Founders or any other person in the Founders organization.Any such views are subject to change at any time based upon market or other conditions and Founders disclaims any responsibility to update such views.These views may not be relied on as investment advice and, because investment decisions for a Dreyfus Founders Fund are based on numerous factors, may not be relied on as an indication of trading intent on behalf of any Dreyfus Founders Fund.
Not FDIC-Insured • Not Bank-Guaranteed • May Lose Value
| Contents |
| |
| | | THE FUND |
| |
|
| 2 | | A Letter from the Chairman |
| 3 | | Discussion of Fund Performance |
| 6 | | Fund Performance |
| 8 | | Understanding Your Fund’s Expenses |
| 8 | | Comparing Your Fund’s Expenses |
| | | With Those of Other Funds |
| 9 | | Statement of Investments |
| 24 | | Statement of Assets and Liabilities |
| 25 | | Statement of Operations |
| 26 | | Statement of Changes in Net Assets |
| 29 | | Financial Highlights |
| 35 | | Notes to Financial Statements |
| 47 | | Report of Independent Registered |
| | | Public Accounting Firm |
| 48 | | Important Tax Information |
| 49 | | Factors Considered in Renewing |
| | | the Advisory Agreement |
| 57 | | Your Board Representatives |
| |
| FOR MORE INFORMATION |
|
| | | Back Cover |
| Dreyfus Founders |
| Balanced Fund |

A LETTER FROM THE CHAIRMAN
Dear Shareholder:
We are pleased to present this annual report for Dreyfus Founders Balanced Fund, covering the 12-month period from January 1, 2007, through December 31, 2007.
Looking back, 2007 was a year of significant change for the stock market.Turmoil in the sub-prime mortgage market, declining housing values and soaring energy prices sparked a “flight to quality” in which investors reassessed their attitudes toward risk.As a result, smaller, more speculative companies that had led the stock market over the past several years lost value over the second half of the year, while shares of larger, multinational growth companies returned to favor. Many financial services and consumer discretionary companies were hurt by repercussions from the sub-prime lending crisis and economic downturn, but energy and basic materials producers generally moved higher along with underlying commodity prices.
The turbulence of 2007 reinforced a central principle of successful investing: diversification. Investors with broad exposure to the world’s stock and bond markets were better protected from the full impact of market volatility in areas that, earlier in the year, were among the bright spots at the time. As we look ahead, we believe that now is the perfect time to meet with your financial advisor, who can help you plan and diversify your investment portfolio in a way that manages the potential opportunities and risks that may continue to arise in 2008.
For information about how the fund performed during the reporting period, as well as market perspectives, we have provided a Discussion of Fund Performance given by the fund’s Portfolio Managers.
Thank you for your continued confidence and support.
2

DISCUSSION OF FUND PERFORMANCE
For the period between January 1, 2007, and December 31, 2007, as provided by John B. Jares, CFA, and Catherine Powers, CFA, Portfolio Managers
Fund and Market Performance Overview
Softer consumer spending, a slowing U.S. economy and escalating sub-prime mortgage delinquencies and defaults weighed on U.S. stock and bond markets during 2007. However, large-capitalization growth stocks posted stronger returns than most other equity market segments as investors grew increasingly risk-averse, and U.S. Treasury bonds gained value in a “flight to quality” among investors.The fund’s returns generally were slightly higher than its benchmark, mainly due to strength among the growth-oriented stocks favored by the fund’s equity portfolio.
For the 12-month period ended December 31, 2007, Dreyfus Founders Balanced Fund produced total returns of 6.24% for Class A shares, 6.54% for Class B shares, 5.21% for Class C shares, 6.27% for Class F shares, 6.37% for Class I shares and 5.52% for Class T shares,1 in comparison to its benchmark, the Standard & Poor’s 500 Composite Stock Price Index, which gained 5.49% for the same time period.2
The Fund’s Investment Approach
The fund seeks current income and capital appreciation by investing in a balanced portfolio of common stocks, U.S. and foreign government debt securities and corporate fixed-income obligations. The fund’s equity portion uses a “growth style” of investing, in which we search for companies whose fundamental strengths suggest the potential for superior earnings growth over time. Our “bottom-up” approach emphasizes individual stock selection through intensive qualitative and quantitative research.When choosing bonds, we consider their income characteristics as well as the potential for capital appreciation.We may invest in U.S. government securities, investment-grade and high yield corporate bonds, mortgage-related securities and asset-backed securities.
Stocks and Bonds Posted Mixed Results amid Heightened Volatility
Stocks advanced broadly and bonds remained in a narrow trading range over the first half of 2007, due to strong corporate earnings, moderate economic growth and stable short-term interest rates. However, market conditions changed dramatically over the second half
The Fund 3
DISCUSSION OF FUND PERFORMANCE (continued)
of the year, when a credit crisis emanating from the sub-prime mortgage market spread to other areas of the financial markets.As investors reassessed their attitudes toward risk, they turned away from the smaller, more speculative stocks and higher-yielding bonds that previously led the markets’ advances. Instead, newly risk-averse investors began to favor U.S. Treasury securities and large growth companies with a presence in overseas markets.
Our Sector Allocation and Security Selection Strategies Boosted Equity Results
The fund’s underweighted allocation to lagging financial and consumer discretionary stocks supported its relative performance. In addition, our security selection strategy scored a number of successes. In the consumer discretionary area, specialty retailer Gap, Inc. benefited from solid execution by a new management team in restructuring the company. In the telecommunication services sector,handset maker Nokia saw an increase in Chinese and Indian contracts. In other industry groups, brokerage firm Charles Schwab & Co. benefited from strong asset inflows, while oil producer Exxon Mobil’s stock price advanced along with crude oil prices. Among information technology companies, computer and electronics producer Apple scored a resounding success with the introduction of its iPhone, and software giant Microsoft achieved gains in its gaming platforms and operating systems divisions. Online media leader Google and hardware manufacturer Hewlett-Packard both captured larger shares of their respective markets.
However, strong performance in these areas was partly offset by underweighted allocations to the industrials and materials areas and a lack of exposure to some of these sectors’ top individual performers. In addition, semiconductor manufacturers Marvell Technology Group and Broadcom were hindered by company-specific issues, while banking giant Citigroup fell victim to subprime mortgage turmoil and retailer Home Depot suffered from depressed activity in the housing industry.
Non-Treasury Holdings Constrained Fixed-Income Performance
The fund’s relatively light holdings of U.S.Treasuries and overweighted position in shorter-duration corporate bonds and asset-backed securities proved to be a drag on performance.We had adopted a defensive investment posture with regard to investment-grade corporate bonds, including an emphasis on issuers that tend to be less vulnerable to risks associated with leveraged buyouts. However, this focus detracted from
4
relative performance during the credit crisis. While the portfolio’s holdings of asset-backed securities were composed primarily of AAA-rated bonds and fixed-rate mortgages, their underperformance had a negative impact on the portfolio’s returns.
On a more positive note, underweighted exposure to mortgage-backed securities helped shield the fund from some of the sector’s weakness during the downturn, and our “bulleted” yield curve strategy benefited from widening yield differences along the market’s maturity range.
Finding Growth and Income Opportunities in a Challenging Market
Despite the Federal Reserve Board’s attempts to calm the stock and bond markets, uncertainty has persisted with regard to elevated energy prices, the housing recession, ongoing sub-prime turmoil and mounting bank losses. We believe recent price dislocations have created opportunities to purchase stocks and high-quality corporate bonds at more attractive valuations. However, we are proceeding cautiously until the economic outlook becomes clearer.
On November 8, 2007, the fund’s Board of Directors approved, subject to shareholder approval, an Agreement and Plan of Reorganization, which provides for the transfer of the fund’s assets to the Growth and Income Portfolio of Dreyfus LifeTime Portfolios, Inc. (“Growth and Income Portfolio”) in a tax-free exchange for shares of the Growth and Income Portfolio. If approved, the Reorganization is expected to be completed in the second quarter of 2008.
January 15, 2008
| | | Part of the fund’s performance is due to assets received from class action settlements |
| | | regarding prior fund holdings. There is no guarantee that these settlement distributions will |
| | | occur in the future or have a similar impact on performance. |
| 1 | | Total return includes reinvestment of dividends and any capital gains paid, and does not take into |
| | | consideration the maximum initial sales charges in the case of Class A and Class T shares, or the |
| | | applicable contingent deferred sales charges imposed on redemptions in the case of Class B and |
| | | Class C shares. Had these charges been reflected, returns would have been lower. Past performance |
| | | is no guarantee of future results. Share price and investment return fluctuate such that upon |
| | | redemption, fund shares may be worth more or less than their original cost. Return figures provided |
| | | for the fund’s Class I and Class T shares reflect the absorption of certain portfolio expenses by an |
| | | affiliate of Founders pursuant to an agreement that will extend through at least August 31, 2008, |
| | | and will not be terminated without prior notice to the fund’s Board of Directors. Had these |
| | | expenses not been absorbed, the fund’s Class I and Class T shares’ returns would have been lower. |
| 2 | | SOURCE: LIPPER, INC. – The Standard & Poor’s 500 Composite Stock Price Index is a |
| | | widely accepted, unmanaged index of U.S. stock market performance.The total return figure cited |
| | | for this index assumes change in security prices and reinvestment of dividends, but does not reflect |
| | | the costs of managing a mutual fund. |
The Fund 5
FUND PERFORMANCE

† Source: Lipper Inc.
Past performance is not predictive of future performance.
The above graph compares a $10,000 investment made in Class F shares of Dreyfus Founders Balanced Fund on 12/31/97 to a $10,000 investment made in each of the Standard & Poor’s 500 Composite Stock Price Index (the “S&P 500 Index”) and the Lipper Balanced Fund Index (the “Lipper Index”) on that date.All dividends and capital gain distributions are reinvested. Performance for Class A, Class B, Class C, Class I and Class T shares will vary from the performance of Class F shares shown above due to differences in charges and expenses.
The fund’s performance shown in the line graph takes into account all applicable Class F fees and expenses (after any expense reimbursements).The S&P 500 Index is designed to be representative of the U.S. equities market and consists of 500 leading companies in leading industries of the U.S. economy. Unlike the fund, it does not contain a fixed-income component.The Lipper Balanced Fund Index is an equal dollar weighted index of the largest mutual funds within the Balanced Fund classification, as defined by Lipper. Unlike a mutual fund, the indices are not subject to charges, fees and other expenses. Investors cannot invest directly in any index. Further information relating to fund performance, including expense reimbursements, if applicable, is contained in the Financial Highlights section of the prospectus and elsewhere in this report.
| Average Annual Total Returns as of 12/31/07 | | | | | | |
| |
| | | Inception | | | | | | | | From |
| | | Date | | 1 Year | | 5 Years | | 10 Years | | Inception |
| |
| |
| |
| |
| |
|
| Class A shares | | | | | | | | | | |
| with maximum sales charge (5.75%) | | 12/31/99 | | 0.14% | | 7.68% | | — | | (0.55)% |
| without sales charge | | 12/31/99 | | 6.24% | | 8.98% | | — | | 0.19% |
| Class B shares | | | | | | | | | | |
| with applicable redemption charge † | | 12/31/99 | | 2.54% | | 8.08% | | — | | (0.37)%†† |
| without redemption | | 12/31/99 | | 6.54% | | 8.38% | | — | | (0.37)%†† |
| Class C shares | | | | | | | | | | |
| with applicable redemption charge ††† | | 12/31/99 | | 4.21% | | 8.00% | | — | | (0.85)% |
| without redemption | | 12/31/99 | | 5.21% | | 8.00% | | — | | (0.85)% |
| Class F shares | | 2/19/63 | | 6.27% | | 9.16% | | 1.41% | | N/A |
| Class I shares | | 12/31/99 | | 6.37% | | 9.13% | | — | | 0.26% |
| Class T shares | | | | | | | | | | |
| with applicable sales charge (4.5%) | | 12/31/99 | | 0.73% | | 7.49% | | — | �� | (0.43)% |
| without sales charge | | 12/31/99 | | 5.52% | | 8.47% | | — | | 0.14% |
Past performance is not predictive of future performance.The fund’s performance shown in the graph and table does not reflect the deduction of taxes that a shareholder would pay on fund distributions or the redemption of fund shares, but does reflect expense reimbursements for certain share classes. Part of the fund’s performance is due to amounts received from class action settlements regarding prior fund holdings.There is no guarantee that these settlement distributions will occur in the future or have a similar impact on performance.
| † | | The maximum contingent deferred sales charge for Class B shares is 4%. After six years Class B shares convert to |
| | | Class A shares. |
| †† | | Assumes the conversion of Class B shares to Class A shares at the end of the sixth year following the date of |
| | | purchase. |
| ††† | | The maximum contingent deferred sales charge for Class C shares is 1% for shares redeemed within one year of the |
| | | date of purchase. |
The Fund 7
UNDERSTANDING YOUR FUND’S EXPENSES (Unaudited)
As a mutual fund investor, you pay ongoing expenses, such as management fees and other expenses. Using the information below, you can estimate how these expenses affect your investment and compare them with the expenses of other funds.You also may pay one-time transaction expenses, including sales charges (loads) and redemption fees, which are not shown in this section and would have resulted in higher total expenses. For more information, see your fund’s prospectus or talk to your financial advisor.
Review your fund’s expenses
The table below shows the expenses you would have paid on a $1,000 investment in Dreyfus Founders Balanced Fund from July 1, 2007 to December 31, 2007. It also shows how much a $1,000 investment would be worth at the close of the period, assuming actual returns and expenses.To estimate the expenses you paid on your account over this period, simply divide your account value by $1,000 (for example, an $8,600 account value divided by $1,000 = 8.60), then multiply the results by the number in the Expenses paid per $1,000 line for the class of shares you own.
Expenses and Value of a $1,000 Investment
assuming actual returns for the six months ended December 31, 2007
|
| | | Class A | | Class B | | Class C | | Class F | | Class I | | Class T |
| |
| |
| |
| |
| |
| |
|
| Expenses paid | | | | | | | | | | | | |
| per $1,000 † | | $ 8.28 | | $ 10.18 | | $ 14.07 | | $ 8.02 | | $ 9.20 | | $ 13.00 |
| Ending value | | | | | | | | | | | | |
| (after expenses) | | $1,026.60 | | $1,029.50 | | $1,022.30 | | $1,026.70 | | $1,026.90 | | $1,022.60 |
| | COMPARING YOUR FUND’S EXPENSES
WITH THOSE OF OTHER FUNDS (Unaudited)
|
Using the SEC’s method to compare expenses
The Securities and Exchange Commission (SEC) has established guidelines to help investors assess fund expenses. Per these guidelines, the table below shows your fund’s expenses based on a $1,000 investment, assuming a hypothetical 5% annualized return. You can use this information to compare the ongoing expenses (but not transaction expenses or total cost) of investing in the fund with those of other funds.All mutual fund shareholder reports will provide this information to help you make this comparison. Please note that you cannot use this information to estimate your actual ending account balance and expenses paid during the period.
Expenses and Value of a $1,000 Investment
assuming a hypothetical 5% annualized return for the six months ended December 31, 2007
|
| | | Class A | | Class B | | Class C | | Class F | | Class I | | Class T |
| |
| |
| |
| |
| |
| |
|
| Expenses paid per | | | | | | | | | | | | |
| $1,000 † | | $ 8.24 | | $ 10.11 | | $ 13.99 | | $ 7.98 | | $ 9.15 | | $ 12.93 |
| Ending value | | | | | | | | | | | | |
| (after expenses) | | $1,017.04 | | $1,015.17 | | $1,011.29 | | $1,017.29 | | $1,016.13 | | $1,012.35 |
| † Expenses are equal to the fund’s annualized expense ratio of 1.62% for Class A shares, 1.99% for Class B shares, |
| 2.76% for Class C shares, 1.57% for Class F shares, 1.80% for Class I shares and 2.55% for Class T shares; |
| multiplied by the average account value over the period, multiplied by 184/365 (to reflect the one-half year period). |
8
STATEMENT OF INVESTMENTS
December 31, 2007
|
| Common Stocks—62.0% | | Shares | | Value ($) |
| |
| |
|
| Advertising—.6% | | | | |
| Omnicom Group | | 6,846 | | 325,390 |
| Air Freight & Logistics—.4% | | | | |
| FedEx | | 2,322 | | 207,053 |
| Apparel Retail—2.3% | | | | |
| Gap | | 38,554 | | 820,429 |
| Urban Outfitters | | 15,499 a | | 422,503 |
| | | | | 1,242,932 |
| Application Software—.4% | | | | |
| Autodesk | | 4,121 a | | 205,061 |
| Asset Management & Custody Banks—1.0% | | |
| Janus Capital Group | | 8,232 | | 270,421 |
| State Street | | 3,722 | | 302,226 |
| | | | | 572,647 |
| Automotive Retail—1.1% | | | | |
| Advance Auto Parts | | 15,762 | | 598,799 |
| Biotechnology—2.6% | | | | |
| Amylin Pharmaceuticals | | 11,296 a | | 417,952 |
| Genentech | | 5,811 a | | 389,744 |
| Gilead Sciences | | 13,381 a | | 615,660 |
| | | | | 1,423,356 |
| Broadcasting & Cable TV—.3% | | | | |
| Discovery Holding, Cl. A | | 7,100 a | | 178,494 |
| Casinos & Gaming—.5% | | | | |
| International Game Technology | | 5,919 | | 260,022 |
| Communications Equipment—3.2% | | |
| Cisco Systems | | 34,246 a | | 927,039 |
| Corning | | 16,174 | | 388,014 |
| Juniper Networks | | 13,708 a | | 455,106 |
| | | | | 1,770,159 |
| Computer & Electronics Retail—1.0% | | |
| Best Buy | | 9,923 | | 522,446 |
| Computer Hardware—3.2% | | | | |
| Apple | | 4,637 a | | 918,497 |
| Hewlett-Packard | | 12,869 | | 649,627 |
| Teradata | | 7,141 a | | 195,735 |
| | | | | 1,763,859 |
The Fund 9
STATEMENT OF INVESTMENTS (continued)
| Common Stocks (continued) | | Shares | | Value ($) |
| |
| |
|
| Computer Storage & Peripherals—.7% | | | | |
| EMC | | 19,595 a | | 363,095 |
| Department Stores—.5% | | | | |
| Nordstrom | | 7,421 | | 272,573 |
| Diversified Chemicals—.5% | | | | |
| E.I. du Pont de Nemours & Co. | | 6,006 | | 264,805 |
| Education Services—.4% | | | | |
| DeVry | | 4,369 | | 227,013 |
| Environmental & Facilities Services—.9% | | |
| Waste Management | | 15,026 | | 490,899 |
| Food Retail—1.1% | | | | |
| Whole Foods Market | | 15,403 | | 628,442 |
| Health Care Equipment—.3% | | | | |
| Medtronic | | 3,443 | | 173,080 |
| Home Entertainment Software—1.4% | | | | |
| Electronic Arts | | 13,052 a | | 762,367 |
| Home Improvement Retail—.5% | | | | |
| Home Depot | | 10,047 | | 270,666 |
| Household Products—1.1% | | | | |
| Colgate-Palmolive | | 3,986 | | 310,749 |
| Procter & Gamble | | 4,208 | | 308,951 |
| | | | | 619,700 |
| Hypermarkets & Super Centers—2.3% | | | | |
| Costco Wholesale | | 4,350 | | 303,456 |
| Wal-Mart Stores | | 19,880 | | 944,896 |
| | | | | 1,248,352 |
| Industrial Conglomerates—1.9% | | | | |
| General Electric | | 28,231 | | 1,046,523 |
| Integrated Oil & Gas—2.8% | | | | |
| Chevron | | 3,985 | | 371,920 |
| Exxon Mobil | | 12,204 | | 1,143,393 |
| | | | | 1,515,313 |
| Integrated Telecommunication—.5% | | | | |
| Verizon Communications | | 6,017 | | 262,883 |
| Internet Retail—1.1% | | | | |
| Amazon.com | | 1,778 a | | 164,714 |
| eBay | | 13,124 a | | 435,586 |
| | | | | 600,300 |
10
| Common Stocks (continued) | | Shares | | Value ($) |
| |
| |
|
| Internet Software & Services—2.3% | | | | |
| Google, Cl. A | | 1,310 a | | 905,839 |
| Yahoo! | | 15,815 a | | 367,857 |
| | | | | 1,273,696 |
| Investment Banking & Brokerage—1.9% | | | | |
| Charles Schwab | | 28,174 | | 719,846 |
| Goldman Sachs Group | | 1,517 | | 326,231 |
| | | | | 1,046,077 |
| IT Consulting & Other Services—.4% | | | | |
| Accenture, Cl. A | | 6,831 | | 246,121 |
| Leisure Facilities—.5% | | | | |
| Royal Caribbean Cruises | | 6,526 | | 276,964 |
| Life & Health Insurance—1.0% | | | | |
| Unum Group | | 23,285 | | 553,950 |
| Life Sciences Tools & Services—2.0% | | | | |
| Pharmaceutical Product Development | | 10,128 | | 408,867 |
| Thermo Fisher Scientific | | 12,142 a | | 700,351 |
| | | | | 1,109,218 |
| Movies & Entertainment—.4% | | | | |
| Walt Disney | | 7,480 | | 241,454 |
| Oil & Gas Equipment & Services—1.3% | | | | |
| Halliburton | | 7,417 | | 281,178 |
| Schlumberger | | 4,341 | | 427,024 |
| | | | | 708,202 |
| Oil & Gas Exploration & Production—.6% | | | | |
| Ultra Petroleum | | 4,493 a | | 321,250 |
| Oil & Gas Refining & Marketing—.7% | | | | |
| Sunoco | | 2,592 | | 187,764 |
| Tesoro | | 3,835 | | 182,930 |
| | | | | 370,694 |
| Other Diversified Financial Services—.6% | | | | |
| Citigroup | | 11,613 | | 341,887 |
| Packaged Foods & Meats—1.9% | | | | |
| Cadbury Schweppes, ADR | | 7,304 | | 360,599 |
| Dean Foods | | 13,137 | | 339,723 |
| Kraft Foods, Cl. A | | 10,751 | | 350,805 |
| | | | | 1,051,127 |
The Fund 11
STATEMENT OF INVESTMENTS (continued)
| Common Stocks (continued) | | Shares | | Value ($) |
| |
| |
|
| Personal Products—1.4% | | | | |
| Avon Products | | 12,633 | | 499,382 |
| Estee Lauder Cos., Cl. A | | 5,877 | | 256,296 |
| | | | | 755,678 |
| Pharmaceuticals—3.8% | | | | |
| Allergan | | 9,225 | | 592,614 |
| Covance | | 1,734 a | | 150,199 |
| Johnson & Johnson | | 2,830 | | 188,761 |
| Merck & Co. | | 8,613 | | 500,501 |
| Pfizer | | 10,561 | | 240,052 |
| Schering-Plough | | 14,937 | | 397,922 |
| | | | | 2,070,049 |
| Property & Casualty Insurance—.2% | | |
| MBIA | | 4,762 | | 88,716 |
| Railroads—.5% | | | | |
| Canadian National Railway | | 5,323 | | 249,808 |
| Restaurants—.4% | | | | |
| Starbucks | | 11,484 a | | 235,077 |
| Semiconductor Equipment—1.3% | | | | |
| KLA-Tencor | | 6,107 | | 294,113 |
| MEMC Electronic Materials | | 4,477 a | | 396,170 |
| | | | | 690,283 |
| Semiconductors—2.0% | | | | |
| Broadcom, Cl. A | | 14,819 a | | 387,369 |
| Intersil, Cl. A | | 6,505 | | 159,242 |
| Marvell Technology Group | | 19,418 a | | 271,464 |
| Maxim Integrated Products | | 11,376 | | 301,236 |
| | | | | 1,119,311 |
| Specialized Finance—.5% | | | | |
| CME Group | | 423 | | 290,178 |
| Specialty Chemicals—.4% | | | | |
| Ecolab | | 3,853 | | 197,312 |
| Systems Software—4.4% | | | | |
| Adobe Systems | | 13,439 a | | 574,249 |
| Microsoft | | 51,544 | | 1,834,966 |
| | | | | 2,409,215 |
| Tobacco—.9% | | | | |
| Altria Group | | 6,607 | | 499,357 |
| Total Common Stocks | | | | |
| (cost $29,318,231) | | | | 33,961,853 |
12
| | �� | Coupon | | Maturity | | Principal | | |
| Bonds and Notes—36.8% | | Rate (%) | | Date | | Amount ($) | | Value ($) |
| |
| |
| |
| |
|
| Aerospace & Defense—.2% | | | | | | | | |
| Boeing Capital, | | | | | | | | |
| Sr. Unscd. Notes | | 7.38 | | 9/27/10 | | 100,000 | | 107,354 |
| Asset-Backed Ctfs./ | | | | | | | | |
| Auto Receivables—.7% | | | | | | | | |
| Americredit Prime Automobile | | | | | | | | |
| Receivables, Ser. 2007-1, Cl. B | | 5.35 | | 9/9/13 | | 20,000 | | 20,118 |
| Americredit Prime Automobile | | | | | | | | |
| Receivables, Ser. 2007-1, Cl. C | | 5.43 | | 2/10/14 | | 20,000 | | 19,726 |
| Ford Credit Auto Owner Trust, | | | | | | | | |
| Ser. 2005-B, Cl. B | | 4.64 | | 4/15/10 | | 74,000 | | 74,016 |
| Ford Credit Auto Owner Trust, | | | | | | | | |
| Ser. 2007-A, Cl. C | | 5.80 | | 2/15/13 | | 100,000 | | 97,489 |
| Hyundai Auto Receivables Trust, | | | | | | | | |
| Ser. 2006-B, Cl. C | | 5.25 | | 5/15/13 | | 100,000 | | 99,191 |
| Wachovia Auto Loan Owner Trust, | | | | | | |
| Ser. 2007-1, Cl. D | | 5.65 | | 2/20/13 | | 75,000 | | 70,506 |
| | | | | | | | | 381,046 |
| Asset-Backed Ctfs./Credit Cards—.7% | | | | | | |
| BA Credit Card Trust, | | | | | | | | |
| Ser. 2007-C1, Cl. C1 | | 5.32 | | 6/15/14 | | 200,000 b | | 186,032 |
| Citibank Credit Card Issuance | | | | | | | | |
| Trust, Ser. 2006-C4, Cl. C4 | | 5.47 | | 1/9/12 | | 190,000 b | | 183,648 |
| | | | | | | | | 369,680 |
| Asset-Backed Ctfs./ | | | | | | | | |
| Home Equity Loans—.1% | | | | | | | | |
| Credit Suisse Mortgage Capital | | | | | | | | |
| Certificates, Ser. 2007-1, | | | | | | | | |
| Cl. 1A6A | | 5.86 | | 2/25/37 | | 65,000 b | | 61,903 |
| Automotive—.2% | | | | | | | | |
| Ford Motor Credit, | | | | | | | | |
| Unscd. Notes | | 7.38 | | 10/28/09 | | 100,000 | | 94,124 |
| Banking—2.9% | | | | | | | | |
| BTM Curacao Holdings, | | | | | | | | |
| Bank Gtd. Notes | | 4.76 | | 7/21/15 | | 175,000 b,c | | 174,213 |
| Chevy Chase Bank, | | | | | | | | |
| Sub. Notes | | 6.88 | | 12/1/13 | | 55,000 | | 52,388 |
| Chuo Mitsui Trust & Banking, | | | | | | | | |
| Jr. Sub. Notes | | 5.51 | | 12/29/49 | | 100,000 b,c | | 91,949 |
| Citigroup, | | | | | | | | |
| Sr. Unscd. Notes | | 5.30 | | 10/17/12 | | 50,000 | | 50,651 |
The Fund 13
STATEMENT OF INVESTMENTS (continued)
| | | Coupon | | Maturity | | Principal | | |
| Bonds and Notes (continued) | | Rate (%) | | Date | | Amount ($) | | Value ($) |
| |
| |
| |
| |
|
| Banking (continued) | | | | | | | | |
| Compass Bank, | | | | | | | | |
| Bonds | | 5.50 | | 4/1/20 | | 110,000 | | 103,494 |
| Credit Suisse First Boston USA, | | | | | | | | |
| Gtd. Notes | | 4.13 | | 1/15/10 | | 165,000 | | 164,212 |
| Credit Suisse Guernsey, | | | | | | | | |
| Jr. Sub. Notes | | 5.86 | | 5/29/49 | | 52,000 b | | 46,550 |
| Credit Suisse USA, | | | | | | | | |
| Gtd. Notes | | 5.50 | | 8/16/11 | | 125,000 | | 128,441 |
| Glitnir Banki, | | | | | | | | |
| Sub. Notes | | 6.69 | | 6/15/16 | | 100,000 b,c | | 100,739 |
| JPMorgan Chase & Co., | | | | | | | | |
| Sub. Notes | | 5.13 | | 9/15/14 | | 115,000 | | 112,721 |
| M&T Bank, | | | | | | | | |
| Sr. Unscd. Bonds | | 5.38 | | 5/24/12 | | 55,000 | | 54,855 |
| Marshall & Ilsley, | | | | | | | | |
| Sr. Unscd. Notes | | 5.63 | | 8/17/09 | | 105,000 | | 106,044 |
| Royal Bank of Scotland Group, | | | | | | | | |
| Jr. Sub. Bonds | | 6.99 | | 10/29/49 | | 100,000 b,c | | 99,699 |
| Wachovia Bank, | | | | | | | | |
| Sub. Notes | | 5.00 | | 8/15/15 | | 115,000 | | 108,749 |
| Washington Mutual, | | | | | | | | |
| Sr. Sub. Notes | | 8.25 | | 4/1/10 | | 110,000 | | 105,045 |
| Zions Bancorporation, | | | | | | | | |
| Sub. Notes | | 6.00 | | 9/15/15 | | 85,000 | | 82,528 |
| | | | | | | | | 1,582,278 |
| Brokerage—2.5% | | | | | | | | |
| Amvescap, | | | | | | | | |
| Sr. Unscd. Notes | | 5.38 | | 12/15/14 | | 25,000 | | 23,434 |
| Bear Stearns, | | | | | | | | |
| Notes | | 3.25 | | 3/25/09 | | 170,000 | | 164,613 |
| Bear Stearns, | | | | | | | | |
| Sr. Unscd. Notes | | 5.50 | | 8/15/11 | | 90,000 | | 88,865 |
| Goldman Sachs Capital II, | | | | | | | | |
| Gtd. Bonds | | 5.79 | | 12/29/49 | | 35,000 b | | 31,161 |
| Goldman Sachs Group, | | | | | | | | |
| Sr. Notes | | 5.35 | | 1/15/16 | | 110,000 | | 108,997 |
| Janus Capital Group, | | | | | | | | |
| Notes | | 6.25 | | 6/15/12 | | 40,000 | | 40,955 |
| Jefferies Group, | | | | | | | | |
| Sr. Unscd. Debs | | 6.25 | | 1/15/36 | | 120,000 | | 107,264 |
14
| | | Coupon | | Maturity | | Principal | | |
| Bonds and Notes (continued) | | Rate (%) | | Date | | Amount ($) | | Value ($) |
| |
| |
| |
| |
|
| Brokerage (continued) | | | | | | | | |
| Lehman Brothers Holdings, | | | | | | | | |
| Notes | | 4.25 | | 1/27/10 | | 165,000 | | 162,130 |
| Lehman Brothers Holdings, | | | | | | | | |
| Sr. Notes | | 6.00 | | 7/19/12 | | 85,000 | | 86,550 |
| Merrill Lynch & Co., | | | | | | | | |
| Notes | | 4.79 | | 8/4/10 | | 165,000 | | 163,495 |
| Merrill Lynch & Co., | | | | | | | | |
| Sub. Notes | | 6.05 | | 5/16/16 | | 140,000 | | 137,560 |
| Morgan Stanley, | | | | | | | | |
| Notes | | 4.00 | | 1/15/10 | | 170,000 | | 167,164 |
| Morgan Stanley, | | | | | | | | |
| Notes | | 5.55 | | 4/27/17 | | 100,000 | | 97,517 |
| | | | | | | | | 1,379,705 |
| Chemicals—.0% | | | | | | | | |
| Rohm & Haas, | | | | | | | | |
| Unsub. Notes | | 5.60 | | 3/15/13 | | 15,000 | | 15,587 |
| Commercial Mortgage | | | | | | | | |
| Pass-Through Ctfs.—4.1% | | | | | | | | |
| Banc of America Commercial | | | | | | | | |
| Mortgage, Ser. 2002-2, Cl. A3 | | 5.12 | | 7/11/43 | | 95,000 | | 96,203 |
| Bear Stearns Commercial Mortgage | | | | | | | | |
| Securities, Ser. 2006-PW14, | | | | | | | | |
| Cl. AAB | | 5.17 | | 12/11/38 | | 190,000 | | 188,946 |
| Bear Stearns Commercial Mortgage | | | | | | | | |
| Securities, Ser. 2007-T26, | | | | | | | | |
| Cl. AAB | | 5.43 | | 1/12/45 | | 225,000 | | 225,918 |
| Bear Stearns Commercial Mortgage | | | | | | | | |
| Securities, Ser. 2006-PW13, | | | | | | | | |
| Cl. A3 | | 5.52 | | 9/11/41 | | 30,000 | | 30,224 |
| Bear Stearns Commercial Mortgage | | | | | | | | |
| Securities, Ser. 2006-T24, Cl. AAB | | 5.53 | | 10/12/41 | | 110,000 | | 111,340 |
| Citigroup/Deutsche Bank Commercial | | | | | | |
| Mortgage Trust, Ser. 2007-CD4, | | | | | | | | |
| Cl. A2B | | 5.21 | | 12/11/49 | | 110,000 | | 109,982 |
| Crown Castle Towers, | | | | | | | | |
| Ser. 2006-1A, Cl. B | | 5.36 | | 11/15/36 | | 25,000 c | | 24,548 |
| Crown Castle Towers, | | | | | | | | |
| Ser. 2006-1A, Cl. C | | 5.47 | | 11/15/36 | | 70,000 c | | 68,151 |
| Crown Castle Towers, | | | | | | | | |
| Ser. 2006-1A, Cl. D | | 5.77 | | 11/15/36 | | 55,000 c | | 52,708 |
The Fund 15
STATEMENT OF INVESTMENTS (continued)
| | | Coupon | | Maturity | | Principal | | |
| Bonds and Notes (continued) | | Rate (%) | | Date | | Amount ($) | | Value ($) |
| |
| |
| |
| |
|
| Commercial Mortgage | | | | | | | | |
| Pass-Through Ctfs. (continued) | | | | | | | | |
| Global Signal Trust, | | | | | | | | |
| Ser. 2006-1, Cl. D | | 6.05 | | 2/15/36 | | 45,000 c | | 43,829 |
| GMAC Commercial Mortgage | | | | | | | | |
| Securities, Ser. 2003-C3, | | | | | | | | |
| Cl. A3 | | 4.65 | | 4/10/40 | | 175,000 | | 174,874 |
| Goldman Sachs Mortgage Securities | | | | | | |
| Corporation II, Ser. 2007-EOP, | | | | | | | | |
| Cl. E | | 5.69 | | 3/6/20 | | 45,000 b,c | | 43,205 |
| Goldman Sachs Mortgage Securities | | | | | | |
| Corporation II, Ser. 2007-EOP, | | | | | | | | |
| Cl. K | | 6.30 | | 3/6/20 | | 25,000 b,c | | 22,728 |
| J.P. Morgan Chase Commercial | | | | | | | | |
| Mortgage Securities, | | | | | | | | |
| Ser. 2004-C1, Cl. A2 | | 4.30 | | 1/15/38 | | 85,000 | | 83,911 |
| JP Morgan Chase Commercial | | | | | | | | |
| Mortgage Securities, | | | | | | | | |
| Ser. 2006-LDP7, Cl. ASB | | 5.88 | | 4/15/45 | | 125,000 b | | 129,168 |
| LB-UBS Commercial Mortgage Trust, | | | | | | |
| Ser. 2001-C3, Cl. A2 | | 6.37 | | 12/15/28 | | 95,000 | | 99,948 |
| Merrill Lynch Mortgage Trust, | | | | | | | | |
| Ser. 2002-MW1, Cl. A4 | | 5.62 | | 7/12/34 | | 215,000 | | 221,635 |
| Morgan Stanley Capital I, | | | | | | | | |
| Ser. 2005-HQ5, Cl. A2 | | 4.81 | | 1/14/42 | | 70,000 | | 69,794 |
| Morgan Stanley Capital I, | | | | | | | | |
| Ser. 2006-IQ12, Cl. AAB | | 5.33 | | 12/15/43 | | 110,000 | | 110,178 |
| Morgan Stanley Capital I, | | | | | | | | |
| Ser. 2006-HQ9, Cl. A3 | | 5.71 | | 7/12/44 | | 215,000 | | 218,704 |
| Sovereign Commercial Mortgage | | | | | | | | |
| Securities Trust, | | | | | | | | |
| Ser. 2007-C1, Cl. D | | 5.78 | | 7/22/30 | | 30,000 b,c | | 24,027 |
| TIAA Seasoned Commercial Mortgage | | | | | | |
| Trust, Ser. 2007-C4, Cl. A3 | | 6.10 | | 8/15/39 | | 70,000 b | | 72,190 |
| | | | | | | | | 2,222,211 |
| Construction—.3% | | | | | | | | |
| Atlas Copco, | | | | | | | | |
| Bonds | | 5.60 | | 5/22/17 | | 20,000 c | | 20,007 |
| Case New Holland, | | | | | | | | |
| Gtd. Notes | | 7.13 | | 3/1/14 | | 35,000 | | 34,912 |
16
| | | Coupon | | Maturity | | Principal | | |
| Bonds and Notes (continued) | | Rate (%) | | Date | | Amount ($) | | Value ($) |
| |
| |
| |
| |
|
| Construction (continued) | | | | | | | | |
| John Deere Capital, | | | | | | | | |
| Notes | | 5.16 | | 9/1/09 | | 110,000 b | | 110,213 |
| | | | | | | | | 165,132 |
| Diversified Financial Services—1.0% | | | | | | |
| American Express Credit, | | | | | | | | |
| Sr. Unscd. Notes | | 5.30 | | 11/9/09 | | 40,000 b | | 39,324 |
| Capital One Financial, | | | | | | | | |
| Sr. Unsub. Notes | | 5.43 | | 9/10/09 | | 105,000 b | | 99,243 |
| Capmark Financial Group, | | | | | | | | |
| Gtd. Notes | | 5.88 | | 5/10/12 | | 110,000 c | | 87,072 |
| Countrywide Financial, | | | | | | | | |
| Gtd. Notes | | 5.80 | | 6/7/12 | | 30,000 | | 21,915 |
| General Electric Capital, | | | | | | | | |
| Sr. Unscd. Notes | | 5.25 | | 10/19/12 | | 200,000 | | 204,548 |
| HSBC Finance, | | | | | | | | |
| Notes | | 5.50 | | 1/19/16 | | 110,000 | | 107,353 |
| | | | | | | | | 559,455 |
| Electric—1.5% | | | | | | | | |
| Appalachian Power, | | | | | | | | |
| Sr. Unscd. Notes, Ser. O | | 5.65 | | 8/15/12 | | 25,000 | | 25,405 |
| Cleveland Electric Illumination, | | | | | | | | |
| Sr. Unscd. Notes | | 5.70 | | 4/1/17 | | 50,000 | | 48,825 |
| Connecticut Light and Power, | | | | | | | | |
| First Mortgage Bonds, Ser. A | | 5.38 | | 3/1/17 | | 100,000 | | 97,046 |
| Consolidated Edison of NY, | | | | | | | | |
| Sr. Unscd. Debs., Ser. D | | 5.30 | | 12/1/16 | | 90,000 | | 88,529 |
| Consumers Energy, | | | | | | | | |
| First Mortgage Bonds | | 5.65 | | 4/15/20 | | 55,000 | | 54,353 |
| FPL Group Capital, | | | | | | | | |
| Gtd. Debs | | 5.63 | | 9/1/11 | | 110,000 | | 112,637 |
| Gulf Power, | | | | | | | | |
| Sr. Unsub. Notes, Ser. M | | 5.30 | | 12/1/16 | | 110,000 | | 109,347 |
| Nevada Power, | | | | | | | | |
| Mortgage Notes, Ser. R | | 6.75 | | 7/1/37 | | 30,000 | | 31,011 |
| NiSource Finance, | | | | | | | | |
| Gtd. Notes | | 5.25 | | 9/15/17 | | 35,000 | | 32,176 |
| PacifiCorp, | | | | | | | | |
| First Mortgage Bonds | | 6.90 | | 11/15/11 | | 150,000 | | 161,531 |
The Fund 17
STATEMENT OF INVESTMENTS (continued)
| | | Coupon | | Maturity | | Principal | | |
| Bonds and Notes (continued) | | Rate (%) | | Date | | Amount ($) | | Value ($) |
| |
| |
| |
| |
|
| Electric (continued) | | | | | | | | |
| Sierra Pacific Power, | | | | | | | | |
| Mortgage Notes, Ser. P | | 6.75 | | 7/1/37 | | 15,000 | | 15,505 |
| Southern, | | | | | | | | |
| Sr. Unsub. Notes, Ser. A | | 5.30 | | 1/15/12 | | 25,000 | | 25,454 |
| | | | | | | | | 801,819 |
| Energy—.0% | | | | | | | | |
| Chesapeake Energy, | | | | | | | | |
| Gtd. Notes | | 7.50 | | 6/15/14 | | 10,000 | | 10,175 |
| Entertainment—.1% | | | | | | | | |
| AOL Time Warner, | | | | | | | | |
| Gtd. Notes | | 6.75 | | 4/15/11 | | 50,000 | | 52,077 |
| Environmental—.3% | | | | | | | | |
| Allied Waste North America, | | | | | | | | |
| Scd. Notes, Ser. B | | 5.75 | | 2/15/11 | | 20,000 | | 19,600 |
| Allied Waste North America, | | | | | | | | |
| Scd. Notes | | 6.38 | | 4/15/11 | | 20,000 | | 19,800 |
| Republic Services, | | | | | | | | |
| Sr. Unsub. Notes | | 6.75 | | 8/15/11 | | 80,000 | | 83,861 |
| Waste Management, | | | | | | | | |
| Gtd. Notes | | 7.38 | | 5/15/29 | | 25,000 | | 27,321 |
| | | | | | | | | 150,582 |
| Food & Beverages—.0% | | | | | | | | |
| Kraft Foods, | | | | | | | | |
| Sr. Unscd. Notes | | 6.00 | | 2/11/13 | | 10,000 | | 10,281 |
| Gaming—.0% | | | | | | | | |
| MGM Mirage, | | | | | | | | |
| Gtd. Notes | | 8.38 | | 2/1/11 | | 25,000 | | 25,563 |
| Health Care—.0% | | | | | | | | |
| Community Health Systems, | | | | | | | | |
| Gtd. Notes | | 8.88 | | 7/15/15 | | 20,000 | | 20,375 |
| Health Insurance—.1% | | | | | | | | |
| Coventry Health Care, | | | | | | | | |
| Sr. Unscd. Notes | | 5.95 | | 3/15/17 | | 30,000 | | 29,415 |
| Wellpoint, | | | | | | | | |
| Sr. Unsub. Notes | | 5.88 | | 6/15/17 | | 30,000 | | 30,204 |
| | | | | | | | | 59,619 |
| Integrated Oil & Gas—.3% | | | | | | | | |
| PC Financial Partnership, | | | | | | | | |
| Gtd. Notes | | 5.00 | | 11/15/14 | | 115,000 | | 111,844 |
18
| | | Coupon | | Maturity | | Principal | | |
| Bonds and Notes (continued) | | Rate (%) | | Date | | Amount ($) | | Value ($) |
| |
| |
| |
| |
|
| Integrated Oil & Gas (continued) | | | | | | | | |
| Pemex Project Funding Master | | | | | | | | |
| Trust, Gtd. Notes | | 5.75 | | 3/1/18 | | 45,000 c | | 44,888 |
| | | | | | | | | 156,732 |
| Life Insurance—.6% | | | | | | | | |
| American International Group, | | | | | | | | |
| Sr. Unscd. Notes | | 5.05 | | 10/1/15 | | 115,000 | | 111,058 |
| American International Group, | | | | | | | | |
| Sr. Unscd. Notes | | 5.38 | | 10/18/11 | | 50,000 | | 50,797 |
| MetLife, | | | | | | | | |
| Sr. Unscd. Notes | | 5.00 | | 6/15/15 | | 115,000 | | 111,291 |
| Prudential Financial, | | | | | | | | |
| Notes | | 5.10 | | 12/14/11 | | 40,000 | | 40,462 |
| | | | | | | | | 313,608 |
| Media—.4% | | | | | | | | |
| Comcast Cable Communications, | | | | | | | | |
| Gtd. Notes | | 6.88 | | 6/15/09 | | 40,000 | | 41,143 |
| Comcast, | | | | | | | | |
| Gtd. Notes | | 5.50 | | 3/15/11 | | 65,000 | | 65,621 |
| News America Holdings, | | | | | | | | |
| Gtd. Debs | | 7.70 | | 10/30/25 | | 50,000 | | 56,167 |
| Time Warner Cable, | | | | | | | | |
| Gtd. Notes | | 5.85 | | 5/1/17 | | 35,000 | | 35,086 |
| | | | | | | | | 198,017 |
| Metals and Mining—.1% | | | | | | | | |
| Steel Dynamics, | | | | | | | | |
| Sr. Notes | | 7.38 | | 11/1/12 | | 30,000 c | | 30,150 |
| Packaging & Containers—.1% | | | | | | | | |
| Ace INA Holdings, | | | | | | | | |
| Gtd. Notes | | 5.70 | | 2/15/17 | | 50,000 | | 49,550 |
| Ball, | | | | | | | | |
| Gtd. Notes | | 6.88 | | 12/15/12 | | 15,000 | | 15,225 |
| | | | | | | | | 64,775 |
| Pipelines—.1% | | | | | | | | |
| National Grid, | | | | | | | | |
| Sr. Unscd. Notes | | 6.30 | | 8/1/16 | | 50,000 | | 51,045 |
| Railroads—.3% | | | | | | | | |
| Norfolk Southern, | | | | | | | | |
| Sr. Unscd. Notes | | 6.75 | | 2/15/11 | | 50,000 | | 53,578 |
The Fund 19
STATEMENT OF INVESTMENTS (continued)
| | | Coupon | | Maturity | | Principal | | |
| Bonds and Notes (continued) | | Rate (%) | | Date | | Amount ($) | | Value ($) |
| |
| |
| |
| |
|
| Railroads (continued) | | | | | | | | |
| Union Pacific, | | | | | | | | |
| Sr. Unscd. Notes | | 3.88 | | 2/15/09 | | 85,000 | | 84,275 |
| | | | | | | | | 137,853 |
| Real Estate Investment Trusts—1.1% | | | | | | |
| Avalonbay Communities, | | | | | | | | |
| Sr. Unscd. Notes | | 6.63 | | 9/15/11 | | 25,000 | | 26,111 |
| Boston Properties, | | | | | | | | |
| Sr. Unscd. Notes | | 5.63 | | 4/15/15 | | 85,000 | | 82,202 |
| Duke Realty, | | | | | | | | |
| Sr. Notes | | 5.88 | | 8/15/12 | | 85,000 | | 85,869 |
| ERP Operating, | | | | | | | | |
| Notes | | 5.13 | | 3/15/16 | | 60,000 | | 55,824 |
| ERP Operating, | | | | | | | | |
| Unscd. Notes | | 5.20 | | 4/1/13 | | 50,000 | | 48,376 |
| Federal Realty Investment Trust, | | | | | | | | |
| Notes | | 6.00 | | 7/15/12 | | 20,000 | | 20,527 |
| Federal Realty Investment Trust, | | | | | | | | |
| Notes | | 6.20 | | 1/15/17 | | 55,000 | | 54,842 |
| Healthcare Realty Trust, | | | | | | | | |
| Sr. Unscd. Notes | | 8.13 | | 5/1/11 | | 50,000 | | 54,589 |
| Liberty Property, | | | | | | | | |
| Sr. Unscd. Notes | | 5.50 | | 12/15/16 | | 20,000 | | 18,712 |
| Mack-Cali Realty, | | | | | | | | |
| Sr. Unscd. Notes | | 7.75 | | 2/15/11 | | 50,000 | | 54,737 |
| Regency Centers, | | | | | | | | |
| Gtd. Notes | | 5.88 | | 6/15/17 | | 25,000 | | 24,159 |
| Simon Property, | | | | | | | | |
| Notes | | 5.63 | | 8/15/14 | | 85,000 | | 83,157 |
| | | | | | | | | 609,105 |
| Retailers—.1% | | | | | | | | |
| CVS Caremark, | | | | | | | | |
| Sr. Unscd. Notes | | 5.75 | | 8/15/11 | | 25,000 | | 25,608 |
| Federated Retail Holdings, | | | | | | | | |
| Gtd. Bonds | | 5.35 | | 3/15/12 | | 20,000 | | 19,486 |
| Federated Retail Holdings, | | | | | | | | |
| Gtd. Notes | | 5.90 | | 12/1/16 | | 20,000 | | 18,836 |
| Lowe’s Companies, | | | | | | | | |
| Sr. Unscd. Notes | | 5.60 | | 9/15/12 | | 15,000 | | 15,406 |
| | | | | | | | | 79,336 |
20
| | | Coupon | | Maturity | | Principal | | |
| Bonds and Notes (continued) | | Rate (%) | | Date | | Amount ($) | | Value ($) |
| |
| |
| |
| |
|
| State/Territory Gen Oblg—2.1% | | | | | | | | |
| Delaware Housing Authority, | | | | | | | | |
| SFMR | | 5.80 | | 7/1/16 | | 35,000 | | 35,645 |
| Michigan Tobacco Settlement | | | | | | | | |
| Finance Authority, Tobacco | | | | | | | | |
| Settlement Asset-Backed Bonds | | 7.05 | | 6/1/34 | | 200,000 b | | 189,620 |
| Tennessee Valley Authority, | | | | | | | | |
| Bonds, Ser. A | | 5.63 | | 1/18/11 | | 800,000 | | 840,858 |
| Tobacco Settlement Finance | | | | | | | | |
| Authority of West Virginia, | | | | | | | | |
| Tobacco Settlement | | | | | | | | |
| Asset-Backed Bonds | | 7.47 | | 6/1/47 | | 105,000 | | 100,842 |
| | | | | | | | | 1,166,965 |
| Supermarkets—.0% | | | | | | | | |
| Delhaize Group, | | | | | | | | |
| Sr. Unsub Notes | | 6.50 | | 6/15/17 | | 15,000 | | 15,345 |
| Transportation Services—.1% | | | | | | | | |
| Erac USA Finance, | | | | | | | | |
| Gtd. Notes | | 7.00 | | 10/15/37 | | 50,000 c | | 45,411 |
| U.S. Government Agencies—.6% | | | | | | | | |
| Federal National Mortgage | | | | | | | | |
| Association, Notes | | 4.63 | | 10/15/13 | | 315,000 | | 324,667 |
| U.S. Government Agencies/ | | | | | | | | |
| Mortgage-Backed—11.5% | | | | | | | | |
| Federal Home Loan Mortgage Corp.: | | | | | | |
| 5.00%, 10/1/35 | | | | | | 571,052 | | 557,621 |
| 6.00%, 9/1/37 | | | | | | 981,678 | | 996,492 |
| Federal National Mortgage Association: | | | | | | |
| 4.50%, 6/1/20 | | | | | | 414,678 | | 407,865 |
| 5.00%, 1/1/36—2/1/37 | | | | | | 707,037 | | 690,126 |
| 5.50%, 4/1/22—5/1/36 | | | | | | 2,465,681 | | 2,469,103 |
| 6.00%, 4/1/22—10/1/37 | | | | | | 776,836 | | 792,318 |
| Government National Mortgage Association I: | | | | | | |
| Ser. 2007-52, Cl. A, 4.05%, 1/16/48 | | | | 64,330 | | 63,641 |
| Ser. 2005-87, Cl. A, 4.45%, 3/16/25 | | | | 344,798 | | 343,246 |
| | | | | | | | | 6,320,412 |
| U.S. Government Securities—4.2% | | | | | | |
| U.S. Treasury Bonds | | 4.50 | | 2/15/36 | | 1,226,000 | | 1,232,226 |
| U.S. Treasury Notes | | 3.88 | | 10/31/12 | | 300,000 | | 305,883 |
| U.S. Treasury Notes | | 4.63 | | 12/31/11 | | 575,000 | | 603,121 |
The Fund 21
STATEMENT OF INVESTMENTS (continued)
| | | Coupon | | Maturity | | Principal | | |
| Bonds and Notes (continued) | | Rate (%) | | Date | | Amount ($) | | Value ($) |
| |
| |
| |
| |
|
| U.S. Government | | | | | | | | |
| Securities (continued) | | | | | | | | |
| U.S. Treasury Notes | | 4.63 | | 11/15/16 | | 17,000 | | 17,804 |
| U.S. Treasury Notes | | 4.75 | | 8/15/17 | | 60,000 | | 63,370 |
| U.S. Treasury Notes | | 4.88 | | 6/30/12 | | 65,000 | | 68,941 |
| | | | | | | | | 2,291,345 |
| Wireless Telecommunication | | | | | | | | |
| Services—.5% | | | | | | | | |
| AT & T Wireless, | | | | | | | | |
| Sr. Unscd. Notes | | 8.75 | | 3/1/31 | | 20,000 | | 25,919 |
| AT & T, | | | | | | | | |
| Sr. Unscd. Notes | | 7.30 | | 11/15/11 | | 100,000 b | | 108,351 |
| KPN, | | | | | | | | |
| Sr. Unsub. Notes | | 8.00 | | 10/1/10 | | 15,000 | | 16,087 |
| KPN, | | | | | | | | |
| Sr. Unsub. Bonds | | 8.38 | | 10/1/30 | | 7,000 | | 8,393 |
| Qwest, | | | | | | | | |
| Sr. Unscd. Notes | | 7.50 | | 10/1/14 | | 36,000 | | 36,540 |
| Telefonica Emisiones, | | | | | | | | |
| Gtd. Notes | | 5.98 | | 6/20/11 | | 100,000 | | 102,869 |
| | | | | | | | | 298,159 |
| Total Bonds and Notes | | | | | | | | |
| (cost $20,075,452) | | | | | | | | 20,171,891 |
| |
| |
| |
| |
|
| |
| Exchange Traded Funds—.8% | | | | | | | | |
| |
| |
| |
| |
|
| iShares Russell 1000 Growth Index Fund | | | | 4,307 | | 261,779 |
| Standard & Poor’s Depository | | | | | | | | |
| Receipts (Tr. Ser. 1) | | | | | | 1,373 | | 200,746 |
| Total Exchange Traded Funds | | | | | | | | |
| (cost $473,943) | | | | | | | | 462,525 |
22
| Other Investment—.2% | | Shares | | Value ($) |
| |
| |
|
| Registered Investment Company; | | | | |
| Dreyfus Institutional Preferred | | | | |
| Plus Money Market Fund | | | | |
| (cost $115,000) | | 115,000 d | | 115,000 |
| |
| |
|
| Total Investments (cost $49,982,626) | | 99.8% | | 54,711,269 |
| Cash and Receivables (Net) | | .2% | | 130,360 |
| Net Assets | | 100.0% | | 54,841,629 |
| ADR—American Depository Receipts |
| a Non-income producing security. |
| b Variable rate security—interest rate subject to periodic change. |
| c Securities exempt from registration under Rule 144A of the Securities Act of 1933.These securities may be resold in |
| transactions exempt from registration, normally to qualified institutional buyers. At December 31, 2007, these |
| securities amounted to $973,324 or 1.8% of net assets. |
| d Investment in affiliated money market mutual fund. |
| Portfolio Summary | | (Unaudited) † | | | | |
| |
| | | Value (%) | | | | Value (%) |
| |
| |
| |
|
| Information Technology | | 19.4 | | Materials | | .8 |
| Consumer Discretionary | | 9.6 | | Telecom Services | | .5 |
| Consumer Staples | | 8.8 | | Other | | .8 |
| Health Care | | 8.7 | | Fixed Income Investments | | 36.8 |
| Energy | | 5.3 | | Money Market Investments | | .2 |
| Financials | | 5.3 | | | | |
| Industrials | | 3.6 | | | | 99.8 |
| † Based on net assets. |
| See notes to financial statements. |
The Fund 23
STATEMENT OF ASSETS AND LIABILITIES
December 31, 2007
| | | Cost | | Value |
| |
| |
|
| Assets ($): | | | | |
| Investments in securities—See Statement of Investments: | | |
| Unaffiliated issuers | | 49,867,626 | | 54,596,269 |
| Affiliated issuers | | 115,000 | | 115,000 |
| Cash | | | | 186,693 |
| Dividends and interest receivable | | | | 233,448 |
| Receivable for shares of Common Stock subscribed | | 6,131 |
| Prepaid expenses | | | | 35,170 |
| Other assets | | | | 356,258 |
| | | | | 55,528,969 |
| |
| |
|
| Liabilities ($): | | | | |
| Due to Founders Asset Management LLC and affiliates—Note 3(c) | | 77,167 |
| Payable for shares of Common Stock redeemed | | 114,781 |
| Interest payable—Note 2 | | | | 449 |
| Accrued expenses | | | | 138,685 |
| Directors’ deferred compensation | | | | 356,258 |
| | | | | 687,340 |
| |
| |
|
| Net Assets ($) | | | | 54,841,629 |
| |
| |
|
| Composition of Net Assets ($): | | | | |
| Paid-in capital | | | | 228,450,893 |
| Accumulated distributions in excess of investment income—net | | (46,938) |
| Accumulated net realized gain (loss) on investments | | (178,310,312) |
| Accumulated net unrealized appreciation | | |
| (depreciation) on investments | | | | 4,747,986 |
| |
| |
|
| Net Assets ($) | | | | 54,841,629 |
| Net Asset Value Per Share | | | | | | | | | | |
| | | Class A | | Class B | | Class C | | Class F | | Class I | | Class T |
| |
| |
| |
| |
| |
| |
|
| Net Assets ($) | | 2,192,473 | | 282,267 | | 164,087 | | 52,056,707 | | 100,675 | | 45,420 |
| Shares Outstanding | | 227,585 | | 29,032 | | 17,332 | | 5,397,496 | | 10,519 | | 4,578 |
| |
| |
| |
| |
| |
| |
|
| Net Asset Value | | | | | | | | | | | | |
| Per Share ($) | | 9.63 | | 9.72 | | 9.47 | | 9.64 | | 9.57 | | 9.92 |
| |
| See notes to financial statements. | | | | | | | | | | |
24
STATEMENT OF OPERATIONS
Year Ended December 31, 2007
|
| Investment Income ($): | | |
| Income: | | |
| Dividends (net of $1,831 foreign taxes withheld at source): | | |
| Unaffiliated issuers | | 556,685 |
| Affiliated issuers | | 147,568 |
| Interest | | 1,005,769 |
| Total Income | | 1,710,022 |
| Expenses: | | |
| Investment advisory fee—Note 3(a) | | 378,543 |
| Shareholder servicing costs—Note 3(c) | | 149,340 |
| Distribution fees—Note 3(b) | | 139,139 |
| Registration fees | | 50,424 |
| Professional fees | | 37,161 |
| Accounting fees—Note 3(c) | | 34,416 |
| Prospectus and shareholders’ reports | | 21,793 |
| Directors’ fees and expenses—Note 3(d) | | 32,443 |
| Custodian fees—Note 3(c) | | 8,931 |
| Loan commitment fees—Note 2 | | 2,251 |
| Interest expense—Note 2 | | 992 |
| Miscellaneous | | 59,306 |
| Total Expenses | | 914,739 |
| Less—reduction in custody fees due to | | |
| earnings credits—Note 1(c) | | (6,041) |
| Less—reduction in accounting fees—Note 3(c) | | (10,628) |
| Less—expense offset to broker commission—Note 1 | | (633) |
| Less—reimbursed/waived expenses—Note 3(c) | | (176) |
| Net Expenses | | 897,261 |
| Investment Income—Net | | 812,761 |
| |
|
| Realized and Unrealized Gain (Loss) on Investments—Note 4 ($): |
| Net realized gain (loss) on investments | | 3,214,482 |
| Net unrealized appreciation (depreciation) on investments | | (453,533) |
| Net Realized and Unrealized Gain (Loss) on Investments | | 2,760,949 |
| Net Increase in Net Assets Resulting from Operations | | 3,573,710 |
| |
| See notes to financial statements. | | |
The Fund 25
STATEMENT OF CHANGES IN NET ASSETS
| | | Year Ended December 31, |
| |
|
| | | 2007 a | | 2006 |
| |
| |
|
| Operations ($): | | | | |
| Investment income—net | | 812,761 | | 909,261 |
| Net realized gain (loss) on investments | | 3,214,482 | | 2,944,480 |
| Net unrealized appreciation | | | | |
| (depreciation) on investments | | (453,533) | | 2,332,121 |
| Net Increase (Decrease) in Net Assets | | |
| Resulting from Operations | | 3,573,710 | | 6,185,862 |
| |
| |
|
| Dividends to Shareholders from ($): | | | | |
| Investment income—net: | | | | |
| Class A shares | | (30,480) | | (45,385) |
| Class B shares | | (4,640) | | (334) |
| Class C shares | | (900) | | (1,027) |
| Class F shares | | (774,189) | | (1,580,307) |
| Class I shares | | (1,050) | | (1,485) |
| Class T shares | | (419) | | (1,052) |
| Total Dividends | | (811,678) | | (1,629,590) |
| |
| |
|
| Capital Stock Transactions ($): | | | | |
| Net proceeds from shares sold: | | | | |
| Class A shares | | 508,978 | | 671,584 |
| Class B shares | | 17,862 | | 121,336 |
| Class C shares | | 74,490 | | 23,263 |
| Class F shares | | 3,056,982 | | 3,863,377 |
| Class I shares | | 52,728 | | 203 |
| Class T shares | | 15,572 | | 18,236 |
26
| | | Year Ended December 31, |
| |
|
| | | 2007 a | | 2006 |
| |
| |
|
| Capital Stock Transactions ($) (continued): | | |
| Dividends reinvested: | | | | |
| Class A shares | | 24,987 | | 40,018 |
| Class B shares | | 3,387 | | 254 |
| Class C shares | | 522 | | 505 |
| Class F shares | | 746,391 | | 1,528,006 |
| Class I shares | | 1,050 | | 1,484 |
| Class T shares | | 291 | | 729 |
| Cost of shares redeemed: | | | | |
| Class A shares | | (418,676) | | (630,365) |
| Class B shares | | (200,859) | | (781,673) |
| Class C shares | | (99,964) | | (46,335) |
| Class F shares | | (13,342,192) | | (19,699,238) |
| Class I shares | | (2,015) | | (13,000) |
| Class T shares | | (29,783) | | (103) |
| Increase (Decrease) in Net Assets | | | | |
| from Capital Stock Transactions | | (9,590,249) | | (14,901,719) |
| Total Increase (Decrease) in Net Assets | | (6,828,217) | | (10,345,447) |
| |
| |
|
| Net Assets ($): | | | | |
| Beginning of Period | | 61,669,846 | | 72,015,293 |
| End of Period | | 54,841,629 | | 61,669,846 |
| Accumulated distibution in | | | | |
| excess of investment income—net | | (46,938) | | (49,576) |
The Fund 27
STATEMENT OF CHANGES IN NET ASSETS (continued)
| | | Year Ended December 31, |
| |
|
| | | 2007 a | | 2006 |
| |
| |
|
| Capital Share Transactions: | | | | |
| Class A b | | | | |
| Shares sold | | 53,856 | | 76,063 |
| Shares issued for dividends reinvested | | 2,636 | | 4,419 |
| Shares redeemed | | (43,760) | | (70,773) |
| Net Increase (Decrease) in Shares Outstanding | | 12,732 | | 9,709 |
| |
| |
|
| Class B b | | | | |
| Shares sold | | 1,891 | | 13,825 |
| Shares issued for dividends reinvested | | 359 | | 29 |
| Shares redeemed | | (21,013) | | (89,931) |
| Net Increase (Decrease) in Shares Outstanding | | (18,763) | | (76,077) |
| |
| |
|
| Class C | | | | |
| Shares sold | | 8,132 | | 2,778 |
| Shares issued for dividends reinvested | | 57 | | 57 |
| Shares redeemed | | (10,877) | | (5,354) |
| Net Increase (Decrease) in Shares Outstanding | | (2,688) | | (2,519) |
| |
| |
|
| Class F | | | | |
| Shares sold | | 322,384 | | 432,639 |
| Shares issued for dividends reinvested | | 78,650 | | 168,738 |
| Shares redeemed | | (1,410,653) | | (2,220,047) |
| Net Increase (Decrease) in Shares Outstanding | | (1,009,619) | | (1,618,670) |
| |
| |
|
| Class I | | | | |
| Shares sold | | 5,600 | | 22 |
| Shares issued for dividends reinvested | | 111 | | 165 |
| Shares redeemed | | (217) | | (1,453) |
| Net Increase (Decrease) in Shares Outstanding | | 5,494 | | (1,266) |
| |
| |
|
| Class T | | | | |
| Shares sold | | 1,610 | | 1,999 |
| Shares issued for dividends reinvested | | 30 | | 78 |
| Shares redeemed | | (3,054) | | (12) |
| Net Increase (Decrease) in Shares Outstanding | | (1,414) | | 2,065 |
| a | | Effective June 1, 2007, Class R shares were redesignated as Class I shares. |
| b | | During the period ended December 31, 2007, 7,754 Class B shares representing $73,999 were automatically |
| | | converted to 7,794 Class A shares and during the period ended December 31, 2006, 31,019 Class B shares |
| | | representing $271,694 were automatically converted to 30,728 Class A shares. |
| See notes to financial statements. |
28
FINANCIAL HIGHLIGHTS
The following tables describe the performance for each share class for the fiscal periods indicated.All information (except portfolio turnover rate) reflects financial results for a single fund share.Total return shows how much your investment in the fund would have increased (or decreased) during each period, assuming you had reinvested all dividends and distributions.These figures have been derived from the fund’s financial statements.
| | | | | | | Year Ended December 31, | | |
| | | |
| |
| |
|
| Class A Shares | | 2007 | | 2006 | | 2005 | | 2004 | | 2003 |
| |
| |
| |
| |
| |
|
| Per Share Data ($): | | | | | | | | | | |
| Net asset value, beginning of period | | 9.20 | | 8.58 | | 8.45 | | 7.88 | | 6.68 |
| Investment Operations: | | | | | | | | | | |
| Investment income—net | | .13a | | .12a | | .08 | | .08 | | .05 |
| Net realized and unrealized | | | | | | | | | | |
| gain (loss) on investments | | .43 | | .71 | | .13 | | .57 | | 1.20 |
| Total from Investment Operations | | .56 | | .83 | | .21 | | .65 | | 1.25 |
| Distributions: | | | | | | | | | | |
| Dividends from investment income—net | | (.13) | | (.21) | | (.08) | | (.08) | | (.05) |
| Net asset value, end of period | | 9.63 | | 9.20 | | 8.58 | | 8.45 | | 7.88 |
| |
| |
| |
| |
| |
|
| Total Return (%) b | | 6.24 | | 9.66 | | 2.51 | | 8.31 | | 18.81 |
| |
| |
| |
| |
| |
|
| Ratios/Supplemental Data (%): | | | | | | | | | | |
| Ratio of total expenses | | | | | | | | | | |
| to average net assets | | 1.60 | | 1.56 | | 1.69 | | 1.49 | | 1.83 |
| Ratio of net expenses | | | | | | | | | | |
| to average net assets | | 1.57 | | 1.56 | | 1.66 | | 1.48 | | 1.83 |
| Ratio of net investment income | | | | | | | | | | |
| to average net assets | | 1.35 | | 1.28 | | .90 | | .96 | | .63 |
| Portfolio Turnover Rate | | 151 | | 197 | | 181 | | 134 | | 108 |
| |
| |
| |
| |
| |
|
| Net Assets, end of period ($ x 1,000) | | 2,192 | | 1,976 | | 1,760 | | 1,682 | | 1,572 |
| |
| a | | Based on average shares outstanding at each month end. | | | | | | | | |
| b | | Exclusive of sales charge. | | | | | | | | | | |
| See notes to financial statements. | | | | | | | | | | |
The Fund 29
FINANCIAL HIGHLIGHTS (continued)
| | | | | | | Year Ended December 31, | | |
| | | |
| |
| |
|
| Class B Shares | | 2007 | | 2006 | | 2005 | | 2004 | | 2003 |
| |
| |
| |
| |
| |
|
| Per Share Data ($): | | | | | | | | | | |
| Net asset value, beginning of period | | 9.24 | | 8.50 | | 8.37 | | 7.80 | | 6.63 |
| Investment Operations: | | | | | | | | | | |
| Investment income—net | | .13a | | .02a | | .01a | | .01 | | .01 |
| Net realized and unrealized | | | | | | | | | | |
| gain (loss) on investments | | .47 | | .72 | | .13 | | .58 | | 1.17 |
| Total from Investment Operations | | .60 | | .74 | | .14 | | .59 | | 1.18 |
| Distributions: | | | | | | | | | | |
| Dividends from investment income—net | | (.12) | | — | | (.01) | | (.02) | | (.01) |
| Net asset value, end of period | | 9.72 | | 9.24 | | 8.50 | | 8.37 | | 7.80 |
| |
| |
| |
| |
| |
|
| Total Return (%) b | | 6.54 | | 8.75 | | 1.66 | | 7.63 | | 17.76 |
| |
| |
| |
| |
| |
|
| Ratios/Supplemental Data (%): | | | | | | | | | | |
| Ratio of total expenses | | | | | | | | | | |
| to average net assets | | 1.57 | | 2.56 | | 2.47 | | 2.21 | | 2.53 |
| Ratio of net expenses | | | | | | | | | | |
| to average net assets | | 1.55 | | 2.56 | | 2.45 | | 2.21 | | 2.53 |
| Ratio of net investment income | | | | | | | | | | |
| (loss) to average net assets | | 1.40 | | .25 | | .08 | | .23 | | (.08) |
| Portfolio Turnover Rate | | 151 | | 197 | | 181 | | 134 | | 108 |
| |
| |
| |
| |
| |
|
| Net Assets, end of period ($ x 1,000) | | 282 | | 442 | | 1,053 | | 1,625 | | 1,647 |
| |
| a | | Based on average shares outstanding at each month end. | | | | | | | | |
| b | | Exclusive of sales charge. | | | | | | | | | | |
| See notes to financial statements. | | | | | | | | | | |
30
| | | | | | | Year Ended December 31, | | |
| | | |
| |
| |
|
| Class C Shares | | 2007 | | 2006 | | 2005 | | 2004 | | 2003 |
| |
| |
| |
| |
| |
|
| Per Share Data ($): | | | | | | | | | | |
| Net asset value, beginning of period | | 9.05 | | 8.36 | | 8.24 | | 7.69 | | 6.54 |
| Investment Operations: | | | | | | | | | | |
| Investment income (loss)—net | | .03a | | .03a | | .00a,b | | .01a | | (.01) |
| Net realized and unrealized | | | | | | | | | | |
| gain (loss) on investments | | .50 | | .71 | | .13 | | .56 | | 1.16 |
| Total from Investment Operations | | .53 | | .74 | | .13 | | .57 | | 1.15 |
| Distributions: | | | | | | | | | | |
| Dividends from investment income—net | | (.11) | | (.05) | | (.01) | | (.02) | | (.00)b |
| Net asset value, end of period | | 9.47 | | 9.05 | | 8.36 | | 8.24 | | 7.69 |
| |
| |
| |
| |
| |
|
| Total Return (%) c | | 5.21 | | 8.87 | | 1.54 | | 7.42 | | 17.59 |
| |
| |
| |
| |
| |
|
| Ratios/Supplemental Data (%): | | | | | | | | | | |
| Ratio of total expenses | | | | | | | | | | |
| to average net assets | | 2.59 | | 2.53 | | 2.54 | | 2.35 | | 2.69 |
| Ratio of net expenses | | | | | | | | | | |
| to average net assets | | 2.57 | | 2.53 | | 2.51 | | 2.34 | | 2.69 |
| Ratio of net investment income | | | | | | | | | | |
| (loss) to average net assets | | .38 | | .31 | | .02 | | .08 | | (.17) |
| Portfolio Turnover Rate | | 151 | | 197 | | 181 | | 134 | | 108 |
| |
| |
| |
| |
| |
|
| Net Assets, end of period ($ x 1,000) | | 164 | | 181 | | 189 | | 264 | | 295 |
| |
| a | | Based on average shares outstanding at each month end. | | | | | | | | |
| b | | Amount represents less than $.01 per share. | | | | | | | | |
| c | | Exclusive of sales charge. | | | | | | | | | | |
| See notes to financial statements. | | | | | | | | | | |
The Fund 31
FINANCIAL HIGHLIGHTS (continued)
| | | | | Year Ended December 31, | | |
| |
| |
| |
|
| Class F Shares | | 2007 | | 2006 | | 2005 | | 2004 | | 2003 |
| |
| |
| |
| |
| |
|
| Per Share Data ($): | | | | | | | | | | |
| Net asset value, beginning of period | | 9.20 | | 8.59 | | 8.46 | | 7.88 | | 6.69 |
| Investment Operations: | | | | | | | | | | |
| Investment income—net | | .14a | | .13a | | .09 | | .08 | | .06 |
| Net realized and unrealized | | | | | | | | | | |
| gain (loss) on investments | | .43 | | .72 | | .14 | | .59 | | 1.20 |
| Total from Investment Operations | | .57 | | .85 | | .23 | | .67 | | 1.26 |
| Distributions: | | | | | | | | | | |
| Dividends from investment income—net | | (.13) | | (.24) | | (.10) | | (.09) | | (.07) |
| Net asset value, end of period | | 9.64 | | 9.20 | | 8.59 | | 8.46 | | 7.88 |
| |
| |
| |
| |
| |
|
| Total Return (%) | | 6.27 | | 9.91 | | 2.75 | | 8.58 | | 18.96 |
| |
| |
| |
| |
| |
|
| Ratios/Supplemental Data (%): | | | | | | | | | | |
| Ratio of total expenses | | | | | | | | | | |
| to average net assets | | 1.53 | | 1.42 | | 1.43 | | 1.34 | | 1.54 |
| Ratio of net expenses | | | | | | | | | | |
| to average net assets | | 1.51 | | 1.42 | | 1.40 | | 1.33 | | 1.54 |
| Ratio of net investment income | | | | | | | | | | |
| to average net assets | | 1.43 | | 1.41 | | 1.14 | | 1.08 | | .93 |
| Portfolio Turnover Rate | | 151 | | 197 | | 181 | | 134 | | 108 |
| |
| |
| |
| |
| |
|
| Net Assets, end of period ($ x 1,000) | | 52,057 | | 58,969 | | 68,926 | | 89,701 | | 119,835 |
| |
| a Based on average shares outstanding at each month end. | | | | | | | | |
| See notes to financial statements. | | | | | | | | | | |
32
| | | | | | | Year Ended December 31, | | |
| | | |
| |
| |
|
| Class I Shares | | 2007 a | | 2006 | | 2005 | | 2004 | | 2003 |
| |
| |
| |
| |
| |
|
| Per Share Data ($): | | | | | | | | | | |
| Net asset value, beginning of period | | 9.14 | | 8.56 | | 8.43 | | 7.86 | | 6.68 |
| Investment Operations: | | | | | | | | | | |
| Investment income—net | | .13b | | .15b | | .11 | | .09 | | .16 |
| Net realized and unrealized | | | | | | | | | | |
| gain (loss) on investments | | .45 | | .71 | | .14 | | .58 | | 1.05 |
| Total from Investment Operations | | .58 | | .86 | | .25 | | .67 | | 1.21 |
| Distributions: | | | | | | | | | | |
| Dividends from investment income—net | | (.15) | | (.28) | | (.12) | | (.10) | | (.03) |
| Net asset value, end of period | | 9.57 | | 9.14 | | 8.56 | | 8.43 | | 7.86 |
| |
| |
| |
| |
| |
|
| Total Return (%) | | 6.37 | | 10.10 | | 3.01 | | 8.63 | | 18.12 |
| |
| |
| |
| |
| |
|
| Ratios/Supplemental Data (%): | | | | | | | | | | |
| Ratio of total expenses | | | | | | | | | | |
| to average net assets | | 1.72 | | 1.38 | | 1.36 | | 1.35 | | 2.62 |
| Ratio of net expenses | | | | | | | | | | |
| to average net assets | | 1.56 | | 1.21 | | 1.17 | | 1.21 | | 2.37 |
| Ratio of net investment income | | | | | | | | | | |
| to average net assets | | 1.34 | | 1.62 | | 1.38 | | 1.21 | | .01 |
| Portfolio Turnover Rate | | 151 | | 197 | | 181 | | 134 | | 108 |
| |
| |
| |
| |
| |
|
| Net Assets, end of period ($ x 1,000) | | 101 | | 46 | | 54 | | 59 | | 72 |
| |
| a | | Effective June 1, 2007, Class R shares were redesignated as Class I shares. | | | | | | |
| b | | Based on average shares outstanding at each month end. | | | | | | | | |
| See notes to financial statements. | | | | | | | | | | |
The Fund 33
FINANCIAL HIGHLIGHTS (continued)
| | | | | | | Year Ended December 31, | | |
| | | |
| |
| |
|
| Class T Shares | | 2007 | | 2006 | | 2005 | | 2004 | | 2003 |
| |
| |
| |
| |
| |
|
| Per Share Data ($): | | | | | | | | | | |
| Net asset value, beginning of period | | 9.47 | | 8.81 | | 8.68 | | 8.09 | | 6.88 |
| Investment Operations: | | | | | | | | | | |
| Investment income—net | | .07a | | .10a | | .05 | | .03 | | .21 |
| Net realized and unrealized | | | | | | | | | | |
| gain (loss) on investments | | .45 | | .74 | | .14 | | .62 | | 1.00 |
| Total from Investment Operations | | .52 | | .84 | | .19 | | .65 | | 1.21 |
| Distributions: | | | | | | | | | | |
| Dividends from investment income—net | | (.07) | | (.18) | | (.06) | | (.06) | | (.00)b |
| Net asset value, end of period | | 9.92 | | 9.47 | | 8.81 | | 8.68 | | 8.09 |
| |
| |
| |
| |
| |
|
| Total Return (%) c | | 5.52 | | 9.56 | | 2.21 | | 8.01 | | 17.65 |
| |
| |
| |
| |
| |
|
| Ratios/Supplemental Data (%): | | | | | | | | | | |
| Ratio of total expenses | | | | | | | | | | |
| to average net assets | | 2.35 | | 1.96 | | 2.15 | | 2.02 | | 3.18 |
| Ratio of net expenses | | | | | | | | | | |
| to average net assets | | 2.17 | | 1.79 | | 1.87 | | 1.77 | | 2.73 |
| Ratio of net investment income | | | | | | | | | | |
| (loss) to average net assets | | .75 | | 1.06 | | .69 | | .66 | | (.29) |
| Portfolio Turnover Rate | | 151 | | 197 | | 181 | | 134 | | 108 |
| |
| |
| |
| |
| |
|
| Net Assets, end of period ($ x 1,000) | | 45 | | 57 | | 35 | | 35 | | 36 |
| |
| a | | Based on average shares outstanding at each month end. | | | | | | | | |
| b | | Amount represents less than $.01 per share. | | | | | | | | |
| c | | Exclusive of sales charge. | | | | | | | | | | |
| See notes to financial statements. | | | | | | | | | | |
34
NOTES TO FINANCIAL STATEMENTS
NOTE 1—Significant Accounting Policies:
Dreyfus Founders Balanced Fund (the “fund”) is a separate diversified series of Dreyfus Founders Funds, Inc. (the “Company”), which is registered under the Investment Company Act of 1940, as amended (the “Act”), as an open-end management investment company and operates as a series company currently offering six series, including the fund.The fund’s investment objective is to seek current income and capital appreciation. Founders Asset Management LLC (“Founders”) serves as the fund’s investment adviser. During the first half of the reporting period, Founders was an indirect wholly-owned subsidiary of Mellon Financial Corporation (“Mellon Financial”).
On July 1, 2007, Mellon Financial and The Bank of New York Company, Inc. merged, forming The Bank of New York Mellon Corporation (“BNY Mellon”). As part of this transaction, Founders became an indirect, wholly-owned subsidiary of BNY Mellon.
The Company’s Board of Directors approved the redesignation of the fund’s Class R shares as Class I shares, effective June 1, 2007.The eligibility requirements for Class I shares remained the same as for Class R shares.
MBSC Securities Corporation (the “Distributor”), the direct owner of Founders and a wholly-owned subsidiary of The Dreyfus Corporation (“Dreyfus”), an affiliate of Founders, is the distributor of the fund’s shares. The fund is authorized to issue up to 850 million shares of Common Stock, par value $ .01 per share, in the following classes of shares: Class A, Class B, Class C, Class F, Class I and Class T shares. Class A and Class T shares are subject to a sales charge imposed at the time of purchase, although the shares may be purchased at net asset value (“NAV”) without a slaes charge by certain categories of investors. Class B shares are subject to a contingent deferred sales charge (“CDSC”) imposed on Class B share redemptions made within six years of purchase and automatically convert to Class A shares after six
The Fund 35
NOTES TO FINANCIAL STATEMENTS (continued)
years.The fund does not offer Class B shares, except in connection with dividend reinvestment and permitted exchanges of Class B shares.Class C shares are subject to a CDSC imposed on Class C shares redeemed within one year of purchase. Class F and Class I shares are sold at (“NAV”) per share. Class F shares are sold only to Class F grandfathered investors, and Class I shares are sold only to eligible institutional investors. Other differences between the classes include the services offered to and the expenses borne by each class.Income and realized and unrealized gains or losses on investments are allocated to each class of shares based on its relative net assets.
Each class of the fund bears expenses incurred specifically on its behalf and, in addition, each class bears a portion of general expenses based on the relative net assets or the number of shareholder accounts of the class.The type of expense determines the allocation method.
The Company’s Board of Directors has authorized the payment of certain fund expenses with commissions on fund portfolio transactions. These commissions reduce miscellaneous expenses and are included in the expense offset to broker commissions in the Statement of Operations.
The fund’s financial statements are prepared in accordance with U.S. generally accepted accounting principles, which require the use of management estimates and assumptions. Actual results could differ from those estimates.
The fund enters into contracts that contain a variety of indemnifications. The fund’s maximum exposure under these arrangements is unknown.The fund does not anticipate recognizing any loss related to these arrangements.
(a) Portfolio valuation: A domestic equity security listed or traded on a securities exchange or in the over-the-counter market is valued at its last sale price on the exchange or market where it is principally traded or, in the case of a security traded on NASDAQ, at its official closing price. Lacking any sales on that day, the security is valued at the cur-
36
rent closing bid price, or by quotes from dealers making a market in the security if the closing bid price is not available, or in the case of written call options, at the mean between the highest bid and lowest asked quotations obtained from at least two securities dealers.
A foreign equity security traded on a foreign exchange is valued at the last quoted official closing price available before the time when the fund’s assets are valued, or at the last quoted sales price if the exchange does not provide an official closing price or if the foreign market has not yet closed. Lacking any sales that day, the security is valued at the current closing bid price, or by quotes from dealers making a market in the security if the closing bid price is not available. New York closing exchange rates are used to convert foreign currencies to U.S. dollars.
A debt security with a remaining maturity greater than 60 days at the time of purchase is valued in accordance with the evaluated bid price supplied by a pricing service approved by the Company’s Board of Directors or, if such price is not available, at the mean between the highest bid and lowest asked quotations obtained from at least two securities dealers.A debt security with a remaining maturity of 60 days or less at the time of purchase is valued at amortized cost, which approximates market value, unless it is determined that amortized cost would not represent market value, in which case the securities would be marked to market.
Registered open-end investment companies that are not traded on an exchange are valued at their NAV.
If market quotations or official closing prices are not readily available or are determined not to reflect accurately fair value, securities will be valued at their fair value as determined in good faith by the Company’s Board of Directors or pursuant to procedures approved by the Board of Directors.These situations may include instances where an event occurs after the close of the market on which a security is traded but before the fund calculates its NAV, and it is determined that
The Fund 37
NOTES TO FINANCIAL STATEMENTS (continued)
the event has materially affected the value of the security. Fair value of foreign equity securities may be determined with the assistance of a pricing service using calculations based on indexes of domestic securities and other appropriate indicators, such as prices of relevant ADRs and futures contracts.
The Financial Accounting Standards Board (“FASB”) released Statement of Financial Accounting Standards No. 157 “Fair Value Measurements” (“FAS 157”). FAS 157 establishes an authoritative definition of fair value, sets out a framework for measuring fair value, and requires additional disclosures about fair-value measurements.The application of FAS 157 is required for fiscal years beginning after November 15, 2007 and interim periods within those fiscal years. Management does not believe that the application of this standard will have a material impact on the financial statements of the fund.
(b) Foreign securities and currency transactions:The fund may invest at least a portion of its assets in foreign securities. Foreign securities carry more risk than U.S. securities, such as political and currency risks. In the event the fund executes a foreign security transaction, the fund may enter into a foreign currency contract to settle the foreign security transaction. The fund could be exposed to risk if counterparties are unable to meet the terms of the contracts or if the value of the currency changes unfavorably to the U.S. dollar.The resultant foreign currency gain or loss from the contract is recorded as foreign currency gain or loss and is presented as such in the Statement of Operations.
The accounting records of the fund are maintained in U.S. dollars.The market values of foreign securities, currency holdings and other assets and liabilities are translated into U.S. dollars based on the current exchange rates each business day. Purchases and sales of investment securities and income and expense items denominated in foreign currencies are translated into U.S. dollar amounts on the respective dates of such transactions.
38
The fund does not isolate that portion of the results of operations resulting from changes in foreign exchange rates on investments from the fluctuations arising from changes in market prices of securities held. Such fluctuations are included with the net unrealized appreciation (depreciation) from investments and foreign currency translations not on Statement of Operations.
Reported net realized foreign exchange gains or losses arise from sales of foreign currencies, currency gains or losses realized between the trade and settlement dates on securities transactions, and the difference between the amounts of dividends, interest, and foreign withholding taxes recorded on the fund’s books and the U.S. dollar equivalent of the amounts actually received or paid. Net unrealized appreciation or depreciation on investments and foreign currency translation arises from changes in the values of assets and liabilities, including investments in securities held at the date of the financial statements, resulting from changes in the exchange rates and changes in market prices of securities held.
(c) Securities transactions and investment income: Securities transactions are recorded on a trade date basis. Realized gains and losses from securities transactions are recorded on the identified cost basis. Dividend income is recognized on the ex-dividend date and interest income, including, where applicable, accretion of discount and amortization of premium on investments, is recognized on the accrual basis.
The fund has an arrangement with the custodian bank, Mellon Bank, N.A. (“Mellon Bank”), whereby the fund receives earnings credits from the custodian when positive cash balances are maintained, which are used to offset custody fees. For financial reporting purposes, the fund includes any earnings credits as an expense offset in the Statement of Operations.
(d) Affiliated issuers: Investments in other investment companies advised by Founders or its affiliates are defined as “affiliated” in the Act.
The Fund 39
NOTES TO FINANCIAL STATEMENTS (continued)
(e) Dividends to shareholders: Dividends are recorded on the ex-dividend date.The fund declares and distributes dividends from investment income-net, if any, quarterly, and dividends from net realized capital gains, if any, annually, but the fund may make distributions on a more frequent basis to comply with the distribution requirements of the Internal Revenue Code of 1986, as amended (the “Code”). To the extent that net realized capital gains can be offset by capital loss carryovers, it is the policy of the fund not to distribute such gains. Income and capital gain distributions are determined in accordance with income tax regulations, which may differ from U.S. generally accepted accounting principles.
(f) Federal income taxes: No provision has been made for federal income taxes since it is the policy of the fund to continue to comply with the requirements of Subchapter M of the Code that are applicable to regulated investment companies and to make distributions of income and capital gains sufficient to relieve it from all income taxes.The fund is treated as a separate tax entity for federal income tax purposes.
During the current year, the fund adopted FASB Interpretation No. 48 “Accounting for Uncertainty in Income Taxes” (“FIN 48”). FIN 48 provides guidance for how uncertain tax positions should be recognized, measured, presented and disclosed in the financial statements. FIN 48 requires the evaluation of tax positions taken or expected to be taken in the course of preparing the fund’s tax returns to determine whether the tax positions are “more-likely-than-not” of being sustained by the applicable tax authority.Tax positions not deemed to meet the more-likely-than-not threshold would be recorded as a tax benefit or expense in the current year.The adoption of FIN 48 had no impact on the operations of the fund for the period ended December 31, 2007.
The fund is not subject to examination by U.S. Federal, State and City tax authorities for the tax years before 2004.
At December 31, 2007, the components of accumulated earnings on a tax basis were as follows: undistributed ordinary income $13,421, accumulated capital losses $178,104,898 and unrealized appreciation $4,523,229.
40
The accumulated capital loss carryover is available to be applied against future net securities profits, if any, realized subsequent to December 31, 2007. If not applied, $57,256,068 of the carryover expires in fiscal 2008, $49,289,530 expires in fiscal 2009, $70,087,112 expires in fiscal 2010 and $1,472,188 expires in fiscal 2011.
The tax character of distributions paid to shareholders during the fiscal periods ended December 31, 2007 and December 31, 2006, were as follows: ordinary income $811,678 and $1,629,590, respectively.
During the period ended December 31, 2007, as a result of permanent book to tax differences, primarily due to the tax treatment for amortization adjustments, the fund increased accumulated undistributed investment income-net by $1,555, decreased accumulated net realized gain (loss) on investments by $1,399 and decreased paid-in capital by $156. Net assets and net asset value were not affected by this reclassification.
NOTE 2—Bank Line of Credit:
The Company has a line of credit arrangement (“LOC”) with State Street Bank and Trust Company, to be used for temporary or emergency purposes, primarily for financing redemption payments. The borrowings by each series of the Company are limited to the lesser of (a) $25 million, or (b) the lesser of 25% of the series’ total net assets or the maximum amount which the series is permitted to borrow pursuant to the prospectus, any law or any other agreement. Combined borrowings are subject to the $25 million cap on the total LOC. Each series agrees to pay annual fees and interest on the unpaid balance based on prevailing market rates as defined in the LOC.
The average daily amount of borrowings outstanding under the LOC during the period ended December 31, 2007 was approximately $18,300, with a related weighted average annualized interest rate of 5.43% .
The Fund 41
NOTES TO FINANCIAL STATEMENTS (continued)
NOTE 3—Investment Advisory Fee and Other Transactions With Affiliates:
(a) In accordance with an investment advisory agreement between the Company and Founders, the fund compensates Founders for its services as investment adviser by the payment of fees computed daily and paid monthly at the annual rate equal to a percentage of the average daily value of the fund’s net assets.The fee is .65% of the first $250 million of net assets, .60% of the next $250 million of net assets, .55% of the next $250 million of net assets and .50% of net assets in excess of $750 million.
During the period ended December 31, 2007, the Distributor retained $539 and $12 from commissions earned on sales of the fund’s Class A and Class T shares, respectively, and $550 from CDSC on redemptions of the fund’s Class C shares.
(b) Under a Distribution Plan (the “Class B, C and T “Plan”) adopted pursuant to Rule 12b-1 under the Act, Class B, Class C and Class T shares pay the Distributor for distributing their shares at an annual rate of .75% of the value of their average daily net assets of Class B and Class C shares and .25% of the value of the average daily net assets of Class T shares.The Class B shares ceased paying Rule 12b-1 fees to the Distributor in late 2006 in accordance with regulatory requirements that limit the amount of sales charges a mutual fund may impose based on sales of the fund’s shares. The Class B shares may resume paying Rule 12b-1 fees in the future if permitted to do so by applicable regulation. During the period ended December 31, 2007, Class B, Class C and Class T shares were charged $0, $1,196 and $141, respectively, pursuant to the Class B, C and T Plan.
The fund also has adopted a Distribution Plan pursuant to Rule 12b-1 under the Act applicable to its Class F shares (the “Class F Plan”). Under the Class F Plan, the fund is authorized to reimburse the Distributor for expenses paid for distributing or servicing its Class F shares at an annual rate of up to .25% of the value of the average daily net assets of the fund’s Class F shares. During the period ended December 31, 2007, Class F shares were charged $137,802 pursuant to the Class F Plan.
42
(c) Under the Shareholder Services Plan, Class A, Class B, Class C and Class T shares pay the Distributor at an annual rate of .25% of the value of their average daily net assets for the provision of certain services.The services provided may include personal services relating to shareholder accounts, such as answering shareholder inquiries regarding the fund and providing reports and other information, and services related to the maintenance of shareholder accounts.The Distributor may make payments to Service Agents (a securities dealer, financial institution or other industry professional) in respect of these services.The Distributor determines the amounts to be paid to Service Agents. During the period ended December 31, 2007, Class A, Class B, Class C and Class T shares were charged $5,440, $891, $399 and $141, respectively, pursuant to the Shareholder Services Plan.
The Company has a shareholder services agreement with the Distributor, whereby the fund has agreed to compensate the Distributor for providing certain shareholder servicing functions to holders of Class F shares.The fund paid the Distributor a monthly fee equal, on an annual basis, to $24.00 per Class F shareholder account considered to be an open account at any time during a given month. During the period ended December 31, 2007, Class F shares were charged $43,801 pursuant to this shareholder services agreement.
Dreyfus Transfer, Inc. (“DTI”), a wholly-owned subsidiary of Dreyfus, is the transfer and dividend disbursing agent for all of the fund’s share classes.With the exception of out-of-pocket charges, the fees charged by DTI with respect to the fund’s Class F shares are paid by the Distributor.The out-of-pocket charges from DTI are paid by the fund. During the period ended December 31, 2007, Class F shares were charged $5,111 for out-of-pocket transfer agent charges.
The fees charged by DTI with respect to the fund’s Class A, B, C, I and T shares are paid by the fund. These transfer agency fees, including both the per account fees paid to DTI and out-of-pocket charges, during the period ended December 31, 2007 were $11,576.
The Fund 43
NOTES TO FINANCIAL STATEMENTS (continued)
Founders has agreed to reimburse (or to cause its affiliates to reimburse) the Class I and Class T share classes of the Fund for certain transfer agency expenses pursuant to a written contractual commitment. This commitment will extend through at least August 31, 2008, and will not be terminated without prior notification to the Company’s Board of Directors. During the period ended December 31, 2007, Class I and Class T were each reimbursed $88, which reduced the amounts paid to DTI to $182 and $259, respectively.
The fund compensates Mellon Bank, an affiliate of Founders, under a custody agreement for providing custodial services for the fund. During the period ended December 31, 2007, the fund was charged $8,931 pursuant to the custody agreement.
The fund also pays Mellon Bank for certain cash management services. These fees are included in the out-of-pocket transfer agency charges above.
The fund has agreed to compensate Dreyfus for providing accounting services, administration, compliance monitoring, regulatory and shareholder reporting, as well as related facilities, equipment and clerical help.The fee is computed at the annual rate of .06% of the average daily net assets of the fund on the first $500 million, .04% of the average daily net assets of the fund on the next $500 million and .02% of the average daily net assets of the fund in excess of $1 billion, plus reasonable out-of pocket expenses. Dreyfus has contractually agreed in writing to waive any fees received for these services to the extent they exceed its costs in providing the services and a reasonable allocation of Founders’ costs related to the support and oversight of these services. During the period ended December 31, 2007, Dreyfus waived $10,628.
The components of “Due to Founders Asset Management LLC and affiliates” in the Statement of Assets and Liabilities consist of: investment advisory fees $30,501, Rule 12b-1 distribution plan fees $11,015, shareholder services plan fees $31,238, custodian fees $2,233, accounting fees $1,390 and transfer agency per account fees $790.
44
(d) Annual retainer fees and attendance fees for the Company’s Board of Directors are allocated to each series of the Company based on net assets.The Company’s Board of Directors has adopted a deferred compensation plan for Company directors that enables directors to elect to defer receipt of all or a portion of the annual compensation that they are entitled to receive from the Company. Under the plan, the compensation deferred is invested in shares of one or more of the Company’s series.The amount paid to the director under the plan will be determined based upon the performance of the selected series.The current value of these amounts, if any, is included in Other Assets and Directors’ Deferred Compensation in the Statement of Assets and Liabilities. Changes in market value are included in the directors’ fees and expenses and the net change in unrealized appreciation (depreciation) of investments in the Statement of Operations. Deferral of directors’ fees under the plan does not affect the net assets of the fund.
Certain officers of the Company are also officers and/or directors of Founders or its affiliates, which pay their compensation.The affairs of the fund, including services provided by Founders, are subject to the supervision and general oversight of the Company’s Board of Directors.
NOTE 4—Securities Transactions:
The aggregate amount of purchases and sales of investment securities, excluding short-term securities, during the period ended December 31, 2007, amounted to $87,654,959 and $98,073,717, respectively.
At December 31, 2007, the cost of investments for federal income tax purposes was $50,188,040; accordingly, accumulated net unrealized appreciation on investments was $4,523,229, consisting of $6,290,973 gross unrealized appreciation and $1,767,744 gross unrealized depreciation.
The Fund 45
NOTES TO FINANCIAL STATEMENTS (continued)
NOTE 5—Plan of Reorganization:
At a meeting of the Company’s Board of Directors held on November
8, 2007, the Board approved, subject to shareholder approval, an Agreement and Plan of Reorganization (the “Agreement”) between the Company, on behalf of the fund, and Dreyfus LifeTime Portfolios, Inc., on behalf of Dreyfus LifeTime Growth and Income Portfolio (the “Acquiring Fund”). The Agreement provides for the transfer of the fund’s assets to the Acquiring Fund in a tax-free exchange for shares of the Acquiring Fund and the assumption by the Acquiring Fund of the fund’s stated liabilities, the distribution of shares of the Acquiring Fund to the fund’s shareholders and the subsequent termination of the fund (the “Reorganization”). It is currently contemplated that holders of fund shares as of December 21, 2007 will be asked to approve the Agreement on behalf of the fund at a special meeting of shareholders to be held on or about February 27, 2008. If approved, the Reorganization is expected to take place on or about April 2, 2008.
46
REPORT OF INDEPENDENT REGISTERED
PUBLIC ACCOUNTING FIRM
|
| | Shareholders and Board of Directors
Dreyfus Founders Balanced Fund
|
We have audited the accompanying statement of assets and liabilities, including the statement of investments, of Dreyfus Founders Balanced Fund (one of the funds comprising Dreyfus Founders Funds, Inc.), as of December 31,2007,and the related statement of operations,the statement of changes in net assets and financial highlights for the year then ended. These financial statements and financial highlights are the responsibility of the Fund’s management. Our responsibility is to express an opinion on these financial statements and financial highlights based on our audit.The statement of changes in net assets of Dreyfus Founders Balanced Fund for the year ended December 31, 2006 and the financial highlights for each of the indicated periods through December 31, 2006, were audited by other auditors whose report dated February 23, 2007, expressed an unqualified opinion on the statement and financial highlights.
We conducted our audit in accordance with the standards of the Public Company Accounting Oversight Board (United States).Those standards require that we plan and perform the audit to obtain reasonable assurance about whether the financial statements and financial highlights are free of material misstatement.We were not engaged to perform an audit of the Fund’s internal control over financial reporting. Our audits included consideration of internal control over financial reporting as a basis for designing audit procedures that are appropriate in the circumstances,but not for the purpose of expressing an opinion on the effectiveness of the Fund’s internal control over financial reporting.Accordingly, we express no such opinion.An audit also includes examining, on a test basis, evidence supporting the amounts and disclosures in the financial statements and financial highlights, assessing the accounting principles used and significant estimates made by management, and evaluating the overall financial statement presentation. Our procedures included confirmation of securities as of December 31, 2007 by correspondence with the custodian.We believe that our audit provides a reasonable basis for our opinion.
In our opinion, the financial statements and financial highlights referred to above present fairly, in all material respects, the financial position of Dreyfus Founders Balanced Fund at December 31, 2007, and the results of its operations, the changes in its net assets and the financial highlights for the year then ended, in conformity with accounting principles generally accepted in the United States.

| | New York, New York
February 21, 2008
|
The Fund 47
IMPORTANT TAX INFORMATION (Unaudited)
For federal tax purposes, the fund hereby designates 66.76% of the ordinary dividends paid during the fiscal year ended December 31, 2007 as qualifying for the corporate dividends received deduction. For the fiscal year ended December 31, 2007, certain dividends paid by the fund may be subject to a maximum tax rate of 15%, as provided for by the Jobs and Growth Tax Relief Reconciliation Act of 2003. Of the distributions paid during the fiscal year, $558,128 represents the maximum amount that may be considered qualified dividend income. Shareholders will receive notification in January 2008 of the percentage applicable to the preparation of their 2007 income tax returns.
48
FACTORS CONSIDERED IN RENEWING
THE ADVISORY AGREEMENT (Unaudited)
|
At a meeting of the board of directors of Dreyfus Founders Funds, Inc. (the “Funds” and, in reference to any one of the Funds’ portfolios, a “Fund”) held on August 15 and 16, 2007, the Funds’ directors unanimously approved the continuation of the Investment Advisory Agreement (“management agreement”) between each of the Funds and Founders Asset Management LLC, the Funds’ investment adviser (“Founders”), for a one-year term ending August 31, 2008.The board of directors of the Funds (“board”) is comprised entirely of individuals who have no affiliation with Founders or any affiliates of Founders (the “directors”).
Prior to the directors’ August 2007 meeting, Founders had provided the directors with extensive materials related to the renewal of the management agreement, including performance and expense information for other investment companies with similar investment objectives to each Fund derived from data compiled by Lipper Inc., an independent third party (“Lipper”).
During their meeting, the directors discussed the proposed continuance of the management agreement with the senior management personnel of Founders. At the conclusion of these discussions, the directors and their independent counsel met in a private session at which no representatives of Founders were present, to continue their discussion of continuance of the agreement. In determining to continue the management agreement, the directors considered all factors which they believed to be relevant, including the following:
Nature, Extent and Quality of Services Provided and to be Provided by Founders
The directors recognized that they have had the opportunity to evaluate the investment and non-investment related services which Founders and its affiliates provide to the Funds primarily through their quarterly review of all of the operations of the Funds during Fund committee and Fund board meetings held throughout the past twelve months. At each such meeting, extensive discussions of Fund operations are held with senior management personnel of Founders and a
The Fund 49
| | FACTORS CONSIDERED IN RENEWING THE
ADVISORY AGREEMENT (Unaudited) (continued)
|
large volume of documentation with respect to these operations is provided to and reviewed by the directors. Such discussions and documentation afford the directors the continual opportunity to evaluate the nature, extent, and quality of the services provided by Founders and its affiliates to the Funds.
The directors were satisfied that Founders is managing the investment of the assets of the Funds in accordance with each Fund’s respective investment objective, policies and restrictions, subject to the directors’ overall supervision.
The directors considered that Founders also provides many non-investment related services to the Funds in fulfilling its responsibilities under the management agreement.
Following their discussion and review, the directors reached the following conclusions:
- That the breadth and quality of investment advisory and other ser- vices being provided to the Funds are satisfactory, as evidenced in part by the performance records of the Funds, to which the direc- tors gave significant attention as indicated below; and
- That the directors are satisfied not only with the research, long-term portfolio management, and trading services being provided to the Funds, but also recognize that Founders or its affiliates have pro- vided the highest quality accounting, compliance and regulatory, administrative, underwriting, custody, shareholder, transfer agent and cash management services to the Funds, while charging fair, reason- able and competitive fees.
Investment Performance
On a quarterly basis, the directors hold meetings with representatives of the portfolio management team for each Fund (usually a portfolio manager), during which each representative reviews, among other items, performance information, attribution analyses, and the portfolio manager’s investment outlook. The directors also receive written monthly and quarterly performance information for each Fund.These written quarterly reports include comparisons of each Fund’s perfor-
50
mance with its respective Lipper category and one or more benchmark indexes, as well as a comparable exchange-traded fund, for the most recent quarter and one-, three- and five-year periods, as well as for the portfolio manager’s tenure.
In conjunction with their consideration of renewal of the management agreement, the directors received a more detailed performance report about each Fund from Lipper.These reports compared each Fund’s performance to both a relatively small group of similar funds selected by Lipper (the “Lipper performance group”), as well as to all funds in the applicable Lipper category (the “Lipper performance universe”).
The performance of Balanced Fund’s Class F shares placed in the lowest two quintiles of both its Lipper performance group and the Lipper mixed-asset target allocation growth fund performance universe for the one-, three- and five-year periods ended December 31, 2006, placed in the lowest two quintiles of its Lipper performance universe for the one, three- and five-year periods ended June 30, 2007, and underperformed its benchmark index for the one-, three- and five-year periods ended June 30, 2007.The directors recognized that in its efforts to improve the unsatisfactory performance results of Balanced Fund, Founders had implemented certain changes with respect to the management of the Fund in 2006.The Funds’ directors were hopeful that the steps Founders has taken in an effort to improve the Fund’s performance will show relative performance progress.The directors intend to continue to monitor the Fund’s future performance results closely.
After consideration of all relevant information and data, the directors concluded that although past performance cannot be a guaranty of future performance, each Fund and its shareholders would continue to benefit from Founders’ investment management of the Fund. The directors further determined:
- That although certain of the Funds have experienced performance difficulties, Founders has focused its efforts upon improving the per- formance records of the Funds and will continue to seek improve- ment; and
The Fund 51
| | FACTORS CONSIDERED IN RENEWING THE
ADVISORY AGREEMENT (Unaudited) (continued)
|
- That the materials provided by Lipper demonstrated that most of the Funds maintained satisfactory performance quintile rankings in their respective comparison groups and comparison universes, with five of seven Funds placing in the top two quintiles of their respec- tive Lipper performance universes for the one-year period ended December 31, 2006, and four placing in the top two quintiles for the three years ended December 31, 2006.
Costs of the Services to be Provided and Profits to be
Realized by Founders and Its Affiliates from Founders’
Relationship With the Funds
|
The directors recognized that on a quarterly basis, they receive information with respect to each Fund’s expenses. The directors carefully review and discuss the expense ratios for all classes of shares of each Fund at each of their quarterly meetings throughout the year.
In conjunction with their annual consideration of renewal of the Funds’ management agreement and other service arrangements, the directors received detailed information from Lipper which compared each Fund’s management fees and other expenses with those of a group of similar funds selected by Lipper (the “Lipper expense group”), as well as summary information comparing each Fund’s management fees and expenses with those of the funds in its Lipper performance universe with load structures similar to that of the Funds (the “Lipper expense universe”).
The directors noted that for the one-year period ended December 31, 2006, Balanced Fund’s management fees ranked in the first (best) quin-tile of its Lipper expense group, with the Fund’s fees the third lowest of 19 “peer funds.”The Fund’s contractual management fees at a common asset level were determined by Lipper to be the second lowest of 19 funds in its group.The Fund’s management fees were in the third quintile of its Lipper expense universe.
The directors also considered information provided by Lipper with respect to the profitability of the investment management activities conducted by a number of publicly-held corporations. Lipper also pre-
52
pared an analysis providing detailed information with respect to the types of services rendered to various mutual fund complexes under their respective investment advisory contracts, including the services provided by Founders to the Funds under the management agreement.
The directors had been provided with extensive materials with respect to the profitability derived by Founders from providing investment advisory and other services to the Funds as a group and to each Fund individually.
The directors further considered certain indirect benefits received by Founders and its affiliates as a result of Founders’ provision of investment advisory services to the Funds.These included the following:
- Since Founders manages a non-Fund account in a style that is sim- ilar to that used for one of the Funds (and for portions of certain other Funds), and employees of Founders manage other non-Fund accounts in a similar style in their capacities as employees of the affiliates, Founders and its affiliates realize efficiencies in performing the portfolio management, trading and operational functions related to those non-Fund accounts;
- The Funds’ brokerage transactions may be executed with brokers that provide research and brokerage services to Founders and its affiliates. These research and brokerage services may be useful to Founders and its affiliates in providing investment advisory services to any of the clients they advise, including the Funds; and
- Affiliates of Founders receive various fees for providing accounting, underwriting, shareholder, transfer agency, custody and cash man- agement services to the Funds.
After deliberation and discussion of Fund fees and expenses, the directors determined:
- That upon review of the advisory fee structures of the Funds in comparison with the competitive expense groups and expense uni- verses selected by Lipper, the levels of investment advisory fees paid by the Funds were deemed to be competitive;
The Fund 53
| | FACTORS CONSIDERED IN RENEWING THE
ADVISORY AGREEMENT (Unaudited) (continued)
|
- That the expense ratios of the Funds are competitive and that Founders continually reviews each Fund’s total expense ratio and has initiated voluntarily expense caps and fee waivers for certain Funds to reduce their expense ratios;
- That five of the seven Funds’ expense ratios decreased or remained the same for all or most of their share classes in 2006 as compared to those experienced in 2005, in some instances as a result of increases in Fund assets; and
- That the comparative fee and expense information included in the materials provided by Lipper supports the determination that the advisory and other fees payable by the Funds to Founders and its affiliates are essentially fees which would be similar to those that would have resulted solely from “arm’s-length” bargaining.
With respect to profitability to Founders, the directors reviewed the adviser profitability analysis provided by Lipper, which demonstrated that Founders’ 2006 profitability from providing management services to the Funds was reasonable in comparison to the entities included in the Lipper analysis.
The directors were also advised by independent counsel of the profitability percentage ranges which court cases have found acceptable and determined that Founders’ profitability percentage for providing management and other services to the Funds was reasonable.
The directors concluded that Founders’ profits from providing management services to the Funds were reasonable in relationship to the overall services which Founders provides.
Economies of Scale
The directors reviewed information provided by Founders which summarized the extent, if any, that both Founders and the Funds would achieve certain economies of scale if the assets of the Funds were to increase.
54
After review and discussion, the directors considered the extent to which economies of scale and common management are shared with each Fund, including the economies that would be realized from the growth of each Fund’s assets. After such consideration, the directors determined that all of the Funds have structured breakpoints in their advisory fees, which result in fee reductions as the assets of each Fund reach defined levels, and that such fee reductions, when implemented, would benefit all of the applicable Fund’s shareholders through decreases in the Fund’s expense ratio.
Dedication to Regulatory Requirements and Restrictions
An important factor in the directors’ consideration of renewal of the Funds’ management agreement with Founders included the directors’ recognition of the dedication by Founders of stringent adherence to regulatory requirements and restrictions.The directors determined that Founders is dedicated to compliance with all applicable rules and regulations and that the systems of controls which are in place to ensure that the service providers to the Funds, including Founders, and the Funds themselves, maintain strict adherence to the law are excellent.
Overall Conclusions
The directors determined that they are generally satisfied with the performance of the Funds and with the quality of the advisory and other services being provided by Founders and its affiliates to the Funds. The directors recognized that efforts are being and will continue to be made to improve the Funds’ performance and to maintain Fund expense ratios at reasonable and competitive levels.
The directors concluded that continuation of the current management agreement between each Fund and Founders, which would enable each Fund to continue to receive investment advisory services from Founders, is in the best interests of each Fund and its shareholders, the
The Fund 55
| | FACTORS CONSIDERED IN RENEWING THE
ADVISORY AGREEMENT (Unaudited) (continued)
|
services to be performed under the management agreement are services required for the operations of the Funds, Founders has provided satisfactory investment management services to the Funds in the past, and the fees for the management services which Founders will perform will be within the range of what would have been negotiated at arm’s length in light of the circumstances.
56
YOUR BOARD REPRESENTATIVES (Unaudited)
The Board of Directors of the Company oversees all six Dreyfus Founders Funds.The business and affairs of the Company are managed under the direction of the Board. The directors serving on the Board perform their responsibilities in the manner which they reasonably believe to be in the best interests of the Funds and their shareholders.
All of the directors,as listed below,are independent directors.They are not affiliated with the Fund’s adviser, its parent company, or its affiliates.The directors have no official term of office and generally serve until they retire (normally at age 75, but subject to extension to age 80), resign, or are not re-elected.As you can see from their backgrounds, the directors have broad experience as active or former business and community leaders.
Eugene H.Vaughan, CFA, 74.Year elected to the Board: 1970
Board Chairman. Founding Chairman,Vaughan Nelson Investment Management, LP, an investment counseling firm. Director, Encore Bank, Houston. Founding Chairman, Center for Houston’s Future, a non-profit organization. Founding Chairman and former Governor, CFA Institute. Past Chairman and Trustee, Institute of Chartered Financial Analysts. Past Chairman and Director, Financial Analysts Federation. Chairman-elect, University of Texas Health Science Center.
Alan S. Danson, 68.Year elected to the Board: 1991
Private investor. Formerly, President and Director, D.H. Management, Inc., the general partner of a limited partnership with technology company holdings (1996 to 2003). Director, Gore Range Natural Science School and The Les Streeter Program, Inc., both of which are non-profit organizations.
Robert P. Mastrovita, 63.Year elected to the Board: 1998
Private investor. Chairman of a private charitable foundation (1997 to present). Formerly, Chairman and Director, Hagler, Mastrovita & Hewitt, Inc., a registered investment adviser (1982 to 1997). Member, Boston Society of Security Analysts. Trustee, Partridge Academy. Director, King Caesar Foundation.
Trygve E. Myhren, 71.Year elected to the Board: 1996
President, Myhren Media, Inc., a firm that invests in and advises media, telecommunications, Internet and software companies. Special Limited Partner and member of Investment Committee, Megunticook Funds, a venture capital firm (1998 to present). Director, AdPay, Inc.Trustee, Executive Committee and Chairman of Faculty Education Affairs Committee, the University of Denver. Trustee, Denver Art
The Fund 57
YOUR BOARD REPRESENTATIVES (Unaudited) (continued)
Museum. Member, Colorado FORUM and Cable Television Hall of Fame. Formerly, President (1990 to 1996) and Director (1992 to 2001) of the Providence Journal Company, a diversified media and communications company. Formerly, Chairman and Chief Executive Officer of American Television and Communications Corporation (now Time Warner Cable) (1981 to 1988). Formerly, Chairman of the National Cable Television Association (1986-1987). Chief of Mission, 2006 Paralympic Games,Torino/Sestrierre, Italy.
George W. Phillips, 69.Year elected to the Board: 1998
Retired.Vice Chairman of the Board and Chairman of the Investment Committee, Children’s Medical Center of Boston. Formerly, President and Chief Executive Officer (1992 to 1997) and Director (1992 to 2002) of Warren Bancorp, Inc. Formerly, President, Chief Executive Officer and Director of Warren Five Cents Savings Bank (1992 to 1997).
Martha A. Solis-Turner, 47.Year elected to the Board: 2005
Formerly, Telecommunications Director, Wholesale Markets (1995 to 2001), and Manager (1990 to 1995), Qwest Communications International Inc. Board member and Treasurer, Mile High Montessori Early Learning Centers (2002 to present), and formerly, Board member (1995 to 2004) and Vice President (2002 to 2004), Curtis Park Community Center, both of which are non-profit organizations.
Principal Officers
J. David Officer, 59. President and Principal Executive Officer of the Funds since 2007. Chief Operating Officer,Vice Chairman and a Director of Dreyfus, and an officer of 78 investment companies (comprised of 163 portfolios) managed by Dreyfus. He has been an employee of Dreyfus since 1998.
Denise B. Kneeland, 56. Vice President of the Funds since 2008. Assistant Vice President (since 1996) and Secretary (since 2007) of the Mellon Institutional Funds Investment Trust. First Vice President and Manager, Mutual Funds Operations, BNY Mellon Asset Management (since 2006). Formerly,Vice President and Manager, Mutual Funds Operations, Standish Mellon Asset Management Company, LLC (1996 to 2001).
Kenneth R. Christoffersen, 52. Vice President of the Funds since 2008, and Secretary since 2000 (and from 1996 to 1998). Founders’ Senior Vice President -Legal, General Counsel and Secretary. Assistant Secretary of the Distributor since 2003. Employed by Founders and its predecessor company since 1996.
58
Steven M. Anderson, 42.Treasurer and Principal Financial and Accounting Officer of the Funds since 2007. Vice President (since 1999), Treasurer (since 2002) and Chief Financial Officer of Mellon Institutional Funds Investment Trust. Vice President and Mutual Funds Controller, BNY Mellon Asset Management (since 2003). Formerly, Assistant Vice President and Mutual Funds Controller, Standish Mellon Asset Management Company, LLC (2000 to 2003).
Janelle E. Belcher, 49. Chief Compliance Officer of the Funds since 2004 and Assistant Secretary of the Funds since 2002. Founders’ Vice President - Compliance since 2002. Formerly, Founders’ Manager of Compliance (2000 to 2002) and Securities Compliance Examiner, Staff Accountant and Team Leader for the U.S. Securities and Exchange Commission (1990 to 2000).
David T. Buhler, 36. Assistant Secretary since 2007. Founders’ Associate General Counsel and Assistant Secretary since 2006. Formerly, Counsel for Great-West Life & Annuity Insurance Company (1997-2006), and Chief Compliance Officer for Greenwood Investments, LLC (2002 - 2006).
Robert S. Robol, 43. Assistant Treasurer since 2006. Senior Accounting Manager -Taxable Fixed Income Funds of Dreyfus, and an officer of 79 investment companies (comprised of 180 portfolios) managed by Dreyfus. Employed by Dreyfus since 1988.
Robert Salviolo, 40. Assistant Treasurer since 2007. Senior Accounting Manager -Foreign Equity Funds of Dreyfus, and an officer of 79 investment companies (comprised of 180 portfolios) managed by Dreyfus. Employed by Dreyfus since 1989.
Robert Svagna, 40. Assistant Treasurer since 2006. Senior Accounting Manager -Equity Funds of Dreyfus, and an officer of 79 investment companies (comprised of 180 portfolios) managed by Dreyfus. Employed by Dreyfus since 1990.
William G. Germenis, 37. Anti-Money Laundering Compliance Officer (“AMLCO”) for the Class A, Class B, Class C, Class I, and Class T shares of the Funds since 2002 and for the Class F shares of the Funds since 2003.Vice President and AMLCO of the Distributor and AMLCO of 75 investment companies (comprised of 176 portfolios) managed by Dreyfus. Employed by the Distributor since 1998.
The directors and officers may be contacted at Founders’ address appearing on the back cover, except for Messrs. Officer, Robol, Salviolo, Svagna and Germenis, who can be contacted at The Dreyfus Corporation, 200 Park Avenue, New York, New York 10166, and Mr.Anderson and Ms. Kneeland, who can be contacted at BNY Mellon Asset Management, One Boston Place, Boston, Massachusetts 02108.Additional information about the Company’s directors is available in the Statement of Additional Information, which can be obtained free of charge by calling 1-800-525-2440 (Class F shareholders) or 1-800-554-4611 (all other shareholders).
The Fund 59
NOTES

| Dreyfus Founders |
| Discovery Fund |
ANNUAL REPORT December 31, 2007

Save time. Save paper. View your next shareholder report online as soon as it’s available. Log into www.dreyfus.com and sign up for Dreyfus eCommunications. It’s simple and only takes a few minutes.
The views expressed in this report reflect those of the portfolio manager only through the end of the period covered and do not necessarily represent the views of Founders or any other person in the Founders organization.Any such views are subject to change at any time based upon market or other conditions and Founders disclaims any responsibility to update such views.These views may not be relied on as investment advice and, because investment decisions for a Dreyfus Founders Fund are based on numerous factors, may not be relied on as an indication of trading intent on behalf of any Dreyfus Founders Fund.
Not FDIC-Insured • Not Bank-Guaranteed • May Lose Value
| Contents |
| |
| | | THE FUND |
| |
|
| 2 | | A Letter from the Chairman |
| 3 | | Discussion of Fund Performance |
| 6 | | Fund Performance |
| 8 | | Understanding Your Fund’s Expenses |
| 8 | | Comparing Your Fund’s Expenses |
| | | With Those of Other Funds |
| 9 | | Statement of Investments |
| 16 | | Statement of Assets and Liabilities |
| 17 | | Statement of Operations |
| 18 | | Statement of Changes in Net Assets |
| 20 | | Financial Highlights |
| 26 | | Notes to Financial Statements |
| 37 | | Report of Independent Registered |
| | | Public Accounting Firm |
| 38 | | Factors Considered in Renewing |
| | | the Advisory Agreement |
| 46 | | Your Board Representatives |
| |
| FOR MORE INFORMATION |
|
| | | Back Cover |
| Dreyfus Founders |
| Discovery Fund |

A LETTER FROM THE CHAIRMAN
Dear Shareholder:
We are pleased to present this annual report for Dreyfus Founders Discovery Fund, covering the 12-month period from January 1, 2007, through December 31, 2007.
Looking back, 2007 was a year of significant change for the stock market.Turmoil in the sub-prime mortgage market, declining housing values and soaring energy prices sparked a “flight to quality” in which investors reassessed their attitudes toward risk. As a result, smaller, more speculative companies that had led the stock market over the past several years lost value over the second half of the year, while shares of larger, multinational growth companies returned to favor. Many financial services and consumer discretionary companies were hurt by repercussions from the sub-prime lending crisis and economic downturn, but energy and basic materials producers generally moved higher along with underlying commodity prices.
The turbulence of 2007 reinforced a central principle of successful investing: diversification. Investors with broad exposure to the world’s stock and bond markets were better protected from the full impact of market volatility in areas that, earlier in the year, were among the bright spots at the time. As we look ahead, we believe that now is the perfect time to meet with your financial advisor, who can help you plan and diversify your investment portfolio in a way that manages the potential opportunities and risks that may continue to arise in 2008.
For information about how the fund performed during the reporting period, as well as market perspectives, we have provided a Discussion of Fund Performance given by the fund’s Portfolio Manager.
Thank you for your continued confidence and support.
2

DISCUSSION OF FUND PERFORMANCE
For the period of January 1, 2007, through December 31, 2007, as provided by B. Randall Watts, Jr., Portfolio Manager
Fund and Market Performance Overview
While small-cap stocks fared relatively well over the first half of 2007, they generally lost value over the second half as the U.S. economy slowed and a credit crisis spread from sub-prime mortgages to other areas of the financial markets.The fund produced higher returns than its benchmark, primarily due to the success of our stock selection strategy in the industrials, health care, energy and financials sectors.
For the 12-month period ended December 31, 2007, Dreyfus Founders Discovery Fund produced total returns of 9.01% for its Class A shares, 8.38% for its Class B shares, 8.41% for its Class C shares, 9.69% for its Class F shares, 9.68% for its Class I shares and 8.70% for its Class T shares.1 In comparison, the Russell 2000 Growth Index, the fund’s benchmark, produced a total return of 7.05% for the reporting period.2
The Fund’s Investment Approach
The fund invests primarily in small U.S.-based companies that we believe possess high-growth potential.The fund may also invest in larger companies if, in our opinion, they represent better prospects for capital appreciation. Our strategy combines market economics with fundamental research.We assess current economic conditions and examine each sector of the Russell 2000 Growth Index to determine its market-capitalized weighting and estimate its relative performance.We generally give greater relative weight to sectors that we expect to outperform the overall market. Within each sector, we look for companies with solid market positions, visionary leadership and reasonable financial strength. We typically will sell a stock when we find a more attractive alternative, determine that its valuation is excessive, become aware of deteriorating fundamentals or change our assessment of its sector’s valuation.
Small-Cap Stocks Retreated as the Economy Slowed
Small-cap stocks posted positive absolute returns during 2007 despite growing worries regarding the effects on the U.S. economy of deteriorating housing and mortgage markets, a credit crunch, higher gasoline prices and slumping consumer spending. Because small-cap companies typically are more economically sensitive than their large-cap counterparts, these concerns weighed more heavily on
The Fund 3
DISCUSSION OF FUND PERFORMANCE (continued)
the small-cap market than other capitalization ranges over the second half of the year. In addition, many of the broader stock market’s gains in 2007 were achieved by companies with sizeable overseas operations, which most U.S.-based, small-cap companies do not have.
Several Sectors Supported Relative Performance
Our sector allocation and security selection strategies worked relatively well in most sectors in this challenging environment. A number of industrial stocks were among the top contributors to the fund’s performance, including construction and engineering firm Washington Group International, which was acquired at a healthy premium to its stock price. Utilities services provider Quanta Services reported strong earnings growth. Commercial services and supplies company Copart gained value as rising commodity prices spurred demand for the materials it recycles. Richie Brothers Auctioneers advanced after an encouraging earnings outlook.
Among health care companies, the fund scored successes with medical device developer Respironics, which achieved strong sales of its sleep apnea product and was acquired by a larger company. Also acquired in 2007 were diagnostic equipment maker Cytyc, which became part of Hologic;VIASYS Healthcare, which was absorbed by Cardinal Health; and Bruker BioSpin Group, which completed an accretive acquisition. Drug development services company Covance and medical equipment supplier Thermo Fisher Scientific both rallied after reporting strong earnings and improved outlooks.
The energy sector generally benefited from rising crude oil prices, but the fund’s holdings of equipment-and-services providers and exploration-and-production companies fared especially well.Winners included T-3 Energy Services, Global Industries,W-H Energy Services and Dril-Quip. The fund sold T-3 Energy Services and Global Industries during the reporting period.The fund also received strong contributions from coal producer Foundation Coal Holdings, which was sold during the period, and natural gas producers Penn Virginia Resource Partners and Berry Petroleum.
Although the financials area was hard hit during the credit crisis, the fund produced relatively good results in the sector by avoiding real estate investment trusts and focusing on less economically-sensitive companies, such as investment firm Waddell & Reed Financial, broker optionsXpress Holdings, electronic options market International Securities Exchange and debt collector Portfolio Recovery Associates. The fund sold International Securities Exchange and Portfolio Recovery Associates during the reporting period.
4
Detractors from relative performance during 2007 included consumer-oriented companies that were hurt by economic and company-specific woes. U.S. Auto Parts Network, which was sold during the reporting period, stumbled when integrating a recent acquisition, workplace childcare provider Bright Horizons Family Solutions fell short of revenue growth expectations, spa operator Steiner Leisure reported disappointing earnings and apparel retailers Kenneth Cole Productions and Iconix Brand Group struggled with slower consumer spending. Kenneth Cole Productions and Iconix Brand Group were sold by the fund during the reporting period. Some information technology companies also posted earnings shortfalls, including casino cash machine access supplier Global Cash Access Holdings, which was sold during the period, telecommunications clearinghouse Neustar and computer components maker SMART Modular Technologies.
Positioning the Fund for a Slower Economy
Additional signs of economic weakness have continued to produce volatile market conditions.Therefore, we have intensified our focus on identifying small-cap companies with sound business fundamentals that we believe can weather an economic downturn.We have found a number of opportunities meeting our criteria in the information technology area, but fewer in the financials and industrials areas.
January 15, 2008
| | | Small companies carry additional risks because their earnings and revenues tend to be less |
| | | predictable, and their share prices more volatile than those of larger, more established |
| | | companies. The shares of smaller companies tend to trade less frequently than those of |
| | | larger, more established companies. |
| | | Part of the fund’s recent performance is attributable to positive returns from its initial public |
| | | offering (IPO) investments. There can be no guarantee that IPOs will have or continue to |
| | | have a positive effect on fund performance. |
| | | Part of the fund’s historical performance is due to amounts received from class action |
| | | settlements regarding prior fund holdings. There is no guarantee that these settlement |
| | | distributions will occur in the future or have a similar impact on performance. |
| 1 | | Total return includes reinvestment of dividends and any capital gains paid, and does not take into |
| | | consideration the maximum initial sales charges in the case of Class A and Class T shares, or the |
| | | applicable contingent deferred sales charges imposed on redemptions in the case of Class B and |
| | | Class C shares. Had these charges been reflected, returns would have been lower. Past performance |
| | | is no guarantee of future results. Share price and investment return fluctuate such that upon |
| | | redemption, fund shares may be worth more or less than their original cost. |
| 2 | | SOURCE: LIPPER INC. –The Russell 2000 Growth Index is an unmanaged index, which |
| | | measures the performance of those Russell 2000 companies with higher price-to-book ratios and |
| | | higher forecasted growth values.The total return figure cited for this index assumes change in security |
| | | prices and reinvestment of dividends, but does not reflect the costs of managing a mutual fund. |
The Fund 5
FUND PERFORMANCE
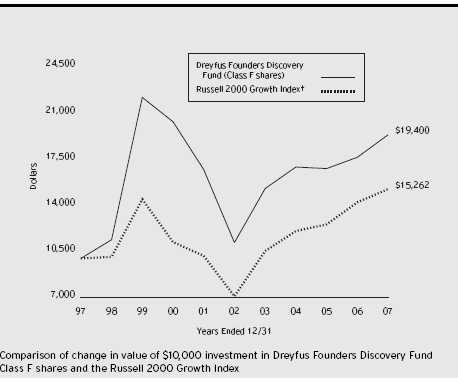
| † Source: Lipper Inc. |
| Past performance is not predictive of future performance. |
| Part of the fund’s recent performance is attributable to positive returns from its initial public offering (IPO) investments. |
| There can be no guarantee that IPOs will have or continue to have a positive effect on fund performance. |
| The above graph compares a $10,000 investment made in Class F shares of Dreyfus Founders Discovery Fund on |
| 12/31/97 to a $10,000 investment made in the Russell 2000 Growth Index (the “Index”) on that date. All |
| dividends and capital gain distributions are reinvested. Performance for Class A, Class B, Class C, Class I and Class T |
| shares will vary from the performance of Class F shares shown above due to differences in charges and expenses. |
| The fund’s performance shown in the line graph takes into account all applicable Class F fees and expenses (after any |
| expense reimbursements).The Index is an unmanaged index, which measures the performance of those Russell 2000 |
| companies with higher price-to-book ratios and higher forecasted growth values. Unlike a mutual fund, the Index is not |
| subject to charges, fees and other expenses. Investors cannot invest directly in any index. Further information relating to |
| fund performance, including expense reimbursements, if applicable, is contained in the Financial Highlights section of the |
| prospectus and elsewhere in this report. |
6
| Average Annual Total Returns as of 12/31/07 | | | | | | |
| |
| | | Inception | | | | | | | | From |
| | | Date | | 1 Year | | 5 Years | | 10 Years | | Inception |
| |
| |
| |
| |
| |
|
| Class A shares | | | | | | | | | | |
| with maximum sales charge (5.75%) | | 12/31/99 | | 2.73% | | 10.13% | | — | | (2.47)% |
| without sales charge | | 12/31/99 | | 9.01% | | 11.43% | | — | | (1.74)% |
| Class B shares | | | | | | | | | | |
| with applicable redemption charge † | | 12/31/99 | | 4.38% | | 10.05% | | — | | (2.41)%†† |
| without redemption | | 12/31/99 | | 8.38% | | 10.32% | | — | | (2.41)%†† |
| Class C shares | | | | | | | | | | |
| with applicable redemption charge ††† | | 12/31/99 | | 7.41% | | 10.51% | | — | | (2.56)% |
| without redemption | | 12/31/99 | | 8.41% | | 10.51% | | — | | (2.56)% |
| Class F shares | | 12/29/89 | | 9.69% | | 11.59% | | 6.85% | | N/A |
| Class I shares | | 12/31/99 | | 9.68% | | 11.83% | | — | | (1.43)% |
| Class T shares | | | | | | | | | | |
| with applicable sales charge (4.5%) | | 12/31/99 | | 3.79% | | 10.04% | | — | | (2.70)% |
| without sales charge | | 12/31/99 | | 8.70% | | 11.06% | | — | | (2.14)% |
Past performance is not predictive of future performance.The fund’s performance shown in the graph and table does not reflect the deduction of taxes that a shareholder would pay on fund distributions or the redemption of fund shares. Part of the fund’s performance is due to amounts received from class action settlements regarding prior fund holdings.There is no guarantee that these settlement distributions will occur in the future or have a similar impact on performance.
| † | | The maximum contingent deferred sales charge for Class B shares is 4%. After six years Class B shares convert to |
| | | Class A shares. |
| †† | | Assumes the conversion of Class B shares to Class A shares at the end of the sixth year following the date of |
| | | purchase. |
| ††† | | The maximum contingent deferred sales charge for Class C shares is 1% for shares redeemed within one year of the |
| | | date of purchase. |
The Fund 7
UNDERSTANDING YOUR FUND’S EXPENSES (Unaudited)
As a mutual fund investor, you pay ongoing expenses, such as management fees and other expenses. Using the information below, you can estimate how these expenses affect your investment and compare them with the expenses of other funds.You also may pay one-time transaction expenses, including sales charges (loads) and redemption fees, which are not shown in this section and would have resulted in higher total expenses. For more information, see your fund's prospectus or talk to your financial advisor.
Review your fund’s expenses
The table below shows the expenses you would have paid on a $1,000 investment in Dreyfus Founders Discovery Fund from July 1, 2007 to December 31, 2007. It also shows how much a $1,000 investment would be worth at the close of the period, assuming actual returns and expenses.To estimate the expenses you paid on your account over this period, simply divide your account value by $1,000 (for example, an $8,600 account value divided by $1,000 = 8.60), then multiply the results by the number in the Expenses paid per $1,000 line for the class of shares you own.
Expenses and Value of a $1,000 Investment
assuming actual returns for the six months ended December 31, 2007
|
| | | Class A | | Class B | | Class C | | Class F | | Class I | | Class T |
| |
| |
| |
| |
| |
| |
|
| Expenses paid | | | | | | | | | | | | |
| per $1,000 † | | $ 9.33 | | $ 15.28 | | $ 13.13 | | $ 7.52 | | $ 7.72 | | $ 11.48 |
| Ending value | | | | | | | | | | | | |
| (after expenses) | | $1,000.30 | | $993.80 | | $996.10 | | $1,002.10 | | $1,001.80 | | $997.80 |
| | COMPARING YOUR FUND’S EXPENSES
WITH THOSE OF OTHER FUNDS (Unaudited)
|
Using the SEC’s method to compare expenses
The Securities and Exchange Commission (SEC) has established guidelines to help investors assess fund expenses. Per these guidelines, the table below shows your fund’s expenses based on a $1,000 investment, assuming a hypothetical 5% annualized return. You can use this information to compare the ongoing expenses (but not transaction expenses or total cost) of investing in the fund with those of other funds.All mutual fund shareholder reports will provide this information to help you make this comparison. Please note that you cannot use this information to estimate your actual ending account balance and expenses paid during the period.
| | Expenses and Value of a $1,000 Investment
assuming a hypothetical 5% annualized return for the six months ended December 31, 2007
|
| | | Class A | | Class B | | Class C | | Class F | | Class I | | Class T |
| |
| |
| |
| |
| |
| |
|
| Expenses paid | | | | | | | | | | | | |
| per $1,000 † | | $ 9.40 | | $ 15.40 | | $ 13.24 | | $ 7.58 | | $ 7.78 | | $11.57 |
| Ending value | | | | | | | | | | | | |
| (after expenses) | | $1,015.88 | | $1,009.88 | | $1,012.05 | | $1,017.69 | | $1,017.49 | | $1,013.71 |
| † Expenses are equal to the fund’s non annualized expense ratio of 1.85% for Class A shares, 3.04% for Class B |
| shares, 2.61% for Class C shares, 1.49% for Class F shares, 1.53% for Class I shares and 2.28% for Class T shares; |
| multiplied by the average account value over the period, multiplied by 184/365 (to reflect the one-half year period). |
8
STATEMENT OF INVESTMENTS
December 31, 2007
|
| Common Stocks—99.0% | | Shares | | | | Value ($) |
| |
| |
| |
|
| Aerospace & Defense—2.8% | | | | | | |
| AAR | | 70,310 a | | | | 2,673,889 |
| ManTech International, Cl. A | | 64,460 a | | | | 2,824,637 |
| Stanley | | 28,490 a | | | | 912,250 |
| | | | | | | 6,410,776 |
| Aluminum—.5% | | | | | | |
| Century Aluminum | | 22,970 a | | | | 1,239,002 |
| Apparel Retail—1.8% | | | | | | |
| JoS. A. Bank Clothiers | | 60,680 a | | | | 1,726,346 |
| Pacific Sunwear of California | | 175,280 a | | | | 2,473,201 |
| | | | | | | 4,199,547 |
| Apparel, Accessories & Luxury Goods—.7% | | | | |
| True Religion Apparel | | 73,330 a | | | | 1,565,595 |
| Application Software—2.4% | | | | | | |
| Informatica | | 97,350 a | | | | 1,754,247 |
| InterVoice | | 110,670 a | | | | 884,253 |
| Jack Henry & Associates | | 48,860 | | | | 1,189,252 |
| QAD | | 89,012 | | | | 831,372 |
| Ultimate Software Group | | 23,990 a | | | | 754,965 |
| | | | | | | 5,414,089 |
| Asset Management & Custody Banks—1.3% | | | | |
| Waddell & Reed Financial, Cl. A | | 79,310 | | | | 2,862,298 |
| Biotechnology—3.4% | | | | | | |
| Applera—Celera Genomics Group | | 77,830 a | | | | 1,235,162 |
| Array BioPharma | | 109,020 a | | | | 917,948 |
| Enzon Pharmaceuticals | | 125,680 a | | | | 1,197,730 |
| Indevus Pharmaceuticals | | 106,950 a | | | | 743,302 |
| Isis Pharmaceuticals | | 70,770 a | | | | 1,114,627 |
| Regeneron Pharmaceuticals | | 67,900 a | | | | 1,639,785 |
| Sangamo BioSciences | | 78,121 a | | | | 1,022,604 |
| | | | | | | 7,871,158 |
| Building Products—1.3% | | | | | | |
| Interface, Cl. A | | 175,810 | | | | 2,869,219 |
| Casinos & Gaming—.9% | | | | | | |
| WMS Industries | | 58,500 a | | | | 2,143,440 |
The Fund 9
STATEMENT OF INVESTMENTS (continued)
| Common Stocks (continued) | | Shares | | Value ($) |
| |
| |
|
| Communications Equipment—2.0% | | | | |
| InterDigital | | 45,830 a | | 1,069,214 |
| NETGEAR | | 97,120 a | | 3,464,270 |
| | | | | 4,533,484 |
| Construction & Engineering—2.2% | | | | |
| Quanta Services | | 96,980 a | | 2,544,755 |
| URS | | 47,458 a | | 2,578,393 |
| | | | | 5,123,148 |
| Construction & Farm Machinery & Heavy Trucks—.8% | | |
| Bucyrus International, Cl. A | | 17,497 | | 1,739,027 |
| Consumer Finance—.3% | | | | |
| Cardtronics | | 67,080 a | | 678,179 |
| Data Processing & Outsourced Services—4.6% | | |
| Broadridge Financial Solutions | | 115,110 | | 2,581,917 |
| Euronet Worldwide | | 77,730 a | | 2,331,900 |
| NeuStar, Cl. A | | 129,350 a | | 3,709,758 |
| Wright Express | | 52,560 a | | 1,865,354 |
| | | | | 10,488,929 |
| Diversified Chemicals—.1% | | | | |
| LSB Industries | | 6,110 a | | 172,424 |
| Diversified Commercial & Professional Services—2.9% | | |
| Bright Horizons Family Solutions | | 39,090 a | | 1,350,169 |
| Copart | | 58,170 a | | 2,475,133 |
| McGrath Rentcorp | | 78,410 | | 2,019,058 |
| Ritchie Brothers Auctioneers | | 9,620 | | 795,574 |
| | | | | 6,639,934 |
| Drug Retail—1.0% | | | | |
| Longs Drug Stores | | 48,080 | | 2,259,760 |
| Educational Services—2.0% | | | | |
| Corinthian Colleges | | 161,140 a | | 2,481,556 |
| DeVry | | 39,950 | | 2,075,802 |
| | | | | 4,557,358 |
| Electronic Equipment Manufacturers—1.5% | | |
| FLIR Systems | | 60,810 a | | 1,903,353 |
| Technitrol | | 50,260 | | 1,436,431 |
| | | | | 3,339,784 |
10
| Common Stocks (continued) | | Shares | | Value ($) |
| |
| |
|
| Electronic Manufacturing Services—.5% | | |
| TTM Technologies | | 104,050 a | | 1,213,223 |
| Fertilizers & Agricultural Chemicals—.6% | | |
| American Vanguard | | 77,470 | | 1,344,105 |
| Food Distributors—.9% | | | | |
| United Natural Foods | | 67,100 a | | 2,128,412 |
| Food Retail—.8% | | | | |
| Ruddick | | 51,800 | | 1,795,906 |
| Gold—.7% | | | | |
| Royal Gold | | 54,160 | | 1,652,963 |
| Health Care Equipment—10.8% | | | | |
| Dexcom | | 36,850 a | | 325,386 |
| Hansen Medical | | 31,520 a | | 943,709 |
| Hologic | | 40,562 a | | 2,784,176 |
| Integra LifeSciences Holdings | | 44,550 a | | 1,867,981 |
| Natus Medical | | 200,640 a | | 3,882,384 |
| NuVasive | | 25,220 a | | 996,694 |
| NxStage Medical | | 70,980 a | | 1,076,767 |
| PerkinElmer | | 108,170 | | 2,814,583 |
| Respironics | | 77,950 a | | 5,104,166 |
| Thoratec | | 67,890 a | | 1,234,919 |
| Wright Medical Group | | 136,440 a | | 3,979,955 |
| | | | | 25,010,720 |
| Health Care Facilities—3.0% | | | | |
| Psychiatric Solutions | | 99,320 a | | 3,227,900 |
| VCA Antech | | 79,990 a | | 3,537,958 |
| | | | | 6,765,858 |
| Health Care Services—2.9% | | | | |
| Amedisys | | 52,950 a | | 2,569,133 |
| Pediatrix Medical Group | | 59,770 a | | 4,073,326 |
| | | | | 6,642,459 |
| Health Care Technology—.8% | | | | |
| Phase Forward | | 87,910 a | | 1,912,043 |
| Home Entertainment Software—1.1% | | |
| THQ | | 86,580 a | | 2,440,690 |
The Fund 11
STATEMENT OF INVESTMENTS (continued)
| Common Stocks (continued) | | Shares | | Value ($) |
| |
| |
|
| Industrial Machinery—1.4% | | | | |
| Actuant, Cl. A | | 60,850 | | 2,069,509 |
| Hurco | | 26,420 a | | 1,153,233 |
| | | | | 3,222,742 |
| Internet Retail—.4% | | | | |
| Systemax | | 45,290 | | 920,293 |
| Internet Software & Services—2.6% | | | | |
| DivX | | 37,360 a | | 523,040 |
| SkillSoft, ADR | | 198,910 a | | 1,901,580 |
| TIBCO Software | | 134,170 a | | 1,082,752 |
| ValueClick | | 111,850 a | | 2,449,515 |
| | | | | 5,956,887 |
| Investment Banking & | | | | |
| Brokerage—1.2% | | | | |
| optionsXpress Holdings | | 78,000 | | 2,637,960 |
| IT Consulting & Other Services—3.8% | | | | |
| CACI International, Cl. A | | 44,910 a | | 2,010,621 |
| Forrester Research | | 59,040 a | | 1,654,301 |
| Investment Technology Group | | 80,980 a | | 3,853,838 |
| Virtusa | | 70,960 a | | 1,229,737 |
| | | | | 8,748,497 |
| Leisure Products—1.9% | | | | |
| Polaris Industries | | 50,840 | | 2,428,627 |
| Steiner Leisure | | 45,600 a | | 2,013,696 |
| | | | | 4,442,323 |
| Life Sciences Tools & Services—3.4% | | | | |
| Bruker BioSciences | | 217,380 a | | 2,891,154 |
| Exelixis | | 145,220 a | | 1,253,249 |
| Thermo Fisher Scientific | | 62,670 a | | 3,614,806 |
| | | | | 7,759,209 |
| Movies & Entertainment—1.5% | | | | |
| Lions Gate Entertainment | | 295,260 a | | 2,781,349 |
| Playboy Enterprises, Cl. B | | 79,880 a | | 728,506 |
| | | | | 3,509,855 |
| Multi-Line Insurance—.6% | | | | |
| Arch Capital Group | | 18,220 a | | 1,281,777 |
12
| Common Stocks (continued) | | Shares | | Value ($) |
| |
| |
|
| Oil & Gas Equipment & Services—2.2% | | |
| Dril-Quip | | 53,170 a | | 2,959,442 |
| W-H Energy Services | | 35,230 a | | 1,980,278 |
| | | | | 4,939,720 |
| Oil & Gas Exploration & Production—4.8% | | |
| Berry Petroleum, Cl. A | | 55,460 | | 2,465,197 |
| Comstock Resources | | 75,100 a | | 2,553,400 |
| GMX Resources | | 25,540 a | | 824,431 |
| Penn Virginia | | 73,750 | | 3,217,712 |
| St. Mary Land & Exploration | | 47,290 | | 1,825,867 |
| | | | | 10,886,607 |
| Oil & Gas Storage & Transportation—.8% | | |
| Overseas Shipholding Group | | 23,950 | | 1,782,599 |
| Packaged Foods & Meats—.9% | | | | |
| Diamond Foods | | 38,210 | | 818,840 |
| Hain Celestial Group | | 39,020 a | | 1,248,640 |
| | | | | 2,067,480 |
| Personal Products—2.9% | | | | |
| Alberto-Culver | | 108,290 | | 2,657,437 |
| Bare Escentuals | | 94,980 a | | 2,303,265 |
| Inter Parfums | | 6,520 | | 117,164 |
| NU Skin Enterprises, Cl. A | | 96,780 | | 1,590,095 |
| | | | | 6,667,961 |
| Pharmaceuticals—1.9% | | | | |
| Biodel | | 11,400 a | | 264,822 |
| Covance | | 34,860 a | | 3,019,573 |
| Sirtris Pharmaceuticals | | 76,540 a | | 1,047,833 |
| | | | | 4,332,228 |
| Precious Metals & Minerals—.7% | | | | |
| Minefinders | | 13,370 a | | 151,081 |
| Silver Wheaton | | 84,270 a | | 1,430,062 |
| | | | | 1,581,143 |
| Property & Casualty Insurance—1.5% | | |
| First Mercury Financial | | 58,310 a | | 1,422,764 |
| RLI | | 35,000 | | 1,987,650 |
| | | | | 3,410,414 |
The Fund 13
STATEMENT OF INVESTMENTS (continued)
| Common Stocks (continued) | | Shares | | | | Value ($) |
| |
| |
| |
|
| Regional Banks—.3% | | | | | | |
| Signature Bank | | 21,840 a | | | | 737,100 |
| Reinsurance—.3% | | | | | | |
| Max Capital Group | | 27,980 | | | | 783,160 |
| Restaurants—1.7% | | | | | | |
| Panera Bread, Cl. A | | 39,140 a | | | | 1,401,995 |
| Red Robin Gourmet Burgers | | 75,330 a | | | | 2,409,807 |
| | | | | | | 3,811,802 |
| Semiconductor Equipment—1.2% | | | | | | |
| Cymer | | 45,960 a | | | | 1,789,223 |
| Eagle Test Systems | | 79,980 a | | | | 1,022,144 |
| | | | | | | 2,811,367 |
| Semiconductors—4.7% | | | | | | |
| Diodes | | 43,185 a | | | | 1,298,573 |
| Micrel | | 211,270 | | | | 1,785,232 |
| Microsemi | | 54,080 a | | | | 1,197,331 |
| O2Micro International, ADR | | 64,910 a | | | | 749,061 |
| RF Micro Devices | | 316,170 a | | | | 1,805,331 |
| Standard Microsystems | | 50,100 a | | | | 1,957,407 |
| Tessera Technologies | | 49,620 a | | | | 2,064,192 |
| | | | | | | 10,857,127 |
| Soft Drinks—.5% | | | | | | |
| Hansen Natural | | 26,550 a | | | | 1,175,900 |
| Specialty Chemicals—.8% | | | | | | |
| H.B. Fuller | | 77,370 | | | | 1,736,957 |
| Steel—.5% | | | | | | |
| Haynes International | | 14,930 a | | | | 1,037,635 |
| Technology Distributors—1.1% | | | | | | |
| Tech Data | | 64,820 a | | | | 2,445,010 |
| Trading Companies & Distributors—.8% | | | | |
| MSC Industrial Direct, Cl. A | | 46,870 | | | | 1,896,829 |
| Total Common Stocks | | | | | | |
| (cost $212,518,674) | | | | | | 226,454,112 |
14
| Other Investment—1.3% | | Shares | | Value ($) |
| |
| |
|
| Registered Investment Company; | | | | |
| Dreyfus Institutional Preferred | | | | |
| Plus Money Market Fund | | | | |
| (cost $2,977,000) | | 2,977,000 b | | 2,977,000 |
| |
| |
|
| Total Investments (cost $215,495,674) | | 100.3% | | 229,431,112 |
| Liabilities, Less Cash and Receivables | | (.3%) | | (629,930) |
| Net Assets | | 100.0% | | 228,801,182 |
| ADR—American Depository Receipts |
| a | | Non-income producing security. |
| b | | Investment in affiliated money market mutual fund. |
| Portfolio Summary (Unaudited) † | | | | |
| |
| | | Value (%) | | | | Value (%) |
| |
| |
| |
|
| Health Care | | 26.4 | | Consumer Staples | | 7.0 |
| Information Technology | | 25.5 | | Financials | | 5.4 |
| Industrials | | 12.2 | | Materials | | 3.8 |
| Consumer Discretionary | | 11.0 | | Money Market Investments | | 1.3 |
| Energy | | 7.7 | | | | 100.3 |
| † Based on net assets. |
| See notes to financial statements. |
The Fund 15
| | STATEMENT OF ASSETS AND LIABILITIES
December 31, 2007
|
| | | Cost | | Value |
| |
| |
|
| Assets ($): | | | | |
| Investments in securities—See Statement of Investments: | | |
| Unaffiliated issuers | | 212,518,674 | | 226,454,112 |
| Affiliated issuers | | 2,977,000 | | 2,977,000 |
| Cash | | | | 310,794 |
| Receivable for investment securities sold | | 12,682,706 |
| Dividends and interest receivable | | | | 76,796 |
| Receivable for shares of Common Stock subscribed | | 16,272 |
| Prepaid expenses | | | | 61,024 |
| Other assets | | | | 90,118 |
| | | | | 242,668,822 |
| |
| |
|
| Liabilities ($): | | | | |
| Due to Founders Asset Management LLC and affiliates—Note 3(c) | | 413,148 |
| Payable for shares of Common Stock redeemed | | 2,037,789 |
| Payable for investment securities purchased | | 11,083,851 |
| Interest payable—Note 2 | | | | 37 |
| Directors’ deferred compensation | | | | 90,118 |
| Accrued expenses | | | | 242,697 |
| | | | | 13,867,640 |
| |
| |
|
| Net Assets ($) | | | | 228,801,182 |
| |
| |
|
| Composition of Net Assets ($): | | | | |
| Paid-in capital | | | | 448,528,468 |
| Accumulated investment (loss)—net | | | | (179,066) |
| Accumulated net realized gain (loss) on investments | | (233,491,619) |
| Accumulated net unrealized appreciation | | |
| (depreciation) on investments | | | | 13,943,399 |
| |
| |
|
| Net Assets ($) | | | | 228,801,182 |
| Net Asset Value Per Share | | | | | | | | | | |
| | | Class A | | Class B | | Class C | | Class F | | Class I | | Class T |
| |
| |
| |
| |
| |
| |
|
| Net Assets ($) | | 11,024,374 | | 776,956 | | 2,301,840 | | 195,509,595 | | 19,086,481 | | 101,936 |
| Shares Outstanding | | 336,125 | | 25,555 | | 75,049 | | 5,935,425 | | 567,338 | | 3,211 |
| |
| |
| |
| |
| |
| |
|
| Net Asset Value | | | | | | | | | | | | |
| Per Share ($) | | 32.80 | | 30.40 | | 30.67 | | 32.94 | | 33.64 | | 31.75 |
See notes to financial statements.
16
STATEMENT OF OPERATIONS
Year Ended December 31, 2007
|
| Investment Income ($): | | |
| Income: | | |
| Dividends (net of $3,825 foreign taxes withheld at source): | | |
| Unaffiliated issuers | | 927,660 |
| Affiliated issuers | | 281,639 |
| Total Income | | 1,209,299 |
| Expenses: | | |
| Investment advisory fee—Note 3(a) | | 2,551,412 |
| Shareholder servicing costs—Note 3(c) | | 670,315 |
| Distribution fees—Note 3(b) | | 301,185 |
| Accounting fees—3(c) | | 152,182 |
| Professional fees | | 128,950 |
| Directors’ fees and expenses—Note 3(d) | | 59,749 |
| Registration fees | | 33,653 |
| Prospectus and shareholders’ reports | | 32,102 |
| Custodian fees—Note 3(c) | | 16,319 |
| Interest expense—Note 2 | | 5,157 |
| Loan commitment fees—Note 2 | | 2,624 |
| Miscellaneous | | 14,143 |
| Total Expenses | | 3,967,791 |
| Less—reduction in custody fees due to earnings credits—Note 1(c) | | (11,060) |
| Less—reduction in accounting fees—Note 3(c) | | (9,767) |
| Less—expense offset to broker commission—Note 1 | | (7,399) |
| Net Expenses | | 3,939,565 |
| Investment (Loss)—Net | | (2,730,266) |
| |
|
| Realized and Unrealized Gain (Loss) on Investments—Note 4 ($): |
| Net realized gain (loss) on investments | | 39,744,942 |
| Net in unrealized appreciation (depreciation) on investments | | (12,738,584) |
| Net Realized and Unrealized Gain (Loss) on Investments | | 27,006,358 |
| Net Increase in Net Assets Resulting from Operations | | 24,276,092 |
See notes to financial statements.
The Fund 17
STATEMENT OF CHANGES IN NET ASSETS
| | | Year Ended December 31, |
| |
|
| | | 2007 a | | 2006 |
| |
| |
|
| Operations ($): | | | | |
| Investment (loss)—net | | (2,730,266) | | (4,260,407) |
| Net realized gain (loss) on investments | | 39,744,942 | | 11,932,242 |
| Net in unrealized appreciation | | | | |
| (depreciation) on investments | | (12,738,584) | | 8,602,976 |
| Net Increase (Decrease) in Net Assets | | | | |
| Resulting from Operations | | 24,276,092 | | 16,274,811 |
| |
| |
|
| Capital Stock Transactions ($): | | | | |
| Net proceeds from shares sold: | | | | |
| Class A shares | | 940,650 | | 31,753,979 |
| Class B shares | | 32,730 | | 69,786 |
| Class C shares | | 138,400 | | 578,469 |
| Class F shares | | 7,011,491 | | 19,688,048 |
| Class I shares | | 24,982,780 | | 7,013,386 |
| Class T shares | | 47,348 | | 33,471 |
| Cost of shares redeemed: | | | | |
| Class A shares | | (27,506,640) | | (41,576,885) |
| Class B shares | | (688,450) | | (13,014,588) |
| Class C shares | | (1,048,474) | | (2,147,554) |
| Class F shares | | (70,053,374) | | (147,807,521) |
| Class I shares | | (16,095,549) | | (6,869,929) |
| Class T shares | | (124,423) | | (1,142,702) |
| Increase (Decrease) in Net Assets | | | | |
| from Capital Stock Transactions | | (82,363,511) | | (153,422,040) |
| Total Increase (Decrease) in Net Assets | | (58,087,419) | | (137,147,229) |
| |
| |
|
| Net Assets ($): | | | | |
| Beginning of Period | | 286,888,601 | | 424,035,830 |
| End of Period | | 228,801,182 | | 286,888,601 |
| Accumulated investment (loss)—net | | (179,066) | | (158,079) |
See notes to financial statements.
18
| | | Year Ended December 31, |
| |
|
| | | 2007a | | 2006 |
| |
| |
|
| Capital Share Transactions: | | | | |
| Class A b | | | | |
| Shares sold | | 29,689 | | 1,033,819 |
| Shares redeemed | | (880,815) | | (1,421,803) |
| Net Increase (Decrease) in Shares Outstanding | | (851,126) | | (387,984) |
| |
| |
|
| Class B b | | | | |
| Shares sold | | 1,036 | | 2,416 |
| Shares redeemed | | (23,427) | | (469,720) |
| Net Increase (Decrease) in Shares Outstanding | | (22,391) | | (467,304) |
| |
| |
|
| Class C | | | | |
| Shares sold | | 4,882 | | 19,922 |
| Shares redeemed | | (35,209) | | (76,293) |
| Net Increase (Decrease) in Shares Outstanding | | (30,327) | | (56,371) |
| |
| |
|
| Class F | | | | |
| Shares sold | | 222,651 | | 662,494 |
| Shares redeemed | | (2,212,860) | | (5,022,156) |
| Net Increase (Decrease) in Shares Outstanding | | (1,990,209) | | (4,359,662) |
| |
| |
|
| Class I | | | | |
| Shares sold | | 779,085 | | 225,128 |
| Shares redeemed | | (494,171) | | (228,359) |
| Net Increase (Decrease) in Shares Outstanding | | 284,914 | | (3,231) |
| |
| |
|
| Class T | | | | |
| Shares sold | | 1,509 | | 1,121 |
| Shares redeemed | | (4,062) | | (37,890) |
| Net Increase (Decrease) in Shares Outstanding | | (2,553) | | (36,769) |
| a | | Effective June1, 2007, Class R shares were redisignated as Class I shares. |
| b | | During the period ended December 31, 2007, 14,074 Class B shares representing $413,834, were automatically |
| | | converted to 13,130 Class A shares and during the period ended December 31, 2006, 314,250 Class B shares |
| | | representing $8,696,579 were automatically converted to 296,178 Class A shares. |
| See notes to financial statements. |
The Fund 19
FINANCIAL HIGHLIGHTS
The following tables describe the performance for each share class for the fiscal periods indicated. All information (except portfolio turnover rate) reflects financial results for a single fund share.Total return shows how much your investment in the fund would have increased (or decreased) during each period, assuming you had reinvested all dividends and distributions.These figures have been derived from the fund’s financial statements.
| | | | | Year Ended December 31, | | |
| |
| |
| |
|
| Class A Shares | | 2007 | | 2006 | | 2005 | | 2004 | | 2003 |
| |
| |
| |
| |
| |
|
| Per Share Data ($): | | | | | | | | | | |
| Net asset value, beginning of period | | 30.09 | | 28.63 | | 28.82 | | 26.04 | | 19.09 |
| Investment Operations: | | | | | | | | | | |
| Investment (loss)—net | | (.50)a | | (.35)a | | (.28)a | | (.64) | | (.36) |
| Net realized and unrealized | | | | | | | | | | |
| gain (loss) on investments | | 3.21 | | 1.81 | | .09 | | 3.42 | | 7.31 |
| Total from Investment Operations | | 2.71 | | 1.46 | | (.19) | | 2.78 | | 6.95 |
| Net asset value, end of period | | 32.80 | | 30.09 | | 28.63 | | 28.82 | | 26.04 |
| |
| |
| |
| |
| |
|
| Total Return (%) b | | 9.01 | | 5.10 | | (.66) | | 10.68 | | 36.41 |
| |
| |
| |
| |
| |
|
| Ratios/Supplemental Data (%): | | | | | | | | | | |
| Ratio of total expenses | | | | | | | | | | |
| to average net assets | | 2.02 | | 1.51 | | 1.47 | | 1.38 | | 1.50 |
| Ratio of net expenses | | | | | | | | | | |
| to average net assets | | 2.01 | | 1.51 | | 1.45 | | 1.37 | | 1.50 |
| Ratio of net investment (loss) | | | | | | | | | | |
| to average net assets | | (1.58) | | (1.15) | | (1.09) | | (1.11) | | (1.25) |
| Portfolio Turnover Rate | | 215 | | 202 | | 160 | | 98 | | 130 |
| |
| |
| |
| |
| |
|
| Net Assets, end of period ($ x 1,000) | | 11,024 | | 35,719 | | 45,092 | | 65,763 | | 79,630 |
| a | | Based on average shares outstanding at each month end. |
| b | | Exclusive of sales charge. |
| See notes to financial statements. |
20
| | | | | Year Ended December 31, | | |
| |
| |
| |
|
| Class B Shares | | 2007 | | 2006 | | 2005 | | 2004 | | 2003 |
| |
| |
| |
| |
| |
|
| Per Share Data ($): | | | | | | | | | | |
| Net asset value, beginning of period | | 28.04 | | 27.10 | | 27.55 | | 25.12 | | 18.60 |
| Investment Operations: | | | | | | | | | | |
| Investment (loss)—net | | (.60)a | | (.61)a | | (.54)a | | (1.07) | | (.81) |
| Net realized and unrealized | | | | | | | | | | |
| gain (loss) on investments | | 2.96 | | 1.55 | | .09 | | 3.50 | | 7.33 |
| Total from Investment Operations | | 2.36 | | .94 | | (.45) | | 2.43 | | 6.52 |
| Net asset value, end of period | | 30.40 | | 28.04 | | 27.10 | | 27.55 | | 25.12 |
| |
| |
| |
| |
| |
|
| Total Return (%) b | | 8.38 | | 3.51 | | (1.63) | | 9.67 | | 35.05 |
| |
| |
| |
| |
| |
|
| Ratios/Supplemental Data (%): | | | | | | | | | | |
| Ratio of total expenses | | | | | | | | | | |
| to average net assets | | 2.55 | | 2.64 | | 2.44 | | 2.30 | | 2.56 |
| Ratio of net expenses | | | | | | | | | | |
| to average net assets | | 2.54 | | 2.64 | | 2.43 | | 2.29 | | 2.56 |
| Ratio of net investment (loss) | | | | | | | | | | |
| to average net assets | | (2.08) | | (2.28) | | (2.06) | | (2.03) | | (2.31) |
| Portfolio Turnover Rate | | 215 | | 202 | | 160 | | 98 | | 130 |
| |
| |
| |
| |
| |
|
| Net Assets, end of period ($ x 1,000) | | 777 | | 1,344 | | 13,964 | | 18,795 | | 21,009 |
| a | | Based on average shares outstanding at each month end. |
| b | | Exclusive of sales charge. |
| See notes to financial statements. |
The Fund 21
FINANCIAL HIGHLIGHTS (continued)
| | | | | Year Ended December 31, | | |
| |
| |
| |
|
| Class C Shares | | 2007 | | 2006 | | 2005 | | 2004 | | 2003 |
| |
| |
| |
| |
| |
|
| Per Share Data ($): | | | | | | | | | | |
| Net asset value, beginning of period | | 28.29 | | 27.14 | | 27.57 | | 25.14 | | 18.60 |
| Investment Operations: | | | | | | | | | | |
| Investment (loss)—net | | (.64)a | | (.56)a | | (.50)a | | (1.53) | | (.94) |
| Net realized and unrealized | | | | | | | | | | |
| gain (loss) on investments | | 3.02 | | 1.71 | | .07 | | 3.96 | | 7.48 |
| Total from Investment Operations | | 2.38 | | 1.15 | | (.43) | | 2.43 | | 6.54 |
| Net asset value, end of period | | 30.67 | | 28.29 | | 27.14 | | 27.57 | | 25.14 |
| |
| |
| |
| |
| |
|
| Total Return (%) b | | 8.41 | | 4.24 | | (1.56) | | 9.67 | | 35.16 |
| |
| |
| |
| |
| |
|
| Ratios/Supplemental Data (%): | | | | | | | | | | |
| Ratio of total expenses | | | | | | | | | | |
| to average net assets | | 2.64 | | 2.36 | | 2.36 | | 2.28 | | 2.52 |
| Ratio of net expenses | | | | | | | | | | |
| to average net assets | | 2.63 | | 2.36 | | 2.35 | | 2.27 | | 2.52 |
| Ratio of net investment (loss) | | | | | | | | | | |
| to average net assets | | (2.16) | | (2.01) | | (1.98) | | (2.01) | | (2.28) |
| Portfolio Turnover Rate | | 215 | | 202 | | 160 | | 98 | | 130 |
| |
| |
| |
| |
| |
|
| Net Assets, end of period ($ x 1,000) | | 2,302 | | 2,981 | | 4,391 | | 6,668 | | 8,352 |
| a | | Based on average shares outstanding at each month end. |
| b | | Exclusive of sales charge. |
| See notes to financial statements. |
22
| | | | | Year Ended December 31, | | |
| |
| |
| |
|
| Class F Shares | | 2007 | | 2006 | | 2005 | | 2004 | | 2003 |
| |
| |
| |
| |
| |
|
| Per Share Data ($): | | | | | | | | | | |
| Net asset value, beginning of period | | 30.03 | | 28.58 | | 28.77 | | 25.98 | | 19.04 |
| Investment Operations: | | | | | | | | | | |
| Investment (loss)—net | | (.32)a | | (.34)a | | (.30)a | | (.69) | | (.35) |
| Net realized and unrealized | | | | | | | | | | |
| gain (loss) on investments | | 3.23 | | 1.79 | | .11 | | 3.48 | | 7.29 |
| Total from Investment Operations | | 2.91 | | 1.45 | | (.19) | | 2.79 | | 6.94 |
| Net asset value, end of period | | 32.94 | | 30.03 | | 28.58 | | 28.77 | | 25.98 |
| |
| |
| |
| |
| |
|
| Total Return (%) | | 9.69 | | 5.08 | | (.66) | | 10.74 | | 36.45 |
| |
| |
| |
| |
| |
|
| Ratios/Supplemental Data (%): | | | | | | | | | | |
| Ratio of total expenses | | | | | | | | | | |
| to average net assets | | 1.49 | | 1.53 | | 1.46 | | 1.35 | | 1.53 |
| Ratio of net expenses | | | | | | | | | | |
| to average net assets | | 1.48 | | 1.52 | | 1.45 | | 1.34 | | 1.53 |
| Ratio of net investment (loss) | | | | | | | | | | |
| to average net assets | | (1.01) | | (1.16) | | (1.09) | | (1.08) | | (1.29) |
| Portfolio Turnover Rate | | 215 | | 202 | | 160 | | 98 | | 130 |
| |
| |
| |
| |
| |
|
| Net Assets, end of period ($ x 1,000) | | 195,510 | | 238,015 | | 351,087 | | 550,622 | | 638,880 |
| a Based on average shares outstanding at each month end. |
| See notes to financial statements. |
The Fund 23
FINANCIAL HIGHLIGHTS (continued)
| | | | | Year Ended December 31, | | |
| |
| |
| |
|
| Class I Shares | | 2007 a | | 2006 | | 2005 | | 2004 | | 2003 |
| |
| |
| |
| |
| |
|
| Per Share Data ($): | | | | | | | | | | |
| Net asset value, beginning of period | | 30.67 | | 29.11 | | 29.22 | | 26.32 | | 19.23 |
| Investment Operations: | | | | | | | | | | |
| Investment (loss)—net | | (.32)b | | (.27)b | | (.24)b | | (.24) | | (.17) |
| Net realized and unrealized | | | | | | | | | | |
| gain (loss) on investments | | 3.29 | | 1.83 | | .13 | | 3.14 | | 7.26 |
| Total from Investment Operations | | 2.97 | | 1.56 | | (.11) | | 2.90 | | 7.09 |
| Net asset value, end of period | | 33.64 | | 30.67 | | 29.11 | | 29.22 | | 26.32 |
| |
| |
| |
| |
| |
|
| Total Return (%) | | 9.68 | | 5.36 | | (.38) | | 11.02 | | 36.87 |
| |
| |
| |
| |
| |
|
| Ratios/Supplemental Data (%): | | | | | | | | | | |
| Ratio of total expenses | | | | | | | | | | |
| to average net assets | | 1.49 | | 1.26 | | 1.18 | | 1.11 | | 1.21 |
| Ratio of net expenses | | | | | | | | | | |
| to average net assets | | 1.48 | | 1.26 | | 1.17 | | 1.10 | | 1.21 |
| Ratio of net investment (loss) | | | | | | | | | | |
| to average net assets | | (.98) | | (.91) | | (.80) | | (.83) | | (.96) |
| Portfolio Turnover Rate | | 215 | | 202 | | 160 | | 98 | | 130 |
| |
| |
| |
| |
| |
|
| Net Assets, end of period ($ x 1,000) | | 19,086 | | 8,662 | | 8,315 | | 72,317 | | 65,240 |
| a | | Effective June 1, 2007, Class R shares were redesignated as Class I shares. |
| b | | Based on average shares outstanding at each month end. |
| See notes to financial statements. |
24
| | | | | Year Ended December 31, | | |
| |
| |
| |
|
| Class T Shares | | 2007 | | 2006 | | 2005 | | 2004 | | 2003 |
| |
| |
| |
| |
| |
|
| Per Share Data ($): | | | | | | | | | | |
| Net asset value, beginning of period | | 29.21 | | 27.91 | | 28.18 | | 25.55 | | 18.79 |
| Investment Operations: | | | | | | | | | | |
| Investment (loss)—net | | (.57)a | | (.45)a | | (.38)a | | (.65) | | (.31) |
| Net realized and unrealized | | | | | | | | | | |
| gain (loss) on investments | | 3.11 | | 1.75 | | .11 | | 3.28 | | 7.07 |
| Total from Investment Operations | | 2.54 | | 1.30 | | (.27) | | 2.63 | | 6.76 |
| Net asset value, end of period | | 31.75 | | 29.21 | | 27.91 | | 28.18 | | 25.55 |
| |
| |
| |
| |
| |
|
| Total Return (%) b | | 8.70 | | 4.66 | | (.96) | | 10.29 | | 35.98 |
| |
| |
| |
| |
| |
|
| Ratios/Supplemental Data (%): | | | | | | | | | | |
| Ratio of total expenses | | | | | | | | | | |
| to average net assets | | 2.33 | | 1.84 | | 1.77 | | 1.71 | | 1.91 |
| Ratio of net expenses | | | | | | | | | | |
| to average net assets | | 2.32 | | 1.84 | | 1.76 | | 1.70 | | 1.90 |
| Ratio of net investment (loss) | | | | | | | | | | |
| to average net assets | | (1.85) | | (1.51) | | (1.40) | | (1.44) | | (1.66) |
| Portfolio Turnover Rate | | 215 | | 202 | | 160 | | 98 | | 130 |
| |
| |
| |
| |
| |
|
| Net Assets, end of period ($ x 1,000) | | 102 | | 168 | | 1,187 | | 1,648 | | 1,788 |
| a | | Based on average shares outstanding at each month end. |
| b | | Exclusive of sales charge. |
| See notes to financial statements. |
The Fund 25
NOTES TO FINANCIAL STATEMENTS
NOTE 1—Significant Accounting Policies:
Dreyfus Founders Discovery Fund (the “fund”) is a separate diversified series of Dreyfus Founders Funds, Inc. (the “Company”), which is registered under the Investment Company Act of 1940, as amended (the “Act”), as an open-end management investment company and operates as a series company currently offering six series, including the fund.The fund’s investment objective is to seek capital appreciation. Founders Asset Management LLC (“Founders”) serves as the fund’s investment adviser. During the first half of the reporting period, Founders was an indirect wholly-owned subsidiary of Mellon Financial Corporation (“Mellon Financial”).
On July 1, 2007, Mellon Financial and The Bank of New York Company, Inc. merged, forming The Bank of New York Mellon Corporation (“BNY Mellon”). As part of this transaction, Founders became an indirect, wholly-owned subsidiary of BNY Mellon.
The Company’s Board of Directors approved the redesignation of the fund’s Class R shares as Class I shares, effective June 1, 2007.The eligibility requirements for Class I shares remained the same as for Class R shares.
MBSC Securities Corporation (the “Distributor”), the direct owner of Founders and a wholly-owned subsidiary of The Dreyfus Corporation (“Dreyfus”), an affiliate of Founders, is the distributor of the fund’s shares. The fund is authorized to issue up to 550 million shares of Common Stock, par value $.01 per share, in the following classes of shares: Class A, Class B, Class C, Class F, Class I and Class T shares. Class A and Class T shares are subject to a sales charge imposed at the time of purchase, although the shares may be purchased at net asset value (“NAV”) without a sales charge by certain categories of investors. Class B shares are subject to a contingent deferred sales charge (“CDSC”) imposed on Class B share redemptions made within six years of purchase and automatically convert to Class A shares after six years. The fund does not offer Class B shares, except in connection
26
with dividend reinvestment and permitted exchanges of Class B shares. Class C shares are subject to a CDSC imposed on Class C shares redeemed within one year of purchase. Class F and Class I shares are sold at NAV per share. Class F shares are sold only to Class F grandfathered investors, and Class I shares are sold only to eligible institutional investors. Other differences between the classes include the services offered to and the expenses borne by each class. Income and realized and unrealized gains or losses on investments are allocated to each class of shares based on its relative net assets.
Each class of the fund bears expenses incurred specifically on its behalf and, in addition, each class bears a portion of general expenses based on the relative net assets or the number of shareholder accounts of the class.The type of expense determines the allocation method.
The Company’s Board of Directors has authorized the payment of certain fund expenses with commissions on fund portfolio transactions. These commissions reduce miscellaneous expenses and are included in the expense offset to broker commissions in the Statement of Operations.
The fund’s financial statements are prepared in accordance with U.S. generally accepted accounting principles, which require the use of management estimates and assumptions. Actual results could differ from those estimates.
The fund enters into contracts that contain a variety of indemnifications. The fund’s maximum exposure under these arrangements is unknown.The fund does not anticipate recognizing any loss related to these arrangements.
(a) Portfolio valuation: A domestic equity security listed or traded on a securities exchange or in the over-the-counter market is valued at its last sale price on the exchange or market where it is principally traded or, in the case of a security traded on NASDAQ, at its official closing price. Lacking any sales on that day, the security is valued at the current closing bid price, or by quotes from dealers making a market in
The Fund 27
NOTES TO FINANCIAL STATEMENTS (continued)
the security if the closing bid price is not available, or in the case of written call options, at the mean between the highest bid and lowest asked quotations obtained from at least two securities dealers.
A foreign equity security traded on a foreign exchange is valued at the last quoted official closing price available before the time when the fund’s assets are valued, or at the last quoted sales price if the exchange does not provide an official closing price or if the foreign market has not yet closed. Lacking any sales that day, the security is valued at the current closing bid price, or by quotes from dealers making a market in the security if the closing bid price is not available. New York closing exchange rates are used to convert foreign currencies to U.S. dollars.
A debt security with a remaining maturity greater than 60 days at the time of purchase is valued in accordance with the evaluated bid price supplied by a pricing service approved by the Company’s Board of Directors or, if such price is not available, at the mean between the highest bid and lowest asked quotations obtained from at least two securities dealers.A debt security with a remaining maturity of 60 days or less at the time of purchase is valued at amortized cost, which approximates market value, unless it is determined that amortized cost would not represent market value, in which case the securities would be marked to market.The fund amortizes premiums and discounts on all debt securities.
Registered open-end investment companies that are not traded on an exchange are valued at their NAV.
If market quotations or official closing prices are not readily available or are determined not to reflect accurately fair value, securities will be valued at their fair value as determined in good faith by the Company’s Board of Directors or pursuant to procedures approved by the Board of Directors.These situations may include instances where an event occurs after the close of the market on which a security is traded but before the fund calculates its NAV, and it is determined
28
that the event has materially affected the value of the security. Fair value of foreign equity securities may be determined with the assistance of a pricing service using calculations based on indexes of domestic securities and other appropriate indicators, such as prices of relevant ADRs and futures contracts.
The Financial Accounting Standards Board (“FASB”) released Statement of Financial Accounting Standards No. 157 “Fair Value Measurements” (“FAS 157”). FAS 157 establishes an authoritative definition of fair value, sets out a framework for measuring fair value, and requires additional disclosures about fair-value measurements. The application of FAS 157 is required for fiscal years beginning after November 15, 2007 and interim periods within those fiscal years. Management does not believe that the application of this standard will have a material impact on the financial statements of the fund.
(b) Foreign securities and currency transactions: The fund may invest at least a portion of its assets in foreign securities. Foreign securities carry more risk than U.S. securities, such as political and currency risks. In the event the fund executes a foreign security transaction, the fund may enter into a foreign currency contract to settle the foreign security trans-action.The fund could be exposed to risk if counterparties are unable to meet the terms of the contracts or if the value of the currency changes unfavorably to the U.S. dollar.The resultant foreign currency gain or loss from the contract is recorded as foreign currency gain or loss and is presented as such in the Statement of Operations.
The accounting records of the fund are maintained in U.S. dollars.The market values of foreign securities, currency holdings and other assets and liabilities are translated into U.S. dollars based on the current exchange rates each business day. Purchases and sales of investment securities and income and expense items denominated in foreign currencies are translated into U.S. dollar amounts on the respective dates of such transactions.
The Fund 29
NOTES TO FINANCIAL STATEMENTS (continued)
The fund does not isolate that portion of the results of operations resulting from changes in foreign exchange rates on investments from the fluctuations arising from changes in market prices of securities held. Such fluctuations are included with the net unrealized appreciation (depreciation) from investments and foreign currency translations in the Statement of Operations.
Reported net realized foreign exchange gains or losses arise from sales of foreign currencies,currency gains or losses realized between the trade and settlement dates on securities transactions,and the difference between the amounts of dividends,interest,and foreign withholding taxes recorded on the fund’s books and the U.S. dollar equivalent of the amounts actually received or paid. Net unrealized appreciation or depreciation on investments and foreign currency translation arises from changes in the values of assets and liabilities, including investments in securities held at the date of the financial statements, resulting from changes in the exchange rates and changes in market prices of securities held.
(c) Securities transactions and investment income: Securities transactions are recorded on a trade date basis. Realized gains and losses from securities transactions are recorded on the identified cost basis. Dividend income is recognized on the ex-dividend date and interest income, including, where applicable, accretion of discount and amortization of premium on investments, is recognized on the accrual basis.
The fund has an arrangement with the custodian bank, Mellon Bank, N.A. (“Mellon Bank”), whereby the fund receives earnings credits from the custodian when positive cash balances are maintained, which are used to offset custody fees. For financial reporting purposes, the fund includes any earnings credits as an expense offset in the Statement of Operations.
(d) Affiliated issuers: Investments in other investment companies advised by Founders or its affiliates are defined as “affiliated” in the Act.
(e) Dividends to shareholders: Dividends are recorded on the ex-dividend date. Dividends from investment income-net and dividends from net realized capital gains, if any, are normally declared and paid annually, but the fund may make distributions on a more frequent basis to
30
comply with the distribution requirements of the Internal Revenue Code of 1986, as amended (the “Code”).To the extent that net realized capital gains can be offset by capital loss carryovers, it is the policy of the fund not to distribute such gains. Income and capital gain distributions are determined in accordance with income tax regulations, which may differ from U.S. generally accepted accounting principles.
(f) Federal income taxes: No provision has been made for federal income taxes since it is the policy of the fund to comply with the requirements of Subchapter M of the Code that are applicable to regulated investment companies and to make distributions of income and capital gains sufficient to relieve it from all income taxes.The fund is treated as a separate tax entity for federal income tax purposes.
During the current year, the fund adopted FASB Interpretation No. 48 “Accounting for Uncertainty in Income Taxes” (“FIN 48”). FIN 48 provides guidance for how uncertain tax positions should be recognized, measured, presented and disclosed in the financial statements. FIN 48 requires the evaluation of tax positions taken or expected to be taken in the course of preparing the fund’s tax returns to determine whether the tax positions are “more likely- than-not”of being sustained by the applicable tax authority. Tax positions not deemed to meet the more-likely-than-not threshold would be recorded as a tax benefit or expense in the current year.The adoption of FIN 48 had no impact on the operations of the fund for the period ended December 31, 2007.
The fund is not subject to examination by U.S. Federal, State and City tax authorities for the tax years before 2004.
At December 31, 2007, the components of accumulated earnings on a tax basis were as follows: accumulated capital losses $232,708,199 and unrealized appreciation $13,150,350.
The accumulated capital loss carryover is available to be applied against future net securities profits, if any, realized subsequent to December 31, 2007. If not applied, $218,607,732 of the carryover expires in fiscal 2010 and $14,100,467 expires in fiscal 2011.
The Fund 31
NOTES TO FINANCIAL STATEMENTS (continued)
During the period ended December 31, 2007, as a result of permanent book to tax differences, primarily due to the tax treatment for net operating losses and real estate investment trusts, the fund increased accumulated undistributed investment income-net by $2,709,279, increased accumulated net realized gain (loss) on investments by $15,702 and decreased paid-in-capital by $2,724,981. Net assets and net asset value per share were not affected by this reclassification.
NOTE 2—Bank Line of Credit:
The Company has a line of credit arrangement (“LOC”) with State Street Bank and Trust Company, to be used for temporary or emergency purposes, primarily for financing redemption payments. The borrowings by each series of the Company are limited to the lesser of (a) $25 million, or (b) the lesser of 25% of the series’ total net assets or the maximum amount which the series is permitted to borrow pursuant to the prospectus, any law or any other agreement. Combined borrowings are subject to the $25 million cap on the total LOC. Each series agrees to pay annual fees and interest on the unpaid balance based on prevailing market rates as defined in the LOC.
The average daily amount of borrowings outstanding under the LOC during the period December 31, 2007, was approximately $88,600 with a related weighted average annualized interest rate of 5.82% .
NOTE 3—Investment Advisory Fee and Other Transactions With Affiliates:
(a) In accordance with an investment advisory agreement between the Company and Founders, the fund compensates Founders for its services as investment adviser by the payment of fees computed daily and paid monthly at the annual rate equal to a percentage of the average daily value of the fund’s net assets.The fee is 1% of the first $250 million of net assets, .80% of the next $250 million of net assets and .70% of net assets in excess of $500 million.
During the period ended December 31, 2007, the Distributor retained $1,030 and $235 from sales commissions earned on sales of
32
the fund’s Class A and Class T shares, respectively, and $11,742 and $642 from CDSC on redemptions of the fund’s Class B and Class C shares, respectively.
(b) Under a Distribution Plan (the “Class B, C and T Plan”) adopted pursuant to Rule 12b-1 under the Act, Class B, Class C and Class T shares pay the Distributor for distributing their shares at an annual rate of .75% of the value of their average daily net assets of Class B and Class C shares and .25% of the value of the average daily net assets of Class T shares. During the period ended December 31, 2007, Class B, Class C and Class T shares were charged $7,333, $19,629 and $307, respectively, pursuant to the Class B, C and T Plan.
The fund also has adopted a Distribution Plan pursuant to Rule 12b-1 under the Act applicable to its Class F shares (the “Class F Plan”). Under the Class F Plan, the fund is authorized to reimburse the Distributor for expenses paid for distributing or servicing its Class F shares at an annual rate of up to .25% of the value of the average daily net assets of the Fund’s Class F shares. During the period ended December 31, 2007, Class F shares were charged $273,916 pursuant to the Class F Plan.
(c) Under the Shareholder Services Plan, Class A, Class B, Class C and Class T shares pay the Distributor at an annual rate of .25% of the value of their average daily net assets for the provision of certain services. The services provided may include personal services relating to shareholder accounts, such as answering shareholder inquiries regarding the fund and providing reports and other information, and services related to the maintenance of shareholder accounts. The Distributor may make payments to Service Agents (a securities dealer, financial institution or other industry professional) in respect of these services. The Distributor determines the amounts to be paid to Service Agents. During the period ended December 31, 2007, Class A, Class B, Class C and Class T shares were charged $39,509, $2,444, $6,543 and $307, respectively, pursuant to the Shareholder Services Plan.
The Fund 33
NOTES TO FINANCIAL STATEMENTS (continued)
The Company has a shareholder services agreement with the Distributor, whereby the fund has agreed to compensate the Distributor for providing certain shareholder servicing functions to holders of Class F shares.The fund paid the Distributor a monthly fee equal, on an annual basis, to $24.00 per Class F shareholder account considered to be an open account at any time during a given month. During the period ended December 31, 2007, Class F shares were charged $209,875 pursuant to this shareholder services agreement.
Dreyfus Transfer, Inc. (“DTI”), a wholly-owned subsidiary of Dreyfus, is the transfer and dividend disbursing agent for all of the fund’s share classes.With the exception of out-of-pocket charges, the fees charged by DTI with respect to the fund’s Class F shares are paid by the Distributor.The out-of-pocket charges from DTI are paid by the fund. During the period ended December 31, 2007, Class F shares were charged $20,257 for out-of-pocket transfer agent charges.
The fees charged by DTI with respect to the fund’s Class A, B, C, I and T shares are paid by the fund. These transfer agency fees, including both the per account fees paid to DTI and out-of-pocket charges, during the period ended December 31, 2007 were $47,249.
The fund compensates Mellon Bank, an affiliate of Founders, under a custody agreement for providing custodial services for the fund. During the period ended December 31, 2007, the fund was charged $16,319 pursuant to the custody agreement.
The fund also pays Mellon Bank for certain cash management services. These fees are included in the out-of-pocket transfer agency charges above.
The fund has agreed to compensate Dreyfus for providing accounting services, administration, compliance monitoring, regulatory and shareholder reporting, as well as related facilities, equipment and clerical help.The fee is computed at the annual rate of .06% of the average daily net assets of the fund on the first $500 million, .04% of the average daily
34
net assets of the fund on the next $500 million and .02% of the average daily net assets of the fund in excess of $1 billion, plus reasonable out-of pocket expenses. Dreyfus has contractually agreed in writing to waive any fees received for these services to the extent they exceed its costs in providing the services and a reasonable allocation of Founders’ costs related to the support and oversight of these services. During the period ended December 31, 2007, Dreyfus waived $9,767.
The components of “Due to Founders Asset Management LLC and affiliates” in the Statement of Assets and Liabilities consist of: investment advisory fees $197,490, Rule 12b-1 distribution plan fees $37,655, shareholder services plan fees $165,501, transfer agency per account fees $7,595 and accounting fees $4,907.
(d) Annual retainer fees and attendance fees for the Company’s Board of Directors are allocated to each series of the Company based on net assets.The Company’s Board of Directors has adopted a deferred compensation plan for Company directors that enables directors to elect to defer receipt of all or a portion of the annual compensation that they are entitled to receive from the Company. Under the plan, the compensation deferred is invested in shares of one or more of the Company’s series.The amount paid to the director under the plan will be determined based upon the performance of the selected series.The current value of these amounts is included in Other Assets and Directors’ Deferred Compensation in the Statement of Assets and Liabilities. Changes in market value are included in the directors’ fees and expenses and the net change in unrealized appreciation (depreciation) of investments in the Statement of Operations. Deferral of directors’ fees under the plan does not affect the net assets of the fund.
Certain officers of the Company are also officers and/or directors of Founders or its affiliates, which pay their compensation.The affairs of the fund, including services provided by Founders, are subject to the supervision and general oversight of the Company’s Board of Directors.
The Fund 35
NOTES TO FINANCIAL STATEMENTS (continued)
NOTE 4—Securities Transactions:
The aggregate amount of purchases and sales of investment securities, excluding short-term securities, during the period ended December 31, 2007, amounted to $543,050,173 and $632,703,635, respectively.
At December 31, 2007, the cost of investments for federal income tax purposes was $216,280,762; accordingly, accumulated net unrealized appreciation on investments was $13,150,350, consisting of $21,490,389 gross unrealized appreciation and $8,340,039 gross unrealized depreciation.
36
REPORT OF INDEPENDENT REGISTERED
PUBLIC ACCOUNTING FIRM
|
Shareholders and Board of Directors
Dreyfus Founders Discovery Fund
|
We have audited the accompanying statement of assets and liabilities, including the statement of investments, of Dreyfus Founders Discovery Fund (one of the funds comprising Dreyfus Founders Funds, Inc.), as of December 31, 2007, and the related statement of operations, the statement of changes in net assets and financial highlights for the year then ended.These financial statements and financial highlights are the responsibility of the Fund's management. Our responsibility is to express an opinion on these financial statements and financial highlights based on our audit.The statement of changes in net assets of Dreyfus Founders Mid-Cap Growth Fund for the year ended December 31, 2006 and the financial highlights for each of the indicated periods through December 31, 2006, were audited by other auditors whose report dated February 23, 2007, expressed an unqualified opinion on the statement and financial highlights.
We conducted our audit in accordance with the standards of the Public Company Accounting Oversight Board (United States).Those standards require that we plan and perform the audit to obtain reasonable assurance about whether the financial statements and financial highlights are free of material misstatement.We were not engaged to perform an audit of the Fund's internal control over financial reporting.Our audits included consideration of internal control over financial reporting as a basis for designing audit procedures that are appropriate in the circumstances,but not for the purpose of expressing an opinion on the effectiveness of the Fund's internal control over financial reporting.Accordingly, we express no such opinion.An audit also includes examining, on a test basis, evidence supporting the amounts and disclosures in the financial statements and financial highlights, assessing the accounting principles used and significant estimates made by management, and evaluating the overall financial statement presentation. Our procedures included confirmation of securities as of December 31, 2007 by correspondence with the custodian.We believe that our audit provides a reasonable basis for our opinion.
In our opinion, the financial statements and financial highlights referred to above present fairly, in all material respects, the financial position of Dreyfus Founders Discovery Fund at December 31, 2007, and the results of its operations, the changes in its net assets and the financial highlights for the year then ended, in conformity with accounting principles generally accepted in the United States.

| | New York, New York
February 21, 2008
|
The Fund 37
| | FACTORS CONSIDERED IN RENEWING
THE ADVISORY AGREEMENT (Unaudited)
|
At a meeting of the board of directors of Dreyfus Founders Funds, Inc. (the “Funds” and, in reference to any one of the Funds’ portfolios, a “Fund”) held on August 15 and 16, 2007, the Funds’ directors unanimously approved the continuation of the Investment Advisory Agreement (“management agreement”) between each of the Funds and Founders Asset Management LLC, the Funds’ investment adviser (“Founders”), for a one-year term ending August 31, 2008.The board of directors of the Funds (“board”) is comprised entirely of individuals who have no affiliation with Founders or any affiliates of Founders (the “directors”).
Prior to the directors’August 2007 meeting, Founders had provided the directors with extensive materials related to the renewal of the management agreement, including performance and expense information for other investment companies with similar investment objectives to each Fund derived from data compiled by Lipper Inc., an independent third party (“Lipper”).
During their meeting, the directors discussed the proposed continuance of the management agreement with the senior management personnel of Founders. At the conclusion of these discussions, the directors and their independent counsel met in a private session at which no representatives of Founders were present, to continue their discussion of continuance of the agreement. In determining to continue the management agreement, the directors considered all factors which they believed to be relevant, including the following:
Nature, Extent and Quality of Services Provided and to be Provided by Founders
The directors recognized that they have had the opportunity to evaluate the investment and non-investment related services which Founders and its affiliates provide to the Funds primarily through their quarterly review of all of the operations of the Funds during Fund committee and Fund board meetings held throughout the past twelve months. At each such meeting, extensive discussions of Fund operations are held with senior management personnel of Founders and a large volume of documentation with respect to these operations is
38
provided to and reviewed by the directors. Such discussions and documentation afford the directors the continual opportunity to evaluate the nature, extent, and quality of the services provided by Founders and its affiliates to the Funds.
The directors were satisfied that Founders is managing the investment of the assets of the Funds in accordance with each Fund’s respective investment objective, policies and restrictions, subject to the directors’ overall supervision.
The directors considered that Founders also provides many non-investment related services to the Funds in fulfilling its responsibilities under the management agreement.
Following their discussion and review, the directors reached the following conclusions:
- That the breadth and quality of investment advisory and other ser- vices being provided to the Funds are satisfactory, as evidenced in part by the performance records of the Funds, to which the direc- tors gave significant attention as indicated below; and
- That the directors are satisfied not only with the research, long-term portfolio management, and trading services being provided to the Funds, but also recognize that Founders or its affiliates have provided the highest quality accounting, compliance and regulatory, adminis- trative, underwriting, custody, shareholder, transfer agent and cash management services to the Funds, while charging fair, reasonable and competitive fees.
Investment Performance
On a quarterly basis, the directors hold meetings with representatives of the portfolio management team for each Fund (usually a portfolio manager), during which each representative reviews, among other items, performance information, attribution analyses, and the portfolio manager’s investment outlook. The directors also receive written monthly and quarterly performance information for each Fund.These written quarterly reports include comparisons of each Fund’s perfor-
The Fund 39
| | FACTORS CONSIDERED IN RENEWING THE
ADVISORY AGREEMENT (Unaudited) (continued)
|
mance with its respective Lipper category and one or more benchmark indexes, as well as a comparable exchange-traded fund, for the most recent quarter and one-, three- and five-year periods, as well as for the portfolio manager’s tenure.
In conjunction with their consideration of renewal of the management agreement, the directors received a more detailed performance report about each Fund from Lipper.These reports compared each Fund’s performance to both a relatively small group of similar funds selected by Lipper (the “Lipper performance group”), as well as to all funds in the applicable Lipper category (the “Lipper performance universe”).
The performance of Discovery Fund’s Class F shares placed in the lowest two quintiles of both its Lipper performance group and the Lipper small-cap growth fund performance universe for the one-, three- and five-year periods ended December 31, 2006, placed in the lowest two quintiles of its Lipper performance universe for the one-, three- and five-year periods ended June 30, 2007, and underperformed its benchmark index for the one-, three- and five-year periods ended June 30, 2007.The directors recognized that in its efforts to improve the unsatisfactory performance results of Discovery Fund, Founders had changed the portfolio managers of the Fund in August 2006, and that the Fund’s relative performance to date in 2007 had improved. The directors were hopeful that the steps Founders has taken in an effort to improve the Fund’s performance would continue to show relative performance progress.The directors intend to continue to monitor the Fund’s future performance results closely.
After consideration of all relevant information and data, the directors concluded that although past performance cannot be a guaranty of future performance, each Fund and its shareholders would continue to benefit from Founders’ investment management of the Fund. The directors further determined:
- That although certain of the Funds have experienced performance difficulties, Founders has focused its efforts upon improving the performance records of the Funds and will continue to seek improvement; and
40
- That the materials provided by Lipper demonstrated that most of the Funds maintained satisfactory performance quintile rankings in their respective comparison groups and comparison universes, with five of seven Funds placing in the top two quintiles of their respec- tive Lipper performance universes for the one-year period ended December 31, 2006, and four placing in the top two quintiles for the three years ended December 31, 2006.
Costs of the Services to be Provided and Profits to be Realized by Founders and Its Affiliates from Founders’ Relationship With the Funds
The directors recognized that on a quarterly basis, they receive information with respect to each Fund’s expenses. The directors carefully review and discuss the expense ratios for all classes of shares of each Fund at each of their quarterly meetings throughout the year.
In conjunction with their annual consideration of renewal of the Funds’ management agreement and other service arrangements, the directors received detailed information from Lipper which compared each Fund’s management fees and other expenses with those of a group of similar funds selected by Lipper (the “Lipper expense group”), as well as summary information comparing each Fund’s management fees and expenses with those of the funds in its Lipper performance universe with load structures similar to that of the Funds (the “Lipper expense universe”).
The directors noted that for the period ended December 31, 2006, Discovery Fund’s management fees ranked in the third quintile of its Lipper expense group, with the Fund’s fees the ninth lowest of 17 “peer funds.” The Fund’s contractual management fees at a common asset level were determined by Lipper to be lower than nine of the 17 funds in its group.The Fund’s management fees were in the third quin-tile of its Lipper expense universe.
The directors also considered information provided by Lipper with respect to the profitability of the investment management activities conducted by a number of publicly-held corporations. Lipper also pre-
The Fund 41
| | FACTORS CONSIDERED IN RENEWING THE
ADVISORY AGREEMENT (Unaudited) (continued)
|
pared an analysis providing detailed information with respect to the types of services rendered to various mutual fund complexes under their respective investment advisory contracts, including the services provided by Founders to the Funds under the management agreement.
The directors had been provided with extensive materials with respect to the profitability derived by Founders from providing investment advisory and other services to the Funds as a group and to each Fund individually.
The directors further considered certain indirect benefits received by Founders and its affiliates as a result of Founders’ provision of investment advisory services to the Funds.These included the following:
- Since Founders manages a non-Fund account in a style that is sim- ilar to that used for one of the Funds (and for portions of certain other Funds), and employees of Founders manage other non-Fund accounts in a similar style in their capacities as employees of the affiliates, Founders and its affiliates realize efficiencies in perform- ing the portfolio management, trading and operational functions related to those non-Fund accounts;
- The Funds’ brokerage transactions may be executed with brokers that provide research and brokerage services to Founders and its affiliates. These research and brokerage services may be useful to Founders and its affiliates in providing investment advisory services to any of the clients they advise, including the Funds; and
- Affiliates of Founders receive various fees for providing accounting, underwriting, shareholder, transfer agency, custody and cash man- agement services to the Funds.
After deliberation and discussion of Fund fees and expenses, the directors determined:
- That upon review of the advisory fee structures of the Funds in comparison with the competitive expense groups and expense uni- verses selected by Lipper, the levels of investment advisory fees paid by the Funds were deemed to be competitive;
42
- That the expense ratios of the Funds are competitive and that Founders continually reviews each Fund’s total expense ratio and has initiated voluntarily expense caps and fee waivers for certain Funds to reduce their expense ratios;
- That five of the seven Funds’ expense ratios decreased or remained the same for all or most of their share classes in 2006 as compared to those experienced in 2005, in some instances as a result of increases in Fund assets; and
- That the comparative fee and expense information included in the materials provided by Lipper supports the determination that the advisory and other fees payable by the Funds to Founders and its affiliates are essentially fees which would be similar to those that would have resulted solely from “arm’s-length” bargaining.
With respect to profitability to Founders, the directors reviewed the adviser profitability analysis provided by Lipper, which demonstrated that Founders’ 2006 profitability from providing management services to the Funds was reasonable in comparison to the entities included in the Lipper analysis.
The directors were also advised by independent counsel of the profitability percentage ranges which court cases have found acceptable and determined that Founders’ profitability percentage for providing management and other services to the Funds was reasonable.
The directors concluded that Founders’ profits from providing management services to the Funds were reasonable in relationship to the overall services which Founders provides.
Economies of Scale
The directors reviewed information provided by Founders which summarized the extent, if any, that both Founders and the Funds would achieve certain economies of scale if the assets of the Funds were to increase.
The Fund 43
| | FACTORS CONSIDERED IN RENEWING THE
ADVISORY AGREEMENT (Unaudited) (continued)
|
After review and discussion, the directors considered the extent to which economies of scale and common management are shared with each Fund, including the economies that would be realized from the growth of each Fund’s assets. After such consideration, the directors determined that all of the Funds have structured breakpoints in their advisory fees, which result in fee reductions as the assets of each Fund reach defined levels, and that such fee reductions, when implemented, would benefit all of the applicable Fund’s shareholders through decreases in the Fund’s expense ratio.
Dedication to Regulatory Requirements and Restrictions
An important factor in the directors’ consideration of renewal of the Funds’ management agreement with Founders included the directors’ recognition of the dedication by Founders of stringent adherence to regulatory requirements and restrictions.The directors determined that Founders is dedicated to compliance with all applicable rules and regulations and that the systems of controls which are in place to ensure that the service providers to the Funds, including Founders, and the Funds themselves, maintain strict adherence to the law are excellent.
Overall Conclusions
The directors determined that they are generally satisfied with the performance of the Funds and with the quality of the advisory and other services being provided by Founders and its affiliates to the Funds. The directors recognized that efforts are being and will continue to be made to improve the Funds’ performance and to maintain Fund expense ratios at reasonable and competitive levels.
44
The directors concluded that continuation of the current management agreement between each Fund and Founders, which would enable each Fund to continue to receive investment advisory services from Founders, is in the best interests of each Fund and its shareholders, the services to be performed under the management agreement are services required for the operations of the Funds, Founders has provided satisfactory investment management services to the Funds in the past, and the fees for the management services which Founders will perform will be within the range of what would have been negotiated at arm’s length in light of the circumstances.
The Fund 45
YOUR BOARD REPRESENTATIVES (Unaudited)
The Board of Directors of the Company oversees all six Dreyfus Founders Funds.The business and affairs of the Company are managed under the direction of the Board. The directors serving on the Board perform their responsibilities in the manner which they reasonably believe to be in the best interests of the Funds and their shareholders.
All of the directors,as listed below,are independent directors.They are not affiliated with the Fund’s adviser, its parent company, or its affiliates.The directors have no official term of office and generally serve until they retire (normally at age 75, but subject to extension to age 80), resign, or are not re-elected.As you can see from their backgrounds, the directors have broad experience as active or former business and community leaders.
Eugene H.Vaughan, CFA, 74.Year elected to the Board: 1970
Board Chairman. Founding Chairman,Vaughan Nelson Investment Management, LP, an investment counseling firm. Director, Encore Bank, Houston. Founding Chairman, Center for Houston’s Future, a non-profit organization. Founding Chairman and former Governor, CFA Institute. Past Chairman and Trustee, Institute of Chartered Financial Analysts. Past Chairman and Director, Financial Analysts Federation. Chairman-elect, University of Texas Health Science Center.
Alan S. Danson, 68.Year elected to the Board: 1991
Private investor. Formerly, President and Director, D.H. Management, Inc., the general partner of a limited partnership with technology company holdings (1996 to 2003). Director, Gore Range Natural Science School and The Les Streeter Program, Inc., both of which are non-profit organizations.
Robert P. Mastrovita, 63.Year elected to the Board: 1998
Private investor. Chairman of a private charitable foundation (1997 to present). Formerly, Chairman and Director, Hagler, Mastrovita & Hewitt, Inc., a registered investment adviser (1982 to 1997). Member, Boston Society of Security Analysts. Trustee, Partridge Academy. Director, King Caesar Foundation.
Trygve E. Myhren, 71.Year elected to the Board: 1996
President, Myhren Media, Inc., a firm that invests in and advises media, telecommunications, Internet and software companies. Special Limited Partner and member of Investment Committee, Megunticook Funds, a venture capital firm (1998 to present). Director, AdPay, Inc.Trustee, Executive Committee and Chairman of Faculty Education Affairs Committee, the University of Denver. Trustee, Denver Art
46
Museum. Member, Colorado FORUM and Cable Television Hall of Fame. Formerly, President (1990 to 1996) and Director (1992 to 2001) of the Providence Journal Company, a diversified media and communications company. Formerly, Chairman and Chief Executive Officer of American Television and Communications Corporation (now Time Warner Cable) (1981 to 1988). Formerly, Chairman of the National Cable Television Association (1986-1987). Chief of Mission, 2006 Paralympic Games,Torino/Sestrierre, Italy.
George W. Phillips, 69.Year elected to the Board: 1998
Retired.Vice Chairman of the Board and Chairman of the Investment Committee, Children’s Medical Center of Boston. Formerly, President and Chief Executive Officer (1992 to 1997) and Director (1992 to 2002) of Warren Bancorp, Inc. Formerly, President, Chief Executive Officer and Director of Warren Five Cents Savings Bank (1992 to 1997).
Martha A. Solis-Turner, 47.Year elected to the Board: 2005
Formerly, Telecommunications Director, Wholesale Markets (1995 to 2001), and Manager (1990 to 1995), Qwest Communications International Inc. Board member and Treasurer, Mile High Montessori Early Learning Centers (2002 to present), and formerly, Board member (1995 to 2004) and Vice President (2002 to 2004), Curtis Park Community Center, both of which are non-profit organizations.
Principal Officers
J. David Officer, 59. President and Principal Executive Officer of the Funds since 2007. Chief Operating Officer,Vice Chairman and a Director of Dreyfus, and an officer of 78 investment companies (comprised of 163 portfolios) managed by Dreyfus. He has been an employee of Dreyfus since 1998.
Denise B. Kneeland, 56. Vice President of the Funds since 2008. Assistant Vice President (since 1996) and Secretary (since 2007) of the Mellon Institutional Funds Investment Trust. First Vice President and Manager, Mutual Funds Operations, BNY Mellon Asset Management (since 2006). Formerly,Vice President and Manager, Mutual Funds Operations, Standish Mellon Asset Management Company, LLC (1996 to 2001).
Kenneth R. Christoffersen, 52. Vice President of the Funds since 2008, and Secretary since 2000 (and from 1996 to 1998). Founders’ Senior Vice President -Legal, General Counsel and Secretary. Assistant Secretary of the Distributor since 2003. Employed by Founders and its predecessor company since 1996.
The Fund 47
YOUR BOARD REPRESENTATIVES (Unaudited) (continued)
Steven M. Anderson, 42.Treasurer and Principal Financial and Accounting Officer of the Funds since 2007. Vice President (since 1999), Treasurer (since 2002) and Chief Financial Officer of Mellon Institutional Funds Investment Trust. Vice President and Mutual Funds Controller, BNY Mellon Asset Management (since 2003). Formerly, Assistant Vice President and Mutual Funds Controller, Standish Mellon Asset Management Company, LLC (2000 to 2003).
Janelle E. Belcher, 49. Chief Compliance Officer of the Funds since 2004 and Assistant Secretary of the Funds since 2002. Founders’ Vice President - Compliance since 2002. Formerly, Founders’ Manager of Compliance (2000 to 2002) and Securities Compliance Examiner, Staff Accountant and Team Leader for the U.S. Securities and Exchange Commission (1990 to 2000).
David T. Buhler, 36. Assistant Secretary since 2007. Founders’ Associate General Counsel and Assistant Secretary since 2006. Formerly, Counsel for Great-West Life & Annuity Insurance Company (1997-2006), and Chief Compliance Officer for Greenwood Investments, LLC (2002 - 2006).
Robert S. Robol, 43. Assistant Treasurer since 2006. Senior Accounting Manager -Taxable Fixed Income Funds of Dreyfus, and an officer of 79 investment companies (comprised of 180 portfolios) managed by Dreyfus. Employed by Dreyfus since 1988.
Robert Salviolo, 40. Assistant Treasurer since 2007. Senior Accounting Manager -Foreign Equity Funds of Dreyfus, and an officer of 79 investment companies (comprised of 180 portfolios) managed by Dreyfus. Employed by Dreyfus since 1989.
Robert Svagna, 40. Assistant Treasurer since 2006. Senior Accounting Manager -Equity Funds of Dreyfus, and an officer of 79 investment companies (comprised of 180 portfolios) managed by Dreyfus. Employed by Dreyfus since 1990.
William G. Germenis, 37. Anti-Money Laundering Compliance Officer (“AMLCO”) for the Class A, Class B, Class C, Class I, and Class T shares of the Funds since 2002 and for the Class F shares of the Funds since 2003.Vice President and AMLCO of the Distributor and AMLCO of 75 investment companies (comprised of 176 portfolios) managed by Dreyfus. Employed by the Distributor since 1998.
The directors and officers may be contacted at Founders’ address appearing on the back cover, except for Messrs. Officer, Robol, Salviolo, Svagna and Germenis, who can be contacted at The Dreyfus Corporation, 200 Park Avenue, New York, New York 10166, and Mr. Anderson and Ms. Kneeland, who can be contacted at BNY Mellon Asset Management, One Boston Place, Boston, Massachusetts 02108. Additional information about the Company’s directors is available in the Statement of Additional Information, which can be obtained free of charge by calling 1-800-525-2440 (Class F shareholders) or 1-800-554-4611 (all other shareholders).
48
| Dreyfus Founders |
| Equity Growth Fund |
ANNUAL REPORT December 31, 2007
Save time. Save paper. View your next shareholder report online as soon as it’s available. Log into www.dreyfus.com and sign up for Dreyfus eCommunications. It’s simple and only takes a few minutes.
The views expressed in this report reflect those of the portfolio manager only through the end of the period covered and do not necessarily represent the views of Founders or any other person in the Founders organization.Any such views are subject to change at any time based upon market or other conditions and Founders disclaims any responsibility to update such views.These views may not be relied on as investment advice and, because investment decisions for a Dreyfus Founders Fund are based on numerous factors, may not be relied on as an indication of trading intent on behalf of any Dreyfus Founders Fund.
Not FDIC-Insured • Not Bank-Guaranteed • May Lose Value
| Contents |
| |
| | | THE FUND |
| |
|
| 2 | | A Letter from the Chairman |
| 3 | | Discussion of Fund Performance |
| 6 | | Fund Performance |
| 8 | | Understanding Your Fund’s Expenses |
| 8 | | Comparing Your Fund’s Expenses |
| | | With Those of Other Funds |
| 9 | | Statement of Investments |
| 14 | | Statement of Assets and Liabilities |
| 15 | | Statement of Operations |
| 16 | | Statement of Changes in Net Assets |
| 18 | | Financial Highlights |
| 24 | | Notes to Financial Statements |
| 36 | | Report of Independent Registered |
| | | Public Accounting Firm |
| 37 | | Important Tax Information |
| 38 | | Factors Considered in Renewing |
| | | the Advisory Agreement |
| 46 | | Your Board Representatives |
| |
| FOR MORE INFORMATION |
|
| | | Back Cover |
| Dreyfus Founders |
| Equity Growth Fund |

A LETTER FROM THE CHAIRMAN
Dear Shareholder:
We are pleased to present this annual report for Dreyfus Founders Equity Growth Fund, covering the 12-month period from January 1, 2007, through December 31, 2007.
Looking back, 2007 was a year of significant change for the stock market.Turmoil in the sub-prime mortgage market, declining housing values and soaring energy prices sparked a “flight to quality” in which investors reassessed their attitudes toward risk.As a result, smaller, more speculative companies that had led the stock market over the past several years lost value over the second half of the year, while shares of larger, multinational growth companies returned to favor. Many financial services and consumer discretionary companies were hurt by repercussions from the sub-prime lending crisis and economic downturn, but energy and basic materials producers generally moved higher along with underlying commodity prices.
The turbulence of 2007 reinforced a central principle of successful investing: diversification. Investors with broad exposure to the world’s stock and bond markets were better protected from the full impact of market volatility in areas that, earlier in the year, were among the bright spots at the time. As we look ahead, we believe that now is the perfect time to meet with your financial advisor, who can help you plan and diversify your investment portfolio in a way that manages the potential opportunities and risks that may continue to arise in 2008.
For information about how the fund performed during the reporting period, as well as market perspectives, we have provided a Discussion of Fund Performance given by the fund’s Portfolio Manager.
Thank you for your continued confidence and support.
2

DISCUSSION OF FUND PERFORMANCE
For the period between January 1, 2007, and December 31, 2007, as provided by John B. Jares, CFA, Portfolio Manager
Fund and Market Performance Overview
Softer consumer spending, a slowing U.S. economy and sub-prime mortgage delinquencies and defaults weighed on the U.S. stock market during 2007. However, large-capitalization growth stocks posted stronger returns than most other market segments as investors grew increasingly risk averse.Although the fund participated in the market’s advance, the fund underperformed its benchmark, mainly due to disappointing stock selections in several market sectors.
For the 12-month period ended December 31, 2007, Dreyfus Founders Equity Growth Fund produced total returns of 7.81% for Class A shares, 6.72% for Class B shares, 7.21% for Class C shares, 8.14% for Class F shares, 8.09% for Class I shares, and 6.24% for Class T shares.1 In comparison, the Russell 1000 Growth Index returned 11.81% over the same period.2
The Fund’s Investment Approach
To pursue the fund’s goal of long-term growth of capital and income, we invest primarily in the common stocks of large, well-established companies with records of profitability, dividend payments and a reputation for high-quality management, products and services. Using a “bottom-up” approach, we focus on individual stock selection instead of broad economic or industry trends.We look mainly for companies whose fundamental strengths suggest the potential to provide superior earnings growth over time.The fund may also invest in non-dividend-paying companies, and it may invest up to 30% of its total assets in foreign securities.
Growth Stocks Posted Gains Despite Heightened Volatility
Stocks advanced broadly over the first half of 2007 as companies in a variety of industry groups reported strong corporate earnings amid moderate economic growth, stable short-term interest rates and robust mergers-and-acquisitions activity. However, market conditions changed dramatically over the second half of the year, when a credit crisis ema-
The Fund 3
DISCUSSION OF FUND PERFORMANCE (continued)
nating from the sub-prime mortgage market spread to other areas of the financial markets.As investors reassessed their attitudes toward risk, they turned away from the smaller, more speculative stocks that previously led the market’s advance. Instead, they began to favor the types of large, growth-oriented companies in which the fund primarily invests, many of which benefited from their presence in robust overseas markets.
Our Sector Allocation and Security Selection Strategies Produced Mixed Results
In an environment of slowing consumer spending, the fund’s underweighted allocation to consumer discretionary stocks supported its relative performance.Within the consumer discretionary sector, specialty retailer Gap, Inc. benefited from solid execution by a new management team in restructuring the company and improving its merchandising efforts. Strong security selections in the telecommunication services area included wireless handset maker Nokia, which saw an increase in Chinese and Indian contracts. In other sectors, brokerage firm Charles Schwab & Co. benefited from strong asset inflows and a successful restructuring plan, while oil producer Exxon Mobil’s stock price advanced along with crude oil prices.
In the information technology sector, computer and electronics producer Apple scored a resounding success with the introduction of its iPhone, and software giant Microsoft achieved gains in its gaming platforms and operating systems divisions. Online media leader Google and hardware manufacturer Hewlett-Packard both gained share in their respective markets.
Although the fund ended the reporting period with a positive absolute return, the fund underperformed its benchmark due to shortfalls in our stock selection strategy. Most notably, industrials and materials stocks continued their upward climb amid persistent demand from the world’s emerging markets.The fund did not participate fully in these advances, as underweighted allocations to these areas weighed on relative performance. In addition, the fund suffered from lack of exposure to some of these sectors’ top individual performers.
The fund’s investment in some strong-performing information technology stocks could not counterbalance the weight of less stellar performers
4
in this area. Semiconductor manufacturer Marvell Technology Group reported sub-par profitability in a newly purchased processor line. Broadcom Corporation, another semiconductor firm, was bridled by increased research-and-development expenditures for its venture into “baseband” solutions for cell phone usage. In other areas, banking giant Citigroup fell victim to sub-prime mortgage turmoil, and retailer Home Depot suffered from lackluster consumer spending as well as depressed activity in the housing industry.
Finding Growth Opportunities in a Challenging Market
As of year end, several economic obstacles, such as rising unemployment and a housing recession, have depressed investor sentiment. Volatility caused by the anticipation of changes in government policy that typically occur during an election year may also weigh on the market. However, we believe that steps taken by the Chinese government to slow its economy may help to reduce global inflationary pressures, which could contribute to improved economic conditions in the United States. We also expect the Federal Reserve Board to reduce short-term interest rates further, and the federal government may adopt a fiscal stimulus package designed to bolster the U.S. economy.We believe the fund is well positioned for this environment, and we have continued to identify what we believe to be attractive opportunities for growth.
January 15, 2008
| 1 | | Total return includes reinvestment of dividends and any capital gains paid, and does not take into |
| | | consideration the maximum initial sales charges in the case of Class A and Class T shares, or the |
| | | applicable contingent deferred sales charges imposed on redemptions in the case of Class B and |
| | | Class C shares. Had these charges been reflected, returns would have been lower. Past performance |
| | | is no guarantee of future results. Share price and investment return fluctuate such that upon |
| | | redemption, fund shares may be worth more or less than their original cost.The return figure |
| | | provided for the fund’s Class I shares reflects the absorption of certain fund expenses by Founders |
| | | pursuant to an agreement that will extend through at least August 31, 2008, and will not be |
| | | terminated without prior notice to the fund’s Board of Directors.The return figure provided for the |
| | | fund’s Class T shares reflects the absorption of certain fund expenses by an affiliate of Founders |
| | | pursuant to an agreement that terminated on August 31, 2007. Had these expenses not been |
| | | absorbed, the fund’s Class I and Class T share returns would have been lower. |
| 2 | | SOURCE: LIPPER, INC. — The Russell 1000 Growth Index is a widely accepted, |
| | | unmanaged large-cap index that measures the performance of those Russell 1000 Index |
| | | companies with higher price-to-book ratios and higher forecasted growth values.The total return |
| | | figure cited for this index assumes change in security prices and reinvestment of dividends, but does |
| | | not reflect the costs of managing a mutual fund. |
The Fund 5
FUND PERFORMANCE
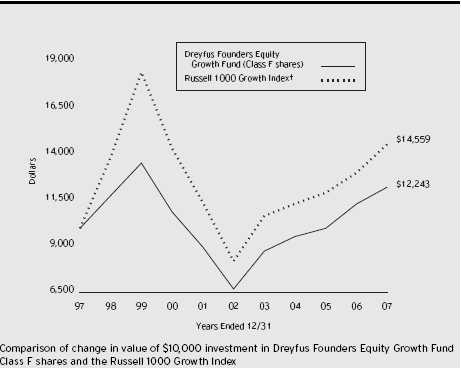
† Source: Lipper Inc.
Past performance is not predictive of future performance.
The above graph compares a $10,000 investment made in Class F shares of Dreyfus Founders Equity Growth Fund on 12/31/97 to a $10,000 investment made in the Russell 1000 Growth Index (the “Index”) on that date. All dividends and capital gain distributions are reinvested. Performance for Class A, Class B, Class C, Class I and Class T shares will vary from the performance of Class F shares shown above due to differences in charges and expenses. The fund’s performance shown in the line graph takes into account all applicable Class F fees and expenses (after any expense reimbursements).The Index is an unmanaged index which measures the performance of those Russell 1000 companies with higher price-to-book ratios and higher forecasted growth values. Unlike a mutual fund, the Index is not subject to charges, fees and other expenses. Investors cannot invest directly in any index. Further information relating to fund performance, including expense reimbursements, if applicable, is contained in the Financial Highlights section of the prospectus and elsewhere in this report.
6
| Average Annual Total Returns as of 12/31/07 | | | | | | |
| |
| | | Inception | | | | | | | | From |
| | | Date | | 1 Year | | 5 Years | | 10 Years | | Inception |
| |
| |
| |
| |
| |
|
| Class A shares | | | | | | | | | | |
| with maximum sales charge (5.75%) | | 12/31/99 | | 1.59% | | 11.19% | | — | | (2.35)% |
| without sales charge | | 12/31/99 | | 7.81% | | 12.51% | | — | | (1.63)% |
| Class B shares | | | | | | | | | | |
| with applicable redemption charge † | | 12/31/99 | | 2.72% | | 11.32% | | — | | (2.06)%†† |
| without redemption | | 12/31/99 | | 6.72% | | 11.58% | | — | | (2.06)%†† |
| Class C shares | | | | | | | | | | |
| with applicable redemption charge ††† | | 12/31/99 | | 6.21% | | 11.72% | | — | | (2.41)% |
| without redemption | | 12/31/99 | | 7.21% | | 11.72% | | — | | (2.41)% |
| Class F shares | | 7/5/38 | | 8.14% | | 12.78% | | 2.05% | | N/A |
| Class I shares | | 12/31/99 | | 8.09% | | 12.82% | | — | | (1.36)% |
| Class T shares | | | | | | | | | | |
| with applicable sales charge (4.5%) | | 12/31/99 | | 1.40% | | 10.28% | | — | | (3.03)% |
| without sales charge | | 12/31/99 | | 6.24% | | 11.30% | | — | | (2.47)% |
Past performance is not predictive of future performance.The fund’s performance shown in the graph and table does not reflect the deduction of taxes that a shareholder would pay on fund distributions or the redemption of fund shares, but does reflect expense reimbursements for certain share classes.
| † | | The maximum contingent deferred sales charge for Class B shares is 4%. After six years Class B shares convert to |
| | | Class A shares. |
| †† | | Assumes the conversion of Class B shares to Class A shares at the end of the sixth year following the date of |
| | | purchase. |
| ††† | | The maximum contingent deferred sales charge for Class C shares is 1% for shares redeemed within one year of the |
| | | date of purchase. |
The Fund 7
UNDERSTANDING YOUR FUND’S EXPENSES (Unaudited)
As a mutual fund investor, you pay ongoing expenses, such as management fees and other expenses. Using the information below, you can estimate how these expenses affect your investment and compare them with the expenses of other funds.You also may pay one-time transaction expenses, including sales charges (loads) and redemption fees, which are not shown in this section and would have resulted in higher total expenses. For more information, see your fund's prospectus or talk to your financial advisor.
Review your fund’s expenses
The table below shows the expenses you would have paid on a $1,000 investment in Dreyfus Founders Equity Growth Fund from July 1, 2007 to December 31, 2007. It also shows how much a $1,000 investment would be worth at the close of the period, assuming actual returns and expenses.To estimate the expenses you paid on your account over this period, simply divide your account value by $1,000 (for example, an $8,600 account value divided by $1,000 = 8.60), then multiply the results by the number in the Expenses paid per $1,000 line for the class of shares you own.
Expenses and Value of a $1,000 Investment
assuming actual returns for the six months ended December 31, 2007
|
| | | Class A | | Class B | | Class C | | Class F | | Class I | | Class T |
| |
| |
| |
| |
| |
| |
|
| Expenses paid | | | | | | | | | | | | |
| per $1,000 † | | $ 6.03 | | $ 11.56 | | $ 9.89 | | $ 4.90 | | $ 4.85 | | $ 12.67 |
| Ending value | | | | | | | | | | | | |
| (after expenses) | | $1,026.10 | | $1,020.80 | | $1,022.90 | | $1,027.00 | | $1,026.20 | | $1,019.40 |
COMPARING YOUR FUND’S EXPENSES
WITH THOSE OF OTHER FUNDS (Unaudited)
|
Using the SEC’s method to compare expenses
The Securities and Exchange Commission (SEC) has established guidelines to help investors assess fund expenses. Per these guidelines, the table below shows your fund’s expenses based on a $1,000 investment, assuming a hypothetical 5% annualized return. You can use this information to compare the ongoing expenses (but not transaction expenses or total cost) of investing in the fund with those of other funds.All mutual fund shareholder reports will provide this information to help you make this comparison. Please note that you cannot use this information to estimate your actual ending account balance and expenses paid during the period.
Expenses and Value of a $1,000 Investment
assuming a hypothetical 5% annualized return for the six months ended December 31, 2007
|
| | | Class A | | Class B | | Class C | | Class F | | Class I | | Class T |
| |
| |
| |
| |
| |
| |
|
| Expenses paid | | | | | | | | | | | | |
| per $1,000 † | | $ 6.01 | | $ 11.52 | | $ 9.86 | | $ 4.89 | | $ 4.84 | | $ 12.63 |
| Ending value | | | | | | | | | | | | |
| (after expenses) | | $1,019.26 | | $1,013.76 | | $1,015.43 | | $1,020.37 | | $1,020.42 | | $1,012.65 |
| † Expenses are equal to the fund’s annualized expense ratio of 1.18% for Class A shares, 2.27% for Class B shares, |
| 1.94% for Class C shares, .96% for Class F shares, .95% for Class I shares and 2.49% for Class T shares; |
| multiplied by the average account value over the period, multiplied by 184/365 (to reflect the one-half year period). |
8
STATEMENT OF INVESTMENTS
December 31, 2007
|
| Common Stocks—97.8% | | Shares | | Value ($) |
| |
| |
|
| Advertising—.9% | | | | |
| Omnicom Group | | 110,386 | | 5,246,647 |
| Air Freight & Logistics—.6% | | | | |
| FedEx | | 37,777 | | 3,368,575 |
| Apparel Retail—3.6% | | | | |
| Gap | | 632,615 | | 13,462,047 |
| Urban Outfitters | | 249,899 a | | 6,812,247 |
| | | | | 20,274,294 |
| Application Software—.6% | | | | |
| Autodesk | | 63,136 a | | 3,141,647 |
| Asset Management & Custody Banks—1.7% | | |
| Janus Capital Group | | 134,749 | | 4,426,505 |
| State Street | | 60,014 | | 4,873,137 |
| | | | | 9,299,642 |
| Automotive Retail—1.7% | | | | |
| Advance Auto Parts | | 258,056 | | 9,803,547 |
| Biotechnology—4.1% | | | | |
| Amylin Pharmaceuticals | | 182,129 a | | 6,738,773 |
| Genentech | | 93,794 a | | 6,290,764 |
| Gilead Sciences | | 215,766 a | | 9,927,394 |
| | | | | 22,956,931 |
| Broadcasting & Cable TV—.5% | | | | |
| Discovery Holding, Cl. A | | 116,072 a | | 2,918,050 |
| Casinos & Gaming—.8% | | | | |
| International Game Technology | | 96,923 | | 4,257,827 |
| Communications Equipment—5.1% | | |
| Cisco Systems | | 559,154 a | | 15,136,299 |
| Corning | | 260,795 | | 6,256,472 |
| Juniper Networks | | 221,028 a | | 7,338,130 |
| | | | | 28,730,901 |
| Computer & Electronics Retail—1.5% | | |
| Best Buy | | 159,989 | | 8,423,421 |
| Computer Hardware—5.1% | | | | |
| Apple | | 75,030 a | | 14,861,942 |
| Hewlett-Packard | | 210,117 | | 10,606,706 |
| Teradata | | 116,592 a | | 3,195,787 |
| | | | | 28,664,435 |
The Fund 9
STATEMENT OF INVESTMENTS (continued)
| Common Stocks (continued) | | Shares | | Value ($) |
| |
| |
|
| Computer Storage & Peripherals—1.0% | | |
| EMC | | 315,945 a | | 5,854,461 |
| Department Stores—.8% | | | | |
| Nordstrom | | 119,659 | | 4,395,075 |
| Diversified Chemicals—.8% | | | | |
| E.I. du Pont de Nemours & Co. | | 96,830 | | 4,269,235 |
| Educational Services—.7% | | | | |
| DeVry | | 71,155 | | 3,697,214 |
| Environmental & Facilities Services—1.4% | | |
| Waste Management | | 242,280 | | 7,915,288 |
| Food Retail—1.8% | | | | |
| Whole Foods Market | | 249,158 | | 10,165,646 |
| Health Care Equipment—.5% | | | | |
| Medtronic | | 56,184 | | 2,824,370 |
| Home Entertainment Software—2.2% | | |
| Electronic Arts | | 210,432 a | | 12,291,333 |
| Home Improvement Retail—.8% | | | | |
| Home Depot | | 161,988 | | 4,363,957 |
| Household Products—1.8% | | | | |
| Colgate-Palmolive | | 64,265 | | 5,010,099 |
| Procter & Gamble | | 68,703 | | 5,044,174 |
| | | | | 10,054,273 |
| Hypermarkets & Super Centers—3.6% | | |
| Costco Wholesale | | 70,139 | | 4,892,897 |
| Wal-Mart Stores | | 320,538 | | 15,235,171 |
| | | | | 20,128,068 |
| Industrial Conglomerates—3.0% | | | | |
| General Electric | | 455,182 | | 16,873,597 |
| Integrated Oil & Gas—4.3% | | | | |
| Chevron | | 64,253 | | 5,996,732 |
| Exxon Mobil | | 196,778 | | 18,436,131 |
| | | | | 24,432,863 |
| Integrated Telecommunication Services—.8% | | |
| Verizon Communications | | 96,988 | | 4,237,406 |
| Internet Retail—1.7% | | | | |
| Amazon.com | | 29,096 a | | 2,695,453 |
| eBay | | 211,597 a | | 7,022,904 |
| | | | | 9,718,357 |
10
| Common Stocks (continued) | | Shares | | Value ($) |
| |
| |
|
| Internet Software & Services—3.7% | | | | |
| Google, Cl. A | | 21,428 a | | 14,817,033 |
| Yahoo! | | 254,994 a | | 5,931,160 |
| | | | | 20,748,193 |
| Investment Banking & Brokerage—3.0% | | | | |
| Charles Schwab | | 454,275 | | 11,606,726 |
| Goldman Sachs Group | | 24,740 | | 5,320,337 |
| | | | | 16,927,063 |
| IT Consulting & Other Services—.7% | | | | |
| Accenture, Cl. A | | 111,873 | | 4,030,784 |
| Leisure Facilities—.8% | | | | |
| Royal Caribbean Cruises | | 106,609 | | 4,524,486 |
| Life & Health Insurance—1.6% | | | | |
| Unum Group | | 371,429 | | 8,836,296 |
| Life Sciences Tools & Services—3.2% | | | | |
| Pharmaceutical Product Development | | 163,291 | | 6,592,058 |
| Thermo Fisher Scientific | | 200,831 a | | 11,583,932 |
| | | | | 18,175,990 |
| Movies & Entertainment—.7% | | | | |
| Walt Disney | | 120,593 | | 3,892,742 |
| Oil & Gas Equipment & Services—2.0% | | | | |
| Halliburton | | 119,589 | | 4,533,619 |
| Schlumberger | | 69,200 | | 6,807,204 |
| | | | | 11,340,823 |
| Oil & Gas Exploration & Production—.9% | | | | |
| Ultra Petroleum | | 72,434 a | | 5,179,031 |
| Oil & Gas Refining & Marketing—1.1% | | | | |
| Sunoco | | 42,420 | | 3,072,905 |
| Tesoro | | 62,756 | | 2,993,461 |
| | | | | 6,066,366 |
| Other Diversified Financial Services—1.0% | | |
| Citigroup | | 187,244 | | 5,512,463 |
| Packaged Foods & Meats—3.1% | | | | |
| Cadbury Schweppes, ADR | | 118,943 | | 5,872,216 |
| Dean Foods | | 214,767 | | 5,553,875 |
| Kraft Foods, Cl. A | | 175,977 | | 5,742,130 |
| | | | | 17,168,221 |
The Fund 11
STATEMENT OF INVESTMENTS (continued)
| Common Stocks (continued) | | Shares | | Value ($) |
| |
| |
|
| Personal Products—2.2% | | | | |
| Avon Products | | 201,511 | | 7,965,730 |
| Estee Lauder, Cl. A | | 96,080 | | 4,190,049 |
| | | | | 12,155,779 |
| Pharmaceuticals—5.9% | | | | |
| Allergan | | 148,750 | | 9,555,700 |
| Covance | | 28,372 a | | 2,457,583 |
| Johnson & Johnson | | 44,183 | | 2,947,006 |
| Merck & Co. | | 139,374 | | 8,099,023 |
| Pfizer | | 170,290 | | 3,870,692 |
| Schering-Plough | | 240,845 | | 6,416,111 |
| | | | | 33,346,115 |
| Property & Casualty Insurance—.3% | | |
| MBIA | | 78,474 | | 1,461,971 |
| Railroads—.7% | | | | |
| Canadian National Railway | | 85,842 | | 4,028,565 |
| Restaurants—.7% | | | | |
| Starbucks | | 187,504 a | | 3,838,207 |
| Semiconductor Equipment—2.0% | | | | |
| KLA-Tencor | | 98,475 | | 4,742,556 |
| MEMC Electronic Materials | | 72,180 a | | 6,387,208 |
| | | | | 11,129,764 |
| Semiconductors—3.2% | | | | |
| Broadcom, Cl. A | | 238,940 a | | 6,245,891 |
| Intersil, Cl. A | | 106,362 | | 2,603,742 |
| Marvell Technology Group | | 317,046 a | | 4,432,303 |
| Maxim Integrated Products | | 183,435 | | 4,857,359 |
| | | | | 18,139,295 |
| Specialized Finance—.8% | | | | |
| CME Group | | 6,912 | | 4,741,632 |
| Specialty Chemicals—.6% | | | | |
| Ecolab | | 61,871 | | 3,168,414 |
| Systems Software—6.8% | | | | |
| Adobe Systems | | 219,876 a | | 9,395,301 |
| Microsoft | | 831,077 | | 29,586,341 |
| | | | | 38,981,642 |
12
| Common Stocks (continued) | | Shares | | Value ($) |
| |
| |
|
| Tobacco—1.4% | | | | |
| Altria Group | | 106,540 | | 8,052,293 |
| Total Common Stocks | | | | |
| (cost $489,269,013) | | | | 549,753,195 |
| |
| |
|
| |
| Exchange Traded Funds—2.1% | | | | |
| |
| |
|
| iShares Russell 1000 Growth Index Fund | | 69,444 | | 4,220,806 |
| Powershares QQQ | | 87,759 | | 4,496,771 |
| Standard & Poor’s Depository | | | | |
| Receipts (Tr. Ser. 1) | | 22,142 | | 3,237,382 |
| Total Exchange Traded Funds | | | | |
| (cost $9,780,091) | | | | 11,954,959 |
| |
| |
|
| |
| Other Investment—.5% | | | | |
| |
| |
|
| Registered Investment Company; | | | | |
| Dreyfus Institutional Preferred | | | | |
| Plus Money Market Fund | | | | |
| (cost $3,078,000) | | 3,078,000 b | | 3,078,000 |
| |
| |
|
| |
| Total Investments (cost $502,127,104) | | 100.4% | | 564,786,154 |
| Liabilities, Less Cash and Receivables | | (.4%) | | (2,012,757) |
| Net Assets | | 100.0% | | 562,773,397 |
| ADR—American Depository Receipts |
| a | | Non-income producing security. |
| b | | Investment in affiliated money market mutual fund. |
| Portfolio Summary | | (Unaudited) † | | | | |
| |
| | | Value (%) | | | | Value (%) |
| |
| |
| |
|
| Information Technology | | 30.6 | | Industrials | | 5.7 |
| Consumer Discretionary | | 15.2 | | Materials | | 1.3 |
| Consumer Staples | | 13.8 | | Telecommunications Services | | .8 |
| Health Care | | 13.7 | | Other | | 2.1 |
| Energy | | 8.4 | | Money Market Investments | | .5 |
| Financials | | 8.3 | | | | 100.4 |
| † Based on net assets. |
| See notes to financial statements. |
The Fund 13
| | STATEMENT OF ASSETS AND LIABILITIES
December 31, 2007
|
| | | Cost | | Value |
| |
| |
|
| Assets ($): | | | | |
| Investments in securities—See Statement of Investments: | | |
| Unaffiliated issuers | | 499,049,104 | | 561,708,154 |
| Affiliated issuers | | 3,078,000 | | 3,078,000 |
| Cash | | | | 344,524 |
| Dividends and interest receivable | | | | 658,519 |
| Receivable for shares of Common Stock subscribed | | 164,460 |
| Prepaid expenses | | | | 69,395 |
| Other assets | | | | 14,407 |
| | | | | 566,037,459 |
| |
| |
|
| Liabilities ($): | | | | |
| Due to Founders Asset Management LLC and affiliates—Note 3(c) | | 617,733 |
| Payable for shares of Common Stock redeemed | | 1,975,719 |
| Accrued expenses | | | | 656,203 |
| Directors’ deferred compensation | | | | 14,407 |
| | | | | 3,264,062 |
| |
| |
|
| Net Assets ($) | | | | 562,773,397 |
| |
| |
|
| Composition of Net Assets ($): | | | | |
| Paid-in capital | | | | 1,192,320,559 |
| Accumulated undistributed investment income—net | | 183,242 |
| Accumulated net realized gain (loss) on investments | | (692,389,613) |
| Accumulated net unrealized appreciation | | |
| (depreciation) on investments | | | | 62,659,209 |
| |
| |
|
| Net Assets ($) | | | | 562,773,397 |
| Net Asset Value Per Share | | | | | | | | | | |
| | | Class A | | Class B | | Class C | | Class F | | Class I | | Class T |
| |
| |
| |
| |
| |
| |
|
| Net Assets ($) | | 317,753,343 | | 1,854,804 | | 8,628,161 | | 231,030,032 | | 3,434,019 | | 73,038 |
| Shares | | | | | | | | | | | | |
| Outstanding | | 51,676,626 | | 315,422 | | 1,488,659 | | 36,554,059 | | 547,233 | | 12,608 |
| |
| |
| |
| |
| |
| |
|
| Net Asset Value | | | | | | | | | | | | |
| Per Share ($) | | 6.15 | | 5.88 | | 5.80 | | 6.32 | | 6.28 | | 5.79 |
See notes to financial statements.
14
STATEMENT OF OPERATIONS
Year Ended December 31, 2007
|
| Investment Income ($): | | |
| Income: | | |
| Dividends (net of $15,073 foreign taxes withheld at source): | | |
| Unaffiliated issuers | | 5,107,292 |
| Affiliated issuers | | 349,839 |
| Interest | | 1,146 |
| Total Income | | 5,458,277 |
| Expenses: | | |
| Management fee—Note 3(a) | | 2,312,574 |
| Shareholder servicing costs—Note 3(c) | | 870,623 |
| Professional fees | | 203,022 |
| Accounting fees—Note 3(c) | | 194,482 |
| Distribution fees—Note 3(b) | | 169,665 |
| Directors’ fees and expenses—Note 3(d) | | 121,704 |
| Prospectus and shareholders’ reports | | 89,419 |
| Registration fees | | 64,746 |
| Custodian fees—Note 3(c) | | 12,856 |
| Interest expense—Note 2 | | 9,983 |
| Loan commitment fees—Note 2 | | 2,760 |
| Miscellaneous | | 52,061 |
| Total Expenses | | 4,103,895 |
| Less—reduction in custody fees due to earnings credits—Note 1(c) | | (6,476) |
| Less—reduction in accounting fees—Note 3(c) | | (6,045) |
| Less—expense offset to broker commissions—Note 1 | | (4,140) |
| Less—reimbursed/waived expenses—Note 3(a,c) | | (3,249) |
| Net Expenses | | 4,083,985 |
| Investment Income—Net | | 1,374,292 |
| |
|
| Realized and Unrealized Gain (Loss) on Investments—Note 4 ($): |
| Net realized gain (loss) on investments | | 25,187,025 |
| Net unrealized appreciation (depreciation) on investments | | 34,892,854 |
| Net Realized and Unrealized Gain (Loss) on Investments | | 60,079,879 |
| Net Increase in Net Assets Resulting from Operations | | 61,454,171 |
See notes to financial statements.
The Fund 15
STATEMENT OF CHANGES IN NET ASSETS
| | | Year Ended December 31, |
| |
|
| | | 2007 a | | 2006 |
| |
| |
|
| Operations ($): | | | | |
| Investment income—net | | 1,374,292 | | 406,416 |
| Net realized gain (loss) on investments | | 25,187,025 | | 13,557,877 |
| Net unrealized appreciation | | | | |
| (depreciation) on investments | | 34,892,854 | | 13,579,976 |
| Net Increase (Decrease) in Net Assets | | | | |
| Resulting from Operations | | 61,454,171 | | 27,544,269 |
| |
| |
|
| Dividends to Shareholders from ($): | | | | |
| Investment income—net: | | | | |
| Class A shares | | (878,882) | | (7,353) |
| Class F shares | | (620,830) | | (233,077) |
| Class I shares | | (17,203) | | (83) |
| Total Dividends | | (1,516,915) | | (240,513) |
| |
| |
|
| Capital Stock Transactions ($): | | | | |
| Net proceeds from shares sold: | | | | |
| Class A shares | | 7,855,890 | | 3,804,434 |
| Class B shares | | 762,769 | | 300,494 |
| Class C shares | | 3,832,820 | | 1,664,484 |
| Class F shares | | 33,401,508 | | 3,481,474 |
| Class I shares | | 2,016,371 | | 4,416 |
| Class T shares | | 18,827 | | 13,106 |
| Net assets received in connection | | | | |
| with reorganization—Note 1 | | 321,813,313 | | — |
| Dividends reinvested: | | | | |
| Class A shares | | 842,144 | | 6,396 |
| Class F shares | | 550,314 | | 203,321 |
| Class I shares | | 17,203 | | 80 |
| Cost of shares redeemed: | | | | |
| Class A shares | | (53,185,837) | | (944,270) |
| Class B shares | | (1,998,605) | | (829,672) |
| Class C shares | | (696,980) | | (207,635) |
| Class F shares | | (40,033,176) | | (25,345,638) |
| Class I shares | | (2,141,429) | | (195,260) |
| Class T shares | | (33,690) | | (9,431) |
| Increase (Decrease) in Net Assets | | | | |
| from Capital Stock Transactions | | 273,021,442 | | (18,053,701) |
| Total Increase (Decrease) in Net Assets | | 332,958,698 | | 9,250,055 |
| |
| |
|
| Net Assets ($): | | | | |
| Beginning of Period | | 229,814,699 | | 220,564,644 |
| End of Period | | 562,773,397 | | 229,814,699 |
| Undistributed investment income—net | | 183,242 | | 325,865 |
16
| | | Year Ended December 31, |
| |
|
| | | 2007 a | | 2006 |
| |
| |
|
| Capital Share Transactions: | | | | |
| Class A b | | | | |
| Shares sold | | 6,364,436 | | 692,697 |
| Shares issued in connection | | | | |
| with reorganization—Note 1 | | 53,224,886 | | — |
| Shares issued for dividends reinvested | | 135,176 | | 1,112 |
| Shares redeemed | | (8,817,166) | | (174,383) |
| Net Increase (Decrease) in Shares Outstanding | | 50,907,332 | | 519,426 |
| |
| |
|
| Class B b | | | | |
| Shares sold | | 44,281 | | 58,611 |
| Shares issued in connection | | | | |
| with reorganization—Note 1 | | 214,494 | | — |
| Shares redeemed | | (133,263) | | (164,527) |
| Net Increase (Decrease) in Shares Outstanding | | 125,512 | | (105,916) |
| |
| |
|
| Class C | | | | |
| Shares sold | | 692,752 | | 319,251 |
| Shares issued in connection | | | | |
| with reorganization—Note 1 | | 225,549 | | — |
| Shares redeemed | | (124,071) | | (42,390) |
| Net Increase (Decrease) in Shares Outstanding | | 794,230 | | 276,861 |
| |
| |
|
| Class F | | | | |
| Shares sold | | 5,386,838 | | 627,800 |
| Shares issued for dividends reinvested | | 85,998 | | 34,459 |
| Shares redeemed | | (6,521,388) | | (4,684,422) |
| Net Increase (Decrease) in Shares Outstanding | | (1,048,552) | | (4,022,163) |
| |
| |
|
| Class I | | | | |
| Shares sold | | 364,633 | | 823 |
| Shares issued in connection | | | | |
| with reorganization—Note 1 | | 505,107 | | — |
| Shares issued for dividends reinvested | | 2,709 | | 14 |
| Shares redeemed | | (341,865) | | (36,870) |
| Net Increase (Decrease) in Shares Outstanding | | 530,584 | | (36,033) |
| |
| |
|
| Class T | | | | |
| Shares sold | | 4,200 | | 2,545 |
| Shares issued in connection | | | | |
| with reorganization—Note 1 | | 11,934 | | — |
| Shares redeemed | | (5,765) | | (1,963) |
| Net Increase (Decrease) in Shares Outstanding | | 10,369 | | 582 |
| a | | Effective June 1, 2007, Class R shares were redesignated as Class I shares. |
| b | | During the period ended December 31, 2007, 87,792 Class B shares representing $504,513, were automatically |
| | | converted to 84,111 Class A shares and during the period ended December 31, 2006, 58,439 Class B shares |
| | | representing $298,911 were automatically converted to 56,464 Class A shares. |
| See notes to financial statements. |
The Fund 17
The following tables describe the performance for each share class for the fiscal periods indicated. All information (except portfolio turnover rate) reflects financial results for a single fund share.Total return shows how much your investment in the fund would have increased (or decreased) during each period, assuming you had reinvested all dividends and distributions.These figures have been derived from the fund’s financial statements.
| | | | | Year Ended December 31, | | |
| |
| |
| |
|
| Class A Shares | | 2007 | | 2006 | | 2005 | | 2004 | | 2003 |
| |
| |
| |
| |
| |
|
| Per Share Data ($): | | | | | | | | | | |
| Net asset value, beginning of period | | 5.72 | | 5.07 | | 4.86 | | 4.49 | | 3.44 |
| Investment Operations: | | | | | | | | | | |
| Investment income (loss)—net | | .01a | | .00a,b | | (.00)b | | .02 | | .03 |
| Net realized and unrealized | | | | | | | | | | |
| gain (loss) on investments | | .44 | | .66 | | .22 | | .36 | | 1.02 |
| Total from Investment Operations | | .45 | | .66 | | .22 | | .38 | | 1.05 |
| Distributions: | | | | | | | | | | |
| Dividends from investment income—net | | (.02) | | (.01) | | (.01) | | (.01) | | — |
| Net asset value, end of period | | 6.15 | | 5.72 | | 5.07 | | 4.86 | | 4.49 |
| |
| |
| |
| |
| |
|
| Total Return (%) c | | 7.81 | | 13.02 | | 4.46 | | 8.54 | | 30.52 |
| |
| |
| |
| |
| |
|
| Ratios/Supplemental Data (%): | | | | | | | | | | |
| Ratio of total expenses | | | | | | | | | | |
| to average net assets | | 1.19 | | 1.34 | | 1.35 | | 1.26 | | 1.49 |
| Ratio of net expenses | | | | | | | | | | |
| to average net assets | | 1.19e | | 1.34 | | 1.33 | | 1.25 | | 1.48 |
| Ratio of net investment income | | | | | | | | | | |
| (loss) to average net assets | | .14 | | .00d | | (.09) | | .38 | | (.25) |
| Portfolio Turnover Rate | | 68 | | 110 | | 126 | | 115 | | 123 |
| |
| |
| |
| |
| |
|
| Net Assets, end of period ($ x 1,000) | | 317,753 | | 4,399 | | 1,266 | | 1,180 | | 935 |
| a | | Based on average shares outstanding at each month end. |
| b | | Amount represents less than $.01 per share. |
| c | | Exclusive of sales charge. |
| d | | Amount represents less than .01%. |
| e | | The difference for the period represents less than .01%. |
| See notes to financial statements. |
18
| | | | | Year Ended December 31, | | |
| |
| |
| |
|
| Class B Shares | | 2007 | | 2006 | | 2005 | | 2004 | | 2003 |
| |
| |
| |
| |
| |
|
| Per Share Data ($): | | | | | | | | | | |
| Net asset value, beginning of period | | 5.51 | | 4.91 | | 4.74 | | 4.40 | | 3.40 |
| Investment Operations: | | | | | | | | | | |
| Investment (loss)—net | | (.04)a | | (.05)a | | (.04)a | | (.00)b | | (.01) |
| Net realized and unrealized | | | | | | | | | | |
| gain (loss) on investments | | .41 | | .65 | | .21 | | .34 | | 1.01 |
| Total from Investment Operations | | .37 | | .60 | | .17 | | .34 | | 1.00 |
| Net asset value, end of period | | 5.88 | | 5.51 | | 4.91 | | 4.74 | | 4.40 |
| |
| |
| |
| |
| |
|
| Total Return (%) c | | 6.72 | | 12.22 | | 3.59 | | 7.73 | | 29.41 |
| |
| |
| |
| |
| |
|
| Ratios/Supplemental Data (%): | | | | | | | | | | |
| Ratio of total expenses | | | | | | | | | | |
| to average net assets | | 2.24 | | 2.21 | | 2.19 | | 2.01 | | 2.30 |
| Ratio of net expenses | | | | | | | | | | |
| to average net assets | | 2.24d | | 2.21 | | 2.18 | | 2.00 | | 2.30 |
| Ratio of net investment | | | | | | | | | | |
| (loss) to average net assets | | (.76) | | (.93) | | (.97) | | (.34) | | (1.08) |
| Portfolio Turnover Rate | | 68 | | 110 | | 126 | | 115 | | 123 |
| |
| |
| |
| |
| |
|
| Net Assets, end of period ($ x 1,000) | | 1,855 | | 1,046 | | 1,453 | | 2,110 | | 1,709 |
| a | | Based on average shares outstanding at each month end. |
| b | | Amount represents less than $.01 per share. |
| c | | Exclusive of sales charge. |
| d | | The difference for the period represents less than .01%. |
| See notes to financial statements. |
The Fund 19
FINANCIAL HIGHLIGHTS (continued)
| | | | | Year Ended December 31, | | |
| |
| |
| |
|
| Class C Shares | | 2007 | | 2006 | | 2005 | | 2004 | | 2003 |
| |
| |
| |
| |
| |
|
| Per Share Data ($): | | | | | | | | | | |
| Net asset value, beginning of period | | 5.41 | | 4.82 | | 4.66 | | 4.32 | | 3.34 |
| Investment Operations: | | | | | | | | | | |
| Investment income (loss)—net | | (.03)a | | (.03)a | | (.03)a | | .04 | | .04 |
| Net realized and unrealized | | | | | | | | | | |
| gain (loss) on investments | | .42 | | .62 | | .20 | | .30 | | .94 |
| Total from Investment Operations | | .39 | | .59 | | .17 | | .34 | | .98 |
| Distributions: | | | | | | | | | | |
| Dividends from investment income—net | | — | | — | | (.01) | | — | | — |
| Net asset value, end of period | | 5.80 | | 5.41 | | 4.82 | | 4.66 | | 4.32 |
| |
| |
| |
| |
| |
|
| Total Return (%) b | | 7.21 | | 12.24 | | 3.68 | | 7.87 | | 29.34 |
| |
| |
| |
| |
| |
|
| Ratios/Supplemental Data (%): | | | | | | | | | | |
| Ratio of total expenses | | | | | | | | | | |
| to average net assets | | 1.97 | | 2.01 | | 1.98 | | 1.99 | | 2.29 |
| Ratio of net expenses | | | | | | | | | | |
| to average net assets | | 1.97c | | 2.01 | | 1.96 | | 1.99 | | 2.28 |
| Ratio of net investment | | | | | | | | | | |
| (loss) to average net assets | | (.45) | | (.69) | | (.72) | | (.24) | | (1.04) |
| Portfolio Turnover Rate | | 68 | | 110 | | 126 | | 115 | | 123 |
| |
| |
| |
| |
| |
|
| Net Assets, end of period ($ x 1,000) | | 8,628 | | 3,759 | | 2,012 | | 571 | | 357 |
| a | | Based on average shares outstanding at each month end. |
| b | | Exclusive of sales charge. |
| c | | The difference for the period represents less than .01%. |
| See notes to financial statements. |
20
| | | | | Year Ended December 31, | | |
| |
| |
| |
|
| Class F Shares | | 2007 | | 2006 | | 2005 | | 2004 | | 2003 |
| |
| |
| |
| |
| |
|
| Per Share Data ($): | | | | | | | | | | |
| Net asset value, beginning of period | | 5.86 | | 5.18 | | 4.96 | | 4.57 | | 3.50 |
| Investment Operations: | | | | | | | | | | |
| Investment income—net | | .03a | | .01a | | .00b | | .02 | | .00b |
| Net realized and unrealized | | | | | | | | | | |
| gain (loss) on investments | | .45 | | .68 | | .23 | | .39 | | 1.07 |
| Total from Investment Operations | | .48 | | .69 | | .23 | | .41 | | 1.07 |
| Distributions: | | | | | | | | | | |
| Dividends from investment income—net | | (.02) | | (.01) | | (.01) | | (.02) | | (.00)b |
| Net asset value, end of period | | 6.32 | | 5.86 | | 5.18 | | 4.96 | | 4.57 |
| |
| |
| |
| |
| |
|
| Total Return (%) | | 8.14 | | 13.25 | | 4.64 | | 8.97 | | 30.67 |
| |
| |
| |
| |
| |
|
| Ratios/Supplemental Data (%): | | | | | | | | | | |
| Ratio of total expenses | | | | | | | | | | |
| to average net assets | | 1.04 | | 1.10 | | 1.13 | | 1.06 | | 1.13 |
| Ratio of net expenses | | | | | | | | | | |
| to average net assets | | 1.04c | | 1.10 | | 1.12 | | 1.06 | | 1.13 |
| Ratio of net investment income | | | | | | | | | | |
| to average net assets | | .54 | | .20 | | .11 | | .56 | | .06 |
| Portfolio Turnover Rate | | 68 | | 110 | | 126 | | 115 | | 123 |
| |
| |
| |
| |
| |
|
| Net Assets, end of period ($ x 1,000) | | 231,030 | | 220,502 | | 215,556 | | 233,410 | | 233,333 |
| a | | Based on average shares outstanding at each month end. |
| b | | Amount represents less than $.01 per share. |
| c | | The difference for the period represents less than .01%. |
| See notes to financial statements. |
The Fund 21
FINANCIAL HIGHLIGHTS (continued)
| | | | | Year Ended December 31, | | |
| |
| |
| |
|
| Class I Shares | | 2007 a | | 2006 | | 2005 | | 2004 | | 2003 |
| |
| |
| |
| |
| |
|
| Per Share Data ($): | | | | | | | | | | |
| Net asset value, beginning of period | | 5.82 | | 5.13 | | 4.91 | | 4.53 | | 3.47 |
| Investment Operations: | | | | | | | | | | |
| Investment income—net | | .03b | | .01b | | .01 | | .03 | | .06 |
| Net realized and unrealized | | | | | | | | | | |
| gain (loss) on investments | | .45 | | .69 | | .22 | | .37 | | 1.00 |
| Total from Investment Operations | | .48 | | .70 | | .23 | | .40 | | 1.06 |
| Distributions: | | | | | | | | | | |
| Dividends from investment income—net | | (.02) | | (.01) | | (.01) | | (.02) | | — |
| Net asset value, end of period | | 6.28 | | 5.82 | | 5.13 | | 4.91 | | 4.53 |
| |
| |
| |
| |
| |
|
| Total Return (%) | | 8.09 | | 13.55 | | 4.78 | | 8.88 | | 30.55 |
| |
| |
| |
| |
| |
|
| Ratios/Supplemental Data (%): | | | | | | | | | | |
| Ratio of total expenses | | | | | | | | | | |
| to average net assets | | 1.09 | | 1.04 | | 1.10 | | 1.00 | | 1.35 |
| Ratio of net expenses | | | | | | | | | | |
| to average net assets | | .96 | | 1.04 | | 1.09 | | 1.00 | | 1.35 |
| Ratio of net investment income | | | | | | | | | | |
| to average net assets | | .48 | | .21 | | .15 | | .54 | | (.12) |
| Portfolio Turnover Rate | | 68 | | 110 | | 126 | | 115 | | 123 |
| |
| |
| |
| |
| |
|
| Net Assets, end of period ($ x 1,000) | | 3,434 | | 97 | | 270 | | 247 | | 211 |
| a | | Effective June 1, 2007, Class R shares were redignated as Class I shares. |
| b | | Based on average shares outstanding at each month end. |
| See notes to financial statements. |
22
| | | | | Year Ended December 31, | | |
| |
| |
| |
|
| Class T Shares | | 2007 | | 2006 | | 2005 | | 2004 | | 2003 |
| |
| |
| |
| |
| |
|
| Per Share Data ($): | | | | | | | | | | |
| Net asset value, beginning of period | | 5.45 | | 4.85 | | 4.72 | | 4.38 | | 3.39 |
| Investment Operations: | | | | | | | | | | |
| Investment (loss)—net | | (.06)a | | (.03)a | | (.05)a | | (.01) | | (.23) |
| Net realized and unrealized | | | | | | | | | | |
| gain (loss) on investments | | .40 | | .63 | | .18 | | .25 | | 1.22 |
| Total from Investment Operations | | .34 | | .60 | | .13 | | .24 | | .99 |
| Payment by Service Provider | | — | | — | | — | | .10b | | — |
| Net asset value, end of period | | 5.79 | | 5.45 | | 4.85 | | 4.72 | | 4.38 |
| |
| |
| |
| |
| |
|
| Total Return (%) c | | 6.24 | | 12.37 | | 2.75 | | 7.76 | | 29.20 |
| |
| |
| |
| |
| |
|
| Ratios/Supplemental Data (%): | | | | | | | | | | |
| Ratio of total expenses | | | | | | | | | | |
| to average net assets | | 2.64 | | 2.46 | | 2.59 | | 1.90 | | 2.27 |
| Ratio of net expenses | | | | | | | | | | |
| to average net assets | | 2.47 | | 1.82 | | 2.15 | | 1.90 | | 2.26 |
| Ratio of net investment | | | | | | | | | | |
| (loss) to average net assets | | (1.06) | | (.48) | | (.98) | | (.29) | | (1.11) |
| Portfolio Turnover Rate | | 68 | | 110 | | 126 | | 115 | | 123 |
| |
| |
| |
| |
| |
|
| Net Assets, end of period ($ x 1,000) | | 73 | | 12 | | 8 | | 32 | | 30 |
| a | | Based on average shares outstanding at each month end. |
| b | | A service provider reimbursed the fund’s Class T shares for losses resulting from certain sharerholder adjustments |
| | | which othwise would have reduced total return by 2.28%. |
| c | | Exclusive of sales charge. |
| See notes to financial statements. |
The Fund 23
NOTES TO FINANCIAL STATEMENTS
NOTE 1—Significant Accounting Policies:
Dreyfus Founders Equity Growth Fund (the “fund”) is a separate diversified series of Dreyfus Founders Funds, Inc. (the “Company”), which is registered under the Investment Company Act of 1940, as amended (the “Act”), as an open-end management investment company and operates as a series company currently offering six series, including the fund. The fund’s investment objective is to seek long-term growth of capital and income. Founders Asset Management LLC (“Founders”) serves as the fund’s investment adviser. During the first half of the reporting period, Founders was an indirect wholly-owned subsidiary of Mellon Financial Corporation (“Mellon Financial”).
On July 1, 2007, Mellon Financial and The Bank of New York Company, Inc. merged, forming The Bank of New York Mellon Corporation (“BNY Mellon”). As part of this transaction, Founders became an indirect, wholly-owned subsidiary of BNY Mellon.
As of the close of business on August 10, 2007, pursuant to an Agreement and Plan of Reorganization previously approved by the Dreyfus Founders Growth Fund’s shareholders, all of the assets, subject to the liabilities, of Dreyfus Founders Growth Fund (the “Growth Fund”), another series of the Company, were transferred to the fund in exchange for shares of common stock of the fund of equal value. Shareholders of Class A, Class B, Class C, Class I and Class T shares of Growth Fund received Class A, Class B, Class C, Class I and Class T shares of the fund, respectively, in each case in an equal amount to the aggregate net asset value of their investment in Growth Fund at the time of the exchange. Shareholders of Class F of Growth Fund received Class A shares of the fund in an equal amount to the aggregate net asset value of their investment in Growth Fund at the time of exchange.The net asset value of the fund’s shares on the close of business August 10, 2007, after the reorganization was $5.94 for Class A, $5.69 for Class B, $5.60 for Class C, $6.06 for Class I and $5.61 for Class T shares, and a total of 53,224,886 Class A shares, 214,494 Class
24
B shares, 225,549 Class C shares, 505,107 Class I shares and 11,934 Class T shares, representing net assets of $321,813,313 (including $31,012,525 net unrealized appreciation on investments) were issued to Growth Fund shareholders in the exchange. The exchange was a tax-free event to Growth Fund shareholders.
The Company’s Board of Directors approved the redesignation of the fund’s Class R shares as Class I shares, effective June 1, 2007.The eligibility requirements for Class I shares remained the same as for Class R shares.
MBSC Securities Corporation (the “Distributor”), the direct owner of Founders and a wholly-owned subsidiary of The Dreyfus Corporation (“Dreyfus”), an affiliate of Founders, is the distributor of the fund’s shares. The fund is authorized to issue up to 2.25 billion shares of Common Stock, par value $ .01 per share, in the following classes of shares: Class A, Class B, Class C, Class F, Class I and Class T shares. Class A and Class T shares are subject to a sales charge imposed at the time of purchase, although the shares may be purchased at net asset value (“NAV”) without a sales charge by certain categories of investors. Class B shares are subject to a contingent deferred sales charge (“CDSC”) imposed on Class B share redemptions made within six years of purchase and automatically convert to Class A shares after six years. The fund does not offer Class B shares, except in connection with dividend reinvestment and permitted exchanges of Class B shares. Class C shares are subject to a CDSC imposed on Class C shares redeemed within one year of purchase. Class F and Class I shares are sold at NAV per share. Class F shares are sold only to Class F grandfathered investors, and Class I shares are sold only to eligible institutional investors. Other differences between the classes include the services offered to and the expenses borne by each class. Income and realized and unrealized gains or losses on investments are allocated to each class of shares based on its relative net assets.
The Fund 25
NOTES TO FINANCIAL STATEMENTS (continued)
Each class of the fund bears expenses incurred specifically on its behalf and, in addition, each class bears a portion of general expenses based on the relative net assets or the number of shareholder accounts of the class.The type of expense determines the allocation method.
The Company’s Board of Directors has authorized the payment of certain fund expenses with commissions on fund portfolio transactions. These commissions reduce miscellaneous expenses and are included in the expense offset to broker commissions in the Statement of Operations.
The fund’s financial statements are prepared in accordance with U.S. generally accepted accounting principles, which require the use of management estimates and assumptions. Actual results could differ from those estimates.
The fund enters into contracts that contain a variety of indemnifications. The fund’s maximum exposure under these arrangements is unknown.The fund does not anticipate recognizing any loss related to these arrangements.
(a) Portfolio valuation: A domestic equity security listed or traded on a securities exchange or in the over-the-counter market is valued at its last sale price on the exchange or market where it is principally traded or, in the case of a security traded on NASDAQ, at its official closing price. Lacking any sales on that day, the security is valued at the current closing bid price, or by quotes from dealers making a market in the security if the closing bid price is not available, or in the case of written call options, at the mean between the highest bid and lowest asked quotations obtained from at least two securities dealers.
A foreign equity security traded on a foreign exchange is valued at the last quoted official closing price available before the time when the fund’s assets are valued, or at the last quoted sales price if the exchange does not provide an official closing price or if the foreign market has not yet closed. Lacking any sales that day, the security is valued at the current closing bid price, or by quotes from dealers making a market in the security if the closing bid price is not available. New York closing exchange rates are used to convert foreign currencies to U.S. dollars.
26
A debt security with a remaining maturity greater than 60 days at the time of purchase is valued in accordance with the evaluated bid price supplied by a pricing service approved by the Company’s Board of Directors or, if such price is not available, at the mean between the highest bid and lowest asked quotations obtained from at least two securities dealers.A debt security with a remaining maturity of 60 days or less at the time of purchase is valued at amortized cost, which approximates market value, unless it is determined that amortized cost would not represent market value, in which case the securities would be marked to market.
Registered open-end investment companies that are not traded on an exchange are valued at their NAV.
If market quotations or official closing prices are not readily available or are determined not to reflect accurately fair value, securities will be valued at their fair value as determined in good faith by the Company’s Board of Directors or pursuant to procedures approved by the Board of Directors.These situations may include instances where an event occurs after the close of the market on which a security is traded but before the fund calculates its NAV, and it is determined that the event has materially affected the value of the security. Fair value of foreign equity securities may be determined with the assistance of a pricing service using calculations based on indexes of domestic securities and other appropriate indicators, such as prices of relevant ADRs and futures contracts.
The Financial Accounting Standards Board (“FASB”) released Statement of Financial Accounting Standards No. 157 “Fair Value Measurements” (“FAS 157”). FAS 157 establishes an authoritative definition of fair value, sets out a framework for measuring fair value, and requires additional disclosures about fair-value measurements.The application of FAS 157 is required for fiscal years beginning after November 15, 2007 and interim periods within those fiscal years. Management does not believe that the application of this standard will have a material impact on the financial statements of the fund.
The Fund 27
NOTES TO FINANCIAL STATEMENTS (continued)
(b) Foreign Securities and Currency Transactions: The fund may invest at least a portion of its assets in foreign securities. Foreign securities carry more risk than U.S. securities, such as political and currency risks. In the event the fund executes a foreign security transaction, the fund may enter into a foreign currency contract to settle the foreign security transaction.The fund could be exposed to risk if counterpar-ties are unable to meet the terms of the contracts or if the value of the currency changes unfavorably to the U.S. dollar.The resultant foreign currency gain or loss from the contract is recorded as foreign currency gain or loss and is presented as such in the Statement of Operations.
The accounting records of the fund are maintained in U.S. dollars.The market values of foreign securities, currency holdings and other assets and liabilities are translated into U.S. dollars based on the current exchange rates each business day. Purchases and sales of investment securities and income and expense items denominated in foreign currencies are translated into U.S. dollar amounts on the respective dates of such transactions.
The fund does not isolate that portion of the results of operations resulting from changes in foreign exchange rates on investments from the fluctuations arising from changes in market prices of securities held. Such fluctuations are included with the net unrealized appreciation (depreciation) from investments and foreign currency translations in the Statement of Operations.
Reported net realized foreign exchange gains or losses arise from sales of foreign currencies, currency gains or losses realized between the trade and settlement dates on securities transactions, and the difference between the amounts of dividends, interest, and foreign withholding taxes recorded on the fund’s books and the U.S. dollar equivalent of the amounts actually received or paid. Net unrealized appreciation or depreciation on investments and foreign currency translation arises from changes in the values of assets and liabilities, including investments in securities held at the date of the financial statements, resulting from changes in the exchange rates and changes in market prices of securities held.
28
(c) Securities transactions and investment income: Securities transactions are recorded on a trade date basis. Realized gains and losses from securities transactions are recorded on the identified cost basis. Dividend income is recognized on the ex-dividend date and interest income, including, where applicable, accretion of discount and amortization of premium on investments, is recognized on the accrual basis.
The fund has an arrangement with the custodian bank, Mellon Bank, N.A. (“Mellon Bank”), whereby the fund receives earnings credits from the custodian when positive cash balances are maintained, which are used to offset custody fees. For financial reporting purposes, the fund includes any earnings credits as an expense offset in the Statement of Operations.
(d) Affiliated issuers: Investments in other investment companies advised by Founders or its affiliates are defined as “affiliated” in the Act.
(e) Dividends to shareholders: Dividends are recorded on the ex-dividend date. Dividends from investment income-net and dividends from net realized capital gains, if any, are normally declared and paid annually, but the fund may make distributions on a more frequent basis to comply with the distribution requirements of the Internal Revenue Code of 1986, as amended (the “Code”).To the extent that net realized capital gains can be offset by capital loss carryovers, it is the policy of the fund not to distribute such gains. Income and capital gain distributions are determined in accordance with income tax regulations, which may differ from U.S. generally accepted accounting principles.
(f) Federal income taxes: No provision has been made for federal income taxes since it is the policy of the fund to continue to comply with the requirements of Subchapter M of the Code that are applicable to regulated investment companies and to make distributions of income and capital gains sufficient to relieve it from all income taxes.The fund is treated as a separate tax entity for federal income tax purposes.
During the current year, the fund adopted FASB Interpretation No. 48 “Accounting for Uncertainty in Income Taxes” (“FIN 48”). FIN 48 provides guidance for how uncertain tax positions should be recog-
The Fund 29
NOTES TO FINANCIAL STATEMENTS (continued)
nized, measured, presented and disclosed in the financial statements. FIN 48 requires the evaluation of tax positions taken or expected to be taken in the course of preparing the fund’s tax returns to determine whether the tax positions are “more-likely-than-not” of being sustained by the applicable tax authority.Tax positions not deemed to meet the more-likely-than-not threshold would be recorded as a tax benefit or expense in the current year.The adoption of FIN 48 had no impact on the operations of the fund for the period ended December 31, 2007.
The fund is not subject to examination by U.S. Federal, State and City tax authorities for the tax years before 2004.
At December 31, 2007, the components of accumulated earnings on a tax basis were as follows: undistributed ordinary income $250,635, accumulated capital losses $690,184,176 and unrealized appreciation $60,453,613.
The accumulated capital loss carryover is available to be applied against future net securities profits, if any, realized subsequent to December 31, 2007. If not applied, $427,430,092 of the carryover expires in fiscal 2008, $212,670,448 expires in fiscal 2009 and $50,083,636 expires in fiscal 2010.
The tax characters of distributions paid to shareholders during fiscal periods ended December 31, 2007 and December 31, 2006 were as follows: ordinary income $1,516,915 and $240,513, respectively.
During the period ended December 31, 2007, as a result of permanent book to tax differences, primarily from capital loss carryover from the Growth Fund merger, the fund decreased accumulated net realized gain (loss) on investments by $648,660,462 and increased paid in capital by the same amount. Net assets and net asset values were not affected by this reclassification.
NOTE 2—Bank Line of Credit:
The Company has a line of credit arrangement (“LOC”) with State Street Bank and Trust Company, to be used for temporary or emer-
30
gency purposes, primarily for financing redemption payments. The borrowings by each series of the Company are limited to the lesser of (a) $25 million, or (b) the lesser of 25% of the series’ total net assets or the maximum amount which the series is permitted to borrow pursuant to the prospectus, any law or any other agreement. Combined borrowings are subject to the $25 million cap on the total LOC. Each series agrees to pay annual fees and interest on the unpaid balance based on prevailing market rates as defined in the LOC.
The average daily amount of borrowings outstanding under the LOC during the period ended December 31, 2007, was approximately $175,000, with a related weighted average annualized interest rate of 5.70% .
NOTE 3—Investment Advisory Fee and Other Transactions With Affiliates:
(a) In accordance with an investment advisory agreement between the Company and Founders, the fund compensates Founders for its services as investment adviser by the payment of fees computed daily and paid monthly at the annual rate equal to a percentage of the average daily value of the fund’s net assets. The fee is .65% of the first $250 million of net assets, .60% of the next $250 million of net assets, .55% of the next $250 million of net assets and .50% of net assets in excess of $750 million.
Effective August 10, 2007, Founders agreed to limit the total annual fund operating expenses of the fund’s Class I Shares to 0.97% of the Class I average daily net assets.This commitment will extend through at least August 31, 2008, and will not be terminated without prior notice to the Company’s board of directors.The reduction amounted to $3,190 during the period ended December 31, 2007.
During the period ended December 31, 2007, the Distributor retained $3,241 and $5 from commissions earned on sales of the fund’s Class A and Class T shares, respectively, and $1,570 and $2,285 from CDSCs on redemptions of the fund’s Class B and Class C shares, respectively.
The Fund 31
NOTES TO FINANCIAL STATEMENTS (continued)
(b) Under a Distribution Plan (the “Class B, C and T Plan”) adopted pursuant to Rule 12b-1 under the Act, Class B, Class C and Class T shares pay the Distributor for distributing their shares at an annual rate of .75% of the value of their average daily net assets of Class B and Class C shares and .25% of the value of the average daily net assets of Class T shares. During the period ended December 31, 2007, Class B, Class C and Class T shares were charged $10,169, $43,253 and $87, respectively, pursuant to the Class B, C and T Plan.
The fund also has adopted a Distribution Plan pursuant to Rule 12b-1 under the Act applicable to its Class F shares (the “Class F Plan”). Under the Class F Plan, the fund is authorized to reimburse the Distributor for expenses paid for distributing or servicing its Class F shares at an annual rate of up to .25% of the value of the average daily net assets of the fund’s Class F shares. During the period ended December 31, 2007, Class F shares were charged $116,156 pursuant to the Class F Plan.
(c) Under the Shareholder Services Plan, Class A, Class B, Class C and Class T shares pay the Distributor at an annual rate of .25% of the value of their average daily net assets for the provision of certain services. The services provided may include personal services relating to shareholder accounts, such as answering shareholder inquiries regarding the fund and providing reports and other information, and services related to the maintenance of shareholder accounts. The Distributor may make payments to Service Agents (a securities dealer, financial institution or other industry professional) in respect of these services. The Distributor determines the amounts to be paid to Service Agents. During the period ended December 31, 2007, Class A, Class B, Class C and Class T shares were charged $329,371, $3,389, $14,418 and $87, respectively, pursuant to the Shareholder Services Plan.
The Company has a shareholder services agreement with the Distributor, whereby the fund has agreed to compensate the Distributor for providing certain shareholder servicing functions to holders of Class F shares. The fund paid the Distributor a monthly fee equal, on an annual basis, to $24.00 per Class F shareholder account considered to be
32
an open account at any time during a given month. During the period ended December 31, 2007, Class F shares were charged $119,724 pursuant to this shareholder services agreement.
Dreyfus Transfer, Inc. (“DTI”), a wholly-owned subsidiary of Dreyfus, is the transfer and dividend disbursing agent for all of the fund’s share classes.With the exception of out-of-pocket charges, the fees charged by DTI with respect to the fund’s Class F shares are paid by the Distributor.The out-of-pocket charges from DTI are paid by the fund. During the period ended December 31, 2007, Class F shares were charged $5,330 for out-of-pocket transfer agent charges.
The fees charged by DTI with respect to the fund’s Class A, Class B, Class C, Class I and Class T shares are paid by the fund.These transfer agency fees, including both the per account fees paid to DTI and out-of-pocket charges, during the period ended December 31, 2007 were $106,195.
Founders previously had agreed to reimburse (or to cause its affiliates to reimburse) the Class T share class of the fund for certain transfer agency expenses pursuant to a written contractual commitment. This commitment terminated on August 31, 2007. During the period ended December 31, 2007, Class T was reimbursed $59, which reduced the amount paid to DTI to $316.
The fund compensates Mellon Bank, an affiliate of Founders, under a custody agreement for providing custodial services for the fund. During the period ended December 31, 2007, the fund was charged $12,856 pursuant to the custody agreement.
The fund also pays Mellon Bank for certain cash management services. These fees are included in the out-of-pocket transfer agency charges above.
The fund has agreed to compensate Dreyfus for providing accounting services, administration, compliance monitoring, regulatory and shareholder reporting, as well as related facilities, equipment and clerical
The Fund 33
NOTES TO FINANCIAL STATEMENTS (continued)
help.The fee is computed at the annual rate of .06% of the average daily net assets of the fund on the first $500 million, .04% of the average daily net assets of the fund on the next $500 million and .02% of the average daily net assets of the fund in excess of $1 billion, plus reasonable out-of-pocket expenses. Dreyfus has contractually agreed in writing to waive any fees received for these services to the extent they exceed its costs in providing the services and a reasonable allocation of Founders’ costs related to the support and oversight of these services. During the period ended December 31, 2007, Dreyfus waived $6,045.
The components of “Due to Founders Asset Management LLC and affiliates” in the Statement of Assets and Liabilities consist of: investment advisory fees $298,110, Rule 12b-1 distribution plan fees $10,281, shareholder services plan fees $245,390, custodian fees $2,553, transfer agency per account fees $35,890 and accounting fees $27,857, which are offset against an expense reimbursement for accounting fees in amount of $2,348.
(d) Annual retainer fees and attendance fees for the Company’s Board of Directors are allocated to each series of the Company based on net assets.The Company’s Board of Directors has adopted a deferred compensation plan for Company directors that enables directors to elect to defer receipt of all or a portion of the annual compensation that they are entitled to receive from the Company. Under the plan, the compensation deferred is invested in shares of one or more of the Company’s series.The amount paid to the director under the plan will be determined based upon the performance of the selected series.The current value of these amounts, if any, is included in Other Assets and Directors’ Deferred Compensation in the Statement of Assets and Liabilities. Changes in market value are included in the directors’ fees and expenses and the net change in unrealized appreciation (depreciation) of investments in the Statement of Operations. Deferral of directors’ fees under the plan does not affect the net assets of the fund.
34
Certain officers of the Company are also officers and/or directors of Founders or its affiliates, which pay their compensation.The affairs of the fund, including services provided by Founders, are subject to the supervision and general oversight of the Company’s Board of Directors.
NOTE 4—Securities Transactions:
The aggregate amount of purchases and sales of investment securities, excluding short-term securities and $288,963,486 of securities received pursuant to the merger with Growth Fund, during the period ended December 31, 2007, amounted to $246,688,481 and $255,457,326 respectively.
At December 31, 2007, the cost of investments for federal income tax purposes was $504,332,541; accordingly, accumulated net unrealized appreciation on investments was $60,453,613, consisting of $85,740,876 gross unrealized appreciation and $25,287,263 gross unrealized depreciation.
The Fund 35
REPORT OF INDEPENDENT REGISTERED
PUBLIC ACCOUNTING FIRM
|
Shareholders and Board of Directors
Dreyfus Founders Equity Growth Fund
|
We have audited the accompanying statement of assets and liabilities, including the statements of investments, of Dreyfus Founders Equity Growth Fund (one of the funds comprising Dreyfus Founders Funds, Inc.) as of December 31, 2007, and the related statement of operations, the statement of changes in net assets and financial highlights the year then ended. These financial statements and financial highlights are the responsibility of the Fund’s management. Our responsibility is to express an opinion on these financial statements and financial highlights based on our audit.The statement of changes in net assets for the year ended December 31, 2006 and the highlights for each of the indicated periods through December 31, 2006, were audited by other auditors whose report dated February 23, 2007, expressed an unqualified opinion on the statements and financial highlights.
We conducted our audit in accordance with the standards of the Public Company Accounting Oversight Board (United States).Those standards require that we plan and perform the audit to obtain reasonable assurance about whether the financial statements and financial highlights are free of material misstatement.We were not engaged to perform an audit of the Fund’s internal control over financial reporting. Our audits included consideration of internal control over financial reporting as a basis for designing audit procedures that are appropriate in the circumstances, but not for the purpose of expressing an opinion on the effectiveness of the Fund’s internal control over financial reporting. Accordingly, we express no such opinion. An audit also includes examining, on a test basis, evidence supporting the amounts and disclosures in the financial statements and financial highlights, assessing the accounting principles used and significant estimates made by management, and evaluating the overall financial statement presentation. Our procedures included confirmation of securities owned as of December 31, 2007 by correspondence with the custodian and others or by other appropriate auditing procedures where replies from others were not received.We believe that our audit provides a reasonable basis for our opinion.
In our opinion, the financial statements and financial highlights referred to above present fairly, in all material respects, the financial position of Dreyfus Founders Equity Growth Fund at December 31, 2007, and the results of its operations, the changes in its net assets, and financial highlights the year then ended, in conformity with U.S. generally accepted accounting principles.
| | New York, New York
February 21, 2008
|
36
IMPORTANT TAX INFORMATION (Unaudited)
For federal tax purposes, the fund hereby designates 100% of the ordinary dividends paid during the fiscal year ended December 31, 2007 as qualifying for the corporate dividends received deduction. For the fiscal year ended December 31, 2007, certain dividends paid by the fund may be subject to a maximum tax rate of 15%, as provided for by the Jobs and Growth Tax Relief Reconciliation Act of 2003. Of the distributions paid during the fiscal year, $1,516,915 represents the maximum amount that may be considered qualified dividend income. Shareholders will receive notification in January 2008 of the percentage applicable to the preparation of their 2007 income tax returns.
The Fund 37
| | FACTORS CONSIDERED IN RENEWING
THE ADVISORY AGREEMENT (Unaudited)
|
At a meeting of the board of directors of Dreyfus Founders Funds, Inc. (the “Funds” and, in reference to any one of the Funds’ portfolios, a “Fund”) held on August 15 and 16, 2007, the Funds’ directors unanimously approved the continuation of the Investment Advisory Agreement (“management agreement”) between each of the Funds and Founders Asset Management LLC, the Funds’ investment adviser (“Founders”), for a one-year term ending August 31, 2008.The board of directors of the Funds (“board”) is comprised entirely of individuals who have no affiliation with Founders or any affiliates of Founders (the “directors”).
Prior to the directors’ August 2007 meeting, Founders had provided the directors with extensive materials related to the renewal of the management agreement, including performance and expense information for other investment companies with similar investment objectives to each Fund derived from data compiled by Lipper Inc., an independent third party (“Lipper”).
During their meeting, the directors discussed the proposed continuance of the management agreement with the senior management personnel of Founders. At the conclusion of these discussions, the directors and their independent counsel met in a private session at which no representatives of Founders were present, to continue their discussion of continuance of the agreement. In determining to continue the management agreement, the directors considered all factors which they believed to be relevant, including the following:
Nature, Extent and Quality of Services Provided and to be Provided by Founders
The directors recognized that they have had the opportunity to evaluate the investment and non-investment related services which Founders and its affiliates provide to the Funds primarily through their quarterly review of all of the operations of the Funds during Fund committee and Fund board meetings held throughout the past twelve months. At each such meeting, extensive discussions of Fund operations are held with senior management personnel of Founders and a
38
large volume of documentation with respect to these operations is provided to and reviewed by the directors. Such discussions and documentation afford the directors the continual opportunity to evaluate the nature, extent, and quality of the services provided by Founders and its affiliates to the Funds.
The directors were satisfied that Founders is managing the investment of the assets of the Funds in accordance with each Fund’s respective investment objective, policies and restrictions, subject to the directors’ overall supervision.
The directors considered that Founders also provides many non-investment related services to the Funds in fulfilling its responsibilities under the management agreement.
Following their discussion and review, the directors reached the following conclusions:
- That the breadth and quality of investment advisory and other ser- vices being provided to the Funds are satisfactory, as evidenced in part by the performance records of the Funds, to which the direc- tors gave significant attention as indicated below; and
- That the directors are satisfied not only with the research, long-term portfolio management, and trading services being provided to the Funds, but also recognize that Founders or its affiliates have provided the highest quality accounting, compliance and regulatory, adminis- trative, underwriting, custody, shareholder, transfer agent and cash management services to the Funds, while charging fair, reasonable and competitive fees.
Investment Performance
On a quarterly basis, the directors hold meetings with representatives of the portfolio management team for each Fund (usually a portfolio manager), during which each representative reviews, among other items, performance information, attribution analyses, and the portfolio manager’s investment outlook. The directors also receive written monthly and quarterly performance information for each Fund.These
The Fund 39
| | FACTORS CONSIDERED IN RENEWING THE
ADVISORY AGREEMENT (Unaudited) (continued)
|
written quarterly reports include comparisons of each Fund’s performance with its respective Lipper category and one or more benchmark indexes, as well as a comparable exchange-traded fund, for the most recent quarter and one-, three- and five-year periods, as well as for the portfolio manager’s tenure.
In conjunction with their consideration of renewal of the management agreement, the directors received a more detailed performance report about each Fund from Lipper.These reports compared each Fund’s performance to both a relatively small group of similar funds selected by Lipper (the “Lipper performance group”), as well as to all funds in the applicable Lipper category (the “Lipper performance universe”).
The performance of Equity Growth Fund’s Class F shares placed in the first (highest) quintile of both its Lipper performance group and the Lipper large-cap growth fund performance universe for the one-, three-and five-year periods ended December 31, 2006, placed in the top two quintiles of its Lipper performance universe for the one-, three- and five-year periods ended June 30, 2007, and outperformed its benchmark index for the three- and five-year periods ended June 30, 2007. The directors deemed these relative performance results to be very satisfactory, although the directors noted that the Fund’s relative performance to date in 2007 had deteriorated, and that the Fund’s Class F shares had underperformed its benchmark index for the one-year period ended June 30, 2007.The directors stressed the importance to Founders of the need to seek to maintain the Fund’s strong performance record.
After consideration of all relevant information and data, the directors concluded that although past performance cannot be a guaranty of future performance, each Fund and its shareholders would continue to benefit from Founders’ investment management of the Fund. The directors further determined:
- That although certain of the Funds have experienced performance difficulties, Founders has focused its efforts upon improving the performance records of the Funds and will continue to seek improvement; and
40
- That the materials provided by Lipper demonstrated that most of the Funds maintained satisfactory performance quintile rankings in their respective comparison groups and comparison universes, with five of seven Funds placing in the top two quintiles of their respec- tive Lipper performance universes for the one-year period ended December 31, 2006, and four placing in the top two quintiles for the three years ended December 31, 2006.
Costs of the Services to be Provided and Profits to be Realized by Founders and Its Affiliates from Founders’ Relationship With the Funds
The directors recognized that on a quarterly basis, they receive information with respect to each Fund’s expenses. The directors carefully review and discuss the expense ratios for all classes of shares of each Fund at each of their quarterly meetings throughout the year.
In conjunction with their annual consideration of renewal of the Funds’ management agreement and other service arrangements, the directors received detailed information from Lipper which compared each Fund’s management fees and other expenses with those of a group of similar funds selected by Lipper (the “Lipper expense group”), as well as summary information comparing each Fund’s management fees and expenses with those of the funds in its Lipper performance universe with load structures similar to that of the Funds (the “Lipper expense universe”).
The directors noted that for the period ended December 31, 2006, Equity Growth Fund’s management fees ranked in the second quintile of its Lipper expense group, with the Fund’s fees the fifth lowest of 20 “peer funds.” The Fund’s contractual management fees at a common asset level were determined by Lipper to be the fourth lowest of the 20 funds in its group.The Fund’s management fees were in the third best quintile of its Lipper expense universe.
The directors also considered information provided by Lipper with respect to the profitability of the investment management activities conducted by a number of publicly-held corporations. Lipper also pre-
The Fund 41
| | FACTORS CONSIDERED IN RENEWING THE
ADVISORY AGREEMENT (Unaudited) (continued)
|
pared an analysis providing detailed information with respect to the types of services rendered to various mutual fund complexes under their respective investment advisory contracts, including the services provided by Founders to the Funds under the management agreement.
The directors had been provided with extensive materials with respect to the profitability derived by Founders from providing investment advisory and other services to the Funds as a group and to each Fund individually.
The directors further considered certain indirect benefits received by Founders and its affiliates as a result of Founders’ provision of investment advisory services to the Funds.These included the following:
- Since Founders manages a non-Fund account in a style that is sim- ilar to that used for one of the Funds (and for portions of certain other Funds), and employees of Founders manage other non-Fund accounts in a similar style in their capacities as employees of the affiliates, Founders and its affiliates realize efficiencies in performing the portfolio management, trading and operational functions related to those non-Fund accounts;
- The Funds’ brokerage transactions may be executed with brokers that provide research and brokerage services to Founders and its affiliates. These research and brokerage services may be useful to Founders and its affiliates in providing investment advisory services to any of the clients they advise, including the Funds; and
- Affiliates of Founders receive various fees for providing accounting, underwriting, shareholder, transfer agency, custody and cash man- agement services to the Funds.
The directors also reviewed a table comparing the Equity Growth Fund and a similarly-managed subadvisory account managed by Founders, and their respective fee schedules. In their review of this table, the directors noted that Founders provides many services to the Fund in fulfilling its responsibilities under the management agreement that it does not provide to the sub-advised account.The directors con-
42
cluded that the fees paid to Founders under the management agreement are reasonable in relation to the nature and extent of the services provided by Founders to the Fund under the agreement.
After deliberation and discussion of Fund fees and expenses, the directors determined:
- That upon review of the advisory fee structures of the Funds in comparison with the competitive expense groups and expense uni- verses selected by Lipper, the levels of investment advisory fees paid by the Funds were deemed to be competitive;
- That the expense ratios of the Funds are competitive and that Founders continually reviews each Fund’s total expense ratio and has initiated voluntarily expense caps and fee waivers for certain Funds to reduce their expense ratios;
- That five of the seven Funds’ expense ratios decreased or remained the same for all or most of their share classes in 2006 as compared to those experienced in 2005, in some instances as a result of increases in Fund assets; and
- That the comparative fee and expense information included in the materials provided by Lipper supports the determination that the advisory and other fees payable by the Funds to Founders and its affiliates are essentially fees which would be similar to those that would have resulted solely from “arm’s-length” bargaining.
With respect to profitability to Founders, the directors reviewed the adviser profitability analysis provided by Lipper, which demonstrated that Founders’ 2006 profitability from providing management services to the Funds was reasonable in comparison to the entities included in the Lipper analysis.
The directors were also advised by independent counsel of the profitability percentage ranges which court cases have found acceptable and determined that Founders’ profitability percentage for providing management and other services to the Funds was reasonable.
The Fund 43
| | FACTORS CONSIDERED IN RENEWING THE
ADVISORY AGREEMENT (Unaudited) (continued)
|
The directors concluded that Founders’ profits from providing management services to the Funds were reasonable in relationship to the overall services which Founders provides.
Economies of Scale
The directors reviewed information provided by Founders which summarized the extent, if any, that both Founders and the Funds would achieve certain economies of scale if the assets of the Funds were to increase.
After review and discussion, the directors considered the extent to which economies of scale and common management are shared with each Fund, including the economies that would be realized from the growth of each Fund’s assets. After such consideration, the directors determined that all of the Funds have structured breakpoints in their advisory fees, which result in fee reductions as the assets of each Fund reach defined levels, and that such fee reductions, when implemented, would benefit all of the applicable Fund’s shareholders through decreases in the Fund’s expense ratio.
Dedication to Regulatory Requirements and Restrictions
An important factor in the directors’ consideration of renewal of the Funds’ management agreement with Founders included the directors’ recognition of the dedication by Founders of stringent adherence to regulatory requirements and restrictions.The directors determined that Founders is dedicated to compliance with all applicable rules and regulations and that the systems of controls which are in place to ensure that the service providers to the Funds, including Founders, and the Funds themselves, maintain strict adherence to the law are excellent.
44
Overall Conclusions
The directors determined that they are generally satisfied with the performance of the Funds and with the quality of the advisory and other services being provided by Founders and its affiliates to the Funds. The directors recognized that efforts are being and will continue to be made to improve the Funds’ performance and to maintain Fund expense ratios at reasonable and competitive levels.
The directors concluded that continuation of the current management agreement between each Fund and Founders, which would enable each Fund to continue to receive investment advisory services from Founders, is in the best interests of each Fund and its shareholders, the services to be performed under the management agreement are services required for the operations of the Funds, Founders has provided satisfactory investment management services to the Funds in the past, and the fees for the management services which Founders will perform will be within the range of what would have been negotiated at arm’s length in light of the circumstances.
The Fund 45
YOUR BOARD REPRESENTATIVES (Unaudited)
The Board of Directors of the Company oversees all six Dreyfus Founders Funds.The business and affairs of the Company are managed under the direction of the Board. The directors serving on the Board perform their responsibilities in the manner which they reasonably believe to be in the best interests of the Funds and their shareholders.
All of the directors,as listed below,are independent directors.They are not affiliated with the Fund’s adviser, its parent company, or its affiliates.The directors have no official term of office and generally serve until they retire (normally at age 75, but subject to extension to age 80), resign, or are not re-elected.As you can see from their backgrounds, the directors have broad experience as active or former business and community leaders.
Eugene H.Vaughan, CFA, 74.Year elected to the Board: 1970
Board Chairman. Founding Chairman,Vaughan Nelson Investment Management, LP, an investment counseling firm. Director, Encore Bank, Houston. Founding Chairman, Center for Houston’s Future, a non-profit organization. Founding Chairman and former Governor, CFA Institute. Past Chairman and Trustee, Institute of Chartered Financial Analysts. Past Chairman and Director, Financial Analysts Federation. Chairman-elect, University of Texas Health Science Center.
Alan S. Danson, 68.Year elected to the Board: 1991
Private investor. Formerly, President and Director, D.H. Management, Inc., the general partner of a limited partnership with technology company holdings (1996 to 2003). Director, Gore Range Natural Science School and The Les Streeter Program, Inc., both of which are non-profit organizations.
Robert P. Mastrovita, 63.Year elected to the Board: 1998
Private investor. Chairman of a private charitable foundation (1997 to present). Formerly, Chairman and Director, Hagler, Mastrovita & Hewitt, Inc., a registered investment adviser (1982 to 1997). Member, Boston Society of Security Analysts. Trustee, Partridge Academy. Director, King Caesar Foundation.
Trygve E. Myhren, 71.Year elected to the Board: 1996
President, Myhren Media, Inc., a firm that invests in and advises media, telecommunications, Internet and software companies. Special Limited Partner and member of Investment Committee, Megunticook Funds, a venture capital firm (1998 to present). Director, AdPay, Inc.Trustee, Executive Committee and Chairman of Faculty Education Affairs Committee, the University of Denver. Trustee, Denver Art
46
Museum. Member, Colorado FORUM and Cable Television Hall of Fame. Formerly, President (1990 to 1996) and Director (1992 to 2001) of the Providence Journal Company, a diversified media and communications company. Formerly, Chairman and Chief Executive Officer of American Television and Communications Corporation (now Time Warner Cable) (1981 to 1988). Formerly, Chairman of the National Cable Television Association (1986-1987). Chief of Mission, 2006 Paralympic Games,Torino/Sestrierre, Italy.
George W. Phillips, 69.Year elected to the Board: 1998
Retired.Vice Chairman of the Board and Chairman of the Investment Committee, Children’s Medical Center of Boston. Formerly, President and Chief Executive Officer (1992 to 1997) and Director (1992 to 2002) of Warren Bancorp, Inc. Formerly, President, Chief Executive Officer and Director of Warren Five Cents Savings Bank (1992 to 1997).
Martha A. Solis-Turner, 47.Year elected to the Board: 2005
Formerly, Telecommunications Director, Wholesale Markets (1995 to 2001), and Manager (1990 to 1995), Qwest Communications International Inc. Board member and Treasurer, Mile High Montessori Early Learning Centers (2002 to present), and formerly, Board member (1995 to 2004) and Vice President (2002 to 2004), Curtis Park Community Center, both of which are non-profit organizations.
Principal Officers
J. David Officer, 59. President and Principal Executive Officer of the Funds since 2007. Chief Operating Officer,Vice Chairman and a Director of Dreyfus, and an officer of 78 investment companies (comprised of 163 portfolios) managed by Dreyfus. He has been an employee of Dreyfus since 1998.
Denise B. Kneeland, 56. Vice President of the Funds since 2008. Assistant Vice President (since 1996) and Secretary (since 2007) of the Mellon Institutional Funds Investment Trust. First Vice President and Manager, Mutual Funds Operations, BNY Mellon Asset Management (since 2006). Formerly,Vice President and Manager, Mutual Funds Operations, Standish Mellon Asset Management Company, LLC (1996 to 2001).
Kenneth R. Christoffersen, 52. Vice President of the Funds since 2008, and Secretary since 2000 (and from 1996 to 1998). Founders’ Senior Vice President -Legal, General Counsel and Secretary. Assistant Secretary of the Distributor since 2003. Employed by Founders and its predecessor company since 1996.
The Fund 47
YOUR BOARD REPRESENTATIVES (Unaudited) (continued)
Steven M. Anderson, 42.Treasurer and Principal Financial and Accounting Officer of the Funds since 2007. Vice President (since 1999), Treasurer (since 2002) and Chief Financial Officer of Mellon Institutional Funds Investment Trust. Vice President and Mutual Funds Controller, BNY Mellon Asset Management (since 2003). Formerly, Assistant Vice President and Mutual Funds Controller, Standish Mellon Asset Management Company, LLC (2000 to 2003).
Janelle E. Belcher, 49. Chief Compliance Officer of the Funds since 2004 and Assistant Secretary of the Funds since 2002. Founders’ Vice President - Compliance since 2002. Formerly, Founders’ Manager of Compliance (2000 to 2002) and Securities Compliance Examiner, Staff Accountant and Team Leader for the U.S. Securities and Exchange Commission (1990 to 2000).
David T. Buhler, 36. Assistant Secretary since 2007. Founders’ Associate General Counsel and Assistant Secretary since 2006. Formerly, Counsel for Great-West Life & Annuity Insurance Company (1997-2006), and Chief Compliance Officer for Greenwood Investments, LLC (2002 - 2006).
Robert S. Robol, 43. Assistant Treasurer since 2006. Senior Accounting Manager -Taxable Fixed Income Funds of Dreyfus, and an officer of 79 investment companies (comprised of 180 portfolios) managed by Dreyfus. Employed by Dreyfus since 1988.
Robert Salviolo, 40. Assistant Treasurer since 2007. Senior Accounting Manager -Foreign Equity Funds of Dreyfus, and an officer of 79 investment companies (comprised of 180 portfolios) managed by Dreyfus. Employed by Dreyfus since 1989.
Robert Svagna, 40. Assistant Treasurer since 2006. Senior Accounting Manager -Equity Funds of Dreyfus, and an officer of 79 investment companies (comprised of 180 portfolios) managed by Dreyfus. Employed by Dreyfus since 1990.
William G. Germenis, 37. Anti-Money Laundering Compliance Officer (“AMLCO”) for the Class A, Class B, Class C, Class I, and Class T shares of the Funds since 2002 and for the Class F shares of the Funds since 2003.Vice President and AMLCO of the Distributor and AMLCO of 75 investment companies (comprised of 176 portfolios) managed by Dreyfus. Employed by the Distributor since 1998.
The directors and officers may be contacted at Founders’ address appearing on the back cover, except for Messrs. Officer, Robol, Salviolo, Svagna and Germenis, who can be contacted at The Dreyfus Corporation, 200 Park Avenue, New York, New York 10166, and Mr. Anderson and Ms. Kneeland, who can be contacted at BNY Mellon Asset Management, One Boston Place, Boston, Massachusetts 02108. Additional information about the Company’s directors is available in the Statement of Additional Information, which can be obtained free of charge by calling 1-800-525-2440 (Class F shareholders) or 1-800-554-4611 (all other shareholders).
48
| Dreyfus Founders |
| Mid-Cap Growth Fund |
ANNUAL REPORT December 31, 2007

Save time. Save paper. View your next shareholder report online as soon as it’s available. Log into www.dreyfus.com and sign up for Dreyfus eCommunications. It’s simple and only takes a few minutes.
The views expressed in this report reflect those of the portfolio managers only through the end of the period covered and do not necessarily represent the views of Founders or any other person in the Founders organization.Any such views are subject to change at any time based upon market or other conditions and Founders disclaims any responsibility to update such views.These views may not be relied on as investment advice and, because investment decisions for a Dreyfus Founders Fund are based on numerous factors, may not be relied on as an indication of trading intent on behalf of any Dreyfus Founders Fund.
Not FDIC-Insured • Not Bank-Guaranteed • May Lose Value
| Contents |
| |
| | | THE FUND |
| |
|
| 2 | | A Letter from the Chairman |
| 3 | | Discussion of Fund Performance |
| 6 | | Fund Performance |
| 8 | | Understanding Your Fund’s Expenses |
| 8 | | Comparing Your Fund’s Expenses |
| | | With Those of Other Funds |
| 9 | | Statement of Investments |
| 13 | | Statement of Assets and Liabilities |
| 14 | | Statement of Operations |
| 15 | | Statement of Changes in Net Assets |
| 18 | | Financial Highlights |
| 24 | | Notes to Financial Statements |
| 35 | | Report of Independent Registered |
| | | Public Accounting Firm |
| 36 | | Important Tax Information |
| 37 | | Factors Considered in Renewing |
| | | the Advisory Agreement |
| 44 | | Your Board Representatives |
| |
| FOR MORE INFORMATION |
|
| | | Back Cover |
| Dreyfus Founders |
| Mid-Cap Growth Fund |

A LETTER FROM THE CHAIRMAN
Dear Shareholder:
We are pleased to present this annual report for Dreyfus Founders Mid-Cap Growth Fund, covering the 12-month period from January 1, 2007, through December 31, 2007.
Looking back, 2007 was a year of significant change for the stock market.Turmoil in the sub-prime mortgage market, declining housing values and soaring energy prices sparked a “flight to quality” in which investors reassessed their attitudes toward risk. As a result, smaller, more speculative companies that had led the stock market over the past several years lost value over the second half of the year, while shares of larger, multinational growth companies returned to favor. Many financial services and consumer discretionary companies were hurt by repercussions from the sub-prime lending crisis and economic downturn, but energy and basic materials producers generally moved higher along with underlying commodity prices.
The turbulence of 2007 reinforced a central principle of successful investing: diversification. Investors with broad exposure to the world’s stock and bond markets were better protected from the full impact of market volatility in areas that, earlier in the year, were among the bright spots at the time. As we look ahead, we believe that now is the perfect time to meet with your financial advisor, who can help you plan and diversify your investment portfolio in a way that manages the potential opportunities and risks that may continue to arise in 2008.
For information about how the fund performed during the reporting period, as well as market perspectives, we have provided a Discussion of Fund Performance given by the fund’s Portfolio Managers.
Thank you for your continued confidence and support.

2

DISCUSSION OF FUND PERFORMANCE
For the period of January 1, 2007, through December 31, 2007, as provided by Joseph S. Chin, CFA, and John B. Jares, CFA, Portfolio Managers
Fund and Market Performance Overview
Mid-capitalization stocks generally posted healthy gains in 2007, despite heightened market volatility due to a credit crisis and a slowing U.S. economy.The fund found a number of growth opportunities in this uncertain environment, outperforming its benchmark through solid stock selections in a variety of market sectors.
For the 12-month period ended December 31, 2007, Dreyfus Founders Mid-Cap Growth Fund achieved total returns of 12.77% for Class A shares, 11.84% for Class B shares, 11.96% for Class C shares, 13.03% for Class F shares, 13.11% for Class I shares, and 12.52% for Class T shares.1 In comparison, the fund’s benchmark, the Russell Midcap Growth Index, returned 11.43% over the same period.2
The Fund’s Investment Approach
The fund seeks capital appreciation by emphasizing investments in the stocks of medium-size companies with favorable growth prospects.The fund also may invest in larger or smaller companies if, in our judgment, they represent better prospects for capital appreciation. We look for companies whose fundamental strengths suggest the potential for superior earnings growth over time.We go beyond Wall Street analysis and perform intensive qualitative and quantitative in-house research to determine whether companies meet our investment criteria.
Heightened Market Volatility Erased Some Previous Gains
The U.S. stock market began 2007 with support from moderate economic growth and significant activity in private equity markets. The market’s advance stalled in mid-year, however, amid a weakening housing market and turmoil in the subprime mortgage market. Over the summer and fall, the resulting credit and liquidity crisis had spilled over into other parts of the financial markets, creating increased price volatility and reducing some of the gains achieved earlier in the year.
Our disciplined investment approach proved advantageous in this environment. Our bottom-up stock selection strategy was particularly
The Fund 3
DISCUSSION OF FUND PERFORMANCE (continued)
effective in the consumer discretionary sector, a relatively weak area for the benchmark. Executing a multi-year turnaround plan, gaming equipment manufacturer Bally Technologies gained market share and delivered significantly improved financial results. Specialty retailer Gap, Inc. advanced due to solid execution by its new management team as part of a restructuring. An underweighted allocation to this area also proved beneficial to relative performance.
An overweighted allocation and strong selection of health care stocks also produced favorable results.A provider of neonatal and maternal-fetal services, Pediatrix Medical Group, benefited from strong outsourcing trends as well as new ventures into related services. Diagnostic firm Dade Behring Holdings, which was sold by the fund, was acquired by Siemens Healthcare Diagnostics during the reporting period, sending its stock price higher.
The financials sector was greatly bruised by the credit crisis and slowing economy, but an underweighted allocation to financial stocks helped cushion some of the area’s impact.The fund also received positive contributions from individual stock selections, such as specialty property and casualty insurer Assurant, which benefited from strong underwriting practices and diverse end markets, and asset manager Northern Trust, which was aided by its exposure to strong demographic trends in custody banking. Our selection of industrials stocks, particularly those in the aerospace and defense industry, also fared well. Industrial and aerospace supplier Precision Castparts, which was sold by the fund during the reporting period, encountered rising demand for high-tolerance aerospace engine components, and B/E Aerospace received new orders for interior systems.Finally,in the technology sector,Cypress Semiconductor benefited from its participation in the growing solar energy industry.
On the other hand, an underweighted position in the energy sector, the benchmark’s best-performing sector in 2007, detracted from the fund’s relative return. In addition, our selection of energy companies did not keep pace with the benchmark.An overweight exposure coupled with weak stock selection within the telecommunications services sector also proved detrimental. NII Holdings, a provider of wireless telephone service to Latin America, experienced competitive pressures in its core market. In spite of growing demand for satellite telephony, Globalstar, which was sold during the reporting period, saw its stock price plummet as the company reported that its service may be interrupted.
4
A slightly underweighted position in the strong-performing consumer staples area also dampened the fund’s return, and our selection of consumer staples stocks lagged the benchmark. SUPERVALU, which was sold during the period, and Whole Foods Market both saw their stock values decline due to integration problems after recent acquisitions. Other underperforming stocks included hard-disk drive manufacturer Seagate Technology, which was sold during the reporting period, and which faltered due to aggressive pricing and lower demand. Incorrect revenue accounting related to in-transit inventory caused VeriFone Holdings to reduce earnings expectations, significantly eroding the value of its stock.
Uncovering Strong Stocks Regardless of Economic Backdrop
As we begin 2008, credit conditions have not improved, recession fears have intensified and investors generally have remained risk averse. In the midst of this uncertainty, we have maintained an emphasis on our bottom-up security selection strategy, which has identified a number of companies across a variety of industry groups that, in our judgment, offer solid growth potential despite current economic weakness.
January 15, 2008
| | | Part of the fund’s recent performance is attributable to positive returns from its initial public |
| | | offering (IPO) investments. There can be no guarantee that IPOs will have or continue to |
| | | have a positive effect on fund performance. |
| | | Midsize companies carry additional risks because their earnings and revenues tend to be |
| | | less predictable and their share prices more volatile than those of larger, more established |
| | | companies. The shares of midsize companies tend to trade less frequently than those of |
| | | larger, more established companies. |
| 1 | | Total return includes reinvestment of dividends and any capital gains paid, and does not take into |
| | | consideration the maximum initial sales charges in the case of Class A and Class T shares, or the |
| | | applicable contingent deferred sales charges imposed on redemptions in the case of Class B and |
| | | Class C shares. Had these charges been reflected, returns would have been lower. Past performance |
| | | is no guarantee of future results. Share price and investment return fluctuate such that upon |
| | | redemption, fund shares may be worth more or less than their original cost. |
| 2 | | SOURCE: LIPPER, INC. –The Russell Midcap Growth Index measures the performance of |
| | | the 800 smallest companies in the Russell 1000 Index with higher price-to-book ratios and |
| | | higher forecasted growth values.The total return figure cited for this index assumes change in |
| | | security prices and reinvestment of dividends, but does not reflect the costs of managing a mutual |
| | | fund.The Russell 1000 Index measures the performance of the largest 1,000 publicly traded |
| | | U.S. companies. |
The Fund 5
FUND PERFORMANCE
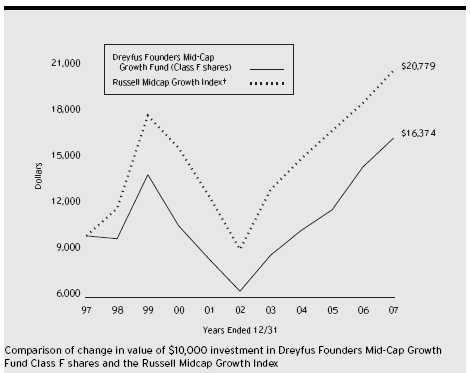
† Source: Lipper Inc.
Past performance is not predictive of future performance.
Part of the fund’s recent performance is attributable to positive returns from its initial public offering (IPO) investments. There can be no guarantee that IPOs will have or continue to have a positive effect on fund performance.
The above graph compares a $10,000 investment made in Class F shares of Dreyfus Founders Mid-Cap Growth Fund on 12/31/97 to a $10,000 investment made in the Russell Midcap Growth Index (the “Index”) on that date. All dividends and capital gain distributions are reinvested. Performance for Class A, Class B, Class C, Class I and Class T shares will vary from the performance of Class F shares shown above due to differences in charges and expenses.
The fund’s performance shown in the line graph takes into account all applicable Class F fees and expenses (after any expense reimbursements).The Index measures the performance of those companies among the 800 smallest companies in the Russell 1000 Index with higher price-to-book ratios and higher forecasted growth values.The Russell 1000 Index measures the performance of the largest 1,000 publicly traded U.S. companies. Unlike a mutual fund, the Index is not subject to charges, fees and other expenses. Investors cannot invest directly in any index. Further information relating to fund performance, including expense reimbursements, if applicable, is contained in the Financial Highlights section of the prospectus and elsewhere in this report.
6
| Average Annual Total Returns as of 12/31/07 | | | | | | |
| |
| | | Inception | | | | | | | | From |
| | | Date | | 1 Year | | 5 Years | | 10 Years | | Inception |
| |
| |
| |
| |
| |
|
| Class A shares | | | | | | | | | | |
| with maximum sales charge (5.75%) | | 12/31/99 | | 6.35% | | 19.01% | | — | | 0.94% |
| without sales charge | | 12/31/99 | | 12.77% | | 20.45% | | — | | 1.70% |
| Class B shares | | | | | | | | | | |
| with applicable redemption charge † | | 12/31/99 | | 7.84% | | 19.15% | | — | | 1.19%†† |
| without redemption | | 12/31/99 | | 11.84% | | 19.35% | | — | | 1.19%†† |
| Class C shares | | | | | | | | | | |
| with applicable redemption charge ††† | | 12/31/99 | | 10.96% | | 19.50% | | — | | 0.84% |
| without redemption | | 12/31/99 | | 11.96% | | 19.50% | | — | | 0.84% |
| Class F shares | | 9/8/61 | | 13.03% | | 20.63% | | 5.06% | | N/A |
| Class I shares | | 12/31/99 | | 13.11% | | 20.57% | | — | | 1.90% |
| Class T shares | | | | | | | | | | |
| with applicable sales charge (4.5%) | | 12/31/99 | | 7.38% | | 18.41% | | — | | 0.30% |
| without sales charge | | 12/31/99 | | 12.52% | | 19.52% | | — | | 0.88% |
Past performance is not predictive of future performance.The fund’s performance shown in the graph and table does not reflect the deduction of taxes that a shareholder would pay on fund distributions or the redemption of fund shares.
| † | | The maximum contingent deferred sales charge for Class B shares is 4%. After six years Class B shares convert to |
| | | Class A shares. |
| †† | | Assumes the conversion of Class B shares to Class A shares at the end of the sixth year following the date of |
| | | purchase. |
| ††† | | The maximum contingent deferred sales charge for Class C shares is 1% for shares redeemed within one year of the |
| | | date of purchase. |
The Fund 7
UNDERSTANDING YOUR FUND’S EXPENSES (Unaudited)
As a mutual fund investor, you pay ongoing expenses, such as management fees and other expenses. Using the information below, you can estimate how these expenses affect your investment and compare them with the expenses of other funds.You also may pay one-time transaction expenses, including sales charges (loads) and redemption fees, which are not shown in this section and would have resulted in higher total expenses. For more information, see your fund’s prospectus or talk to your financial advisor.
Review your fund’s expenses
The table below shows the expenses you would have paid on a $1,000 investment in Dreyfus Founders Mid-Cap Growth Fund from July 1, 2007 to December 31, 2007. It also shows how much a $1,000 investment would be worth at the close of the period, assuming actual returns and expenses.To estimate the expenses you paid on your account over this period, simply divide your account value by $1,000 (for example, an $8,600 account value divided by $1,000 = 8.60), then multiply the results by the number in the Expenses paid per $1,000 line for the class of shares you own.
Expenses and Value of a $1,000 Investment
assuming actual returns for the six months ended December 31, 2007
|
| | | Class A | | Class B | | Class C | | Class F | | Class I | | Class T |
| |
| |
| |
| |
| |
| |
|
| Expenses paid | | | | | | | | | | | | |
| per $1,000 † | | $ 7.42 | | $ 11.43 | | $ 10.68 | | $ 6.66 | | $ 5.71 | | $ 9.12 |
| Ending value | | | | | | | | | | | | |
| (after expenses) | | $1,001.60 | | $996.90 | | $998.50 | | $1,003.20 | | $1,003.10 | | $1,000.10 |
COMPARING YOUR FUND’S EXPENSES
WITH THOSE OF OTHER FUNDS (Unaudited)
|
Using the SEC’s method to compare expenses
The Securities and Exchange Commission (SEC) has established guidelines to help investors assess fund expenses. Per these guidelines, the table below shows your fund’s expenses based on a $1,000 investment, assuming a hypothetical 5% annualized return. You can use this information to compare the ongoing expenses (but not transaction expenses or total cost) of investing in the fund with those of other funds.All mutual fund shareholder reports will provide this information to help you make this comparison. Please note that you cannot use this information to estimate your actual ending account balance and expenses paid during the period.
Expenses and Value of a $1,000 Investment
assuming a hypothetical 5% annualized return for the six months ended December 31, 2007
|
| | | Class A | | Class B | | Class C | | Class F | | Class I | | Class T |
| |
| |
| |
| |
| |
| |
|
| Expenses paid | | | | | | | | | | | | |
| per $1,000 † | | $ 7.48 | | $ 11.52 | | $ 10.76 | | $ 6.72 | | $ 5.75 | | $ 9.20 |
| Ending value | | | | | | | | | | | | |
| (after expenses) | | $1,017.80 | | $1,013.76 | | $1,014.52 | | $1,018.55 | | $1,019.51 | | $1,016.08 |
| † Expenses are equal to the fund’s annualized expense ratio of 1.47% for Class A shares, 2.27% for Class B shares, |
| 2.12% for Class C shares, 1.32% for Class F shares, 1.13% for Class I shares and 1.81% for Class T shares; |
| multiplied by the average account value over the period, multiplied by 184/365 (to reflect the one-half year period). |
8
STATEMENT OF INVESTMENTS
December 31, 2007
|
| Common Stocks—98.5% | | Shares | | Value ($) |
| |
| |
|
| Aerospace & Defense—7.5% | | | | |
| BE Aerospace | | 150,000 a | | 7,935,000 |
| Goodrich | | 155,000 | | 10,944,550 |
| L-3 Communications Holdings | | 60,000 | | 6,356,400 |
| | | | | 25,235,950 |
| Apparel Retail—2.5% | | | | |
| Gap | | 393,000 | | 8,363,040 |
| Apparel, Accessories & Luxury Goods—2.3% | | |
| Coach | | 133,000 a | | 4,067,140 |
| Gildan Activewear | | 94,000 a | | 3,869,040 |
| | | | | 7,936,180 |
| Application Software—2.1% | | | | |
| Quest Software | | 203,000 a | | 3,743,320 |
| Synopsys | | 124,000 a | | 3,215,320 |
| | | | | 6,958,640 |
| Asset Management & Custody Banks—4.4% | | |
| Janus Capital Group | | 272,000 | | 8,935,200 |
| Northern Trust | | 78,000 | | 5,973,240 |
| | | | | 14,908,440 |
| Automotive Retail—2.2% | | | | |
| Advance Auto Parts | | 193,000 | | 7,332,070 |
| Broadcasting & Cable TV—1.0% | | | | |
| Discovery Holding, Cl. A | | 140,000 a | | 3,519,600 |
| Casinos & Gaming—2.6% | | | | |
| Bally Technologies | | 96,000 a | | 4,773,120 |
| Scientific Games, Cl. A | | 120,000 a | | 3,990,000 |
| | | | | 8,763,120 |
| Commercial Printing—1.7% | | | | |
| Cenveo | | 332,000 a | | 5,800,040 |
| Commodity Chemicals—2.2% | | | | |
| Celanese, Ser. A | | 179,000 | | 7,575,280 |
| Communications Equipment—1.4% | | |
| Foundry Networks | | 275,000 a | | 4,818,000 |
| Computer Hardware—1.1% | | | | |
| NCR | | 149,000 a | | 3,739,900 |
| Construction & Farm Machinery | | | | |
| & Heavy Trucks—1.5% | | | | |
| Cummins | | 39,000 | | 4,967,430 |
The Fund 9
STATEMENT OF INVESTMENTS (continued)
| Common Stocks (continued) | | Shares | | Value ($) |
| |
| |
|
| Data Processing & Outsourced Services—3.6% | | |
| Fiserv | | 72,000 a | | 3,995,280 |
| Metavante Technologies | | 261,000 a | | 6,086,520 |
| VeriFone Holdings | | 92,000 a | | 2,139,000 |
| | | | | 12,220,800 |
| Food Retail—.8% | | | | |
| Whole Foods Market | | 67,000 | | 2,733,600 |
| Gas Utilities—1.1% | | | | |
| Questar | | 69,000 | | 3,732,900 |
| Health Care Equipment—2.1% | | | | |
| Mentor | | 178,000 | | 6,959,800 |
| Health Care Facilities—.9% | | | | |
| Psychiatric Solutions | | 90,000 a | | 2,925,000 |
| Health Care Services—4.3% | | | | |
| Express Scripts | | 101,000 a | | 7,373,000 |
| Pediatrix Medical Group | | 103,000 a | | 7,019,450 |
| | | | | 14,392,450 |
| Home Entertainment Software—.7% | | | | |
| Take-Two Interactive Software | | 124,000 a | | 2,287,800 |
| Industrial Machinery—3.2% | | | | |
| Eaton | | 35,000 | | 3,393,250 |
| Middleby | | 95,000 a | | 7,278,900 |
| | | | | 10,672,150 |
| Leisure Facilities—1.4% | | | | |
| Royal Caribbean Cruises | | 112,000 | | 4,753,280 |
| Leisure Products—1.0% | | | | |
| Polaris Industries | | 71,000 | | 3,391,670 |
| Life Sciences Tools & Services—7.0% | | | | |
| Invitrogen | | 42,000 a | | 3,923,220 |
| MDS | | 424,600 a | | 8,258,470 |
| Pharmaceutical Product Development | | 168,000 | | 6,782,160 |
| Thermo Fisher Scientific | | 77,000 a | | 4,441,360 |
| | | | | 23,405,210 |
| Managed Health Care—1.4% | | | | |
| Health Net | | 98,000 a | | 4,733,400 |
| Metal & Glass Containers—2.1% | | | | |
| Owens-Illinois | | 144,000 a | | 7,128,000 |
10
| Common Stocks (continued) | | Shares | | Value ($) |
| |
| |
|
| Multi-Line Insurance—3.9% | | | | |
| Assurant | | 194,000 | | 12,978,600 |
| Oil & Gas Drilling—4.1% | | | | |
| Diamond Offshore Drilling | | 60,000 | | 8,520,000 |
| Noble | | 94,000 | | 5,311,940 |
| | | | | 13,831,940 |
| Oil & Gas Equipment & Services—5.5% | | |
| Cameron International | | 120,000 a | | 5,775,600 |
| Grant Prideco | | 69,000 a | | 3,830,190 |
| ION Geophysical | | 216,000 a | | 3,408,480 |
| Weatherford International | | 80,000 a | | 5,488,000 |
| | | | | 18,502,270 |
| Oil & Gas Exploration & Production—1.9% | | |
| Denbury Resources | | 214,000 a | | 6,366,500 |
| Packaged Foods & Meats—2.5% | | | | |
| Cadbury Schweppes, ADR | | 117,000 | | 5,776,290 |
| Dean Foods | | 96,000 | | 2,482,560 |
| | | | | 8,258,850 |
| Paper Packaging—.9% | | | | |
| Packaging Corp. of America | | 111,000 | | 3,130,200 |
| Pharmaceuticals—1.1% | | | | |
| Auxilium Pharmaceuticals | | 124,000 a | | 3,718,760 |
| Property & Casualty Insurance—1.6% | | |
| Employers Holdings | | 331,500 | | 5,539,365 |
| Semiconductor Equipment—3.1% | | | | |
| ASML Holding (NY Shares) | | 95,111 | | 2,976,023 |
| MEMC Electronic Materials | | 86,000 a | | 7,610,140 |
| | | | | 10,586,163 |
| Semiconductors—4.6% | | | | |
| Cypress Semiconductor | | 227,000 a | | 8,178,810 |
| Microsemi | | 172,000 a | | 3,808,080 |
| NVIDIA | | 98,500 a | | 3,350,970 |
| | | | | 15,337,860 |
| Steel—1.1% | | | | |
| Allegheny Technologies | | 43,500 | | 3,758,400 |
| Systems Software—2.0% | | | | |
| McAfee | | 178,000 a | | 6,675,000 |
The Fund 11
STATEMENT OF INVESTMENTS (continued)
| Common Stocks (continued) | | Shares | | Value ($) |
| |
| |
|
| Wireless Telecommunication Services—4.1% | | |
| American Tower, Cl. A | | 159,050 a | | 6,775,530 |
| NII Holdings | | 142,000 a | | 6,861,440 |
| | | | | 13,636,970 |
| Total Common Stocks | | | | |
| (cost $302,285,297) | | | | 331,574,628 |
| |
| |
|
| |
| Other Investment—1.5% | | | | |
| |
| |
|
| Registered Investment Company; | | | | |
| Dreyfus Institutional Preferred | | | | |
| Plus Money Market Fund | | | | |
| (cost $4,868,000) | | 4,868,000 b | | 4,868,000 |
| |
| |
|
| |
| Total Investments (cost $307,153,297) | | 100.0% | | 336,442,628 |
| Cash and Receivables (Net) | | .0% | | 153,039 |
| Net Assets | | 100.0% | | 336,595,667 |
| ADR—American Depository Receipts |
| a | | Non-income producing security. |
| b | | Investment in affiliated money market mutual fund. |
| Portfolio Summary (Unaudited) † | | | | |
| |
| | | Value (%) | | | | Value (%) |
| |
| |
| |
|
| Information Technology | | 18.6 | | Materials | | 6.4 |
| Healthcare | | 16.7 | | Telecommunications Services | | 4.0 |
| Industrials | | 13.9 | | Consumer Staples | | 3.3 |
| Consumer Discretionary | | 13.1 | | Utilities | | 1.1 |
| Energy | | 11.5 | | Money Market Investments | | 1.5 |
| Financials | | 9.9 | | | | 100.0 |
| † Based on net assets. |
| See notes to financial statements. |
12
| | STATEMENT OF ASSETS AND LIABILITIES
December 31, 2007
|
| | | Cost | | Value |
| |
| |
|
| Assets ($): | | | | |
| Investments in securities—See Statement of Investments: | | |
| Unaffiliated issuers | | 302,285,297 | | 331,574,628 |
| Affiliated issuers | | 4,868,000 | | 4,868,000 |
| Cash | | | | 277,206 |
| Receivable for investment securities sold | | 852,443 |
| Receivable for shares of Common Stock subscribed | | 730,343 |
| Dividends and interest receivable | | | | 181,953 |
| Prepaid expenses | | | | 61,687 |
| Other assets | | | | 51,515 |
| | | | | 338,597,775 |
| |
| |
|
| Liabilities ($): | | | | |
| Due to Founders Asset Management LLC and affiliates—Note 3(c) | | 521,472 |
| Payable for shares of Common Stock redeemed | | 1,175,187 |
| Directors’ deferred compensation | | | | 51,515 |
| Accrued expenses | | | | 253,934 |
| | | | | 2,002,108 |
| |
| |
|
| Net Assets ($) | | | | 336,595,667 |
| |
| |
|
| Composition of Net Assets ($): | | | | |
| Paid-in capital | | | | 308,696,594 |
| Accumulated investment (loss)—net | | | | (49,931) |
| Accumulated net realized gain (loss) on investments | | (1,346,165) |
| Accumulated net unrealized appreciation | | |
| (depreciation) on investments | | | | 29,295,169 |
| |
| |
|
| Net Assets ($) | | | | 336,595,667 |
| Net Asset Value Per Share | | | | | | | | | | |
| | | Class A | | Class B | | Class C | | Class F | | Class I | | Class T |
| |
| |
| |
| |
| |
| |
|
| Net Assets ($) | | 97,331,254 | | 2,200,047 | | 43,824,697 | | 182,335,927 | | 10,266,037 | | 637,705 |
| Shares Outstanding | | 15,492,784 | | 373,376 | | 7,514,625 | | 28,364,771 | | 1,605,445 | | 108,780 |
| |
| |
| |
| |
| |
| |
|
| Net Asset Value | | | | | | | | | | | | |
| Per Share ($) | | 6.28 | | 5.89 | | 5.83 | | 6.43 | | 6.39 | | 5.86 |
See notes to financial statements.
The Fund 13
STATEMENT OF OPERATIONS
Year Ended December 31, 2007
|
| Investment Income ($): | | |
| Income: | | |
| Dividends (net of $2,921 foreign taxes withheld at source): | | |
| Unaffiliated issuers | | 3,147,218 |
| Affiliated issuers | | 507,811 |
| Total Income | | 3,655,029 |
| Expenses: | | |
| Investment advisory fee—Note 3(a) | | 2,338,134 |
| Shareholder servicing costs—Note 3(c) | | 846,905 |
| Distribution fees—Note 3(b) | | 555,366 |
| Accounting fees—Note 3(c) | | 181,725 |
| Professional fees | | 139,741 |
| Directors’ fees and expenses—Note 3(d) | | 92,359 |
| Registration fees | | 52,439 |
| Prospectus and shareholders’ reports | | 50,933 |
| Custodian fees—Note 3(c) | | 17,284 |
| Loan commitment fees—Note 2 | | 2,711 |
| Interest expense—Note 2 | | 642 |
| Miscellaneous | | 59,541 |
| Total Expenses | | 4,337,780 |
| Less—reduction in accounting fees—Note 3(c) | | (1,806) |
| Less—reduction in custody fees due to | | |
| earnings credits—Note 1(c) | | (7,215) |
| Less—expense offset to broker commissions—Note 1 | | (4,441) |
| Net Expenses | | 4,324,318 |
| Investment (Loss)—Net | | (669,289) |
| |
|
| Realized and Unrealized Gain (Loss) on Investments—Note 4 ($): |
| Net realized gain (loss) on investments | | 22,599,861 |
| Net unrealized appreciation (depreciation) on investments | | 7,939,103 |
| Net Realized and Unrealized Gain (Loss) on Investments | | 30,538,964 |
| Net Increase in Net Assets Resulting from Operations | | 29,869,675 |
See notes to financial statements.
14
STATEMENT OF CHANGES IN NET ASSETS
| | | Year Ended December 31, |
| |
|
| | | 2007 a | | 2006 |
| |
| |
|
| Operations ($): | | | | |
| Investment (loss)—net | | (669,289) | | (963,176) |
| Net realized gain (loss) on investments | | 22,599,861 | | 20,028,137 |
| Net unrealized appreciation | | | | |
| (depreciation) on investments | | 7,939,103 | | 10,769,064 |
| Net Increase (Decrease) in Net Assets | | |
| Resulting from Operations | | 29,869,675 | | 29,834,025 |
| |
| |
|
| Dividends to Shareholders from ($): | | | | |
| Net realized gain on investments: | | | | |
| Class A shares | | (3,931,014) | | — |
| Class B shares | | (90,730) | | — |
| Class C shares | | (1,917,287) | | — |
| Class F shares | | (7,202,948) | | — |
| Class I shares | | (419,265) | | — |
| Class T shares | | (27,597) | | — |
| Total Dividends | | (13,588,841) | | — |
| |
| |
|
| Capital Stock Transactions ($): | | | | |
| Net proceeds from shares sold: | | | | |
| Class A shares | | 107,502,995 | | 37,467,252 |
| Class B shares | | 998,575 | | 518,095 |
| Class C shares | | 38,939,430 | | 8,956,013 |
| Class F shares | | 48,898,562 | | 32,755,186 |
| Class I shares | | 12,109,131 | | 5,558,800 |
| Class T shares | | 777,078 | | 71,649 |
| Dividends reinvested: | | | | |
| Class A shares | | 3,425,728 | | — |
| Class B shares | | 83,159 | | — |
| Class C shares | | 1,383,039 | | — |
| Class F shares | | 6,901,667 | | — |
| Class I shares | | 379,793 | | — |
| Class T shares | | 13,748 | | — |
The Fund 15
STATEMENT OF CHANGES IN NET ASSETS (continued)
| | | Year Ended December 31, |
| |
|
| | | 2007 a | | 2006 |
| |
| |
|
| Capital Stock Transactions ($) (continued): | | |
| Cost of shares redeemed: | | | | |
| Class A shares | | (36,607,936) | | (19,186,553) |
| Class B shares | | (936,304) | | (867,550) |
| Class C shares | | (6,603,790) | | (512,532) |
| Class F shares | | (34,226,600) | | (22,858,050) |
| Class I shares | | (6,960,515) | | (1,809,667) |
| Class T shares | | (275,605) | | (4,729) |
| Increase (Decrease) in Net Assets | | | | |
| from Capital Stock Transactions | | 135,802,155 | | 40,087,914 |
| Total Increase (Decrease) in Net Assets | | 152,082,989 | | 69,921,939 |
| |
| |
|
| Net Assets ($): | | | | |
| Beginning of Period | | 184,512,678 | | 114,590,739 |
| End of Period | | 336,595,667 | | 184,512,678 |
| Accumulated investment (loss)—net | | (49,931) | | (38,722) |
16
| | | Year Ended December 31, |
| |
|
| | | 2007 a | | 2006 |
| |
| |
|
| Capital Share Transactions: | | | | |
| Class Ab | | | | |
| Shares sold | | 17,029,336 | | 7,083,331 |
| Shares issued for dividends reinvested | | 540,173 | | — |
| Shares redeemed | | (5,725,288) | | (3,788,704) |
| Net Increase (Decrease) in Shares Outstanding | | 11,844,221 | | 3,294,627 |
| |
| |
|
| Class B b | | | | |
| Shares sold | | 166,780 | | 103,687 |
| Shares issued for dividends reinvested | | 14,000 | | — |
| Shares redeemed | | (158,357) | | (173,743) |
| Net Increase (Decrease) in Shares Outstanding | | 22,423 | | (70,056) |
| |
| |
|
| Class C | | | | |
| Shares sold | | 6,607,852 | | 1,749,691 |
| Shares issued for dividends reinvested | | 235,211 | | — |
| Shares redeemed | | (1,102,096) | | (100,366) |
| Net Increase (Decrease) in Shares Outstanding | | 5,740,967 | | 1,649,325 |
| |
| |
|
| Class F | | | | |
| Shares sold | | 7,666,480 | | 6,102,380 |
| Shares issued for dividends reinvested | | 1,065,072 | | �� |
| Shares redeemed | | (5,275,025) | | (4,250,707) |
| Net Increase (Decrease) in Shares Outstanding | | 3,456,527 | | 1,851,673 |
| |
| |
|
| Class I | | | | |
| Shares sold | | 1,897,374 | | 1,011,954 |
| Shares issued for dividends reinvested | | 58,882 | | — |
| Shares redeemed | | (1,078,755) | | (346,756) |
| Net Increase (Decrease) in Shares Outstanding | | 877,501 | | 665,198 |
| |
| |
|
| Class T | | | | |
| Shares sold | | 131,478 | | 13,519 |
| Shares issued for dividends reinvested | | 2,326 | | — |
| Shares redeemed | | (44,924) | | (979) |
| Net Increase (Decrease) in Shares Outstanding | | 88,880 | | 12,540 |
| a | | Effective June 1, 2007, Class R shares were redesignated as Class I shares. |
| b | | During the period ended December 31, 2007, 73,005 Class B shares representing $432,266 were automatically |
| | | converted to 68,997 Class A shares and during the period ended December 31, 2006, 80,660 Class B shares |
| | | representing $404,799 were automatically converted to 76,944 Class A shares. |
| See notes to financial statements. |
The Fund 17
FINANCIAL HIGHLIGHTS
The following tables describe the performance for each share class for the fiscal periods indicated. All information (except portfolio turnover rate) reflects financial results for a single fund share.Total return shows how much your investment in the fund would have increased (or decreased) during each period, assuming you had reinvested all dividends and distributions.These figures have been derived from the fund’s financial statements.
| | | | | Year Ended December 31, | | |
| |
| |
| |
|
| Class A Shares | | 2007 | | 2006 | | 2005 | | 2004 | | 2003 |
| |
| |
| |
| |
| |
|
| Per Share Data ($): | | | | | | | | | | |
| Net asset value, beginning of period | | 5.80 | | 4.68 | | 4.15 | | 3.52 | | 2.58 |
| Investment Operations: | | | | | | | | | | |
| Investment income (loss)—net | | (.02)a | | (.04)a | | (.05) | | (.03) | | .03 |
| Net realized and unrealized | | | | | | | | | | |
| gain (loss) on investments | | .76 | | 1.16 | | .58 | | .66 | | .91 |
| Total from Investment Operations | | .74 | | 1.12 | | .53 | | .63 | | .94 |
| Distributions: | | | | | | | | | | |
| Dividends from net realized | | | | | | | | | | |
| gain on investments | | (.26) | | — | | — | | — | | — |
| Net asset value, end of period | | 6.28 | | 5.80 | | 4.68 | | 4.15 | | 3.52 |
| |
| |
| |
| |
| |
|
| Total Return (%) b | | 12.77 | | 23.93 | | 12.77 | | 17.90 | | 36.43 |
| |
| |
| |
| |
| |
|
| Ratios/Supplemental Data (%): | | | | | | | | | | |
| Ratio of total expenses | | | | | | | | | | |
| to average net assets | | 1.43 | | 1.40 | | 1.58 | | 1.54 | | 1.87 |
| Ratio of net expenses | | | | | | | | | | |
| to average net assets | | 1.43c | | 1.39 | | 1.55 | | 1.53 | | 1.86 |
| Ratio of net investment (loss) | | | | | | | | | | |
| to average net assets | | (.32) | | (.68) | | (.92) | | (1.07) | | (1.38) |
| Portfolio Turnover Rate | | 165 | | 104 | | 211 | | 147 | | 160 |
| |
| |
| |
| |
| |
|
| Net Assets, end of period ($ x 1,000) | | 97,331 | | 21,146 | | 1,656 | | 1,546 | | 1,191 |
| a | | Based on average shares outstanding at each month end. |
| b | | Exclusive of sales charge. |
| c | | The difference for the period represents less than .01%. |
| See notes to financial statements. |
18
| | | | | Year Ended December 31, | | |
| |
| |
| |
|
| Class B Shares | | 2007 | | 2006 | | 2005 | | 2004 | | 2003 |
| |
| |
| |
| |
| |
|
| Per Share Data ($): | | | | | | | | | | |
| Net asset value, beginning of period | | 5.50 | | 4.48 | | 4.01 | | 3.43 | | 2.54 |
| Investment Operations: | | | | | | | | | | |
| Investment (loss)—net | | (.06)a | | (.08)a | | (.09) | | (.07) | | (.03) |
| Net realized and unrealized | | | | | | | | | | |
| gain (loss) on investments | | .71 | | 1.10 | | .56 | | .65 | | .92 |
| Total from Investment Operations | | .65 | | 1.02 | | .47 | | .58 | | .89 |
| Distributions: | | | | | | | | | | |
| Dividends from net realized | | | | | | | | | | |
| gain on investments | | (.26) | | — | | — | | — | | — |
| Net asset value, end of period | | 5.89 | | 5.50 | | 4.48 | | 4.01 | | 3.43 |
| |
| |
| |
| |
| |
|
| Total Return (%) b | | 11.84 | | 22.77 | | 11.72 | | 16.91 | | 35.04 |
| |
| |
| |
| |
| |
|
| Ratios/Supplemental Data (%): | | | | | | | | | | |
| Ratio of total expenses | | | | | | | | | | |
| to average net assets | | 2.26 | | 2.29 | | 2.43 | | 2.37 | | 2.65 |
| Ratio of net expenses | | | | | | | | | | |
| to average net assets | | 2.26c | | 2.29 | | 2.41 | | 2.37 | | 2.64 |
| Ratio of net investment (loss) | | | | | | | | | | |
| to average net assets | | (1.02) | | (1.60) | | (1.78) | | (1.90) | | (2.16) |
| Portfolio Turnover Rate | | 165 | | 104 | | 211 | | 147 | | 160 |
| |
| |
| |
| |
| |
|
| Net Assets, end of period ($ x 1,000) | | 2,200 | | 1,929 | | 1,886 | | 1,823 | | 1,587 |
| a | | Based on average shares outstanding at each month end. |
| b | | Exclusive of sales charge. |
| c | | The difference for the period represents less than .01%. |
| See notes to financial statements. |
The Fund 19
FINANCIAL HIGHLIGHTS (continued)
| | | | | Year Ended December 31, | | |
| |
| |
| |
|
| Class C Shares | | 2007 | | 2006 | | 2005 | | 2004 | | 2003 |
| |
| |
| |
| |
| |
|
| Per Share Data ($): | | | | | | | | | | |
| Net asset value, beginning of period | | 5.44 | | 4.42 | | 3.96 | | 3.38 | | 2.50 |
| Investment Operations: | | | | | | | | | | |
| Investment (loss)—net | | (.06)a | | (.06)a | | (.02) | | (.06)a | | (.10) |
| Net realized and unrealized | | | | | | | | | | |
| gain (loss) on investments | | .71 | | 1.08 | | .48 | | .64 | | .98 |
| Total from Investment Operations | | .65 | | 1.02 | | .46 | | .58 | | .88 |
| Distributions: | | | | | | | | | | |
| Dividends from net realized | | | | | | | | | | |
| gain on investments | | (.26) | | — | | — | | — | | — |
| Net asset value, end of period | | 5.83 | | 5.44 | | 4.42 | | 3.96 | | 3.38 |
| |
| |
| |
| |
| |
|
| Total Return (%) b | | 11.96 | | 23.08 | | 11.62 | | 17.16 | | 35.20 |
| |
| |
| |
| |
| |
|
| Ratios/Supplemental Data (%): | | | | | | | | | | |
| Ratio of total expenses | | | | | | | | | | |
| to average net assets | | 2.13 | | 2.19 | | 2.35 | | 2.32 | | 2.51 |
| Ratio of net expenses | | | | | | | | | | |
| to average net assets | | 2.13c | | 2.18 | | 2.32 | | 2.31 | | 2.51 |
| Ratio of net investment (loss) | | | | | | | | | | |
| to average net assets | | (1.04) | | (1.27) | | (1.69) | | (1.83) | | (2.02) |
| Portfolio Turnover Rate | | 165 | | 104 | | 211 | | 147 | | 160 |
| |
| |
| |
| |
| |
|
| Net Assets, end of period ($ x 1,000) | | 43,825 | | 9,641 | | 550 | | 428 | | 323 |
| a | | Based on average shares outstanding at each month end. |
| b | | Exclusive of sales charge. |
| c | | The difference for the period represents less than .01%. |
| See notes to financial statements. |
20
| | | | | Year Ended December 31, | | |
| |
| |
| |
|
| Class F Shares | | 2007 | | 2006 | | 2005 | | 2004 | | 2003 |
| |
| |
| |
| |
| |
|
| Per Share Data ($): | | | | | | | | | | |
| Net asset value, beginning of period | | 5.92 | | 4.78 | | 4.24 | | 3.58 | | 2.62 |
| Investment Operations: | | | | | | | | | | |
| Investment income (loss)—net | | (.00)a,b | | (.03)a | | (.12) | | (.03)a | | .02 |
| Net realized and unrealized | | | | | | | | | | |
| gain (loss) on investments | | .77 | | 1.17 | | .66 | | .69 | | .94 |
| Total from Investment Operations | | .77 | | 1.14 | | .54 | | .66 | | .96 |
| Distributions: | | | | | | | | | | |
| Dividends from net realized | | | | | | | | | | |
| gain on investments | | (.26) | | — | | — | | — | | — |
| Net asset value, end of period | | 6.43 | | 5.92 | | 4.78 | | 4.24 | | 3.58 |
| |
| |
| |
| |
| |
|
| Total Return (%) | | 13.03 | | 23.85 | | 12.74 | | 18.44 | | 36.64 |
| |
| |
| |
| |
| |
|
| Ratios/Supplemental Data (%): | | | | | | | | | | |
| Ratio of total expenses | | | | | | | | | | |
| to average net assets | | 1.30 | | 1.33 | | 1.41 | | 1.33 | | 1.51 |
| Ratio of net expenses | | | | | | | | | | |
| to average net assets | | 1.30c | | 1.33 | | 1.39 | | 1.33 | | 1.50 |
| Ratio of net investment (loss) | | | | | | | | | | |
| to average net assets | | (.03) | | (.62) | | (.77) | | (.87) | | (1.01) |
| Portfolio Turnover Rate | | 165 | | 104 | | 211 | | 147 | | 160 |
| |
| |
| |
| |
| |
|
| Net Assets, end of period ($ x 1,000) | | 182,336 147,410 | | 110,170 | | 119,273 | | 159,161 |
| a | | Based on average shares outstanding at each month end. |
| b | | Amount represents less than $.01 per share. |
| c | | The difference for the period represents less than .01%. |
| See notes to financial statements. |
The Fund 21
FINANCIAL HIGHLIGHTS (continued)
| | | | | Year Ended December 31, | | |
| |
| |
| |
|
| Class I Shares | | 2007a | | 2006 | | 2005 | | 2004 | | 2003 |
| |
| |
| |
| |
| |
|
| Per Share Data ($): | | | | | | | | | | |
| Net asset value, beginning of period | | 5.88 | | 4.73 | | 4.19 | | 3.56 | | 2.61 |
| Investment Operations: | | | | | | | | | | |
| Investment income (loss)—net | | .00b,c | | (.02)b | | (.02)b | | (.04)b | | (.03) |
| Net realized and unrealized | | | | | | | | | | |
| gain (loss) on investments | | .77 | | 1.17 | | .56 | | .67 | | .98 |
| Total from Investment Operations | | .77 | | 1.15 | | .54 | | .63 | | .95 |
| Distributions: | | | | | | | | | | |
| Dividends from net realized | | | | | | | | | | |
| gain on investments | | (.26) | | — | | — | | — | | — |
| Net asset value, end of period | | 6.39 | | 5.88 | | 4.73 | | 4.19 | | 3.56 |
| |
| |
| |
| |
| |
|
| Total Return (%) | | 13.11 | | 24.31 | | 12.89 | | 17.70 | | 36.40 |
| |
| |
| |
| |
| |
|
| Ratios/Supplemental Data (%): | | | | | | | | | | |
| Ratio of total expenses | | | | | | | | | | |
| to average net assets | | 1.12 | | 1.14 | | 1.38 | | 1.48 | | 1.64 |
| Ratio of net expenses | | | | | | | | | | |
| to average net assets | | 1.11 | | 1.12 | | 1.34 | | 1.48 | | 1.64 |
| Ratio of net investment income | | | | | | | | | | |
| (loss) to average net assets | | .06 | | (.28) | | (.70) | | (1.03) | | (1.15) |
| Portfolio Turnover Rate | | 165 | | 104 | | 211 | | 147 | | 160 |
| |
| |
| |
| |
| |
|
| Net Assets, end of period ($ x 1,000) | | 10,266 | | 4,279 | | 297 | | 71 | | 119 |
| a | | Effective June 1, 2007, Class R shares were redesignated as Class I shares. |
| b | | Based on average shares outstanding at each month end. |
| c | | Amount represents less than $.01 per share. |
| See notes to financial statements. |
22
| | | | | Year Ended December 31, | | |
| |
| |
| |
|
| Class T Shares | | 2007 | | 2006 | | 2005 | | 2004 | | 2003 |
| |
| |
| |
| |
| |
|
| Per Share Data ($): | | | | | | | | | | |
| Net asset value, beginning of period | | 5.44 | | 4.43 | | 3.97 | | 3.39 | | 2.51 |
| Investment Operations: | | | | | | | | | | |
| Investment (loss)—net | | (.04)a | | (.07)a | | (.17) | | (.06) | | (.02) |
| Net realized and unrealized | | | | | | | | | | |
| gain (loss) on investments | | .72 | | 1.08 | | .63 | | .64 | | .90 |
| Total from Investment Operations | | .68 | | 1.01 | | .46 | | .58 | | .88 |
| Distributions: | | | | | | | | | | |
| Dividends from net realized | | | | | | | | | | |
| gain on investments | | (.26) | | — | | — | | — | | — |
| Net asset value, end of period | | 5.86 | | 5.44 | | 4.43 | | 3.97 | | 3.39 |
| |
| |
| |
| |
| |
|
| Total Return (%) b | | 12.52 | | 22.80 | | 11.59 | | 17.11 | | 35.06 |
| |
| |
| |
| |
| |
|
| Ratios/Supplemental Data (%): | | | | | | | | | | |
| Ratio of total expenses | | | | | | | | | | |
| to average net assets | | 1.78 | | 2.13 | | 2.59 | | 2.26 | | 2.76 |
| Ratio of net expenses | | | | | | | | | | |
| to average net assets | | 1.78c | | 2.13 | | 2.57 | | 2.25 | | 2.76 |
| Ratio of net investment (loss) | | | | | | | | | | |
| to average net assets | | (.73) | | (1.39) | | (1.94) | | (1.78) | | (2.27) |
| Portfolio Turnover Rate | | 165 | | 104 | | 211 | | 147 | | 160 |
| |
| |
| |
| |
| |
|
| Net Assets, end of period ($ x 1,000) | | 638 | | 108 | | 33 | | 40 | | 34 |
| a | | Based on average shares outstanding at each month end. |
| b | | Exclusive of sales charge. |
| c | | The difference for the period represents less than .01%. |
| See notes to financial statements. |
The Fund 23
NOTES TO FINANCIAL STATEMENTS
NOTE 1—Significant Accounting Policies:
Dreyfus Founders Mid-Cap Growth Fund (the “fund”) is a separate diversified series of Dreyfus Founders Funds, Inc. (the “Company”), which is registered under the Investment Company Act of 1940, as amended (the “Act”), as an open-end management investment company and operates as a series company currently offering six series, including the fund. The fund’s investment objective is to seek capital appreciation through investments in mid-cap growth companies. Founders Asset Management LLC (“Founders”) serves as the fund’s investment adviser. During the first half of the reporting period, Founders was an indirect, wholly-owned subsidiary of Mellon Financial Corporation (“Mellon Financial”).
On July 1, 2007, Mellon Financial and The Bank of New York Company, Inc. merged, forming The Bank of New York Mellon Corporation (“BNY Mellon”). As part of this transaction, Founders became an indirect, wholly-owned subsidiary of BNY Mellon.
The Company’s Board of Directors approved the redesignation of the fund’s Class R shares as Class I shares, effective June 1, 2007.The eligibility requirements for Class I shares remained the same as for Class R shares.
MBSC Securities Corporation (the “Distributor”), the direct owner of Founders and a wholly-owned subsidiary of The Dreyfus Corporation (“Dreyfus”), an affiliate of Founders, is the distributor of the fund’s shares. The fund is authorized to issue up to 1.15 billion shares of Common Stock, par value $ .01 per share, in the following classes of shares: Class A, Class B, Class C, Class F, Class I and Class T. Class A and Class T shares are subject to a sales charge imposed at the time of purchase, although the shares may be purchased at net asset value (“NAV”) without a sales charge by certain categories of investors. Class B shares are subject to a contingent deferred sales charge (“CDSC”) imposed on Class B share redemptions made within six years of purchase and automatically convert to Class A shares after six years. The fund does not offer Class B shares, except in connection with dividend reinvestment
24
and permitted exchanges of Class B shares. Class C shares are subject to a CDSC imposed on Class C shares redeemed within one year of purchase. Class F and Class I shares are sold at NAV per share. Class F shares are sold only to Class F grandfathered investors, and Class I shares are sold only to eligible institutional investors. Other differences between the classes include the services offered to and the expenses borne by each class. Income and realized and unrealized gains or losses on investments are allocated to each class of shares based on its relative net assets.
Each class of the fund bears expenses incurred specifically on its behalf and, in addition, each class bears a portion of general expenses based on the relative net assets or the number of shareholder accounts of the class.The type of expense determines the allocation method.
The Company’s Board of Directors has authorized the payment of certain fund expenses with commissions on fund portfolio transactions. These commissions increase miscellaneous expenses and are included in the expense offset to broker commissions in the Statement of Operations.
The fund’s financial statements are prepared in accordance with U.S. generally accepted accounting principles, which require the use of management estimates and assumptions. Actual results could differ from those estimates.
The fund enters into contracts that contain a variety of indemnifications. The fund’s maximum exposure under these arrangements is unknown.The fund does not anticipate recognizing any loss related to these arrangements.
(a) Portfolio valuation: A domestic equity security listed or traded on a securities exchange or in the over-the-counter market is valued at its last sale price on the exchange or market where it is principally traded or, in the case of a security traded on NASDAQ, at its official closing price. Lacking any sales on that day, the security is valued at the current closing bid price, or by quotes from dealers making a market in
The Fund 25
NOTES TO FINANCIAL STATEMENTS (continued)
the security if the closing bid price is not available, or in the case of written call options, at the mean between the highest bid and lowest asked quotations obtained from at least two securities dealers.
A foreign equity security traded on a foreign exchange is valued at the last quoted official closing price available before the time when the fund’s assets are valued, or at the last quoted sales price if the exchange does not provide an official closing price or if the foreign market has not yet closed. Lacking any sales that day, the security is valued at the current closing bid price, or by quotes from dealers making a market in the security if the closing bid price is not available. New York closing exchange rates are used to convert foreign currencies to U.S. dollars.
A debt security with a remaining maturity greater than 60 days at the time of purchase is valued in accordance with the evaluated bid price supplied by a pricing service approved by the Company’s Board of Directors or, if such price is not available, at the mean between the highest bid and lowest asked quotations obtained from at least two securities dealers.A debt security with a remaining maturity of 60 days or less at the time of purchase is valued at amortized cost, which approximates market value, unless it is determined that amortized cost would not represent market value, in which case the securities would be marked to market.
Registered open-end investment companies that are not traded on an exchange are valued at their NAV.
If market quotations or official closing prices are not readily available or are determined not to reflect accurately fair value, securities will be valued at their fair value as determined in good faith by the Company’s Board of Directors or pursuant to procedures approved by the Board of Directors.These situations may include instances where an event occurs after the close of the market on which a security is traded but before the fund calculates its NAV, and it is determined that the event has materially affected the value of the security. Fair value of foreign equity securities may be determined with the assistance of a pricing service using calculations based on indexes of domestic securities and other appropriate indicators, such as prices of relevant ADRs and futures contracts.
26
The Financial Accounting Standards Board (“FASB”) released Statement of Financial Accounting Standards No. 157 “Fair Value Measurements” (“FAS 157”). FAS 157 establishes an authoritative definition of fair value, sets out a framework for measuring fair value, and requires additional disclosures about fair-value measurements. The application of FAS 157 is required for fiscal years beginning after November 15, 2007 and interim periods within those fiscal years. Management does not believe that the application of this standard will have a material impact on the financial statements of the fund.
(b) Foreign securities and currency transactions: The fund may invest at least a portion of its assets in foreign securities. Foreign securities carry more risk than U.S. securities, such as political and currency risks. In the event the fund executes a foreign security transaction, the fund may enter into a foreign currency contract to settle the foreign security transaction.The fund could be exposed to risk if counterpar-ties are unable to meet the terms of the contracts or if the value of the currency changes unfavorably to the U.S. dollar.The resultant foreign currency gain or loss from the contract is recorded as foreign currency gain or loss and is presented as such in the Statement of Operations.
The accounting records of the fund are maintained in U.S. dollars.The market values of foreign securities,currency holdings and other assets and liabilities are translated into U.S. dollars based on the current exchange rates each business day. Purchases and sales of investment securities and income and expense items denominated in foreign currencies are translated into U.S.dollar amounts on the respective dates of such transactions.
The fund does not isolate that portion of the results of operations resulting from changes in foreign exchange rates on investments from the fluctuations arising from changes in market prices of securities held. Such fluctuations are included with the net unrealized appreciation (depreciation) from investments and foreign currency translations in the Statement of Operations.
Reported net realized foreign exchange gains or losses arise from sales of foreign currencies,currency gains or losses realized between the trade and
The Fund 27
NOTES TO FINANCIAL STATEMENTS (continued)
settlement dates on securities transactions,and the difference between the amounts of dividends,interest,and foreign withholding taxes recorded on the fund’s books and the U.S. dollar equivalent of the amounts actually received or paid. Net unrealized appreciation or depreciation on investments and foreign currency translation arises from changes in the values of assets and liabilities, including investments in securities held at the date of the financial statements, resulting from changes in the exchange rates and changes in market prices of securities held.
(c) Securities transactions and investment income: Securities transactions are recorded on a trade date basis. Realized gains and losses from securities transactions are recorded on the identified cost basis. Dividend income is recognized on the ex-dividend date and interest income, including, where applicable, accretion of discount and amortization of premium on investments, is recognized on the accrual basis.
The fund has an arrangement with the custodian bank, Mellon Bank, N.A. (“Mellon Bank”), whereby the fund receives earnings credits from the custodian when positive cash balances are maintained, which are used to offset custody fees. For financial reporting purposes, the fund includes any earnings credits as an expense offset in the Statement of Operations.
(d) Affiliated issuers: Investments in other investment companies advised by Founders or its affiliates are defined as “affiliated” in the Act.
(e) Dividends to shareholders: Dividends are recorded on the ex-dividend date. Dividends from investment income-net and dividends from net realized capital gains, if any, are normally declared and paid annually, but the fund may make distributions on a more frequent basis to comply with the distribution requirements of the Internal Revenue Code of 1986, as amended (the “Code”).To the extent that net realized capital gains can be offset by capital loss carryovers, if any, it is the policy of the fund not to distribute such gains. Income and capital gain distributions are determined in accordance with income tax regulations, which may differ from U.S. generally accepted accounting principles.
28
(f) Federal income taxes: No provision has been made for federal income taxes since it is the policy of the fund to continue to comply with the requirements of Subchapter M of the Code that are applicable to regulated investment companies and to make distributions of income and capital gains sufficient to relieve it from all income taxes.The fund is treated as a separate tax entity for federal income tax purposes.
During the current year, the fund adopted FASB Interpretation No. 48 “Accounting for Uncertainty in Income Taxes” (“FIN 48”). FIN 48 provides guidance for how uncertain tax positions should be recognized, measured, presented and disclosed in the financial statements. FIN 48 requires the evaluation of tax positions taken or expected to be taken in the course of preparing the fund’s tax returns to determine whether the tax positions are “more-likely-than-not” of being sustained by the applicable tax authority.Tax positions not deemed to meet the more-likely-than-not threshold would be recorded as a tax benefit or expense in the current year.The adoption of FIN 48 had no impact on the operations of the fund for the period ended December 31, 2007.
The fund is not subject to examination by U.S. Federal, State and City tax authorities for the tax years before 2004.
At December 31, 2007, the components of accumulated earnings on a tax basis were as follows: unrealized appreciation $28,973,015. In addition, the fund had $1,029,848 of capital losses realized after October 31, 2007, which were deferred for tax purposes to the first day of the following fiscal year.
The tax characters of distributions paid to shareholders during the fiscal periods ended December 31, 2007 and December 31, 2006 were as follows: long-term capital gains $13,588,841 and $0, respectively.
During the period ended December 31, 2007, as a result of permanent book to tax differences, primarily due to the tax treatment for net operating losses, the fund increased accumulated undistributed investment income-net by $658,080, increased accumulated net realized
The Fund 29
NOTES TO FINANCIAL STATEMENTS (continued)
gain (loss) on investments by $7,004 and decreased paid-in capital by $665,084. Net assets and net asset value per share were not affected by this reclassification.
NOTE 2—Bank Line of Credit:
The Company has a line of credit arrangement (“LOC”) with State Street Bank and Trust Company, to be used for temporary or emergency purposes, primarily for financing redemption payments. The borrowings by each series of the Company are limited to the lesser of (a) $25 million, or (b) the lesser of 25% of the series’ total net assets or the maximum amount which the series is permitted to borrow pursuant to the prospectus, any law or any other agreement. Combined borrowings are subject to the $25 million cap on the total LOC. Each series agrees to pay annual fees and interest on the unpaid balance based on prevailing market rates as defined in the LOC.
The average daily amount of borrowings outstanding under the LOC during the period ended December 31, 2007, was approximately $12,300, with a related weighted average annualized interest rate of 5.21% .
NOTE 3—Investment Advisory Fee and Other Transactions With Affiliates:
(a) In accordance with an investment advisory agreement between the Company and Founders, the fund compensates Founders for its services as investment adviser by the payment of fees computed daily and paid monthly at the annual rate equal to a percentage of the average daily value of the fund’s net assets.The fee is 1% of the first $30 million of net assets, .75% of the next $270 million of net assets, .70% of the next $200 million of net assets and .65% of net assets in excess of $500 million.
During the period ended December 31, 2007, the Distributor retained $93,067 and $803 from commissions earned on sales of the fund’s Class A and Class T shares, respectively, and $2,880 and $14,425 from CDSC on redemptions of the fund’s Class B and Class C shares, respectively.
30
(b) Under a Distribution Plan (the “Class B, C and T Plan”) adopted pursuant to Rule 12b-1 under the Act, Class B, Class C and Class T shares pay the Distributor for distributing their shares at an annual rate of .75% of the value of their average daily net assets of Class B and Class C shares and .25% of the value of the average daily net assets of Class T shares. During the period ended December 31, 2007, Class B, Class C and Class T shares were charged $15,149, $253,804 and $1,134 respectively, pursuant to the Class B, C and T Plan.
The fund also has adopted a Distribution Plan pursuant to Rule 12b-1 under the Act applicable to its Class F shares (the “Class F Plan”). Under the Class F Plan, the fund is authorized to reimburse the Distributor for expenses paid for distributing or servicing its Class F shares at an annual rate of up to .25% of the value of the average daily net assets of the fund’s Class F shares. During the period ended December 31, 2007, Class F shares were charged $285,279 pursuant to the Class F Plan.
(c) Under the Shareholder Services Plan, Class A, Class B, Class C and Class T shares pay the Distributor at an annual rate of .25% of the value of their average daily net assets for the provision of certain services. The services provided may include personal services relating to shareholder accounts, such as answering shareholder inquiries regarding the fund and providing reports and other information, and services related to the maintenance of shareholder accounts. The Distributor may make payments to Service Agents (a securities dealer, financial institution or other industry professional) in respect of these services. The Distributor determines the amounts to be paid to Service Agents. During the period ended December 31, 2007, Class A, Class B, Class C and Class T shares were charged $191,901, $5,050, $84,601 and $1,134, respectively, pursuant to the Shareholder Services Plan.
The Company has a shareholder services agreement with the Distributor, whereby the fund has agreed to compensate the Distributor for providing certain shareholder servicing functions to
The Fund 31
NOTES TO FINANCIAL STATEMENTS (continued)
holders of Class F shares.The fund paid the Distributor a monthly fee equal, on an annual basis, to $24.00 per Class F shareholder account considered to be an open account at any time during a given month. During the period ended December 31, 2007, Class F shares were charged $153,168 pursuant to this shareholder services agreement.
Dreyfus Transfer, Inc. (“DTI”), a wholly-owned subsidiary of Dreyfus, is the transfer and dividend disbursing agent for all of the fund’s share classes.With the exception of out-of-pocket charges, the fees charged by DTI with respect to the fund’s Class F shares are paid by the Distributor.The out-of-pocket charges from DTI are paid by the fund. During the period ended December 31, 2007, Class F shares were charged $19,537 for out-of-pocket transfer agent charges.
The fees charged by DTI with respect to the fund’s Class A, Class B, Class C, Class I and Class T shares are paid by the fund.These transfer agency fees, including both the per account fees paid to DTI and out-of-pocket charges, during the period ended December 31, 2007 were $163,393.
The fund compensates Mellon Bank, an affiliate of Founders, under a custody agreement for providing custodial services for the fund. During the period ended December 31, 2007, the fund was charged $17,284 pursuant to the custody agreement.
The fund also pays Mellon Bank for certain cash management services. These fees are included in the out-of-pocket transfer agency charges above.
The fund has agreed to compensate Dreyfus for providing accounting services, administration, compliance monitoring, regulatory and shareholder reporting, as well as related facilities, equipment and clerical help. The fee is computed at the annual rate of .06% of the average daily net assets of the fund on the first $500 million, .04% of the average daily net assets of the fund on the next $500 million and .02% of the average daily net assets of the fund in excess of $1 billion, plus rea-
32
sonable out-of-pocket expenses. Dreyfus has contractually agreed in writing to waive any fees received for these services to the extent they exceed its costs in providing the services and a reasonable allocation of Founders’ costs related to the support and oversight of these services. During the period ended December 31, 2007, Dreyfus waived $1,806.
The components of “Due to Founders Asset Management LLC and affiliates” in the Statement of Assets and Liabilities consist of: investment advisory fees $219,293, Rule 12b-1 distribution plan fees $65,839, shareholder services plan fees $191,468, custodian fees $3,454, accounting fees $16,908 and transfer agency per account fees $24,510.
(d) Annual retainer fees and attendance fees for the Company’s Board of Directors are allocated to each series of the Company based on net assets.The Company’s Board of Directors has adopted a deferred compensation plan for Company directors that enables directors to elect to defer receipt of all or a portion of the annual compensation that they are entitled to receive from the Company. Under the plan, the compensation deferred is invested in shares of one or more of the Company’s series.The amount paid to the director under the plan will be determined based upon the performance of the selected series.The current value of these amounts is included in Other Assets and Directors’ Deferred Compensation in the Statement of Assets and Liabilities. Changes in market value are included in the directors’ fees and expenses and the net change in unrealized appreciation (depreciation) of investments in the Statement of Operations. Deferral of directors’ fees under the plan does not affect the net assets of the fund.
Certain officers of the Company are also officers and/or directors of Founders or its affiliates, which pay their compensation.The affairs of the fund, including services provided by Founders, are subject to the supervision and general oversight of the Company’s Board of Directors.
The Fund 33
NOTES TO FINANCIAL STATEMENTS (continued)
NOTE 4—Securities Transactions:
The aggregate amount of purchases and sales of investment securities, excluding short-term securities, during the period ended December 31, 2007, amounted to $604,827,138 and $480,069,907 respectively.
At December 31, 2007, the cost of investments for federal income tax purposes was $307,469,613; accordingly, accumulated net unrealized appreciation on investments was $28,973,015, consisting of $41,370,734 gross unrealized appreciation and $12,397,719 gross unrealized depreciation.
34
REPORT OF INDEPENDENT REGISTERED
PUBLIC ACCOUNTING FIRM
|
| | Shareholders and Board of Directors
Dreyfus Founders Mid-Cap Growth Fund
|
We have audited the accompanying statement of assets and liabilities, including the statement of investments, of Dreyfus Founders Mid-Cap Growth Fund (one of the funds comprising Dreyfus Founders Funds, Inc.), as of December 31, 2007, and the related statement of operations, the statement of changes in net assets and financial highlights for the year then ended.These financial statements and financial highlights are the responsibility of the Fund’s management. Our responsibility is to express an opinion on these financial statements and financial highlights based on our audit. The statement of changes in net assets of Dreyfus Founders Mid-Cap Growth Fund for the year ended December 31, 2006 and the financial highlights for each of the indicated periods through December 31, 2006, were audited by other auditors whose report dated February 23, 2007, expressed an unqualified opinion on the statement and financial highlights.
We conducted our audit in accordance with the standards of the Public Company Accounting Oversight Board (United States).Those standards require that we plan and perform the audit to obtain reasonable assurance about whether the financial statements and financial highlights are free of material misstatement.We were not engaged to perform an audit of the Fund’s internal control over financial reporting. Our audits included consideration of internal control over financial reporting as a basis for designing audit procedures that are appropriate in the circumstances,but not for the purpose of expressing an opinion on the effectiveness of the Fund’s internal control over financial reporting.Accordingly, we express no such opinion.An audit also includes examining, on a test basis, evidence supporting the amounts and disclosures in the financial statements and financial highlights, assessing the accounting principles used and significant estimates made by management, and evaluating the overall financial statement presentation. Our procedures included confirmation of securities as of December 31, 2007 by correspondence with the custodian.We believe that our audit provides a reasonable basis for our opinion.
In our opinion, the financial statements and financial highlights referred to above present fairly, in all material respects, the financial position of Dreyfus Founders Mid-Cap Growth Fund at December 31, 2007, and the results of its operations, the changes in its net assets and the financial highlights for the year then ended, in conformity with accounting principles generally accepted in the United States.

| | New York, New York
February 21, 2008
|
The Fund 35
IMPORTANT TAX INFORMATION ( U n a u d i t e d )
For federal tax purposes, the fund hereby designates $.2631 per share as a long-term capital gain distribution paid on December 21, 2007.
36
FACTORS CONSIDERED IN RENEWING
THE ADVISORY AGREEMENT (Unaudited)
|
At a meeting of the board of directors of Dreyfus Founders Funds, Inc. (the “Funds” and, in reference to any one of the Funds’ portfolios, a “Fund”) held on August 15 and 16, 2007, the Funds’ directors unanimously approved the continuation of the Investment Advisory Agreement (“management agreement”) between each of the Funds and Founders Asset Management LLC, the Funds’ investment adviser (“Founders”), for a one-year term ending August 31, 2008.The board of directors of the Funds (“board”) is comprised entirely of individuals who have no affiliation with Founders or any affiliates of Founders (the “directors”).
Prior to the directors’August 2007 meeting, Founders had provided the directors with extensive materials related to the renewal of the management agreement, including performance and expense information for other investment companies with similar investment objectives to each Fund derived from data compiled by Lipper Inc., an independent third party (“Lipper”).
During their meeting, the directors discussed the proposed continuance of the management agreement with the senior management personnel of Founders. At the conclusion of these discussions, the directors and their independent counsel met in a private session at which no representatives of Founders were present, to continue their discussion of continuance of the agreement. In determining to continue the management agreement, the directors considered all factors which they believed to be relevant, including the following:
Nature, Extent and Quality of Services Provided and to be Provided by Founders
The directors recognized that they have had the opportunity to evaluate the investment and non-investment related services which Founders and its affiliates provide to the Funds primarily through their quarterly review of all of the operations of the Funds during Fund committee and Fund board meetings held throughout the past twelve months. At each such meeting, extensive discussions of Fund operations are held with senior management personnel of Founders and a
The Fund 37
| | FACTORS CONSIDERED IN RENEWING THE
ADVISORY AGREEMENT (Unaudited) (continued)
|
large volume of documentation with respect to these operations is provided to and reviewed by the directors. Such discussions and documentation afford the directors the continual opportunity to evaluate the nature, extent, and quality of the services provided by Founders and its affiliates to the Funds.
The directors were satisfied that Founders is managing the investment of the assets of the Funds in accordance with each Fund’s respective investment objective, policies and restrictions, subject to the directors’ overall supervision.
The directors considered that Founders also provides many non-investment related services to the Funds in fulfilling its responsibilities under the management agreement.
Following their discussion and review, the directors reached the following conclusions:
- That the breadth and quality of investment advisory and other ser- vices being provided to the Funds are satisfactory, as evidenced in part by the performance records of the Funds, to which the direc- tors gave significant attention as indicated below; and
- That the directors are satisfied not only with the research, long- term portfolio management, and trading services being provided to the Funds, but also recognize that Founders or its affiliates have provided the highest quality accounting, compliance and regula- tory, administrative, underwriting, custody, shareholder, transfer agent and cash management services to the Funds, while charging fair, reasonable and competitive fees.
Investment Performance
On a quarterly basis, the directors hold meetings with representatives of the portfolio management team for each Fund (usually a portfolio manager), during which each representative reviews, among other items, performance information, attribution analyses, and the portfolio manager’s investment outlook. The directors also receive written monthly and quarterly performance information for each Fund.These
38
written quarterly reports include comparisons of each Fund’s performance with its respective Lipper category and one or more benchmark indexes, as well as a comparable exchange-traded fund, for the most recent quarter and one-, three- and five-year periods, as well as for the portfolio manager’s tenure.
In conjunction with their consideration of renewal of the management agreement, the directors received a more detailed performance report about each Fund from Lipper.These reports compared each Fund’s performance to both a relatively small group of similar funds selected by Lipper (the “Lipper performance group”), as well as to all funds in the applicable Lipper category (the “Lipper performance universe”).
The performance of Mid-Cap Growth Fund’s Class F shares placed in the first (highest) quintile of both its Lipper performance group and the Lipper mid-cap growth fund performance universe for the one-, three- and five-year periods ended December 31, 2006, placed in the first quintile of its Lipper performance universe for the one-, three-and five-year periods ended June 30, 2007, and outperformed its benchmark index for the one-, three- and five-year periods ended June 30, 2007.The directors deemed these relative performance results to be very satisfactory, although the directors noted that the Fund’s relative performance to date in 2007 had deteriorated. The directors stressed the importance to Founders of the need to seek to maintain the Fund’s strong performance record.
After consideration of all relevant information and data, the directors concluded that although past performance cannot be a guaranty of future performance, each Fund and its shareholders would continue to benefit from Founders’ investment management of the Fund. The directors further determined:
- That although certain of the Funds have experienced performance difficulties, Founders has focused its efforts upon improving the performance records of the Funds and will continue to seek improvement; and
The Fund 39
| | FACTORS CONSIDERED IN RENEWING THE
ADVISORY AGREEMENT (Unaudited) (continued)
|
- That the materials provided by Lipper demonstrated that most of the Funds maintained satisfactory performance quintile rankings in their respective comparison groups and comparison universes, with five of seven Funds placing in the top two quintiles of their respec- tive Lipper performance universes for the one-year period ended December 31, 2006, and four placing in the top two quintiles for the three years ended December 31, 2006.
Costs of the Services to be Provided and Profits to be Realized by Founders and Its Affiliates from Founders’ Relationship With the Funds
The directors recognized that on a quarterly basis, they receive information with respect to each Fund’s expenses. The directors carefully review and discuss the expense ratios for all classes of shares of each Fund at each of their quarterly meetings throughout the year.
In conjunction with their annual consideration of renewal of the Funds’ management agreement and other service arrangements, the directors received detailed information from Lipper which compared each Fund’s management fees and other expenses with those of a group of similar funds selected by Lipper (the “Lipper expense group”), as well as summary information comparing each Fund’s management fees and expenses with those of the funds in its Lipper performance universe with load structures similar to that of the Funds (the “Lipper expense universe”).
The directors noted that for the period ended December 31, 2006, Mid-Cap Growth Fund’s management fees ranked in the second quin-tile of its Lipper expense group, with the Fund’s fees the seventh lowest of 16 “peer funds.” The Fund’s contractual management fees at a common asset level were determined by Lipper to be the fifth lowest of the 16 funds in its group.The Fund’s management fees were in the third quintile of its Lipper expense universe.
The directors also considered information provided by Lipper with respect to the profitability of the investment management activities conducted by a number of publicly-held corporations. Lipper also pre-
40
pared an analysis providing detailed information with respect to the types of services rendered to various mutual fund complexes under their respective investment advisory contracts, including the services provided by Founders to the Funds under the management agreement.
The directors had been provided with extensive materials with respect to the profitability derived by Founders from providing investment advisory and other services to the Funds as a group and to each Fund individually.
The directors further considered certain indirect benefits received by Founders and its affiliates as a result of Founders’ provision of investment advisory services to the Funds.These included the following:
- Since Founders manages a non-Fund account in a style that is sim- ilar to that used for one of the Funds (and for portions of certain other Funds), and employees of Founders manage other non-Fund accounts in a similar style in their capacities as employees of the affiliates, Founders and its affiliates realize efficiencies in perform- ing the portfolio management, trading and operational functions related to those non-Fund accounts;
- The Funds’ brokerage transactions may be executed with brokers that provide research and brokerage services to Founders and its affiliates. These research and brokerage services may be useful to Founders and its affiliates in providing investment advisory services to any of the clients they advise, including the Funds; and
- Affiliates of Founders receive various fees for providing accounting, underwriting, shareholder, transfer agency, custody and cash man- agement services to the Funds.
After deliberation and discussion of Fund fees and expenses, the directors determined:
- That upon review of the advisory fee structures of the Funds in comparison with the competitive expense groups and expense uni- verses selected by Lipper, the levels of investment advisory fees paid by the Funds were deemed to be competitive;
The Fund 41
| | FACTORS CONSIDERED IN RENEWING THE
ADVISORY AGREEMENT (Unaudited) (continued)
|
- That the expense ratios of the Funds are competitive and that Founders continually reviews each Fund’s total expense ratio and has initiated voluntarily expense caps and fee waivers for certain Funds to reduce their expense ratios;
- That five of the seven Funds’ expense ratios decreased or remained the same for all or most of their share classes in 2006 as compared to those experienced in 2005, in some instances as a result of increases in Fund assets; and
- That the comparative fee and expense information included in the materials provided by Lipper supports the determination that the advisory and other fees payable by the Funds to Founders and its affiliates are essentially fees which would be similar to those that would have resulted solely from “arm’s-length” bargaining.
With respect to profitability to Founders, the directors reviewed the adviser profitability analysis provided by Lipper, which demonstrated that Founders’ 2006 profitability from providing management services to the Funds was reasonable in comparison to the entities included in the Lipper analysis.
The directors were also advised by independent counsel of the profitability percentage ranges which court cases have found acceptable and determined that Founders’ profitability percentage for providing management and other services to the Funds was reasonable.
The directors concluded that Founders’ profits from providing management services to the Funds were reasonable in relationship to the overall services which Founders provides.
Economies of Scale
The directors reviewed information provided by Founders which summarized the extent, if any, that both Founders and the Funds would achieve certain economies of scale if the assets of the Funds were to increase.
After review and discussion, the directors considered the extent to which economies of scale and common management are shared with each Fund, including the economies that would be realized from the
42
growth of each Fund’s assets. After such consideration, the directors determined that all of the Funds have structured breakpoints in their advisory fees, which result in fee reductions as the assets of each Fund reach defined levels, and that such fee reductions, when implemented, would benefit all of the applicable Fund’s shareholders through decreases in the Fund’s expense ratio.
Dedication to Regulatory Requirements and Restrictions
An important factor in the directors’ consideration of renewal of the Funds’ management agreement with Founders included the directors’ recognition of the dedication by Founders of stringent adherence to regulatory requirements and restrictions.The directors determined that Founders is dedicated to compliance with all applicable rules and regulations and that the systems of controls which are in place to ensure that the service providers to the Funds, including Founders, and the Funds themselves, maintain strict adherence to the law are excellent.
Overall Conclusions
The directors determined that they are generally satisfied with the performance of the Funds and with the quality of the advisory and other services being provided by Founders and its affiliates to the Funds. The directors recognized that efforts are being and will continue to be made to improve the Funds’ performance and to maintain Fund expense ratios at reasonable and competitive levels.
The directors concluded that continuation of the current management agreement between each Fund and Founders, which would enable each Fund to continue to receive investment advisory services from Founders, is in the best interests of each Fund and its shareholders, the services to be performed under the management agreement are services required for the operations of the Funds, Founders has provided satisfactory investment management services to the Funds in the past, and the fees for the management services which Founders will perform will be within the range of what would have been negotiated at arm’s length in light of the circumstances.
The Fund 43
YOUR BOARD REPRESENTATIVES (Unaudited)
The Board of Directors of the Company oversees all six Dreyfus Founders Funds.The business and affairs of the Company are managed under the direction of the Board. The directors serving on the Board perform their responsibilities in the manner which they reasonably believe to be in the best interests of the Funds and their shareholders.
All of the directors,as listed below,are independent directors.They are not affiliated with the Fund’s adviser, its parent company, or its affiliates.The directors have no official term of office and generally serve until they retire (normally at age 75, but subject to extension to age 80), resign, or are not re-elected.As you can see from their backgrounds, the directors have broad experience as active or former business and community leaders.
Eugene H.Vaughan, CFA, 74.Year elected to the Board: 1970
Board Chairman. Founding Chairman,Vaughan Nelson Investment Management, LP, an investment counseling firm. Director, Encore Bank, Houston. Founding Chairman, Center for Houston’s Future, a non-profit organization. Founding Chairman and former Governor, CFA Institute. Past Chairman and Trustee, Institute of Chartered Financial Analysts. Past Chairman and Director, Financial Analysts Federation. Chairman-elect, University of Texas Health Science Center.
Alan S. Danson, 68.Year elected to the Board: 1991
Private investor. Formerly, President and Director, D.H. Management, Inc., the general partner of a limited partnership with technology company holdings (1996 to 2003). Director, Gore Range Natural Science School and The Les Streeter Program, Inc., both of which are non-profit organizations.
Robert P. Mastrovita, 63.Year elected to the Board: 1998
Private investor. Chairman of a private charitable foundation (1997 to present). Formerly, Chairman and Director, Hagler, Mastrovita & Hewitt, Inc., a registered investment adviser (1982 to 1997). Member, Boston Society of Security Analysts. Trustee, Partridge Academy. Director, King Caesar Foundation.
Trygve E. Myhren, 71.Year elected to the Board: 1996
President, Myhren Media, Inc., a firm that invests in and advises media, telecommunications, Internet and software companies. Special Limited Partner and member of Investment Committee, Megunticook Funds, a venture capital firm (1998 to present). Director, AdPay, Inc.Trustee, Executive Committee and Chairman of Faculty Education Affairs Committee, the University of Denver. Trustee, Denver Art
44
Museum. Member, Colorado FORUM and Cable Television Hall of Fame. Formerly, President (1990 to 1996) and Director (1992 to 2001) of the Providence Journal Company, a diversified media and communications company. Formerly, Chairman and Chief Executive Officer of American Television and Communications Corporation (now Time Warner Cable) (1981 to 1988). Formerly, Chairman of the National Cable Television Association (1986-1987). Chief of Mission, 2006 Paralympic Games,Torino/Sestrierre, Italy.
George W. Phillips, 69.Year elected to the Board: 1998
Retired.Vice Chairman of the Board and Chairman of the Investment Committee, Children’s Medical Center of Boston. Formerly, President and Chief Executive Officer (1992 to 1997) and Director (1992 to 2002) of Warren Bancorp, Inc. Formerly, President, Chief Executive Officer and Director of Warren Five Cents Savings Bank (1992 to 1997).
Martha A. Solis-Turner, 47.Year elected to the Board: 2005
Formerly, Telecommunications Director, Wholesale Markets (1995 to 2001), and Manager (1990 to 1995), Qwest Communications International Inc. Board member and Treasurer, Mile High Montessori Early Learning Centers (2002 to present), and formerly, Board member (1995 to 2004) and Vice President (2002 to 2004), Curtis Park Community Center, both of which are non-profit organizations.
Principal Officers
J. David Officer, 59. President and Principal Executive Officer of the Funds since 2007. Chief Operating Officer,Vice Chairman and a Director of Dreyfus, and an officer of 78 investment companies (comprised of 163 portfolios) managed by Dreyfus. He has been an employee of Dreyfus since 1998.
Denise B. Kneeland, 56. Vice President of the Funds since 2008. Assistant Vice President (since 1996) and Secretary (since 2007) of the Mellon Institutional Funds Investment Trust. First Vice President and Manager, Mutual Funds Operations, BNY Mellon Asset Management (since 2006). Formerly,Vice President and Manager, Mutual Funds Operations, Standish Mellon Asset Management Company, LLC (1996 to 2001).
Kenneth R. Christoffersen, 52. Vice President of the Funds since 2008, and Secretary since 2000 (and from 1996 to 1998). Founders’ Senior Vice President -Legal, General Counsel and Secretary. Assistant Secretary of the Distributor since 2003. Employed by Founders and its predecessor company since 1996.
The Fund 45
YOUR BOARD REPRESENTATIVES (Unaudited) (continued)
Steven M. Anderson, 42.Treasurer and Principal Financial and Accounting Officer of the Funds since 2007. Vice President (since 1999), Treasurer (since 2002) and Chief Financial Officer of Mellon Institutional Funds Investment Trust. Vice President and Mutual Funds Controller, BNY Mellon Asset Management (since 2003). Formerly, Assistant Vice President and Mutual Funds Controller, Standish Mellon Asset Management Company, LLC (2000 to 2003).
Janelle E. Belcher, 49. Chief Compliance Officer of the Funds since 2004 and Assistant Secretary of the Funds since 2002. Founders’ Vice President - Compliance since 2002. Formerly, Founders’ Manager of Compliance (2000 to 2002) and Securities Compliance Examiner, Staff Accountant and Team Leader for the U.S. Securities and Exchange Commission (1990 to 2000).
David T. Buhler, 36. Assistant Secretary since 2007. Founders’ Associate General Counsel and Assistant Secretary since 2006. Formerly, Counsel for Great-West Life & Annuity Insurance Company (1997-2006), and Chief Compliance Officer for Greenwood Investments, LLC (2002 - 2006).
Robert S. Robol, 43. Assistant Treasurer since 2006. Senior Accounting Manager -Taxable Fixed Income Funds of Dreyfus, and an officer of 79 investment companies (comprised of 180 portfolios) managed by Dreyfus. Employed by Dreyfus since 1988.
Robert Salviolo, 40. Assistant Treasurer since 2007. Senior Accounting Manager -Foreign Equity Funds of Dreyfus, and an officer of 79 investment companies (comprised of 180 portfolios) managed by Dreyfus. Employed by Dreyfus since 1989.
Robert Svagna, 40. Assistant Treasurer since 2006. Senior Accounting Manager -Equity Funds of Dreyfus, and an officer of 79 investment companies (comprised of 180 portfolios) managed by Dreyfus. Employed by Dreyfus since 1990.
William G. Germenis, 37. Anti-Money Laundering Compliance Officer (“AMLCO”) for the Class A, Class B, Class C, Class I, and Class T shares of the Funds since 2002 and for the Class F shares of the Funds since 2003.Vice President and AMLCO of the Distributor and AMLCO of 75 investment companies (comprised of 176 portfolios) managed by Dreyfus. Employed by the Distributor since 1998.
The directors and officers may be contacted at Founders’ address appearing on the back cover, except for Messrs. Officer, Robol, Salviolo, Svagna and Germenis, who can be contacted at The Dreyfus Corporation, 200 Park Avenue, New York, New York 10166, and Mr. Anderson and Ms. Kneeland, who can be contacted at BNY Mellon Asset Management, One Boston Place, Boston, Massachusetts 02108. Additional information about the Company’s directors is available in the Statement of Additional Information, which can be obtained free of charge by calling 1-800-525-2440 (Class F shareholders) or 1-800-554-4611 (all other shareholders).
46
NOTES
| Dreyfus Founders |
| Passport Fund |
| | Passport Fund is closed to new investors.
Please see the prospectus for additional information.
|
ANNUAL REPORT December 31, 2007
Save time. Save paper. View your next shareholder report online as soon as it’s available. Log into www.dreyfus.com and sign up for Dreyfus eCommunications. It’s simple and only takes a few minutes.
The views expressed in this report reflect those of the portfolio manager only through the end of the period covered and do not necessarily represent the views of Founders or any other person in the Founders organization.Any such views are subject to change at any time based upon market or other conditions and Founders disclaims any responsibility to update such views.These views may not be relied on as investment advice and, because investment decisions for a Dreyfus Founders Fund are based on numerous factors, may not be relied on as an indication of trading intent on behalf of any Dreyfus Founders Fund.
Not FDIC-Insured • Not Bank-Guaranteed • May Lose Value
| Contents |
| |
| | | THE FUND |
| |
|
| 2 | | A Letter from the Chairman |
| 3 | | Discussion of Fund Performance |
| 6 | | Fund Performance |
| 8 | | Understanding Your Fund’s Expenses |
| 8 | | Comparing Your Fund’s Expenses |
| | | With Those of Other Funds |
| 9 | | Statement of Investments |
| 17 | | Statement of Financial Futures |
| 18 | | Statement of Assets and Liabilities |
| 19 | | Statement of Operations |
| 20 | | Statement of Changes in Net Assets |
| 22 | | Financial Highlights |
| 28 | | Notes to Financial Statements |
| 40 | | Report of Independent Registered |
| | | Public Accounting Firm |
| 41 | | Important Tax Information |
| 42 | | Factors Considered in Renewing |
| | | the Advisory Agreement |
| 50 | | Your Board Representatives |
| |
| FOR MORE INFORMATION |
|
| | | Back Cover |
| Dreyfus Founders |
| Passport Fund |

A LETTER FROM THE CHAIRMAN
Dear Shareholder:
We are pleased to present this annual report for Dreyfus Founders Passport Fund, covering the 12-month period from January 1, 2007, through December 31, 2007.
Looking back, 2007 was a year of significant change for the financial markets worldwide.Turmoil in the U.S. sub-prime mortgage market, declining U.S. housing values and soaring energy prices caused significant challenges for international investors throughout the world. As a result, a number of asset classes lost value amid heightened volatility over the summer and fall. International equities generally proved to be a notable exception. As they have for several years, most major international equities indices outperformed their U.S. counterparts as global economic growth remained robust even as the U.S. economy entered a downturn.
The turbulence of 2007 reinforced a central principle of successful investing: diversification. Investors with broad exposure to the world’s stock and bond markets were better protected from the full impact of market volatility in areas that, earlier in the year, were among the bright spots at the time. As we look ahead, we believe that now is the perfect time to meet with your financial advisor, who can help you plan and diversify your investment portfolio in a way that manages the potential opportunities and risks that may continue to arise in 2008.
For information about how the fund performed during the reporting period, as well as market perspectives, we have provided a Discussion of Fund Performance given by the fund’s Portfolio Manager.
Thank you for your continued confidence and support.

2

DISCUSSION OF FUND PERFORMANCE
For the period of January 1, 2007, through December 31, 2007, as provided by William S. Patzer, CFA, Portfolio Manager
Fund and Market Performance Overview
Strong economic growth and robust mergers-and-acquisitions (M&A) activity bolstered the global stock markets’ performance over the first six months of 2007. However, these gains were offset to a significant degree in the second half of the year, as economic concerns and credit issues weighed on investor sentiment. The fund underperformed its benchmark, primarily due to disappointing stock selections across several market sectors.
For the 12-month period ended December 31, 2007, Dreyfus Founders Passport Fund achieved total returns of –1.15% for Class A shares, –2.11% for Class B shares, –1.82% for Class C shares, –0.94% for Class F shares, –0.98% for Class I shares and –1.37% for Class T shares.1 The fund’s benchmark, the Standard & Poor’s/Citigroup Extended Market Index World ex-U.S.SM returned 7.32% for the same period.2
The Fund’s Investment Approach
The fund seeks capital appreciation by investing at least 65% of its total assets in foreign small-cap companies from a minimum of three countries, in both developed and emerging economies.The fund may invest in larger foreign companies or in U.S.-based companies and may purchase securities of companies in initial public offerings. Our “bottom-up” investment approach emphasizes individual stock selection over broader economic and market trends. We use quantitative models and traditional qualitative analysis to construct a diversified portfolio of stocks with low price multiples and positive trends in earnings forecasts when compared to the benchmark.
Global Markets Were Hurt by a Credit Crisis
Persistently vigorous construction activity in the emerging markets produced steady demand for basic materials and construction services throughout 2007. Corporate restructuring and heightened levels of M&A activity also put upward pressure on stock prices in the developed
The Fund 3
DISCUSSION OF FUND PERFORMANCE (continued)
markets of Europe. However, as the year progressed, a credit crisis that originated in the U.S. bond market’s sub-prime mortgage sector, slowing U.S. economic growth, rising energy costs and higher inventory levels convinced investors to reassess their attitudes toward risk, resulting in a reversal of earlier market advances over the second half of the year.
The fund suffered in this more challenging market environment,as countries including Japan, the United Kingdom, Hong Kong and Germany were adversely affected by softer real-estate markets, with many property intermediaries and developers losing ground. Japan’s Kenedix and Joint Corporation; the U.K’s Savills and Barratt Developments; and Germany’s Vivacon ranked among the fund’s greatest laggards in 2007.
From a market sector perspective, the industrials sector detracted significantly from the fund’s relative performance, owing to collapsing and dwindling construction contracts and slowing employment markets in many developed countries. U.K. employment agency Michael Page International faltered in a stagnant hiring environment over the final six months of the year. Consumer staples and consumer discretionary stocks also proved to be a drain on the fund’s performance compared to its benchmark. McBride, a U.K. developer of household and personal care products, saw its share price drop substantially as the rising cost of raw material costs put pressure on its margins.The fund also lost ground due to weak performance by Irish beverage manufacturer C&C Group when concerns persisted that the popularity of the firm’s Magner’s Cider was not sustainable.
Where Our Investment Strategy Worked
Fortunately, the fund received positive contributions from other European markets, such as Finland, Austria and Spain. Finnish industrial company Rautaruukki Oyj participated in the strength of global construction trends. Austrian specialty steel manufacturer Böehler-Uddeholm’s stock advanced amid M&A speculation and strong sales and earnings trends.
The fund received strongly positive contributions from the health care and energy sectors. Germany’s Fresenius Medical Care encountered heightened demand for its dialysis products and services. Australia-based Cochlear Ltd.’s new implant device for the hearing impaired was well received. Energy stocks such as Britain’s Burren Energy and the Netherland’s Fugro performed strongly as commodity prices surged higher.
4
Other positive contributors included Australia’s Incitec Pivot, which experienced heightened demand for its agricultural products. Canada’s Inmet Mining Corp. benefited from rising commodity prices and industry consolidation. Deutsche Böerse Group, the German Stock Exchange, appreciated due to M&A speculation, record trading volumes and successful restructuring plans, while Korean shipbuilder Hyundai Mipo Dockyard Co. progressed because of solid business execution and rising productivity. The fund’s cash position also provided a positive contribution to performance during the reporting period.
Market Fundamentals Appear Sound despite the Downturn
We have continued to employ our disciplined, research-driven approach to selecting stocks, focusing on fundamentals in an effort to find companies that are positioned for gains despite current economic concerns. Although fast-growing emerging economies have continued to post gains, international equity markets have wrestled with volatility caused by the credit crisis and slowing economic growth in some developed countries.We believe that the market is, to a significant degree, focusing on these macroeconomic developments while ignoring sound business fundamentals in a number of industry groups. However, in our view, this perception may soon reverse, potentially putting the fund in a position to capture the benefits of a market rebound.
January 15, 2008
| | | Small companies carry additional risks because their earnings and revenues tend to be less |
| | | predictable, and their share prices more volatile than those of larger, more established |
| | | companies. The shares of smaller companies tend to trade less frequently than those of |
| | | larger, more established companies. |
| | | Investing in foreign companies involves special risks, including changes in currency rates, |
| | | political, economic and social instability, a lack of comprehensive company information, |
| | | differing auditing and legal standards and less market liquidity. An investment in this fund |
| | | should be considered only as a supplement to an overall investment program. |
| 1 | | Total return includes reinvestment of dividends and any capital gains paid, and does not take into |
| | | consideration the maximum initial sales charges in the case of Class A and Class T shares, or the |
| | | applicable contingent deferred sales charges imposed on redemptions in the case of Class B and |
| | | Class C shares. Had these charges been reflected, returns would have been lower. Past performance |
| | | is no guarantee of future results. Share price and investment return fluctuate such that upon |
| | | redemption, fund shares may be worth more or less than their original cost. Return figures provided |
| | | reflect Founders’ waiver of 25% of its management fee for the period of September 14, 2007 |
| | | through December 31, 2007.This waiver will continue through September 13, 2008, at which |
| | | time it will end. Had this waiver not been in effect, the fund’s returns would have been lower. |
| 2 | | SOURCE: LIPPER, INC. – The Standard & Poor’s/Citigroup EMI World ex U.S.SM |
| | | represents, on a country-by-country basis, the small capitalization component of the Citigroup |
| | | Broad Market Index SM, which is a comprehensive float-weighted index of companies in certain |
| | | foreign countries with market capitalizations of at least $100 million.The total return figure cited |
| | | for this index assumes change in security prices and reinvestment of dividends, but does not reflect |
| | | the costs of managing a mutual fund. |
The Fund 5
FUND PERFORMANCE
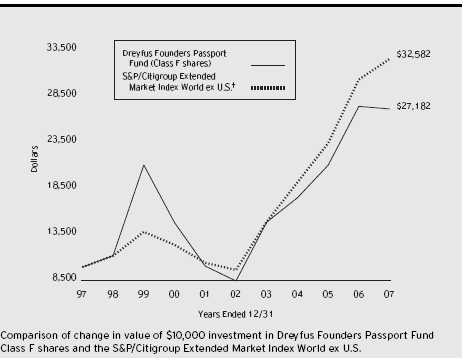
† Source: Citigroup Global Markets Inc.
Past performance is not predictive of future performance.
The above graph compares a $10,000 investment made in Class F shares of Dreyfus Founders Passport Fund on 12/31/97 to a $10,000 investment made in the S&P/ Citigroup Extended Market Index World ex U.S.SM (the “Index”) on that date. All dividends and capital gain distributions are reinvested. Performance for Class A, Class B, Class C, Class I and Class T shares will vary from the performance of Class F shares shown above due to differences in charges and expenses.
The fund’s performance shown in the line graph takes into account all applicable Class F fees and expenses (after any expense reimbursements and fee waivers).The Index represents, on a country-by-country basis, the small capitalization component of the Citigroup Broad Market IndexSM, which is a comprehensive, float-weighted index of companies in certain foreign countries with market capitalizations of at least $100 million. Unlike a mutual fund, the Index is not subject to charges, fees and other expenses. Investors cannot invest directly in any index. Further information relating to fund performance, including expense reimbursements, if applicable, is contained in the Financial Highlights section of the prospectus and elsewhere in this report.
6
| Average Annual Total Returns as of 12/31/07 | | | | | | |
| |
| | | Inception | | | | | | | | From |
| | | Date | | 1 Year | | 5 Years | | 10 Years | | Inception |
| |
| |
| |
| |
| |
|
| Class A shares | | | | | | | | | | |
| with maximum sales charge (5.75%) | | 12/31/99 | | (6.84)% | | 24.57% | | — | | 2.44% |
| without sales charge | | 12/31/99 | | (1.15)% | | 26.07% | | — | | 3.20% |
| Class B shares | | | | | | | | | | |
| with applicable redemption charge † | | 12/31/99 | | (6.02)% | | 24.71% | | — | | 2.58%†† |
| without redemption | | 12/31/99 | | (2.11)% | | 24.88% | | — | | 2.58%†† |
| Class C shares | | | | | | | | | | |
| with applicable redemption charge ††† | | 12/31/99 | | (2.80)% | | 25.09% | | — | | 2.38% |
| without redemption | | 12/31/99 | | (1.82)% | | 25.09% | | — | | 2.38% |
| Class F shares | | 11/16/93 | | (0.94)% | | 26.14% | | 10.52% | | N/A |
| Class I shares | | 12/31/99 | | (0.98)% | | 26.36% | | — | | 2.91% |
| Class T shares | | | | | | | | | | |
| with applicable sales charge (4.5%) | | 12/31/99 | | (5.79)% | | 24.41% | | — | | 1.92% |
| without sales charge | | 12/31/99 | | (1.37)% | | 25.56% | | — | | 2.51% |
Past performance is not predictive of future performance.The fund’s performance shown in the graph and table does not reflect the deduction of taxes that a shareholder would pay on fund distributions or the redemption of fund shares, but does reflect fee waivers.
| † | | The maximum contingent deferred sales charge for Class B shares is 4%. After six years Class B shares convert to |
| | | Class A shares. |
| †† | | Assumes the conversion of Class B shares to Class A shares at the end of the sixth year following the date of |
| | | purchase. |
| ††† | | The maximum contingent deferred sales charge for Class C shares is 1% for shares redeemed within one year of the |
| | | date of purchase. |
The Fund 7
UNDERSTANDING YOUR FUND’S EXPENSES (Unaudited)
As a mutual fund investor, you pay ongoing expenses, such as management fees and other expenses. Using the information below, you can estimate how these expenses affect your investment and compare them with the expenses of other funds.You also may pay one-time transaction expenses, including sales charges (loads) and redemption fees, which are not shown in this section and would have resulted in higher total expenses. For more information, see your fund's prospectus or talk to your financial advisor.
Review your fund’s expenses
The table below shows the expenses you would have paid on a $1,000 investment in Dreyfus Founders Passport Fund from July 1, 2007 to December 31, 2007. It also shows how much a $1,000 investment would be worth at the close of the period, assuming actual returns and expenses.To estimate the expenses you paid on your account over this period, simply divide your account value by $1,000 (for example, an $8,600 account value divided by $1,000 = 8.60), then multiply the results by the number in the Expenses paid per $1,000 line for the class of shares you own.
Expenses and Value of a $1,000 Investment
assuming actual returns for the six months ended December 31, 2007
|
| | | Class A | | Class B | | Class C | | Class F | | Class I | | Class T |
| |
| |
| |
| |
| |
| |
|
| Expenses paid | | | | | | | | | | | | |
| per $1,000 † | | $ 9.09 | | $ 13.66 | | $ 12.28 | | $ 7.71 | | $ 8.76 | | $ 10.43 |
| Ending value | | | | | | | | | | | | |
| (after expenses) | | $899.00 | | $894.70 | | $896.00 | | $900.30 | | $899.30 | | $897.70 |
COMPARING YOUR FUND’S EXPENSES
WITH THOSE OF OTHER FUNDS (Unaudited)
|
Using the SEC’s method to compare expenses
The Securities and Exchange Commission (SEC) has established guidelines to help investors assess fund expenses. Per these guidelines, the table below shows your fund’s expenses based on a $1,000 investment, assuming a hypothetical 5% annualized return. You can use this information to compare the ongoing expenses (but not transaction expenses or total cost) of investing in the fund with those of other funds.All mutual fund shareholder reports will provide this information to help you make this comparison. Please note that you cannot use this information to estimate your actual ending account balance and expenses paid during the period.
Expenses and Value of a $1,000 Investment
assuming a hypothetical 5% annualized return for the six months ended December 31, 2007
|
| | | Class A | | Class B | | Class C | | Class F | | Class I | | Class T |
| |
| |
| |
| |
| |
| |
|
| Expenses paid | | | | | | | | | | | | |
| per $1,000 † | | $ 9.65 | | $ 14.50 | | $ 13.03 | | $ 8.19 | | $ 9.30 | | $ 11.07 |
| Ending value | | | | | | | | | | | | |
| (after expenses) | | $1,015.63 | | $1,010.79 | | $1,012.25 | | $1,017.09 | | $1,015.98 | | $1,014.22 |
| † Expenses are equal to the fund’s annualized expense ratio of 1.90% for Class A shares, 2.86% for Class B shares, |
| 2.57% for Class C shares, 1.61% for Class F shares, 1.83% for Class I shares and 2.18% for Class T shares; |
| multiplied by the average account value over the period, multiplied by 184/365 (to reflect the one-half year period). |
8
STATEMENT OF INVESTMENTS
December 31, 2007
|
| Common Stocks—96.0% | | Shares | | Value ($) |
| |
| |
|
| Australia—4.5% | | | | |
| Babcock & Brown | | 23,790 | | 566,970 |
| Challenger Financial Services Group | | 137,090 | | 600,486 |
| Incitec Pivot | | 12,180 | | 1,251,989 |
| Just Group | | 98,940 | | 403,851 |
| Oxiana | | 88,485 | | 270,299 |
| Seven Network | | 25,820 | | 290,790 |
| Sims Group | | 30,480 | | 718,382 |
| | | | | 4,102,767 |
| Belgium—1.4% | | | | |
| EVS Broadcast Equipment | | 2,400 | | 279,282 |
| Mobistar | | 3,590 | | 326,702 |
| Omega Pharma | | 4,010 | | 279,628 |
| Tessenderlo Chemie | | 7,940 | | 385,369 |
| | | | | 1,270,981 |
| Canada—6.2% | | | | |
| Astral Media | | 12,400 | | 586,132 |
| Axcan Pharma | | 13,700 a | | 315,043 |
| Canaccord Capital | | 19,910 | | 308,729 |
| Canadian Western Bank | | 12,700 | | 403,512 |
| Crescent Point Energy Trust | | 15,600 | | 392,253 |
| Emera | | 13,000 | | 288,406 |
| Gildan Activewear | | 13,000 a | | 539,394 |
| Industrial Alliance Insurance and | | | | |
| Financial Services | | 6,700 | | 289,131 |
| Major Drilling Group International | | 7,100 a | | 450,451 |
| Northbridge Financial | | 8,300 | | 310,314 |
| Oilexco | | 25,000 a | | 333,941 |
| Sherritt International | | 53,700 | | 723,293 |
| Westjet Airlines | | 27,300 a | | 623,913 |
| | | | | 5,564,512 |
| Denmark—.9% | | | | |
| D/S Norden | | 2,900 | | 320,756 |
| Sydbank | | 11,500 | | 494,465 |
| | | | | 815,221 |
The Fund 9
STATEMENT OF INVESTMENTS (continued)
| Common Stocks (continued) | | Shares | | Value ($) |
| |
| |
|
| Finland—1.5% | | | | |
| Konecranes | | 14,970 | | 516,041 |
| Nokian Renkaat | | 12,810 | | 450,383 |
| Wartsila, Cl. B | | 5,380 | | 409,690 |
| | | | | 1,376,114 |
| France—8.5% | | | | |
| Air France-KLM | | 9,590 | | 337,173 |
| Alstom | | 2,175 | | 467,407 |
| Arkema | | 4,700 a | | 308,780 |
| CNP Assurances | | 5,450 | | 709,016 |
| Compagnie Generale de | | | | |
| Geophysique-Veritas | | 1,610 a | | 458,965 |
| Eramet | | 1,670 | | 854,482 |
| GFI Informatique | | 33,230 | | 291,474 |
| Haulotte Group | | 12,960 | | 388,019 |
| Ipsen | | 8,070 | | 486,649 |
| Ipsos | | 9,000 | | 256,564 |
| Lagardere | | 3,520 | | 263,933 |
| Neuf Cegetel | | 8,300 | | 419,829 |
| Nexans | | 3,630 | | 453,723 |
| Rallye | | 5,330 | | 377,909 |
| Scor | | 11,350 | | 290,371 |
| SEB | | 1,990 | | 360,739 |
| Teleperformance | | 13,830 | | 538,409 |
| Wendel | | 2,780 | | 402,101 |
| | | | | 7,665,543 |
| Germany—7.3% | | | | |
| Aareal Bank | | 12,720 | | 582,036 |
| Continental | | 5,430 | | 706,414 |
| Deutsche Boerse | | 3,390 | | 672,757 |
| Hannover Rueckversicherung | | 6,650 | | 306,718 |
| Hypo Real Estate Holding | | 12,240 | | 645,962 |
| KUKA | | 6,450 a | | 245,255 |
| Lanxess | | 8,880 | | 436,185 |
| MAN | | 3,760 | | 625,531 |
| MTU Aero Engines Holding | | 8,210 | | 480,089 |
| Salzgitter | | 3,530 | | 526,631 |
10
| Common Stocks (continued) | | Shares | | Value ($) |
| |
| |
|
| Germany (continued) | | | | |
| Stada Arzneimittel | | 7,000 | | 430,311 |
| Vivacon | | 18,530 | | 350,803 |
| Wincor Nixdorf | | 6,330 | | 601,500 |
| | | | | 6,610,192 |
| Greece—.6% | | | | |
| Folli-Follie | | 10,760 | | 401,117 |
| Metka | | 4,270 | | 96,257 |
| | | | | 497,374 |
| Hong Kong—3.1% | | | | |
| Kowloon Development | | 193,000 | | 500,019 |
| Neo-China Group Holdings | | 499,500 | | 440,119 |
| Pacific Basin Shipping | | 182,000 | | 293,650 |
| Vtech Holdings | | 59,000 | | 423,758 |
| Wing Hang Bank | | 43,000 | | 643,602 |
| Wing Lung Bank | | 42,200 | | 516,885 |
| | | | | 2,818,033 |
| Ireland—2.5% | | | | |
| DCC | | 23,830 | | 674,795 |
| Greencore Group | | 56,220 | | 368,203 |
| IAWS Group | | 19,940 | | 441,628 |
| Kerry Group, Cl. A | | 23,220 | | 744,762 |
| | | | | 2,229,388 |
| Italy—3.7% | | | | |
| Azimut Holding | | 52,500 | | 680,388 |
| Banca Popolare di Milano | | 18,940 | | 258,056 |
| Credito Emiliano | | 33,500 | | 462,312 |
| Fondiaria-SAI | | 9,140 | | 376,803 |
| Marr | | 27,000 | | 276,221 |
| Milano Assicurazioni | | 52,470 | | 410,147 |
| Prysmian | | 18,120 a | | 447,411 |
| Recordati | | 45,630 | | 407,511 |
| | | | | 3,318,849 |
| Japan—13.3% | | | | |
| Ardepro | | 2,404 | | 527,072 |
| Atrium | | 10,500 | | 217,614 |
The Fund 11
STATEMENT OF INVESTMENTS (continued)
| Common Stocks (continued) | | Shares | | Value ($) |
| |
| |
|
| Japan (continued) | | | | |
| Chugoku Marine Paints | | 44,000 | | 401,397 |
| DON Quijote | | 25,200 | | 496,329 |
| Foster Electric | | 9,500 | | 265,354 |
| Hisamitsu Pharmaceutical | | 17,000 | | 517,457 |
| Hitachi Construction Machinery | | 14,400 | | 431,871 |
| Hitachi Kokusai Electric | | 36,000 | | 441,218 |
| Hogy Medical | | 7,000 | | 295,166 |
| Joint | | 13,900 | | 270,036 |
| K’s Holdings | | 15,300 | | 399,964 |
| Kenedix | | 398 | | 644,924 |
| Kintetsu World Express | | 9,800 | | 342,167 |
| Koito Manufacturing | | 29,000 | | 396,186 |
| Kuroda Electric | | 26,100 | | 371,756 |
| Mitsumi Electric | | 7,200 | | 244,942 |
| Nihon Dempa Kogyo | | 5,600 | | 274,736 |
| Nihon Kohden | | 10,900 | | 260,546 |
| Nippon Sheet Glass | | 47,000 | | 240,260 |
| Nippon Synthetic Chemical Industry | | 68,000 | | 353,089 |
| Nissan Chemical Industries | | 35,000 | | 457,789 |
| Nissin Kogyo | | 26,400 | | 619,230 |
| NSD | | 30,900 | | 409,695 |
| O-M | | 29,000 | | 250,018 |
| Star Micronics | | 13,900 | | 305,501 |
| Takeuchi Manufacturing | | 6,100 | | 245,201 |
| Toho Pharmaceutical | | 24,900 | | 485,962 |
| Tokai Rika | | 23,100 | | 723,814 |
| Toyo Engineering | | 59,000 | | 293,151 |
| Urban | | 19,200 | | 256,974 |
| Yamaguchi Financial Group | | 52,000 | | 605,658 |
| | | | | 12,045,077 |
| Luxembourg—1.2% | | | | |
| Millicom International Cellular | | 4,200 a | | 495,348 |
| Oriflame Cosmetics | | 8,800 | | 562,479 |
| | | | | 1,057,827 |
| Netherlands—3.7% | | | | |
| AerCap Holdings | | 12,800 a | | 267,136 |
| ASM International | | 12,500 | | 306,086 |
12
| Common Stocks (continued) | | Shares | | Value ($) |
| |
| |
|
| Netherlands (continued) | | | | |
| Core Laboratories | | 3,000 a | | 374,160 |
| Fugro | | 9,190 | | 709,362 |
| Imtech | | 12,500 | | 309,558 |
| Koninklijke BAM Groep | | 10,500 | | 247,135 |
| Koninklijke Ten Cate NV | | 8,040 | | 250,001 |
| Nutreco Holdings | | 7,160 | | 414,083 |
| TomTom | | 6,370 a | | 479,585 |
| | | | | 3,357,106 |
| Norway—.3% | | | | |
| Tandberg | | 12,400 | | 259,290 |
| Singapore—1.2% | | | | |
| Allgreen Properties | | 374,000 | | 387,255 |
| Singapore Petroleum | | 72,000 | | 378,763 |
| Wing Tai Holdings | | 179,800 | | 337,359 |
| | | | | 1,103,377 |
| South Korea—5.4% | | | | |
| CJ Internet | | 14,930 | | 256,891 |
| Daegu Bank | | 12,990 | | 215,875 |
| Daelim Industrial | | 2,820 | | 539,468 |
| Forhuman | | 9,445 a | | 300,806 |
| Hite Brewery | | 3,470 | | 528,455 |
| Honam Petrochemical | | 3,360 | | 378,839 |
| Hyundai Mipo Dockyard | | 2,460 | | 758,480 |
| Jusung Engineering | | 23,960 a | | 460,917 |
| Korea Zinc | | 2,720 | | 379,352 |
| LG Telecom | | 27,920 a | | 293,612 |
| Osstem Implant | | 7,623 a | | 259,884 |
| Pusan Bank | | 32,480 | | 544,978 |
| | | | | 4,917,557 |
| Spain—5.0% | | | | |
| Bolsas y Mercados Espanoles | | 8,160 | | 555,897 |
| Espanola de Tubos Por Extrusion | | 39,510 | | 385,835 |
| Fomento de Construcciones y Contratas | | 7,890 | | 592,869 |
| Gestevision Telecinco | | 17,400 | | 445,404 |
| Laboratorios Almirall | | 11,950 a | | 262,920 |
| Obrascon Huarte Lain | | 6,500 | | 218,840 |
| Red Electrica de Espana | | 5,200 | | 328,706 |
The Fund 13
STATEMENT OF INVESTMENTS (continued)
| Common Stocks (continued) | | Shares | | Value ($) |
| |
| |
|
| Spain (continued) | | | | |
| Sol Melia | | 20,170 | | 307,250 |
| Union Fenosa | | 16,910 | | 1,141,853 |
| Viscofan | | 13,200 | | 279,422 |
| | | | | 4,518,996 |
| Sweden—1.5% | | | | |
| Getinge, Cl. B | | 11,400 | | 306,110 |
| NCC, Cl. B | | 20,900 | | 449,608 |
| Peab | | 35,200 | | 363,636 |
| Trelleborg, Cl. B | | 9,600 | | 201,319 |
| | | | | 1,320,673 |
| Switzerland—5.6% | | | | |
| Actelion | | 6,190 a | | 284,645 |
| Galenica | | 1,175 | | 513,848 |
| Holcim | | 8,750 | | 937,693 |
| Julius Baer Holding | | 8,360 | | 691,312 |
| Rieter Holdings | | 1,013 | | 447,478 |
| Sika Finanz AG | | 317 | | 598,208 |
| Swatch Group | | 2,620 | | 789,889 |
| Syngenta | | 2,170 | | 553,092 |
| Vontobel Holding | | 5,200 | | 251,524 |
| | | | | 5,067,689 |
| United Kingdom—18.6% | | | | |
| Amlin | | 59,600 | | 353,512 |
| Antofagasta | | 20,500 | | 292,560 |
| Axon Group | | 25,900 | | 271,677 |
| British Airways | | 50,780 a | | 313,073 |
| Burren Energy | | 11,560 | | 280,021 |
| Cable & Wireless | | 120,060 | | 446,317 |
| Cattles | | 50,660 | | 296,452 |
| Charter | | 16,680 a | | 263,442 |
| Cookson Group | | 39,710 | | 550,902 |
| Croda International | | 29,000 | | 335,364 |
| Dairy Crest Group | | 40,400 | | 468,804 |
| Dana Petroleum | | 25,350 a | | 702,359 |
| De La Rue | | 21,532 | | 416,575 |
14
| Common Stocks (continued) | | Shares | | Value ($) |
| |
| |
|
| United Kingdom (continued) | | | | |
| DS Smith | | 80,650 | | 333,210 |
| Enterprise Inns | | 32,260 | | 312,705 |
| Firstgroup | | 26,800 | | 430,718 |
| Galliford Try | | 101,800 | | 208,702 |
| GKN | | 91,890 | | 515,774 |
| Greene King | | 28,280 | | 450,310 |
| Inchcape | | 63,420 | | 477,786 |
| Informa | | 52,680 | | 484,166 |
| International Power | | 71,790 | | 648,012 |
| Interserve | | 33,900 | | 323,204 |
| Kesa Electricals | | 79,140 | | 367,811 |
| Kier Group | | 9,345 | | 271,007 |
| McBride | | 128,680 | | 279,177 |
| Michael Page International | | 66,670 | | 382,177 |
| Morgan Crucible | | 57,970 | | 233,481 |
| Morgan Sindall | | 10,710 | | 221,486 |
| N Brown Group | | 64,346 | | 303,217 |
| Next | | 16,510 | | 529,922 |
| Petrofac | | 63,500 | | 695,149 |
| Qinetiq | | 123,830 | | 485,550 |
| Regus Group | | 133,110 | | 217,458 |
| Restaurant Group | | 106,612 | | 396,816 |
| Rightmove | | 27,510 | | 254,068 |
| Savills | | 42,150 | | 234,908 |
| Southern Cross Healthcare | | 23,960 | | 252,758 |
| Speedy Hire | | 11,681 | | 194,834 |
| Spirent Communications | | 308,700 a | | 380,952 |
| Sthree | | 34,140 | | 151,534 |
| Thomas Cook Group | | 94,390 a | | 518,346 |
| Vedanta Resources | | 11,260 | | 458,549 |
| Venture Production | | 16,820 | | 265,150 |
| Wood Group (John) | | 74,150 | | 639,059 |
| | | | | 16,909,054 |
| Total Common Stocks | | | | |
| (cost $81,467,274) | | | | 86,825,620 |
The Fund 15
STATEMENT OF INVESTMENTS (continued)
| Preferred Stocks—1.9% | | Shares | | Value ($) |
| |
| |
|
| Germany | | | | |
| Fresenius | | 9,770 | | 812,691 |
| Fuchs Petrolub | | 4,700 | | 416,310 |
| Hugo Boss | | 8,090 | | 461,245 |
| Total Preferred Stocks | | | | |
| (cost $1,259,064) | | | | 1,690,246 |
| |
| |
|
| | | Principal | | |
| Short-Term Investments—.1% | | Amount ($) | | Value ($) |
| |
| |
|
| U.S. Treasury Bills; | | | | |
| 4.13%, 3/20/08 | | | | |
| (cost $94,423) | | 95,000 b | | 94,353 |
| |
| |
|
| Total Investments (cost $82,820,761) | | 98.0% | | 88,610,219 |
| Cash and Receivables (Net) | | 2.0% | | 1,782,565 |
| Net Assets | | 100.0% | | 90,392,784 |
| a | | Non-income producing security. |
| b | | All or partially held by a broker as collateral for open financial futures positions. |
| Portfolio Summary | | (Unaudited) † | | | | |
| |
| | | Value (%) | | | | Value (%) |
| |
| |
| |
|
| United Kingdom | | 18.6 | | Ireland | | 2.5 |
| Japan | | 13.3 | | Finland | | 1.5 |
| Germany | | 9.2 | | Sweden | | 1.5 |
| France | | 8.5 | | Belgium | | 1.4 |
| Canada | | 6.2 | | Singapore | | 1.2 |
| Switzerland | | 5.6 | | Luxembourg | | 1.2 |
| South Korea | | 5.4 | | Denmark | | .9 |
| Spain | | 5.0 | | Greece | | .6 |
| Australia | | 4.5 | | Norway | | .3 |
| Netherlands | | 3.7 | | US Treasury Bills | | .1 |
| Italy | | 3.7 | | | | |
| Hong Kong | | 3.1 | | | | 98.0 |
| † Based on net assets. |
| See notes to financial statements. |
16
STATEMENT OF FINANCIAL FUTURES
December 31, 2007
|
| | | | | | | | | Unrealized |
| | | | | Market Value | | | | Appreciation |
| | | | | Covered by | | | | (Depreciation) |
| | | Contracts | | Contracts ($) | | Expiration | | at 12/31/2007 ($) |
| |
| |
| |
| |
|
| Financial Futures Long | | | | | | | | |
| MSCI Pan Euro | | 30 | | 1,083,270 | | March 2008 | | 7,497 |
| Topix | | 2 | | 263,205 | | March 2008 | | (17,353) |
| | | | | | | | | (9,856) |
See notes to financial statements.
The Fund 17
STATEMENT OF ASSETS AND LIABILITIES
December 31, 2007
|
| | | Cost | | Value |
| |
| |
|
| Assets ($): | | | | |
| Investments in securities—See Statement of Investments | | 82,820,761 | | 88,610,219 |
| Cash | | | | 1,229,141 |
| Cash denominated in foreign currencies | | 539,754 | | 543,267 |
| Receivable for investment securities sold | | | | 252,437 |
| Dividends and interest receivable | | | | 220,334 |
| Receivable for shares of Common Stock subscribed | | | | 8,755 |
| Unrealized appreciation on forward currency | | | | |
| exchange contracts—Note 4 | | | | 414 |
| Prepaid expenses | | | | 34,873 |
| Other assets | | | | 145,189 |
| | | | | 91,044,629 |
| |
| |
|
| Liabilities ($): | | | | |
| Due to Founders Asset Management LLC and affiliates—Note 3(c) | | 171,789 |
| Payable for investment securities purchased | | | | 129,690 |
| Payable for shares of Common Stock redeemed | | | | 87,543 |
| Payable for futures variation margin—Note 4 | | | | 639 |
| Interest payable—Note 2 | | | | 79 |
| Directors’ deferred compensation | | | | 145,189 |
| Accrued expenses | | | | 116,916 |
| | | | | 651,845 |
| |
| |
|
| Net Assets ($) | | | | 90,392,784 |
| |
| |
|
| Composition of Net Assets ($): | | | | |
| Paid-in capital | | | | 169,370,770 |
| Accumulated distributions in excess of investment income—net | | (240,574) |
| Accumulated net realized gain (loss) on investments | | | | (84,536,669) |
| Accumulated net unrealized appreciation (depreciation) | | | | |
| on investments and foreign currency transactions [including | | |
| ($9,856) net unrealized depreciation on financial futures] | | 5,799,257 |
| |
|
| Net Assets ($) | | | | 90,392,784 |
| Net Asset Value Per Share | | | | | | | | | | |
| | | Class A | | Class B | | Class C | | Class F | | Class I | | Class T |
| |
| |
| |
| |
| |
| |
|
| Net Assets ($) | | 22,653,449 | | 1,282,547 | | 5,051,905 | | 60,918,039 | | 152,423 | | 334,421 |
| Shares Outstanding | | 878,098 | | 53,119 | | 207,940 | | 2,357,709 | | 6,056 | | 13,614 |
| |
| |
| |
| |
| |
| |
|
| Net Asset Value | | | | | | | | | | | | |
| Per Share ($) | | 25.80 | | 24.14 | | 24.30 | | 25.84 | | 25.17 | | 24.56 |
See notes to financial statements.
18
| | STATEMENT OF OPERATIONS
Year Ended December 31, 2007
|
| Investment Income ($): | | |
| Income: | | |
| Cash dividends (net of $201,393 foreign taxes withheld at source): | | |
| Unaffiliated issuers | | 1,897,466 |
| Affiliated issuers | | 43,226 |
| Interest | | 12,985 |
| Total Income | | 1,953,677 |
| Expenses: | | |
| Investment advisory fee—Note 3(a) | | 1,078,258 |
| Shareholder servicing costs—Note 3(c) | | 344,064 |
| Distribution fees—Note 3(b) | | 190,069 |
| Custodian fees—Note 3(c) | | 128,227 |
| Accounting fees—Note 3 (c) | | 107,826 |
| Professional fees | | 58,808 |
| Registration fees | | 49,565 |
| Directors’ fees and expenses—Note 3(d) | | 44,128 |
| Prospectus and shareholders’ reports | | 40,291 |
| Interest expense—Note 2 | | 4,625 |
| Loan commitment fees—Note 2 | | 1,877 |
| Miscellaneous | | 46,215 |
| Total Expenses | | 2,093,953 |
| Less—reduction in accounting fees—Note 3 (c) | | (35,768) |
| Less—reduction in custody fees | | |
| due to earnings credits—Note 1(c) | | (32,573) |
| Less—reduction in investment advisory fees—Note 3(a) | | (74,597) |
| Net Expenses | | 1,951,015 |
| Investment Income—Net | | 2,662 |
| |
|
| Realized and Unrealized Gain (Loss) on Investments—Note 4 ($): |
| Net realized gain (loss) on investments and foreign currency transactions | | 22,329,830 |
| Net realized gain (loss) on financial futures | | 136,878 |
| Net realized gain (loss) on forward currency exchange contracts | | 120,110 |
| Net Realized Gain (Loss) | | 22,586,818 |
| Net unrealized appreciation (depreciation) on investments | | |
| and foreign currency transactions [including ($23,669) | | |
| net unrealized depreciation on financial futures] | | (22,365,031) |
| Net Realized and Unrealized Gain (Loss) on Investments | | 221,787 |
| Net Increase in Net Assets Resulting from Operations | | 224,449 |
See notes to financial statements.
The Fund 19
STATEMENT OF CHANGES IN NET ASSETS
| | | Year Ended December 31, |
| |
|
| | | 2007 a | | 2006 |
| |
| |
|
| Operations ($): | | | | |
| Investment income (loss)—net | | 2,662 | | (285,634) |
| Net realized gain (loss) on investments | | 22,586,818 | | 12,077,935 |
| Net unrealized appreciation | | | | |
| (depreciation) on investments | | (22,365,031) | | 17,524,405 |
| Net Increase (Decrease) in Net Assets | | | | |
| Resulting from Operations | | 224,449 | | 29,316,706 |
| |
| |
|
| Dividends to Shareholders from ($): | | | | |
| Investment income—net: | | | | |
| Class A shares | | (110,276) | | — |
| Class F shares | | (312,146) | | — |
| Class I shares | | (1,150) | | — |
| Total Dividends | | (423,572) | | — |
| |
| |
|
| Capital Stock Transactions ($): | | | | |
| Net proceeds from shares sold: | | | | |
| Class A shares | | 2,359,867 | | 17,497,801 |
| Class B shares | | 57,708 | | 107,874 |
| Class C shares | | 136,054 | | 405,353 |
| Class F shares | | 2,179,451 | | 7,998,811 |
| Class I shares | | 38,680 | | 56,702 |
| Class T shares | | 225 | | 48,181 |
| Dividends reinvested: | | | | |
| Class A shares | | 88,366 | | — |
| Class F shares | | 300,765 | | — |
| Class I shares | | 1,096 | | — |
| Cost of shares redeemed: | | | | |
| Class A shares | | (9,670,277) | | (17,033,564) |
| Class B shares | | (1,398,713) | | (16,125,589) |
| Class C shares | | (2,247,031) | | (2,712,046) |
| Class F shares | | (13,308,058) | | (17,851,176) |
| Class I shares | | (85,982) | | (222,631) |
| Class T shares | | (280,599) | | (28,123) |
| Increase (Decrease) in Net Assets | | | | |
| from Capital Stock Transactions | | (21,828,448) | | (27,858,407) |
| Total Increase (Decrease) in Net Assets | | (22,027,571) | | 1,458,299 |
| |
| |
|
| Net Assets ($): | | | | |
| Beginning of Period | | 112,420,355 | | 110,962,056 |
| End of Period | | 90,392,784 | | 112,420,355 |
| Investment (loss)—net | | (240,574) | | (196,536) |
20
| | | Year Ended December 31, |
| |
|
| | | 2007 a | | 2006 |
| |
| |
|
| Capital Share Transactions: | | | | |
| Class A b | | | | |
| Shares sold | | 84,664 | | 780,495 |
| Shares issued for dividends reinvested | | 3,480 | | — |
| Shares redeemed | | (347,430) | | (743,011) |
| Net Increase (Decrease) in Shares Outstanding | | (259,286) | | 37,484 |
| |
| |
|
| Class B b | | | | |
| Shares sold | | 2,163 | | 5,224 |
| Shares redeemed | | (54,150) | | (758,437) |
| Net Increase (Decrease) in Shares Outstanding | | (51,987) | | (753,213) |
| |
| |
|
| Class C | | | | |
| Shares sold | | 5,275 | | 18,427 |
| Shares redeemed | | (87,181) | | (124,386) |
| Net Increase (Decrease) in Shares Outstanding | | (81,906) | | (105,959) |
| |
| |
|
| Class F | | | | |
| Shares sold | | 79,141 | | 351,691 |
| Shares issued for dividends reinvested | | 11,832 | | — |
| Shares redeemed | | (481,661) | | (791,790) |
| Net Increase (Decrease) in Shares Outstanding | | (390,688) | | (440,099) |
| |
| |
|
| Class I | | | | |
| Shares sold | | 1,393 | | 2,610 |
| Shares issued for dividends reinvested | | 44 | | — |
| Shares redeemed | | (3,191) | | (10,635) |
| Net Increase (Decrease) in Shares Outstanding | | (1,754) | | (8,025) |
| |
| |
|
| Class T | | | | |
| Shares sold | | 8 | | 2,217 |
| Shares redeemed | | (10,502) | | (1,295) |
| Net Increase (Decrease) in Shares Outstanding | | (10,494) | | 922 |
| a | | Effective June 1, 2007, Class R shares were redesignated as Class I shares. |
| b | | During the period ended December 31, 2007, 29,942 Class B shares representing $771,552, were automatically |
| | | converted to 28,062 Class A shares and during the period ended December 31, 2006, 537,890 Class B shares |
| | | representing $11,394,019 were automatically converted to 510,894 Class A shares. |
| See notes to financial statements. |
The Fund 21
FINANCIAL HIGHLIGHTS
The following tables describe the performance for each share class for the fiscal periods indicated.All information (except portfolio turnover rate) reflects financial results for a single fund share.Total return shows how much your investment in the fund would have increased (or decreased) during each period, assuming you had reinvested all dividends and distributions.These figures have been derived from the fund’s financial statements.
| | | | | Year Ended December 31, | | |
| |
| |
| |
|
| Class A Shares | | 2007 | | 2006 | | 2005 | | 2004 | | 2003 |
| |
| |
| |
| |
| |
|
| Per Share Data ($): | | | | | | | | | | |
| Net asset value, beginning of period | | 26.22 | | 20.10 | | 16.76 | | 14.24 | | 8.14 |
| Investment Operations: | | | | | | | | | | |
| Investment income (loss)—net | | (.01)a | | (.01)a | | (.14)a | | (.11)a | | .10 |
| Net realized and unrealized | | | | | | | | | | |
| gain (loss) on investments | | (.28) | | 6.13 | | 3.48 | | 2.63 | | 6.00 |
| Total from Investment Operations | | (.29) | | 6.12 | | 3.34 | | 2.52 | | 6.10 |
| Distributions: | | | | | | | | | | |
| Dividends from investment income—net | | (.13) | | — | | — | | — | | — |
| Net asset value, end of period | | 25.80 | | 26.22 | | 20.10 | | 16.76 | | 14.24 |
| |
| |
| |
| |
| |
|
| Total Return (%) b | | (1.15) | | 30.45 | | 19.93 | | 17.70 | | 74.94 |
| |
| |
| |
| |
| |
|
| Ratios/Supplemental Data (%): | | | | | | | | | | |
| Ratio of total expenses | | | | | | | | | | |
| to average net assets | | 2.00 | | 1.87 | | 2.29 | | 2.02 | | 2.54 |
| Ratio of net expenses | | | | | | | | | | |
| to average net assets | | 1.87 | | 1.78 | | 2.12 | | 1.92 | | 2.45 |
| Ratio of net investment (loss) | | | | | | | | | | |
| to average net assets | | (.05) | | (.05) | | (.82) | | (.77) | | (.83) |
| Portfolio Turnover Rate | | 93 | | 73 | | 729 | | 648 | | 707 |
| |
| |
| |
| |
| |
|
| Net Assets, end of period ($ x 1,000) | | 22,653 | | 29,817 | | 22,107 | | 19,726 | | 27,252 |
| a | | Based on average shares outstanding at each month end. |
| b | | Exclusive of sales charge. |
| See notes to financial statements. |
22
| | | | | Year Ended December 31, | | |
| |
| |
| |
|
| Class B Shares | | 2007 | | 2006 | | 2005 | | 2004 | | 2003 |
| |
| |
| |
| |
| |
|
| Per Share Data ($): | | | | | | | | | | |
| Net asset value, beginning of period | | 24.65 | | 19.13 | | 16.09 | | 13.79 | | 7.95 |
| Investment Operations: | | | | | | | | | | |
| Investment (loss)—net | | (.26)a | | (.22)a | | (.28)a | | (.23)a | | (.31) |
| Net realized and unrealized | | | | | | | | | | |
| gain (loss) on investments | | (.25) | | 5.74 | | 3.32 | | 2.53 | | 6.15 |
| Total from Investment Operations | | (.51) | | 5.52 | | 3.04 | | 2.30 | | 5.84 |
| Net asset value, end of period | | 24.14 | | 24.65 | | 19.13 | | 16.09 | | 13.79 |
| |
| |
| |
| |
| |
|
| Total Return (%) b | | (2.11) | | 28.91 | | 18.89 | | 16.68 | | 73.46 |
| |
| |
| |
| |
| |
|
| Ratios/Supplemental Data (%): | | | | | | | | | | |
| Ratio of total expenses | | | | | | | | | | |
| to average net assets | | 2.98 | | 2.85 | | 3.13 | | 2.89 | | 3.38 |
| Ratio of net expenses | | | | | | | | | | |
| to average net assets | | 2.87 | | 2.77 | | 2.97 | | 2.78 | | 3.29 |
| Ratio of net investment (loss) | | | | | | | | | | |
| to average net assets | | (1.03) | | (1.17) | | (1.66) | | (1.63) | | (1.44) |
| Portfolio Turnover Rate | | 93 | | 73 | | 729 | | 648 | | 707 |
| |
| |
| |
| |
| |
|
| Net Assets, end of period ($ x 1,000) | | 1,283 | | 2,591 | | 16,421 | | 17,917 | | 18,198 |
| a | | Based on average shares outstanding at each month end. |
| b | | Exclusive of sales charge. |
| See notes to financial statements. |
The Fund 23
FINANCIAL HIGHLIGHTS (continued)
| | | | | Year Ended December 31, | | |
| |
| |
| |
|
| Class C Shares | | 2007 | | 2006 | | 2005 | | 2004 | | 2003 |
| |
| |
| |
| |
| |
|
| Per Share Data ($): | | | | | | | | | | |
| Net asset value, beginning of period | | 24.73 | | 19.12 | | 16.07 | | 13.76 | | 7.93 |
| Investment Operations: | | | | | | | | | | |
| Investment (loss)—net | | (.19)a | | (.19)a | | (.27)a | | (.22)a | | (.01) |
| Net realized and unrealized | | | | | | | | | | |
| gain (loss) on investments | | (.24) | | 5.80 | | 3.32 | | 2.53 | | 5.84 |
| Total from Investment Operations | | (.43) | | 5.61 | | 3.05 | | 2.31 | | 5.83 |
| Net asset value, end of period | | 24.30 | | 24.73 | | 19.12 | | 16.07 | | 13.76 |
| |
| |
| |
| |
| |
|
| Total Return (%) b | | (1.82) | | 29.39 | | 18.98 | | 16.79 | | 73.52 |
| |
| |
| |
| |
| |
|
| Ratios/Supplemental Data (%): | | | | | | | | | | |
| Ratio of total expenses | | | | | | | | | | |
| to average net assets | | 2.68 | | 2.68 | | 3.08 | | 2.81 | | 3.34 |
| Ratio of net expenses | | | | | | | | | | |
| to average net assets | | 2.55 | | 2.60 | | 2.92 | | 2.70 | | 3.25 |
| Ratio of net investment (loss) | | | | | | | | | | |
| to average net assets | | (.73) | | (.89) | | (1.60) | | (1.55) | | (1.43) |
| Portfolio Turnover Rate | | 93 | | 73 | | 729 | | 648 | | 707 |
| |
| |
| |
| |
| |
|
| Net Assets, end of period ($ x 1,000) | | 5,052 | | 7,169 | | 7,568 | | 10,249 | | 10,639 |
| a | | Based on average shares outstanding at each month end. |
| b | | Exclusive of sales charge. |
| See notes to financial statements. |
24
| | | | | Year Ended December 31, | | |
| |
| |
| |
|
| Class F Shares | | 2007 | | 2006 | | 2005 | | 2004 | | 2003 |
| |
| |
| |
| |
| |
|
| Per Share Data ($): | | | | | | | | | | |
| Net asset value, beginning of period | | 26.21 | | 20.11 | | 16.76 | | 14.24 | | 8.13 |
| Investment Operations: | | | | | | | | | | |
| Investment income (loss)—net | | .03a | | (.04)a | | (.13)a | | (.11)a | | (.14) |
| Net realized and unrealized | | | | | | | | | | |
| gain (loss) on investments | | (.27) | | 6.14 | | 3.48 | | 2.63 | | 6.25 |
| Total from Investment Operations | | (.24) | | 6.10 | | 3.35 | | 2.52 | | 6.11 |
| Distributions: | | | | | | | | | | |
| Dividends from investment income—net | | (.13) | | — | | — | | — | | — |
| Net asset value, end of period | | 25.84 | | 26.21 | | 20.11 | | 16.76 | | 14.24 |
| |
| |
| |
| |
| |
|
| Total Return (%) | | (.94) | | 30.33 | | 19.99 | | 17.70 | | 75.15 |
| |
| |
| |
| |
| |
|
| Ratios/Supplemental Data (%): | | | | | | | | | | |
| Ratio of total expenses | | | | | | | | | | |
| to average net assets | | 1.82 | | 1.93 | | 2.24 | | 2.00 | | 2.40 |
| Ratio of net expenses | | | | | | | | | | |
| to average net assets | | 1.69 | | 1.85 | | 2.08 | | 1.89 | | 2.31 |
| Ratio of net investment income | | | | | | | | | | |
| (loss) to average net assets | | .12 | | (.20) | | (.76) | | (.75) | | (.45) |
| Portfolio Turnover Rate | | 93 | | 73 | | 729 | | 648 | | 707 |
| |
| |
| |
| |
| |
|
| Net Assets, end of period ($ x 1,000) | | 60,918 | | 72,043 | | 64,112 | | 75,677 | | 78,759 |
a Based on average shares outstanding at each month end. See notes to financial statements.
The Fund 25
FINANCIAL HIGHLIGHTS (continued)
| | | | | Year Ended December 31, | | |
| |
| |
| |
|
| Class I Shares | | 2007 a | | 2006 | | 2005 | | 2004 | | 2003 |
| |
| |
| |
| |
| |
|
| Per Share Data ($): | | | | | | | | | | |
| Net asset value, beginning of period | | 25.60 | | 19.60 | | 16.31 | | 13.82 | | 7.87 |
| Investment Operations: | | | | | | | | | | |
| Investment income (loss)—net | | .04b | | .03b | | (.12)b | | (.07)b | | .54 |
| Net realized and unrealized | | | | | | | | | | |
| gain (loss) on investments | | (.28) | | 5.97 | | 3.41 | | 2.56 | | 5.41 |
| Total from Investment Operations | | (.24) | | 6.00 | | 3.29 | | 2.49 | | 5.95 |
| Distributions: | | | | | | | | | | |
| Dividends from investment income—net | | (.19) | | — | | — | | — | | — |
| Net asset value, end of period | | 25.17 | | 25.60 | | 19.60 | | 16.31 | | 13.82 |
| |
| |
| |
| |
| |
|
| Total Return (%) | | (.98) | | 30.61 | | 20.17 | | 18.02 | | 75.60 |
| |
| |
| |
| |
| |
|
| Ratios/Supplemental Data (%): | | | | | | | | | | |
| Ratio of total expenses | | | | | | | | | | |
| to average net assets | | 1.83 | | 1.68 | | 2.08 | | 1.79 | | 2.17 |
| Ratio of net expenses | | | | | | | | | | |
| to average net assets | | 1.71 | | 1.61 | | 1.89 | | 1.68 | | 2.07 |
| Ratio of net investment income | | | | | | | | | | |
| (loss) to average net assets | | .13 | | .09 | | (.69) | | (.51) | | (.32) |
| Portfolio Turnover Rate | | 93 | | 73 | | 729 | | 648 | | 707 |
| |
| |
| |
| |
| |
|
| Net Assets, end of period ($ x 1,000) | | 152 | | 200 | | 310 | | 190 | | 142 |
| a | | Effective June 1, 2007, Class R shares were redesignated as Class I shares. |
| b | | Based on average shares outstanding at each month end. |
| See notes to financial statements. |
26
| | | | | Year Ended December 31, | | |
| |
| |
| |
|
| Class T Shares | | 2007 | | 2006 | | 2005 | | 2004 | | 2003 |
| |
| |
| |
| |
| |
|
| Per Share Data ($): | | | | | | | | | | |
| Net asset value, beginning of period | | 24.90 | | 19.16 | | 16.05 | | 13.70 | | 7.87 |
| Investment Operations: | | | | | | | | | | |
| Investment (loss)—net | | (.07)a | | (.11)a | | (.21)a | | (.17)a | | (.24) |
| Net realized and unrealized | | | | | | | | | | |
| gain (loss) on investments | | (.27) | | 5.85 | | 3.32 | | 2.52 | | 6.07 |
| Total from Investment Operations | | (.34) | | 5.74 | | 3.11 | | 2.35 | | 5.83 |
| Net asset value, end of period | | 24.56 | | 24.90 | | 19.16 | | 16.05 | | 13.70 |
| |
| |
| |
| |
| |
|
| Total Return (%) b | | (1.37) | | 29.96 | | 19.38 | | 17.15 | | 74.08 |
| |
| |
| |
| |
| |
|
| Ratios/Supplemental Data (%): | | | | | | | | | | |
| Ratio of total expenses | | | | | | | | | | |
| to average net assets | | 2.21 | | 2.26 | | 2.70 | | 2.47 | | 3.16 |
| Ratio of net expenses | | | | | | | | | | |
| to average net assets | | 2.10 | | 2.18 | | 2.54 | | 2.36 | | 3.07 |
| Ratio of net investment (loss) | | | | | | | | | | |
| to average net assets | | (.26) | | (.54) | | (1.24) | | (1.21) | | (1.06) |
| Portfolio Turnover Rate | | 93 | | 73 | | 729 | | 648 | | 707 |
| |
| |
| |
| |
| |
|
| Net Assets, end of period ($ x 1,000) | | 334 | | 600 | | 444 | | 510 | | 522 |
| a | | Based on average shares outstanding at each month end. |
| b | | Exclusive of sales charge. |
| See notes to financial statements. |
The Fund 27
NOTES TO FINANCIAL STATEMENTS
NOTE 1—Significant Accounting Policies:
Dreyfus Founders Passport Fund (the “fund”) is a separate diversified series of Dreyfus Founders Funds, Inc. (the “Company”), which is registered under the Investment Company Act of 1940, as amended (the “Act”), as an open-end management investment company and operates as a series company currently offering six series, including the fund.The fund’s investment objective is to seek capital appreciation through investments in foreign small-cap companies. Founders Asset Management LLC (“Founders”) serves as the fund’s investment adviser. During the first half of the reporting period, Founders was an indirect, wholly-owned subsidiary of Mellon Financial Corporation (“Mellon Financial”).
On July 1, 2007, Mellon Financial and The Bank of New York Company, Inc. merged, forming The Bank of New York Mellon Corporation (“BNY Mellon”). As part of this transaction, Founders became an indirect, wholly-owned subsidiary of BNY Mellon.
The Company’s Board of Directors approved the redesignation of the fund’s Class R shares to Class I shares, effective June 1, 2007.The eligibility requirements for Class I shares remained the same as for Class R shares.
MBSC Securities Corporation (the “Distributor”), the direct owner of Founders and a wholly-owned subsidiary of The Dreyfus Corporation (“Dreyfus”), an affiliate of Founders, served as the distributor of the fund’s shares.The fund is authorized to issue up to 600 million shares of Common Stock, par value $ .01 per share, in the following classes of shares: Class A, Class B, Class C, Class F, Class I and Class T shares. Class A and Class T shares are subject to a sales charge imposed at the time of purchase, although the shares may be purchased at net asset value (“NAV”) without a sales charge by certain categories of investors. Class B shares are subject to a contingent deferred sales charge (“CDSC”) imposed on Class B share redemptions made within six years of purchase and automatically convert to Class A shares after six years.The fund does not offer Class B shares, except in connection with dividend reinvestment and permitted exchanges of Class B shares.
28
Class C shares are subject to a CDSC imposed on Class C shares redeemed within one year of purchase. Class F and Class I shares are sold at NAV per share. Class F shares are sold only to Class F grandfathered investors, and Class I shares are sold only to eligible institutional investors. Other differences between the classes include the services offered to and the expenses borne by each class. Income and realized and unrealized gains or losses on investments are allocated to each class of shares based on its relative net assets.
Each class of the fund bears expenses incurred specifically on its behalf and, in addition, each class bears a portion of general expenses based on the relative net assets or the number of shareholder accounts of the class.The type of expense determines the allocation method.
The fund’s financial statements are prepared in accordance with U.S. generally accepted accounting principles, which require the use of management estimates and assumptions. Actual results could differ from those estimates.
The fund enters into contracts that contain a variety of indemnifications. The fund’s maximum exposure under these arrangements is unknown.The fund does not anticipate recognizing any loss related to these arrangements.
(a) Portfolio valuation: A domestic equity security listed or traded on a securities exchange or in the over-the-counter market is valued at its last sale price on the exchange or market where it is principally traded or, in the case of a security traded on NASDAQ, at its official closing price. Lacking any sales on that day, the security is valued at the current closing bid price, or by quotes from dealers making a market in the security if the closing bid price is not available, or in the case of written call options, at the mean between the highest bid and lowest asked quotations obtained from at least two securities dealers.
A foreign equity security traded on a foreign exchange is valued at the last quoted official closing price available before the time when the fund’s assets are valued, or at the last quoted sales price if the exchange
The Fund 29
NOTES TO FINANCIAL STATEMENTS (continued)
does not provide an official closing price or if the foreign market has not yet closed. Lacking any sales that day, the security is valued at the current closing bid price, or by quotes from dealers making a market in the security if the closing bid price is not available. New York closing exchange rates are used to convert foreign currencies to U.S. dollars.
A debt security with a remaining maturity greater than 60 days at the time of purchase is valued in accordance with the evaluated bid price supplied by a pricing service approved by the Company’s Board of Directors or, if such price is not available, at the mean between the highest bid and lowest asked quotations obtained from at least two securities dealers.A debt security with a remaining maturity of 60 days or less at the time of purchase is valued at amortized cost, which approximates market value, unless it is determined that amortized cost would not represent market value, in which case the securities would be marked to market.The fund amortizes premiums and discounts on all debt securities.
Registered open-end investment companies that are not traded on an exchange are valued at their NAV.
If market quotations or official closing prices are not readily available or are determined not to reflect accurately fair value, securities will be valued at their fair value as determined in good faith by the Company’s Board of Directors or pursuant to procedures approved by the Board of Directors.These situations may include instances where an event occurs after the close of the market on which a security is traded but before the fund calculates its NAV, and it is determined that the event has materially affected the value of the security. Fair value of foreign equity securities may be determined with the assistance of a pricing service using calculations based on indexes of domestic securities and other appropriate indicators, such as prices of relevant ADRs and futures contracts.
The Financial Accounting Standards Board (“FASB”) released Statement of Financial Accounting Standards No. 157 “Fair Value Measurements” (“FAS 157”). FAS 157 establishes an authoritative definition of fair
30
value, sets out a framework for measuring fair value, and requires additional disclosures about fair-value measurements.The application of FAS 157 is required for fiscal years beginning after November 15, 2007 and interim periods within those fiscal years. Management does not believe that the application of this standard will have a material impact on the financial statements of the fund.
(b) Foreign securities and currency transactions:The fund normally will invest a large portion of its assets in foreign securities. Foreign securities carry more risk than U.S. securities, such as political and currency risks. In the event the fund executes a foreign security transaction, the fund may enter into a foreign currency contract to settle the foreign security transaction.The fund could be exposed to risk if counterpar-ties are unable to meet the terms of the contracts or if the value of the currency changes unfavorably to the U.S. dollar.The resultant foreign currency gain or loss from the contract is recorded as foreign currency gain or loss and is presented as such in the Statement of Operations.
The accounting records of the fund are maintained in U.S. dollars.The market values of foreign securities, currency holdings and other assets and liabilities are translated into U.S. dollars based on the current exchange rates each business day. Purchases and sales of investment securities and income and expense items denominated in foreign currencies are translated into U.S. dollar amounts on the respective dates of such transactions.
The fund does not isolate that portion of the results of operations resulting from changes in foreign exchange rates on investments from the fluctuations arising from changes in market prices of securities held. Such fluctuations are included with the net unrealized appreciation (depreciation) from investments and foreign currency transactions in the Statement of Operations.
Reported net realized foreign exchange gains or losses arise from sales of foreign currencies, currency gains or losses realized between the trade and settlement dates on securities transactions, and the difference
The Fund 31
NOTES TO FINANCIAL STATEMENTS (continued)
between the amounts of dividends, interest, and foreign withholding taxes recorded on the fund’s books and the U.S. dollar equivalent of the amounts actually received or paid. Net unrealized appreciation or depreciation on investments and foreign currency translation arises from changes in the values of assets and liabilities, including investments in securities held at the date of the financial statements, resulting from changes in the exchange rates and changes in market prices of securities held.
(c) Securities transactions and investment income: Securities transactions are recorded on a trade date basis. Realized gains and losses from securities transactions are recorded on the identified cost basis. Dividend income is recognized on the ex-dividend date and interest income, including, where applicable, accretion of discount and amortization of premium on investments, is recognized on the accrual basis.
The fund has an arrangement with the custodian bank, Mellon Bank, N.A. (“Mellon Bank”), whereby the fund receives earnings credits from the custodian when positive cash balances are maintained, which are used to offset custody fees. For financial reporting purposes, the fund includes any earnings credits as an expense offset in the Statement of Operations.
(d) Affiliated issuers: Investments in other investment companies advised by Founders or its affiliates are defined as “affiliated” in the Act.
(e) Dividends to shareholders: Dividends are recorded on the ex-dividend date. Dividends from investment income-net and dividends from net realized capital gain, if any, are normally declared and paid annually, but the fund may make distributions on a more frequent basis to comply with the distribution requirements of the Internal Revenue Code of 1986, as amended (the “Code”).To the extent that net realized capital gain can be offset by capital loss carryovers, it is the policy of the fund not to distribute such gain. Income and capital gain distributions are determined in accordance with income tax regulations, which may differ from U.S. generally accepted accounting principles.
(f) Federal income taxes: No provision has been made for federal income taxes since it is the policy of the fund to comply with the
32
requirements of Subchapter M of the Code that are applicable to regulated investment companies and to make distributions of income and capital gains sufficient to relieve it from all income taxes.The fund is treated as a separate tax entity for federal income tax purposes.
During the current year, the fund adopted FASB Interpretation No. 48 “Accounting for Uncertainty in Income Taxes” (“FIN 48”). FIN 48 provides guidance for how uncertain tax positions should be recognized, measured, presented and disclosed in the financial statements. FIN 48 requires the evaluation of tax positions taken or expected to be taken in the course of preparing the fund’s tax returns to determine whether the tax positions are “more-likely-than-not” of being sustained by the applicable tax authority.Tax positions not deemed to meet the more-likely-than-not threshold would be recorded as a tax benefit or expense in the current year.The adoption of FIN 48 had no impact on the operations of the fund for the period ended December 31, 2007.
The fund is not subject to examination by U.S. Federal, State and City tax authorities for the tax years before 2004.
At December 31, 2007, the components of accumulated earnings on a tax basis were as follows: undistributed ordinary income $122,851, accumulated capital losses $84,427,909 and unrealized appreciation $5,607,072. In addition, the fund had $245,714 of capital losses realized after October 31, 2007 which were deferred for tax purposes to the first day of the following fiscal year.
The accumulated capital loss carryover is available to be applied against future net securities profits, if any, realized subsequent to December 31, 2007. If not applied, $72,594,825 of the carryover expires in fiscal 2009 and $11,833,084 expires in fiscal 2010.
The tax character of distributions paid to shareholders during the fiscal period ended December 31, 2007 was as follows: ordinary income $423,572.
During the period ended December 31, 2007, as a result of permanent book to tax differences, primarily due to the tax treatment for foreign
The Fund 33
NOTES TO FINANCIAL STATEMENTS (continued)
currency transactions and passive foreign investment companies, the fund increased accumulated undistributed investment income-net by $376,872 and decreased accumulated net realized gains (losses) on investments by the same amount. Net assets and net asset value per share were not affected by this reclassification.
NOTE 2—Bank Line of Credit:
The Company has a line of credit arrangement (“LOC”) with State Street Bank and Trust Company, to be used for temporary or emergency purposes, primarily for financing redemption payments. The borrowings by each series of the Company are limited to the lesser of (a) $25 million, or (b) the lesser of 25% of the series’ total net assets or the maximum amount which the series is permitted to borrow pursuant to the prospectus, any law or any other agreement. Combined borrowings are subject to the $25 million cap on the total LOC. Each series agrees to pay annual fees and interest on the unpaid balance based on prevailing market rates as defined in the LOC.
The average daily amount of borrowings outstanding under the LOC during the period ended December 31,2007,was approximately $79,900 with a related weighted average annualized interest rate of 5.79% .
NOTE 3—Investment Advisory Fee and Other Transactions With Affiliates:
(a) In accordance with an investment advisory agreement between the Company and Founders, the fund compensates Founders for its services as investment adviser by the payment of fees computed daily and paid monthly at the annual rate equal to a percentage of the average daily value of the fund’s net assets.The fee is 1% of the first $250 million of net assets, .80% of the next $250 million of net assets, and .70% of net assets in excess of $500 million. For the period from September 14, 2007 through September 13, 2008, Founders has agreed to waive 25% of its investment advisory fee for the fund.This waiver will end on September 14, 2008, and on that date the fund’s contractual investment advisory fee will be again in effect. The reduction in investment advisory fee amounted to $74,597 during the period ended December 31, 2007.
34
During the period ended December 31, 2007, the Distributor retained $283 and $1 from commissions earned on sales of the fund’s Class A and Class T shares, respectively, and $2,319 and $19,972 from CDSCs on redemptions of the fund’s Class B and Class C shares, respectively.
(b) Under a Distribution Plan (the “Class B, C and T Plan”) adopted pursuant to Rule 12b-1 under the Act, Class B, Class C and Class T shares pay the Distributor for distributing their shares at an annual rate of .75% of the value of their average daily net assets of Class B and Class C shares and .25% of the value of the average daily net assets of Class T shares. During the period ended December 31, 2007, Class B, Class C and Class T shares were charged $13,956, $48,557 and $1,378, respectively, pursuant to the Class B, C and T Plan.
The fund also has adopted a Distribution Plan pursuant to Rule 12b-1 under the Act applicable to its Class F shares (the “Class F Plan”). Under the Class F Plan, the fund is authorized to reimburse the Distributor for expenses paid for distributing or servicing its Class F shares at an annual rate of up to .25% of the value of the average daily net assets of the Fund’s Class F shares. During the period ended December 31, 2007, Class F shares were charged $126,178 pursuant to the Class F Plan.
(c) Under the Shareholder Services Plan, Class A, Class B, Class C and Class T shares pay the Distributor at an annual rate of .25% of the value of their average daily net assets for the provision of certain services.The services provided may include personal services relating to shareholder accounts, such as answering shareholder inquiries regarding the fund and providing reports and other information, and services related to the maintenance of shareholder accounts.The Distributor may make payments to Service Agents (a securities dealer, financial institution or other industry professional) in respect of these services.The Distributor determines the amounts to be paid to Service Agents. During the period ended December 31, 2007, Class A, Class B, Class C and Class T shares were charged $69,425, $4,652, $16,186 and $1,378, respectively, pursuant to the Shareholder Services Plan.
The Fund 35
NOTES TO FINANCIAL STATEMENTS (continued)
The Company has a shareholder services agreement with the Distributor whereby the fund has agreed to compensate the Distributor for providing certain shareholder servicing functions to holders of Class F shares. The fund paid the Distributor a monthly fee equal, on an annual basis, to $24.00 per Class F shareholder account considered to be an open account at any time during a given month. During the period ended December 31, 2007, Class F shares were charged $51,100 pursuant to this shareholder services agreement.
Dreyfus Transfer, Inc. (“DTI”), a wholly-owned subsidiary of Dreyfus, is the transfer and dividend disbursing agent for all of the fund’s share classes.With the exception of out-of-pocket charges, the fees charged by DTI with respect to the fund’s Class F shares are paid by the Distributor. The out-of-pocket charges from DTI are paid by the fund. During the period ended December 31, 2007, Class F shares were charged $22,221 for out-of-pocket transfer agent charges.
The fees charged by DTI with respect to the fund’s Class A, Class B, Class C, Class I and Class T shares are paid by the fund.These transfer agency fees, including both the per account fees paid to DTI and out-of-pocket charges, during the period ended December 31, 2007 were $55,718.
The fund compensates Mellon Bank, an affiliate of Founders, under a custody agreement for providing custodial services for the fund. During the period ended December 31, 2007, the fund was charged $128,227 pursuant to the custody agreement.
The fund also pays Mellon Bank for certain cash management services. These fees are included in the out-of-pocket transfer agency charges above.
The fund has agreed to compensate Dreyfus for providing accounting services, administration, compliance monitoring, regulatory and shareholder reporting, as well as related facilities, equipment and clerical help.The fee is computed at the annual rate of .10% of the average daily net assets of the fund on the first $500 million, .065% of the average
36
daily net assets of the fund on the next $500 million and .02% of the average daily net assets of the fund in excess of $1 billion, plus reasonable out-of-pocket expenses. Dreyfus has contractually agreed in writing to waive any fees received for these services to the extent they exceed its costs in providing the services and a reasonable allocation of Founders’ costs related to the support and oversight of these services. During the period ended December 31, 2007, Dreyfus waived $35,768.
The components of “Due to Founders Asset Management LLC and affiliates” in the Statement of Assets and Liabilities consist of: investment advisory fees $78,222, Rule 12b-1 distribution plan fees $16,986, shareholder services plan fees $54,298, custodian fees $43,170, transfer agency per account fees $ 8,952 and accounting fees $7,822, which are offset against a reduction in investment advisory fee currently in effect in the amount of $37,661.
(d) Annual retainer fees and attendance fees for the Company’s Board of Directors are allocated to each series of the Company based on net assets.The Company’s Board of Directors has adopted a deferred compensation plan for Company directors that enables directors to elect to defer receipt of all or a portion of the annual compensation that they are entitled to receive from the Company. Under the plan, the compensation deferred is invested in shares of one or more of the Company’s series.The amount paid to the director under the plan will be determined based upon the performance of the selected series.The current value of these amounts is included in Other Assets and Directors’ Deferred Compensation in the Statement of Assets and Liabilities. Changes in market value are included in the directors’ fees and expenses and the net change in unrealized appreciation (depreciation) of investments in the Statement of Operations. Deferral of directors’ fees under the plan does not affect the net assets of the fund.
Certain officers of the Company are also officers and/or directors of Founders or its affiliates, which pay their compensation.The affairs of the fund, including services provided by Founders, are subject to the supervision and general oversight of the Company’s Board of Directors.
The Fund 37
NOTES TO FINANCIAL STATEMENTS (continued)
NOTE 4—Securities Transactions:
The aggregate amount of purchases and sales of investment securities, excluding short-term securities, financial futures and forward currency exchange contracts, during the period ended December 31, 2007, amounted to $98,011,683 and $98,247,193, respectively.
The fund may invest in financial futures contracts in order to gain exposure to or protect against changes in the market. The fund is exposed to market risk as a result of changes in the value of the underlying financial instruments. Investments in financial futures require the fund to “mark to market” on a daily basis, which reflects the change in market value of the contracts at the close of each day’s trading. Accordingly, variation margin payments are received or made to reflect daily unrealized appreciation or depreciation.When the contracts are closed, the fund recognizes a realized gain or loss. These investments require initial margin deposits with a broker, which consist of cash or cash equivalents. The amount of these deposits is determined by the exchange or Board of Trade on which the contract is traded and is subject to change. Contracts open at December 31, 2007, are set forth in the Statement of Financial Futures.
The fund enters into forward currency exchange contracts in order to hedge its exposure to changes in foreign currency exchange rates on its foreign portfolio holdings and to settle foreign currency transactions. When executing forward currency exchange contracts, the fund is obligated to buy or sell a foreign currency at a specified rate on a certain date in the future. With respect to sales of forward currency exchange contracts, the fund would incur a loss if the value of the contract increases between the date the forward contract is opened and the date the forward contract is closed.The fund realizes a gain if the value of the contract decreases between those dates.With respect to purchases of forward currency exchange contracts, the fund would incur a loss if the value of the contract decreases between the date the forward con-
38
tract is opened and the date the forward contract is closed. The fund realizes a gain if the value of the contract increases between those dates. The fund is also exposed to credit risk associated with counterparty nonperformance on these forward currency exchange contracts which is typically limited to the unrealized gain on each open contract.The following summarizes open forward currency exchange contracts at December 31, 2007:
| | | Foreign | | | | | | |
| Forward Currency | | Currency | | | | | | Unrealized |
| Exchange Contracts | | Amounts | | Proceeds ($) | | Value ($) | | Appreciation ($) |
| |
| |
| |
| |
|
| |
| Sales: | | | | | | | | |
| Euro, expiring 1/2/2008 | | 61,324 | | 90,063 | | 89,649 | | 414 |
At December 31, 2007, the cost of investments for federal income tax purposes was $83,014,746; accordingly, accumulated net unrealized appreciation on investments was $5,595,473, consisting of $12,647,699 gross unrealized appreciation and $7,052,226 gross unrealized depreciation.
The Fund 39
| | REPORT OF INDEPENDENT REGISTERED
PUBLIC ACCOUNTING FIRM
|
Shareholders and Board of Directors
Dreyfus Founders Passport Fund
|
We have audited the accompanying statement of assets and liabilities, including the statement of investments, of Dreyfus Founders Passport Fund (one of the funds comprising Dreyfus Founders Funds, Inc.), as of December 31,2007,and the related statement of operations,the statement of changes in net assets and financial highlights for the year then ended. These financial statements and financial highlights are the responsibility of the Fund’s management. Our responsibility is to express an opinion on these financial statements and financial highlights based on our audit.The statement of changes in net assets of Dreyfus Founders Passport Fund for the year ended December 31, 2006 and the financial highlights for each of the indicated periods through December 31, 2006, were audited by other auditors whose report dated February 23, 2007, expressed an unqualified opinion on the statement and financial highlights.
We conducted our audit in accordance with the standards of the Public Company Accounting Oversight Board (United States).Those standards require that we plan and perform the audit to obtain reasonable assurance about whether the financial statements and financial highlights are free of material misstatement.We were not engaged to perform an audit of the Fund’s internal control over financial reporting.Our audits included consideration of internal control over financial reporting as a basis for designing audit procedures that are appropriate in the circumstances,but not for the purpose of expressing an opinion on the effectiveness of the Fund’s internal control over financial reporting.Accordingly, we express no such opinion.An audit also includes examining, on a test basis, evidence supporting the amounts and disclosures in the financial statements and financial highlights, assessing the accounting principles used and significant estimates made by management, and evaluating the overall financial statement presentation. Our procedures included confirmation of securities as of December 31, 2007 by correspondence with the custodian and oth-ers.We believe that our audit provides a reasonable basis for our opinion.
In our opinion, the financial statements and financial highlights referred to above present fairly, in all material respects, the financial position of Dreyfus Founders Passport Fund at December 31, 2007, and the results of its operations, the changes in its net assets and the financial highlights for the year then ended, in conformity with accounting principles generally accepted in the United States.

| | New York, New York
February 21, 2008
|
40
IMPORTANT TAX INFORMATION (Unaudited)
In accordance with federal tax law, the fund elects to provide each shareholder with their portion of the fund’s foreign taxes paid and the income sourced from foreign countries. Accordingly, the fund hereby makes the following designations regarding its fiscal year ended December 31, 2007:
—the total amount of taxes paid to foreign countries was $192,505.
—the total amount of income sourced from foreign countries was $327,185.
As required by federal tax law rules, shareholders will receive notification of their proportionate share of foreign taxes paid and foreign source income for the 2007 calendar year with Form 1099-DIV which will be mailed by January 31, 2008.
For the fiscal year ended December 31, 2007, certain dividends paid by the Fund may be subject to a maximum tax rate of 15%, as provided for by the Jobs and Growth Tax Relief Reconciliation Act of 2003. Of the distributions paid during the fiscal year, $423,572 represents the maximum amount that may be considered qualified dividend income.
The Fund 41
| | FACTORS CONSIDERED IN RENEWING
THE ADVISORY AGREEMENT (Unaudited)
|
At a meeting of the board of directors of Dreyfus Founders Funds, Inc. (the “Funds” and, in reference to any one of the Funds’ portfolios, a “Fund”) held on August 15 and 16, 2007, the Funds’ directors unanimously approved the continuation of the Investment Advisory Agreement (“management agreement”) between each of the Funds and Founders Asset Management LLC, the Funds’ investment adviser (“Founders”), for a one-year term ending August 31, 2008.The board of directors of the Funds (“board”) is comprised entirely of individuals who have no affiliation with Founders or any affiliates of Founders (the “directors”).
Prior to the directors’August 2007 meeting, Founders had provided the directors with extensive materials related to the renewal of the management agreement, including performance and expense information for other investment companies with similar investment objectives to each Fund derived from data compiled by Lipper Inc., an independent third party (“Lipper”).
During their meeting, the directors discussed the proposed continuance of the management agreement with the senior management personnel of Founders. At the conclusion of these discussions, the directors and their independent counsel met in a private session at which no representatives of Founders were present, to continue their discussion of continuance of the agreement. In determining to continue the management agreement, the directors considered all factors which they believed to be relevant, including the following:
Nature, Extent and Quality of Services Provided and to be Provided by Founders
The directors recognized that they have had the opportunity to evaluate the investment and non-investment related services which Founders and its affiliates provide to the Funds primarily through their quarterly review of all of the operations of the Funds during Fund committee and Fund board meetings held throughout the past twelve months.At each such meeting, extensive discussions of Fund operations are held with senior management personnel of Founders and a large volume of doc-
42
umentation with respect to these operations is provided to and reviewed by the directors. Such discussions and documentation afford the directors the continual opportunity to evaluate the nature, extent, and quality of the services provided by Founders and its affiliates to the Funds.
The directors were satisfied that Founders is managing the investment of the assets of the Funds in accordance with each Fund’s respective investment objective, policies and restrictions, subject to the directors’ overall supervision.
The directors considered that Founders also provides many non-investment related services to the Funds in fulfilling its responsibilities under the management agreement.
Following their discussion and review, the directors reached the following conclusions:
- That the breadth and quality of investment advisory and other ser- vices being provided to the Funds are satisfactory, as evidenced in part by the performance records of the Funds, to which the directors gave significant attention as indicated below; and
- That the directors are satisfied not only with the research, long-term portfolio management, and trading services being provided to the Funds, but also recognize that Founders or its affiliates have provided the highest quality accounting, compliance and regulatory, adminis- trative, underwriting, custody, shareholder, transfer agent and cash management services to the Funds, while charging fair, reasonable and competitive fees.
Investment Performance
On a quarterly basis, the directors hold meetings with representatives of the portfolio management team for each Fund (usually a portfolio manager), during which each representative reviews, among other items, performance information, attribution analyses, and the portfolio manager’s investment outlook. The directors also receive written monthly and quarterly performance information for each Fund.These written quarterly reports include comparisons of each Fund’s perfor-
The Fund 43
| | FACTORS CONSIDERED IN RENEWING THE
ADVISORY AGREEMENT (Unaudited) (continued)
|
mance with its respective Lipper category and one or more benchmark indexes, as well as a comparable exchange-traded fund, for the most recent quarter and one-, three- and five-year periods, as well as for the portfolio manager’s tenure.
In conjunction with their consideration of renewal of the management agreement, the directors received a more detailed performance report about each Fund from Lipper.These reports compared each Fund’s performance to both a relatively small group of similar funds selected by Lipper (the “Lipper performance group”), as well as to all funds in the applicable Lipper category (the “Lipper performance universe”).
The performance of Passport Fund’s Class F shares placed in the first (highest) quintile of its Lipper performance group and in the second quintile of the Lipper international small/mid-cap growth fund performance universe for the one-year period ended December 31, 2006, and in the fourth quintile of its Lipper performance group and in the fifth (lowest) quintile of its Lipper performance universe for the three-year period ended December 31, 2006.The performance of the Fund’s Class F shares placed in the lowest two quintiles of its Lipper performance universe for the one- and three-year periods ended June 30, 2007, and in the third quintile of its Lipper performance universe for the five-year period ended June 30, 2007.The Fund’s Class F shares underperformed its benchmark index for the one- and five-year periods ended June 30, 2007, but outperformed its benchmark index for the three-year period ended June 30, 2007. The directors noted that Passport Fund’s 2006 performance had improved relative to both its Lipper performance group and universe from its 2005 results, which had placed it in the third and fourth quintiles, respectively.The directors deemed these relative performance results to be satisfactory, although the directors noted that the Fund’s relative performance to date in 2007 had deteriorated. The directors stressed the importance to Founders of the need to continue to seek to improve the Fund’s longer-term performance record.
After consideration of all relevant information and data, the directors concluded that although past performance cannot be a guaranty of future performance, each Fund and its shareholders would continue to
44
benefit from Founders’ investment management of the Fund. The directors further determined:
- That although certain of the Funds have experienced performance difficulties, Founders has focused its efforts upon improving the per- formance records of the Funds and will continue to seek improve- ment; and
- That the materials provided by Lipper demonstrated that most of the Funds maintained satisfactory performance quintile rankings in their respective comparison groups and comparison universes, with five of seven Funds placing in the top two quintiles of their respec- tive Lipper performance universes for the one-year period ended December 31, 2006, and four placing in the top two quintiles for the three years ended December 31, 2006.
Costs of the Services to be Provided and Profits to be Realized by Founders and Its Affiliates from Founders’ Relationship With the Funds
The directors recognized that on a quarterly basis, they receive information with respect to each Fund’s expenses. The directors carefully review and discuss the expense ratios for all classes of shares of each Fund at each of their quarterly meetings throughout the year.
In conjunction with their annual consideration of renewal of the Funds’ management agreement and other service arrangements, the directors received detailed information from Lipper which compared each Fund’s management fees and other expenses with those of a group of similar funds selected by Lipper (the “Lipper expense group”), as well as summary information comparing each Fund’s management fees and expenses with those of the funds in its Lipper performance universe with load structures similar to that of the Funds (the “Lipper expense universe”).
The directors noted that for the period ended December 31, 2006, Passport Fund’s management fees ranked in the third quintile of its Lipper expense group, with the Fund’s fees the seventh lowest of 15
The Fund 45
| | FACTORS CONSIDERED IN RENEWING THE
ADVISORY AGREEMENT (Unaudited) (continued)
|
“peer funds.” The Fund’s contractual management fees at a common asset level were determined by Lipper to be lower than 10 of the 15 funds in its group.The Fund’s management fees were in the third quin-tile of its Lipper expense universe.
The directors also considered information provided by Lipper with respect to the profitability of the investment management activities conducted by a number of publicly-held corporations. Lipper also prepared an analysis providing detailed information with respect to the types of services rendered to various mutual fund complexes under their respective investment advisory contracts, including the services provided by Founders to the Funds under the management agreement.
The directors had been provided with extensive materials with respect to the profitability derived by Founders from providing investment advisory and other services to the Funds as a group and to each Fund individually.
The directors further considered certain indirect benefits received by Founders and its affiliates as a result of Founders’ provision of investment advisory services to the Funds.These included the following:
- Since Founders manages a non-Fund account in a style that is sim- ilar to that used for one of the Funds (and for portions of certain other Funds), and employees of Founders manage other non-Fund accounts in a similar style in their capacities as employees of the affiliates, Founders and its affiliates realize efficiencies in performing the portfolio management, trading and operational functions related to those non-Fund accounts;
- The Funds’ brokerage transactions may be executed with brokers that provide research and brokerage services to Founders and its affiliates. These research and brokerage services may be useful to Founders and its affiliates in providing investment advisory services to any of the clients they advise, including the Funds; and
- Affiliates of Founders receive various fees for providing accounting, underwriting, shareholder, transfer agency, custody and cash man- agement services to the Funds.
46
After deliberation and discussion of Fund fees and expenses, the directors determined:
- That upon review of the advisory fee structures of the Funds in comparison with the competitive expense groups and expense uni- verses selected by Lipper, the levels of investment advisory fees paid by the Funds were deemed to be competitive;
- That the expense ratios of the Funds are competitive and that Founders continually reviews each Fund’s total expense ratio and has initiated voluntarily expense caps and fee waivers for certain Funds to reduce their expense ratios;
- That five of the seven Funds’ expense ratios decreased or remained the same for all or most of their share classes in 2006 as compared to those experienced in 2005, in some instances as a result of increases in Fund assets; and
- That the comparative fee and expense information included in the materials provided by Lipper supports the determination that the advisory and other fees payable by the Funds to Founders and its affiliates are essentially fees which would be similar to those that would have resulted solely from “arm’s-length” bargaining.
With respect to profitability to Founders, the directors reviewed the adviser profitability analysis provided by Lipper, which demonstrated that Founders’ 2006 profitability from providing management services to the Funds was reasonable in comparison to the entities included in the Lipper analysis.
The directors were also advised by independent counsel of the profitability percentage ranges which court cases have found acceptable and determined that Founders’ profitability percentage for providing management and other services to the Funds was reasonable.
The directors concluded that Founders’ profits from providing management services to the Funds were reasonable in relationship to the overall services which Founders provides.
The Fund 47
| | FACTORS CONSIDERED IN RENEWING THE
ADVISORY AGREEMENT (Unaudited) (continued)
|
Economies of Scale
The directors reviewed information provided by Founders which summarized the extent, if any, that both Founders and the Funds would achieve certain economies of scale if the assets of the Funds were to increase.
After review and discussion, the directors considered the extent to which economies of scale and common management are shared with each Fund, including the economies that would be realized from the growth of each Fund’s assets. After such consideration, the directors determined that all of the Funds have structured breakpoints in their advisory fees, which result in fee reductions as the assets of each Fund reach defined levels, and that such fee reductions, when implemented, would benefit all of the applicable Fund’s shareholders through decreases in the Fund’s expense ratio.
Dedication to Regulatory Requirements and Restrictions
An important factor in the directors’ consideration of renewal of the Funds’ management agreement with Founders included the directors’ recognition of the dedication by Founders of stringent adherence to regulatory requirements and restrictions.The directors determined that Founders is dedicated to compliance with all applicable rules and regulations and that the systems of controls which are in place to ensure that the service providers to the Funds, including Founders, and the Funds themselves, maintain strict adherence to the law are excellent.
Overall Conclusions
The directors determined that they are generally satisfied with the performance of the Funds and with the quality of the advisory and other services being provided by Founders and its affiliates to the Funds. The directors recognized that efforts are being and will continue to be made to improve the Funds’ performance and to maintain Fund expense ratios at reasonable and competitive levels.
48
The directors concluded that continuation of the current management agreement between each Fund and Founders, which would enable each Fund to continue to receive investment advisory services from Founders, is in the best interests of each Fund and its shareholders, the services to be performed under the management agreement are services required for the operations of the Funds, Founders has provided satisfactory investment management services to the Funds in the past, and the fees for the management services which Founders will perform will be within the range of what would have been negotiated at arm’s length in light of the circumstances.
The Fund 49
YOUR BOARD REPRESENTATIVES (Unaudited)
The Board of Directors of the Company oversees all six Dreyfus Founders Funds.The business and affairs of the Company are managed under the direction of the Board. The directors serving on the Board perform their responsibilities in the manner which they reasonably believe to be in the best interests of the Funds and their shareholders.
All of the directors,as listed below,are independent directors.They are not affiliated with the Fund’s adviser, its parent company, or its affiliates.The directors have no official term of office and generally serve until they retire (normally at age 75, but subject to extension to age 80), resign, or are not re-elected.As you can see from their backgrounds, the directors have broad experience as active or former business and community leaders.
Directors
Eugene H.Vaughan, CFA, 74.Year elected to the Board: 1970
Board Chairman. Founding Chairman,Vaughan Nelson Investment Management, LP, an investment counseling firm. Director, Encore Bank, Houston. Founding Chairman, Center for Houston’s Future, a non-profit organization. Founding Chairman and former Governor, CFA Institute. Past Chairman and Trustee, Institute of Chartered Financial Analysts. Past Chairman and Director, Financial Analysts Federation. Chairman-elect, University of Texas Health Science Center.
Alan S. Danson, 68.Year elected to the Board: 1991
Private investor. Formerly, President and Director, D.H. Management, Inc., the general partner of a limited partnership with technology company holdings (1996 to 2003). Director, Gore Range Natural Science School and The Les Streeter Program, Inc., both of which are non-profit organizations.
Robert P. Mastrovita, 63.Year elected to the Board: 1998
Private investor. Chairman of a private charitable foundation (1997 to present). Formerly, Chairman and Director, Hagler, Mastrovita & Hewitt, Inc., a registered investment adviser (1982 to 1997). Member, Boston Society of Security Analysts. Trustee, Partridge Academy. Director, King Caesar Foundation.
Trygve E. Myhren, 71.Year elected to the Board: 1996
President, Myhren Media, Inc., a firm that invests in and advises media, telecommunications, Internet and software companies. Special Limited Partner and member of Investment Committee, Megunticook Funds, a venture capital firm (1998 to present). Director, AdPay, Inc.Trustee, Executive Committee and Chairman of Faculty Education Affairs Committee, the University of Denver. Trustee, Denver Art
50
Museum. Member, Colorado FORUM and Cable Television Hall of Fame. Formerly, President (1990 to 1996) and Director (1992 to 2001) of the Providence Journal Company, a diversified media and communications company. Formerly, Chairman and Chief Executive Officer of American Television and Communications Corporation (now Time Warner Cable) (1981 to 1988). Formerly, Chairman of the National Cable Television Association (1986-1987). Chief of Mission, 2006 Paralympic Games,Torino/Sestrierre, Italy.
George W. Phillips, 69.Year elected to the Board: 1998
Retired.Vice Chairman of the Board and Chairman of the Investment Committee, Children’s Medical Center of Boston. Formerly, President and Chief Executive Officer (1992 to 1997) and Director (1992 to 2002) of Warren Bancorp, Inc. Formerly, President, Chief Executive Officer and Director of Warren Five Cents Savings Bank (1992 to 1997).
Martha A. Solis-Turner, 47.Year elected to the Board: 2005
Formerly, Telecommunications Director, Wholesale Markets (1995 to 2001), and Manager (1990 to 1995), Qwest Communications International Inc. Board member and Treasurer, Mile High Montessori Early Learning Centers (2002 to present), and formerly, Board member (1995 to 2004) and Vice President (2002 to 2004), Curtis Park Community Center, both of which are non-profit organizations.
Principal Officers
J. David Officer, 59. President and Principal Executive Officer of the Funds since 2007. Chief Operating Officer,Vice Chairman and a Director of Dreyfus, and an officer of 78 investment companies (comprised of 163 portfolios) managed by Dreyfus. He has been an employee of Dreyfus since 1998.
Denise B. Kneeland, 56. Vice President of the Funds since 2008. Assistant Vice President (since 1996) and Secretary (since 2007) of the Mellon Institutional Funds Investment Trust. First Vice President and Manager, Mutual Funds Operations, BNY Mellon Asset Management (since 2006). Formerly,Vice President and Manager, Mutual Funds Operations,Standish Mellon Asset Management Company,LLC (1996 to 2001).
Kenneth R. Christoffersen, 52. Vice President of the Funds since 2008, and Secretary since 2000 (and from 1996 to 1998). Founders’ Senior Vice President -Legal, General Counsel and Secretary. Assistant Secretary of the Distributor since 2003. Employed by Founders and its predecessor company since 1996.
The Fund 51
YOUR BOARD REPRESENTATIVES (Unaudited) (continued)
Steven M. Anderson, 42.Treasurer and Principal Financial and Accounting Officer of the Funds since 2007. Vice President (since 1999), Treasurer (since 2002) and Chief Financial Officer of Mellon Institutional Funds Investment Trust. Vice President and Mutual Funds Controller, BNY Mellon Asset Management (since 2003). Formerly, Assistant Vice President and Mutual Funds Controller, Standish Mellon Asset Management Company, LLC (2000 to 2003).
Janelle E. Belcher, 49. Chief Compliance Officer of the Funds since 2004 and Assistant Secretary of the Funds since 2002. Founders’ Vice President - Compliance since 2002. Formerly, Founders’ Manager of Compliance (2000 to 2002) and Securities Compliance Examiner, Staff Accountant and Team Leader for the U.S. Securities and Exchange Commission (1990 to 2000).
David T. Buhler, 36. Assistant Secretary since 2007. Founders’ Associate General Counsel and Assistant Secretary since 2006. Formerly, Counsel for Great-West Life & Annuity Insurance Company (1997-2006), and Chief Compliance Officer for Greenwood Investments, LLC (2002 - 2006).
Robert S. Robol, 43. Assistant Treasurer since 2006. Senior Accounting Manager -Taxable Fixed Income Funds of Dreyfus, and an officer of 79 investment companies (comprised of 180 portfolios) managed by Dreyfus. Employed by Dreyfus since 1988.
Robert Salviolo, 40. Assistant Treasurer since 2007. Senior Accounting Manager -Foreign Equity Funds of Dreyfus, and an officer of 79 investment companies (comprised of 180 portfolios) managed by Dreyfus. Employed by Dreyfus since 1989.
Robert Svagna, 40. Assistant Treasurer since 2006. Senior Accounting Manager -Equity Funds of Dreyfus, and an officer of 79 investment companies (comprised of 180 portfolios) managed by Dreyfus. Employed by Dreyfus since 1990.
William G. Germenis, 37. Anti-Money Laundering Compliance Officer (“AMLCO”) for the Class A, Class B, Class C, Class I, and Class T shares of the Funds since 2002 and for the Class F shares of the Funds since 2003.Vice President and AMLCO of the Distributor and AMLCO of 75 investment companies (comprised of 176 portfolios) managed by Dreyfus. Employed by the Distributor since 1998.
The directors and officers may be contacted at Founders’ address appearing on the back cover, except for Messrs. Officer, Robol, Salviolo, Svagna and Germenis, who can be contacted at The Dreyfus Corporation, 200 Park Avenue, New York, New York 10166, and Mr. Anderson and Ms. Kneeland, who can be contacted at BNY Mellon Asset Management, One Boston Place, Boston, Massachusetts 02108. Additional information about the Company’s directors is available in the Statement of Additional Information, which can be obtained free of charge by calling 1-800-525-2440 (Class F shareholders) or 1-800-554-4611 (all other shareholders).
52
| | Dreyfus Founders
Worldwide Growth Fund
|
ANNUAL REPORT December 31, 2007

Save time. Save paper. View your next shareholder report online as soon as it’s available. Log into www.dreyfus.com and sign up for Dreyfus eCommunications. It’s simple and only takes a few minutes.
The views expressed in this report reflect those of the portfolio managers only through the end of the period covered and do not necessarily represent the views of Founders or any other person in the Founders organization.Any such views are subject to change at any time based upon market or other conditions and Founders disclaims any responsibility to update such views.These views may not be relied on as investment advice and, because investment decisions for a Dreyfus Founders Fund are based on numerous factors, may not be relied on as an indication of trading intent on behalf of any Dreyfus Founders Fund.
Not FDIC-Insured • Not Bank-Guaranteed • May Lose Value
| Contents |
| |
| | | THE FUND |
| |
|
| 2 | | A Letter from the Chairman |
| 3 | | Discussion of Fund Performance |
| 6 | | Fund Performance |
| 8 | | Understanding Your Fund’s Expenses |
| 8 | | Comparing Your Fund’s Expenses |
| | | With Those of Other Funds |
| 9 | | Statement of Investments |
| 16 | | Statement of Assets and Liabilities |
| 17 | | Statement of Operations |
| 18 | | Statement of Changes in Net Assets |
| 20 | | Financial Highlights |
| 26 | | Notes to Financial Statements |
| 38 | | Report of Independent Registered |
| | | Public Accounting Firm |
| 39 | | Factors Considered in Renewing |
| | | the Advisory Agreement |
| 47 | | Your Board Representatives |
| |
| FOR MORE INFORMATION |
|
| | | Back Cover |
| Dreyfus Founders |
| Worldwide Growth Fund |

A LETTER FROM THE CHAIRMAN
Dear Shareholder:
We are pleased to present this annual report for Dreyfus Founders Worldwide Growth Fund, covering the 12-month period from January 1, 2007, through December 31, 2007.
Looking back, 2007 was a year of significant change for the financial markets worldwide.Turmoil in the U.S. sub-prime mortgage market, declining U.S. housing values and soaring energy prices caused significant challenges for international investors throughout the world. As a result, a number of asset classes lost value amid heightened volatility over the summer and fall. International equities generally proved to be a notable exception. As they have for several years, most major international equities indices outperformed their U.S. counterparts as global economic growth remained robust even as the U.S. economy entered a downturn.
The turbulence of 2007 reinforced a central principle of successful investing: diversification. Investors with broad exposure to the world’s stock and bond markets were better protected from the full impact of market volatility in areas that, earlier in the year, were among the bright spots at the time. As we look ahead, we believe that now is the perfect time to meet with your financial advisor, who can help you plan and diversify your investment portfolio in a way that manages the potential opportunities and risks that may continue to arise in 2008.
For information about how the fund performed during the reporting period, as well as market perspectives, we have provided a Discussion of Fund Performance given by the fund’s Portfolio Managers.
Thank you for your continued confidence and support.
2

DISCUSSION OF FUND PERFORMANCE
For the period of January 1, 2007, through December 31, 2007, as provided by William S. Patzer, CFA, and John B. Jares, CFA, Portfolio Managers
Fund and Market Performance Overview
Strong economic growth and robust mergers-and-acquisitions (M&A) activity bolstered the global stock markets’ performance over the first six months of 2007. However, these gains were offset to a degree in the second half of the year, as economic concerns and credit issues weighed on investor sentiment. The fund outperformed its primary benchmark on the strength of successful sector allocations and stock selections.However, the fund fell short of its growth-oriented secondary benchmark, as investors increasingly favored large growth stocks over value-oriented shares during the downturn.
For the 12-month period ended December 31, 2007, Dreyfus Founders Worldwide Growth Fund achieved total returns of 11.41% for Class A shares, 10.49% for Class B shares, 10.63% for Class C shares, 11.62% for Class F shares, 11.75% for Class I shares and 11.21% for Class T shares.1 In comparison, the fund’s benchmarks, the Morgan Stanley Capital International (MSCI) World Index (the “Primary Index”) produced a 9.04% total return,2 and the MSCI World Growth Index (the “Secondary Index”) produced a 14.76% total return for the same period.3
The Fund’s Investment Approach
The fund seeks long-term growth of capital by investing in the stocks of growth companies in markets throughout the world.The fund may purchase securities in any foreign country, as well as in the United States, emphasizing common stocks of both emerging and established growth companies that generally have strong performance records and market positions. We use a “growth style” of investing, searching for companies whose fundamental strengths suggest the potential to provide superior earnings growth over time.Our “bottom-up”approach emphasizes individual stock selection. We go beyond Wall Street analysis and perform intensive qualitative and quantitative in-house research to determine whether companies meet our investment criteria.
The Fund 3
DISCUSSION OF FUND PERFORMANCE (continued)
Global Markets Were Hurt by Economic and Credit Concerns
Vigorous construction activity in the emerging markets produced steady global demand for basic materials and construction services throughout 2007. Corporate restructuring and M&A activity put upward pressure on stock prices in the developed markets of Europe. In the United States, a number of large companies benefited from greater pricing power, and a weak U.S. dollar spurred overseas demand for U.S. exports. However, as the year progressed, a credit crisis originating in the U.S. sub-prime mortgage market, slowing U.S. economic growth, rising energy costs and higher inventory levels convinced investors to reassess their attitudes toward risk, resulting in a reversal of earlier market advances over the second half of the year.
The fund received positive contributions to performance from several markets. Solid selections of U.S. stocks and overweighted exposure to Denmark and Norway aided the fund’s relative performance. A slightly underweighted position in weak-performing Japan also proved to be advantageous.
From a market sector standpoint, the information technology, health care and consumer discretionary areas ranked as positive relative contributors. Computer and consumer electronics maker Apple benefited from the popularity of its new products, while online media giant Google gained market share. Growing popularity for Nintendo’s Wii gaming system aided the Japanese technology company. Danish pharmaceutical developer Novo Nordisk benefited from low patent risk and the popularity of its diabetes drugs. Specialty retailer Gap, Inc. gained ground due to solid execution by a new management team.
Other top performers in 2007 included Australia’s BHP Billiton and British diversified-mining group Xstrata, both of which gained value amid robust demand for industrial commodities.Nokia benefited from an increase in contracts for the Finnish mobile-phone company’s handsets.
Relative to the Primary Index, the fund’s underweighted exposure to financial companies bolstered its relative performance. However, the fund was not able to sustain outperformance in this economic segment against the Secondary Index, which holds a smaller percentage of financial firms. Laggards in this sector included integrated financial services firms Orix Corp. and Sumitomo Trust & Banking Co. in Japan and U.S.-based Citigroup, which were hurt by the credit crisis.
4
From a country standpoint, a number of U.K. stocks fell due to a lack-luster employment market and the spread of the credit crisis. In the Netherlands, a lack of investment in ABN Amro Bank, an acquisition target, hindered the fund’s return relative to the benchmark. Dutch bank ING Groep also lost value due to mortgage defaults and delinquencies.
Underweighted allocations to the energy and industrials sectors prevented the fund from participating more fully in their gains. Finally, U.S. retail giant The Home Depot suffered from lackluster consumer spending and the housing downturn, while coffee chain Starbucks was pressured by higher milk prices.
Finding Opportunities One Company at a Time
We have continued to monitor economic developments, including the possibility of a U.S. recession and the ongoing credit crisis. However, we have remained cautiously optimistic as short-term interest rates in many overseas markets are low and customer demand has been robust in many industries. Consequently, we have not greatly altered the fund’s allocations to various economic sectors, instead focusing on our stock selection strategy to add value.
January 15, 2008
| | | Investing in foreign companies involves special risks, including changes in currency rates, |
| | | political, economic and social instability, a lack of comprehensive company information, |
| | | differing auditing and legal standards and less market liquidity. An investment in this fund |
| | | should be considered only as a supplement to an overall investment program. |
| 1 | | Total return includes reinvestment of dividends and any capital gains paid, and does not take into |
| | | consideration the maximum initial sales charges in the case of Class A and Class T shares, or the |
| | | applicable contingent deferred sales charges imposed on redemptions in the case of Class B and |
| | | Class C shares. Had these charges been reflected, returns would have been lower. Past performance |
| | | is no guarantee of future results. Share price and investment return fluctuate such that upon |
| | | redemption, fund shares may be worth more or less than their original cost. Return figures provided |
| | | reflect Founders’ waiver of 12.5% of its management fee for the period of September 14, 2007 |
| | | through December 31, 2007.This waiver will continue through September 13, 2008, at which |
| | | time it will end. Had this waiver not been in effect, the fund’s returns would have been lower. |
| 2 | | SOURCE: LIPPER, INC. –The Morgan Stanley Capital International (MSCI) World Index |
| | | measures global developed market equity performance.The total return figure cited for this index |
| | | assumes change in security prices and reinvestment of dividends, but does not reflect the costs of |
| | | managing a mutual fund. |
| 3 | | SOURCE: LIPPER, INC. – The Morgan Stanley Capital International (MSCI) World |
| | | Growth Index measures global developed market equity performance of growth securities.The total |
| | | return figure cited for this index assumes change in security prices and reinvestment of dividends, |
| | | but does not reflect the costs of managing a mutual fund. |
The Fund 5
FUND PERFORMANCE
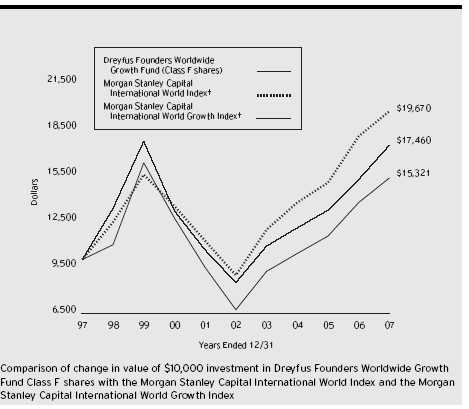
| † Source: Lipper Inc. |
| Past performance is not predictive of future performance. |
| The above graph compares a $10,000 investment made in Class F shares of Dreyfus Founders Worldwide Growth |
| Fund on 12/31/97 to a $10,000 investment made in each of the Morgan Stanley Capital International World Index |
| (the “MSCI World Index”) and the Morgan Stanley Capital International World Growth Index (the “MSCI World |
| Growth Index”) on that date. All dividends and capital gain distributions are reinvested. Performance for Class A, Class |
| B, Class C, Class I and Class T shares will vary from the performance of Class F shares shown above due to differences |
| in charges and expenses. |
| The fund’s performance shown in the line graph takes into account all applicable Class F fees and expenses (after any |
| expense reimbursements and fee waivers).The MSCI World Index is an unmanaged index of global stock market |
| performance, including the United States, Canada,Australia, New Zealand and the Far East.The MSCI World Growth |
| Index measures global developed market equity performance of growth securities. Unlike a mutual fund, the indices are |
| not subject to charges, fees and other expenses. Investors cannot invest directly in any index. Further information relating |
| to fund performance, including expense reimbursements, if applicable, is contained in the Financial Highlights section of |
| the prospectus and elsewhere in this report. |
6
| Average Annual Total Returns as of 12/31/07 | | | | | | |
| |
| | | Inception | | | | | | | | From |
| | | Date | | 1 Year | | 5 Years | | 10 Years | | Inception |
| |
| |
| |
| |
| |
|
| Class A shares | | | | | | | | | | |
| with maximum sales charge (5.75%) | | 12/31/99 | | 5.01% | | 16.38% | | — | | (1.58)% |
| without sales charge | | 12/31/99 | | 11.41% | | 17.77% | | — | | (0.85)% |
| Class B shares | | | | | | | | | | |
| with applicable redemption charge † | | 12/31/99 | | 6.49% | | 16.64% | | — | | (1.38)%†† |
| without redemption | | 12/31/99 | | 10.49% | | 16.85% | | — | | (1.38)%†† |
| Class C shares | | | | | | | | | | |
| with applicable redemption charge ††† | | 12/31/99 | | 9.63% | | 16.90% | | — | | (1.82)% |
| without redemption | | 12/31/99 | | 10.63% | | 16.90% | | — | | (1.82)% |
| Class F shares | | 12/29/89 | | 11.62% | | 17.84% | | 4.36% | | N/A |
| Class I shares | | 12/31/99 | | 11.75% | | 18.35% | | — | | (0.36)% |
| Class T shares | | | | | | | | | | |
| with applicable sales charge (4.5%) | | 12/31/99 | | 6.23% | | 16.28% | | — | | (2.27)% |
| without sales charge | | 12/31/99 | | 11.21% | | 17.35% | | — | | (1.71)% |
Past performance is not predictive of future performance.The fund’s performance shown in the graph and table does not reflect the deduction of taxes that a shareholder would pay on fund distributions or the redemption of fund shares, but does reflect fee waivers.
| † | | The maximum contingent deferred sales charge for Class B shares is 4%. After six years Class B shares convert to |
| | | Class A shares. |
| †† | | Assumes the conversion of Class B shares to Class A shares at the end of the sixth year following the date of |
| | | purchase. |
| ††† | | The maximum contingent deferred sales charge for Class C shares is 1% for shares redeemed within one year of the |
| | | date of purchase. |
The Fund 7
UNDERSTANDING YOUR FUND’S EXPENSES (Unaudited)
As a mutual fund investor, you pay ongoing expenses, such as management fees and other expenses. Using the information below, you can estimate how these expenses affect your investment and compare them with the expenses of other funds.You also may pay one-time transaction expenses, including sales charges (loads) and redemption fees, which are not shown in this section and would have resulted in higher total expenses. For more information, see your fund's prospectus or talk to your financial advisor.
Review your fund’s expenses
The table below shows the expenses you would have paid on a $1,000 investment in Dreyfus Founders Worldwide Growth Fund from July 1, 2007 to December 31, 2007. It also shows how much a $1,000 investment would be worth at the close of the period, assuming actual returns and expenses.To estimate the expenses you paid on your account over this period, simply divide your account value by $1,000 (for example, an $8,600 account value divided by $1,000 = 8.60), then multiply the results by the number in the Expenses paid per $1,000 line for the class of shares you own.
Expenses and Value of a $1,000 Investment
assuming actual returns for the six months ended December 31, 2007
|
| | | Class A | | Class B | | Class C | | Class F | | Class I | | Class T |
| |
| |
| |
| |
| |
| |
|
| Expenses paid | | | | | | | | | | | | |
| per $1,000 † | | $ 9.72 | | $ 14.55 | | $ 13.79 | | $ 8.85 | | $ 8.65 | | $ 10.69 |
| Ending value | | | | | | | | | | | | |
| (after expenses) | | $1,029.50 | | $1,024.90 | | $1,026.00 | | $1,030.50 | | $1,031.00 | | $1,028.70 |
| | COMPARING YOUR FUND’S EXPENSES
WITH THOSE OF OTHER FUNDS (Unaudited)
|
Using the SEC’s method to compare expenses
The Securities and Exchange Commission (SEC) has established guidelines to help investors assess fund expenses. Per these guidelines, the table below shows your fund’s expenses based on a $1,000 investment, assuming a hypothetical 5% annualized return. You can use this information to compare the ongoing expenses (but not transaction expenses or total cost) of investing in the fund with those of other funds.All mutual fund shareholder reports will provide this information to help you make this comparison. Please note that you cannot use this information to estimate your actual ending account balance and expenses paid during the period.
| | Expenses and Value of a $1,000 Investment
assuming a hypothetical 5% annualized return for the six months ended December 31, 2007
|
| | | Class A | | Class B | | Class C | | Class F | | Class I | | Class T |
| |
| |
| |
| |
| |
| |
|
| Expenses paid | | | | | | | | | | | | |
| per $1,000 † | | $ 9.65 | | $ 14.44 | | $ 13.69 | | $ 8.79 | | $ 8.59 | | $ 10.61 |
| Ending value | | | | | | | | | | | | |
| (after expenses) | | $1,015.63 | | $1,010.84 | | $1,011.59 | | $1,016.48 | | $1,016.69 | | $1,014.67 |
| † Expenses are equal to the fund’s annualized expense ratio of 1.90% for Class A shares, 2.85% for Class B shares, |
| 2.70% for Class C shares, 1.73% for Class F shares, 1.69% for Class I shares and 2.09% for Class T shares; |
| multiplied by the average account value over the period, multiplied by 184/365 (to reflect the one-half year period). |
8
STATEMENT OF INVESTMENTS
December 31, 2007
|
| Common Stocks—97.0% | | Shares | | Value ($) |
| |
| |
|
| Australia—2.4% | | | | |
| BHP Billiton | | 28,169 | | 992,533 |
| Coca-Cola Amatil | | 35,149 | | 292,494 |
| Commonwealth Bank of Australia | | 3,100 | | 160,822 |
| | | | | 1,445,849 |
| Austria—.3% | | | | |
| OMV | | 2,100 | | 170,139 |
| Belgium—.9% | | | | |
| Delhaize Group | | 2,260 | | 198,895 |
| InBev | | 4,476 | | 372,978 |
| | | | | 571,873 |
| Canada—2.8% | | | | |
| Barrick Gold | | 6,100 | | 258,293 |
| Bombardier, Cl. B | | 33,900 a | | 204,767 |
| Cognos | | 4,340 a | | 249,854 |
| EnCana | | 4,000 | | 273,639 |
| First Quantum Minerals | | 1,900 | | 163,812 |
| Research In Motion | | 1,800 a | | 205,339 |
| Rogers Communication, Cl. B | | 3,864 | | 176,185 |
| TransCanada | | 4,300 | | 176,672 |
| | | | | 1,708,561 |
| Denmark—.7% | | | | |
| Carlsberg, Cl. B | | 1,580 | | 191,179 |
| Novo Nordisk, Cl. B | | 3,900 | | 256,217 |
| | | | | 447,396 |
| Finland—1.4% | | | | |
| Fortum | | 5,200 | | 234,214 |
| Nokia | | 16,700 | | 647,453 |
| | | | | 881,667 |
| France—3.7% | | | | |
| Alstom | | 1,210 | | 260,029 |
| AXA | | 5,830 | | 233,442 |
| BNP Paribas | | 3,254 | | 353,067 |
| Cap Gemini | | 2,660 | | 167,212 |
| Lafarge | | 2,503 | | 455,563 |
The Fund 9
STATEMENT OF INVESTMENTS (continued)
| Common Stocks (continued) | | Shares | | Value ($) |
| |
| |
|
| France (continued) | | | | |
| Sanofi-Aventis | | 1,819 | | 167,476 |
| Total | | 5,348 | | 444,312 |
| Vivendi | | 5,045 | | 231,437 |
| | | | | 2,312,538 |
| Germany—4.5% | | | | |
| BASF | | 3,321 | | 492,343 |
| Bayerische Motoren Werke | | 2,390 | | 147,969 |
| Daimler | | 1,543 | | 150,005 |
| E.ON | | 1,150 | | 244,764 |
| Linde | | 1,211 | | 160,129 |
| MAN | | 2,020 | | 336,056 |
| Merck | | 1,770 | | 228,482 |
| RWE | | 1,170 | | 164,201 |
| Salzgitter | | 1,050 | | 156,647 |
| ThyssenKrupp | | 3,919 | | 219,715 |
| Wacker Chemie | | 1,130 | | 326,591 |
| Wincor Nixdorf | | 1,790 | | 170,092 |
| | | | | 2,796,994 |
| Greece—.4% | | | | |
| Coca-Cola Hellenic Bottling | | 5,230 | | 226,314 |
| Hong Kong—.5% | | | | |
| Esprit Holdings | | 20,600 | | 306,481 |
| Ireland—.6% | | | | |
| Allied Irish Banks | | 5,580 | | 127,835 |
| Kerry Group, Cl. A | | 7,140 | | 229,009 |
| | | | | 356,844 |
| Italy—.9% | | | | |
| ENI | | 9,713 | | 355,697 |
| Prysmian | | 8,980 a | | 221,730 |
| | | | | 577,427 |
| Japan—8.3% | | | | |
| Aisin Seiki | | 4,300 | | 179,391 |
| Canon | | 5,000 | | 232,766 |
| INPEX Holdings | | 14 | | 151,656 |
| KDDI | | 18 | | 134,073 |
10
| Common Stocks (continued) | | Shares | | Value ($) |
| |
| |
|
| Japan (continued) | | | | |
| Kenedix | | 171 | | 277,090 |
| Marubeni | | 21,000 | | 149,087 |
| Mitsubishi | | 9,100 | | 249,293 |
| Mitsubishi Electric | | 25,000 | | 261,415 |
| Mitsui & Co. | | 21,000 | | 444,628 |
| Nikon | | 8,000 | | 277,171 |
| Nintendo | | 1,400 | | 838,496 |
| Nippon Sheet Glass | | 42,000 | | 214,700 |
| Nippon Yusen | | 21,300 | | 169,332 |
| Sony | | 5,200 | | 288,630 |
| Star Micronics | | 4,900 | | 107,695 |
| Takeda Pharmaceutical | | 4,500 | | 264,682 |
| Terumo | | 4,900 | | 257,941 |
| Toshiba | | 47,000 | | 352,184 |
| Toyota Motor | | 4,900 | | 264,960 |
| | | | | 5,115,190 |
| Netherlands—1.4% | | | | |
| ASML Holding | | 4,538 a | | 143,688 |
| European Aeronautic Defence and Space | | 5,874 | | 187,459 |
| ING Groep | | 12,992 | | 508,064 |
| | | | | 839,211 |
| Norway—.8% | | | | |
| Norsk Hydro | | 11,200 | | 160,121 |
| Petroleum Geo-Services | | 5,350 | | 155,486 |
| Telenor | | 7,700 a | | 184,063 |
| | | | | 499,670 |
| Singapore—.3% | | | | |
| Singapore Press Holdings | | 56,100 | | 175,434 |
| Spain—2.5% | | | | |
| ACS-Actividades de Construccion y Servicios | | 6,200 | | 368,443 |
| Banco Santander | | 7,523 | | 162,659 |
| Inditex | | 3,520 | | 216,231 |
| Telefonica | | 20,490 | | 665,587 |
| Union Fenosa | | 2,160 | | 145,855 |
| | | | | 1,558,775 |
The Fund 11
STATEMENT OF INVESTMENTS (continued)
| Common Stocks (continued) | | Shares | | Value ($) |
| |
| |
|
| Sweden—.6% | | | | |
| Alfa Laval | | 3,150 | | 177,454 |
| TeliaSonera | | 22,300 | | 208,802 |
| | | | | 386,256 |
| Switzerland—4.2% | | | | |
| ABB | | 13,510 | | 389,342 |
| Baloise Holding | | 2,153 | | 212,085 |
| Holcim | | 2,881 | | 308,742 |
| Nestle | | 1,904 | | 874,706 |
| Roche Holding | | 3,299 | | 570,090 |
| Swatch Group | | 800 | | 241,187 |
| | | | | 2,596,152 |
| United Kingdom—9.3% | | | | |
| Amlin | | 34,071 | | 202,090 |
| AstraZeneca | | 2,819 | | 121,423 |
| British American Tobacco | | 12,340 | | 485,251 |
| Charter | | 9,850 a | | 155,570 |
| Dana Petroleum | | 5,660 a | | 156,819 |
| Firstgroup | | 15,160 | | 243,645 |
| GKN | | 21,390 | | 120,061 |
| Greene King | | 11,800 | | 187,894 |
| HBOS | | 13,403 | | 196,079 |
| International Power | | 49,491 | | 446,730 |
| Michael Page International | | 32,340 | | 185,385 |
| National Grid | | 9,390 | | 155,874 |
| Next | | 5,450 | | 174,929 |
| Prudential | | 11,690 | | 165,667 |
| Royal Dutch Shell, Cl. A | | 4,247 | | 178,448 |
| Royal Dutch Shell, Cl. B | | 5,280 | | 219,645 |
| SABMiller | | 11,930 | | 336,237 |
| Schroders | | 5,230 | | 135,536 |
| Shire | | 15,600 | | 354,284 |
| Tesco | | 48,921 | | 464,711 |
12
| Common Stocks (continued) | | Shares | | Value ($) |
| |
| |
|
| United Kingdom (continued) | | | | |
| Tullet Prebon | | 17,520 | | 163,636 |
| William Morrison Supermarkets | | 32,671 | | 209,392 |
| Xstrata | | 9,426 | | 666,036 |
| | | | | 5,725,342 |
| United States—50.5% | | | | |
| Adobe Systems | | 24,215 a | | 1,034,707 |
| Advance Auto Parts | | 27,923 | | 1,060,795 |
| Amazon.com | | 3,207 a | | 297,097 |
| Amylin Pharmaceuticals | | 14,299 a | | 529,063 |
| Apple | | 8,074 a | | 1,599,298 |
| Autodesk | | 5,768 a | | 287,016 |
| Avon Products | | 15,936 | | 629,950 |
| Best Buy | | 15,749 | | 829,185 |
| Broadcom, Cl. A | | 16,225 a | | 424,122 |
| Cadbury Schweppes, ADR | | 12,738 | | 628,875 |
| Chevron | | 5,887 | | 549,434 |
| Cisco Systems | | 19,528 a | | 528,623 |
| Citigroup | | 6,586 | | 193,892 |
| CME Group | | 746 | | 511,756 |
| Covance | | 3,046 a | | 263,845 |
| Dean Foods | | 23,784 | | 615,054 |
| eBay | | 20,559 a | | 682,353 |
| Electronic Arts | | 17,355 a | | 1,013,706 |
| Estee Lauder Cos., Cl. A | | 7,214 | | 314,603 |
| Exxon Mobil | | 7,441 | | 697,147 |
| FedEx | | 2,071 | | 184,671 |
| Gap | | 71,998 | | 1,532,117 |
| Genentech | | 4,748 a | | 318,448 |
| General Electric | | 11,928 | | 442,171 |
| Gilead Sciences | | 20,148 a | | 927,009 |
| Google, Cl. A | | 2,309 a | | 1,596,627 |
| Home Depot | | 9,784 | | 263,581 |
The Fund 13
STATEMENT OF INVESTMENTS (continued)
| Common Stocks (continued) | | Shares | | Value ($) |
| |
| |
|
| United States (continued) | | | | |
| Janus Capital Group | | 14,620 | | 480,267 |
| Juniper Networks | | 21,679 a | | 719,743 |
| KLA-Tencor | | 9,701 | | 467,200 |
| Kraft Foods, Cl. A | | 19,112 | | 623,625 |
| Maxim Integrated Products | | 16,511 | | 437,211 |
| Medtronic | | 6,062 | | 304,737 |
| MEMC Electronic Materials | | 6,920 a | | 612,351 |
| Merck & Co. | | 8,998 | | 522,874 |
| Microsoft | | 22,252 | | 792,171 |
| Pharmaceutical Product Development | | 7,599 | | 306,772 |
| Royal Caribbean Cruises | | 12,281 | | 521,206 |
| Schering-Plough | | 19,193 | | 511,302 |
| Schlumberger | | 2,069 | | 203,528 |
| Starbucks | | 20,335 a | | 416,257 |
| Sunoco | | 4,578 | | 331,630 |
| Tesoro | | 6,346 | | 302,704 |
| Thermo Fisher Scientific | | 16,186 a | | 933,608 |
| Unum Group | | 41,796 | | 994,327 |
| Urban Outfitters | | 13,294 a | | 362,394 |
| Verizon Communications | | 10,449 | | 456,517 |
| Wal-Mart Stores | | 17,291 | | 821,841 |
| Waste Management | | 21,702 | | 709,004 |
| Whole Foods Market | | 27,073 | | 1,104,578 |
| Yahoo! | | 10,050 a | | 233,763 |
| | | | | 31,124,755 |
| Total Common Stocks | | | | |
| (cost $51,921,702) | | | | 59,822,868 |
| |
| |
|
| |
| Preferred Stocks—.8% | | | | |
| |
| |
|
| Germany | | | | |
| Fresenius | | | | |
| (cost $359,899) | | 6,173 | | 513,484 |
14
| Exchange Traded Funds—2.7% | | Shares | | Value ($) |
| |
| |
|
| United States | | | | |
| iShares MSCI EAFE Index Fund | | 10,645 | | 835,633 |
| Standard & Poor’s Depository Receipts (Tr. Ser. 1) | | 5,460 | | 798,307 |
| Total Exchange Traded Funds | | | | |
| (cost $1,677,274) | | | | 1,633,940 |
| |
| |
|
| Total Investments (cost $53,958,875) | | 100.5% | | 61,970,292 |
| Liabilities, Less Cash and Receivables | | (.5%) | | (300,187) |
| Net Assets | | 100.0% | | 61,670,105 |
| ADR—American Depository Receipts |
| a Non-income producing security. |
| Portfolio Summary | | (Unaudited) † | | | | |
| |
| | | Value (%) | | | | Value (%) |
| |
| |
| |
|
| United States | | 53.2 | | Belgium | | .9 |
| United Kingdom | | 9.3 | | Italy | | .9 |
| Japan | | 8.3 | | Norway | | .8 |
| Germany | | 5.3 | | Denmark | | .7 |
| Switzerland | | 4.2 | | Ireland | | .6 |
| France | | 3.7 | | Sweden | | .6 |
| Canada | | 2.8 | | Hong Kong | | .5 |
| Spain | | 2.5 | | Greece | | .4 |
| Australia | | 2.4 | | Austria | | .3 |
| Finland | | 1.4 | | Singapore | | .3 |
| Netherlands | | 1.4 | | | | 100.5 |
| † Based on net assets. |
| See notes to financial statements. |
The Fund 15
| | STATEMENT OF ASSETS AND LIABILITIES
December 31, 2007
|
| | | Cost | | Value |
| |
| |
|
| Assets ($): | | | | |
| Investments in securities—See Statement of Investments | | 53,958,875 | | 61,970,292 |
| Cash | | | | 1,071,897 |
| Cash denominated in foreign currencies | | 214,744 | | 219,524 |
| Dividends and interest receivable | | | | 92,714 |
| Receivable for shares of Common Stock subscribed | | | | 53,078 |
| Prepaid expenses | | | | 29,855 |
| Other assets | | | | 162,362 |
| | | | | 63,599,722 |
| |
| |
|
| Liabilities ($): | | | | |
| Due to Founders Asset Management LLC and affiliates—Note 3(c) | | 142,122 |
| Payable for shares of Common Stock redeemed | | | | 1,559,679 |
| Directors’ deferred compensation | | | | 162,362 |
| Interest payable—Note 2 | | | | 84 |
| Accrued expenses | | | | 65,370 |
| | | | | 1,929,617 |
| |
| |
|
| Net Assets ($) | | | | 61,670,105 |
| |
| |
|
| Composition of Net Assets ($): | | | | |
| Paid-in capital | | | | 93,492,182 |
| Accumulated investment (loss)—net | | | | (64,909) |
| Accumulated net realized gain (loss) on investments | | | | (39,789,346) |
| Accumulated net unrealized appreciation (depreciation) | | | | |
| on investments and foreign currency transactions | | | | 8,032,178 |
| |
| |
|
| Net Assets ($) | | | | 61,670,105 |
| Net Asset Value Per Share | | | | | | | | | | |
| | | Class A | | Class B | | Class C | | Class F | | Class I | | Class T |
| |
| |
| |
| |
| |
| |
|
| Net Assets ($) | | 1,938,059 | | 540,672 | | 730,277 | | 56,943,405 | | 1,389,063 | | 128,629 |
| Shares Outstanding | | 102,780 | | 30,564 | | 42,025 | | 3,007,722 | | 70,863 | | 7,324 |
| |
| |
| |
| |
| |
| |
|
| Net Asset Value | | | | | | | | | | | | |
| Per Share ($) | | 18.86 | | 17.69 | | 17.38 | | 18.93 | | 19.60 | | 17.56 |
See notes to financial statements.
16
| | STATEMENT OF OPERATIONS
Year Ended December 31, 2007
|
| Investment Income ($): | | |
| Income: | | |
| Dividends (net of $72,955 foreign taxes withheld at source): | | |
| Unaffiliated issuers | | 1,017,639 |
| Affiliated issuers | | 5,278 |
| Interest | | 6,794 |
| Total Income | | 1,029,711 |
| Expenses: | | |
| Investment advisory fee—Note 3(a) | | 651,829 |
| Shareholder servicing costs—Note 3(c) | | 169,222 |
| Distribution fees—Note 3(b) | | 130,027 |
| Accounting fees—Note 3(c) | | 52,413 |
| Custodian fees—Note 3(c) | | 37,263 |
| Registration fees | | 33,686 |
| Directors’ fees and expenses—Note 3(d) | | 33,646 |
| Professional fees | | 28,439 |
| Prospectus and shareholders’ reports | | 19,753 |
| Interest expense—Note 2 | | 3,438 |
| Miscellaneous | | 26,459 |
| Total Expenses | | 1,186,175 |
| Less—reduction in investment advisory fee—Note 3(a) | | (24,132) |
| Less—reduction in accounting fees—Note 3(c) | | (12,042) |
| Less—reduction in custody fees due to | | |
| earnings credits—Note 1(c) | | (15,148) |
| Less—expense offset to broker commissions—Note 1 | | (2,544) |
| Net Expenses | | 1,132,309 |
| Investment (Loss)—Net | | (102,598) |
| |
|
| Realized and Unrealized Gain (Loss) on Investments—Note 4 ($): |
| Net realized gain (loss) on investments and foreign currency transactions | | 11,192,976 |
| Net realized gain (loss) on forward currency exchange contracts | | (57,217) |
| Net Realized Gain (Loss) | | 11,135,759 |
| Net unrealized appreciation (depreciation) on | | |
| investments and foreign currency transactions | | (3,881,641) |
| Net Realized and Unrealized Gain (Loss) on Investments | | 7,254,118 |
| Net Increase in Net Assets Resulting from Operations | | 7,151,520 |
See notes to financial statements.
The Fund 17
STATEMENT OF CHANGES IN NET ASSETS
| | | Year Ended December 31, |
| |
|
| | | 2007 a | | 2006 |
| |
| |
|
| Operations ($): | | | | |
| Investment (loss)—net | | (102,598) | | (221,632) |
| Net realized gain (loss) on investments | | 11,135,759 | | 9,108,976 |
| Net unrealized appreciation | | | | |
| (depreciation) on investments | | (3,881,641) | | 1,144,647 |
| Net Increase (Decrease) in Net Assets | | | | |
| Resulting from Operations | | 7,151,520 | | 10,031,991 |
| |
| |
|
| Capital Stock Transactions ($): | | | | |
| Net proceeds from shares sold: | | | | |
| Class A shares | | 724,777 | | 984,635 |
| Class B shares | | 140,383 | | 29,902 |
| Class C shares | | 415,442 | | 127,049 |
| Class F shares | | 9,650,997 | | 2,375,671 |
| Class I shares | | 868,350 | | 876,169 |
| Class T shares | | 164,133 | | 3,754 |
| Cost of shares redeemed: | | | | |
| Class A shares | | (611,856) | | (170,595) |
| Class B shares | | (478,611) | | (1,222,465) |
| Class C shares | | (112,362) | | (101,092) |
| Class F shares | | (13,444,416) | | (10,595,986) |
| Class I shares | | (2,093,396) | | (601,168) |
| Class T shares | | (75,238) | | (13,950) |
| Increase (Decrease) in Net Assets | | | | |
| from Capital Stock Transactions | | (4,851,797) | | (8,308,076) |
| Total Increase (Decrease) in Net Assets | | 2,299,723 | | 1,723,915 |
| |
| |
|
| Net Assets ($): | | | | |
| Beginning of Period | | 59,370,382 | | 57,646,467 |
| End of Period | | 61,670,105 | | 59,370,382 |
| Undistributed investment (loss)—net | | (64,909) | | (87,166) |
18
| | | Year Ended December 31, |
| |
|
| | | 2007 a | | 2006 |
| |
| |
|
| Capital Share Transactions: | | | | |
| Class A b | | | | |
| Shares sold | | 39,153 | | 64,493 |
| Shares redeemed | | (33,766) | | (10,658) |
| Net Increase (Decrease) in Shares Outstanding | | 5,387 | | 53,835 |
| |
| |
|
| Class B b | | | | |
| Shares sold | | 7,967 | | 2,062 |
| Shares redeemed | | (28,571) | | (83,719) |
| Net Increase (Decrease) in Shares Outstanding | | (20,604) | | (81,657) |
| |
| |
|
| Class C | | | | |
| Shares sold | | 24,153 | | 8,673 |
| Shares redeemed | | (6,627) | | (7,336) |
| Net Increase (Decrease) in Shares Outstanding | | 17,526 | | 1,337 |
| |
| |
|
| Class F | | | | |
| Shares sold | | 558,552 | | 153,883 |
| Shares redeemed | | (744,216) | | (689,269) |
| Net Increase (Decrease) in Shares Outstanding | | (185,664) | | (535,386) |
| |
| |
|
| Class I | | | | |
| Shares sold | | 45,705 | | 56,296 |
| Shares redeemed | | (108,088) | | (38,898) |
| Net Increase (Decrease) in Shares Outstanding | | (62,383) | | 17,398 |
| |
| |
|
| Class T | | | | |
| Shares sold | | 9,814 | | 268 |
| Shares redeemed | | (4,088) | | (936) |
| Net Increase (Decrease) in Shares Outstanding | | 5,726 | | (668) |
| a | | Effective June 1, 2007, Class R shares were redesignated as Class I shares. |
| b | | During the period ended December 31, 2007, 14,394 Class B shares representing $242,292 were automatically |
| | | converted to 13,585 Class A shares and during the period ended December 31, 2006, 44,212 Class B shares |
| | | representing $652,334 were automatically converted to 42,063 Class A shares. |
| See notes to financial statements. |
The Fund 19
FINANCIAL HIGHLIGHTS
The following tables describe the performance for each share class for the fiscal periods indicated.All information (except portfolio turnover rate) reflects financial results for a single fund share.Total return shows how much your investment in the fund would have increased (or decreased) during each period, assuming you had reinvested all dividends and distributions.These figures have been derived from the fund’s financial statements.
| | | | | Year Ended December 31, | | |
| |
| |
| |
|
| Class A Shares | | 2007 | | 2006 | | 2005 | | 2004 | | 2003 |
| |
| |
| |
| |
| |
|
| Per Share Data ($): | | | | | | | | | | |
| Net asset value, beginning of period | | 16.91 | | 14.21 | | 12.82 | | 11.38 | | 8.32 |
| Investment Operations: | | | | | | | | | | |
| Investment (loss)—net | | (.05)a | | (.06)a | | (.02)a | | (.21) | | (.10) |
| Net realized and unrealized | | | | | | | | | | |
| gain (loss) on investments | | 2.00 | | 2.76 | | 1.41 | | 1.65 | | 3.16 |
| Total from Investment Operations | | 1.95 | | 2.70 | | 1.39 | | 1.44 | | 3.06 |
| Net asset value, end of period | | 18.86 | | 16.91 | | 14.21 | | 12.82 | | 11.38 |
| |
| |
| |
| |
| |
|
| Total Return (%) b | | 11.41 | | 19.07 | | 10.84 | | 12.65 | | 36.78 |
| |
| |
| |
| |
| |
|
| Ratios/Supplemental Data (%): | | | | | | | | | | |
| Ratio of total expenses | | | | | | | | | | |
| to average net assets | | 1.94 | | 1.97 | | 1.98 | | 1.83 | | 2.04 |
| Ratio of net expenses | | | | | | | | | | |
| to average net assets | | 1.86 | | 1.93 | | 1.92 | | 1.81 | | 2.03 |
| Ratio of net investment (loss) | | | | | | | | | | |
| to average net assets | | (.28) | | (.39) | | (.19) | | (.18) | | (.55) |
| Portfolio Turnover Rate | | 117 | | 114 | | 120 | | 130 | | 138 |
| |
| |
| |
| |
| |
|
| Net Assets, end of period ($ x 1,000) | | 1,938 | | 1,647 | | 619 | | 519 | | 656 |
| a | | Based on average shares outstanding at each month end. |
| b | | Exclusive of sales charge. |
| See notes to financial statements. |
20
| | | | | Year Ended December 31, | | |
| |
| |
| |
|
| Class B Shares | | 2007 | | 2006 | | 2005 | | 2004 | | 2003 |
| |
| |
| |
| |
| |
|
| Per Share Data ($): | | | | | | | | | | |
| Net asset value, beginning of period | | 16.00 | | 13.58 | | 12.33 | | 11.02 | | 8.12 |
| Investment Operations: | | | | | | | | | | |
| Investment (loss)—net | | (.18)a | | (.16)a | | (.11)a | | (.09) | | (.16) |
| Net realized and unrealized | | | | | | | | | | |
| gain (loss) on investments | | 1.87 | | 2.58 | | 1.36 | | 1.40 | | 3.06 |
| Total from Investment Operations | | 1.69 | | 2.42 | | 1.25 | | 1.31 | | 2.90 |
| Net asset value, end of period | | 17.69 | | 16.00 | | 13.58 | | 12.33 | | 11.02 |
| |
| |
| |
| |
| |
|
| Total Return (%) b | | 10.49 | | 17.89 | | 10.14 | | 11.89 | | 35.71 |
| |
| |
| |
| |
| |
|
| Ratios/Supplemental Data (%): | | | | | | | | | | |
| Ratio of total expenses | | | | | | | | | | |
| to average net assets | | 2.75 | | 2.84 | | 2.72 | | 2.54 | | 2.82 |
| Ratio of net expenses | | | | | | | | | | |
| to average net assets | | 2.68 | | 2.79 | | 2.66 | | 2.52 | | 2.80 |
| Ratio of net investment (loss) | | | | | | | | | | |
| to average net assets | | (1.09) | | (1.13) | | (.93) | | (.87) | | (1.30) |
| Portfolio Turnover Rate | | 117 | | 114 | | 120 | | 130 | | 138 |
| |
| |
| |
| |
| |
|
| Net Assets, end of period ($ x 1,000) | | 541 | | 819 | | 1,803 | | 2,061 | | 1,821 |
| a | | Based on average shares outstanding at each month end. |
| b | | Exclusive of sales charge. |
| See notes to financial statements. |
The Fund 21
FINANCIAL HIGHLIGHTS (continued)
| | | | | Year Ended December 31, | | |
| |
| |
| |
|
| Class C Shares | | 2007 | | 2006 | | 2005 | | 2004 | | 2003 |
| |
| |
| |
| |
| |
|
| Per Share Data ($): | | | | | | | | | | |
| Net asset value, beginning of period | | 15.71 | | 13.31 | | 12.08 | | 10.81 | | 7.96 |
| Investment Operations: | | | | | | | | | | |
| Investment (loss)—net | | (.19)a | | (.15)a | | (.07)a | | (.20) | | (.20) |
| Net realized and unrealized | | | | | | | | | | |
| gain (loss) on investments | | 1.86 | | 2.55 | | 1.30 | | 1.47 | | 3.05 |
| Total from Investment Operations | | 1.67 | | 2.40 | | 1.23 | | 1.27 | | 2.85 |
| Net asset value, end of period | | 17.38 | | 15.71 | | 13.31 | | 12.08 | | 10.81 |
| |
| |
| |
| |
| |
|
| Total Return (%) b | | 10.63 | | 18.03 | | 10.18 | | 11.75 | | 35.80 |
| |
| |
| |
| |
| |
|
| Ratios/Supplemental Data (%): | | | | | | | | | | |
| Ratio of total expenses | | | | | | | | | | |
| to average net assets | | 2.75 | | 2.76 | | 2.72 | | 2.62 | | 2.84 |
| Ratio of net expenses | | | | | | | | | | |
| to average net assets | | 2.63 | | 2.71 | | 2.66 | | 2.59 | | 2.82 |
| Ratio of net investment (loss) | | | | | | | | | | |
| to average net assets | | (1.11) | | (1.10) | | (.93) | | (.97) | | (1.34) |
| Portfolio Turnover Rate | | 117 | | 114 | | 120 | | 130 | | 138 |
| |
| |
| |
| |
| |
|
| Net Assets, end of period ($ x 1,000) | | 730 | | 385 | | 308 | | 272 | | 271 |
| a | | Based on average shares outstanding at each month end. |
| b | | Exclusive of sales charge. |
| See notes to financial statements. |
22
| | | | | Year Ended December 31, | | |
| |
| |
| |
|
| Class F Shares | | 2007 | | 2006 | | 2005 | | 2004 | | 2003 |
| |
| |
| |
| |
| |
|
| Per Share Data ($): | | | | | | | | | | |
| Net asset value, beginning of period | | 16.96 | | 14.26 | | 12.86 | | 11.41 | | 8.33 |
| Investment Operations: | | | | | | | | | | |
| Investment (loss)—net | | (.03)a | | (.05)a | | (.02)a | | (.21) | | (.13) |
| Net realized and unrealized | | | | | | | | | | |
| gain (loss) on investments | | 2.00 | | 2.75 | | 1.42 | | 1.66 | | 3.21 |
| Total from Investment Operations | | 1.97 | | 2.70 | | 1.40 | | 1.45 | | 3.08 |
| Net asset value, end of period | | 18.93 | | 16.96 | | 14.26 | | 12.86 | | 11.41 |
| |
| |
| |
| |
| |
|
| Total Return (%) | | 11.62 | | 18.93 | | 10.89 | | 12.71 | | 36.97 |
| |
| |
| |
| |
| |
|
| Ratios/Supplemental Data (%): | | | | | | | | | | |
| Ratio of total expenses | | | | | | | | | | |
| to average net assets | | 1.80 | | 2.03 | | 1.96 | | 1.80 | | 1.98 |
| Ratio of net expenses | | | | | | | | | | |
| to average net assets | | 1.72 | | 1.98 | | 1.91 | | 1.77 | | 1.97 |
| Ratio of net investment (loss) | | | | | | | | | | |
| to average net assets | | (.14) | | (.38) | | (.17) | | (.13) | | (.47) |
| Portfolio Turnover Rate | | 117 | | 114 | | 120 | | 130 | | 138 |
| |
| |
| |
| |
| |
|
| Net Assets, end of period ($ x 1,000) | | 56,943 | | 54,158 | | 53,184 | | 61,038 | | 70,566 |
| a Based on average shares outstanding at each month end. |
| See notes to financial statements. |
The Fund 23
FINANCIAL HIGHLIGHTS (continued)
| | | | | Year Ended December 31, | | |
| |
| |
| |
|
| Class I Shares | | 2007 a | | 2006 | | 2005 | | 2004 | | 2003 |
| |
| |
| |
| |
| |
|
| Per Share Data ($): | | | | | | | | | | |
| Net asset value, beginning of period | | 17.54 | | 14.69 | | 13.13 | | 11.60 | | 8.44 |
| Investment Operations: | | | | | | | | | | |
| Investment income (loss)—net | | (.01)b | | .01b | | .05b | | .03 | | .00c |
| Net realized and unrealized | | | | | | | | | | |
| gain (loss) on investments | | 2.07 | | 2.84 | | 1.51 | | 1.50 | | 3.16 |
| Total from Investment Operations | | 2.06 | | 2.85 | | 1.56 | | 1.53 | | 3.16 |
| Net asset value, end of period | | 19.60 | | 17.54 | | 14.69 | | 13.13 | | 11.60 |
| |
| |
| |
| |
| |
|
| Total Return (%) | | 11.75 | | 19.40 | | 11.88 | | 13.19 | | 37.44 |
| |
| |
| |
| |
| |
|
| Ratios/Supplemental Data (%): | | | | | | | | | | |
| Ratio of total expenses | | | | | | | | | | |
| to average net assets | | 1.69 | | 1.62 | | 1.47 | | 1.39 | | 1.53 |
| Ratio of net expenses | | | | | | | | | | |
| to average net assets | | 1.60 | | 1.58 | | 1.44 | | 1.37 | | 1.51 |
| Ratio of net investment income | | | | | | | | | | |
| (loss) to average net assets | | (.04) | | .02 | | .35 | | .28 | | (.03) |
| Portfolio Turnover Rate | | 117 | | 114 | | 120 | | 130 | | 138 |
| |
| |
| |
| |
| |
|
| Net Assets, end of period ($ x 1,000) | | 1,389 | | 2,337 | | 1,701 | | 24,665 | | 21,404 |
| a | | Effective June 1, 2007, Class R shares were redesignated as Class I shares. |
| b | | Based on average shares outstanding at each month end. |
| c | | Amount represents less than $.01 per share. |
| See notes to financial statements. |
24
| | | | | Year Ended December 31, | | |
| |
| |
| |
|
| Class T Shares | | 2007 | | 2006 | | 2005 | | 2004 | | 2003 |
| |
| |
| |
| |
| |
|
| Per Share Data ($): | | | | | | | | | | |
| Net asset value, beginning of period | | 15.79 | | 13.31 | | 12.05 | | 10.73 | | 7.89 |
| Investment Operations: | | | | | | | | | | |
| Investment (loss)—net | | (.10)a | | (.08)a | | (.07)a | | (.36) | | (.14) |
| Net realized and unrealized | | | | | | | | | | |
| gain (loss) on investments | | 1.87 | | 2.56 | | 1.33 | | 1.68 | | 2.98 |
| Total from Investment Operations | | 1.77 | | 2.48 | | 1.26 | | 1.32 | | 2.84 |
| Net asset value, end of period | | 17.56 | | 15.79 | | 13.31 | | 12.05 | | 10.73 |
| |
| |
| |
| |
| |
|
| Total Return (%) b | | 11.21 | | 18.63 | | 10.46 | | 12.30 | | 35.99 |
| |
| |
| |
| |
| |
|
| Ratios/Supplemental Data (%): | | | | | | | | | | |
| Ratio of total expenses | | | | | | | | | | |
| to average net assets | | 2.11 | | 2.23 | | 2.35 | | 2.16 | | 2.56 |
| Ratio of net expenses | | | | | | | | | | |
| to average net assets | | 2.02 | | 2.19 | | 2.30 | | 2.14 | | 2.54 |
| Ratio of net investment (loss) | | | | | | | | | | |
| to average net assets | | (.55) | | (.57) | | (.56) | | (.50) | | (1.05) |
| Portfolio Turnover Rate | | 117 | | 114 | | 120 | | 130 | | 138 |
| |
| |
| |
| |
| |
|
| Net Assets, end of period ($ x 1,000) | | 129 | | 25 | | 30 | | 54 | | 61 |
| a | | Based on average shares outstanding at each month end. |
| b | | Exclusive of sales charge. |
| See notes to financial statements. |
The Fund 25
NOTES TO FINANCIAL STATEMENTS
NOTE 1—Significant Accounting Policies:
Dreyfus Founders Worldwide Growth Fund (the “fund”) is a separate diversified series of Dreyfus Founders Funds, Inc. (the “Company”), which is registered under the Investment Company Act of 1940, as amended (the “Act”), as an open-end management investment company and operates as a series company currently offering six series, including the fund. The fund’s investment objective is to seek long-term growth of capital through investments in foreign and U.S. companies. Founders Asset Management LLC (“Founders”) serves as the fund’s investment adviser. During the first half of the reporting period, Founders was an indirect, wholly-owned subsidiary of Mellon Financial Corporation (“Mellon Financial”).
On July 1, 2007, Mellon Financial and The Bank of New York Company, Inc. merged, forming The Bank of New York Mellon Corporation (“BNY Mellon”). As part of this transaction, Founders became an indirect, wholly-owned subsidiary of BNY Mellon.
The Company’s Board of Directors approved the redesignation of the fund’s Class R shares as Class I shares, effective June 1, 2007.The eligibility requirements for Class I shares remained the same as for Class R shares.
MBSC Securities Corporation (the “Distributor”), the direct owner of Founders and a wholly-owned subsidiary of The Dreyfus Corporation (“Dreyfus”), an affiliate of Founders, is the distributor of the fund’s shares. The fund is authorized to issue up to 550 million shares of Common Stock, par value $ .01 per share, in the following classes of shares: Class A, Class B, Class C, Class F, Class I and Class T. Class A and Class T shares are subject to a sales charge imposed at the time of purchase, although the shares may be purchased at net asset value (“NAV”) without a sales charge by certain categories of investors. Class B shares are subject to a contingent deferred sales charge (“CDSC”) imposed on Class B share redemptions made within six years of purchase and automatically convert to Class A shares after six years. The fund does not offer Class B shares, except in connection with dividend reinvestment
26
and permitted exchanges of Class B shares. Class C shares are subject to a CDSC imposed on Class C shares redeemed within one year of purchase. Class F and Class I shares are sold at NAV per share. Class F shares are sold only to Class F grandfathered investors, and Class I shares are sold only to eligible institutional investors. Other differences between the classes include the services offered to and the expenses borne by each class. Income and realized and unrealized gains or losses on investments are allocated to each class of shares based on its relative net assets.
Each class of the fund bears expenses incurred specifically on its behalf and, in addition, each class bears a portion of general expenses based on the relative net assets or the number of shareholder accounts of the class.The type of expense determines the allocation method.
The Company’s Board of Directors has authorized the payment of certain fund expenses with commissions on fund portfolio transactions. These commissions increase miscellaneous expenses and are included in the expense offset to broker commissions in the Statement of Operations.
The fund’s financial statements are prepared in accordance with U.S. generally accepted accounting principles, which require the use of management estimates and assumptions. Actual results could differ from those estimates.
The fund enters into contracts that contain a variety of indemnifications. The fund’s maximum exposure under these arrangements is unknown.The fund does not anticipate recognizing any loss related to these arrangements.
(a) Portfolio valuation: A domestic equity security listed or traded on a securities exchange or in the over-the-counter market is valued at its last sale price on the exchange or market where it is principally traded or, in the case of a security traded on NASDAQ, at its official closing price. Lacking any sales on that day, the security is valued at the current closing bid price, or by quotes from dealers making a market in the security if the closing bid price is not available, or in the case of
The Fund 27
NOTES TO FINANCIAL STATEMENTS (continued)
written call options, at the mean between the highest bid and lowest asked quotations obtained from at least two securities dealers.
A foreign equity security traded on a foreign exchange is valued at the last quoted official closing price available before the time when the fund’s assets are valued, or at the last quoted sales price if the exchange does not provide an official closing price or if the foreign market has not yet closed. Lacking any sales that day, the security is valued at the current closing bid price, or by quotes from dealers making a market in the security if the closing bid price is not available. New York closing exchange rates are used to convert foreign currencies to U.S. dollars.
A debt security with a remaining maturity greater than 60 days at the time of purchase is valued in accordance with the evaluated bid price supplied by a pricing service approved by the Company’s Board of Directors or, if such price is not available, at the mean between the highest bid and lowest asked quotations obtained from at least two securities dealers.A debt security with a remaining maturity of 60 days or less at the time of purchase is valued at amortized cost, which approximates market value, unless it is determined that amortized cost would not represent market value, in which case the securities would be marked to market.
Registered open-end investment companies that are not traded on an exchange are valued at their NAV.
If market quotations or official closing prices are not readily available or are determined not to reflect accurately fair value, securities will be valued at their fair value as determined in good faith by the Company’s Board of Directors or pursuant to procedures approved by the Board of Directors.These situations may include instances where an event occurs after the close of the market on which a security is traded but before the fund calculates its NAV, and it is determined that the event has materially affected the value of the security. Fair value of foreign equity securities may be determined with the assistance of a pricing service using calculations based on indexes of domestic securities and other appropriate indicators, such as prices of relevant ADRs and futures contracts.
28
The Financial Accounting Standards Board (“FASB”) released Statement of Financial Accounting Standards No. 157 “Fair Value Measurements” (“FAS 157”). FAS 157 establishes an authoritative definition of fair value, sets out a framework for measuring fair value, and requires additional disclosures about fair-value measurements.The application of FAS 157 is required for fiscal years beginning after November 15, 2007 and interim periods within those fiscal years. Management does not believe that the application of this standard will have a material impact on the financial statements of the fund.
(b) Foreign securities and currency transactions: The fund normally will invest a significant portion of its assets in foreign securities. Foreign securities carry more risk than U.S. securities, such as political and currency risks. In the event the fund executes a foreign security transaction, the fund may enter into a foreign currency contract to settle the foreign security transaction.The fund could be exposed to risk if counterparties are unable to meet the terms of the contracts or if the value of the currency changes unfavorably to the U.S. dollar.The resultant foreign currency gain or loss from the contract is recorded as foreign currency gain or loss and is presented as such in the Statement of Operations.
The accounting records of the fund are maintained in U.S. dollars.The market values of foreign securities, currency holdings and other assets and liabilities are translated into U.S. dollars based on the current exchange rates each business day. Purchases and sales of investment securities and income and expense items denominated in foreign currencies are translated into U.S. dollar amounts on the respective dates of such transactions.
The fund does not isolate that portion of the results of operations resulting from changes in foreign exchange rates on investments from the fluctuations arising from changes in market prices of securities held. Such fluctuations are included with net unrealized appreciation (depreciation) from investments and foreign currency transactions in the Statement of Operations.
The Fund 29
NOTES TO FINANCIAL STATEMENTS (continued)
Reported net realized foreign exchange gains or losses arise from sales of foreign currencies,currency gains or losses realized between the trade and settlement dates on securities transactions,and the difference between the amounts of dividends,interest,and foreign withholding taxes recorded on the fund’s books and the U.S. dollar equivalent of the amounts actually received or paid. Net unrealized appreciation or depreciation on investments and foreign currency translation arises from changes in the values of assets and liabilities, including investments in securities held at the date of the financial statements, resulting from changes in the exchange rates and changes in market prices of securities held.
(c) Securities transactions and investment income: Securities transactions are recorded on a trade date basis. Realized gains and losses from securities transactions are recorded on the identified cost basis. Dividend income is recognized on the ex-dividend date and interest income, including, where applicable, accretion of discount and amortization of premium on investments, is recognized on the accrual basis.
The fund has an arrangement with the custodian bank, Mellon Bank, N.A. (“Mellon Bank”), whereby the fund receives earnings credits from the custodian when positive cash balances are maintained, which are used to offset custody fees. For financial reporting purposes, the fund includes any earnings credits as an expense offset in the Statement of Operations.
(d) Affiliated issuers: Investments in other investment companies advised by Founders or its affiliates are defined as “affiliated” in the Act.
(e) Dividends to shareholders: Dividends are recorded on the ex-dividend date. Dividends from investment income-net and dividends from net realized capital gains, if any, are normally declared and paid annually, but the fund may make distributions on a more frequent basis to comply with the distribution requirements of the Internal Revenue Code of 1986, as amended (the “Code”).To the extent that net realized capital gains can be offset by capital loss carryovers, it is the policy of the fund not to distribute such gains. Income and capital gain distribu-
30
tions are determined in accordance with income tax regulations, which may differ from U.S. generally accepted accounting principles.
(f) Federal income taxes: No provision has been made for federal income taxes since it is the policy of the fund to continue to comply with the requirements of Subchapter M of the Code that are applicable to regulated investment companies and to make distributions of income and capital gains sufficient to relieve it from all income taxes.The fund is treated as a separate tax entity for federal income tax purposes.
During the current year, the fund adopted FASB Interpretation No. 48 “Accounting for Uncertainty in Income Taxes” (“FIN 48”). FIN 48 provides guidance for how uncertain tax positions should be recognized, measured, presented and disclosed in the financial statements. FIN 48 requires the evaluation of tax positions taken or expected to be taken in the course of preparing the fund’s tax returns to determine whether the tax positions are “more-likely-than-not” of being sustained by the applicable tax authority.Tax positions not deemed to meet the more-likely-than-not threshold would be recorded as a tax benefit or expense in the current year.The adoption of FIN 48 had no impact on the operations of the fund for the period ended December 31, 2007.
The fund is not subject to examination by U.S. Federal, State and City tax authorities for the tax years before 2004.
At December 31, 2007, the components of accumulated earnings on a tax basis were as follows: accumulated capital losses $39,639,243 and unrealized appreciation $7,841,897.
The accumulated capital loss carryover is available to be applied against future net securities profits, if any, realized subsequent to December 31, 2007. If not applied, $14,296,069 of the carryover expires in fiscal 2009, $22,200,649 expires in fiscal 2010 and $3,142,525 expires in fiscal 2011.
During the period ended December 31, 2007, as a result of permanent book to tax differences, primarily due to the tax treatment for foreign currency transactions and net operating losses, the fund increased accu-
The Fund 31
NOTES TO FINANCIAL STATEMENTS (continued)
mulated undistributed investment income-net by $124,855, decreased accumulated net realized gain (loss) on investments by $8,783 and decreased paid-in capital by $116,072. Net assets and net asset value per share were not affected by this reclassification.
NOTE 2—Bank Line of Credit:
The Company has a line of credit arrangement (“LOC”) with State Street Bank and Trust Company, to be used for temporary or emergency purposes, primarily for financing redemption payments. The borrowings by each series of the Company are limited to the lesser of (a) $25 million, or (b) the lesser of 25% of the series’ total net assets or the maximum amount which the series is permitted to borrow pursuant to the prospectus, any law or any other agreement. Combined borrowings are subject to the $25 million cap on the total LOC. Each series agrees to pay annual fees and interest on the unpaid balance based on prevailing market rates as defined in the LOC.
The average daily amount of borrowings outstanding under the LOC during the period ended December 31, 2007, was approximately $60,000, with a related weighted average annualized interest rate of 5.73% .
NOTE 3—Investment Advisory Fee and Other Transactions With Affiliates:
(a) In accordance with an investment advisory agreement between the Company and Founders, the fund compensates Founders for its services as investment adviser by the payment of fees computed daily and paid monthly at the annual rate equal to a percentage of the average daily value of the fund’s net assets.The fee is 1% of the first $250 million of net assets, .80% of the next $250 million of net assets and .70% of net assets in excess of $500 million. For the period from September 14, 2007 through September 13, 2008, Founders has agreed to waive 12.5% of its investment advisory fee for the Fund. This waiver will end on September 14, 2008, and on that date, the Fund’s contractual investment
32
advisory fee will again be in effect.The reduction in investment advisory fee amounted to $24,132 during the period ended December 31, 2007.
During the period ended December 31, 2007, the Distributor retained $534 and $1 from commissions earned on sales of the fund’s Class A and Class T shares, respectively, and $253 and $8 from CDSC on redemptions of the fund’s Class B and Class C shares, respectively.
(b) Under a Distribution Plan (the “Class B, C and T Plan”) adopted pursuant to Rule 12b-1 under the Act, Class B, Class C and Class T shares pay the Distributor for distributing their shares at an annual rate of .75% of the value of their average daily net assets of Class B and Class C shares and .25% of the value of the average daily net assets of Class T shares. During the period ended December 31, 2007, Class B, Class C and Class T shares were charged $4,400, $3,595 and $322 respectively, pursuant to the Class B, C and T Plan.
The fund also has adopted a Distribution Plan pursuant to Rule 12b-1 under the Act applicable to its Class F shares (the “Class F Plan”). Under the Class F Plan, the fund is authorized to reimburse the Distributor for expenses paid for distributing or servicing its Class F shares at an annual rate of up to .25% of the value of the average daily net assets of the fund’s Class F shares. During the period ended December 31, 2007, Class F shares were charged $121,710 pursuant to the Class F Plan.
(c) Under the Shareholder Services Plan, Class A, Class B, Class C and Class T shares pay the Distributor at an annual rate of .25% of the value of their average daily net assets for the provision of certain services.The services provided may include personal services relating to shareholder accounts, such as answering shareholder inquiries regarding the fund and providing reports and other information, and services related to the maintenance of shareholder accounts.The Distributor may make payments to Service Agents (a securities dealer, financial institution or other industry professional) in respect of these services.The Distributor determines the amounts to be paid to Service Agents. During the
The Fund 33
NOTES TO FINANCIAL STATEMENTS (continued)
period ended December 31, 2007, Class A, Class B, Class C and Class T shares were charged $4,565, $1,467, $1,198 and $322, respectively, pursuant to the Shareholder Services Plan.
The Company has a shareholder services agreement with the Distributor, whereby the fund has agreed to compensate the Distributor for providing certain shareholder servicing functions to holders of Class F shares. The fund paid the Distributor a monthly fee equal, on an annual basis, to $24.00 per Class F shareholder account considered to be an open account at any time during a given month. During the period ended December 31, 2007, Class F shares were charged $69,350 pursuant to this shareholder services agreement.
Dreyfus Transfer, Inc. (“DTI”), a wholly-owned subsidiary of Dreyfus, is the transfer and dividend disbursing agent for all of the fund’s share classes.With the exception of out-of-pocket charges, the fees charged by DTI with respect to the fund’s Class F shares are paid by the Distributor.The out-of-pocket charges from DTI are paid by the fund. During the period ended December 31, 2007, Class F shares were charged $22,590 for out-of-pocket transfer agent charges.
The fees charged by DTI with respect to the fund’s Class A, Class B, Class C, Class I and Class T shares are paid by the fund.These transfer agency fees, including both the per account fees paid to DTI and out-of-pocket charges, during the period ended December 31, 2007 were $6,331.
The fund compensates Mellon Bank, an affiliate of Founders, under a custody agreement for providing custodial services for the fund. During the period ended December 31, 2007, the fund was charged $37,263 pursuant to the custody agreement.
The fund also pays Mellon Bank for certain cash management services. These fees are included in the out-of-pocket transfer agency charges above.
34
The fund has agreed to compensate Dreyfus for providing accounting services, administration, compliance monitoring, regulatory and shareholder reporting, as well as related facilities, equipment and clerical help.The fee is computed by applying the following rates, as applicable, to the domestic assets and foreign assets, with the proportions of domestic and foreign assets recalculated monthly, plus reasonable out-of-pocket expenses.
| On Assets in | | But Not | | | | |
| Excess of ($) | | Exceeding ($) | | Domestic Fee (%) | | Foreign Fee (%) |
| |
| |
| |
|
| 0 | | 500 million | | .06 | | .10 |
| 500 million | | 1 billion | | .04 | | .065 |
| 1 billion | | | | .02 | | .02 |
Dreyfus has contractually agreed in writing to waive any fees received for these services to the extent they exceed its costs in providing the services and a reasonable allocation of Founders’ costs related to the support and oversight of these services. During the period ended December 31, 2007, Dreyfus waived $12,042.
The components of “Due to Founders Asset Management LLC and affiliates” in the Statement of Assets and Liabilities consist of: investment advisory fees $53,867, Rule 12b-1 distribution plan fees $12,488, shareholder services plan fees $60,409, custodian fees $15,178, transfer agency per account fees $840 and accounting fees $4,239, which are offset against a reduction in investment advisory fee currently in effect in the amount of $4,899.
(d) Annual retainer fees and attendance fees for the Company’s Board of Directors are allocated to each series of the Company based on net assets.The Company’s Board of Directors has adopted a deferred compensation plan for Company directors that enables directors to elect to defer receipt of all or a portion of the annual compensation that they are entitled to receive from the Company. Under the plan, the compensation deferred is invested in shares of one or more of the Company’s
The Fund 35
NOTES TO FINANCIAL STATEMENTS (continued)
series.The amount paid to the director under the plan will be determined based upon the performance of the selected series.The current value of these amounts is included in Other Assets and Directors’ Deferred Compensation in the Statement of Assets and Liabilities. Changes in market value are included in the directors’ fees and expenses and the net change in unrealized appreciation (depreciation) of investments in the Statement of Operations. Deferral of directors’ fees under the plan does not affect the net assets of the fund.
Certain officers of the Company are also officers and/or directors of Founders or its affiliates, which pay their compensation.The affairs of the fund, including services provided by Founders, are subject to the supervision and general oversight of the Company’s Board of Directors.
NOTE 4—Securities Transactions:
The aggregate amount of purchases and sales of investment securities, excluding short-term securities and forward currency exchange contracts, during the period ended December 31, 2007, amounted to $74,502,768 and $78,437,667, respectively.
The fund enters into forward currency exchange contracts in order to hedge its exposure to changes in foreign currency exchange rates on its foreign portfolio holdings and to settle foreign currency transactions. When executing forward currency exchange contracts, the fund is obligated to buy or sell a foreign currency at a specified rate on a certain date in the future. With respect to sales of forward currency exchange contracts, the fund would incur a loss if the value of the contract increases between the date the forward contract is opened and the date the forward contract is closed.The fund realizes a gain if the value of the contract decreases between those dates.With respect to purchases of forward currency exchange contracts, the fund would incur a loss if the value of the contract decreases between the date the forward contract is opened and the date the forward contract is closed. The fund realizes a gain if the value of the contract increases between those dates.
36
The fund is also exposed to credit risk associated with counterparty nonperformance on these forward currency exchange contracts which is typically limited to the unrealized gain on each open contract. At December 31, 2007, there were no open forward currency exchange contracts outstanding.
At December 31, 2007, the cost of investments for federal income tax purposes was $54,134,182; accordingly, accumulated net unrealized appreciation on investments was $7,836,110, consisting of $10,175,961 gross unrealized appreciation and $2,339,851 gross unrealized depreciation.
The Fund 37
REPORT OF INDEPENDENT REGISTERED
PUBLIC ACCOUNTING FIRM
|
Shareholders and Board of Directors
Dreyfus Founders Worldwide Growth Fund
|
We have audited the accompanying statement of assets and liabilities, including the statement of investments, of Dreyfus Founders Worldwide Growth Fund (one of the funds comprising Dreyfus Founders Funds, Inc.), as of December 31, 2007, and the related statement of operations, the statement of changes in net assets and financial highlights for the year then ended. These financial statements and financial highlights are the responsibility of the Fund’s management. Our responsibility is to express an opinion on these financial statements and financial highlights based on our audit.The statement of changes in net assets of Dreyfus Founders Worldwide Growth Fund for the year ended December 31, 2006 and the financial highlights for each of the indicated periods through December 31, 2006, were audited by other auditors whose report dated February 23, 2007, expressed an unqualified opinion on the statement and financial highlights.
We conducted our audit in accordance with the standards of the Public Company Accounting Oversight Board (United States).Those standards require that we plan and perform the audit to obtain reasonable assurance about whether the financial statements and financial highlights are free of material misstatement.We were not engaged to perform an audit of the Fund’s internal control over financial reporting.Our audits included consideration of internal control over financial reporting as a basis for designing audit procedures that are appropriate in the circumstances,but not for the purpose of expressing an opinion on the effectiveness of the Fund’s internal control over financial reporting.Accordingly, we express no such opinion.An audit also includes examining, on a test basis, evidence supporting the amounts and disclosures in the financial statements and financial highlights, assessing the accounting principles used and significant estimates made by management, and evaluating the overall financial statement presentation. Our procedures included confirmation of securities as of December 31, 2007 by correspondence with the custodian.We believe that our audit provides a reasonable basis for our opinion.
In our opinion, the financial statements and financial highlights referred to above present fairly, in all material respects, the financial position of Dreyfus Founders Worldwide Growth Fund at December 31, 2007, and the results of its operations, the changes in its net assets and the financial highlights for the year then ended, in conformity with accounting principles generally accepted in the United States.
| | New York, New York
February 21, 2008
|
38
FACTORS CONSIDERED IN RENEWING
THE ADVISORY AGREEMENT (Unaudited)
|
At a meeting of the board of directors of Dreyfus Founders Funds, Inc. (the “Funds” and, in reference to any one of the Funds’ portfolios, a “Fund”) held on August 15 and 16, 2007, the Funds’ directors unanimously approved the continuation of the Investment Advisory Agreement (“management agreement”) between each of the Funds and Founders Asset Management LLC, the Funds’ investment adviser (“Founders”), for a one-year term ending August 31, 2008.The board of directors of the Funds (“board”) is comprised entirely of individuals who have no affiliation with Founders or any affiliates of Founders (the “directors”).
Prior to the directors’August 2007 meeting, Founders had provided the directors with extensive materials related to the renewal of the management agreement, including performance and expense information for other investment companies with similar investment objectives to each Fund derived from data compiled by Lipper Inc., an independent third party (“Lipper”).
During their meeting, the directors discussed the proposed continuance of the management agreement with the senior management personnel of Founders. At the conclusion of these discussions, the directors and their independent counsel met in a private session at which no representatives of Founders were present, to continue their discussion of continuance of the agreement. In determining to continue the management agreement, the directors considered all factors which they believed to be relevant, including the following:
Nature, Extent and Quality of Services Provided and to be Provided by Founders
The directors recognized that they have had the opportunity to evaluate the investment and non-investment related services which Founders and its affiliates provide to the Funds primarily through their quarterly review of all of the operations of the Funds during Fund committee and Fund board meetings held throughout the past twelve months. At each such meeting, extensive discussions of Fund operations are held with senior management personnel of Founders and a large volume of
The Fund 39
| | FACTORS CONSIDERED IN RENEWING THE
ADVISORY AGREEMENT (Unaudited) (continued)
|
documentation with respect to these operations is provided to and reviewed by the directors. Such discussions and documentation afford the directors the continual opportunity to evaluate the nature, extent, and quality of the services provided by Founders and its affiliates to the Funds.
The directors were satisfied that Founders is managing the investment of the assets of the Funds in accordance with each Fund’s respective investment objective, policies and restrictions, subject to the directors’ overall supervision.
The directors considered that Founders also provides many non-investment related services to the Funds in fulfilling its responsibilities under the management agreement.
Following their discussion and review, the directors reached the following conclusions:
- That the breadth and quality of investment advisory and other ser- vices being provided to the Funds are satisfactory, as evidenced in part by the performance records of the Funds, to which the direc- tors gave significant attention as indicated below; and
- That the directors are satisfied not only with the research, long-term portfolio management, and trading services being provided to the Funds, but also recognize that Founders or its affiliates have provided the highest quality accounting, compliance and regulatory, adminis- trative, underwriting, custody, shareholder, transfer agent and cash management services to the Funds, while charging fair, reasonable and competitive fees.
Investment Performance
On a quarterly basis, the directors hold meetings with representatives of the portfolio management team for each Fund (usually a portfolio manager), during which each representative reviews, among other items, performance information, attribution analyses, and the portfolio manager’s investment outlook. The directors also receive written
40
monthly and quarterly performance information for each Fund.These written quarterly reports include comparisons of each Fund’s performance with its respective Lipper category and one or more benchmark indexes, as well as a comparable exchange-traded fund, for the most recent quarter and one-, three- and five-year periods, as well as for the portfolio manager’s tenure.
In conjunction with their consideration of renewal of the management agreement, the directors received a more detailed performance report about each Fund from Lipper.These reports compared each Fund’s performance to both a relatively small group of similar funds selected by Lipper (the “Lipper performance group”), as well as to all funds in the applicable Lipper category (the “Lipper performance universe”).
The performance of Worldwide Growth Fund’s Class F shares placed in the top two quintiles of its Lipper performance group and the Lipper global large-cap growth fund performance universe for the one-and three-year periods ended December 31, 2006.The performance of the Fund’s Class F shares placed in the third quintile of its Lipper performance universe for the one-, three- and five-year periods ended June 30, 2007.The Fund’s Class F shares outperformed its benchmark growth index for the one-, three- and five-year periods ended June 30, 2007. The directors deemed these relative performance results to be satisfactory, but stressed the importance to Founders of the need for the Fund to continue to seek to maintain a strong performance record.
After consideration of all relevant information and data, the directors concluded that although past performance cannot be a guaranty of future performance, each Fund and its shareholders would continue to benefit from Founders’ investment management of the Fund. The directors further determined:
- That although certain of the Funds have experienced performance difficulties, Founders has focused its efforts upon improving the per- formance records of the Funds and will continue to seek improve- ment; and
The Fund 41
| | FACTORS CONSIDERED IN RENEWING THE
ADVISORY AGREEMENT (Unaudited) (continued)
|
- That the materials provided by Lipper demonstrated that most of the Funds maintained satisfactory performance quintile rankings in their respective comparison groups and comparison universes, with five of seven Funds placing in the top two quintiles of their respec- tive Lipper performance universes for the one-year period ended December 31, 2006, and four placing in the top two quintiles for the three years ended December 31, 2006.
Costs of the Services to be Provided and Profits to be Realized by Founders and Its Affiliates from Founders’ Relationship With the Funds
The directors recognized that on a quarterly basis, they receive information with respect to each Fund’s expenses. The directors carefully review and discuss the expense ratios for all classes of shares of each Fund at each of their quarterly meetings throughout the year.
In conjunction with their annual consideration of renewal of the Funds’ management agreement and other service arrangements, the directors received detailed information from Lipper which compared each Fund’s management fees and other expenses with those of a group of similar funds selected by Lipper (the “Lipper expense group”), as well as summary information comparing each Fund’s management fees and expenses with those of the funds in its Lipper performance universe with load structures similar to that of the Funds (the “Lipper expense universe”).
The directors noted that for the period ended December 31, 2006, Worldwide Growth Fund’s management fees ranked in the third quin-tile of its Lipper expense group, with the Fund’s fees the eighth lowest of 14 “peer funds.”The Fund’s contractual management fees at a common asset level were determined by Lipper to be lower than six of the 14 funds in its group.The Fund’s management fees were in the fourth quintile of its Lipper expense universe.
42
The directors also considered information provided by Lipper with respect to the profitability of the investment management activities conducted by a number of publicly-held corporations. Lipper also prepared an analysis providing detailed information with respect to the types of services rendered to various mutual fund complexes under their respective investment advisory contracts, including the services provided by Founders to the Funds under the management agreement.
The directors had been provided with extensive materials with respect to the profitability derived by Founders from providing investment advisory and other services to the Funds as a group and to each Fund individually.
The directors further considered certain indirect benefits received by Founders and its affiliates as a result of Founders’ provision of investment advisory services to the Funds.These included the following:
- Since Founders manages a non-Fund account in a style that is sim- ilar to that used for one of the Funds (and for portions of certain other Funds), and employees of Founders manage other non-Fund accounts in a similar style in their capacities as employees of the affiliates, Founders and its affiliates realize efficiencies in performing the portfolio management, trading and operational functions related to those non-Fund accounts;
- The Funds’ brokerage transactions may be executed with brokers that provide research and brokerage services to Founders and its affiliates. These research and brokerage services may be useful to Founders and its affiliates in providing investment advisory services to any of the clients they advise, including the Funds; and
- Affiliates of Founders receive various fees for providing accounting, underwriting, shareholder, transfer agency, custody and cash man- agement services to the Funds.
The Fund 43
| | FACTORS CONSIDERED IN RENEWING THE
ADVISORY AGREEMENT (Unaudited) (continued)
|
After deliberation and discussion of Fund fees and expenses, the directors determined:
- That upon review of the advisory fee structures of the Funds in comparison with the competitive expense groups and expense uni- verses selected by Lipper, the levels of investment advisory fees paid by the Funds were deemed to be competitive;
- That the expense ratios of the Funds are competitive and that Founders continually reviews each Fund’s total expense ratio and has initiated voluntarily expense caps and fee waivers for certain Funds to reduce their expense ratios;
- That five of the seven Funds’ expense ratios decreased or remained the same for all or most of their share classes in 2006 as compared to those experienced in 2005, in some instances as a result of increases in Fund assets; and
- That the comparative fee and expense information included in the materials provided by Lipper supports the determination that the advisory and other fees payable by the Funds to Founders and its affiliates are essentially fees which would be similar to those that would have resulted solely from “arm’s-length” bargaining.
With respect to profitability to Founders, the directors reviewed the adviser profitability analysis provided by Lipper, which demonstrated that Founders’ 2006 profitability from providing management services to the Funds was reasonable in comparison to the entities included in the Lipper analysis.
The directors were also advised by independent counsel of the profitability percentage ranges which court cases have found acceptable and determined that Founders’ profitability percentage for providing management and other services to the Funds was reasonable.
The directors concluded that Founders’ profits from providing management services to the Funds were reasonable in relationship to the overall services which Founders provides.
44
Economies of Scale
The directors reviewed information provided by Founders which summarized the extent, if any, that both Founders and the Funds would achieve certain economies of scale if the assets of the Funds were to increase.
After review and discussion, the directors considered the extent to which economies of scale and common management are shared with each Fund, including the economies that would be realized from the growth of each Fund’s assets. After such consideration, the directors determined that all of the Funds have structured breakpoints in their advisory fees, which result in fee reductions as the assets of each Fund reach defined levels, and that such fee reductions, when implemented, would benefit all of the applicable Fund’s shareholders through decreases in the Fund’s expense ratio.
Dedication to Regulatory Requirements and Restrictions
An important factor in the directors’ consideration of renewal of the Funds’ management agreement with Founders included the directors’ recognition of the dedication by Founders of stringent adherence to regulatory requirements and restrictions.The directors determined that Founders is dedicated to compliance with all applicable rules and regulations and that the systems of controls which are in place to ensure that the service providers to the Funds, including Founders, and the Funds themselves, maintain strict adherence to the law are excellent.
Overall Conclusions
The directors determined that they are generally satisfied with the performance of the Funds and with the quality of the advisory and other services being provided by Founders and its affiliates to the Funds.The directors recognized that efforts are being and will continue to be made to improve the Funds’ performance and to maintain Fund expense ratios at reasonable and competitive levels.
The Fund 45
| | FACTORS CONSIDERED IN RENEWING THE
ADVISORY AGREEMENT (Unaudited) (continued)
|
The directors concluded that continuation of the current management agreement between each Fund and Founders, which would enable each Fund to continue to receive investment advisory services from Founders, is in the best interests of each Fund and its shareholders, the services to be performed under the management agreement are services required for the operations of the Funds, Founders has provided satisfactory investment management services to the Funds in the past, and the fees for the management services which Founders will perform will be within the range of what would have been negotiated at arm’s length in light of the circumstances.
46
YOUR BOARD REPRESENTATIVES (Unaudited)
The Board of Directors of the Company oversees all six Dreyfus Founders Funds.The business and affairs of the Company are managed under the direction of the Board. The directors serving on the Board perform their responsibilities in the manner which they reasonably believe to be in the best interests of the Funds and their shareholders.
All of the directors,as listed below,are independent directors.They are not affiliated with the Fund’s adviser, its parent company, or its affiliates.The directors have no official term of office and generally serve until they retire (normally at age 75, but subject to extension to age 80), resign, or are not re-elected.As you can see from their backgrounds, the directors have broad experience as active or former business and community leaders.
Directors
Eugene H.Vaughan, CFA, 74.Year elected to the Board: 1970
Board Chairman. Founding Chairman,Vaughan Nelson Investment Management, LP, an investment counseling firm. Director, Encore Bank, Houston. Founding Chairman, Center for Houston’s Future, a non-profit organization. Founding Chairman and former Governor, CFA Institute. Past Chairman and Trustee, Institute of Chartered Financial Analysts. Past Chairman and Director, Financial Analysts Federation. Chairman-elect, University of Texas Health Science Center.
Alan S. Danson, 68.Year elected to the Board: 1991
Private investor. Formerly, President and Director, D.H. Management, Inc., the general partner of a limited partnership with technology company holdings (1996 to 2003). Director, Gore Range Natural Science School and The Les Streeter Program, Inc., both of which are non-profit organizations.
Robert P. Mastrovita, 63.Year elected to the Board: 1998
Private investor. Chairman of a private charitable foundation (1997 to present). Formerly, Chairman and Director, Hagler, Mastrovita & Hewitt, Inc., a registered investment adviser (1982 to 1997). Member, Boston Society of Security Analysts. Trustee, Partridge Academy. Director, King Caesar Foundation.
Trygve E. Myhren, 71.Year elected to the Board: 1996
President, Myhren Media, Inc., a firm that invests in and advises media, telecommunications, Internet and software companies. Special Limited Partner and member of Investment Committee, Megunticook Funds, a venture capital firm (1998 to present). Director, AdPay, Inc.Trustee, Executive Committee and Chairman of Faculty Education Affairs Committee, the University of Denver. Trustee, Denver Art
The Fund 47
YOUR BOARD REPRESENTATIVES (Unaudited) (continued)
Museum. Member, Colorado FORUM and Cable Television Hall of Fame. Formerly, President (1990 to 1996) and Director (1992 to 2001) of the Providence Journal Company, a diversified media and communications company. Formerly, Chairman and Chief Executive Officer of American Television and Communications Corporation (now Time Warner Cable) (1981 to 1988). Formerly, Chairman of the National Cable Television Association (1986-1987). Chief of Mission, 2006 Paralympic Games,Torino/Sestrierre, Italy.
George W. Phillips, 69.Year elected to the Board: 1998
Retired.Vice Chairman of the Board and Chairman of the Investment Committee, Children’s Medical Center of Boston. Formerly, President and Chief Executive Officer (1992 to 1997) and Director (1992 to 2002) of Warren Bancorp, Inc. Formerly, President, Chief Executive Officer and Director of Warren Five Cents Savings Bank (1992 to 1997).
Martha A. Solis-Turner, 47.Year elected to the Board: 2005
Formerly, Telecommunications Director, Wholesale Markets (1995 to 2001), and Manager (1990 to 1995), Qwest Communications International Inc. Board member and Treasurer, Mile High Montessori Early Learning Centers (2002 to present), and formerly, Board member (1995 to 2004) and Vice President (2002 to 2004), Curtis Park Community Center, both of which are non-profit organizations.
Principal Officers
J. David Officer, 59. President and Principal Executive Officer of the Funds since 2007. Chief Operating Officer,Vice Chairman and a Director of Dreyfus, and an officer of 78 investment companies (comprised of 163 portfolios) managed by Dreyfus. He has been an employee of Dreyfus since 1998.
Denise B. Kneeland, 56. Vice President of the Funds since 2008. Assistant Vice President (since 1996) and Secretary (since 2007) of the Mellon Institutional Funds Investment Trust. First Vice President and Manager, Mutual Funds Operations, BNY Mellon Asset Management (since 2006). Formerly,Vice President and Manager, Mutual Funds Operations,Standish Mellon Asset Management Company,LLC (1996 to 2001).
Kenneth R. Christoffersen, 52. Vice President of the Funds since 2008, and Secretary since 2000 (and from 1996 to 1998). Founders’ Senior Vice President -Legal, General Counsel and Secretary. Assistant Secretary of the Distributor since 2003. Employed by Founders and its predecessor company since 1996.
48
Steven M. Anderson, 42.Treasurer and Principal Financial and Accounting Officer of the Funds since 2007. Vice President (since 1999), Treasurer (since 2002) and Chief Financial Officer of Mellon Institutional Funds Investment Trust. Vice President and Mutual Funds Controller, BNY Mellon Asset Management (since 2003). Formerly, Assistant Vice President and Mutual Funds Controller, Standish Mellon Asset Management Company, LLC (2000 to 2003).
Janelle E. Belcher, 49. Chief Compliance Officer of the Funds since 2004 and Assistant Secretary of the Funds since 2002. Founders’ Vice President - Compliance since 2002. Formerly, Founders’ Manager of Compliance (2000 to 2002) and Securities Compliance Examiner, Staff Accountant and Team Leader for the U.S. Securities and Exchange Commission (1990 to 2000).
David T. Buhler, 36. Assistant Secretary since 2007. Founders’ Associate General Counsel and Assistant Secretary since 2006. Formerly, Counsel for Great-West Life & Annuity Insurance Company (1997-2006), and Chief Compliance Officer for Greenwood Investments, LLC (2002 - 2006).
Robert S. Robol, 43. Assistant Treasurer since 2006. Senior Accounting Manager -Taxable Fixed Income Funds of Dreyfus, and an officer of 79 investment companies (comprised of 180 portfolios) managed by Dreyfus. Employed by Dreyfus since 1988.
Robert Salviolo, 40. Assistant Treasurer since 2007. Senior Accounting Manager -Foreign Equity Funds of Dreyfus, and an officer of 79 investment companies (comprised of 180 portfolios) managed by Dreyfus. Employed by Dreyfus since 1989.
Robert Svagna, 40. Assistant Treasurer since 2006. Senior Accounting Manager -Equity Funds of Dreyfus, and an officer of 79 investment companies (comprised of 180 portfolios) managed by Dreyfus. Employed by Dreyfus since 1990.
William G. Germenis, 37. Anti-Money Laundering Compliance Officer (“AMLCO”) for the Class A, Class B, Class C, Class I, and Class T shares of the Funds since 2002 and for the Class F shares of the Funds since 2003.Vice President and AMLCO of the Distributor and AMLCO of 75 investment companies (comprised of 176 portfolios) managed by Dreyfus. Employed by the Distributor since 1998.
The directors and officers may be contacted at Founders’ address appearing on the back cover, except for Messrs. Officer, Robol, Salviolo, Svagna and Germenis, who can be contacted at The Dreyfus Corporation, 200 Park Avenue, New York, New York 10166, and Mr.Anderson and Ms. Kneeland, who can be contacted at BNY Mellon Asset Management, One Boston Place, Boston, Massachusetts 02108.Additional information about the Company’s directors is available in the Statement of Additional Information, which can be obtained free of charge by calling 1-800-525-2440 (Class F shareholders) or 1-800-554-4611 (all other shareholders).
The Fund 49
(a) As of the end of the period covered by this report, Dreyfus Founders Funds, Inc. (the "Funds") has adopted a code of ethics that applies to the Funds' principal executive officer, principal financial officer, and principal accounting officer.
(c) During the period covered by this report, no amendments have been made to a provision of the code of ethics that applies to the Funds' principal executive officer, principal financial officer, or principal accounting officer, and that relates to any element of the code of ethics definition enumerated in paragraph (b) of Item 2 of Form N-CSR.
(d) During the period covered by this report, the Funds have not granted a waiver, including an implicit waiver, from a provision of the code of ethics to the Funds' principal executive officer, principal financial officer, or principal accounting officer that relates to one or more of the items set forth in paragraph (b) of Item 2 of Form N-CSR.
(f)(1) A copy of the code of ethics is filed as an exhibit to this report, pursuant to Item 12(a)(1) of Form N-CSR.
| ITEM 3. AUDIT COMMITTEE FINANCIAL EXPERT |
(a)(1) The board of directors of the Funds has determined that the Funds have an "audit committee financial expert" serving on its audit committee, as that term is defined in paragraph (b) of Item 3 of Form N-CSR.
(a)(2) The name of the audit committee financial expert is George W. Phillips. Mr. Phillips is an "independent" member of the audit committee as that term is defined in Item 3(a)(2) of Form N-CSR.
| ITEM 4. PRINCIPAL ACCOUNTANT FEES AND SERVICES |
Note: Descriptions and amounts for 2007 reflect services provided by Ernst & Young LLP, the Funds’ independent registered public accounting firm for the fiscal year. The Funds’ financial statements for the 2006 fiscal year were audited by another independent registered public accounting firm, and the descriptions and amounts for 2006 reflect services provided by that firm.
(a) Audit Fees - The aggregate fees billed to the Funds by their principal accountant for professional services rendered for the audit of the Funds’ annual financial statements or services that are normally provided by the accountant in connection with statutory and regulatory filings or engagements for the fiscal years ending December 31, 2007 and December 31, 2006 were $219,800 and $346,000, respectively.
(b) Audit-Related Fees – The aggregate fees billed to the Funds by their principal accountant for assurance and related services that are reasonably related to the performance of the audit of the Funds’ financial statements and that are not reported under paragraph (a) of this Item 4 for the fiscal years ending December 31, 2007 and December 31, 2006 were $0 and $0, respectively.
The aggregate fees billed for assurance and related services by the Funds’ principal accountant to the Funds’ investment adviser, and any entity controlling, controlled by, or under common control with the adviser that provides ongoing services to the Funds (collectively, the “Service Providers”), that were reasonably related to the performance of the annual audit of the Service Provider, which required pre-approval by the Audit Committee for the fiscal years ending December 31, 2007 and December 31, 2006 were $0 and $590,000, respectively. These fees were for a SAS 70 review of affiliates providing trading and research services for the Funds, and a review of the internal controls of the transfer agent.
(c) Tax Fees – The aggregate fees billed to the Funds by their principal accountant for professional services rendered by the accountant for tax compliance, tax advice, and tax planning (“tax fees”) for the fiscal years ending December 31, 2007 and December 31, 2006 were $26,400 and $61,500, respectively. These fees were for review of U.S. federal, state, local and excise tax returns and determination of Passive Foreign Investment Companies for 2007, and preparation of U.S. federal, state, local and excise tax returns, and related consultations, and excise tax distribution calculations for 2006.
The aggregate tax fees billed by the Funds’ principal accountant to the Service Providers for services which required pre-approval by the Audit Committee for the fiscal years ending December 31, 2007 and December 31, 2006 were $0 and $0, respectively.
(d) All Other Fees – The aggregate fees billed to the Funds by their principal accountant for products and services provided by the accountant, other than the services reported in paragraphs (a), (b), and (c) of this Item 4 (“all other fees”), for the fiscal years ending December 31, 2007 and December 31, 2006 were $505 and $0, respectively. This fee was for a review of the Funds’ anti-money laundering program.
The aggregate of all other fees billed by the Funds’ principal accountant for products and services provided to the Service Providers which required pre-approval by the Audit Committee for the fiscal years ending December 31, 2007 and December 31, 2006 were $0 and $102,000, respectively. These fees were for network vulnerability testing.
(e)(1) Approval is required of all audit and significant permitted non-audit engagements of the Funds’ principal accountant, prior to the commencement of any such engagement, including pre-approval not only of services provided directly to the Funds but also services provided to the Service Providers where the nature of the services provided has a direct relationship to the operations or financial reporting of the Funds; pre-approval may be given up to one year in advance of the audit or non-audit activity for which pre-approval is sought.
In any instance in which it may become necessary or desirable for the audit committee to grant immediate pre-approval of a non-audit service to be provided either by the Funds’ principal accountant or by another audit firm, such pre-approval may be procured in writing from the chair of the Funds’ audit committee or, in the event of his or her unavailability, from the chair of the Funds’ board of directors. Any such pre-approval shall be subject to consideration and review by the audit committee at its next regularly scheduled quarterly meeting.
(e)(2) None of the services described in paragraphs (b) through (d) of this Item 4 were approved by the audit committee pursuant to paragraph (c)(7)(i)(C) of Rule 2-01 of Regulation S-X.
(f) Not applicable.
(g) For the fiscal years ending December 31, 2007 and December 31, 2006, the aggregate non-audit fees billed by the Funds’ principal accountant to the Funds and the Service Providers were $1,916,237 and $1,818,500, respectively.
(h) The Funds’ Audit Committee has considered whether the provision of non-audit services that were rendered to the Service Providers which were not pre-approved (not requiring pre- approval) is compatible with maintaining the principal accountant’s independence.
| ITEM 5. AUDIT COMMITTEE OF LISTED REGISTRANTS |
Not applicable.
| ITEM 6. SCHEDULE OF INVESTMENTS |
Schedule I - Investments in securities of unaffiliated issuers is included as part of the reports to shareholders filed under Item 1 of this report on Form N-CSR.
| ITEM 7. DISCLOSURE OF PROXY VOTING POLICIES AND PROCEDURES |
| FOR CLOSED-END MANAGEMENT INVESTMENT COMPANIES |
Not applicable.
| ITEM 8. PORTFOLIO MANAGERS OF CLOSED-END MANAGEMENT |
| INVESTMENT COMPANIES |
Not applicable.
| ITEM 9. PURCHASE OF EQUITY SECURITIES BY CLOSED-END MANAGEMENT |
| INVESTMENT COMPANY AND AFFILIATED PURCHASERS |
Not applicable.
| ITEM 10. SUBMISSION OF MATTERS TO A VOTE OF SECURITY HOLDERS |
No material changes have been made to the procedures by which shareholders may recommend nominees to the board of directors of the Funds, where those changes were implemented after the Funds last provided disclosure in response to the requirements of Item 407(c)(2)(iv) of Regulation S-K (as required by Item 22(b)(15) of Schedule 14A or this Item 10).
| ITEM 11. CONTROLS AND PROCEDURES |
(a) Based on an evaluation of the Funds' Disclosure Controls and Procedures as of a date within 90 days of the filing date of this report, the Funds' Principal Executive Officer ("PEO") and Principal Financial Officer ("PFO") have concluded that the Funds' Disclosure Controls and Procedures are effectively designed to ensure that information required to be disclosed by the Funds in the report is recorded, processed, summarized, and reported within required time periods, and to ensure that information required to be disclosed in the report is accumulated and communicated to the Funds' management, including the Funds' PEO and PFO, or persons performing similar functions, as appropriate to allow timely decisions regarding required disclosure.
(b) During the quarter ended December 31, 2007, there has been no change in the Funds' internal control over financial reporting that has materially affected, or that is reasonably likely to materially affect, the Funds' internal control over financial reporting.
(a)(1) Attached hereto as Exhibit EX-99.CODE ETH.
(a)(2) Attached hereto as Exhibit EX-99.CERT.
(a)(3) Not applicable.
(b) Attached hereto as Exhibit EX-99.906CERT.
SIGNATURES
Pursuant to the requirements of the Securities Exchange Act of 1934 and the Investment Company Act of 1940, the registrant has duly caused this report to be signed on its behalf by the undersigned, thereunto duly authorized.
DREYFUS FOUNDERS FUNDS, INC.
| By: | | /s/ J. David Officer |
| | | J. David Officer, President |
Date: February 25, 2008
Pursuant to the requirements of the Securities Exchange Act of 1934 and the Investment Company Act of 1940, this report has been signed below by the following persons on behalf of the registrant and in the capacities and on the dates indicated.
| By: | | /s/ J. David Officer |
| | | J. David Officer, Principal Executive Officer |
Date: February 25, 2008
| By: | | /s/ Steven M. Anderson |
| | | Steven M. Anderson, Principal Financial Officer |
Date: February 25, 2008