UNITED STATES
SECURITIES AND EXCHANGE COMMISSION
Washington, D.C. 20549
FORM N-CSR
CERTIFIED SHAREHOLDER REPORT OF REGISTERED MANAGEMENT
INVESTMENT COMPANIES
| |
| Investment Company Act file number | 811- 1018 |
Dreyfus Funds, Inc.
(Exact name of Registrant as specified in charter)
c/o The Dreyfus Corporation
200 Park Avenue
New York, New York 10166
(Address of principal executive offices) (Zip code)
Michael A. Rosenberg, Esq.
200 Park Avenue
New York, New York 10166
(Name and address of agent for service)
| | |
| Registrant's telephone number, including area code: | (212) 922-6000 |
| Date of fiscal year end: | 12/31 | |
| Date of reporting period: | 12/31/2009 | |
FORM N-CSR
| |
| Item 1. | Reports to Stockholders. |
-2-
Save time. Save paper. View your next shareholder report online as soon as it’s available. Log into www.dreyfus.com and sign up for Dreyfus eCommunications. It’s simple and only takes a few minutes.
The views expressed in this report reflect those of the portfolio manager only through the end of the period covered and do not necessarily represent the views of Dreyfus or any other person in the Dreyfus organization. Any such views are subject to change at any time based upon market or other conditions and Dreyfus disclaims any responsibility to update such views.These views may not be relied on as investment advice and, because investment decisions for a Dreyfus fund are based on numerous factors, may not be relied on as an indication of trading intent on behalf of any Dreyfus fund.
Not FDIC-Insured • Not Bank-Guaranteed • May Lose Value
| | Contents |
| | THE FUND |
| 2 | A Letter from the Chairman and CEO |
| 3 | Discussion of Fund Performance |
| 6 | Fund Performance |
| 8 | Understanding Your Fund’s Expenses |
| 8 | Comparing Your Fund’s Expenses With Those of Other Funds |
| 9 | Statement of Investments |
| 14 | Statement of Assets and Liabilities |
| 15 | Statement of Operations |
| 16 | Statement of Changes in Net Assets |
| 18 | Financial Highlights |
| 23 | Notes to Financial Statements |
| 36 | Report of Independent Registered Public Accounting Firm |
| 37 | Proxy Results |
| 38 | Board Members Information |
| 40 | Officers of the Fund |
| | FOR MORE INFORMATION |
| | Back Cover |
Dreyfus
Discovery Fund
The Fund

A LETTER FROM THE CHAIRMAN AND CEO
Dear Shareholder:
We are pleased to present this annual report for Dreyfus Discovery Fund, covering the 12-month period from January 1, 2009, through December 31, 2009.
The U.S. stock market ended 2009 with a healthy annual gain, but market indices across all capitalization ranges and investment styles remained well below the peaks reached in the fall of 2007. The equity market’s advance was driven by improving investor sentiment as the U.S. economy staged a gradual, but sustained, recovery from the recession and banking crisis that had depressed stock prices at the beginning of the year. After four consecutive quarters of contraction, the U.S. economy returned to growth during the third quarter of 2009, buoyed by greater manufacturing activity to replenish depleted inventories and satisfy export demand. The slumping housing market also showed signs of renewed life later in the year when home sales and prices rebounded modestly. However, economic headwinds remain, including a high unemployment rate and the prospect of anemic consumer spending.
As 2010 begins, our Chief Economist, as well as many securities analysts and portfolio managers have continued to find opportunities and survey potential challenges across a variety of asset classes, including equities. While no one can predict the future, we believe that the 2010 investment environment will likely require a broader range of investment considerations relative to last year. As always, your financial adviser can help you determine the mix of investments that may be best suited to helping you achieve your goals at a level of risk that is comfortable for you.
For information about how the fund performed during the reporting period, as well as market perspectives, we have provided a Discussion of Fund Performance.
Thank you for your continued confidence and support.

Jonathan R. Baum
Chairman and Chief Executive Officer
The Dreyfus Corporation
January 15, 2010
2

DISCUSSION OF FUND PERFORMANCE
For the period of January 1, 2009 through December 31, 2009, as provided by B. Randall Watts, Jr., CFA, Portfolio Manager
Market and Fund Performance Overview
For the 12-month period ended December 31, 2009, Dreyfus Discovery Fund’s Class A shares produced a total return of 20.55%, Class B shares returned 19.67%, Class C shares returned 19.59%, Class F shares returned 21.18% and Class I shares returned 21.11%.1 In comparison, the Russell 2000 Growth Index, the fund’s benchmark, produced a total return of 34.47% for the reporting period.2 After suffering early declines, stocks rallied strongly during 2009 as investors looked forward to an economic recovery. The stocks that drove the rally were highly cyclical stocks that were among the worst performing in 2008. Many of these stocks were low-priced, highly levered companies with financially suspect balance sheets and overall weak fundamentals. At the inflection point, investors realized that while these stocks were priced at near-insolvency levels, that scenario was not likely to emerge. They began to embrace these cyclical and levered companies more on their potential earnings streams than on their current fundamentals. Classic growth stocks, which typically have sound balance sheets, low leverage, and generate free cash flow, did not benefit as much during this rally.
The Fund’s Investment Approach
The fund invests primarily in small U.S.-based companies that we believe possess high-growth potential. The fund may also invest in larger companies if, in our opinion, they represent better prospects for capital appreciation.We use a “growth style” of investing, searching for companies whose fundamental strengths suggest the potential to provide superior earnings growth over time. Our “bottom-up” approach emphasizes individual stock selection.We go beyond Wall Street analysis and perform intensive qualitative and quantitative in-house research to determine whether companies meet our investment criteria.
Equity Markets Rebounded Sharply
When 2009 began, equity markets were reeling from a financial crisis that nearly caused the collapse of the worldwide banking system. In addition, rising unemployment and declining housing markets had produced the most severe recession since the 1930s.These influences fueled a bear market that drove stock prices to multi-year lows during the first quarter of the year.
The Fund 3
DISCUSSION OF FUND PERFORMANCE (continued)
Market sentiment began to improve in March, when it became clearer that aggressive remedial actions by government and monetary authorities had helped repair the credit markets. Subsequently, evidence of economic improvement also helped propel stocks higher through year-end. Small-cap growth stocks represented one of the market’s stronger performing segments, as investors turned away from traditionally defensive investments toward beaten-down stocks that appeared poised to avert bankruptcy in an economic recovery.
Quality Bias Dampened Results in Market Rebound
Much of the fund’s lagging performance can be traced to the second quarter of 2009,when the market rebound was particularly strong among low-quality stocks. Given our focus on more quality-oriented companies, the fund’s participation was limited in the early stages of the rally.
The fund’s greatest laggards could be found in the health care, technology, financials and consumer discretionary sectors. Health care stocks generally were constrained by concerns regarding proposed health care reform legislation. In addition, patients delayed elective procedures due to the recession. BioMarin Pharmaceutical and Alnylam Pharmaceuticals both missed earnings targets amid sluggish sales and disappointing clinical trials. Cost cutting by hospitals negatively affected medical equipment and supplies providers CONMED, Haemonetics and Integra LifeSciences Holdings. A difficult pricing environment hindered returns from service providers Psychiatric Solutions, CardioNet and PharMerica. Biotechnology company Human Genome Sciences had a weaker relative return to the benchmark.The fund’s gain of 120% paled in comparison to the benchmark’s 1,342% gain, as the benchmark had the benefit of holding the stock since the beginning of the year before it rallied on some positive clinical trial data.
In the technology sector, the benchmark’s top performing segment, the fund was undermined by our focus on companies that tend to do well in the early stages of economic recoveries. In hindsight, we were too quick to sell the fund’s positions in Limelight Networks, DealerTrack Holdings, Marchex, Concur Technologies, Sybase and Informatica, all of which continued to climb in the rally. Information technology services provider ManTech International also hurt performance when it reported disappointing financial results.
Our focus on insurance companies, in anticipation of firmer pricing trends that had not materialized as of the end of the reporting period, weighed on the fund’s results in the financials sector. RLI Corp.,Arch Capital Group, Tower Group, Validus Holdings and ProAssurance also were impaired by concerns regarding their investment portfolios and capital positions.
4
Market leadership broadened over the second half of the year, and the fund’s relative performance improved, helping the fund achieve above-average results in the energy and telecommunications services sectors. Overweighted exposure to energy companies helped the fund participate more fully in the benefits of recovering commodity prices among well-positioned and financially healthy equipment-and-service providers, including Dril-Quip, Natco Group and Oil States International. The fund also achieved strong results from exploration-and-production companies Concho Resources, Comstock Resources, Plains Exploration & Production and Arena Resources. Among telecommunications services companies,the fund benefited from favorable timing of trades in network bridge provider Neutral Tandem.
Finding Growth Opportunities in a Recovering Economy
We remain optimistic regarding the small-cap market’s prospects.We have increased the fund’s overweighted position in the technology sector, where we expect businesses to spend more freely on system upgrades that were postponed during the recession. We believe we have found additional opportunities among health care companies as political uncertainties wane. We have moderated the fund’s overweighted exposure to energy companies, as we believe we have found greater growth opportunities in certain industrial companies in the recovering global economy. However, we remain cautious regarding consumer discretionary stocks, which may continue to encounter sluggish consumer spending.
| |
| January 15, 2010 |
| |
| | Please note: the position in any security highlighted with italicized typeface was sold during the |
| | reporting period. |
| | Small companies carry additional risks because their earnings and revenues tend to be less |
| | predictable, and their share prices more volatile than those of larger, more established |
| | companies. The shares of smaller companies tend to trade less frequently than those of |
| | larger, more established companies. |
| | Part of the fund’s historical performance is due to amounts received from class action |
| | settlements regarding prior fund holdings. There is no guarantee that these settlement |
| | distributions will occur in the future or have a similar impact on performance. |
| 1 | Total return includes reinvestment of dividends and any capital gains paid, and does not take into |
| | consideration the maximum initial sales charge in the case of Class A shares, or the applicable |
| | contingent deferred sales charges imposed on redemptions in the case of Class B and Class C |
| | shares. Had these charges been reflected, returns would have been lower. Past performance is no |
| | guarantee of future results. Share price and investment return fluctuate such that upon redemption, |
| | fund shares may be worth more or less than their original cost. |
| 2 | SOURCE: LIPPER INC. – Reflects reinvestment of dividends and, where applicable, capital |
| | gains distributions.The Russell 2000 Growth Index is an unmanaged index, which measures the |
| | performance of those Russell 2000 companies with higher price-to-book ratios and higher |
| | forecasted growth values.The total return figure cited for this index assumes change in security |
| | prices and reinvestment of dividends, but does not reflect the costs of managing a mutual fund. |
The Fund 5
FUND PERFORMANCE
|
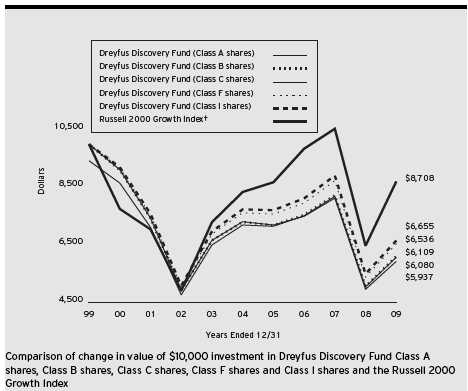
| † Source: Lipper Inc. |
| Past performance is not predictive of future performance. |
| The above graph compares a $10,000 investment made in Class A, Class B, Class C, Class F and Class I shares of |
| Dreyfus Discovery Fund on 12/31/99 to a $10,000 investment made in the Russell 2000 Growth Index (the |
| “Index”) on that date.All dividends and capital gain distributions are reinvested. |
| The fund’s performance shown in the line graph takes into account the maximum initial sales charge on Class A shares |
| and all other applicable fees and expenses on all classes (after any expense reimbursements).The Index is an unmanaged |
| index, which measures the performance of those Russell 2000 companies with higher price-to-book ratios and higher |
| forecasted growth values. Unlike a mutual fund, the Index is not subject to charges, fees and other expenses. Investors |
| cannot invest directly in any index. Further information relating to fund performance, including expense reimbursements, |
| if applicable, is contained in the Financial Highlights section of the prospectus and elsewhere in this report. |
6
| | | |
| Average Annual Total Returns as of 12/31/09 | | | |
| |
| | 1 Year | 5 Years | 10 Years |
| Class A shares | | | |
| with maximum sales charge (5.75%) | 13.63% | –4.45% | –4.86% |
| without sales charge | 20.55% | –3.32% | –4.29% |
| Class B shares | | | |
| with applicable redemption charge † | 15.67% | –4.60% | –4.81% |
| without redemption | 19.67% | –4.22% | –4.81% |
| Class C shares | | | |
| with applicable redemption charge †† | 18.59% | –4.07% | –5.08% |
| without redemption | 19.59% | –4.07% | –5.08% |
| Class F shares | 21.18% | –3.04% | –4.16% |
| Class I shares | 21.11% | –2.97% | –3.99% |
| |
| Past performance is not predictive of future performance.The fund’s performance shown in the graph and table does not |
| reflect the deduction of taxes that a shareholder would pay on fund distributions or the redemption of fund shares. Part of |
| the fund’s historical performance is due to amounts received from class action settlements regarding prior fund holdings. |
| There is no guarantee that these settlement distributions will occur in the future or have a similar impact on performance. |
| Performance for Class B shares assumes the conversion of Class B shares to Class A shares at the end of the sixth year |
| following the date of purchase. |
| † | The maximum contingent deferred sales charge for Class B shares is 4%.After six years Class B shares convert to |
| | Class A shares. |
| †† | The maximum contingent deferred sales charge for Class C shares is 1% for shares redeemed within one year of the |
| | date of purchase. |
The Fund 7
UNDERSTANDING YOUR FUND’S EXPENSES (Unaudited)
As a mutual fund investor, you pay ongoing expenses, such as management fees and other expenses. Using the information below, you can estimate how these expenses affect your investment and compare them with the expenses of other funds.You also may pay one-time transaction expenses, including sales charges (loads) and redemption fees, which are not shown in this section and would have resulted in higher total expenses. For more information, see your fund’s prospectus or talk to your financial advisor.
Review your fund’s expenses
The table below shows the expenses you would have paid on a $1,000 investment in Dreyfus Discovery Fund from July 1, 2009 to December 31, 2009. It also shows how much a $1,000 investment would be worth at the close of the period, assuming actual returns and expenses.
| | | | | |
| Expenses and Value of a $1,000 Investment | | | |
| assuming actual returns for the six months ended December 31, 2009 | | |
| | Class A | Class B | Class C | Class F | Class I |
| Expenses paid per $1,000† | $ 11.39 | $ 16.11 | $ 16.22 | $ 9.14 | $ 10.02 |
| Ending value (after expenses) | $1,194.20 | $1,189.00 | $1,188.30 | $1,196.50 | $1,195.50 |
|
| COMPARING YOUR FUND’S EXPENSES |
| WITH THOSE OF OTHER FUNDS (Unaudited) |
Using the SEC’s method to compare expenses
The Securities and Exchange Commission (SEC) has established guidelines to help investors assess fund expenses. Per these guidelines, the table below shows your fund’s expenses based on a $1,000 investment, assuming a hypothetical 5% annualized return. You can use this information to compare the ongoing expenses (but not transaction expenses or total cost) of investing in the fund with those of other funds.All mutual fund shareholder reports will provide this information to help you make this comparison. Please note that you cannot use this information to estimate your actual ending account balance and expenses paid during the period.
| | | | | |
| Expenses and Value of a $1,000 Investment | | | |
| assuming a hypothetical 5% annualized return for the six months ended December 31, 2009 |
| | Class A | Class B | Class C | Class F | Class I |
| Expenses paid per $1,000† | $ 10.46 | $ 14.80 | $ 14.90 | $ 8.39 | $ 9.20 |
| Ending value (after expenses) | $1,014.82 | $1,010.49 | $1,010.38 | $1,016.89 | $1,016.08 |
† Expenses are equal to the fund’s annualized expense ratio of 2.06% for Class A, 2.92% for Class B, 2.94% for Class C, 1.65% for Class F and 1.81% for Class I, multiplied by the average account value over the period, multiplied by 184/365 (to reflect the one-half year period).
8
|
| STATEMENT OF INVESTMENTS |
| December 31, 2009 |
| | |
| Common Stocks—98.6% | Shares | Value ($) |
| Consumer Discretionary—13.9% | | |
| 99 Cents Only Stores | 77,740 a | 1,016,062 |
| Carter’s | 29,600 a | 777,000 |
| Cato, Cl. A | 72,960 | 1,463,578 |
| Chipotle Mexican Grill | 10,436 a,b | 920,038 |
| Citi Trends | 41,820 a | 1,155,068 |
| Columbia Sportswear | 15,760 | 615,270 |
| Gentex | 47,000 | 838,950 |
| Hibbett Sports | 68,240 a,b | 1,500,598 |
| Inter Parfums | 80,550 | 980,293 |
| Interface, Cl. A | 111,860 | 929,557 |
| Lions Gate Entertainment | 145,010 a,b | 842,508 |
| OfficeMax | 76,580 a | 971,800 |
| Papa John’s International | 22,260 a | 519,994 |
| QLogic | 33,600 a | 634,032 |
| Resources Connection | 58,530 a | 1,242,007 |
| THQ | 126,380 a | 636,955 |
| Tractor Supply | 31,840 a | 1,686,246 |
| Wolverine World Wide | 34,990 | 952,428 |
| | | 17,682,384 |
| Consumer Staples—2.8% | | |
| Alberto-Culver | 46,180 | 1,352,612 |
| Casey’s General Stores | 21,350 | 681,492 |
| Hain Celestial Group | 32,400 a,b | 551,124 |
| Jarden | 31,430 b | 971,501 |
| | | 3,556,729 |
| Energy—4.2% | | |
| Arena Resources | 36,950 a | 1,593,284 |
| Comstock Resources | 37,850 a | 1,535,574 |
| Dril-Quip | 17,340 a,b | 979,363 |
| Oil States International | 24,570 a | 965,355 |
| Seneca Foods, Cl. A | 9,610 a | 229,391 |
| | | 5,302,967 |
| Exchange Traded Funds—2.8% | | |
| iShares Russell 2000 Growth Index Fund | 51,750 b | 3,522,622 |
The Fund 9
STATEMENT OF INVESTMENTS (continued)
| | |
| Common Stocks (continued) | Shares | Value ($) |
| Financial—8.1% | | |
| Altisource Portfolio Solutions | 64,020 a | 1,343,780 |
| Arch Capital Group | 18,740 a | 1,340,847 |
| Hatteras Financial | 42,210 b | 1,180,192 |
| Portfolio Recovery Associates | 17,670 a,b | 793,030 |
| Prosperity Bancshares | 23,600 | 955,092 |
| Starwood Property Trust | 64,480 | 1,218,027 |
| Tower Group | 38,510 | 901,519 |
| Validus Holdings | 54,840 | 1,477,390 |
| Westamerica Bancorporation | 19,650 b | 1,088,020 |
| | | 10,297,897 |
| Health Care—23.7% | | |
| Alexion Pharmaceuticals | 21,940 a | 1,071,111 |
| Allscripts-Misys Healthcare Solutions | 62,340 a,b | 1,261,138 |
| Analogic | 27,040 | 1,041,310 |
| AngioDynamics | 69,410 a | 1,116,113 |
| Bio-Rad Laboratories, Cl. A | 9,480 a | 914,441 |
| Cardiome Pharma | 136,910 a,b | 609,249 |
| Catalyst Health Solutions | 34,790 a | 1,268,791 |
| Centene | 35,750 a | 756,827 |
| Chemed | 21,960 b | 1,053,421 |
| Coherent | 47,390 a,b | 1,408,905 |
| Cyberonics | 1,490 a | 30,456 |
| Eclipsys | 48,030 a | 889,516 |
| Emergency Medical Services, Cl. A | 26,476 a | 1,433,675 |
| ev3 | 70,720 a | 943,405 |
| Human Genome Sciences | 66,590 a,b | 2,037,654 |
| Isis Pharmaceuticals | 38,610 a | 428,571 |
| MAP Pharmaceuticals | 36,780 a,b | 350,513 |
| MEDNAX | 17,820 a | 1,071,160 |
| Micromet | 6,400 a,b | 42,624 |
| Natus Medical | 42,020 a | 621,476 |
| Nektar Therapeutics | 51,250 a | 477,650 |
| OncoGenex Pharmaceutical | 12,170 a,b | 271,148 |
| Owens & Minor | 15,620 | 670,567 |
| PerkinElmer | 32,100 | 660,939 |
| Phase Forward | 45,510 a | 698,578 |
10
| | |
| Common Stocks (continued) | Shares | Value ($) |
| Health Care (continued) | | |
| PSS World Medical | 53,220 a,b | 1,201,175 |
| Quality Systems | 15,190 b | 953,780 |
| RehabCare Group | 33,360 a | 1,015,145 |
| Salix Pharmaceuticals | 38,140 a | 968,756 |
| SXC Health Solutions | 20,150 a | 1,087,093 |
| Thermo Fisher Scientific | 22,580 a | 1,076,840 |
| Thoratec | 17,120 a | 460,870 |
| United Therapeutics | 18,750 a,b | 987,188 |
| Volcano | 63,511 a | 1,103,821 |
| | | 29,983,906 |
| Industrial—12.2% | | |
| Administaff | 46,630 b | 1,100,002 |
| Columbus McKinnon | 41,280 a | 563,885 |
| Cornell | 27,420 a | 622,434 |
| EnerSys | 37,600 a | 822,312 |
| EnPro Industries | 42,720 a,b | 1,128,235 |
| Exponent | 18,240 a | 507,802 |
| Great Lakes Dredge and Dock | 55,740 | 361,195 |
| Haynes International | 24,040 | 792,599 |
| Heidrick & Struggles International | 40,980 b | 1,280,215 |
| Hub Group, Cl. A | 61,550 a | 1,651,386 |
| ICF International | 33,650 a | 901,820 |
| Knight Transportation | 57,290 | 1,105,124 |
| Landstar System | 24,700 | 957,619 |
| Mueller Industries | 54,050 | 1,342,602 |
| Quanex Building Products | 54,180 | 919,435 |
| Teledyne Technologies | 27,253 a | 1,045,425 |
| Werner Enterprises | 20,050 | 396,790 |
| | | 15,498,880 |
| Information Technology—25.4% | | |
| Acxiom | 121,650 a | 1,632,543 |
| Advanced Energy Industries | 80,500 a | 1,213,940 |
| Atheros Communications | 37,640 a | 1,288,794 |
| ATMI | 38,000 a,b | 707,560 |
| CACI International, Cl. A | 32,770 a | 1,600,814 |
| Computer Programs & Systems | 14,900 | 686,145 |
The Fund 11
STATEMENT OF INVESTMENTS (continued)
| | |
| Common Stocks (continued) | Shares | Value ($) |
| Information Technology (continued) | | |
| CyberSource | 93,190 a,b | 1,874,051 |
| Fidelity National Information Services | 25,675 | 601,822 |
| International Rectifier | 52,280 a,b | 1,156,434 |
| j2 Global Communications | 34,780 a | 707,773 |
| Kforce | 43,670 a | 545,875 |
| Lawson Software | 148,280 a | 986,062 |
| Mellanox Technologies | 41,440 a | 781,558 |
| Mentor Graphics | 148,460 a | 1,310,902 |
| MicroStrategy, Cl. A | 13,280 a | 1,248,586 |
| NCI, Cl. A | 13,220 a | 365,533 |
| NETGEAR | 34,230 a | 742,449 |
| NetScout Systems | 74,000 a,b | 1,083,360 |
| Novellus Systems | 17,400 a | 406,116 |
| Pericom Semiconductor | 83,360 a | 961,141 |
| PMC-Sierra | 114,560 a | 992,090 |
| Polycom | 37,230 a | 929,633 |
| Quest Software | 71,430 a | 1,314,312 |
| SkillSoft, ADR | 165,070 a | 1,729,934 |
| SMART Modular Technologies | 110,880 a | 697,435 |
| SuccessFactors | 63,860 a,b | 1,058,799 |
| Take-Two Interactive Software | 45,720 a,b | 459,486 |
| Ultratech | 35,170 a | 522,626 |
| Verigy | 100,190 a,b | 1,289,445 |
| Vishay Intertechnology | 149,920 a | 1,251,832 |
| Vocus | 36,860 a | 663,480 |
| Volterra Semiconductor | 73,470 a | 1,404,746 |
| | | 32,215,276 |
| Materials—3.9% | | |
| Aurizon Mines | 127,843 a | 575,293 |
| Crane | 29,580 | 905,740 |
| H.B. Fuller | 30,330 | 690,008 |
| Horsehead Holding | 60,400 a | 770,100 |
| Penn Virginia | 59,990 | 1,277,187 |
| Zep | 39,270 | 680,156 |
| | | 4,898,484 |
| Telecommunication Services—1.6% | | |
| Neutral Tandem | 29,620 a | 673,855 |
12
| | |
| Common Stocks (continued) | Shares | Value ($) |
| Telecommunication Services (continued) | | |
| TeleCommunication Systems, Cl. A | 134,340 a | 1,300,411 |
| | | 1,974,266 |
| Total Common Stocks | | |
| (cost $111,879,213) | | 124,933,411 |
| |
| Other Investment—1.9% | | |
| Registered Investment Company; | | |
| Dreyfus Institutional Preferred | | |
| Plus Money Market Fund | | |
| (cost $2,470,000) | 2,470,000 c | 2,470,000 |
| |
| Investment of Cash Collateral | | |
| for Securities Loaned—11.9% | | |
| Registered Investment Company; | | |
| Dreyfus Institutional Cash | | |
| Advantage Fund | | |
| (cost $15,033,233) | 15,033,233 c | 15,033,233 |
| Total Investments (cost $129,382,446) | 112.4% | 142,436,644 |
| Liabilities, Less Cash and Receivables | (12.4%) | (15,659,274) |
| Net Assets | 100.0% | 126,777,370 |
|
| ADR—American Depository Receipt |
| a Non-income producing security. |
| b Security, or portion thereof, on loan.At December 31, 2009, the total market value of the fund’s securities on loan is |
| $14,470,929 and the total market value of the collateral held by the fund is $15,033,233. |
| c Investment in affiliated money market mutual fund. |
| | | |
| Portfolio Summary (Unaudited)† | | |
| |
| | Value (%) | | Value (%) |
| Information Technology | 25.4 | Energy | 4.2 |
| Health Care | 23.7 | Materials | 3.9 |
| Consumer Discretionary | 13.9 | Consumer Staples | 2.8 |
| Money Market Investments | 13.8 | Exchange Traded Funds | 2.8 |
| Industrial | 12.2 | Telecommunication Services | 1.6 |
| Financial | 8.1 | | 112.4 |
| |
| † Based on net assets. | | | |
| See notes to financial statements. | | | |
The Fund 13
|
| STATEMENT OF ASSETS AND LIABILITIES |
| December 31, 2009 |
| | | | | |
| | | | | Cost | Value |
| Assets ($): | | | | | |
| Investments in securities—See Statement of Investments (including | | |
| securities on loan, valued at $14,470,929)—Note 1(b): | | |
| Unaffiliated issuers | | | | 111,879,213 | 124,933,411 |
| Affiliated issuers | | | | 17,503,233 | 17,503,233 |
| Cash | | | | | 20,398 |
| Receivable for investment securities sold | | | | 738,998 |
| Dividends and interest receivable | | | | 86,273 |
| Receivable for shares of Common Stock subscribed | | | 12,108 |
| Prepaid expenses | | | | | 24,645 |
| | | | | | 143,319,066 |
| Liabilities ($): | | | | | |
| Due to The Dreyfus Corporation and affiliates—Note 3(c) | | | 186,228 |
| Liability for securities on loan—Note 1(b) | | | | 15,033,233 |
| Payable for investment securities purchased | | | 1,065,505 |
| Payable for shares of Common Stock redeemed | | | 111,597 |
| Accrued expenses | | | | | 145,133 |
| | | | | | 16,541,696 |
| Net Assets ($) | | | | | 126,777,370 |
| Composition of Net Assets ($): | | | | |
| Paid-in capital | | | | | 400,048,585 |
| Accumulated net realized gain (loss) on investments | | | (286,325,413) |
| Accumulated net unrealized appreciation | | | | |
| (depreciation) on investments | | | | 13,054,198 |
| Net Assets ($) | | | | | 126,777,370 |
| |
| |
| Net Asset Value Per Share | | | | |
| | Class A | Class B | Class C | Class F | Class I |
| Net Assets ($) | 5,601,344 | 220,813 | 1,197,689 | 110,458,857 | 9,298,667 |
| Shares Outstanding | 230,049 | 9,944 | 53,457 | 4,479,475 | 370,048 |
| Net Asset Value | | | | | |
| Per Share ($) | 24.35 | 22.21 | 22.40 | 24.66 | 25.13 |
| |
| See notes to financial statements. | | | | |
14
STATEMENT OF OPERATIONS
Year Ended December 31, 2009
| |
| Investment Income ($): | |
| Income: | |
| Cash dividends: | |
| Unaffiliated issuers | 581,046 |
| Affiliated issuers | 4,887 |
| Income from securities lending—Note 1(b) | 8,830 |
| Total Income | 594,763 |
| Expenses: | |
| Investment advisory fee—Note 3(a) | 1,161,719 |
| Shareholder servicing costs—Note 3(c) | 340,028 |
| Accounting fees—Note 3(c) | 103,636 |
| Prospectus and shareholders’ reports | 74,209 |
| Registration fees | 73,756 |
| Professional fees | 67,456 |
| Distribution fees—Note 3(b) | 63,604 |
| Directors’ fees and expenses—Note 3(d) | 55,205 |
| Custodian fees—Note 3(c) | 26,939 |
| Loan commitment fees—Note 2 | 4,780 |
| Miscellaneous | 41,231 |
| Total Expenses | 2,012,563 |
| Less—reduction in fees due to earnings credits—Note 1(b) | (24,868) |
| Net Expenses | 1,987,695 |
| Investment (Loss)—Net | (1,392,932) |
| Realized and Unrealized Gain (Loss) on Investments—Note 4 ($): | |
| Net realized gain (loss) on investments | (9,824,747) |
| Net unrealized appreciation (depreciation) on investments | 33,920,601 |
| Net Realized and Unrealized Gain (Loss) on Investments | 24,095,854 |
| Net Increase in Net Assets Resulting from Operations | 22,702,922 |
| |
| See notes to financial statements. | |
The Fund 15
STATEMENT OF CHANGES IN NET ASSETS
| | |
| | Year Ended December 31, |
| | 2009a | 2008 |
| Operations ($): | | |
| Investment (loss)—net | (1,392,932) | (1,833,780) |
| Net realized gain (loss) on investments | (9,824,747) | (43,009,047) |
| Net unrealized appreciation | | |
| (depreciation) on investments | 33,920,601 | (34,809,802) |
| Net Increase (Decrease) in Net Assets | | |
| Resulting from Operations | 22,702,922 | (79,652,629) |
| Capital Stock Transactions ($): | | |
| Net proceeds from shares sold: | | |
| Class A Shares | 467,129 | 678,427 |
| Class B Shares | — | 30,853 |
| Class C Shares | 13,714 | 248,924 |
| Class F Shares | 3,416,756 | 4,845,191 |
| Class I Shares | 431,908 | 3,037,366 |
| Class T Shares | 191 | 67,912 |
| Cost of shares redeemed: | | |
| Class A Shares | (1,337,145) | (2,473,778) |
| Class B Shares | (163,942) | (210,161) |
| Class C Shares | (248,152) | (493,414) |
| Class F Shares | (16,364,096) | (28,433,576) |
| Class I Shares | (2,033,139) | (6,440,640) |
| Class T Shares | (73,055) | (41,378) |
| Increase (Decrease) in Net Assets from | | |
| Capital Stock Transactions | (15,889,831) | (29,184,274) |
| Total Increase (Decrease) in Net Assets | 6,813,091 | (108,836,903) |
| Net Assets ($): | | |
| Beginning of Period | 119,964,279 | 228,801,182 |
| End of Period | 126,777,370 | 119,964,279 |
| Accumulated distributions in excess | | |
| of investment income—net | — | (127,770) |
16
| | |
| | Year Ended December 31, |
| | 2009a | 2008 |
| Capital Share Transactions: | | |
| Class Ab,c | | |
| Shares sold | 23,163 | 24,094 |
| Shares redeemed | (61,707) | (91,626) |
| Net Increase (Decrease) in Shares Outstanding | (38,544) | (67,532) |
| Class Bb | | |
| Shares sold | — | 1,064 |
| Shares redeemed | (8,707) | (7,968) |
| Net Increase (Decrease) in Shares Outstanding | (8,707) | (6,904) |
| Class C | | |
| Shares sold | 739 | 9,469 |
| Shares redeemed | (13,226) | (18,574) |
| Net Increase (Decrease) in Shares Outstanding | (12,487) | (9,105) |
| Class F | | |
| Shares sold | 164,465 | 175,364 |
| Shares redeemed | (777,725) | (1,018,054) |
| Net Increase (Decrease) in Shares Outstanding | (613,260) | (842,690) |
| Class I | | |
| Shares sold | 20,741 | 100,083 |
| Shares redeemed | (95,989) | (222,125) |
| Net Increase (Decrease) in Shares Outstanding | (75,248) | (122,042) |
| Class Tc | | |
| Shares sold | 10 | 2,287 |
| Shares redeemed | (4,075) | (1,433) |
| Net Increase (Decrease) in Shares Outstanding | (4,065) | 854 |
| |
| a | Effective as of the close of business on February 4, 2009, the fund no longer offers Class T shares. |
| b | During the period ended December 31, 2009, 2,691 Class B shares representing $50,050 were automatically |
| | converted to 2,465 Class A shares and during the period ended December 31, 2008, 5,625 Class B shares |
| | representing $149,695, were automatically converted to 5,194 Class A shares. |
| c | On the close of business on February 4, 2009, 2,918 Class T shares representing $52,312 were converted to 2,811 |
| | Class A shares. |
| See notes to financial statements. |
The Fund 17
FINANCIAL HIGHLIGHTS
The following tables describe the performance for each share class for the fiscal periods indicated.All information (except portfolio turnover rate) reflects financial results for a single fund share.Total return shows how much your investment in the fund would have increased (or decreased) during each period, assuming you had reinvested all dividends and distributions.These figures have been derived from the fund’s financial statements.
| | | | | |
| | | Year Ended December 31, | |
| Class A Shares | 2009† | 2008 | 2007 | 2006 | 2005 |
| Per Share Data ($): | | | | | |
| Net asset value, beginning of period | 20.20 | 32.80 | 30.09 | 28.63 | 28.82 |
| Investment Operations: | | | | | |
| Investment (loss)—neta | (.34) | (.37) | (.50) | (.35) | (.28) |
| Net realized and unrealized | | | | | |
| gain (loss) on investments | 4.49 | (12.23) | 3.21 | 1.81 | .09 |
| Total from Investment Operations | 4.15 | (12.60) | 2.71 | 1.46 | (.19) |
| Net asset value, end of period | 24.35 | 20.20 | 32.80 | 30.09 | 28.63 |
| Total Return (%)b | 20.55 | (38.41) | 9.01 | 5.10 | (.66) |
| Ratios/Supplemental Data (%): | | | | | |
| Ratio of total expenses | | | | | |
| to average net assets | 2.19 | 1.77 | 2.02 | 1.51 | 1.47 |
| Ratio of net expenses | | | | | |
| to average net assets | 2.17 | 1.77c | 2.01 | 1.51 | 1.45 |
| Ratio of net investment (loss) | | | | | |
| to average net assets | (1.66) | (1.30) | (1.58) | (1.15) | (1.09) |
| Portfolio Turnover Rate | 238.12 | 234 | 215 | 202 | 160 |
| Net Assets, end of period ($ x 1,000) | 5,601 | 5,425 | 11,024 | 35,719 | 45,092 |
| |
| † | Effective September 1, 2009,The Dreyfus Corporation replaced Founders Asset Management LLC as the fund’s |
| | investment adviser. |
| a | Based on average shares outstanding at each month end. |
| b | Exclusive of sales charge. |
| c | Expense waivers and/or reimbursements amounted to less than .01%. |
| See notes to financial statements. |
18
| | | | | |
| | | Year Ended December 31, | |
| Class B Shares | 2009† | 2008 | 2007 | 2006 | 2005 |
| Per Share Data ($): | | | | | |
| Net asset value, beginning of period | 18.56 | 30.40 | 28.04 | 27.10 | 27.55 |
| Investment Operations: | | | | | |
| Investment (loss)—neta | (.46) | (.58) | (.60) | (.61) | (.54) |
| Net realized and unrealized | | | | | |
| gain (loss) on investments | 4.11 | (11.26) | 2.96 | 1.55 | .09 |
| Total from Investment Operations | 3.65 | (11.84) | 2.36 | .94 | (.45) |
| Net asset value, end of period | 22.21 | 18.56 | 30.40 | 28.04 | 27.10 |
| Total Return (%)b | 19.67 | (38.95) | 8.38 | 3.51 | (1.63) |
| Ratios/Supplemental Data (%): | | | | | |
| Ratio of total expenses | | | | | |
| to average net assets | 2.97 | 2.76 | 2.55 | 2.64 | 2.44 |
| Ratio of net expenses | | | | | |
| to average net assets | 2.95 | 2.75 | 2.54 | 2.64 | 2.43 |
| Ratio of net investment (loss) | | | | | |
| to average net assets | (2.46) | (2.29) | (2.08) | (2.28) | (2.06) |
| Portfolio Turnover Rate | 238.12 | 234 | 215 | 202 | 160 |
| Net Assets, end of period ($ x 1,000) | 221 | 346 | 777 | 1,344 | 13,964 |
| |
| † | Effective September 1, 2009,The Dreyfus Corporation replaced Founders Asset Management LLC as the fund’s |
| | investment adviser. |
| a | Based on average shares outstanding at each month end. |
| b | Exclusive of sales charge. |
| See notes to financial statements. |
The Fund 19
FINANCIAL HIGHLIGHTS (continued)
| | | | | |
| | | Year Ended December 31, | |
| Class C Shares | 2009† | 2008 | 2007 | 2006 | 2005 |
| Per Share Data ($): | | | | | |
| Net asset value, beginning of period | 18.73 | 30.67 | 28.29 | 27.14 | 27.57 |
| Investment Operations: | | | | | |
| Investment (loss)—neta | (.47) | (.55) | (.64) | (.56) | (.50) |
| Net realized and unrealized | | | | | |
| gain (loss) on investments | 4.14 | (11.39) | 3.02 | 1.71 | .07 |
| Total from Investment Operations | 3.67 | (11.94) | 2.38 | 1.15 | (.43) |
| Net asset value, end of period | 22.40 | 18.73 | 30.67 | 28.29 | 27.14 |
| Total Return (%)b | 19.59 | (38.93) | 8.41 | 4.24 | (1.56) |
| Ratios/Supplemental Data (%): | | | | | |
| Ratio of total expenses | | | | | |
| to average net assets | 2.99 | 2.60 | 2.64 | 2.36 | 2.36 |
| Ratio of net expenses | | | | | |
| to average net assets | 2.97 | 2.60c | 2.63 | 2.36 | 2.35 |
| Ratio of net investment (loss) | | | | | |
| to average net assets | (2.46) | (2.13) | (2.16) | (2.01) | (1.98) |
| Portfolio Turnover Rate | 238.12 | 234 | 215 | 202 | 160 |
| Net Assets, end of period ($ x 1,000) | 1,198 | 1,235 | 2,302 | 2,981 | 4,391 |
| |
| † | Effective September 1, 2009,The Dreyfus Corporation replaced Founders Asset Management LLC as the fund’s |
| | investment adviser. |
| a | Based on average shares outstanding at each month end. |
| b | Exclusive of sales charge. |
| c | Expense waivers and/or reimbursements amounted to less than .01%. |
| See notes to financial statements. |
20
| | | | | |
| | | Year Ended December 31, | |
| Class F Shares | 2009† | 2008 | 2007 | 2006 | 2005 |
| Per Share Data ($): | | | | | |
| Net asset value, beginning of period | 20.35 | 32.94 | 30.03 | 28.58 | 28.77 |
| Investment Operations: | | | | | |
| Investment (loss)—neta | (.24) | (.28) | (.32) | (.34) | (.30) |
| Net realized and unrealized | | | | | |
| gain (loss) on investments | 4.55 | (12.31) | 3.23 | 1.79 | .11 |
| Total from Investment Operations | 4.31 | (12.59) | 2.91 | 1.45 | (.19) |
| Net asset value, end of period | 24.66 | 20.35 | 32.94 | 30.03 | 28.58 |
| Total Return (%) | 21.18 | (38.22) | 9.69 | 5.08 | (.66) |
| Ratios/Supplemental Data (%): | | | | | |
| Ratio of total expenses | | | | | |
| to average net assets | 1.69 | 1.48 | 1.49 | 1.53 | 1.46 |
| Ratio of net expenses | | | | | |
| to average net assets | 1.67 | 1.47 | 1.48 | 1.52 | 1.45 |
| Ratio of net investment (loss) | | | | | |
| to average net assets | (1.15) | (1.00) | (1.01) | (1.16) | (1.09) |
| Portfolio Turnover Rate | 238.12 | 234 | 215 | 202 | 160 |
| Net Assets, end of period ($ x 1,000) | 110,459 | 103,639 | 195,510 | 238,015 | 351,087 |
| |
| † | Effective September 1, 2009,The Dreyfus Corporation replaced Founders Asset Management LLC as the fund’s |
| | investment adviser. |
| a | Based on average shares outstanding at each month end. |
| See notes to financial statements. |
The Fund 21
FINANCIAL HIGHLIGHTS (continued)
| | | | | |
| | | Year Ended December 31, | |
| Class I Shares | 2009† | 2008 | 2007a | 2006 | 2005 |
| Per Share Data ($): | | | | | |
| Net asset value, beginning of period | 20.75 | 33.64 | 30.67 | 29.11 | 29.22 |
| Investment Operations: | | | | | |
| Investment (loss)—netb | (.26) | (.33) | (.32) | (.27) | (.24) |
| Net realized and unrealized | | | | | |
| gain (loss) on investments | 4.64 | (12.56) | 3.29 | 1.83 | .13 |
| Total from Investment Operations | 4.38 | (12.89) | 2.97 | 1.56 | (.11) |
| Net asset value, end of period | 25.13 | 20.75 | 33.64 | 30.67 | 29.11 |
| Total Return (%) | 21.11 | (38.32) | 9.68 | 5.36 | (.38) |
| Ratios/Supplemental Data (%): | | | | | |
| Ratio of total expenses | | | | | |
| to average net assets | 1.77 | 1.62 | 1.49 | 1.26 | 1.18 |
| Ratio of net expenses | | | | | |
| to average net assets | 1.75 | 1.61 | 1.48 | 1.26 | 1.17 |
| Ratio of net investment (loss) | | | | | |
| to average net assets | (1.24) | (1.14) | (.98) | (.91) | (.80) |
| Portfolio Turnover Rate | 238.12 | 234 | 215 | 202 | 160 |
| Net Assets, end of period ($ x 1,000) | 9,299 | 9,240 | 19,086 | 8,662 | 8,315 |
| |
| † | Effective September 1, 2009,The Dreyfus Corporation replaced Founders Asset Management LLC as the fund’s |
| | investment adviser. |
| a | Effective June 1, 2007, Class R shares were redesignated as Class I shares. |
| b | Based on average shares outstanding at each month end. |
| See notes to financial statements. |
22
NOTES TO FINANCIAL STATEMENTS
NOTE 1—Significant Accounting Policies:
Dreyfus Discovery Fund (the “fund”) is a separate diversified series of Dreyfus Funds, Inc. (the “Company”), which is registered under the Investment Company Act of 1940, as amended (the “Act”), as an open-end management investment company and operates as a series company currently offering three series, including the fund.The fund’s investment objective seeks capital appreciation. Prior to September 1, 2009, Founders Asset Management LLC, an indirect wholly-owned subsidiary of The Bank of New York Mellon Corporation (“BNY Mellon”), served as the fund’s investment adviser. Effective September 1, 2009,The Dreyfus Corporation (the “Manager” or “Dreyfus”), a wholly-owned subsidiary of BNY Mellon, serves as the fund’s investment adviser.
MBSC Securities Corporation (the “Distributor”), a wholly-owned subsidiary of the Manager, is the distributor of the fund’s shares. The fund is authorized to issue 500 million shares of $.001 par value Common Stock.The fund currently offers five classes of shares: Class A (150 million shares authorized), Class B (50 million shares authorized), Class C (50 million shares authorized), Class F (200 million shares authorized) and Class I (50 million shares authorized). Class A shares are subject to a sales charge imposed at the time of purchase. Class B shares are subject to a contingent deferred sales charge (“CDSC”) imposed on Class B share redemptions made within six years of purchase and automatically convert to Class A shares after six years. The fund does not offer Class B shares, except in connection with dividend reinvestment and permitted exchanges of Class B shares. Class C shares are subject to a CDSC imposed on Class C shares redeemed within one year of purchase. Class F and Class I shares are sold at net asset value per share. Class F shares are sold only to Class F grandfathered investors, and Class I shares are sold only to institutional investors. Other differences between the classes include the services offered to and the expenses borne by each class, the allocation of certain transfer agency costs and certain voting rights. Income, expenses (other than expenses attributable to a specific class), and realized and unrealized gains or losses on investments are allocated to each class of shares based on its relative net assets.
The Fund 23
NOTES TO FINANCIAL STATEMENTS (continued)
Effective December 3, 2008, investments for new accounts were no longer permitted in ClassT of the fund, except that participants in certain group retirement plans were able to open a new account in Class T of the fund, provided that the fund was established as an investment option under the plans before December 3, 2008. On February 4, 2009, the fund issued to each holder of its Class T shares, in exchange for said shares, Class A shares of the fund having an aggregate net asset value equal to the aggregate net asset value of the shareholder’s Class T shares. Subsequent investments in the fund’s Class A shares made by prior holders of the fund’s Class T shares who received Class A shares of the fund in exchange for their Class T shares are subject to the front-end sales load schedule that was in effect for Class T shares at the time of the exchange. Otherwise, all other Class A share attributes will be in effect . Effective as of the close of business on February 4, 2009, the fund no longer offers Class T shares.
The fund accounts separately for the assets, liabilities and operations of each series. Expenses directly attributable to each series are charged to that series’ operations; expenses which are applicable to all series are allocated among them on a pro rata basis.
The Financial Accounting Standards Board (“FASB”) Accounting Standards Codification (“ASC”) has become the exclusive reference of authoritative U.S. generally accepted accounting principles (“GAAP”) recognized by the FASB to be applied by nongovernmental entities. Rules and interpretive releases of the Securities and Exchange Commission (“SEC”) under authority of federal laws are also sources of authoritative GAAP for SEC registrants.The ASC has superseded all existing non-SEC accounting and reporting standards. The fund’s financial statements are prepared in accordance with GAAP, which may require the use of management estimates and assumptions.Actual results could differ from those estimates.
The Company enters into contracts that contain a variety of indemnifications. The fund’s maximum exposure under these arrangements is unknown.The fund does not anticipate recognizing any loss related to these arrangements.
24
(a) Portfolio valuation: Investments in securities are valued at the last sales price on the securities exchange or national securities market on which such securities are primarily traded. Securities listed on the National Market System for which market quotations are available are valued at the official closing price or, if there is no official closing price that day, at the last sales price. Securities not listed on an exchange or the national securities market, or securities for which there were no transactions, are valued at the average of the most recent bid and asked prices, except for open short positions, where the asked price is used for valuation purposes. Bid price is used when no asked price is available. Registered investment companies that are not traded on an exchange are valued at their net asset value.When market quotations or officia l closing prices are not readily available, or are determined not to reflect accurately fair value, such as when the value of a security has been significantly affected by events after the close of the exchange or market on which the security is principally traded (for example, a foreign exchange or market), but before the fund calculates its net asset value, the fund may value these investments at fair value as determined in accordance with the procedures approved by the Board of Directors. Fair valuing of securities may be determined with the assistance of a pricing service using calculations based on indices of domestic securities and other appropriate indicators, such as prices of relevant ADRs and futures contracts. For other securities that are fair valued by the Board of Directors, certain factors may be considered such as: fundamental analytical data, the nature and duration of restrictions on disposition, an evaluation of the forces that influence the market in which the securities are purchased and sold and public trading in similar securities of the issuer or comparable issuers. Financial futures are valued at the last sales price.
The fair value of a financial instrument is the amount that would be received to sell an asset or paid to transfer a liability in an orderly transaction between market participants at the measurement date (i.e. the exit price). GAAP establishes a fair value hierarchy that prioritizes the inputs of valuation techniques used to measure fair value.This hierar-
The Fund 25
NOTES TO FINANCIAL STATEMENTS (continued)
chy gives the highest priority to unadjusted quoted prices in active markets for identical assets or liabilities (Level 1 measurements) and the lowest priority to unobservable inputs (Level 3 measurements).
Additionally, GAAP provides guidance on determining whether the volume and activity in a market has decreased significantly and whether such a decrease in activity results in transactions that are not orderly. GAAP requires enhanced disclosures around valuation inputs and techniques used during annual and interim periods.
Various inputs are used in determining the value of the fund’s investments relating to fair value measurements. These inputs are summarized in the three broad levels listed below:
Level 1—unadjusted quoted prices in active markets for identical investments.
Level 2—other significant observable inputs (including quoted prices for similar investments, interest rates, prepayment speeds, credit risk, etc.).
Level 3—significant unobservable inputs (including the fund’s own assumptions in determining the fair value of investments).
The inputs or methodology used for valuing securities are not necessarily an indication of the risk associated with investing in those securities.
The following is a summary of the inputs used as of December 31, 2009 in valuing the fund’s investments:
| | | | |
| | | Level 2—Other | Level 3— | |
| | Level 1— | Significant | Significant | |
| | Unadjusted | Observable | Unobservable | |
| | Quoted Prices | Inputs | Inputs | Total |
| Assets ($) | | | | |
| Investments in Securities: | | | |
| Equity Securities— | | | | |
| Domestic† | 117,206,868 | — | — | 117,206,868 |
| Equity Securities— | | | | |
| Foreign† | 4,203,921 | — | — | 4,203,921 |
| Mutual Funds/ | | | | |
| Exchange | | | | |
| Traded Funds | 21,025,855 | — | — | 21,025,855 |
| |
| † See Statement of Investments for industry classification. | | |
26
(b) Securities transactions and investment income: Securities transactions are recorded on a trade date basis. Realized gains and losses from securities transactions are recorded on the identified cost basis. Dividend income is recognized on the ex-dividend date and interest income, including, where applicable, accretion of discount and amortization of premium on investments, is recognized on the accrual basis.
The fund has arrangements with the custodian and cash management bank whereby the fund may receive earnings credits when positive cash balances are maintained, which are used to offset custody and cash management fees. For financial reporting purposes, the fund includes net earnings credits as an expense offset in the Statement of Operations.
Pursuant to a securities lending agreement with The Bank of New York Mellon, a subsidiary of BNY Mellon and an affiliate of Dreyfus, the fund may lend securities to qualified institutions. It is the fund’s policy that, at origination, all loans are secured by collateral of at least 102% of the value of U.S. securities loaned and 105% of the value of foreign securities loaned. Collateral equivalent to at least 100% of the market value of securities on loan is maintained at all times. Collateral is either in the form of cash, which can be invested in certain money market mutual funds managed by the Manager, U.S. Government and Agency securities or letters of credit.The fund is entitled to receive all income on securities loaned, in addition to income earned as a result of the lending transaction. Although each security loaned is fully collateralized, the fund bears the risk of delay in recovery of, or loss of rights in, the securities loaned should a borrower fail to return the securities in a timely manner. During the period ended December 31, 2009, The Bank of New York Mellon earned $3,784 from lending portfolio securities, pursuant to the securities lending agreement.
(c) Affiliated issuers: Investments in other investment companies advised by the Manager are defined as “affiliated” in the Act.
(d) Dividends to shareholders: Dividends are recorded on the ex-dividend date. Dividends from investment income-net and dividends from net realized capital gains, if any, are normally declared and paid
The Fund 27
NOTES TO FINANCIAL STATEMENTS (continued)
annually, but the fund may make distributions on a more frequent basis to comply with the distribution requirements of the Internal Revenue Code of 1986, as amended (the “Code”).To the extent that net realized capital gains can be offset by capital loss carryovers, it is the policy of the fund not to distribute such gains. Income and capital gain distributions are determined in accordance with income tax regulations, which may differ from GAAP.
(e) Federal income taxes: It is the policy of the fund to continue to qualify as a regulated investment company, if such qualification is in the best interests of its shareholders, by complying with the applicable provisions of the Code, and to make distributions of taxable income sufficient to relieve it from substantially all federal income and excise taxes.
As of and during the period ended December 31, 2009, the fund did not have any liabilities for any uncertain tax positions.The fund recognizes interest and penalties, if any, related to uncertain tax positions as income tax expense in the Statement of Operations. During the period, the fund did not incur any interest or penalties.
Each of the tax years in the four-year period ended December 31, 2009 remains subject to examination by the Internal Revenue Service and state taxing authorities.
At December 31, 2009, the components of accumulated earnings on a tax basis were as follows: accumulated capital losses $285,343,716 and unrealized appreciation $12,618,058. In addition, the fund had $545,557 of capital losses realized after October 31, 2009, which were deferred for tax purposes to the first day of the following fiscal year.
The accumulated capital loss carryover is available for federal income tax purposes to be applied against future net securities profits, if any, realized subsequent to December 31, 2009. If not applied, $218,607,732 of the carryover expires in fiscal 2010, $14,100,467 expires in fiscal 2011, $19,897,540 expires in fiscal 2016 and $32,737,977 expires in fiscal 2017.
During the period ended December 31, 2009, as a result of permanent book to tax differences, primarily due to the tax treatment for net
28
operating losses, the fund increased accumulated undistributed investment income-net by $1,520,702 and decreased paid-in-capital by the same amount. Net assets and net asset value per share were not affected by this reclassification.
NOTE 2—Bank Lines of Credit:
The fund participates with other Dreyfus-managed funds in a $225 million unsecured credit facility led by Citibank, N.A. and a $300 million unsecured credit facility provided by The Bank of New York Mellon (each, a “Facility”), each to be utilized primarily for temporary or emergency purposes, including the financing of redemptions. In connection therewith, the fund has agreed to pay its pro rata portion of commitment fees for each Facility. Interest is charged to the fund based on rates determined pursuant to the terms of the respective Facility at the time of borrowing. Prior to May 28, 2009, the Company had a line of credit arrangement (“LOC”) with State Street Bank and Trust Company until May 27, 2009, to be used for temporary or emergency purposes, primarily for financing redemption payments. The borrowings by each series of the Company were limited to the lesser of (a) $25 million, or (b) the lesser of 25% of the series’ total net assets or the maximum amount which the series was permitted to borrow pursuant to the prospectus, any law or any other agreement. Combined borrowings were subject to the $25 million cap on the total LOC. Each series agreed to pay annual fees and interest on the unpaid balance based on prevailing market rates as defined in the LOC. During the period ended December 31, 2009, the fund did not borrow under the Facilities and LOC.
NOTE 3—Investment Advisory Fee and Other Transactions With Affiliates:
(a) Pursuant to a investment advisory agreement with the Manager, the investment advisory fee is based on the value of the fund’s average daily net assets and is computed at the following annual rates: 1% of the first $250 million, .80% of the next $250 million and .70% in excess of $500 million.The fee is payable monthly.
The Fund 29
NOTES TO FINANCIAL STATEMENTS (continued)
During the period ended December 31, 2009, the Distributor retained $401 and $17 from commissions earned on sales of the fund’s Class A and Class T shares, respectively, and $2,269 and $724 from CDSCs on redemptions of the fund’s Class B and Class C shares, respectively.
(b) Under the Distribution Plan (the “Class B, C andT Plan”) adopted pursuant to Rule 12b-1 under the Act, Class B and Class C shares pay and Class T shares paid the Distributor for distributing their shares at an annual rate of .75% of the value of the average daily net assets of Class B and Class C shares and .25% of the value of the average daily net assets of Class T shares. During the period ended December 31, 2009, Class B, Class C and Class T shares were charged $2,009, $8,460 and $15, respectively, pursuant to the Class B, C and T Plan.
The fund also adopted a Distribution Plan pursuant to Rule 12b-1 under the Act applicable to its Class F shares (the “Class F Plan”). Under the Class F Plan, the fund is authorized to reimburse the Distributor for expenses paid for distributing or servicing its Class F shares at an annual rate of up to .25% of the value of the average daily net assets of the fund’s Class F shares.The Distributor has agreed not to seek reimbursement of any expenses under the Class F Plan other than reimbursements for payments made to brokers and other intermediaries whose customers hold Class F shares (“Third Party Payments”).This commitment applies to any such expenses (other than Third Party Payments) incurred after May 13, 2009.The Distributor may seek reimbursement under the Class F Plan for any such expenses that may have been incurred by the Distributor on or before May 13, 2009, subject to the terms of the Class F Plan.This commitment will continue indefinitely and will not terminate without the prior approval of the fund's Board of Directors. During the period ended December 31, 2009, Class F shares were charged $53,120 pursuant to the Class F Plan.
(c) Under the Shareholder Services Plan (“Shareholder Services Plan”), Class A, Class B and Class C shares pay and Class T shares paid the Distributor at an annual rate of .25% of the value of their average daily net assets for the provision of certain services. The services provided
30
may include personal services relating to shareholder accounts, such as answering shareholder inquiries regarding Class A, Class B, Class C and Class T shares and providing reports and other information, and services related to the maintenance of shareholder accounts.The Distributor may make payments to Service Agents (a securities dealer, financial institution or other industry professional) in respect of these services. The Distributor determines the amounts to be paid to Service Agents. During the period ended December 31, 2009 Class A, Class B, Class C and Class T shares were charged $13,285, $670, $2,820 and $15, respectively, pursuant to the Shareholder Services Plan.
The Company has a shareholder services agreement with the Distributor, whereby the fund agrees to compensate the Distributor for providing certain shareholder servicing functions to holders of Class F shares. The fund pays the Distributor a monthly fee equal, on an annual basis, of $24.00 per Class F shareholder account considered to be an open account at any time during a given month. During the period ended December 31, 2009, Class F shares were charged $137,225 pursuant to the shareholder services agreement.
The fund compensates DreyfusTransfer, Inc., a wholly-owned subsidiary of the Manager, under a transfer agency agreement for providing personnel and facilities to perform transfer agency services for the fund. During the period ended December 31, 2009, the fund was charged $20,803 pursuant to the transfer agency agreement, which is included in Shareholder servicing costs in the Statement of Operations.
The fund compensates The Bank of New York Mellon under cash management agreements for performing cash management services related to fund subscriptions and redemptions. During the period ended December 31, 2009, the fund was charged $23,808 pursuant to the cash management agreements, which is included in Shareholder servicing costs in the Statement of Operations.These fees were offset by earnings credits pursuant to the cash management agreements.
The Fund 31
NOTES TO FINANCIAL STATEMENTS (continued)
The fund also compensates The Bank of New York Mellon under a custody agreement for providing custodial services for the fund. During the period ended December 31, 2009, the fund was charged $26,939 pursuant to the custody agreement.
The fund has agreed to compensate the Manager for providing accounting services, administration, compliance monitoring, regulatory and shareholder reporting, as well as related facilities, equipment and clerical help.The fee is based on the fund’s average daily net assets and computed at the following annual rates: .06% of the first $500 million, .04% of the next $500 million and .02% in excess of $1 billion, plus reasonable out-of-pocket expenses.The Manager has contractually agreed in writing to waive any fees received for these services to the extent they exceed its costs in providing the services and a reasonable allocation of the costs incurred by the Manager and its affiliates related to the support and oversight of these services.
During the period ended December 31, 2009, the fund was charged $6,681 for services performed by the Chief Compliance Officer.
The components of “Due to The Dreyfus Corporation and affiliates” in the Statement of Assets and Liabilities consist of: investment advisory fees $101,275, Rule 12b-1 distribution plan fees $5,525, shareholder services plan fees $61,979, custodian fees $3,440, chief compliance officer fees $5,011, transfer agency per account fees $2,621 and accounting fees $6,377.
(d) The Company’s current Board of Directors were elected as Board members of the Company as of September 1, 2009 (the “Effective Date”). From the Effective Date through December 31, 2009, each Board member received $45,000 per year, plus $6,000 for each joint Board meeting of the Company, The Dreyfus/Laurel Funds, Inc., The Dreyfus/Laurel Funds Trust, The Dreyfus/Laurel Tax-Free Municipal Funds and Dreyfus Investment Funds (collectively, the “Board Group Open-end Funds”) attended, $2,000 for separate in-person committee meetings attended which were not held in conjunction with a regularly scheduled Board meeting and $1,500 for Board meetings and separate
32
committee meetings attended that were conducted by telephone. Effective January 1, 2010, the Board Group Open-end Funds will pay each Board member who is not an “interested person” of the Company (as defined in the 1940 Act) $60,000 per annum, plus $7,000 per joint Board Group Open-end Funds Board meeting attended, $2,500 for separate in-person committee meetings attended which are not held in conjunction with a regularly scheduled Board meeting and $2,000 for Board meetings and separate committee meetings attended that are conducted by telephone.The Board Group Open-end Funds also reimburse each Board member who is not an “interested person” of the Company (as defined in the 1940 Act) for travel and out-of-pocket expenses.With respect to Board meetings, the Chairman of the Board receives an additional 25% of such compensation (with the exception of reimbursable amounts). With respect to compensation committ ee meetings from September 1, 2009 to January 1, 2010, the Chair of the compensation committee received $900 per compensation committee meeting, and, effective January 1, 2010, the Chair of each of the Board’s committees, unless the Chair also serves as Chair of the Board, will receive $1,350 per applicable committee meeting. In the event that there is an in-person joint committee meeting or a joint telephone meeting of the Board Group Open-end Funds and Dreyfus High Yield Strategies Fund, the $2,000 or $1,500 fee (prior to January 1, 2010) or the $2,500 or $2,000 fee (effective January 1, 2010), as applicable, is allocated between the Board Group Open-end Funds and Dreyfus HighYield Strategies Fund. The Company’s portion of these fees and expenses are charged and allocated to each series based on net assets.Amounts required to be paid by the Company directly to the non-interested Directors, that would be applied to offset a portion of the management fee to the Manager, are in fact paid directly by the Manager to the non-interested Directors.
NOTE 4—Securities Transactions:
The aggregate amount of purchases and sales of investment securities, excluding short-term securities, during the period ended December 31, 2009, amounted to $269,902,476 and $287,043,229, respectively.
The Fund 33
NOTES TO FINANCIAL STATEMENTS (continued)
The fund adopted the provisions of ASC Topic 815 “Derivatives and Hedging” which requires qualitative disclosures about objectives and strategies for using derivatives, quantitative disclosures about fair value amounts of gains and losses on derivative instruments and disclosures about credit-risk-related contingent features in derivative agreements.The fund held no derivatives during the period ended December 31, 2009. These disclosures did not impact the notes to the financial statements.
At December 31, 2009, the cost of investments for federal income tax purposes was $129,818,586; accordingly, accumulated net unrealized appreciation on investments was $12,618,058, consisting of $15,196,027 gross unrealized appreciation and $2,577,969 gross unrealized depreciation.
NOTE 5—New Accounting Pronouncement:
In January 2010, FASB issued Accounting Standards Update (“ASU”) No. 2010-06 “Improving Disclosures about FairValue Measurements”. ASU 2010-06 will require reporting entities to make new disclosures about amounts and reasons for significant transfers in and out of Level 1 and Level 2 fair value measurements as well as inputs and valuation techniques used to measure fair value for both recurring and nonrecur-ring fair value measurements that fall in either Level 2 or Level 3, and information on purchases, sales, issuances and settlements on a gross basis in the reconciliation of activity in Level 3 fair value measurements. The new and revised disclosures are required to be implemented for fiscal years beginning after December 15, 2009 except for the disclosures surrounding purchases, sales, issuances and settlements on a gross basis in the reconciliation of Level 3 fair value measurements, which are effective for fiscal years beginning after December 15, 2010. Management is currently evaluating the impact the adoption of ASU No. 2010-06 may have on the fund’s financial statement disclosures.
NOTE 6—Plan of Reorganization:
At a Board meeting held on October 28-29,2009,the Board of Directors of the Company approved, subject to fund shareholder approval, an Agreement and Plan of Reorganization (the “Agreement”) between the Company, on behalf of the fund, and Dreyfus Investment Funds, on
34
behalf of Dreyfus/The Boston Company Small/Mid Cap Growth Fund (the “Acquiring Fund”).The Agreement provides for the transfer of the fund’s assets to the Acquiring Fund in a tax-free exchange for shares of the Acquiring Fund and the assumption by the Acquiring Fund of the stated liabilities of the fund, the distribution of shares of the Acquiring Fund to the fund’s shareholders and the subsequent termination of the fund (the “Reorganization”). In anticipation of the Reorganization, effective February 2, 2010, the fund was closed to any investments for new accounts. A special meeting of the fund’s shareholders is scheduled on March 3, 2010, and, if approved by fund shareholders, the Reorganization will take place on or about April 29, 2010.
NOTE 7—Subsequent Events Evaluation:
Dreyfus has evaluated the need for disclosures and/or adjustments resulting from subsequent events through February 25, 2010, the date the financial statements were issued. This evaluation did not result in any subsequent events that necessitated disclosures and/or adjustments other than the following:
Change in Independent Registered Public Accounting Firm:
Ernst &Young LLP (“E&Y”), an independent registered public accounting firm, was the independent registered public accounting firm for the fund for the fiscal years ended December 31, 2009 and 2008. At the meeting held on February 9, 2010, the Audit Committee and the Board of Directors of the Company engaged KPMG LLP to replace E&Y as the independent registered public accounting firm for the Company.
During the fund’s past two fiscal years: (i) no report on the fund’s financial statements contained an adverse opinion or a disclaimer of opinion, or was qualified or modified as to uncertainty, audit scope, or accounting principles; and (ii) there were no “disagreements” (as such term is used in Item 304 of Regulation S-K) with E&Y on any matter of accounting principles or practices, financial statement disclosure, or auditing scope or procedure, which disagreement(s), if not resolved to the satisfaction of E&Y, would have caused it to make reference to the subject matter of the disagreement(s) in connection with its report.
The Fund 35
REPORT OF INDEPENDENT REGISTERED
PUBLIC ACCOUNTING FIRM
Shareholders and Board of Directors
Dreyfus Discovery Fund
We have audited the accompanying statement of assets and liabilities, including the statement of investments, of Dreyfus Discovery Fund (one of the series comprising Dreyfus Funds, Inc.) as of December 31, 2009, and the related statement of operations for the year then ended, the statement of changes in net assets for each of the two years in the period then ended, and financial highlights for each of the three years in the period then ended. These financial statements and financial highlights are the responsibility of the Fund’s management. Our responsibility is to express an opinion on these financial statements and financial highlights based on our audits.The financial highlights for the years ended December 31, 2006 and 2005 were audited by other auditors whose report dated February 23, 2007, expressed an unqualified opinion on such financial highlights.
We conducted our audits in accordance with the standards of the Public Company Accounting Oversight Board (United States).Those standards require that we plan and perform the audit to obtain reasonable assurance about whether the financial statements and financial highlights are free of material misstatement.We were not engaged to perform an audit of the Fund’s internal control over financial reporting. Our audits included consideration of internal control over financial reporting as a basis for designing audit procedures that are appropriate in the circumstances, but not for the purpose of expressing an opinion on the effectiveness of the Fund’s internal control over financial reporting. Accordingly, we express no such opinion.An audit also includes examining, on a test basis, evidence supporting the amounts and disclosures in the financial statements and financial highlights, assessing the accounting principles used and significant estimates made by management, and evaluating the overall financial statement presentation. Our procedures included confirmation of securities owned as of December 31, 2009 by correspondence with the custodian and others. We believe that our audits provide a reasonable basis for our opinion.
In our opinion, the 2009, 2008 and 2007 financial statements and financial highlights referred to above present fairly, in all material respects, the financial position of Dreyfus Discovery Fund at December 31, 2009, the results of its operations for the year then ended, the changes in its net assets for each of the two years in the period then ended, and the financial highlights for each of the three years in the period then ended, in conformity with U.S. generally accepted accounting principles.
New York, New York
February 25, 2010
36
PROXY RESULTS (Unaudited)
Dreyfus Funds, Inc. held an annual meeting of shareholders on August 20, 2009.
The proposal considered at the meeting, and the results, are as follows:
| | | |
| | | Shares | |
| | Votes For | | Authority Withheld |
| To elect a new slate of Directors: | | | |
| Joseph S. DiMartino | 71,760,496 | | 6,207,846 |
| James M. Fitzgibbons | 71,630,227 | | 6,338,115 |
| Kenneth A. Himmel | 71,844,526 | | 6,123,816 |
| Stephen J. Lockwood | 71,924,968 | | 6,043,374 |
| Roslyn M. Watson | 71,791,344 | | 6,176,998 |
| Benaree Pratt Wiley | 71,721,801 | | 6,246,541 |
The Fund 37
| |
| Roslyn M. Watson (60) | |
| Board Member (2009) | |
| Principal Occupation During Past 5Years: | |
| • Principal,WatsonVentures, Inc., a real estate investment company (1993-present) | |
| Other Board Memberships and Affiliations: | |
| • American Express Bank, FSB, Director | |
| • The Hyams Foundation Inc., a Massachusetts Charitable Foundation,Trustee | |
| • National Osteoporosis Foundation,Trustee | |
| • SBLI-USA, Director | |
| No. of Portfolios for which Board Member Serves: 35 | |
| |
| ——————— | |
| Benaree Pratt Wiley (63) | |
| Board Member (2009) | |
| Principal Occupation During Past 5Years: | |
| • Principal,The Wiley Group, a firm specializing in strategy and business | |
| development (2005-present) | |
| • President and CEO,The Partnership, an organization dedicated to increasing the representa- |
| tion of African Americans in positions of leadership, influence and decision-making in Boston, |
| MA (1991-2005) | |
| Other Board Memberships and Affiliations: | |
| • Blue Cross Blue Shield of Massachusetts, Director | |
| • CBIZ (formerly, Century Business Services, Inc.), a provider of outsourcing functions for small |
| and medium size companies, Director | |
| • Commonwealth Institute, Director | |
| • Efficacy Institute, Director | |
| • PepsiCo African-American, Chair of Advisory Board | |
| • The Boston Foundation, Director | |
| No. of Portfolios for which Board Member Serves: 72 | |
| |
| ——————— | |
| Once elected all Board Members serve for an indefinite term, but achieve Emeritus status upon reaching age 80.The |
| address of the Board Members and Officers is in c/o The Dreyfus Corporation, 200 Park Avenue, NewYork, NewYork |
| 10166.Additional information about the Board Members is available in the fund’s Statement of Additional Information |
| which can be obtained from Dreyfus free of charge by calling this toll free number: 1-800-554-4611. | |
| |
| |
| |
| |
| The Fund | 39 |
OFFICERS OF THE FUND (Unaudited)
BRADLEY J. SKAPYAK, President since January 2010.
Chief Operating Officer and a director of the Manager since June 2009. From April 2003 to June 2009, Mr. Skapyak was the head of the Investment Accounting and Support Department of the Manager. He is an officer of 76 investment companies (comprised of 171 portfolios) managed by the Manager. He is 51 years old and has been an employee of the Manager since February 1988.
PHILLIP N. MAISANO, Executive Vice President since September 2009.
Chief Investment Officer,Vice Chair and a director of the Manager, and an officer of 76 investment companies (comprised of 171 portfolios) managed by the Manager.
Mr. Maisano also is an officer and/or Board member of certain other investment management subsidiaries of The Bank of New York Mellon Corporation, each of which is an affiliate of the Manager. He is 62 years old and has been an employee of the Manager since November 2006. Prior to joining the Manager, Mr. Maisano served as Chairman and Chief Executive Officer of EACM Advisors, an affiliate of the Manager, since August 2004.
J. DAVID OFFICER, Vice President since January 2010.
Director of Mellon United National Bank, an affiliate of the Manager, and an officer of 77 investment companies (comprised of 194 portfolios) managed by the Manager. Prior to June 2009, Mr. Officer was Chief Operating Officer,Vice Chairman and a director of the Manager, where he had been employed since April 1998. He is 61 years old.
MICHAEL A. ROSENBERG, Vice President and Secretary since September 2009.
Assistant General Counsel of BNY Mellon, and an officer of 77 investment companies (comprised of 194 portfolios) managed by the Manager. He is 49 years old and has been an employee of the Manager since October 1991.
KIESHA ASTWOOD, Vice President and Assistant Secretary since January 2010.
Counsel of BNY Mellon, and an officer of 77 investment companies (comprised of 194 portfolios) managed by the Manager. She is 36 years old and has been an employee of the Manager since July 1995.
JAMES BITETTO, Vice President and Assistant Secretary since September 2009.
Senior Counsel of BNY Mellon and Secretary of the Manager, and an officer of 77 investment companies (comprised of 194 portfolios) managed by the Manager. He is 43 years old and has been an employee of the Manager since December 1996.
JONI LACKS CHARATAN, Vice President and Assistant Secretary since September 2009.
Senior Counsel of BNY Mellon, and an officer of 77 investment companies (comprised of 194 portfolios) managed by the Manager. She is 54 years old and has been an employee of the Manager since October 1988.
JOSEPH M. CHIOFFI, Vice President and Assistant Secretary since September 2009.
Senior Counsel of BNY Mellon, and an officer of 77 investment companies (comprised of 194 portfolios) managed by the Manager. He is 48 years old and has been an employee of the Manager since June 2000.
KATHLEEN DENICHOLAS, Vice President and Assistant Secretary since January 2010.
Senior Counsel of BNY Mellon, and an officer of 77 investment companies (comprised of 194 portfolios) managed by the Manager. She is 35 years old and has been an employee of the Manager since February 2001.
40
JANETTE E. FARRAGHER, Vice President and Assistant Secretary since September 2009.
Assistant General Counsel of BNY Mellon, and an officer of 77 investment companies (comprised of 194 portfolios) managed by the Manager. She is 47 years old and has been an employee of the Manager since February 1984.
JOHN B. HAMMALIAN, Vice President and Assistant Secretary since September 2009.
Managing Counsel of BNY Mellon, and an officer of 77 investment companies (comprised of 194 portfolios) managed by the Manager. He is 46 years old and has been an employee of the Manager since February 1991.
M. CRISTINA MEISER, Vice President and Assistant Secretary since January 2010.
Senior Counsel of BNY Mellon, and an officer of 77 investment companies (comprised of 194 portfolios) managed by the Manager. She is 39 years old and has been an employee of the Manager since August 2001.
ROBERT R. MULLERY, Vice President and Assistant Secretary since September 2009.
Managing Counsel of BNY Mellon, and an officer of 77 investment companies (comprised of 194 portfolios) managed by the Manager. He is 57 years old and has been an employee of the Manager since May 1986.
JEFF PRUSNOFSKY, Vice President and Assistant Secretary since September 2009.
Managing Counsel of BNY Mellon, and an officer of 77 investment companies (comprised of 194 portfolios) managed by the Manager. He is 44 years old and has been an employee of the Manager since October 1990.
JAMES WINDELS, Treasurer since September 2009.
Director – Mutual Fund Accounting of the Manager, and an officer of 77 investment companies (comprised of 194 portfolios) managed by the Manager. He is 51 years old and has been an employee of the Manager since April 1985.
RICHARD CASSARO, Assistant Treasurer since September 2009.
Senior Accounting Manager – Money Market and Municipal Bond Funds of the Manager, and an officer of 77 investment companies (comprised of 194 portfolios) managed by the Manager. He is 50 years old and has been an employee of the Manager since September 1982.
GAVIN C. REILLY, Assistant Treasurer since September 2009.
Tax Manager of the Investment Accounting and Support Department of the Manager, and an officer of 77 investment companies (comprised of 194 portfolios) managed by the Manager. He is 41 years old and has been an employee of the Manager since April 1991.
ROBERT ROBOL, Assistant Treasurer since September 2006.
Senior Accounting Manager – Fixed Income Funds of the Manager, and an officer of 77 investment companies (comprised of 194 portfolios) managed by the Manager. He is 45 years old and has been an employee of the Manager since October 1988.
ROBERT SALVIOLO, Assistant Treasurer since May 2007.
Senior Accounting Manager – Equity Funds of the Manager, and an officer of 77 investment companies (comprised of 194 portfolios) managed by the Manager. He is 42 years old and has been an employee of the Manager since June 1989.
The Fund 41
OFFICERS OF THE FUND (Unaudited) (continued)
ROBERT SVAGNA, Assistant Treasurer since September 2006.
Senior Accounting Manager – Equity Funds of the Manager, and an officer of 77 investment companies (comprised of 194 portfolios) managed by the Manager. He is 42 years old and has been an employee of the Manager since November 1990.
JOSEPH W. CONNOLLY, Chief Compliance Officer since September 2009.
Chief Compliance Officer of the Manager and The Dreyfus Family of Funds (77 investment companies, comprised of 194 portfolios). From November 2001 through March 2004, Mr. Connolly was first Vice-President, Mutual Fund Servicing for Mellon Global Securities Services. In that capacity, Mr. Connolly was responsible for managing Mellon’s Custody, Fund Accounting and Fund Administration services to third-party mutual fund clients.
He is 52 years old and has served in various capacities with the Manager since 1980, including manager of the firm’s Fund Accounting Department from 1997 through October 2001.
WILLIAM GERMENIS, Anti-Money Laundering Compliance Officer since 2002/2003 (Class F Shares).
Vice President and Anti-Money Laundering Compliance Officer of the Distributor, and the Anti-Money Laundering Compliance Officer of 73 investment companies (comprised of 190 portfolios) managed by the Manager. He is 39 years old and has been an employee of the Distributor since October 1998.
42
Save time. Save paper. View your next shareholder report online as soon as it’s available. Log into www.dreyfus.com and sign up for Dreyfus eCommunications. It’s simple and only takes a few minutes.
The views expressed in this report reflect those of the portfolio manager only through the end of the period covered and do not necessarily represent the views of Dreyfus or any other person in the Dreyfus organization. Any such views are subject to change at any time based upon market or other conditions and Dreyfus disclaims any responsibility to update such views.These views may not be relied on as investment advice and, because investment decisions for a Dreyfus fund are based on numerous factors, may not be relied on as an indication of trading intent on behalf of any Dreyfus fund.
Not FDIC-Insured • Not Bank-Guaranteed • May Lose Value
| | Contents |
| | THE FUND |
| 2 | A Letter from the Chairman and CEO |
| 3 | Discussion of Fund Performance |
| 6 | Fund Performance |
| 8 | Understanding Your Fund’s Expenses |
| 8 | Comparing Your Fund’s Expenses With Those of Other Funds |
| 9 | Statement of Investments |
| 13 | Statement of Assets and Liabilities |
| 14 | Statement of Operations |
| 15 | Statement of Changes in Net Assets |
| 17 | Financial Highlights |
| 22 | Notes to Financial Statements |
| 35 | Report of Independent Registered Public Accounting Firm |
| 36 | Important Tax Information |
| 36 | Proxy Results |
| 37 | Board Members Information |
| 39 | Officers of the Fund |
| | FOR MORE INFORMATION |
| | Back Cover |
Dreyfus
Equity Growth Fund
The Fund

A LETTER FROM THE CHAIRMAN AND CEO
Dear Shareholder:
We are pleased to present this annual report for Dreyfus Equity Growth Fund, covering the 12-month period from January 1, 2009, through December 31, 2009.
The U.S. stock market ended 2009 with a healthy annual gain, but market indices across all capitalization ranges and investment styles remained well below the peaks reached in the fall of 2007.The equity market’s advance was driven by improving investor sentiment as the U.S. economy staged a gradual, but sustained, recovery from the recession and banking crisis that had depressed stock prices at the beginning of the year. After four consecutive quarters of contraction, the U.S. economy returned to growth during the third quarter of 2009, buoyed by greater manufacturing activity to replenish depleted inventories and satisfy export demand. The slumping housing market also showed signs of renewed life later in the year when home sales and prices rebounded modestly. However, economic headwinds remain, including a high unemployment rate and the prospect of anemic consumer spending.
As 2010 begins, our Chief Economist, as well as many securities analysts and portfolio managers have continued to find opportunities and survey potential challenges across a variety of asset classes, including equities. While no one can predict the future, we believe that the 2010 investment environment will likely require a broader range of investment considerations relative to last year. As always, your financial adviser can help you determine the mix of investments that may be best suited to helping you achieve your goals at a level of risk that is comfortable for you.
For information about how the fund performed during the reporting period, as well as market perspectives, we have provided a Discussion of Fund Performance.
Thank you for your continued confidence and support.
Jonathan R. Baum
Chairman and Chief Executive Officer
The Dreyfus Corporation
January 15, 2010
2

DISCUSSION OF FUND PERFORMANCE
For the reporting period of January 1, 2009, through December 31, 2009, as provided by Elizabeth Slover, Portfolio Manager
Fund and Market Performance Overview
For the 12-month period ended December 31, 2009, Dreyfus Equity Growth Fund’s Class A shares produced a total return of 33.97%, Class B shares returned 32.16%, Class C shares returned 32.54%, Class F shares returned 33.94% and Class I shares returned 34.54%.1 In comparison, the Russell 1000 Growth Index produced a total return of 37.21% over the same period.2
In the wake of a severe recession and banking crisis, stocks rallied over much of 2009 as credit markets thawed and investors looked forward to better economic times.The fund produced lower returns than its benchmark, due primarily to shortfalls in the financials and health care sectors.
The Fund’s Investment Approach
To pursue the fund’s goal of long-term growth of capital and income, we invest primarily in the common stocks of large, well-established companies with records of profitability, dividend payments and a reputation for high-quality management, products and services.The fund normally invests at least 80% of its net assets in stocks that are included in a widely recognized index of stock market performance, such as the Dow Jones Industrial Average, the Standard & Poor’s 500 Index, or the NASDAQ Composite Index. Using a “bottom-up” approach, we focus on individual stock selection instead of broad economic or industry trends. We look mainly for companies whose fundamental strengths suggest the potential to provide superior earnings growth over time. The fund may also invest in non-dividend-paying companies, and it may invest up to 30% of its total assets in foreign securities.
U.S. Stock Market Rebounded Sharply
During the winter of 2008 and into 2009, equity markets were still reeling from a global financial crisis that nearly led to the collapse of the worldwide banking system. In addition, rising unemployment and declining housing markets had produced the most severe reces-
The Fund 3
DISCUSSION OF FUND PERFORMANCE (continued)
sion since the 1930s. These influences fueled a bear market that drove stocks across all capitalization ranges and investment styles to multi-year lows during the first quarter of the year. The decline affected a wide variety of industry groups seemingly regardless of their underlying business fundamentals.
Market sentiment began to improve in early March, as aggressive measures adopted by government and monetary authorities to repair the credit markets—including historically low short-term interest rates and a massive economic stimulus program—seemed to gain traction. Additional evidence of economic stabilization later appeared, sparking a sustained market rally through year-end. Lower-quality companies generally led the rally as investors turned to stocks that had been severely punished in the downturn.
Stock Selection Strategy Drove Fund Performance
The early months of 2009 proved to be a time of transition for the U.S. economy, stock market and the fund. After the current management team took the reins on January 6, we began to sell some of the fund’s legacy positions in the financials sector as quickly as market conditions allowed. Some of those positions remained in the portfolio for a time, however, dampening relative performance. Laggards in the financials sector during the first quarter of 2009 included commercial bank Wells Fargo and insurers Assurant and Unum Group.
Health care stocks underperformed the market as investors grappled with uncertainty driven by the constantly changing direction of the Washington reform discussion.This was magnified by investors rotating into more economically sensitive sectors to position portfolios for a recovery from the recession.The fund’s positioning in the health care sector weighed on its relative results. Biotechnology firms BioMarin Pharmaceutical, Gilead Sciences and Genzyme were hurt by questionable visibility and industry-wide uncertainty surrounding proposed health care reform legislation. Among medical service providers, Psychiatric Solutions lagged due to a challenging pricing environment, prompting us to sell the fund’s position.
The fund achieved better relative performance in other sectors, enabling it to participate in the market rally to a substantial degree. In the consumer discretionary sector, dining chain Darden Restaurants achieved
4
excellent results by managing costs effectively while attracting cost-conscious consumers.The fund sold its holdings of Darden Restaurants mid-year, avoiding subsequent declines as investors rotated away from the stock. In the sector’s leisure segment, Carnival rebounded from oversold levels when consumers resumed spending on travel.
The materials sector also represented a bright spot in 2009. Chemical producers such as Monsanto, Praxair and Albemarle bolstered the fund’s results as commodity prices and manufacturing activity recovered. Metals-and-mining giant Freeport McMoRan Copper & Gold also gained value along with the underlying price of its products.
Positioned for a Global Economic Recovery
As of the reporting period’s end, the economy appeared to be gaining strength, and we have seen signs that investors have been refocusing on companies with healthy finances and strong business fundamentals, including earnings-growth characteristics. In our judgment, these developments could lead to an investment environment that is especially well suited to our stock selection process. Indeed, we have continued to find attractive opportunities among large-cap growth companies, especially in the consumer discretionary, information technology and health care sectors.We have found fewer opportunities in the traditionally defensive consumer staples sector and the highly cyclical industrials sector.
January 15, 2010
| |
| | Please note, the position in any security highlighted with italicized typeface was sold during the |
| | reporting period. |
| | Part of the fund’s historical performance is due to amounts received from class action |
| | settlements regarding prior fund holdings. There is no guarantee that these settlement |
| | distributions will occur in the future or have a similar impact on performance. |
| 1 | Total return includes reinvestment of dividends and any capital gains paid, and does not take into |
| | consideration the maximum initial sales charge in the case of Class A shares, or the applicable |
| | contingent deferred sales charges imposed on redemptions in the case of Class B and Class C |
| | shares. Had these charges been reflected, returns would have been lower. Past performance is no |
| | guarantee of future results. Share price and investment return fluctuate such that upon redemption, |
| | fund shares may be worth more or less than their original cost. |
| 2 | SOURCE: LIPPER INC. — The Russell 1000 Growth Index is a widely accepted, |
| | unmanaged large-cap index that measures the performance of those Russell 1000 Index |
| | companies with higher price-to-book ratios and higher forecasted growth values.The total return |
| | figure cited for this index assumes change in security prices and reinvestment of dividends, but does |
| | not reflect the costs of managing a mutual fund. |
The Fund 5
FUND PERFORMANCE
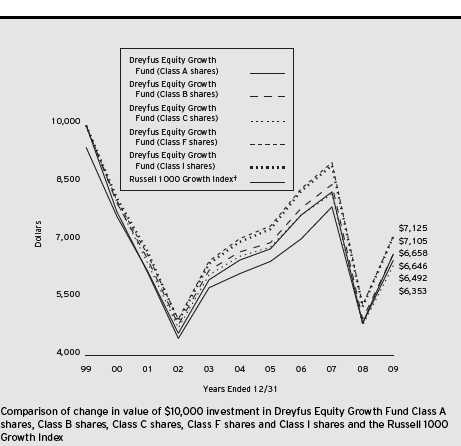
|
| † Source: Lipper Inc. |
| Past performance is not predictive of future performance. |
| The above graph compares a $10,000 investment made in Class A, Class B, Class C, Class F and Class I shares of |
| Dreyfus Equity Growth Fund on 12/31/99 to a $10,000 investment made in the Russell 1000 Growth Index (the |
| “Index”) on that date.All dividends and capital gain distributions are reinvested. |
| The fund’s performance shown in the line graph takes into account the maximum initial sales charge on Class A shares |
| and all other applicable fees and expenses on all classes (after any expense reimbursements).The Index is an unmanaged |
| index which measures the performance of those Russell 1000 companies with higher price-to-book ratios and higher |
| forecasted growth values. Unlike a mutual fund, the Index is not subject to charges, fees and other expenses. Investors |
| cannot invest directly in any index. Further information relating to fund performance, including expense reimbursements, |
| if applicable, is contained in the Financial Highlights section of the prospectus and elsewhere in this report. |
6
| | | |
| Average Annual Total Returns as of 12/31/09 | | | |
| |
| | 1 Year | 5 Years | 10 Years |
| Class A shares | | | |
| with maximum sales charge (5.75%) | 26.26% | –1.20% | –4.23% |
| without sales charge | 33.97% | –0.01% | –3.67% |
| Class B shares | | | |
| with applicable redemption charge † | 28.16% | –1.35% | –4.00% |
| without redemption | 32.16% | –0.95% | –4.00% |
| Class C shares | | | |
| with applicable redemption charge †† | 31.54% | –0.74% | –4.44% |
| without redemption | 32.54% | –0.74% | –4.44% |
| Class F shares | 33.94% | 0.21% | –3.33% |
| Class I shares | 34.54% | 0.38% | –3.36% |
| |
| Past performance is not predictive of future performance.The fund’s performance shown in the graph and table does not |
| reflect the deduction of taxes that a shareholder would pay on fund distributions or the redemption of fund shares, but |
| does reflect expense reimbursements for certain share classes. Part of the fund’s historical performance is due to amounts |
| received from class action settlements regarding prior fund holdings.There is no guarantee that these settlement |
| distributions will occur in the future or have a similar impact on performance. Performance for Class B shares assumes the |
| conversion of Class B shares to Class A shares at the end of the sixth year following the date of purchase. |
| † | The maximum contingent deferred sales charge for Class B shares is 4%.After six years Class B shares convert to |
| | Class A shares. |
| †† | The maximum contingent deferred sales charge for Class C shares is 1% for shares redeemed within one year of the |
| | date of purchase. |
The Fund 7
UNDERSTANDING YOUR FUND’S EXPENSES (Unaudited)
As a mutual fund investor, you pay ongoing expenses, such as management fees and other expenses. Using the information below, you can estimate how these expenses affect your investment and compare them with the expenses of other funds.You also may pay one-time transaction expenses, including sales charges (loads) and redemption fees, which are not shown in this section and would have resulted in higher total expenses. For more information, see your fund’s prospectus or talk to your financial adviser.
Review your fund’s expenses
The table below shows the expenses you would have paid on a $1,000 investment in Dreyfus Equity Growth Fund from July 1, 2009 to December 31, 2009. It also shows how much a $1,000 investment would be worth at the close of the period, assuming actual returns and expenses.
| | | | | |
| Expenses and Value of a $1,000 Investment | | | |
| assuming actual returns for the six months ended December 31, 2009 | | |
| | Class A | Class B | Class C | Class F | Class I |
| Expenses paid per $1,000† | $ 7.18 | $ 12.68 | $ 11.67 | $ 5.77 | $ 4.53 |
| Ending value (after expenses) | $1,243.00 | $1,235.00 | $1,237.60 | $1,242.40 | $1,245.50 |
|
| COMPARING YOUR FUND’S EXPENSES |
| WITH THOSE OF OTHER FUNDS (Unaudited) |
Using the SEC’s method to compare expenses
The Securities and Exchange Commission (SEC) has established guidelines to help investors assess fund expenses. Per these guidelines, the table below shows your fund’s expenses based on a $1,000 investment, assuming a hypothetical 5% annualized return. You can use this information to compare the ongoing expenses (but not transaction expenses or total cost) of investing in the fund with those of other funds.All mutual fund shareholder reports will provide this information to help you make this comparison. Please note that you cannot use this information to estimate your actual ending account balance and expenses paid during the period.
| | | | | |
| Expenses and Value of a $1,000 Investment | | | |
| assuming a hypothetical 5% annualized return for the six months ended December 31, 2009 |
| | Class A | Class B | Class C | Class F | Class I |
| Expenses paid per $1,000† | $ 6.46 | $ 11.42 | $ 10.51 | $ 5.19 | $ 4.08 |
| Ending value (after expenses) | $1,018.80 | $1,013.86 | $1,014.77 | $1,020.06 | $1,021.17 |
† Expenses are equal to the fund’s annualized expense ratio of 1.27% for Class A, 2.25% for Class B, 2.07% for Class C, 1.02% for Class F and .80% for Class I, multiplied by the average account value over the period, multiplied by 184/365 (to reflect the one-half year period).
8
|
| STATEMENT OF INVESTMENTS |
| December 31, 2009 |
| | |
| Common Stocks—99.4% | Shares | Value ($) |
| Consumer Discretionary—12.2% | | |
| Autoliv | 73,000 | 3,165,280 |
| Best Buy | 75,090 | 2,963,051 |
| Carnival | 68,944 a | 2,184,835 |
| Dick’s Sporting Goods | 64,190 a | 1,596,405 |
| Gap | 135,440 | 2,837,468 |
| Home Depot | 97,018 | 2,806,731 |
| Interpublic Group of Cos. | 309,690 a | 2,285,512 |
| Kohl’s | 56,470 a | 3,045,427 |
| Limited Brands | 138,780 | 2,670,127 |
| Newell Rubbermaid | 146,980 | 2,206,170 |
| Nordstrom | 74,580 b | 2,802,716 |
| Staples | 162,830 b | 4,003,990 |
| Target | 98,400 | 4,759,608 |
| Time Warner | 86,736 | 2,527,487 |
| | | 39,854,807 |
| Consumer Staples—13.5% | | |
| Clorox | 68,330 | 4,168,130 |
| Coca-Cola Enterprises | 160,400 | 3,400,480 |
| Colgate-Palmolive | 74,617 | 6,129,787 |
| Energizer Holdings | 55,820 a | 3,420,650 |
| Estee Lauder, Cl. A | 67,410 | 3,259,948 |
| PepsiCo | 181,590 | 11,040,672 |
| Philip Morris International | 179,340 | 8,642,395 |
| SUPERVALU | 131,570 | 1,672,255 |
| Whole Foods Market | 85,850 a,b | 2,356,583 |
| | | 44,090,900 |
| Energy—5.7% | | |
| Cameron International | 48,060 a | 2,008,908 |
| Consol Energy | 37,930 | 1,888,914 |
| EOG Resources | 25,340 | 2,465,582 |
| Halliburton | 65,110 | 1,959,160 |
| Noble Energy | 26,990 | 1,922,228 |
| Occidental Petroleum | 39,430 | 3,207,631 |
The Fund 9
STATEMENT OF INVESTMENTS (continued)
| | |
| Common Stocks (continued) | Shares | Value ($) |
| Energy (continued) | | |
| Southwestern Energy | 66,680 a | 3,213,976 |
| Transocean | 21,580 a | 1,786,824 |
| | | 18,453,223 |
| Financial—3.4% | | |
| BlackRock | 13,250 b | 3,076,650 |
| Discover Financial Services | 97,130 | 1,428,782 |
| Prudential Financial | 32,470 | 1,615,707 |
| T. Rowe Price Group | 92,800 | 4,941,600 |
| | | 11,062,739 |
| Health Care—16.7% | | |
| Abbott Laboratories | 95,860 | 5,175,481 |
| Aetna | 49,810 | 1,578,977 |
| Alexion Pharmaceuticals | 69,920 a | 3,413,494 |
| Amgen | 125,340 a | 7,090,484 |
| Celgene | 56,080 a | 3,122,534 |
| Covidien | 47,867 | 2,292,350 |
| DaVita | 35,340 a | 2,075,872 |
| Gilead Sciences | 73,016 a | 3,160,132 |
| Hospira | 36,360 a | 1,854,360 |
| Human Genome Sciences | 56,960 a | 1,742,976 |
| Medco Health Solutions | 45,410 a | 2,902,153 |
| MEDNAX | 38,190 a | 2,295,601 |
| Merck & Co. | 164,260 | 6,002,060 |
| Pfizer | 148,954 | 2,709,473 |
| Shire, ADR | 29,540 b | 1,733,998 |
| Thermo Fisher Scientific | 42,730 a | 2,037,794 |
| Universal Health | | |
| Services, Cl. B | 75,770 | 2,310,985 |
| Vertex Pharmaceuticals | 66,450 a,b | 2,847,383 |
| | | 54,346,107 |
| Industrial—8.4% | | |
| Caterpillar | 73,030 | 4,161,980 |
| Cummins | 51,400 | 2,357,204 |
| Dover | 73,921 | 3,075,853 |
| Norfolk Southern | 58,020 | 3,041,408 |
| Rockwell Collins | 46,260 | 2,560,954 |
10
| | |
| Common Stocks (continued) | Shares | Value ($) |
| Industrial (continued) | | |
| Tyco International | 91,370 a | 3,260,082 |
| Union Pacific | 60,565 | 3,870,104 |
| United Technologies | 70,030 | 4,860,782 |
| | | 27,188,367 |
| Information Technology—35.6% | | |
| Agilent Technologies | 85,190 a | 2,646,853 |
| AOL | 1 a | 15 |
| Apple | 68,914 a | 14,531,206 |
| Autodesk | 109,410 a | 2,780,108 |
| BMC Software | 95,420 a | 3,826,342 |
| Broadcom, Cl. A | 141,976 a | 4,465,145 |
| Cisco Systems | 480,890 a | 11,512,506 |
| Dolby Laboratories, Cl. A | 34,860 a | 1,663,868 |
| EMC | 173,880 a | 3,037,684 |
| Equinix | 16,700 a,b | 1,772,705 |
| Google, Cl. A | 17,846 a | 11,064,163 |
| Hewlett-Packard | 168,810 | 8,695,403 |
| Informatica | 129,270 a | 3,342,922 |
| Juniper Networks | 158,254 a | 4,220,634 |
| KLA-Tencor | 66,110 | 2,390,538 |
| Microsoft | 533,350 | 16,261,842 |
| Oracle | 302,660 | 7,427,276 |
| Salesforce.com | 46,370 a | 3,420,715 |
| Sybase | 78,860 a | 3,422,524 |
| Teradata | 100,670 a | 3,164,058 |
| VMware, Cl. A | 69,630 a | 2,950,919 |
| Western Union | 171,730 | 3,237,111 |
| | | 115,834,537 |
| Materials—3.9% | | |
| Albemarle | 63,050 | 2,293,128 |
| Alcoa | 227,120 | 3,661,174 |
| Celanese, Ser. A | 105,420 | 3,383,982 |
| CF Industries Holdings | 37,650 | 3,417,867 |
| | | 12,756,151 |
| Total Common Stocks | | |
| (cost $267,554,093) | | 323,586,831 |
The Fund 11
STATEMENT OF INVESTMENTS (continued)
| | |
| Other Investment—.8% | Shares | Value ($) |
| Registered Investment Company; | | |
| Dreyfus Institutional Preferred | | |
| Plus Money Market Fund | | |
| (cost $2,734,000) | 2,734,000 c | 2,734,000 |
| |
| Investment of Cash Collateral | | |
| for Securities Loaned—2.5% | | |
| Registered Investment Company; | | |
| Dreyfus Institutional Cash | | |
| Advantage Fund | | |
| (cost $8,250,076) | 8,250,076 c | 8,250,076 |
| |
| Total Investments (cost $278,538,169) | 102.7% | 334,570,907 |
| Liabilities, Less Cash and Receivables | (2.7%) | (8,846,575) |
| Net Assets | 100.0% | 325,724,332 |
|
| ADR—American Depository Receipts |
| a Non-income producing security. |
| b Security, or portion thereof on loan.At December 31, 2009, the total market value of the fund’s securities on loan is |
| $7,933,364 and the total market value of the collateral held by the fund is $8,250,076. |
| c Investment in affiliated money market mutual fund. |
| | | |
| Portfolio Summary (Unaudited)† | | |
| |
| | Value (%) | | Value (%) |
| Information Technology | 35.6 | Energy | 5.7 |
| Health Care | 16.7 | Materials | 3.9 |
| Consumer Staples | 13.5 | Financial | 3.4 |
| Consumer Discretionary | 12.2 | Money Market Investments | 3.3 |
| Industrial | 8.4 | | 102.7 |
| |
| † Based on net assets. | | | |
| See notes to financial statements. | | | |
12
|
| STATEMENT OF ASSETS AND LIABILITIES |
| December 31, 2009 |
| | | | | |
| | | | | Cost | Value |
| Assets ($): | | | | | |
| Investments in securities—See Statement of Investments (including | | |
| securities on loan, valued at $7,933,364)—Note 1(b): | | | |
| Unaffiliated issuers | | | 267,554,093 | 323,586,831 |
| Affiliated issuers | | | | 10,984,076 | 10,984,076 |
| Dividends and interest receivable | | | | 339,947 |
| Receivable for shares of Common Stock subscribed | | | 28,111 |
| Prepaid expenses | | | | | 69,254 |
| | | | | | 335,008,219 |
| Liabilities ($): | | | | | |
| Due to The Dreyfus Corporation and affiliates—Note 3(c) | | | 319,260 |
| Cash overdraft due to Custodian | | | | 46,215 |
| Liability for securities on loan—Note 1(b) | | | | 8,250,076 |
| Payable for shares of Common Stock redeemed | | | 322,025 |
| Accrued expenses | | | | | 346,311 |
| | | | | | 9,283,887 |
| Net Assets ($) | | | | | 325,724,332 |
| Composition of Net Assets ($): | | | | |
| Paid-in capital | | | | | 440,772,402 |
| Accumulated undistributed investment income—net | | | 183,774 |
| Accumulated net realized gain (loss) on investments | | (171,264,582) |
| Accumulated net unrealized appreciation | | | | |
| (depreciation) on investments | | | | 56,032,738 |
| Net Assets ($) | | | | | 325,724,332 |
| |
| |
| Net Asset Value Per Share | | | | |
| | Class A | Class B | Class C | Class F | Class I |
| Net Assets ($) | 177,423,610 | 320,683 | 3,092,216 | 142,787,107 | 2,100,716 |
| Shares Outstanding | 36,830,110 | 70,907 | 689,756 | 28,934,162 | 429,022 |
| Net Asset Value | | | | | |
| Per Share ($) | 4.82 | 4.52 | 4.48 | 4.93 | 4.90 |
| |
| See notes to financial statements. | | | | |
The Fund 13
|
| STATEMENT OF OPERATIONS |
| Year Ended December 31, 2009 |
| |
| Investment Income ($): | |
| Income: | |
| Dividends (net of $270 foreign taxes withheld at source): | |
| Unaffiliated issuers | 4,300,158 |
| Affiliated issuers | 4,934 |
| Income from securities lending—Note 1(b) | 34,423 |
| Total Income | 4,339,515 |
| Expenses: | |
| Management fee—Note 3(a) | 1,898,726 |
| Shareholder servicing costs—Note 3(c) | 1,017,594 |
| Accounting fees—Note 3(c) | 217,310 |
| Professional fees | 124,991 |
| Directors’ fees and expenses—Note 3(d) | 94,649 |
| Distribution fees—Note 3(b) | 73,562 |
| Registration fees | 53,048 |
| Prospectus and shareholders’ reports | 45,015 |
| Custodian fees—Note 3(c) | 8,222 |
| Loan commitment fees—Note 2 | 1,867 |
| Interest expense—Note 2 | 1,274 |
| Miscellaneous | 83,377 |
| Total Expenses | 3,619,635 |
| Less—reduction in fees due to earnings credits—Note 1(b) | (51,375) |
| Net Expenses | 3,568,260 |
| Investment Income—Net | 771,255 |
| Realized and Unrealized Gain (Loss) on Investments—Note 4 ($): | |
| Net realized gain (loss) on investments | (49,298,470) |
| Net unrealized appreciation (depreciation) on investments | 137,374,652 |
| Net Realized and Unrealized Gain (Loss) on Investments | 88,076,182 |
| Net Increase in Net Assets Resulting from Operations | 88,847,437 |
| |
| See notes to financial statements. | |
14
STATEMENT OF CHANGES IN NET ASSETS
| | |
| | Year Ended December 31, |
| | 2009a | 2008 |
| Operations ($): | | |
| Investment income—net | 771,255 | 989,924 |
| Net realized gain (loss) on investments | (49,298,470) | (69,677,039) |
| Net unrealized appreciation | | |
| (depreciation) on investments | 137,374,652 | (144,001,123) |
| Net Increase (Decrease) in Net Assets | | |
| Resulting from Operations | 88,847,437 | (212,688,238) |
| Dividends to Shareholders from ($): | | |
| Investment income—net: | | |
| Class A Shares | (110,755) | (253,070) |
| Class F Shares | (680,875) | (694,566) |
| Class I Shares | (12,613) | (8,768) |
| Total Dividends | (804,243) | (956,404) |
| Capital Stock Transactions ($): | | |
| Net proceeds from shares sold: | | |
| Class A Shares | 7,601,144 | 13,581,804 |
| Class B Shares | 1,834 | 21,617 |
| Class C Shares | 315,444 | 690,704 |
| Class F Shares | 1,779,617 | 4,904,299 |
| Class I Shares | 640,328 | 516,988 |
| Class T Shares | 2,500 | 43,194 |
| Dividends reinvested: | | |
| Class A Shares | 105,531 | 241,943 |
| Class F Shares | 601,276 | 615,939 |
| Class I Shares | 11,530 | 8,768 |
| Cost of shares redeemed: | | |
| Class A Shares | (34,966,953) | (56,638,264) |
| Class B Shares | (281,302) | (813,417) |
| Class C Shares | (966,649) | (3,653,876) |
| Class F Shares | (19,895,195) | (23,931,484) |
| Class I Shares | (352,939) | (1,546,766) |
| Class T Shares | (45,740) | (39,492) |
| Increase (Decrease) in Net Assets | | |
| from Capital Stock Transactions | (45,449,574) | (65,998,043) |
| Total Increase (Decrease) in Net Assets | 42,593,620 | (279,642,685) |
| Net Assets ($): | | |
| Beginning of Period | 283,130,712 | 562,773,397 |
| End of Period | 325,724,332 | 283,130,712 |
| Undistributed investment income—net | 183,774 | 216,762 |
The Fund 15
STATEMENT OF CHANGES IN NET ASSETS (continued)
| | |
| | Year Ended December 31, |
| | 2009a | 2008 |
| Capital Share Transactions: | | |
| Class Ab,c | | |
| Shares sold | 1,987,119 | 2,708,902 |
| Shares issued for dividends reinvested | 21,759 | 55,288 |
| Shares redeemed | (8,533,785) | (11,085,799) |
| Net Increase (Decrease) in Shares Outstanding | (6,524,907) | (8,321,609) |
| Class Bb | | |
| Shares sold | 451 | 4,191 |
| Shares redeemed | (79,207) | (169,950) |
| Net Increase (Decrease) in Shares Outstanding | (78,756) | (165,759) |
| Class C | | |
| Shares sold | 95,045 | 152,046 |
| Shares redeemed | (249,847) | (796,147) |
| Net Increase (Decrease) in Shares Outstanding | (154,802) | (644,101) |
| Class F | | |
| Shares sold | 443,473 | 977,734 |
| Shares issued for dividends reinvested | 138,897 | 163,708 |
| Shares redeemed | (4,659,408) | (4,684,301) |
| Net Increase (Decrease) in Shares Outstanding | (4,077,038) | (3,542,859) |
| Class I | | |
| Shares sold | 149,599 | 99,593 |
| Shares issued for dividends reinvested | 2,701 | 2,436 |
| Shares redeemed | (94,856) | (277,684) |
| Net Increase (Decrease) in Shares Outstanding | 57,444 | (175,655) |
| Class Tc | | |
| Shares sold | 799 | 8,672 |
| Shares redeemed | (14,253) | (7,826) |
| Net Increase (Decrease) in Shares Outstanding | (13,454) | 846 |
| |
| a | Effective as of the close of business on February 4, 2009, the fund no longer offers Class T shares. |
| b | During the period ended December 31, 2009, 25,581 Class B shares representing $95,932 were automatically |
| | converted to 24,116 Class A shares and during the period ended December 31, 2008, 65,665 Class B shares |
| | representing $337,212 were automatically converted to 62,632 Class A shares. |
| c | On the close of business on February 4, 2009, 13,911 Class T shares representing $44,654 were converted to |
| | 12,943 Class A shares. |
| See notes to financial statements. |
16
FINANCIAL HIGHLIGHTS
The following tables describe the performance for each share class for the fiscal periods indicated.All information (except portfolio turnover rate) reflects financial results for a single fund share.Total return shows how much your investment in the fund would have increased (or decreased) during each period, assuming you had reinvested all dividends and distributions.These figures have been derived from the fund’s financial statements.
| | | | | |
| | | Year Ended December 31, | |
| Class A Shares | 2009† | 2008 | 2007 | 2006 | 2005 |
| Per Share Data ($): | | | | | |
| Net asset value, beginning of period | 3.60 | 6.15 | 5.72 | 5.07 | 4.86 |
| Investment Operations: | | | | | |
| Investment income (loss)—neta | .01 | .01 | .01 | .00b | (.00)b |
| Net realized and unrealized | | | | | |
| gain (loss) on investments | 1.21 | (2.55) | .44 | .66 | .22 |
| Total from Investment Operations | 1.22 | (2.54) | .45 | .66 | .22 |
| Distributions: | | | | | |
| Dividends from investment income—net | (.00)b | (.01) | (.02) | (.01) | (.01) |
| Net asset value, end of period | 4.82 | 3.60 | 6.15 | 5.72 | 5.07 |
| Total Return (%)c | 33.97 | (41.39) | 7.81 | 13.02 | 4.46 |
| Ratios/Supplemental Data (%): | | | | | |
| Ratio of total expenses | | | | | |
| to average net assets | 1.32 | 1.25 | 1.19 | 1.34 | 1.35 |
| Ratio of net expenses | | | | | |
| to average net assets | 1.31 | 1.23 | 1.19d | 1.34d | 1.33 |
| Ratio of net investment income | | | | | |
| (loss) to average net assets | .16 | .12 | .14 | .00e | (.09) |
| Portfolio Turnover Rate | 162.04 | 112 | 68 | 110 | 126 |
| Net Assets, end of period ($ x 1,000) | 177,424 | 156,236 | 317,753 | 4,399 | 1,266 |
| |
| † | Effective September 1, 2009,The Dreyfus Corporation replaced Founders Asset Management LLC as the fund’s |
| | investment adviser. |
| a | Based on average shares outstanding at each month end. |
| b | Amount represents less than $.01 per share. |
| c | Exclusive of sales charge. |
| d | Expense waivers and/or reimbursements amounted to less than .01%. |
| e | Amount represents less than .01%. |
| See notes to financial statements. |
The Fund 17
FINANCIAL HIGHLIGHTS (continued)
| | | | | |
| | | Year Ended December 31, | |
| Class B Shares | 2009† | 2008 | 2007 | 2006 | 2005 |
| Per Share Data ($): | | | | | |
| Net asset value, beginning of period | 3.42 | 5.88 | 5.51 | 4.91 | 4.74 |
| Investment Operations: | | | | | |
| Investment (loss)—neta | (.04) | (.04) | (.04) | (.05) | (.04) |
| Net realized and unrealized | | | | | |
| gain (loss) on investments | 1.14 | (2.42) | .41 | .65 | .21 |
| Total from Investment Operations | 1.10 | (2.46) | .37 | .60 | .17 |
| Net asset value, end of period | 4.52 | 3.42 | 5.88 | 5.51 | 4.91 |
| Total Return (%)b | 32.16 | (41.84) | 6.72 | 12.22 | 3.59 |
| Ratios/Supplemental Data (%): | | | | | |
| Ratio of total expenses | | | | | |
| to average net assets | 2.50 | 2.12 | 2.24 | 2.21 | 2.19 |
| Ratio of net expenses | | | | | |
| to average net assets | 2.48 | 2.10 | 2.24c | 2.21c | 2.18 |
| Ratio of net investment | | | | | |
| (loss) to average net assets | (.97) | (.78) | (.76) | (.93) | (.97) |
| Portfolio Turnover Rate | 162.04 | 112 | 68 | 110 | 126 |
| Net Assets, end of period ($ x 1,000) | 321 | 512 | 1,855 | 1,046 | 1,453 |
| |
| † | Effective September 1, 2009,The Dreyfus Corporation replaced Founders Asset Management LLC as the fund’s |
| | investment adviser. |
| a | Based on average shares outstanding at each month end. |
| b | Exclusive of sales charge. |
| c | Expense waivers and/or reimbursements amounted to less than .01%. |
| See notes to financial statements. |
18
| | | | | |
| | | Year Ended December 31, | |
| Class C Shares | 2009† | 2008 | 2007 | 2006 | 2005 |
| Per Share Data ($): | | | | | |
| Net asset value, beginning of period | 3.38 | 5.80 | 5.41 | 4.82 | 4.66 |
| Investment Operations: | | | | | |
| Investment (loss)—neta | (.02) | (.03) | (.03) | (.03) | (.03) |
| Net realized and unrealized | | | | | |
| gain (loss) on investments | 1.12 | (2.39) | .42 | .62 | .20 |
| Total from Investment Operations | 1.10 | (2.42) | .39 | .59 | .17 |
| Distributions: | | | | | |
| Dividends from investment income—net | — | — | — | — | (.01) |
| Net asset value, end of period | 4.48 | 3.38 | 5.80 | 5.41 | 4.82 |
| Total Return (%)b | 32.54 | (41.72) | 7.21 | 12.24 | 3.68 |
| Ratios/Supplemental Data (%): | | | | | |
| Ratio of total expenses | | | | | |
| to average net assets | 2.12 | 1.99 | 1.97 | 2.01 | 1.98 |
| Ratio of net expenses | | | | | |
| to average net assets | 2.10 | 1.97 | 1.97c | 2.01c | 1.96 |
| Ratio of net investment (loss) | | | | | |
| to average net assets | (.63) | (.64) | (.45) | (.69) | (.72) |
| Portfolio Turnover Rate | 162.04 | 112 | 68 | 110 | 126 |
| Net Assets, end of period ($ x 1,000) | 3,092 | 2,853 | 8,628 | 3,759 | 2,012 |
| |
| † | Effective September 1, 2009,The Dreyfus Corporation replaced Founders Asset Management LLC as the fund’s |
| | investment adviser. |
| a | Based on average shares outstanding at each month end. |
| b | Exclusive of sales charge. |
| c | Expense waivers and/or reimbursements amounted to less than .01%. |
| See notes to financial statements. |
The Fund 19
FINANCIAL HIGHLIGHTS (continued)
| | | | | |
| | | Year Ended December 31, | |
| Class F Shares | 2009† | 2008 | 2007 | 2006 | 2005 |
| Per Share Data ($): | | | | | |
| Net asset value, beginning of period | 3.70 | 6.32 | 5.86 | 5.18 | 4.96 |
| Investment Operations: | | | | | |
| Investment income—neta | .02 | .02 | .03 | .01 | .00b |
| Net realized and unrealized | | | | | |
| gain (loss) on investments | 1.23 | (2.62) | .45 | .68 | .23 |
| Total from Investment Operations | 1.25 | (2.60) | .48 | .69 | .23 |
| Distributions: | | | | | |
| Dividends from investment income—net | (.02) | (.02) | (.02) | (.01) | (.01) |
| Net asset value, end of period | 4.93 | 3.70 | 6.32 | 5.86 | 5.18 |
| Total Return (%) | 33.94 | (41.13) | 8.14 | 13.25 | 4.64 |
| Ratios/Supplemental Data (%): | | | | | |
| Ratio of total expenses | | | | | |
| to average net assets | 1.08 | .96 | 1.04 | 1.10 | 1.13 |
| Ratio of net expenses | | | | | |
| to average net assets | 1.06 | .94 | 1.04c | 1.10c | 1.12 |
| Ratio of net investment income | | | | | |
| to average net assets | .41 | .41 | .54 | .20 | .11 |
| Portfolio Turnover Rate | 162.04 | 112 | 68 | 110 | 126 |
| Net Assets, end of period ($ x 1,000) | 142,787 | 122,119 | 231,030 | 220,502 | 215,556 |
| |
| † | Effective September 1, 2009,The Dreyfus Corporation replaced Founders Asset Management LLC as the fund’s |
| | investment adviser. |
| a | Based on average shares outstanding at each month end. |
| b | Amount represents less than $.01 per share. |
| c | Expense waivers and/or reimbursements amounted to less than .01%. |
| See notes to financial statements. |
20
| | | | | |
| | | Year Ended December 31, | |
| Class I Shares | 2009† | 2008 | 2007a | 2006 | 2005 |
| Per Share Data ($): | | | | | |
| Net asset value, beginning of period | 3.67 | 6.28 | 5.82 | 5.13 | 4.91 |
| Investment Operations: | | | | | |
| Investment income—netb | .02 | .03 | .03 | .01 | .01 |
| Net realized and unrealized | | | | | |
| gain (loss) on investments | 1.24 | (2.62) | .45 | .69 | .22 |
| Total from Investment Operations | 1.26 | (2.59) | .48 | .70 | .23 |
| Distributions: | | | | | |
| Dividends from investment income—net | (.03) | (.02) | (.02) | (.01) | (.01) |
| Net asset value, end of period | 4.90 | 3.67 | 6.28 | 5.82 | 5.13 |
| Total Return (%) | 34.54 | (41.08) | 8.09 | 13.55 | 4.78 |
| Ratios/Supplemental Data (%): | | | | | |
| Ratio of total expenses | | | | | |
| to average net assets | .96 | .89 | 1.09 | 1.04 | 1.10 |
| Ratio of net expenses | | | | | |
| to average net assets | .94 | .81 | .96 | 1.04c | 1.09 |
| Ratio of net investment income | | | | | |
| to average net assets | .53 | .54 | .48 | .21 | .15 |
| Portfolio Turnover Rate | 162.04 | 112 | 68 | 110 | 126 |
| Net Assets, end of period ($ x 1,000) | 2,101 | 1,365 | 3,434 | 97 | 270 |
| |
| † | Effective September 1, 2009,The Dreyfus Corporation replaced Founders Asset Management LLC as the fund’s |
| | investment adviser. |
| a | Effective June 1, 2007, Class R shares were redesignated as Class I shares. |
| b | Based on average shares outstanding at each month end. |
| c | Expense waivers and/or reimbursements amounted to less than .01%. |
| See notes to financial statements. |
The Fund 21
NOTES TO FINANCIAL STATEMENTS
NOTE 1—Significant Accounting Policies:
Dreyfus Equity Growth Fund (the “fund”) is a separate diversified series of Dreyfus Funds, Inc. (the “Company”), which is registered under the Investment Company Act of 1940, as amended (the “Act”), as an open-end management investment company and operates as a series company currently offering three series, including the fund.The fund’s investment objective seeks long-term growth of capital. Prior to September 1, 2009, Founders Asset Management LLC, an indirect wholly-owned subsidiary of The Bank of New York Mellon Corporation (“BNY Mellon”), served as the fund’s investment adviser. Effective September 1, 2009,The Dreyfus Corporation (the “Manager” or “Dreyfus”), a wholly-owned subsidiary of BNY Mellon, serves as the fund’s investment adviser.
MBSC Securities Corporation (the “Distributor”), a wholly-owned subsidiary of the Manager, is the distributor of the fund’s shares. The fund is authorized to issue 2.15 billion shares of $.001 par value Common Stock.The fund currently offers five classes of shares: Class A (1 billion shares authorized), Class B (50 million shares authorized), Class C (250 million shares authorized), Class F (700 million shares authorized) and Class I (150 million shares authorized). Class A shares are subject to a sales charge imposed at the time of purchase. Class B shares are subject to a contingent deferred sales charge (“CDSC”) imposed on Class B share redemptions made within six years of purchase and automatically convert to Class A shares after six years. The fund does not offer Class B shares, except in connection with dividend reinvestment and permitted exchanges of Class B shares. Class C shares are subject to a CDSC imposed on Class C shares redeemed within one year of purchase. Class F and Class I shares are sold at net asset value per share. Class F shares are sold only to Class F grandfathered investors, and Class I shares are sold only to institutional investors. Other differences between the classes include the services offered to and the expenses borne by each class, the allocation of certain transfer agency costs and certain voting rights. Income, expenses (other than expenses attributable to a specific class), and realized and unrealized gains or losses on investments are allocated to each class of shares based on its relative net assets.
22
Effective December 3, 2008, investments for new accounts were no longer permitted in Class T shares of the fund, except that participants in certain group retirement plans were able to open a new account in Class T shares of the fund, provided that the fund was established as an investment option under the plans before December 3, 2008. On February 4, 2009, the fund issued to each holder of its Class T shares, in exchange for said shares, Class A shares of the fund having an aggregate net asset value equal to the aggregate net asset value of the shareholder’s Class T shares. Subsequent investments in the fund’s Class A shares made by prior holders of the fund’s Class T shares who received Class A shares of the fund in exchange for their Class T shares are subject to the front-end sales load schedule that was in effect for Class T shares at the time of the exchange. Otherwise, all other Class A share attributes wi ll be in effect. Effective as of the close of business on February 4, 2009, the fund no longer offers Class T shares.
The Company accounts separately for the assets, liabilities and operations of each series. Expenses directly attributable to each series are charged to that series’ operations; expenses which are applicable to all series are allocated among them on a pro rata basis.
The Financial Accounting Standards Board (“FASB”) Accounting Standards Codification (“ASC”) has become the exclusive reference of authoritative U.S. generally accepted accounting principles (“GAAP”) recognized by the FASB to be applied by nongovernmental entities. Rules and interpretive releases of the Securities and Exchange Commission (“SEC”) under authority of federal laws are also sources of authoritative GAAP for SEC registrants. The ASC has superseded all existing non-SEC accounting and reporting standards. The fund’s financial statements are prepared in accordance with GAAP, which may require the use of management estimates and assumptions.Actual results could differ from those estimates.
The Company enters into contracts that contain a variety of indemnifications. The fund’s maximum exposure under these arrangements is unknown.The fund does not anticipate recognizing any loss related to these arrangements.
The Fund 23
NOTES TO FINANCIAL STATEMENTS (continued)
(a) Portfolio valuation: Investments in securities are valued at the last sales price on the securities exchange or national securities market on which such securities are primarily traded. Securities listed on the National Market System for which market quotations are available are valued at the official closing price or, if there is no official closing price that day, at the last sales price. Securities not listed on an exchange or the national securities market, or securities for which there were no transactions, are valued at the average of the most recent bid and asked prices, except for open short positions, where the asked price is used for valuation purposes. Bid price is used when no asked price is available. Registered investment companies that are not traded on an exchange are valued at their net asset value. When market quotations or offici al closing prices are not readily available, or are determined not to reflect accurately fair value, such as when the value of a security has been significantly affected by events after the close of the exchange or market on which the security is principally traded (for example, a foreign exchange or market),but before the fund calculates its net asset value,the fund may value these investments at fair value as determined in accordance with the procedures approved by the Board of Directors. Fair valuing of securities may be determined with the assistance of a pricing service using calculations based on indices of domestic securities and other appropriate indicators, such as prices of relevant ADRs and futures contracts. For other securities that are fair valued by the Board of Directors, certain factors may be considered such as: fundamental analytical data, the nature and duration of restrictions on disposition, an evaluation of the forces that influence the market in which the securities are purchased and sold, and public trading in similar securities of the issuer or comparable issuers.
The fair value of a financial instrument is the amount that would be received to sell an asset or paid to transfer a liability in an orderly transaction between market participants at the measurement date (i.e. the exit price). GAAP establishes a fair value hierarchy that prioritizes the inputs of valuation techniques used to measure fair value.This hierarchy gives the highest priority to unadjusted quoted prices in active
24
markets for identical assets or liabilities (Level 1 measurements) and the lowest priority to unobservable inputs (Level 3 measurements).
Additionally, GAAP provides guidance on determining whether the volume and activity in a market has decreased significantly and whether such a decrease in activity results in transactions that are not orderly. GAAP requires enhanced disclosures around valuation inputs and techniques used during annual and interim periods.
Various inputs are used in determining the value of the fund’s investments relating to fair value measurements.These inputs are summarized in the three broad levels listed below:
Level 1—unadjusted quoted prices in active markets for identical investments.
Level 2—other significant observable inputs (including quoted prices for similar investments, interest rates, prepayment speeds, credit risk, etc.).
Level 3—significant unobservable inputs (including the fund’s own assumptions in determining the fair value of investments).
The inputs or methodology used for valuing securities are not necessarily an indication of the risk associated with investing in those securities.
The following is a summary of the inputs used as of December 31, 2009 in valuing the fund’s investments:
| | | | |
| | | Level 2—Other | Level 3— | |
| | Level 1— | Significant | Significant | |
| | Unadjusted | Observable | Unobservable | |
| | Quoted Prices | Inputs | Inputs | Total |
| Assets ($) | | | | |
| Investments in Securities: | | | |
| Equity Securities— | | | | |
| Domestic† | 318,687,553 | — | — | 318,687,553 |
| Equity Securities— | | | | |
| Foreign† | 4,899,278 | — | — | 4,899,278 |
| Mutual Funds | 10,984,076 | — | — | 10,984,076 |
| † See Statement of Investments for industry classification. | | |
The Fund 25
NOTES TO FINANCIAL STATEMENTS (continued)
(b) Securities transactions and investment income: Securities transactions are recorded on a trade date basis. Realized gains and losses from securities transactions are recorded on the identified cost basis. Dividend income is recognized on the ex-dividend date and interest income, including, where applicable, accretion of discount and amortization of premium on investments, is recognized on the accrual basis.
The fund has arrangements with the custodian and cash management bank whereby the fund may receive earnings credits when positive cash balances are maintained, which are used to offset custody and cash management fees. For financial reporting purposes, the fund includes net earnings credits as an expense offset in the Statement of Operations.
Pursuant to a securities lending agreement with The Bank of New York Mellon, a subsidiary of BNY Mellon and an affiliate of Dreyfus, the fund may lend securities to qualified institutions. It is the fund’s policy that, at origination, all loans are secured by collateral of at least 102% of the value of U.S. securities loaned and 105% of the value of foreign securities loaned. Collateral equivalent to at least 100% of the market value of securities on loan is maintained at all times. Collateral is either in the form of cash, which can be invested in certain money market mutual funds managed by the Manager, U.S. Government and Agency securities or letters of credit.The fund is entitled to receive all income on securities loaned, in addition to income earned as a result of the lending transaction. Although each security loaned is fully collateralized, the fund bears the risk of delay in recovery of, or loss of rights in, the securities loaned should a borrower fail to return the securities in a timely manner. During the period ended December 31, 2009, The Bank of New York Mellon earned $14,753 from lending portfolio securities, pursuant to the securities lending agreement.
(c) Affiliated issuers: Investments in other investment companies advised by the Manager are defined as “affiliated” in the Act.
(d) Dividends to shareholders: Dividends are recorded on the ex-dividend date. Dividends from investment income-net and dividends
26
from net realized capital gains, if any, are normally declared and paid annually, but the fund may make distributions on a more frequent basis to comply with the distribution requirements of the Internal Revenue Code of 1986, as amended (the “Code”).To the extent that net realized capital gains can be offset by capital loss carryovers, it is the policy of the fund not to distribute such gains. Income and capital gain distributions are determined in accordance with income tax regulations, which may differ from GAAP.
(e) Federal income taxes: It is the policy of the fund to continue to qualify as a regulated investment company, if such qualification is in the best interests of its shareholders, by complying with the applicable provisions of the Code, and to make distributions of taxable income sufficient to relieve it from substantially all federal income and excise taxes.
As of and during the period ended December 31, 2009, the fund did not have any liabilities for any uncertain tax positions.The fund recognizes interest and penalties, if any, related to uncertain tax positions as income tax expense in the Statement of Operations. During the period, the fund did not incur any interest or penalties.
Each of the tax years in the four-year period ended December 31, 2009 remains subject to examination by the Internal Revenue Service and state taxing authorities.
At December 31, 2009, the components of accumulated earnings on a tax basis were as follows: undistributed ordinary income $183,774, accumulated capital losses $165,692,151 and unrealized appreciation $50,460,307.
The accumulated capital loss carryover is available for federal income tax purposes to be applied against future net securities profits, if any, realized subsequent to December 31, 2009. If not applied, $50,083,636 of the carryover expires in fiscal 2010, $37,347,074 expires in fiscal 2016 and $78,261,441 expires in fiscal 2017.
The Fund 27
NOTES TO FINANCIAL STATEMENTS (continued)
The tax character of distributions paid to shareholders during the fiscal periods ended December 31, 2009 and December 31, 2008 were as follows: ordinary income $804,243 and $956,404, respectively.
During the period ended December 31, 2009, as a result of permanent book to tax differences, primarily due to the tax treatment for capital loss carryover expiration, the fund increased accumulated net realized gain (loss) on investments by $212,670,448 and decreased paid-in capital by the same amount. Net assets and net asset value per share were not affected by this reclassification.
NOTE 2—Bank Lines of Credit:
The fund participates with other Dreyfus-managed funds in a $225 million unsecured credit facility led by Citibank, N.A. and a $300 million unsecured credit facility provided by The Bank of New York Mellon (each, a “Facility”), each to be utilized primarily for temporary or emergency purposes, including the financing of redemptions. In connection therewith, the fund has agreed to pay its pro rata portion of commitment fees for each Facility. Interest is charged to the fund based on rates determined pursuant to the terms of the respective Facility at the time of borrowing. Prior to May 28, 2009, the Company had a line of credit arrangement (“LOC”) with State Street Bank and Trust Company, to be used for temporary or emergency purposes, primarily for financing redemption payments.The borrowings by each series of the Company were limited to the lesser of (a) $25 million, or (b) the lesser of 25% of the series&# 146; total net assets or the maximum amount which the series was permitted to borrow pursuant to the prospectus, any law or any other agreement. Combined borrowings were subject to the $25 million cap on the total LOC. Each series agreed to pay annual fees and interest on the unpaid balance based on prevailing market rates as defined in the LOC.
The average amount of borrowings outstanding under the Facilities and LOC during the period ended December 31, 2009, was approximately $91,100 with a related weighted average annualized interest rate of 1.40%.
28
NOTE 3—Management Fee and Other Transactions With Affiliates:
(a) Pursuant to a management agreement with the Manager, the management fee is based on the value of the fund’s average daily net assets and is computed at the following annual rates: .65% of the first $250 million, .60% of the next $250 million, .55% of the next $250 million and .50% in excess of $750 million.The fee is payable monthly.
During the period ended December 31, 2009, the Distributor retained $316 from commissions earned on sales of the fund’s Class A shares and $2,530 and $561 from CDSCs on redemptions of the fund’s Class B and Class C shares, respectively.
(b) Under a Distribution Plan (the “Class B, C and T Plan”) adopted pursuant to Rule 12b-1 under the Act, Class B and Class C shares pay and Class T shares paid the Distributor for distributing their shares at an annual rate of .75% of the value of the average daily net assets of Class B and Class C shares and .25% of the value of the average daily net assets of Class T shares. During the period ended December 31, 2009, Class B, Class C and ClassT shares were charged $2,774, $22,896 and $11, respectively, pursuant to the Class B, C and T Plan.
The fund also adopted a Distribution Plan pursuant to Rule 12b-1 under the Act applicable to its Class F shares (the “Class F Plan”). Under the Class F Plan, the fund is authorized to reimburse the Distributor for expenses paid for distributing or servicing its Class F shares at an annual rate of up to .25% of the value of the average daily net assets of the fund’s Class F shares.The Distributor has agreed not to seek reimbursement of any expenses under the Class F Plan other than reimbursements for payments made to brokers and other intermediaries whose customers hold Class F shares (“Third Party Payments”). This commitment applies to any such expenses (other than Third Party Payments) incurred after May 13, 2009.The Distributor may seek reimbursement under the Class F Plan for any such expenses that may have been incurred by the Distributor on or before May 13, 2009, subject to
The Fund 29
NOTES TO FINANCIAL STATEMENTS (continued)
the terms of the Class F Plan.This commitment will continue indefinitely and will not terminate without the prior approval of the fund's Board of Directors. During the period ended December 31, 2009, Class F shares were charged $47,881 pursuant to the Class F Plan.
(c) Under the Shareholder Services Plan, Class A, Class B and Class C shares pay and Class T shares paid the Distributor at an annual rate of .25% of the value of their average daily net assets for the provision of certain services. The services provided may include personal services relating to shareholder accounts, such as answering shareholder inquiries regarding Class A, Class B, Class C and Class T shares and providing reports and other information, and services related to the maintenance of shareholder accounts.The Distributor may make payments to Service Agents (a securities dealer, financial institution or other industry professional) in respect of these services. The Distributor determines the amounts to be paid to Service Agents. During the period ended December 31, 2009, Class A, Class B, Class C and Class T shares were charged $405,838, $92 5, $7,632 and $11, respectively, pursuant to the Shareholder Services Plan.
The Company has a shareholder services agreement with the Distributor, whereby the fund agrees to compensate the Distributor for providing certain shareholder servicing functions to holders of Class F shares. The fund pays the Distributor a monthly fee equal, on an annual basis, of $24.00 per Class F shareholder account considered to be an open account at any time during a given month. During the period ended December 31, 2009, Class F shares were charged $144,469 pursuant to the shareholder services agreement.
The fund compensates Dreyfus Transfer, Inc., a wholly-owned subsidiary of the Manager, under a transfer agency agreement for providing personnel and facilities to perform transfer agency services for the fund. During the period ended December 31, 2009, the fund was charged $162,308 pursuant to the transfer agency agreement, which is included in Shareholder servicing costs in the Statement of Operations.
30
The fund compensates The Bank of New York Mellon under cash management agreements for performing cash management services related to fund subscriptions and redemptions. During the period ended December 31, 2009, the fund was charged $51,375 pursuant to the cash management agreements, which is included in Shareholder servicing costs in the Statement of Operations.These fees were offset by earnings credits pursuant to the cash management agreements.
The fund also compensates The Bank of New York Mellon under a custody agreement for providing custodial services for the fund. During the period ended December 31, 2009, the fund was charged $8,222 pursuant to the custody agreement.
The fund has agreed to compensate the Manager for providing accounting services, administration, compliance monitoring, regulatory and shareholder reporting, as well as related facilities, equipment and clerical help.The fee is based on the fund’s average daily net assets and computed at the following annual rates: .06% of the first $500 million, .04% of the next $500 million and .02% in excess of $1 billion, plus reasonable out-of-pocket expenses.The Manager has contractually agreed in writing to waive any fees received for these services to the extent they exceed its costs in providing the services and a reasonable allocation of the costs incurred by the Manager and its affiliates related to the support and oversight of these services.
During the period ended December 31, 2009, the fund was charged $6,681 for services performed by the Chief Compliance Officer.
The components of “Due to The Dreyfus Corporation and affiliates” in the Statement of Assets and Liabilities consist of: management fees $175,594, Rule 12b-1 distribution plan fees $6,115, shareholder services plan fees $90,202, custodian fees $1,400, chief compliance officer fees $5,011, accounting fees $14,552 and transfer agency per account fees $26,386.
The Fund 31
NOTES TO FINANCIAL STATEMENTS (continued)
(d) The Company’s current Board of Directors were elected as Board members of the Company as of September 1, 2009 (the “Effective Date”). From the Effective Date through December 31, 2009, each Board member received $45,000 per year, plus $6,000 for each joint Board meeting of the Company,The Dreyfus/Laurel Funds, Inc.,The Dreyfus/Laurel Funds Trust, The Dreyfus/Laurel Tax-Free Municipal Funds and Dreyfus Investment Funds (collectively, the “Board Group Open-End Funds”) attended, $2,000 for separate in-person committee meetings attended which were not held in conjunction with a regularly scheduled Board meeting and $1,500 for Board meetings and separate committee meetings attended that were conducted by telephone. Effective January 1, 2010, the Board Group Open-End Funds will pay each Board member who is not an “interested person” of the Company (as defined in the 1940 Act) $60,000 per annum, plus $7,000 per joint Board Group Open-End Funds Board meeting attended, $2,500 for separate in-person committee meetings attended which are not held in conjunction with a regularly scheduled Board meeting and $2,000 for Board meetings and separate committee meetings attended that are conducted by telephone. The Board Group Open-End Funds also reimburse each Board member who is not an “interested person” of the Company (as defined in the 1940 Act) for travel and out-of-pocket expenses.With respect to Board meetings, the Chairman of the Board receives an additional 25% of such compensation (with the exception of reimbursable amounts). With respect to compensation committee meetings from September 1, 2009 to January 1, 2010, the Chair of the compensation committee received $900 per compensation committee meeting, and, effective January 1, 2010, the Chair of each of the Board’s committees, unless the Chair also serves as Chair of the Board, will receive $1,350 per applicable committee meeting. In the event that there is an in-person joint committee meeting or a joint telephone meeting of the Board Group Open-End Funds and Dreyfus HighYield Strategies Fund, the $2,000 or $1,500 fee (prior to January 1, 2010) or the $2,500 or $2,000 fee (effective January 1, 2010), as applicable, is allocated between the Board Group Open-End Funds and Dreyfus
32
High Yield Strategies Fund.The Company’s portion of these fees and expenses are charged and allocated to each series based on net assets. Amounts required to be paid by the Company directly to the non-interested Directors, that would be applied to offset a portion of the management fee to the Manager, are in fact paid directly by the Manager to the non-interested Directors.
NOTE 4—Securities Transactions:
The aggregate amount of purchases and sales of investment securities, excluding short-term securities, during the period ended December 31, 2009, amounted to $471,507,969 and $514,596,180, respectively.
The fund adopted the provisions of ASC Topic 815 “Derivatives and Hedging” which requires qualitative disclosures about objectives and strategies for using derivatives, quantitative disclosures about fair value amounts of gains and losses on derivative instruments and disclosures about credit-risk-related contingent features in derivative agreements. The fund held no derivatives during the period ended December 31, 2009. These disclosures did not impact the notes to the financial statements.
At December 31, 2009, the cost of investments for federal income tax purposes was $284,110,600; accordingly, accumulated net unrealized appreciation on investments was $50,460,307, consisting of $57,831,805 gross unrealized appreciation and $7,371,498 gross unrealized depreciation.
NOTE 5—New Accounting Pronouncement:
In January 2010, FASB issued Accounting Standards Update (“ASU”) No. 2010-06 “Improving Disclosures about Fair Value Measurements”. ASU 2010-06 will require reporting entities to make new disclosures about amounts and reasons for significant transfers in and out of Level 1 and Level 2 fair value measurements as well as inputs and valuation techniques used to measure fair value for both recurring and nonrecur-ring fair value measurements that fall in either Level 2 or Level 3, and
The Fund 33
NOTES TO FINANCIAL STATEMENTS (continued)
information on purchases, sales, issuances and settlements on a gross basis in the reconciliation of activity in Level 3 fair value measurements.The new and revised disclosures are required to be implemented for fiscal years beginning after December 15, 2009 except for the disclosures surrounding purchases, sales, issuances and settlements on a gross basis in the reconciliation of Level 3 fair value measurements, which are effective for fiscal years beginning after December 15, 2010. Management is currently evaluating the impact the adoption of ASU No. 2010-06 may have on the fund’s financial statement disclosures.
NOTE 6—Subsequent Events Evaluation:
Dreyfus has evaluated the need for disclosures and/or adjustments resulting from subsequent events through February 25, 2010, the date the financial statements were issued. This evaluation did not result in any subsequent events that necessitated disclosures and/or adjustments other than the following:
Change in Independent Registered Public Accounting Firm:
Ernst &Young LLP (“E&Y”), an independent registered public accounting firm, was the independent registered public accounting firm for the fund for the fiscal years ended December 31, 2009 and 2008. At the meeting held on February 9, 2010, the Audit Committee and the Board of Directors of the Company engaged KPMG LLP to replace E&Y as the independent registered public accounting firm for the Company.
During the fund’s past two fiscal years: (i) no report on the fund’s financial statements contained an adverse opinion or a disclaimer of opinion, or was qualified or modified as to uncertainty, audit scope, or accounting principles; and (ii) there were no “disagreements” (as such term is used in Item 304 of Regulation S-K) with E&Y on any matter of accounting principles or practices, financial statement disclosure, or auditing scope or procedure, which disagreement(s), if not resolved to the satisfaction of E&Y, would have caused it to make reference to the subject matter of the disagreement(s) in connection with its report.
34
|
| REPORT OF INDEPENDENT REGISTERED |
| PUBLIC ACCOUNTING FIRM |
Shareholders and Board of Directors
Dreyfus Equity Growth Fund
We have audited the accompanying statement of assets and liabilities, including the statement of investments, of Dreyfus Equity Growth Fund (one of the series comprising Dreyfus Funds, Inc.) as of December 31, 2009, and the related statement of operations for the year then ended, the statement of changes in net assets for each of the two years in the period then ended and financial highlights for each of the three years in the period then ended. These financial statements and financial highlights are the responsibility of the Fund’s management. Our responsibility is to express an opinion on these financial statements and financial highlights based on our audits.The financial highlights for the years ended December 31, 2006 and 2005 were audited by other auditors whose report dated February 23, 2007, expressed an unqualified opinion on such financial highlights.
We conducted our audits in accordance with the standards of the Public Company Accounting Oversight Board (United States).Those standards require that we plan and perform the audit to obtain reasonable assurance about whether the financial statements and financial highlights are free of material misstatement.We were not engaged to perform an audit of the Fund’s internal control over financial reporting. Our audits included consideration of internal control over financial reporting as a basis for designing audit procedures that are appropriate in the circumstances, but not for the purpose of expressing an opinion on the effectiveness of the Fund’s internal control over financial reporting. Accordingly, we express no such opinion.An audit also includes examining, on a test basis, evidence supporting the amounts and disclosures in the financial statements and financial highlights, assessing the accounting principles used and significant estimates made by management, and evaluating the overall financial statement presentation. Our procedures included confirmation of securities owned as of December 31, 2009 by correspondence with the custodian and others. We believe that our audits provide a reasonable basis for our opinion.
In our opinion, the 2009, 2008 and 2007 financial statements and financial highlights referred to above present fairly, in all material respects, the financial position of Dreyfus Equity Growth Fund at December 31, 2009, the results of its operations for the year then ended, the changes in its net assets for each of the two years in the period then ended and the financial highlights for each of the three years in the period then ended, in conformity with U.S. generally accepted accounting principles.

New York, New York
February 25, 2010
The Fund 35
IMPORTANT TAX INFORMATION (Unaudited)
In accordance with federal tax law, the fund hereby designates 100% of the ordinary dividends paid during the fiscal year ended December 31, 2009 as qualifying for the corporate dividends received deduction. For the fiscal year ended December 31, 2009, certain dividends paid by the fund may be subject to a maximum tax rate of 15%, as provided for by the Jobs and Growth Tax Relief Reconciliation Act of 2003. Of the distributions paid during the fiscal year, $804,243 represents the maximum amount that may be considered qualified dividend income. Shareholders will receive notification in early 2010 of the percentage applicable to the preparation of their 2009 income tax returns.
PROXY RESULTS (Unaudited)
Dreyfus Funds, Inc. held an annual meeting of shareholders on August 20, 2009.
The proposal considered at the meeting, and the results, are as follows:
| | | |
| | | Shares | |
| | Votes For | | Authority Withheld |
| To elect a new slate of Directors: | | | |
| Joseph S. DiMartino | 71,760,496 | | 6,207,846 |
| James M. Fitzgibbons | 71,630,227 | | 6,338,115 |
| Kenneth A. Himmel | 71,844,526 | | 6,123,816 |
| Stephen J. Lockwood | 71,924,968 | | 6,043,374 |
| Roslyn M. Watson | 71,791,344 | | 6,176,998 |
| Benaree Pratt Wiley | 71,721,801 | | 6,246,541 |
36
OFFICERS OF THE FUND (Unaudited)
BRADLEY J. SKAPYAK, President since January 2010.
Chief Operating Officer and a director of the Manager since June 2009. From April 2003 to June 2009, Mr. Skapyak was the head of the Investment Accounting and Support Department of the Manager. He is an officer of 76 investment companies (comprised of 171 portfolios) managed by the Manager. He is 51 years old and has been an employee of the Manager since February 1988.
PHILLIP N. MAISANO, Executive Vice President since September 2009.
Chief Investment Officer,Vice Chair and a director of the Manager, and an officer of 76 investment companies (comprised of 171 portfolios) managed by the Manager. Mr. Maisano also is an officer and/or Board member of certain other investment management subsidiaries of The Bank of New York Mellon Corporation, each of which is an affiliate of the Manager. He is 62 years old and has been an employee of the Manager since November 2006. Prior to joining the Manager, Mr. Maisano served as Chairman and Chief Executive Officer of EACM Advisors, an affiliate of the Manager, since August 2004.
J. DAVID OFFICER, Vice President since January 2010.
Director of Mellon United National Bank, an affiliate of the Manager, and an officer of 77 investment companies (comprised of 194 portfolios) managed by the Manager. Prior to June 2009, Mr. Officer was Chief Operating Officer,Vice Chairman and a director of the Manager, where he had been employed since April 1998. He is 61 years old.
MICHAEL A. ROSENBERG, Vice President and Secretary since September 2009.
Assistant General Counsel of BNY Mellon, and an officer of 77 investment companies (comprised of 194 portfolios) managed by the Manager. He is 49 years old and has been an employee of the Manager since October 1991.
KIESHA ASTWOOD, Vice President and Assistant Secretary since January 2010.
Counsel of BNY Mellon, and an officer of 77 investment companies (comprised of 194 portfolios) managed by the Manager. She is 36 years old and has been an employee of the Manager since July 1995.
JAMES BITETTO, Vice President and Assistant Secretary since September 2009.
Senior Counsel of BNY Mellon and Secretary of the Manager, and an officer of 77 investment companies (comprised of 194 portfolios) managed by the Manager. He is 43 years old and has been an employee of the Manager since December 1996.
JONI LACKS CHARATAN, Vice President and Assistant Secretary since September 2009.
Senior Counsel of BNY Mellon, and an officer of 77 investment companies (comprised of 194 portfolios) managed by the Manager. She is 54 years old and has been an employee of the Manager since October 1988.
JOSEPH M. CHIOFFI, Vice President and Assistant Secretary since September 2009.
Senior Counsel of BNY Mellon, and an officer of 77 investment companies (comprised of 194 portfolios) managed by the Manager. He is 48 years old and has been an employee of the Manager since June 2000.
KATHLEEN DENICHOLAS, Vice President and Assistant Secretary since January 2010.
Senior Counsel of BNY Mellon, and an officer of 77 investment companies (comprised of 194 portfolios) managed by the Manager. She is 35 years old and has been an employee of the Manager since February 2001.
The Fund 39
OFFICERS OF THE FUND (Unaudited) (continued)
JANETTE E. FARRAGHER, Vice President and Assistant Secretary since September 2009.
Assistant General Counsel of BNY Mellon, and an officer of 77 investment companies (comprised of 194 portfolios) managed by the Manager. She is 47 years old and has been an employee of the Manager since February 1984.
JOHN B. HAMMALIAN, Vice President and Assistant Secretary since September 2009.
Managing Counsel of BNY Mellon, and an officer of 77 investment companies (comprised of 194 portfolios) managed by the Manager. He is 46 years old and has been an employee of the Manager since February 1991.
M. CRISTINA MEISER, Vice President and Assistant Secretary since January 2010.
Senior Counsel of BNY Mellon, and an officer of 77 investment companies (comprised of 194 portfolios) managed by the Manager. She is 39 years old and has been an employee of the Manager since August 2001.
ROBERT R. MULLERY, Vice President and Assistant Secretary since September 2009.
Managing Counsel of BNY Mellon, and an officer of 77 investment companies (comprised of 194 portfolios) managed by the Manager. He is 57 years old and has been an employee of the Manager since May 1986.
JEFF PRUSNOFSKY, Vice President and Assistant Secretary since September 2009.
Managing Counsel of BNY Mellon, and an officer of 77 investment companies (comprised of 194 portfolios) managed by the Manager. He is 44 years old and has been an employee of the Manager since October 1990.
JAMES WINDELS, Treasurer since September 2009.
Director – Mutual Fund Accounting of the Manager, and an officer of 77 investment companies (comprised of 194 portfolios) managed by the Manager. He is 51 years old and has been an employee of the Manager since April 1985.
RICHARD CASSARO, Assistant Treasurer since September 2009.
Senior Accounting Manager – Money Market and Municipal Bond Funds of the Manager, and an officer of 77 investment companies (comprised of 194 portfolios) managed by the Manager. He is 50 years old and has been an employee of the Manager since September 1982.
GAVIN C. REILLY, Assistant Treasurer since September 2009.
Tax Manager of the Investment Accounting and Support Department of the Manager, and an officer of 77 investment companies (comprised of 194 portfolios) managed by the Manager. He is 41 years old and has been an employee of the Manager since April 1991.
ROBERT ROBOL, Assistant Treasurer since September 2006.
Senior Accounting Manager – Fixed Income Funds of the Manager, and an officer of 77 investment companies (comprised of 194 portfolios) managed by the Manager. He is 45 years old and has been an employee of the Manager since October 1988.
ROBERT SALVIOLO, Assistant Treasurer since May 2007.
Senior Accounting Manager – Equity Funds of the Manager, and an officer of 77 investment companies (comprised of 194 portfolios) managed by the Manager. He is 42 years old and has been an employee of the Manager since June 1989.
40
ROBERT SVAGNA, Assistant Treasurer since September 2006.
Senior Accounting Manager – Equity Funds of the Manager, and an officer of 77 investment companies (comprised of 194 portfolios) managed by the Manager. He is 42 years old and has been an employee of the Manager since November 1990.
JOSEPH W. CONNOLLY, Chief Compliance Officer since September 2009.
Chief Compliance Officer of the Manager and The Dreyfus Family of Funds (77 investment companies, comprised of 194 portfolios). From November 2001 through March 2004, Mr. Connolly was first Vice-President, Mutual Fund Servicing for Mellon Global Securities Services. In that capacity, Mr. Connolly was responsible for managing Mellon’s Custody, Fund Accounting and Fund Administration services to third-party mutual fund clients. He is 52 years old and has served in various capacities with the Manager since 1980, including manager of the firm’s Fund Accounting Department from 1997 through October 2001.
WILLIAM GERMENIS, Anti-Money Laundering Compliance Officer since 2002/2003 (Class F shares).
Vice President and Anti-Money Laundering Compliance Officer of the Distributor, and the Anti-Money Laundering Compliance Officer of 73 investment companies (comprised of 190 portfolios) managed by the Manager. He is 39 years old and has been an employee of the Distributor since October 1998.
The Fund 41
Save time. Save paper. View your next shareholder report online as soon as it’s available. Log into www.dreyfus.com and sign up for Dreyfus eCommunications. It’s simple and only takes a few minutes.
The views expressed in this report reflect those of the portfolio manager only through the end of the period covered and do not necessarily represent the views of Dreyfus or any other person in the Dreyfus organization. Any such views are subject to change at any time based upon market or other conditions and Dreyfus disclaims any responsibility to update such views.These views may not be relied on as investment advice and, because investment decisions for a Dreyfus fund are based on numerous factors, may not be relied on as an indication of trading intent on behalf of any Dreyfus fund.
Not FDIC-Insured • Not Bank-Guaranteed • May Lose Value
| | Contents |
| | THE FUND |
| 2 | A Letter from the Chairman and CEO |
| 3 | Discussion of Fund Performance |
| 6 | Fund Performance |
| 8 | Understanding Your Fund’s Expenses |
| 8 | Comparing Your Fund’s Expenses With Those of Other Funds |
| 9 | Statement of Investments |
| 12 | Statement of Assets and Liabilities |
| 13 | Statement of Operations |
| 14 | Statement of Changes in Net Assets |
| 16 | Financial Highlights |
| 21 | Notes to Financial Statements |
| 34 | Report of Independent Registered Public Accounting Firm |
| 35 | Proxy Results |
| 36 | Board Members Information |
| 38 | Officers of the Fund |
| | FOR MORE INFORMATION |
| | Back Cover |
Dreyfus
Mid-Cap Growth Fund
The Fund

A LETTER FROM THE CHAIRMAN AND CEO
Dear Shareholder:
We are pleased to present this annual report for Dreyfus Mid-Cap Growth Fund, covering the 12-month period from January 1, 2009, through December 31, 2009.
The U.S. stock market ended 2009 with a healthy annual gain, but market indices across all capitalization ranges and investment styles remained well below the peaks reached in the fall of 2007.The equity market’s advance was driven by improving investor sentiment as the U.S. economy staged a gradual, but sustained, recovery from the recession and banking crisis that had depressed stock prices at the beginning of the year. After four consecutive quarters of contraction, the U.S. economy returned to growth during the third quarter of 2009, buoyed by greater manufacturing activity to replenish depleted inventories and satisfy export demand. The slumping housing market also showed signs of renewed life later in the year when home sales and prices rebounded modestly. However, economic headwinds remain, including a high unemployment rate and the prospect of anemic consumer spending.
As 2010 begins, our Chief Economist, as well as many securities analysts and portfolio managers have continued to find opportunities and survey potential challenges across a variety of asset classes, including equities. While no one can predict the future, we believe that the 2010 investment environment will likely require a broader range of investment considerations relative to last year. As always, your financial adviser can help you determine the mix of investments that may be best suited to helping you achieve your goals at a level of risk that is comfortable for you.
For information about how the fund performed during the reporting period, as well as market perspectives, we have provided a Discussion of Fund Performance.
Thank you for your continued confidence and support.

Jonathan R. Baum
Chairman and Chief Executive Officer
The Dreyfus Corporation
January 15, 2010
2

DISCUSSION OF FUND PERFORMANCE
For the reporting period of January 1, 2009, through December 31, 2009, as provided by Fred A. Kuehndorf, Portfolio Manager
Fund and Market Performance Overview
For the 12-month period ended December 31, 2009, Dreyfus Mid-Cap Growth Fund’s Class A shares produced a total return of 26.18%, Class B shares returned 24.66%, Class C shares returned 25.34%, Class F shares returned 26.38% and Class I shares returned 26.54%.1 In comparison, the fund’s benchmark, the Russell Midcap Growth Index (the “Index”), produced a total return of 46.29% for the same period.2
A sustained market rally during much of 2009 stood in stark contrast to steep declines early in the year, as economic conditions and credit markets stabilized in the wake of a global financial crisis and recession. The fund produced lower returns than its benchmark, primarily due to its focus on higher-quality companies at a time when more speculative stocks led the rebound.
The Fund’s Investment Approach
The fund seeks capital appreciation by emphasizing investments in equity securities of midcap companies with favorable growth prospects. The fund will normally invest at least 80% of its net assets in equity securities of companies within the market capitalization range of companies comprising the Russell Midcap Growth Index.The fund also may invest in larger or smaller companies if they represent better prospects for capital appreciation.We look for companies whose fundamental strengths suggest the potential for superior earnings growth over time. We go beyond Wall Street analysis and perform intensive qualitative and quantitative in-house research to determine whether companies meet our investment criteria.
Equity Markets Rebounded Sharply
During the winter of 2008 and into 2009, equity markets were still reeling from a global financial crisis that nearly led to the collapse of the worldwide banking system. In addition, rising unemployment and declining housing markets had produced the most severe recession since
The Fund 3
DISCUSSION OF FUND PERFORMANCE (continued)
the 1930s. These influences fueled a bear market that drove midcap growth stocks to multi-year lows during the first quarter of the year.
Market sentiment began to improve in March, when it became clearer that aggressive remedial actions by government and monetary authorities had helped repair the world’s credit markets. Subsequently, evidence of improving business conditions—including a return to economic growth in the third quarter of the year after four consecutive quarters of contraction—also helped propel stocks higher through year-end.Midcap growth stocks proved to be one of the stronger segments of the market in 2009, as investors shifted their attention away from traditionally defensive investments toward stocks that had been punished severely in the downturn and appeared poised to benefit from a resumption of economic growth.
Quality Bias Dampened Results in Market Rebound
While the fundamentally sound growth companies on which the fund focuses rebounded to a substantial degree during the year, the market rally was dominated by lower-quality stocks, and the fund lagged market averages as a result. Returns were particularly disappointing in the health care sector, where biotechnology firm BioMarin Pharmaceutical was hurt by product development issues, prompting us to sell the fund’s position. Martek Biosciences also was affected by general weakness in the biotechnology industry, and Masimo Corporation, which produces patient monitoring equipment, suffered when hospitals cut spending in the recession.
The consumer discretionary sector was one of 2009’s better performers for the benchmark, and an overweighted position helped the fund participate in the sector’s relative strength. However, lagging returns from apparel maker Gildan Activewear, off-road vehicles maker Polaris Industries and swimming pool supplies provider Pool Corp. more than offset above-average results from online travel services provider Priceline.com, DVD rental company NetFlix, clothing seller Guess?, discount retailer TJX Cos. and home goods chain Bed Bath & Beyond. The fund’s underweighted exposure to the materials sector, where few stocks met our investment criteria, also detracted from relative performance. Finally, competitive pressures hurt the stock price of mobile telecommunications provider MetroPCS Communications.
4
On a more positive note, the fund received stronger contributions to performance from energy stocks, where overweighted exposure to the sector helped the fund benefit from rising commodity prices. Results were particularly robust from energy services providers Noble and Cameron International, coal producer Consol Energy, and natural gas specialist Southwestern Energy. In other market sectors, top performers included industrial companies Joy Global and Flowserve, as well as information technology businesses Akamai Technologies, Shanda Interactive Entertainment, Baidu and Broadcom.
Finding Growth Opportunities in a Mild Recovery
Although economic conditions clearly have improved, it appears to us that the stock market at year-end 2009 has already reflected optimistic investor expectations for continued economic recovery and higher corporate earnings. In addition, we are wary regarding the potential effect on stock prices of the possibility of higher short-term interest rates. Consequently, we have maintained the fund’s underweighted exposure to financial stocks, but we have found a number of attractive growth opportunities in the consumer discretionary and technology sectors, which we believe are poised to benefit from better global economic conditions in 2010.
| |
| January 15, 2010 |
| |
| | Please note, the position in any security highlighted with italicized typeface was sold during the |
| | reporting period. |
| | Midsize companies carry additional risks because their earnings and revenues tend to be |
| | less predictable and their share prices more volatile than those of larger, more established |
| | companies. The shares of midsize companies tend to trade less frequently than those of |
| | larger, more established companies. |
| 1 | Total return includes reinvestment of dividends and any capital gains paid, and does not take into |
| | consideration the maximum initial sales charges in the case of Class A shares, or the applicable |
| | contingent deferred sales charges imposed on redemptions in the case of Class B and Class C |
| | shares. Had these charges been reflected, returns would have been lower. Past performance is no |
| | guarantee of future results. Share price and investment return fluctuate such that upon redemption, |
| | fund shares may be worth more or less than their original cost. |
| 2 | SOURCE: LIPPER INC. — The Russell Midcap Growth Index measures the performance of |
| | the 800 smallest companies in the Russell 1000 Index with higher price-to-book ratios and |
| | higher forecasted growth values.The total return figure cited for this index assumes change in |
| | security prices and reinvestment of dividends, but does not reflect the costs of managing a mutual |
| | fund.The Russell 1000 Index measures the performance of the largest 1,000 publicly traded |
| | U.S. companies. |
The Fund 5
FUND PERFORMANCE
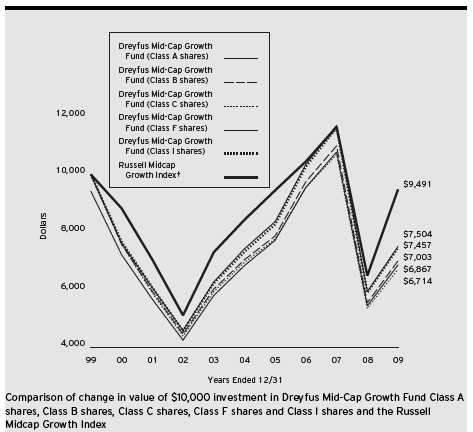
† Source: Lipper Inc.
Past performance is not predictive of future performance.
The above graph compares a $10,000 investment made in Class A, Class B, Class C, Class F and Class I shares of Dreyfus Mid-Cap Growth Fund on 12/31/99 to a $10,000 investment made in the Russell Midcap Growth Index (the “Index”) on that date. All dividends and capital gain distributions are reinvested.
The fund’s performance shown in the line graph takes into account the maximum initial sales charge on Class A shares and all other applicable fees and expenses on all classes (after any expense reimbursements).The Index measures the performance of those companies among the 800 smallest companies in the Russell 1000 Index with higher price-to-book ratios and higher forecasted growth values.The Russell 1000 Index measures the performance of the largest 1,000 publicly traded U.S. companies. Unlike a mutual fund, the Index is not subject to charges, fees and other expenses. Investors cannot invest directly in any index. Further information relating to fund performance, including expense reimbursements, if applicable, is contained in the Financial Highlights section of the prospectus and elsewhere in this report.
6
| | | |
| Average Annual Total Returns as of 12/31/09 | | | |
| |
| | 1 Year | 5 Years | 10 Years |
| Class A shares | | | |
| with maximum sales charge (5.75%) | 19.05% | –1.09% | –3.69% |
| without sales charge | 26.18% | 0.08% | –3.12% |
| Class B shares | | | |
| with applicable redemption charge † | 20.66% | –1.18% | –3.50% |
| without redemption | 24.66% | –0.79% | –3.50% |
| Class C shares | | | |
| with applicable redemption charge †† | 24.34% | –0.70% | –3.91% |
| without redemption | 25.34% | –0.70% | –3.91% |
| Class F shares | 26.38% | 0.22% | –2.83% |
| Class I shares | 26.54% | 0.37% | –2.89% |
| |
| Past performance is not predictive of future performance.The fund’s performance shown in the graph and table does not |
| reflect the deduction of taxes that a shareholder would pay on fund distributions or the redemption of fund shares. |
| Performance for Class B shares assumes the conversion of Class B shares to Class A shares at the end of the sixth year |
| following the date of purchase. |
| † | The maximum contingent deferred sales charge for Class B shares is 4%. After six years Class B shares convert to |
| | Class A shares. |
| †† | The maximum contingent deferred sales charge for Class C shares is 1% for shares redeemed within one year of the |
| | date of purchase. |
The Fund 7
UNDERSTANDING YOUR FUND’S EXPENSES (Unaudited)
As a mutual fund investor, you pay ongoing expenses, such as management fees and other expenses. Using the information below, you can estimate how these expenses affect your investment and compare them with the expenses of other funds.You also may pay one-time transaction expenses, including sales charges (loads) and redemption fees, which are not shown in this section and would have resulted in higher total expenses. For more information, see your fund’s prospectus or talk to your financial adviser.
Review your fund’s expenses
The table below shows the expenses you would have paid on a $1,000 investment in Dreyfus Mid-Cap Growth Fund from July 1, 2009 to December 31, 2009. It also shows how much a $1,000 investment would be worth at the close of the period, assuming actual returns and expenses.
| | | | | |
| Expenses and Value of a $1,000 Investment | | | |
| assuming actual returns for the six months ended December 31, 2009 | | |
| | Class A | Class B | Class C | Class F | Class I |
| Expenses paid per $1,000† | $ 9.36 | $ 14.13 | $ 13.87 | $ 7.59 | $ 7.87 |
| Ending value (after expenses) | $1,197.60 | $1,190.30 | $1,192.20 | $1,197.70 | $1,198.80 |
|
| COMPARING YOUR FUND’S EXPENSES |
| WITH THOSE OF OTHER FUNDS (Unaudited) |
Using the SEC’s method to compare expenses
The Securities and Exchange Commission (SEC) has established guidelines to help investors assess fund expenses. Per these guidelines, the table below shows your fund’s expenses based on a $1,000 investment, assuming a hypothetical 5% annualized return. You can use this information to compare the ongoing expenses (but not transaction expenses or total cost) of investing in the fund with those of other funds.All mutual fund shareholder reports will provide this information to help you make this comparison. Please note that you cannot use this information to estimate your actual ending account balance and expenses paid during the period.
| | | | | |
| Expenses and Value of a $1,000 Investment | | | |
| assuming a hypothetical 5% annualized return for the six months ended December 31, 2009 |
| | Class A | Class B | Class C | Class F | Class I |
| Expenses paid per $1,000† | $ 8.59 | $ 12.98 | $ 12.73 | $ 6.97 | $ 7.22 |
| Ending value (after expenses) | $1,016.69 | $1,012.30 | $1,012.55 | $1,018.30 | $1,018.05 |
† Expenses are equal to the fund’s annualized expense ratio of 1.69% for Class A, 2.56% for Class B, 2.51% for Class C, 1.37% for Class F and 1.42% for Class I, multiplied by the average account value over the period, multiplied by 184/365 (to reflect the one-half year period).
8
|
| STATEMENT OF INVESTMENTS |
| December 31, 2009 |
| | |
| Common Stocks—99.5% | Shares | Value ($) |
| Consumer Discretionary—23.6% | | |
| Advance Auto Parts | 58,000 | 2,347,840 |
| Aeropostale | 71,000 a | 2,417,550 |
| Bed Bath & Beyond | 65,000 a,b | 2,510,950 |
| Chipotle Mexican Grill | 27,680 a | 2,440,269 |
| DeVry | 45,000 | 2,552,850 |
| Family Dollar Stores | 77,000 | 2,142,910 |
| GameStop, Cl. A | 55,000 a | 1,206,700 |
| Hansen Natural | 58,500 a | 2,246,400 |
| Kohl’s | 22,000 a | 1,186,460 |
| NetFlix | 65,000 a,b | 3,584,100 |
| Priceline.com | 23,660 a | 5,169,710 |
| | | 27,805,739 |
| Energy—8.7% | | |
| Consol Energy | 72,000 | 3,585,600 |
| Noble | 80,000 | 3,256,000 |
| Southwestern Energy | 70,000 a | 3,374,000 |
| | | 10,215,600 |
| Financial—1.2% | | |
| Hudson City Bancorp | 100,000 | 1,373,000 |
| Health Care—16.2% | | |
| Alexion Pharmaceuticals | 64,500 a | 3,148,890 |
| AmerisourceBergen | 134,000 | 3,493,380 |
| Illumina | 66,000 a,b | 2,022,900 |
| Intuitive Surgical | 6,000 a | 1,819,920 |
| Life Technologies | 50,000 a | 2,611,500 |
| Mead Johnson Nutrition | 71,000 | 3,102,700 |
| Varian Medical Systems | 62,700 a,b | 2,937,495 |
| | | 19,136,785 |
| Industrial—18.3% | | |
| Alliant Techsystems | 28,000 a,b | 2,471,560 |
| C.H. Robinson Worldwide | 56,000 b | 3,288,880 |
| Cummins | 30,000 | 1,375,800 |
| Diamond Offshore Drilling | 32,000 b | 3,149,440 |
| First Solar | 12,300 a,b | 1,665,420 |
| Flowserve | 47,000 | 4,442,910 |
The Fund 9
STATEMENT OF INVESTMENTS (continued)
| | |
| Common Stocks (continued) | Shares | Value ($) |
| Industrial (continued) | | |
| Jacobs Engineering Group | 33,000 a | 1,241,130 |
| Joy Global | 30,000 | 1,547,700 |
| Stericycle | 45,000 a | 2,482,650 |
| | | 21,665,490 |
| Information Technology—29.4% | | |
| Akamai Technologies | 170,000 a,b | 4,306,100 |
| Baidu, ADR | 8,500 a | 3,495,455 |
| BMC Software | 110,000 a | 4,411,000 |
| Broadcom, Cl. A | 50,000 a | 1,572,500 |
| Cognizant Technology Solutions, Cl. A | 40,000 a | 1,812,000 |
| Dolby Laboratories, Cl. A | 98,000 a | 4,677,540 |
| F5 Networks | 35,000 a | 1,854,300 |
| FactSet Research Systems | 38,000 b | 2,503,060 |
| Juniper Networks | 55,000 a | 1,466,850 |
| MasterCard, Cl. A | 5,500 b | 1,407,890 |
| McAfee | 30,000 a | 1,217,100 |
| Salesforce.com | 25,000 a | 1,844,250 |
| Shanda Interactive Entertainment, ADR | 52,000 a,b | 2,735,720 |
| VeriSign | 60,800 a | 1,473,792 |
| | | 34,777,557 |
| Telecommunication Services—2.1% | | |
| American Tower, Cl. A | 57,000 a | 2,462,970 |
| Total Common Stocks | | |
| (cost $100,530,582) | | 117,437,141 |
| |
| Other Investment—.9% | | |
| Registered Investment Company; | | |
| Dreyfus Institutional Preferred | | |
| Plus Money Market Fund | | |
| (cost $1,109,000) | 1,109,000 c | 1,109,000 |
10
| | |
| Investment of Cash Collateral | | |
| for Securities Loaned—13.1% | Shares | Value ($) |
| Registered Investment Company; | | |
| Dreyfus Institutional Cash | | |
| Advantage Fund | | |
| (cost $15,392,634) | 15,392,634 c | 15,392,634 |
| |
| Total Investments (cost $117,032,216) | 113.5% | 133,938,775 |
| Liabilities, Less Cash and Receivables | (13.5%) | (15,937,934) |
| Net Assets | 100.0% | 118,000,841 |
|
| ADR—American Depository Receipt |
| a Non-income producing security. |
| b Security, or portion thereof, on loan. At December 31, 2009, the total market value of the fund’s securities on loan is |
| $14,811,869 and the total market value of the collateral held by the fund is $15,392,634. |
| c Investment in affiliated money market mutual fund. |
| | | |
| Portfolio Summary (Unaudited)† | | |
| |
| | Value (%) | | Value (%) |
| Information Technology | 29.4 | Energy | 8.7 |
| Consumer Discretionary | 23.6 | Telecommunication Services | 2.1 |
| Industrial | 18.3 | Financial | 1.2 |
| Health Care | 16.2 | | |
| Money Market Investments | 14.0 | | 113.5 |
| |
| † Based on net assets. | | | |
| See notes to financial statements. | | | |
The Fund 11
|
| STATEMENT OF ASSETS AND LIABILITIES |
| December 31, 2009 |
| | | | | |
| | | | | Cost | Value |
| Assets ($): | | | | | |
| Investments in securities—See Statement of Investments (including | | |
| securities on loan, valued at $14,811,869)—Note 1(b): | | |
| Unaffiliated issuers | | | | 100,530,582 | 117,437,141 |
| Affiliated issuers | | | | 16,501,634 | 16,501,634 |
| Dividends and interest receivable | | | | 99,228 |
| Receivable for shares of Common Stock subscribed | | | 30,150 |
| Prepaid expenses | | | | | 43,630 |
| | | | | | 134,111,783 |
| Liabilities ($): | | | | | |
| Due to The Dreyfus Corporation and affiliates—Note 3(c) | | 152,004 |
| Cash overdraft due to Custodian | | | | 307,057 |
| Liability for securities on loan—Note 1(b) | | | | 15,392,634 |
| Payable for shares of Common Stock redeemed | | | 96,033 |
| Accrued expenses | | | | | 163,214 |
| | | | | | 16,110,942 |
| Net Assets ($) | | | | | 118,000,841 |
| Composition of Net Assets ($): | | | | |
| Paid-in capital | | | | | 199,074,312 |
| Accumulated net realized gain (loss) on investments | | | (97,980,030) |
| Accumulated net unrealized appreciation | | | | |
| (depreciation) on investments | | | | 16,906,559 |
| Net Assets ($) | | | | | 118,000,841 |
| |
| |
| Net Asset Value Per Share | | | | |
| | Class A | Class B | Class C | Class F | Class I |
| Net Assets ($) | 23,448,467 | 558,915 | 11,677,812 | 78,217,911 | 4,097,736 |
| Shares Outstanding | 5,859,457 | 151,421 | 3,194,352 | 18,979,197 | 1,000,361 |
| Net Asset Value | | | | | |
| Per Share ($) | 4.00 | 3.69 | 3.66 | 4.12 | 4.10 |
| |
| See notes to financial statements. | | | | |
12
|
| STATEMENT OF OPERATIONS |
| Year Ended December 31, 2009 |
| |
| Investment Income ($): | |
| Income: | |
| Cash dividends: | |
| Unaffiliated issuers | 829,852 |
| Affiliated issuers | 5,044 |
| Income from securities lending—Note 1(b) | 214,169 |
| Total Income | 1,049,065 |
| Expenses: | |
| Management fee—Note 3(a) | 955,369 |
| Shareholder servicing costs—Note 3(c) | 361,475 |
| Distribution fees—Note 3(b) | 161,434 |
| Accounting fees—Note 3(c) | 99,142 |
| Registration fees | 70,258 |
| Professional fees | 70,138 |
| Prospectus and shareholders’ reports | 57,304 |
| Directors’ fees and expenses—Note 3(d) | 54,735 |
| Loan commitment fees—Note 2 | 4,797 |
| Custodian fees—Note 3(c) | 2,322 |
| Interest expense—Note 2 | 147 |
| Miscellaneous | 50,203 |
| Total Expenses | 1,887,324 |
| Less—reduction in fees due to | |
| earnings credits—Note 1(b) | (21,082) |
| Net Expenses | 1,866,242 |
| Investment (Loss)—Net | (817,177) |
| Realized and Unrealized Gain (Loss) on Investments—Note 4 ($): | |
| Net realized gain (loss) on investments | (43,666,398) |
| Net unrealized appreciation (depreciation) on investments | 71,449,490 |
| Net Realized and Unrealized Gain (Loss) on Investments | 27,783,092 |
| Net Increase in Net Assets Resulting from Operations | 26,965,915 |
| |
| See notes to financial statements. | |
The Fund 13
STATEMENT OF CHANGES IN NET ASSETS
| | |
| | Year Ended December 31, |
| | 2009a | 2008 |
| Operations ($): | | |
| Investment (loss)—net | (817,177) | (2,006,279) |
| Net realized gain (loss) on investments | (43,666,398) | (52,967,467) |
| Net unrealized appreciation | | |
| (depreciation) on investments | 71,449,490 | (83,838,100) |
| Net Increase (Decrease) in Net Assets | | |
| Resulting from Operations | 26,965,915 | (138,811,846) |
| Capital Stock Transactions ($): | | |
| Net proceeds from shares sold: | | |
| Class A Shares | 6,489,918 | 21,794,218 |
| Class B Shares | 2,998 | 202,260 |
| Class C Shares | 527,471 | 3,955,723 |
| Class F Shares | 1,696,620 | 7,053,772 |
| Class I Shares | 1,376,339 | 3,738,726 |
| Class T Shares | 18,200 | 1,486,187 |
| Cost of shares redeemed: | | |
| Class A Shares | (18,663,153) | (54,213,274) |
| Class B Shares | (293,334) | (821,032) |
| Class C Shares | (5,469,772) | (16,403,399) |
| Class F Shares | (16,013,985) | (33,815,076) |
| Class I Shares | (2,025,820) | (5,995,031) |
| Class T Shares | (972,785) | (404,666) |
| Increase (Decrease) in Net Assets | | |
| from Capital Stock Transactions | (33,327,303) | (73,421,592) |
| Total Increase (Decrease) in Net Assets | (6,361,388) | (212,233,438) |
| Net Assets ($): | | |
| Beginning of Period | 124,362,229 | 336,595,667 |
| End of Period | 118,000,841 | 124,362,229 |
| Accumulated distributions in excess of | | |
| investment income—net | — | (18,230) |
14
| | |
| | Year Ended December 31, |
| | 2009a | 2008 |
| Capital Share Transactions: | | |
| Class Ab,c | | |
| Shares sold | 1,961,128 | 4,209,002 |
| Shares redeemed | (5,403,462) | (10,399,995) |
| Net Increase (Decrease) in Shares Outstanding | (3,442,334) | (6,190,993) |
| Class Bb | | |
| Shares sold | 1,177 | 37,586 |
| Shares redeemed | (96,448) | (164,270) |
| Net Increase (Decrease) in Shares Outstanding | (95,271) | (126,684) |
| Class C | | |
| Shares sold | 169,408 | 804,987 |
| Shares redeemed | (1,773,198) | (3,521,470) |
| Net Increase (Decrease) in Shares Outstanding | (1,603,790) | (2,716,483) |
| Class F | | |
| Shares sold | 489,863 | 1,317,273 |
| Shares redeemed | (4,609,615) | (6,583,095) |
| Net Increase (Decrease) in Shares Outstanding | (4,119,752) | (5,265,822) |
| Class I | | |
| Shares sold | 375,603 | 679,251 |
| Shares redeemed | (563,472) | (1,096,466) |
| Net Increase (Decrease) in Shares Outstanding | (187,869) | (417,215) |
| Class Tc | | |
| Shares sold | 6,416 | 317,418 |
| Shares redeemed | (346,191) | (86,423) |
| Net Increase (Decrease) in Shares Outstanding | (339,775) | 230,995 |
| |
| a | Effective as of the close of business on February 4, 2009, the fund no longer offers Class T shares. |
| b | During the period ended December 31, 2009, 8,986 Class B shares representing $27,399 were automatically |
| | converted to 8,348 Class A shares and during the period ended December 31, 2008, 57,149 Class B shares |
| | representing $299,563 were automatically converted to 53,476 Class A shares. |
| c | On the close of business on February 4, 2009, 335,018 Class T shares representing $941,401 were converted to |
| | 311,722 Class A shares. |
| See notes to financial statements. |
The Fund 15
FINANCIAL HIGHLIGHTS
The following tables describe the performance for each share class for the fiscal periods indicated. All information (except portfolio turnover rate) reflects financial results for a single fund share.Total return shows how much your investment in the fund would have increased (or decreased) during each period, assuming you had reinvested all dividends and distributions.These figures have been derived from the fund’s financial statements.
| | | | | |
| | | Year Ended December 31, | |
| Class A Shares | 2009† | 2008 | 2007 | 2006 | 2005 |
| Per Share Data ($): | | | | | |
| Net asset value, beginning of period | 3.17 | 6.28 | 5.80 | 4.68 | 4.15 |
| Investment Operations: | | | | | |
| Investment (loss)—net | (.03)a | (.05)a | (.02)a | (.04)a | (.05) |
| Net realized and unrealized | | | | | |
| gain (loss) on investments | .86 | (3.06) | .76 | 1.16 | .58 |
| Total from Investment Operations | .83 | (3.11) | .74 | 1.12 | .53 |
| Distributions: | | | | | |
| Dividends from net realized | | | | | |
| gain on investments | — | — | (.26) | — | — |
| Net asset value, end of period | 4.00 | 3.17 | 6.28 | 5.80 | 4.68 |
| Total Return (%)b | 26.18 | (49.52) | 12.77 | 23.93 | 12.77 |
| Ratios/Supplemental Data (%): | | | | | |
| Ratio of total expenses | | | | | |
| to average net assets | 1.77 | 1.45 | 1.43 | 1.40 | 1.58 |
| Ratio of net expenses | | | | | |
| to average net assets | 1.75 | 1.44 | 1.43c | 1.39 | 1.55 |
| Ratio of net investment | | | | | |
| (loss) to average net assets | (.86) | (.89) | (.32) | (.68) | (.92) |
| Portfolio Turnover Rate | 59.66 | 119 | 165 | 104 | 211 |
| Net Assets, end of period ($ x 1,000) | 23,448 | 29,525 | 97,331 | 21,146 | 1,656 |
| |
| † | Effective September 1, 2009,The Dreyfus Corporation replaced Founders Asset Management LLC as the fund’s |
| | investment adviser. |
| a | Based on average shares outstanding at each month end. |
| b | Exclusive of sales charge. |
| c | Expense waivers and/or reimbursements amounted to less than .01%. |
| See notes to financial statements. |
16
| | | | | |
| | | Year Ended December 31, | |
| Class B Shares | 2009† | 2008 | 2007 | 2006 | 2005 |
| Per Share Data ($): | | | | | |
| Net asset value, beginning of period | 2.96 | 5.89 | 5.50 | 4.48 | 4.01 |
| Investment Operations: | | | | | |
| Investment (loss)—net | (.06)a | (.08)a | (.06)a | (.08)a | (.09) |
| Net realized and unrealized | | | | | |
| gain (loss) on investments | .79 | (2.85) | .71 | 1.10 | .56 |
| Total from Investment Operations | .73 | (2.93) | .65 | 1.02 | .47 |
| Distributions: | | | | | |
| Dividends from net realized | | | | | |
| gain on investments | — | — | (.26) | — | — |
| Net asset value, end of period | 3.69 | 2.96 | 5.89 | 5.50 | 4.48 |
| Total Return (%)b | 24.66 | (49.75) | 11.84 | 22.77 | 11.72 |
| Ratios/Supplemental Data (%): | | | | | |
| Ratio of total expenses | | | | | |
| to average net assets | 2.68 | 2.21 | 2.26 | 2.29 | 2.43 |
| Ratio of net expenses | | | | | |
| to average net assets | 2.66 | 2.20 | 2.26c | 2.29 | 2.41 |
| Ratio of net investment | | | | | |
| (loss) to average net assets | (1.77) | (1.66) | (1.02) | (1.60) | (1.78) |
| Portfolio Turnover Rate | 59.66 | 119 | 165 | 104 | 211 |
| Net Assets, end of period ($ x 1,000) | 559 | 729 | 2,200 | 1,929 | 1,886 |
| |
| † | Effective September 1, 2009,The Dreyfus Corporation replaced Founders Asset Management LLC as the fund’s |
| | investment adviser. |
| a | Based on average shares outstanding at each month end. |
| b | Exclusive of sales charge. |
| c | Expense waivers and/or reimbursements amounted to less than .01%. |
| See notes to financial statements. |
The Fund 17
FINANCIAL HIGHLIGHTS (continued)
| | | | | |
| | | Year Ended December 31, | |
| Class C Shares | 2009† | 2008 | 2007 | 2006 | 2005 |
| Per Share Data ($): | | | | | |
| Net asset value, beginning of period | 2.92 | 5.83 | 5.44 | 4.42 | 3.96 |
| Investment Operations: | | | | | |
| Investment (loss)—net | (.05)a | (.08)a | (.06)a | (.06)a | (.02) |
| Net realized and unrealized | | | | | |
| gain (loss) on investments | .79 | (2.83) | .71 | 1.08 | .48 |
| Total from Investment Operations | .74 | (2.91) | .65 | 1.02 | .46 |
| Distributions: | | | | | |
| Dividends from net realized | | | | | |
| gain on investments | — | — | (.26) | — | — |
| Net asset value, end of period | 3.66 | 2.92 | 5.83 | 5.44 | 4.42 |
| Total Return (%)b | 25.34 | (49.91) | 11.96 | 23.08 | 11.62 |
| Ratios/Supplemental Data (%): | | | | | |
| Ratio of total expenses | | | | | |
| to average net assets | 2.61 | 2.20 | 2.13 | 2.19 | 2.35 |
| Ratio of net expenses | | | | | |
| to average net assets | 2.60 | 2.19 | 2.13c | 2.18 | 2.32 |
| Ratio of net investment | | | | | |
| (loss) to average net assets | (1.70) | (1.65) | (1.04) | (1.27) | (1.69) |
| Portfolio Turnover Rate | 59.66 | 119 | 165 | 104 | 211 |
| Net Assets, end of period ($ x 1,000) | 11,678 | 14,033 | 43,825 | 9,641 | 550 |
| |
| † | Effective September 1, 2009,The Dreyfus Corporation replaced Founders Asset Management LLC as the fund’s |
| | investment adviser. |
| a | Based on average shares outstanding at each month end. |
| b | Exclusive of sales charge. |
| c | Expense waivers and/or reimbursements amounted to less than .01%. |
| See notes to financial statements. |
18
| | | | | |
| | | Year Ended December 31, | |
| Class F Shares | 2009† | 2008 | 2007 | 2006 | 2005 |
| Per Share Data ($): | | | | | |
| Net asset value, beginning of period | 3.26 | 6.43 | 5.92 | 4.78 | 4.24 |
| Investment Operations: | | | | | |
| Investment (loss)—net | (.02)a | (.04)a | (.00)a,b | (.03)a | (.12) |
| Net realized and unrealized | | | | | |
| gain (loss) on investments | .88 | (3.13) | .77 | 1.17 | .66 |
| Total from Investment Operations | .86 | (3.17) | .77 | 1.14 | .54 |
| Distributions: | | | | | |
| Dividends from net realized | | | | | |
| gain on investments | — | — | (.26) | — | — |
| Net asset value, end of period | 4.12 | 3.26 | 6.43 | 5.92 | 4.78 |
| Total Return (%) | 26.38 | (49.30) | 13.03 | 23.85 | 12.74 |
| Ratios/Supplemental Data (%): | | | | | |
| Ratio of total expenses | | | | | |
| to average net assets | 1.38 | 1.23 | 1.30 | 1.33 | 1.41 |
| Ratio of net expenses | | | | | |
| to average net assets | 1.36 | 1.22 | 1.30c | 1.33 | 1.39 |
| Ratio of net investment | | | | | |
| (loss) to average net assets | (.47) | (.68) | (.03) | (.62) | (.77) |
| Portfolio Turnover Rate | 59.66 | 119 | 165 | 104 | 211 |
| Net Assets, end of period ($ x 1,000) | 78,218 | 75,224 | 182,336 147,410 | 110,170 |
| |
| † | Effective September 1, 2009,The Dreyfus Corporation replaced Founders Asset Management LLC as the fund’s |
| | investment adviser. |
| a | Based on average shares outstanding at each month end. |
| b | Amount represents less than $.01 per share. |
| c | Expense waivers and/or reimbursements amounted to less than .01%. |
| See notes to financial statements. |
The Fund 19
FINANCIAL HIGHLIGHTS (continued)
| | | | | |
| | | Year Ended December 31, | |
| Class I Shares | 2009† | 2008 | 2007a | 2006 | 2005 |
| Per Share Data ($): | | | | | |
| Net asset value, beginning of period | 3.24 | 6.39 | 5.88 | 4.73 | 4.19 |
| Investment Operations: | | | | | |
| Investment income (loss)—net | (.02)b | (.03)b | .00b,c | (.02)b | (.02) |
| Net realized and unrealized | | | | | |
| gain (loss) on investments | .88 | (3.12) | .77 | 1.17 | .56 |
| Total from Investment Operations | .86 | (3.15) | .77 | 1.15 | .54 |
| Distributions: | | | | | |
| Dividends from net realized | | | | | |
| gain on investments | — | — | (.26) | — | — |
| Net asset value, end of period | 4.10 | 3.24 | 6.39 | 5.88 | 4.73 |
| Total Return (%) | 26.54 | (49.30) | 13.11 | 24.31 | 12.89 |
| Ratios/Supplemental Data (%): | | | | | |
| Ratio of total expenses | | | | | |
| to average net assets | 1.49 | 1.20 | 1.12 | 1.14 | 1.38 |
| Ratio of net expenses | | | | | |
| to average net assets | 1.47 | 1.19 | 1.11 | 1.12 | 1.34 |
| Ratio of net investment income | | | | | |
| (loss) to average net assets | (.58) | (.65) | .06 | (.28) | (.70) |
| Portfolio Turnover Rate | 59.66 | 119 | 165 | 104 | 211 |
| Net Assets, end of period ($ x 1,000) | 4,098 | 3,849 | 10,266 | 4,279 | 297 |
| |
| † | Effective September 1, 2009,The Dreyfus Corporation replaced Founders Asset Management LLC as the fund’s |
| | investment adviser. |
| a | Effective June 1, 2007, Class R shares were redesignated as Class I shares. |
| b | Based on average shares outstanding at each month end. |
| c | Amount represents less than $.01 per share. |
| See notes to financial statements. |
20
NOTES TO FINANCIAL STATEMENTS
NOTE 1—Significant Accounting Policies:
Dreyfus Mid-Cap Growth Fund (the “fund”) is a separate diversified series of Dreyfus Funds, Inc. (the “Company”), which is registered under the Investment Company Act of 1940, as amended (the “Act”), as an open-end management investment company and operates as a series company currently offering three series, including the fund.The fund’s investment objective seeks capital appreciation through investments in mid-cap growth companies. Prior to September 1, 2009 Founders Asset Management LLC, a wholly-owned subsidiary of The Bank of New York Mellon Corporation (“BNY Mellon”), served as the fund’s investment adviser. Effective September 1, 2009,The Dreyfus Corporation (the “Manager” or “Dreyfus”), an indirect wholly-owned subsidiary of BNY Mellon, serves as the fund’s investment adviser.
MBSC Securities Corporation (the “Distributor”), a wholly-owned subsidiary of the Manager, is the distributor of the fund’s shares. The fund is authorized to issue 1.05 billion shares of $.001 par value Common Stock.The fund currently offers five classes of shares: Class A (300 million shares authorized), Class B (50 million shares authorized), Class C (100 million shares authorized), Class F (500 million shares authorized) and Class I (100 million shares authorized). Class A shares are subject to a sales charge imposed at the time of purchase. Class B shares are subject to a contingent deferred sales charge (“CDSC”) imposed on Class B share redemptions made within six years of purchase and automatically convert to Class A shares after six years. The fund does not offer Class B shares, except in connection with dividend reinvestment and permitted exchanges of Class B shares. Class C shares are subject t o a CDSC imposed on Class C shares redeemed within one year of purchase. Class F and Class I shares are sold at net asset value per share. Class F shares are sold only to Class F grandfathered investors, and Class I shares are sold only to institutional investors. Other differences between the classes include the services
The Fund 21
NOTES TO FINANCIAL STATEMENTS (continued)
offered to and the expenses borne by each class, the allocation of certain transfer agency costs and certain voting rights. Income, expenses (other than expenses attributable to a specific class), and realized and unrealized gains or losses on investments are allocated to each class of shares based on its relative net assets.
Effective December 3, 2008, investments for new accounts were no longer permitted in Class T shares of the fund, except that participants in certain group retirement plans were able to open a new account in Class T shares of the fund, provided that the fund was established as an investment option under the plans before December 3, 2008. On February 4, 2009, the fund issued to each holder of its Class T shares, in exchange for said shares, Class A shares of the fund having an aggregate net asset value equal to the aggregate net asset value of the shareholder’s Class T shares. Subsequent investments in the fund’s Class A shares made by prior holders of the fund’s Class T shares who received Class A shares of the fund in exchange for their Class T shares are subject to the front-end sales load schedule that was in effect for Class T shares at the time of the exchange. Otherwise, all other Class A share attributes wi ll be in effect. Effective as of the close of business on February 4, 2009, the fund no longer offers Class T shares.
The Company accounts separately for the assets, liabilities and operations of each series. Expenses directly attributable to each series are charged to that series’ operations; expenses which are applicable to all series are allocated among them on a pro rata basis.
The Financial Accounting Standards Board (“FASB”) Accounting Standards Codification (“ASC”) has become the exclusive reference of authoritative U.S. generally accepted accounting principles (“GAAP”) recognized by the FASB to be applied by nongovernmental entities. Rules and interpretive releases of the Securities and Exchange Commission (“SEC”) under authority of federal laws are also sources of authoritative GAAP for SEC registrants. The ASC has superseded
22
all existing non-SEC accounting and reporting standards. The fund’s financial statements are prepared in accordance with GAAP, which may require the use of management estimates and assumptions.Actual results could differ from those estimates.
The Company enters into contracts that contain a variety of indemnifications. The fund’s maximum exposure under these arrangements is unknown.The fund does not anticipate recognizing any loss related to these arrangements.
(a) Portfolio valuation: Investments in securities are valued at the last sales price on the securities exchange or national securities market on which such securities are primarily traded. Securities listed on the National Market System for which market quotations are available are valued at the official closing price or, if there is no official closing price that day, at the last sales price. Securities not listed on an exchange or the national securities market, or securities for which there were no transactions, are valued at the average of the most recent bid and asked prices, except for open short positions, where the asked price is used for valuation purposes. Bid price is used when no asked price is available. Registered investment companies that are not traded on an exchange are valued at their net asset value.When market quotations or officia l closing prices are not readily available, or are determined not to reflect accurately fair value, such as when the value of a security has been significantly affected by events after the close of the exchange or market on which the security is principally traded (for example, a foreign exchange or market), but before the fund calculates its net asset value, the fund may value these investments at fair value as determined in accordance with the procedures approved by the Board of Directors. Fair valuing of securities may be determined with the assistance of a pricing service using calculations based on indices of domestic securities and other appropriate indicators, such as prices of relevant ADRs
The Fund 23
NOTES TO FINANCIAL STATEMENTS (continued)
and futures contracts. For other securities that are fair valued by the Board of Directors, certain factors may be considered such as: fundamental analytical data, the nature and duration of restrictions on disposition, an evaluation of the forces that influence the market in which the securities are purchased and sold and public trading in similar securities of the issuer or comparable issuers.
The fair value of a financial instrument is the amount that would be received to sell an asset or paid to transfer a liability in an orderly transaction between market participants at the measurement date (i.e. the exit price). GAAP establishes a fair value hierarchy that prioritizes the inputs of valuation techniques used to measure fair value.This hierarchy gives the highest priority to unadjusted quoted prices in active markets for identical assets or liabilities (Level 1 measurements) and the lowest priority to unobservable inputs (Level 3 measurements).
Additionally, GAAP provides guidance on determining whether the volume and activity in a market has decreased significantly and whether such a decrease in activity results in transactions that are not orderly. GAAP requires enhanced disclosures around valuation inputs and techniques used during annual and interim periods.
Various inputs are used in determining the value of the fund’s investments relating to fair value measurements.These inputs are summarized in the three broad levels listed below:
Level 1—unadjusted quoted prices in active markets for identical investments.
Level 2—other significant observable inputs (including quoted prices for similar investments, interest rates, prepayment speeds, credit risk, etc.).
Level 3—significant unobservable inputs (including the fund’s own assumptions in determining the fair value of investments).
The inputs or methodology used for valuing securities are not necessarily an indication of the risk associated with investing in those securities.
24
The following is a summary of the inputs used as of December 31, 2009 in valuing the fund’s investments:
| | | | |
| | | Level 2—Other | Level 3— | |
| | Level 1— | Significant | Significant | |
| | Unadjusted | Observable | Unobservable | |
| | Quoted Prices | Inputs | Inputs | Total |
| Assets ($) | | | | |
| Investments in Securities: | | | |
| Equity Securities— | | | | |
| Domestic† | 111,205,966 | — | — | 111,205,966 |
| Equity Securities— | | | | |
| Foreign† | 6,231,175 | — | — | 6,231,175 |
| Mutual Funds | 16,501,634 | — | — | 16,501,634 |
| † See Statement of Investments for industry classification. | | |
(b) Securities transactions and investment income: Securities transactions are recorded on a trade date basis. Realized gains and losses from securities transactions are recorded on the identified cost basis. Dividend income is recognized on the ex-dividend date and interest income, including, where applicable, accretion of discount and amortization of premium on investments, is recognized on the accrual basis.
The fund has arrangements with the custodian and cash management bank whereby the fund may receive earnings credits when positive cash balances are maintained, which are used to offset custody and cash management fees. For financial reporting purposes, the fund includes net earnings credits as an expense offset in the Statement of Operations.
Pursuant to a securities lending agreement with The Bank of New York Mellon, a subsidiary of BNY Mellon and an affiliate of Dreyfus, the fund may lend securities to qualified institutions. It is the fund’s policy that, at origination, all loans are secured by collateral of at least 102% of the value of U.S. securities loaned and 105% of the value of foreign securities loaned. Collateral equivalent to at least 100% of the market value of securities on loan is maintained at all times. Collateral is either in the form of cash, which can be invested in certain money
The Fund 25
NOTES TO FINANCIAL STATEMENTS (continued)
market mutual funds managed by the Manager, U.S. Government and Agency securities or letters of credit.The fund is entitled to receive all income on securities loaned, in addition to income earned as a result of the lending transaction. Although each security loaned is fully collateralized, the fund bears the risk of delay in recovery of, or loss of rights in, the securities loaned should a borrower fail to return the securities in a timely manner. During the period ended December 31, 2009, The Bank of New York Mellon earned $91,787 from lending portfolio securities, pursuant to the securities lending agreement.
(c) Affiliated issuers: Investments in other investment companies advised by the Manager are defined as “affiliated” in the Act.
(d) Dividends to shareholders: Dividends are recorded on the ex-dividend date. Dividends from investment income-net and dividends from net realized capital gains, if any, are normally declared and paid annually, but the fund may make distributions on a more frequent basis to comply with the distribution requirements of the Internal Revenue Code of 1986, as amended (the “Code”).To the extent that net realized capital gains can be offset by capital loss carryovers, it is the policy of the fund not to distribute such gains. Income and capital gain distributions are determined in accordance with income tax regulations, which may differ from GAAP.
(e) Federal income taxes: It is the policy of the fund to continue to qualify as a regulated investment company, if such qualification is in the best interests of its shareholders, by complying with the applicable provisions of the Code, and to make distributions of taxable income sufficient to relieve it from substantially all federal income and excise taxes.
As of and during the period ended December 31, 2009, the fund did not have any liabilities for any uncertain tax positions.The fund recognizes interest and penalties, if any, related to uncertain tax positions as income tax expense in the Statement of Operations. During the period, the fund did not incur any interest or penalties.
Each of the tax years in the four-year period ended December 31, 2009 remains subject to examination by the Internal Revenue Service and state taxing authorities.
26
At December 31, 2009, the components of accumulated earnings on a tax basis were as follows: accumulated capital losses $97,963,747 and unrealized appreciation $16,890,276.
The accumulated capital loss carryover is available for federal income tax purposes to be applied against future net securities profits, if any, realized subsequent to December 31, 2009. If not applied, $29,443,355 of the carryover expires in fiscal 2016 and $68,520,392 expires in fiscal 2017.
During the period ended December 31, 2009, as a result of permanent book to tax differences, primarily due to the tax treatment for net operating losses, the fund increased accumulated undistributed investment income-net by $835,407 and decreased paid-in capital by the same amount. Net assets and net asset value per share were not affected by this reclassification.
NOTE 2—Bank Lines of Credit:
The fund participates with other Dreyfus-managed funds in a $225 million unsecured credit facility led by Citibank, N.A. and a $300 million unsecured credit facility provided by The Bank of New York Mellon (each, a “Facility”), each to be utilized primarily for temporary or emergency purposes, including the financing of redemptions. In connection therewith, the fund has agreed to pay its pro rata portion of commitment fees for each Facility. Interest is charged to the fund based on rates determined pursuant to the terms of the respective Facility at the time of borrowing. Prior to May 28, 2009, the Company had a line of credit arrangement (“LOC”) with State Street Bank and Trust Company to be used for temporary or emergency purposes, primarily for financing redemption payments. The borrowings by each series of the Company were limited to the lesser of (a) $25 million, or (b) the lesser of 25% of the series&# 146; total net assets or the maximum amount which the series was permitted to borrow pursuant to the prospectus, any law or any other agreement. Combined borrowings were subject to the $25 million cap on the total LOC. Each series agreed to pay annual fees and interest on the unpaid balance based on prevailing market rates as defined in the LOC.
The Fund 27
NOTES TO FINANCIAL STATEMENTS (continued)
The average amount of borrowings outstanding under the Facilities and LOC during the period ended December 31, 2009 was approximately $19,300, with a related weighted average annualized interest rate of .76%.
NOTE 3—Management Fee and Other Transactions With Affiliates:
(a) Pursuant to a management agreement with the Manager, the management fee is based on the fund’s average daily net assets and is computed at the following annual rates: 1% of the first $30 million, .75% of the next $270 million, .70% of the next $200 million and .65% in excess of $500 million.The fee is payable monthly.
During the period ended December 31, 2009, the Distributor retained $497 and $7 from commissions earned on sales of the fund’s Class A and Class T shares, respectively, and $1,231 and $3,902 from CDSCs on redemptions of the fund’s Class B and Class C shares, respectively.
(b) Under the Distribution Plan (the “Class B, C and T Plan”) adopted pursuant to Rule 12b-1 under the Act, Class B and Class C shares pay and Class T shares paid the Distributor for distributing their shares at an annual rate of .75% of the value of the average daily net assets of Class B and Class C shares and .25% of the value of the average daily net assets of Class T shares. During the period ended December 31, 2009, Class B, Class C and ClassT shares were charged $4,500, $92,131 and $234, respectively, pursuant to the Class B, C and T Plan.
The fund also adopted a Distribution Plan pursuant to Rule 12b-1 under the Act applicable to its Class F shares (the “Class F Plan”). Under the Class F Plan, the fund is authorized to reimburse the Distributor for expenses paid for distributing or servicing its Class F shares at an annual rate of up to .25% of the value of the average daily net assets of the fund’s Class F shares.The Distributor has agreed not to seek reimbursement of any expenses under the Class F Plan other than reimbursement for payments made to brokers and other intermediaries whose customers hold Class F shares (“Third Party Payments”).This commitment applies to any such expenses (other than third Party Payments) incurred
28
after May 13, 2009.The Distributor may seek reimbursement under the Class F Plan for any such expenses that may have been incurred by the Distributor on or before May 13, 2009, subject to the terms of the Class F Plan.This commitment will continue indefinitely and will not terminate without the prior approval of the fund’s Board of Directors. During the period ended December 31, 2009, Class F shares were charged $64,569 pursuant to the Class F Plan.
(c) Under the Shareholder Services Plan, Class A, Class B and Class C shares pay and Class T shares paid the Distributor at an annual rate of .25% of the value of their average daily net assets for the provision of certain services. The services provided may include personal services relating to shareholder accounts, such as answering shareholder inquiries regarding Class A, Class B, Class C and Class T shares and providing reports and other information, and services related to the maintenance of shareholder accounts.The Distributor may make payments to Service Agents (a securities dealer, financial institution or other industry professional) in respect of these services.The Distributor determines the amounts to be paid to Service Agents. During the period ended December 31, 2009 Class A, Class B, Class C and Class T shares were charged $67,583, $1,500 , $30,710 and $234, respectively, pursuant to the Shareholder Services Plan.
The Company has a shareholder services agreement with the Distributor, whereby the fund agrees to compensate the Distributor for providing certain shareholder servicing functions to holders of Class F shares.The fund pays the Distributor a monthly fee equal, on an annual basis, of $24.00 per Class F shareholder account considered to be an open account at any time during a given month. During the period ended December 31, 2009, Class F shares were charged $36,410 pursuant to the shareholder services agreement.
The fund compensates DreyfusTransfer, Inc., a wholly-owned subsidiary of the Manager, under a transfer agency agreement for providing personnel and facilities to perform transfer agency services for the fund. During the period ended December 31, 2009, the fund was charged
The Fund 29
NOTES TO FINANCIAL STATEMENTS (continued)
$57,513 pursuant to the transfer agency agreement, which is included in Shareholder servicing costs in the Statement of Operations.
The fund compensates The Bank of New York Mellon under cash management agreements for performing cash management services related to fund subscriptions and redemptions. During the period ended December 31, 2009, the fund was charged $21,007 pursuant to the cash management agreements, which is included in Shareholder servicing costs in the Statement of Operations.These fees were offset by earnings credits pursuant to the cash management agreements.
The fund also compensates The Bank of New York Mellon under a custody agreement for providing custodial services for the fund. During the period ended December 31, 2009, the fund was charged $2,322 pursuant to the custody agreement.
The fund has agreed to compensate the Manager for providing accounting services, administration, compliance monitoring, regulatory and shareholder reporting, as well as related facilities, equipment and clerical help.The fee is based on the fund’s average daily net assets and computed at the following annual rates .06% of the first $500 million, .04% of next $500 million and .02% in excess of $1 billion, plus reasonable out-of-pocket expenses. The Manager has contractually agreed in writing to waive any fees received for these services to the extent they exceed its costs in providing the services and a reasonable allocation of the costs incurred by the Manager and its affiliates related to the support and oversight of these services.
During the period ended December 31, 2009, the fund was charged $6,681 for services performed by the Chief Compliance Officer.
The components of “Due to The Dreyfus Corporation and affiliates” in the Statement of Assets and Liabilities consist of: management fees $81,801, Rule 12b-1 distribution plan fees $12,611, shareholder services plan fees $39,651, custodian fees $320, chief compliance officer fees $5,011, accounting fees $5,030 and transfer agency per account fees $7,580.
30
(d) The Company’s current Board of Directors were elected as Board members of the Company as of September 1, 2009 (the “Effective Date”). From the Effective Date through December 31, 2009, each Board member received $45,000 per year, plus $6,000 for each joint Board meeting of the Company,The Dreyfus/Laurel Funds, Inc.,The Dreyfus/Laurel Funds Trust, The Dreyfus/Laurel Tax-Free Municipal Funds and Dreyfus Investment Funds (collectively, the “Board Group Open-end Funds”) attended, $2,000 for separate in-person committee meetings attended which were not held in conjunction with a regularly scheduled Board meeting and $1,500 for Board meetings and separate committee meetings attended that were conducted by telephone. Effective January 1, 2010, the Board Group Open-end Funds will pay each Board member who is not an “interested person” of the Company (as defined in the 1940 Act) $60,000 per annum, plus $7,000 per joint Board Group Open-end Funds Board meeting attended, $2,500 for separate in-person committee meetings attended which are not held in conjunction with a regularly scheduled Board meeting and $2,000 for Board meetings and separate committee meetings attended that are conducted by telephone.The Board Group Open-end Funds also reimburse each Board member who is not an “interested person” of the Company (as defined in the 1940 Act) for travel and out-of-pocket expenses.With respect to Board meetings, the Chairman of the Board receives an additional 25% of such compensation (with the exception of reimbursable amounts). With respect to compensation committee meetings from September 1, 2009 to January 1, 2010, the Chair of the compensation committee received $900 per compensation committee meeting, and, effective January 1, 2010, the Chair of each of the Board’s committees, unless the Chair also serves as Chair of the Board, will receive $1,350 per applicable committee meeting. In the event that there is an in-person joint committee meeting or a joint telephone meeting of the Board Group Open-end Funds and Dreyfus HighYield Strategies Fund, the $2,000 or $1,500 fee (prior to January 1, 2010) or the $2,500 or $2,000 fee (effective January 1, 2010), as applicable, is
The Fund 31
NOTES TO FINANCIAL STATEMENTS (continued)
allocated between the Board Group Open-end Funds and Dreyfus High Yield Strategies Fund.The Company’s portion of these fees and expenses are charged and allocated to each series based on net assets. Amounts required to be paid by the Company directly to the non-interested Directors, that would be applied to offset a portion of the management fee payable to the Manager, are in fact paid directly by the Manager to the non-interested Directors.
NOTE 4—Securities Transactions:
The aggregate amount of purchases and sales of investment securities, excluding short-term securities, during the period ended December 31, 2009, amounted to $67,992,707 and $99,581,561, respectively.
The fund adopted the provisions of ASC Topic 815 “Derivatives and Hedging” which requires qualitative disclosures about objectives and strategies for using derivatives, quantitative disclosures about fair value amounts of gains and losses on derivative instruments and disclosures about credit-risk-related contingent features in derivative agreements. The fund held no derivatives during the period ended December 31, 2009. These disclosures did not impact the notes to the financial statements.
At December 31, 2009, the cost of investments for federal income tax purposes was $117,048,499; accordingly, accumulated net unrealized appreciation on investments was $16,890,276, consisting of $21,750,334 gross unrealized appreciation and $4,860,058 gross unrealized depreciation.
NOTE 5—New Accounting Pronouncement:
In January 2010, FASB issued Accounting Standards Update (“ASU”) No. 2010-06 “Improving Disclosures about Fair Value Measurements”. ASU 2010-06 will require reporting entities to make new disclosures about amounts and reasons for significant transfers in and out of Level 1 and Level 2 fair value measurements as well as inputs and valuation techniques used to measure fair value for both recurring and nonrecur-ring fair value measurements that fall in either Level 2 or Level 3, and information on purchases, sales, issuances and settlements on a gross basis
32
in the reconciliation of activity in Level 3 fair value measurements.The new and revised disclosures are required to be implemented for fiscal years beginning after December 15, 2009 except for the disclosures surrounding purchases, sales, issuances and settlements on a gross basis in the reconciliation of Level 3 fair value measurements, which are effective for fiscal years beginning after December 15, 2010. Management is currently evaluating the impact the adoption of ASU No. 2010-06 may have on the fund’s financial statement disclosures.
NOTE 6—Subsequent Events Evaluation:
Dreyfus has evaluated the need for disclosures and/or adjustments resulting from subsequent events through February 25, 2010, the date the financial statements were issued. This evaluation did not result in any subsequent events that necessitated disclosures and/or adjustments other than the following:
Change in Independent Registered Public Accounting Firm:
Ernst &Young LLP (“E&Y”), an independent registered public accounting firm, was the independent registered public accounting firm for the fund for the fiscal years ended December 31, 2009 and 2008. At the meeting held on February 9, 2010, the Audit Committee and the Board of Directors of the Company engaged KPMG LLP to replace E&Y as the independent registered public accounting firm for the Company.
During the fund’s past two fiscal years: (i) no report on the fund’s financial statements contained an adverse opinion or a disclaimer of opinion, or was qualified or modified as to uncertainty, audit scope, or accounting principles; and (ii) there were no “disagreements” (as such term is used in Item 304 of Regulation S-K) with E&Y on any matter of accounting principles or practices, financial statement disclosure, or auditing scope or procedure, which disagreement(s), if not resolved to the satisfaction of E&Y, would have caused it to make reference to the subject matter of the disagreement(s) in connection with its report.
The Fund 33
REPORT OF INDEPENDENT REGISTERED
PUBLIC ACCOUNTING FIRM
Shareholders and Board of Directors
Dreyfus Mid-Cap Growth Fund
We have audited the accompanying statement of assets and liabilities, including the statement of investments, of Dreyfus Mid-Cap Growth Fund (one of the series comprising Dreyfus Funds, Inc.) as of December 31, 2009, and the related statement of operations for the year then ended, the statement of changes in net assets for each of the two years in the period then ended, and financial highlights for each of the three years in the period then ended. These financial statements and financial highlights are the responsibility of the Fund’s management. Our responsibility is to express an opinion on these financial statements and financial highlights based on our audits.The financial highlights for the years ended December 31, 2006 and 2005 were audited by other auditors whose report dated February 23, 2007, expressed an unqualified opinion on such financial highlights.
We conducted our audits in accordance with the standards of the Public Company Accounting Oversight Board (United States).Those standards require that we plan and perform the audit to obtain reasonable assurance about whether the financial statements and financial highlights are free of material misstatement.We were not engaged to perform an audit of the Fund’s internal control over financial reporting. Our audits included consideration of internal control over financial reporting as a basis for designing audit procedures that are appropriate in the circumstances, but not for the purpose of expressing an opinion on the effectiveness of the Fund’s internal control over financial reporting. Accordingly, we express no such opinion.An audit also includes examining, on a test basis, evidence supporting the amounts and disclosures in the financial statements and financial highlights, assessing the accounting principles used and significant estimates made by management, and evaluating the overall financial statement presentation. Our procedures included confirmation of securities owned as of December 31, 2009 by correspondence with the custodian and others. We believe that our audits provide a reasonable basis for our opinion.
In our opinion, the 2009, 2008 and 2007 financial statements and financial highlights referred to above present fairly, in all material respects, the financial position of Dreyfus Mid-Cap Growth Fund at December 31, 2009, the results of its operations for the year then ended, the changes in its net assets for each of the two years in the period then ended, and the financial highlights for each of the three years in the period then ended, in conformity with U.S. generally accepted accounting principles.

New York, New York
February 25, 2010
34
PROXY RESULTS (Unaudited)
Dreyfus Funds, Inc. held an annual meeting of shareholders on August 20, 2009.The proposal considered at the meeting, and the results, are as follows:
| | | |
| | | Shares | |
| | Votes For | | Authority Withheld |
| To elect a new slate of Directors: | | | |
| Joseph S. DiMartino | 71,760,496 | | 6,207,846 |
| James M. Fitzgibbons | 71,630,227 | | 6,338,115 |
| Kenneth A. Himmel | 71,844,526 | | 6,123,816 |
| Stephen J. Lockwood | 71,924,968 | | 6,043,374 |
| Roslyn M. Watson | 71,791,344 | | 6,176,998 |
| Benaree Pratt Wiley | 71,721,801 | | 6,246,541 |
The Fund 35
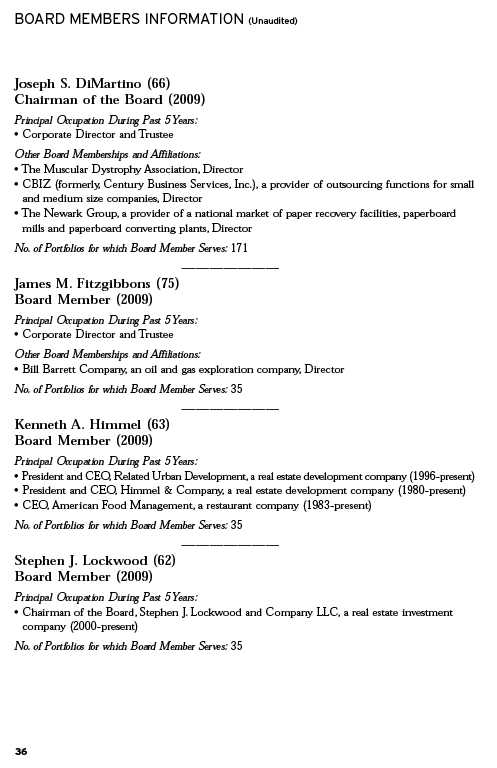

OFFICERS OF THE FUND (Unaudited)
BRADLEY J. SKAPYAK, President since January 2010.
Chief Operating Officer and a director of the Manager since June 2009. From April 2003 to June 2009, Mr. Skapyak was the head of the Investment Accounting and Support Department of the Manager. He is an officer of 76 investment companies (comprised of 171 portfolios) managed by the Manager. He is 51 years old and has been an employee of the Manager since February 1988.
PHILLIP N. MAISANO, Executive Vice President since September 2009.
Chief Investment Officer,Vice Chair and a director of the Manager, and an officer of 76 investment companies (comprised of 171 portfolios) managed by the Manager. Mr. Maisano also is an officer and/or Board member of certain other investment management subsidiaries of The Bank of New York Mellon Corporation, each of which is an affiliate of the Manager. He is 62 years old and has been an employee of the Manager since November 2006. Prior to joining the Manager, Mr. Maisano served as Chairman and Chief Executive Officer of EACM Advisors, an affiliate of the Manager, since August 2004.
J. DAVID OFFICER, Vice President since January 2010.
Director of Mellon United National Bank, an affiliate of the Manager, and an officer of 77 investment companies (comprised of 194 portfolios) managed by the Manager. Prior to June 2009, Mr. Officer was Chief Operating Officer,Vice Chairman and a director of the Manager, where he had been employed since April 1998. He is 61 years old.
MICHAEL A. ROSENBERG, Vice President and Secretary since September 2009.
Assistant General Counsel of BNY Mellon, and an officer of 77 investment companies (comprised of 194 portfolios) managed by the Manager. He is 49 years old and has been an employee of the Manager since October 1991.
KIESHA ASTWOOD, Vice President and Assistant Secretary since January 2010.
Counsel of BNY Mellon, and an officer of 77 investment companies (comprised of 194 portfolios) managed by the Manager. She is 36 years old and has been an employee of the Manager since July 1995.
JAMES BITETTO, Vice President and Assistant Secretary since September 2009.
Senior Counsel of BNY Mellon and Secretary of the Manager, and an officer of 77 investment companies (comprised of 194 portfolios) managed by the Manager. He is 43 years old and has been an employee of the Manager since December 1996.
JONI LACKS CHARATAN, Vice President and Assistant Secretary since September 2009.
Senior Counsel of BNY Mellon, and an officer of 77 investment companies (comprised of 194 portfolios) managed by the Manager. She is 54 years old and has been an employee of the Manager since October 1988.
JOSEPH M. CHIOFFI, Vice President and Assistant Secretary since September 2009.
Senior Counsel of BNY Mellon, and an officer of 77 investment companies (comprised of 194 portfolios) managed by the Manager. He is 48 years old and has been an employee of the Manager since June 2000.
KATHLEEN DENICHOLAS, Vice President and Assistant Secretary since January 2010.
Senior Counsel of BNY Mellon, and an officer of 77 investment companies (comprised of 194 portfolios) managed by the Manager. She is 35 years old and has been an employee of the Manager since February 2001.
38
JANETTE E. FARRAGHER, Vice President and Assistant Secretary since September 2009.
Assistant General Counsel of BNY Mellon, and an officer of 77 investment companies (comprised of 194 portfolios) managed by the Manager. She is 47 years old and has been an employee of the Manager since February 1984.
JOHN B. HAMMALIAN, Vice President and Assistant Secretary since September 2009.
Managing Counsel of BNY Mellon, and an officer of 77 investment companies (comprised of 194 portfolios) managed by the Manager. He is 46 years old and has been an employee of the Manager since February 1991.
M. CRISTINA MEISER, Vice President and Assistant Secretary since January 2010.
Senior Counsel of BNY Mellon, and an officer of 77 investment companies (comprised of 194 portfolios) managed by the Manager. She is 39 years old and has been an employee of the Manager since August 2001.
ROBERT R. MULLERY, Vice President and Assistant Secretary since September 2009.
Managing Counsel of BNY Mellon, and an officer of 77 investment companies (comprised of 194 portfolios) managed by the Manager. He is 57 years old and has been an employee of the Manager since May 1986.
JEFF PRUSNOFSKY, Vice President and Assistant Secretary since September 2009.
Managing Counsel of BNY Mellon, and an officer of 77 investment companies (comprised of 194 portfolios) managed by the Manager. He is 44 years old and has been an employee of the Manager since October 1990.
JAMES WINDELS, Treasurer since September 2009.
Director – Mutual Fund Accounting of the Manager, and an officer of 77 investment companies (comprised of 194 portfolios) managed by the Manager. He is 51 years old and has been an employee of the Manager since April 1985.
RICHARD CASSARO, Assistant Treasurer since September 2009.
Senior Accounting Manager – Money Market and Municipal Bond Funds of the Manager, and an officer of 77 investment companies (comprised of 194 portfolios) managed by the Manager. He is 50 years old and has been an employee of the Manager since September 1982.
GAVIN C. REILLY, Assistant Treasurer since September 2009.
Tax Manager of the Investment Accounting and Support Department of the Manager, and an officer of 77 investment companies (comprised of 194 portfolios) managed by the Manager. He is 41 years old and has been an employee of the Manager since April 1991.
ROBERT ROBOL, Assistant Treasurer since September 2006.
Senior Accounting Manager – Fixed Income Funds of the Manager, and an officer of 77 investment companies (comprised of 194 portfolios) managed by the Manager. He is 45 years old and has been an employee of the Manager since October 1988.
ROBERT SALVIOLO, Assistant Treasurer since May 2007.
Senior Accounting Manager – Equity Funds of the Manager, and an officer of 77 investment companies (comprised of 194 portfolios) managed by the Manager. He is 42 years old and has been an employee of the Manager since June 1989.
The Fund 39
OFFICERS OF THE FUND (Unaudited) (continued)
ROBERT SVAGNA, Assistant Treasurer since September 2006.
Senior Accounting Manager – Equity Funds of the Manager, and an officer of 77 investment companies (comprised of 194 portfolios) managed by the Manager. He is 42 years old and has been an employee of the Manager since November 1990.
JOSEPH W. CONNOLLY, Chief Compliance Officer since September 2009.
Chief Compliance Officer of the Manager and The Dreyfus Family of Funds (77 investment companies, comprised of 194 portfolios). From November 2001 through March 2004, Mr. Connolly was first Vice-President, Mutual Fund Servicing for Mellon Global Securities Services. In that capacity, Mr. Connolly was responsible for managing Mellon’s Custody, Fund Accounting and Fund Administration services to third-party mutual fund clients. He is 52 years old and has served in various capacities with the Manager since 1980, including manager of the firm’s Fund Accounting Department from 1997 through October 2001.
WILLIAM GERMENIS, Anti-Money Laundering Compliance Officer since 2002/2003 (Class F shares).
Vice President and Anti-Money Laundering Compliance Officer of the Distributor, and the Anti-Money Laundering Compliance Officer of 73 investment companies (comprised of 190 portfolios) managed by the Manager. He is 39 years old and has been an employee of the Distributor since October 1998.
40
The Registrant has adopted a code of ethics that applies to the Registrant's principal executive officer, principal financial officer, principal accounting officer or controller, or persons performing similar functions. There have been no amendments to, or waivers in connection with, the Code of Ethics during the period covered by this Report.
| |
| Item 3. | Audit Committee Financial Expert. |
The Registrant's Board has determined that Joseph DiMartino, a member of the Audit Committee of the Board, is an audit committee financial expert as defined by the Securities and Exchange Commission (the "SEC"). Joseph DiMartino is "independent" as defined by the SEC for purposes of audit committee financial expert determinations.
| |
| Item 4. | Principal Accountant Fees and Services. |
(a) Audit Fees. The aggregate fees billed for each of the last two fiscal years (the "Reporting Periods") for professional services rendered by the Registrant's principal accountant (the "Auditor") for the audit of the Registrant's annual financial statements or services that are normally provided by the Auditor in connection with the statutory and regulatory filings or engagements for the Reporting Periods, were $182,600 in 2008 and $94,368 in 2009.
(b) Audit-Related Fees. The aggregate fees billed in the Reporting Periods for assurance and related services by the Auditor that are reasonably related to the performance of the audit of the Registrant's financial statements and are not reported under paragraph (a) of this Item 4 were $0 in 2008 and $23,175 in 2009. These services consisted of security counts required by Rule 17f-2 under the Investment Company Act of 1940, as amended.
The aggregate fees billed in the Reporting Periods for non-audit assurance and related services by the Auditor to the Registrant's investment adviser (not including any sub-investment adviser whose role is primarily portfolio management and is subcontracted with or overseen by another investment adviser), and any entity controlling, controlled by or under common control with the investment adviser that provides ongoing services to the Registrant ("Service Affiliates"), that were reasonably related to the performance of the annual audit of the Service Affiliate, which required pre-approval by the Audit Committee were $0 in 2008 and $0 in 2009.
(c) Tax Fees. The aggregate fees billed in the Reporting Periods for professional services rendered by the Auditor for tax compliance, tax advice, and tax planning ("Tax Services") were $21,490 in 2008 and $1,826 in 2009. These services consisted of: (i) review or preparation of U.S. federal, state, local and excise tax returns; (ii) U.S. federal, state and local tax planning, advice and assistance regarding statutory, regulatory or administrative developments; (iii) tax advice regarding tax qualification matters and/or treatment of various financial instruments held or proposed to be acquired or held. The aggregate fees billed in the Reporting Periods for Tax Services by the Auditor to Service Affiliates, which required pre-approval by the Audit Committee were $0 in 2008 and $0 in 2009.
(d) All Other Fees. The aggregate fees billed in the Reporting Periods for products and services provided by the Auditor, other than the services reported in paragraphs (a) through (c) of this Item, were $176 in 2008 and $158 1n 2009. These services consisted of a review of the Registrant's anti-money laundering program.
The aggregate fees billed in the Reporting Periods for Non-Audit Services by the Auditor to Service Affiliates, other than the services reported in paragraphs (b) through (c) of this Item, which required pre-approval by the Audit Committee, were $0 in 2008 and $0 in 2009.
-3-
SSL-DOCS2 70128344v15
Note: None of the services described in paragraphs (b) through (d) of this Item 4 were approved by the Audit Committee pursuant to paragraph (c)(7)(i)(C) of Rule 2-01 of Regulation S-X.
Audit Committee Pre-Approval Policies and Procedures. The Registrant's Audit Committee has established policies and procedures (the "Policy") for pre-approval (within specified fee limits) of the Auditor's engagements for non-audit services to the Registrant and Service Affiliates without specific case-by-case consideration. Pre-approval considerations include whether the proposed services are compatible with maintaining the Auditor's independence. Pre-approvals pursuant to the Policy are considered annually.
Non-Audit Fees. The aggregate non-audit fees billed by the Auditor for services rendered to the Registrant, and rendered to Service Affiliates, for the Reporting Periods were $12,582,986 in 2008 and $24,975,296 in 2009.
Auditor Independence. The Registrant's Audit Committee has considered whether the provision of non-audit services that were rendered to Service Affiliates, which were not pre-approved (not requiring pre-approval), is compatible with maintaining the Auditor's independence.
| |
| Item 5. | Audit Committee of Listed Registrants. |
| | Not applicable. [CLOSED-END FUNDS ONLY] |
| Item 6. | Investments. |
| (a) | Not applicable. |
| Item 7. | Disclosure of Proxy Voting Policies and Procedures for Closed-End Management |
| | Investment Companies. |
| | Not applicable. [CLOSED-END FUNDS ONLY] |
| Item 8. | Portfolio Managers of Closed-End Management Investment Companies. |
| | Not applicable. [CLOSED-END FUNDS ONLY, beginning with reports for periods ended |
| | on and after December 31, 2005] |
| Item 9. | Purchases of Equity Securities by Closed-End Management Investment Companies and |
| | Affiliated Purchasers. |
| | Not applicable. [CLOSED-END FUNDS ONLY] |
| Item 10. | Submission of Matters to a Vote of Security Holders. |
| There have been no material changes to the procedures applicable to Item 10. |
| Item 11. | Controls and Procedures. |
(a) The Registrant's principal executive and principal financial officers have concluded, based on their evaluation of the Registrant's disclosure controls and procedures as of a date within 90 days of the filing date of this report, that the Registrant's disclosure controls and procedures are reasonably designed to ensure that information required to be disclosed by the Registrant on Form N-CSR is recorded, processed, summarized and reported within the required time periods and that information required to be disclosed by the Registrant in the reports that it files or submits on Form N-CSR is accumulated and communicated to the Registrant's
-4-
SSL-DOCS2 70128344v15
management, including its principal executive and principal financial officers, as appropriate to allow timely decisions regarding required disclosure.
(b) There were no changes to the Registrant's internal control over financial reporting that occurred during the second fiscal quarter of the period covered by this report that have materially affected, or are reasonably likely to materially affect, the Registrant's internal control over financial reporting.
(a)(1) Code of ethics referred to in Item 2.
(a)(2) Certifications of principal executive and principal financial officers as required by Rule 30a-2(a) under the Investment Company Act of 1940.
(a)(3) Not applicable.
(b) Certification of principal executive and principal financial officers as required by Rule 30a-2(b) under the Investment Company Act of 1940.
-5-
SSL-DOCS2 70128344v15
SIGNATURES
Pursuant to the requirements of the Securities Exchange Act of 1934 and the Investment Company Act of 1940, the Registrant has duly caused this Report to be signed on its behalf by the undersigned, thereunto duly authorized.
Dreyfus Funds, Inc.
| |
| By: | /s/ Bradley J. Skapyak |
| | Bradley J. Skapyak, |
| | President |
| |
| Date: | February 19, 2010 |
Pursuant to the requirements of the Securities Exchange Act of 1934 and the Investment Company Act of 1940, this Report has been signed below by the following persons on behalf of the Registrant and in the capacities and on the dates indicated.
| |
| By: | /s/ Bradley J. Skapyak |
| | Bradley J. Skapyak, |
| | President |
| |
| Date: | February 19, 2010 |
| |
| By: | /s/ James Windels |
| | James Windels, |
| Treasurer |
| |
| Date: | February 19, 2010 |
EXHIBIT INDEX
(a)(1) Code of ethics referred to in Item 2.
(a)(2) Certifications of principal executive and principal financial officers as required by Rule 30a-2(a) under the Investment Company Act of 1940. (EX-99.CERT)
(b) Certification of principal executive and principal financial officers as required by Rule 30a-2(b) under the Investment Company Act of 1940. (EX-99.906CERT)
-6-
SSL-DOCS2 70128344v15