UNITED STATES
SECURITIES AND EXCHANGE COMMISSION
Washington, D.C. 20549
FORM N-CSR
CERTIFIED SHAREHOLDER REPORT OF REGISTERED MANAGEMENT INVESTMENT COMPANIES
Investment Company Act file number: 811-1018
Dreyfus Founders Funds, Inc.
- ---------------------------------------------------------------
(Exact name of registrant as specified in charter)
210 University Boulevard, Suite 800, Denver, Colorado 80206
---------------------------------------------------------------
(Address of principal executive offices) (Zip code)
Kenneth R. Christoffersen, Esq.
210 University Boulevard, Suite 800, Denver, Colorado 80206
---------------------------------------------------------------
(Name and address of agent for service)
Registrant's telephone number, including area code: 303-394-4404
Date of fiscal year end: December 31
Date of reporting period: December 31, 2006
ITEM 1. REPORTS TO STOCKHOLDERS

Save time. Save paper. View your next shareholder report online as soon as it’s available. To take advantage of this service, simply inform us online of your decision to receive materials through our E-Communications Program. Cut down on mailbox clutter and help the Fund reduce printing and postage charges by enrolling today. It’s simple and only takes a few minutes.
Class F shareholders can log into www.founders.com/ ecommunications, or www.icsdelivery.com if you own funds through a third party.
Class A, B, C, R and T shareholders can log into www.dreyfus.com.
The views expressed in this report reflect those of the portfolio managers only through the end of the period covered and do not necessarily represent the views of Founders or any other person in the Founders organization.Any such views are subject to change at any time based upon market or other conditions and Founders disclaims any responsibility to update such views.These views may not be relied on as investment advice and, because investment decisions for a Dreyfus Founders Fund are based on numerous factors, may not be relied on as an indication of trading intent on behalf of any Dreyfus Founders Fund.
Not FDIC-Insured • Not Bank-Guaranteed • May Lose Value
| Contents |
| |
| | | THE FUND |
| |
|
| 2 | | A Letter from the President |
| 3 | | Discussion of Fund Performance |
| 6 | | Fund Performance |
| 8 | | Understanding Your Fund’s Expenses |
| 8 | | Comparing Your Fund’s Expenses |
| With Those of Other Funds |
| 9 | | Statement of Investments |
| 22 | | Statement of Assets and Liabilities |
| 23 | | Statement of Operations |
| 24 | | Statement of Changes in Net Assets |
| 27 | | Financial Highlights |
| 33 | | Notes to Financial Statements |
| 45 | | Report of Independent Registered |
| | | Public Accounting Firm |
| 46 | | Important Tax Information |
| 47 | | Factors Considered in Renewing |
| the Advisory Agreement |
| 55 | | Your Board Representatives |
| |
| FOR MORE INFORMATION |
|
| | | Back Cover |
| Dreyfus Founders |
| Balanced Fund |
The Fund

A LETTER FROM THE PRESIDENT
Dear Shareholder:
We are pleased to present this annual report for Dreyfus Founders Balanced Fund, covering the 12-month period from January 1, 2006, through December 31, 2006.
2006 proved to be a good year for the financial markets.Virtually all sectors and capitalization ranges of the U.S. equity markets generated strong returns, especially over the second half of the year.A number of positive factors contributed to the markets’ gains in 2006, including an expanding domestic economy, subdued inflation, stabilizing interest rates, rising productivity and robust corporate profits.
In our analysis, 2006 provided an excellent reminder of the need for a long-term investment perspective. Adopting too short a time frame proved costly for some investors last year, as chasing recent winners often meant buying the next month’s losers. Indeed, history shows that reacting to near-term developments with extreme shifts in strategy rarely is the right decision.We believe that a better course of action is to set a portfolio mix to meet future goals, while attempting to ignore short term market fluctuations in favor of a longer-term view.
For information about how the fund performed during the reporting period, as well as market perspectives, we have provided a Discussion of Fund Performance given by the fund’s portfolio managers.
Thank you for your continued confidence and support.We wish you good health and prosperity in 2007.


DISCUSSION OF FUND PERFORMANCE
John B. Jares, CFA, and Catherine A. Powers, CFA, Portfolio Managers
How did Dreyfus Founders Balanced Fund perform relative to its benchmark?
For the 12-month period ended December 31, 2006, Dreyfus Founders Balanced Fund produced a total return of 9.66% for Class A Shares, 8.75% for Class B Shares, 8.87% for Class C Shares, 9.91% for Class F Shares, 10.10% for Class R Shares, and 9.56% for Class T Shares1 in comparison to its benchmark, the Standard & Poor’s 500 Composite Stock Price Index, which gained 15.78% for the same time period.2
Stocks ended 2006 broadly higher due to strong corporate profits and waning concerns regarding the economy and inflation. Bonds also generally fared well, but to a lesser extent than stocks, as short-term interest rates stabilized and inflationary pressures eased over the second half of the year.The fund produced lower returns than its equity-only benchmark, which we attribute primarily to the moderating effect of the fund’s fixed-income portfolio, which sought to minimize volatility and achieve current income.
What is the fund’s investment approach?
The fund seeks current income and capital appreciation by investing in a balanced portfolio of common stocks, U.S. and foreign government debt securities and corporate fixed-income obligations. The fund’s equity portion uses a “growth style” of investing, in which we search for companies whose fundamental strengths suggest the potential for superior earnings growth over time. Our “bottom-up” approach emphasizes individual stock selection through intensive qualitative and quantitative research.When choosing bonds, we consider their income characteristics as well as the potential for capital appreciation. We may invest in U.S. government securities, investment-grade and high yield corporate bonds, mortgage-related securities and asset-backed securities.
What other factors influenced the fund’s performance?
Resurgent energy prices and rising interest rates dampened investor sentiment over the first half of the year. As a result, stocks and bonds
The Fund 3
DISCUSSION OF FUND PERFORMANCE (continued)
|
generally lost value. However, investors’ economic concerns waned over the second half of 2006, when the Federal Reserve Board (the “Fed”) held short-term interest rates steady after its June 30 meeting. Both stocks and bonds responded well to the Fed’s decision and generally rallied, more than offsetting previous weakness. Furthermore, economic data suggested that the U.S. economy, despite showing signs of slowing, continued to trend upward, which helped moderate recession concerns.
In this environment, we generally maintained the fund’s allocations of approximately 60% of assets to stocks and approximately 40% to bonds during 2006. In the stock portfolio, our security selection strategy in the information technology sector was one of the greater drivers of relative performance in 2006.Top performers included hardware manufacturers Cisco Systems,Apple Computer, Hewlett-Packard and Microsoft. Cisco Systems reported robust earnings growth and remained well-positioned for the next generation of voice and data technology to hit the consumer market. Apple continued to benefit from the success of its iPod music players and other new products. Hewlett-Packard’s stock price rose on solid business execution by the company’s new management and the favorable acquisition of numerous software companies.
Strong relative performance in the industrials sector was driven by rebounding airline companies, particularly Continental Airlines, as consolidation and cost efficiencies aided the airline industry’s turnaround. The consumer discretionary sector also produced several strong individual performers, including apparel retailer Kohl’s and supermarket chain Safeway.
However, the fund’s health care holdings hampered returns during the reporting period, with stent manufacturer Boston Scientific, pharmaceutical companies MGI Pharma and Omnicare, and vision product manufacturer Advanced Medical Optics each producing shortfalls. Relatively light exposure to the telecommunications services sector and weakness in wireless services provider Sprint detracted from performance. Finally, the fund’s light exposure to the financials sector and disappointing selections among financials stocks produced a negative impact.
In the fixed-income portfolio, positions in high yield bonds helped the fund participate in the rally among lower-rated credits during the second half of 2006, while we attempted to manage credit risks by focusing on securities with relatively short maturities. In the invest-
ment-grade corporate bond market, where we have seen significant negative event risk due to leveraged buy-outs, mergers and share buy-backs, we have favored regulated industries, where such activities are less common, and sectors that offer strong covenant protection. However, an underweight position in mortgage-backed securities detracted modestly from the fund’s relative performance. In addition, tactical positions in Treasury Inflation Protected Securities (TIPS) underperformed as energy prices fell in the second half of the year.
What is the fund’s current strategy?
In the fund’s equities portion, we have continued to find attractive investment opportunities among individual companies, particularly in the information technology sector. We also have identified a number of attractive investment candidates in the health care sector, as a fair amount of underperformance among health care firms in 2006 has produced more attractive valuations. In the fund’s fixed-income portion, we have increased the allocation to mortgages in light of continued low market volatility and favorable supply and demand factors. Conversely, we may reduce the fund’s position in TIPS due to declining oil prices and a slowing economy, which seem unlikely to produce higher inflation expectations.
| | | Part of the fund’s historical performance is due to the purchase of securities sold in initial |
| | | public offerings (IPOs). There is no guarantee that the fund’s investments in IPOs, if any, |
| | | will continue to have a similar impact on performance |
| 1 | | Total return includes reinvestment of dividends and any capital gains paid, and does not take into |
| | | consideration the maximum initial sales charges in the case of Class A and Class T shares, or the |
| | | applicable contingent deferred sales charges imposed on redemptions in the case of Class B and |
| | | Class C shares. Had these charges been reflected, returns would have been lower. Past performance |
| | | is no guarantee of future results. Share price and investment return fluctuate such that upon |
| | | redemption, fund shares may be worth more or less than their original cost. Return figures |
| | | provided for the fund’s Class R and Class T shares reflect the absorption of certain portfolio |
| | | expenses by an affiliate of Founders pursuant to an agreement that will extend through at least |
| | | August 31, 2007, and will not be terminated without prior notice to the fund’s Board of |
| | | Directors. Had these expenses not been absorbed, the fund’s Class R and Class T shares’ returns |
| | | would have been lower. |
| 2 | | SOURCE: LIPPER, INC. – Reflects reinvestment of net dividends and, where applicable, |
| | | capital gain distributions.The Standard & Poor’s 500 Composite Stock Price Index is a widely |
| | | accepted, unmanaged index of U.S. stock market performance. |
The Fund 5
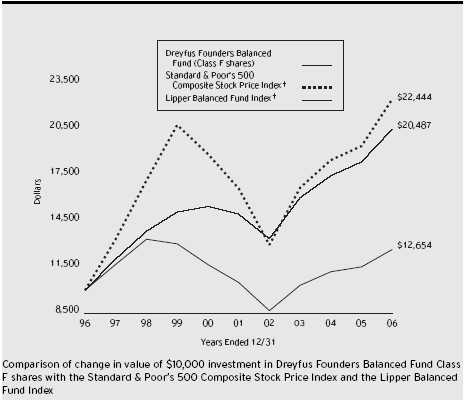
| † Source: Lipper Inc. |
| Past performance is not predictive of future performance. |
| Part of the fund’s historical performance is due to the purchase of securities sold in initial public offerings (IPOs).There is |
| no guarantee that the fund’s investments in IPOs, if any, will continue to have a similar impact on performance. |
| The above graph compares a $10,000 investment made in Class F shares of Dreyfus Balanced Fund on 12/31/96 to |
| a $10,000 investment made in each of the Standard & Poor’s 500 Composite Stock Price Index (the “S&P 500 |
| Index”) and the Lipper Balanced Fund Index (the “Lipper Index”) on that date. All dividends and capital gain |
| distributions are reinvested. Performance for Class A, Class B, Class C, Class R and Class T shares will vary from the |
| performance of Class F shares shown above due to differences in charges and expenses. |
| The fund’s performance shown in the line graph takes into account all applicable Class F fees and expenses (after any |
| expense reimbursements).The S&P 500 Index is designed to be representative of the U.S. equities market and consists of |
| 500 leading companies in leading industries of the U.S. economy. Unlike the fund, it does not contain a fixed-income |
| component.The Lipper Balanced Fund Index is an equal dollar weighted index of the largest mutual funds within the |
| Balanced Fund classification, as defined by Lipper.The S&P 500 Index does not take into account charges, fees and |
| other expenses. Further information relating to fund performance, including expense reimbursements, if applicable, is |
| contained in the Financial Highlights section of the prospectus and elsewhere in this report. |
| Average Annual Total Returns as of 12/31/06 | | | | | | |
| |
| | | Inception | | | | | | | | From |
| | | Date | | 1 Year | | 5 Years | | 10 Years | | Inception |
| |
| |
| |
| |
| |
|
| Class A shares | | | | | | | | | | |
| with maximum sales charge (5.75%) | | 12/31/99 | | 3.40% | | 2.32% | | — | | (1.49)% |
| without sales charge | | 12/31/99 | | 9.66% | | 3.54% | | — | | (0.65)% |
| Class B shares | | | | | | | | | | |
| with applicable redemption charge † | | 12/31/99 | | 4.75% | | 2.40% | | — | | (1.28)% |
| without redemption | | 12/31/99 | | 8.75% | | 2.76% | | — | | (1.28)% |
| Class C shares | | | | | | | | | | |
| with applicable redemption charge †† | | 12/31/99 | | 7.87% | | 2.58% | | — | | (1.68)% |
| without redemption | | 12/31/99 | | 8.87% | | 2.58% | | — | | (1.68)% |
| Class F shares | | 2/19/63 | | 9.91% | | 3.81% | | 2.38% | | N/A |
| Class R shares | | 12/31/99 | | 10.10% | | 3.51% | | — | | (0.58)% |
| Class T shares | | | | | | | | | | |
| with applicable sales charge (4.5%) | | 12/31/99 | | 4.58% | | 2.70% | | — | | (1.25)% |
| without sales charge | | 12/31/99 | | 9.56% | | 3.66% | | — | | (0.60)% |
Past performance is not predictive of future performance.The fund’s performance shown in the graph and table does not reflect the deduction of taxes that a shareholder would pay on fund distributions or the redemption of fund shares, but does reflect fee waivers for certain share classes. Performance for Class B shares assumes the conversion of Class B shares to Class A shares at the end of the sixth year following the date of purchase.
| † | | The maximum contingent deferred sales charge for Class B shares is 4%. After six years Class B shares convert to |
| | | Class A shares. |
| †† | | The maximum contingent deferred sales charge for Class C shares is 1% for shares redeemed within one year of the |
| | | date of purchase. |
The Fund 7
UNDERSTANDING YOUR FUND’S EXPENSES (Unaudited)
As a mutual fund investor, you pay ongoing expenses, such as management fees and other expenses. Using the information below, you can estimate how these expenses affect your investment and compare them with the expenses of other funds.You also may pay one-time transaction expenses, including sales charges (loads) and redemption fees, which are not shown in this section and would have resulted in higher total expenses. For more information, see your fund's prospectus or talk to your financial advisor.
Review your fund’s expenses
|
The table below shows the expenses you would have paid on a $1,000 investment in Dreyfus Founders Balanced Fund from July 1, 2006 to December 31, 2006. It also shows how much a $1,000 investment would be worth at the close of the period, assuming actual returns and expenses.To estimate the expenses you paid on your account over this period, simply divide your account value by $1,000 (for example, an $8,600 account value divided by $1,000 = 8.60), then multiply the results by the number in the Expenses paid per $1,000 line for the class of shares you own.
| Expenses and Value of a $1,000 Investment | | | | | | |
| assuming actual returns for the six months ended December 31, 2006 | | | | |
| | | Class A | | Class B | | Class C | | Class F | | Class R | | Class T |
| |
| |
| |
| |
| |
| |
|
| Expenses paid | | | | | | | | | | | | |
| per $1,000 † | | $ 8.01 | | $ 13.14 | | $ 13.09 | | $ 7.38 | | $ 6.17 | | $ 9.01 |
| Ending value | | | | | | | | | | | | |
| (after expenses) | | $1,090.00 | | $1,085.80 | | $1,085.90 | | $1,091.60 | | $1,092.30 | | $1,090.00 |
| COMPARING YOUR FUND’S EXPENSES |
| WITH THOSE OF OTHER FUNDS (Unaudited) |
Using the SEC’s method to compare expenses
The Securities and Exchange Commission (SEC) has established guidelines to help investors assess fund expenses. Per these guidelines, the table below shows your fund's expenses based on a $1,000 investment, assuming a hypothetical 5% annualized return. You can use this information to compare the ongoing expenses (but not transaction expenses or total cost) of investing in the fund with those of other funds.All mutual fund shareholder reports will provide this information to help you make this comparison. Please note that you cannot use this information to estimate your actual ending account balance and expenses paid during the period.
| Expenses and Value of a $1,000 Investment |
| assuming a hypothetical 5% annualized return for the six months ended December 31, 2006 |
| | | Class A | | Class B | | Class C | | Class F | | Class R | | Class T |
| |
| |
| |
| |
| |
| |
|
| Expenses paid per | | | | | | | | | | | | |
| $1,000 † | | $ 7.73 | | $ 12.68 | | $ 12.63 | | $ 7.12 | | $ 5.96 | | $ 8.69 |
| Ending value | | | | | | | | | | | | |
| (after expenses) | | $1,017.54 | | $1,012.60 | | $1,012.65 | | $1,018.15 | | $1,019.31 | | $1,016.59 |
| † Expenses are equal to the fund’s annualized expense ratio of 1.52% for Class A shares, 2.50% for Class B shares, |
| 2.49% for Class C shares, 1.40% for Class F shares, 1.17% for Class R shares and 1.71% for Class T shares; |
| multiplied by the average account value over the period, multiplied by 184/365 (to reflect the one-half year period). |
STATEMENT OF INVESTMENTS
December 31, 2006
|
| Common Stocks—64.8% | | Shares | | Value ($) |
| |
| |
|
| Aerospace & Defense—.4% | | | | |
| Empresa Brasileira de Aeronautica, ADR | | 5,525 | | 228,901 |
| Airlines—1.2% | | | | |
| AMR | | 8,000 a | | 241,840 |
| Continental Airlines, Cl. B | | 7,300 a | | 301,125 |
| US Airways Group | | 3,100 a | | 166,935 |
| | | | | 709,900 |
| Apparel Retail—.7% | | | | |
| Gap | | 10,086 | | 196,677 |
| Limited Brands | | 8,019 | | 232,070 |
| | | | | 428,747 |
| Application Software—1.1% | | | | |
| Autodesk | | 9,519 a | | 385,139 |
| Cognos | | 6,491 a | | 275,608 |
| | | | | 660,747 |
| Asset Management & Custody Banks—.4% | | |
| State Street | | 3,800 | | 256,272 |
| Biotechnology—1.8% | | | | |
| Amgen | | 6,860 a | | 468,607 |
| Genzyme | | 2,900 a | | 178,582 |
| MedImmune | | 13,422 a | | 434,470 |
| | | | | 1,081,659 |
| Broadcasting & Cable TV—.8% | | | | |
| Comcast, Cl. A (Special) | | 11,600 a | | 485,808 |
| Building Products—.5% | | | | |
| Masco | | 10,042 | | 299,955 |
| Coal—.3% | | | | |
| Peabody Energy | | 4,214 | | 170,288 |
| Communications Equipment—3.7% | | | | |
| Cisco Systems | | 47,753 a | | 1,305,089 |
| Corning | | 18,334 a | | 343,029 |
| Motorola | | 12,028 | | 247,296 |
| Nokia, ADR | | 20,278 | | 412,049 |
| | | | | 2,307,463 |
| Computer & Electronics Retail—.7% | | | | |
| Best Buy | | 8,886 | | 437,102 |
The Fund 9
STATEMENT OF INVESTMENTS (continued)
|
| Common Stocks (continued) | | Shares | | Value ($) |
| |
| |
|
| Computer Hardware—3.9% | | | | |
| Apple Computer | | 9,942 a | | 843,479 |
| Diebold | | 11,664 | | 543,542 |
| Hewlett-Packard | | 20,300 | | 836,157 |
| Sun Microsystems | | 39,120 a | | 212,030 |
| | | | | 2,435,208 |
| Computer Storage & Peripherals—1.4% | | | | |
| EMC/Massachusetts | | 21,576 a | | 284,803 |
| SanDisk | | 4,500 a | | 193,635 |
| Seagate Technology | | 14,921 | | 395,407 |
| | | | | 873,845 |
| Consumer Electronics—.3% | | | | |
| Harman International Industries | | 1,554 | | 155,260 |
| Data Processing & Outsourced Services—.7% | | | | |
| Automatic Data Processing | | 6,800 | | 334,900 |
| Western Union | | 4,707 | | 105,531 |
| | | | | 440,431 |
| Department Stores—.9% | | | | |
| Federated Department Stores | | 14,200 | | 541,446 |
| Diversified Chemicals—.5% | | | | |
| E.I. du Pont de Nemours & Co. | | 6,800 | | 331,228 |
| Diversified Financial Services—1.4% | | | | |
| Citigroup | | 5,028 | | 280,060 |
| JPMorgan Chase & Co. | | 12,000 | | 579,600 |
| | | | | 859,660 |
| Environmental & Facilities Services—.6% | | | | |
| Waste Management | | 9,433 | | 346,852 |
| Exchange Traded Funds—3.0% | | | | |
| iShares Russell 1000 Growth Index Fund | | 11,544 | | 635,266 |
| NASDAQ-100 Index Trust Series 1 | | 13,900 | | 599,924 |
| Standard & Poor’s Depository Receipts (Tr. Ser. 1) | | 4,514 | | 639,589 |
| | | | | 1,874,779 |
| Food Distributors—.4% | | | | |
| SYSCO | | 6,720 | | 247,027 |
| Food Retail—.5% | | | | |
| Safeway | | 8,611 | | 297,596 |
| Health Care Equipment—1.1% | | | | |
| Zimmer Holdings | | 8,365 a | | 655,649 |
| |
| 10 | | | | |
| Common Stocks (continued) | | Shares | | Value ($) |
| |
| |
|
| Home Entertainment Software—1.1% | | | | |
| Electronic Arts | | 13,000 a | | 654,680 |
| Home Furnishing Retail—.2% | | | | |
| Williams-Sonoma | | 4,109 | | 129,187 |
| Hotels, Resorts & Cruise Lines—.3% | | | | |
| Marriott International, Cl. A | | 3,663 | | 174,798 |
| Household Products—2.5% | | | | |
| Colgate-Palmolive | | 11,550 | | 753,522 |
| Procter & Gamble | | 12,457 | | 800,611 |
| | | | | 1,554,133 |
| Hypermarkets & Super Centers—1.4% | | | | |
| Wal-Mart Stores | | 18,364 | | 848,050 |
| Industrial Conglomerates—2.3% | | | | |
| General Electric | | 37,426 | | 1,392,621 |
| Integrated Oil & Gas—2.3% | | | | |
| Chevron | | 4,629 | | 340,370 |
| Exxon Mobil | | 13,700 | | 1,049,831 |
| | | | | 1,390,201 |
| Internet Software & Services—2.0% | | | | |
| Google, Cl. A | | 2,015 a | | 927,867 |
| Yahoo! | | 10,994 a | | 280,787 |
| | | | | 1,208,654 |
| Investment Banking & Brokerage—2.9% | | |
| Charles Schwab | | 38,400 | | 742,656 |
| Goldman Sachs Group | | 2,994 | | 596,854 |
| Morgan Stanley | | 5,734 | | 466,920 |
| | | | | 1,806,430 |
| IT Consulting & | | | | |
| Other Services—.6% | | | | |
| Accenture, Cl. A | | 10,488 | | 387,322 |
| Life Sciences Tools & Services—.7% | | | | |
| Thermo Fisher Scientific | | 9,167 a | | 415,173 |
| Movies & Entertainment—.7% | | | | |
| Walt Disney | | 12,430 | | 425,976 |
| Multi-Line Insurance—.5% | | | | |
| American International Group | | 4,715 | | 337,877 |
| Oil & Gas Equipment & Services—.8% | | | | |
| Schlumberger | | 7,979 | | 503,954 |
The Fund 11
STATEMENT OF INVESTMENTS (continued)
|
| Common Stocks (continued) | | Shares | | Value ($) |
| |
| |
|
| Packaged Foods & Meats—1.2% | | | | |
| Cadbury Schweppes, ADR | | 4,959 | | 212,890 |
| Dean Foods | | 7,234 a | | 305,854 |
| Unilever (NY Shares) | | 8,064 | | 219,744 |
| | | | | 738,488 |
| Personal Products—1.1% | | | | |
| Avon Products | | 20,505 | | 677,485 |
| Pharmaceutical—5.6% | | | | |
| Allergan | | 5,397 | | 646,237 |
| Bristol-Myers Squibb | | 8,035 | | 211,481 |
| Covance | | 3,471 a | | 204,477 |
| Eli Lilly & Co. | | 3,792 | | 197,563 |
| Johnson & Johnson | | 12,813 | | 845,914 |
| Pfizer | | 12,823 | | 332,116 |
| Schering-Plough | | 25,398 | | 600,409 |
| Wyeth | | 9,360 | | 476,611 |
| | | | | 3,514,808 |
| Property & Casualty Insurance—.8% | | | | |
| Allstate | | 7,900 | | 514,369 |
| Semiconductor Equipment—1.2% | | | | |
| ASML Holding (NY Shares) | | 22,099 a | | 544,298 |
| KLA-Tencor | | 4,442 | | 220,990 |
| | | | | 765,288 |
| Semiconductors—1.6% | | | | |
| Broadcom, Cl. A | | 6,235 a | | 201,453 |
| Linear Technology | | 9,457 | | 286,736 |
| Marvell Technology Group | | 8,618 a | | 165,379 |
| Texas Instruments | | 12,121 | | 349,085 |
| | | | | 1,002,653 |
| Soft Drinks—.9% | | | | |
| PepsiCo | | 9,000 | | 562,950 |
| Specialized Finance—.7% | | | | |
| Chicago Mercantile Exchange Holdings | | 503 | | 256,404 |
| Nasdaq Stock Market | | 5,598 a | | 172,362 |
| | | | | 428,766 |
| Common Stocks (continued) | | | | Shares | | Value ($) |
| |
| |
| |
|
| Specialty Stores—1.0% | | | | | | | | |
| AutoZone | | | | | | 1,436 a | | 165,944 |
| Tiffany & Co. | | | | | | 11,135 | | 436,937 |
| | | | | | | | | 602,881 |
| Systems Software—5.0% | | | | | | | | |
| Adobe Systems | | | | | | 21,242 a | | 873,471 |
| Microsoft | | | | | | 59,397 | | 1,773,594 |
| Oracle | | | | | | 26,064 a | | 446,737 |
| | | | | | | | | 3,093,802 |
| Tobacco—1.1% | | | | | | | | |
| Altria Group | | | | | | 7,733 | | 663,646 |
| Total Common Stocks | | | | | | | | |
| (cost $34,692,667) | | | | | | | | 39,920,015 |
| |
| |
| |
| |
|
| |
| | | Coupon | | Maturity | | Principal | | |
| Bonds and Notes—35.9% | | Rate (%) | | Date | | Amount ($) | | Value ($) |
| |
| |
| |
| |
|
| Asset-Backed Ctfs./ | | | | | | | | |
| Auto Receivables—.3% | | | | | | | | |
| Ford Credit Auto Owner Trust, | | | | | | |
| Ser. 2005-B, Cl. B | | 4.64 | | 4/15/10 | | 74,000 | | 73,429 |
| Hyundai Auto Receivables Trust, | | | | | | |
| Ser. 2006-B, Cl. C | | 5.25 | | 5/15/13 | | 100,000 | | 100,073 |
| | | | | | | | | 173,502 |
| Auto & Trucks—.0% | | | | | | | | |
| DaimlerChrysler N.A. Holding, | | | | | | | | |
| Gtd. Notes | | 8.50 | | 1/18/31 | | 25,000 | | 29,761 |
| Building And | | | | | | | | |
| Construction—.0% | | | | | | | | |
| Owens Corning, | | | | | | | | |
| Sr. Unscd. Notes | | 6.50 | | 12/1/16 | | 15,000 b | | 15,238 |
| Cable Television—.2% | | | | | | | | |
| Comcast Cable Communications, | | | | | | |
| Sr. Unsub. Notes | | 6.88 | | 6/15/09 | | 40,000 | | 41,378 |
| Comcast, | | | | | | | | |
| Gtd. Notes | | 5.50 | | 3/15/11 | | 65,000 | | 65,274 |
| | | | | | | | | 106,652 |
The Fund 13
| | STATEMENT OF INVESTMENTS (continued)
|
| | | Coupon | | Maturity | | Principal | | |
| Bonds and Notes (continued) | | Rate (%) | | Date | | Amount ($) | | Value ($) |
| |
| |
| |
| |
|
| Casinos—.1% | | | | | | | | |
| MGM Mirage, | | | | | | | | |
| Gtd. Notes | | 8.50 | | 9/15/10 | | 50,000 | | 53,500 |
| Cellular Telephone—.1% | | | | | | | | |
| AT & T Wireless, | | | | | | | | |
| Sr. Notes | | 8.75 | | 3/1/31 | | 20,000 | | 25,991 |
| Nextel Partners, | | | | | | | | |
| Gtd. Notes | | 8.13 | | 7/1/11 | | 50,000 | | 52,063 |
| | | | | | | | | 78,054 |
| Commercial Banks—.6% | | | | | | | | |
| Glitnir Banki, | | | | | | | | |
| Sub. Notes | | 6.69 | | 6/15/16 | | 100,000 b,c | | 103,237 |
| Landsbanki Islands, | | | | | | | | |
| Notes | | 6.10 | | 8/25/11 | | 50,000 b | | 50,834 |
| Wachovia Bank N.A., | | | | | | | | |
| Sub. Notes | | 5.00 | | 8/15/15 | | 115,000 | | 111,396 |
| Zions Bancorporation, | | | | | | | | |
| Sub. Notes | | 6.00 | | 9/15/15 | | 85,000 | | 86,558 |
| | | | | | | | | 352,025 |
| Commercial Mortgage | | | | | | | | |
| Pass-Through Ctfs.—1.4% | | | | | | | | |
| Bear Stearns Commercial Mortgage | | | | | | | | |
| Securities, Ser. 2006-PW14, | | | | | | | | |
| Cl. AAB | | 5.17 | | 12/1/38 | | 190,000 | | 191,036 |
| Bear Stearns Commercial Mortgage | | | | | | | | |
| Securities, Ser. 2006-PW13, Cl. A3 | | 5.52 | | 9/11/41 | | 30,000 | | 30,338 |
| Bear Stearns Commercial Mortgage | | | | | | | | |
| Securities, Ser. 2006-T24, Cl. AAB | | 5.53 | | 10/12/41 | | 110,000 | | 111,374 |
| Crown Castle Towers, | | | | | | | | |
| Ser. 2006-1A, Cl. D | | 5.77 | | 11/15/36 | | 55,000 b | | 54,965 |
| Global Signal Trust, | | | | | | | | |
| Ser. 2006-1, Cl. D | | 6.05 | | 2/15/36 | | 45,000 b | | 45,439 |
| J.P. Morgan Chase Commercial | | | | | | | | |
| Mortgage Securities, | | | | | | | | |
| Ser. 2006-LDP7, Cl. ASB | | 5.88 | | 4/15/45 | | 125,000 c | | 129,380 |
| Morgan Stanley Capital I, | | | | | | | | |
| Ser. 2006-IQ12, Cl. AAB | | 5.33 | | 12/15/43 | | 110,000 c | | 109,902 |
| Morgan Stanley Capital I, | | | | | | | | |
| Ser. 2006-HQ9, Cl. A3 | | 5.71 | | 7/12/44 | | 215,000 | | 219,728 |
| | | | | | | | | 892,162 |
14
| | | Coupon | | Maturity | | Principal | | |
| Bonds and Notes (continued) | | Rate (%) | | Date | | Amount ($) | | Value ($) |
| |
| |
| |
| |
|
| Consumer Finance—.4% | | | | | | | | |
| HSBC Finance, | | | | | | | | |
| Notes | | 5.50 | | 1/19/16 | | 110,000 | | 110,519 |
| SLM, | | | | | | | | |
| Notes, Ser. A | | 5.00 | | 4/15/15 | | 115,000 | | 110,603 |
| | | | | | | | | 221,122 |
| Containers-Metal & | | | | | | | | |
| Glass—.0% | | | | | | | | |
| Ball, | | | | | | | | |
| Gtd. Notes | | 6.88 | | 12/15/12 | | 15,000 | | 15,300 |
| Containers-Paper—.1% | | | | | | | | |
| Sealed Air, | | | | | | | | |
| Notes | | 5.63 | | 7/15/13 | | 60,000 b | | 59,368 |
| Diversified Chemicals—.3% | | | | | | | | |
| BTM (Curacao) Holdings, | | | | | | | | |
| Bank Gtd. Notes | | 4.76 | | 7/21/15 | | 175,000 b,c | | 171,217 |
| Diversified Financial | | | | | | | | |
| Services—.1% | | | | | | | | |
| CIT Group Funding, | | | | | | | | |
| Gtd. Notes | | 5.60 | | 11/2/11 | | 85,000 | | 85,605 |
| Drug Retail—.0% | | | | | | | | |
| CVS, | | | | | | | | |
| Sr. Unscd. Notes | | 5.75 | | 8/15/11 | | 25,000 | | 25,301 |
| Electric—Integrated—1.1% | | | | | | | | |
| Consolidated Edison, | | | | | | | | |
| Sr. Unscd. Debs, Ser. D | | 5.30 | | 12/1/16 | | 90,000 | | 88,446 |
| Dominion Resources/VA, | | | | | | | | |
| Sr. Unscd. Notes, Ser. E | | 7.20 | | 9/15/14 | | 100,000 | | 109,731 |
| DTE Energy, | | | | | | | | |
| Sr. Unsub. Notes | | 6.35 | | 6/1/16 | | 55,000 | | 57,133 |
| FPL Group Capital, | | | | | | | | |
| Gtd. Notes | | 5.63 | | 9/1/11 | | 110,000 | | 111,205 |
| Gulf Power, | | | | | | | | |
| Sr. Unsub. Notes, Ser. M | | 5.30 | | 12/1/16 | | 110,000 | | 108,265 |
| NiSource Finance, | | | | | | | | |
| Gtd. Notes | | 5.25 | | 9/15/17 | | 35,000 | | 32,804 |
| PacifiCorp, | | | | | | | | |
| First Mortgage Bonds, | | 6.90 | | 11/15/11 | | 150,000 | | 159,863 |
| | | | | | | | | 667,447 |
The Fund 15
| | STATEMENT OF INVESTMENTS (continued)
|
| | | Coupon | | Maturity | | Principal | | |
| Bonds and Notes (continued) | | Rate (%) | | Date | | Amount ($) | | Value ($) |
| |
| |
| |
| |
|
| Electronics Distributors—.1% | | | | | | | | |
| National Grid, | | | | | | | | |
| Sr. Unscd. Notes | | 6.30 | | 8/1/16 | | 50,000 | | 51,784 |
| Food Retail—.1% | | | | | | | | |
| Safeway, | | | | | | | | |
| Sr. Unscd. Notes | | 5.63 | | 8/15/14 | | 45,000 | | 44,404 |
| Foreign/Governmental—.2% | | | | | | | | |
| Republic of Peru, | | | | | | | | |
| Notes | | 9.13 | | 2/21/12 | | 50,000 | | 57,750 |
| United Mexican States, | | | | | | | | |
| Notes, Ser. A | | 8.00 | | 9/24/22 | | 45,000 | | 54,990 |
| | | | | | | | | 112,740 |
| Forest Products—.1% | | | | | | | | |
| Weyerhaeuser, | | | | | | | | |
| Debs. | | 7.25 | | 7/1/13 | | 40,000 | | 42,511 |
| Gaming—.0% | | | | | | | | |
| Mohegan Tribal Gaming Authority, | | | | | | | | |
| Sr. Notes | | 6.13 | | 2/15/13 | | 30,000 | | 29,775 |
| Integrated Oil & Gas—.2% | | | | | | | | |
| PC Financial Partnership, | | | | | | | | |
| Notes | | 5.00 | | 11/15/14 | | 115,000 | | 109,535 |
| Integrated Telecommunication | | | | | | | | |
| Services—.5% | | | | | | | | |
| AT & T, | | | | | | | | |
| Sr. Notes | | 7.30 | | 11/15/11 | | 100,000 | | 108,268 |
| Deutsche Telekom International | | | | | | | | |
| Finance, Gtd. Bonds | | 8.25 | | 6/15/30 | | 50,000 | | 61,467 |
| KPN, | | | | | | | | |
| Sr. Unsub. Bonds | | 8.38 | | 10/1/30 | | 15,000 | | 17,186 |
| Telefonica Emisiones, | | | | | | | | |
| Gtd. Notes | | 5.98 | | 6/20/11 | | 100,000 | | 101,793 |
| | | | | | | | | 288,714 |
| Investment Banking & | | | | | | | | |
| Brokerage—3.0% | | | | | | | | |
| Bear Stearns, | | | | | | | | |
| Notes | | 3.25 | | 3/25/09 | | 170,000 | | 163,090 |
| Bear Stearns, | | | | | | | | |
| Sr. Unscd. Notes | | 5.50 | | 8/15/11 | | 90,000 | | 90,887 |
| Credit Suisse First Boston USA, | | | | | | | | |
| Notes | | 4.13 | | 1/15/10 | | 165,000 | | 160,079 |
16
| | | Coupon | | Maturity | | Principal | | |
| Bonds and Notes (continued) | | Rate (%) | | Date | | Amount ($) | | Value ($) |
| |
| |
| |
| |
|
| Investment Banking & | | | | | | | | |
| Brokerage (continued) | | | | | | | | |
| Credit Suisse USA, | | | | | | | | |
| Sr. Unsub. Notes | | 5.50 | | 8/16/11 | | 125,000 | | 126,362 |
| Goldman Sachs Group, | | | | | | | | |
| Sr. Notes | | 5.35 | | 1/15/16 | | 110,000 | | 108,573 |
| Jefferies Group, | | | | | | | | |
| Sr. Notes | | 5.50 | | 3/15/16 | | 120,000 | | 116,850 |
| JPMorgan Chase & Co., | | | | | | | | |
| Sub. Notes | | 5.13 | | 9/15/14 | | 115,000 | | 113,081 |
| Kaupthing Bank, | | | | | | | | |
| Notes | | 7.13 | | 5/19/16 | | 100,000 b | | 106,068 |
| Lehman Brothers Holdings, | | | | | | | | |
| Notes | | 4.25 | | 1/27/10 | | 165,000 | | 160,615 |
| Lehman Brothers Holdings, | | | | | | | | |
| Notes | | 5.50 | | 4/4/16 | | 85,000 | | 84,988 |
| Merrill Lynch & Co., | | | | | | | | |
| Notes | | 4.79 | | 8/4/10 | | 165,000 | | 162,754 |
| Merrill Lynch & Co., | | | | | | | | |
| Sub. Notes | | 6.22 | | 9/15/26 | | 165,000 | | 170,027 |
| Morgan Stanley, | | | | | | | | |
| Notes | | 4.00 | | 1/15/10 | | 170,000 | | 164,493 |
| Morgan Stanley, | | | | | | | | |
| Sr. Unscd. Notes | | 6.25 | | 8/9/26 | | 100,000 | | 104,569 |
| | | | | | | | | 1,832,436 |
| Investment Managers—.2% | | | | | | | | |
| Amvescap, | | | | | | | | |
| Notes | | 5.38 | | 12/15/14 | | 115,000 | | 112,927 |
| Leasing—.2% | | | | | | | | |
| Boeing Capital, | | | | | | | | |
| Sr. Notes | | 7.38 | | 9/27/10 | | 100,000 | | 107,210 |
| Life Insurance—.2% | | | | | | | | |
| Lincoln National, | | | | | | | | |
| Bonds | | 7.00 | | 5/17/66 | | 105,000 c | | 111,288 |
| Prudential Financial, | | | | | | | | |
| Notes | | 5.10 | | 12/14/11 | | 40,000 | | 39,659 |
| | | | | | | | | 150,947 |
| Machinery-Construction & Mining—.0% | | | | | | |
| Terex, | | | | | | | | |
| Gtd. Notes | | 7.38 | | 1/15/14 | | 30,000 | | 30,450 |
The Fund 17
| | STATEMENT OF INVESTMENTS (continued)
|
| | | Coupon | | Maturity | | Principal | | |
| Bonds and Notes (continued) | | Rate (%) | | Date | | Amount ($) | | Value ($) |
| |
| |
| |
| |
|
| Mortgage Banking—.3% | | | | | | | | |
| Countrywide Home Loans, | | | | | | | | |
| Gtd. Notes, Ser. L | | 4.00 | | 3/22/11 | | 115,000 | | 109,176 |
| Residential Capital, | | | | | | | | |
| Gtd. Notes | | 6.13 | | 11/21/08 | | 55,000 | | 55,272 |
| | | | | | | | | 164,448 |
| Multi-Line Insurance—.4% | | | | | | | | |
| American International Group, | | | | | | | | |
| Sr. Notes | | 5.05 | | 10/1/15 | | 115,000 | | 111,823 |
| MetLife, | | | | | | | | |
| Sr. Unscd. Notes | | 5.00 | | 6/15/15 | | 115,000 | | 111,536 |
| | | | | | | | | 223,359 |
| Multimedia—.2% | | | | | | | | |
| AOL Time Warner, | | | | | | | | |
| Gtd. Notes | | 6.75 | | 4/15/11 | | 50,000 | | 52,340 |
| News America Holdings, | | | | | | | | |
| Debs. | | 7.70 | | 10/30/25 | | 50,000 | | 56,231 |
| | | | | | | | | 108,571 |
| Municipal—.3% | | | | | | | | |
| Michigan Tobacco Settlement | | | | | | | | |
| Finance Authority, Tobacco | | | | | | | | |
| Settlement Asset—Backed Bonds | | 7.43 | | 6/1/34 | | 200,000 c | | 200,220 |
| Paper & Paper Related—.1% | | | | | | | | |
| Georgia-Pacific, | | | | | | | | |
| Gtd. Notes | | 7.00 | | 1/15/15 | | 40,000 b | | 39,900 |
| Temple-Inland, | | | | | | | | |
| Bonds | | 6.63 | | 1/15/18 | | 45,000 | | 46,663 |
| | | | | | | | | 86,563 |
| Power Producers—1.3% | | | | | | | | |
| Tennessee Valley Authority, | | | | | | | | |
| Bonds, Ser. A | | 5.63 | | 1/18/11 | | 800,000 | | 818,522 |
| Real Estate Investment | | | | | | | | |
| Trusts—.7% | | | | | | | | |
| Archstone-Smith Operating Trust, | | | | | | | | |
| Sr. Unscd. Notes | | 5.25 | | 5/1/15 | | 60,000 | | 58,871 |
| Boston Properties, | | | | | | | | |
| Sr. Notes | | 5.63 | | 4/15/15 | | 85,000 | | 85,303 |
| Federal Realty Investment Trust, | | | | | | | | |
| Notes | | 6.00 | | 7/15/12 | | 20,000 | | 20,413 |
| Federal Realty Investment Trust, | | | | | | | | |
| Bonds | | 6.20 | | 1/15/17 | | 55,000 | | 56,730 |
18
| | | Coupon | | Maturity | | Principal | | |
| Bonds and Notes (continued) | | Rate (%) | | Date | | Amount ($) | | Value ($) |
| |
| |
| |
| |
|
| Real Estate Investment | | | | | | | | |
| Trusts (continued) | | | | | | | | |
| Healthcare Realty Trust, | | | | | | | | |
| Sr. Notes | | 8.13 | | 5/1/11 | | 50,000 | | 54,229 |
| Host Hotels & Resorts, | | | | | | | | |
| Gtd. Notes | | 6.88 | | 11/1/14 | | 10,000 b | | 10,125 |
| Liberty Property, | | | | | | | | |
| Sr. Unscd. Notes | | 5.50 | | 12/15/16 | | 20,000 | | 19,717 |
| Mack-Cali Realty, | | | | | | | | |
| Notes | | 7.75 | | 2/15/11 | | 50,000 | | 53,870 |
| Simon Property, | | | | | | | | |
| Notes | | 5.63 | | 8/15/14 | | 85,000 | | 85,720 |
| | | | | | | | | 444,978 |
| Real Estate Management & | | | | | | | | |
| Development—.4% | | | | | | | | |
| Duke Realty, | | | | | | | | |
| Sr. Notes | | 5.88 | | 8/15/12 | | 85,000 | | 86,326 |
| EOP Operating, | | | | | | | | |
| Sr. Notes | | 7.00 | | 7/15/11 | | 50,000 | | 54,109 |
| ERP Operating, | | | | | | | | |
| Notes | | 5.13 | | 3/15/16 | | 60,000 | | 58,271 |
| ERP Operating, | | | | | | | | |
| Unscd. Notes | | 5.20 | | 4/1/13 | | 50,000 | | 49,443 |
| | | | | | | | | 248,149 |
| Retail Trade-Department Stores—.0% | | | | | | |
| Federated Retail Holding, | | | | | | | | |
| Gtd. Notes | | 5.90 | | 12/1/16 | | 20,000 | | 19,969 |
| Savings & Loans—1.3% | | | | | | | | |
| Chevy Chase Bank, F.S.B., | | | | | | | | |
| Sub. Notes | | 6.88 | | 12/1/13 | | 55,000 | | 55,000 |
| Washington Mutual, | | | | | | | | |
| Sub. Notes | | 4.63 | | 4/1/14 | | 150,000 | | 140,423 |
| Washington Mutual, | | | | | | | | |
| Sub. Notes | | 8.25 | | 4/1/10 | | 540,000 | | 581,653 |
| | | | | | | | | 777,076 |
| Specialty Chemicals—.0% | | | | | | | | |
| Lubrizol, | | | | | | | | |
| Sr. Notes | | 5.50 | | 10/1/14 | | 30,000 | | 29,246 |
| Transportation-Rail—.3% | | | | | | | | |
| Norfolk Southern, | | | | | | | | |
| Sr. Notes | | 6.75 | | 2/15/11 | | 50,000 | | 52,583 |
The Fund 19
| | STATEMENT OF INVESTMENTS (continued)
|
| | | Coupon | | Maturity | | Principal | | |
| Bonds and Notes (continued) | | Rate (%) | | Date | | Amount ($) | | Value ($) |
| |
| |
| |
| |
|
| Transportation-Rail (continued) | | | | | | | | |
| Union Pacific, | | | | | | | | |
| Notes | | 3.88 | | 2/15/09 | | 85,000 | | 82,477 |
| Union Pacific, | | | | | | | | |
| Notes | | 5.75 | | 10/15/07 | | 25,000 | | 25,014 |
| | | | | | | | | 160,074 |
| U.S. Government Agencies—5.5% | | | | | | |
| Federal Farm Credit Bank, | | | | | | | | |
| Bonds | | 4.26 | | 9/30/10 | | 1,040,000 | | 1,015,155 |
| Federal Home Loan Banks, | | | | | | | | |
| Bonds, Ser. 617 | | 4.75 | | 1/11/08 | | 500,000 | | 497,685 |
| Federal Home Loan Mortgage Corp., | | | | | | |
| Notes | | 4.13 | | 7/12/10 | | 1,000,000 | | 975,290 |
| Federal Home Loan Mortgage Corp., | | | | | | |
| Notes | | 5.13 | | 7/15/12 | | 900,000 | | 907,506 |
| | | | | | | | | 3,395,636 |
| U.S. Government Agencies/ | | | | | | | | |
| Mortgage-Backed—12.6% | | | | | | | | |
| Federal Home Loan Mortgage Corp | | | | | | | | |
| 4.50% | | | | | | 450,000 d | | 433,548 |
| 5.50% | | | | | | 875,000 d | | 874,458 |
| 6.00% | | | | | | 850,000 d | | 861,430 |
| Federal National Mortgage Association | | | | | | |
| 5.00% | | | | | | 1,985,000 d | | 1,928,568 |
| 5.50% | | | | | | 2,700,000 d | | 2,668,761 |
| 6.00% | | | | | | 1,015,000 d | | 1,021,973 |
| | | | | | | | | 7,788,738 |
| U.S. Government Securities—2.7% | | | | | | |
| U.S. Treasury Bonds | | 4.50 | | 2/15/36 | | 838,000 | | 796,886 |
| U.S. Treasury Inflation Protected | | | | | | | | |
| Securities | | 2.00 | | 1/15/16 | | 223,722 e | | 216,018 |
| U.S. Treasury Notes | | 4.50 | | 9/30/11 | | 235,000 | | 232,935 |
| U.S. Treasury Notes | | 4.88 | | 8/15/16 | | 390,000 | | 394,662 |
| | | | | | | | | 1,640,501 |
| Waste Management—.3% | | | | | | | | |
| Republic Services, | | | | | | | | |
| Sr. Notes | | 6.75 | | 8/15/11 | | 80,000 | | 83,854 |
| Waste Management, | | | | | | | | |
| Gtd. Notes | | 6.88 | | 5/15/09 | | 105,000 | | 108,544 |
| | | | | | | | | 192,398 |
| Total Bonds and Notes | | | | | | | | |
| (cost $22,202,127) | | | | | | | | 22,158,135 |
20
| Other Investment—13.6% | | Shares | | Value ($) |
| |
| |
|
| Registered Investment Company; | | | | |
| Dreyfus Institutional Preferred | | | | |
| Plus Money Market Fund | | | | |
| (cost $8,398,000) | | 8,398,000 f | | 8,398,000 |
| |
| |
|
| Total Investments (cost $65,292,794) | | 114.3% | | 70,476,150 |
| Liabilities, Less Cash and Receivables | | (14.3%) | | (8,806,304) |
| Net Assets | | 100.0% | | 61,669,846 |
| ADR—American Depository Receipts |
| a Non-income producing security. |
| b Securities exempt from registration under Rule 144A of the Securities Act of 1933.These securities may be resold in |
| transactions exempt from registration, normally to qualified institutional buyers. At December 31, 2006, these |
| securities amounted to $656,391 or 1.1% of net assets. |
| c Variable rate security—interest rate subject to periodic change. |
| d Purchased on a forward commitment basis. |
| e Principal amount for accrual purposes is periodically adjusted based on changes in the Consumer Price Index. |
| f Investment in affiliated money market mutual fund. |
| Portfolio Summary (Unaudited) † | | | | |
| |
| | | Value (%) | | | | Value (%) |
| |
| |
| |
|
| Information Technology | | 22.4 | | Energy | | 3.3 |
| Healthcare | | 9.2 | | Materials | | .5 |
| Consumer Staples | | 9.1 | | Other | | 2.5 |
| Financials | | 6.8 | | Fixed Income Investments | | 35.9 |
| Consumer Discretionary | | 5.5 | | | | |
| Industrials | | 4.8 | | | | 100.0 |
| † Based on net assets. |
| See notes to financial statements. |
The Fund 21
STATEMENT OF ASSETS AND LIABILITIES
December 31, 2006
| | | Cost | | Value |
| |
| |
|
| Assets ($): | | | | |
| Investments in securities—See Statement of Investments: | | |
| Unaffiliated issuers | | 56,894,794 | | 62,078,150 |
| Affiliated issuers | | 8,398,000 | | 8,398,000 |
| Cash | | | | 138,798 |
| Receivable for investment securities sold | | 478,461 |
| Dividends and interest receivable | | | | 333,460 |
| Receivable for shares of Common Stock subscribed | | 16,353 |
| Prepaid expenses | | | | 21,399 |
| Other assets | | | | 284,465 |
| | | | | 71,749,086 |
| |
| |
|
| Liabilities ($): | | | | |
| Due to The Founders Asset Management LLC and affiliates—Note 3(c) | | 68,028 |
| Payable for investment securities purchased | | 8,197,274 |
| Payable for shares of Common Stock redeemed | | 1,459,987 |
| Directors’ deferred compensation | | | | 284,465 |
| Accrued expenses | | | | 69,486 |
| | | | | 10,079,240 |
| |
| |
|
| Net Assets ($) | | | | 61,669,846 |
| |
| |
|
| Composition of Net Assets ($): | | | | |
| Paid-in capital | | | | 238,041,298 |
| Accumulated investment (loss)—net | | | | (49,576) |
| Accumulated net realized gain (loss) on investments | | (181,523,395) |
| Accumulated net unrealized appreciation | | |
| (depreciation) on investments | | | | 5,201,519 |
| |
| |
|
| Net Assets ($) | | | | 61,669,846 |
| Net Asset Value Per Share | | | | | | | | | | |
| | | Class A | | Class B | | Class C | | Class F | | Class R | | Class T |
| |
| |
| |
| |
| |
| |
|
| Net Assets ($) | | 1,975,680 | | 441,568 | | 181,183 | | 58,968,709 | | 45,955 | | 56,751 |
| Shares Outstanding | | 214,853 | | 47,795 | | 20,020 | | 6,407,115 | | 5,025.376 | | 5,992 |
| |
| |
| |
| |
| |
| |
|
| Net Asset Value | | | | | | | | | | | | |
| Per Share ($) | | 9.20 | | 9.24 | | 9.05 | | 9.20 | | 9.14 | | 9.47 |
| |
| See notes to financial statements. | | | | | | | | | | |
STATEMENT OF OPERATIONS
Year Ended December 31, 2006
|
| Investment Income ($): | | |
| Income: | | |
| Dividends (net of $2,615 foreign taxes withheld at source): | | |
| Unaffiliated issuers | | 509,460 |
| Affiliated issuers | | 166,296 |
| Interest | | 1,175,996 |
| Total Income | | 1,851,752 |
| Expenses: | | |
| Investment advisory fee—Note 3(a) | | 426,588 |
| Distribution fees—Note 3(b) | | 162,745 |
| Shareholder servicing costs—Note 3(c) | | 129,879 |
| Registration fees | | 50,739 |
| Prospectus and shareholders’ reports | | 47,760 |
| Accounting fees—Note 3( c) | | 37,938 |
| Professional fees | | 28,535 |
| Directors’ fees and expenses—Note 3(d) | | 39,193 |
| Custodian fees—Note 3(c) | | 7,041 |
| Loan commitment fees—Note 2 | | 2,414 |
| Interest expense—Note 2 | | 230 |
| Miscellaneous | | 15,345 |
| Total Expenses | | 948,407 |
| Less—expense offset to broker commissions—Note 1 | | (1,960) |
| Less—reduction in custody fees due to waiver—Note 3(c) | | (474) |
| Less—reduction in custody fees due to | | |
| earnings credits—Note 1(c) | | (3,306) |
| Less—reimbursed/waived expenses—Note 3(c) | | (176) |
| Net Expenses | | 942,491 |
| Investment Income—Net | | 909,261 |
| |
|
| Realized and Unrealized Gain (Loss) on Investments—Note 4 ($): |
| Net realized gain (loss) on investments | | 2,944,480 |
| Net change in unrealized appreciation (depreciation) on investments | | 2,332,121 |
| Net Realized and Unrealized Gain (Loss) on Investments | | 5,276,601 |
| Net Increase in Net Assets Resulting from Operations | | 6,185,862 |
| |
| See notes to financial statements. | | |
The Fund 23
STATEMENT OF CHANGES IN NET ASSETS
| | | Year Ended December 31, |
| |
|
| | | 2006 | | 2005 |
| |
| |
|
| Operations ($): | | | | |
| Investment income—net | | 909,261 | | 929,198 |
| Net realized gain (loss) on investments | | 2,944,480 | | 10,647,924 |
| Net change in unrealized appreciation | | | | |
| (depreciation) on investments | | 2,332,121 | | (9,571,705) |
| Net Increase (Decrease) in Net Assets | | |
| Resulting from Operations | | 6,185,862 | | 2,005,417 |
| |
| |
|
| Dividends to Shareholders from ($): | | | | |
| Investment income—net: | | | | |
| Class A shares | | (45,385) | | (16,241) |
| Class B shares | | (334) | | (1,226) |
| Class C shares | | (1,027) | | (165) |
| Class F shares | | (1,580,307) | | (925,766) |
| Class R shares | | (1,485) | | (776) |
| Class T shares | | (1,052) | | (240) |
| Total Dividends | | (1,629,590) | | (944,414) |
| |
| |
|
| Capital Stock Transactions ($): | | | | |
| Net proceeds from shares sold: | | | | |
| Class A shares | | 671,584 | | 480,146 |
| Class B shares | | 121,336 | | 163,928 |
| Class C shares | | 23,263 | | 4,356 |
| Class F shares | | 3,863,377 | | 6,098,334 |
| Class R shares | | 203 | | 2,500 |
| Class T shares | | 18,236 | | 100 |
| | | Year Ended December 31, |
| |
|
| | | 2006 | | 2005 |
| |
| |
|
| Capital Stock Transactions ($) (continued): | | |
| Dividends reinvested: | | | | |
| Class A shares | | 40,018 | | 15,071 |
| Class B shares | | 254 | | 919 |
| Class C shares | | 505 | | 99 |
| Class F shares | | 1,528,006 | | 897,919 |
| Class R shares | | 1,484 | | 776 |
| Class T shares | | 729 | | 130 |
| Cost of shares redeemed: | | | | |
| Class A shares | | (630,365) | | (443,070) |
| Class B shares | | (781,673) | | (752,663) |
| Class C shares | | (46,335) | | (81,911) |
| Class F shares | | (19,699,238) | | (28,788,616) |
| Class R shares | | (13,000) | | (9,000) |
| Class T shares | | (103) | | (1,086) |
| Increase (Decrease) in Net Assets | | | | |
| from Capital Stock Transactions | | (14,901,719) | | (22,412,068) |
| Total Increase (Decrease) in Net Assets | | (10,345,447) | | (21,351,065) |
| |
| |
|
| Net Assets ($): | | | | |
| Beginning of Period | | 72,015,293 | | 93,366,358 |
| End of Period | | 61,669,846 | | 72,015,293 |
| Undistributed (distribution in excess of) | | | | |
| investment income—net | | (49,576) | | 670,753 |
The Fund 25
STATEMENT OF CHANGES IN NET ASSETS (continued)
|
| | | Year Ended December 31, |
| |
|
| | | 2006 | | 2005 |
| |
| |
|
| Capital Share Transactions: | | | | |
| Class A a | | | | |
| Shares sold | | 76,063 | | 57,061 |
| Shares issued for dividends reinvested | | 4,419 | | 1,781 |
| Shares redeemed | | (70,773) | | (52,764) |
| Net Increase (Decrease) in Shares Outstanding | | 9,709 | | 6,078 |
| |
| |
|
| Class B a | | | | |
| Shares sold | | 13,825 | | 19,802 |
| Shares issued for dividends reinvested | | 29 | | 109 |
| Shares redeemed | | (89,931) | | (90,247) |
| Net Increase (Decrease) in Shares Outstanding | | (76,077) | | (70,336) |
| |
| |
|
| Class C | | | | |
| Shares sold | | 2,778 | | 536 |
| Shares issued for dividends reinvested | | 57 | | 12 |
| Shares redeemed | | (5,354) | | (10,020) |
| Net Increase (Decrease) in Shares Outstanding | | (2,519) | | (9,472) |
| |
| |
|
| Class F | | | | |
| Shares sold | | 432,639 | | 724,211 |
| Shares issued for dividends reinvested | | 168,738 | | 106,167 |
| Shares redeemed | | (2,220,047) | | (3,407,950) |
| Net Increase (Decrease) in Shares Outstanding | | (1,618,670) | | (2,577,572) |
| |
| |
|
| Class R | | | | |
| Shares sold | | 22 | | 288 |
| Shares issued for dividends reinvested | | 165 | | 92 |
| Shares redeemed | | (1,453) | | (1,074) |
| Net Increase (Decrease) in Shares Outstanding | | (1,266) | | (694) |
| |
| |
|
| Class T | | | | |
| Shares sold | | 1,999 | | 11 |
| Shares issued for dividends reinvested | | 78 | | 15 |
| Shares redeemed | | (12) | | (127) |
| Net Increase (Decrease) in Shares Outstanding | | 2,065 | | (101) |
| a | | During the period ended December 31, 2006, 31,019 Class B shares representing $271,694 were automatically |
| | | converted to 30,728 Class A shares and during the period ended December 31, 2005, 24,206 Class B shares |
| | | representing $202,427 were automatically converted to 23,959 Class A shares. |
| See notes to financial statements. |
The following tables describe the performance for each share class for the fiscal periods indicated.All information (except portfolio turnover rate) reflects financial results for a single fund share.Total return shows how much your investment in the fund would have increased (or decreased) during each period, assuming you had reinvested all dividends and distributions.These figures have been derived from the fund’s financial statements.
| | | | | | | Year Ended December 31, | | |
| | | |
| |
| |
|
| Class A Shares | | 2006 | | 2005 | | 2004 | | 2003 | | 2002 |
| |
| |
| |
| |
| |
|
| Per Share Data ($): | | | | | | | | | | |
| Net asset value, beginning of period | | 8.58 | | 8.45 | | 7.88 | | 6.68 | | 8.18 |
| Investment Operations: | | | | | | | | | | |
| Investment income—net | | .12a | | .08 | | .08 | | .05 | | .05 |
| Net realized and unrealized | | | | | | | | | | |
| gain (loss) on investments | | .71 | | .13 | | .57 | | 1.20 | | (1.51) |
| Total from Investment Operations | | .83 | | .21 | | .65 | | 1.25 | | (1.46) |
| Distributions: | | | | | | | | | | |
| Dividends from investment income—net | | (.21) | | (.08) | | (.08) | | (.05) | | (.04) |
| Net asset value, end of period | | 9.20 | | 8.58 | | 8.45 | | 7.88 | | 6.68 |
| |
| |
| |
| |
| |
|
| Total Return (%) b | | 9.66 | | 2.51 | | 8.31 | | 18.81 | | (17.85) |
| |
| |
| |
| |
| |
|
| Ratios/Supplemental Data (%): | | | | | | | | | | |
| Ratio of total expenses | | | | | | | | | | |
| to average net assets | | 1.56 | | 1.69 | | 1.49 | | 1.83 | | 1.89 |
| Ratio of net expenses | | | | | | | | | | |
| to average net assets | | 1.56 | | 1.66 | | 1.48 | | 1.83 | | 1.89 |
| Ratio of net investment income | | | | | | | | | | |
| to average net assets | | 1.28 | | .90 | | .96 | | .63 | | .56 |
| Portfolio Turnover Rate c | | 197 | | 181 | | 134 | | 108 | | 122 |
| |
| |
| |
| |
| |
|
| Net Assets, end of period ($ x 1,000) | | 1,976 | | 1,760 | | 1,682 | | 1,572 | | 1,243 |
| |
| a | | Based on average shares outstanding at each month end. | | | | | | | | |
| b | | Exclusive of sales charge. | | | | | | | | | | |
| c | | Portfolio Turnover Rate is a measure of portfolio activity that is calculated by dividing the lesser of purchases or sales |
| | | of securities, excluding securities having maturity dates at acquisition of one year or less, by the average value of the |
| | | portfolio securities held during the period, which is a rolling 12-month period. | | | | |
| See notes to financial statements. | | | | | | | | | | |
The Fund 27
FINANCIAL HIGHLIGHTS (continued)
|
| | | | | | | Year Ended December 31, | | |
| | | |
| |
| |
|
| Class B Shares | | 2006 | | 2005 | | 2004 | | 2003 | | 2002 |
| |
| |
| |
| |
| |
|
| Per Share Data ($): | | | | | | | | | | |
| Net asset value, beginning of period | | 8.50 | | 8.37 | | 7.80 | | 6.63 | | 8.11 |
| Investment Operations: | | | | | | | | | | |
| Investment income (loss)—net | | .02a | | .01a | | .01 | | .01 | | (.01) |
| Net realized and unrealized | | | | | | | | | | |
| gain (loss) on investments | | .72 | | .13 | | .58 | | 1.17 | | (1.47) |
| Total from Investment Operations | | .74 | | .14 | | .59 | | 1.18 | | (1.48) |
| Distributions: | | | | | | | | | | |
| Dividends from investment income—net | | — | | (.01) | | (.02) | | (.01) | | (.00)b |
| Net asset value, end of period | | 9.24 | | 8.50 | | 8.37 | | 7.80 | | 6.63 |
| |
| |
| |
| |
| |
|
| Total Return (%) c | | 8.75 | | 1.66 | | 7.63 | | 17.76 | | (18.21) |
| |
| |
| |
| |
| |
|
| Ratios/Supplemental Data (%): | | | | | | | | | | |
| Ratio of total expenses | | | | | | | | | | |
| to average net assets | | 2.56 | | 2.47 | | 2.21 | | 2.53 | | 2.54 |
| Ratio of net expenses | | | | | | | | | | |
| to average net assets | | 2.56 | | 2.45 | | 2.21 | | 2.53 | | 2.54 |
| Ratio of net investment income | | | | | | | | | | |
| (loss) to average net assets | | .25 | | .08 | | .23 | | (.08) | | (.10) |
| Portfolio Turnover Rate d | | 197 | | 181 | | 134 | | 108 | | 122 |
| |
| |
| |
| |
| |
|
| Net Assets, end of period ($ x 1,000) | | 442 | | 1,053 | | 1,625 | | 1,647 | | 1,181 |
| |
| a | | Based on average shares outstanding at each month end. | | | | | | | | |
| b | | Amount represents less than $.01 per share. | | | | | | | | |
| c | | Exclusive of sales charge. | | | | | | | | | | |
| d | | Portfolio Turnover Rate is a measure of portfolio activity that is calculated by dividing the lesser of purchases or sales |
| | | of securities, excluding securities having maturity dates at acquisition of one year or less, by the average | | value of the |
| | | portfolio securities held during the period, which is a rolling 12-month period. | | | | | | |
| See notes to financial statements. | | | | | | | | | | |
| | | | | | | Year Ended December 31, | | |
| | | |
| |
| |
|
| Class C Shares | | 2006 | | 2005 | | 2004 | | 2003 | | 2002 |
| |
| |
| |
| |
| |
|
| Per Share Data ($): | | | | | | | | | | |
| Net asset value, beginning of period | | 8.36 | | 8.24 | | 7.69 | | 6.54 | | 8.04 |
| Investment Operations: | | | | | | | | | | |
| Investment income (loss)—net | | .03a | | .00a,b | | .01a | | (.01) | | (.17) |
| Net realized and unrealized | | | | | | | | | | |
| gain (loss) on investments | | .71 | | .13 | | .56 | | 1.16 | | (1.33) |
| Total from Investment Operations | | .74 | | .13 | | .57 | | 1.15 | | (1.50) |
| Distributions: | | | | | | | | | | |
| Dividends from investment income—net | | (.05) | | (.01) | | (.02) | | (.00)b | | — |
| Net asset value, end of period | | 9.05 | | 8.36 | | 8.24 | | 7.69 | | 6.54 |
| |
| |
| |
| |
| |
|
| Total Return (%) c | | 8.87 | | 1.54 | | 7.42 | | 17.59 | | (18.66) |
| |
| |
| |
| |
| |
|
| Ratios/Supplemental Data (%): | | | | | | | | | | |
| Ratio of total expenses | | | | | | | | | | |
| to average net assets | | 2.53 | | 2.54 | | 2.35 | | 2.69 | | 3.48 |
| Ratio of net expenses | | | | | | | | | | |
| to average net assets | | 2.53 | | 2.51 | | 2.34 | | 2.69 | | 3.48 |
| Ratio of net investment income | | | | | | | | | | |
| (loss) to average net assets | | .31 | | .02 | | .08 | | (.17) | | (1.05) |
| Portfolio Turnover Rate d | | 197 | | 181 | | 134 | | 108 | | 122 |
| |
| |
| |
| |
| |
|
| Net Assets, end of period ($ x 1,000) | | 181 | | 189 | | 264 | | 295 | | 248 |
| |
| a | | Based on average shares outstanding at each month end. | | | | | | | | |
| b | | Amount represents less than $.01 per share. | | | | | | | | |
| c | | Exclusive of sales charge. | | | | | | | | | | |
| d | | Portfolio Turnover Rate is a measure of portfolio activity that is calculated by dividing the lesser of purchases or sales |
| | | of securities, excluding securities having maturity dates at acquisition of one year or less, by the average value of the |
| | | portfolio securities held during the period, which is a rolling 12-month period. | | | | | | |
| See notes to financial statements. | | | | | | | | | | |
The Fund 29
FINANCIAL HIGHLIGHTS (continued)
|
| | | | | Year Ended December 31, | | |
| |
| |
| |
|
| Class F Shares | | 2006 | | 2005 | | 2004 | | 2003 | | 2002 |
| |
| |
| |
| |
| |
|
| Per Share Data ($): | | | | | | | | | | |
| Net asset value, beginning of period | | 8.59 | | 8.46 | | 7.88 | | 6.69 | | 8.20 |
| Investment Operations: | | | | | | | | | | |
| Investment income—net | | .13 | | .09 | | .08 | | .06 | | .07 |
| Net realized and unrealized | | | | | | | | | | |
| gain (loss) on investments | | .72 | | .14 | | .59 | | 1.20 | | (1.50) |
| Total from Investment Operations | | .85 | | .23 | | .67 | | 1.26 | | (1.43) |
| Distributions: | | | | | | | | | | |
| Dividends from investment income—net | | (.24) | | (.10) | | (.09) | | (.07) | | (.08) |
| Net asset value, end of period | | 9.20 | | 8.59 | | 8.46 | | 7.88 | | 6.69 |
| |
| |
| |
| |
| |
|
| Total Return (%) | | 9.91 | | 2.75 | | 8.58 | | 18.96 | | (17.46) |
| |
| |
| |
| |
| |
|
| Ratios/Supplemental Data (%): | | | | | | | | | | |
| Ratio of total expenses | | | | | | | | | | |
| to average net assets | | 1.42 | | 1.43 | | 1.34 | | 1.54 | | 1.43 |
| Ratio of net expenses | | | | | | | | | | |
| to average net assets | | 1.42 | | 1.40 | | 1.33 | | 1.54 | | 1.42 |
| Ratio of net investment income | | | | | | | | | | |
| to average net assets | | 1.41 | | 1.14 | | 1.08 | | .93 | | .99 |
| Portfolio Turnover Rate a | | 197 | | 181 | | 134 | | 108 | | 122 |
| |
| |
| |
| |
| |
|
| Net Assets, end of period ($ x 1,000) | | 58,969 | | 68,926 | | 89,701 | | 119,835 | | 130,314 |
| a | | Portfolio Turnover Rate is a measure of portfolio activity that is calculated by dividing the lesser of purchases or sales |
| | | of securities, excluding securities having maturity dates at acquisition of one year or less, by the average value of the |
| | | portfolio securities held during the period, which is a rolling 12-month period. |
| See notes to financial statements. |
| | | | | Year Ended December 31, | | |
| |
| |
| |
|
| Class R Shares | | 2006 | | 2005 | | 2004 | | 2003 | | 2002 |
| |
| |
| |
| |
| |
|
| Per Share Data ($): | | | | | | | | | | |
| Net asset value, beginning of period | | 8.56 | | 8.43 | | 7.86 | | 6.68 | | 8.18 |
| Investment Operations: | | | | | | | | | | |
| Investment income (loss)—net | | .15 | | .11 | | .09 | | .16 | | (.16) |
| Net realized and unrealized | | | | | | | | | | |
| gain (loss) on investments | | .71 | | .14 | | .58 | | 1.05 | | (1.34) |
| Total from Investment Operations | | .86 | | .25 | | .67 | | 1.21 | | (1.50) |
| Distributions: | | | | | | | | | | |
| Dividends from investment income—net | | (.28) | | (.12) | | (.10) | | (.03) | | — |
| Net asset value, end of period | | 9.14 | | 8.56 | | 8.43 | | 7.86 | | 6.68 |
| |
| |
| |
| |
| |
|
| Total Return (%) | | 10.10 | | 3.01 | | 8.63 | | 18.12 | | (18.34) |
| |
| |
| |
| |
| |
|
| Ratios/Supplemental Data (%): | | | | | | | | | | |
| Ratio of total expenses | | | | | | | | | | |
| to average net assets | | 1.38 | | 1.36 | | 1.35 | | 2.62 | | 19.52 |
| Ratio of net expenses | | | | | | | | | | |
| to average net assets | | 1.21 | | 1.17 | | 1.21 | | 2.37 | | 4.24 |
| Ratio of net investment income | | | | | | | | | | |
| (loss) to average net assets | | 1.62 | | 1.38 | | 1.21 | | .01 | | (1.77) |
| Portfolio Turnover Rate a | | 197 | | 181 | | 134 | | 108 | | 122 |
| |
| |
| |
| |
| |
|
| Net Assets, end of period ($ x 1,000) | | 46 | | 54 | | 59 | | 72 | | 11 |
| a | | Portfolio Turnover Rate is a measure of portfolio activity that is calculated by dividing the lesser of purchases or sales |
| | | of securities, excluding securities having maturity dates at acquisition of one year or less, by the average value of the |
| | | portfolio securities held during the period, which is a rolling 12-month period. |
| See notes to financial statements. |
The Fund 31
FINANCIAL HIGHLIGHTS (continued)
|
| | | | | | | Year Ended December 31, | | |
| | | |
| |
| |
|
| Class T Shares | | 2006 | | 2005 | | 2004 | | 2003 | | 2002 |
| |
| |
| |
| |
| |
|
| Per Share Data ($): | | | | | | | | | | |
| Net asset value, beginning of period | | 8.81 | | 8.68 | | 8.09 | | 6.88 | | 8.17 |
| Investment Operations: | | | | | | | | | | |
| Investment income (loss)—net | | .10 | | .05 | | .03 | | .21 | | (.37) |
| Net realized and unrealized | | | | | | | | | | |
| gain (loss) on investments | | .74 | | .14 | | .62 | | 1.00 | | (.92) |
| Total from Investment Operations | | .84 | | .19 | | .65 | | 1.21 | | (1.29) |
| Distributions: | | | | | | | | | | |
| Dividends from investment income—net | | (.18) | | (.06) | | (.06) | | (.00)a | | — |
| Net asset value, end of period | | 9.47 | | 8.81 | | 8.68 | | 8.09 | | 6.88 |
| |
| |
| |
| |
| |
|
| Total Return (%) b | | 9.56 | | 2.21 | | 8.01 | | 17.65 | | (15.79) |
| |
| |
| |
| |
| |
|
| Ratios/Supplemental Data (%): | | | | | | | | | | |
| Ratio of total expenses | | | | | | | | | | |
| to average net assets | | 1.96 | | 2.15 | | 2.02 | | 3.18 | | 14.63 |
| Ratio of net expenses | | | | | | | | | | |
| to average net assets | | 1.79 | | 1.87 | | 1.77 | | 2.73 | | 2.59 |
| Ratio of net investment income | | | | | | | | | | |
| (loss) to average net assets | | 1.06 | | .69 | | .66 | | (.29) | | (.31) |
| Portfolio Turnover Rate c | | 197 | | 181 | | 134 | | 108 | | 122 |
| |
| |
| |
| |
| |
|
| Net Assets, end of period ($ x 1,000) | | 57 | | 35 | | 35 | | 36 | | 13 |
| |
| a | | Amount represents less than $.01 per share. | | | | | | | | | | |
| b | | Exclusive of sales charge. | | | | | | | | | | |
| c | | Portfolio Turnover Rate is a measure of portfolio activity that is calculated by dividing the lesser of purchases or sales |
| | | of securities, excluding securities having maturity dates at acquisition of one year or less, by the average value of the |
| | | portfolio securities held during the period, which is a rolling 12-month period. | | | | | | |
| See notes to financial statements. | | | | | | | | | | |
NOTES TO FINANCIAL STATEMENTS
NOTE 1—Significant Accounting Policies:
Dreyfus Founders Balanced Fund (the “fund”) is a separate diversified series of Dreyfus Founders Funds, Inc. (the “Company”), which is registered under the Investment Company Act of 1940, as amended (the “Act”), as an open-end management investment company and operates as a series company currently offering eight series, including the fund. The fund’s investment objective is to seek current income and capital appreciation. Founders Asset Management LLC (the “Manager” or “Founders”) serves as the fund’s investment adviser. Founders is an indirect wholly-owned subsidiary of Mellon Financial Corporation (“Mellon Financial”), a publicly-owned financial services company which provides a comprehensive range of financial products and services in domestic and selected international markets.
On December 4, 2006, Mellon Financial and The Bank of New York Company, Inc. announced that they had entered into a definitive agreement to merge. The new company will be called The Bank of New York Mellon Corporation. As part of this transaction, Founders would become an indirect wholly-owned subsidiary of The Bank of New York Mellon Corporation. The transaction is subject to certain regulatory approvals and the approval of The Bank of New York Company, Inc.’s and Mellon Financial’s shareholders, as well as other customary conditions to closing. Subject to such approvals and the satisfaction of the other conditions, Mellon Financial and The Bank of New York Company, Inc. expect the transaction to be completed in the third quarter of 2007.
Dreyfus Service Corporation (the “Distributor”), the direct owner of Founders and a wholly-owned subsidiary of The Dreyfus Corporation (“Dreyfus”, an affiliate of Founders), is the Distributor of the fund’s shares. The fund is authorized to issue up to 850 million shares of Common Stock, par value $ .01 per share, in the following classes of shares: Class A, Class B, Class C, Class F, Class R and Class T shares. Class A and Class T shares are subject to a sales charge imposed at the time of purchase. Class B shares are subject to a contingent deferred sales charge (“CDSC”) imposed on Class B share redemptions made
The Fund 33
NOTES TO FINANCIAL STATEMENTS (continued)
|
within six years of purchase and automatically convert to Class A shares after six years. Class C shares are subject to a CDSC imposed on Class C shares redeemed within one year of purchase. Class F and Class R shares are sold at net asset value (“NAV”) per share. Class F shares are sold only to Class F grandfathered investors, and Class R shares are sold only to eligible institutional investors. Other differences between the classes include the services offered to and the expenses borne by each class. Income and realized and unrealized gains or losses on investments are allocated to each class of shares based on its relative net assets.
Effective June 1, 2006, the fund no longer offers Class B shares, except in connection with dividend reinvestment and permitted exchanges of Class B shares.
Each class of the fund bears expenses incurred specifically on its behalf and, in addition, each class bears a portion of general expenses based on the relative net assets or the number of shareholder accounts of the class.The type of expense determines the allocation method.
The Company’s Board of Directors has authorized the payment of certain fund expenses with commissions on fund portfolio transactions. These commissions reduce miscellaneous expenses and are included in the expense offset to broker commissions in the Statement of Operations.
The fund’s financial statements are prepared in accordance with U.S. generally accepted accounting principles, which requires the use of management estimates and assumptions. Actual results could differ from those estimates.
In the normal course of business, the fund may enter into contracts and agreements that contain a variety of representations and warranties, and which provide general indemnifications. The maximum exposure to the fund under these arrangements is unknown, as this would involve future claims that may be made against the fund that have not yet occurred. However, based on experience, the fund expects the risks of loss to be remote.
(a) Portfolio valuation: A domestic equity security listed or traded on a securities exchange or in the over-the-counter market is valued at its last sale price on the exchange or market where it is principally traded or, in the case of a security traded on NASDAQ, at its official closing price. Lacking any sales on that day, the security is valued at the current closing bid price, or by quotes from dealers making a market in the security if the closing bid price is not available, or in the case of written call options, at the mean between the highest bid and lowest asked quotations obtained from at least two securities dealers.
A foreign equity security traded on a foreign exchange is valued at the last quoted official closing price available before the time when the fund’s assets are valued, or at the last quoted sales price if the exchange does not provide an official closing price or if the foreign market has not yet closed. Lacking any sales that day, the security is valued at the current closing bid price, or by quotes from dealers making a market in the security if the closing bid price is not available. New York closing exchange rates are used to convert foreign currencies to U.S. dollars.
A debt security with a remaining maturity greater than 60 days at the time of purchase is valued in accordance with the evaluated bid price supplied by a pricing service approved by the Company’s Board of Directors or, if such price is not available, at the mean between the highest bid and lowest asked quotations obtained from at least two securities dealers. A debt security with a remaining maturity of 60 days or less at the time of purchase is valued at amortized cost, which approximates market value, unless it is determined that amortized cost would not represent market value, in which case the securities would be marked to market.
If market quotations or official closing prices are not readily available or are determined not to reflect accurately fair value, securities will be valued at their fair value as determined in good faith by the Company’s Board of Directors or pursuant to procedures approved by
The Fund 35
NOTES TO FINANCIAL STATEMENTS (continued)
|
the Board of Directors.These situations may include instances where an event occurs after the close of the market on which a security is traded but before the fund calculates its NAV, and it is determined that the event has materially affected the value of the security. Fair value of foreign equity securities may be determined with the assistance of a pricing service using correlations between the movement of prices of foreign securities and indexes of domestic securities and other appropriate indicators, such as closing market prices of relevant ADRs and futures contracts.
Investments in registered investment companies are valued at their NAV.
Using fair value to price securities requires the use of estimates, and as such, may result in a value that is different from a security’s most recent closing price and from the prices used by other mutual funds to calculate their NAV’s. In addition, it is possible that the fair value determined for a security may be different from the value that may be realized upon the security’s sale, and that these differences may be material to the NAV of the fund.
On September 20, 2006, the Financial Accounting Standards Board (FASB) released Statement of Financial Accounting Standards No. 157 “Fair Value Measurements” (“FAS 157”). FAS 157 establishes an authoritative definition of fair value, sets out a framework for measuring fair value, and requires additional disclosures about fair value measurements. The application of FAS 157 is required for fiscal years beginning after November 15, 2007 and interim periods within those fiscal years. Management does not believe that the application of this standard will have a material impact on the financial statements of the fund.
(b) Foreign Securities and Currency Transactions: The fund may invest at least a portion of its assets in foreign securities. Foreign securities carry more risk than U.S. securities, such as political and currency risks. In the event the fund executes a foreign security transaction, the fund may enter into a foreign currency contract to settle the foreign security transaction.The fund could be exposed to risk if counterpar-ties are unable to meet the terms of the contracts or if the value of the
currency changes unfavorably to the U.S. dollar.The resultant foreign currency gain or loss from the contract is recorded as foreign currency gain or loss and is presented as such in the Statement of Operations.
The accounting records of the fund are maintained in U.S. dollars.The market values of foreign securities, currency holdings and other assets and liabilities are translated into U.S. dollars based on the current exchange rates each business day. Purchases and sales of investment securities and income and expense items denominated in foreign currencies are translated into U.S. dollar amounts on the respective dates of such transactions.
The fund does not isolate that portion of the results of operations resulting from changes in foreign exchange rates on investments from the fluctuations arising from changes in market prices of securities held. Such fluctuations are included with the net unrealized appreciation or depreciation from investments and foreign currency translations on the Statement of Operations.
Reported net realized foreign exchange gains or losses arise from sales of foreign currencies, currency gains or losses realized between the trade and settlement dates on securities transactions, and the difference between the amounts of dividends, interest, and foreign withholding taxes recorded on the fund’s books and the U.S. dollar equivalent of the amounts actually received or paid. Net unrealized appreciation or depreciation on investments and foreign currency translation arises from changes in the values of assets and liabilities, including investments in securities held at the date of the financial statements, resulting from changes in the exchange rates and changes in market prices of securities held.
(c) Securities transactions and investment income: Securities transactions are recorded on a trade date basis. Realized gain and loss from securities transactions are recorded on the identified cost basis. Dividend income is recognized on the ex-dividend date and interest income, including, where applicable, accretion of discount and amortization of premium on investments, is recognized on the accrual basis.
The Fund 37
NOTES TO FINANCIAL STATEMENTS (continued)
|
The fund has an arrangement with the custodian bank, Mellon Bank, N.A. (“Mellon Bank”), which is an affiliate of Founders, whereby the fund receives earnings credits from the custodian when positive cash balances are maintained, which are used to offset custody fees. For financial reporting purposes, the fund includes net earnings credits, if any, as an expense offset in the Statement of Operations.
(d) Affiliated issuers: Investments in other investment companies advised by the Manager or its affiliates are defined as “affiliated” in the Act.
(e) Dividends to shareholders: Dividends are recorded on the ex-dividend date.The fund declares and distributes dividends from investment income-net, if any, quarterly, and dividends from net realized capital gain, if any, annually, but the fund may make distributions on a more frequent basis to comply with the distribution requirements of the Internal Revenue Code of 1986, as amended (the “Code”). To the extent that net realized capital gain can be offset by capital loss carryovers, it is the policy of the fund not to distribute such gain. Income and capital gain distributions are determined in accordance with income tax regulations, which may differ from U.S. generally accepted accounting principles.
(f) Federal income taxes: No provision has been made for federal income taxes since it is the policy of the fund to continue to comply with the requirements of Subchapter M of the Code that are applicable to regulated investment companies and to make distributions of income and capital gains sufficient to relieve it from all income taxes. The fund is treated as a separate tax entity for federal income tax purposes.
On July 13, 2006, the FASB released FASB Interpretation No. 48 “Accounting for Uncertainty in Income Taxes” (FIN 48). FIN 48 provides guidance for how uncertain tax positions should be recognized, measured, presented and disclosed in the financial statements. FIN 48 requires the evaluation of tax positions taken or expected to be taken
in the course of preparing the fund’s tax returns to determine whether the tax positions are “more-likely-than-not” of being sustained by the applicable tax authority.Tax positions not deemed to meet the more-likely-than-not threshold would be recorded as a tax benefit or expense in the current year. Adoption of FIN 48 is required for fiscal years beginning after December 15, 2006 and is to be applied to all open tax years as of the effective date.At this time, management is evaluating the implications of FIN 48 and its impact, if any, in the financial statements has not yet been determined.
At December 31, 2006, the components of accumulated earnings on a tax basis were as follows: undistributed ordinary income $6,358, accumulated capital losses $181,196,350 and unrealized appreciation $4,948,862. In addition, the fund had $92,394 of capital losses realized after Octber 31, 2006, which were deferred for tax purposes to the first day of the following fiscal year.
The accumulated capital loss carryover is available to be applied against future net securities profits, if any, realized subsequent to December 31, 2006. If not applied, $60,347,520 of the carryover expires in fiscal 2008, $49,289,530 expires in fiscal 2009, $70,087,112 expires in fiscal 2010 and $1,472,188 expires in fiscal 2011.
The tax character of distributions paid to shareholders during the fiscal periods ended December 31, 2006 and December 31, 2005 were as follows: ordinary income $1,629,590 and $944,414, respectively.
NOTE 2—Bank Line of Credit:
|
The Company has a line of credit arrangement (“LOC”) with State Street Bank and Trust Company, to be used for temporary or emergency purposes, primarily for financing redemption payments. The borrowings by each series of the Company are limited to the lesser of (a) $50 million, or (b) the lesser of 25% of the series’ total net assets or the maximum amount which the series is permitted to borrow pursuant to the prospectus, any law or any other agreement. Combined
The Fund 39
NOTES TO FINANCIAL STATEMENTS (continued)
|
borrowings are subject to the $50 million cap on the total LOC. Each series agrees to pay annual fees and interest on the unpaid balance based on prevailing market rates as defined in the LOC.
The average daily amount of borrowings outstanding under the LOC during the period ended December 31, 2006 was approximately $4,400, with a related weighted average annualized interest rate of 5.24% .
NOTE 3—Investment Advisory Fee and Other Transactions With Affiliates:
(a) In accordance with an investment advisory agreement between the Company and Founders, the fund compensates Founders for its services as investment adviser by the payment of fees computed daily and paid monthly at the annual rate equal to a percentage of the average daily value of the fund’s net assets.The fee is .65% of the first $250 million of net assets, .60% of the next $250 million of net assets, .55% of the next $250 million of net assets and .50% of net assets in excess of $750 million.
During the period ended December 31, 2006, the fund was advised that the Distributor retained $2,026 and $1 from sales commissions earned on sales of the fund’s Class A and Class T shares, respectively, and $7,554 and $42 from CDSC on redemptions of the fund’s Class B and Class C shares, respectively.
(b) Under the Distribution Plan (the “Plan”) adopted pursuant to Rule 12b-1 under the Act, Class B, Class C and Class T shares pay the Distributor for distributing their shares at an annual rate of .75% of the value of their average daily net assets of Class B and Class C shares and .25% of the value of the average daily net assets of Class T shares.The Class B shares ceased paying Rule 12b-1 fees to the Distributor in late 2006 in accordance with regulatory requirements that limit the amount of sales charges a mutual fund may impose based on sales of the fund's shares. The Class B shares may resume paying Rule 12b-1 fees in the future if permitted to do so by applicable regulation.
During the period ended December 31, 2006, Class B, Class C and Class T shares were charged $4,347, $1,373 and $125, respectively, pursuant to the Plan.
The fund has adopted a Distribution Plan pursuant to Rule 12b-1 under the Act applicable to its Class F shares. Under the plan, the fund is authorized to reimburse the Distributor for expenses paid for distributing or servicing its Class F shares at an annual rate of up to .25% of the value of the average daily net assets of the fund’s Class F shares. During the period ended December 31, 2006, Class F shares were charged $156,900 pursuant to this Distribution Plan.
(c) Under the Shareholder Services Plan, Class A, Class B, Class C and Class T shares pay the Distributor at an annual rate of .25% of the value of their average daily net assets for the provision of certain services.The services provided may include personal services relating to shareholder accounts, such as answering shareholder inquiries regarding the fund and providing reports and other information, and services related to the maintenance of shareholder accounts.The Distributor may make payments to Service Agents (a securities dealer, financial institution or other industry professional) in respect of these services.The Distributor determines the amounts to be paid to Service Agents. During the period ended December 31, 2006, Class A, Class B, Class C and Class T shares were charged $4,699, $1,762, $457 and $125, respectively, pursuant to the Shareholder Services Plan.
The Company has a shareholder services agreement with the Distributor, whereby the fund has agreed to compensate the Distributor for providing certain shareholder servicing functions to holders of Class F shares. The fund paid the Distributor a monthly fee equal, on an annual basis, to $24.00 per Class F shareholder account considered to be an open account at any time during a given month. During the period ended December 31, 2006, Class F shares were charged $46,850 pursuant to this shareholder services agreement.
The Fund 41
NOTES TO FINANCIAL STATEMENTS (continued)
|
Dreyfus Transfer, Inc. (“DTI”), a wholly-owned subsidiary of Dreyfus, is the transfer and dividend disbursing agent for all of the fund’s share classes.With the exception of out-of-pocket charges, the fees charged by DTI with respect to the fund’s Class F shares are paid by the Distributor.The out-of-pocket charges from DTI are paid by the fund. During the period ended December 31, 2006, Class F shares were charged $5,147 for out-of-pocket transfer agent charges.
The fees charged by DTI with respect to the fund’s Class A, B, C, R and T shares are paid by the fund.These transfer agency fees, including both the per account fees paid to DTI and out-of-pocket charges, during the period ended December 31, 2006 were $3,133.
Founders has agreed to reimburse (or to cause its affiliates to reimburse) the Class R and the Class T share classes of the Fund for certain transfer agency expenses pursuant to a written contractual commitment.This commitment will extend through at least August 31, 2007, and will not be terminated without prior notification to the Company’s Board of Directors. During the period ended December 31, 2006, Class R and Class T were each reimbursed $88, which reduced the amounts paid to DTI to $66 and $109, respectively.
The fund has agreed to compensate Founders for providing accounting services, administration, compliance monitoring, regulatory and shareholder reporting, as well as related facilities, equipment and clerical help. The fee is computed at the annual rate of .06% of the average daily net assets of the fund on the first $500 million, .04% of the average daily net assets of the fund on the next $500 million and .02% of the average daily net assets of the fund in excess of $1 billion, plus reasonable out-of-pocket expenses. Founders has contractually agreed in writing to waive any fees received for these services to the extent they exceed Founders’ costs in providing the services. Effective January 1, 2007, Dreyfus replaced Founders as fund accounting and administrative services agent for the fund pursuant to an agreement containing substantially the same terms.
Mellon Bank serves as custodian for the fund.The fees for the custody services are subject to reduction by credits earned on the cash balances
of the fund held by the custodian, which are shown as earnings credits on the Statement of Operations. The fund could have employed these assets elsewhere to produce income had it not entered into this arrangement. The custodian contractually agreed in writing to a fee waiver for the Company during the time period and in the amount set forth below:
| Time Period | | Amount of Waiver ($) |
| |
|
| 9/1/05 to 8/31/06 | | 200,000 |
This fee waiver was allocated among the Company’s series in proportion to their respective shares of the total custodian fee. During the period ended December 31, 2006, the fund’s portion of the waiver was $474, which reduced the amount paid to Mellon Bank to $6,567.
The components of Due to Founders Asset Management LLC and affiliates in the Statement of Assets and Liabilities consist of: investment advisory fees $35,173, Rule 12b-1 distribution plan fees $10,511, shareholder services plan fees $17,319 and transfer agency per account fees $5,025.
(d) Annual retainer fees and attendance fees for the Company’s Board of Directors are allocated to each series of the Company based on net assets.The Company’s Board of Directors has adopted a deferred compensation plan for Company directors that enables directors to elect to defer receipt of all or a portion of the annual compensation that they are entitled to receive from the Company. Under the plan, the compensation deferred is invested in shares of one or more of the Company’s series. The amount paid to the director under the plan will be determined based upon the performance of the selected series.The current value of these amounts is included in Other Assets and Directors’ Deferred Compensation on the Statement of Assets and Liabilities. Changes in market value are included in the directors’ fees and expenses and the net change in unrealized appreciation/depreciation of investments on the Statement of Operations. Deferral of directors’ fees under the plan does not affect the net assets of the fund.
The Fund 43
NOTES TO FINANCIAL STATEMENTS (continued)
|
Certain officers of the Company are also officers and/or directors of Founders or its affiliates, which pay their compensation.The affairs of the fund, including services provided by Founders, are subject to the supervision and general oversight of the Company’s Board of Directors.
(e) Pursuant to an exemptive order from the SEC, the fund may invest its available cash balances in affiliated money market mutual funds. Management fees of the underlying money market mutual funds have been waived by Dreyfus.
NOTE 4—Securities Transactions:
|
The aggregate amount of purchases and sales of investment securities, excluding short-term securities, during the period ended December 31, 2006, amounted to $122,221,040 and $136,260,027, respectively.
At December 31, 2006, the cost of investments for federal income tax purposes was $65,527,288; accordingly, accumulated net unrealized appreciation on investments was $4,948,862, consisting of $5,676,157 gross unrealized appreciation and $727,295 gross unrealized depreciation.
REPORT OF INDEPENDENT REGISTERED PUBLIC ACCOUNTING FIRM
To the Board of Directors and Shareholders of Dreyfus Founders Funds, Inc.
In our opinion, the accompanying statement of assets and liabilities, including the statement of investments, and the related statements of operations and of changes in net assets and the financial highlights present fairly, in all material respects, the financial position of Dreyfus Founders Balanced Fund (one of the portfolios constituting Dreyfus Founders Funds, Inc., hereafter referred to as the “Fund”) at December 31,2006,the results of its operations for the year then ended,the changes in its net assets for each of the two years in the period then ended and the financial highlights for each of the five years in the period then ended, in conformity with accounting principles generally accepted in the United States of America. These financial statements and financial highlights (hereafter referred to as “financial statements”) are the responsibility of the Fund’s management; our responsibility is to express an opinion on these financial statements based on our audits.We conducted our audits of these financial statements in accordance with the standards of the Public Company Accounting Oversight Board (United States). Those standards require that we plan and perform the audit to obtain reasonable assurance about whether the financial statements are free of material misstatement.An audit includes examining, on a test basis, evidence supporting the amounts and disclosures in the financial statements, assessing the accounting principles used and significant estimates made by management, and evaluating the overall financial statement presentation.We believe that our audits, which included confirmation of securities at December 31, 2006 by correspondence with the custodian and brokers, provide a reasonable basis for our opinion.
| | PricewaterhouseCoopers LLP
New York, New York
February 23, 2007
|
The Fund 45
IMPORTANT TAX INFORMATION (Unaudited)
For federal tax purposes, the fund hereby designates 43.73% of the ordinary dividends paid during the fiscal year ended December 31, 2006 as qualifying for the corporate dividends received deduction. For the fiscal year ended December 31, 2006, certain dividends paid by the fund may be subject to a maximum tax rate of 15%, as provided for by the Jobs and Growth tax Relief Reconciliation Act of 2003. Of the distributions paid during the fiscal year, $511,801 represents the maximum amount that may be considered qualified dividend income. Shareholders will receive notification in January 2007 of the percentage applicable to the preparation of their 2006 income tax returns.
FACTORS CONSIDERED IN RENEWING THE ADVISORY AGREEMENT (Unaudited)
At a meeting of the board of directors of Dreyfus Founders Funds, Inc. (the “Funds” and, in reference to any one of the Funds’ portfolios, a “Fund”) held on August 9 and 10, 2006, the Funds’ directors unanimously approved the continuation of the Investment Advisory Agreement (“management agreement”) between each of the Funds and Founders Asset Management LLC, the Funds’ investment adviser (“Founders”), for a one-year term ending August 31, 2007.The board of directors of the Funds (“board”) is comprised entirely of individuals who have no affiliation with Founders or any affiliates of Founders (the “directors”).
Prior to the directors’August 2006 meeting, Founders had provided the directors with extensive materials related to the renewal of the management agreement, including performance and expense information for other investment companies with similar investment objectives to each Fund derived from data compiled by Lipper Inc., an independent third party (“Lipper”).
During their meeting, the directors discussed the proposed continuance of the management agreement with the senior management personnel of Founders. At the conclusion of these discussions, the directors and their independent counsel met in a private session at which no representatives of Founders were present, to continue their discussion of continuance of the agreement. In determining to continue the management agreement, the directors considered all factors which they believed to be relevant, including the following:
Nature, Extent and Quality of Services Provided and to be Provided by Founders
The directors recognized that they have had the opportunity to evaluate the investment and non-investment related services which Founders provides to the Funds primarily through their quarterly review of all of the operations of the Funds during Fund committee and Fund board meetings held throughout the past twelve months.At each such meeting, extensive discussions of Fund operations are held with senior management personnel of Founders and a large volume
The Fund 47
FACTORS CONSIDERED IN RENEWING THE
ADVISORY AGREEMENT (Unaudited) (continued)
|
of documentation with respect to these operations is provided to and reviewed by the directors. Such discussions and documentation afford the directors the continual opportunity to evaluate the nature, extent, and quality of the services provided by Founders and its affiliates to the Funds.
The directors were satisfied that Founders is managing the investment of the assets of the Funds in accordance with each Fund’s respective investment objective, policies and restrictions, subject to the directors’ overall supervision.
The directors considered that Founders also provides many non-investment related services to the Funds in fulfilling its responsibilities under the management agreement.
Following their discussion and review, the directors reached the following conclusions:
- That the breadth and quality of investment advisory and other ser- vices being provided to the Funds are satisfactory, as evidenced in part by the performance records of the Funds, to which the directors gave significant attention as indicated below; and
- That the directors are satisfied not only with the research, long-term portfolio management, and trading services being provided to the Funds, but also recognize that Founders or its affiliates have provided the highest quality accounting, compliance and regulatory, adminis- trative, underwriting, custody, shareholder, transfer agent and cash management services to the Funds, while charging fair, reasonable and competitive fees.
On a quarterly basis, the directors hold in-person meetings with representatives of the portfolio management team for each Fund (usually a portfolio manager), during which each representative reviews, among other items, performance information, attribution analyses, and the portfolio manager’s investment outlook.The directors also receive written monthly and quarterly performance information for each Fund.
In conjunction with their consideration of renewal of the management agreement, the directors received a more detailed performance report about each Fund from Lipper.These reports compared each Fund’s performance to both a relatively small group of similar funds selected by Lipper (the “Lipper performance group”), as well as to all funds in the applicable Lipper category (the “Lipper performance universe”).
Balanced Fund’s performance for the one-year period ended December 31, 2005 and for the six-month period ended June 30, 2006 placed it in the fifth (lowest) quintile of both its Lipper performance group and the Lipper balanced fund performance universe. The directors noted that Balanced Fund’s performance had been better relative to both its Lipper performance group and universe in 2003 and 2004.The directors recognized that in its efforts to improve the performance results of Balanced Fund, Founders had implemented certain changes with respect to the management of the equity portion of the Fund and, effective August 1, 2006, had selected a new co-portfolio manager with responsibility for managing the fixed-income portion of the Fund.The Funds’ directors were hopeful that the steps Founders has taken in an effort to improve the Fund’s performance would be sufficient. The directors intend to continue to monitor the Fund’s performance results closely.
After consideration of all relevant information and data, the directors concluded that although past performance cannot be a guaranty of future performance, each Fund and its shareholders would continue to benefit from Founders’ investment management of the Fund. The directors further determined:
- That although certain of the Funds have experienced performance difficulties, Founders has focused its efforts upon improving the per- formance records of the Funds and will continue to seek improve- ment; and
- That the materials provided by Lipper demonstrated that most of the Funds maintained satisfactory performance quintile rankings in their respective comparison groups and comparison universes, with six of the eight Funds placing in the top two quintiles of their
The Fund 49
FACTORS CONSIDERED IN RENEWING THE
ADVISORY AGREEMENT (Unaudited) (continued)
|
respective Lipper performance universes for the three-years ended December 31, 2005, and five of the eight Funds placing in the top two quintiles for the six months ended June 30, 2006.
Costs of the Services to be Provided and Profits to be Realized by Founders and Its Affiliates from Founders’ Relationship With the Funds
The directors recognized that on a quarterly basis, they receive information with respect to each Fund’s expenses. The directors carefully review and discuss the expense ratios for all classes of shares of each Fund at each of their quarterly meetings throughout the year.
In conjunction with their annual consideration of renewal of the Funds’ management agreement and other service arrangements, the directors received information from Lipper which included graphs for each Fund that provided outlines of contractual management fees at common asset levels, actual management fees, actual non-management expenses and actual total Fund expenses, each graph comparing the relevant information of each Fund with each Fund’s Lipper performance group.
The directors noted that for the period ended December 31, 2005, Balanced Fund’s management fees ranked in the first (best) quintile of its Lipper performance group, with the Fund’s fees the lowest of 16 “peer funds.” The Fund’s contractual management fees at a common asset level were also determined by Lipper to be lowest of 16 funds in its group.The Fund’s management fees were in the third quintile of its Lipper expense universe.
The directors also considered a brochure provided by Lipper which included information with respect to the profitability of the mutual fund advisory activities conducted by a number of publicly-held corporations. Lipper also prepared an analysis providing detailed information with respect to the types of services rendered to various mutual fund complexes under their respective investment advisory contracts.
The directors had been provided with extensive materials with respect to the profitability derived by Founders from providing investment advisory and other services to the Funds as a group and to each Fund individually.
The directors further considered certain indirect benefits received by Founders and its affiliates from providing investment advisory services to the Funds.These included the following:
- Since Founders manages several non-Fund accounts in a style that is similar to that used for certain of the Funds, Founders and its affil- iates realize certain efficiencies in performing the portfolio manage- ment, trading and operational functions related to those accounts;
- The Funds’ brokerage transactions may be executed with brokers that provide research and brokerage services to Founders and its affiliates. These research and brokerage services may be useful to Founders and its affiliates in providing investment services to any of the clients they advise, not just the Funds; and
- Founders receives fees for providing accounting services to the Funds, and affiliates of Founders receive various fees for providing underwriting, shareholder, transfer agency, custody and cash man- agement services to the Funds.
The directors also reviewed a table listing the Funds and corresponding subadvisory accounts managed by Founders, and their respective fee schedules. In their review of this table, the directors noted that Founders provides many services to the Funds in fulfilling its responsibilities under the management agreement that it does not provide to entities for which Founders has assumed subadvisory duties. The directors concluded that the fees paid to Founders under the management agreement are reasonable in relation to the nature and extent of the services provided by Founders to the Funds under the agreement.
The Fund 51
FACTORS CONSIDERED IN RENEWING THE
ADVISORY AGREEMENT (Unaudited) (continued)
|
After deliberation and discussion of Fund fees and expenses, the directors determined:
- That upon review of the advisory fee structures of the Funds in comparison with the competitive performance groups selected by Lipper, the levels of investment advisory fees paid by the Funds were deemed to be acceptable;
- That the expense ratios of the Funds are acceptable and that Founders continually reviews each Fund’s total expense ratio and has initiated voluntarily expense caps and fee waivers for certain Funds to reduce their expense ratios;
- That the majority of the Funds’ expense ratios increased in 2005 from those experienced in 2004, primarily as a result of declines in Fund assets; and
- That the comparative fee and expense information included in the materials provided by Lipper supports the determination that the advisory and other fees payable by the Funds to Founders and its affiliates are essentially fees which would be similar to those which would have resulted solely from “arm’s-length” bargaining.
With respect to profitability to Founders, the directors reviewed the adviser profitability analysis provided by Lipper, which demonstrated that Founders’ 2005 profitability from providing management services to the Funds was reasonable in comparison to the entities included in the Lipper analysis.
The directors were also advised by independent counsel of the profitability percentage ranges determined by court cases to be acceptable and determined that Founders’ profitability percentage for providing management and other services to the Funds was reasonable.
The directors concluded that Founders’ profits from providing management services to the Funds were reasonable in relationship to the overall services which Founders provides.
Economies of Scale
The directors reviewed information provided by Founders which summarized the extent, if any, that both Founders and the Funds would achieve certain economies of scale if the assets of the Funds were to increase.
After review and discussion, the directors considered the extent to which economies of scale and common management are shared with each Fund, including the economies that would be realized from the growth of each Fund’s assets. After such consideration, the directors determined that all of the Funds have structured breakpoints in their advisory fees, which result in fee reductions as the assets of each Fund reach defined levels, and that such fee reductions, when implemented, would benefit all of the applicable Fund’s shareholders through decreases in the Fund’s expense ratio.
Dedication to Regulatory Requirements and Restrictions
An important factor in the directors’ consideration of renewal of the Funds’ management agreement with Founders included the directors’ recognition of the dedication by Founders of stringent adherence to regulatory requirements and restrictions.The directors determined that Founders is dedicated to compliance with all applicable rules and regulations and that the systems of controls which are in place to ensure that the service providers to the Funds, including Founders, and the Funds themselves, maintain strict adherence to the law are excellent.
The directors determined that they are generally satisfied with the performance of the Funds and with the quality of the advisory and other services being provided by Founders and its affiliates to the Funds. The directors recognized that overall Fund performance has improved in recent years and that efforts are being and will continue
The Fund 53
FACTORS CONSIDERED IN RENEWING THE
ADVISORY AGREEMENT (Unaudited) (continued)
|
to be made to enhance such improvements and to maintain Fund expense ratios at reasonable and acceptable levels.
The directors concluded that continuation of the current management agreement between each Fund and Founders, which would enable each Fund to continue to receive investment advisory services from Founders, is in the best interests of each Fund and its shareholders, the services to be performed under the management agreement are services required for the operations of the Funds, Founders has provided satisfactory investment management services to the Funds in the past, and the fees for the management services which Founders will perform will be within the range of what would have been negotiated at arm’s length in light of the circumstances.
YOUR BOARD REPRESENTATIVES (Unaudited)
The Board of Directors of the Company oversees all 8 Dreyfus Founders Funds.The business and affairs of the Company are managed under the direction of the Board. The directors serving on the Board perform their responsibilities in the manner which they reasonably believe to be in the best interests of the Funds and their shareholders.
All of the directors,as listed below,are independent directors.They are not affiliated with the Fund ‘s adviser, its parent company, or its affiliates.The directors have no official term of office and generally serve until they retire (normally at age 75, but subject to extension to age 80), resign, or are not re-elected.As you can see from their backgrounds, the directors have broad experience as active or former business and community leaders.
Eugene H.Vaughan, CFA, 73.Year elected to the Board: 1970
Board Chairman. Founding Chairman,Vaughan Nelson Investment Management, LP, an investment counseling firm. Director, Encore Bank, Houston. Founding Chairman, Center for Houston’s Future, a non-profit organization. Founding Chairman and former Governor, CFA Institute. Past Chairman and Trustee, Institute of Chartered Financial Analysts. Past Chairman and Director, Financial Analysts Federation. Chairman-elect, University of Texas Health Science Center.
Alan S. Danson, 67.Year elected to the Board: 1991
Private investor. Formerly, President and Director, D.H. Management, Inc., the general partner of a limited partnership with technology company holdings (1996 to 2003). Director, Gore Range Natural Science School and The Les Streeter Program, Inc., both of which are non-profit organizations.
Robert P. Mastrovita, 62.Year elected to the Board: 1998
Private investor. Chairman of a private charitable foundation (1997 to present). Formerly, Chairman and Director, Hagler, Mastrovita & Hewitt, Inc., a registered investment adviser (1982 to 1997). Member, Boston Society of Security Analysts. Trustee, Partridge Academy.
Trygve E. Myhren, 70.Year elected to the Board: 1996
President, Myhren Media, Inc., a firm that invests in and advises media, telecommunications, Internet and software companies. Special Limited Partner and member of Investment Committee, Megunticook Funds, a venture capital firm (1998 to present). Director,Advanced Marketing Services, Inc.Trustee and Chairman of Finance
The Fund 55
YOUR BOARD REPRESENTATIVES (Unaudited) (continued)
Committee, the University of Denver.Trustee, Denver Art Museum. Member, Cable Television Hall of Fame. Formerly, President (1990 to 1996) and Director (1992 to 2001) of the Providence Journal Company, a diversified media and communications company. Formerly, Chairman and Chief Executive Officer of American Television and Communications Corporation (now Timer Warner Cable) (1981 to 1988). Formerly, Chairman of the National Cable Television Association (1986-1987).
George W. Phillips, 68.Year elected to the Board: 1998
Retired.Vice Chairman of the Board, Chairman of the Finance Committee, and Chairman of the Investment Committee, Children’s Medical Center of Boston. Formerly, President and Chief Executive Officer (1992 to 1997) and Director (1992 to 2002) of Warren Bancorp, Inc. Formerly, President, Chief Executive Officer and Director of Warren Five Cents Savings Bank (1992 to 1997).
Martha A. Solis-Turner, 46.Year elected to the Board: 2005
Formerly, Telecommunications Director, Wholesale Markets (1995 to 2001), and Manager (1990 to 1995), Qwest Communications International Inc. Board member and Treasurer, Mile High Montessori Early Learning Centers (2002 to present), and formerly, Board member (1995 to 2004) and Vice President (2002 to 2004), Curtis Park Community Center, both of which are non-profit organizations.
Thomas F. Eggers, 54. President and Principal Executive Officer of the Funds since 2006. Founders’ Chairman of the Board, President and Chief Executive Officer. President, Chief Executive Officer and a Director of Dreyfus. Chairman of the Board and Chief Executive Officer of the Distributor since 2005. Formerly, President of Scudder Investments (2002 to 2005). Previously employed by Dreyfus from 1996 to 2002, including as President from 2001 to 2002.
David L. Ray, 49.Vice President of the Funds since 2000, and from 1990 to 1998. Founders’ Senior Vice President, Chief Operating Officer and Treasurer. Vice President of the Distributor since 2003. Employed by Founders and its predecessor company since 1990. Formerly,Treasurer of the Funds (1990 to 1998).
Kenneth R. Christoffersen, 51. Secretary of the Funds since 2000, and from 1996 to 1998. Founders’ Senior Vice President-Legal, General Counsel and Secretary. Assistant Secretary of the Distributor since 2003. Employed by Founders and its predecessor company since 1996.
Jennifer L. Carnes, 35. Treasurer, Principal Financial Officer and Principal Accounting Officer of the Funds since 2006. Manager of Fund Administration for Founders since 2006. Formerly, Founders’ Supervisor of Corporate Actions and Pricing (2002 to 2006), and Corporate Actions and Pricing Specialist (2000 to 2002).
Janelle E. Belcher, 48. Chief Compliance Officer of the Funds since 2004 and Assistant Secretary of the Funds since 2002. Founders’ Vice President - Compliance since 2002. Formerly, Founders’ Manager of Compliance (2000 to 2002) and Securities Compliance Examiner, Staff Accountant and Team Leader for the U.S. Securities and Exchange Commission (1990 to 2000).
Eric D. Naviloff, 38. Assistant Treasurer since 2006. Senior Accounting Manager -Taxable Fixed-Income Funds of Dreyfus, and an officer of 91 investment companies (comprised of 205 portfolios) managed by Dreyfus. Employed by Dreyfus since 1992.
Robert S. Robol, 42.Assistant Treasurer since 2006. Senior Accounting Manager -Money Market and Municipal Bond Funds of Dreyfus, and an officer of 91 investment companies (comprised of 205 portfolios) managed by Dreyfus. Employed by Dreyfus since 1988.
Robert Svagna, 39. Assistant Treasurer since 2006. Senior Accounting Manager -Equity Funds of Dreyfus, and an officer of 91 investment companies (comprised of 205 portfolios) managed by Dreyfus. Employed by Dreyfus since 1990.
William G. Germenis, 36.Anti-Money Laundering Compliance Officer (“AMLCO”) for the Class A, Class B, Class C, Class R, and Class T shares of the Funds since 2002 and for the Class F shares of the Funds since 2003.Vice President and AMLCO of MBSC, LLC since 2002.Vice President and AMLCO of the Distributor and AMLCO of investment companies managed by Dreyfus. Employed by the Distributor since 1998.
The directors and officers may be contacted at Founders’ address appearing on the back cover, except for Messrs. Eggers, Naviloff, Robol, Svagna and Germenis, who can be contacted at The Dreyfus Corporation, 200 Park Avenue, New York, New York 10166.Additional information about the Company’s directors is available in the Statement of Additional Information, which can be obtained free of charge by calling 1-800-525-2440 (Class F shareholders) or 1-800-554-4611 (all other shareholders).
The Fund 57
For Class F shareholders
Telephone Call your financial representative or 1-800-525-2440
| Mail | | Dreyfus Founders Funds, Inc. |
| | | P.O. Box 55360, Boston, MA 02205-8252 |
| |
|
| |
| For Class A, B, C, R and T shareholders |
| Telephone Call your financial representative or 1-800-554-4611 |
| Mail | | Dreyfus Founders Funds, Inc. |
| | | 144 Glenn Curtiss Boulevard, Uniondale, NY 11556-0144 |
| | |
The fund files its complete schedule of portfolio holdings with the Securities and Exchange Commission (“SEC”) for the first and third quarters of each fiscal year on Form N-Q. The fund’s Forms N-Q are available on the SEC’s website at http://www.sec.gov and may be reviewed and copied at the SEC’s Public Reference Room in Washington, DC. Information on the operation of the Public Reference Room may be obtained by calling 1-800-SEC-0330.
A description of the policies and procedures that the fund uses to determine how to vote proxies relating to portfolio securities, and information regarding how the fund voted these proxies for the 12-month period ended June 30, 2006, is available at http://www.founders.com, http://www.dreyfus.com and on the SEC’s website at http://www.sec.gov. The description of the policies and procedures is also available without charge, upon request, by calling 1-800-645-6561.
This report and the statements it contains are submitted for the general information of our shareholders. The report is not authorized for distribution to prospective investors unless preceded or accompanied by an effective prospectus.
| Founders and Founders Funds are registered trademarks |
| of Founders Asset Management LLC. |
© 2007 Dreyfus Service Corporation


Save time. Save paper. View your next shareholder report online as soon as it’s available. To take advantage of this service, simply inform us online of your decision to receive materials through our E-Communications Program. Cut down on mailbox clutter and help the Fund reduce printing and postage charges by enrolling today. It’s simple and only takes a few minutes.
Class F shareholders can log into www.founders.com/ ecommunications, or www.icsdelivery.com if you own funds through a third party.
Class A, B, C, R and T shareholders can log into www.dreyfus.com.
The views expressed in this report reflect those of the portfolio manager only through the end of the period covered and do not necessarily represent the views of Founders or any other person in the Founders organization.Any such views are subject to change at any time based upon market or other conditions and Founders disclaims any responsibility to update such views.These views may not be relied on as investment advice and, because investment decisions for a Dreyfus Founders Fund are based on numerous factors, may not be relied on as an indication of trading intent on behalf of any Dreyfus Founders Fund.
Not FDIC-Insured • Not Bank-Guaranteed • May Lose Value
| Contents |
| |
| | | THE FUND |
| |
|
| 2 | | A Letter from the President |
| 3 | | Discussion of Fund Performance |
| 6 | | Fund Performance |
| 8 | | Understanding Your Fund’s Expenses |
| 8 | | Comparing Your Fund’s Expenses |
| With Those of Other Funds |
| 9 | | Statement of Investments |
| 16 | | Statement of Assets and Liabilities |
| 17 | | Statement of Operations |
| 18 | | Statement of Changes in Net Assets |
| 20 | | Financial Highlights |
| 26 | | Notes to Financial Statements |
| 37 | | Report of Independent Registered |
| | | Public Accounting Firm |
| 38 | | Factors Considered in Renewing |
| the Advisory Agreement |
| 46 | | Your Board Representatives |
| |
| FOR MORE INFORMATION |
|
| | | Back Cover |
| Dreyfus Founders |
| Discovery Fund |
The Fund

A LETTER FROM THE PRESIDENT
Dear Shareholder:
We are pleased to present this annual report for Dreyfus Founders Discovery Fund, covering the 12-month period from January 1, 2006, through December 31, 2006.
2006 proved to be a good year for the financial markets.Virtually all sectors and capitalization ranges of the U.S. equity markets generated strong returns, especially over the second half of the year.A number of positive factors contributed to the markets’ gains in 2006, including an expanding domestic economy, subdued inflation, stabilizing interest rates, rising productivity and robust corporate profits.
In our analysis, 2006 provided an excellent reminder of the need for a long-term investment perspective. Adopting too short a time frame proved costly for some investors last year, as chasing recent winners often meant buying the next month’s losers. Indeed, history shows that reacting to near-term developments with extreme shifts in strategy rarely is the right decision.We believe that a better course of action is to set a portfolio mix to meet future goals, while attempting to ignore short term market fluctuations in favor of a longer-term view.
For information about how the fund performed during the reporting period, as well as market perspectives, we have provided a Discussion of Fund Performance given by the fund’s portfolio manager.
Thank you for your continued confidence and support.We wish you good health and prosperity in 2007.


DISCUSSION OF FUND PERFORMANCE
Randall Watts, Jr., Portfolio Manager
Note to Shareholders: On August 1, 2006, Randall Watts, Jr. replaced Bradley C. Orr and James D. Padgett as the fund’s primary portfolio manager.
How did Dreyfus Founders Discovery Fund perform relative to its benchmark?
For the 12-month period ended December 31, 2006, the fund produced total returns of 5.10% for its Class A shares, 3.51% for its Class B shares, 4.24% for its Class C shares, 5.08% for its Class F shares, 5.36% for its Class R shares and 4.66% for its Class T shares.1 In comparison, the Russell 2000 Growth Index, the fund’s benchmark, produced a total return of 13.35% for the reporting period.2
Small-cap growth stocks generally continued to produce attractive returns in an environment of moderate economic growth and robust corporate earnings. Although the fund’s performance relative to its benchmark improved over the second half of the year, it was not enough to fully offset weakness during the first half of the reporting period stemming mainly from disappointing stock selections in the health care, information technology and energy sectors.
What is the fund’s investment approach?
The fund invests primarily in small U.S.-based companies that we believe possess high-growth potential.The fund may also invest in larger companies if, in our opinion, they represent better prospects for capital appreciation. Our strategy combines market economics with fundamental research. We assess current economic conditions and examine each sector of the Russell 2000 Growth Index to determine its market-capitalized weighting and estimate its relative performance.We generally give greater relative weight to sectors that we expect to outperform the overall market. Within each sector, we look for companies with solid market positions, visionary leadership and reasonable financial strength. We typically will sell a stock when we find a more attractive alternative, determine that its valuation is excessive, become aware of deteriorating fundamentals or change our assessment of its sector’s valuation.
The Fund 3
DISCUSSION OF FUND PERFORMANCE (continued)
|
What other factors influenced the fund’s performance?
Despite a sharp market correction in the spring of 2006 stemming from heightened interest-rate and inflation concerns, small-cap stocks generally advanced during the reporting period on the strength of a growing U.S. economy and robust corporate earnings.As they have for the past several years, these favorable market conditions helped whet investors’ appetites for riskier, faster-growing companies. However, the margin of small-cap outperformance narrowed over the second half of the reporting period, when slowing economic growth caused investors to begin to turn toward larger, more value-oriented companies. As investor sentiment toward small-cap growth stocks waned, our security selection and risk management strategies became even more critical determinants of fund performance.
Indeed, after the portfolio manager change on August 1, my team moved quickly to alter the fund’s composition.We increased the number of holdings to reflect a more diversified risk management approach. At the same time, we intensified the fund’s focus on companies with track records of strong historical growth. Consequently, the average price-earnings ratio of the fund’s holdings fell below the benchmark’s, while the fund’s average growth rate exceeded that of the benchmark.
From August through December, the fund began to achieve solid results. Diversified financial services provider Dollar Services Corp. and student loan provider First Marblehead helped boost relative results in the financials sector, while biotechnology company Intermune contributed to outperformance in the health care area. Beverage producer Hansen Natural was a top performer in the consumer staples sector due to expanded distribution of its products. A number of companies helped fuel above-average returns in the industrials sector, an area of emphasis for the fund. Driving performance in the industrials sector were air-freight and logistics company HUB Group and industrial machinery manufacturer Robbins & Meyers.
However, these successes were offset by the fund’s lagging relative performance over the first seven months of 2006, when a handful of holdings in the medical technology industry and company-specific issues in the information technology area produced disappointing results. The fund’s energy holdings also generally underperformed the benchmark’s energy component over the first half of 2006. During the
second half of the year, returns were held back when a few holdings — such as drug developer Covance and telecommunications equipment maker DSP Group — missed analysts’ earnings estimates by small margins, hurting their stock prices. We sold our DSP Group positions before the end of the reporting period.Also weighing on the fund’s overall performance during the second half of the year was the information technology sector, which despite generating strong performance slightly lagged that of the benchmark.The biggest detractors came from the semiconductor segment, led by Ikanos Communications, which missed earnings, and the information technology services segment, led by payment processor and information management systems provider Wright Express.
What is the fund’s current strategy?
The fund ended 2006 with relatively light exposure to consumer discretionary and industrial companies, and heavier participation in information technology and health care areas.This positioning reflects our view that future economic conditions are uncertain, leading us to favor companies that we believe are poised to benefit from secular growth trends, not cyclical ones. For example, we have continued to find pockets of opportunities among online advertising companies and health care companies that can benefit from the aging of the baby-boomers. In addition, as the economy slows and earnings growth becomes scarcer, we believe that investors may pay a premium for smaller companies with records of strong historical growth, including many of the companies in which the fund invests.
| | | Small companies carry additional risks because their earnings and revenues tend to be less |
| | | predictable, and their share prices more volatile than those of larger, more established companies. |
| | | The shares of smaller companies tend to trade less frequently than those of larger, more established |
| | | companies. |
| 1 | | Total return includes reinvestment of dividends and any capital gains paid, and does not take into |
| | | consideration the maximum initial sales charges in the case of Class A and Class T shares, or the |
| | | applicable contingent deferred sales charges imposed on redemptions in the case of Class B and |
| | | Class C shares. Had these charges been reflected, returns would have been lower. Past performance |
| | | is no guarantee of future results. Share price and investment return fluctuate such that upon |
| | | redemption, fund shares may be worth more or less than their original cost. |
| 2 | | SOURCE: LIPPER INC. – Reflects reinvestment of dividends and, where applicable, capital |
| | | gain distributions.The Russell 2000 Growth Index is an unmanaged index, which measures the |
| | | performance of those Russell 2000 companies with higher price-to-book ratios and higher |
| | | forecasted growth values. |
The Fund 5
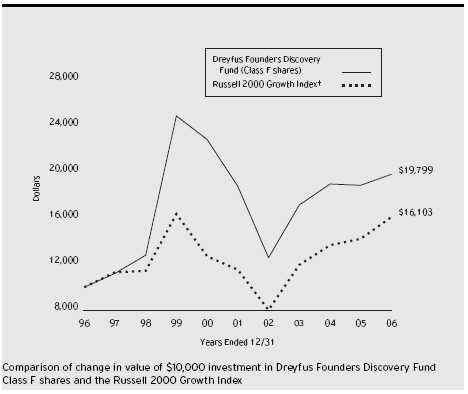
| † Source: Lipper Inc. |
| Past performance is not predictive of future performance. |
| The above graph compares a $10,000 investment made in Class F shares of Dreyfus Founders Discovery Fund on |
| 12/31/96 to a $10,000 investment made in the Russell 2000 Growth Index (the “Index”) on that date. All |
| dividends and capital gain distributions are reinvested. Performance for Class A, Class B, Class C, Class R and Class T |
| shares will vary from the performance of Class F shares shown above due to differences in charges and expenses. |
| The fund’s performance shown in the line graph takes into account all applicable Class F fees and expenses (after any |
| expense reimbursements).The Index is an unmanaged index, which measures the performance of those Russell 2000 |
| companies with higher price-to-book ratios and higher forecasted growth values.The Index does not take into account |
| charges, fees and other expenses. Further information relating to fund performance, including expense reimbursements, if |
| applicable, is contained in the Financial Highlights section of the prospectus and elsewhere in this report. |
| Average Annual Total Returns as of 12/31/06 | | | | | | |
| |
| | | Inception | | | | | | | | From |
| | | Date | | 1 Year | | 5 Years | | 10 Years | | Inception |
| |
| |
| |
| |
| |
|
| Class A shares | | | | | | | | | | |
| with maximum sales charge (5.75%) | | 12/31/99 | | (0.96)% | | (0.10)% | | — | | (4.00)% |
| without sales charge | | 12/31/99 | | 5.10% | | 1.09% | | — | | (3.19)% |
| Class B shares | | | | | | | | | | |
| with applicable redemption charge † | | 12/31/99 | | (0.50)% | | (0.39)% | | — | | (3.94)% |
| without redemption | | 12/31/99 | | 3.51% | | 0.01% | | — | | (3.94)% |
| Class C shares | | | | | | | | | | |
| with applicable redemption charge †† | | 12/31/99 | | 3.24% | | 0.18% | | — | | (4.03)% |
| without redemption | | 12/31/99 | | 4.24% | | 0.18% | | — | | (4.03)% |
| Class F shares | | 12/29/89 | | 5.08% | | 1.09% | | 7.07% | | N/A |
| Class R shares | | 12/31/99 | | 5.36% | | 1.38% | | — | | (2.93)% |
| Class T shares | | | | | | | | | | |
| with applicable sales charge (4.5%) | | 12/31/99 | | (0.07)% | | (0.25)% | | — | | (4.23)% |
| without sales charge | | 12/31/99 | | 4.66% | | 0.68% | | — | | (3.60)% |
Past performance is not predictive of future performance.The fund’s performance shown in the graph and table does not reflect the deduction of taxes that a shareholder would pay on fund distributions or the redemption of fund shares. Performance for Class B shares assumes the conversion of Class B shares to Class A shares at the end of the sixth year following the date of purchase.
| † | | The maximum contingent deferred sales charge for Class B shares is 4%. After six years Class B shares convert to |
| | | Class A shares. |
| †† | | The maximum contingent deferred sales charge for Class C shares is 1% for shares redeemed within one year of the |
| | | date of purchase. |
The Fund 7
U N D E R S TA N D I N G YO U R F U N D ’ S E X P E N S E S ( U n a u d i t e d )
As a mutual fund investor, you pay ongoing expenses, such as management fees and other expenses. Using the information below, you can estimate how these expenses affect your investment and compare them with the expenses of other funds.You also may pay one-time transaction expenses, including sales charges (loads) and redemption fees, which are not shown in this section and would have resulted in higher total expenses. For more information, see your fund’s prospectus or talk to your financial advisor.
| | Review your fund’s expenses
|
The table below shows the expenses you would have paid on a $1,000 investment in Dreyfus Founders Discovery Fund from July 1, 2006 to December 31, 2006. It also shows how much a $1,000 investment would be worth at the close of the period, assuming actual returns and expenses.To estimate the expenses you paid on your account over this period, simply divide your account value by $1,000 (for example, an $8,600 account value divided by $1,000 = 8.60), then multiply the results by the number in the Expenses paid per $1,000 line for the class of shares you own.
| Expenses and Value of a $1,000 Investment | | | | | | |
| assuming actual returns for the six months ended December 31, 2006 | | | | |
| | | Class A | | Class B | | Class C | | Class F | | Class R | | Class T |
| |
| |
| |
| |
| |
| |
|
| Expenses paid | | | | | | | | | | | | |
| per $1,000 † | | $ 7.85 | | $ 13.47 | | $ 12.08 | | $ 7.85 | | $ 6.57 | | $ 9.53 |
| Ending value | | | | | | | | | | | | |
| (after expenses) | | $1,035.80 | | $1,024.80 | | $1,031.30 | | $1,035.50 | | $1,036.90 | | $1,033.30 |
| COMPARING YOUR FUND’S EXPENSES |
| WITH THOSE OF OTHER FUNDS (Unaudited) |
Using the SEC’s method to compare expenses
The Securities and Exchange Commission (SEC) has established guidelines to help investors assess fund expenses. Per these guidelines, the table below shows your fund's expenses based on a $1,000 investment, assuming a hypothetical 5% annualized return. You can use this information to compare the ongoing expenses (but not transaction expenses or total cost) of investing in the fund with those of other funds.All mutual fund shareholder reports will provide this information to help you make this comparison. Please note that you cannot use this information to estimate your actual ending account balance and expenses paid during the period.
| Expenses and Value of a $1,000 Investment |
| assuming a hypothetical 5% annualized return for the six months ended December 31, 2006 |
| | | Class A | | Class B | | Class C | | Class F | | Class R | | Class T |
| |
| |
| |
| |
| |
| |
|
| Expenses paid | | | | | | | | | | | | |
| per $1,000 † | | $ 7.78 | | $ 13.39 | | $ 11.98 | | $ 7.78 | | $ 6.51 | | $ 9.45 |
| Ending value | | | | | | | | | | | | |
| (after expenses) | | $1,017.49 | | $1,011.90 | | $1,013.31 | | $1,017.49 | | $1,018.75 | | $1,015.83 |
| † Expenses are equal to the fund’s annualized expense ratio of 1.53% for Class A shares, 2.64% for Class B shares, |
| 2.36% for Class C shares, 1.53% for Class F shares, 1.28% for Class R shares and 1.86% for Class T shares; |
| multiplied by the average account value over the period, multiplied by 184/365 (to reflect the one-half year period). |
8
STATEMENT OF INVESTMENTS
December 31, 2006
|
| Common Stocks—101.0% | | Shares | | Value ($) |
| |
| |
|
| Air Freight & Logistics—2.5% | | | | |
| Hub Group, Cl. A | | 79,884 a | | 2,200,804 |
| Pacer International | | 87,080 | | 2,592,372 |
| UTi Worldwide | | 83,990 | | 2,511,301 |
| | | | | 7,304,477 |
| Airlines—1.1% | | | | |
| Alaska Air Group | | 80,400 a | | 3,175,800 |
| Apparel Retail—2.3% | | | | |
| Aeropostale | | 56,720 a | | 1,750,946 |
| bebe Stores | | 118,820 | | 2,351,448 |
| Cache | | 101,216 a | | 2,554,692 |
| | | | | 6,657,086 |
| Application Software—2.2% | | | | |
| BEA Systems | | 113,400 a | | 1,426,572 |
| Epicor Software | | 117,190 a | | 1,583,237 |
| Informatica | | 123,100 a | | 1,503,051 |
| Ultimate Software Group | | 71,450 a | | 1,661,927 |
| | | | | 6,174,787 |
| Biotechnology—4.8% | | | | |
| Alnylam Pharmaceuticals | | 94,900 a | | 2,030,860 |
| Applera—Celera Genomics Group | | 94,700 a | | 1,324,853 |
| Array BioPharma | | 82,300 a | | 1,063,316 |
| Enzon Pharmaceuticals | | 182,600 a | | 1,553,926 |
| InterMune | | 117,400 a | | 3,610,050 |
| Medarex | | 123,700 a | | 1,829,523 |
| Rigel Pharmaceuticals | | 127,000 a | | 1,507,490 |
| Vertex Pharmaceuticals | | 21,600 a | | 808,272 |
| | | | | 13,728,290 |
| Broadcasting & Cable Tv—.5% | | | | |
| LIN TV, Cl. A | | 154,200 a | | 1,534,290 |
| Casinos & Gaming—.9% | | | | |
| Penn National Gaming | | 59,100 a | | 2,459,742 |
| Coal & Consumable Fuels—.6% | | | | |
| GeoMet | | 160,730 a | | 1,671,592 |
| Commercial & Professional Services—3.3% | | |
| Bright Horizons Family Solutions | | 91,500 a | | 3,537,390 |
| Copart | | 102,670 a | | 3,080,100 |
The Fund 9
STATEMENT OF INVESTMENTS (continued)
|
| Common Stocks (continued) | | Shares | | Value ($) |
| |
| |
|
| Commercial & Professional Services (continued) | | |
| Global Cash Access Holdings | | 179,190 a | | 2,908,254 |
| | | | | 9,525,744 |
| Communications Equipment—4.1% | | | | |
| Arris Group | | 157,450 a | | 1,969,700 |
| MasTec | | 208,600 a | | 2,407,244 |
| NETGEAR | | 110,390 a | | 2,897,737 |
| Polycom | | 104,800 a | | 3,239,368 |
| Sirenza Microdevices | | 164,708 a | | 1,294,605 |
| | | | | 11,808,654 |
| Computer Storage & Peripherals—1.6% | | |
| Brocade Communications Systems | | 241,630 a | | 1,983,782 |
| Rackable Systems | | 84,950 a | | 2,630,901 |
| | | | | 4,614,683 |
| Construction & Engineering—3.2% | | | | |
| Quanta Services | | 198,800 a | | 3,910,396 |
| Washington Group International | | 87,900 a | | 5,255,541 |
| | | | | 9,165,937 |
| Construction, Farm Machinery & Heavy Trucks—1.0% | | |
| Bucyrus International, Cl. A | | 54,537 | | 2,822,835 |
| Consumer Finance—1.7% | | | | |
| Dollar Financial | | 78,170 a | | 2,177,816 |
| First Cash Financial Services | | 107,872 a | | 2,790,649 |
| | | | | 4,968,465 |
| Consumer Services—1.2% | | | | |
| Jackson Hewitt Tax Service | | 99,820 | | 3,390,885 |
| Data Processing & Outsourced Services—.9% | | |
| Wright Express | | 79,370 a | | 2,473,963 |
| Diversified Banks—.3% | | | | |
| Nara Bancorp | | 47,082 | | 984,955 |
| Diversified Financial Services—.9% | | | | |
| CapitalSource | | 97,300 | | 2,657,263 |
| Drug Retail—1.1% | | | | |
| Rite Aid | | 576,400 a | | 3,135,616 |
| Electronic Equipment Manufacturers—.5% | | |
| Tektronix | | 53,100 | | 1,548,927 |
| Electronic Manufacturing Services—1.8% | | |
| SMART Modular Technologies | | 374,990 a | | 5,047,365 |
| |
| 10 | | | | |
| Common Stocks (continued) | | Shares | | Value ($) |
| |
| |
|
| Environmental & Facilities Services—2.3% | | |
| Central Parking | | 132,250 | | 2,380,500 |
| Stericycle | | 26,000 a | | 1,963,000 |
| Team | | 60,700 a | | 2,114,181 |
| | | | | 6,457,681 |
| Fertilizers—.6% | | | | |
| American Vanguard | | 105,800 | | 1,682,220 |
| Food Distributors—1.7% | | | | |
| Performance Food Group | | 80,000 a | | 2,211,200 |
| United Natural Foods | | 74,330 a | | 2,669,934 |
| | | | | 4,881,134 |
| Food Retail—.4% | | | | |
| Ruddick | | 37,400 | | 1,037,850 |
| Gold—.4% | | | | |
| Kinross Gold | | 108,020 a | | 1,283,278 |
| Health Care Equipment—7.0% | | | | |
| ArthroCare | | 38,475 a | | 1,535,922 |
| Cytyc | | 96,000 a | | 2,716,800 |
| Integra LifeSciences Holdings | | 78,450 a | | 3,341,185 |
| Natus Medical | | 187,580 a | | 3,115,704 |
| PerkinElmer | | 78,200 | | 1,738,386 |
| Respironics | | 88,210 a | | 3,329,928 |
| Thoratec | | 118,310 a | | 2,079,890 |
| VIASYS Healthcare | | 82,330 a | | 2,290,421 |
| | | | | 20,148,236 |
| Health Care Facilities—2.6% | | | | |
| Community Health Systems | | 58,200 a | | 2,125,464 |
| Triad Hospitals | | 35,700 a | | 1,493,331 |
| United Surgical Partners | | | | |
| International | | 57,700 a | | 1,635,795 |
| VCA Antech | | 72,100 a | | 2,320,899 |
| | | | | 7,575,489 |
| Health Care Services—1.2% | | | | |
| Matria Healthcare | | 58,240 a | | 1,673,235 |
| Pediatrix Medical Group | | 33,490 a | | 1,637,661 |
| | | | | 3,310,896 |
| Health Care Supplies—.5% | | | | |
| Arrow International | | 43,500 | | 1,539,030 |
The Fund 11
STATEMENT OF INVESTMENTS (continued)
|
| Common Stocks (continued) | | Shares | | Value ($) |
| |
| |
|
| Internet Software & Services—5.3% | | | | |
| 24/7 Real Media | | 596,995 a | | 5,402,805 |
| Art Technology Group | | 843,130 a | | 1,964,493 |
| DealerTrack Holdings | | 86,700 a | | 2,550,714 |
| ValueClick | | 132,370 a | | 3,127,903 |
| VeriSign | | 92,000 a | | 2,212,600 |
| | | | | 15,258,515 |
| Investment Banking & Brokerage—.8% | | | | |
| Piper Jaffray Cos. | | 35,580 a | | 2,318,037 |
| Leisure Products—1.4% | | | | |
| Steiner Leisure | | 87,500 a | | 3,981,250 |
| Life Sciences Tools & Services—1.3% | | | | |
| Exelixis | | 141,900 a | | 1,277,100 |
| Thermo Fisher Scientific | | 51,900 a | | 2,350,551 |
| | | | | 3,627,651 |
| Managed Health Care—1.1% | | | | |
| Centene | | 128,440 a | | 3,155,771 |
| Movies & Entertainment—1.4% | | | | |
| Lions Gate Entertainment | | 381,190 a | | 4,090,169 |
| Multi-Line Insurance—.6% | | | | |
| Arch Capital Group | | 27,500 a | | 1,859,275 |
| Oil & Gas Equipment & Services—4.2% | | | | |
| Dril-Quip | | 53,060 a | | 2,077,830 |
| Hanover Compressor | | 79,370 a | | 1,499,299 |
| Oil States International | | 81,000 a | | 2,610,630 |
| Superior Well Services | | 88,370 a | | 2,258,737 |
| W-H Energy Services | | 71,400 a | | 3,476,466 |
| | | | | 11,922,962 |
| Oil & Gas Exploration & Production—2.3% | | |
| Arena Resources | | 49,350 a | | 2,107,738 |
| GMX Resources | | 38,620 a | | 1,371,010 |
| Penn Virginia | | 44,400 | | 3,109,776 |
| | | | | 6,588,524 |
| Packaged Foods & Meats—.2% | | | | |
| Green Mountain Coffee Roasters | | 9,818 a | | 483,340 |
| Common Stocks (continued) | | Shares | | | | Value ($) |
| |
| |
| |
|
| Personal Products—3.2% | | | | | | |
| Herbalife | | 40,440 | | a | | 1,624,070 |
| Inter Parfums | | 158,050 | | | | 3,032,980 |
| Physicians Formula Holdings | | 161,530 | | a | | 3,018,996 |
| Prestige Brands Holdings | | 117,380 | | a | | 1,528,288 |
| | | | | | | 9,204,334 |
| Pharmaceutical—1.1% | | | | | | |
| Covance | | 25,200 | | a | | 1,484,532 |
| Santarus | | 199,080 | | a | | 1,558,796 |
| | | | | | | 3,043,328 |
| Power Producers—1.1% | | | | | | |
| Ormat Technologies | | 85,690 | | | | 3,155,106 |
| Precious Metals & Minerals—1.1% | | | | | | |
| Hecla Mining | | 414,040 | | a | | 3,171,546 |
| Property & Casualty Insurance—1.6% | | | | |
| Argonaut Group | | 70,430 | | a | | 2,455,190 |
| First Mercury Financial | | 93,640 | | a | | 2,202,413 |
| | | | | | | 4,657,603 |
| Regional Banks—3.0% | | | | | | |
| Capitol Bancorp | | 51,260 | | | | 2,368,212 |
| Financial Institutions | | 37,848 | | | | 872,396 |
| First Midwest Bancorp/IL | | 41,170 | | | | 1,592,456 |
| First State Bancorporation/NM | | 61,250 | | | | 1,515,937 |
| Umpqua Holdings | | 78,300 | | | | 2,304,369 |
| | | | | | | 8,653,370 |
| Reinsurance—.8% | | | | | | |
| Montpelier Re Holdings | | 125,700 | | | | 2,339,277 |
| Restaurants—2.5% | | | | | | |
| California Pizza Kitchen | | 47,645 | | a | | 1,587,055 |
| Ruth’s Chris Steak House | | 177,890 | | a | | 3,251,829 |
| Texas Roadhouse, Cl. A | | 166,186 | | a | | 2,203,626 |
| | | | | | | 7,042,510 |
| Semiconductor Equipment—2.0% | | | | | | |
| Cymer | | 38,310 | | a | | 1,683,725 |
| FormFactor | | 54,250 | | a | | 2,020,813 |
The Fund 13
STATEMENT OF INVESTMENTS (continued)
|
| Common Stocks (continued) | | Shares | | Value ($) |
| |
| |
|
| Semiconductor Equipment (continued) | | |
| Rudolph Technologies | | 124,430 a | | 1,980,926 |
| | | | | 5,685,464 |
| Semiconductors—4.6% | | | | |
| AMIS Holdings | | 146,390 a | | 1,547,342 |
| Micrel | | 122,950 a | | 1,325,401 |
| MoSys | | 146,210 a | | 1,352,442 |
| Silicon Image | | 114,540 a | | 1,456,949 |
| Standard Microsystems | | 54,790 a | | 1,533,024 |
| Supertex | | 85,060 a | | 3,338,605 |
| Tessera Technologies | | 66,120 a | | 2,667,281 |
| | | | | 13,221,044 |
| Soft Drinks—1.6% | | | | |
| Hansen Natural | | 78,690 a | | 2,650,279 |
| National Beverage | | 131,800 | | 1,849,154 |
| | | | | 4,499,433 |
| Specialized Finance—1.1% | | | | |
| Portfolio Recovery Associates | | 70,130 a | | 3,274,370 |
| Specialty Stores—.5% | | | | |
| Tractor Supply | | 32,720 a | | 1,462,911 |
| Steel—1.3% | | | | |
| Cleveland-Cliffs | | 37,500 | | 1,816,500 |
| Schnitzer Steel Industries, Cl. A | | 44,800 | | 1,778,560 |
| | | | | 3,595,060 |
| Telecommunication Services—1.1% | | |
| NeuStar, Cl. A | | 93,530 a | | 3,034,113 |
| Trading Companies & Distributors—2.6% | | |
| Interline Brands | | 61,500 a | | 1,381,905 |
| MSC Industrial Direct, Cl. A | | 79,430 | | 3,109,685 |
| UAP Holding | | 119,286 | | 3,003,621 |
| | | | | 7,495,211 |
| Total Common Stocks | | | | |
| (cost $262,908,965) | | | | 289,587,344 |
| Other Investment—1.2% | | Shares | | Value ($) |
| |
| |
|
| Registered Investment Company; | | | | |
| Dreyfus Institutional Preferred | | | | |
| Plus Money Market Fund | | | | |
| (cost $3,512,000) | | 3,512,000 b | | 3,512,000 |
| |
| |
|
| Total Investments (cost $266,420,965) | | 102.2% | | 293,099,344 |
| Liabilities, Less Cash and Receivables | | (2.2%) | | (6,210,743) |
| Net Assets | | 100.0% | | 286,888,601 |
| a | | Non-income producing security. |
| b | | Investment in affiliated money market mutual fund. |
| Portfolio Summary (Unaudited) † | | | | |
| |
| | | Value (%) | | | | Value (%) |
| |
| |
| |
|
| Information Technology | | 22.9 | | Energy | | 7.0 |
| Healthcare | | 19.6 | | Materials | | 3.4 |
| Industrials | | 16.0 | | Telecommunications Services | | 1.1 |
| Financials | | 12.2 | | Other | | .2 |
| Consumer Discretionary | | 9.5 | | | | |
| Consumer Staples | | 8.1 | | | | 100.0 |
| † Based on net assets. |
| See notes to financial statements. |
The Fund 15
STATEMENT OF ASSETS AND LIABILITIES
December 31, 2006
| | | Cost | | Value |
| |
| |
|
| Assets ($): | | | | |
| Investments in securities—See Statement of Investments: | | |
| Unaffiliated issuers | | 262,908,965 | | 289,587,344 |
| Affiliated issuers | | 3,512,000 | | 3,512,000 |
| Cash | | | | 81,662 |
| Receivable for investment securities sold | | 406,783 |
| Dividends and interest receivable | | | | 102,166 |
| Receivable for shares of Common Stock subscribed | | 42,355 |
| Prepaid expenses | | | | 3,460 |
| Other assets | | | | 82,157 |
| | | | | 293,817,927 |
| |
| |
|
| Liabilities ($): | | | | |
| Due to Founders Asset Management LLC and affiliates—Note 3(c) | | 387,871 |
| Payable for shares of Common Stock redeemed | | 4,391,817 |
| Payable for investment securities purchased | | 1,811,273 |
| Interest payable—Note 2 | | | | 1,570 |
| Directors’ deferred compensation | | | | 82,157 |
| Accrued expenses | | | | 254,638 |
| | | | | 6,929,326 |
| |
| |
|
| Net Assets ($) | | | | 286,888,601 |
| |
| |
|
| Composition of Net Assets ($): | | | | |
| Paid-in capital | | | | 533,616,960 |
| Accumulated investment (loss)—net | | | | (158,079) |
| Accumulated net realized gain (loss) on investments | | (273,252,263) |
| Accumulated net unrealized appreciation | | |
| (depreciation) on investments | | | | 26,681,983 |
| |
| |
|
| Net Assets ($) | | | | 286,888,601 |
| Net Asset Value Per Share | | | | | | | | | | |
| | | Class A | | Class B | | Class C | | Class F | | Class R | | Class T |
| |
| |
| |
| |
| |
| |
|
| Net Assets ($) | | 35,718,667 | | 1,344,401 | | 2,980,614 238,014,969 | | 8,661,585 | | 168,365 |
| Shares Outstanding | | 1,187,251 | | 47,946 | | 105,376 | | 7,925,634 | | 282,424 | | 5,764 |
| |
| |
| |
| |
| |
| |
|
| Net Asset Value | | | | | | | | | | | | |
| Per Share ($) | | 30.09 | | 28.04 | | 28.29 | | 30.03 | | 30.67 | | 29.21 |
See notes to financial statements.
16
STATEMENT OF OPERATIONS
Year Ended December 31, 2006
|
| Investment Income ($): | | |
| Income: | | |
| Dividends (net of $4,465 foreign taxes withheld at source): | | |
| Unaffiliated issuers | | 887,845 |
| Affiliated issuers | | 100,419 |
| Interest | | 289,937 |
| Total Income | | 1,278,201 |
| Expenses: | | |
| Investment advisory fee—Note 3(a) | | 3,368,131 |
| Shareholder servicing costs—Note 3(c) | | 851,067 |
| Distribution fees—Note 3(b) | | 598,843 |
| Accounting fees—Note 3(c) | | 208,051 |
| Professional fees | | 148,450 |
| Directors’ fees and expenses—Note 3(d) | | 124,064 |
| Prospectus and shareholders’ reports | | 96,740 |
| Registration fees | | 63,440 |
| Custodian fees—Note 3(c) | | 17,173 |
| Loan commitment fees—Note 2 | | 16,089 |
| Interest expense—Note 2 | | 13,614 |
| Miscellaneous | | 52,450 |
| Total Expenses | | 5,558,112 |
| Less—reduction in custody fees due to | | |
| earnings credits—Note 1(c) | | (19,504) |
| Net Expenses | | 5,538,608 |
| Investment (Loss)—Net | | (4,260,407) |
| |
|
| Realized and Unrealized Gain (Loss) on Investments—Note 4 ($): |
| Net realized gain (loss) on investments | | 11,932,242 |
| Net change in unrealized appreciation (depreciation) on investments | | 8,602,976 |
| Net Realized and Unrealized Gain (Loss) on Investments | | 20,535,218 |
| Net Increase in Net Assets Resulting from Operations | | 16,274,811 |
See notes to financial statements.
|
The Fund 17
STATEMENT OF CHANGES IN NET ASSETS
| | | Year Ended December 31, |
| |
|
| | | 2006 | | 2005 |
| |
| |
|
| Operations ($): | | | | |
| Investment (loss)—net | | (4,260,407) | | (6,209,050) |
| Net realized gain (loss) on investments | | 11,932,242 | | 104,859,627 |
| Net change in unrealized appreciation | | | | |
| (depreciation) on investments | | 8,602,976 | | (110,156,860) |
| Net Increase (Decrease) in Net Assets | | | | |
| Resulting from Operations | | 16,274,811 | | (11,506,283) |
| |
| |
|
| Capital Stock Transactions ($): | | | | |
| Net proceeds from shares sold: | | | | |
| Class A shares | | 31,753,979 | | 16,949,413 |
| Class B shares | | 69,786 | | 179,523 |
| Class C shares | | 578,469 | | 207,689 |
| Class F shares | | 19,688,048 | | 40,938,769 |
| Class R shares | | 7,013,386 | | 9,843,662 |
| Class T shares | | 33,471 | | 222,678 |
| Cost of shares redeemed: | | | | |
| Class A shares | | (41,576,885) | | (36,911,551) |
| Class B shares | | (13,014,588) | | (4,561,621) |
| Class C shares | | (2,147,554) | | (2,325,790) |
| Class F shares | | (147,807,521) | | (231,351,396) |
| Class R shares | | (6,869,929) | | (72,804,524) |
| Class T shares | | (1,142,702) | | (657,341) |
| Increase (Decrease) in Net Assets | | | | |
| from Capital Stock Transactions | | (153,422,040) | | (280,270,489) |
| Total Increase (Decrease) in Net Assets | | (137,147,229) | | (291,776,772) |
| |
| |
|
| Net Assets ($): | | | | |
| Beginning of Period | | 424,035,830 | | 715,812,602 |
| End of Period | | 286,888,601 | | 424,035,830 |
| Accumulated investment (loss) | | (158,079) | | (132,136) |
See notes to financial statements.
|
| | | Year Ended December 31, |
| |
|
| | | 2006 | | 2005 |
| |
| |
|
| Capital Share Transactions: | | | | |
| Class Aa | | | | |
| Shares sold | | 1,033,819 | | 608,634 |
| Shares redeemed | | (1,421,803) | | (1,315,511) |
| Net Increase (Decrease) in Shares Outstanding | | (387,984) | | (706,877) |
| |
| |
|
| Class B a | | | | |
| Shares sold | | 2,416 | | 6,784 |
| Shares redeemed | | (469,720) | | (173,781) |
| Net Increase (Decrease) in Shares Outstanding | | (467,304) | | (166,997) |
| |
| |
|
| Class C | | | | |
| Shares sold | | 19,922 | | 7,954 |
| Shares redeemed | | (76,293) | | (88,042) |
| Net Increase (Decrease) in Shares Outstanding | | (56,371) | | (80,088) |
| |
| |
|
| Class F | | | | |
| Shares sold | | 662,494 | | 1,487,909 |
| Shares redeemed | | (5,022,156) | | (8,342,143) |
| Net Increase (Decrease) in Shares Outstanding | | (4,359,662) | | (6,854,234) |
| |
| |
|
| Class R | | | | |
| Shares sold | | 225,128 | | 348,073 |
| Shares redeemed | | (228,359) | | (2,537,460) |
| Net Increase (Decrease) in Shares Outstanding | | (3,231) | | (2,189,387) |
| |
| |
|
| Class T | | | | |
| Shares sold | | 1,121 | | 8,141 |
| Shares redeemed | | (37,890) | | (24,068) |
| Net Increase (Decrease) in Shares Outstanding | | (36,769) | | (15,927) |
| a | | During the period ended December 31, 2006, 314,250 Class B shares representing $8,696,579, were |
| | | automatically converted to 296,178 Class A shares and during the period ended December 31, 2005, 3,805 Class |
| | | B shares representing $100,466 were automatically converted to 3,623 Class A shares. |
| See notes to financial statements. |
The Fund 19
The following tables describe the performance for each share class for the fiscal periods indicated. All information (except portfolio turnover rate) reflects financial results for a single fund share.Total return shows how much your investment in the fund would have increased (or decreased) during each period, assuming you had reinvested all dividends and distributions.These figures have been derived from the fund’s financial statements.
| | | | | | | Year Ended December 31, | | |
| | | |
| |
| |
|
| Class A Shares | | 2006 | | 2005 | | 2004 | | 2003 | | 2002 |
| |
| |
| |
| |
| |
|
| Per Share Data ($): | | | | | | | | | | |
| Net asset value, beginning of period | | 28.63 | | 28.82 | | 26.04 | | 19.09 | | 28.50 |
| Investment Operations: | | | | | | | | | | |
| Investment (loss)—net | | (.35)a | | (.28)a | | (.64) | | (.36) | | (.31) |
| Net realized and unrealized | | | | | | | | | | |
| gain (loss) on investments | | 1.81 | | .09 | | 3.42 | | 7.31 | | (9.10) |
| Total from Investment Operations | | 1.46 | | (.19) | | 2.78 | | 6.95 | | (9.41) |
| Net asset value, end of period | | 30.09 | | 28.63 | | 28.82 | | 26.04 | | 19.09 |
| |
| |
| |
| |
| |
|
| Total Return (%) b | | 5.10 | | (.66) | | 10.68 | | 36.41 | | (33.02) |
| |
| |
| |
| |
| |
|
| Ratios/Supplemental Data (%): | | | | | | | | | | |
| Ratio of total expenses | | | | | | | | | | |
| to average net assets | | 1.51 | | 1.47 | | 1.38 | | 1.50 | | 1.35 |
| Ratio of net expenses | | | | | | | | | | |
| to average net assets | | 1.51 | | 1.45 | | 1.37 | | 1.50 | | 1.35 |
| Ratio of net investment (loss) | | | | | | | | | | |
| to average net assets | | (1.15) | | (1.09) | | (1.11) | | (1.25) | | (1.08) |
| Portfolio Turnover Rate c | | 202 | | 160 | | 98 | | 130 | | 128 |
| |
| |
| |
| |
| |
|
| Net Assets, end of period ($ x 1,000) | | 35,719 | | 45,092 | | 65,763 | | 79,630 | | 67,184 |
| |
| a | | Based on average shares outstanding at each month end. | | | | | | | | |
| b | | Exclusive of sales charge. | | | | | | | | | | |
| c | | Portfolio Turnover Rate is a measure of portfolio activity that is calculated by dividing the lesser of purchases or sales |
| | | of securities, excluding securities having maturity dates at acquisition of one year or less, by the average value of the |
| | | portfolio securities held during the period, which is a rolling 12-month period. | | | | |
| See notes to financial statements. | | | | | | | | | | |
| | | | | | | Year Ended December 31, | | |
| | | |
| |
| |
|
| Class B Shares | | 2006 | | 2005 | | 2004 | | 2003 | | 2002 |
| |
| |
| |
| |
| |
|
| Per Share Data ($): | | | | | | | | | | |
| Net asset value, beginning of period | | 27.10 | | 27.55 | | 25.12 | | 18.60 | | 28.03 |
| Investment Operations: | | | | | | | | | | |
| Investment (loss)—net | | (.61)a | | (.54)a | | (1.07) | | (.81) | | (.69) |
| Net realized and unrealized | | | | | | | | | | |
| gain (loss) on investments | | 1.55 | | .09 | | 3.50 | | 7.33 | | (8.74) |
| Total from Investment Operations | | .94 | | (.45) | | 2.43 | | 6.52 | | (9.43) |
| Net asset value, end of period | | 28.04 | | 27.10 | | 27.55 | | 25.12 | | 18.60 |
| |
| |
| |
| |
| |
|
| Total Return (%) b | | 3.51 | | (1.63) | | 9.67 | | 35.05 | | (33.64) |
| |
| |
| |
| |
| |
|
| Ratios/Supplemental Data (%): | | | | | | | | | | |
| Ratio of total expenses | | | | | | | | | | |
| to average net assets | | 2.64 | | 2.44 | | 2.30 | | 2.56 | | 2.26 |
| Ratio of net expenses | | | | | | | | | | |
| to average net assets | | 2.64 | | 2.43 | | 2.29 | | 2.56 | | 2.26 |
| Ratio of net investment (loss) | | | | | | | | | | |
| to average net assets | | (2.28) | | (2.06) | | (2.03) | | (2.31) | | (1.98) |
| Portfolio Turnover Rate c | | 202 | | 160 | | 98 | | 130 | | 128 |
| |
| |
| |
| |
| |
|
| Net Assets, end of period ($ x 1,000) | | 1,344 | | 13,964 | | 18,795 | | 21,009 | | 18,804 |
| a | | Based on average shares outstanding at each month end. | | | | | | | | |
| b | | Exclusive of sales charge. | | | | | | | | | | |
| c | | Portfolio Turnover Rate is a measure of portfolio activity that is calculated by dividing the lesser of purchases or sales |
| | | of securities, excluding securities having maturity dates at acquisition of one year or less, by the average value of the |
| | | portfolio securities held during the period, which is a rolling 12-month period. | | | | |
| See notes to financial statements. | | | | | | | | | | |
The Fund 21
FINANCIAL HIGHLIGHTS (continued)
|
| | | | | | | Year Ended December 31, | | |
| | | |
| |
| |
|
| Class C Shares | | 2006 | | 2005 | | 2004 | | 2003 | | 2002 |
| |
| |
| |
| |
| |
|
| Per Share Data ($): | | | | | | | | | | |
| Net asset value, beginning of period | | 27.14 | | 27.57 | | 25.14 | | 18.60 | | 28.05 |
| Investment Operations: | | | | | | | | | | |
| Investment (loss)—net | | (.56)a | | (.50)a | | (1.53) | | (.94) | | (.86) |
| Net realized and unrealized | | | | | | | | | | |
| gain (loss) on investments | | 1.71 | | .07 | | 3.96 | | 7.48 | | (8.59) |
| Total from Investment Operations | | 1.15 | | (.43) | | 2.43 | | 6.54 | | (9.45) |
| Net asset value, end of period | | 28.29 | | 27.14 | | 27.57 | | 25.14 | | 18.60 |
| |
| |
| |
| |
| |
|
| Total Return (%) b | | 4.24 | | (1.56) | | 9.67 | | 35.16 | | (33.69) |
| |
| |
| |
| |
| |
|
| Ratios/Supplemental Data (%): | | | | | | | | | | |
| Ratio of total expenses | | | | | | | | | | |
| to average net assets | | 2.36 | | 2.36 | | 2.28 | | 2.52 | | 2.27 |
| Ratio of net expenses | | | | | | | | | | |
| to average net assets | | 2.36 | | 2.35 | | 2.27 | | 2.52 | | 2.26 |
| Ratio of net investment (loss) | | | | | | | | | | |
| to average net assets | | (2.01) | | (1.98) | | (2.01) | | (2.28) | | (1.99) |
| Portfolio Turnover Rate c | | 202 | | 160 | | 98 | | 130 | | 128 |
| |
| |
| |
| |
| |
|
| Net Assets, end of period ($ x 1,000) | | 2,981 | | 4,391 | | 6,668 | | 8,352 | | 7,794 |
| |
| a | | Based on average shares outstanding at each month end. | | | | | | | | |
| b | | Exclusive of sales charge. | | | | | | | | | | |
| c | | Portfolio Turnover Rate is a measure of portfolio activity that is calculated by dividing the lesser of purchases or sales |
| | | of securities, excluding securities having maturity dates at acquisition of one year or less, by the average value of the |
| | | portfolio securities held during the period, which is a rolling 12-month period. | | | | | | |
| See notes to financial statements. | | | | | | | | | | |
| | | | | Year Ended December 31, | | |
| |
| |
| |
|
| Class F Shares | | 2006 | | 2005 | | 2004 | | 2003 | | 2002 |
| |
| |
| |
| |
| |
|
| Per Share Data ($): | | | | | | | | | | |
| Net asset value, beginning of period | | 28.58 | | 28.77 | | 25.98 | | 19.04 | | 28.45 |
| Investment Operations: | | | | | | | | | | |
| Investment (loss)—net | | (.34)a | | (.30)a | | (.69) | | (.35) | | (.36) |
| Net realized and unrealized | | | | | | | | | | |
| gain (loss) on investments | | 1.79 | | .11 | | 3.48 | | 7.29 | | (9.05) |
| Total from Investment Operations | | 1.45 | | (.19) | | 2.79 | | 6.94 | | (9.41) |
| Net asset value, end of period | | 30.03 | | 28.58 | | 28.77 | | 25.98 | | 19.04 |
| |
| |
| |
| |
| |
|
| Total Return (%) | | 5.08 | | (.66) | | 10.74 | | 36.45 | | (33.08) |
| |
| |
| |
| |
| |
|
| Ratios/Supplemental Data (%): | | | | | | | | | | |
| Ratio of total expenses | | | | | | | | | | |
| to average net assets | | 1.53 | | 1.46 | | 1.35 | | 1.53 | | 1.41 |
| Ratio of net expenses | | | | | | | | | | |
| to average net assets | | 1.52 | | 1.45 | | 1.34 | | 1.53 | | 1.40 |
| Ratio of net investment (loss) | | | | | | | | | | |
| to average net assets | | (1.16) | | (1.09) | | (1.08) | | (1.29) | | (1.13) |
| Portfolio Turnover Rate b | | 202 | | 160 | | 98 | | 130 | | 128 |
| |
| |
| |
| |
| |
|
| Net Assets, end of period ($ x 1,000) | | 238,015 | | 351,087 | | 550,622 | | 638,880 | | 498,970 |
| a | | Based on average shares outstanding at each month end. |
| b | | Portfolio Turnover Rate is a measure of portfolio activity that is calculated by dividing the lesser of purchases or sales |
| | | of securities, excluding securities having maturity dates at acquisition of one year or less, by the average value of the |
| | | portfolio securities held during the period, which is a rolling 12-month period. |
| See notes to financial statements. |
The Fund 23
FINANCIAL HIGHLIGHTS (continued)
|
| | | | | | | Year Ended December 31, | | |
| | | |
| |
| |
|
| Class R Shares | | 2006 | | 2005 | | 2004 | | 2003 | | 2002 |
| |
| |
| |
| |
| |
|
| Per Share Data ($): | | | | | | | | | | |
| Net asset value, beginning of period | | 29.11 | | 29.22 | | 26.32 | | 19.23 | | 28.64 |
| Investment Operations: | | | | | | | | | | |
| Investment (loss)—net | | (.27)a | | (.24)a | | (.24) | | (.17) | | (.18) |
| Net realized and unrealized | | | | | | | | | | |
| gain (loss) on investments | | 1.83 | | .13 | | 3.14 | | 7.26 | | (9.23) |
| Total from Investment Operations | | 1.56 | | (.11) | | 2.90 | | 7.09 | | (9.41) |
| Net asset value, end of period | | 30.67 | | 29.11 | | 29.22 | | 26.32 | | 19.23 |
| |
| |
| |
| |
| |
|
| Total Return (%) | | 5.36 | | (.38) | | 11.02 | | 36.87 | | (32.86) |
| |
| |
| |
| |
| |
|
| Ratios/Supplemental Data (%): | | | | | | | | | | |
| Ratio of total expenses | | | | | | | | | | |
| to average net assets | | 1.26 | | 1.18 | | 1.11 | | 1.21 | | 1.10 |
| Ratio of net expenses | | | | | | | | | | |
| to average net assets | | 1.26 | | 1.17 | | 1.10 | | 1.21 | | 1.10 |
| Ratio of net investment (loss) | | | | | | | | | | |
| to average net assets | | (.91) | | (.80) | | (.83) | | (.96) | | (.82) |
| Portfolio Turnover Rate b | | 202 | | 160 | | 98 | | 130 | | 128 |
| |
| |
| |
| |
| |
|
| Net Assets, end of period ($ x 1,000) | | 8,662 | | 8,315 | | 72,317 | | 65,240 | | 42,872 |
| |
| a | | Based on average shares outstanding at each month end. | | | | | | | | |
| b | | Portfolio Turnover Rate is a measure of portfolio activity that is calculated by dividing the lesser of purchases or sales |
| | | of securities, excluding securities having maturity dates at acquisition of one year or less, by the average value of the |
| | | portfolio securities held during the period, which is a rolling 12-month period. | | | | |
| See notes to financial statements. | | | | | | | | | | |
| | | | | | | Year Ended December 31, | | |
| | | |
| |
| |
|
| Class T Shares | | 2006 | | 2005 | | 2004 | | 2003 | | 2002 |
| |
| |
| |
| |
| |
|
| Per Share Data ($): | | | | | | | | | | |
| Net asset value, beginning of period | | 27.91 | | 28.18 | | 25.55 | | 18.79 | | 28.24 |
| Investment Operations: | | | | | | | | | | |
| Investment (loss)—net | | (.45)a | | (.38)a | | (.65) | | (.31) | | (.54) |
| Net realized and unrealized | | | | | | | | | | |
| gain (loss) on investments | | 1.75 | | .11 | | 3.28 | | 7.07 | | (8.91) |
| Total from Investment Operations | | 1.30 | | (.27) | | 2.63 | | 6.76 | | (9.45) |
| Net asset value, end of period | | 29.21 | | 27.91 | | 28.18 | | 25.55 | | 18.79 |
| |
| |
| |
| |
| |
|
| Total Return (%) b | | 4.66 | | (.96) | | 10.29 | | 35.98 | | (33.46) |
| |
| |
| |
| |
| |
|
| Ratios/Supplemental Data (%): | | | | | | | | | | |
| Ratio of total expenses | | | | | | | | | | |
| to average net assets | | 1.84 | | 1.77 | | 1.71 | | 1.91 | | 2.06 |
| Ratio of net expenses | | | | | | | | | | |
| to average net assets | | 1.84 | | 1.76 | | 1.70 | | 1.90 | | 2.06 |
| Ratio of net investment (loss) | | | | | | | | | | |
| to average net assets | | (1.51) | | (1.40) | | (1.44) | | (1.66) | | (1.79) |
| Portfolio Turnover Rate c | | 202 | | 160 | | 98 | | 130 | | 128 |
| |
| |
| |
| |
| |
|
| Net Assets, end of period ($ x 1,000) | | 168 | | 1,187 | | 1,648 | | 1,788 | | 1,291 |
| |
| a | | Based on average shares outstanding at each month end. | | | | | | | | |
| b | | Exclusive of sales charge. | | | | | | | | | | |
| c | | Portfolio Turnover Rate is a measure of portfolio activity that is calculated by dividing the lesser of purchases or sales |
| | | of securities, excluding securities having maturity dates at acquisition of one year or less, by the average value of the |
| | | portfolio securities held during the period, which is a rolling 12-month period. | | | | | | |
| See notes to financial statements. | | | | | | | | | | |
The Fund 25
NOTES TO FINANCIAL STATEMENTS
NOTE 1—Significant Accounting Policies:
Dreyfus Founders Discovery Fund (the “fund”) is a separate diversified series of Dreyfus Founders Funds, Inc. (the “Company”), which is registered under the Investment Company Act of 1940, as amended (the “Act”), as an open-end management investment company and operates as a series company currently offering eight series, including the fund. The fund’s investment objective is to seek capital appreciation through investments in stocks of small-cap growth companies. Founders Asset Management LLC (the “Manager” or “Founders”) serves as the fund’s investment adviser. Founders is an indirect wholly-owned subsidiary of Mellon Financial Corporation (“Mellon Financial”), a publicly-owned financial services company which provides a comprehensive range of financial products and services in domestic and selected international markets.
On December 4, 2006, Mellon Financial and The Bank of New York Company, Inc. announced that they had entered into a definitive agreement to merge.The new company will be called The Bank of New York Mellon Corporation.As part of this transaction, Founders would become an indirect wholly-owned subsidiary of The Bank of New York Mellon Corporation. The transaction is subject to certain regulatory approvals and the approval of The Bank of New York Company, Inc.’s and Mellon Financial’s shareholders, as well as other customary conditions to closing. Subject to such approvals and the satisfaction of the other conditions, Mellon Financial and The Bank of New York Company, Inc. expect the transaction to be completed in the third quarter of 2007.
Dreyfus Service Corporation (the “Distributor”), the direct owner of Founders and a wholly-owned subsidiary of The Dreyfus Corporation (“Dreyfus”, an affiliate of Founders), is the Distributor of the fund’s shares. The fund is authorized to issue up to 550 million shares of Common Stock, par value $ .01 per share, in the following classes of shares: Class A, Class B, Class C, Class F, Class R and Class T shares. Class A and Class T shares are subject to a sales charge imposed at the time of purchase. Class B shares are subject to a contingent deferred sales charge (“CDSC”) imposed on Class B share redemptions made within six years
of purchase and automatically convert to Class A shares after six years. Class C shares are subject to a CDSC imposed on Class C shares redeemed within one year of purchase. Class F and Class R shares are sold at net asset value (“NAV”) per share. Class F shares are sold only to Class F grandfathered investors, and Class R shares are sold only to eligible institutional investors. Other differences between the classes include the services offered to and the expenses borne by each class. Income and realized and unrealized gains or losses on investments are allocated to each class of shares based on its relative net assets.
Effective June 1, 2006, the fund no longer offers Class B shares, except in connection with dividend reinvestment and permitted exchanges of Class B shares.
Each class of the fund bears expenses incurred specifically on its behalf and, in addition, each class bears a portion of general expenses based on the relative net assets or the number of shareholder accounts of the class.The type of expense determines the allocation method.
The fund’s financial statements are prepared in accordance with U.S. generally accepted accounting principles, which requires the use of management estimates and assumptions. Actual results could differ from those estimates.
In the normal course of business, the fund may enter into contracts and agreements that contain a variety of representations and warranties, and which provide general indemnifications. The maximum exposure to the fund under these arrangements is unknown, as this would involve future claims that may be made against the fund that have not yet occurred. However, based on experience, the fund expects the risks of loss to be remote.
(a) Portfolio valuation: A domestic equity security listed or traded on a securities exchange or in the over-the-counter market is valued at its last sale price on the exchange or market where it is principally traded or, in the case of a security traded on NASDAQ, at its official closing price. Lacking any sales on that day, the security is valued at the current closing bid price, or by quotes from dealers making a market in
The Fund 27
NOTES TO FINANCIAL STATEMENTS (continued)
|
the security if the closing bid price is not available, or in the case of written call options, at the mean between the highest bid and lowest asked quotations obtained from at least two securities dealers.
A foreign equity security traded on a foreign exchange is valued at the last quoted official closing price available before the time when the fund’s assets are valued, or at the last quoted sales price if the exchange does not provide an official closing price or if the foreign market has not yet closed. Lacking any sales that day, the security is valued at the current closing bid price, or by quotes from dealers making a market in the security if the closing bid price is not available. New York closing exchange rates are used to convert foreign currencies to U.S. dollars.
A debt security with a remaining maturity greater than 60 days at the time of purchase is valued in accordance with the evaluated bid price supplied by a pricing service approved by the Company’s Board of Directors or, if such price is not available, at the mean between the highest bid and lowest asked quotations obtained from at least two securities dealers. A debt security with a remaining maturity of 60 days or less at the time of purchase is valued at amortized cost, which approximates market value, unless it is determined that amortized cost would not represent market value, in which case the securities would be marked to market.
If market quotations or official closing prices are not readily available or are determined not to reflect accurately fair value, securities will be valued at their fair value as determined in good faith by the Company’s Board of Directors or pursuant to procedures approved by the Board of Directors.These situations may include instances where an event occurs after the close of the market on which a security is traded but before the fund calculates its NAV, and it is determined that the event has materially affected the value of the security. Fair value of foreign equity securities may be determined with the assistance of a pricing service using correlations between the movement of prices of foreign securities and indexes of domestic securities and other appropriate indicators, such as closing market prices of relevant ADRs and futures contracts.
Investments in registered investment companies are valued at their NAV.
Using fair value to price securities requires the use of estimates, and as such, may result in a value that is different from a security’s most recent closing price and from the prices used by other mutual funds to calculate their NAV’s. In addition, it is possible that the fair value determined for a security may be different from the value that may be realized upon the security’s sale, and that these differences may be material to the NAV of the fund.
On September 20, 2006, the Financial Accounting Standards Board (FASB) released Statement of Financial Accounting Standards No. 157 “Fair Value Measurements” (“FAS 157”). FAS 157 establishes an authoritative definition of fair value, sets out a framework for measuring fair value, and requires additional disclosures about fair value measurements. The application of FAS 157 is required for fiscal years beginning after November 15, 2007 and interim periods within those fiscal years. Management does not believe that the application of this standard will have a material impact on the financial statements of the fund.
(b) Foreign Securities and Currency Transactions: The fund may invest at least a portion of its assets in foreign securities. Foreign securities carry more risk than U.S. securities, such as political and currency risks. In the event the fund executes a foreign security transaction, the fund may enter into a foreign currency contract to settle the foreign security transaction.The fund could be exposed to risk if counterpar-ties are unable to meet the terms of the contracts or if the value of the currency changes unfavorably to the U.S. dollar.The resultant foreign currency gain or loss from the contract is recorded as foreign currency gain or loss and is presented as such in the Statement of Operations.
The accounting records of the fund are maintained in U.S. dollars.The market values of foreign securities, currency holdings and other assets and liabilities are translated into U.S. dollars based on the current exchange rates each business day. Purchases and sales of investment securities and income and expense items denominated in foreign currencies are translated into U.S. dollar amounts on the respective dates of such transactions.
The Fund 29
NOTES TO FINANCIAL STATEMENTS (continued)
|
The fund does not isolate that portion of the results of operations resulting from changes in foreign exchange rates on investments from the fluctuations arising from changes in market prices of securities held. Such fluctuations are included with the net unrealized appreciation/(depreciation) from investments and foreign currency translations on the Statement of Operations.
Reported net realized foreign exchange gains or losses arise from sales of foreign currencies, currency gains or losses realized between the trade and settlement dates on securities transactions, and the difference between the amounts of dividends, interest, and foreign withholding taxes recorded on the fund’s books and the U.S. dollar equivalent of the amounts actually received or paid. Net unrealized appreciation or depreciation on investments and foreign currency translation arises from changes in the values of assets and liabilities, including investments in securities held at the date of the financial statements, resulting from changes in the exchange rates and changes in market prices of securities held.
(c) Securities transactions and investment income: Securities transactions are recorded on a trade date basis. Realized gain and loss from securities transactions are recorded on the identified cost basis. Dividend income is recognized on the ex-dividend date and interest income, including, where applicable, accretion of discount and amortization of premium on investments, is recognized on the accrual basis.
The fund has an arrangement with the custodian bank, Mellon Bank, N.A. (“Mellon Bank”), which is an affiliate of Founders, whereby the fund receives earnings credits from the custodian when positive cash balances are maintained, which are used to offset custody fees. For financial reporting purposes, the fund includes net earnings credits as an expense offset in the Statement of Operations.
(d) Affiliated issuers: Investments in other investment companies advised by the Manager or its affiliates are defined as “affiliated” in the Act.
(e) Dividends to shareholders: Dividends are recorded on the ex-dividend date. Dividends from investment income-net and dividends from net realized capital gain, if any, are normally declared and paid annually, but the fund may make distributions on a more frequent basis to comply with the distribution requirements of the Internal Revenue Code of 1986, as amended (the “Code”).To the extent that net realized capital gain can be offset by capital loss carryovers, it is the policy of the fund not to distribute such gain. Income and capital gain distributions are determined in accordance with income tax regulations, which may differ from U.S. generally accepted accounting principles.
(f) Federal income taxes: No provision has been made for federal income taxes since it is the policy of the fund to continue to comply with the requirements of Subchapter M of the Code that are applicable to regulated investment companies and to make distributions of income and capital gains sufficient to relieve it from all income taxes. The fund is treated as a separate tax entity for federal income tax purposes.
On July 13, 2006, the FASB released FASB Interpretation No. 48 “Accounting for Uncertainty in Income Taxes” (FIN 48). FIN 48 provides guidance for how uncertain tax positions should be recognized, measured, presented and disclosed in the financial statements. FIN 48 requires the evaluation of tax positions taken or expected to be taken in the course of preparing the fund’s tax returns to determine whether the tax positions are “more-likely-than-not” of being sustained by the applicable tax authority.Tax positions not deemed to meet the more-likely-than-not threshold would be recorded as a tax benefit or expense in the current year. Adoption of FIN 48 is required for fiscal years beginning after December 15, 2006 and is to be applied to all open tax years as of the effective date.At this time, management is evaluating the implications of FIN 48 and its impact, if any, in the financial statements has not yet been determined.
The Fund 31
NOTES TO FINANCIAL STATEMENTS (continued)
|
At December 31, 2006, the components of accumulated earnings on a tax basis were as follows: accumulated capital losses $272,781,396 and unrealized appreciation $26,361,505. In addition, the fund had $153,993 of capital losses realized after October 31, 2006, which were deferred for tax purposes to the first day of the following fiscal year.
The accumulated capital loss carryover is available to be applied against future net securities profits, if any, realized subsequent to December 31, 2006. If not applied, $28,240,961 of the carryover expires in fiscal 2009, $230,439,968 expires in fiscal 2010 and $14,100,467 expires in fiscal 2011.
During the period ended December 31, 2006, as a result of permanent book to tax differences, primarily due to the tax treatment for net operating losses, the fund increased accumulated undistributed investment income-net $4,234,464 and decreased paid-in capital by the same amount. Net assets were not affected by this reclassification.
NOTE 2—Bank Line of Credit:
|
The Company has a line of credit arrangement (“LOC”) with State Street Bank and Trust Company, to be used for temporary or emergency purposes, primarily for financing redemption payments. The borrowings by each series of the Company are limited to the lesser of (a) $50 million, or (b) the lesser of 25% of the series’ total net assets or the maximum amount which the series is permitted to borrow pursuant to the prospectus, any law or any other agreement. Combined borrowings are subject to the $50 million cap on the total LOC. Each series agrees to pay annual fees and interest on the unpaid balance based on prevailing market rates as defined in the LOC.
The average daily amount of borrowings outstanding under the LOC during the period December 31, 2006, was $261,000 with a related weighted average annualized interest rate of 5.22% .
NOTE 3—Investment Advisory Fee and Other Transactions With Affiliates:
(a) In accordance with an investment advisory agreement between the Company and Founders, the fund compensates Founders for its services
as investment adviser by the payment of fees computed daily and paid monthly at the annual rate equal to a percentage of the average daily value of the fund’s net assets.The fee is 1% of the first $250 million of net assets, .80% of the next $250 million of net assets and .70% of net assets in excess of $500 million.
During the period ended December 31, 2006, the fund was advised that the Distributor retained $825 and $20 from sales commissions earned on sales of the fund’s Class A and Class T shares, respectively, and $18,182 and $1,612 from CDSC on redemptions of the fund’s Class B and Class C shares, respectively.
(b) Under the Distribution Plan (the “Plan”) adopted pursuant to Rule 12b-1 under the Act, Class B, Class C and Class T shares pay the Distributor for distributing their shares at an annual rate of .75% of the value of their average daily net assets of Class B and Class C shares and .25% of the value of the average daily net assets of Class T shares. During the period ended December 31, 2006, Class B, Class C and Class T shares were charged $52,818, $28,343 and $704, respectively, pursuant to the Plan.
The fund has adopted a Distribution Plan pursuant to Rule 12b-1 under the Act applicable to its Class F shares. Under the plan, the fund is authorized to reimburse the Distributor for expenses paid for distributing or servicing its Class F shares at an annual rate of up to .25% of the value of the average daily net assets of the fund’s Class F shares. During the period ended December 31, 2006, Class F shares were charged $516,978 pursuant to this Distribution Plan.
(c) Under the Shareholder Services Plan, Class A, Class B, Class C and Class T shares pay the Distributor at an annual rate of .25% of the value of their average daily net assets for the provision of certain services. The services provided may include personal services relating to shareholder accounts, such as answering shareholder inquiries regarding the fund and providing reports and other information, and services related to the maintenance of shareholder accounts. The Distributor may make payments to Service Agents (a securities dealer, financial institu-
The Fund 33
NOTES TO FINANCIAL STATEMENTS (continued)
|
tion or other industry professional) in respect of these services. The Distributor determines the amounts to be paid to Service Agents. During the period ended December 31, 2006, Class A, Class B, Class C and Class T shares were charged $116,005, $17,606, $9,447 and $704, respectively, pursuant to the Shareholder Services Plan.
The Company has a shareholder services agreement with the Distributor, whereby the fund has agreed to compensate the Distributor for providing certain shareholder servicing functions to holders of Class F shares. The fund paid the Distributor a monthly fee equal, on an annual basis, to $24.00 per Class F shareholder account considered to be an open account at any time during a given month. During the period ended December 31, 2006, Class F shares were charged $225,125 pursuant to this shareholder services agreement.
Dreyfus Transfer, Inc. (“DTI”), a wholly-owned subsidiary of Dreyfus, is the transfer and dividend disbursing agent for all of the fund’s share classes.With the exception of out-of-pocket charges, the fees charged by DTI with respect to the fund’s Class F shares are paid by the Distributor. The out-of-pocket charges from DTI are paid by the fund. During the period ended December 31, 2006, Class F shares were charged $1,490 for out-of-pocket transfer agent charges.
The fees charged by DTI with respect to the fund’s Class A, B, C, R and T shares are paid by the fund.These transfer agency fees, including both the per account fees paid to DTI and out-of-pocket charges, during the period ended December 31, 2006 were $54,242.
The fund has agreed to compensate Founders for providing accounting services, administration, compliance monitoring, regulatory and shareholder reporting, as well as related facilities, equipment and clerical help.The fee is computed at the annual rate of .06% of the average daily net assets of the fund on the first $500 million, .04% of the average daily net assets of the fund on the next $500 million and .02% of the average daily net assets of the fund in excess of $1 billion, plus reasonable out-of-pocket expenses. Founders has contractually agreed in writing to waive any fees received for these services to the extent they
exceed Founders’ costs in providing the services. Effective January 1, 2007, Dreyfus replaced Founders as fund accounting and administrative services agent for the fund pursuant to an agreement containing substantially the same terms.
Mellon Bank serves as custodian for the fund. The fees for the custody services are subject to reduction by credits earned on the cash balances of the fund held by the custodian, which are shown as earnings credits on the Statement of Operations. The fund could have employed these assets elsewhere to produce income had it not entered into this arrangement.The custodian contractually agreed in writing to a fee waiver for the Company during the time period and in the amount set forth below:
| Time Period | | Amount of Waiver ($) |
| |
|
| 9/1/05 to 8/31/06 | | 200,000 |
This fee waiver was allocated among the Company’s series in proportion to their respective shares of the total custodian fee. During the period ended December 31, 2006, the fund’s portion of the waiver was $0.The amount paid to Mellon Bank was $17,173.
The components of Due to Founders Asset Management LLC and affiliates in the Statement of Assets and Liabilities consist of: investment advisory fees $248,437, Rule 12b-1 distribution plan fees $33,687, shareholder services plan fees $73,726 and transfer agency per account fees $32,021.
(d) Annual retainer fees and attendance fees for the Company’s Board of Directors are allocated to each series of the Company based on net assets.The Company’s Board of Directors has adopted a deferred compensation plan for Company directors that enables directors to elect to defer receipt of all or a portion of the annual compensation that they are entitled to receive from the Company. Under the plan, the compensation deferred is invested in shares of one or more of the Company’s series.The amount paid to the director under the plan will be determined based upon the performance of the selected series.The
The Fund 35
NOTES TO FINANCIAL STATEMENTS (continued)
|
current value of these amounts is included in Other Assets and Directors’ Deferred Compensation on the Statement of Assets and Liabilities. Changes in market value are included in the directors’ fees and expenses and the net change in unrealized appreciation/depreciation of investments on the Statement of Operations. Deferral of directors’ fees under the plan does not affect the net assets of the fund.
Certain officers of the Company are also officers and/or directors of Founders or its affiliates, which pay their compensation.The affairs of the fund, including services provided by Founders, are subject to the supervision and general oversight of the Company’s Board of Directors.
(e) Pursuant to an exemptive order from the SEC, the fund may invest its available cash balances in affiliated money market mutual funds. Management fees of the underlying money market mutual funds have been waived by Dreyfus.
NOTE 4—Securities Transactions:
|
The aggregate amount of purchases and sales of investment securities, excluding short-term securities, during the period ended December 31, 2006, amounted to $713,390,259 and $850,876,701, respectively.
At December 31, 2006, the cost of investments for federal income tax purposes was $266,737,839; accordingly, accumulated net unrealized appreciation on investments was $26,361,505, consisting of $29,851,445 gross unrealized appreciation and $3,489,940 gross unrealized depreciation.
REPORT OF INDEPENDENT REGISTERED PUBLIC ACCOUNTING FIRM
To the Board of Directors and Shareholders of Dreyfus Founders Funds, Inc.
In our opinion, the accompanying statement of assets and liabilities, including the statement of investments, and the related statements of operations and of changes in net assets and the financial highlights present fairly, in all material respects, the financial position of Dreyfus Founders Discovery Fund (one of the portfolios constituting Dreyfus Founders Funds, Inc., hereafter referred to as the “Fund”) at December 31,2006,the results of its operations for the year then ended,the changes in its net assets for each of the two years in the period then ended and the financial highlights for each of the five years in the period then ended, in conformity with accounting principles generally accepted in the United States of America. These financial statements and financial highlights (hereafter referred to as “financial statements”) are the responsibility of the Fund’s management; our responsibility is to express an opinion on these financial statements based on our audits.We conducted our audits of these financial statements in accordance with the standards of the Public Company Accounting Oversight Board (United States). Those standards require that we plan and perform the audit to obtain reasonable assurance about whether the financial statements are free of material misstatement.An audit includes examining, on a test basis, evidence supporting the amounts and disclosures in the financial statements, assessing the accounting principles used and significant estimates made by management, and evaluating the overall financial statement presentation.We believe that our audits, which included confirmation of securities at December 31, 2006 by correspondence with the custodian and brokers, provide a reasonable basis for our opinion.
| | PricewaterhouseCoopers LLP
New York, New York
February 23, 2007
|
The Fund 37
FACTORS CONSIDERED IN RENEWING THE ADVISORY AGREEMENT (Unaudited)
At a meeting of the board of directors of Dreyfus Founders Funds, Inc. (the “Funds” and, in reference to any one of the Funds’ portfolios, a “Fund”) held on August 9 and 10,2006,the Funds’directors unanimously approved the continuation of the Investment Advisory Agreement (“management agreement”) between each of the Funds and Founders Asset Management LLC,the Funds’investment adviser (“Founders”),for a one-year term ending August 31, 2007.The board of directors of the Funds (“board”) is comprised entirely of individuals who have no affiliation with Founders or any affiliates of Founders (the “directors”).
Prior to the directors’August 2006 meeting, Founders had provided the directors with extensive materials related to the renewal of the management agreement, including performance and expense information for other investment companies with similar investment objectives to each Fund derived from data compiled by Lipper Inc., an independent third party (“Lipper”).
During their meeting, the directors discussed the proposed continuance of the management agreement with the senior management personnel of Founders. At the conclusion of these discussions, the directors and their independent counsel met in a private session at which no representatives of Founders were present, to continue their discussion of continuance of the agreement. In determining to continue the management agreement, the directors considered all factors which they believed to be relevant, including the following:
Nature, Extent and Quality of Services Provided and to be Provided by Founders
The directors recognized that they have had the opportunity to evaluate the investment and non-investment related services which Founders provides to the Funds primarily through their quarterly review of all of the operations of the Funds during Fund committee and Fund board meetings held throughout the past twelve months.At each such meeting, extensive discussions of Fund operations are held with senior management personnel of Founders and a large volume of documentation
with respect to these operations is provided to and reviewed by the directors. Such discussions and documentation afford the directors the continual opportunity to evaluate the nature, extent, and quality of the services provided by Founders and its affiliates to the Funds.
The directors were satisfied that Founders is managing the investment of the assets of the Funds in accordance with each Fund’s respective investment objective, policies and restrictions, subject to the directors’ overall supervision.
The directors considered that Founders also provides many non-investment related services to the Funds in fulfilling its responsibilities under the management agreement.
Following their discussion and review, the directors reached the following conclusions:
- That the breadth and quality of investment advisory and other ser- vices being provided to the Funds are satisfactory, as evidenced in part by the performance records of the Funds, to which the direc- tors gave significant attention as indicated below; and
- That the directors are satisfied not only with the research, long-term portfolio management, and trading services being provided to the Funds, but also recognize that Founders or its affiliates have pro- vided the highest quality accounting, compliance and regulatory, administrative, underwriting, custody, shareholder, transfer agent and cash management services to the Funds, while charging fair, reason- able and competitive fees.
On a quarterly basis, the directors hold in-person meetings with representatives of the portfolio management team for each Fund (usually a portfolio manager), during which each representative reviews, among other items, performance information, attribution analyses, and the portfolio manager’s investment outlook.The directors also receive written monthly and quarterly performance information for each Fund.
The Fund 39
FACTORS CONSIDERED IN RENEWING THE
ADVISORY AGREEMENT (Unaudited) (continued)
|
In conjunction with their consideration of renewal of the management agreement, the directors received a more detailed performance report about each Fund from Lipper.These reports compared each Fund’s performance to both a relatively small group of similar funds selected by Lipper (the “Lipper performance group”), as well as to all funds in the applicable Lipper category (the “Lipper performance universe”).
Discovery Fund’s performance for the one-year period ended December 31, 2005 placed it in the fifth (lowest) quintile of both its Lipper performance group and the Lipper small-cap growth fund performance universe. For the six-month period ended June 30, 2006, Discovery Fund’s performance placed it in the fourth quintile of its Lipper performance group and in the fifth quintile of its Lipper performance universe.The Fund’s performance within its Lipper-selected group and universe had been in the third quintiles in 2004.The directors recognized that in its efforts to improve the performance results of Discovery Fund, effective August 1, 2006, Founders had changed the portfolio managers of the Fund. The directors were hopeful that the steps Founders has taken in an effort to improve the Fund’s performance would be sufficient. The directors intend to continue to monitor the Fund’s performance results closely.
After consideration of all relevant information and data, the directors concluded that although past performance cannot be a guaranty of future performance, each Fund and its shareholders would continue to benefit from Founders’ investment management of the Fund. The directors further determined:
- That although certain of the Funds have experienced performance difficulties, Founders has focused its efforts upon improving the per- formance records of the Funds and will continue to seek improve- ment; and
- That the materials provided by Lipper demonstrated that most of the Funds maintained satisfactory performance quintile rankings in their respective comparison groups and comparison universes, with six of the eight Funds placing in the top two quintiles of their
respective Lipper performance universes for the three-years ended December 31, 2005, and five of the eight Funds placing in the top two quintiles for the six months ended June 30, 2006.
Costs of the Services to be Provided and Profits to be Realized by Founders and Its Affiliates from Founders’ Relationship With the Funds
The directors recognized that on a quarterly basis, they receive information with respect to each Fund’s expenses. The directors carefully review and discuss the expense ratios for all classes of shares of each Fund at each of their quarterly meetings throughout the year.
In conjunction with their annual consideration of renewal of the Funds’ management agreement and other service arrangements, the directors received information from Lipper which included graphs for each Fund that provided outlines of contractual management fees at common asset levels, actual management fees, actual non-management expenses and actual total Fund expenses, each graph comparing the relevant information of each Fund with each Fund’s Lipper performance group.
The directors noted that for the period ended December 31, 2005, Discovery Fund’s management fees ranked in the third quintile of its Lipper performance group, with the Fund’s fees the ninth lowest of 17 “peer funds.” The Fund’s contractual management fees at a common asset level were determined by Lipper to be lower than eight of the 17 funds in its group.The Fund’s management fees were in the third quin-tile of its Lipper expense universe.
The directors also considered a brochure provided by Lipper which included information with respect to the profitability of the mutual fund advisory activities conducted by a number of publicly-held corporations. Lipper also prepared an analysis providing detailed information with respect to the types of services rendered to various mutual fund complexes under their respective investment advisory contracts.
The Fund 41
FACTORS CONSIDERED IN RENEWING THE
ADVISORY AGREEMENT (Unaudited) (continued)
|
The directors had been provided with extensive materials with respect to the profitability derived by Founders from providing investment advisory and other services to the Funds as a group and to each Fund individually.
The directors further considered certain indirect benefits received by Founders and its affiliates from providing investment advisory services to the Funds.These included the following:
- Since Founders manages several non-Fund accounts in a style that is similar to that used for certain of the Funds, Founders and its affil- iates realize certain efficiencies in performing the portfolio manage- ment, trading and operational functions related to those accounts;
- The Funds’ brokerage transactions may be executed with brokers that provide research and brokerage services to Founders and its affiliates. These research and brokerage services may be useful to Founders and its affiliates in providing investment services to any of the clients they advise, not just the Funds; and
- Founders receives fees for providing accounting services to the Funds, and affiliates of Founders receive various fees for providing underwriting, shareholder, transfer agency, custody and cash man- agement services to the Funds.
The directors also reviewed a table listing the Funds and corresponding subadvisory accounts managed by Founders, and their respective fee schedules. In their review of this table, the directors noted that Founders provides many services to the Funds in fulfilling its responsibilities under the management agreement that it does not provide to entities for which Founders has assumed subadvisory duties. The directors concluded that the fees paid to Founders under the management agreement are reasonable in relation to the nature and extent of the services provided by Founders to the Funds under the agreement.
After deliberation and discussion of Fund fees and expenses, the directors determined:
- That upon review of the advisory fee structures of the Funds in comparison with the competitive performance groups selected by
- Lipper, the levels of investment advisory fees paid by the Funds were deemed to be acceptable;
- That the expense ratios of the Funds are acceptable and that Founders continually reviews each Fund’s total expense ratio and has initiated voluntarily expense caps and fee waivers for certain Funds to reduce their expense ratios;
- That the majority of the Funds’ expense ratios increased in 2005 from those experienced in 2004, primarily as a result of declines in Fund assets; and
- That the comparative fee and expense information included in the materials provided by Lipper supports the determination that the advisory and other fees payable by the Funds to Founders and its affiliates are essentially fees which would be similar to those which would have resulted solely from “arm’s-length” bargaining.
With respect to profitability to Founders, the directors reviewed the adviser profitability analysis provided by Lipper, which demonstrated that Founders’ 2005 profitability from providing management services to the Funds was reasonable in comparison to the entities included in the Lipper analysis.
The directors were also advised by independent counsel of the profitability percentage ranges determined by court cases to be acceptable and determined that Founders’ profitability percentage for providing management and other services to the Funds was reasonable.
The directors concluded that Founders’ profits from providing management services to the Funds were reasonable in relationship to the overall services which Founders provides.
Economies of Scale
The directors reviewed information provided by Founders which summarized the extent, if any, that both Founders and the Funds would achieve certain economies of scale if the assets of the Funds were to increase.
The Fund 43
FACTORS CONSIDERED IN RENEWING THE
ADVISORY AGREEMENT (Unaudited) (continued)
|
After review and discussion, the directors considered the extent to which economies of scale and common management are shared with each Fund, including the economies that would be realized from the growth of each Fund’s assets. After such consideration, the directors determined that all of the Funds have structured breakpoints in their advisory fees, which result in fee reductions as the assets of each Fund reach defined levels, and that such fee reductions, when implemented, would benefit all of the applicable Fund’s shareholders through decreases in the Fund’s expense ratio.
Dedication to Regulatory Requirements and Restrictions
An important factor in the directors’ consideration of renewal of the Funds’ management agreement with Founders included the directors’ recognition of the dedication by Founders of stringent adherence to regulatory requirements and restrictions.The directors determined that Founders is dedicated to compliance with all applicable rules and regulations and that the systems of controls which are in place to ensure that the service providers to the Funds, including Founders, and the Funds themselves, maintain strict adherence to the law are excellent.
The directors determined that they are generally satisfied with the performance of the Funds and with the quality of the advisory and other services being provided by Founders and its affiliates to the Funds. The directors recognized that overall Fund performance has improved in recent years and that efforts are being and will continue to be made to enhance such improvements and to maintain Fund expense ratios at reasonable and acceptable levels.
The directors concluded that continuation of the current management agreement between each Fund and Founders, which would enable each Fund to continue to receive investment advisory services from Founders, is in the best interests of each Fund and its shareholders, the services to be performed under the management agreement are services required for the operations of the Funds, Founders has provided satisfactory investment management services to the Funds in the past, and the fees for the management services which Founders will perform will be within the range of what would have been negotiated at arm’s length in light of the circumstances.
The Fund 45
YOUR BOARD REPRESENTATIVES (Unaudited)
The Board of Directors of the Company oversees all 8 Dreyfus Founders Funds.The business and affairs of the Company are managed under the direction of the Board. The directors serving on the Board perform their responsibilities in the manner which they reasonably believe to be in the best interests of the Funds and their shareholders.
All of the directors,as listed below,are independent directors.They are not affiliated with the Fund ‘s adviser, its parent company, or its affiliates.The directors have no official term of office and generally serve until they retire (normally at age 75, but subject to extension to age 80), resign, or are not re-elected.As you can see from their backgrounds, the directors have broad experience as active or former business and community leaders.
Eugene H.Vaughan, CFA, 73.Year elected to the Board: 1970
Board Chairman. Founding Chairman,Vaughan Nelson Investment Management, LP, an investment counseling firm. Director, Encore Bank, Houston. Founding Chairman, Center for Houston’s Future, a non-profit organization. Founding Chairman and former Governor, CFA Institute. Past Chairman and Trustee, Institute of Chartered Financial Analysts. Past Chairman and Director, Financial Analysts Federation. Chairman-elect, University of Texas Health Science Center.
Alan S. Danson, 67.Year elected to the Board: 1991
Private investor. Formerly, President and Director, D.H. Management, Inc., the general partner of a limited partnership with technology company holdings (1996 to 2003). Director, Gore Range Natural Science School and The Les Streeter Program, Inc., both of which are non-profit organizations.
Robert P. Mastrovita, 62.Year elected to the Board: 1998
Private investor. Chairman of a private charitable foundation (1997 to present). Formerly, Chairman and Director, Hagler, Mastrovita & Hewitt, Inc., a registered investment adviser (1982 to 1997). Member, Boston Society of Security Analysts. Trustee, Partridge Academy.
Trygve E. Myhren, 70.Year elected to the Board: 1996
President, Myhren Media, Inc., a firm that invests in and advises media, telecommunications, Internet and software companies. Special Limited Partner and member of Investment Committee, Megunticook Funds, a venture capital firm (1998 to present). Director,Advanced Marketing Services, Inc.Trustee and Chairman of Finance Committee, the University of Denver.Trustee, Denver Art Museum. Member, Cable
Television Hall of Fame. Formerly, President (1990 to 1996) and Director (1992 to 2001) of the Providence Journal Company, a diversified media and communications company. Formerly, Chairman and Chief Executive Officer of American Television and Communications Corporation (now Timer Warner Cable) (1981 to 1988). Formerly, Chairman of the National Cable Television Association (1986-1987).
George W. Phillips, 68.Year elected to the Board: 1998
Retired.Vice Chairman of the Board, Chairman of the Finance Committee, and Chairman of the Investment Committee, Children’s Medical Center of Boston. Formerly, President and Chief Executive Officer (1992 to 1997) and Director (1992 to 2002) of Warren Bancorp, Inc. Formerly, President, Chief Executive Officer and Director of Warren Five Cents Savings Bank (1992 to 1997).
Martha A. Solis-Turner, 46.Year elected to the Board: 2005
Formerly, Telecommunications Director, Wholesale Markets (1995 to 2001), and Manager (1990 to 1995), Qwest Communications International Inc. Board member and Treasurer, Mile High Montessori Early Learning Centers (2002 to present), and formerly, Board member (1995 to 2004) and Vice President (2002 to 2004), Curtis Park Community Center, both of which are non-profit organizations.
Thomas F. Eggers, 54. President and Principal Executive Officer of the Funds since 2006. Founders’ Chairman of the Board, President and Chief Executive Officer. President, Chief Executive Officer and a Director of Dreyfus. Chairman of the Board and Chief Executive Officer of Dreyfus Service Corporation (“DSC”) since 2005. Formerly, President of Scudder Investments (2002 to 2005). Previously employed by Dreyfus from 1996 to 2002, including as President from 2001 to 2002.
David L. Ray, 49.Vice President of the Funds since 2000, and from 1990 to 1998. Founders’ Senior Vice President, Chief Operating Officer and Treasurer. Vice President of DSC since 2003. Employed by Founders and its predecessor company since 1990. Formerly,Treasurer of the Funds (1990 to 1998).
Kenneth R. Christoffersen, 51. Secretary of the Funds since 2000, and from 1996 to 1998. Founders’ Senior Vice President-Legal, General Counsel and Secretary. Assistant Secretary of DSC since 2003. Employed by Founders and its predecessor company since 1996.
The Fund 47
YOUR BOARD REPRESENTATIVES (Unaudited) (continued)
Jennifer L. Carnes, 35. Treasurer, Principal Financial Officer and Principal Accounting Officer of the Funds since 2006. Manager of Fund Administration for Founders since 2006. Formerly, Founders’ Supervisor of Corporate Actions and Pricing (2002 to 2006), and Corporate Actions and Pricing Specialist (2000 to 2002).
Janelle E. Belcher, 48. Chief Compliance Officer of the Funds since 2004 and Assistant Secretary of the Funds since 2002. Founders’ Vice President - Compliance since 2002. Formerly, Founders’ Manager of Compliance (2000 to 2002) and Securities Compliance Examiner, Staff Accountant and Team Leader for the U.S. Securities and Exchange Commission (1990 to 2000).
Eric D. Naviloff, 38. Assistant Treasurer since 2006. Senior Accounting Manager -Taxable Fixed-Income Funds of Dreyfus, and an officer of 91 investment companies (comprised of 205 portfolios) managed by Dreyfus. Employed by Dreyfus since 1992.
Robert S. Robol, 42.Assistant Treasurer since 2006. Senior Accounting Manager -Money Market and Municipal Bond Funds of Dreyfus, and an officer of 91 investment companies (comprised of 205 portfolios) managed by Dreyfus. Employed by Dreyfus since 1988.
Robert Svagna, 39. Assistant Treasurer since 2006. Senior Accounting Manager -Equity Funds of Dreyfus, and an officer of 91 investment companies (comprised of 205 portfolios) managed by Dreyfus. Employed by Dreyfus since 1990.
William G. Germenis, 36.Anti-Money Laundering Compliance Officer (“AMLCO”) for the Class A, Class B, Class C, Class R, and Class T shares of the Funds since 2002 and for the Class F shares of the Funds since 2003.Vice President and AMLCO of MBSC, LLC since 2002.Vice President and AMLCO of DSC and AMLCO of investment companies managed by Dreyfus. Employed by DSC since 1998.
The directors and officers may be contacted at Founders’ address appearing on the back cover, except for Messrs. Eggers, Naviloff, Robol, Svagna and Germenis, who can be contacted at The Dreyfus Corporation, 200 Park Avenue, New York, New York 10166.Additional information about the Company’s directors is available in the Statement of Additional Information, which can be obtained free of charge by calling 1-800-525-2440 (Class F shareholders) or 1-800-554-4611 (all other shareholders).
For Class F shareholders
Telephone Call your financial representative or 1-800-525-2440
| Mail | | Dreyfus Founders Funds, Inc. |
| | | P.O. Box 55360, Boston, MA 02205-8252 |
| |
|
| |
| For Class A, B, C, R and T shareholders |
| Telephone Call your financial representative or 1-800-554-4611 |
| Mail | | Dreyfus Founders Funds, Inc. |
| | | 144 Glenn Curtiss Boulevard, Uniondale, NY 11556-0144 |
| | |
The fund files its complete schedule of portfolio holdings with the Securities and Exchange Commission (“SEC”) for the first and third quarters of each fiscal year on Form N-Q. The fund’s Forms N-Q are available on the SEC’s website at http://www.sec.gov and may be reviewed and copied at the SEC’s Public Reference Room in Washington, DC. Information on the operation of the Public Reference Room may be obtained by calling 1-800-SEC-0330.
A description of the policies and procedures that the fund uses to determine how to vote proxies relating to portfolio securities, and information regarding how the fund voted these proxies for the 12-month period ended June 30, 2006, is available at http://www.founders.com, http://www.dreyfus.com and on the SEC’s website at http://www.sec.gov. The description of the policies and procedures is also available without charge, upon request, by calling 1-800-645-6561.
This report and the statements it contains are submitted for the general information of our shareholders. The report is not authorized for distribution to prospective investors unless preceded or accompanied by an effective prospectus.
| Founders and Founders Funds are registered trademarks |
| of Founders Asset Management LLC. |
| |
| © 2007 Dreyfus Service Corporation |

Save time. Save paper. View your next shareholder report online as soon as it’s available. To take advantage of this service, simply inform us online of your decision to receive materials through our E-Communications Program. Cut down on mailbox clutter and help the Fund reduce printing and postage charges by enrolling today. It’s simple and only takes a few minutes.
Class F shareholders can log into www.founders.com/ ecommunications, or www.icsdelivery.com if you own funds through a third party.
Class A, B, C, R and T shareholders can log into www.dreyfus.com.
The views expressed in this report reflect those of the portfolio manager only through the end of the period covered and do not necessarily represent the views of Founders or any other person in the Founders organization.Any such views are subject to change at any time based upon market or other conditions and Founders disclaims any responsibility to update such views.These views may not be relied on as investment advice and, because investment decisions for a Dreyfus Founders Fund are based on numerous factors, may not be relied on as an indication of trading intent on behalf of any Dreyfus Founders Fund.
Not FDIC-Insured • Not Bank-Guaranteed • May Lose Value
| Contents |
| |
| | | THE FUND |
| |
|
| 2 | | A Letter from the President |
| 3 | | Discussion of Fund Performance |
| 6 | | Fund Performance |
| 8 | | Understanding Your Fund’s Expenses |
| 8 | | Comparing Your Fund’s Expenses |
| With Those of Other Funds |
| 9 | | Statement of Investments |
| 14 | | Statement of Assets and Liabilities |
| 15 | | Statement of Operations |
| 16 | | Statement of Changes in Net Assets |
| 19 | | Financial Highlights |
| 25 | | Notes to Financial Statements |
| 36 | | Report of Independent Registered |
| | | Public Accounting Firm |
| 37 | | Important Tax Information |
| 38 | | Factors Considered in Renewing |
| the Advisory Agreement |
| 46 | | Your Board Representatives |
| |
| FOR MORE INFORMATION |
|
| | | Back Cover |
| Dreyfus Founders |
| Equity Growth Fund |
The Fund

A LETTER FROM THE PRESIDENT
Dear Shareholder:
We are pleased to present this annual report for Dreyfus Founders Equity Growth Fund, covering the 12-month period from January 1, 2006, through December 31, 2006.
2006 proved to be a good year for the financial markets.Virtually all sectors and capitalization ranges of the U.S. equity markets generated strong returns, especially over the second half of the year.A number of positive factors contributed to the markets’ gains in 2006, including an expanding domestic economy, subdued inflation, stabilizing interest rates, rising productivity and robust corporate profits.
In our analysis, 2006 provided an excellent reminder of the need for a long-term investment perspective. Adopting too short a time frame proved costly for some investors last year, as chasing recent winners often meant buying the next month’s losers. Indeed, history shows that reacting to near-term developments with extreme shifts in strategy rarely is the right decision.We believe that a better course of action is to set a portfolio mix to meet future goals, while attempting to ignore short term market fluctuations in favor of a longer-term view.
For information about how the fund performed during the reporting period, as well as market perspectives, we have provided a Discussion of Fund Performance given by the fund’s portfolio manager.
Thank you for your continued confidence and support.We wish you good health and prosperity in 2007.


DISCUSSION OF FUND PERFORMANCE
John B. Jares, CFA, Portfolio Manager
How did Dreyfus Founders Equity Growth Fund perform relative to its benchmark?
For the 12-month period ended December 31, 2006, Dreyfus Founders Equity Growth Fund produced total returns of 13.02% for Class A Shares, 12.22% for Class B Shares, 12.24% for Class C Shares, 13.25% for Class F Shares, 13.55% for Class R Shares and 12.37% for Class T Shares.1 In comparison, the fund’s benchmark, the Russell 1000 Growth Index (the “Index”), rose 9.07% over the same period.2
High energy prices, concerns regarding consumer spending and interest-rate increases by the Federal Reserve Board (the “Fed”) constrained stock prices during the first half of 2006. However, stabilizing oil prices, an end to the Fed’s rate hikes and expectations of an economic “soft landing” helped support a sustained market rally in the second half.The fund’s returns were higher than its benchmark, primarily due to successful stock selection strategies in a majority of the market sectors in which the fund invested.
What is the fund’s investment approach?
To pursue the fund’s goal of long-term growth of capital and income, we invest primarily in the common stocks of large, well-established companies with records of profitability, dividend payments and a reputation for high-quality management, products and services. Using a “bottom-up” approach, we focus on individual stock selection instead of broad economic or industry trends. We look mainly for companies whose fundamental strengths suggest the potential to provide superior earnings growth over time. The fund may also invest in non-dividend-paying companies, and it may invest up to 30% of its total assets in foreign securities.
The Fund 3
DISCUSSION OF FUND PERFORMANCE (continued)
|
What other factors influenced the fund’s performance?
Resurgent energy prices, higher interest rates and a slowing housing market weighed on consumers and stock prices over the first half of the year, as did continued geopolitical unrest in the Middle East. However, the market rallied strongly over the second half of 2006, mainly due to improving investor sentiment as the Fed refrained from further rate hikes and the U.S. economy slowed gradually, helping to relieve inflation fears.
The success of the fund’s stock selection strategy in the information technology sector, which advanced only moderately in the Index, was the greatest driver of the fund’s relative performance in 2006. The fund’s top overall performers included several information technology companies, including hardware manufacturers Cisco Systems, Apple Computer and Hewlett-Packard, as well as software giant Microsoft. Cisco Systems reported robust earnings growth and remained well-positioned for the next generation of voice and data technology to hit the consumer market. Apple continued to benefit from the success of its iPod digital music players and other new products.
Strong stock selections within the consumer discretionary sector also boosted the fund’s relative performance as stocks of consumer-oriented companies such as apparel retailer Kohl’s, which was sold during the reporting period, and media companies Pixar and The Walt Disney Company rose significantly during the reporting period. Pixar’s stock price increased due to its acquisition by Disney. Disney benefited from new management and the favorable performances of recent movie releases, its television subsidiaries and theme parks.The energy and industrials sectors also contributed positively to the fund’s performance. Integrated energy producer Exxon Mobil led the fund’s energy investments higher. Airlines such as Continental Airlines bolstered the fund’s return in the industrials sector, as the industry began to recover amid numerous consolidations and newly implemented cost and infrastructure efficiencies.
On the other hand, the telecommunication services sector represented the fund’s most disappointing sector of 2006, as relatively poor stock picking led to underperformance compared to the benchmark.
Wireless telephone service provider Sprint, which was sold during the reporting period and the main driver of this sector’s weak performance, lost market share to its competitors in spite of its acquisition of Nextel, a stock the fund did not own.The health care sector also hampered the fund’s results. Medical device makers Boston Scientific and Medtronic, which were sold during the reporting period, struggled in a sluggish cardiac rhythm management market. Advanced Medical Optics’ new intraocular lens was less successful than expected, which caused the company’s stock to decline and eventually be sold. Finally the fund did not invest in any utilities stocks during the reporting period, which proved to be a drag on returns.
What is the fund’s current strategy?
We have continued to find attractive investment opportunities among individual companies, particularly in the information technology sector. We also have identified a number of opportunities in the health care sector, as a fair amount of underperformance among health care firms in 2006 has produced more attractive valuations. In addition, we have continued to find investment candidates in the biotechnology industry as business fundamentals improve and stock valuations have moderated. As always, we intend to continue to rely on our bottom-up research process to seek companies that, in our judgment, have the potential to post superior revenue and earnings growth.
| 1 | | Total return includes reinvestment of dividends and any capital gains paid, and does not take into |
| | | consideration the maximum initial sales charges in the case of Class A and Class T shares, or the |
| | | applicable contingent deferred sales charges imposed on redemptions in the case of Class B and |
| | | Class C shares. Had these charges been reflected, returns would have been lower. Past performance |
| | | is no guarantee of future results. Share price and investment return fluctuate such that upon |
| | | redemption, fund shares may be worth more or less than their original cost. Return figure provided |
| | | for the fund’s Class T shares reflects the absorption of certain portfolio expenses by an affiliate of |
| | | Founders pursuant to an agreement that will extend through at least August 31, 2007, and will |
| | | not be terminated without prior notice to the fund’s Board of Directors. Had these expenses not |
| | | been absorbed, the fund’s Class T share return would have been lower. |
| 2 | | SOURCE: LIPPER, INC. – Reflects reinvestment of net dividends and, where applicable, |
| | | capital gain distributions.The Russell 1000 Growth Index is a widely accepted, unmanaged |
| | | large-cap index that measures the performance of those Russell 1000 Index companies with |
| | | higher price-to-book ratios and higher forecasted growth values. |
The Fund 5
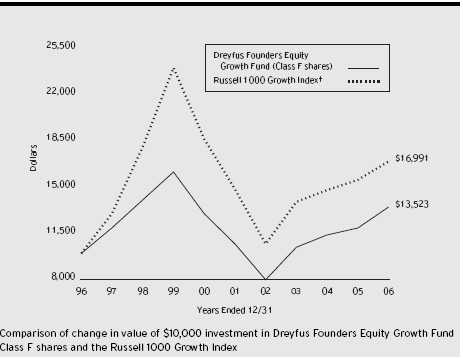
| † Source: Lipper Inc. |
| Past performance is not predictive of future performance. |
| The above graph compares a $10,000 investment made in Class F shares of Dreyfus Founders Equity Growth Fund |
| on 12/31/96 to a $10,000 investment made in the Russell 1000 Growth Index (the “Index”) on that date. All |
| dividends and capital gain distributions are reinvested. Performance for Class A, Class B, Class C, Class R and Class T |
| shares will vary from the performance of Class F shares shown above due to differences in charges and expenses. |
| The fund’s performance shown in the line graph takes into account all applicable Class F fees and expenses (after any |
| expense reimbursements).The Russell 1000 Growth Index is an unmanaged index which measures the performance of |
| those Russell 1000 companies with higher price-to-book ratios and higher forecasted growth values.The Index does not |
| take into account charges, fees and other expenses. Further information relating to fund performance, including expense |
| reimbursements, if applicable, is contained in the Financial Highlights section of the prospectus and elsewhere in this report. |
| Average Annual Total Returns as of 12/31/06 | | | | | | |
| |
| | | Inception | | | | | | | | From |
| | | Date | | 1 Year | | 5 Years | | 10 Years | | Inception |
| |
| |
| |
| |
| |
|
| Class A shares | | | | | | | | | | |
| with maximum sales charge (5.75%) | | 12/31/99 | | 6.51% | | 3.10% | | — | | (3.72)% |
| without sales charge | | 12/31/99 | | 13.02% | | 4.31% | | — | | (2.91)% |
| Class B shares | | | | | | | | | | |
| with applicable redemption charge † | | 12/31/99 | | 8.22% | | 3.28% | | — | | (3.40)% |
| without redemption | | 12/31/99 | | 12.22% | | 3.63% | | — | | (3.40)% |
| Class C shares | | | | | | | | | | |
| with applicable redemption charge †† | | 12/31/99 | | 11.24% | | 3.62% | | — | | (3.72)% |
| without redemption | | 12/31/99 | | 12.24% | | 3.62% | | — | | (3.72)% |
| Class F shares | | 7/5/38 | | 13.25% | | 4.73% | | 3.06% | | N/A |
| Class R shares | | 12/31/99 | | 13.55% | | 4.32% | | — | | (2.64)% |
| Class T shares | | | | | | | | | | |
| with applicable sales charge (4.5%) | | 12/31/99 | | 7.28% | | 2.53% | | — | | (4.28)% |
| without sales charge | | 12/31/99 | | 12.37% | | 3.49% | | — | | (3.65)% |
Past performance is not predictive of future performance.The fund’s performance shown in the graph and table does not reflect the deduction of taxes that a shareholder would pay on fund distributions or the redemption of fund shares but does reflect fee waivers for certain share classes. Performance for Class B shares assumes the conversion of Class B shares to Class A shares at the end of the sixth year following the date of purchase.
| † | | The maximum contingent deferred sales charge for Class B shares is 4%. After six years Class B shares convert to |
| | | Class A shares. |
| †† | | The maximum contingent deferred sales charge for Class C shares is 1% for shares redeemed within one year of the |
| | | date of purchase. |
The Fund 7
UNDERSTANDING YOUR FUND’S EXPENSES (Unaudited)
As a mutual fund investor, you pay ongoing expenses, such as management fees and other expenses. Using the information below, you can estimate how these expenses affect your investment and compare them with the expenses of other funds.You also may pay one-time transaction expenses, including sales charges (loads) and redemption fees, which are not shown in this section and would have resulted in higher total expenses. For more information, see your fund's prospectus or talk to your financial advisor.
Review your fund’s expenses
|
The table below shows the expenses you would have paid on a $1,000 investment in Dreyfus Founders Equity Growth Fund from July 1, 2006 to December 31, 2006. It also shows how much a $1,000 investment would be worth at the close of the period, assuming actual returns and expenses.To estimate the expenses you paid on your account over this period, simply divide your account value by $1,000 (for example, an $8,600 account value divided by $1,000 = 8.60), then multiply the results by the number in the Expenses paid per $1,000 line for the class of shares you own.
| Expenses and Value of a $1,000 Investment | | | | | | |
| assuming actual returns for the six months ended December 31, 2006 | | | | |
| | | Class A | | Class B | | Class C | | Class F | | Class R | | Class T |
| |
| |
| |
| |
| |
| |
|
| Expenses paid | | | | | | | | | | | | |
| per $1,000 † | | $ 7.55 | | $ 11.88 | | $ 11.06 | | $ 5.89 | | $ 5.84 | | $ 11.12 |
| Ending value | | | | | | | | | | | | |
| (after expenses) | | $1,125.70 | | $1,122.20 | | $1,120.10 | | $1,126.00 | | $1,126.70 | | $1,121.40 |
| COMPARING YOUR FUND’S EXPENSES |
| WITH THOSE OF OTHER FUNDS (Unaudited) |
Using the SEC’s method to compare expenses
The Securities and Exchange Commission (SEC) has established guidelines to help investors assess fund expenses. Per these guidelines, the table below shows your fund's expenses based on a $1,000 investment, assuming a hypothetical 5% annualized return. You can use this information to compare the ongoing expenses (but not transaction expenses or total cost) of investing in the fund with those of other funds.All mutual fund shareholder reports will provide this information to help you make this comparison. Please note that you cannot use this information to estimate your actual ending account balance and expenses paid during the period.
| Expenses and Value of a $1,000 Investment |
| assuming a hypothetical 5% annualized return for the six months ended December 31, 2006 |
| | | Class A | | Class B | | Class C | | Class F | | Class R | | Class T |
| |
| |
| |
| |
| |
| |
|
| Expenses paid | | | | | | | | | | | | |
| per $1,000 † | | $ 7.17 | | $ 11.27 | | $ 10.51 | | $ 5.60 | | $ 5.55 | | $ 10.56 |
| Ending value | | | | | | | | | | | | |
| (after expenses) | | $1,018.10 | | $1,014.01 | | $1,014.77 | | $1,019.66 | | $1,019.71 | | $1,014.72 |
| † Expenses are equal to the fund’s annualized expense ratio of 1.41% for Class A shares, 2.22% for Class B shares, |
| 2.07% for Class C shares, 1.10% for Class F shares, 1.09% for Class R shares and 2.08% for Class T shares; |
| multiplied by the average account value over the period, multiplied by 184/365 (to reflect the one-half year period). |
STATEMENT OF INVESTMENTS
December 31, 2006
|
| Common Stocks—96.5% | | Shares | | Value ($) |
| |
| |
|
| Aerospace & Defense—.6% | | | | |
| Empresa Brasileira de Aeronautica, ADR | | 32,525 | | 1,347,511 |
| Airlines—1.8% | | | | |
| AMR | | 47,175 a | | 1,426,100 |
| Continental Airlines, Cl. B | | 43,125 a | | 1,778,906 |
| US Airways Group | | 18,325 a | | 986,801 |
| | | | | 4,191,807 |
| Apparel Retail—1.1% | | | | |
| Gap | | 57,676 | | 1,124,682 |
| Limited Brands | | 45,261 | | 1,309,853 |
| | | | | 2,434,535 |
| Application Software—1.6% | | | | |
| Autodesk | | 52,543 a | | 2,125,890 |
| Cognos | | 36,507 a | | 1,550,087 |
| | | | | 3,675,977 |
| Asset Management & Custody Banks—.7% | | |
| State Street | | 22,475 | | 1,515,714 |
| Biotechnology—2.6% | | | | |
| Amgen | | 37,827 a | | 2,583,962 |
| Genzyme | | 17,250 a | | 1,062,255 |
| MedImmune | | 74,012 a | | 2,395,768 |
| | | | | 6,041,985 |
| Broadcasting & Cable Tv—1.2% | | | | |
| Comcast, Cl. A (Special) | | 64,575 a | | 2,704,401 |
| Building Products—.8% | | | | |
| Masco | | 57,787 | | 1,726,098 |
| Coal—.4% | | | | |
| Peabody Energy | | 22,841 | | 923,005 |
| Communications Equipment—5.5% | | | | |
| Cisco Systems | | 259,984 a | | 7,105,363 |
| Corning | | 102,887 a | | 1,925,016 |
| Motorola | | 65,797 | | 1,352,786 |
| Nokia, ADR | | 114,452 | | 2,325,665 |
| | | | | 12,708,830 |
| Computer & Electronics Retail—1.0% | | | | |
| Best Buy | | 47,072 | | 2,315,472 |
The Fund 9
STATEMENT OF INVESTMENTS (continued)
|
| Common Stocks (continued) | | Shares | | Value ($) |
| |
| |
|
| Computer Hardware—5.9% | | | | |
| Apple Computer | | 52,583 a | | 4,461,142 |
| Diebold | | 65,944 | | 3,072,990 |
| Hewlett-Packard | | 121,050 | | 4,986,050 |
| Sun Microsystems | | 214,234 a | | 1,161,148 |
| | | | | 13,681,330 |
| Computer Storage & Peripherals—2.1% | | | | |
| EMC/Massachusetts | | 121,360 a | | 1,601,952 |
| SanDisk | | 25,408 a | | 1,093,306 |
| Seagate Technology | | 81,709 | | 2,165,289 |
| | | | | 4,860,547 |
| Consumer Electronics—.4% | | | | |
| Harman International Industries | | 8,741 | | 873,313 |
| Data Processing & Outsourced Services—1.1% | | | | |
| Automatic Data Processing | | 38,050 | | 1,873,963 |
| Western Union | | 26,369 | | 591,193 |
| | | | | 2,465,156 |
| Department Stores—1.4% | | | | |
| Federated Department Stores | | 82,925 | | 3,161,930 |
| Diversified Chemicals—.8% | | | | |
| E.I. du Pont de Nemours & Co. | | 37,975 | | 1,849,762 |
| Diversified Financials—2.2% | | | | |
| Citigroup | | 28,284 | | 1,575,419 |
| JPMorgan Chase & Co. | | 70,775 | | 3,418,433 |
| | | | | 4,993,852 |
| Environmental & Facilities Services—.8% | | | | |
| Waste Management | | 51,661 | | 1,899,575 |
| Exchange Traded Funds—4.6% | | | | |
| iShares Russell 1000 Growth Index Fund | | 63,147 | | 3,474,979 |
| NASDAQ-100 Trust Series 1 | | 81,525 | | 3,518,619 |
| Standard & Poor’s Depository Receipts (Tr. Ser. 1) | | 24,691 | | 3,498,468 |
| | | | | 10,492,066 |
| Food Distributors—.6% | | | | |
| SYSCO | | 37,797 | | 1,389,418 |
| Food Retail—.7% | | | | |
| Safeway | | 48,435 | | 1,673,914 |
| Health Care Equipment—1.6% | | | | |
| Zimmer Holdings | | 45,821 a | | 3,591,450 |
| |
| 10 | | | | |
| Common Stocks (continued) | | Shares | | Value ($) |
| |
| |
|
| Home Entertainment Software—1.6% | | | | |
| Electronic Arts | | 74,812 a | | 3,767,532 |
| Home Furnishing Retail—.3% | | | | |
| Williams-Sonoma | | 22,271 | | 700,200 |
| Hotels, Resorts & Cruise Lines—.4% | | | | |
| Marriott International, Cl. A | | 19,942 | | 951,632 |
| Household Products—3.8% | | | | |
| Colgate-Palmolive | | 67,675 | | 4,415,117 |
| Procter & Gamble | | 68,121 | | 4,378,137 |
| | | | | 8,793,254 |
| Hypermarkets & Super Centers—2.1% | | | | |
| Wal-Mart Stores | | 103,296 | | 4,770,209 |
| Industrial Conglomerates—3.2% | | | | |
| General Electric | | 197,702 | | 7,356,491 |
| Integrated Oil & Gas—3.4% | | | | |
| Chevron | | 25,156 | | 1,849,721 |
| Exxon Mobil | | 77,275 | | 5,921,583 |
| | | | | 7,771,304 |
| Internet Software & Services—2.8% | | | | |
| Google, Cl. A | | 10,647 a | | 4,902,731 |
| Yahoo! | | 63,198 a | | 1,614,077 |
| | | | | 6,516,808 |
| Investment Banking & Brokerage—4.4% | | |
| Charles Schwab | | 225,675 | | 4,364,555 |
| Goldman Sachs Group | | 16,073 | | 3,204,153 |
| Morgan Stanley | | 31,356 | | 2,553,319 |
| | | | | 10,122,027 |
| IT Consulting & Other Services—.9% | | | | |
| Accenture, Cl. A | | 55,856 | | 2,062,762 |
| Life Sciences Tools & Services—1.0% | | | | |
| Thermo Fisher Scientific | | 51,565 a | | 2,335,379 |
| Movies & Entertainment—1.1% | | | | |
| Walt Disney | | 71,232 | | 2,441,121 |
| Multi-Line Insurance—.8% | | | | |
| American International Group | | 24,909 | | 1,784,979 |
| Oil & Gas Equipment & | | | | |
| Services—1.2% | | | | |
| Schlumberger | | 43,692 | | 2,759,587 |
The Fund 11
STATEMENT OF INVESTMENTS (continued)
|
| Common Stocks (continued) | | Shares | | Value ($) |
| |
| |
|
| Packaged Foods & Meats—1.8% | | | | |
| Cadbury Schweppes, ADR | | 27,522 | | 1,181,519 |
| Dean Foods | | 40,250 a | | 1,701,770 |
| Unilever (NY Shares) | | 44,164 | | 1,203,469 |
| | | | | 4,086,758 |
| Personal Products—1.6% | | | | |
| Avon Products | | 113,948 | | 3,764,842 |
| Pharmaceutical—8.2% | | | | |
| Allergan | | 29,241 | | 3,501,317 |
| Bristol-Myers Squibb | | 44,003 | | 1,158,159 |
| Covance | | 19,476 a | | 1,147,331 |
| Eli Lilly & Co. | | 21,398 | | 1,114,836 |
| Johnson & Johnson | | 67,686 | | 4,468,630 |
| Pfizer | | 66,548 | | 1,723,593 |
| Schering-Plough | | 134,163 | | 3,171,613 |
| Wyeth | | 49,446 | | 2,517,790 |
| | | | | 18,803,269 |
| Property & Casualty Insurance—1.3% | | | | |
| Allstate | | 46,675 | | 3,039,009 |
| Semiconductor Equipment—1.8% | | | | |
| ASML Holding (NY Shares) | | 120,954 a | | 2,979,097 |
| KLA-Tencor | | 24,324 | | 1,210,119 |
| | | | | 4,189,216 |
| Semiconductors—2.4% | | | | |
| Broadcom, Cl. A | | 35,190 a | | 1,136,989 |
| Linear Technology | | 50,020 | | 1,516,606 |
| Marvell Technology Group | | 48,151 a | | 924,018 |
| Texas Instruments | | 68,021 | | 1,959,005 |
| | | | | 5,536,618 |
| Soft Drinks—1.4% | | | | |
| PepsiCo | | 51,475 | | 3,219,761 |
| Specialized Finance—1.0% | | | | |
| Chicago Mercantile Exchange Holdings, Cl. A | | 2,832 | | 1,443,612 |
| Nasdaq Stock Market | | 31,066 a | | 956,522 |
| | | | | 2,400,134 |
| Common Stocks (continued) | | Shares | | Value ($) |
| |
| |
|
| Specialty Stores—1.5% | | | | |
| AutoZone | | 8,104 a | | 936,498 |
| Tiffany & Co. | | 62,372 | | 2,447,477 |
| | | | | 3,383,975 |
| Systems Software—7.4% | | | | |
| Adobe Systems | | 117,391 a | | 4,827,118 |
| Microsoft | | 327,520 | | 9,779,747 |
| Oracle | | 141,898 a | | 2,432,132 |
| | | | | 17,038,997 |
| Tobacco—1.6% | | | | |
| Altria Group | | 41,912 | | 3,596,888 |
| Total Common Stocks | | | | |
| (cost $193,944,324) | | | | 221,710,400 |
| |
| |
|
| |
| Other Investment—3.2% | | | | |
| |
| |
|
| Registered Investment Company; | | | | |
| Dreyfus Institutional Preferred | | | | |
| Plus Money Market Fund | | | | |
| (cost $7,362,000) | | 7,362,000 b | | 7,362,000 |
| |
| |
|
| |
| Total Investments (cost $201,306,324) | | 99.7% | | 229,072,400 |
| Cash and Receivables (Net) | | .3% | | 742,299 |
| Net Assets | | 100.0% | | 229,814,699 |
| ADR—American Depository Receipts |
| a | | Non-income producing security. |
| b | | Investment in affiliated money market mutual fund. |
| Portfolio Summary | | (Unaudited) † | | | | |
| |
| | | Value (%) | | | | Value (%) |
| |
| |
| |
|
| Information Technology | | 33.3 | | Energy | | 5.0 |
| Consumer Staples | | 13.6 | | Materials | | .8 |
| Healthcare | | 13.4 | | Other | | 4.6 |
| Financials | | 10.4 | | Cash & Equivalents | | 3.4 |
| Consumer Discretionary | | 8.3 | | | | |
| Industrials | | 7.2 | | | | 100.0 |
| † Based on net assets. |
| See notes to financial statements. |
The Fund 13
STATEMENT OF ASSETS AND LIABILITIES
December 31, 2006
| | | Cost | | Value |
| |
| |
|
| Assets ($): | | | | |
| Investments in securities—See Statement of Investments: | | |
| Unaffiliated issuers | | 193,944,324 | | 221,710,400 |
| Affiliated issuers | | 7,362,000 | | 7,362,000 |
| Cash | | | | 210,660 |
| Receivable for investment securities sold | | 2,594,750 |
| Dividends and interest receivable | | 295,073 |
| Receivable for shares of Common Stock subscribed | | 193,841 |
| Prepaid expenses | | | | 34,526 |
| | | | | 232,401,250 |
| |
| |
|
| Liabilities ($): | | | | |
| Due to Founders Asset Management LLC and affiliates—Note 3(c) | | 234,349 |
| Payable for investment securities purchased | | 2,178,936 |
| Payable for shares of Common Stock redeemed | | 22,723 |
| Accrued expenses | | | | 150,543 |
| | | | | 2,586,551 |
| |
| |
|
| Net Assets ($) | | | | 229,814,699 |
| |
| |
|
| Composition of Net Assets ($): | | |
| Paid-in capital | | | | 270,638,655 |
| Accumulated undistributed investment income—net | | 325,865 |
| Accumulated net realized gain (loss) on investments | | (68,916,176) |
| Accumulated net unrealized appreciation | | |
| (depreciation) on investments | | 27,766,355 |
| |
|
| Net Assets ($) | | | | 229,814,699 |
| Net Asset Value Per Share | | | | | | | | | | |
| | | Class A | | Class B | | Class C | | Class F | | Class R | | Class T |
| |
| |
| |
| |
| |
| |
|
| Net Assets ($) | | 4,399,026 | | 1,045,553 | | 3,758,718 | | 220,502,271 | | 96,939 | | 12,192 |
| Shares Outstanding | | 769,294 | | 189,910 | | 694,429 | | 37,602,611 | | 16,649 | | 2,239 |
| |
| |
| |
| |
| |
| |
|
| Net Asset Value | | | | | | | | | | | | |
| Per Share ($) | | 5.72 | | 5.51 | | 5.41 | | 5.86 | | 5.82 | | 5.45 |
| |
| See notes to financial statements. | | | | | | | | | | |
STATEMENT OF OPERATIONS
Year Ended December 31, 2006
|
| Investment Income ($): | | |
| Income: | | |
| Dividends (net of $13,706 foreign taxes withheld at source): | | |
| Unaffiliated issuers | | 2,416,650 |
| Affiliated issuers | | 151,266 |
| Interest | | 279,207 |
| Total Income | | 2,847,123 |
| Expenses: | | |
| Investment advisory fee—Note 3(a) | | 1,422,728 |
| Distribution fees—Note 3(b) | | 174,239 |
| Shareholder servicing costs—Note 3(c) | | 371,396 |
| Accounting fees—Note 3(c) | | 131,407 |
| Professional fees | | 97,191 |
| Prospectus and shareholders’ reports | | 69,284 |
| Registration fees | | 67,252 |
| Directors’ fees and expenses—Note 3(d) | | 59,476 |
| Loan commitment fees—Note 2 | | 8,783 |
| Custodian fees—Note 3(c) | | 6,817 |
| Miscellaneous | | 40,888 |
| Total Expenses | | 2,449,461 |
| Less—reduction in custody fees due to waiver—Note 3(c) | | (287) |
| Less—reduction in custody fees due to | | |
| earnings credits—Note 1(c) | | (8,387) |
| Less—reimbursed/waived expenses—Note 3(c) | | (80) |
| Net Expenses | | 2,440,707 |
| Investment Income—Net | | 406,416 |
| |
|
| Realized and Unrealized Gain (Loss) on Investments—Note 4 ($): |
| Net realized gain (loss) on investments | | 13,557,877 |
| Net change in unrealized appreciation | | |
| (depreciation) on investments | | 13,579,976 |
| Net Realized and Unrealized Gain (Loss) on Investments | | 27,137,853 |
| Net Increase in Net Assets Resulting from Operations | | 27,544,269 |
See notes to financial statements.
|
The Fund 15
STATEMENT OF CHANGES IN NET ASSETS
| | | Year Ended December 31, |
| |
|
| | | 2006 | | 2005 |
| |
| |
|
| Operations ($): | | | | |
| Investment income—net | | 406,416 | | 205,080 |
| Net realized gain on investments | | 13,557,877 | | 22,014,185 |
| Net change in unrealized appreciation | | | | |
| (depreciation) on investments | | 13,579,976 | | (12,580,203) |
| Net Increase (Decrease) in Net Assets | | |
| Resulting from Operations | | 27,544,269 | | 9,639,062 |
| |
| |
|
| Dividends to Shareholders from ($): | | | | |
| Investment income—net: | | | | |
| Class A shares | | (7,353) | | (1,749) |
| Class C shares | | — | | (4,846) |
| Class F shares | | (233,077) | | (428,422) |
| Class R shares | | (83) | | (786) |
| Total Dividends | | (240,513) | | (435,803) |
| |
| |
|
| Capital Stock Transactions ($): | | | | |
| Net proceeds from shares sold: | | | | |
| Class A shares | | 3,804,434 | | 645,347 |
| Class B shares | | 300,494 | | 63,612 |
| Class C shares | | 1,664,484 | | 1,510,039 |
| Class F shares | | 3,481,474 | | 2,884,040 |
| Class R shares | | 4,416 | | 23,193 |
| Class T shares | | 13,106 | | 7,232 |
| | | Year Ended December 31, |
| |
|
| | | 2006 | | 2005 |
| |
| |
|
| Capital Stock Transactions ($) (continued): | | |
| Dividends reinvested: | | | | |
| Class A shares | | 6,396 | | 1,321 |
| Class C shares | | — | | 1,336 |
| Class F shares | | 203,321 | | 373,127 |
| Class R shares | | 80 | | 778 |
| Cost of shares redeemed: | | | | |
| Class A shares | | (944,270) | | (618,053) |
| Class B shares | | (829,672) | | (765,761) |
| Class C shares | | (207,635) | | (168,857) |
| Class F shares | | (25,345,638) | | (30,102,729) |
| Class R shares | | (195,260) | | (12,075) |
| Class T shares | | (9,431) | | (30,338) |
| Increase (Decrease) in Net Assets | | | | |
| from Capital Stock Transactions | | (18,053,701) | | (26,187,788) |
| Total Increase (Decrease) in Net Assets | | 9,250,055 | | (16,984,529) |
| |
| |
|
| Net Assets ($): | | | | |
| Beginning of Period | | 220,564,644 | | 237,549,173 |
| End of Period | | 229,814,699 | | 220,564,644 |
| Undistributed investment income—net | | 325,865 | | 159,962 |
The Fund 17
STATEMENT OF CHANGES IN NET ASSETS (continued)
|
| | | Year Ended December 31, |
| |
|
| | | 2006 | | 2005 |
| |
| |
|
| Capital Share Transactions: | | | | |
| Class A a | | | | |
| Shares sold | | 692,697 | | 133,918 |
| Shares issued for dividends reinvested | | 1,112 | | 258 |
| Shares redeemed | | (174,383) | | (127,183) |
| Net Increase (Decrease) in Shares Outstanding | | 519,426 | | 6,993 |
| |
| |
|
| Class B a | | | | |
| Shares sold | | 58,611 | | 13,761 |
| Shares redeemed | | (164,527) | | (162,888) |
| Net Increase (Decrease) in Shares Outstanding | | (105,916) | | (149,127) |
| |
| |
|
| Class C | | | | |
| Shares sold | | 319,251 | | 331,465 |
| Shares issued for dividends reinvested | | — | | 275 |
| Shares redeemed | | (42,390) | | (36,722) |
| Net Increase (Decrease) in Shares Outstanding | | 276,861 | | 295,018 |
| |
| |
|
| Class F | | | | |
| Shares sold | | 627,800 | | 587,677 |
| Shares issued for dividends reinvested | | 34,459 | | 71,482 |
| Shares redeemed | | (4,684,422) | | (6,113,337) |
| Net Increase (Decrease) in Shares Outstanding | | (4,022,163) | | (5,454,178) |
| |
| |
|
| Class R | | | | |
| Shares sold | | 823 | | 4,796 |
| Shares issued for dividends reinvested | | 14 | | 150 |
| Shares redeemed | | (36,870) | | (2,559) |
| Net Increase (Decrease) in Shares Outstanding | | (36,033) | | 2,387 |
| |
| |
|
| Class T | | | | |
| Shares sold | | 2,545 | | 1,538 |
| Shares redeemed | | (1,963) | | (6,655) |
| Net Increase (Decrease) in Shares Outstanding | | 582 | | (5,117) |
| a | | During the period ended December 31, 2006, 58,439 Class B shares representing $298,911 were automatically |
| | | converted to 56,464 Class A shares and during the period ended December 31, 2005, 31,864 Class B shares |
| | | representing $147,985 were automatically converted to 30,991 Class A shares. |
| See notes to financial statements. |
The following tables describe the performance for each share class for the fiscal periods indicated.All information (except portfolio turnover rate) reflects financial results for a single fund share.Total return shows how much your investment in the fund would have increased (or decreased) during each period, assuming you had reinvested all dividends and distributions.These figures have been derived from the fund’s financial statements.
| | | | | Year Ended December 31, | | |
| |
| |
| |
|
| Class A Shares | | 2006 | | 2005 | | 2004 | | 2003 | | 2002 |
| |
| |
| |
| |
| |
|
| Per Share Data ($): | | | | | | | | | | |
| Net asset value, beginning of period | | 5.07 | | 4.86 | | 4.49 | | 3.44 | | 4.66 |
| Investment Operations: | | | | | | | | | | |
| Investment income (loss)—net | | .00a,b | | (.00)a | | .02 | | .03 | | (.02) |
| Net realized and unrealized | | | | | | | | | | |
| gain (loss) on investments | | .66 | | .22 | | .36 | | 1.02 | | (1.20) |
| Total from Investment Operations | | .66 | | .22 | | .38 | | 1.05 | | (1.22) |
| Distributions: | | | | | | | | | | |
| Dividends from investment income—net | | (.01) | | (.01) | | (.01) | | — | | — |
| Net asset value, end of period | | 5.72 | | 5.07 | | 4.86 | | 4.49 | | 3.44 |
| |
| |
| |
| |
| |
|
| Total Return (%) c | | 13.02 | | 4.46 | | 8.54 | | 30.52 | | (26.18) |
| |
| |
| |
| |
| |
|
| Ratios/Supplemental Data (%): | | | | | | | | | | |
| Ratio of total expenses | | | | | | | | | | |
| to average net assets | | 1.34 | | 1.35 | | 1.26 | | 1.49 | | 1.87 |
| Ratio of net expenses | | | | | | | | | | |
| to average net assets | | 1.34 | | 1.33 | | 1.25 | | 1.48 | | 1.87 |
| Ratio of net investment income | | | | | | | | | | |
| (loss) to average net assets | | .00d | | (.09) | | .38 | | (.25) | | (.67) |
| Portfolio Turnover Rate e | | 110 | | 126 | | 115 | | 123 | | 152 |
| |
| |
| |
| |
| |
|
| Net Assets, end of period ($ x 1,000) | | 4,399 | | 1,266 | | 1,180 | | 935 | | 378 |
| |
| a Amount represents less than $.01 per share. | | | | | | | | | | |
| b Based on average shares outstanding at each month end. | | | | | | | | |
| c Exclusive of sales charge. | | | | | | | | | | |
| d Amount represents less than .01%. | | | | | | | | | | |
| e | | Portfolio Turnover Rate is a measure of portfolio activity that is calculated by dividing the lesser of purchases or sales |
| | | of securities, excluding securities having maturity dates at acquisition of one year or less, by the average value of the |
| | | portfolio securities held during the period, which is a rolling 12-month period. |
| See notes to financial statements. |
The Fund 19
FINANCIAL HIGHLIGHTS (continued)
|
| | | | | Year Ended December 31, | | |
| |
| |
| |
|
| Class B Shares | | 2006 | | 2005 | | 2004 | | 2003 | | 2002 |
| |
| |
| |
| |
| |
|
| Per Share Data ($): | | | | | | | | | | |
| Net asset value, beginning of period | | 4.91 | | 4.74 | | 4.40 | | 3.40 | | 4.61 |
| Investment Operations: | | | | | | | | | | |
| Investment (loss)—net | | (.05)a | | (.04)a | | (.00)b | | (.01) | | (.05) |
| Net realized and unrealized | | | | | | | | | | |
| gain (loss) on investments | | .65 | | .21 | | .34 | | 1.01 | | (1.16) |
| Total from Investment Operations | | .60 | | .17 | | .34 | | 1.00 | | (1.21) |
| Net asset value, end of period | | 5.51 | | 4.91 | | 4.74 | | 4.40 | | 3.40 |
| |
| |
| |
| |
| |
|
| Total Return (%) c | | 12.22 | | 3.59 | | 7.73 | | 29.41 | | (26.25) |
| |
| |
| |
| |
| |
|
| Ratios/Supplemental Data (%): | | | | | | | | | | |
| Ratio of total expenses | | | | | | | | | | |
| to average net assets | | 2.21 | | 2.19 | | 2.01 | | 2.30 | | 2.14 |
| Ratio of net expenses | | | | | | | | | | |
| to average net assets | | 2.21 | | 2.18 | | 2.00 | | 2.30 | | 2.14 |
| Ratio of net investment (loss) | | | | | | | | | | |
| to average net assets | | (.93) | | (.97) | | (.34) | | (1.08) | | (.95) |
| Portfolio Turnover Rate d | | 110 | | 126 | | 115 | | 123 | | 152 |
| |
| |
| |
| |
| |
|
| Net Assets, end of period ($ x 1,000) | | 1,046 | | 1,453 | | 2,110 | | 1,709 | | 1,013 |
| |
| a Based on average shares outstanding at each month end. | | | | | | | | |
| b Amount represents less than $.01 per share. | | | | | | | | |
| c Exclusive of sales charge. | | | | | | | | | | |
| d | | Portfolio Turnover Rate is a measure of portfolio activity that is calculated by dividing the lesser of purchases or sales |
| | | of securities, excluding securities having maturity dates at acquisition of one year or less, by the average value of the |
| | | portfolio securities held during the period, which is a rolling 12-month period. |
| See notes to financial statements. |
| | | | | | | Year Ended December 31, | | |
| | | |
| |
| |
|
| Class C Shares | | 2006 | | 2005 | | 2004 | | 2003 | | 2002 |
| |
| |
| |
| |
| |
|
| Per Share Data ($): | | | | | | | | | | |
| Net asset value, beginning of period | | 4.82 | | 4.66 | | 4.32 | | 3.34 | | 4.55 |
| Investment Operations: | | | | | | | | | | |
| Investment income (loss)—net | | (.03)a | | (.03)a | | .04 | | .04 | | (.07) |
| Net realized and unrealized | | | | | | | | | | |
| gain (loss) on investments | | .62 | | .20 | | .30 | | .94 | | (1.14) |
| Total from Investment Operations | | .59 | | .17 | | .34 | | .98 | | (1.21) |
| Distributions: | | | | | | | | | | |
| Dividends from investment income—net | | — | | (.01) | | — | | — | | — |
| Net asset value, end of period | | 5.41 | | 4.82 | | 4.66 | | 4.32 | | 3.34 |
| |
| |
| |
| |
| |
|
| Total Return (%) b | | 12.24 | | 3.68 | | 7.87 | | 29.34 | | (26.59) |
| |
| |
| |
| |
| |
|
| Ratios/Supplemental Data (%): | | | | | | | | | | |
| Ratio of total expenses | | | | | | | | | | |
| to average net assets | | 2.01 | | 1.98 | | 1.99 | | 2.29 | | 3.02 |
| Ratio of net expenses | | | | | | | | | | |
| to average net assets | | 2.01 | | 1.96 | | 1.99 | | 2.28 | | 2.76 |
| Ratio of net investment (loss) | | | | | | | | | | |
| to average net assets | | (.69) | | (.72) | | (.24) | | (1.04) | | (1.55) |
| Portfolio Turnover Rate c | | 110 | | 126 | | 115 | | 123 | | 152 |
| |
| |
| |
| |
| |
|
| Net Assets, end of period ($ x 1,000) | | 3,759 | | 2,012 | | 571 | | 357 | | 186 |
| |
| a | | Based on average shares outstanding at each month end. | | | | | | | | |
| b | | Exclusive of sales charge. | | | | | | | | | | |
| c | | Portfolio Turnover Rate is a measure of portfolio activity that is calculated by dividing the lesser of purchases or sales |
| | | of securities, excluding securities having maturity dates at acquisition of one year or less, by the average value of the |
| | | portfolio securities held during the period, which is a rolling 12-month period. | | | | |
| See notes to financial statements. | | | | | | | | | | |
The Fund 21
FINANCIAL HIGHLIGHTS (continued)
|
| | | | | Year Ended December 31, | | |
| |
| |
| |
|
| Class F Shares | | 2006 | | 2005 | | 2004 | | 2003 | | 2002 |
| |
| |
| |
| |
| |
|
| Per Share Data ($): | | | | | | | | | | |
| Net asset value, beginning of period | | 5.18 | | 4.96 | | 4.57 | | 3.50 | | 4.69 |
| Investment Operations: | | | | | | | | | | |
| Investment (loss)—net | | .01a | | .00b | | .02 | | .00b | | .00b |
| Net realized and unrealized | | | | | | | | | | |
| gain (loss) on investments | | .68 | | .23 | | .39 | | 1.07 | | (1.19) |
| Total from Investment Operations | | .69 | | .23 | | .41 | | 1.07 | | (1.19) |
| Distributions: | | | | | | | | | | |
| Dividends from investment income—net | | (.01) | | (.01) | | (.02) | | (.00)b | | (.00)b |
| Net asset value, end of period | | 5.86 | | 5.18 | | 4.96 | | 4.57 | | 3.50 |
| |
| |
| |
| |
| |
|
| Total Return (%) | | 13.25 | | 4.64 | | 8.97 | | 30.67 | | (25.33) |
| |
| |
| |
| |
| |
|
| Ratios/Supplemental Data (%): | | | | | | | | | | |
| Ratio of total expenses | | | | | | | | | | |
| to average net assets | | 1.10 | | 1.13 | | 1.06 | | 1.13 | | 1.08 |
| Ratio of net expenses | | | | | | | | | | |
| to average net assets | | 1.10 | | 1.12 | | 1.06 | | 1.13 | | 1.08 |
| Ratio of net investment income | | | | | | | | | | |
| to average net assets | | .20 | | .11 | | .56 | | .06 | | .11 |
| Portfolio Turnover Rate c | | 110 | | 126 | | 115 | | 123 | | 152 |
| |
| |
| |
| |
| |
|
| Net Assets, end of period ($ x 1,000) | | 220,502 | | 215,556 | | 233,410 | | 233,333 | | 191,701 |
| a | | Based on average shares outstanding at each month end. |
| b | | Amount represents less than $.01 per share. |
| c | | Portfolio Turnover Rate is a measure of portfolio activity that is calculated by dividing the lesser of purchases or sales |
| | | of securities, excluding securities having maturity dates at acquisition of one year or less, by the average value of the |
| | | portfolio securities held during the period, which is a rolling 12-month period. |
| See notes to financial statements. |
| | | | | | | Year Ended December 31, | | |
| | | |
| |
| |
|
| Class R Shares | | 2006 | | 2005 | | 2004 | | 2003 | | 2002 |
| |
| |
| |
| |
| |
|
| Per Share Data ($): | | | | | | | | | | |
| Net asset value, beginning of period | | 5.13 | | 4.91 | | 4.53 | | 3.47 | | 4.74 |
| Investment Operations: | | | | | | | | | | |
| Investment income (loss)—net | | .01a | | .01 | | .03 | | .06 | | (.08) |
| Net realized and unrealized | | | | | | | | | | |
| gain (loss) on investments | | .69 | | .22 | | .37 | | 1.00 | | (1.19) |
| Total from Investment Operations | | .70 | | .23 | | .40 | | 1.06 | | (1.27) |
| Distributions: | | | | | | | | | | |
| Dividends from investment income—net | | (.01) | | (.01) | | (.02) | | — | | — |
| Net asset value, end of period | | 5.82 | | 5.13 | | 4.91 | | 4.53 | | 3.47 |
| |
| |
| |
| |
| |
|
| Total Return (%) | | 13.55 | | 4.78 | | 8.88 | | 30.55 | | (26.79) |
| |
| |
| |
| |
| |
|
| Ratios/Supplemental Data (%): | | | | | | | | | | |
| Ratio of total expenses | | | | | | | | | | |
| to average net assets | | 1.04 | | 1.10 | | 1.00 | | 1.35 | | 4.68 |
| Ratio of net expenses | | | | | | | | | | |
| to average net assets | | 1.04 | | 1.09 | | 1.00 | | 1.35 | | 2.95 |
| Ratio of net investment income | | | | | | | | | | |
| (loss) to average net assets | | .21 | | .15 | | .54 | | (.12) | | (1.78) |
| Portfolio Turnover Rate b | | 110 | | 126 | | 115 | | 123 | | 152 |
| |
| |
| |
| |
| |
|
| Net Assets, end of period ($ x 1,000) | | 97 | | 270 | | 247 | | 211 | | 57 |
| |
| a | | Based on average shares outstanding at each month end. | | | | | | | | |
| b | | Portfolio Turnover Rate is a measure of portfolio activity that is calculated by dividing the lesser of purchases or sales |
| | | of securities, excluding securities having maturity dates at acquisition of one year or less, by the average value of the |
| | | portfolio securities held during the period, which is a rolling 12-month period. | | | | |
| See notes to financial statements. | | | | | | | | | | |
The Fund 23
FINANCIAL HIGHLIGHTS (continued)
|
| | | | | | | Year Ended December 31, | | |
| | | |
| |
| |
|
| Class T Shares | | 2006 | | 2005 | | 2004 | | 2003 | | 2002 |
| |
| |
| |
| |
| |
|
| Per Share Data ($): | | | | | | | | | | |
| Net asset value, beginning of period | | 4.85 | | 4.72 | | 4.38 | | 3.39 | | 4.60 |
| Investment Operations: | | | | | | | | | | |
| Investment (loss)—net | | (.03)a | | (.05)a | | (.01) | | (.23) | | (.30) |
| Net realized and unrealized | | | | | | | | | | |
| gain (loss)on investments | | .63 | | .18 | | .25 | | 1.22 | | (.91) |
| Total from Investment Operations | | .60 | | .13 | | .24 | | .99 | | (1.21) |
| Payment by Service Provider | | — | | — | | .10b | | — | | — |
| Net asset value, end of period | | 5.45 | | 4.85 | | 4.72 | | 4.38 | | 3.39 |
| |
| |
| |
| |
| |
|
| Total Return (%) c | | 12.37 | | 2.75 | | 7.76 | | 29.20 | | (26.30) |
| |
| |
| |
| |
| |
|
| Ratios/Supplemental Data (%): | | | | | | | | | | |
| Ratio of total expenses | | | | | | | | | | |
| to average net assets | | 2.46 | | 2.59 | | 1.90 | | 2.27 | | 3.71 |
| Ratio of net expenses | | | | | | | | | | |
| to average net assets | | 1.82 | | 2.15 | | 1.90 | | 2.26 | | 2.46 |
| Ratio of net investment (loss) | | | | | | | | | | |
| to average net assets | | (.48) | | (.98) | | (.29) | | (1.11) | | (1.29) |
| Portfolio Turnover Rate d | | 110 | | 126 | | 115 | | 123 | | 152 |
| |
| |
| |
| |
| |
|
| Net Assets, end of period ($ x 1,000) | | 12 | | 8 | | 32 | | 30 | | 33 |
| |
| a | | Based on average shares outstanding at each month end. | | | | | | | | |
| b | | A service provider reimbursed the Fund’s Class T shares for losses resulting from certain shareholder adjustments |
| | | which otherwise would have reduced total return by 2.28%. | | | | | | | | |
| c | | Exclusive of sales charge. | | | | | | | | | | |
| d | | Portfolio Turnover Rate is a measure of portfolio activity that is calculated by dividing the lesser of purchases or sales |
| | | of securities, excluding securities having maturity dates at acquisition of one year or less, by the average value of the |
| | | portfolio securities held during the period, which is a rolling 12-month period. | | | | | | |
| See notes to financial statements. | | | | | | | | | | |
NOTES TO FINANCIAL STATEMENTS
NOTE 1—Significant Accounting Policies:
Dreyfus Founders Equity Growth Fund (the “fund”) is a separate diversified series of Dreyfus Founders Funds, Inc. (the “Company”), which is registered under the Investment Company Act of 1940, as amended (the “Act”), as an open-end management investment company and operates as a series company currently offering eight series, including the fund. The fund’s investment objective is to seek long-term growth of capital and income. Founders Asset Management LLC (the “Manager” or “Founders”) serves as the fund’s investment adviser. Founders is an indirect wholly-owned subsidiary of Mellon Financial Corporation (“Mellon Financial”), a publicly-owned financial services company which provides a comprehensive range of financial products and services in domestic and selected international markets.
On December 4, 2006, Mellon Financial and The Bank of New York Company, Inc. announced that they had entered into a definitive agreement to merge. The new company will be called The Bank of New York Mellon Corporation. As part of this transaction, Founders would become an indirect wholly-owned subsidiary of The Bank of New York Mellon Corporation. The transaction is subject to certain regulatory approvals and the approval of The Bank of New York Company, Inc.’s and Mellon Financial’s shareholders, as well as other customary conditions to closing. Subject to such approvals and the satisfaction of the other conditions, Mellon Financial and The Bank of New York Company, Inc. expect the transaction to be completed in the third quarter of 2007.
Dreyfus Service Corporation (the “Distributor”), the direct owner of Founders and a wholly-owned subsidiary of The Dreyfus Corporation (“Dreyfus”, an affiliate of Founders), is the Distributor of the fund’s shares. The fund is authorized to issue up to 1.5 billion shares of Common Stock, par value $ .01 per share, in the following classes of shares: Class A, Class B, Class C, Class F, Class R and Class T shares. Class A and Class T shares are subject to a sales charge imposed at the time of purchase. Class B shares are subject to a contingent deferred sales charge (“CDSC”) imposed on Class B share redemptions made within
The Fund 25
NOTES TO FINANCIAL STATEMENTS (continued)
|
six years of purchase and automatically convert to Class A shares after six years. Class C shares are subject to a CDSC imposed on Class C shares redeemed within one year of purchase. Class F and Class R shares are sold at net asset value (“NAV”) per share. Class F shares are sold only to Class F grandfathered investors, and Class R shares are sold only to eligible institutional investors. Other differences between the classes include the services offered to and the expenses borne by each class. Income and realized and unrealized gains or losses on investments are allocated to each class of shares based on its relative net assets.
Effective June 1, 2006, the fund no longer offers Class B shares, except in connection with dividend reinvestment and permitted exchanges of Class B shares.
Each class of the fund bears expenses incurred specifically on its behalf and, in addition, each class bears a portion of general expenses based on the relative net assets or the number of shareholder accounts of the class.The type of expense determines the allocation method.
The fund’s financial statements are prepared in accordance with U.S. generally accepted accounting principles, which requires the use of management estimates and assumptions. Actual results could differ from those estimates.
In the normal course of business, the fund may enter into contracts and agreements that contain a variety of representations and warranties, and which provide general indemnifications. The maximum exposure to the fund under these arrangements is unknown, as this would involve future claims that may be made against the fund that have not yet occurred. However, based on experience, the fund expects the risks of loss to be remote.
(a) Portfolio valuation: A domestic equity security listed or traded on a securities exchange or in the over-the-counter market is valued at its last sale price on the exchange or market where it is principally traded or, in the case of a security traded on NASDAQ, at its official closing price. Lacking any sales on that day, the security is valued at the current closing bid price, or by quotes from dealers making a market in the security if the closing bid price is not available, or in the case of
written call options, at the mean between the highest bid and lowest asked quotations obtained from at least two securities dealers.
A foreign equity security traded on a foreign exchange is valued at the last quoted official closing price available before the time when the fund’s assets are valued, or at the last quoted sales price if the exchange does not provide an official closing price or if the foreign market has not yet closed. Lacking any sales that day, the security is valued at the current closing bid price, or by quotes from dealers making a market in the security if the closing bid price is not available. New York closing exchange rates are used to convert foreign currencies to U.S. dollars.
A debt security with a remaining maturity greater than 60 days at the time of purchase is valued in accordance with the evaluated bid price supplied by a pricing service approved by the Company’s Board of Directors or, if such price is not available, at the mean between the highest bid and lowest asked quotations obtained from at least two securities dealers.A debt security with a remaining maturity of 60 days or less at the time of purchase is valued at amortized cost, which approximates market value, unless it is determined that amortized cost would not represent market value, in which case the securities would be marked to market.
If market quotations or official closing prices are not readily available or are determined not to reflect accurately fair value, securities will be valued at their fair value as determined in good faith by the Company’s Board of Directors or pursuant to procedures approved by the Board of Directors.These situations may include instances where an event occurs after the close of the market on which a security is traded but before the fund calculates its NAV, and it is determined that the event has materially affected the value of the security. Fair value of foreign equity securities may be determined with the assistance of a pricing service using correlations between the movement of prices of foreign securities and indexes of domestic securities and other appropriate indicators, such as closing market prices of relevant ADRs and futures contracts.
Investments in registered investment companies are valued at their NAV.
The Fund 27
NOTES TO FINANCIAL STATEMENTS (continued)
|
Using fair value to price securities requires the use of estimates, and as such, may result in a value that is different from a security’s most recent closing price and from the prices used by other mutual funds to calculate their NAV’s. In addition, it is possible that the fair value determined for a security may be different from the value that may be realized upon the security’s sale, and that these differences may be material to the NAV of the fund.
On September 20, 2006, the Financial Accounting Standards Board (FASB) released Statement of Financial Accounting Standards No. 157 “Fair Value Measurements” (“FAS 157”). FAS 157 establishes an authoritative definition of fair value, sets out a framework for measuring fair value, and requires additional disclosures about fair value measurements. The application of FAS 157 is required for fiscal years beginning after November 15, 2007 and interim periods within those fiscal years. Management does not believe that the application of this standard will have a material impact on the financial statements of the fund.
(b) Foreign Securities and Currency Transactions: The fund may invest at least a portion of its assets in foreign securities. Foreign securities carry more risk than U.S. securities, such as political and currency risks. In the event the fund executes a foreign security transaction, the fund may enter into a foreign currency contract to settle the foreign security transaction.The fund could be exposed to risk if counterpar-ties are unable to meet the terms of the contracts or if the value of the currency changes unfavorably to the U.S. dollar.The resultant foreign currency gain or loss from the contract is recorded as foreign currency gain or loss and is presented as such in the Statement of Operations.
The accounting records of the fund are maintained in U.S. dollars.The market values of foreign securities, currency holdings and other assets and liabilities are translated into U.S. dollars based on the current exchange rates each business day. Purchases and sales of investment securities and income and expense items denominated in foreign currencies are translated into U.S. dollar amounts on the respective dates of such transactions.
The fund does not isolate that portion of the results of operations resulting from changes in foreign exchange rates on investments from the fluctuations arising from changes in market prices of appreciation/(depreciation) from investments and foreign currency translations on the Statement of Operations.
Reported net realized foreign exchange gains or losses arise from sales of foreign currencies, currency gains or losses realized between the trade and settlement dates on securities transactions, and the difference between the amounts of dividends, interest, and foreign withholding taxes recorded on the fund’s books and the U.S. dollar equivalent of the amounts actually received or paid. Net unrealized appreciation or depreciation on investments and foreign currency translation arises from changes in the values of assets and liabilities, including investments in securities held at the date of the financial statements, resulting from changes in the exchange rates and changes in market prices of securities held.
(c) Securities transactions and investment income: Securities transactions are recorded on a trade date basis. Realized gain and loss from securities transactions are recorded on the identified cost basis. Dividend income is recognized on the ex-dividend date and interest income, including, where applicable, accretion of discount and amortization of premium on investments, is recognized on the accrual basis.
The fund has an arrangement with the custodian bank, Mellon Bank, N.A. (“Mellon Bank”), which is an affiliate of Founders, whereby the fund receives earnings credits from the custodian when positive cash balances are maintained, which are used to offset custody fees. For financial reporting purposes, the fund includes net earnings credits as an expense offset in the Statement of Operations.
(d) Affiliated issuers: Investments in other investment companies advised by the Manager or its affiliates are defined as “affiliated” in the Act.
The Fund 29
NOTES TO FINANCIAL STATEMENTS (continued)
|
(e) Dividends to shareholders: Dividends are recorded on the ex-dividend date. Dividends from investment income-net and dividends from net realized capital gain, if any, are normally declared and paid annually, but the fund may make distributions on a more frequent basis to comply with the distribution requirements of the Internal Revenue Code of 1986, as amended (the “Code”).To the extent that net realized capital gain can be offset by capital loss carryovers, it is the policy of the fund not to distribute such gain. Income and capital gain distributions are determined in accordance with income tax regulations, which may differ from U.S. generally accepted accounting principles.
(f) Federal income taxes: No provision has been made for federal income taxes since it is the policy of the fund to continue to comply with the requirements of Subchapter M of the Code that are applicable to regulated investment companies and to make distributions of income and capital gains sufficient to relieve it from all income taxes.The fund is treated as a separate tax entity for federal income tax purposes.
On July 13, 2006, the FASB released FASB Interpretation No. 48 “Accounting for Uncertainty in Income Taxes” (FIN 48). FIN 48 provides guidance for how uncertain tax positions should be recognized, measured, presented and disclosed in the financial statements. FIN 48 requires the evaluation of tax positions taken or expected to be taken in the course of preparing the fund’s tax returns to determine whether the tax positions are “more-likely-than-not” of being sustained by the applicable tax authority.Tax positions not deemed to meet the more-likely-than-not threshold would be recorded as a tax benefit or expense in the current year. Adoption of FIN 48 is required for fiscal years beginning after December 15, 2006 and is to be applied to all open tax years as of the effective date.At this time, management is evaluating the implications of FIN 48 and its impact, if any, in the financial statements has not yet been determined.
At December 31, 2006, the components of accumulated earnings on a tax basis were as follows: undistributed ordinary income $372,988, accumulated capital losses $66,924,439 and unrealized appreciation $27,020,009. In addition, the fund had $1,245,673 of capital losses
realized after October 31, 2006, which were deferred for tax purposes to the first day of the following fiscal year.
The accumulated capital loss carryover is available to be applied against future net securities profits, if any, realized subsequent to December 31, 2006. If not applied, $16,840,804 of the carryover expires in fiscal 2009 and $50,083,635 expires in fiscal 2010.
The tax character of distributions paid to shareholders during the fiscal periods ended December 31, 2006 and December 31, 2005 were as follows: ordinary income $240,513 and $435,803, respectively.
NOTE 2—Bank Line of Credit:
|
The Company has a line of credit arrangement (“LOC”) with State Street Bank and Trust Company, to be used for temporary or emergency purposes, primarily for financing redemption payments. The borrowings by each series of the Company are limited to the lesser of (a) $50 million, or (b) the lesser of 25% of the series’ total net assets or the maximum amount which the series is permitted to borrow pursuant to the prospectus, any law or any other agreement. Combined borrowings are subject to the $50 million cap on the total LOC. Each series agrees to pay annual fees and interest on the unpaid balance based on prevailing market rates as defined in the LOC. During the period ended December 31, 2006, the fund did not have any borrowings under the LOC.
NOTE 3—Investment Advisory Fee and Other Transactions With Affiliates:
(a) In accordance with an investment advisory agreement between the Company and Founders, the fund compensates Founders for its services as investment adviser by the payment of fees computed daily and paid monthly at the annual rate equal to a percentage of the average daily value of the fund’s net assets.The fee is .65% of the first $250 million of net assets, .60% of the next $250 million of net assets, .55% of the next $250 million of net assets and .50% of net assets in excess of $750 million.
The Fund 31
NOTES TO FINANCIAL STATEMENTS (continued)
|
During the period ended December 31, 2006, the fund was advised that the Distributor retained $3,762 and $1 from sales commissions earned on sales of the fund’s Class A and Class T shares, respectively, and $3,061 and $304 from CDSC on redemptions of the fund’s Class B and Class C shares, respectively.
(b) Under the Distribution Plan (the “Plan”) adopted pursuant to Rule 12b-1 under the Act, Class B, Class C and Class T shares pay the Distributor for distributing their shares at an annual rate of .75% of the value of their average daily net assets of Class B and Class C shares and .25% of the value of the average daily net assets of Class T shares. During the period ended December 31, 2006, Class B, Class C and Class T shares were charged $8,525, $17,569 and $31, respectively, pursuant to the Plan.
The fund has adopted a Distribution Plan pursuant to Rule 12b-1 under the Act applicable to its Class F shares. Under the plan, the fund is authorized to reimburse the Distributor for expenses paid for distributing or servicing its Class F shares at an annual rate of up to .25% of the value of the average daily net assets of the fund’s Class F shares. During the period ended December 31, 2006, Class F shares were charged $148,114 pursuant to this Distribution Plan.
(c) Under the Shareholder Services Plan, Class A, Class B, Class C and Class T shares pay the Distributor at an annual rate of .25% of the value of their average daily net assets for the provision of certain services.The services provided may include personal services relating to shareholder accounts, such as answering shareholder inquiries regarding the fund and providing reports and other information, and services related to the maintenance of shareholder accounts.The Distributor may make payments to Service Agents (a securities dealer, financial institution or other industry professional) in respect of these services.The Distributor determines the amounts to be paid to Service Agents. During the period ended December 31, 2006, Class A, Class B, Class C and Class T shares were charged $5,078, $2,842, $5,866 and $31, respectively, pursuant to the Shareholder Services Plan.
The Company has a shareholder services agreement with the Distributor, whereby the fund has agreed to compensate the Distributor for providing certain shareholder servicing functions to holders of Class F shares. The fund paid the Distributor a monthly fee equal, on an annual basis, to $24.00 per Class F shareholder account considered to be an open account at any time during a given month. During the period ended December 31, 2006, Class F shares were charged $211,583 pursuant to this shareholder services agreement.
Dreyfus Transfer, Inc. (“DTI”), a wholly-owned subsidiary of Dreyfus, is the transfer and dividend disbursing agent for all of the fund’s share classes.With the exception of out-of-pocket charges, the fees charged by DTI with respect to the fund’s Class F shares are paid by the Distributor.The out-of-pocket charges from DTI are paid by the fund. During the period ended December 31, 2006, Class F shares were charged $96,420 for out-of-pocket transfer agent charges.
The fees charged by DTI with respect to the fund’s Class A, B, C, R and T shares are paid by the fund.These transfer agency fees, including both the per account fees paid to DTI and out-of-pocket charges, during the period ended December 31, 2006 were $7,138.
Founders has agreed to reimburse (or to cause its affiliates to reimburse) the Class T share class of the Fund for certain transfer agency expenses pursuant to a written contractual commitment. This commitment will extend through at least August 31, 2007, and will not be terminated without prior notification to the Company’s Board of Directors. During the period ended December 31, 2006, Class T was reimbursed $80, which reduced the amount paid to DTI to $12.
The fund has agreed to compensate Founders for providing accounting services, administration, compliance monitoring, regulatory and shareholder reporting, as well as related facilities, equipment and clerical help. The fee is computed at the annual rate of .06% of the average daily net assets of the fund on the first $500 million, .04% of the average daily net assets of the fund on the next $500 million and .02% of the average daily
The Fund 33
NOTES TO FINANCIAL STATEMENTS (continued)
|
net assets of the fund in excess of $1 billion, plus reasonable out-of-pocket expenses. Founders has contractually agreed in writing to waive any fees received for these services to the extent they exceed Founders’ costs in providing the services. Effective January 1, 2007, Dreyfus replaced Founders as fund accounting and administrative services agent for the fund pursuant to an agreement containing substantially the same terms.
Mellon Bank serves as custodian for the fund.The fees for the custody services are subject to reduction by credits earned on the cash balances of the fund held by the custodian, which are shown as earnings credits on the Statement of Operations. The fund could have employed these assets elsewhere to produce income had it not entered into this arrangement. The custodian contractually agreed in writing to a fee waiver for the Company during the time period and in the amount set forth below:
| Time Period | | Amount of Waiver ($) |
| |
|
| 9/1/05 to 8/31/06 | | 200,000 |
This fee waiver was allocated among the Company’s series in proportion to their respective shares of the total custodian fee. During the period ended December 31, 2006, the fund’s portion of the waiver was $287, which reduced the amount paid to Mellon Bank to $6,530.
The components of Due to Founders Asset Management LLC and affiliates in the Statement of Assets and Liabilities consist of: investment advisory fees $123,783, Rule 12b-1 distribution plan fees $18,060, shareholder services plan fees $54,207, custodian fees $1,649 and transfer agency per account fees $36,650.
(d) Annual retainer fees and attendance fees for the Company’s Board of Directors are allocated to each series of the Company based on net assets.The Company’s Board of Directors has adopted a deferred compensation plan for Company directors that enables directors to elect to defer receipt of all or a portion of the annual compensation that they are entitled to receive from the Company. Under the plan, the compensation deferred is invested in shares of one or more of the
Company’s series.The amount paid to the director under the plan will be determined based upon the performance of the selected series. Changes in market value are included in the directors’ fees and expenses and the net change in unrealized appreciation/depreciation of investments on the Statement of Operations. Deferral of directors’ fees under the plan does not affect the net assets of the fund.
Certain officers of the Company are also officers and/or directors of Founders or its affiliates, which pay their compensation.The affairs of the fund, including services provided by Founders, are subject to the supervision and general oversight of the Company’s Board of Directors.
(e) Pursuant to an exemptive order from the SEC, the fund may invest its available cash balances in affiliated money market mutual funds. Management fees of the underlying money market mutual funds have been waived by Dreyfus.
NOTE 4—Securities Transactions:
The aggregate amount of purchases and sales of investment securities, excluding short-term securities, during the period ended December 31, 2006, amounted to $231,161,593 and $253,944,691, respectively.
At December 31, 2006, the cost of investments for federal income tax purposes was $202,052,391; accordingly, accumulated net unrealized appreciation on investments was $27,020,009, consisting of $29,442,953 gross unrealized appreciation and $2,422,944 gross unrealized depreciation.
Shareholders of Dreyfus Founders Growth Fund will be asked to approve a reorganization whereby shareholders would receive shares of the fund. If shareholder approval is received, it is expected that the reorganization will occur during the second quarter of calendar year 2007.
The Fund 35
REPORT OF INDEPENDENT REGISTERED PUBLIC ACCOUNTING FIRM
To the Board of Directors and Shareholders of Dreyfus Founders Funds, Inc.
In our opinion, the accompanying statement of assets and liabilities, including the statement of investments, and the related statements of operations and of changes in net assets and the financial highlights present fairly, in all material respects, the financial position of Dreyfus Founders Equity Growth Fund (one of the portfolios constituting Dreyfus Founders Funds, Inc., hereafter referred to as the “Fund”) at December 31, 2006, the results of its operations for the year then ended, the changes in its net assets for each of the two years in the period then ended and the financial highlights for each of the five years in the period then ended, in conformity with accounting principles generally accepted in the United States of America. These financial statements and financial highlights (hereafter referred to as “financial statements”) are the responsibility of the Fund’s management; our responsibility is to express an opinion on these financial statements based on our audits.We conducted our audits of these financial statements in accordance with the standards of the Public Company Accounting Oversight Board (United States). Those standards require that we plan and perform the audit to obtain reasonable assurance about whether the financial statements are free of material misstate-ment.An audit includes examining, on a test basis, evidence supporting the amounts and disclosures in the financial statements, assessing the accounting principles used and significant estimates made by management, and evaluating the overall financial statement presentation. We believe that our audits, which included confirmation of securities at December 31, 2006 by correspondence with the custodian and brokers, provide a reasonable basis for our opinion.
PricewaterhouseCoopers LLP
New York, New York
February 23, 2007
|
IMPORTANT TAX INFORMATION ( U n a u d i t e d )
For federal tax purposes, the fund hereby designates 100% of the ordinary dividends paid during the fiscal year ended December 31, 2006 as qualifying for the corporate dividends received deduction. For the fiscal year ended December 31, 2006, certain dividends paid by the fund may be subject to a maximum tax rate of 15%, as provided for by the Jobs and Growth Tax Relief Reconciliation Act of 2003. Of the distributions paid during the fiscal year, $240,513 represents the maximum amount that may be considered qualified dividend income. Shareholders will receive notification in January 2007 of the percentage applicable to the preparation of their 2006 income tax returns.
The Fund 37
FACTORS CONSIDERED IN RENEWING THE ADVISORY AGREEMENT (Unaudited)
At a meeting of the board of directors of Dreyfus Founders Funds, Inc. (the “Funds” and, in reference to any one of the Funds’ portfolios, a “Fund”) held on August 9 and 10, 2006, the Funds’ directors unanimously approved the continuation of the Investment Advisory Agreement (“management agreement”) between each of the Funds and Founders Asset Management LLC, the Funds’ investment adviser (“Founders”), for a one-year term ending August 31, 2007.The board of directors of the Funds (“board”) is comprised entirely of individuals who have no affiliation with Founders or any affiliates of Founders (the “directors”).
Prior to the directors’August 2006 meeting, Founders had provided the directors with extensive materials related to the renewal of the management agreement, including performance and expense information for other investment companies with similar investment objectives to each Fund derived from data compiled by Lipper Inc., an independent third party (“Lipper”).
During their meeting, the directors discussed the proposed continuance of the management agreement with the senior management personnel of Founders. At the conclusion of these discussions, the directors and their independent counsel met in a private session at which no representatives of Founders were present, to continue their discussion of continuance of the agreement. In determining to continue the management agreement, the directors considered all factors which they believed to be relevant, including the following:
Nature, Extent and Quality of Services Provided and to be Provided by Founders
The directors recognized that they have had the opportunity to evaluate the investment and non-investment related services which Founders provides to the Funds primarily through their quarterly review of all of the operations of the Funds during Fund committee and Fund board meetings held throughout the past twelve months. At each such meeting, extensive discussions of Fund operations are held with senior management personnel of Founders and a large vol-
ume of documentation with respect to these operations is provided to and reviewed by the directors. Such discussions and documentation afford the directors the continual opportunity to evaluate the nature, extent, and quality of the services provided by Founders and its affiliates to the Funds.
The directors were satisfied that Founders is managing the investment of the assets of the Funds in accordance with each Fund’s respective investment objective, policies and restrictions, subject to the directors’ overall supervision.
The directors considered that Founders also provides many non-investment related services to the Funds in fulfilling its responsibilities under the management agreement.
Following their discussion and review, the directors reached the following conclusions:
- That the breadth and quality of investment advisory and other ser- vices being provided to the Funds are satisfactory, as evidenced in part by the performance records of the Funds, to which the directors gave significant attention as indicated below; and
- That the directors are satisfied not only with the research, long-term portfolio management, and trading services being provided to the Funds, but also recognize that Founders or its affiliates have provided the highest quality accounting, compliance and regulatory, adminis- trative, underwriting, custody, shareholder, transfer agent and cash management services to the Funds, while charging fair, reasonable and competitive fees.
On a quarterly basis, the directors hold in-person meetings with representatives of the portfolio management team for each Fund (usually a portfolio manager), during which each representative reviews, among other items,performance information,attribution analyses,and the portfolio manager’s investment outlook. The directors also receive written monthly and quarterly performance information for each Fund.
The Fund 39
FACTORS CONSIDERED IN RENEWING THE
ADVISORY AGREEMENT (Unaudited) (continued)
|
In conjunction with their consideration of renewal of the management agreement, the directors received a more detailed performance report about each Fund from Lipper.These reports compared each Fund’s performance to both a relatively small group of similar funds selected by Lipper (the “Lipper performance group”), as well as to all funds in the applicable Lipper category (the “Lipper performance universe”).
Equity Growth Fund’s performance for the one-year period ended December 31, 2005 placed it in the fourth quintile of both its Lipper performance group and the Lipper large-cap growth fund performance universe.The Fund’s performance within its Lipper-selected group and universe for the three-year period ended December 31, 2005 had placed it in the second quintiles. For the six-month and one-, three-and five-year periods ended June 30, 2006, the Fund’s performance placed it in the top two quintiles of its Lipper performance group and universe.The directors deemed these more recent relative performance results to be satisfactory, but stressed the importance to Founders of the need for the Fund to seek to maintain a strong performance record.
After consideration of all relevant information and data, the directors concluded that although past performance cannot be a guaranty of future performance, each Fund and its shareholders would continue to benefit from Founders’ investment management of the Fund. The directors further determined:
- That although certain of the Funds have experienced performance difficulties, Founders has focused its efforts upon improving the performance records of the Funds and will continue to seek improvement; and
- That the materials provided by Lipper demonstrated that most of the Funds maintained satisfactory performance quintile rankings in their respective comparison groups and comparison universes, with six of the eight Funds placing in the top two quintiles of their respective Lipper performance universes for the three-years ended December 31, 2005, and five of the eight Funds placing in the top two quintiles for the six months ended June 30, 2006.
Costs of the Services to be Provided and Profits to be Realized by Founders and Its Affiliates from Founders’ Relationship With the Funds
The directors recognized that on a quarterly basis, they receive information with respect to each Fund’s expenses. The directors carefully review and discuss the expense ratios for all classes of shares of each Fund at each of their quarterly meetings throughout the year.
In conjunction with their annual consideration of renewal of the Funds’ management agreement and other service arrangements, the directors received information from Lipper which included graphs for each Fund that provided outlines of contractual management fees at common asset levels, actual management fees, actual non-management expenses and actual total Fund expenses, each graph comparing the relevant information of each Fund with each Fund’s Lipper performance group.
The directors noted that for the period ended December 31, 2005, Equity Growth Fund’s management fees ranked in the first (best) quintile of its Lipper performance group, with the Fund’s fees the third lowest of 16 “peer funds.”The Fund’s contractual management fees at a common asset level were determined by Lipper to be the lowest of the 16 funds in its group.The Fund’s management fees were in the second best quintile of its Lipper expense universe.
The directors also considered a brochure provided by Lipper which included information with respect to the profitability of the mutual fund advisory activities conducted by a number of publicly-held corporations. Lipper also prepared an analysis providing detailed information with respect to the types of services rendered to various mutual fund complexes under their respective investment advisory contracts.
The directors had been provided with extensive materials with respect to the profitability derived by Founders from providing investment advisory and other services to the Funds as a group and to each Fund individually.
The Fund 41
FACTORS CONSIDERED IN RENEWING THE
ADVISORY AGREEMENT (Unaudited) (continued)
|
The directors further considered certain indirect benefits received by Founders and its affiliates from providing investment advisory services to the Funds.These included the following:
- Since Founders manages several non-Fund accounts in a style that is similar to that used for certain of the Funds, Founders and its affiliates realize certain efficiencies in performing the portfolio management, trading and operational functions related to those accounts;
- The Funds’ brokerage transactions may be executed with brokers that provide research and brokerage services to Founders and its affiliates. These research and brokerage services may be useful to Founders and its affiliates in providing investment services to any of the clients they advise, not just the Funds; and
- Founders receives fees for providing accounting services to the Funds, and affiliates of Founders receive various fees for providing underwriting, shareholder, transfer agency, custody and cash man- agement services to the Funds.
The directors also reviewed a table listing the Funds and corresponding subadvisory accounts managed by Founders, and their respective fee schedules. In their review of this table, the directors noted that Founders provides many services to the Funds in fulfilling its responsibilities under the management agreement that it does not provide to entities for which Founders has assumed subadvisory duties. The directors concluded that the fees paid to Founders under the management agreement are reasonable in relation to the nature and extent of the services provided by Founders to the Funds under the agreement.
After deliberation and discussion of Fund fees and expenses, the directors determined:
- That upon review of the advisory fee structures of the Funds in comparison with the competitive performance groups selected by Lipper, the levels of investment advisory fees paid by the Funds were deemed to be acceptable;
- That the expense ratios of the Funds are acceptable and that Founders continually reviews each Fund’s total expense ratio and has initiated voluntarily expense caps and fee waivers for certain Funds to reduce their expense ratios;
- That the majority of the Funds’ expense ratios increased in 2005 from those experienced in 2004, primarily as a result of declines in Fund assets; and
- That the comparative fee and expense information included in the materials provided by Lipper supports the determination that the advisory and other fees payable by the Funds to Founders and its affiliates are essentially fees which would be similar to those which would have resulted solely from “arm’s-length” bargaining.
With respect to profitability to Founders, the directors reviewed the adviser profitability analysis provided by Lipper, which demonstrated that Founders’ 2005 profitability from providing management services to the Funds was reasonable in comparison to the entities included in the Lipper analysis.
The directors were also advised by independent counsel of the profitability percentage ranges determined by court cases to be acceptable and determined that Founders’ profitability percentage for providing management and other services to the Funds was reasonable.
The directors concluded that Founders’ profits from providing management services to the Funds were reasonable in relationship to the overall services which Founders provides.
Economies of Scale
The directors reviewed information provided by Founders which summarized the extent, if any, that both Founders and the Funds would achieve certain economies of scale if the assets of the Funds were to increase.
The Fund 43
FACTORS CONSIDERED IN RENEWING THE
ADVISORY AGREEMENT (Unaudited) (continued)
|
After review and discussion, the directors considered the extent to which economies of scale and common management are shared with each Fund, including the economies that would be realized from the growth of each Fund’s assets. After such consideration, the directors determined that all of the Funds have structured breakpoints in their advisory fees, which result in fee reductions as the assets of each Fund reach defined levels, and that such fee reductions, when implemented, would benefit all of the applicable Fund’s shareholders through decreases in the Fund’s expense ratio.
Dedication to Regulatory Requirements and Restrictions
An important factor in the directors’ consideration of renewal of the Funds’ management agreement with Founders included the directors’ recognition of the dedication by Founders of stringent adherence to regulatory requirements and restrictions.The directors determined that Founders is dedicated to compliance with all applicable rules and regulations and that the systems of controls which are in place to ensure that the service providers to the Funds, including Founders, and the Funds themselves, maintain strict adherence to the law are excellent.
The directors determined that they are generally satisfied with the performance of the Funds and with the quality of the advisory and other services being provided by Founders and its affiliates to the Funds. The directors recognized that overall Fund performance has improved in recent years and that efforts are being and will continue to be made to enhance such improvements and to maintain Fund expense ratios at reasonable and acceptable levels.
The directors concluded that continuation of the current management agreement between each Fund and Founders, which would enable each Fund to continue to receive investment advisory services from Founders, is in the best interests of each Fund and its shareholders, the services to be performed under the management agreement are services required for the operations of the Funds, Founders has provided satisfactory investment management services to the Funds in the past, and the fees for the management services which Founders will perform will be within the range of what would have been negotiated at arm’s length in light of the circumstances.
The Fund 45
YOUR BOARD REPRESENTATIVES (Unaudited)
The Board of Directors of the Company oversees all 8 Dreyfus Founders Funds.The business and affairs of the Company are managed under the direction of the Board. The directors serving on the Board perform their responsibilities in the manner which they reasonably believe to be in the best interests of the Funds and their shareholders.
All of the directors,as listed below,are independent directors.They are not affiliated with the Fund ‘s adviser, its parent company, or its affiliates.The directors have no official term of office and generally serve until they retire (normally at age 75, but subject to extension to age 80), resign, or are not re-elected.As you can see from their backgrounds, the directors have broad experience as active or former business and community leaders.
Eugene H.Vaughan, CFA, 73.Year elected to the Board: 1970
Board Chairman. Founding Chairman,Vaughan Nelson Investment Management, LP, an investment counseling firm. Director, Encore Bank, Houston. Founding Chairman, Center for Houston’s Future, a non-profit organization. Founding Chairman and former Governor, CFA Institute. Past Chairman and Trustee, Institute of Chartered Financial Analysts. Past Chairman and Director, Financial Analysts Federation. Chairman-elect, University of Texas Health Science Center.
Alan S. Danson, 67.Year elected to the Board: 1991
Private investor. Formerly, President and Director, D.H. Management, Inc., the general partner of a limited partnership with technology company holdings (1996 to 2003). Director, Gore Range Natural Science School and The Les Streeter Program, Inc., both of which are non-profit organizations.
Robert P. Mastrovita, 62.Year elected to the Board: 1998
Private investor. Chairman of a private charitable foundation (1997 to present). Formerly, Chairman and Director, Hagler, Mastrovita & Hewitt, Inc., a registered investment adviser (1982 to 1997). Member, Boston Society of Security Analysts. Trustee, Partridge Academy.
Trygve E. Myhren, 70.Year elected to the Board: 1996
President, Myhren Media, Inc., a firm that invests in and advises media, telecommunications, Internet and software companies. Special Limited Partner and member of Investment Committee, Megunticook Funds, a venture capital firm (1998 to present). Director,Advanced Marketing Services, Inc.Trustee and Chairman of Finance Committee, the University of Denver.Trustee, Denver Art Museum. Member, Cable
Television Hall of Fame. Formerly, President (1990 to 1996) and Director (1992 to 2001) of the Providence Journal Company, a diversified media and communications company. Formerly, Chairman and Chief Executive Officer of American Television and Communications Corporation (now Timer Warner Cable) (1981 to 1988). Formerly, Chairman of the National Cable Television Association (1986-1987).
George W. Phillips, 68.Year elected to the Board: 1998
Retired.Vice Chairman of the Board, Chairman of the Finance Committee, and Chairman of the Investment Committee, Children’s Medical Center of Boston. Formerly, President and Chief Executive Officer (1992 to 1997) and Director (1992 to 2002) of Warren Bancorp, Inc. Formerly, President, Chief Executive Officer and Director of Warren Five Cents Savings Bank (1992 to 1997).
Martha A. Solis-Turner, 46.Year elected to the Board: 2005
Formerly, Telecommunications Director, Wholesale Markets (1995 to 2001), and Manager (1990 to 1995), Qwest Communications International Inc. Board member and Treasurer, Mile High Montessori Early Learning Centers (2002 to present), and formerly, Board member (1995 to 2004) and Vice President (2002 to 2004), Curtis Park Community Center, both of which are non-profit organizations.
Thomas F. Eggers, 54. President and Principal Executive Officer of the Funds since 2006. Founders’ Chairman of the Board, President and Chief Executive Officer. President, Chief Executive Officer and a Director of Dreyfus. Chairman of the Board and Chief Executive Officer of the Distributor since 2005. Formerly, President of Scudder Investments (2002 to 2005). Previously employed by Dreyfus from 1996 to 2002, including as President from 2001 to 2002.
David L. Ray, 49.Vice President of the Funds since 2000, and from 1990 to 1998. Founders’ Senior Vice President, Chief Operating Officer and Treasurer. Vice President of the Distributor since 2003. Employed by Founders and its predecessor company since 1990. Formerly,Treasurer of the Funds (1990 to 1998).
Kenneth R. Christoffersen, 51. Secretary of the Funds since 2000, and from 1996 to 1998. Founders’ Senior Vice President-Legal, General Counsel and Secretary. Assistant Secretary of the Distributor since 2003. Employed by Founders and its predecessor company since 1996.
The Fund 47
YOUR BOARD REPRESENTATIVES (Unaudited) (continued)
Jennifer L. Carnes, 35. Treasurer, Principal Financial Officer and Principal Accounting Officer of the Funds since 2006. Manager of Fund Administration for Founders since 2006. Formerly, Founders’ Supervisor of Corporate Actions and Pricing (2002 to 2006), and Corporate Actions and Pricing Specialist (2000 to 2002).
Janelle E. Belcher, 48. Chief Compliance Officer of the Funds since 2004 and Assistant Secretary of the Funds since 2002. Founders’ Vice President - Compliance since 2002. Formerly, Founders’ Manager of Compliance (2000 to 2002) and Securities Compliance Examiner, Staff Accountant and Team Leader for the U.S. Securities and Exchange Commission (1990 to 2000).
Eric D. Naviloff, 38. Assistant Treasurer since 2006. Senior Accounting Manager -Taxable Fixed-Income Funds of Dreyfus, and an officer of 91 investment companies (comprised of 205 portfolios) managed by Dreyfus. Employed by Dreyfus since 1992.
Robert S. Robol, 42.Assistant Treasurer since 2006. Senior Accounting Manager -Money Market and Municipal Bond Funds of Dreyfus, and an officer of 91 investment companies (comprised of 205 portfolios) managed by Dreyfus. Employed by Dreyfus since 1988.
Robert Svagna, 39. Assistant Treasurer since 2006. Senior Accounting Manager -Equity Funds of Dreyfus, and an officer of 91 investment companies (comprised of 205 portfolios) managed by Dreyfus. Employed by Dreyfus since 1990.
William G. Germenis, 36.Anti-Money Laundering Compliance Officer (“AMLCO”) for the Class A, Class B, Class C, Class R, and Class T shares of the Funds since 2002 and for the Class F shares of the Funds since 2003.Vice President and AMLCO of MBSC, LLC since 2002.Vice President and AMLCO of the Distributor and AMLCO of investment companies managed by Dreyfus. Employed by the Distributor since 1998.
The directors and officers may be contacted at Founders’ address appearing on the back cover, except for Messrs. Eggers, Naviloff, Robol, Svagna and Germenis, who can be contacted at The Dreyfus Corporation, 200 Park Avenue, New York, New York 10166.Additional information about the Company’s directors is available in the Statement of Additional Information, which can be obtained free of charge by calling 1-800-525-2440 (Class F shareholders) or 1-800-554-4611 (all other shareholders).
For Class F shareholders
Telephone Call your financial representative or 1-800-525-2440
| Mail | | Dreyfus Founders Funds, Inc. |
| | | P.O. Box 55360, Boston, MA 02205-8252 |
| |
|
| |
| For Class A, B, C, R and T shareholders |
| Telephone Call your financial representative or 1-800-554-4611 |
| Mail | | Dreyfus Founders Funds, Inc. |
| | | 144 Glenn Curtiss Boulevard, Uniondale, NY 11556-0144 |
| | |
The fund files its complete schedule of portfolio holdings with the Securities and Exchange Commission (“SEC”) for the first and third quarters of each fiscal year on Form N-Q. The fund’s Forms N-Q are available on the SEC’s website at http://www.sec.gov and may be reviewed and copied at the SEC’s Public Reference Room in Washington, DC. Information on the operation of the Public Reference Room may be obtained by calling 1-800-SEC-0330.
A description of the policies and procedures that the fund uses to determine how to vote proxies relating to portfolio securities, and information regarding how the fund voted these proxies for the 12-month period ended June 30, 2006, is available at http://www.founders.com, http://www.dreyfus.com and on the SEC’s website at http://www.sec.gov. The description of the policies and procedures is also available without charge, upon request, by calling 1-800-645-6561.
This report and the statements it contains are submitted for the general information of our shareholders. The report is not authorized for distribution to prospective investors unless preceded or accompanied by an effective prospectus.
| Founders and Founders Funds are registered trademarks |
| of Founders Asset Management LLC. |
| |
| © 2007 Dreyfus Service Corporation |

Save time. Save paper. View your next shareholder report online as soon as it’s available. To take advantage of this service, simply inform us online of your decision to receive materials through our E-Communications Program. Cut down on mailbox clutter and help the Fund reduce printing and postage charges by enrolling today. It’s simple and only takes a few minutes.
Class F shareholders can log into www.founders.com/ ecommunications, or www.icsdelivery.com if you own funds through a third party.
Class A, B, C, R and T shareholders can log into www.dreyfus.com.
The views expressed in this report reflect those of the portfolio manager only through the end of the period covered and do not necessarily represent the views of Founders or any other person in the Founders organization.Any such views are subject to change at any time based upon market or other conditions and Founders disclaims any responsibility to update such views.These views may not be relied on as investment advice and, because investment decisions for a Dreyfus Founders Fund are based on numerous factors, may not be relied on as an indication of trading intent on behalf of any Dreyfus Founders Fund.
Not FDIC-Insured • Not Bank-Guaranteed • May Lose Value
| Contents |
| |
| | | THE FUND |
| |
|
| 2 | | A Letter from the President |
| 3 | | Discussion of Fund Performance |
| 6 | | Fund Performance |
| 8 | | Understanding Your Fund’s Expenses |
| 8 | | Comparing Your Fund’s Expenses |
| With Those of Other Funds |
| 9 | | Statement of Investments |
| 14 | | Statement of Assets and Liabilities |
| 15 | | Statement of Operations |
| 16 | | Statement of Changes in Net Assets |
| 18 | | Financial Highlights |
| 24 | | Notes to Financial Statements |
| 35 | | Report of Independent Registered |
| | | Public Accounting Firm |
| 36 | | Factors Considered in Renewing |
| the Advisory Agreement |
| 44 | | Your Board Representatives |
| |
| FOR MORE INFORMATION |
|
| | | Back Cover |
| Dreyfus Founders |
| Growth Fund |
The Fund

A LETTER FROM THE PRESIDENT
Dear Shareholder:
We are pleased to present this annual report for Dreyfus Founders Growth Fund, covering the 12-month period from January 1, 2006, through December 31, 2006.
2006 proved to be a good year for the financial markets.Virtually all sectors and capitalization ranges of the U.S. equity markets generated strong returns, especially over the second half of the year.A number of positive factors contributed to the markets’ gains in 2006, including an expanding domestic economy, subdued inflation, stabilizing interest rates, rising productivity and robust corporate profits.
In our analysis, 2006 provided an excellent reminder of the need for a long-term investment perspective. Adopting too short a time frame proved costly for some investors last year, as chasing recent winners often meant buying the next month’s losers. Indeed, history shows that reacting to near-term developments with extreme shifts in strategy rarely is the right decision.We believe that a better course of action is to set a portfolio mix to meet future goals, while attempting to ignore short term market fluctuations in favor of a longer-term view.
For information about how the fund performed during the reporting period, as well as market perspectives, we have provided a Discussion of Fund Performance given by the fund’s portfolio manager.
Thank you for your continued confidence and support.We wish you good health and prosperity in 2007.

DISCUSSION OF FUND PERFORMANCE
John B. Jares, CFA, Portfolio Manager
How did Dreyfus Founders Growth Fund perform relative to its benchmark?
For the 12-month period ended December 31, 2006, Dreyfus Founders Growth Fund produced total returns of 13.11% for Class A Shares, 11.95% for Class B Shares, 12.15% for Class C Shares, 13.13% for Class F Shares, 13.50% for Class R Shares and 12.30% for Class T Shares.1 In comparison, the fund’s benchmark, the Russell 1000 Growth Index (the “Index”), saw a gain of 9.07% for the same period.2
High energy prices, concerns regarding consumer spending and interest-rate increases by the Federal Reserve Board (the “Fed”) constrained stock prices during the first half of 2006. However, stabilizing oil prices, an end to the Fed’s rate hikes and expectations of an economic “soft landing” helped support a sustained market rally in the second half of the reporting period. The fund’s returns were higher than its benchmark, primarily due to successful stock selection strategies in a majority of the market sectors in which the fund invested.
What is the fund’s investment approach?
The fund seeks long-term capital growth by investing primarily in stocks of well-established, high-quality “growth” companies. Using a “bottom-up” approach, we focus on individual stock selection and look for high-quality companies with strong performance records, solid market positions, reasonable financial strength and continuous operating records of three years or more.We generally seek investment opportunities in companies that we believe have fundamental strengths that indicate the potential for growth of earnings per share.The fund may invest up to 30% of its assets in foreign securities, and up to 25% of its assets in any one foreign country.
What other factors influenced the fund’s performance?
2006 generally proved to be a weak year for consumer spending. Resurgent energy prices, higher interest rates and a slowing housing market weighed on consumers and stock prices over the first half of the year. Continued geopolitical unrest in the Middle East and other parts
The Fund 3
DISCUSSION OF FUND PERFORMANCE (continued)
|
of the world also dampened the market’s performance early in the year. However, investors’ economic concerns waned over the second half of 2006, when the Fed held short-term interest rates steady after its June 30 meeting. Both stocks and bonds responded well to the Fed’s decision and generally rallied, more than offsetting previous weakness. Furthermore, economic data suggested that the U.S. economy, despite showing signs of slowing, continued to trend upward, which helped moderate recession concerns.
The success of the fund’s stock selection strategy in the information technology sector, which advanced only moderately in the Index, was the greatest driver of the fund’s relative performance in 2006. The fund’s top overall performers included several information technology companies, including hardware manufacturers Cisco Systems, Apple Computer and Hewlett-Packard, as well as software giant Microsoft. Cisco Systems reported robust earnings growth and remained well-positioned for the next generation of voice and data technology to hit the consumer market. Apple continued to benefit from the success of its iPod digital music players and other new products.
Strong stock selections within the consumer discretionary sector also boosted the fund’s relative performance as stocks of consumer-oriented companies such as apparel retailer Kohl’s, which was sold during the reporting period, and media companies Pixar and The Walt Disney Company rose significantly during the reporting period. Pixar’s stock price increased due to its acquisition by Disney. Disney benefited from new management and the favorable performances of recent movie releases, its television subsidiaries and theme parks.The energy and industrials sectors also contributed positively to the fund’s performance. Integrated energy producer Exxon Mobil led the fund’s energy investments higher. Airlines such as Continental Airlines bolstered the fund’s return in the industrials sector, as the industry began to recover amid numerous consolidations and newly implemented cost and infrastructure efficiencies.
On the other hand, the telecommunication services sector represented the fund’s most disappointing sector of 2006, as relatively poor stock picking led to underperformance compared to the benchmark. Wireless telephone service provider Sprint, which was sold during the reporting period and the main driver of this sector’s weak perfor-
mance, lost market share to its competitors in spite of its acquisition of Nextel, a stock the fund did not own.The health care sector also hampered the fund’s results. Medical device makers Boston Scientific and Medtronic, which were sold during the reporting period, struggled in a sluggish cardiac rhythm management market. Advanced Medical Optics’ new intraocular lens was less successful than expected, which caused the company’s stock to decline and eventually be sold. Finally the fund did not invest in any utilities stocks during the reporting period, which proved to be a drag on returns.
What is the fund’s current strategy?
We have continued to find attractive investment opportunities among individual companies, particularly in the information technology sector. We also have identified a number of opportunities in the health care sector, as a fair amount of underperformance among health care firms in 2006 has produced more attractive valuations. In addition, we have continued to find investment candidates in the biotechnology industry as business fundamentals improve and stock valuations have moderated. As always, we intend to continue to rely on our bottom-up research process to seek companies that, in our judgment, have the potential to post superior revenue and earnings growth.
On January 17, 2007, the fund’s Board of Directors approved, subject to shareholder approval, a Plan of Reorganization, which provides for the transfer of the fund’s assets to the Dreyfus Founders Equity Growth Fund (the “Equity Growth Fund”) in a tax-free exchange for shares of the Equity Growth Fund. If approved, the Reorganization is expected to be completed in the second quarter of 2007.
| 1 | | Total return includes reinvestment of dividends and any capital gains paid, and does not take into |
| | | consideration the maximum initial sales charges in the case of Class A and Class T shares, or the |
| | | applicable contingent deferred sales charges imposed on redemptions in the case of Class B and |
| | | Class C shares. Had these charges been reflected, returns would have been lower. Past performance |
| | | is no guarantee of future results. Share price and investment return fluctuate such that upon |
| | | redemption, fund shares may be worth more or less than their original cost. |
| 2 | | SOURCE: LIPPER, INC. – Reflects reinvestment of net dividends and, where applicable, capital |
| | | gain distributions.The Russell 1000 Growth Index is a widely accepted, unmanaged large-cap |
| | | index that measures the performance of those Russell 1000 Index companies with higher price-to- |
| | | book ratios and higher forecasted growth values. |
The Fund 5
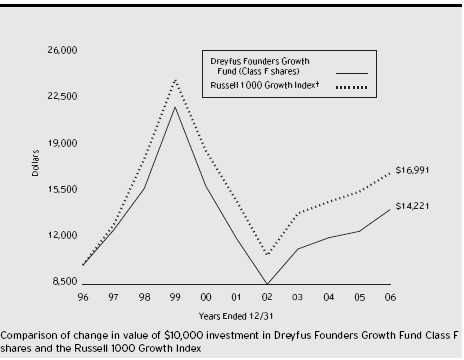
| † Source: Lipper Inc. |
| Past performance is not predictive of future performance. |
| The above graph compares a $10,000 investment made in Class F shares of Dreyfus Founders Growth Fund on |
| 12/31/96 to a $10,000 investment made in the Russell 1000 Growth Index (the “Index”) on that date. All |
| dividends and capital gain distributions are reinvested. Performance for Class A, Class B, Class C, Class R and Class T |
| shares will vary from the performance of Class F shares shown above due to differences in charges and expenses. |
| The fund’s performance shown in the line graph takes into account all applicable Class F fees and expenses (after any |
| expense reimbursements).The Russell 1000 Growth Index is an unmanaged index which measures the performance of |
| those Russell 1000 companies with higher price-to-book ratios and higher forecasted growth values.The Index does not |
| take into account charges, fees and other expenses. Further information relating to fund performance, including expense |
| reimbursements, if applicable, is contained in the Financial Highlights section of the prospectus and elsewhere in this report. |
| Average Annual Total Returns as of 12/31/06 | | | | | | |
| |
| | | Inception | | | | | | | | From |
| | | Date | | 1 Year | | 5 Years | | 10 Years | | Inception |
| |
| |
| |
| |
| |
|
| Class A shares | | | | | | | | | | |
| with maximum sales charge (5.75%) | | 12/31/99 | | 6.56% | | 2.09% | | — | | (6.92)% |
| without sales charge | | 12/31/99 | | 13.11% | | 3.30% | | — | | (6.13)% |
| Class B shares | | | | | | | | | | |
| with applicable redemption charge † | | 12/31/99 | | 7.95% | | 2.08% | | — | | (6.72)% |
| without redemption | | 12/31/99 | | 11.95% | | 2.44% | | — | | (6.72)% |
| Class C shares | | | | | | | | | | |
| with applicable redemption charge †† | | 12/31/99 | | 11.15% | | 2.50% | | — | | (6.85)% |
| without redemption | | 12/31/99 | | 12.15% | | 2.50% | | — | | (6.85)% |
| Class F shares | | 1/5/62 | | 13.13% | | 3.42% | | 3.58% | | N/A |
| Class R shares | | 12/31/99 | | 13.50% | | 3.71% | | — | | (5.82)% |
| Class T shares | | | | | | | | | | |
| with applicable sales charge (4.5%) | | 12/31/99 | | 7.29% | | 1.62% | | — | | (7.41)% |
| without sales charge | | 12/31/99 | | 12.30% | | 2.56% | | — | | (6.79)% |
Past performance is not predictive of future performance.The fund’s performance shown in the graph and table does not reflect the deduction of taxes that a shareholder would pay on fund distributions or the redemption of fund shares. Performance for Class B shares assumes the conversion of Class B shares to Class A shares at the end of the sixth year following the date of purchase.
| † | | The maximum contingent deferred sales charge for Class B shares is 4%. After six years Class B shares convert to |
| | | Class A shares. |
| †† | | The maximum contingent deferred sales charge for Class C shares is 1% for shares redeemed within one year of the |
| | | date of purchase. |
The Fund 7
U N D E R S TA N D I N G YO U R F U N D ’ S E X P E N S E S ( U n a u d i t e d )
As a mutual fund investor, you pay ongoing expenses, such as management fees and other expenses. Using the information below, you can estimate how these expenses affect your investment and compare them with the expenses of other funds.You also may pay one-time transaction expenses, including sales charges (loads) and redemption fees, which are not shown in this section and would have resulted in higher total expenses. For more information, see your fund's prospectus or talk to your financial advisor.
Review your fund’s expenses
|
The table below shows the expenses you would have paid on a $1,000 investment in Dreyfus Founders Growth Fund from July 1, 2006 to December 31, 2006. It also shows how much a $1,000 investment would be worth at the close of the period, assuming actual returns and expenses.To estimate the expenses you paid on your account over this period, simply divide your account value by $1,000 (for example, an $8,600 account value divided by $1,000 = 8.60), then multiply the results by the number in the Expenses paid per $1,000 line for the class of shares you own.
| Expenses and Value of a $1,000 Investment | | | | | | |
| assuming actual returns for the six months ended December 31, 2006 | | | | |
| | | Class A | | Class B | | Class C | | Class F | | Class R | | Class T |
| |
| |
| |
| |
| |
| |
|
| Expenses paid | | | | | | | | | | | | |
| per $1,000 † | | $ 8.31 | | $ 13.14 | | $ 12.45 | | $ 7.61 | | $ 7.08 | | $ 11.23 |
| Ending value | | | | | | | | | | | | |
| (after expenses) | | $1,125.90 | | $1,119.50 | | $1,120.50 | | $1,126.10 | | $1,126.90 | | $1,121.90 |
| COMPARING YOUR FUND’S EXPENSES |
| WITH THOSE OF OTHER FUNDS (Unaudited) |
Using the SEC’s method to compare expenses
The Securities and Exchange Commission (SEC) has established guidelines to help investors assess fund expenses. Per these guidelines, the table below shows your fund's expenses based on a $1,000 investment, assuming a hypothetical 5% annualized return. You can use this information to compare the ongoing expenses (but not transaction expenses or total cost) of investing in the fund with those of other funds.All mutual fund shareholder reports will provide this information to help you make this comparison. Please note that you cannot use this information to estimate your actual ending account balance and expenses paid during the period.
| Expenses and Value of a $1,000 Investment |
| assuming a hypothetical 5% annualized return for the six months ended December 31, 2006 |
| | | Class A | | Class B | | Class C | | Class F | | Class R | | Class T |
| |
| |
| |
| |
| |
| |
|
| Expenses paid | | | | | | | | | | | | |
| per $1,000 † | | $ 7.88 | | $ 12.48 | | $ 11.82 | | $ 7.22 | | $ 6.72 | | $ 10.66 |
| Ending value | | | | | | | | | | | | |
| (after expenses) | | $1,017.39 | | $1,012.80 | | $1,013.46 | | $1,018.05 | | $1,018.55 | | $1,014.62 |
| † Expenses are equal to the fund’s annualized expense ratio of 1.55% for Class A shares, 2.46% for Class B shares, |
| 2.33% for Class C shares, 1.42% for Class F shares, 1.32% for Class R shares and 2.10% for Class T shares; |
| multiplied by the average account value over the period, multiplied by 184/365 (to reflect the one-half year period). |
STATEMENT OF INVESTMENTS
December 31, 2006
|
| Common Stocks—97.0% | | Shares | | Value ($) |
| |
| |
|
| Aerospace & Defense—.6% | | | | |
| Empresa Brasileira de Aeronautica, ADR | | 49,375 | | 2,045,606 |
| Airlines—1.9% | | | | |
| AMR | | 71,325 a | | 2,156,155 |
| Continental Airlines, Cl. B | | 65,400 a | | 2,697,750 |
| US Airways Group | | 27,775 a | | 1,495,684 |
| | | | | 6,349,589 |
| Apparel Retail—1.1% | | | | |
| Gap | | 85,633 | | 1,669,844 |
| Limited Brands | | 67,534 | | 1,954,434 |
| | | | | 3,624,278 |
| Application Software—1.6% | | | | |
| Autodesk | | 77,418 a | | 3,132,332 |
| Cognos | | 54,477 a | | 2,313,093 |
| | | | | 5,445,425 |
| Asset Management & Custody Banks—.7% | | |
| State Street | | 36,375 | | 2,453,130 |
| Biotechnology—2.7% | | | | |
| Amgen | | 56,211 a | | 3,839,773 |
| Genzyme | | 27,875 a | | 1,716,543 |
| MedImmune | | 109,984 a | | 3,560,182 |
| | | | | 9,116,498 |
| Broadcasting & Cable Tv—1.2% | | | | |
| Comcast, Cl. A (Special) | | 96,973 a | | 4,061,229 |
| Building Products—.8% | | | | |
| Masco | | 86,068 | | 2,570,851 |
| Coal—.4% | | | | |
| Peabody Energy | | 34,045 | | 1,375,758 |
| Communications Equipment—5.6% | | | | |
| Cisco Systems | | 390,723 a | | 10,678,460 |
| Corning | | 152,614 a | | 2,855,408 |
| Motorola | | 98,127 | | 2,017,491 |
| Nokia, ADR | | 170,775 | | 3,470,148 |
| | | | | 19,021,507 |
| Computer & Electronics Retail—1.0% | | | | |
| Best Buy | | 70,391 | | 3,462,533 |
The Fund 9
STATEMENT OF INVESTMENTS (continued)
|
| Common Stocks (continued) | | Shares | | Value ($) |
| |
| |
|
| Computer Hardware—6.1% | | | | |
| Apple Computer | | 78,639 a | | 6,671,733 |
| Diebold | | 98,472 | | 4,588,795 |
| Hewlett-Packard | | 182,850 | | 7,531,591 |
| Sun Microsystems | | 319,369 a | | 1,730,980 |
| | | | | 20,523,099 |
| Computer Storage & Peripherals—2.1% | | | | |
| EMC/Massachusetts | | 179,976 a | | 2,375,683 |
| SanDisk | | 37,877 a | | 1,629,847 |
| Seagate Technology | | 122,334 | | 3,241,851 |
| | | | | 7,247,381 |
| Consumer Electronics—.4% | | | | |
| Harman International Industries | | 13,044 | | 1,303,226 |
| Data Processing & Outsourced Services—1.1% | | |
| Automatic Data Processing | | 57,000 | | 2,807,250 |
| Western Union | | 39,300 | | 881,106 |
| | | | | 3,688,356 |
| Department Stores—1.4% | | | | |
| Federated Department Stores | | 125,900 | | 4,800,567 |
| Diversified Chemicals—.8% | | | | |
| E.I. du Pont de Nemours & Co. | | 56,900 | | 2,771,599 |
| Diversified Financial Services—2.2% | | | | |
| Citigroup | | 41,945 | | 2,336,337 |
| JPMorgan Chase & Co. | | 106,875 | | 5,162,063 |
| | | | | 7,498,400 |
| Environmental & Facilities Services—.8% | | |
| Waste Management | | 77,013 | | 2,831,768 |
| Exchange Traded Funds—3.3% | | | | |
| iShares Russell 1000 Growth Index Fund | | 94,150 | | 5,181,075 |
| NASDAQ-100 Trust Series 1 | | 65,075 | | 2,808,637 |
| Standard & Poor’s Depository | | | | |
| Receipts (Tr. Ser. 1) | | 22,625 | | 3,205,736 |
| | | | | 11,195,448 |
| Food Distributors—.6% | | | | |
| SYSCO | | 56,402 | | 2,073,338 |
| Food Retail—.7% | | | | |
| Safeway | | 71,829 | | 2,482,410 |
| |
| |
| 10 | | | | |
| Common Stocks (continued) | | Shares | | Value ($) |
| |
| |
|
| Health Care Equipment—1.6% | | | | |
| Zimmer Holdings | | 68,665 a | | 5,381,963 |
| Home Entertainment Software—1.7% | | | | |
| Electronic Arts | | 111,425 a | | 5,611,363 |
| Home Furnishing Retail—.3% | | | | |
| Williams-Sonoma | | 33,196 | | 1,043,682 |
| Hotels, Resorts & Cruise Lines—.4% | | | | |
| Marriott International, Cl. A | | 29,970 | | 1,430,168 |
| Household Products—3.9% | | | | |
| Colgate-Palmolive | | 102,825 | | 6,708,303 |
| Procter & Gamble | | 102,044 | | 6,558,368 |
| | | | | 13,266,671 |
| Hypermarkets & Super Centers—2.1% | | | | |
| Wal-Mart Stores | | 153,188 | | 7,074,222 |
| Industrial Conglomerates—3.2% | | | | |
| General Electric | | 296,357 | | 11,027,444 |
| Integrated Oil & Gas—3.4% | | | | |
| Chevron | | 37,802 | | 2,779,581 |
| Exxon Mobil | | 115,525 | | 8,852,681 |
| | | | | 11,632,262 |
| Internet Software & Services—2.9% | | | | |
| Google, Cl. A | | 15,959 a | | 7,348,800 |
| Yahoo! | | 94,042 a | | 2,401,833 |
| | | | | 9,750,633 |
| Investment Banking & Brokerage—4.5% | | |
| Charles Schwab | | 344,750 | | 6,667,465 |
| Goldman Sachs Group | | 24,004 | | 4,785,197 |
| Morgan Stanley | | 46,970 | | 3,824,767 |
| | | | | 15,277,429 |
| IT Consulting & Other Services—.9% | | | | |
| Accenture, Cl. A | | 83,940 | | 3,099,904 |
| Life Sciences Tools & Services—1.0% | | | | |
| Thermo Fisher Scientific | | 76,470 a | | 3,463,326 |
| Movies & Entertainment—1.1% | | | | |
| Walt Disney | | 104,980 | | 3,597,665 |
| Multi-Line Insurance—.8% | | | | |
| American International Group | | 37,339 | | 2,675,713 |
The Fund 11
STATEMENT OF INVESTMENTS (continued)
|
| Common Stocks (continued) | | Shares | | Value ($) |
| |
| |
|
| Oil & Gas Equipment & Services—1.2% | | | | |
| Schlumberger | | 65,416 | | 4,131,675 |
| Packaged Foods & Meats—1.8% | | | | |
| Cadbury Schweppes, ADR | | 40,731 | | 1,748,582 |
| Dean Foods | | 60,000 a | | 2,536,800 |
| Unilever (NY Shares) | | 65,837 | | 1,794,058 |
| | | | | 6,079,440 |
| Personal Products—1.6% | | | | |
| Avon Products | | 168,320 | | 5,561,293 |
| Pharmaceuticals—8.3% | | | | |
| Allergan | | 43,627 | | 5,223,897 |
| Bristol-Myers Squibb | | 65,598 | | 1,726,539 |
| Covance | | 28,890 a | | 1,701,910 |
| Eli Lilly & Co. | | 31,872 | | 1,660,531 |
| Johnson & Johnson | | 101,462 | | 6,698,521 |
| Pfizer | | 100,316 | | 2,598,184 |
| Schering-Plough | | 201,112 | | 4,754,288 |
| Wyeth | | 74,121 | | 3,774,241 |
| | | | | 28,138,111 |
| Property & Casualty Insurance—1.6% | | | | |
| Allstate | | 82,500 | | 5,371,575 |
| Semiconductor Equipment—1.8% | | | | |
| ASML Holding (NY Shares) | | 180,331 a | | 4,441,553 |
| KLA-Tencor | | 36,262 | | 1,804,035 |
| | | | | 6,245,588 |
| Semiconductors—2.4% | | | | |
| Broadcom, Cl. A | | 52,508 a | | 1,696,533 |
| Linear Technology | | 74,805 | | 2,268,088 |
| Marvell Technology Group | | 71,252 a | | 1,367,326 |
| Texas Instruments | | 100,896 | | 2,905,805 |
| | | | | 8,237,752 |
| Soft Drinks—1.8% | | | | |
| PepsiCo | | 95,100 | | 5,948,505 |
| Specialized Finance—1.0% | | | | |
| Chicago Mercantile Exchange Holdings | | 4,200 | | 2,140,950 |
| Nasdaq Stock Market | | 45,975 a | | 1,415,570 |
| | | | | 3,556,520 |
| |
| |
| 12 | | | | |
| Common Stocks (continued) | | Shares | | Value ($) |
| |
| |
|
| Specialty Stores—1.5% | | | | |
| AutoZone | | 12,071 a | | 1,394,925 |
| Tiffany & Co. | | 92,956 | | 3,647,593 |
| | | | | 5,042,518 |
| Systems Software—7.5% | | | | |
| Adobe Systems | | 172,927 a | | 7,110,758 |
| Microsoft | | 486,703 | | 14,532,952 |
| Oracle | | 213,254 a | | 3,655,174 |
| | | | | 25,298,884 |
| Tobacco—1.6% | | | | |
| Altria Group | | 62,470 | | 5,361,175 |
| Total Common Stocks | | | | |
| (cost $287,720,793) | | | | 329,247,477 |
| |
| |
|
| |
| Other Investment—2.8% | | | | |
| |
| |
|
| Registered Investment Company; | | | | |
| Dreyfus Institutional Preferred | | | | |
| Plus Money Market Fund | | | | |
| (cost $9,637,000) | | 9,637,000 b | | 9,637,000 |
| |
| |
|
| |
| Total Investments (cost $297,357,793) | | 99.8% | | 338,884,477 |
| Cash and Receivables (Net) | | .2% | | 628,143 |
| Net Assets | | 100.0% | | 339,512,620 |
| ADR—American Depository Receipts |
| a | | Non-income producing security. |
| b | | Investment in affiliated money market mutual fund. |
| Portfolio Summary | | (Unaudited) † | | | | |
| |
| | | Value (%) | | | | Value (%) |
| |
| |
| |
|
| Information Technology | | 33.7 | | Energy | | 5.0 |
| Consumer Staples | | 14.1 | | Materials | | 0.8 |
| Healthcare | | 13.6 | | Other | | 3.3 |
| Financials | | 10.8 | | Cash & Equivalents | | 3.0 |
| Consumer Discretionary | | 8.4 | | | | |
| Industrials | | 7.3 | | | | 100.0 |
| † Based on net assets. |
| See notes to financial statements. |
The Fund 13
STATEMENT OF ASSETS AND LIABILITIES
December 31, 2006
| | | Cost | | Value |
| |
| |
|
| Assets ($): | | | | |
| Investments in securities—See Statement of Investments; | | |
| Unaffiliated issuers | | 287,720,793 | | 329,247,477 |
| Affiliated issuers | | 9,637,000 | | 9,637,000 |
| Cash | | | | 260,836 |
| Receivable for investment securities sold | | 3,904,211 |
| Dividends and interest receivable | | | | 439,796 |
| Receivable for shares of Common Stock subscribed | | 70,399 |
| Prepaid expenses | | | | 44,068 |
| Other assets | | | | 7,418 |
| | | | | 343,611,205 |
| |
| |
|
| Liabilities ($): | | | | |
| Due to Founders Asset Management LLC and affiliates—Note 3(c) | | 423,076 |
| Payable for investment securities purchased | | 3,182,902 |
| Payable for shares of Common Stock redeemed | | 214,855 |
| Directors’ deferred compensation | | | | 7,418 |
| Accrued expenses | | | | 270,334 |
| | | | | 4,098,585 |
| |
| |
|
| Net Assets ($) | | | | 339,512,620 |
| |
| |
|
| Composition of Net Assets ($): | | | | |
| Paid-in capital | | | | 969,209,847 |
| Accumulated investment (loss)—net | | | | (114,287) |
| Accumulated net realized gain (loss) on investments | | (671,110,759) |
| Accumulated net unrealized appreciation | | |
| (depreciation) on investments | | | | 41,527,819 |
| |
| |
|
| Net Assets ($) | | | | 339,512,620 |
| Net Asset Value Per Share | | | | | | | | | | |
| | | Class A | | Class B | | Class C | | Class F | | Class R | | Class T |
| |
| |
| |
| |
| |
| |
|
| Net Assets ($) | | 12,267,718 | | 2,442,667 | | 1,399,493 | | 320,732,912 | | 2,594,467 | | 75,363 |
| Shares | | | | | | | | | | | | |
| Outstanding | | 994,507 | | 208,650 | | 119,387 | | 25,838,095 | | 205,798 | | 6,397 |
| |
| |
| |
| |
| |
| |
|
| Net Asset Value | | | | | | | | | | | | |
| Per Share ($) | | 12.34 | | 11.71 | | 11.72 | | 12.41 | | 12.61 | | 11.78 |
| |
| See notes to financial statements. | | | | | | | | | | |
14
STATEMENT OF OPERATIONS
Year Ended December 31, 2006
|
| Investment Income ($): | | |
| Income: | | |
| Dividends (net of $20,771 foreign taxes withheld at source): | | |
| Unaffiliated issuers | | 3,689,880 |
| Affiliated issuers | | 226,113 |
| Interest | | 311,752 |
| Total Income | | 4,227,745 |
| Expenses: | | |
| Investment advisory fee—Note 3(a) | | 2,549,761 |
| Distribution fees—Note 3(b) | | 838,188 |
| Shareholder servicing costs—Note 3(c) | | 680,486 |
| Accounting fees—Note 3(c) | | 199,405 |
| Professional fees | | 138,833 |
| Prospectus and shareholders’ reports | | 115,815 |
| Directors’ fees and expenses—Note 3(d) | | 88,606 |
| Registration fees | | 70,727 |
| Loan commitment fees—Note 2 | | 13,444 |
| Custodian fees—Note 3(c) | | 7,108 |
| Interest expense—Note 2 | | 388 |
| Miscellaneous | | 69,585 |
| Total Expenses | | 4,772,346 |
| Less—reduction in custody fees due to | | |
| earnings credits—Note 1(c) | | (12,337) |
| Net Expenses | | 4,760,009 |
| Investment (Loss)—Net | | (532,264) |
| |
|
| Realized and Unrealized Gain (Loss) on Investments—Note 4 ($): |
| Net realized gain (loss) on investments | | 23,110,311 |
| Net change in unrealized appreciation (depreciation) on investments | | 18,372,201 |
| Net Realized and Unrealized Gain (Loss) on Investments | | 41,482,512 |
| Net Increase in Net Assets Resulting from Operations | | 40,950,248 |
See notes to financial statements.
|
The Fund 15
STATEMENT OF CHANGES IN NET ASSETS
| | | Year Ended December 31, |
| |
|
| | | 2006 | | 2005 |
| |
| |
|
| Operations ($): | | | | |
| Investment (loss)—net | | (532,264) | | (773,131) |
| Net realized gain (loss) on investments | | 23,110,311 | | 38,521,459 |
| Net change in unrealized appreciation | | | | |
| (depreciation) on investments | | 18,372,201 | | (24,451,397) |
| Net Increase (Decrease) in Net Assets | | | | |
| Resulting from Operations | | 40,950,248 | | 13,296,931 |
| |
| |
|
| Dividends to Shareholders from ($): | | | | |
| Investment income—net: | | | | |
| Class A shares | | — | | (19,905) |
| Class F shares | | — | | (1,261,946) |
| Class R shares | | — | | (13,251) |
| Total Dividends | | — | | (1,295,102) |
| |
| |
|
| Capital Sock Transactions ($): | | | | |
| Net proceeds from shares sold: | | | | |
| Class A shares | | 7,236,894 | | 588,334 |
| Class B shares | | 120,899 | | 130,840 |
| Class C shares | | 272,610 | | 80,497 |
| Class F shares | | 31,533,012 | | 19,477,463 |
| Class R shares | | 746,925 | | 3,445,896 |
| Class T shares | | 22,965 | | 1,893 |
| Dividends reinvested: | | | | |
| Class A shares | | — | | 17,366 |
| Class F shares | | — | | 1,193,334 |
| Class R shares | | — | | 13,251 |
| Cost of shares redeemed: | | | | |
| Class A shares | | (1,610,088) | | (1,637,810) |
| Class B shares | | (7,845,590) | | (3,180,356) |
| Class C shares | | (384,068) | | (632,976) |
| Class F shares | | (81,194,994) | | (106,690,262) |
| Class R shares | | (418,406) | | (12,546,288) |
| Class T shares | | (25,743) | | (33,173) |
| Increase (Decrease) in Net Assets | | | | |
| from Capital Stock Transactions | | (51,545,584) | | (99,771,991) |
| Total Increase (Decrease) in Net Assets | | (10,595,336) | | (87,770,162) |
| |
| |
|
| Net Assets ($): | | | | |
| Beginning of Period | | 350,107,956 | | 437,878,118 |
| End of Period | | 339,512,620 | | 350,107,956 |
| Accumulated investment (loss)—net | | (114,287) | | (107,913) |
| 16 | | | | |
| | | Year Ended December 31, |
| |
|
| | | 2006 | | 2005 |
| |
| |
|
| Capital Share Transactions: | | | | |
| Class A a | | | | |
| Shares sold | | 631,237 | | 56,086 |
| Shares issued for dividends reinvested | | — | | 1,577 |
| Shares redeemed | | (141,364) | | (156,471) |
| Net Increase (Decrease) in Shares Outstanding | | 489,873 | | (98,808) |
| |
| |
|
| Class B a | | | | |
| Shares sold | | 10,955 | | 13,206 |
| Shares redeemed | | (720,794) | | (317,903) |
| Net Increase (Decrease) in Shares Outstanding | | (709,839) | | (304,697) |
| |
| |
|
| Class C | | | | |
| Shares sold | | 24,522 | | 7,980 |
| Shares redeemed | | (35,460) | | (63,320) |
| Net Increase (Decrease) in Shares Outstanding | | (10,938) | | (55,340) |
| |
| |
|
| Class F | | | | |
| Shares sold | | 2,695,683 | | 1,864,857 |
| Shares issued for dividends reinvested | | — | | 107,799 |
| Shares redeemed | | (7,078,716) | | (10,161,828) |
| Net Increase (Decrease) in Shares Outstanding | | (4,383,033) | | (8,189,172) |
| |
| |
|
| Class R | | | | |
| Shares sold | | 63,039 | | 323,673 |
| Shares issued for dividends reinvested | | — | | 1,182 |
| Shares redeemed | | (35,583) | | (1,136,441) |
| Net Increase (Decrease) in Shares Outstanding | | 27,456 | | (811,586) |
| |
| |
|
| Class T | | | | |
| Shares sold | | 2,053 | | 189 |
| Shares redeemed | | (2,377) | | (3,345) |
| Net Increase (Decrease) in Shares Outstanding | | (324) | | (3,156) |
| |
| a During the period ended December 31, 2006, 490,821 Class B shares representing $5,354,586 were |
| automatically converted to 468,424 Class A shares and during the period ended December 31, 2005, 22,760 Class |
| B shares representing $230,838 were automatically converted to 21,811 Class A shares. |
| See notes to financial statements. | | | | |
The Fund 17
The following tables describe the performance for each share class for the fiscal periods indicated. All information (except portfolio turnover rate) reflects financial results for a single fund share.Total return shows how much your investment in the fund would have increased (or decreased) during each period, assuming you had reinvested all dividends and distributions.These figures have been derived from the fund’s financial statements.
| | | | | | | Year Ended December 31, | | |
| | | |
| |
| |
|
| Class A Shares | | 2006 | | 2005 | | 2004 | | 2003 | | 2002 |
| |
| |
| |
| |
| |
|
| Per Share Data ($): | | | | | | | | | | |
| Net asset value, beginning of period | | 10.91 | | 10.53 | | 9.79 | | 7.46 | | 10.53 |
| Investment Operations: | | | | | | | | | | |
| Investment income (loss)—net | | (.02)a | | (.03)a | | .02a | | (.06) | | (.06) |
| Net realized and unrealized | | | | | | | | | | |
| gain (loss) on investments | | 1.45 | | .45 | | .72 | | 2.39 | | (3.01) |
| Total from Investment Operations | | 1.43 | | .42 | | .74 | | 2.33 | | (3.07) |
| Distributions: | | | | | | | | | | |
| Dividends from investment income—net | | — | | (.04) | | — | | — | | — |
| Net asset value, end of period | | 12.34 | | 10.91 | | 10.53 | | 9.79 | | 7.46 |
| |
| |
| |
| |
| |
|
| Total Return (%) b | | 13.11 | | 3.98 | | 7.56 | | 31.23 | | (29.15) |
| |
| |
| |
| |
| |
|
| Ratios/Supplemental Data (%): | | | | | | | | | | |
| Ratio of total expenses | | | | | | | | | | |
| to average net assets | | 1.49 | | 1.49 | | 1.42 | | 1.66 | | 1.48 |
| Ratio of net expenses | | | | | | | | | | |
| to average net assets | | 1.49 | | 1.47 | | 1.41 | | 1.66 | | 1.48 |
| Ratio of net investment income | | | | | | | | | | |
| (loss) to average net assets | | (.17) | | (.28) | | .22 | | (.59) | | (.56) |
| Portfolio Turnover Rate c | | 103 | | 120 | | 107 | | 124 | | 139 |
| |
| |
| |
| |
| |
|
| Net Assets, end of period ($ x 1,000) | | 12,268 | | 5,505 | | 6,356 | | 6,452 | | 5,149 |
| |
| a | | Based on average shares outstanding at each month end. | | | | | | | | |
| b | | Exclusive of sales charge. | | | | | | | | | | |
| c | | Portfolio Turnover Rate is a measure of portfolio activity that is calculated by dividing the lesser of purchases or sales |
| | | of securities, excluding securities having maturity dates at acquisition of one year or less, by the average value of the |
| | | portfolio securities held during the period, which is a rolling 12-month period. | | | | |
| See notes to financial statements. | | | | | | | | | | |
| | | | | | | Year Ended December 31, | | |
| | | |
| |
| |
|
| Class B Shares | | 2006 | | 2005 | | 2004 | | 2003 | | 2002 |
| |
| |
| |
| |
| |
|
| Per Share Data ($): | | | | | | | | | | |
| Net asset value, beginning of period | | 10.46 | | 10.14 | | 9.50 | | 7.30 | | 10.38 |
| Investment Operations: | | | | | | | | | | |
| Investment (loss)—net | | (.12)a | | (.11)a | | (.06)a | | (.17) | | (.18) |
| Net realized and unrealized | | | | | | | | | | |
| gain (loss) on investments | | 1.37 | | .43 | | .70 | | 2.37 | | (2.90) |
| Total from Investment Operations | | 1.25 | | .32 | | .64 | | 2.20 | | (3.08) |
| Net asset value, end of period | | 11.71 | | 10.46 | | 10.14 | | 9.50 | | 7.30 |
| |
| |
| |
| |
| |
|
| Total Return (%) b | | 11.95 | | 3.16 | | 6.74 | | 30.14 | | (29.67) |
| |
| |
| |
| |
| |
|
| Ratios/Supplemental Data (%): | | | | | | | | | | |
| Ratio of total expenses | | | | | | | | | | |
| to average net assets | | 2.40 | | 2.31 | | 2.22 | | 2.48 | | 2.22 |
| Ratio of net expenses | | | | | | | | | | |
| to average net assets | | 2.40 | | 2.30 | | 2.22 | | 2.48 | | 2.22 |
| Ratio of net investment (loss) | | | | | | | | | | |
| to average net assets | | (1.20) | | (1.11) | | (.58) | | (1.41) | | (1.30) |
| Portfolio Turnover Rate c | | 103 | | 120 | | 107 | | 124 | | 139 |
| |
| |
| |
| |
| |
|
| Net Assets, end of period ($ x 1,000) | | 2,443 | | 9,603 | | 12,406 | | 13,664 | | 11,603 |
| |
| a | | Based on average shares outstanding at each month end. | | | | | | | | |
| b | | Exclusive of sales charge. | | | | | | | | | | |
| c | | Portfolio Turnover Rate is a measure of portfolio activity that is calculated by dividing the lesser of purchases or sales |
| | | of securities, excluding securities having maturity dates at acquisition of one year or less, by the average value of the |
| | | portfolio securities held during the period, which is a rolling 12-month period. | | | | |
| See notes to financial statements. | | | | | | | | | | |
The Fund 19
FINANCIAL HIGHLIGHTS (continued)
|
| | | | | | | Year Ended December 31, | | |
| | | |
| |
| |
|
| Class C Shares | | 2006 | | 2005 | | 2004 | | 2003 | | 2002 |
| |
| |
| |
| |
| |
|
| Per Share Data ($): | | | | | | | | | | |
| Net asset value, beginning of period | | 10.45 | | 10.13 | | 9.48 | | 7.29 | | 10.36 |
| Investment Operations: | | | | | | | | | | |
| Investment (loss)—net | | (.11)a | | (.10)a | | (.05)a | | (.19) | | (.26) |
| Net realized and unrealized | | | | | | | | | | |
| gain (loss) on investments | | 1.38 | | .42 | | .70 | | 2.38 | | (2.81) |
| Total from Investment Operations | | 1.27 | | .32 | | .65 | | 2.19 | | (3.07) |
| Net asset value, end of period | | 11.72 | | 10.45 | | 10.13 | | 9.48 | | 7.29 |
| |
| |
| |
| |
| |
|
| Total Return (%) b | | 12.15 | | 3.16 | | 6.86 | | 30.04 | | (29.63) |
| |
| |
| |
| |
| |
|
| Ratios/Supplemental Data (%): | | | | | | | | | | |
| Ratio of total expenses | | | | | | | | | | |
| to average net assets | | 2.26 | | 2.24 | | 2.16 | | 2.49 | | 2.37 |
| Ratio of net expenses | | | | | | | | | | |
| to average net assets | | 2.26 | | 2.22 | | 2.16 | | 2.49 | | 2.37 |
| Ratio of net investment (loss) | | | | | | | | | | |
| to average net assets | | (.99) | | (1.03) | | (.49) | | (1.42) | | (1.46) |
| Portfolio Turnover Rate c | | 103 | | 120 | | 107 | | 124 | | 139 |
| |
| |
| |
| |
| |
|
| Net Assets, end of period ($ x 1,000) | | 1,399 | | 1,362 | | 1,881 | | 1,774 | | 1,528 |
| |
| a | | Based on average shares outstanding at each month end. | | | | | | | | |
| b | | Exclusive of sales charge. | | | | | | | | | | |
| c | | Portfolio Turnover Rate is a measure of portfolio activity that is calculated by dividing the lesser of purchases or sales |
| | | of securities, excluding securities having maturity dates at acquisition of one year or less, by the average value of the |
| | | portfolio securities held during the period, which is a rolling 12-month period. | | | | |
| See notes to financial statements. | | | | | | | | | | |
| | | | | Year Ended December 31, | | |
| |
| |
| |
|
| Class F Shares | | 2006 | | 2005 | | 2004 | | 2003 | | 2002 |
| |
| |
| |
| |
| |
|
| Per Share Data ($): | | | | | | | | | | |
| Net asset value, beginning of period | | 10.97 | | 10.58 | | 9.83 | | 7.48 | | 10.53 |
| Investment Operations: | | | | | | | | | | |
| Investment income (loss)—net | | (.02)a | | (.02)a | | .03a | | (.17) | | (.22) |
| Net realized and unrealized | | | | | | | | | | |
| gain (loss) on investments | | 1.46 | | .45 | | .72 | | 2.52 | | (2.83) |
| Total from Investment Operations | | 1.44 | | .43 | | .75 | | 2.35 | | (3.05) |
| Distributions: | | | | | | | | | | |
| Dividends from investment income—net | | — | | (.04) | | — | | — | | — |
| Net asset value, end of period | | 12.41 | | 10.97 | | 10.58 | | 9.83 | | 7.48 |
| |
| |
| |
| |
| |
|
| Total Return (%) | | 13.13 | | 4.08 | | 7.63 | | 31.42 | | (28.96) |
| |
| |
| |
| |
| |
|
| Ratios/Supplemental Data (%): | | | | | | | | | | |
| Ratio of total expenses | | | | | | | | | | |
| to average net assets | | 1.41 | | 1.38 | | 1.33 | | 1.47 | | 1.38 |
| Ratio of net expenses | | | | | | | | | | |
| to average net assets | | 1.41 | | 1.37 | | 1.33 | | 1.47 | | 1.37 |
| Ratio of net investment income | | | | | | | | | | |
| (loss) to average net assets | | (.14) | | (.18) | | .30 | | (.41) | | (.46) |
| Portfolio Turnover Rate b | | 103 | | 120 | | 107 | | 124 | | 139 |
| |
| |
| |
| |
| |
|
| Net Assets, end of period ($ x 1,000) | | 320,733 | | 331,585 | | 406,550 | | 484,742 | | 443,307 |
| a | | Based on average shares outstanding at each month end. |
| b | | Portfolio Turnover Rate is a measure of portfolio activity that is calculated by dividing the lesser of purchases or sales |
| | | of securities, excluding securities having maturity dates at acquisition of one year or less, by the average value of the |
| | | portfolio securities held during the period, which is a rolling 12-month period. |
| See notes to financial statements. |
The Fund 21
FINANCIAL HIGHLIGHTS (continued)
|
| | | | | | | Year Ended December 31, | | |
| | | |
| |
| |
|
| Class R Shares | | 2006 | | 2005 | | 2004 | | 2003 | | 2002 |
| |
| |
| |
| |
| |
|
| Per Share Data ($): | | | | | | | | | | |
| Net asset value, beginning of period | | 11.11 | | 10.69 | | 9.89 | | 7.50 | | 10.57 |
| Investment Operations: | | | | | | | | | | |
| Investment income—net | | .01a | | .02a | | .07 | | .01 | | .01 |
| Net realized and unrealized | | | | | | | | | | |
| gain (loss) on investments | | 1.49 | | .47 | | .73 | | 2.38 | | (3.08) |
| Total from Investment Operations | | 1.50 | | .49 | | .80 | | 2.39 | | (3.07) |
| Distributions: | | | | | | | | | | |
| Dividends from investment income—net | | — | | (.07) | | — | | — | | — |
| Net asset value, end of period | | 12.61 | | 11.11 | | 10.69 | | 9.89 | | 7.50 |
| |
| |
| |
| |
| |
|
| Total Return (%) | | 13.50 | | 4.54 | | 8.09 | | 31.87 | | (29.04) |
| |
| |
| |
| |
| |
|
| Ratios/Supplemental Data (%): | | | | | | | | | | |
| Ratio of total expenses | | | | | | | | | | |
| to average net assets | | 1.17 | | 1.05 | | 1.03 | | 1.13 | | 1.30 |
| Ratio of net expenses | | | | | | | | | | |
| to average net assets | | 1.17 | | 1.04 | | 1.03 | | 1.13 | | 1.30 |
| Ratio of net investment income | | | | | | | | | | |
| (loss) to average net assets | | .11 | | .15 | | .65 | | (.04) | | (.34) |
| Portfolio Turnover Rate b | | 103 | | 120 | | 107 | | 124 | | 139 |
| |
| |
| |
| |
| |
|
| Net Assets, end of period ($ x 1,000) | | 2,594 | | 1,982 | | 10,584 | | 8,792 | | 4,333 |
| |
| a | | Based on average shares outstanding at each month end. | | | | | | | | |
| b | | Portfolio Turnover Rate is a measure of portfolio activity that is calculated by dividing the lesser of purchases or sales |
| | | of securities, excluding securities having maturity dates at acquisition of one year or less, by the average value of the |
| | | portfolio securities held during the period, which is a rolling 12-month period. | | | | |
| See notes to financial statements. | | | | | | | | | | |
| | | | | | | Year Ended December 31, | | |
| | | |
| |
| |
|
| Class T Shares | | 2006 | | 2005 | | 2004 | | 2003 | | 2002 |
| |
| |
| |
| |
| |
|
| Per Share Data ($): | | | | | | | | | | |
| Net asset value, beginning of period | | 10.49 | | 10.17 | | 9.48 | | 7.27 | | 10.38 |
| Investment Operations: | | | | | | | | | | |
| Investment (loss)—net | | (.10)a | | (.10)a | | (.02)a | | (.30) | | (.56) |
| Net realized and unrealized | | | | | | | | | | |
| gain (loss) on investments | | 1.39 | | .42 | | .71 | | 2.51 | | (2.55) |
| Total from Investment Operations | | 1.29 | | .32 | | .69 | | 2.21 | | (3.11) |
| Net asset value, end of period | | 11.78 | | 10.49 | | 10.17 | | 9.48 | | 7.27 |
| |
| |
| |
| |
| |
|
| Total Return (%) b | | 12.30 | | 3.15 | | 7.28 | | 30.40 | | (29.96) |
| |
| |
| |
| |
| |
|
| Ratios/Supplemental Data (%): | | | | | | | | | | |
| Ratio of total expenses | | | | | | | | | | |
| to average net assets | | 2.19 | | 2.21 | | 1.79 | | 2.22 | | 2.78 |
| Ratio of net expenses | | | | | | | | | | |
| to average net assets | | 2.19 | | 2.20 | | 1.79 | | 2.22 | | 2.78 |
| Ratio of net investment (loss) | | | | | | | | | | |
| to average net assets | | (.91) | | (1.01) | | (.17) | | (1.15) | | (1.89) |
| Portfolio Turnover Rate c | | 103 | | 120 | | 107 | | 124 | | 139 |
| |
| |
| |
| |
| |
|
| Net Assets, end of period ($ X 1,000) | | 75 | | 71 | | 100 | | 220 | | 208 |
| |
| a | | Based on average shares outstanding at each month end. | | | | | | | | |
| b | | Exclusive of sales charge. | | | | | | | | | | |
| c | | Portfolio Turnover Rate is a measure of portfolio activity that is calculated by dividing the lesser of purchases or sales |
| | | of securities, excluding securities having maturity dates at acquisition of one year or less, by the average value of the |
| | | portfolio securities held during the period, which is a rolling 12-month period. | | | | |
| See notes to financial statements. | | | | | | | | | | |
The Fund 23
NOTES TO FINANCIAL STATEMENTS
NOTE 1—Significant Accounting Policies:
Dreyfus Founders Growth Fund (the “fund”) is a separate diversified series of Dreyfus Founders Funds, Inc. (the “Company”), which is registered under the Investment Company Act of 1940, as amended (the “Act”), as an open-end management investment company and operates as a series company currently offering eight series, including the fund. The fund’s investment objective is to seek long-term growth of capital. Founders Asset Management LLC (the “Manager”or “Founders”) serves as the fund’s investment adviser. Founders is an indirect wholly-owned subsidiary of Mellon Financial Corporation (“Mellon Financial”), a publicly-owned financial services company which provides a comprehensive range of financial products and services in domestic and selected international markets.
On December 4, 2006, Mellon Financial and The Bank of New York Company, Inc. announced that they had entered into a definitive agreement to merge.The new company will be called The Bank of New York Mellon Corporation.As part of this transaction, Founders would become an indirect wholly-owned subsidiary of The Bank of New York Mellon Corporation. The transaction is subject to certain regulatory approvals and the approval of The Bank of New York Company, Inc.’s and Mellon Financial’s shareholders, as well as other customary conditions to closing. Subject to such approvals and the satisfaction of the other conditions, Mellon Financial and The Bank of New York Company, Inc. expect the transaction to be completed in the third quarter of 2007.
Dreyfus Service Corporation (the “Distributor”), the direct owner of Founders and a wholly-owned subsidiary of The Dreyfus Corporation (“Dreyfus”, an affiliate of Founders), is the Distributor of the fund’s shares. The fund is authorized to issue up to 750 million shares of Common Stock, par value $ .01 per share, in the following classes of shares: Class A, Class B, Class C, Class F, Class R and Class T shares. Class A and Class T shares are subject to a sales charge imposed at the time of purchase. Class B shares are subject to a contingent deferred sales charge (“CDSC”) imposed on Class B share redemptions made within six years of purchase and automatically convert to Class A shares after
six years. Class C shares are subject to a CDSC imposed on Class C shares redeemed within one year of purchase. Class F and Class R shares are sold at net asset value (“NAV”) per share. Class F shares are sold only to Class F grandfathered investors, and Class R shares are sold only to eligible institutional investors. Other differences between the classes include the services offered to and the expenses borne by each class. Income and realized and unrealized gains or losses on investments are allocated to each class of shares based on its relative net assets.
Effective June 1, 2006, the fund no longer offers Class B shares, except in connection with dividend reinvestment and permitted exchanges of Class B shares.
Each class of the fund bears expenses incurred specifically on its behalf and, in addition, each class bears a portion of general expenses based on the relative net assets or the number of shareholder accounts of the class.The type of expense determines the allocation method.
The fund’s financial statements are prepared in accordance with U.S. generally accepted accounting principles, which requires the use of management estimates and assumptions. Actual results could differ from those estimates.
In the normal course of business, the fund may enter into contracts and agreements that contain a variety of representations and warranties, and which provide general indemnifications. The maximum exposure to the fund under these arrangements is unknown, as this would involve future claims that may be made against the fund that have not yet occurred. However, based on experience, the fund expects the risks of loss to be remote.
(a) Portfolio valuation: A domestic equity security listed or traded on a securities exchange or in the over-the-counter market is valued at its last sale price on the exchange or market where it is principally traded or, in the case of a security traded on NASDAQ, at its official closing price. Lacking any sales on that day, the security is valued at the current closing bid price, or by quotes from dealers making a market in the security if the closing bid price is not available, or in the case of
The Fund 25
NOTES TO FINANCIAL STATEMENTS (continued)
|
written call options, at the mean between the highest bid and lowest asked quotations obtained from at least two securities dealers.
A foreign equity security traded on a foreign exchange is valued at the last quoted official closing price available before the time when the fund’s assets are valued, or at the last quoted sales price if the exchange does not provide an official closing price or if the foreign market has not yet closed. Lacking any sales that day, the security is valued at the current closing bid price, or by quotes from dealers making a market in the security if the closing bid price is not available. New York closing exchange rates are used to convert foreign currencies to U.S. dollars.
A debt security with a remaining maturity greater than 60 days at the time of purchase is valued in accordance with the evaluated bid price supplied by a pricing service approved by the Company’s Board of Directors or, if such price is not available, at the mean between the highest bid and lowest asked quotations obtained from at least two securities dealers.A debt security with a remaining maturity of 60 days or less at the time of purchase is valued at amortized cost, which approximates market value, unless it is determined that amortized cost would not represent market value, in which case the securities would be marked to market.
If market quotations or official closing prices are not readily available or are determined not to reflect accurately fair value, securities will be valued at their fair value as determined in good faith by the Company’s Board of Directors or pursuant to procedures approved by the Board of Directors.These situations may include instances where an event occurs after the close of the market on which a security is traded but before the fund calculates its NAV, and it is determined that the event has materially affected the value of the security. Fair value of foreign equity securities may be determined with the assistance of a pricing service using correlations between the movement of prices of foreign securities and indexes of domestic securities and other appropriate indicators, such as closing market prices of relevant ADRs and futures contracts.
Investments in registered investment companies are valued at their NAV.
Using fair value to price securities requires the use of estimates, and as such, may result in a value that is different from a security’s most recent closing price and from the prices used by other mutual funds to calculate their NAV’s. In addition, it is possible that the fair value determined for a security may be different from the value that may be realized upon the security’s sale, and that these differences may be material to the NAV of the fund.
On September 20, 2006, the Financial Accounting Standards Board (FASB) released Statement of Financial Accounting Standards No. 157 “Fair Value Measurements” (“FAS 157”). FAS 157 establishes an authoritative definition of fair value, sets out a framework for measuring fair value, and requires additional disclosures about fair value measurements. The application of FAS 157 is required for fiscal years beginning after November 15, 2007 and interim periods within those fiscal years. Management does not believe that the application of this standard will have a material impact on the financial statements of the fund.
(b) Foreign Securities and Currency Transactions: The fund may invest at least a portion of its assets in foreign securities. Foreign securities carry more risk than U.S. securities, such as political and currency risks. In the event the fund executes a foreign security transaction, the fund may enter into a foreign currency contract to settle the foreign security transaction.The fund could be exposed to risk if counterpar-ties are unable to meet the terms of the contracts or if the value of the currency changes unfavorably to the U.S. dollar.The resultant foreign currency gain or loss from the contract is recorded as foreign currency gain or loss and is presented as such in the Statement of Operations.
The accounting records of the fund are maintained in U.S. dollars.The market values of foreign securities,currency holdings and other assets and liabilities are translated into U.S. dollars based on the current exchange rates each business day. Purchases and sales of investment securities and income and expense items denominated in foreign currencies are translated into U.S.dollar amounts on the respective dates of such transactions.
The fund does not isolate that portion of the results of operations resulting from changes in foreign exchange rates on investments from
The Fund 27
NOTES TO FINANCIAL STATEMENTS (continued)
|
the fluctuations arising from changes in market prices of securities held. Such fluctuations are included with the net unrealized appreciation/(depreciation) from investments and foreign currency translations on the Statement of Operations.
Reported net realized foreign exchange gains or losses arise from sales of foreign currencies, currency gains or losses realized between the trade and settlement dates on securities transactions, and the difference between the amounts of dividends, interest, and foreign withholding taxes recorded on the fund’s books and the U.S. dollar equivalent of the amounts actually received or paid. Net unrealized appreciation or depreciation on investments and foreign currency translation arises from changes in the values of assets and liabilities, including investments in securities held at the date of the financial statements, resulting from changes in the exchange rates and changes in market prices of securities held.
(c) Securities transactions and investment income: Securities transactions are recorded on a trade date basis. Realized gain and loss from securities transactions are recorded on the identified cost basis. Dividend income is recognized on the ex-dividend date and interest income, including, where applicable, accretion of discount and amortization of premium on investments, is recognized on the accrual basis.
The fund has an arrangement with the custodian bank, Mellon Bank, N.A. (“Mellon Bank”), which is an affiliate of Founders, whereby the fund receives earnings credits from the custodian when positive cash balances are maintained, which are used to offset custody fees. For financial reporting purposes, the fund includes net earnings credits, if any, as an expense offset in the Statement of Operations.
(d) Affiliated issuers: Investments in other investment companies advised by the Manager or its affiliates are defined as “affiliated” in the Act.
(e) Dividends to shareholders: Dividends are recorded on the ex-dividend date. Dividends from investment income-net and dividends from net realized capital gain, if any, are normally declared and paid annually, but the fund may make distributions on a more frequent basis
to comply with the distribution requirements of the Internal Revenue Code of 1986, as amended (the “Code”).To the extent that net realized capital gain can be offset by capital loss carryovers, it is the policy of the fund not to distribute such gain. Income and capital gain distributions are determined in accordance with income tax regulations, which may differ from U.S. generally accepted accounting principles.
(f) Federal income taxes: No provision has been made for federal income taxes since it is the policy of the fund to continue to comply with the requirements of Subchapter M of the Code that are applicable to regulated investment companies and to make distributions of income and capital gains sufficient to relieve it from all income taxes.The fund is treated as a separate tax entity for federal income tax purposes.
On July 13, 2006, the FASB released FASB Interpretation No. 48 “Accounting for Uncertainty in Income Taxes” (FIN 48). FIN 48 provides guidance for how uncertain tax positions should be recognized, measured, presented and disclosed in the financial statements. FIN 48 requires the evaluation of tax positions taken or expected to be taken in the course of preparing the fund’s tax returns to determine whether the tax positions are “more-likely-than-not” of being sustained by the applicable tax authority.Tax positions not deemed to meet the more-likely-than-not threshold would be recorded as a tax benefit or expense in the current year. Adoption of FIN 48 is required for fiscal years beginning after December 15, 2006 and is to be applied to all open tax years as of the effective date.At this time, management is evaluating the implications of FIN 48 and its impact, if any, in the financial statements has not yet been determined.
At December 31, 2006, the components of accumulated earnings on a tax basis were as follows: accumulated capital losses $670,062,710 and unrealized appreciation $40,478,635.
The accumulated capital loss carryover is available to be applied against future net securities profits, if any, realized subsequent to December 31, 2006. If not applied, $460,086,756 of the carryover expires in fiscal 2009 and $209,975,954 expires in fiscal 2010.
The Fund 29
NOTES TO FINANCIAL STATEMENTS (continued)
|
The tax character of distributions paid to shareholders during the fiscal periods ended December 31, 2006 and December 31, 2005 were as follows: ordinary income $0 and $1,295,102, respectively.
During the period ended December 31, 2006, as a result of permanent book to tax differences, primarily due to the tax treatment for net operating losses, the fund increased accumulated undistributed investment income-net $525,890 and decreased paid-in capital by the same amount. Net assets were not affected by this reclassification.
NOTE 2—Bank Line of Credit:
|
The Company has a line of credit arrangement (“LOC”) with State Street Bank and Trust Company, to be used for temporary or emergency purposes, primarily for financing redemption payments.The borrowings by each series of the Company are limited to the lesser of (a) $50 million, or (b) the lesser of 25% of the series’ total net assets or the maximum amount which the series is permitted to borrow pursuant to the prospectus, any law or any other agreement. Combined borrowings are subject to the $50 million cap on the total LOC. Each series agrees to pay annual fees and interest on the unpaid balance based on prevailing market rates as defined in the LOC.
The average daily amount of borrowings outstanding under the LOC during the period ended December 31, 2006, was approximately $7,900, with a related weighted average annualized interest rate of 4.88% .
NOTE 3—Investment Advisory Fee and Other Transactions With Affiliates:
(a) In accordance with an investment advisory agreement between the Company and Founders, the fund compensates Founders for its services as investment adviser by the payment of fees computed daily and paid monthly at the annual rate equal to a percentage of the average daily value of the fund’s net assets. The fee is 1.00% of the first $30 million of net assets, .75% of the next $270 million of net assets, .70% of the next $200 million of net assets and .65% of net assets in excess of $500 million.
During the period ended December 31, 2006, the fund was advised that the Distributor retained $1,812 and $52 from sales commissions
earned on sales of the fund’s Class A and Class T shares, respectively, and $13,336 and $67 from CDSC on redemptions of the fund’s Class B and Class C shares, respectively.
(b) Under the Distribution Plan (the “Plan”) adopted pursuant to Rule 12b-1 under the Act, Class B, Class C and Class T shares pay the Distributor for distributing their shares at an annual rate of .75% of the value of their average daily net assets of Class B and Class C shares and .25% of the value of the average daily net assets of Class T shares. During the period ended December 31, 2006, Class B, Class C and Class T shares were charged $42,782, $10,084 and $173, respectively, pursuant to the Plan.
The fund has adopted a Distribution Plan pursuant to Rule 12b-1 under the Act applicable to its Class F shares. Under the plan, the fund is authorized to reimburse the Distributor for expenses paid for distributing or servicing its Class F shares at an annual rate of up to .25% of the value of the average daily net assets of the fund’s Class F shares. During the period ended December 31, 2006, Class F shares were charged $785,149 pursuant to this Distribution Plan.
(c) Under the Shareholder Services Plan, Class A, Class B, Class C and Class T shares pay the Distributor at an annual rate of .25% of the value of their average daily net assets for the provision of certain services. The services provided may include personal services relating to shareholder accounts, such as answering shareholder inquiries regarding the fund and providing reports and other information, and services related to the maintenance of shareholder accounts. The Distributor may make payments to Service Agents (a securities dealer, financial institution or other industry professional) in respect of these services. The Distributor determines the amounts to be paid to Service Agents. During the period ended December 31, 2006, Class A, Class B, Class C and Class T shares were charged $21,910, $14,261, $3,361 and $173, respectively, pursuant to the Shareholder Services Plan.
The Company has a shareholder services agreement with the Distributor, whereby the fund has agreed to compensate the Distributor for providing certain shareholder servicing functions to holders of Class F shares.
The Fund 31
NOTES TO FINANCIAL STATEMENTS (continued)
|
The fund paid the Distributor a monthly fee equal, on an annual basis, to $24.00 per Class F shareholder account considered to be an open account at any time during a given month. During the period ended December 31, 2006, Class F shares were charged $299,379 pursuant to this shareholder services agreement.
Dreyfus Transfer, Inc. (“DTI”), a wholly-owned subsidiary of Dreyfus, is the transfer and dividend disbursing agent for all of the fund’s share classes.With the exception of out-of-pocket charges, the fees charged by DTI with respect to the fund’s Class F shares are paid by the Distributor. The out-of-pocket charges from DTI are paid by the fund. During the period ended December 31, 2006, Class F shares were charged $112,650 for out-of-pocket transfer agent charges.
The fees charged by DTI with respect to the fund’s Class A, B, C, R and T shares are paid by the fund.These transfer agency fees, including both the per account fees paid to DTI and out-of-pocket charges, during the period ended December 31, 2006 were $36,985.
The fund has agreed to compensate Founders for providing accounting services, administration, compliance monitoring, regulatory and shareholder reporting, as well as related facilities, equipment and clerical help.The fee is computed at the annual rate of .06% of the average daily net assets of the fund on the first $500 million, .04% of the average daily net assets of the fund on the next $500 million and .02% of the average daily net assets of the fund in excess of $1 billion, plus reasonable out-of-pocket expenses. Founders has contractually agreed in writing to waive any fees received for these services to the extent they exceed Founders’ costs in providing the services. Effective January 1, 2007, Dreyfus replaced Founders as fund accounting and administrative services agent for the fund pursuant to an agreement containing substantially the same terms.
Mellon Bank serves as custodian for the fund.The fees for the custody services are subject to reduction by credits earned on the cash balances of the fund held by the custodian, which are shown as earnings cred-
its on the Statement of Operations. The fund could have employed these assets elsewhere to produce income had it not entered into this arrangement. The custodian contractually agreed in writing to a fee waiver for the Company during the time period and in the amount set forth below:
| Time Period | | Amount of Waiver ($) |
| |
|
| 9/1/05 to 8/31/06 | | 200,000 |
This fee waiver was allocated among the Company’s series in proportion to their respective shares of the total custodian fee. During the period ended December 31, 2006, the fund’s portion of the waiver was $0.The amount paid to Mellon Bank was $7,108.
The components of Due to Founders Asset Management LLC and affiliates in the Statement of Assets and Liabilities consist of: investment advisory fees $217,030, Rule 12b-1 distribution plan fees $95,784, shareholder services plan fees $77,042, custodian fees $1,981 and transfer agency per account fees $31,239.
(d) Annual retainer fees and attendance fees for the Company’s Board of Directors are allocated to each series of the Company based on net assets.The Company’s Board of Directors has adopted a deferred compensation plan for Company directors that enables directors to elect to defer receipt of all or a portion of the annual compensation that they are entitled to receive from the Company. Under the plan, the compensation deferred is invested in shares of one or more of the Company’s series.The amount paid to the director under the plan will be determined based upon the performance of the selected series.The current value of these amounts is included in Other Assets and Directors’ Deferred Compensation on the Statement of Assets and Liabilities. Changes in market value are included in the directors’ fees and expenses and the net change in unrealized appreciation/depreciation of investments on the Statement of Operations. Deferral of directors’ fees under the plan does not affect the net assets of the fund.
The Fund 33
NOTES TO FINANCIAL STATEMENTS (continued)
|
Certain officers of the Company are also officers and/or directors of Founders or its affiliates, which pay their compensation.The affairs of the fund, including services provided by Founders, are subject to the supervision and general oversight of the Company’s Board of Directors.
(e) Pursuant to an exemptive order from the SEC, the fund may invest its available cash balances in affiliated money market mutual funds. Management fees of the underlying money market mutual funds have been waived by Dreyfus.
NOTE 4—Securities Transactions:
|
The aggregate amount of purchases and sales of investment securities, excluding short-term securities, during the period ended December 31, 2006, amounted to $334,211,511 and $399,205,397, respectively.
At December 31, 2006, the cost of investments for federal income tax purposes was $298,405,842; accordingly, accumulated net unrealized appreciation on investments was $40,478,635, consisting of $44,068,200 gross unrealized appreciation and $3,589,565 gross unrealized depreciation.
On January 17, 2007, the fund’s Board of Directors approved, subject to shareholder approval, a Plan of Reorganization, which provides for the transfer of the fund’s assets to the Dreyfus Founders Equity Growth Fund (the “Equity Growth Fund”) in a tax-free exchange for shares of the Equity Growth Fund. If approved, the Reorganization is expected to be completed in the second quarter of 2007.
REPORT OF INDEPENDENT REGISTERED PUBLIC ACCOUNTING FIRM
To the Board of Directors and Shareholders of Dreyfus Founders Funds, Inc.
In our opinion, the accompanying statement of assets and liabilities, including the statement of investments, and the related statements of operations and of changes in net assets and the financial highlights present fairly, in all material respects, the financial position of Dreyfus Founders Growth Fund (one of the portfolios constituting Dreyfus Founders Funds, Inc., hereafter referred to as the “Fund”) at December 31,2006,the results of its operations for the year then ended,the changes in its net assets for each of the two years in the period then ended and the financial highlights for each of the five years in the period then ended, in conformity with accounting principles generally accepted in the United States of America. These financial statements and financial highlights (hereafter referred to as “financial statements”) are the responsibility of the Fund’s management; our responsibility is to express an opinion on these financial statements based on our audits.We conducted our audits of these financial statements in accordance with the standards of the Public Company Accounting Oversight Board (United States). Those standards require that we plan and perform the audit to obtain reasonable assurance about whether the financial statements are free of material misstatement.An audit includes examining, on a test basis, evidence supporting the amounts and disclosures in the financial statements, assessing the accounting principles used and significant estimates made by management, and evaluating the overall financial statement presentation.We believe that our audits, which included confirmation of securities at December 31, 2006 by correspondence with the custodian and brokers, provide a reasonable basis for our opinion.
| | PricewaterhouseCoopers LLP
New York, New York
February 23, 2007
|
The Fund 35
FACTORS CONSIDERED IN RENEWING THE ADVISORY AGREEMENT (Unaudited)
At a meeting of the board of directors of Dreyfus Founders Funds, Inc. (the “Funds” and, in reference to any one of the Funds’ portfolios, a “Fund”) held on August 9 and 10, 2006, the Funds’ directors unanimously approved the continuation of the Investment Advisory Agreement (“management agreement”) between each of the Funds and Founders Asset Management LLC, the Funds’ investment adviser (“Founders”), for a one-year term ending August 31, 2007.The board of directors of the Funds (“board”) is comprised entirely of individuals who have no affiliation with Founders or any affiliates of Founders (the “directors”).
Prior to the directors’August 2006 meeting, Founders had provided the directors with extensive materials related to the renewal of the management agreement, including performance and expense information for other investment companies with similar investment objectives to each Fund derived from data compiled by Lipper Inc., an independent third party (“Lipper”).
During their meeting, the directors discussed the proposed continuance of the management agreement with the senior management personnel of Founders. At the conclusion of these discussions, the directors and their independent counsel met in a private session at which no representatives of Founders were present, to continue their discussion of continuance of the agreement. In determining to continue the management agreement, the directors considered all factors which they believed to be relevant, including the following:
Nature, Extent and Quality of Services Provided and to be Provided by Founders
The directors recognized that they have had the opportunity to evaluate the investment and non-investment related services which Founders provides to the Funds primarily through their quarterly review of all of the operations of the Funds during Fund committee and Fund board meetings held throughout the past twelve months.At each such meeting, extensive discussions of Fund operations are held with senior management personnel of Founders and a large volume of documentation
with respect to these operations is provided to and reviewed by the directors. Such discussions and documentation afford the directors the continual opportunity to evaluate the nature, extent, and quality of the services provided by Founders and its affiliates to the Funds.
The directors were satisfied that Founders is managing the investment of the assets of the Funds in accordance with each Fund’s respective investment objective, policies and restrictions, subject to the directors’ overall supervision.
The directors considered that Founders also provides many non-investment related services to the Funds in fulfilling its responsibilities under the management agreement.
Following their discussion and review, the directors reached the following conclusions:
- That the breadth and quality of investment advisory and other ser- vices being provided to the Funds are satisfactory, as evidenced in part by the performance records of the Funds, to which the direc- tors gave significant attention as indicated below; and
- That the directors are satisfied not only with the research, long-term portfolio management, and trading services being provided to the Funds, but also recognize that Founders or its affiliates have pro- vided the highest quality accounting, compliance and regulatory, administrative, underwriting, custody, shareholder, transfer agent and cash management services to the Funds, while charging fair, reason- able and competitive fees.
On a quarterly basis, the directors hold in-person meetings with representatives of the portfolio management team for each Fund (usually a portfolio manager), during which each representative reviews, among other items, performance information, attribution analyses, and the portfolio manager’s investment outlook.The directors also receive written monthly and quarterly performance information for each Fund.
The Fund 37
FACTORS CONSIDERED IN RENEWING THE
ADVISORY AGREEMENT (Unaudited) (continued)
|
In conjunction with their consideration of renewal of the management agreement, the directors received a more detailed performance report about each Fund from Lipper.These reports compared each Fund’s performance to both a relatively small group of similar funds selected by Lipper (the “Lipper performance group”), as well as to all funds in the applicable Lipper category (the “Lipper performance universe”).
Growth Fund’s performance for the one-year period ended December 31, 2005 placed it in the fourth quintile of both its Lipper performance group and the Lipper large-cap growth fund performance universe.The Fund’s performance within its Lipper-selected group and universe for the three-year period ended December 31, 2005 had placed it in the third and second quintiles, respectively. For the six-month and one-, three- and five-year periods ended June 30, 2006, the Fund’s performance placed it in the top two quintiles of its Lipper performance universe.The directors deemed these more recent relative performance results to be satisfactory, but stressed the importance to Founders of the need to seek to maintain the Fund’s strong performance record.
After consideration of all relevant information and data, the directors concluded that although past performance cannot be a guaranty of future performance, each Fund and its shareholders would continue to benefit from Founders’ investment management of the Fund. The directors further determined:
- That although certain of the Funds have experienced performance difficulties, Founders has focused its efforts upon improving the per- formance records of the Funds and will continue to seek improve- ment; and
- That the materials provided by Lipper demonstrated that most of the Funds maintained satisfactory performance quintile rankings in their respective comparison groups and comparison universes, with six of the eight Funds placing in the top two quintiles of their respective Lipper performance universes for the three-years ended December 31, 2005, and five of the eight Funds placing in the top two quintiles for the six months ended June 30, 2006.
Costs of the Services to be Provided and Profits to be Realized by Founders and Its Affiliates from Founders’ Relationship With the Funds
The directors recognized that on a quarterly basis, they receive information with respect to each Fund’s expenses. The directors carefully review and discuss the expense ratios for all classes of shares of each Fund at each of their quarterly meetings throughout the year.
In conjunction with their annual consideration of renewal of the Funds’ management agreement and other service arrangements, the directors received information from Lipper which included graphs for each Fund that provided outlines of contractual management fees at common asset levels, actual management fees, actual non-management expenses and actual total Fund expenses, each graph comparing the relevant information of each Fund with each Fund’s Lipper performance group.
The directors noted that for the period ended December 31, 2005, Growth Fund’s management fees ranked in the second best quintile of its Lipper performance group, with the Fund’s fees the sixth lowest of 15 “peer funds.” The Fund’s contractual management fees at a common asset level were determined by Lipper to be lower than 10 of the 15 funds in its group.The Fund’s management fees were in the fourth quin-tile of its Lipper expense universe.
The directors also considered a brochure provided by Lipper which included information with respect to the profitability of the mutual fund advisory activities conducted by a number of publicly-held corporations. Lipper also prepared an analysis providing detailed information with respect to the types of services rendered to various mutual fund complexes under their respective investment advisory contracts.
The directors had been provided with extensive materials with respect to the profitability derived by Founders from providing investment advisory and other services to the Funds as a group and to each Fund individually.
The Fund 39
FACTORS CONSIDERED IN RENEWING THE
ADVISORY AGREEMENT (Unaudited) (continued)
|
The directors further considered certain indirect benefits received by Founders and its affiliates from providing investment advisory services to the Funds.These included the following:
- Since Founders manages several non-Fund accounts in a style that is similar to that used for certain of the Funds, Founders and its affil- iates realize certain efficiencies in performing the portfolio manage- ment, trading and operational functions related to those accounts;
- The Funds’ brokerage transactions may be executed with brokers that provide research and brokerage services to Founders and its affiliates.
These research and brokerage services may be useful to Founders and its affiliates in providing investment services to any of the clients they advise, not just the Funds; and - Founders receives fees for providing accounting services to the Funds, and affiliates of Founders receive various fees for providing underwriting, shareholder, transfer agency, custody and cash man- agement services to the Funds.
The directors also reviewed a table listing the Funds and corresponding subadvisory accounts managed by Founders, and their respective fee schedules. In their review of this table, the directors noted that Founders provides many services to the Funds in fulfilling its responsibilities under the management agreement that it does not provide to entities for which Founders has assumed subadvisory duties. The directors concluded that the fees paid to Founders under the management agreement are reasonable in relation to the nature and extent of the services provided by Founders to the Funds under the agreement.
After deliberation and discussion of Fund fees and expenses, the directors determined:
- That upon review of the advisory fee structures of the Funds in comparison with the competitive performance groups selected by Lipper, the levels of investment advisory fees paid by the Funds were deemed to be acceptable;
- That the expense ratios of the Funds are acceptable and that Founders continually reviews each Fund’s total expense ratio and has initiated voluntarily expense caps and fee waivers for certain Funds to reduce their expense ratios;
- That the majority of the Funds’ expense ratios increased in 2005 from those experienced in 2004, primarily as a result of declines in Fund assets; and
- That the comparative fee and expense information included in the materials provided by Lipper supports the determination that the advisory and other fees payable by the Funds to Founders and its affiliates are essentially fees which would be similar to those which would have resulted solely from “arm’s-length” bargaining.
With respect to profitability to Founders, the directors reviewed the adviser profitability analysis provided by Lipper, which demonstrated that Founders’ 2005 profitability from providing management services to the Funds was reasonable in comparison to the entities included in the Lipper analysis.
The directors were also advised by independent counsel of the profitability percentage ranges determined by court cases to be acceptable and determined that Founders’ profitability percentage for providing management and other services to the Funds was reasonable.
The directors concluded that Founders’ profits from providing management services to the Funds were reasonable in relationship to the overall services which Founders provides.
Economies of Scale
The directors reviewed information provided by Founders which summarized the extent, if any, that both Founders and the Funds would achieve certain economies of scale if the assets of the Funds were to increase.
The Fund 41
FACTORS CONSIDERED IN RENEWING THE
ADVISORY AGREEMENT (Unaudited) (continued)
|
After review and discussion, the directors considered the extent to which economies of scale and common management are shared with each Fund, including the economies that would be realized from the growth of each Fund’s assets. After such consideration, the directors determined that all of the Funds have structured breakpoints in their advisory fees, which result in fee reductions as the assets of each Fund reach defined levels, and that such fee reductions, when implemented, would benefit all of the applicable Fund’s shareholders through decreases in the Fund’s expense ratio.
Dedication to Regulatory Requirements and Restrictions
An important factor in the directors’ consideration of renewal of the Funds’ management agreement with Founders included the directors’ recognition of the dedication by Founders of stringent adherence to regulatory requirements and restrictions.The directors determined that Founders is dedicated to compliance with all applicable rules and regulations and that the systems of controls which are in place to ensure that the service providers to the Funds, including Founders, and the Funds themselves, maintain strict adherence to the law are excellent.
The directors determined that they are generally satisfied with the performance of the Funds and with the quality of the advisory and other services being provided by Founders and its affiliates to the Funds.The directors recognized that overall Fund performance has improved in recent years and that efforts are being and will continue to be made to enhance such improvements and to maintain Fund expense ratios at reasonable and acceptable levels.
The directors concluded that continuation of the current management agreement between each Fund and Founders, which would enable each Fund to continue to receive investment advisory services from Founders, is in the best interests of each Fund and its shareholders, the services to be performed under the management agreement are services required for the operations of the Funds, Founders has provided satisfactory investment management services to the Funds in the past, and the fees for the management services which Founders will perform will be within the range of what would have been negotiated at arm’s length in light of the circumstances.
The Fund 43
YOUR BOARD REPRESENTATIVES (Unaudited)
The Board of Directors of the Company oversees all 8 Dreyfus Founders Funds.The business and affairs of the Company are managed under the direction of the Board. The directors serving on the Board perform their responsibilities in the manner which they reasonably believe to be in the best interests of the Funds and their shareholders.
All of the directors,as listed below,are independent directors.They are not affiliated with the Fund ‘s adviser, its parent company, or its affiliates.The directors have no official term of office and generally serve until they retire (normally at age 75, but subject to extension to age 80), resign, or are not re-elected.As you can see from their backgrounds, the directors have broad experience as active or former business and community leaders.
Eugene H.Vaughan, CFA, 73.Year elected to the Board: 1970
Board Chairman. Founding Chairman,Vaughan Nelson Investment Management, LP, an investment counseling firm. Director, Encore Bank, Houston. Founding Chairman, Center for Houston’s Future, a non-profit organization. Founding Chairman and former Governor, CFA Institute. Past Chairman and Trustee, Institute of Chartered Financial Analysts. Past Chairman and Director, Financial Analysts Federation. Chairman-elect, University of Texas Health Science Center.
Alan S. Danson, 67.Year elected to the Board: 1991
Private investor. Formerly, President and Director, D.H. Management, Inc., the general partner of a limited partnership with technology company holdings (1996 to 2003). Director, Gore Range Natural Science School and The Les Streeter Program, Inc., both of which are non-profit organizations.
Robert P. Mastrovita, 62.Year elected to the Board: 1998
Private investor. Chairman of a private charitable foundation (1997 to present). Formerly, Chairman and Director, Hagler, Mastrovita & Hewitt, Inc., a registered investment adviser (1982 to 1997). Member, Boston Society of Security Analysts. Trustee, Partridge Academy.
Trygve E. Myhren, 70.Year elected to the Board: 1996
President, Myhren Media, Inc., a firm that invests in and advises media, telecommunications, Internet and software companies. Special Limited Partner and member of Investment Committee, Megunticook Funds, a venture capital firm (1998 to present). Director,Advanced Marketing Services, Inc.Trustee and Chairman of Finance Committee, the University of Denver.Trustee, Denver Art Museum. Member, Cable
Television Hall of Fame. Formerly, President (1990 to 1996) and Director (1992 to 2001) of the Providence Journal Company, a diversified media and communications company. Formerly, Chairman and Chief Executive Officer of American Television and Communications Corporation (now Timer Warner Cable) (1981 to 1988). Formerly, Chairman of the National Cable Television Association (1986-1987).
George W. Phillips, 68.Year elected to the Board: 1998
Retired.Vice Chairman of the Board, Chairman of the Finance Committee, and Chairman of the Investment Committee, Children’s Medical Center of Boston. Formerly, President and Chief Executive Officer (1992 to 1997) and Director (1992 to 2002) of Warren Bancorp, Inc. Formerly, President, Chief Executive Officer and Director of Warren Five Cents Savings Bank (1992 to 1997).
Martha A. Solis-Turner, 46.Year elected to the Board: 2005
Formerly, Telecommunications Director, Wholesale Markets (1995 to 2001), and Manager (1990 to 1995), Qwest Communications International Inc. Board member and Treasurer, Mile High Montessori Early Learning Centers (2002 to present), and formerly, Board member (1995 to 2004) and Vice President (2002 to 2004), Curtis Park Community Center, both of which are non-profit organizations.
Thomas F. Eggers, 54. President and Principal Executive Officer of the Funds since 2006. Founders’ Chairman of the Board, President and Chief Executive Officer. President, Chief Executive Officer and a Director of Dreyfus. Chairman of the Board and Chief Executive Officer of the Distributor since 2005. Formerly, President of Scudder Investments (2002 to 2005). Previously employed by Dreyfus from 1996 to 2002, including as President from 2001 to 2002.
David L. Ray, 49.Vice President of the Funds since 2000, and from 1990 to 1998. Founders’ Senior Vice President, Chief Operating Officer and Treasurer. Vice President of the Distributor since 2003. Employed by Founders and its predecessor company since 1990. Formerly,Treasurer of the Funds (1990 to 1998).
Kenneth R. Christoffersen, 51. Secretary of the Funds since 2000, and from 1996 to 1998. Founders’ Senior Vice President-Legal, General Counsel and Secretary. Assistant Secretary of the Distributor since 2003. Employed by Founders and its predecessor company since 1996.
The Fund 45
YOUR BOARD REPRESENTATIVES (Unaudited) (continued)
Jennifer L. Carnes, 35. Treasurer, Principal Financial Officer and Principal Accounting Officer of the Funds since 2006. Manager of Fund Administration for Founders since 2006. Formerly, Founders’ Supervisor of Corporate Actions and Pricing (2002 to 2006), and Corporate Actions and Pricing Specialist (2000 to 2002).
Janelle E. Belcher, 48. Chief Compliance Officer of the Funds since 2004 and Assistant Secretary of the Funds since 2002. Founders’ Vice President - Compliance since 2002. Formerly, Founders’ Manager of Compliance (2000 to 2002) and Securities Compliance Examiner, Staff Accountant and Team Leader for the U.S. Securities and Exchange Commission (1990 to 2000).
Eric D. Naviloff, 38. Assistant Treasurer since 2006. Senior Accounting Manager -Taxable Fixed-Income Funds of Dreyfus, and an officer of 91 investment companies (comprised of 205 portfolios) managed by Dreyfus. Employed by Dreyfus since 1992.
Robert S. Robol, 42.Assistant Treasurer since 2006. Senior Accounting Manager -Money Market and Municipal Bond Funds of Dreyfus, and an officer of 91 investment companies (comprised of 205 portfolios) managed by Dreyfus. Employed by Dreyfus since 1988.
Robert Svagna, 39. Assistant Treasurer since 2006. Senior Accounting Manager -Equity Funds of Dreyfus, and an officer of 91 investment companies (comprised of 205 portfolios) managed by Dreyfus. Employed by Dreyfus since 1990.
William G. Germenis, 36.Anti-Money Laundering Compliance Officer (“AMLCO”) for the Class A, Class B, Class C, Class R, and Class T shares of the Funds since 2002 and for the Class F shares of the Funds since 2003.Vice President and AMLCO of MBSC, LLC since 2002.Vice President and AMLCO of the Distributor and AMLCO of investment companies managed by Dreyfus. Employed by the Distributor since 1998.
The directors and officers may be contacted at Founders’ address appearing on the back cover, except for Messrs. Eggers, Naviloff, Robol, Svagna and Germenis, who can be contacted at The Dreyfus Corporation, 200 Park Avenue, New York, New York 10166.Additional information about the Company’s directors is available in the Statement of Additional Information, which can be obtained free of charge by calling 1-800-525-2440 (Class F shareholders) or 1-800-554-4611 (all other shareholders).
NOTES
For Class F shareholders
Telephone Call your financial representative or 1-800-525-2440
| Mail | | Dreyfus Founders Funds, Inc. |
| | | P.O. Box 55360, Boston, MA 02205-8252 |
| |
|
| |
| For Class A, B, C, R and T shareholders |
| Telephone Call your financial representative or 1-800-554-4611 |
| Mail | | Dreyfus Founders Funds, Inc. |
| | | 144 Glenn Curtiss Boulevard, Uniondale, NY 11556-0144 |
| | |
The fund files its complete schedule of portfolio holdings with the Securities and Exchange Commission (“SEC”) for the first and third quarters of each fiscal year on Form N-Q. The fund’s Forms N-Q are available on the SEC’s website at http://www.sec.gov and may be reviewed and copied at the SEC’s Public Reference Room in Washington, DC. Information on the operation of the Public Reference Room may be obtained by calling 1-800-SEC-0330.
A description of the policies and procedures that the fund uses to determine how to vote proxies relating to portfolio securities, and information regarding how the fund voted these proxies for the 12-month period ended June 30, 2006, is available at http://www.founders.com, http://www.dreyfus.com and on the SEC’s website at http://www.sec.gov. The description of the policies and procedures is also available without charge, upon request, by calling 1-800-645-6561.
This report and the statements it contains are submitted for the general information of our shareholders. The report is not authorized for distribution to prospective investors unless preceded or accompanied by an effective prospectus.
| Founders and Founders Funds are registered trademarks |
| of Founders Asset Management LLC. |
| |
| © 2007 Dreyfus Service Corporation |


Save time. Save paper. View your next shareholder report online as soon as it’s available. To take advantage of this service, simply inform us online of your decision to receive materials through our E-Communications Program. Cut down on mailbox clutter and help the Fund reduce printing and postage charges by enrolling today. It’s simple and only takes a few minutes.
Class F shareholders can log into www.founders.com/ ecommunications, or www.icsdelivery.com if you own funds through a third party.
Class A, B, C, R and T shareholders can log into www.dreyfus.com.
The views expressed in this report reflect those of the portfolio managers only through the end of the period covered and do not necessarily represent the views of Founders or any other person in the Founders organization.Any such views are subject to change at any time based upon market or other conditions and Founders disclaims any responsibility to update such views.These views may not be relied on as investment advice and, because investment decisions for a Dreyfus Founders Fund are based on numerous factors, may not be relied on as an indication of trading intent on behalf of any Dreyfus Founders Fund.
Not FDIC-Insured • Not Bank-Guaranteed • May Lose Value
| Contents |
| |
| | | THE FUND |
| |
|
| 2 | | A Letter from the President |
| 3 | | Discussion of Fund Performance |
| 6 | | Fund Performance |
| 8 | | Understanding Your Fund’s Expenses |
| 8 | | Comparing Your Fund’s Expenses |
| With Those of Other Funds |
| 9 | | Statement of Investments |
| 14 | | Statement of Assets and Liabilities |
| 15 | | Statement of Operations |
| 16 | | Statement of Changes in Net Assets |
| 19 | | Financial Highlights |
| 25 | | Notes to Financial Statements |
| 38 | | Report of Independent Registered |
| | | Public Accounting Firm |
| 39 | | Important Tax Information |
| 40 | | Factors Considered in Renewing |
| the Advisory Agreement |
| 48 | | Your Board Representatives |
| |
| FOR MORE INFORMATION |
|
| | | Back Cover |
| Dreyfus Founders |
| International Equity Fund |
The Fund

A LETTER FROM THE PRESIDENT
We are pleased to present this annual report for Dreyfus Founders International Equity Fund, covering the 12-month period from January 1, 2006, through December 31, 2006.
2006 proved to be a good year for the financial markets, with most economic sectors and geographic regions of the global equity markets generating strong returns.A number of positive factors contributed to gains in international developed and developing markets, including an expanding global economy, rising commodity prices, financial reforms in key emerging markets, falling trade barriers, rising standards of living and robust corporate profits.
In our analysis, 2006 provided an excellent reminder of the need for a long-term investment perspective. Adopting too short a time frame proved costly for some investors last year, as chasing recent winners sometimes meant buying the next month’s losers. Indeed, history shows that reacting to near-term developments with extreme shifts in strategy rarely is the right decision.We believe that a better course of action is to set a portfolio mix to meet future goals, while attempting to ignore short term market fluctuations in favor of a longer-term view.
For information about how the fund performed during the reporting period, as well as market perspectives, we have provided a Discussion of Fund Performance given by the fund’s portfolio managers.
Thank you for your continued confidence and support.We wish you good health and prosperity in 2007.


DISCUSSION OF FUND PERFORMANCE
Remi J. Browne, CFA, and Jeffrey R. Sullivan, CFA, Portfolio Managers
How did Dreyfus Founders International Equity Fund perform relative to its benchmarks?
The fund produced total returns of 25.20% for Class A Shares, 24.32% for Class B Shares, 24.32% for Class C Shares, 25.27% for Class F Shares, 25.54% for Class R Shares and 24.95% for Class T Shares for the 12-month period ended December 31, 2006.1 In comparison, the fund’s benchmarks, the Morgan Stanley Capital International (MSCI) World ex U.S. Index (the “Primary Index”) and the MSCI World ex U.S. Growth Index (the “Secondary Index”), produced total returns of 25.71% and 22.10%, respectively, for the same time period.2,3
During the reporting period, international equity markets continued their upward climb in 2006, supported by strong economic data and robust mergers-and-acquisitions (M&A) activity in Europe.The fund benefited from the favorable European investment environment, as holdings across several sectors and countries boosted returns, enabling the fund to post competitive returns relative to its Primary Index, but handily beat its Secondary Index.
What is the fund’s investment approach?
To pursue its goal of long-term growth of capital, the fund normally invests at least 80% of its assets in equity securities in foreign companies characterized as “growth” companies. Although the fund intends to invest its assets outside the United States, it may invest in U.S.-based companies.We employ a “bottom-up” approach that emphasizes individual stock selection. We do not attempt to predict interest rates or market movements. Rather, we choose investments on a company-by-company basis, searching for what we believe are well-managed, well-positioned companies.
The Fund 3
DISCUSSION OF FUND PERFORMANCE (continued)
|
What other factors influenced the fund’s performance?
Europe proved to be a primary driver of performance for the fund and its benchmarks in 2006, as continued increases in economic growth and M&A activity fueled rising equity markets. Conversely, the Japanese market underperformed in 2006 as the Bank of Japan raised interest rates and ended its ultra loose monetary policy.
We attribute the fund’s relative performance mainly to the success of our stock selection strategy. Holdings in the materials, telecommunication services and consumer staples sectors were among the stronger contributors to the fund’s relative performance. From a country perspective, stocks in the United Kingdom, Germany and Hong Kong helped boost the fund’s relative returns. However, weak security selections in the consumer discretionary and industrials sectors proved to be a drag on relative performance, as were some holdings in France,Australia and Sweden.
Overall, the fund’s holdings in the materials and telecommunication services sectors ranked among its top performers in 2006. In the materials sector, U.K. metals and mining company Xstrata performed well due to rising commodity prices and a beneficial Canadian acquisition, which transformed the company into a truly diversified mining concern and boosted its stock price in the second half of the year. The stock price of German-based steel producer ThyssenKrupp rose amid vigorous M&A activity within its industry, as rumors of a takeover bid for the company persisted.
Telecommunication-services holding China Mobile also aided the fund’s relative performance, as the Hong Kong-based company increased its market share in China, leading to solid profit growth. Finally, telecommunications services provider Telenor’s stock price climbed mainly due to strong performance from its Russian subsidiary.
Japanese consumer discretionary holdings were responsible for a large portion of the fund’s underperforming stocks during the reporting period. Electronics retailer Yamada Denki, which was sold during the reporting period, lost value when investors took profits in the previously strong-performing stock. Sony’s stock was sold during the reporting
period in the wake of two detrimental announcements: a laptop battery recall and a delay in the initial launch date of its next-generation gaming system, PlayStation 3. In the industrials sector, EADS, a French-listed aerospace company, underperformed due to news of production delays and cost overruns for its Airbus A380 commercial airliner. Japanese industrials holding Sumitomo Electric Industries, maker of cable systems for automobiles, hampered the fund’s relative returns as rising commodity costs, specifically copper, weighed on the company’s financial results. Consequently, we sold our position of Sumitomo Electric Industries before the end of the reporting period.
What is the fund’s current strategy?
We have maintained our strategy of allocating the fund’s assets to various geographical and market sectors in proportions that roughly match those of the benchmark, which we believe enables us to add value through our bottom-up security selection process.We continue to look for companies that combine above average earnings growth with strong business momentum that trade at reasonable valuations.
| | | Investing in foreign companies involves special risks, including changes in currency rates, |
| | | political, economic and social instability, a lack of comprehensive company information, |
| | | differing auditing and legal standards and less market liquidity. An investment in this fund |
| | | should be considered only as a supplement to an overall investment program. |
| 1 | | Total return includes reinvestment of dividends and any capital gains paid, and does not take into |
| | | consideration the maximum initial sales charges in the case of Class A and Class T shares, or the |
| | | applicable contingent deferred sales charges imposed on redemptions in the case of Class B and |
| | | Class C shares. Had these charges been reflected, returns would have been lower. Past performance |
| | | is no guarantee of future results. Share price and investment return fluctuate such that upon |
| | | redemption, fund shares may be worth more or less than their original cost. Return figures |
| | | provided reflect the absorption of certain fund expenses by Founders Asset Management LLC, |
| | | pursuant to a permanent contractual agreement. Had these expenses not been absorbed, the fund’s |
| | | returns would have been lower. |
| 2 | | SOURCE: LIPPER, INC. – Reflects reinvestment of net dividends and, where applicable, |
| | | capital gain distributions.The Morgan Stanley Capital International (MSCI) World ex U.S. |
| | | Index is an unmanaged index of global stock market performance, excluding the United States, |
| | | consisting solely of equity securities. |
| 3 | | SOURCE: Morgan Stanley Capital International Inc. – Reflects reinvestment of dividends and, |
| | | where applicable, capital gain distributions.The Morgan Stanley Capital International (MSCI) |
| | | World ex U.S. Growth Index measures global developed market equity performance of growth |
| | | securities outside of the United States. |
The Fund 5
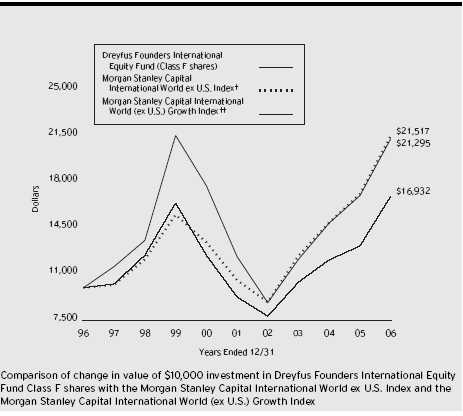
| † | | Source: Lipper Inc. |
| †† | | Source: Morgan Stanley Capital International Inc. |
| Past performance is not predictive of future performance. |
| The above graph compares a $10,000 investment made in Class F shares of Dreyfus Founders International Equity |
| Fund on 12/31/96 to a $10,000 investment made in each of the Morgan Stanley Capital International World ex |
| U.S. Index (the “MSCI World (ex U.S.) Index”) and the Morgan Stanley Capital International World ex U.S. |
| Growth Index (the “MSCI World (ex U.S.) Growth Index”) on that date. All dividends and capital gain distributions |
| are reinvested. Performance for Class A, Class B, Class C, Class R and Class T shares will vary from the performance |
| of Class F shares shown above due to differences in charges and expenses. |
| The fund’s performance shown in the line graph takes into account all applicable Class F fees and expenses (after any |
| expense reimbursements).The MSCI World (ex U.S.) Index measures global developed market equity performance |
| outside of the U.S.The MSCI World (ex U.S.) Growth Index measures global developed market equity performance of |
| growth securities outside of the U.S.The indices do not take into account charges, fees and other expenses. Further |
| information relating to fund performance, including expense reimbursements, if applicable, is contained in the Financial |
| Highlights section of the prospectus and elsewhere in this report. |
| Average Annual Total Returns as of 12/31/06 | | | | | | |
| |
| | | Inception | | | | | | | | From |
| | | Date | | 1 Year | | 5 Years | | 10 Years | | Inception |
| |
| |
| |
| |
| |
|
| Class A shares | | | | | | | | | | |
| with maximum sales charge (5.75%) | | 12/31/99 | | 18.00% | | 10.12% | | — | | (1.05)% |
| without sales charge | | 12/31/99 | | 25.20% | | 11.43% | | — | | (0.21)% |
| Class B shares | | | | | | | | | | |
| with applicable redemption charge † | | 12/31/99 | | 20.32% | | 10.36% | | — | | (0.85)% |
| without redemption | | 12/31/99 | | 24.32% | | 10.62% | | — | | (0.85)% |
| Class C shares | | | | | | | | | | |
| with applicable redemption charge †† | | 12/31/99 | | 23.32% | | 10.60% | | — | | (0.98)% |
| without redemption | | 12/31/99 | | 24.32% | | 10.60% | | — | | (0.98)% |
| Class F shares | | 12/29/95 | | 25.27% | | 11.48% | | 7.85% | | N/A |
| Class R shares | | 12/31/99 | | 25.54% | | 11.81% | | — | | 0.09% |
| Class T shares | | | | | | | | | | |
| with applicable sales charge (4.5%) | | 12/31/99 | | 19.33% | | 10.18% | | — | | (1.10)% |
| without sales charge | | 12/31/99 | | 24.95% | | 11.20% | | — | | (0.45)% |
Past performance is not predictive of future performance.The fund’s performance shown in the graph and table does not reflect the deduction of taxes that a shareholder would pay on fund distributions or the redemption of fund shares, but does reflect fee waivers and expense limitations. Performance for Class B shares assumes the conversion of Class B shares to Class A shares at the end of the sixth year following the date of purchase.
| † | | The maximum contingent deferred sales charge for Class B shares is 4%. After six years Class B shares convert to |
| | | Class A shares. |
| †† | | The maximum contingent deferred sales charge for Class C shares is 1% for shares redeemed within one year of the |
| | | date of purchase. |
The Fund 7
UNDERSTANDING YOUR FUND’S EXPENSES (Unaudited)
As a mutual fund investor, you pay ongoing expenses, such as management fees and other expenses. Using the information below, you can estimate how these expenses affect your investment and compare them with the expenses of other funds.You also may pay one-time transaction expenses, including sales charges (loads) and redemption fees, which are not shown in this section and would have resulted in higher total expenses. For more information, see your fund's prospectus or talk to your financial advisor.
Review your fund’s expenses
|
The table below shows the expenses you would have paid on a $1,000 investment in Dreyfus Founders International Equity Fund from July 1, 2006 to December 31, 2006. It also shows how much a $1,000 investment would be worth at the close of the period, assuming actual returns and expenses.To estimate the expenses you paid on your account over this period, simply divide your account value by $1,000 (for example, an $8,600 account value divided by $1,000 = 8.60), then multiply the results by the number in the Expenses paid per $1,000 line for the class of shares you own.
| Expenses and Value of a $1,000 Investment | | | | | | |
| assuming actual returns for the six months ended December 31, 2006 | | | | |
| | | Class A | | Class B | | Class C | | Class F | | Class R | | Class T |
| |
| |
| |
| |
| |
| |
|
| Expenses paid | | | | | | | | | | | | |
| per $1,000 † | | $ 7.45 | | $ 11.47 | | $ 11.47 | | $ 7.45 | | $ 6.05 | | $ 8.79 |
| Ending value | | | | | | | | | | | | |
| (after expenses) | | $1,140.80 | | $1,136.60 | | $1,136.40 | | $1,140.80 | | $1,141.80 | | $1,139.60 |
| COMPARING YOUR FUND’S EXPENSES |
| WITH THOSE OF OTHER FUNDS (Unaudited) |
Using the SEC’s method to compare expenses
The Securities and Exchange Commission (SEC) has established guidelines to help investors assess fund expenses. Per these guidelines, the table below shows your fund's expenses based on a $1,000 investment, assuming a hypothetical 5% annualized return. You can use this information to compare the ongoing expenses (but not transaction expenses or total cost) of investing in the fund with those of other funds.All mutual fund shareholder reports will provide this information to help you make this comparison. Please note that you cannot use this information to estimate your actual ending account balance and expenses paid during the period.
| Expenses and Value of a $1,000 Investment |
| assuming a hypothetical 5% annualized return for the six months ended December 31, 2006 |
| | | Class A | | Class B | | Class C | | Class F | | Class R | | Class T |
| |
| |
| |
| |
| |
| |
|
| Expenses paid | | | | | | | | | | | | |
| per $1,000 † | | $ 7.02 | | $ 10.82 | | $ 10.82 | | $ 7.02 | | $ 5.70 | | $ 8.29 |
| Ending value | | | | | | | | | | | | |
| (after expenses) | | $1,018.25 | | $1,014.47 | | $1,014.47 | | $1,018.25 | | $1,019.56 | | $1,016.99 |
| † Expenses are equal to the fund’s annualized expense ratio of 1.38% for Class A shares, 2.13% for Class B shares, |
| 2.13% for Class C shares, 1.38% for Class F shares, 1.12% for Class R shares and 1.63% for Class T shares; |
| multiplied by the average account value over the period, multiplied by 184/365 (to reflect the one-half year period). |
STATEMENT OF INVESTMENTS
December 31, 2006
|
| Common Stocks—97.1% | | Shares | | Value ($) |
| |
| |
|
| Australia—3.2% | | | | |
| BHP Billiton | | 39,500 | | 788,834 |
| Orica | | 19,300 | | 370,196 |
| QBE Insurance Group | | 14,000 | | 318,817 |
| | | | | 1,477,847 |
| Belgium—2.9% | | | | |
| Delhaize Group | | 5,900 | | 491,829 |
| InBev | | 12,900 | | 850,407 |
| | | | | 1,342,236 |
| Canada—5.4% | | | | |
| Bank of Nova Scotia | | 5,200 | | 232,320 |
| Canadian National Railway | | 13,500 | | 579,638 |
| Cognos | | 6,400 a | | 271,937 |
| IPSCO | | 4,500 | | 422,853 |
| Teck Cominco, Cl. B | | 6,800 | | 512,558 |
| TransCanada | | 6,900 | | 240,286 |
| Yellow Pages Income Fund (Units) | | 22,900 | | 252,732 |
| | | | | 2,512,324 |
| China—1.0% | | | | |
| Foxconn International Holdings | | 138,000 a | | 454,187 |
| Denmark—1.8% | | | | |
| Carlsberg, Cl. B | | 4,360 | | 433,005 |
| Novo Nordisk, Cl. B | | 5,000 | | 416,460 |
| | | | | 849,465 |
| Finland—.5% | | | | |
| Neste Oil | | 7,100 | | 215,845 |
| France—9.6% | | | | |
| BNP Paribas | | 5,607 | | 611,733 |
| Capgemini | | 4,000 | | 251,073 |
| Groupe Danone | | 3,100 | | 469,777 |
| PPR | | 1,700 | | 254,029 |
| Sanofi-Aventis | | 2,670 | | 246,540 |
| Schneider Electric | | 4,100 | | 455,165 |
| Societe Generale | | 3,900 | | 662,055 |
| Total | | 9,932 | | 716,499 |
| Vivendi | | 19,700 | | 770,005 |
| | | | | 4,436,876 |
The Fund 9
STATEMENT OF INVESTMENTS (continued)
|
| Common Stocks (continued) | | Shares | | Value ($) |
| |
| |
|
| Germany—4.9% | | | | |
| BASF | | 6,300 | | 614,157 |
| Bayerische Motoren Werke | | 4,000 | | 230,216 |
| E.ON | | 2,000 | | 272,695 |
| MAN | | 4,300 | | 388,592 |
| Merck | | 4,380 | | 455,201 |
| ThyssenKrupp | | 6,500 | | 306,231 |
| | | | | 2,267,092 |
| Greece—.5% | | | | |
| Alpha Bank | | 7,300 | | 220,672 |
| Hong Kong—1.8% | | | | |
| China Mobile | | 64,100 | | 555,023 |
| Esprit Holdings | | 25,000 | | 279,785 |
| | | | | 834,808 |
| Ireland—1.5% | | | | |
| Allied Irish Banks | | 8,900 | | 264,339 |
| C & C Group | | 25,100 | | 445,641 |
| | | | | 709,980 |
| Italy—2.8% | | | | |
| ENI | | 19,200 | | 645,787 |
| Intesa Sanpaolo | | 82,600 | | 637,859 |
| | | | | 1,283,646 |
| Japan—22.0% | | | | |
| Ajinomoto | | 19,000 | | 251,141 |
| Canon | | 18,000 | | 1,013,403 |
| Fujitsu | | 45,000 | | 353,178 |
| Honda Motor | | 23,400 | | 924,163 |
| Matsushita Electric Industrial | | 11,000 | | 219,529 |
| Mitsubishi | | 30,900 | | 581,623 |
| Mitsubishi Electric | | 66,300 | | 605,032 |
| Mitsui & Co. | | 35,000 | | 523,507 |
| Mitsui Chemicals | | 38,000 | | 292,492 |
| Mizuho Financial Group | | 27 | | 192,849 |
| Nikon | | 16,000 | | 350,910 |
| ORIX | | 3,070 | | 888,715 |
| Pacific Management | | 83 | | 182,034 |
| Shin-Etsu Chemical | | 9,000 | | 602,748 |
| |
| |
| 10 | | | | |
| Common Stocks (continued) | | Shares | | Value ($) |
| |
| |
|
| Japan (continued) | | | | |
| SUMCO | | 5,500 | | 464,938 |
| Sumitomo Trust & Banking | | 42,000 | | 440,452 |
| Takeda Pharmaceutical | | 5,400 | | 370,724 |
| TDK | | 3,100 | | 246,427 |
| Tokyo Electron | | 8,000 | | 630,562 |
| Toshiba | | 35,000 | | 227,932 |
| Toyota Motor | | 12,500 | | 836,099 |
| | | | | 10,198,458 |
| Netherlands—3.9% | | | | |
| ASML Holding | | 10,100 a | | 251,183 |
| Heineken | | 4,600 | | 218,782 |
| ING Groep | | 24,200 | | 1,073,035 |
| SBM Offshore | | 7,800 | | 268,220 |
| | | | | 1,811,220 |
| Norway—2.2% | | | | |
| Orkla | | 6,600 | | 373,653 |
| Telenor | | 35,300 | | 663,800 |
| | | | | 1,037,453 |
| Spain—4.0% | | | | |
| ACS-Actividades de Construccion y Servicios | | 11,100 | | 625,808 |
| Banco Santander Central Hispano | | 20,300 | | 378,908 |
| Repsol YPF | | 7,200 | | 249,013 |
| Telefonica | | 28,600 | | 608,583 |
| | | | | 1,862,312 |
| Sweden—1.2% | | | | |
| Telefonaktiebolaget LM Ericsson, Cl. B | | 64,600 | | 260,912 |
| Volvo, Cl. B | | 4,100 | | 282,379 |
| | | | | 543,291 |
| Switzerland—7.1% | | | | |
| ABB | | 15,100 | | 270,771 |
| Baloise-Holding | | 3,900 | | 389,840 |
| Credit Suisse Group | | 9,400 | | 657,653 |
| Holcim | | 4,600 | | 421,682 |
| Roche Holding | | 7,420 | | 1,330,545 |
| Swiss Reinsurance | | 2,800 | | 238,063 |
| | | | | 3,308,554 |
The Fund 11
STATEMENT OF INVESTMENTS (continued)
|
| Common Stocks (continued) | | Shares | | Value ($) |
| |
| |
|
| United Kingdom—20.8% | | | | |
| AstraZeneca | | 8,200 | | 440,562 |
| Aviva | | 16,200 | | 260,733 |
| Barclays | | 19,919 | | 284,708 |
| Barratt Developments | | 11,000 | | 265,992 |
| BP | | 49,019 | | 544,677 |
| British Airways | | 73,800 a | | 762,232 |
| BT Group | | 79,400 | | 468,723 |
| GlaxoSmithKline | | 43,500 | | 1,144,714 |
| HBOS | | 18,200 | | 403,391 |
| International Power | | 104,300 | | 779,600 |
| J Sainsbury | | 77,700 | | 622,613 |
| Marks & Spencer Group | | 38,700 | | 543,299 |
| Michael Page International | | 36,300 | | 321,435 |
| National Grid | | 22,700 | | 327,568 |
| Next | | 8,600 | | 303,096 |
| Royal Bank of Scotland Group | | 12,600 | | 491,684 |
| Royal Dutch Shell, Cl. A | | 7,400 | | 258,630 |
| Royal Dutch Shell, Cl. B | | 2,500 | | 87,620 |
| Tate & Lyle | | 14,500 | | 218,183 |
| Xstrata | | 21,800 | | 1,088,442 |
| | | | | 9,617,902 |
| Total Common Stocks | | | | |
| (cost $33,032,016) | | | | 44,984,168 |
| |
| |
|
| |
| Preferred Stocks—2.0% | | | | |
| |
| |
|
| Germany; | | | | |
| Fresenius | | | | |
| (cost $664,625) | | 4,370 | | 934,801 |
| | | Principal | | |
| Short-Term Investment—.1% | | Amount ($) | | Value ($) |
| |
| |
|
| U.S. Treasury Bills; | | | | |
| 4.93%, 3/15/07 | | | | |
| (cost $34,659) | | 35,000 | | 34,667 |
| |
| |
|
| Total Investments (cost $33,731,300) | | 99.2% | | 45,953,636 |
| Cash and Receivables (Net) | | .8% | | 365,895 |
| Net Assets | | 100.0% | | 46,319,531 |
a Non-income producing security.
|
| Portfolio Summary | | (Unaudited) † | | | | |
| |
| | | Value (%) | | | | Value (%) |
| |
| |
| |
|
| Japan | | 22.0 | | Norway | | 2.2 |
| United Kingdom | | 20.8 | | Denmark | | 1.8 |
| France | | 9.6 | | Hong Kong | | 1.8 |
| Switzerland | | 7.1 | | Ireland | | 1.5 |
| Germany | | 6.9 | | Sweden | | 1.2 |
| Canada | | 5.4 | | China | | 1.0 |
| Spain | | 4.0 | | Finland | | .5 |
| Netherlands | | 3.9 | | Greece | | .5 |
| Australia | | 3.2 | | United States | | .1 |
| Belgium | | 2.9 | | Cash & Equivalents | | .8 |
| Italy | | 2.8 | | | | 100.0 |
| |
| † Based on net assets. | | | | | | |
| See notes to financial statements. | | | | |
The Fund 13
STATEMENT OF ASSETS AND LIABILITIES
December 31, 2006
| | | Cost | | Value |
| |
| |
|
| Assets ($): | | | | |
| Investments in securities-See Statement of Investments | | 33,731,300 | | 45,953,636 |
| Cash | | | | 262,123 |
| Cash denominated in foreign currencies | | 116,916 | | 116,566 |
| Dividends and interest receivable | | | | 83,190 |
| Receivable for shares of Common Stock subscribed | | | | 12,649 |
| Other assets | | | | 15,082 |
| | | | | 46,443,246 |
| |
| |
|
| Liabilities ($): | | | | |
| Due to Founders Asset Management LLC and affiliates—Note 3(c) | | 56,154 |
| Payable for shares of Common Stock redeemed | | | | 24,368 |
| Directors deferred compensation | | | | 15,071 |
| Interest payable—Note 2 | | | | 10 |
| Accrued expenses | | | | 28,112 |
| | | | | 123,715 |
| |
| |
|
| Net Assets ($) | | | | 46,319,531 |
| |
| |
|
| Composition of Net Assets ($): | | | | |
| Paid-in capital | | | | 53,736,694 |
| Accumulated distributions in excess of investment income—net | | (15,745) |
| Accumulated net realized gain (loss) on investments | | | | (19,638,600) |
| Accumulated net unrealized appreciation (depreciation) | | | | |
| on investments and foreign currency transactions | | | | 12,237,182 |
| |
| |
|
| Net Assets ($) | | | | 46,319,531 |
| Net Asset Value Per Share | | | | | | | | | | |
| | | Class A | | Class B | | Class C | | Class F | | Class R | | Class T |
| |
| |
| |
| |
| |
| |
|
| Net Assets ($) | | 29,971,983 | | 1,024,882 | | 710,133 | | 14,225,450 | | 213,626 | | 173,457 |
| Shares Outstanding | | 1,794,930 | | 62,838 | | 43,698 | | 848,759 | | 12,662 | | 10,439 |
| |
| |
| |
| |
| |
| |
|
| Net Asset Value | | | | | | | | | | | | |
| Per Share ($) | | 16.70 | | 16.31 | | 16.25 | | 16.76 | | 16.87 | | 16.62 |
| |
| See notes to financial statements. | | | | | | | | | | |
STATEMENT OF OPERATIONS
Year Ended December 31, 2006
|
| Investment Income ($): | | |
| Income: | | |
| Dividends (net of $92,552 foreign taxes withheld at source): | | |
| Unaffiliated issuers | | 897,473 |
| Affiliated issuers | | 2,557 |
| Interest | | 26,283 |
| Total Income | | 926,313 |
| Expenses: | | |
| Investment advisory fee—Note 3(a) | | 431,961 |
| Shareholder servicing costs—Note 3(c) | | 155,733 |
| Registration fees | | 52,910 |
| Custodian fees—Note 3(c) | | 51,398 |
| Distribution fees—Note 3(b) | | 47,969 |
| Accounting fees—Note 3(c) | | 43,190 |
| Prospectus and shareholders’ reports | | 32,834 |
| Professional fees | | 14,420 |
| Directors’ fees and expenses—Note 3(d) | | 13,007 |
| Loan commitment fees—Note 2 | | 1,705 |
| Interest expense—Note 2 | | 572 |
| Miscellaneous | | 29,835 |
| Total Expenses | | 875,534 |
| Less—reimbursed/waived expenses—Note 3(a) | | (225,061) |
| Less—reduction in custody fees due to waiver—Note 3(c) | | (20,783) |
| Less—reduction in custody fees due to | | |
| earnings credits—Note 1(c) | | (3,986) |
| Less—expense offset to broker commissions—Note 1 | | (6,075) |
| Net Expenses | | 619,629 |
| Investment Income—Net | | 306,684 |
| |
|
| Realized and Unrealized Gain (Loss) on Investments—Note 4 ($): |
| Net realized gain (loss) on investments | | 7,567,216 |
| Net realized gain (loss) on financial futures | | 54,417 |
| Net realized gain (loss) on foreign currency transactions | | 18,081 |
| Net Realized Gain (Loss) | | 7,639,714 |
| Net change in unrealized appreciation (depreciation) | | |
| on investments and foreign currency transactions | | 1,767,152 |
| Net Realized and Unrealized Gain (Loss) on Investments | | 9,406,866 |
| Net Increase in Net Assets Resulting from Operations | | 9,713,550 |
| |
| See notes to financial statements. | | |
The Fund 15
STATEMENT OF CHANGES IN NET ASSETS
| | | Year Ended December 31, |
| |
|
| | | 2006 | | 2005 |
| |
| |
|
| Operations ($): | | | | |
| Investment income—net | | 306,684 | | 336,399 |
| Net realized gain (loss) on investments | | 7,639,714 | | 3,931,706 |
| Net change in unrealized appreciation | | | | |
| (depreciation) on investments | | 1,767,152 | | 683,031 |
| Net Increase (Decrease) in Net Assets | | |
| Resulting from Operations | | 9,713,550 | | 4,951,136 |
| |
| |
|
| Dividends to Shareholders from ($): | | | | |
| Investment income—net; | | | | |
| Class A shares | | (224,701) | | (221,917) |
| Class B shares | | — | | (3,527) |
| Class C shares | | (989) | | (1,574) |
| Class F shares | | (85,138) | | (100,227) |
| Class R shares | | (2,072) | | (750) |
| Class T shares | | (886) | | (912) |
| Total Dividends | | (313,786) | | (328,907) |
| |
| |
|
| Capital Stock Transactions ($): | | | | |
| Net proceeds from shares sold: | | | | |
| Class A shares | | 2,216,843 | | 599,013 |
| Class B shares | | 328,445 | | 266,981 |
| Class C shares | | 87,547 | | 162,011 |
| Class F shares | | 3,050,654 | | 1,589,753 |
| Class R shares | | 122,308 | | 1,000 |
| Class T shares | | 28,874 | | 1,276 |
| Dividends reinvested: | | | | |
| Class A shares | | 212,881 | | 210,698 |
| Class B shares | | — | | 2,770 |
| Class C shares | | 491 | | 684 |
| Class F shares | | 82,465 | | 95,978 |
| Class R shares | | 2,072 | | 750 |
| Class T shares | | 856 | | 881 |
| | | Year Ended December 31, |
| |
|
| | | 2006 | | 2005 |
| |
| |
|
| Capital Stock Transactions ($) (continued): | | |
| Cost of shares redeemed: | | | | |
| Class A shares | | (4,054,322) | | (3,356,309) |
| Class B shares | | (1,595,137) | | (798,761) |
| Class C shares | | (95,766) | | (120,257) |
| Class F shares | | (3,203,037) | | (2,414,771) |
| Class R shares | | (12) | | (6,115) |
| Class T shares | | (32,583) | | (50,690) |
| Increase (Decrease) in Net Assets | | | | |
| from Capital Stock Transactions | | (2,847,421) | | (3,815,108) |
| Total Increase (Decrease) in Net Assets | | 6,552,343 | | 807,121 |
| |
| |
|
| Net Assets ($): | | | | |
| Beginning of Period | | 39,767,188 | | 38,960,067 |
| End of Period | | 46,319,531 | | 39,767,188 |
| Accumulated distributions in excess of | | | | |
| investment income—net | | (15,745) | | (4,110) |
The Fund 17
STATEMENT OF CHANGES IN NET ASSETS (continued)
|
| | | Year Ended December 31, |
| |
|
| | | 2006 | | 2005 |
| |
| |
|
| Capital Share Transactions: | | | | |
| Class A a | | | | |
| Shares sold | | 150,231 | | 48,763 |
| Shares issued for dividends reinvested | | 12,803 | | 15,907 |
| Shares redeemed | | (267,283) | | (272,133) |
| Net Increase (Decrease) in Shares Outstanding | | (104,249) | | (207,463) |
| |
| |
|
| Class B a | | | | |
| Shares sold | | 22,765 | | 22,161 |
| Shares issued for dividends reinvested | | — | | 212 |
| Shares redeemed | | (109,812) | | (68,649) |
| Net Increase (Decrease) in Shares Outstanding | | (87,047) | | (46,276) |
| |
| |
|
| Class C | | | | |
| Shares sold | | 5,716 | | 13,942 |
| Shares issued for dividends reinvested | | 31 | | 52 |
| Shares redeemed | | (6,702) | | (10,373) |
| Net Increase (Decrease) in Shares Outstanding | | (955) | | 3,621 |
| |
| |
|
| Class F | | | | |
| Shares sold | | 205,525 | | 129,124 |
| Shares issued for dividends reinvested | | 4,941 | | 7,163 |
| Shares redeemed | | (214,915) | | (196,116) |
| Net Increase (Decrease) in Shares Outstanding | | (4,449) | | (59,829) |
| |
| |
|
| Class R | | | | |
| Shares sold | | 7,402 | | 75 |
| Shares issued for dividends reinvested | | 124 | | 55 |
| Shares redeemed | | (1) | | (518) |
| Net Increase (Decrease) in Shares Outstanding | | 7,525 | | (388) |
| |
| |
|
| Class T | | | | |
| Shares sold | | 1,902 | | 111 |
| Shares issued for dividends reinvested | | 52 | | 66 |
| Shares redeemed | | (2,179) | | (4,290) |
| Net Increase (Decrease) in Shares Outstanding | | (225) | | (4,113) |
| a | | During the period ended December 31, 2006, 65,980 Class B shares representing $954,139 were automatically |
| | | converted to 64,237 Class A shares and during the period ended December 31, 2005, 5,656 Class B shares |
| | | representing $67,259 were automatically converted to 5,507 Class A shares. |
| See notes to financial statements. |
The following tables describe the performance for each share class for the fiscal periods indicated.All information (except portfolio turnover rate) reflects financial results for a single fund share.Total return shows how much your investment in the fund would have increased (or decreased) during each period, assuming you had reinvested all dividends and distributions.These figures have been derived from the fund’s financial statements.
| | | | | | | Year Ended December 31, | | |
| | | |
| |
| |
|
| Class A Shares | | 2006 | | 2005 | | 2004 | | 2003 | | 2002 |
| |
| |
| |
| |
| |
|
| Per Share Data ($): | | | | | | | | | | |
| Net asset value, beginning of period | | 13.44 | | 11.90 | | 9.77 | | 7.19 | | 10.03 |
| Investment Operations: | | | | | | | | | | |
| Investment income—net | | .11a | | .12a | | .08a | | .06 | | .01 |
| Net realized and unrealized | | | | | | | | | | |
| gain (loss) on investments | | 3.28 | | 1.54 | | 2.14 | | 2.59 | | (2.84) |
| Total from Investment Operations | | 3.39 | | 1.66 | | 2.22 | | 2.65 | | (2.83) |
| Distributions: | | | | | | | | | | |
| Dividends from investment income—net | | (.13) | | (.12) | | (.09) | | (.07) | | (.01) |
| Net asset value, end of period | | 16.70 | | 13.44 | | 11.90 | | 9.77 | | 7.19 |
| |
| |
| |
| |
| |
|
| Total Return (%) b | | 25.20 | | 13.93 | | 22.69 | | 36.84 | | (28.19) |
| |
| |
| |
| |
| |
|
| Ratios/Supplemental Data (%): | | | | | | | | | | |
| Ratio of total expenses | | | | | | | | | | |
| to average net assets | | 1.94 | | 2.15 | | 2.05 | | 2.48 | | 2.18 |
| Ratio of net expenses | | | | | | | | | | |
| to average net assets | | 1.40 | | 1.40 | | 1.40 | | 1.40 | | 1.40 |
| Ratio of net investment income | | | | | | | | | | |
| to average net assets | | .75 | | .94 | | .74 | | .80 | | .13 |
| Portfolio Turnover Rate c | | 79 | | 54 | | 85 | | 144 | | 220 |
| |
| |
| |
| |
| |
|
| Net Assets, end of period ($ x 1,000) | | 29,972 | | 25,519 | | 25,076 | | 22,432 | | 18,217 |
| |
| a | | Based on average shares outstanding at each month end. | | | | | | | | |
| b | | Exclusive of sales charge. | | | | | | | | | | |
| c | | Portfolio Turnover Rate is a measure of portfolio activity that is calculated by dividing the lesser of purchases or sales |
| | | of securities, excluding securities having maturity dates at acquisition of one year or less, by the average value of the |
| | | portfolio securities held during the period, which is a rolling 12-month period. | | | | |
| See notes to financial statements. | | | | | | | | | | |
The Fund 19
FINANCIAL HIGHLIGHTS (continued)
|
| | | | | Year Ended December 31, | | |
| |
| |
| |
|
| Class B Shares | | 2006 | | 2005 | | 2004 | | 2003 | | 2002 |
| |
| |
| |
| |
| |
|
| Per Share Data ($): | | | | | | | | | | |
| Net asset value, beginning of period | | 13.12 | | 11.63 | | 9.55 | | 7.03 | | 9.87 |
| Investment Operations: | | | | | | | | | | |
| Investment income (loss)—net | | .01a | | .02a | | .00a,b | | (.08) | | (.11) |
| Net realized and unrealized | | | | | | | | | | |
| gain (loss) on investments | | 3.18 | | 1.49 | | 2.08 | | 2.61 | | (2.73) |
| Total from Investment Operations | | 3.19 | | 1.51 | | 2.08 | | 2.53 | | (2.84) |
| Distributions: | | | | | | | | | | |
| Dividends from investment income—net | | — | | (.02) | | — | | (.01) | | — |
| Net asset value, end of period | | 16.31 | | 13.12 | | 11.63 | | 9.55 | | 7.03 |
| |
| |
| |
| |
| |
|
| Total Return (%) c | | 24.32 | | 13.02 | | 21.78 | | 35.95 | | (28.77) |
| |
| |
| |
| |
| |
|
| Ratios/Supplemental Data (%): | | | | | | | | | | |
| Ratio of total expenses | | | | | | | | | | |
| to average net assets | | 2.86 | | 3.04 | | 2.85 | | 3.32 | | 2.91 |
| Ratio of net expenses | | | | | | | | | | |
| to average net assets | | 2.15 | | 2.15 | | 2.15 | | 2.15 | | 2.15 |
| Ratio of net investment income | | | | | | | | | | |
| (loss) to average net assets | | .05 | | .21 | | .00 | | .07 | | (.61) |
| Portfolio Turnover Rate d | | 79 | | 54 | | 85 | | 144 | | 220 |
| |
| |
| |
| |
| |
|
| Net Assets, end of period ($ x 1,000) | | 1,025 | | 1,966 | | 2,281 | | 2,372 | | 2,201 |
| |
| a Based on average shares outstanding at each month end. | | | | | | | | |
| b Amount represents less than $.01 per share. | | | | | | | | |
| c Exclusive of sales charge. | | | | | | | | | | |
| d | | Portfolio Turnover Rate is a measure of portfolio activity that is calculated by dividing the lesser of purchases or sales |
| | | of securities, excluding securities having maturity dates at acquisition of one year or less, by the average value of the |
| | | portfolio securities held during the period, which is a rolling 12-month period. |
| See notes to financial statements. |
| | | | | Year Ended December 31, | | |
| |
| |
| |
|
| Class C Shares | | 2006 | | 2005 | | 2004 | | 2003 | | 2002 |
| |
| |
| |
| |
| |
|
| Per Share Data ($): | | | | | | | | | | |
| Net asset value, beginning of period | | 13.09 | | 11.61 | | 9.53 | | 7.02 | | 9.86 |
| Investment Operations: | | | | | | | | | | |
| Investment income (loss)—net | | (.00)a,b | | .02a | | .00a,b | | (.26) | | (.29) |
| Net realized and unrealized | | | | | | | | | | |
| gain (loss) on investments | | 3.18 | | 1.50 | | 2.08 | | 2.77 | | (2.55) |
| Total from Investment Operations | | 3.18 | | 1.52 | | 2.08 | | 2.51 | | (2.84) |
| Distributions: | | | | | | | | | | |
| Dividends from investment income—net | | (.02) | | (.04) | | — | | — | | — |
| Net asset value, end of period | | 16.25 | | 13.09 | | 11.61 | | 9.53 | | 7.02 |
| |
| |
| |
| |
| |
|
| Total Return (%) c | | 24.32 | | 13.05 | | 21.83 | | 35.76 | | (28.80) |
| |
| |
| |
| |
| |
|
| Ratios/Supplemental Data (%): | | | | | | | | | | |
| Ratio of total expenses | | | | | | | | | | |
| to average net assets | | 2.69 | | 2.94 | | 2.87 | | 3.25 | | 3.11 |
| Ratio of net expenses | | | | | | | | | | |
| to average net assets | | 2.15 | | 2.15 | | 2.15 | | 2.15 | | 2.15 |
| Ratio of net investment income | | | | | | | | | | |
| (loss) to average net assets | | (.02) | | .14 | | .03 | | .08 | | (.63) |
| Portfolio Turnover Rate d | | 79 | | 54 | | 85 | | 144 | | 220 |
| |
| |
| |
| |
| |
|
| Net Assets, end of period ($ x 1,000) | | 710 | | 584 | | 476 | | 482 | | 532 |
| |
| a Based on average shares outstanding at each month end. | | | | | | | | |
| b Amount represents less than $.01 per share. | | | | | | | | |
| c Exclusive of sales charge. | | | | | | | | | | |
| d | | Portfolio Turnover Rate is a measure of portfolio activity that is calculated by dividing the lesser of purchases or sales |
| | | of securities, excluding securities having maturity dates at acquisition of one year or less, by the average value of the |
| | | portfolio securities held during the period, which is a rolling 12-month period. |
| See notes to financial statements. |
The Fund 21
FINANCIAL HIGHLIGHTS (continued)
|
| | | | | | | Year Ended December 31, | | |
| | | |
| |
| |
|
| Class F Shares | | 2006 | | 2005 | | 2004 | | 2003 | | 2002 |
| |
| |
| |
| |
| |
|
| Per Share Data ($): | | | | | | | | | | |
| Net asset value, beginning of period | | 13.46 | | 11.92 | | 9.78 | | 7.18 | | 10.03 |
| Investment Operations: | | | | | | | | | | |
| Investment income (loss)—net | | .11a | | .11a | | .08a | | (.01) | | (.05) |
| Net realized and unrealized | | | | | | | | | | |
| gain (loss) on investments | | 3.29 | | 1.55 | | 2.14 | | 2.68 | | (2.79) |
| Total from Investment Operations | | 3.40 | | 1.66 | | 2.22 | | 2.67 | | (2.84) |
| Distributions: | | | | | | | | | | |
| Dividends from investment income—net | | (.10) | | (.12) | | (.08) | | (.07) | | (.01) |
| Net asset value, end of period | | 16.76 | | 13.46 | | 11.92 | | 9.78 | | 7.18 |
| |
| |
| |
| |
| |
|
| Total Return (%) | | 25.27 | | 13.91 | | 22.70 | | 37.17 | | (28.30) |
| |
| |
| |
| |
| |
|
| Ratios/Supplemental Data (%): | | | | | | | | | | |
| Ratio of total expenses | | | | | | | | | | |
| to average net assets | | 2.04 | | 2.28 | | 2.10 | | 2.52 | | 2.13 |
| Ratio of net expenses | | | | | | | | | | |
| to average net assets | | 1.40 | | 1.40 | | 1.40 | | 1.40 | | 1.40 |
| Ratio of net investment income | | | | | | | | | | |
| to average net assets | | .75 | | .92 | | .76 | | .80 | | .12 |
| Portfolio Turnover Rate b | | 79 | | 54 | | 85 | | 144 | | 220 |
| |
| |
| |
| |
| |
|
| Net Assets, end of period ($ x 1,000) | | 14,225 | | 11,485 | | 10,885 | | 9,837 | | 9,321 |
| |
| a | | Based on average shares outstanding at each month end. | | | | | | | | |
| b | | Portfolio Turnover Rate is a measure of portfolio activity that is calculated by dividing the lesser of purchases or sales |
| | | of securities, excluding securities having maturity dates at acquisition of one year or less, by the average value of the |
| | | portfolio securities held during the period, which is a rolling 12-month period. | | | | |
| See notes to financial statements. | | | | | | | | | | |
| | | | | | | Year Ended December 31, | | |
| | | |
| |
| |
|
| Class R Shares | | 2006 | | 2005 | | 2004 | | 2003 | | 2002 |
| |
| |
| |
| |
| |
|
| Per Share Data ($): | | | | | | | | | | |
| Net asset value, beginning of period | | 13.57 | | 12.01 | | 9.82 | | 7.22 | | 10.08 |
| Investment Operations: | | | | | | | | | | |
| Investment income—net | | .13a | | .14a | | .13a | | .09 | | .02 |
| Net realized and unrealized | | | | | | | | | | |
| gain (loss) on investments | | 3.34 | | 1.57 | | 2.17 | | 2.60 | | (2.85) |
| Total from Investment Operations | | 3.47 | | 1.71 | | 2.30 | | 2.69 | | (2.83) |
| Distributions: | | | | | | | | | | |
| Dividends from investment income—net | | (.17) | | (.15) | | (.11) | | (.09) | | (.03) |
| Net asset value, end of period | | 16.87 | | 13.57 | | 12.01 | | 9.82 | | 7.22 |
| |
| |
| |
| |
| |
|
| Total Return (%) | | 25.54 | | 14.22 | | 23.45 | | 37.27 | | (28.10) |
| |
| |
| |
| |
| |
|
| Ratios/Supplemental Data (%): | | | | | | | | | | |
| Ratio of total expenses | | | | | | | | | | |
| to average net assets | | 1.85 | | 3.35 | | 1.65 | | 1.95 | | 1.71 |
| Ratio of net expenses | | | | | | | | | | |
| to average net assets | | 1.15 | | 1.15 | | 1.15 | | 1.15 | | 1.15 |
| Ratio of net investment income | | | | | | | | | | |
| to average net assets | | .89 | | 1.15 | | 1.21 | | 1.03 | | .27 |
| Portfolio Turnover Rate b | | 79 | | 54 | | 85 | | 144 | | 220 |
| |
| |
| |
| |
| |
|
| Net Assets, end of period ($ x 1,000) | | 214 | | 70 | | 66 | | 3,146 | | 2,470 |
| |
| a | | Based on average shares outstanding at each month end. | | | | | | | | |
| b | | Portfolio Turnover Rate is a measure of portfolio activity that is calculated by dividing the lesser of purchases or sales |
| | | of securities, excluding securities having maturity dates at acquisition of one year or less, by the average value of the |
| | | portfolio securities held during the period, which is a rolling 12-month period. | | | | |
| See notes to financial statements. | | | | | | | | | | |
The Fund 23
FINANCIAL HIGHLIGHTS (continued)
|
| | | | | Year Ended December 31, | | |
| |
| |
| |
|
| Class T Shares | | 2006 | | 2005 | | 2004 | | 2003 | | 2002 |
| |
| |
| |
| |
| |
|
| Per Share Data ($): | | | | | | | | | | |
| Net asset value, beginning of period | | 13.37 | | 11.84 | | 9.70 | | 7.14 | | 9.97 |
| Investment Operations: | | | | | | | | | | |
| Investment income (loss)—net | | .08a | | .08a | | .06a | | .00b | | (.10) |
| Net realized and unrealized | | | | | | | | | | |
| gain (loss) on investments | | 3.26 | | 1.54 | | 2.11 | | 2.61 | | (2.73) |
| Total from Investment Operations | | 3.34 | | 1.62 | | 2.17 | | 2.61 | | (2.83) |
| Distributions: | | | | | | | | | | |
| Dividends from investment income—net | | (.09) | | (.09) | | (.03) | | (.05) | | .00 |
| Net asset value, end of period | | 16.62 | | 13.37 | | 11.84 | | 9.70 | | 7.14 |
| |
| |
| |
| |
| |
|
| Total Return (%) c | | 24.95 | | 13.65 | | 22.42 | | 36.58 | | (28.39) |
| |
| |
| |
| |
| |
|
| Ratios/Supplemental Data (%): | | | | | | | | | | |
| Ratio of total expenses | | | | | | | | | | |
| to average net assets | | 2.42 | | 2.81 | | 2.44 | | 2.88 | | 4.00 |
| Ratio of net expenses | | | | | | | | | | |
| to average net assets | | 1.65 | | 1.65 | | 1.65 | | 1.65 | | 1.65 |
| Ratio of net investment (loss) | | | | | | | | | | |
| to average net assets | | .55 | | .67 | | .57 | | .67 | | (.12) |
| Portfolio Turnover Rate d | | 79 | | 54 | | 85 | | 144 | | 220 |
| |
| |
| |
| |
| |
|
| Net Assets, end of period ($ X 1,000) | | 173 | | 143 | | 175 | | 172 | | 158 |
| |
| a Based on average shares outstanding at each month end. | | | | | | | | |
| b Amount represents less than $.01 per share. | | | | | | | | |
| c Exclusive of sales charge. | | | | | | | | | | |
| d | | Portfolio Turnover Rate is a measure of portfolio activity that is calculated by dividing the lesser of purchases or sales |
| | | of securities, excluding securities having maturity dates at acquisition of one year or less, by the average value of the |
| | | portfolio securities held during the period, which is a rolling 12-month period. |
| See notes to financial statements. |
NOTES TO FINANCIAL STATEMENTS
NOTE 1—Significant Accounting Policies:
Dreyfus Founders International Equity Fund (the “fund”) is a separate diversified series of Dreyfus Founders Funds, Inc. (the “Company”), which is registered under the Investment Company Act of 1940, as amended (the “Act”), as an open-end management investment company and operates as a series company currently offering eight series, including the fund. The fund’s investment objective is to seek long-term growth of capital. Founders Asset Management LLC (the “Manager” or “Founders”) serves as the fund’s investment adviser. Founders is an indirect wholly-owned subsidiary of Mellon Financial Corporation (“Mellon Financial”), a publicly-owned financial services company which provides a comprehensive range of financial products and services in domestic and selected international markets.
On December 4, 2006, Mellon Financial and The Bank of New York Company, Inc. announced that they had entered into a definitive agreement to merge. The new company will be called The Bank of New York Mellon Corporation. As part of this transaction, Founders would become an indirect wholly-owned subsidiary of The Bank of New York Mellon Corporation.The transaction is subject to certain regulatory approvals and the approval of The Bank of New York Company, Inc.’s and Mellon Financial’s shareholders, as well as other customary conditions to closing. Subject to such approvals and the satisfaction of the other conditions, Mellon Financial and The Bank of New York Company, Inc. expect the transaction to be completed in the third quarter of 2007.
Dreyfus Service Corporation (the “Distributor”), the direct owner of Founders and a wholly-owned subsidiary of The Dreyfus Corporation (“Dreyfus”, an affiliate of Founders), is the Distributor of the fund’s shares. The fund is authorized to issue up to 550 million shares of Common Stock, par value $ .01 per share, in the following classes of shares: Class A, Class B, Class C, Class F, Class R and Class T shares. Class A and Class T shares are subject to a sales charge imposed at the time of purchase. Class B shares are subject to a contingent deferred
The Fund 25
NOTES TO FINANCIAL STATEMENTS (continued)
|
sales charge (“CDSC”) imposed on Class B share redemptions made within six years of purchase and automatically convert to Class A shares after six years. Class C shares are subject to a CDSC imposed on Class C shares redeemed within one year of purchase. Class F and Class R shares are sold at net asset value (“NAV”) per share. Class F shares are sold only to Class F grandfathered investors, and Class R shares are sold only to eligible institutional investors. Other differences between the classes include the services offered to and the expenses borne by each class. Income and realized and unrealized gains or losses on investments are allocated to each class of shares based on its relative net assets.
Effective June 1, 2006, the fund no longer offers Class B shares, except in connection with dividend reinvestment and permitted exchanges of Class B shares.
Each class of the fund bears expenses incurred specifically on its behalf and, in addition, each class bears a portion of general expenses based on the relative net assets or the number of shareholder accounts of the class.The type of expense determines the allocation method.
The Company’s Board of Directors has authorized the payment of certain fund expenses with commissions on fund portfolio transactions.The commissions reduced miscellaneous expenses and are included in the expense offset to broker commissions in the Statement of Operations.
The fund’s financial statements are prepared in accordance with U.S. generally accepted accounting principles, which requires the use of management estimates and assumptions. Actual results could differ from those estimates.
In the normal course of business, the fund may enter into contracts and agreements that contain a variety of representations and warranties, and which provide general indemnifications. The maximum exposure to the fund under these arrangements is unknown, as this would involve future claims that may be made against the fund that have not yet occurred. However, based on experience, the fund expects the risks of loss to be remote.
(a) Portfolio valuation: A domestic equity security listed or traded on a securities exchange or in the over-the-counter market is valued at its last sale price on the exchange or market where it is principally traded or, in the case of a security traded on Nasdaq, at its official closing price. Lacking any sales on that day, the security is valued at the current closing bid price, or by quotes from dealers making a market in the security if the closing bid price is not available, or in the case of written call options, at the mean between the highest bid and lowest asked quotations obtained from at least two securities dealers.
A foreign equity security traded on a foreign exchange is valued at the last quoted official closing price available before the time when the fund’s assets are valued, or at the last quoted sales price if the exchange does not provide an official closing price or if the foreign market has not yet closed. Lacking any sales that day, the security is valued at the current closing bid price, or by quotes from dealers making a market in the security if the closing bid price is not available. New York closing exchange rates are used to convert foreign currencies to U.S. dollars.
A debt security with a remaining maturity greater than 60 days at the time of purchase is valued in accordance with the evaluated bid price supplied by a pricing service approved by the Company’s Board of Directors or, if such price is not available, at the mean between the highest bid and lowest asked quotations obtained from at least two securities dealers. A debt security with a remaining maturity of 60 days or less at the time of purchase is valued at amortized cost, which approximates market value, unless it is determined that amortized cost would not represent market value, in which case the securities would be marked to market.
If market quotations or official closing prices are not readily available or are determined not to reflect accurately fair value, securities will be valued at their fair value as determined in good faith by the Company’s Board of Directors or pursuant to procedures approved by the Board of Directors.These situations may include instances where
The Fund 27
NOTES TO FINANCIAL STATEMENTS (continued)
|
an event occurs after the close of the market on which a security is traded but before the fund calculates its NAV, and it is determined that the event has materially affected the value of the security. Fair value of foreign equity securities may be determined with the assistance of a pricing service using correlations between the movement of prices of foreign securities and indexes of domestic securities and other appropriate indicators, such as closing market prices of relevant ADRs and futures contracts.
Investments in registered investment companies are valued at their NAV.
Using fair value to price securities requires the use of estimates, and as such, may result in a value that is different from a security’s most recent closing price and from the prices used by other mutual funds to calculate their NAV’s. In addition, it is possible that the fair value determined for a security may be different from the value that may be realized upon the security’s sale, and that these differences may be material to the NAV of the fund.
On September 20, 2006, the Financial Accounting Standards Board (FASB) released Statement of Financial Accounting Standards No. 157 “Fair Value Measurements” (“FAS 157”). FAS 157 establishes an authoritative definition of fair value, sets out a framework for measuring fair value, and requires additional disclosures about fair value measurements. The application of FAS 157 is required for fiscal years beginning after November 15, 2007 and interim periods within those fiscal years. Management does not believe that the application of this standard will have a material impact on the financial statements of the fund.
(b) Foreign Securities and Currency Transactions:The fund normally will invest a large portion of its assets in foreign securities. Foreign securities carry more risk than U.S. securities, such as political and currency risks. In the event the fund executes a foreign security transaction, the fund may enter into a foreign currency contract to settle the foreign security transaction.The fund could be exposed to risk if counterpar-ties are unable to meet the terms of the contracts or if the value of the currency changes unfavorably to the U.S. dollar. The resultant foreign
currency gain or loss from the contract is recorded as foreign currency gain or loss and is presented as such in the Statement of Operations.
The accounting records of the fund are maintained in U.S. dollars.The market values of foreign securities, currency holdings and other assets and liabilities are translated into U.S. dollars based on the current exchange rates each business day. Purchases and sales of investment securities and income and expense items denominated in foreign currencies are translated into U.S. dollar amounts on the respective dates of such transactions.
The fund does not isolate that portion of the results of operations resulting from changes in foreign exchange rates on investments from the fluctuations arising from changes in market prices of securities held. Such fluctuations are included with the net unrealized appreciation/(depreciation) from investments and foreign currency transactions on the Statement of Operations.
Reported net realized foreign exchange gains or losses arise from sales of foreign currencies, currency gains or losses realized between the trade and settlement dates on securities transactions, and the difference between the amounts of dividends, interest, and foreign withholding taxes recorded on the fund’s books and the U.S. dollar equivalent of the amounts actually received or paid. Net unrealized appreciation or depreciation on investments and foreign currency translation arises from changes in the values of assets and liabilities, including investments in securities held at the date of the financial statements, resulting from changes in the exchange rates and changes in market prices of securities held.
(c) Securities transactions and investment income: Securities transactions are recorded on a trade date basis. Realized gain and loss from securities transactions are recorded on the identified cost basis. Dividend income is recognized on the ex-dividend date and interest income, including, where applicable, accretion of discount and amortization of premium on investments, is recognized on the accrual basis.
The Fund 29
NOTES TO FINANCIAL STATEMENTS (continued)
|
The fund has an arrangement with the custodian bank, Mellon Bank, N.A. (“Mellon Bank”), which is an affiliate of Founders, whereby the fund receives earnings credits from the custodian when positive cash balances are maintained, which are used to offset custody fees. For financial reporting purposes, the fund includes net earnings credits, if any, as an expense offset in the Statement of Operations.
(d) Affiliated issuers: Investments in other investment companies advised by the Manager or its affiliates are defined as “affiliated” in the Act.
(e) Dividends to shareholders: Dividends are recorded on the ex-dividend date. Dividends from investment income-net and dividends from net realized capital gain, if any, are normally declared and paid annually, but the fund may make distributions on a more frequent basis to comply with the distribution requirements of the Internal Revenue Code of 1986, as amended (the “Code”).To the extent that net realized capital gain can be offset by capital loss carryovers, it is the policy of the fund not to distribute such gain. Income and capital gain distributions are determined in accordance with income tax regulations, which may differ from U.S. generally accepted accounting principles.
(f) Federal income taxes: No provision has been made for federal income taxes since it is the policy of the fund to continue to comply with the requirements of Subchapter M of the Code that are applicable to regulated investment companies and to make distributions of income and capital gains sufficient to relieve it from all income taxes.The fund is treated as a separate tax entity for federal income tax purposes.
On July 13, 2006, the FASB released FASB Interpretation No. 48 “Accounting for Uncertainty in Income Taxes” (FIN 48). FIN 48 provides guidance for how uncertain tax positions should be recognized, measured, presented and disclosed in the financial statements. FIN 48 requires the evaluation of tax positions taken or expected to be taken in the course of preparing the fund’s tax returns to determine whether the tax positions are “more-likely-than-not” of being sustained by the applicable tax authority.Tax positions not deemed to meet the more-
likely-than-not threshold would be recorded as a tax benefit or expense in the current year. Adoption of FIN 48 is required for fiscal years beginning after December 15, 2006 and is to be applied to all open tax years as of the effective date.At this time, management is evaluating the implications of FIN 48 and its impact, if any, in the financial statements has not yet been determined.
At December 31, 2006, the components of accumulated earnings on a tax basis were as follows: undistributed ordinary income $44,581, accumulated capital losses $19,636,486 and unrealized appreciation $12,184,057.
The accumulated capital loss carryover is available to be applied against future net securities profits, if any, realized subsequent to December 31, 2006. If not applied, $2,537,202 of the carryover expires in fiscal 2008, $3,774,019 expires in fiscal 2009, $5,986,171 expires in fiscal 2010 and $7,339,094 expires in fiscal 2011.
The tax character of distributions paid to shareholders during the fiscal periods ended December 31, 2006 and December 31, 2005 were as follows: ordinary income $313,786 and $328,907, respectively.
During the period ended December 31, 2006, as a result of permanent book to tax differences, primarily due to the tax treatment for foreign currency transactions, the fund decreased accumulated undistributed investment income-net $4,533 and increased accumulated net realized gain (loss) on investments by the same amount. Net assets were not affected by this reclassification.
NOTE 2—Bank Line of Credit:
|
The Company has a line of credit arrangement (“LOC”) with State Street Bank and Trust Company, to be used for temporary or emergency purposes, primarily for financing redemption payments. The borrowings by each series of the Company are limited to the lesser of (a) $50 million, or (b) the lesser of 25% of the series’ total net assets or the maximum amount which the series is permitted to borrow pursuant to the prospectus, any law or any other agreement. Combined
The Fund 31
NOTES TO FINANCIAL STATEMENTS (continued)
|
borrowings are subject to the $50 million cap on the total LOC. Each series agrees to pay annual fees and interest on the unpaid balance based on prevailing market rates as defined in the LOC.
The average daily amount of borrowings outstanding under the LOC during the period end December 31, 2006 was approximately $11,100, with a related weighed average annualized interest rate of 5.14% .
NOTE 3—Investment Advisory Fee and Other Transactions With Affiliates:
(a) In accordance with an investment advisory agreement between the Company and Founders, the fund compensates Founders for its services as investment adviser by the payment of fees computed daily and paid monthly at the annual rate equal to a percentage of the average daily value of the fund’s net assets.The fee is 1.00% of the first $250 million of net assets, .80% of the next $250 million of net assets, .70% of net assets in excess of $500 million.
Founders has agreed to waive a portion of its management fee and to limit the total expenses of the fund. Founders agreed to waive that portion of its management fee that exceeds 0.75% of the fund’s average net assets and to limit the annual expenses of the fund (net of credits received from the fund’s custodian and expense offsets to broker commissions) to 1.40% for Class A and Class F shares, 2.15% for Class B and Class C shares, 1.15% for Class R shares and 1.65% for Class T shares. These reductions are made pursuant to a permanent written contractual commitment. For the period ended December 31, 2006, $225,061 was reimbursed to the fund by Founders pursuant to this provision.
During the period ended December 31, 2006, the fund was advised that the Distributor retained $1,435 and $318 from sales commissions earned on sales of the fund’s Class A and Class T shares, respectively, and $3,098 and $2 from CDSC on redemptions of the fund’s Class B and Class C shares, respectively.
(b) Under the Distribution Plan (the “Plan”) adopted pursuant to Rule 12b-1 under the Act, Class B, Class C and Class T shares pay the Distributor for distributing their shares at an annual rate of .75% of the
value of their average daily net assets of Class B and Class C shares and .25% of the value of the average daily net assets of Class T shares. During the period ended December 31, 2006, Class B, Class C and Class T shares were charged $10,757, $4,604 and $415, respectively, pursuant to the Plan.
The fund has adopted a Distribution Plan pursuant to Rule 12b-1 under the Act applicable to its Class F shares. Under the plan, the fund is authorized to reimburse the Distributor for expenses paid for distributing or servicing its Class F shares at an annual rate of up to .25% of the value of the average daily net assets of the fund’s Class F shares. During the period ended December 31, 2006, Class F shares were charged $32,193 pursuant to this Distribution Plan.
(c) Under the Shareholder Services Plan, Class A, Class B, Class C and Class T shares pay the Distributor at an annual rate of .25% of the value of their average daily net assets for the provision of certain services.The services provided may include personal services relating to shareholder accounts, such as answering shareholder inquiries regarding the fund and providing reports and other information, and services related to the maintenance of shareholder accounts.The Distributor may make payments to Service Agents (a securities dealer, financial institution or other industry professional) in respect of these services.The Distributor determines the amounts to be paid to Service Agents. During the period ended December 31, 2006, Class A, Class B, Class C and Class T shares were charged $70,032, $3,586, $1,534 and $415, respectively, pursuant to the Shareholder Services Plan.
The Company has a shareholder services agreement with the Distributor, whereby the fund has agreed to compensate the Distributor for providing certain shareholder servicing functions to holders of Class F shares. The fund paid the Distributor a monthly fee equal, on an annual basis, to $24.00 per Class F shareholder account considered to be an open account at any time during a given month. During the period ended December 31, 2006, Class F shares were charged $21,920 pursuant to this shareholder services agreement.
The Fund 33
NOTES TO FINANCIAL STATEMENTS (continued)
|
Dreyfus Transfer, Inc. (“DTI”), a wholly-owned subsidiary of Dreyfus, is the transfer and dividend disbursing agent for all of the fund’s share classes.With the exception of out-of-pocket charges, the fees charged by DTI with respect to the fund’s Class F shares are paid by the Distributor. The out-of-pocket charges from DTI are paid by the fund. During the period ended December 31, 2006, Class F shares were charged $9,243 for out-of-pocket transfer agent charges.
The fees charged by DTI with respect to the fund’s Class A, B, C, R and T shares are paid by the fund.These transfer agency fees, including both the per account fees paid to DTI and out-of-pocket charges, during the period ended December 31, 2006 were $41,162.
The fund has agreed to compensate Founders for providing accounting services, administration, compliance monitoring, regulatory and shareholder reporting, as well as related facilities, equipment and clerical help.The fee is computed at the annual rate of .10% of the average daily net assets of the fund on the first $500 million, .065% of the average daily net assets of the fund on the next $500 million and .02% of the average daily net assets of the fund in excess of $1 billion, plus reasonable out-of-pocket expenses. Founders has contractually agreed in writing to waive any fees received for these services to the extent they exceed Founders’ costs in providing the services. Effective January 1, 2007, Dreyfus replaced Founders as fund accounting and administrative services agent for the fund pursuant to an agreement containing substantially the same terms.
Mellon Bank serves as custodian for the fund.The fees for the custody services are subject to reduction by credits earned on the cash balances of the fund held by the custodian, which are shown as earnings credits on the Statement of Operations.The fund could have employed these assets elsewhere to produce income had it not entered into this arrangement. The custodian contractually agreed in writing to a fee waiver for the Company during the time period and in the amount set forth below:
| Time Period | | Amount of Waiver ($) |
| |
|
| 9/1/05 to 8/31/06 | | 200,000 |
This fee waiver was allocated among the Company’s series in proportion to their respective shares of the total custodian fee. During the period ended December 31, 2006, the fund’s portion of the waiver was $20,783, which reduced the amount paid to Mellon Bank to $30,615.
The components of Due to Founders Asset Management LLC and affiliates in the Statement of Assets and Liabilities consist of:investment advisory fees $29,305, Rule 12b-1 distribution plan fees $4,104, shareholder services plan fees $6,752, custodian fees $13,937, accounting fees $3,900 and transfer agency per account fees $7,410, which are offset against an expense reimbursement currently in effect in the amount of $9,254.
(d) Annual retainer fees and attendance fees for the Company’s Board of Directors are allocated to each series of the Company based on net assets.The Company’s Board of Directors has adopted a deferred compensation plan for Company directors that enables directors to elect to defer receipt of all or a portion of the annual compensation that they are entitled to receive from the Company. Under the plan, the compensation deferred is invested in shares of one or more of the Company’s series. The amount paid to the director under the plan will be determined based upon the performance of the selected series.The current value of these amounts is included in Other Assets and Directors’ Deferred Compensation on the Statement of Assets and Liabilities. Changes in market value are included in the directors’ fees and expenses and the net change in unrealized appreciation/depreciation of investments on the Statement of Operations. Deferral of directors’ fees under the plan does not affect the net assets of the fund.
Certain officers of the Company are also officers and/or directors of Founders or its affiliates, which pay their compensation.The affairs of the fund, including services provided by Founders, are subject to the supervision and general oversight of the Company’s Board of Directors.
(e) Pursuant to an exemptive order from the SEC, the fund may invest its available cash balances in affiliated money market mutual funds. Management fees of the underlying money market mutual funds have been waived by Dreyfus.
The Fund 35
NOTES TO FINANCIAL STATEMENTS (continued)
|
NOTE 4—Securities Transactions:
|
The aggregate amount of purchases and sales of investment securities, excluding short-term securities, financial futures and forward currency exchange contracts, during the period ended December 31, 2006, amounted to $33,697,566 and $36,165,781, respectively.
The fund may invest in financial futures contracts in order to gain exposure to or protect against changes in the market. The fund is exposed to market risk as a result of changes in the value of the underlying financial instruments. Investments in financial futures require the fund to “mark to market” on a daily basis, which reflects the change in market value of the contracts at the close of each day’s trading. Accordingly, variation margin payments are received or made to reflect daily unrealized gains or losses.When the contracts are closed, the fund recognizes a realized gain or loss.These investments require initial margin deposits with a broker, which consist of cash or cash equivalents. The amount of these deposits is determined by the exchange or Board of Trade on which the contract is traded and is subject to change. At December 31, 2006, there were no open financial futures contracts.
The fund enters into forward currency exchange contracts in order to hedge its exposure to changes in foreign currency exchange rates on its foreign portfolio holdings and to settle foreign currency transac-tions.When executing forward currency exchange contracts, the fund is obligated to buy or sell a foreign currency at a specified rate on a certain date in the future. With respect to sales of forward currency exchange contracts, the fund would incur a loss if the value of the contract increases between the date the forward contract is opened and the date the forward contract is closed.The fund realizes a gain if the value of the contract decreases between those dates. With respect to purchases of forward currency exchange contracts, the fund would incur a loss if the value of the contract decreases between the date the forward contract is opened and the date the forward contract is closed.
The fund realizes a gain if the value of the contract increases between those dates. The fund is also exposed to credit risk associated with counterparty nonperformance on these forward currency exchange contracts which is typically limited to the unrealized gain on each open contract. At December 31, 2006, there were no open forward currency exchange contracts.
At December 31, 2006, the cost of investments for federal income tax purposes was $33,781,731; accordingly, accumulated net unrealized appreciation on investments was $12,171,905, consisting of $12,406,505 gross unrealized appreciation and $234,600 gross unrealized depreciation.
The Fund 37
REPORT OF INDEPENDENT REGISTERED PUBLIC ACCOUNTING FIRM
To the Board of Directors and Shareholders of Dreyfus Founders Funds, Inc.
In our opinion, the accompanying statement of assets and liabilities, including the statement of investments, and the related statements of operations and of changes in net assets and the financial highlights present fairly, in all material respects, the financial position of Dreyfus Founders International Equity Fund (one of the portfolios constituting Dreyfus Founders Funds, Inc., hereafter referred to as the “Fund”) at December 31, 2006, the results of its operations for the year then ended, the changes in its net assets for each of the two years in the period then ended and the financial highlights for each of the five years in the period then ended, in conformity with accounting principles generally accepted in the United States of America. These financial statements and financial highlights (hereafter referred to as “financial statements”) are the responsibility of the Fund’s management; our responsibility is to express an opinion on these financial statements based on our audits.We conducted our audits of these financial statements in accordance with the standards of the Public Company Accounting Oversight Board (United States). Those standards require that we plan and perform the audit to obtain reasonable assurance about whether the financial statements are free of material misstate-ment.An audit includes examining, on a test basis, evidence supporting the amounts and disclosures in the financial statements, assessing the accounting principles used and significant estimates made by management, and evaluating the overall financial statement presentation. We believe that our audits, which included confirmation of securities at December 31, 2006 by correspondence with the custodian and brokers, provide a reasonable basis for our opinion.
PricewaterhouseCoopers LLP
New York, New York
February 23, 2007
|
IMPORTANT TAX INFORMATION (Unaudited)
In accordance with federal tax law, the fund elects to provide each shareholder with their portion of the fund’s foreign taxes paid and the income sourced from foreign countries. Accordingly, the fund hereby makes the following designations regarding its fiscal year ended December 31, 2006:
—the total amount of taxes paid to foreign countries was $92,552.
—the total amount of income sourced from foreign countries was $434,937.
As required by federal tax law rules, shareholders will receive notification of their proportionate share of foreign taxes paid and foreign source income for the 2006 calendar year with Form 1099-DIV which will be mailed by January 31, 2007.
For the fiscal year ended December 31, 2006, certain dividends paid by the fund may be subject to a maximum tax rate of 15%, as provided for by the Jobs and Growth tax Relief Reconciliation Act of 2003. Of the distributions paid during the fiscal year, $313,786 represents the maximum amount that may be considered qualified dividend income.
The Fund 39
FACTORS CONSIDERED IN RENEWING THE ADVISORY AGREEMENT (Unaudited)
At a meeting of the board of directors of Dreyfus Founders Funds, Inc. (the “Funds” and, in reference to any one of the Funds’ portfolios, a “Fund”) held on August 9 and 10, 2006, the Funds’ directors unanimously approved the continuation of the Investment Advisory Agreement (“management agreement”) between each of the Funds and Founders Asset Management LLC, the Funds’ investment adviser (“Founders”), for a one-year term ending August 31, 2007.The board of directors of the Funds (“board”) is comprised entirely of individuals who have no affiliation with Founders or any affiliates of Founders (the “directors”).
Prior to the directors’August 2006 meeting, Founders had provided the directors with extensive materials related to the renewal of the management agreement, including performance and expense information for other investment companies with similar investment objectives to each Fund derived from data compiled by Lipper Inc., an independent third party (“Lipper”).
During their meeting, the directors discussed the proposed continuance of the management agreement with the senior management personnel of Founders. At the conclusion of these discussions, the directors and their independent counsel met in a private session at which no representatives of Founders were present, to continue their discussion of continuance of the agreement. In determining to continue the management agreement, the directors considered all factors which they believed to be relevant, including the following:
Nature, Extent and Quality of Services Provided and to be Provided by Founders
The directors recognized that they have had the opportunity to evaluate the investment and non-investment related services which Founders provides to the Funds primarily through their quarterly review of all of the operations of the Funds during Fund committee and Fund board meetings held throughout the past twelve months.At each such meeting, extensive discussions of Fund operations are held with senior management personnel of Founders and a large volume of documentation
with respect to these operations is provided to and reviewed by the directors. Such discussions and documentation afford the directors the continual opportunity to evaluate the nature, extent, and quality of the services provided by Founders and its affiliates to the Funds.
The directors were satisfied that Founders is managing the investment of the assets of the Funds in accordance with each Fund’s respective investment objective, policies and restrictions, subject to the directors’ overall supervision.
The directors considered that Founders also provides many non-investment related services to the Funds in fulfilling its responsibilities under the management agreement.
Following their discussion and review, the directors reached the following conclusions:
- That the breadth and quality of investment advisory and other ser- vices being provided to the Funds are satisfactory, as evidenced in part by the performance records of the Funds, to which the direc- tors gave significant attention as indicated below; and
- That the directors are satisfied not only with the research, long-term portfolio management, and trading services being provided to the Funds, but also recognize that Founders or its affiliates have provided the highest quality accounting, compliance and regulatory, adminis- trative, underwriting, custody, shareholder, transfer agent and cash management services to the Funds, while charging fair, reasonable and competitive fees.
On a quarterly basis, the directors hold in-person meetings with representatives of the portfolio management team for each Fund (usually a portfolio manager), during which each representative reviews, among other items,performance information,attribution analyses,and the portfolio manager’s investment outlook. The directors also receive written monthly and quarterly performance information for each Fund.
The Fund 41
FACTORS CONSIDERED IN RENEWING THE
ADVISORY AGREEMENT (Unaudited) (continued)
|
In conjunction with their consideration of renewal of the management agreement, the directors received a more detailed performance report about each Fund from Lipper.These reports compared each Fund’s performance to both a relatively small group of similar funds selected by Lipper (the “Lipper performance group”), as well as to all funds in the applicable Lipper category (the “Lipper performance universe”).
International Equity Fund’s performance for the one-year period ended December 31, 2005 placed it in the fourth quintile of its Lipper performance group and in the third quintile of its Lipper international multi-cap core fund performance universe. The Fund’s performance within its Lipper-selected group and universe for the three-year period ended December 31, 2005 had placed it in the second quintiles. For the six-month period ended June 30, 2006, the Fund’s performance placed it in the second quintile of its Lipper performance group and in the third quintile of its Lipper performance universe. In addition, for the three-year period ended June 30, 2006, the Fund’s performance placed it in the top quintile of its Lipper performance group and universe.The directors deemed these more recent relative performance results to be satisfactory, but stressed the importance to Founders of the need to seek to maintain the Fund’s strong performance record.
After consideration of all relevant information and data, the directors concluded that although past performance cannot be a guaranty of future performance, each Fund and its shareholders would continue to benefit from Founders’ investment management of the Fund. The directors further determined:
- That although certain of the Funds have experienced performance difficulties, Founders has focused its efforts upon improving the per- formance records of the Funds and will continue to seek improve- ment; and
- That the materials provided by Lipper demonstrated that most of the Funds maintained satisfactory performance quintile rankings in their respective comparison groups and comparison universes, with six of the eight Funds placing in the top two quintiles of their
respective Lipper performance universes for the three-years ended December 31, 2005, and five of the eight Funds placing in the top two quintiles for the six months ended June 30, 2006.
Costs of the Services to be Provided and Profits to be Realized by Founders and Its Affiliates from Founders’ Relationship With the Funds
The directors recognized that on a quarterly basis, they receive information with respect to each Fund’s expenses. The directors carefully review and discuss the expense ratios for all classes of shares of each Fund at each of their quarterly meetings throughout the year.
In conjunction with their annual consideration of renewal of the Funds’ management agreement and other service arrangements, the directors received information from Lipper which included graphs for each Fund that provided outlines of contractual management fees at common asset levels, actual management fees, actual non-management expenses and actual total Fund expenses, each graph comparing the relevant information of each Fund with each Fund’s Lipper performance group.
The directors noted that for the period ended December 31, 2005, International Equity Fund’s management fees ranked in the second quintile of its Lipper performance group, with the Fund’s fees the sixth lowest of 15 “peer funds.”The Fund’s contractual management fees at a common asset level were determined by Lipper to be lower than 9 of the 15 funds in its group.The Fund’s management fees were in the second quintile of its Lipper expense universe.The directors noted that Founders has agreed to permanently waive the portion of its management fee for the Fund that exceeds 0.75% of the Fund’s average net assets, and has further agreed to a permanent limitation upon the total expenses of each class of the Fund’s shares.
The directors also considered a brochure provided by Lipper which included information with respect to the profitability of the mutual fund advisory activities conducted by a number of publicly-held cor-
The Fund 43
FACTORS CONSIDERED IN RENEWING THE
ADVISORY AGREEMENT (Unaudited) (continued)
|
porations. Lipper also prepared an analysis providing detailed information with respect to the types of services rendered to various mutual fund complexes under their respective investment advisory contracts.
The directors had been provided with extensive materials with respect to the profitability derived by Founders from providing investment advisory and other services to the Funds as a group and to each Fund individually.
The directors further considered certain indirect benefits received by Founders and its affiliates from providing investment advisory services to the Funds.These included the following:
- Since Founders manages several non-Fund accounts in a style that is similar to that used for certain of the Funds, Founders and its affil- iates realize certain efficiencies in performing the portfolio manage- ment, trading and operational functions related to those accounts;
- The Funds’ brokerage transactions may be executed with brokers that provide research and brokerage services to Founders and its affiliates. These research and brokerage services may be useful to Founders and its affiliates in providing investment services to any of the clients they advise, not just the Funds; and
- Founders receives fees for providing accounting services to the Funds, and affiliates of Founders receive various fees for providing underwriting, shareholder, transfer agency, custody and cash man- agement services to the Funds.
The directors also reviewed a table listing the Funds and corresponding subadvisory accounts managed by Founders, and their respective fee schedules. In their review of this table, the directors noted that Founders provides many services to the Funds in fulfilling its responsibilities under the management agreement that it does not provide to entities for which Founders has assumed subadvisory duties. The directors concluded that the fees paid to Founders under the management agreement are reasonable in relation to the nature and extent of the services provided by Founders to the Funds under the agreement.
After deliberation and discussion of Fund fees and expenses, the directors determined:
- That upon review of the advisory fee structures of the Funds in comparison with the competitive performance groups selected by Lipper, the levels of investment advisory fees paid by the Funds were deemed to be acceptable;
- That the expense ratios of the Funds are acceptable and that Founders continually reviews each Fund’s total expense ratio and has initiated voluntarily expense caps and fee waivers for certain Funds to reduce their expense ratios;
- That the majority of the Funds’ expense ratios increased in 2005 from those experienced in 2004, primarily as a result of declines in Fund assets; and
- That the comparative fee and expense information included in the materials provided by Lipper supports the determination that the advisory and other fees payable by the Funds to Founders and its affiliates are essentially fees which would be similar to those which would have resulted solely from “arm’s-length” bargaining.
With respect to profitability to Founders, the directors reviewed the adviser profitability analysis provided by Lipper, which demonstrated that Founders’ 2005 profitability from providing management services to the Funds was reasonable in comparison to the entities included in the Lipper analysis.
The directors were also advised by independent counsel of the profitability percentage ranges determined by court cases to be acceptable and determined that Founders’ profitability percentage for providing management and other services to the Funds was reasonable.
The directors concluded that Founders’ profits from providing management services to the Funds were reasonable in relationship to the overall services which Founders provides.
The Fund 45
FACTORS CONSIDERED IN RENEWING THE
ADVISORY AGREEMENT (Unaudited) (continued)
|
Economies of Scale
The directors reviewed information provided by Founders which summarized the extent, if any, that both Founders and the Funds would achieve certain economies of scale if the assets of the Funds were to increase.
After review and discussion, the directors considered the extent to which economies of scale and common management are shared with each Fund, including the economies that would be realized from the growth of each Fund’s assets. After such consideration, the directors determined that all of the Funds have structured breakpoints in their advisory fees, which result in fee reductions as the assets of each Fund reach defined levels, and that such fee reductions, when implemented, would benefit all of the applicable Fund’s shareholders through decreases in the Fund’s expense ratio.
Dedication to Regulatory Requirements and Restrictions
An important factor in the directors’ consideration of renewal of the Funds’ management agreement with Founders included the directors’ recognition of the dedication by Founders of stringent adherence to regulatory requirements and restrictions.The directors determined that Founders is dedicated to compliance with all applicable rules and regulations and that the systems of controls which are in place to ensure that the service providers to the Funds, including Founders, and the Funds themselves, maintain strict adherence to the law are excellent.
The directors determined that they are generally satisfied with the performance of the Funds and with the quality of the advisory and other services being provided by Founders and its affiliates to the Funds. The directors recognized that overall Fund performance has improved in recent years and that efforts are being and will continue to be made to enhance such improvements and to maintain Fund expense ratios at reasonable and acceptable levels.
The directors concluded that continuation of the current management agreement between each Fund and Founders, which would enable each Fund to continue to receive investment advisory services from Founders, is in the best interests of each Fund and its shareholders, the services to be performed under the management agreement are services required for the operations of the Funds, Founders has provided satisfactory investment management services to the Funds in the past, and the fees for the management services which Founders will perform will be within the range of what would have been negotiated at arm’s length in light of the circumstances.
The Fund 47
YOUR BOARD REPRESENTATIVES (Unaudited)
The Board of Directors of the Company oversees all 8 Dreyfus Founders Funds.The business and affairs of the Company are managed under the direction of the Board. The directors serving on the Board perform their responsibilities in the manner which they reasonably believe to be in the best interests of the Funds and their shareholders.
All of the directors,as listed below,are independent directors.They are not affiliated with the Fund ‘s adviser, its parent company, or its affiliates.The directors have no official term of office and generally serve until they retire (normally at age 75, but subject to extension to age 80), resign, or are not re-elected.As you can see from their backgrounds, the directors have broad experience as active or former business and community leaders.
Eugene H.Vaughan, CFA, 73.Year elected to the Board: 1970
Board Chairman. Founding Chairman,Vaughan Nelson Investment Management, LP, an investment counseling firm. Director, Encore Bank, Houston. Founding Chairman, Center for Houston’s Future, a non-profit organization. Founding Chairman and former Governor, CFA Institute. Past Chairman and Trustee, Institute of Chartered Financial Analysts. Past Chairman and Director, Financial Analysts Federation. Chairman-elect, University of Texas Health Science Center.
Alan S. Danson, 67.Year elected to the Board: 1991
Private investor. Formerly, President and Director, D.H. Management, Inc., the general partner of a limited partnership with technology company holdings (1996 to 2003). Director, Gore Range Natural Science School and The Les Streeter Program, Inc., both of which are non-profit organizations.
Robert P. Mastrovita, 62.Year elected to the Board: 1998
Private investor. Chairman of a private charitable foundation (1997 to present). Formerly, Chairman and Director, Hagler, Mastrovita & Hewitt, Inc., a registered investment adviser (1982 to 1997). Member, Boston Society of Security Analysts. Trustee, Partridge Academy.
Trygve E. Myhren, 70.Year elected to the Board: 1996
President, Myhren Media, Inc., a firm that invests in and advises media, telecommunications, Internet and software companies. Special Limited Partner and member of Investment Committee, Megunticook Funds, a venture capital firm (1998 to present). Director,Advanced Marketing Services, Inc.Trustee and Chairman of Finance Committee, the University of Denver.Trustee, Denver Art Museum. Member, Cable
Television Hall of Fame. Formerly, President (1990 to 1996) and Director (1992 to 2001) of the Providence Journal Company, a diversified media and communications company. Formerly, Chairman and Chief Executive Officer of American Television and Communications Corporation (now Timer Warner Cable) (1981 to 1988). Formerly, Chairman of the National Cable Television Association (1986-1987).
George W. Phillips, 68.Year elected to the Board: 1998
Retired.Vice Chairman of the Board, Chairman of the Finance Committee, and Chairman of the Investment Committee, Children’s Medical Center of Boston. Formerly, President and Chief Executive Officer (1992 to 1997) and Director (1992 to 2002) of Warren Bancorp, Inc. Formerly, President, Chief Executive Officer and Director of Warren Five Cents Savings Bank (1992 to 1997).
Martha A. Solis-Turner, 46.Year elected to the Board: 2005
Formerly, Telecommunications Director, Wholesale Markets (1995 to 2001), and Manager (1990 to 1995), Qwest Communications International Inc. Board member and Treasurer, Mile High Montessori Early Learning Centers (2002 to present), and formerly, Board member (1995 to 2004) and Vice President (2002 to 2004), Curtis Park Community Center, both of which are non-profit organizations.
Thomas F. Eggers, 54. President and Principal Executive Officer of the Funds since 2006. Founders’ Chairman of the Board, President and Chief Executive Officer. President, Chief Executive Officer and a Director of Dreyfus. Chairman of the Board and Chief Executive Officer of the Distributor since 2005. Formerly, President of Scudder Investments (2002 to 2005). Previously employed by Dreyfus from 1996 to 2002, including as President from 2001 to 2002.
David L. Ray, 49.Vice President of the Funds since 2000, and from 1990 to 1998. Founders’ Senior Vice President, Chief Operating Officer and Treasurer. Vice President of the Distributor since 2003. Employed by Founders and its predecessor company since 1990. Formerly,Treasurer of the Funds (1990 to 1998).
Kenneth R. Christoffersen, 51. Secretary of the Funds since 2000, and from 1996 to 1998. Founders’ Senior Vice President-Legal, General Counsel and Secretary. Assistant Secretary of the Distributor since 2003. Employed by Founders and its predecessor company since 1996.
The Fund 49
YOUR BOARD REPRESENTATIVES (Unaudited) (continued)
Jennifer L. Carnes, 35. Treasurer, Principal Financial Officer and Principal Accounting Officer of the Funds since 2006. Manager of Fund Administration for Founders since 2006. Formerly, Founders’ Supervisor of Corporate Actions and Pricing (2002 to 2006), and Corporate Actions and Pricing Specialist (2000 to 2002).
Janelle E. Belcher, 48. Chief Compliance Officer of the Funds since 2004 and Assistant Secretary of the Funds since 2002. Founders’ Vice President - Compliance since 2002. Formerly, Founders’ Manager of Compliance (2000 to 2002) and Securities Compliance Examiner, Staff Accountant and Team Leader for the U.S. Securities and Exchange Commission (1990 to 2000).
Eric D. Naviloff, 38. Assistant Treasurer since 2006. Senior Accounting Manager -Taxable Fixed-Income Funds of Dreyfus, and an officer of 91 investment companies (comprised of 205 portfolios) managed by Dreyfus. Employed by Dreyfus since 1992.
Robert S. Robol, 42.Assistant Treasurer since 2006. Senior Accounting Manager -Money Market and Municipal Bond Funds of Dreyfus, and an officer of 91 investment companies (comprised of 205 portfolios) managed by Dreyfus. Employed by Dreyfus since 1988.
Robert Svagna, 39. Assistant Treasurer since 2006. Senior Accounting Manager -Equity Funds of Dreyfus, and an officer of 91 investment companies (comprised of 205 portfolios) managed by Dreyfus. Employed by Dreyfus since 1990.
William G. Germenis, 36.Anti-Money Laundering Compliance Officer (“AMLCO”) for the Class A, Class B, Class C, Class R, and Class T shares of the Funds since 2002 and for the Class F shares of the Funds since 2003.Vice President and AMLCO of MBSC, LLC since 2002.Vice President and AMLCO of the Distributor and AMLCO of investment companies managed by Dreyfus. Employed by the Distributor since 1998.
The directors and officers may be contacted at Founders’ address appearing on the back cover, except for Messrs. Eggers, Naviloff, Robol, Svagna and Germenis, who can be contacted at The Dreyfus Corporation, 200 Park Avenue, New York, New York 10166.Additional information about the Company’s directors is available in the Statement of Additional Information, which can be obtained free of charge by calling 1-800-525-2440 (Class F shareholders) or 1-800-554-4611 (all other shareholders).
NOTES
For Class F shareholders
Telephone Call your financial representative or 1-800-525-2440
| Mail | | Dreyfus Founders Funds, Inc. |
| | | P.O. Box 55360, Boston, MA 02205-8252 |
| |
|
| |
| For Class A, B, C, R and T shareholders |
| Telephone Call your financial representative or 1-800-554-4611 |
| Mail | | Dreyfus Founders Funds, Inc. |
| | | 144 Glenn Curtiss Boulevard, Uniondale, NY 11556-0144 |
| | |
The fund files its complete schedule of portfolio holdings with the Securities and Exchange Commission (“SEC”) for the first and third quarters of each fiscal year on Form N-Q. The fund’s Forms N-Q are available on the SEC’s website at http://www.sec.gov and may be reviewed and copied at the SEC’s Public Reference Room in Washington, DC. Information on the operation of the Public Reference Room may be obtained by calling 1-800-SEC-0330.
A description of the policies and procedures that the fund uses to determine how to vote proxies relating to portfolio securities, and information regarding how the fund voted these proxies for the 12-month period ended June 30, 2006, is available at http://www.founders.com, http://www.dreyfus.com and on the SEC’s website at http://www.sec.gov. The description of the policies and procedures is also available without charge, upon request, by calling 1-800-645-6561.
This report and the statements it contains are submitted for the general information of our shareholders. The report is not authorized for distribution to prospective investors unless preceded or accompanied by an effective prospectus.
| Founders and Founders Funds are registered trademarks |
| of Founders Asset Management LLC. |
| |
| © 2007 Dreyfus Service Corporation |


Save time. Save paper. View your next shareholder report online as soon as it’s available. To take advantage of this service, simply inform us online of your decision to receive materials through our E-Communications Program. Cut down on mailbox clutter and help the Fund reduce printing and postage charges by enrolling today. It’s simple and only takes a few minutes.
Class F shareholders can log into www.founders.com/ ecommunications, or www.icsdelivery.com if you own funds through a third party.
Class A, B, C, R and T shareholders can log into www.dreyfus.com.
The views expressed in this report reflect those of the portfolio manager only through the end of the period covered and do not necessarily represent the views of Founders or any other person in the Founders organization.Any such views are subject to change at any time based upon market or other conditions and Founders disclaims any responsibility to update such views.These views may not be relied on as investment advice and, because investment decisions for a Dreyfus Founders Fund are based on numerous factors, may not be relied on as an indication of trading intent on behalf of any Dreyfus Founders Fund.
Not FDIC-Insured • Not Bank-Guaranteed • May Lose Value
| Contents |
| |
| | | THE FUND |
| |
|
| 2 | | A Letter from the President |
| 3 | | Discussion of Fund Performance |
| 6 | | Fund Performance |
| 8 | | Understanding Your Fund’s Expenses |
| 8 | | Comparing Your Fund’s Expenses |
| With Those of Other Funds |
| 9 | | Statement of Investments |
| 14 | | Statement of Assets and Liabilities |
| 15 | | Statement of Operations |
| 16 | | Statement of Changes in Net Assets |
| 18 | | Financial Highlights |
| 24 | | Notes to Financial Statements |
| 35 | | Report of Independent Registered |
| | | Public Accounting Firm |
| 36 | | Factors Considered in Renewing |
| the Advisory Agreement |
| 43 | | Your Board Representatives |
| |
| FOR MORE INFORMATION |
|
| | | Back Cover |
| Dreyfus Founders |
| Mid-Cap Growth Fund |
The Fund

A LETTER FROM THE PRESIDENT
Dear Shareholder:
We are pleased to present this annual report for Dreyfus Founders Mid-Cap Growth Fund, covering the 12-month period from January 1, 2006, through December 31, 2006.
2006 proved to be a good year for the financial markets.Virtually all sectors and capitalization ranges of the U.S. equity markets generated strong returns, especially over the second half of the year.A number of positive factors contributed to the markets’ gains in 2006, including an expanding domestic economy, subdued inflation, stabilizing interest rates, rising productivity and robust corporate profits.
In our analysis, 2006 provided an excellent reminder of the need for a long-term investment perspective. Adopting too short a time frame proved costly for some investors last year, as chasing recent winners often meant buying the next month’s losers. Indeed, history shows that reacting to near-term developments with extreme shifts in strategy rarely is the right decision.We believe that a better course of action is to set a portfolio mix to meet future goals, while attempting to ignore short term market fluctuations in favor of a longer-term view.
For information about how the fund performed during the reporting period, as well as market perspectives, we have provided a Discussion of Fund Performance given by the fund’s portfolio manager.
Thank you for your continued confidence and support.We wish you good health and prosperity in 2007.


DISCUSSION OF FUND PERFORMANCE
Daniel E. Crowe, CFA, Portfolio Manager
How did Dreyfus Founders Mid-Cap Growth Fund perform relative to its benchmark?
For the 12-month period ended December 31, 2006, Dreyfus Founders Mid-Cap Growth Fund achieved total returns of 23.93% for Class A Shares, 22.77% for Class B Shares, 23.08% for Class C Shares, 23.85% for Class F Shares, 24.31% for Class R Shares and 22.80% for Class T Shares.1 In comparison, the fund’s benchmark, the Russell Midcap Growth Index (the “Index”), returned 10.66% for the same period.2
Although 2006 proved to be a good year for stocks overall, the market encountered a weak patch in May, when concerns arose regarding higher interest rates and inflationary pressures. However, these worries subsequently eased as the rate of economic growth moderated and interest rates stabilized, and the market rallied over the second half of the year as investor sentiment improved.The fund produced substantially higher returns than its benchmark, due primarily to the success of our security selection strategies in the information technology, materials, industrials and health care sectors.
What is the fund’s investment approach?
The fund seeks capital appreciation by emphasizing investments in the stocks of medium-size companies with favorable growth prospects.The fund also may invest in larger or smaller companies if, in our judgment, they represent better prospects for capital appreciation.We use a “bottom-up” investment approach that relies on fundamental analysis and in-depth research.We look for companies whose fundamental strengths suggest the potential for superior earnings growth over time. We go beyond Wall Street analysis and perform intensive qualitative and quantitative in-house research to determine whether companies meet our investment criteria.
What other factors influenced the fund’s performance?
A market rally in the first quarter of 2006 gave way to a sharp decline in the second quarter as the Federal Reserve Board (the “Fed”) con-
The Fund 3
DISCUSSION OF FUND PERFORMANCE (continued)
|
tinued to raise interest rates, energy prices surged higher and investors’ inflation concerns intensified. However, the market rallied over the second half of the year, more than offsetting previous losses, as slowing economic growth, moderating commodity prices and a pause in the Fed’s tightening campaign relieved investors’ inflation worries.
On a relative basis, the fund had positive net impacts in all but two sectors, with the largest contributions to relative performance being derived from our stock selection in the information technology, materials, industrials and health care sectors. In the technology area, a number of software companies—including Cognos, Micros Systems and Altiris—successfully launched new products in 2006, boosting their stock prices. Increased use of semiconductors in a variety of handheld devices supported gains in holdings such as Freescale Semiconductor. In the materials sector, global demand pushed commodities prices higher during the reporting period, which generally bolstered the performance of holdings such as metals mining and refining company NuCor Corporation. Specialty metals firm Allegheny Technologies was the beneficiary of a contract to supply a major airplane manufacturer with titanium.
Among industrial holdings, commercial printer Cenveo saw its stock price rise as more investors recognized its strong business fundamentals. Access equipment maker JLG Industries benefited from increased demand for its products as higher corn prices, caused by increased ethanol production, allowed farmers to upgrade their equipment.The fund’s exposure to biopharmaceutical companies such as Theravance boosted its relative performance in the health care sector.Theravance currently has five products in development for asthma treatment, two of which are in the late stages of clinical testing. This news was reflected positively in Theravance’s stock price, as investors generally expect the drugs to be successful in coming to market.
Finally, our efforts to uncover specific opportunities among consumer discretionary companies, rather than investing in broader themes within the sector, paid off in an environment of relatively weak consumer spending. Despite headwinds created by a slowing economy, high energy prices and softening home values, specific consumer discretionary holdings, such as Wynn Resorts, performed strongly.
On the other hand, the fund did not participate in a rally in the utilities sector during 2006, which detracted from performance relative to the benchmark. In addition, disappointing stock selections in the energy sector hampered the fund’s return. Oil exploration and production (“E&P”) companies such as Patterson-UTI Energy, BJ Services, Bill Barrett and EOG Resources declined in value as investors became increasingly concerned about underlying volatility in the energy market, particularly in the E&P industry.
What is the fund’s current strategy?
As of year-end, the fund has invested in midcap stocks that fall within three main categories: high-growth companies, stable-growth companies, and companies that we believe are on the verge of a business turnaround. By investing in all three types of stocks, we have attempted to insulate the fund from potentially weak market performance while participating in market rallies. We currently intend to maintain this approach, which we regard as an effective way to reap potential rewards with limited risk.
| | | Midsize companies carry additional risks because their earnings and revenues tend to be |
| | | less predictable and their share prices more volatile than those of larger, more established |
| | | companies. The shares of midsize companies tend to trade less frequently than those of |
| | | larger, more established companies. |
| 1 | | Total return includes reinvestment of dividends and any capital gains paid, and does not take into |
| | | consideration the maximum initial sales charges in the case of Class A and Class T shares, or the |
| | | applicable contingent deferred sales charges imposed on redemptions in the case of Class B and |
| | | Class C shares. Had these charges been reflected, returns would have been lower. Past performance |
| | | is no guarantee of future results. Share price and investment return fluctuate such that upon |
| | | redemption, fund shares may be worth more or less than their original cost. Part of the fund’s |
| | | performance may have been due to amounts received from class action settlements regarding prior |
| | | fund holdings.There is no guarantee that these settlement distributions will occur in the future or |
| | | have a similar impact on performance. |
| 2 | | SOURCE: LIPPER INC. – Reflects reinvestment of net dividends and, where applicable, capital |
| | | gain distributions.The Russell Midcap Growth Index measures the performance of the 800 |
| | | smallest companies in the Russell 1000 Index with higher price-to-book ratios and higher |
| | | forecasted growth values.The total return figures cited for this index assume change in security prices |
| | | and reinvestment of dividends, but do not reflect the costs of managing a mutual fund.The Russell |
| | | 1000 Index measures the performance of the largest 1,000 publicly traded U.S. companies. |
The Fund 5
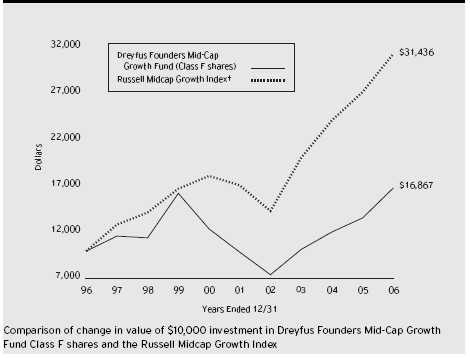
| † Source: Lipper Inc. |
| Past performance is not predictive of future performance. |
| The above graph compares a $10,000 investment made in Class F shares of Dreyfus Founders Mid-Cap Growth Fund |
| on 12/31/96 to a $10,000 investment made in the Russell Midcap Growth Index (the “Index”) on that date. All |
| dividends and capital gain distributions are reinvested. Performance for Class A, Class B, Class C, Class R and Class T |
| shares will vary from the performance of Class F shares shown above due to differences in charges and expenses. |
| The fund’s performance shown in the line graph takes into account all applicable Class F fees and expenses (after any |
| expense reimbursements).The Index measures the performance of those companies among the 800 smallest companies in |
| the Russell 1000 Index with higher price-to-book ratios and higher forecasted growth values.The Russell 1000 Index |
| measures the performance of the largest 1,000 publicly traded U.S. companies.The Index does not take into account |
| charges, fees and other expenses. Further information relating to fund performance, including expense reimbursements, if |
| applicable, is contained in the Financial Highlights section of the prospectus and elsewhere in this report. |
| Average Annual Total Returns as of 12/31/06 | | | | | | |
| |
| | | Inception | | | | | | | | From |
| | | Date | | 1 Year | | 5 Years | | 10 Years | | Inception |
| |
| |
| |
| |
| |
|
| Class A shares | | | | | | | | | | |
| with maximum sales charge (5.75%) | | 12/31/99 | | 16.70% | | 9.71% | | — | | (0.64)% |
| without sales charge | | 12/31/99 | | 23.93% | | 11.01% | | — | | 0.20% |
| Class B shares | | | | | | | | | | |
| with applicable redemption charge † | | 12/31/99 | | 18.77% | | 9.89% | | — | | (0.36)% |
| without redemption | | 12/31/99 | | 22.77% | | 10.16% | | — | | (0.36)% |
| Class C shares | | | | | | | | | | |
| with applicable redemption charge †† | | 12/31/99 | | 22.08% | | 10.12% | | — | | (0.65)% |
| without redemption | | 12/31/99 | | 23.08% | | 10.12% | | — | | (0.65)% |
| Class F shares | | 9/8/61 | | 23.85% | | 11.28% | | 5.37% | | N/A |
| Class R shares | | 12/31/99 | | 24.31% | | 11.06% | | — | | 0.39% |
| Class T shares | | | | | | | | | | |
| with applicable sales charge (4.5%) | | 12/31/99 | | 17.24% | | 8.91% | | — | | (1.34)% |
| without sales charge | | 12/31/99 | | 22.80% | | 9.92% | | — | | (0.69)% |
Past performance is not predictive of future performance.The fund’s performance shown in the graph and table does not reflect the deduction of taxes that a shareholder would pay on fund distributions or the redemption of fund shares. Part of the fund’s performance is due to amounts received from class action settlements regarding prior fund holdings.There is no guarantee that these settlement distributions will occur in the future or have a similar impact on performance.
Performance for Class B shares assumes the conversion of Class B shares to Class A shares at the end of the sixth year following the date of purchase.
| † | | The maximum contingent deferred sales charge for Class B shares is 4%. After six years Class B shares convert to |
| | | Class A shares. |
| †† | | The maximum contingent deferred sales charge for Class C shares is 1% for shares redeemed within one year of the |
| | | date of purchase. |
The Fund 7
UNDERSTANDING YOUR FUND’S EXPENSES (Unaudited)
As a mutual fund investor, you pay ongoing expenses, such as management fees and other expenses. Using the information below, you can estimate how these expenses affect your investment and compare them with the expenses of other funds.You also may pay one-time transaction expenses, including sales charges (loads) and redemption fees, which are not shown in this section and would have resulted in higher total expenses. For more information, see your fund's prospectus or talk to your financial advisor.
Review your fund’s expenses
|
The table below shows the expenses you would have paid on a $1,000 investment in Dreyfus Founders Mid-Cap Growth Fund from July 1, 2006 to December 31, 2006. It also shows how much a $1,000 investment would be worth at the close of the period, assuming actual returns and expenses.To estimate the expenses you paid on your account over this period, simply divide your account value by $1,000 (for example, an $8,600 account value divided by $1,000 = 8.60), then multiply the results by the number in the Expenses paid per $1,000 line for the class of shares you own.
| Expenses and Value of a $1,000 Investment | | | | | | |
| assuming actual returns for the six months ended December 31, 2006 | | | | |
| | | Class A | | Class B | | Class C | | Class F | | Class R | | Class T |
| |
| |
| |
| |
| |
| |
|
| Expenses paid | | | | | | | | | | | | |
| per $1,000 † | | $ 7.71 | | $ 12.34 | | $ 11.65 | | $ 7.17 | | $ 6.00 | | $ 11.16 |
| Ending value | | | | | | | | | | | | |
| (after expenses) | | $1,124.00 | | $1,120.20 | | $1,119.30 | | $1,123.30 | | $1,126.40 | | $1,119.30 |
| COMPARING YOUR FUND’S EXPENSES |
| WITH THOSE OF OTHER FUNDS (Unaudited) |
Using the SEC’s method to compare expenses
The Securities and Exchange Commission (SEC) has established guidelines to help investors assess fund expenses. Per these guidelines, the table below shows your fund's expenses based on a $1,000 investment, assuming a hypothetical 5% annualized return. You can use this information to compare the ongoing expenses (but not transaction expenses or total cost) of investing in the fund with those of other funds.All mutual fund shareholder reports will provide this information to help you make this comparison. Please note that you cannot use this information to estimate your actual ending account balance and expenses paid during the period.
| Expenses and Value of a $1,000 Investment |
| assuming a hypothetical 5% annualized return for the six months ended December 31, 2006 |
| | | Class A | | Class B | | Class C | | Class F | | Class R | | Class T |
| |
| |
| |
| |
| |
| |
|
| Expenses paid | | | | | | | | | | | | |
| per $1,000 † | | $ 7.32 | | $ 11.72 | | $ 11.07 | | $ 6.82 | | $ 5.70 | | $ 10.61 |
| Ending value | | | | | | | | | | | | |
| (after expenses) | | $1,017.95 | | $1,013.56 | | $1,014.22 | | $1,018.45 | | $1,019.56 | | $1,014.67 |
| † Expenses are equal to the fund’s annualized expense ratio of 1.44% for Class A shares, 2.31% for Class B shares, |
| 2.18% for Class C shares, 1.34% for Class F shares, 1.12% for Class R shares and 2.09% for Class T shares; |
| multiplied by the average account value over the period, multiplied by 184/365 (to reflect the one-half year period). |
STATEMENT OF INVESTMENTS
December 31, 2006
|
| Common Stocks—95.7% | | Shares | | Value ($) |
| |
| |
|
| Advertising—2.0% | | | | |
| R. H. Donnelley | | 59,500 | | 3,732,435 |
| Aerospace & Defense—4.8% | | | | |
| Empresa Brasileira de Aeronautica, ADR | | 55,800 | | 2,311,794 |
| L-3 Communications Holdings | | 33,000 | | 2,698,740 |
| Precision Castparts | | 48,000 | | 3,757,440 |
| | | | | 8,767,974 |
| Application Software—4.7% | | | | |
| Altiris | | 122,000 a | | 3,096,360 |
| Blackboard | | 66,500 a | | 1,997,660 |
| Cognos | | 83,000 a | | 3,524,180 |
| | | | | 8,618,200 |
| Asset Management & Custody Banks—2.2% | | |
| Legg Mason | | 14,000 | | 1,330,700 |
| Northern Trust | | 46,000 | | 2,791,740 |
| | | | | 4,122,440 |
| Biotechnology—2.4% | | | | |
| Amylin Pharmaceuticals | | 68,000 a | | 2,452,760 |
| Vertex Pharmaceuticals | | 51,500 a | | 1,927,130 |
| | | | | 4,379,890 |
| Casinos & Gaming—3.5% | | | | |
| Scientific Games, Cl. A | | 148,000 a | | 4,474,040 |
| Wynn Resorts | | 20,200 | | 1,895,770 |
| | | | | 6,369,810 |
| Commercial & Professional Services—3.6% | | |
| Cenveo | | 310,000 a | | 6,572,000 |
| Communications Equipment—.9% | | | | |
| JDS Uniphase | | 103,750 a | | 1,728,475 |
| Computer Hardware—2.3% | | | | |
| Diebold | | 91,000 | | 4,240,600 |
| Computer Storage & Peripherals—3.7% | | |
| SanDisk | | 44,000 a | | 1,893,320 |
| Seagate Technology | | 186,000 | | 4,929,000 |
| | | | | 6,822,320 |
The Fund 9
STATEMENT OF INVESTMENTS (continued)
|
| Common Stocks (continued) | | Shares | | Value ($) |
| |
| |
|
| Construction, Farm Machinery & Heavy Trucks—2.2% | | |
| Joy Global | | 49,000 | | 2,368,660 |
| Terex | | 26,000 a | | 1,679,080 |
| | | | | 4,047,740 |
| Consumer Electronics—2.2% | | | | |
| Harman International Industries | | 41,500 | | 4,146,265 |
| Data Processing & Outsourced Services—2.0% | | |
| CheckFree | | 46,000 a | | 1,847,360 |
| Paychex | | 47,000 | | 1,858,380 |
| | | | | 3,705,740 |
| Electronic Equipment Manufacturers—1.1% | | |
| Agilent Technologies | | 58,000 a | | 2,021,300 |
| Health Care Equipment—2.1% | | | | |
| Cytyc | | 68,000 a | | 1,924,400 |
| Mettler-Toledo International | | 25,500 a | | 2,010,675 |
| | | | | 3,935,075 |
| Health Care Services—3.6% | | | | |
| Omnicare | | 52,000 | | 2,008,760 |
| Pediatrix Medical Group | | 95,000 a | | 4,645,500 |
| | | | | 6,654,260 |
| Health Care Supplies—2.1% | | | | |
| Advanced Medical Optics | | 51,000 a | | 1,795,200 |
| Dade Behring Holdings | | 53,000 | | 2,109,930 |
| | | | | 3,905,130 |
| Home Entertainment Software—1.0% | | |
| Activision | | 105,000 a | | 1,810,200 |
| Home Furnishing Retail—1.8% | | | | |
| Bed Bath & Beyond | | 86,500 a | | 3,295,650 |
| Household Products—1.7% | | | | |
| Clorox | | 50,000 | | 3,207,500 |
| Housewares & Specialties—2.1% | | | | |
| Jarden | | 108,800 a | | 3,785,152 |
| Integrated Telecommunication Services—1.2% | | |
| Embarq | | 42,000 | | 2,207,520 |
| Internet Retail—1.2% | | | | |
| VistaPrint | | 67,000 a | | 2,218,370 |
| Common Stocks (continued) | | Shares | | Value ($) |
| |
| |
|
| Investment Banking & Brokerage—2.0% | | |
| Lazard, Cl. A | | 77,150 | | 3,652,281 |
| Leisure Products—1.3% | | | | |
| Pool | | 60,000 | | 2,350,200 |
| Life Sciences Tools & Services—.9% | | |
| Invitrogen | | 30,000 a | | 1,697,700 |
| Metal & Glass Containers—3.1% | | | | |
| Ball | | 131,000 | | 5,711,600 |
| Movies & Entertainment—2.8% | | | | |
| Live Nation | | 230,000 a | | 5,152,000 |
| Multi-Line Insurance—1.7% | | | | |
| Arch Capital Group | | 46,000 a | | 3,110,060 |
| Office Services & Supplies—1.3% | | | | |
| Herman Miller | | 68,000 | | 2,472,480 |
| Oil & Gas Equipment & Services—2.5% | | |
| BJ Services | | 99,500 | | 2,917,340 |
| Weatherford International | | 42,000 a | | 1,755,180 |
| | | | | 4,672,520 |
| Oil & Gas Exploration & Production—1.6% | | |
| Bill Barrett | | 44,500 a | | 1,210,845 |
| Newfield Exploration | | 39,500 a | | 1,815,025 |
| | | | | 3,025,870 |
| Oil Drilling & Services—.5% | | | | |
| Patterson-UTI Energy | | 40,000 | | 929,200 |
| Packaged Foods & Meats—3.3% | | | | |
| Dean Foods | | 83,000 a | | 3,509,240 |
| J.M. Smucker | | 54,500 | | 2,641,615 |
| | | | | 6,150,855 |
| Pharmaceuticals—6.1% | | | | |
| Covance | | 22,000 a | | 1,296,020 |
| New River Pharmaceuticals | | 38,000 a | | 2,078,980 |
| Shire, ADR | | 32,500 | | 2,007,200 |
| Theravance | | 191,000 a | | 5,899,990 |
| | | | | 11,282,190 |
| Real Estate Management & Development—1.5% | | |
| CB Richard Ellis Group, Cl. A | | 81,850 a | | 2,717,420 |
The Fund 11
STATEMENT OF INVESTMENTS (continued)
|
| Common Stocks (continued) | | Shares | | Value ($) |
| |
| |
|
| Restaurants—1.1% | | | | |
| Applebee’s International | | 79,000 | | 1,948,930 |
| Semiconductors—1.9% | | | | |
| Cypress Semiconductor | | 105,000 a | | 1,771,350 |
| Maxim Integrated Products | | 59,000 | | 1,806,580 |
| | | | | 3,577,930 |
| Specialized Finance—.8% | | | | |
| Nasdaq Stock Market | | 48,000 a | | 1,477,920 |
| Steel—1.4% | | | | |
| Allegheny Technologies | | 28,500 | | 2,584,380 |
| Systems Software—1.8% | | | | |
| Micros Systems | | 63,500 a | | 3,346,450 |
| Trucking—1.1% | | | | |
| J.B. Hunt Transport Services | | 93,100 | | 1,933,687 |
| Wireless Telecommunication Services—4.6% | | |
| American Tower, Cl. A | | 113,050 a | | 4,214,504 |
| Leap Wireless International | | 32,000 a | | 1,903,040 |
| NII Holdings | | 37,000 a | | 2,384,280 |
| | | | | 8,501,824 |
| Total Common Stocks | | | | |
| (cost $155,241,768) | | | | 176,589,543 |
| Other Investment—3.6% | | Shares | | Value ($) |
| |
| |
|
| Registered Investment Company; | | | | |
| Dreyfus Institutional Preferred | | | | |
| Plus Money Market Fund | | | | |
| (cost $6,721,000) | | 6,721,000 b | | 6,721,000 |
| |
| |
|
| Total Investments (cost $161,962,768) | | 99.3% | | 183,310,543 |
| Cash and Receivables (Net) | | .7% | | 1,202,135 |
| Net Assets | | 100.0% | | 184,512,678 |
| ADR—American Depository Receipts |
| a | | Non-income producing security. |
| b | | Investment in affiliated money market mutual fund. |
| Portfolio Summary (Unaudited) † | | | | |
| |
| | | Value (%) | | | | Value (%) |
| |
| |
| |
|
| Information Technology | | 19.4 | | Consumer Staples | | 5.1 |
| Consumer Discretionary | | 17.9 | | Energy | | 4.7 |
| Healthcare | | 17.3 | | Materials | | 4.5 |
| Industrials | | 12.9 | | Cash & Equivalents | | 4.3 |
| Financials | | 8.1 | | | | |
| Telecommunications Services | | 5.8 | | | | 100.0 |
| † Based on net assets. |
| See notes to financial statements. |
The Fund 13
STATEMENT OF ASSETS AND LIABILITIES
December 31, 2006
| | | Cost | | Value |
| |
| |
|
| Assets ($): | | | | |
| Investments in securities—See Statement of Investments: | | |
| Unaffiliated issuers | | 155,241,768 | | 176,589,543 |
| Affiliated issuers | | 6,721,000 | | 6,721,000 |
| Cash | | | | 430,683 |
| Receivable for shares of Common Stock subscribed | | 1,038,907 |
| Dividends and interest receivable | | | | 113,231 |
| Prepaid expenses | | | | 12,360 |
| Other assets | | | | 44,866 |
| | | | | 184,950,590 |
| |
| |
|
| Liabilities ($): | | | | |
| Due to Founders Asset Management LLC and affiliates—Note 3(c) | | 179,522 |
| Payable for shares of Common Stock redeemed | | 139,338 |
| Directors’ deferred compensation | | | | 44,866 |
| Accrued expenses | | | | 74,186 |
| | | | | 437,912 |
| |
| |
|
| Net Assets ($) | | | | 184,512,678 |
| |
| |
|
| Composition of Net Assets ($): | | | | |
| Paid-in capital | | | | 173,559,523 |
| Accumulated investment (loss)—net | | | | (38,722) |
| Accumulated net realized gain (loss) on investments | | (10,364,189) |
| Accumulated net unrealized appreciation | | |
| (depreciation) on investments | | | | 21,356,066 |
| |
| |
|
| Net Assets ($) | | | | 184,512,678 |
| Net Asset Value Per Share | | | | | | | | |
| | | Class A | | Class B | | Class C | | Class F | | Class R Class T |
| |
| |
| |
| |
| |
|
| Net Assets ($) | | 21,145,793 | | 1,928,767 | | 9,640,856 | | 147,410,425 | | 4,278,534 108,303 |
| Shares | | | | | | | | | | |
| Outstanding | | 3,648,563 | | 350,953 | | 1,773,658 | | 24,908,244 | | 727,944 19,900 |
| |
| |
| |
| |
| |
|
| Net Asset Value | | | | | | | | | | |
| Per Share ($) | | 5.80 | | 5.50 | | 5.44 | | 5.92 | | 5.88 5.44 |
| |
| See notes to financial statements. | | | | | | | | |
STATEMENT OF OPERATIONS
Year Ended December 31, 2006
|
| Investment Income ($): | | |
| Income: | | |
| Dividends (net of $5,384 foreign taxes withheld at source): | | |
| Unaffiliated issuers | | 745,516 |
| Affiliated issuers | | 127,592 |
| Interest | | 169,916 |
| Total Income | | 1,043,024 |
| Expenses: | | |
| Investment advisory fee—Note 3(a) | | 1,181,851 |
| Shareholder servicing costs—Note 3(c) | | 267,142 |
| Distribution fees—Note 3(b) | | 206,256 |
| Accounting fees—Note 3(c) | | 88,548 |
| Registration fees | | 88,270 |
| Professional fees | | 62,802 |
| Prospectus and shareholders’ reports | | 54,140 |
| Directors’ fees and expenses—Note 3(d) | | 49,511 |
| Loan commitment fees—Note 2 | | 5,605 |
| Custodian fees—Note 3(c) | | 4,111 |
| Interest expense—Note 2 | | 2,936 |
| Miscellaneous | | 4,679 |
| Total Expenses | | 2,015,851 |
| Less—reduction in custody fees | | |
| due to waiver—Note 3(c) | | (17) |
| Less—reduction in custody fees due to | | |
| earnings credits—Note 1(c) | | (7,859) |
| Less—expense offset to broker commisions—Note 1 | | (1,775) |
| Net Expenses | | 2,006,200 |
| Investment (Loss)—Net | | (963,176) |
| |
|
| Realized and Unrealized Gain (Loss) on Investments—Note 4 ($): |
| Net realized gain (loss) on investments | | 20,028,137 |
| Net change in unrealized appreciation (depreciation) on investments | | 10,769,064 |
| Net Realized and Unrealized Gain (Loss) on Investments | | 30,797,201 |
| Net Increase in Net Assets Resulting from Operations | | 29,834,025 |
| |
| See notes to financial statements. | | |
The Fund 15
STATEMENT OF CHANGES IN NET ASSETS
| | | Year Ended December 31, |
| |
|
| | | 2006 | | 2005 |
| |
| |
|
| Operations ($): | | | | |
| Investment (loss)—net | | (963,176) | | (866,779) |
| Net realized gain (loss) on investments | | 20,028,137 | | 19,689,373 |
| Net change in unrealized appreciation | | | | |
| (depreciation) on investments | | 10,769,064 | | (6,069,623) |
| Net Increase (Decrease) in Net Assets | | | | |
| Resulting from Operations | | 29,834,025 | | 12,752,971 |
| |
| |
|
| Capital Stock Transactions ($): | | | | |
| Net proceeds from shares sold: | | | | |
| Class A shares | | 37,467,252 | | 807,085 |
| Class B shares | | 518,095 | | 353,630 |
| Class C shares | | 8,956,013 | | 176,957 |
| Class F shares | | 32,755,186 | | 5,627,660 |
| Class R shares | | 5,558,800 | | 257,056 |
| Class T shares | | 71,649 | | 4,021 |
| Cost of shares redeemed: | | | | |
| Class A shares | | (19,186,553) | | (894,064) |
| Class B shares | | (867,550) | | (469,544) |
| Class C shares | | (512,532) | | (114,598) |
| Class F shares | | (22,858,050) | | (27,026,700) |
| Class R shares | | (1,809,667) | | (51,229) |
| Class T shares | | (4,729) | | (13,726) |
| Increase (Decrease) in Net Assets | | | | |
| from Capital Stock Transactions | | 40,087,914 | | (21,343,452) |
| Total Increase (Decrease) in Net Assets | | 69,921,939 | | (8,590,481) |
| |
| |
|
| Net Assets ($): | | | | |
| Beginning of Period | | 114,590,739 | | 123,181,220 |
| End of Period | | 184,512,678 | | 114,590,739 |
| Accumulated investment (loss)—net | | (38,722) | | (21,525) |
| | | Year Ended December 31, |
| |
|
| | | 2006 | | 2005 |
| |
| |
|
| Capital Share Transactions: | | | | |
| Class Aa | | | | |
| Shares sold | | 7,083,331 | | 190,179 |
| Shares redeemed | | (3,788,704) | | (208,547) |
| Net Increase (Decrease) in Shares Outstanding | | 3,294,627 | | (18,368) |
| |
| |
|
| Class B a | | | | |
| Shares sold | | 103,687 | | 84,947 |
| Shares redeemed | | (173,743) | | (118,554) |
| Net Increase (Decrease) in Shares Outstanding | | (70,056) | | (33,607) |
| |
| |
|
| Class C | | | | |
| Shares sold | | 1,749,691 | | 44,048 |
| Shares redeemed | | (100,366) | | (27,892) |
| Net Increase (Decrease) in Shares Outstanding | | 1,649,325 | | 16,156 |
| |
| |
|
| Class F | | | | |
| Shares sold | | 6,102,380 | | 1,291,586 |
| Shares redeemed | | (4,250,707) | | (6,397,317) |
| Net Increase (Decrease) in Shares Outstanding | | 1,851,673 | | (5,105,731) |
| |
| |
|
| Class R | | | | |
| Shares sold | | 1,011,954 | | 57,080 |
| Shares redeemed | | (346,756) | | (11,295) |
| Net Increase (Decrease) in Shares Outstanding | | 665,198 | | 45,785 |
| |
| |
|
| Class T | | | | |
| Shares sold | | 13,519 | | 906 |
| Shares redeemed | | (979) | | (3,512) |
| Net Increase (Decrease) in Shares Outstanding | | 12,540 | | (2,606) |
| a | | During the period ended December 31, 2006, 80,660 Class B shares representing $404,799 were automatically |
| | | converted to 76,944 Class A shares and during the period ended December 31, 2005, 35,264 Class B shares |
| | | representing $135,010 were automatically converted to 33,965 Class A shares. |
| See notes to financial statements. |
The Fund 17
The following tables describe the performance for each share class for the fiscal periods indicated. All information (except portfolio turnover rate) reflects financial results for a single fund share.Total return shows how much your investment in the fund would have increased (or decreased) during each period, assuming you had reinvested all dividends and distributions.These figures have been derived from the fund’s financial statements.
| | | | | | | Year Ended December 31, | | |
| | | |
| |
| |
|
| Class A Shares | | 2006 | | 2005 | | 2004 | | 2003 | | 2002 |
| |
| |
| |
| |
| |
|
| Per Share Data ($): | | | | | | | | | | |
| Net asset value, beginning of period | | 4.68 | | 4.15 | | 3.52 | | 2.58 | | 3.44 |
| Investment Operations: | | | | | | | | | | |
| Investment income (loss)—net | | (.04)a | | (.05) | | (.03) | | .03 | | (.04) |
| Net realized and unrealized | | | | | | | | | | |
| gain (loss) on investments | | 1.16 | | .58 | | .66 | | .91 | | (.82) |
| Total from Investment Operations | | 1.12 | | .53 | | .63 | | .94 | | (.86) |
| Net asset value, end of period | | 5.80 | | 4.68 | | 4.15 | | 3.52 | | 2.58 |
| |
| |
| |
| |
| |
|
| Total Return (%) b | | 23.93 | | 12.77 | | 17.90 | | 36.43 | | (25.00) |
| |
| |
| |
| |
| |
|
| Ratios/Supplemental Data (%): | | | | | | | | | | |
| Ratio of total expenses | | | | | | | | | | |
| to average net assets | | 1.40 | | 1.58 | | 1.54 | | 1.87 | | 2.15 |
| Ratio of net expenses | | | | | | | | | | |
| to average net assets | | 1.39 | | 1.55 | | 1.53 | | 1.86 | | 2.15 |
| Ratio of net investment (loss) | | | | | | | | | | |
| to average net assets | | (.68) | | (.92) | | (1.07) | | (1.38) | | (1.81) |
| Portfolio Turnover Rate c | | 104 | | 211 | | 147 | | 160 | | 216 |
| |
| |
| |
| |
| |
|
| Net Assets, end of period ($ x 1,000) | | 21,146 | | 1,656 | | 1,546 | | 1,191 | | 476 |
| |
| a | | Based on average shares outstanding at each month end. | | | | | | | | |
| b | | Exclusive of sales charge. | | | | | | | | | | |
| c | | Portfolio Turnover Rate is a measure of portfolio activity that is calculated by dividing the lesser of purchases or sales |
| | | of securities, excluding securities having maturity dates at acquisition of one year or less, by the average value of the |
| | | portfolio securities held during the period, which is a rolling 12-month period. | | | | |
| See notes to financial statements. | | | | | | | | | | |
| | | | | | | Year Ended December 31, | | |
| | | |
| |
| |
|
| Class B Shares | | 2006 | | 2005 | | 2004 | | 2003 | | 2002 |
| |
| |
| |
| |
| |
|
| Per Share Data ($): | | | | | | | | | | |
| Net asset value, beginning of period | | 4.48 | | 4.01 | | 3.43 | | 2.54 | | 3.39 |
| Investment Operations: | | | | | | | | | | |
| Investment (loss)—net | | (.08)a | | (.09) | | (.07) | | (.03) | | (.05) |
| Net realized and unrealized | | | | | | | | | | |
| gain (loss) on investments | | 1.10 | | .56 | | .65 | | .92 | | (.80) |
| Total from Investment Operations | | 1.02 | | .47 | | .58 | | .89 | | (.85) |
| Net asset value, end of period | | 5.50 | | 4.48 | | 4.01 | | 3.43 | | 2.54 |
| |
| |
| |
| |
| |
|
| Total Return (%) b | | 22.77 | | 11.72 | | 16.91 | | 35.04 | | (25.07) |
| |
| |
| |
| |
| |
|
| Ratios/Supplemental Data (%): | | | | | | | | | | |
| Ratio of total expenses | | | | | | | | | | |
| to average net assets | | 2.29 | | 2.43 | | 2.37 | | 2.65 | | 2.68 |
| Ratio of net expenses | | | | | | | | | | |
| to average net assets | | 2.29 | | 2.41 | | 2.37 | | 2.64 | | 2.67 |
| Ratio of net investment (loss) | | | | | | | | | | |
| to average net assets | | (1.60) | | (1.78) | | (1.90) | | (2.16) | | (2.33) |
| Portfolio Turnover Rate c | | 104 | | 211 | | 147 | | 160 | | 216 |
| |
| |
| |
| |
| |
|
| Net Assets, end of period ($ x 1,000) | | 1,929 | | 1,886 | | 1,823 | | 1,587 | | 969 |
| |
| a | | Based on average shares outstanding at each month end. | | | | | | | | |
| b | | Exclusive of sales charge. | | | | | | | | | | |
| c | | Portfolio Turnover Rate is a measure of portfolio activity that is calculated by dividing the lesser of purchases or sales |
| | | of securities, excluding securities having maturity dates at acquisition of one year or less, by the average value of the |
| | | portfolio securities held during the period, which is a rolling 12-month period. | | | | |
| See notes to financial statements. | | | | | | | | | | |
The Fund 19
FINANCIAL HIGHLIGHTS (continued)
|
| | | | | | | Year Ended December 31, | | |
| | | |
| |
| |
|
| Class C Shares | | 2006 | | 2005 | | 2004 | | 2003 | | 2002 |
| |
| |
| |
| |
| |
|
| Per Share Data ($): | | | | | | | | | | |
| Net asset value, beginning of period | | 4.42 | | 3.96 | | 3.38 | | 2.50 | | 3.36 |
| Investment Operations: | | | | | | | | | | |
| Investment (loss)—net | | (.06)a | | (.02) | | (.06)a | | (.10) | | (.08) |
| Net realized and unrealized | | | | | | | | | | |
| gain (loss) on investments | | 1.08 | | .48 | | .64 | | .98 | | (.78) |
| Total from Investment Operations | | 1.02 | | .46 | | .58 | | .88 | | (.86) |
| Net asset value, end of period | | 5.44 | | 4.42 | | 3.96 | | 3.38 | | 2.50 |
| |
| |
| |
| |
| |
|
| Total Return (%) b | | 23.08 | | 11.62 | | 17.16 | | 35.20 | | (25.60) |
| |
| |
| |
| |
| |
|
| Ratios/Supplemental Data (%): | | | | | | | | | | |
| Ratio of total expenses | | | | | | | | | | |
| to average net assets | | 2.19 | | 2.35 | | 2.32 | | 2.51 | | 3.04 |
| Ratio of net expenses | | | | | | | | | | |
| to average net assets | | 2.18 | | 2.32 | | 2.31 | | 2.51 | | 2.99 |
| Ratio of net investment (loss) | | | | | | | | | | |
| to average net assets | | (1.27) | | (1.69) | | (1.83) | | (2.02) | | (2.65) |
| Portfolio Turnover Rate c | | 104 | | 211 | | 147 | | 160 | | 216 |
| |
| |
| |
| |
| |
|
| Net Assets, end of period ($ x 1,000) | | 9,641 | | 550 | | 428 | | 323 | | 274 |
| |
| a | | Based on average shares outstanding at each month end. | | | | | | | | |
| b | | Exclusive of sales charge. | | | | | | | | | | |
| c | | Portfolio Turnover Rate is a measure of portfolio activity that is calculated by dividing the lesser of purchases or sales |
| | | of securities, excluding securities having maturity dates at acquisition of one year or less, by the average value of the |
| | | portfolio securities held during the period, which is a rolling 12-month period. | | | | |
| See notes to financial statements. | | | | | | | | | | |
| | | | | Year Ended December 31, | | |
| |
| |
| |
|
| Class F Shares | | 2006 | | 2005 | | 2004 | | 2003 | | 2002 |
| |
| |
| |
| |
| |
|
| Per Share Data ($): | | | | | | | | | | |
| Net asset value, beginning of period | | 4.78 | | 4.24 | | 3.58 | | 2.62 | | 3.47 |
| Investment Operations: | | | | | | | | | | |
| Investment income (loss)—net | | (.03)a | | (.12) | | (.03)a | | .02 | | (.04) |
| Net realized and unrealized | | | | | | | | | | |
| gain (loss) on investments | | 1.17 | | .66 | | .69 | | .94 | | (.81) |
| Total from Investment Operations | | 1.14 | | .54 | | .66 | | .96 | | (.85) |
| Net asset value, end of period | | 5.92 | | 4.78 | | 4.24 | | 3.58 | | 2.62 |
| |
| |
| |
| |
| |
|
| Total Return (%) | | 23.85 | | 12.74 | | 18.44 | | 36.64 | | (24.50) |
| |
| |
| |
| |
| |
|
| Ratios/Supplemental Data (%): | | | | | | | | | | |
| Ratio of total expenses | | | | | | | | | | |
| to average net assets | | 1.33 | | 1.41 | | 1.33 | | 1.51 | | 1.56 |
| Ratio of net expenses | | | | | | | | | | |
| to average net assets | | 1.33 | | 1.39 | | 1.33 | | 1.50 | | 1.56 |
| Ratio of net investment (loss) | | | | | | | | | | |
| to average net assets | | (.62) | | (.77) | | (.87) | | (1.01) | | (1.22) |
| Portfolio Turnover Rate b | | 104 | | 211 | | 147 | | 160 | | 216 |
| |
| |
| |
| |
| |
|
| Net Assets, end of period ($ x 1,000) | | 147,410 | | 110,170 | | 119,273 | | 159,161 | | 89,970 |
| a | | Based on average shares outstanding at each month end. |
| b | | Portfolio Turnover Rate is a measure of portfolio activity that is calculated by dividing the lesser of purchases or sales |
| | | of securities, excluding securities having maturity dates at acquisition of one year or less, by the average value of the |
| | | portfolio securities held during the period, which is a rolling 12-month period. |
| See notes to financial statements. |
The Fund 21
FINANCIAL HIGHLIGHTS (continued)
|
| | | | | | | Year Ended December 31, | | |
| | | |
| |
| |
|
| Class R Shares | | 2006 | | 2005 | | 2004 | | 2003 | | 2002 |
| |
| |
| |
| |
| |
|
| Per Share Data ($): | | | | | | | | | | |
| Net asset value, beginning of period | | 4.73 | | 4.19 | | 3.56 | | 2.61 | | 3.48 |
| Investment Operations: | | | | | | | | | | |
| Investment (loss)—net | | (.02)a | | (.02)a | | (.04)a | | (.03) | | (.04) |
| Net realized and unrealized | | | | | | | | | | |
| gain (loss) on investments | | 1.17 | | .56 | | .67 | | .98 | | (.83) |
| Total from Investment Operations | | 1.15 | | .54 | | .63 | | .95 | | (.87) |
| Net asset value, end of period | | 5.88 | | 4.73 | | 4.19 | | 3.56 | | 2.61 |
| |
| |
| |
| |
| |
|
| Total Return (%) | | 24.31 | | 12.89 | | 17.70 | | 36.40 | | (25.00) |
| |
| |
| |
| |
| |
|
| Ratios/Supplemental Data (%): | | | | | | | | | | |
| Ratio of total expenses | | | | | | | | | | |
| to average net assets | | 1.14 | | 1.38 | | 1.48 | | 1.64 | | 3.49 |
| Ratio of net expenses | | | | | | | | | | |
| to average net assets | | 1.12 | | 1.34 | | 1.48 | | 1.64 | | 1.97 |
| Ratio of net investment (loss) | | | | | | | | | | |
| to average net assets | | (.28) | | (.70) | | (1.03) | | (1.15) | | (1.63) |
| Portfolio Turnover Rate b | | 104 | | 211 | | 147 | | 160 | | 216 |
| |
| |
| |
| |
| |
|
| Net Assets, end of period ($ x 1,000) | | 4,279 | | 297 | | 71 | | 119 | | 77 |
| |
| a | | Based on average shares outstanding at each month end. | | | | | | | | |
| b | | Portfolio Turnover Rate is a measure of portfolio activity that is calculated by dividing the lesser of purchases or sales |
| | | of securities, excluding securities having maturity dates at acquisition of one year or less, by the average value of the |
| | | portfolio securities held during the period, which is a rolling 12-month period. | | | | |
| See notes to financial statements. | | | | | | | | | | |
| | | | | | | Year Ended December 31, | | |
| | | |
| |
| |
|
| Class T Shares | | 2006 | | 2005 | | 2004 | | 2003 | | 2002 |
| |
| |
| |
| |
| |
|
| Per Share Data ($): | | | | | | | | | | |
| Net asset value, beginning of period | | 4.43 | | 3.97 | | 3.39 | | 2.51 | | 3.39 |
| Investment Operations: | | | | | | | | | | |
| Investment (loss)—net | | (.07)a | | (.17) | | (.06) | | (.02) | | (.06) |
| Net realized and unrealized | | | | | | | | | | |
| gain (loss) on investments | | 1.08 | | .63 | | .64 | | .90 | | (.82) |
| Total from Investment Operations | | 1.01 | | .46 | | .58 | | .88 | | (.88) |
| Net asset value, end of period | | 5.44 | | 4.43 | | 3.97 | | 3.39 | | 2.51 |
| |
| |
| |
| |
| |
|
| Total Return (%) b | | 22.80 | | 11.59 | | 17.11 | | 35.06 | | (25.96) |
| |
| |
| |
| |
| |
|
| Ratios/Supplemental Data (%): | | | | | | | | | | |
| Ratio of total expenses | | | | | | | | | | |
| to average net assets | | 2.13 | | 2.59 | | 2.26 | | 2.76 | | 10.30 |
| Ratio of net expenses | | | | | | | | | | |
| to average net assets | | 2.13 | | 2.57 | | 2.25 | | 2.76 | | 3.63 |
| Ratio of net investment (loss) | | | | | | | | | | |
| to average net assets | | (1.39) | | (1.94) | | (1.78) | | (2.27) | | (3.29) |
| Portfolio Turnover Rate c | | 104 | | 211 | | 147 | | 160 | | 216 |
| |
| |
| |
| |
| |
|
| Net Assets, end of period ($ x 1,000) | | 108 | | 33 | | 40 | | 34 | | 20 |
| |
| a | | Based on average shares outstanding at each month end. | | | | | | | | |
| b | | Exclusive of sales charge. | | | | | | | | | | |
| c | | Portfolio Turnover Rate is a measure of portfolio activity that is calculated by dividing the lesser of purchases or sales |
| | | of securities, excluding securities having maturity dates at acquisition of one year or less, by the average value of the |
| | | portfolio securities held during the period, which is a rolling 12-month period. | | | | |
| See notes to financial statements. | | | | | | | | | | |
The Fund 23
NOTES TO FINANCIAL STATEMENTS
NOTE 1—Significant Accounting Policies:
Dreyfus Founders Mid-Cap Growth Fund (the “fund”) is a separate diversified series of Dreyfus Founders Funds, Inc. (the “Company”), which is registered under the Investment Company Act of 1940, as amended (the “Act”), as an open-end management investment company and operates as a series company currently offering eight series, including the fund. The fund’s investment objective is to seek capital appreciation through investments in mid-cap growth companies. Founders Asset Management LLC (the “Manager” or “Founders”) serves as the fund’s investment adviser. Founders is an indirect wholly-owned subsidiary of Mellon Financial Corporation (“Mellon Financial”), a publicly-owned financial services company which provides a comprehensive range of financial products and services in domestic and selected international markets.
On December 4, 2006, Mellon Financial and The Bank of New York Company, Inc. announced that they had entered into a definitive agreement to merge. The new company will be called The Bank of New York Mellon Corporation. As part of this transaction, Founders would become an indirect wholly-owned subsidiary of The Bank of New York Mellon Corporation. The transaction is subject to certain regulatory approvals and the approval of The Bank of New York Company, Inc.’s and Mellon Financial’s shareholders, as well as other customary conditions to closing. Subject to such approvals and the satisfaction of the other conditions, Mellon Financial and The Bank of New York Company, Inc. expect the transaction to be completed in the third quarter of 2007.
Dreyfus Service Corporation (the “Distributor”), the direct owner of Founders and a wholly-owned subsidiary of The Dreyfus Corporation (“Dreyfus”, an affiliate of Founders), is the Distributor of the fund’s shares. The fund is authorized to issue up to 1.15 billion shares of Common Stock, par value $ .01 per share, in the following classes of shares: Class A, Class B, Class C, Class F, Class R and Class T shares. Class A and Class T shares are subject to a sales charge imposed at the time of purchase. Class B shares are subject to a contingent deferred sales
charge (“CDSC”) imposed on Class B share redemptions made within six years of purchase and automatically convert to Class A shares after six years. Class C shares are subject to a CDSC imposed on Class C shares redeemed within one year of purchase. Class F and Class R shares are sold at net asset value (“NAV”) per share. Class F shares are sold only to Class F grandfathered investors, and Class R shares are sold only to eligible institutional investors. Other differences between the classes include the services offered to and the expenses borne by each class. Income and realized and unrealized gains or losses on investments are allocated to each class of shares based on its relative net assets.
Effective June 1, 2006, the fund no longer offers Class B shares, except in connection with dividend reinvestment and permitted exchanges of Class B shares.
Each class of the fund bears expenses incurred specifically on its behalf and, in addition, each class bears a portion of general expenses based on the relative net assets or the number of shareholder accounts of the class.The type of expense determines the allocation method.
The Company’s Board of Directors has authorized the payment of certain fund expenses with commissions on fund portfolio transactions. These commissions reduced miscellaneous expenses and are included in the expense offset to broker commissions in the Statement of Operations.
The fund’s financial statements are prepared in accordance with U.S. generally accepted accounting principles, which requires the use of management estimates and assumptions. Actual results could differ from those estimates.
In the normal course of business, the fund may enter into contracts and agreements that contain a variety of representations and warranties, and which provide general indemnifications. The maximum exposure to the fund under these arrangements is unknown, as this would involve future claims that may be made against the fund that have not yet occurred. However, based on experience, the fund expects the risks of loss to be remote.
The Fund 25
NOTES TO FINANCIAL STATEMENTS (continued)
|
(a) Portfolio valuation: A domestic equity security listed or traded on a securities exchange or in the over-the-counter market is valued at its last sale price on the exchange or market where it is principally traded or, in the case of a security traded on NASDAQ, at its official closing price. Lacking any sales on that day, the security is valued at the current closing bid price, or by quotes from dealers making a market in the security if the closing bid price is not available, or in the case of written call options, at the mean between the highest bid and lowest asked quotations obtained from at least two securities dealers.
A foreign equity security traded on a foreign exchange is valued at the last quoted official closing price available before the time when the fund’s assets are valued, or at the last quoted sales price if the exchange does not provide an official closing price or if the foreign market has not yet closed. Lacking any sales that day, the security is valued at the current closing bid price, or by quotes from dealers making a market in the security if the closing bid price is not available. New York closing exchange rates are used to convert foreign currencies to U.S. dollars.
A debt security with a remaining maturity greater than 60 days at the time of purchase is valued in accordance with the evaluated bid price supplied by a pricing service approved by the Company’s Board of Directors or, if such price is not available, at the mean between the highest bid and lowest asked quotations obtained from at least two securities dealers. A debt security with a remaining maturity of 60 days or less at the time of purchase is valued at amortized cost, which approximates market value, unless it is determined that amortized cost would not represent market value, in which case the securities would be marked to market.
If market quotations or official closing prices are not readily available or are determined not to reflect accurately fair value, securities will be valued at their fair value as determined in good faith by the Company’s Board of Directors or pursuant to procedures approved by the Board of Directors.These situations may include instances where an event occurs after the close of the market on which a security is traded but before the fund calculates its NAV, and it is determined that
the event has materially affected the value of the security. Fair value of foreign equity securities may be determined with the assistance of a pricing service using correlations between the movement of prices of foreign securities and indexes of domestic securities and other appropriate indicators, such as closing market prices of relevant ADRs and futures contracts.
Investments in registered investment companies are valued at their NAV.
Using fair value to price securities requires the use of estimates, and as such, may result in a value that is different from a security’s most recent closing price and from the prices used by other mutual funds to calculate their NAV’s. In addition, it is possible that the fair value determined for a security may be different from the value that may be realized upon the security’s sale, and that these differences may be material to the NAV of the fund.
On September 20, 2006, the Financial Accounting Standards Board (FASB) released Statement of Financial Accounting Standards No. 157 “Fair Value Measurements” (“FAS 157”). FAS 157 establishes an authoritative definition of fair value, sets out a framework for measuring fair value, and requires additional disclosures about fair value measurements. The application of FAS 157 is required for fiscal years beginning after November 15, 2007 and interim periods within those fiscal years. Management does not believe that the application of this standard will have a material impact on the financial statements of the fund.
(b) Foreign Securities and Currency Transactions: The fund may invest at least a portion of its assets in foreign securities. Foreign securities carry more risk than U.S. securities, such as political and currency risks. In the event the fund executes a foreign security transaction, the fund may enter into a foreign currency contract to settle the foreign security transaction.The fund could be exposed to risk if counterpar-ties are unable to meet the terms of the contracts or if the value of the currency changes unfavorably to the U.S. dollar.The resultant foreign currency gain or loss from the contract is recorded as foreign currency gain or loss and is presented as such in the Statement of Operations.
The Fund 27
NOTES TO FINANCIAL STATEMENTS (continued)
|
The accounting records of the fund are maintained in U.S. dollars.The market values of foreign securities, currency holdings and other assets and liabilities are translated into U.S. dollars based on the current exchange rates each business day. Purchases and sales of investment securities and income and expense items denominated in foreign currencies are translated into U.S. dollar amounts on the respective dates of such transactions.
The fund does not isolate that portion of the results of operations resulting from changes in foreign exchange rates on investments from the fluctuations arising from changes in market prices of securities held. Such fluctuations are included with the net unrealized appreciation/(depreciation) from investments and foreign currency translations on the Statement of Operations.
Reported net realized foreign exchange gains or losses arise from sales of foreign currencies, currency gains or losses realized between the trade and settlement dates on securities transactions, and the difference between the amounts of dividends, interest, and foreign withholding taxes recorded on the fund’s books and the U.S. dollar equivalent of the amounts actually received or paid. Net unrealized appreciation or depreciation on investments and foreign currency translation arises from changes in the values of assets and liabilities, including investments in securities held at the date of the financial statements, resulting from changes in the exchange rates and changes in market prices of securities held.
(c) Securities transactions and investment income: Securities transactions are recorded on a trade date basis. Realized gain and loss from securities transactions are recorded on the identified cost basis. Dividend income is recognized on the ex-dividend date and interest income, including, where applicable, accretion of discount and amortization of premium on investments, is recognized on the accrual basis.
The fund has an arrangement with the custodian bank, Mellon Bank, N.A. (“Mellon Bank”), which is an affiliate of Founders, whereby the fund receives earnings credits from the custodian when positive cash
balances are maintained, which are used to offset custody fees. For financial reporting purposes, the fund includes net earnings credits as an expense offset in the Statement of Operations.
(d) Affiliated issuers: Investments in other investment companies advised by the Manager or its affiliates are defined as “affiliated” in the Act.
(e) Dividends to shareholders: Dividends are recorded on the ex-dividend date. Dividends from investment income-net and dividends from net realized capital gain, if any, are normally declared and paid annually, but the fund may make distributions on a more frequent basis to comply with the distribution requirements of the Internal Revenue Code of 1986, as amended (the “Code”).To the extent that net realized capital gain can be offset by capital loss carryovers, it is the policy of the fund not to distribute such gain. Income and capital gain distributions are determined in accordance with income tax regulations, which may differ from U.S. generally accepted accounting principles.
(f) Federal income taxes: No provision has been made for federal income taxes since it is the policy of the fund to continue to comply with the requirements of Subchapter M of the Code that are applicable to regulated investment companies and to make distributions of income and capital gains sufficient to relieve it from all income taxes.The fund is treated as a separate tax entity for federal income tax purposes.
On July 13, 2006, the FASB released FASB Interpretation No. 48 “Accounting for Uncertainty in Income Taxes” (FIN 48). FIN 48 provides guidance for how uncertain tax positions should be recognized, measured, presented and disclosed in the financial statements. FIN 48 requires the evaluation of tax positions taken or expected to be taken in the course of preparing the fund’s tax returns to determine whether the tax positions are “more-likely-than-not” of being sustained by the applicable tax authority.Tax positions not deemed to meet the more-likely-than-not threshold would be recorded as a tax benefit or expense in the current year. Adoption of FIN 48 is required for fiscal years beginning after December 15, 2006 and is to be applied to all open tax
The Fund 29
NOTES TO FINANCIAL STATEMENTS (continued)
|
years as of the effective date.At this time, management is evaluating the implications of FIN 48 and its impact, if any, in the financial statements has not yet been determined.
At December 31, 2006, the components of accumulated earnings on a tax basis were as follows: accumulated capital losses $10,299,189 and unrealized appreciation $21,282,775.
The accumulated capital loss carryover is available to be applied against future net securities profits, if any, realized subsequent to December 31, 2006. If not applied, the carryover expires in fiscal 2010.
During the period ended December 31, 2006, as a result of permanent book to tax differences, primarily due to the tax treatment for net operating losses, the fund increased accumulated undistributed investment income-net $945,979 and decreased paid-in capital by the same amount. Net assets were not affected by this reclassification.
NOTE 2—Bank Line of Credit:
|
The Company has a line of credit arrangement (“LOC”) with State Street Bank and Trust Company, to be used for temporary or emergency purposes, primarily for financing redemption payments. The borrowings by each series of the Company are limited to the lesser of (a) $50 million, or (b) the lesser of 25% of the series’ total net assets or the maximum amount which the series is permitted to borrow pursuant to the prospectus, any law or any other agreement. Combined borrowings are subject to the $50 million cap on the total LOC. Each series agrees to pay annual fees and interest on the unpaid balance based on prevailing market rates as defined in the LOC.
The average daily amount of borrowings outstanding under the LOC during the period ended December 31,2006,was approximately $50,000, with a related weighted average annualized interest rate of 5.89% .
NOTE 3—Investment Advisory Fee and Other Transactions With Affiliates:
(a) In accordance with an investment advisory agreement between the Company and Founders, the fund compensates Founders for its ser-
vices as investment adviser by the payment of fees computed daily and paid monthly at the annual rate equal to a percentage of the average daily value of the fund’s net assets.The fee is 1.00% of the first $30 million of net assets, .75% of the next $270 million of net assets, .70% of the next $200 million of net assets and .65% of net assets in excess of $500 million.
During the period ended December 31, 2006, the fund was advised that the Distributor retained $32,446 and $543 from sales commissions earned on sales of the fund’s Class A and Class T shares, respectively, and $5,416 and $599 from CDSC on redemptions of the fund’s Class B and Class C shares, respectively.
(b) Under the Distribution Plan (the “Plan”) adopted pursuant to Rule 12b-1 under the Act, Class B, Class C and Class T shares pay the Distributor for distributing their shares at an annual rate of .75% of the value of their average daily net assets of Class B and Class C shares and .25% of the value of the average daily net assets of Class T shares. During the period ended December 31, 2006, Class B, Class C and Class T shares were charged $14,169, $19,862 and $142, respectively, pursuant to the Plan.
The fund has adopted a Distribution Plan pursuant to Rule 12b-1 under the Act applicable to its Class F shares. Under the plan, the fund is authorized to reimburse the Distributor for expenses paid for distributing or servicing its Class F shares at an annual rate of up to .25% of the value of the average daily net assets of the fund’s Class F shares. During the period ended December 31, 2006, Class F shares were charged $172,083 pursuant to this Distribution Plan.
(c) Under the Shareholder Services Plan, Class A, Class B, Class C and Class T shares pay the Distributor at an annual rate of .25% of the value of their average daily net assets for the provision of certain services. The services provided may include personal services relating to shareholder accounts, such as answering shareholder inquiries regarding the fund and providing reports and other information, and services related to the maintenance of shareholder accounts. The Distributor may
The Fund 31
NOTES TO FINANCIAL STATEMENTS (continued)
|
make payments to Service Agents (a securities dealer, financial institution or other industry professional) in respect of these services. The Distributor determines the amounts to be paid to Service Agents. During the period ended December 31, 2006, Class A, Class B, Class C and Class T shares were charged $33,613, $4,723, $6,621 and $142, respectively, pursuant to the Shareholder Services Plan.
The Company has a shareholder services agreement with the Distributor, whereby the fund has agreed to compensate the Distributor for providing certain shareholder servicing functions to holders of Class F shares.The fund paid the Distributor a monthly fee equal, on an annual basis, to $24.00 per Class F shareholder account considered to be an open account at any time during a given month. During the period ended December 31, 2006, Class F shares were charged $126,935 pursuant to this shareholder services agreement.
Dreyfus Transfer, Inc. (“DTI”), a wholly-owned subsidiary of Dreyfus, is the transfer and dividend disbursing agent for all of the fund’s share classes.With the exception of out-of-pocket charges, the fees charged by DTI with respect to the fund’s Class F shares are paid by the Distributor. The out-of-pocket charges from DTI are paid by the fund. During the period ended December 31, 2006, Class F shares were charged $53,570 for out-of-pocket transfer agent charges.
The fees charged by DTI with respect to the fund’s Class A, B, C, R and T shares are paid by the fund.These transfer agency fees, including both the per account fees paid to DTI and out-of-pocket charges, during the period ended December 31, 2006 were $14,036.
The fund has agreed to compensate Founders for providing accounting services, administration, compliance monitoring, regulatory and shareholder reporting, as well as related facilities, equipment and clerical help.The fee is computed at the annual rate of .06% of the average daily net assets of the fund on the first $500 million, .04% of the average daily net assets of the fund on the next $500 million and .02% of the average daily net assets of the fund in excess of $1 billion, plus reasonable out-of-pocket expenses. Founders has contractually agreed in
writing to waive any fees received for these services to the extent they exceed Founders’ costs in providing the services. Effective January 1, 2007, Dreyfus replaced Founders as fund accounting and administrative services agent for the fund pursuant to an agreement containing substantially the same terms.
Mellon Bank serves as custodian for the fund.The fees for the custody services are subject to reduction by credits earned on the cash balances of the fund held by the custodian, which are shown as earnings credits on the Statement of Operations. The fund could have employed these assets elsewhere to produce income had it not entered into this arrangement. The custodian contractually agreed in writing to a fee waiver for the Company during the time period and in the amount set forth below:
| Time Period | | Amount of Waiver ($) |
| |
|
| 9/1/05 to 8/31/06 | | $200,000 |
This fee waiver was allocated among the Company’s series in proportion to their respective shares of the total custodian fee. During the period ended December 31, 2006, the fund’s portion of the waiver was $17, which reduced the amount paid to Mellon Bank to $4,094.
The components of Due to Founders Asset Management LLC and affiliates in the Statement of Assets and Liabilities consist of: investment advisory fees $121,012, Rule 12b-1 distribution plan fees $35,167, shareholder services plan fees $22,182 and transfer agency per account fees $1,161.
(d) Annual retainer fees and attendance fees for the Company’s Board of Directors are allocated to each series of the Company based on net assets.The Company’s Board of Directors has adopted a deferred compensation plan for Company directors that enables directors to elect to defer receipt of all or a portion of the annual compensation that they are entitled to receive from the Company. Under the plan, the compensation deferred is invested in shares of one or more of the Company’s series.The amount paid to the director under the plan will
The Fund 33
NOTES TO FINANCIAL STATEMENTS (continued)
|
be determined based upon the performance of the selected series.The current value of these amounts is included in Other Assets and Directors’ Deferred Compensation on the Statement of Assets and Liabilities. Changes in market value are included in the directors’ fees and expenses and the net change in unrealized appreciation/depreciation of investments on the Statement of Operations. Deferral of directors’ fees under the plan does not affect the net assets of the fund.
Certain officers of the Company are also officers and/or directors of Founders or its affiliates, which pay their compensation.The affairs of the fund, including services provided by Founders, are subject to the supervision and general oversight of the Company’s Board of Directors.
(e) Pursuant to an exemptive order from the SEC, the fund may invest its available cash balances in affiliated money market mutual funds. Management fees of the underlying money market mutual funds have been waived by Dreyfus.
NOTE 4—Securities Transactions:
|
The aggregate amount of purchases and sales of investment securities, excluding short-term securities, during the period ended December 31, 2006, amounted to $181,844,790 and $145,532,934 respectively.
At December 31, 2006, the cost of investments for federal income tax purposes was $162,027,768; accordingly, accumulated net unrealized appreciation on investments was $21,282,775, consisting of $24,155,493 gross unrealized appreciation and $2,872,718 gross unrealized depreciation.
REPORT OF INDEPENDENT REGISTERED PUBLIC ACCOUNTING FIRM
To the Board of Directors and Shareholders of Dreyfus Founders Funds, Inc.
In our opinion, the accompanying statement of assets and liabilities, including the statement of investments, and the related statements of operations and of changes in net assets and the financial highlights present fairly, in all material respects, the financial position of Dreyfus Founders Mid-Cap Growth Fund (one of the portfolios constituting Dreyfus Founders Funds, Inc., hereafter referred to as the “Fund”) at December 31, 2006, the results of its operations for the year then ended, the changes in its net assets for each of the two years in the period then ended and the financial highlights for each of the five years in the period then ended, in conformity with accounting principles generally accepted in the United States of America.These financial statements and financial highlights (hereafter referred to as “financial statements”) are the responsibility of the Fund’s management; our responsibility is to express an opinion on these financial statements based on our audits.We conducted our audits of these financial statements in accordance with the standards of the Public Company Accounting Oversight Board (United States).Those standards require that we plan and perform the audit to obtain reasonable assurance about whether the financial statements are free of material misstatement. An audit includes examining, on a test basis, evidence supporting the amounts and disclosures in the financial statements, assessing the accounting principles used and significant estimates made by management, and evaluating the overall financial statement presentation. We believe that our audits, which included confirmation of securities at December 31, 2006 by correspondence with the custodian and brokers, provide a reasonable basis for our opinion.
| | PricewaterhouseCoopers LLP
New York, New York
February 23, 2007
|
The Fund 35
FACTORS CONSIDERED IN RENEWING THE ADVISORY AGREEMENT (Unaudited)
At a meeting of the board of directors of Dreyfus Founders Funds, Inc. (the “Funds” and, in reference to any one of the Funds’ portfolios, a “Fund”) held on August 9 and 10,2006,the Funds’directors unanimously approved the continuation of the Investment Advisory Agreement (“management agreement”) between each of the Funds and Founders Asset Management LLC,the Funds’investment adviser (“Founders”),for a one-year term ending August 31, 2007.The board of directors of the Funds (“board”) is comprised entirely of individuals who have no affiliation with Founders or any affiliates of Founders (the “directors”).
Prior to the directors’ August 2006 meeting, Founders had provided the directors with extensive materials related to the renewal of the management agreement, including performance and expense information for other investment companies with similar investment objectives to each Fund derived from data compiled by Lipper Inc., an independent third party (“Lipper”).
During their meeting, the directors discussed the proposed continuance of the management agreement with the senior management personnel of Founders. At the conclusion of these discussions, the directors and their independent counsel met in a private session at which no representatives of Founders were present, to continue their discussion of continuance of the agreement. In determining to continue the management agreement, the directors considered all factors which they believed to be relevant, including the following:
Nature, Extent and Quality of Services Provided and to be Provided by Founders
The directors recognized that they have had the opportunity to evaluate the investment and non-investment related services which Founders provides to the Funds primarily through their quarterly review of all of the operations of the Funds during Fund committee and Fund board meetings held throughout the past twelve months.At each such meeting, extensive discussions of Fund operations are held with senior management personnel of Founders and a large volume of documentation with respect to these operations is provided to and reviewed by the
directors. Such discussions and documentation afford the directors the continual opportunity to evaluate the nature, extent, and quality of the services provided by Founders and its affiliates to the Funds.
The directors were satisfied that Founders is managing the investment of the assets of the Funds in accordance with each Fund’s respective investment objective, policies and restrictions, subject to the directors’ overall supervision.
The directors considered that Founders also provides many non-investment related services to the Funds in fulfilling its responsibilities under the management agreement.
Following their discussion and review, the directors reached the following conclusions:
- That the breadth and quality of investment advisory and other ser- vices being provided to the Funds are satisfactory, as evidenced in part by the performance records of the Funds, to which the direc- tors gave significant attention as indicated below; and
- That the directors are satisfied not only with the research, long- term portfolio management, and trading services being provided to the Funds, but also recognize that Founders or its affiliates have provided the highest quality accounting, compliance and regula- tory, administrative, underwriting, custody, shareholder, transfer agent and cash management services to the Funds, while charging fair, reasonable and competitive fees.
On a quarterly basis, the directors hold in-person meetings with representatives of the portfolio management team for each Fund (usually a portfolio manager), during which each representative reviews, among other items, performance information, attribution analyses, and the portfolio manager’s investment outlook.The directors also receive written monthly and quarterly performance information for each Fund.
The Fund 37
FACTORS CONSIDERED IN RENEWING THE
ADVISORY AGREEMENT (Unaudited) (continued)
|
In conjunction with their consideration of renewal of the management agreement, the directors received a more detailed performance report about each Fund from Lipper.These reports compared each Fund’s performance to both a relatively small group of similar funds selected by Lipper (the “Lipper performance group”), as well as to all funds in the applicable Lipper category (the “Lipper performance universe”).
Mid-Cap Growth Fund’s performance for the one-year period ended December 31, 2005 placed it in the second quintile of both its Lipper performance group and the Lipper mid-cap growth fund performance universe.The Fund’s performance within its Lipper-selected group and universe for the three-year period ended December 31, 2005 had placed it in the second and first quintiles, respectively, of its Lipper-selected group and universe. For the six-month and one-, three- and five-year periods ended June 30, 2006, the Fund’s performance placed it in the top quintile of its Lipper performance universe.The directors deemed these relative performance results to be very satisfactory, and stressed the importance to Founders of the need to seek to maintain the Fund’s strong performance record.
After consideration of all relevant information and data, the directors concluded that although past performance cannot be a guaranty of future performance, each Fund and its shareholders would continue to benefit from Founders’ investment management of the Fund. The directors further determined:
- That although certain of the Funds have experienced performance difficulties, Founders has focused its efforts upon improving the performance records of the Funds and will continue to seek improvement; and
- That the materials provided by Lipper demonstrated that most of the Funds maintained satisfactory performance quintile rankings in their respective comparison groups and comparison universes, with six of the eight Funds placing in the top two quintiles of their respective Lipper performance universes for the three-years ended December 31, 2005, and five of the eight Funds placing in the top two quintiles for the six months ended June 30, 2006.
Costs of the Services to be Provided and Profits to be Realized by Founders and Its Affiliates from Founders’ Relationship With the Funds
The directors recognized that on a quarterly basis, they receive information with respect to each Fund’s expenses. The directors carefully review and discuss the expense ratios for all classes of shares of each Fund at each of their quarterly meetings throughout the year.
In conjunction with their annual consideration of renewal of the Funds’ management agreement and other service arrangements, the directors received information from Lipper which included graphs for each Fund that provided outlines of contractual management fees at common asset levels, actual management fees, actual non-management expenses and actual total Fund expenses, each graph comparing the relevant information of each Fund with each Fund’s Lipper performance group.
The directors noted that for the period ended December 31, 2005, Mid-Cap Growth Fund’s management fees ranked in the third quin-tile of its Lipper performance group, with the Fund’s fees the tenth lowest of 16 “peer funds.”The Fund’s contractual management fees at a common asset level were determined by Lipper to be the fourth lowest of the 16 funds in its group.The Fund’s management fees were in the fourth quintile of its Lipper expense universe.
The directors also considered a brochure provided by Lipper which included information with respect to the profitability of the mutual fund advisory activities conducted by a number of publicly-held corporations. Lipper also prepared an analysis providing detailed information with respect to the types of services rendered to various mutual fund complexes under their respective investment advisory contracts.
The directors had been provided with extensive materials with respect to the profitability derived by Founders from providing investment advisory and other services to the Funds as a group and to each Fund individually.
The Fund 39
FACTORS CONSIDERED IN RENEWING THE
ADVISORY AGREEMENT (Unaudited) (continued)
|
The directors further considered certain indirect benefits received by Founders and its affiliates from providing investment advisory services to the Funds.These included the following:
- Since Founders manages several non-Fund accounts in a style that is similar to that used for certain of the Funds, Founders and its affil- iates realize certain efficiencies in performing the portfolio manage- ment, trading and operational functions related to those accounts;
- The Funds’ brokerage transactions may be executed with brokers that provide research and brokerage services to Founders and its affiliates. These research and brokerage services may be useful to Founders and its affiliates in providing investment services to any of the clients they advise, not just the Funds; and
- Founders receives fees for providing accounting services to the Funds, and affiliates of Founders receive various fees for providing underwriting, shareholder, transfer agency, custody and cash man- agement services to the Funds.
The directors also reviewed a table listing the Funds and corresponding subadvisory accounts managed by Founders, and their respective fee schedules. In their review of this table, the directors noted that Founders provides many services to the Funds in fulfilling its responsibilities under the management agreement that it does not provide to entities for which Founders has assumed subadvisory duties.The directors concluded that the fees paid to Founders under the management agreement are reasonable in relation to the nature and extent of the services provided by Founders to the Funds under the agreement.
After deliberation and discussion of Fund fees and expenses, the directors determined:
- That upon review of the advisory fee structures of the Funds in comparison with the competitive performance groups selected by Lipper, the levels of investment advisory fees paid by the Funds were deemed to be acceptable;
- That the expense ratios of the Funds are acceptable and that Founders continually reviews each Fund’s total expense ratio and
- has initiated voluntarily expense caps and fee waivers for certain Funds to reduce their expense ratios;
- That the majority of the Funds’ expense ratios increased in 2005 from those experienced in 2004, primarily as a result of declines in Fund assets; and
- That the comparative fee and expense information included in the materials provided by Lipper supports the determination that the advisory and other fees payable by the Funds to Founders and its affiliates are essentially fees which would be similar to those which would have resulted solely from “arm’s-length” bargaining.
With respect to profitability to Founders, the directors reviewed the adviser profitability analysis provided by Lipper, which demonstrated that Founders’ 2005 profitability from providing management services to the Funds was reasonable in comparison to the entities included in the Lipper analysis.
The directors were also advised by independent counsel of the profitability percentage ranges determined by court cases to be acceptable and determined that Founders’ profitability percentage for providing management and other services to the Funds was reasonable.
The directors concluded that Founders’ profits from providing management services to the Funds were reasonable in relationship to the overall services which Founders provides.
Economies of Scale
The directors reviewed information provided by Founders which summarized the extent, if any, that both Founders and the Funds would achieve certain economies of scale if the assets of the Funds were to increase.
After review and discussion, the directors considered the extent to which economies of scale and common management are shared with each Fund, including the economies that would be realized from the growth of each Fund’s assets. After such consideration, the directors
The Fund 41
FACTORS CONSIDERED IN RENEWING THE
ADVISORY AGREEMENT (Unaudited) (continued)
|
determined that all of the Funds have structured breakpoints in their advisory fees, which result in fee reductions as the assets of each Fund reach defined levels, and that such fee reductions, when implemented, would benefit all of the applicable Fund’s shareholders through decreases in the Fund’s expense ratio.
Dedication to Regulatory Requirements and Restrictions
An important factor in the directors’ consideration of renewal of the Funds’ management agreement with Founders included the directors’ recognition of the dedication by Founders of stringent adherence to regulatory requirements and restrictions.The directors determined that Founders is dedicated to compliance with all applicable rules and regulations and that the systems of controls which are in place to ensure that the service providers to the Funds, including Founders, and the Funds themselves, maintain strict adherence to the law are excellent.
The directors determined that they are generally satisfied with the performance of the Funds and with the quality of the advisory and other services being provided by Founders and its affiliates to the Funds. The directors recognized that overall Fund performance has improved in recent years and that efforts are being and will continue to be made to enhance such improvements and to maintain Fund expense ratios at reasonable and acceptable levels.
The directors concluded that continuation of the current management agreement between each Fund and Founders, which would enable each Fund to continue to receive investment advisory services from Founders, is in the best interests of each Fund and its shareholders, the services to be performed under the management agreement are services required for the operations of the Funds, Founders has provided satisfactory investment management services to the Funds in the past, and the fees for the management services which Founders will perform will be within the range of what would have been negotiated at arm’s length in light of the circumstances.
YOUR BOARD REPRESENTATIVES (Unaudited)
The Board of Directors of the Company oversees all 8 Dreyfus Founders Funds.The business and affairs of the Company are managed under the direction of the Board. The directors serving on the Board perform their responsibilities in the manner which they reasonably believe to be in the best interests of the Funds and their shareholders.
All of the directors,as listed below,are independent directors.They are not affiliated with the Fund ‘s adviser, its parent company, or its affiliates.The directors have no official term of office and generally serve until they retire (normally at age 75, but subject to extension to age 80), resign, or are not re-elected.As you can see from their backgrounds, the directors have broad experience as active or former business and community leaders.
Eugene H.Vaughan, CFA, 73.Year elected to the Board: 1970
Board Chairman. Founding Chairman,Vaughan Nelson Investment Management, LP, an investment counseling firm. Director, Encore Bank, Houston. Founding Chairman, Center for Houston’s Future, a non-profit organization. Founding Chairman and former Governor, CFA Institute. Past Chairman and Trustee, Institute of Chartered Financial Analysts. Past Chairman and Director, Financial Analysts Federation. Chairman-elect, University of Texas Health Science Center.
Alan S. Danson, 67.Year elected to the Board: 1991
Private investor. Formerly, President and Director, D.H. Management, Inc., the general partner of a limited partnership with technology company holdings (1996 to 2003). Director, Gore Range Natural Science School and The Les Streeter Program, Inc., both of which are non-profit organizations.
Robert P. Mastrovita, 62.Year elected to the Board: 1998
Private investor. Chairman of a private charitable foundation (1997 to present). Formerly, Chairman and Director, Hagler, Mastrovita & Hewitt, Inc., a registered investment adviser (1982 to 1997). Member, Boston Society of Security Analysts. Trustee, Partridge Academy.
Trygve E. Myhren, 70.Year elected to the Board: 1996
President, Myhren Media, Inc., a firm that invests in and advises media, telecommunications, Internet and software companies. Special Limited Partner and member of Investment Committee, Megunticook Funds, a venture capital firm (1998 to present). Director,Advanced Marketing Services, Inc.Trustee and Chairman of Finance
The Fund 43
YOUR BOARD REPRESENTATIVES (Unaudited) (continued)
Committee, the University of Denver.Trustee, Denver Art Museum. Member, Cable Television Hall of Fame. Formerly, President (1990 to 1996) and Director (1992 to 2001) of the Providence Journal Company, a diversified media and communications company. Formerly, Chairman and Chief Executive Officer of American Television and Communications Corporation (now Timer Warner Cable) (1981 to 1988). Formerly, Chairman of the National Cable Television Association (1986-1987).
George W. Phillips, 68.Year elected to the Board: 1998
Retired.Vice Chairman of the Board, Chairman of the Finance Committee, and Chairman of the Investment Committee, Children’s Medical Center of Boston. Formerly, President and Chief Executive Officer (1992 to 1997) and Director (1992 to 2002) of Warren Bancorp, Inc. Formerly, President, Chief Executive Officer and Director of Warren Five Cents Savings Bank (1992 to 1997).
Martha A. Solis-Turner, 46.Year elected to the Board: 2005
Formerly, Telecommunications Director, Wholesale Markets (1995 to 2001), and Manager (1990 to 1995), Qwest Communications International Inc. Board member and Treasurer, Mile High Montessori Early Learning Centers (2002 to present), and formerly, Board member (1995 to 2004) and Vice President (2002 to 2004), Curtis Park Community Center, both of which are non-profit organizations.
Thomas F. Eggers, 54. President and Principal Executive Officer of the Funds since 2006. Founders’ Chairman of the Board, President and Chief Executive Officer. President, Chief Executive Officer and a Director of Dreyfus. Chairman of the Board and Chief Executive Officer of the Distributor since 2005. Formerly, President of Scudder Investments (2002 to 2005). Previously employed by Dreyfus from 1996 to 2002, including as President from 2001 to 2002.
David L. Ray, 49.Vice President of the Funds since 2000, and from 1990 to 1998. Founders’ Senior Vice President, Chief Operating Officer and Treasurer. Vice President of the Distributor since 2003. Employed by Founders and its predecessor company since 1990. Formerly,Treasurer of the Funds (1990 to 1998).
Kenneth R. Christoffersen, 51. Secretary of the Funds since 2000, and from 1996 to 1998. Founders’ Senior Vice President-Legal, General Counsel and Secretary. Assistant Secretary of the Distributor since 2003. Employed by Founders and its predecessor company since 1996.
Jennifer L. Carnes, 35. Treasurer, Principal Financial Officer and Principal Accounting Officer of the Funds since 2006. Manager of Fund Administration for Founders since 2006. Formerly, Founders’ Supervisor of Corporate Actions and Pricing (2002 to 2006), and Corporate Actions and Pricing Specialist (2000 to 2002).
Janelle E. Belcher, 48. Chief Compliance Officer of the Funds since 2004 and Assistant Secretary of the Funds since 2002. Founders’ Vice President - Compliance since 2002. Formerly, Founders’ Manager of Compliance (2000 to 2002) and Securities Compliance Examiner, Staff Accountant and Team Leader for the U.S. Securities and Exchange Commission (1990 to 2000).
Eric D. Naviloff, 38. Assistant Treasurer since 2006. Senior Accounting Manager -Taxable Fixed-Income Funds of Dreyfus, and an officer of 91 investment companies (comprised of 205 portfolios) managed by Dreyfus. Employed by Dreyfus since 1992.
Robert S. Robol, 42.Assistant Treasurer since 2006. Senior Accounting Manager -Money Market and Municipal Bond Funds of Dreyfus, and an officer of 91 investment companies (comprised of 205 portfolios) managed by Dreyfus. Employed by Dreyfus since 1988.
Robert Svagna, 39. Assistant Treasurer since 2006. Senior Accounting Manager -Equity Funds of Dreyfus, and an officer of 91 investment companies (comprised of 205 portfolios) managed by Dreyfus. Employed by Dreyfus since 1990.
William G. Germenis, 36.Anti-Money Laundering Compliance Officer (“AMLCO”) for the Class A, Class B, Class C, Class R, and Class T shares of the Funds since 2002 and for the Class F shares of the Funds since 2003.Vice President and AMLCO of MBSC, LLC since 2002.Vice President and AMLCO of the Distributor and AMLCO of investment companies managed by Dreyfus. Employed by the Distributor since 1998.
The directors and officers may be contacted at Founders’ address appearing on the back cover, except for Messrs. Eggers, Naviloff, Robol, Svagna and Germenis, who can be contacted at The Dreyfus Corporation, 200 Park Avenue, New York, New York 10166.Additional information about the Company’s directors is available in the Statement of Additional Information, which can be obtained free of charge by calling 1-800-525-2440 (Class F shareholders) or 1-800-554-4611 (all other shareholders).
The Fund 45

For Class F shareholders
Telephone Call your financial representative or 1-800-525-2440
| Mail | | Dreyfus Founders Funds, Inc. |
| | | P.O. Box 55360, Boston, MA 02205-8252 |
| |
|
| |
| For Class A, B, C, R and T shareholders |
| Telephone Call your financial representative or 1-800-554-4611 |
| Mail | | Dreyfus Founders Funds, Inc. |
| | | 144 Glenn Curtiss Boulevard, Uniondale, NY 11556-0144 |
| | |
The fund files its complete schedule of portfolio holdings with the Securities and Exchange Commission (“SEC”) for the first and third quarters of each fiscal year on Form N-Q. The fund’s Forms N-Q are available on the SEC’s website at http://www.sec.gov and may be reviewed and copied at the SEC’s Public Reference Room in Washington, DC. Information on the operation of the Public Reference Room may be obtained by calling 1-800-SEC-0330.
A description of the policies and procedures that the fund uses to determine how to vote proxies relating to portfolio securities, and information regarding how the fund voted these proxies for the 12-month period ended June 30, 2006, is available at http://www.founders.com, http://www.dreyfus.com and on the SEC’s website at http://www.sec.gov. The description of the policies and procedures is also available without charge, upon request, by calling 1-800-645-6561.
This report and the statements it contains are submitted for the general information of our shareholders. The report is not authorized for distribution to prospective investors unless preceded or accompanied by an effective prospectus.
| Founders and Founders Funds are registered trademarks |
| of Founders Asset Management LLC. |
| |
| © 2007 Dreyfus Service Corporation |

Save time. Save paper. View your next shareholder report online as soon as it’s available. To take advantage of this service, simply inform us online of your decision to receive materials through our E-Communications Program. Cut down on mailbox clutter and help the Fund reduce printing and postage charges by enrolling today. It’s simple and only takes a few minutes.
Class F shareholders can log into www.founders.com/ ecommunications, or www.icsdelivery.com if you own funds through a third party.
Class A, B, C, R and T shareholders can log into www.dreyfus.com.
The views expressed in this report reflect those of the portfolio managers only through the end of the period covered and do not necessarily represent the views of Founders or any other person in the Founders organization.Any such views are subject to change at any time based upon market or other conditions and Founders disclaims any responsibility to update such views.These views may not be relied on as investment advice and, because investment decisions for a Dreyfus Founders Fund are based on numerous factors, may not be relied on as an indication of trading intent on behalf of any Dreyfus Founders Fund.
Not FDIC-Insured • Not Bank-Guaranteed • May Lose Value
| Contents |
| |
| | | THE FUND |
| |
|
| 2 | | A Letter from the President |
| 3 | | Discussion of Fund Performance |
| 6 | | Fund Performance |
| 8 | | Understanding Your Fund’s Expenses |
| 8 | | Comparing Your Fund’s Expenses |
| With Those of Other Funds |
| 9 | | Statement of Investments |
| 17 | | Statement of Financial Futures |
| 18 | | Statement of Assets and Liabilities |
| 19 | | Statement of Operations |
| 20 | | Statement of Changes in Net Assets |
| 22 | | Financial Highlights |
| 28 | | Notes to Financial Statements |
| 41 | | Report of Independent Registered |
| | | Public Accounting Firm |
| 42 | | Factors Considered in Renewing |
| the Advisory Agreement |
| 50 | | Your Board Representatives |
| |
| FOR MORE INFORMATION |
|
| | | Back Cover |
| Dreyfus Founders |
| Passport Fund |
The Fund

A LETTER FROM THE PRESIDENT
Dear Shareholder:
We are pleased to present this annual report for Dreyfus Founders Passport Fund, covering the 12-month period from January 1, 2006, through December 31, 2006.
2006 proved to be a good year for the financial markets, with most economic sectors and geographic regions of the global equity markets generating strong returns.A number of positive factors contributed to gains in international developed and developing markets, including an expanding global economy, rising commodity prices, financial reforms in key emerging markets, falling trade barriers, rising standards of living and robust corporate profits.
In our analysis, 2006 provided an excellent reminder of the need for a long-term investment perspective. Adopting too short a time frame proved costly for some investors last year, as chasing recent winners sometimes meant buying the next month’s losers. Indeed, history shows that reacting to near-term developments with extreme shifts in strategy rarely is the right decision.We believe that a better course of action is to set a portfolio mix to meet future goals, while attempting to ignore short term market fluctuations in favor of a longer-term view.
For information about how the fund performed during the reporting period, as well as market perspectives, we have provided a Discussion of Fund Performance given by the fund’s portfolio managers.
Thank you for your continued confidence and support.We wish you good health and prosperity in 2007.


DISCUSSION OF FUND PERFORMANCE
Daniel B. LeVan, CFA, and John W. Evers, CFA, Portfolio Managers
How did Dreyfus Founders Passport Fund perform relative to its benchmark?
For the 12-month period ended December 31, 2006, the fund achieved total returns of 30.45% for Class A Shares, 28.91% for Class B Shares, 29.39% for Class C Shares, 30.33% for Class F Shares, 30.61% for Class R Shares and 29.96% for Class T Shares.1 The fund’s benchmark, the Standard & Poor’s/Citigroup Extended Market Index World ex-U.S.SM returned 29.42% for the same period.2
Robust mergers-and-acquisitions (M&A) activity in Europe and an ample appetite for risk among global investors fueled the strong performance of international small-cap markets in 2006.The fund produced competitive returns compared to its benchmark, which we attribute to strong stock selection across a number of sectors and countries.
What is the fund’s investment approach?
The fund seeks capital appreciation by investing at least 65% of its total assets in foreign small-cap companies from a minimum of three countries, in both developed and emerging economies.The fund may invest in larger foreign companies or U.S.-based companies and may purchase securities of companies in initial public offerings. Our “bottom-up” investment approach emphasizes individual stock selection over broader economic and market trends.We use quantitative models and traditional qualitative analysis to construct a diversified portfolio of stocks with low price multiples and positive trends in earnings forecasts when compared to the benchmark.
What other factors influenced the fund’s performance?
Early in 2006, high oil prices put pressure on the earnings of small companies in Japan and, to a lesser extent, Europe. In addition, concerns regarding potentially higher U.S. interest rates and inflationary pressures in May led to a sharp decline in global equity markets. However, most international markets, with the notable exception of
The Fund 3
DISCUSSION OF FUND PERFORMANCE (continued)
|
Japan, recovered over the second half of the year, supporting attractive overall returns for international small-cap companies in 2006.
From a regional perspective, the fund particularly benefited from its investments in companies based in Japan, France, Hong Kong and Ireland. Despite relatively poor small-cap performance in Japan, our bottom-up security selection process identified a number of companies that outperformed in the lagging market. In France, the oil services and steel company Vallourec rose on higher oil prices and very strong orders from companies exploring oil and gas reserves. In Hong Kong, property developer China Overseas Land and Investment benefited from land bank purchases in China and a healthy balance sheet. In Ireland, beverage producer C&C Group saw its stock price rise on the successful introduction of its new hard cider, Magner’s, into the United Kingdom.
Individual stock selection in the consumer staples, industrials, consumer discretionary and materials sectors also supported the fund’s relative performance during the reporting period. In the consumer discretionary area, Hong Kong’s Hengan, a producer of personal hygiene products, saw its stock price advance as the Chinese middle class became increasingly health conscious.The fund’s results from the materials area benefited from heightened M&A activity within the sector, which bolstered the stock prices of metal-based components supplier Rautaruukki, based in Helsinki, and Austrian specialty steel and materials producer Boehler-Uddeholm.As the price of nickel has been rising, due to industry supply disruptions, the Canadian materials producer Inmet Mining has gained value; they also have improved their mill throughput rates.The Australian gold and copper producer Oxiana benefited from higher commodity prices. Additionally as Australian mining companies have been seen as takeover targets, Oxiana’s price was pushed higher by takeover rumors.
On the other hand, some of the fund’s holdings detracted from its relative performance in 2006, including stocks of companies based in Singapore, Italy, Sweden and Denmark. The information technology and telecommunications services sectors represented the weaker areas for the fund’s performance compared to its benchmark, with the energy and financials areas close behind. In the information technology sector, Wolfson Microelectronics, which manufactures components for electronic gaming systems such as Sony’s PlayStation 3, provided lower future sales guidance to investors. Hong Kong’s Solomon Systech expe-
rienced a drop in its earnings during the reporting period, sending its stock price lower. Energy holding Trican Well Service, the Canadian gas and oil services provider, floundered as a result of low drilling activity due to unusually mild weather.A number of real estate companies also provided relatively disappointing results, including Kenedix and Urban Corporation in Japan. Germany’s Vivacon lost value when it announced the postponement of its initial public offering of Vivacon German Properties. Finally, Monex Beans Holdings, a Japanese financial services firm, was hurt by slowing capital markets domestically.
What is the fund’s current strategy?
We currently expect strong worldwide consumer and industrial demand to persist, with China and India leading the charge. Global M&A activity may accelerate, in our view, potentially putting upward pressure on international equity markets. Nonetheless, we may trim the fund’s positions in stocks that fared particularly well in 2006, such as metals and mining companies, as we expect investors to take profits in those companies. Otherwise, we have maintained our disciplined strategy of buying stocks that combine above-average business momentum with below-average valuations.
| | | Part of the fund’s historical performance is due to the purchase of securities sold in initial |
| | | public offerings (IPOs). There is no guarantee that the fund’s investments in IPOs, if any, |
| | | will continue to have a similar impact on performance. |
| | | Small companies carry additional risks because their earnings and revenues tend to be less |
| | | predictable, and their share prices more volatile than those of larger, more established |
| | | companies. The shares of smaller companies tend to trade less frequently than those of |
| | | larger, more established companies. |
| | | Investing in foreign companies involves special risks, including changes in currency rates, |
| | | political, economic and social instability, a lack of comprehensive company information, |
| | | differing auditing and legal standards and less market liquidity. An investment in this fund |
| | | should be considered only as a supplement to an overall investment program. |
| 1 | | Total return includes reinvestment of dividends and any capital gains paid, and does not take into |
| | | consideration the maximum initial sales charges in the case of Class A and Class T shares, or the |
| | | applicable contingent deferred sales charges imposed on redemptions in the case of Class B and |
| | | Class C shares. Had these charges been reflected, returns would have been lower. Past performance |
| | | is no guarantee of future results. Share price and investment return fluctuate such that upon |
| | | redemption, fund shares may be worth more or less than their original cost. |
| 2 | | SOURCE: LIPPER, INC. – Reflects reinvestment of net dividends and, where applicable, |
| | | capital gain distributions.The Standard & Poor’s/Citigroup EMI World ex U.S. represents, on a |
| | | country-by-country basis, the small capitalization component of the Citigroup Broad Market |
| | | Index,SM which is a comprehensive float weighted index of companies in 26 countries (excluding |
| | | the U.S.) with market capitalizations of at least $100 million.The total return figures cited for |
| | | this index assume change in security prices and reinvestment of dividends, but do not reflect the |
| | | costs of managing a mutual fund. |
The Fund 5

| † Source: Citigroup Global Markets Inc. |
| Past performance is not predictive of future performance. |
| Part of the fund’s historical performance is due to the purchase of securities sold in initial public offerings (IPOs).There is |
| no guarantee that the fund’s investments in IPOs, if any, will continue to have a similar impact on performance. |
| The above graph compares a $10,000 investment made in Class F shares of Dreyfus Founders Passport Fund on |
| 12/31/96 to a $10,000 investment made in the S&P/Citigroup Extended Market Index World ex U.S. (the |
| “Index”) on that date. All dividends and capital gain distributions are reinvested. Performance for Class A, Class B, |
| Class C, Class R and Class T shares will vary from the performance of Class F shares shown above due to differences |
| in charges and expenses. |
| The fund’s performance shown in the line graph takes into account all applicable Class F fees and expenses (after any |
| expense reimbursements).The Index measures the performance of small companies outside of the United States |
| (approximately) the bottom 20% by market capitalization) in 26 developed equity markets.The Index does not take into |
| account charges, fees and other expenses. Further information relating to fund performance, including expense |
| reimbursements, if applicable, is contained in the Financial Highlights section of the prospectus and elsewhere in this report. |
| Average Annual Total Returns as of 12/31/06 | | | | | | |
| |
| | | Inception | | | | | | | | From |
| | | Date | | 1 Year | | 5 Years | | 10 Years | | Inception |
| |
| |
| |
| |
| |
|
| Class A shares | | | | | | | | | | |
| with maximum sales charge (5.75%) | | 12/31/99 | | 22.93% | | 20.60% | | — | | 2.96% |
| without sales charge | | 12/31/99 | | 30.45% | | 22.03% | | — | | 3.84% |
| Class B shares | | | | | | | | | | |
| with applicable redemption charge † | | 12/31/99 | | 24.91% | | 20.73% | | — | | 3.12% |
| without redemption | | 12/31/99 | | 28.91% | | 20.92% | | — | | 3.12% |
| Class C shares | | | | | | | | | | |
| with applicable redemption charge †† | | 12/31/99 | | 28.39% | | 21.05% | | — | | 2.99% |
| without redemption | | 12/31/99 | | 29.39% | | 21.05% | | — | | 2.99% |
| Class F shares | | 11/16/93 | | 30.33% | | 22.07% | | 10.81% | | N/A |
| Class R shares | | 12/31/99 | | 30.61% | | 21.78% | | — | | 3.48% |
| Class T shares | | | | | | | | | | |
| with applicable sales charge (4.5%) | | 12/31/99 | | 24.13% | | 20.14% | | — | | 2.40% |
| without sales charge | | 12/31/99 | | 29.96% | | 21.25% | | — | | 3.08% |
Past performance is not predictive of future performance.The fund’s performance shown in the graph and table does not reflect the deduction of taxes that a shareholder would pay on fund distributions or the redemption of fund shares, but does reflect fee waivers. Performance for Class B shares assumes the conversion of Class B shares to Class A shares at the end of the sixth year following the date of purchase.
| † | | The maximum contingent deferred sales charge for Class B shares is 4%. After six years Class B shares convert to |
| | | Class A shares. |
| †† | | The maximum contingent deferred sales charge for Class C shares is 1% for shares redeemed within one year of the |
| | | date of purchase. |
The Fund 7
UNDERSTANDING YOUR FUND’S EXPENSES (Unaudited)
As a mutual fund investor, you pay ongoing expenses, such as management fees and other expenses. Using the information below, you can estimate how these expenses affect your investment and compare them with the expenses of other funds.You also may pay one-time transaction expenses, including sales charges (loads) and redemption fees, which are not shown in this section and would have resulted in higher total expenses. For more information, see your fund’s prospectus or talk to your financial advisor.
Review your fund’s expenses
|
The table below shows the expenses you would have paid on a $1,000 investment in Dreyfus Founders Passport Fund from July 1, 2006 to December 31, 2006. It also shows how much a $1,000 investment would be worth at the close of the period, assuming actual returns and expenses.To estimate the expenses you paid on your account over this period, simply divide your account value by $1,000 (for example, an $8,600 account value divided by $1,000 = 8.60), then multiply the results by the number in the Expenses paid per $1,000 line for the class of shares you own.
| Expenses and Value of a $1,000 Investment | | | | | | |
| assuming actual returns for the six months ended December 31, 2006 | | | | |
| | | Class A | | Class B | | Class C | | Class F | | Class R | | Class T |
| |
| |
| |
| |
| |
| |
|
| Expenses paid | | | | | | | | | | | | |
| per $1,000 † | | $ 9.87 | | $ 16.86 | | $ 14.34 | | $ 10.20 | | $ 9.01 | | $ 11.92 |
| Ending value | | | | | | | | | | | | |
| (after expenses) | | $1,152.50 | | $1,143.80 | | $1,147.50 | | $1,151.60 | | $1,152.60 | | $1,150.10 |
| COMPARING YOUR FUND’S EXPENSES |
| WITH THOSE OF OTHER FUNDS (Unaudited) |
Using the SEC’s method to compare expenses
The Securities and Exchange Commission (SEC) has established guidelines to help investors assess fund expenses. Per these guidelines, the table below shows your fund’s expenses based on a $1,000 investment, assuming a hypothetical 5% annualized return. You can use this information to compare the ongoing expenses (but not transaction expenses or total cost) of investing in the fund with those of other funds.All mutual fund shareholder reports will provide this information to help you make this comparison. Please note that you cannot use this information to estimate your actual ending account balance and expenses paid during the period.
| Expenses and Value of a $1,000 Investment |
| assuming a hypothetical 5% annualized return for the six months ended December 31, 2006 |
| | | Class A | | Class B | | Class C | | Class F | | Class R | | Class T |
| |
| |
| |
| |
| |
| |
|
| Expenses paid | | | | | | | | | | | | |
| per $1,000 † | | $ 9.25 | | $ 15.80 | | $ 13.44 | | $ 9.55 | | $ 8.44 | | $ 11.17 |
| Ending value | | | | | | | | | | | | |
| (after expenses) | | $1,016.03 | | $1,009.48 | | $1,011.85 | | $1,015.73 | | $1,016.84 | | $1,014.12 |
| † Expenses are equal to the fund’s annualized expense ratio of 1.82% for Class A shares, 3.12% for Class B shares, |
| 2.65% for Class C shares, 1.88% for Class F shares, 1.66% for Class R shares and 2.20% for Class T shares; |
| multiplied by the average account value over the period, multiplied by 184/365 (to reflect the one-half year period). |
STATEMENT OF INVESTMENTS
December 31, 2006
|
| Common Stocks—97.2% | | Shares | | Value ($) |
| |
| |
|
| Australia—3.6% | | | | |
| Allco Finance Group | | 89,990 | | 913,489 |
| Babcock & Brown | | 25,000 | | 489,395 |
| Healthscope | | 115,000 | | 489,277 |
| Oil Search | | 148,530 | | 392,760 |
| Oxiana | | 425,650 | | 1,065,074 |
| Pacific Brands | | 203,700 | | 419,662 |
| United Group | | 29,100 | | 320,431 |
| | | | | 4,090,088 |
| Austria—1.2% | | | | |
| Andritz | | 1,860 | | 403,403 |
| Boehler-Uddeholm | | 13,800 | | 967,303 |
| | | | | 1,370,706 |
| Belgium—1.8% | | | | |
| Colruyt | | 2,000 | | 427,167 |
| Mobistar | | 7,200 | | 614,454 |
| Omega Pharma | | 4,700 | | 354,571 |
| Umicore | | 4,010 | | 682,846 |
| | | | | 2,079,038 |
| Canada—5.5% | | | | |
| Astral Media | | 13,900 | | 475,948 |
| Axcan Pharma | | 22,200 a | | 315,633 |
| Gateway Casinos Income Fund (Units) | | 19,500 | | 285,941 |
| Gildan Activewear | | 6,900 a | | 322,412 |
| Inmet Mining | | 33,400 | | 1,787,501 |
| IPSCO | | 3,400 | | 319,489 |
| Kingsway Financial Services | | 19,300 | | 402,335 |
| MEGA Brands | | 14,800 a | | 331,878 |
| Methanex | | 16,100 | | 440,415 |
| Metro, Cl. A | | 13,500 | | 439,215 |
| Northbridge Financial | | 10,100 | | 265,979 |
| Trican Well Service | | 19,300 | | 336,300 |
| WestJet Airlines | | 31,900 a | | 408,410 |
| | | | | 6,131,456 |
| Denmark—.4% | | | | |
| East Asiatic | | 8,600 | | 481,093 |
The Fund 9
STATEMENT OF INVESTMENTS (continued)
|
| Common Stocks (continued) | | Shares | | Value ($) |
| |
| |
|
| Finland—3.4% | | | | |
| Cargotec, Cl. B | | 7,000 | | 389,017 |
| KCI Konecranes | | 19,900 | | 585,796 |
| Kesko, Cl. B | | 8,200 | | 433,191 |
| Nokian Renkaat | | 15,600 | | 319,599 |
| Orion, Cl. B | | 15,400 a | | 334,407 |
| Outokumpu | | 11,700 | | 458,085 |
| Rautaruukki | | 23,900 | | 951,205 |
| Wartsila, Cl. B | | 7,200 | | 387,871 |
| | | | | 3,859,171 |
| France—9.2% | | | | |
| Air France-KLM | | 12,500 | | 526,203 |
| Alten | | 12,780 a | | 476,751 |
| Bacou-Dalloz | | 2,970 | | 397,542 |
| Ciments Francais | | 2,620 | | 503,214 |
| CNP Assurances | | 4,140 | | 462,338 |
| Compagnie Generale de Geophysique | | 3,460 a | | 749,960 |
| Compagnie Generale des Etablissements Michelin, Cl. B | | 5,600 | | 535,938 |
| Euler Hermes | | 6,810 | | 985,250 |
| Eutelsat Communications | | 17,800 | | 340,233 |
| Haulotte Group | | 15,740 | | 419,706 |
| Icade | | 5,300 a | | 334,770 |
| Iliad | | 4,350 | | 377,836 |
| Natixis | | 29,300 | | 823,053 |
| Nexans | | 5,630 | | 720,890 |
| Nexity | | 5,900 | | 427,576 |
| Pierre & Vacances | | 3,350 a | | 411,260 |
| Sodexho Alliance | | 5,700 | | 357,628 |
| Soitec | | 13,630 a | | 484,890 |
| Vallourec | | 3,350 | | 974,200 |
| | | | | 10,309,238 |
| Germany—6.5% | | | | |
| Aareal Bank | | 8,700 a | | 404,710 |
| Continental | | 2,960 | | 344,666 |
| Deutsche Boerse | | 5,250 | | 966,213 |
| Deutsche Postbank | | 6,690 | | 564,925 |
| Common Stocks (continued) | | Shares | | Value ($) |
| |
| |
|
| Germany (continued) | | | | |
| Hannover Rueckversicherung | | 8,000 a | | 370,246 |
| Hypo Real Estate Holding | | 7,070 | | 445,544 |
| Lanxess | | 11,370 a | | 637,579 |
| Leoni | | 10,450 | | 426,249 |
| MAN | | 6,970 | | 629,881 |
| MPC Muenchmeyer Petersen Capital | | 4,200 | | 371,017 |
| MTU Aero Engines Holding | | 10,800 | | 508,957 |
| Software | | 7,160 | | 560,853 |
| Stada Arzneimittel | | 10,990 | | 628,456 |
| Wincor Nixdorf | | 2,530 | | 393,619 |
| | | | | 7,252,915 |
| Hong Kong—2.3% | | | | |
| China Overseas Land & Investment | | 1,054,000 | | 1,411,964 |
| Hengan International Group | | 301,400 | | 736,228 |
| Wing Hang Bank | | 35,000 | | 411,722 |
| | | | | 2,559,914 |
| Ireland—2.2% | | | | |
| C & C Group | | 52,840 | | 938,153 |
| FBD Holdings | | 7,000 | | 381,625 |
| Grafton Group (Units) | | 28,480 | | 475,951 |
| IAWS Group | | 25,150 | | 644,063 |
| | | | | 2,439,792 |
| Italy—5.0% | | | | |
| ASM | | 94,500 | | 517,377 |
| Azimut | | 25,960 | | 347,481 |
| Banca CR Firenze | | 100,300 | | 337,621 |
| Banca Popolare di Milano | | 52,380 | | 909,243 |
| Banco Popolare di Verona e Novara | | 20,090 | | 576,803 |
| Credito Emiliano | | 37,540 | | 531,224 |
| Fondiaria-SAI | | 12,340 | | 590,326 |
| Mediolanum | | 41,400 | | 337,463 |
| Milano Assicurazioni | | 64,140 | | 522,823 |
| Recordati | | 55,950 | | 429,476 |
| Terna | | 160,410 | | 543,664 |
| | | | | 5,643,501 |
The Fund 11
STATEMENT OF INVESTMENTS (continued)
|
| Common Stocks (continued) | | Shares | | Value ($) |
| |
| |
|
| Japan—16.9% | | | | |
| Ardepro | | 940 | | 309,239 |
| Asahi Pretec | | 19,950 | | 398,983 |
| CAPCOM | | 20,600 | | 371,304 |
| Chiyoda Integre | | 10,200 | | 239,990 |
| COMSYS Holdings | | 27,000 | | 299,029 |
| Creed | | 60 | | 207,218 |
| Dainippon Screen Manufacturing | | 44,000 | | 395,244 |
| Dainippon Sumitomo Pharma | | 23,000 | | 267,485 |
| Exedy | | 20,500 | | 632,200 |
| Fuji Machine Manufacturing | | 14,000 | | 269,989 |
| Gigas K’s Denki | | 14,600 | | 428,167 |
| Goldcrest | | 6,000 | | 309,567 |
| Hisamitsu Pharmaceutical | | 13,300 | | 421,335 |
| Hitachi Construction Machinery | | 17,500 | | 470,568 |
| Hitachi High-Technologies | | 18,100 | | 538,414 |
| Izumi | | 13,800 | | 491,677 |
| Japan Aviation Electronics Industry | | 26,000 | | 368,573 |
| Joint | | 17,000 | | 654,258 |
| Kansai Paint | | 48,000 | | 379,950 |
| Keihin | | 15,200 | | 382,539 |
| Kenedix | | 122 | | 550,515 |
| Kenwood | | 205,000 | | 365,195 |
| Kyowa Exeo | | 47,000 | | 480,249 |
| Makita | | 11,800 | | 361,918 |
| Meiji Dairies | | 46,000 | | 362,186 |
| Mitsubishi Gas Chemical | | 42,000 | | 439,393 |
| Mori Seiki | | 21,500 | | 481,471 |
| Nichirei | | 62,000 | | 347,498 |
| Nissin Kogyo | | 28,800 | | 740,540 |
| NSD | | 14,100 | | 447,864 |
| NTN | | 58,000 | | 520,029 |
| Pacific Management | | 248 | | 543,910 |
| Ricoh Leasing | | 10,700 | | 277,829 |
| Shin-Etsu Polymer | | 30,500 | | 426,726 |
| Sumisho Lease | | 9,000 | | 501,407 |
| Suruga Bank | | 31,000 | | 383,967 |
| Taiyo Nippon Sanso | | 58,000 | | 522,465 |
| |
| 12 | | | | |
| Common Stocks (continued) | | Shares | | Value ($) |
| |
| |
|
| Japan (continued) | | | | |
| Takeuchi Manufacturing | | 8,000 | | 373,094 |
| Toho Pharmaceutical | | 25,000 | | 453,762 |
| Tokyo Ohka Kogyo | | 15,400 | | 429,629 |
| Toshiba Machine | | 54,000 | | 496,416 |
| Tosoh | | 97,000 | | 428,738 |
| Ulvac | | 12,700 | | 434,343 |
| Urban | | 23,500 | | 356,632 |
| Yaskawa Electric | | 40,000 | | 462,838 |
| | | | | 19,024,343 |
| Luxembourg—.3% | | | | |
| Oriflame Cosmetics | | 8,800 | | 362,492 |
| Netherlands—4.1% | | | | |
| Aalberts Industries | | 7,930 | | 685,651 |
| Endemol | | 15,900 | | 363,105 |
| Fugro | | 15,760 | | 753,101 |
| Koninklijke DSM | | 11,210 | | 553,878 |
| SBM Offshore | | 16,420 | | 564,637 |
| Univar | | 10,290 | | 576,474 |
| USG People | | 15,920 | | 695,810 |
| Wolters Kluwer | | 15,900 a | | 457,344 |
| | | | | 4,650,000 |
| Norway—1.6% | | | | |
| Ementor | | 70,000 a | | 395,176 |
| Tandberg Television | | 39,300 a | | 492,889 |
| TGS-NOPEC Geophysical | | 45,200 a | | 935,142 |
| | | | | 1,823,207 |
| Portugal—.3% | | | | |
| Banco BPI | | 38,170 | | 297,782 |
| Singapore—.4% | | | | |
| STATS ChipPAC | | 563,000 a | | 429,477 |
| South Korea—2.4% | | | | |
| Cheil Industries | | 7,800 | | 329,194 |
| Daegu Bank | | 15,790 | | 269,958 |
| GS Engineering & Construction | | 6,310 | | 563,829 |
| Humax | | 10,900 | | 304,731 |
| Hyundai Mipo Dockyard | | 3,930 | | 502,871 |
| Korea Zinc | | 3,000 | | 318,387 |
The Fund 13
STATEMENT OF INVESTMENTS (continued)
|
| Common Stocks (continued) | | Shares | | Value ($) |
| |
| |
|
| South Korea (continued) | | | | |
| LG Dacom | | 17,500 | | 368,817 |
| | | | | 2,657,787 |
| Spain—3.1% | | | | |
| Abengoa | | 10,300 | | 378,118 |
| Banco Pastor | | 21,400 | | 416,672 |
| Banco Sabadell | | 17,280 | | 773,500 |
| Ebro Puleva | | 13,900 | | 352,293 |
| Enagas | | 19,710 | | 458,439 |
| Fomento de Construcciones y Contratas | | 6,100 | | 621,635 |
| Sol Melia | | 26,020 | | 515,557 |
| | | | | 3,516,214 |
| Sweden—1.3% | | | | |
| Alfa Laval | | 9,800 | | 442,335 |
| Elekta, Cl. B | | 20,700 | | 436,167 |
| Modern Times Group, Cl. B | | 8,900 | | 585,017 |
| | | | | 1,463,519 |
| Switzerland—6.5% | | | | |
| Actelion | | 4,200 a | | 923,759 |
| Banque Cantonale Vaudoise | | 720 | | 346,853 |
| Barry Callebaut | | 1,179 | | 595,064 |
| Galenica Holding | | 1,270 | | 355,673 |
| Geberit | | 359 | | 553,305 |
| Georg Fischer | | 979 | | 634,321 |
| Julius Baer Holding | | 4,000 | | 440,542 |
| Kudelski | | 10,200 | | 384,226 |
| Rieter Holding | | 1,152 | | 602,708 |
| Sika Finanz AG | | 603 | | 935,306 |
| Sulzer | | 613 | | 697,768 |
| Swatch Group, Cl. B | | 1,800 | | 397,743 |
| Valora Holding | | 1,415 | | 388,733 |
| | | | | 7,256,001 |
| United Kingdom—19.2% | | | | |
| Admiral Group | | 31,750 | | 683,203 |
| Aegis Group | | 159,600 | | 437,491 |
| Amlin | | 87,550 | | 557,548 |
| Barratt Developments | | 24,600 | | 594,854 |
| Bodycote International | | 63,240 | | 282,625 |
| British Airways | | 86,770 | | 896,191 |
| |
| 14 | | | | |
| Common Stocks (continued) | | Shares | | Value ($) |
| |
| |
|
| United Kingdom (continued) | | | | |
| Burren Energy | | 32,950 | | 570,962 |
| Carphone Warehouse Group | | 47,940 | | 294,738 |
| Cattles | | 65,990 | | 567,543 |
| Charter | | 38,670 a | | 685,222 |
| Chemring Group | | 15,469 | | 478,551 |
| Close Brothers Group | | 33,320 | | 663,164 |
| Cookson Group | | 48,680 | | 598,575 |
| Crest Nicholson | | 41,140 | | 498,210 |
| Croda International | | 58,900 | | 674,652 |
| Daily Mail & General Trust, Cl. A | | 31,800 | | 446,432 |
| Dairy Crest Group | | 27,000 | | 358,957 |
| David S. Smith (Holdings) | | 90,200 | | 346,156 |
| Enterprise Inns | | 29,430 | | 779,645 |
| Greene King | | 37,080 | | 825,484 |
| IG Group | | 71,300 | | 405,550 |
| Inchcape | | 67,000 | | 663,795 |
| Informa | | 56,580 | | 661,372 |
| International Power | | 123,970 | | 926,626 |
| Kelda Group | | 17,600 | | 319,104 |
| Kier Group | | 11,345 | | 482,029 |
| LogicaCMG | | 111,500 | | 406,066 |
| Michael Page International | | 85,060 | | 753,204 |
| Morgan Sindall | | 23,900 | | 621,448 |
| N Brown Group | | 62,200 | | 343,438 |
| Next | | 15,700 | | 553,326 |
| Persimmon | | 15,570 | | 465,213 |
| Petrofac | | 85,100 | | 671,079 |
| Regus Group | | 162,520 a | | 396,173 |
| Restaurant Group | | 54,962 | | 332,798 |
| SIG | | 24,860 | | 501,357 |
| Speedy Hire | | 14,231 | | 335,762 |
| Tate & Lyle | | 31,800 | | 478,497 |
| Tullow Oil | | 85,250 | | 664,333 |
| Victrex | | 24,010 | | 377,734 |
| | | | | 21,599,107 |
| Total Common Stocks | | | | |
| (cost $81,783,118) | | | | 109,296,841 |
The Fund 15
| | STATEMENT OF INVESTMENTS (continued)
|
| Preferred Stocks—1.8% | | Shares | | Value ($) |
| |
| |
|
| Germany: | | | | |
| Fresenius | | 3,960 | | 847,097 |
| Henkel | | 2,340 | | 344,722 |
| Hugo Boss | | 8,590 | | 441,321 |
| ProSieben Sat.1 Media | | 12,230 | | 389,558 |
| Total Preferred Stocks | | | | |
| (cost $1,438,596) | | | | 2,022,698 |
| |
| |
|
| | | Principal | | |
| Short-Term Investment—.1% | | Amount ($) | | Value ($) |
| |
| |
|
| U.S. Treasury Bills; | | | | |
| 4.93%, 3/15/07 | | | | |
| (cost $59,415) | | 60,000 b | | 59,429 |
| |
| |
|
| Total Investments (cost $83,281,129) | | 99.1% | | 111,378,968 |
| Cash and Receivables (Net) | | .9% | | 1,041,387 |
| Net Assets | | 100.0% | | 112,420,355 |
| a | | Non-income producing security. |
| b | | All or partially held by a broker as collateral for open financial futures positions. |
| Portfolio Summary (Unaudited) † | | | | |
| |
| | | Value (%) | | | | Value (%) |
| |
| |
| |
|
| United Kingdom | | 19.2 | | Ireland | | 2.2 |
| Japan | | 16.9 | | Belgium | | 1.8 |
| France | | 9.2 | | Norway | | 1.6 |
| Germany | | 8.3 | | Sweden | | 1.3 |
| Switzerland | | 6.5 | | Austria | | 1.2 |
| Canada | | 5.5 | | Denmark | | .4 |
| Italy | | 5.0 | | Singapore | | .4 |
| Netherlands | | 4.1 | | Luxembourg | | .3 |
| Australia | | 3.6 | | Portugal | | .3 |
| Finland | | 3.4 | | United States | | .1 |
| Spain | | 3.1 | | Cash & Equivalents | | .9 |
| South Korea | | 2.4 | | | | |
| Hong Kong | | 2.3 | | | | 100.0 |
| † Based on net assets. |
| See notes to financial statements. |
16
STATEMENT OF FINANCIAL FUTURES
December 31, 2006
| | | | | Market Value | | | | Unrealized |
| | | | | Covered by | | | | Appreciation |
| | | Contracts | | Contracts ($) | | Expiration | | at 12/31/2006 ($) |
| |
| |
| |
| |
|
| Financial Futures Long | | | | | | | | |
| MSCI PAN EURO | | 15 | | 482,384 | | March 2007 | | 7,297 |
| TOPIX | | 1 | | 141,381 | | March 2007 | | 6,516 |
| | | | | | | | | 13,813 |
See notes to financial statements.
|
The Fund 17
STATEMENT OF ASSETS AND LIABILITIES
December 31, 2006
| | | Cost | | Value |
| |
| |
|
| Assets ($): | | | | |
| Investments in securities—See Statement of Investments | | 83,281,129 | | 111,378,968 |
| Cash | | | | 766,279 |
| Cash denominated in foreign currencies | | 197,806 | | 198,044 |
| Receivable for investment securities sold | | | | 252,569 |
| Dividends and interest receivable | | | | 178,637 |
| Receivable for shares of Common Stock subscribed | | | | 8,827 |
| Other assets | | | | 138,014 |
| | | | | 112,921,338 |
| |
| |
|
| Liabilities ($): | | | | |
| Due to Founders Asset Management LLC and affiliates—Note 3(c) | | 194,800 |
| Directors deferred compensation | | | | 138,014 |
| Payable for shares of Common Stock redeemed | | | | 110,731 |
| Payable for futures variation margin—Note 4 | | | | 1,760 |
| Net unrealized depreciation on forward | | | | |
| currency exchange contracts—Note 4 | | | | 1 |
| Accrued expenses | | | | 55,677 |
| | | | | 500,983 |
| |
| |
|
| Net Assets ($) | | | | 112,420,355 |
| |
| |
|
| Composition of Net Assets ($): | | | | |
| Paid-in capital | | | | 191,199,218 |
| Accumulated undistributed investment (loss)—net | | | | (196,536) |
| Accumulated net realized gain (loss) on investments | | | | (106,746,615) |
| Accumulated net unrealized appreciation (depreciation) | | | | |
| on investments and foreign currency transactions (including | | |
| $13,813 net unrealized appreciation on financial futures) | | 28,164,288 |
| |
|
| Net Assets ($) | | | | 112,420,355 |
| Net Asset Value Per Share | | | | | | | | | | |
| | | Class A | | Class B | | Class C | | Class F | | Class R | | Class T |
| |
| |
| |
| |
| |
| |
|
| Net Assets ($) | | 29,817,485 | | 2,591,195 | | 7,168,952 | | 72,042,531 | | 199,954 | | 600,238 |
| Shares Outstanding | | 1,137,384 | | 105,106 | | 289,846 | | 2,748,397 | | 7,810 | | 24,108 |
| |
| |
| |
| |
| |
| |
|
| Net Asset Value | | | | | | | | | | | | |
| Per Share ($) | | 26.22 | | 24.65 | | 24.73 | | 26.21 | | 25.60 | | 24.90 |
See notes to financial statements.
18
STATEMENT OF OPERATIONS
Year Ended December 31, 2006
|
| Investment Income ($): | | |
| Income: | | |
| Dividends (net of $211,995 foreign taxes withheld at source): | | |
| Unaffiliated issuers | | 1,825,745 |
| Affiliated issuers | | 11,010 |
| Interest | | 27,469 |
| Total Income | | 1,864,224 |
| Expenses: | | |
| Investment advisory fee—Note 3(a) | | 1,111,695 |
| Shareholder servicing costs—Note 3(c) | | 279,003 |
| Distribution fees—Note 3(b) | | 269,042 |
| Custodian fees—Note 3(c) | | 190,002 |
| Accounting fees—Note 3(c) | | 111,152 |
| Registration fees | | 58,015 |
| Prospectus and shareholders’ reports | | 55,495 |
| Professional fees | | 39,845 |
| Directors’ fees and expenses—Note 3(d) | | 35,260 |
| Loan commitment fees—Note 2 | | 4,853 |
| Interest expense—Note 2 | | 4,331 |
| Miscellaneous | | 90,071 |
| Total Expenses | | 2,248,764 |
| Less—reduction in custody fees due to waiver—Note 3(c) | | (91,108) |
| Less—reduction in custody fees due to | | |
| earnings credits—Note 1(c) | | (6,634) |
| Less—expense offset to broker commissions—Note 1 | | (1,164) |
| Net Expenses | | 2,149,858 |
| Investment (Loss)—Net | | (285,634) |
| |
|
| Realized and Unrealized Gain (Loss) on Investments—Note 4 ($): |
| Net realized gain (loss) on investments | | 12,067,955 |
| Net realized gain (loss) on financial futures | | 6,670 |
| Net realized gain (loss) on foreign currency transactions | | 3,310 |
| Net Realized Gain (Loss) | | 12,077,935 |
| Net change in unrealized appreciation (depreciation) on investments |
| and foreign currency transactions (including $13,813 | | |
| net unrealized appreciation on financial futures) | | 17,524,405 |
| Net Realized and Unrealized Gain (Loss) on Investments | | 29,602,340 |
| Net Increase in Net Assets Resulting from Operations | | 29,316,706 |
| See notes to financial statements. | | |
The Fund 19
STATEMENT OF CHANGES IN NET ASSETS
| | | Year Ended December 31, |
| |
|
| | | 2006 | | 2005 |
| |
| |
|
| Operations ($): | | | | |
| Investment (loss)—net | | (285,634) | | (1,089,649) |
| Net realized gain (loss) on investments | | 12,077,935 | | 19,668,576 |
| Net change in unrealized appreciation | | | | |
| (depreciation) on investments | | 17,524,405 | | 46,812 |
| Net Increase (Decrease) in Net Assets | | | | |
| Resulting from Operations | | 29,316,706 | | 18,625,739 |
| |
| |
|
| Capital Stock Transactions ($): | | | | |
| Net proceeds from shares sold: | | | | |
| Class A shares | | 17,497,801 | | 7,916,442 |
| Class B shares | | 107,874 | | 327,743 |
| Class C shares | | 405,353 | | 1,393,853 |
| Class F shares | | 7,998,811 | | 8,160,585 |
| Class R shares | | 56,702 | | 458,697 |
| Class T shares | | 48,181 | | 79,625 |
| Cost of shares redeemed: | | | | |
| Class A shares | | (17,033,564) | | (8,984,517) |
| Class B shares | | (16,125,589) | | (4,684,383) |
| Class C shares | | (2,712,046) | | (5,303,597) |
| Class F shares | | (17,851,176) | | (30,687,201) |
| Class R shares | | (222,631) | | (385,612) |
| Class T shares | | (28,123) | | (224,045) |
| Increase (Decrease) in Net Assets | | | | |
| from Capital Stock Transactions | | (27,858,407) | | (31,932,410) |
| Total Increase (Decrease) in Net Assets | | 1,458,299 | | (13,306,671) |
| |
| |
|
| Net Assets ($): | | | | |
| Beginning of Period | | 110,962,056 | | 124,268,727 |
| End of Period | | 112,420,355 | | 110,962,056 |
| Investment (loss)—net | | (196,536) | | (80,032) |
| | | Year Ended December 31, |
| |
|
| | | 2006 | | 2005 |
| |
| |
|
| Capital Share Transactions: | | | | |
| Class A a | | | | |
| Shares sold | | 780,495 | | 431,931 |
| Shares redeemed | | (743,011) | | (509,206) |
| Net Increase (Decrease) in Shares Outstanding | | 37,484 | | (77,275) |
| |
| |
|
| Class B a | | | | |
| Shares sold | | 5,224 | | 19,176 |
| Shares redeemed | | (758,437) | | (274,566) |
| Net Increase (Decrease) in Shares Outstanding | | (753,213) | | (255,390) |
| |
| |
|
| Class C | | | | |
| Shares sold | | 18,427 | | 77,684 |
| Shares redeemed | | (124,386) | | (319,650) |
| Net Increase (Decrease) in Shares Outstanding | | (105,959) | | (241,966) |
| |
| |
|
| Class F | | | | |
| Shares sold | | 351,691 | | 456,877 |
| Shares redeemed | | (791,790) | | (1,783,478) |
| Net Increase (Decrease) in Shares Outstanding | | (440,099) | | (1,326,601) |
| |
| |
|
| Class R | | | | |
| Shares sold | | 2,610 | | 25,002 |
| Shares redeemed | | (10,635) | | (20,814) |
| Net Increase (Decrease) in Shares Outstanding | | (8,025) | | 4,188 |
| |
| |
|
| Class T | | | | |
| Shares sold | | 2,217 | | 4,248 |
| Shares redeemed | | (1,295) | | (12,834) |
| Net Increase (Decrease) in Shares Outstanding | | 922 | | (8,586) |
| |
| a During the period ended December 31, 2006, 537,890 Class B shares representing $11,394,019 were |
| automatically converted to 510,894 Class A shares and during the period ended December 31, 2005, 17,060 Class |
| B shares representing $294,582 were automatically converted to 16,290 Class A shares. |
| See notes to financial statements. | | | | |
The Fund 21
The following tables describe the performance for each share class for the fiscal periods indicated. All information (except portfolio turnover rate) reflects financial results for a single fund share.Total return shows how much your investment in the fund would have increased (or decreased) during each period, assuming you had reinvested all dividends and distributions.These figures have been derived from the fund’s financial statements.
| | | | | Year Ended December 31, | | |
| |
| |
| |
|
| Class A Shares | | 2006 | | 2005 | | 2004 | | 2003 | | 2002 |
| |
| |
| |
| |
| |
|
| Per Share Data ($): | | | | | | | | | | |
| Net asset value, beginning of period | | 20.10 | | 16.76 | | 14.24 | | 8.14 | | 9.68 |
| Investment Operations: | | | | | | | | | | |
| Investment income (loss)—net | | (.01)a | | (.14)a | | (.11)a | | .10 | | (.16) |
| Net realized and unrealized | | | | | | | | | | |
| gain (loss) on investments | | 6.13 | | 3.48 | | 2.63 | | 6.00 | | (1.38) |
| Total from Investment Operations | | 6.12 | | 3.34 | | 2.52 | | 6.10 | | (1.54) |
| Net asset value, end of period | | 26.22 | | 20.10 | | 16.76 | | 14.24 | | 8.14 |
| |
| |
| |
| |
| |
|
| Total Return (%) b | | 30.45 | | 19.93 | | 17.70 | | 74.94 | | (15.91) |
| |
| |
| |
| |
| |
|
| Ratios/Supplemental Data (%): | | | | | | | | | | |
| Ratio of total expenses | | | | | | | | | | |
| to average net assets | | 1.87 | | 2.29 | | 2.02 | | 2.54 | | 2.27 |
| Ratio of net expenses | | | | | | | | | | |
| to average net assets | | 1.78 | | 2.12 | | 1.92 | | 2.45 | | 2.24 |
| Ratio of net investment (loss) | | | | | | | | | | |
| to average net assets | | (.05) | | (.82) | | (.77) | | (.83) | | (.80) |
| Portfolio Turnover Rate c | | 73 | | 729 | | 648 | | 707 | | 495 |
| |
| |
| |
| |
| |
|
| Net Assets, end of period ($ x 1,000) | | 29,817 | | 22,107 | | 19,726 | | 27,252 | | 9,422 |
| a | | Based on average shares outstanding at each month end. |
| b | | Exclusive of sales charge. |
| c | | Portfolio Turnover Rate is a measure of portfolio activity that is calculated by dividing the lesser of purchases or sales |
| | | of securities, excluding securities having maturity dates at acquisition of one year or less, by the average value of the |
| | | portfolio securities held during the period, which is a rolling 12-month period. |
| See notes to financial statements. |
| | | | | Year Ended December 31, | | |
| |
| |
| |
|
| Class B Shares | | 2006 | | 2005 | | 2004 | | 2003 | | 2002 |
| |
| |
| |
| |
| |
|
| Per Share Data ($): | | | | | | | | | | |
| Net asset value, beginning of period | | 19.13 | | 16.09 | | 13.79 | | 7.95 | | 9.54 |
| Investment Operations: | | | | | | | | | | |
| Investment (loss)—net | | (.22)a | | (.28)a | | (.23)a | | (.31) | | (.29) |
| Net realized and unrealized | | | | | | | | | | |
| gain (loss) on investments | | 5.74 | | 3.32 | | 2.53 | | 6.15 | | (1.30) |
| Total from Investment Operations | | 5.52 | | 3.04 | | 2.30 | | 5.84 | | (1.59) |
| Net asset value, end of period | | 24.65 | | 19.13 | | 16.09 | | 13.79 | | 7.95 |
| |
| |
| |
| |
| |
|
| Total Return (%) b | | 28.91 | | 18.89 | | 16.68 | | 73.46 | | (16.67) |
| |
| |
| |
| |
| |
|
| Ratios/Supplemental Data (%): | | | | | | | | | | |
| Ratio of total expenses | | | | | | | | | | |
| to average net assets | | 2.85 | | 3.13 | | 2.89 | | 3.38 | | 3.12 |
| Ratio of net expenses | | | | | | | | | | |
| to average net assets | | 2.77 | | 2.97 | | 2.78 | | 3.29 | | 3.09 |
| Ratio of net investment (loss) | | | | | | | | | | |
| to average net assets | | (1.17) | | (1.66) | | (1.63) | | (1.44) | | (1.64) |
| Portfolio Turnover Rate c | | 73 | | 729 | | 648 | | 707 | | 495 |
| |
| |
| |
| |
| |
|
| Net Assets, end of period ($ x 1,000) | | 2,591 | | 16,421 | | 17,917 | | 18,198 | | 12,810 |
| a | | Based on average shares outstanding at each month end. |
| b | | Exclusive of sales charge. |
| c | | Portfolio Turnover Rate is a measure of portfolio activity that is calculated by dividing the lesser of purchases or sales |
| | | of securities, excluding securities having maturity dates at acquisition of one year or less, by the average value of the |
| | | portfolio securities held during the period, which is a rolling 12-month period. |
| See notes to financial statements. |
The Fund 23
FINANCIAL HIGHLIGHTS (continued)
|
| | | | | | | Year Ended December 31, | | |
| | | |
| |
| |
|
| Class C Shares | | 2006 | | 2005 | | 2004 | | 2003 | | 2002 |
| |
| |
| |
| |
| |
|
| Per Share Data ($): | | | | | | | | | | |
| Net asset value, beginning of period | | 19.12 | | 16.07 | | 13.76 | | 7.93 | | 9.52 |
| Investment Operations: | | | | | | | | | | |
| Investment (loss)—net | | (.19)a | | (.27)a | | (.22)a | | (.01) | | (.35) |
| Net realized and unrealized | | | | | | | | | | |
| gain (loss) on investments | | 5.80 | | 3.32 | | 2.53 | | 5.84 | | (1.24) |
| Total from Investment Operations | | 5.61 | | 3.05 | | 2.31 | | 5.83 | | (1.59) |
| Net asset value, end of period | | 24.73 | | 19.12 | | 16.07 | | 13.76 | | 7.93 |
| |
| |
| |
| |
| |
|
| Total Return (%) b | | 29.39 | | 18.98 | | 16.79 | | 73.52 | | (16.70) |
| |
| |
| |
| |
| |
|
| Ratios/Supplemental Data (%): | | | | | | | | | | |
| Ratio of total expenses | | | | | | | | | | |
| to average net assets | | 2.68 | | 3.08 | | 2.81 | | 3.34 | | 3.08 |
| Ratio of net expenses | | | | | | | | | | |
| to average net assets | | 2.60 | | 2.92 | | 2.70 | | 3.25 | | 3.05 |
| Ratio of net investment (loss) | | | | | | | | | | |
| to average net assets | | (.89) | | (1.60) | | (1.55) | | (1.43) | | (1.58) |
| Portfolio Turnover Rate c | | 73 | | 729 | | 648 | | 707 | | 495 |
| |
| |
| |
| |
| |
|
| Net Assets, end of period ($ x 1,000) | | 7,169 | | 7,568 | | 10,249 | | 10,639 | | 5,268 |
| |
| a | | Based on average shares outstanding at each month end. | | | | | | | | |
| b | | Exclusive of sales charge. | | | | | | | | | | |
| c | | Portfolio Turnover Rate is a measure of portfolio activity that is calculated by dividing the lesser of purchases or sales |
| | | of securities, excluding securities having maturity dates at acquisition of one year or less, by the average value of the |
| | | portfolio securities held during the period, which is a rolling 12-month period. | | | | |
| See notes to financial statements. | | | | | | | | | | |
| | | | | Year Ended December 31, | | |
| |
| |
| |
|
| Class F Shares | | 2006 | | 2005 | | 2004 | | 2003 | | 2002 |
| |
| |
| |
| |
| |
|
| Per Share Data ($): | | | | | | | | | | |
| Net asset value, beginning of period | | 20.11 | | 16.76 | | 14.24 | | 8.13 | | 9.67 |
| Investment Operations: | | | | | | | | | | |
| Investment (loss)—net | | (.04)a | | (.13)a | | (.11)a | | (.14) | | (.23) |
| Net realized and unrealized | | | | | | | | | | |
| gain (loss) on investments | | 6.14 | | 3.48 | | 2.63 | | 6.25 | | (1.31) |
| Total from Investment Operations | | 6.10 | | 3.35 | | 2.52 | | 6.11 | | (1.54) |
| Net asset value, end of period | | 26.21 | | 20.11 | | 16.76 | | 14.24 | | 8.13 |
| |
| |
| |
| |
| |
|
| Total Return (%) | | 30.33 | | 19.99 | | 17.70 | | 75.15 | | (15.93) |
| |
| |
| |
| |
| |
|
| Ratios/Supplemental Data (%): | | | | | | | | | | |
| Ratio of total expenses | | | | | | | | | | |
| to average net assets | | 1.93 | | 2.24 | | 2.00 | | 2.40 | | 2.21 |
| Ratio of net expenses | | | | | | | | | | |
| to average net assets | | 1.85 | | 2.08 | | 1.89 | | 2.31 | | 2.18 |
| Ratio of net investment (loss) | | | | | | | | | | |
| to average net assets | | (.20) | | (.76) | | (.75) | | (.45) | | (.74) |
| Portfolio Turnover Rate b | | 73 | | 729 | | 648 | | 707 | | 495 |
| |
| |
| |
| |
| |
|
| Net Assets, end of period ($ x 1,000) | | 72,043 | | 64,112 | | 75,677 | | 78,759 | | 50,742 |
| a | | Based on average shares outstanding at each month end. |
| b | | Portfolio Turnover Rate is a measure of portfolio activity that is calculated by dividing the lesser of purchases or sales |
| | | of securities, excluding securities having maturity dates at acquisition of one year or less, by the average value of the |
| | | portfolio securities held during the period, which is a rolling 12-month period. |
| See notes to financial statements. |
The Fund 25
FINANCIAL HIGHLIGHTS (continued)
|
| | | | | | | Year Ended December 31, | | |
| | | |
| |
| |
|
| Class R Shares | | 2006 | | 2005 | | 2004 | | 2003 | | 2002 |
| |
| |
| |
| |
| |
|
| Per Share Data ($): | | | | | | | | | | |
| Net asset value, beginning of period | | 19.60 | | 16.31 | | 13.82 | | 7.87 | | 9.56 |
| Investment Operations: | | | | | | | | | | |
| Investment income (loss)—net | | .03a | | (.12)a | | (.07)a | | .54 | | (.81) |
| Net realized and unrealized | | | | | | | | | | |
| gain (loss) on investments | | 5.97 | | 3.41 | | 2.56 | | 5.41 | | (.88) |
| Total from Investment Operations | | 6.00 | | 3.29 | | 2.49 | | 5.95 | | (1.69) |
| Net asset value, end of period | | 25.60 | | 19.60 | | 16.31 | | 13.82 | | 7.87 |
| |
| |
| |
| |
| |
|
| Total Return (%) | | 30.61 | | 20.17 | | 18.02 | | 75.60 | | (17.68) |
| |
| |
| |
| |
| |
|
| Ratios/Supplemental Data (%): | | | | | | | | | | |
| Ratio of total expenses | | | | | | | | | | |
| to average net assets | | 1.68 | | 2.08 | | 1.79 | | 2.17 | | 4.65 |
| Ratio of net expenses | | | | | | | | | | |
| to average net assets | | 1.61 | | 1.89 | | 1.68 | | 2.07 | | 3.91 |
| Ratio of net investment income | | | | | | | | | | |
| (loss) to average net assets | | .09 | | (.69) | | (.51) | | (.32) | | (2.20) |
| Portfolio Turnover Rate b | | 73 | | 729 | | 648 | | 707 | | 495 |
| |
| |
| |
| |
| |
|
| Net Assets, end of period ($ x 1,000) | | 200 | | 310 | | 190 | | 142 | | 37 |
| |
| a | | Based on average shares outstanding at each month end. | | | | | | | | |
| b | | Portfolio Turnover Rate is a measure of portfolio activity that is calculated by dividing the lesser of purchases or sales |
| | | of securities, excluding securities having maturity dates at acquisition of one year or less, by the average value of the |
| | | portfolio securities held during the period, which is a rolling 12-month period. | | | | | | |
| See notes to financial statements. | | | | | | | | | | |
| | | | | | | Year Ended December 31, | | |
| | | |
| |
| |
|
| Class T Shares | | 2006 | | 2005 | | 2004 | | 2003 | | 2002 |
| |
| |
| |
| |
| |
|
| Per Share Data ($): | | | | | | | | | | |
| Net asset value, beginning of period | | 19.16 | | 16.05 | | 13.70 | | 7.87 | | 9.50 |
| Investment Operations: | | | | | | | | | | |
| Investment (loss)—net | | (.11)a | | (.21)a | | (.17)a | | (.24) | | (.45) |
| Net realized and unrealized | | | | | | | | | | |
| gain (loss) on investments | | 5.85 | | 3.32 | | 2.52 | | 6.07 | | (1.18) |
| Total from Investment Operations | | 5.74 | | 3.11 | | 2.35 | | 5.83 | | (1.63) |
| Net asset value, end of period | | 24.90 | | 19.16 | | 16.05 | | 13.70 | | 7.87 |
| |
| |
| |
| |
| |
|
| Total Return (%) b | | 29.96 | | 19.38 | | 17.15 | | 74.08 | | (17.16) |
| |
| |
| |
| |
| |
|
| Ratios/Supplemental Data (%): | | | | | | | | | | |
| Ratio of total expenses | | | | | | | | | | |
| to average net assets | | 2.26 | | 2.70 | | 2.47 | | 3.16 | | 4.05 |
| Ratio of net expenses | | | | | | | | | | |
| to average net assets | | 2.18 | | 2.54 | | 2.36 | | 3.07 | | 4.03 |
| Ratio of net investment (loss) | | | | | | | | | | |
| to average net assets | | (.54) | | (1.24) | | (1.21) | | (1.06) | | (2.69) |
| Portfolio Turnover Rate c | | 73 | | 729 | | 648 | | 707 | | 495 |
| |
| |
| |
| |
| |
|
| Net Assets, end of period ($ x 1,000) | | 600 | | 444 | | 510 | | 522 | | 345 |
| |
| a | | Based on average shares outstanding at each month end. | | | | | | | | |
| b | | Exclusive of sales charge. | | | | | | | | | | |
| c | | Portfolio Turnover Rate is a measure of portfolio activity that is calculated by dividing the lesser of purchases or sales |
| | | of securities, excluding securities having maturity dates at acquisition of one year or less, by the average value of the |
| | | portfolio securities held during the period, which is a rolling 12-month period. | | | | | | |
| See notes to financial statements. | | | | | | | | | | |
The Fund 27
NOTES TO FINANCIAL STATEMENTS
NOTE 1—Significant Accounting Policies:
Dreyfus Founders Passport Fund (the “fund”) is a separate diversified series of Dreyfus Founders Funds, Inc. (the “Company”), which is registered under the Investment Company Act of 1940, as amended (the “Act”), as an open-end management investment company and operates as a series company currently offering eight series, including the fund. The fund’s investment objective is to seek capital appreciation through investments in foreign small-cap companies.Founders Asset Management LLC (the “Manager” or “Founders”) serves as the fund’s investment adviser. Founders is an indirect wholly-owned subsidiary of Mellon Financial Corporation (“Mellon Financial”), a publicly-owned financial services company which provides a comprehensive range of financial products and services in domestic and selected international markets.
On December 4, 2006, Mellon Financial and The Bank of New York Company, Inc. announced that they had entered into a definitive agreement to merge. The new company will be called The Bank of New York Mellon Corporation. As part of this transaction, Founders would become an indirect wholly-owned subsidiary of The Bank of New York Mellon Corporation. The transaction is subject to certain regulatory approvals and the approval of The Bank of New York Company, Inc.’s and Mellon Financial’s shareholders, as well as other customary conditions to closing. Subject to such approvals and the satisfaction of the other conditions, Mellon Financial and The Bank of New York Company, Inc. expect the transaction to be completed in the third quarter of 2007.
Dreyfus Service Corporation (the “Distributor”), the direct owner of Founders and a wholly-owned subsidiary of The Dreyfus Corporation (“Dreyfus”, an affiliate of Founders), is the Distributor of the fund’s shares. The fund is authorized to issue up to 600 million shares of Common Stock, par value $ .01 per share, in the following classes of shares: Class A, Class B, Class C, Class F, Class R and Class T shares. Class A and Class T shares are subject to a sales charge imposed at the time
of purchase. Class B shares are subject to a contingent deferred sales charge (“CDSC”) imposed on Class B share redemptions made within six years of purchase and automatically convert to Class A shares after six years. Class C shares are subject to a CDSC imposed on Class C shares redeemed within one year of purchase. Class F and Class R shares are sold at net asset value (“NAV”) per share. Class F shares are sold only to Class F grandfathered investors, and Class R shares are sold only to eligible institutional investors. Other differences between the classes include the services offered to and the expenses borne by each class. Income and realized and unrealized gains or losses on investments are allocated to each class of shares based on its relative net assets.
Effective June 1, 2006, the fund no longer offers Class B shares, except in connection with dividend reinvestment and permitted exchanges of Class B shares.
Each class of the fund bears expenses incurred specifically on its behalf and, in addition, each class bears a portion of general expenses based on the relative net assets or the number of shareholder accounts of the class.The type of expense determines the allocation method.
The Company’s Board of Directors has authorized the payment of certain fund expenses with commissions on fund portfolio transactions.The commissions reduced miscellaneous expenses and are included in the expense offset to broker commissions in the Statement of Operations.
The fund’s financial statements are prepared in accordance with U.S. generally accepted accounting principles, which requires the use of management estimates and assumptions. Actual results could differ from those estimates.
In the normal course of business, the fund may enter into contracts and agreements that contain a variety of representations and warranties, and which provide general indemnifications. The maximum exposure to the fund under these arrangements is unknown, as this would involve future claims that may be made against the fund that
The Fund 29
NOTES TO FINANCIAL STATEMENTS (continued)
|
have not yet occurred. However, based on experience, the fund expects the risks of loss to be remote.
(a) Portfolio valuation: A domestic equity security listed or traded on a securities exchange or in the over-the-counter market is valued at its last sale price on the exchange or market where it is principally traded or, in the case of a security traded on NASDAQ, at its official closing price. Lacking any sales on that day, the security is valued at the current closing bid price, or by quotes from dealers making a market in the security if the closing bid price is not available, or in the case of written call options, at the mean between the highest bid and lowest asked quotations obtained from at least two securities dealers.
A foreign equity security traded on a foreign exchange is valued at the last quoted official closing price available before the time when the fund’s assets are valued, or at the last quoted sales price if the exchange does not provide an official closing price or if the foreign market has not yet closed. Lacking any sales that day, the security is valued at the current closing bid price, or by quotes from dealers making a market in the security if the closing bid price is not available. New York closing exchange rates are used to convert foreign currencies to U.S. dollars.
A debt security with a remaining maturity greater than 60 days at the time of purchase is valued in accordance with the evaluated bid price supplied by a pricing service approved by the Company’s Board of Directors or, if such price is not available, at the mean between the highest bid and lowest asked quotations obtained from at least two securities dealers. A debt security with a remaining maturity of 60 days or less at the time of purchase is valued at amortized cost, which approximates market value, unless it is determined that amortized cost would not represent market value, in which case the securities would be marked to market.The fund amortizes premiums and discounts on all debt securities.
If market quotations or official closing prices are not readily available or are determined not to reflect accurately fair value, securities will be valued at their fair value as determined in good faith by the Company’s
Board of Directors or pursuant to procedures approved by the Board of Directors.These situations may include instances where an event occurs after the close of the market on which a security is traded but before the fund calculates its NAV, and it is determined that the event has materially affected the value of the security. Fair value of foreign equity securities may be determined with the assistance of a pricing service using correlations between the movement of prices of foreign securities and indexes of domestic securities and other appropriate indicators, such as closing market prices of relevant ADRs and futures contracts.
Investments in registered investment companies are valued at their NAV.
Using fair value to price securities requires the use of estimates, and as such, may result in a value that is different from a security’s most recent closing price and from the prices used by other mutual funds to calculate their NAV’s. In addition, it is possible that the fair value determined for a security may be different from the value that may be realized upon the security’s sale, and that these differences may be material to the NAV of the fund.
On September 20, 2006, the Financial Accounting Standards Board (FASB) released Statement of Financial Accounting Standards No. 157 “Fair Value Measurements” (“FAS 157”). FAS 157 establishes an authoritative definition of fair value, sets out a framework for measuring fair value, and requires additional disclosures about fair value measurements. The application of FAS 157 is required for fiscal years beginning after November 15, 2007 and interim periods within those fiscal years. Management does not believe that the application of this standard will have a material impact on the financial statements of the fund.
(b) Foreign Securities and Currency Transactions: The fund normally will invest a large portion of its assets in foreign securities. Foreign securities carry more risk than U.S. securities, such as political and currency risks. In the event the fund executes a foreign security transaction, the fund may enter into a foreign currency contract to settle the foreign security transaction.The fund could be exposed to risk if counterparties
The Fund 31
NOTES TO FINANCIAL STATEMENTS (continued)
|
are unable to meet the terms of the contracts or if the value of the currency changes unfavorably to the U.S. dollar.The resultant foreign currency gain or loss from the contract is recorded as foreign currency gain or loss and is presented as such in the Statement of Operations.
The accounting records of the fund are maintained in U.S. dollars.The market values of foreign securities, currency holdings and other assets and liabilities are translated into U.S. dollars based on the current exchange rates each business day. Purchases and sales of investment securities and income and expense items denominated in foreign currencies are translated into U.S. dollar amounts on the respective dates of such transactions.
The fund does not isolate that portion of the results of operations resulting from changes in foreign exchange rates on investments from the fluctuations arising from changes in market prices of securities held. Such fluctuations are included with the net unrealized appreciation/(depreciation) from investments and foreign currency transactions on the Statement of Operations.
Reported net realized foreign exchange gains or losses arise from sales of foreign currencies, currency gains or losses realized between the trade and settlement dates on securities transactions, and the difference between the amounts of dividends, interest, and foreign withholding taxes recorded on the fund’s books and the U.S. dollar equivalent of the amounts actually received or paid. Net unrealized appreciation or depreciation on investments and foreign currency translation arises from changes in the values of assets and liabilities, including investments in securities held at the date of the financial statements, resulting from changes in the exchange rates and changes in market prices of securities held.
(c) Securities transactions and investment income: Securities transactions are recorded on a trade date basis. Realized gain and loss from securities transactions are recorded on the identified cost basis. Dividend income is recognized on the ex-dividend date and interest
income, including, where applicable, accretion of discount and amortization of premium on investments, is recognized on the accrual basis.
The fund has an arrangement with the custodian bank, Mellon Bank, N.A. (“Mellon Bank”), which is an affiliate of Founders, whereby the fund receives earnings credits from the custodian when positive cash balances are maintained, which are used to offset custody fees. For financial reporting purposes, the fund includes net earnings credits as an expense offset in the Statement of Operations.
(d) Affiliated issuers: Investments in other investment companies advised by the Manager or its affiliates are defined as “affiliated” in the Act.
(e) Dividends to shareholders: Dividends are recorded on the ex-dividend date. Dividends from investment income-net and dividends from net realized capital gain, if any, are normally declared and paid annually, but the fund may make distributions on a more frequent basis to comply with the distribution requirements of the Code of 1986, as amended (the “Code”).To the extent that net realized capital gain can be offset by capital loss carryovers, it is the policy of the fund not to distribute such gain.Income and capital gain distributions are determined in accordance with income tax regulations, which may differ from U.S. generally accepted accounting principles.
(f) Federal income taxes: No provision has been made for federal income taxes since it is the policy of the fund to comply with the requirements of Subchapter M of the Internal Revenue Code that are applicable to regulated investment companies and to make distributions of income and capital gains sufficient to relieve it from all income taxes. The fund is treated as a separate tax entity for federal income tax purposes.
On July 13, 2006, the FASB released FASB Interpretation No. 48 “Accounting for Uncertainty in Income Taxes” (FIN 48). FIN 48 provides guidance for how uncertain tax positions should be recognized, measured, presented and disclosed in the financial statements. FIN 48
The Fund 33
NOTES TO FINANCIAL STATEMENTS (continued)
|
requires the evaluation of tax positions taken or expected to be taken in the course of preparing the fund’s tax returns to determine whether the tax positions are “more-likely-than-not” of being sustained by the applicable tax authority.Tax positions not deemed to meet the more-likely-than-not threshold would be recorded as a tax benefit or expense in the current year. Adoption of FIN 48 is required for fiscal years beginning after December 15, 2006 and is to be applied to all open tax years as of the effective date. At this time, management is evaluating the implications of FIN 48 and its impact, if any, in the financial statements has not yet been determined.
At December 31, 2006, the components of accumulated earnings on a tax basis were as follows: undistributed ordinary income $420,528, accumulated capital losses $106,702,742 and unrealized appreciation $27,531,745.
The accumulated capital loss carryover is available to be applied against future net securities profits, if any, realized subsequent to December 31, 2006. If not applied, $94,869,658 of the carryover expires in fiscal 2009 and $11,833,084 expires in fiscal 2010.
During the period ended December 31, 2006, as a result of permanent book to tax differences, primarily due to the tax treatment for foreign currency transactions and passive foreign investment companies, the fund increased accumulated undistributed investment income-net $169,130 and decreased accumulated net realized gain (loss) on investments by the same amount. Net assets were not affected by this reclassification.
NOTE 2—Bank Line of Credit:
|
The Company has a line of credit arrangement (“LOC”) with State Street Bank and Trust Company, to be used for temporary or emergency purposes, primarily for financing redemption payments. The borrowings by each series of the Company are limited to the lesser of (a) $50 million, or (b) the lesser of 25% of the series’ total net assets or the maximum amount which the series is permitted to borrow pur-
suant to the prospectus, any law or any other agreement. Combined borrowings are subject to the $50 million cap on the total LOC. Each series agrees to pay annual fees and interest on the unpaid balance based on prevailing market rates as defined in the LOC.
The average daily amount of borrowings outstanding under the LOC during the period ended December 31, 2006, was approximately $76,100, with a related weighted average annualized interest rate of 5.69% .
NOTE 3—Investment Advisory Fee and Other Transactions With Affiliates:
(a) In accordance with an investment advisory agreement between the Company and Founders, the fund compensates Founders for its services as investment adviser by the payment of fees computed daily and paid monthly at the annual rate equal to a percentage of the average daily value of the fund’s net assets.The fee is 1% of the first $250 million of net assets, .80% of the next $250 million of net assets and .70% of net assets in excess of $500 million.
During the period ended December 31, 2006, the Distributor retained $413 and $261 from sales commissions earned on sales of the fund’s Class A and Class T shares, respectively, and $13,286 and $8,951 from CDSC on redemptions of the fund’s Class B and Class C shares, respectively.
(b) Under the Distribution Plan (the “Plan”) adopted pursuant to Rule 12b-1 under the Act, Class B, Class C and Class T shares pay the Distributor for distributing their shares at an annual rate of .75% of the value of their average daily net assets of Class B and Class C shares and .25% of the value of the average daily net assets of Class T shares. During the period ended December 31, 2006, Class B, Class C and Class T shares were charged $47,580, $55,386 and $1,260, respectively, pursuant to the Plan.
The Fund 35
NOTES TO FINANCIAL STATEMENTS (continued)
|
The fund has adopted a Distribution Plan pursuant to Rule 12b-1 under the Act applicable to its Class F shares. Under the plan, the fund is authorized to reimburse the Distributor for expenses paid for distributing or servicing its Class F shares at an annual rate of up to .25% of the value of the average daily net assets of the fund’s Class F shares. During the period ended December 31, 2006, Class F shares were charged $164,816 pursuant to this Distribution Plan.
(c) Under the Shareholder Services Plan, Class A, Class B, Class C and Class T shares pay the Distributor at an annual rate of .25% of the value of their average daily net assets for the provision of certain services. The services provided may include personal services relating to shareholder accounts, such as answering shareholder inquiries regarding the fund and providing reports and other information, and services related to the maintenance of shareholder accounts. The Distributor may make payments to Service Agents (a securities dealer, financial institution or other industry professional) in respect of these services. The Distributor determines the amounts to be paid to Service Agents. During the period ended December 31, 2006, Class A, Class B, Class C and Class T shares were charged $77,034, $15,860, $18,462 and $1,260, respectively, pursuant to the Shareholder Services Plan.
The Company has a shareholder services agreement with the Distributor whereby the fund has agreed to compensate the Distributor for providing certain shareholder servicing functions to holders of Class F shares. The fund paid the Distributor a monthly fee equal, on an annual basis, to $24.00 per Class F shareholder account considered to be an open account at any time during a given month. During the period ended December 31, 2006, Class F shares were charged $53,735 pursuant to this shareholder services agreement.
Dreyfus Transfer, Inc. (“DTI”), a wholly-owned subsidiary of Dreyfus, is the transfer and dividend disbursing agent for all of the fund’s share classes.With the exception of out-of-pocket charges, the fees charged by DTI with respect to the fund’s Class F shares are paid by the
Distributor. The out-of-pocket charges from DTI are paid by the fund. During the period ended December 31, 2006, Class F shares were charged $21,275 for out-of-pocket transfer agent charges.
The fees charged by DTI with respect to the fund’s Class A, B, C, R and T shares are paid by the fund.These transfer agency fees, including both the per account fees paid to DTI and out-of-pocket charges, during the period ended December 31, 2006 were $52,337.
The fund has agreed to compensate Founders for providing accounting services, administration, compliance monitoring, regulatory and shareholder reporting, as well as related facilities, equipment and clerical help.The fee is computed at the annual rate of .10% of the average daily net assets of the fund on the first $500 million, .065% of the average daily net assets of the fund on the next $500 million and .02% of the average daily net assets of the fund in excess of $1 billion, plus reasonable out-of-pocket expenses. Founders has contractually agreed in writing to waive any fees received for these services to the extent they exceed Founders’ costs in providing the services. Effective January 1, 2007, Dreyfus replaced Founders as fund accounting and administrative services agent for the fund pursuant to an agreement containing substantially the same terms.
Mellon Bank serves as custodian for the fund.The fees for the custody services are subject to reduction by credits earned on the cash balances of the fund held by the custodian, which are shown as earnings credits on the Statement of Operations. The fund could have employed these assets elsewhere to produce income had it not entered into this arrangement. The custodian contractually agreed in writing to a fee waiver for the Company during the time period and in the amount set forth below:
| Time Period | | Amount of Waiver ($) |
| |
|
| 9/1/05 to 8/31/06 | | 200,000 |
The Fund 37
NOTES TO FINANCIAL STATEMENTS (continued)
|
This fee waiver was allocated among the Company’s series in proportion to their respective shares of the total custodian fee. For the period ended December 31, 2006, the fund’s portion of the waiver was $91,108, which reduced the amount paid to Mellon Bank to $98,894.
The components of Due to Founders Asset Management LLC and affiliates in the Statement of Assets and Liabilities consist of: investment advisory fees $94,816, Rule 12b-1 distribution plan fees $21,488, shareholder services plan fees $20,910, custodian fees $35,205, accounting fees $9,015 and transfer agency per account fees $13,366.
(d) Annual retainer fees and attendance fees for the Company’s Board of Directors are allocated to each series of the Company based on net assets.The Company’s Board of Directors has adopted a deferred compensation plan for Company directors that enables directors to elect to defer receipt of all or a portion of the annual compensation that they are entitled to receive from the Company. Under the plan, the compensation deferred is invested in shares of one or more of the Company’s series.The amount paid to the director under the plan will be determined based upon the performance of the selected series.The current value of these amounts is included in Other Assets and Directors’ Deferred Compensation on the Statement of Assets and Liabilities. Changes in market value are included in the directors’ fees and expenses and the net change in unrealized appreciation/depreciation of investments on the Statement of Operations. Deferral of directors’ fees under the plan does not affect the net assets of the fund.
Certain officers of the Company are also officers and/or directors of Founders or its affiliates, which pay their compensation.The affairs of the fund, including services provided by Founders, are subject to the supervision and general oversight of the Company’s Board of Directors.
(e) Pursuant to an exemptive order from the SEC, the fund may invest its available cash balances in affiliated money market mutual funds. Management fees of the underlying money market mutual funds have been waived by Dreyfus.
NOTE 4—Securities Transactions:
The aggregate amount of purchases and sales of investment securities, excluding short-term securities, financial futures and forward currency exchange contracts, during the period ended December 31, 2006, amounted to $80,378,730 and $108,480,627 respectively.
The fund may invest in financial futures contracts in order to gain exposure to or protect against changes in the market.The fund is exposed to market risk as a result of changes in the value of the underlying financial instruments. Investments in financial futures require the fund to “mark to market” on a daily basis, which reflects the change in market value of the contracts at the close of each day’s trading.Accordingly, variation margin payments are received or made to reflect daily unrealized appreciation or depreciation.When the contracts are closed, the fund recognizes a realized gain or loss.These investments require initial margin deposits with a broker, which consist of cash or cash equivalents.The amount of these deposits is determined by the exchange or Board of Trade on which the contract is traded and is subject to change. Contracts open at December 31, 2006, are set forth in the Statement of Financial Futures.
The fund enters into forward currency exchange contracts in order to hedge its exposure to changes in foreign currency exchange rates on its foreign portfolio holdings and to settle foreign currency transac-tions.When executing forward currency exchange contracts, the fund is obligated to buy or sell a foreign currency at a specified rate on a certain date in the future. With respect to sales of forward currency exchange contracts, the fund would incur a loss if the value of the contract increases between the date the forward contract is opened and the date the forward contract is closed.The fund realizes a gain if the value of the contract decreases between those dates. With respect to purchases of forward currency exchange contracts, the fund would incur a loss if the value of the contract decreases between the date the forward contract is opened and the date the forward contract is closed. The fund realizes a gain if the value of the contract increases between
The Fund 39
NOTES TO FINANCIAL STATEMENTS (continued)
|
those dates. The fund is also exposed to credit risk associated with counterparty nonperformance on these forward currency exchange contracts which is typically limited to the unrealized gain on each open contract. The following summarizes open forward currency exchange contracts at December 31, 2006:
| | | Foreign | | | | | | Unrealized |
| Forward Currency | | Currency | | | | | | Appreciation |
| Exchange Contracts | | Amounts | | Proceeds ($) | | Value ($) | | (Depreciation) ($) |
| |
| |
| |
| |
|
| Sales: | | | | | | | | |
| British Pound, | | | | | | | | |
| expiring 1/2/2007 | | 85,886 | | 168,163 | | 168,163 | | 0 |
| Swedish Krona, | | | | | | | | |
| expiring 1/2/2007 | | 233,322 | | 34,081 | | 34,082 | | (1) |
| Total | | | | | | | | (1) |
At December 31, 2006, the cost of investments for federal income tax purposes was $83,866,080; accordingly, accumulated net unrealized appreciation on investments was $27,512,888, consisting of $28,924,401 gross unrealized appreciation and $1,411,513 gross unrealized depreciation.
REPORT OF INDEPENDENT REGISTERED PUBLIC ACCOUNTING FIRM
To the Board of Directors and Shareholders of Dreyfus Founders Funds, Inc.
In our opinion, the accompanying statement of assets and liabilities, including the statements of investments and of financial futures, and the related statements of operations and of changes in net assets and the financial highlights present fairly, in all material respects, the financial position of Dreyfus Founders Passport Fund (one of the portfolios constituting Dreyfus Founders Funds, Inc., hereafter referred to as the “Fund”) at December 31, 2006, the results of its operations for the year then ended, the changes in its net assets for each of the two years in the period then ended and the financial highlights for each of the five years in the period then ended, in conformity with accounting principles generally accepted in the United States of America. These financial statements and financial highlights (hereafter referred to as “financial statements”) are the responsibility of the Fund’s management; our responsibility is to express an opinion on these financial statements based on our audits.We conducted our audits of these financial statements in accordance with the standards of the Public Company Accounting Oversight Board (United States).Those standards require that we plan and perform the audit to obtain reasonable assurance about whether the financial statements are free of material misstatement. An audit includes examining, on a test basis, evidence supporting the amounts and disclosures in the financial statements, assessing the accounting principles used and significant estimates made by management, and evaluating the overall financial statement presentation. We believe that our audits, which included confirmation of securities at December 31, 2006 by correspondence with the custodian and brokers, provide a reasonable basis for our opinion.
| | PricewaterhouseCoopers LLP
New York, New York
February 23, 2007
|
The Fund 41
FACTORS CONSIDERED IN RENEWING THE ADVISORY AGREEMENT (Unaudited)
At a meeting of the board of directors of Dreyfus Founders Funds, Inc. (the “Funds” and, in reference to any one of the Funds’ portfolios, a “Fund”) held on August 9 and 10, 2006, the Funds’ directors unanimously approved the continuation of the Investment Advisory Agreement (“management agreement”) between each of the Funds and Founders Asset Management LLC, the Funds’ investment adviser (“Founders”), for a one-year term ending August 31, 2007.The board of directors of the Funds (“board”) is comprised entirely of individuals who have no affiliation with Founders or any affiliates of Founders (the “directors”).
Prior to the directors’ August 2006 meeting, Founders had provided the directors with extensive materials related to the renewal of the management agreement, including performance and expense information for other investment companies with similar investment objectives to each Fund derived from data compiled by Lipper Inc., an independent third party (“Lipper”).
During their meeting, the directors discussed the proposed continuance of the management agreement with the senior management personnel of Founders. At the conclusion of these discussions, the directors and their independent counsel met in a private session at which no representatives of Founders were present, to continue their discussion of continuance of the agreement. In determining to continue the management agreement, the directors considered all factors which they believed to be relevant, including the following:
Nature, Extent and Quality of Services Provided and to be Provided by Founders
The directors recognized that they have had the opportunity to evaluate the investment and non-investment related services which Founders provides to the Funds primarily through their quarterly review of all of the operations of the Funds during Fund committee and Fund board meetings held throughout the past twelve months.At each such meeting, extensive discussions of Fund operations are held with senior management personnel of Founders and a large volume of documentation
with respect to these operations is provided to and reviewed by the directors. Such discussions and documentation afford the directors the continual opportunity to evaluate the nature, extent, and quality of the services provided by Founders and its affiliates to the Funds.
The directors were satisfied that Founders is managing the investment of the assets of the Funds in accordance with each Fund’s respective investment objective, policies and restrictions, subject to the directors’ overall supervision.
The directors considered that Founders also provides many non-investment related services to the Funds in fulfilling its responsibilities under the management agreement.
Following their discussion and review, the directors reached the following conclusions:
- That the breadth and quality of investment advisory and other ser- vices being provided to the Funds are satisfactory, as evidenced in part by the performance records of the Funds, to which the direc- tors gave significant attention as indicated below; and
- That the directors are satisfied not only with the research, long-term portfolio management, and trading services being provided to the Funds, but also recognize that Founders or its affiliates have pro- vided the highest quality accounting, compliance and regulatory, administrative, underwriting, custody, shareholder, transfer agent and cash management services to the Funds, while charging fair, reason- able and competitive fees.
On a quarterly basis, the directors hold in-person meetings with representatives of the portfolio management team for each Fund (usually a portfolio manager), during which each representative reviews, among other items,performance information,attribution analyses,and the portfolio manager’s investment outlook. The directors also receive written monthly and quarterly performance information for each Fund.
The Fund 43
FACTORS CONSIDERED IN RENEWING THE
ADVISORY AGREEMENT (Unaudited) (continued)
|
In conjunction with their consideration of renewal of the management agreement, the directors received a more detailed performance report about each Fund from Lipper.These reports compared each Fund’s performance to both a relatively small group of similar funds selected by Lipper (the “Lipper performance group”), as well as to all funds in the applicable Lipper category (the “Lipper performance universe”).
Passport Fund’s performance for the one-year period ended December 31, 2005 placed it in the third quintile of its Lipper performance group and in the fourth quintile of its Lipper international small/mid-cap growth fund performance universe. For the three-year period ended December 31, 2005, the Fund’s performance within its Lipper-selected group and universe had placed it in the first and second quintiles, respec-tively.The Fund’s current portfolio management team began managing the Fund in November 2005. For the six-month period ended June 30, 2006, the Fund’s performance placed it in the first (top) quintile of its Lipper performance group and its Lipper performance universe. The directors deemed these relative performance results to be satisfactory, but stressed the importance to Founders of the need to continue to seek to improve the Fund’s longer-term performance record.
After consideration of all relevant information and data, the directors concluded that although past performance cannot be a guaranty of future performance, each Fund and its shareholders would continue to benefit from Founders’ investment management of the Fund. The directors further determined:
- That although certain of the Funds have experienced performance difficulties, Founders has focused its efforts upon improving the per- formance records of the Funds and will continue to seek improve- ment; and
- That the materials provided by Lipper demonstrated that most of the Funds maintained satisfactory performance quintile rankings in their respective comparison groups and comparison universes, with six of the eight Funds placing in the top two quintiles of their respective Lipper performance universes for the three-years ended December 31, 2005, and five of the eight Funds placing in the top two quintiles for the six months ended June 30, 2006.
Costs of the Services to be Provided and Profits to be Realized by Founders and Its Affiliates from Founders’ Relationship With the Funds
The directors recognized that on a quarterly basis, they receive information with respect to each Fund’s expenses. The directors carefully review and discuss the expense ratios for all classes of shares of each Fund at each of their quarterly meetings throughout the year.
In conjunction with their annual consideration of renewal of the Funds’ management agreement and other service arrangements, the directors received information from Lipper which included graphs for each Fund that provided outlines of contractual management fees at common asset levels, actual management fees, actual non-management expenses and actual total Fund expenses, each graph comparing the relevant information of each Fund with each Fund’s Lipper performance group.
The directors noted that for the period ended December 31, 2005, Passport Fund’s management fees ranked in the third quintile of its Lipper performance group, with the Fund’s fees the eighth lowest of 15 “peer funds.” The Fund’s contractual management fees at a common asset level were determined by Lipper to be lower than 11 of the 15 funds in its group.The Fund’s management fees were in the third quintile of its Lipper expense universe.
The directors also considered a brochure provided by Lipper which included information with respect to the profitability of the mutual fund advisory activities conducted by a number of publicly-held corporations. Lipper also prepared an analysis providing detailed information with respect to the types of services rendered to various mutual fund complexes under their respective investment advisory contracts.
The directors had been provided with extensive materials with respect to the profitability derived by Founders from providing investment advisory and other services to the Funds as a group and to each Fund individually.
The Fund 45
FACTORS CONSIDERED IN RENEWING THE
ADVISORY AGREEMENT (Unaudited) (continued)
|
The directors further considered certain indirect benefits received by Founders and its affiliates from providing investment advisory services to the Funds.These included the following:
- Since Founders manages several non-Fund accounts in a style that is similar to that used for certain of the Funds, Founders and its affiliates realize certain efficiencies in performing the portfolio management, trading and operational functions related to those accounts;
- The Funds’ brokerage transactions may be executed with brokers that provide research and brokerage services to Founders and its affiliates. These research and brokerage services may be useful to Founders and its affiliates in providing investment services to any of the clients they advise, not just the Funds; and
- Founders receives fees for providing accounting services to the Funds, and affiliates of Founders receive various fees for providing underwriting, shareholder, transfer agency, custody and cash man- agement services to the Funds.
The directors also reviewed a table listing the Funds and corresponding subadvisory accounts managed by Founders, and their respective fee schedules. In their review of this table, the directors noted that Founders provides many services to the Funds in fulfilling its responsibilities under the management agreement that it does not provide to entities for which Founders has assumed subadvisory duties. The directors concluded that the fees paid to Founders under the management agreement are reasonable in relation to the nature and extent of the services provided by Founders to the Funds under the agreement.
After deliberation and discussion of Fund fees and expenses, the directors determined:
- That upon review of the advisory fee structures of the Funds in comparison with the competitive performance groups selected by Lipper, the levels of investment advisory fees paid by the Funds were deemed to be acceptable;
- That the expense ratios of the Funds are acceptable and that Founders continually reviews each Fund’s total expense ratio and has initiated voluntarily expense caps and fee waivers for certain Funds to reduce their expense ratios;
- That the majority of the Funds’ expense ratios increased in 2005 from those experienced in 2004, primarily as a result of declines in Fund assets; and
- That the comparative fee and expense information included in the materials provided by Lipper supports the determination that the advisory and other fees payable by the Funds to Founders and its affiliates are essentially fees which would be similar to those which would have resulted solely from “arm’s-length” bargaining.
With respect to profitability to Founders, the directors reviewed the adviser profitability analysis provided by Lipper, which demonstrated that Founders’ 2005 profitability from providing management services to the Funds was reasonable in comparison to the entities included in the Lipper analysis.
The directors were also advised by independent counsel of the profitability percentage ranges determined by court cases to be acceptable and determined that Founders’ profitability percentage for providing management and other services to the Funds was reasonable.
The directors concluded that Founders’ profits from providing management services to the Funds were reasonable in relationship to the overall services which Founders provides.
Economies of Scale
The directors reviewed information provided by Founders which summarized the extent, if any, that both Founders and the Funds would achieve certain economies of scale if the assets of the Funds were to increase.
The Fund 47
FACTORS CONSIDERED IN RENEWING THE
ADVISORY AGREEMENT (Unaudited) (continued)
|
After review and discussion, the directors considered the extent to which economies of scale and common management are shared with each Fund, including the economies that would be realized from the growth of each Fund’s assets. After such consideration, the directors determined that all of the Funds have structured breakpoints in their advisory fees, which result in fee reductions as the assets of each Fund reach defined levels, and that such fee reductions, when implemented, would benefit all of the applicable Fund’s shareholders through decreases in the Fund’s expense ratio.
Dedication to Regulatory Requirements and Restrictions
An important factor in the directors’ consideration of renewal of the Funds’ management agreement with Founders included the directors’ recognition of the dedication by Founders of stringent adherence to regulatory requirements and restrictions.The directors determined that Founders is dedicated to compliance with all applicable rules and regulations and that the systems of controls which are in place to ensure that the service providers to the Funds, including Founders, and the Funds themselves, maintain strict adherence to the law are excellent.
The directors determined that they are generally satisfied with the performance of the Funds and with the quality of the advisory and other services being provided by Founders and its affiliates to the Funds. The directors recognized that overall Fund performance has improved in recent years and that efforts are being and will continue to be made to enhance such improvements and to maintain Fund expense ratios at reasonable and acceptable levels.
The directors concluded that continuation of the current management agreement between each Fund and Founders, which would enable each Fund to continue to receive investment advisory services from Founders, is in the best interests of each Fund and its shareholders, the services to be performed under the management agreement are services required for the operations of the Funds, Founders has provided satisfactory investment management services to the Funds in the past, and the fees for the management services which Founders will perform will be within the range of what would have been negotiated at arm’s length in light of the circumstances.
The Fund 49
YOUR BOARD REPRESENTATIVES (Unaudited)
The Board of Directors of the Company oversees all 8 Dreyfus Founders Funds.The business and affairs of the Company are managed under the direction of the Board. The directors serving on the Board perform their responsibilities in the manner which they reasonably believe to be in the best interests of the Funds and their shareholders.
All of the directors,as listed below,are independent directors.They are not affiliated with the Fund ‘s adviser, its parent company, or its affiliates.The directors have no official term of office and generally serve until they retire (normally at age 75, but subject to extension to age 80), resign, or are not re-elected.As you can see from their backgrounds, the directors have broad experience as active or former business and community leaders.
Eugene H.Vaughan, CFA, 73.Year elected to the Board: 1970
Board Chairman. Founding Chairman,Vaughan Nelson Investment Management, LP, an investment counseling firm. Director, Encore Bank, Houston. Founding Chairman, Center for Houston’s Future, a non-profit organization. Founding Chairman and former Governor, CFA Institute. Past Chairman and Trustee, Institute of Chartered Financial Analysts. Past Chairman and Director, Financial Analysts Federation. Chairman-elect, University of Texas Health Science Center.
Alan S. Danson, 67.Year elected to the Board: 1991
Private investor. Formerly, President and Director, D.H. Management, Inc., the general partner of a limited partnership with technology company holdings (1996 to 2003). Director, Gore Range Natural Science School and The Les Streeter Program, Inc., both of which are non-profit organizations.
Robert P. Mastrovita, 62.Year elected to the Board: 1998
Private investor. Chairman of a private charitable foundation (1997 to present). Formerly, Chairman and Director, Hagler, Mastrovita & Hewitt, Inc., a registered investment adviser (1982 to 1997). Member, Boston Society of Security Analysts. Trustee, Partridge Academy.
Trygve E. Myhren, 70.Year elected to the Board: 1996
President, Myhren Media, Inc., a firm that invests in and advises media, telecommunications, Internet and software companies. Special Limited Partner and member of Investment Committee, Megunticook Funds, a venture capital firm (1998 to present). Director,Advanced Marketing Services, Inc.Trustee and Chairman of Finance
Committee, the University of Denver.Trustee, Denver Art Museum. Member, Cable Television Hall of Fame. Formerly, President (1990 to 1996) and Director (1992 to 2001) of the Providence Journal Company, a diversified media and communications company. Formerly, Chairman and Chief Executive Officer of American Television and Communications Corporation (now Timer Warner Cable) (1981 to 1988). Formerly, Chairman of the National Cable Television Association (1986-1987).
George W. Phillips, 68.Year elected to the Board: 1998
Retired.Vice Chairman of the Board, Chairman of the Finance Committee, and Chairman of the Investment Committee, Children’s Medical Center of Boston. Formerly, President and Chief Executive Officer (1992 to 1997) and Director (1992 to 2002) of Warren Bancorp, Inc. Formerly, President, Chief Executive Officer and Director of Warren Five Cents Savings Bank (1992 to 1997).
Martha A. Solis-Turner, 46.Year elected to the Board: 2005
Formerly, Telecommunications Director, Wholesale Markets (1995 to 2001), and Manager (1990 to 1995), Qwest Communications International Inc. Board member and Treasurer, Mile High Montessori Early Learning Centers (2002 to present), and formerly, Board member (1995 to 2004) and Vice President (2002 to 2004), Curtis Park Community Center, both of which are non-profit organizations.
Thomas F. Eggers, 54. President and Principal Executive Officer of the Funds since 2006. Founders’ Chairman of the Board, President and Chief Executive Officer. President, Chief Executive Officer and a Director of Dreyfus. Chairman of the Board and Chief Executive Officer of the Distributor since 2005. Formerly, President of Scudder Investments (2002 to 2005). Previously employed by Dreyfus from 1996 to 2002, including as President from 2001 to 2002.
David L. Ray, 49.Vice President of the Funds since 2000, and from 1990 to 1998. Founders’ Senior Vice President, Chief Operating Officer and Treasurer. Vice President of the Distributor since 2003. Employed by Founders and its predecessor company since 1990. Formerly,Treasurer of the Funds (1990 to 1998).
Kenneth R. Christoffersen, 51. Secretary of the Funds since 2000, and from 1996 to 1998. Founders’ Senior Vice President-Legal, General Counsel and Secretary. Assistant Secretary of the Distributor since 2003. Employed by Founders and its predecessor company since 1996.
The Fund 51
YOUR BOARD REPRESENTATIVES (Unaudited) (continued)
Jennifer L. Carnes, 35. Treasurer, Principal Financial Officer and Principal Accounting Officer of the Funds since 2006. Manager of Fund Administration for Founders since 2006. Formerly, Founders’ Supervisor of Corporate Actions and Pricing (2002 to 2006), and Corporate Actions and Pricing Specialist (2000 to 2002).
Janelle E. Belcher, 48. Chief Compliance Officer of the Funds since 2004 and Assistant Secretary of the Funds since 2002. Founders’ Vice President - Compliance since 2002. Formerly, Founders’ Manager of Compliance (2000 to 2002) and Securities Compliance Examiner, Staff Accountant and Team Leader for the U.S. Securities and Exchange Commission (1990 to 2000).
Eric D. Naviloff, 38. Assistant Treasurer since 2006. Senior Accounting Manager -Taxable Fixed-Income Funds of Dreyfus, and an officer of 91 investment companies (comprised of 205 portfolios) managed by Dreyfus. Employed by Dreyfus since 1992.
Robert S. Robol, 42.Assistant Treasurer since 2006. Senior Accounting Manager -Money Market and Municipal Bond Funds of Dreyfus, and an officer of 91 investment companies (comprised of 205 portfolios) managed by Dreyfus. Employed by Dreyfus since 1988.
Robert Svagna, 39. Assistant Treasurer since 2006. Senior Accounting Manager -Equity Funds of Dreyfus, and an officer of 91 investment companies (comprised of 205 portfolios) managed by Dreyfus. Employed by Dreyfus since 1990.
William G. Germenis, 36.Anti-Money Laundering Compliance Officer (“AMLCO”) for the Class A, Class B, Class C, Class R, and Class T shares of the Funds since 2002 and for the Class F shares of the Funds since 2003.Vice President and AMLCO of MBSC, LLC since 2002.Vice President and AMLCO of the Distributor and AMLCO of investment companies managed by Dreyfus. Employed by the Distributor since 1998.
The directors and officers may be contacted at Founders’ address appearing on the back cover, except for Messrs. Eggers, Naviloff, Robol, Svagna and Germenis, who can be contacted at The Dreyfus Corporation, 200 Park Avenue, New York, New York 10166.Additional information about the Company’s directors is available in the Statement of Additional Information, which can be obtained free of charge by calling 1-800-525-2440 (Class F shareholders) or 1-800-554-4611 (all other shareholders).

For Class F shareholders
Telephone Call your financial representative or 1-800-525-2440
| Mail | | Dreyfus Founders Funds, Inc. |
| | | P.O. Box 55360, Boston, MA 02205-8252 |
| |
|
| |
| For Class A, B, C, R and T shareholders |
| Telephone Call your financial representative or 1-800-554-4611 |
| Mail | | Dreyfus Founders Funds, Inc. |
| | | 144 Glenn Curtiss Boulevard, Uniondale, NY 11556-0144 |
| | |
The fund files its complete schedule of portfolio holdings with the Securities and Exchange Commission (“SEC”) for the first and third quarters of each fiscal year on Form N-Q. The fund’s Forms N-Q are available on the SEC’s website at http://www.sec.gov and may be reviewed and copied at the SEC’s Public Reference Room in Washington, DC. Information on the operation of the Public Reference Room may be obtained by calling 1-800-SEC-0330.
A description of the policies and procedures that the fund uses to determine how to vote proxies relating to portfolio securities, and information regarding how the fund voted these proxies for the 12-month period ended June 30, 2006, is available at http://www.founders.com, http://www.dreyfus.com and on the SEC’s website at http://www.sec.gov. The description of the policies and procedures is also available without charge, upon request, by calling 1-800-645-6561.
This report and the statements it contains are submitted for the general information of our shareholders. The report is not authorized for distribution to prospective investors unless preceded or accompanied by an effective prospectus.
| Founders and Founders Funds are registered trademarks |
| of Founders Asset Management LLC. |
| |
| © 2007 Dreyfus Service Corporation |

Save time. Save paper. View your next shareholder report online as soon as it’s available. To take advantage of this service, simply inform us online of your decision to receive materials through our E-Communications Program. Cut down on mailbox clutter and help the Fund reduce printing and postage charges by enrolling today. It’s simple and only takes a few minutes.
Class F shareholders can log into www.founders.com/ ecommunications, or www.icsdelivery.com if you own funds through a third party.
Class A, B, C, R and T shareholders can log into www.dreyfus.com.
The views expressed in this report reflect those of the portfolio managers only through the end of the period covered and do not necessarily represent the views of Founders or any other person in the Founders organization.Any such views are subject to change at any time based upon market or other conditions and Founders disclaims any responsibility to update such views.These views may not be relied on as investment advice and, because investment decisions for a Dreyfus Founders Fund are based on numerous factors, may not be relied on as an indication of trading intent on behalf of any Dreyfus Founders Fund.
Not FDIC-Insured • Not Bank-Guaranteed • May Lose Value
| Contents |
| |
| | | THE FUND |
| |
|
| 2 | | A Letter from the President |
| 3 | | Discussion of Fund Performance |
| 6 | | Fund Performance |
| 8 | | Understanding Your Fund’s Expenses |
| 8 | | Comparing Your Fund’s Expenses |
| With Those of Other Funds |
| 9 | | Statement of Investments |
| 15 | | Statement of Assets and Liabilities |
| 16 | | Statement of Operations |
| 17 | | Statement of Changes in Net Assets |
| 19 | | Financial Highlights |
| 25 | | Notes to Financial Statements |
| 37 | | Report of Independent Registered |
| | | Public Accounting Firm |
| 38 | | Factors Considered in Renewing |
| the Advisory Agreement |
| 46 | | Your Board Representatives |
| |
| FOR MORE INFORMATION |
|
| | | Back Cover |
| Dreyfus Founders |
| Worldwide Growth Fund |
The Fund

A LETTER FROM THE PRESIDENT
We are pleased to present this annual report for Dreyfus Founders Worldwide Growth Fund, covering the 12-month period from January 1, 2006, through December 31, 2006.
2006 proved to be a good year for the financial markets, with most economic sectors and geographic regions of the global equity markets generating strong returns.A number of positive factors contributed to gains in international developed and developing markets, including an expanding global economy, rising commodity prices, financial reforms in key emerging markets, falling trade barriers, rising standards of living and robust corporate profits.
In our analysis, 2006 provided an excellent reminder of the need for a long-term investment perspective. Adopting too short a time frame proved costly for some investors last year, as chasing recent winners sometimes meant buying the next month’s losers. Indeed, history shows that reacting to near-term developments with extreme shifts in strategy rarely is the right decision.We believe that a better course of action is to set a portfolio mix to meet future goals, while attempting to ignore short term market fluctuations in favor of a longer-term view.
For information about how the fund performed during the reporting period, as well as market perspectives, we have provided a Discussion of Fund Performance given by the fund’s portfolio managers.
Thank you for your continued confidence and support.We wish you good health and prosperity in 2007.

DISCUSSION OF FUND PERFORMANCE
Remi Browne, CFA, John B. Jares, CFA, and Jeffrey R. Sullivan, CFA, Portfolio Managers
How did Dreyfus Founders Worldwide Growth Fund perform relative to its benchmarks?
For the 12-month period ended December 31, 2006, Dreyfus Founders Worldwide Growth Fund achieved total returns of 19.07% for Class A Shares, 17.89% for Class B Shares, 18.03% for Class C Shares, 18.93% for Class F Shares, 19.40% for Class R Shares and 18.63% for Class T Shares.1 In comparison, the fund’s benchmarks, the Morgan Stanley Capital International (MSCI) World Index (the “Primary Index”) produced a 20.07% total return,2 and the MSCI World Growth Index (the “Secondary Index”) produced a 15.15% total return for the same period.3
Global equity markets continued their upward climb in 2006, supported by strong economic data in most regions of the world and robust mergers-and-acquisitions (M&A) activity in Europe and the United States. We attribute the fund’s overall performance to our successful security selection, which resulted in higher returns relative to the Secondary Index. However, the fund’s returns slightly under-performed the Primary Index, due in part to fees and expenses to which both indices are not subject.
What is the fund’s investment approach?
The fund seeks long-term growth of capital by investing in the stocks of growth companies in markets throughout the world.The fund may purchase securities in any foreign country, as well as in the United States, emphasizing common stocks of both emerging and established growth companies that generally have strong performance records and market positions.We use a “growth style” of investing, searching for companies whose fundamental strengths suggest the potential to provide superior earnings growth over time. Our “bottom-up” approach emphasizes indi-
The Fund 3
DISCUSSION OF FUND PERFORMANCE (continued)
|
vidual stock selection. We go beyond Wall Street analysis and perform intensive qualitative and quantitative in-house research to determine whether companies meet our investment criteria.
What other factors influenced the fund’s performance?
Europe proved to be a primary driver of performance for the fund and its benchmarks in 2006, as continued economic growth and intensifying M&A activity fueled rising markets. U.S. markets also posted solid gains for the year, as corporate earnings growth remained robust despite periodic concerns regarding inflation and slowing economic growth. Conversely, the Japanese equity market struggled as the Bank of Japan increased interest rates and ended their ultra-loose monetary policy.
We attribute the fund’s relative performance mainly to the success of our stock selection strategy. From a country perspective, stocks in the United Kingdom, Germany and Hong Kong helped boost the fund’s relative returns. However, weak security selection in France, Australia and Sweden proved to be a drag on performance.
Among industry groups, holdings in the materials and telecommunications sectors ranked as some of the stronger contributors to the fund’s relative performance. Among materials stocks, U.K.-based metals and mining producer Xstrata benefited from rising commodity prices and a favorable acquisition that transformed the firm into a truly diversified metals company. Telecommunication-services holdings China Mobile and Telenor both rose strongly as emerging markets exposure benefited both companies throughout the year. Finally, although the fund’s positions in the information technology (IT) sector provided a modest boost to its relative performance overall, U.S. technology giants Cisco Systems,Apple Computer and Hewlett Packard were among the fund’s stronger-performing stocks in 2006.
Despite success from our “bottom-up” approach, weak stock selection in the health care sector and in selected industrial companies had a negative impact on the fund’s return. Disappointments in the U.S. health care sector included Boston Scientific, which struggled in
a slowing cardiac rhythm management market.Also,Advanced Medical Optics’ shares lost value as their new intraocular lens proved less than successful. In the industrials sector, France’s aerospace giant EADS underperformed on news that production of its Airbus A380 would be delayed and over budget.
What is the fund’s current strategy?
We have continued to employ our bottom-up investment strategy to seek out stocks with improving business momentum and attractive valuations. We have found a number of such opportunities in the information technology sector, which lagged the averages in 2006. Conversely, we may consider trimming the fund’s positions in some of 2006’s stronger-performing stocks, including those in the materials sector.
| | | Investing in foreign companies involves special risks, including changes in currency rates, political, |
| | | economic and social instability, a lack of comprehensive company information, differing auditing |
| | | and legal standards and less market liquidity. An investment in this fund should be considered |
| | | only as a supplement to an overall investment program. |
| 1 | | Total return includes reinvestment of dividends and any capital gains paid, and does not take into |
| | | consideration the maximum initial sales charges in the case of Class A and Class T shares, or the |
| | | applicable contingent deferred sales charges imposed on redemptions in the case of Class B and |
| | | Class C shares. Had these charges been reflected, returns would have been lower. Past performance |
| | | is no guarantee of future results. Share price and investment return fluctuate such that upon |
| | | redemption, fund shares may be worth more or less than their original cost |
| 2 | | SOURCE: LIPPER INC. – Reflects reinvestment of net dividends and, where applicable, |
| | | capital gain distributions.The Morgan Stanley Capital International (MSCI) World Index |
| | | measures global developed market equity performance.The total return figures cited for this index |
| | | assume change in security prices and reinvestment of dividends, but do not reflect the costs of |
| | | managing a mutual fund. |
| 3 | | SOURCE: LIPPER INC. – Reflects reinvestment of net dividends and, where applicable, |
| | | capital gain distributions.The Morgan Stanley Capital International (MSCI) World Growth |
| | | Index measures global developed market equity performance of growth securities.The total return |
| | | figures cited for this index assume change in security prices and reinvestment of dividends, but do |
| | | not reflect the costs of managing a mutual fund. |
The Fund 5
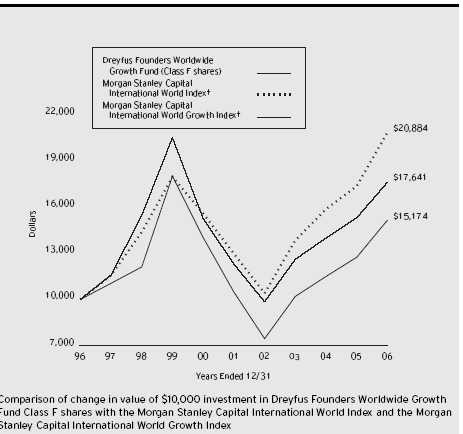
| † Source: Lipper Inc. |
| Past performance is not predictive of future performance. |
| The above graph compares a $10,000 investment made in Class F shares of Dreyfus Founders Worldwide Growth |
| Fund on 12/31/96 to a $10,000 investment made in each of the Morgan Stanley Capital International World Index |
| (the “MSCI World Index”) and the Morgan Stanley Capital International World Growth Index (the “MSCI World |
| Growth Index”) on that date. All dividends and capital gain distributions are reinvested. Performance for Class A, |
| Class B, Class C, Class R and Class T shares will vary from the performance of Class F shares shown above due to |
| differences in charges and expenses. |
| The fund’s performance shown in the line graph takes into account all applicable Class F fees and expenses (after any |
| expense reimbursements).The MSCI World Index is an unmanaged index of global stock market performance, including |
| the United States, Canada, Australia, New Zealand and the Far East.The MSCI World Growth Index measures global |
| developed market equity performance of growth securities.The indices do not take into account charges, fees and other |
| expenses. Further information relating to fund performance, including expense reimbursements, if applicable, is contained |
| in the Financial Highlights section of the prospectus and elsewhere in this report. |
| Average Annual Total Returns as of 12/31/06 | | | | | | |
| |
| | | Inception | | | | | | | | From |
| | | Date | | 1 Year | | 5 Years | | 10 Years | | Inception |
| |
| |
| |
| |
| |
|
| Class A shares | | | | | | | | | | |
| with maximum sales charge (5.75%) | | 12/31/99 | | 12.20% | | 6.38% | | — | | (3.31)% |
| without sales charge | | 12/31/99 | | 19.07% | | 7.64% | | — | | (2.49)% |
| Class B shares | | | | | | | | | | |
| with applicable redemption charge † | | 12/31/99 | | 13.89% | | 6.50% | | — | | (3.08)% |
| without redemption | | 12/31/99 | | 17.89% | | 6.80% | | — | | (3.08)% |
| Class C shares | | | | | | | | | | |
| with applicable redemption charge †† | | 12/31/99 | | 17.03% | | 6.74% | | — | | (3.48)% |
| without redemption | | 12/31/99 | | 18.03% | | 6.74% | | — | | (3.48)% |
| Class F shares | | 12/29/89 | | 18.93% | | 7.67% | | 4.26% | | N/A |
| Class R shares | | 12/31/99 | | 19.40% | | 8.23% | | — | | (1.98)% |
| Class T shares | | | | | | | | | | |
| with applicable sales charge (4.5%) | | 12/31/99 | | 13.27% | | 5.64% | | — | | (4.06)% |
| without sales charge | | 12/31/99 | | 18.63% | | 6.62% | | — | | (3.43)% |
Past performance is not predictive of future performance.The fund’s performance shown in the graph and table does not reflect the deduction of taxes that a shareholder would pay on fund distributions or the redemption of fund shares, but does reflect fee waivers. Performance for Class B shares assumes the conversion of Class B shares to Class A shares at the end of the sixth year following the date of purchase.
| † | | The maximum contingent deferred sales charge for Class B shares is 4%. After six years Class B shares convert to |
| | | Class A shares. |
| †† | | The maximum contingent deferred sales charge for Class C shares is 1% for shares redeemed within one year of the |
| | | date of purchase. |
The Fund 7
UNDERSTANDING YOUR FUND’S EXPENSES (Unaudited)
As a mutual fund investor, you pay ongoing expenses, such as management fees and other expenses. Using the information below, you can estimate how these expenses affect your investment and compare them with the expenses of other funds.You also may pay one-time transaction expenses, including sales charges (loads) and redemption fees, which are not shown in this section and would have resulted in higher total expenses. For more information, see your fund's prospectus or talk to your financial advisor.
Review your fund’s expenses
|
The table below shows the expenses you would have paid on a $1,000 investment in Dreyfus Founders Worldwide Growth Fund from July 1, 2006 to December 31, 2006. It also shows how much a $1,000 investment would be worth at the close of the period, assuming actual returns and expenses.To estimate the expenses you paid on your account over this period, simply divide your account value by $1,000 (for example, an $8,600 account value divided by $1,000 = 8.60), then multiply the results by the number in the Expenses paid per $1,000 line for the class of shares you own.
| Expenses and Value of a $1,000 Investment | | | | | | |
| assuming actual returns for the six months ended December 31, 2006 | | | | |
| | | Class A | | Class B | | Class C | | Class F | | Class R | | Class T |
| |
| |
| |
| |
| |
| |
|
| Expenses paid | | | | | | | | | | | | |
| per $1,000 † | | $ 9.91 | | $ 15.17 | | $ 14.28 | | $ 10.39 | | $ 8.20 | | $ 11.56 |
| Ending value | | | | | | | | | | | | |
| (after expenses) | | $1,125.80 | | $1,119.60 | | $1,121.40 | | $1,124.70 | | $1,127.20 | | $1,123.10 |
| COMPARING YOUR FUND’S EXPENSES |
| WITH THOSE OF OTHER FUNDS (Unaudited) |
Using the SEC’s method to compare expenses
The Securities and Exchange Commission (SEC) has established guidelines to help investors assess fund expenses. Per these guidelines, the table below shows your fund's expenses based on a $1,000 investment, assuming a hypothetical 5% annualized return. You can use this information to compare the ongoing expenses (but not transaction expenses or total cost) of investing in the fund with those of other funds.All mutual fund shareholder reports will provide this information to help you make this comparison. Please note that you cannot use this information to estimate your actual ending account balance and expenses paid during the period.
| Expenses and Value of a $1,000 Investment |
| assuming a hypothetical 5% annualized return for the six months ended December 31, 2006 |
| | | Class A | | Class B | | Class C | | Class F | | Class R | | Class T |
| |
| |
| |
| |
| |
| |
|
| Expenses paid | | | | | | | | | | | | |
| per $1,000 † | | $ 9.40 | | $ 14.39 | | $ 13.54 | | $ 9.86 | | $ 7.78 | | $ 10.97 |
| Ending value | | | | | | | | | | | | |
| (after expenses) | | $1,015.88 | | $1,010.89 | | $1,011.75 | | $1,015.43 | | $1,017.49 | | $1,014.32 |
| † Expenses are equal to the fund’s annualized expense ratio of 1.85% for Class A shares, 2.84% for Class B shares, |
| 2.67% for Class C shares, 1.94% for Class F shares, 1.53% for Class R shares and 2.16% for Class T shares; |
| multiplied by the average account value over the period, multiplied by 184/365 (to reflect the one-half year period). |
STATEMENT OF INVESTMENTS
December 31, 2006
|
| Common Stocks—97.8% | | Shares | | Value ($) |
| |
| |
|
| Australia—1.6% | | | | |
| BHP Billiton | | 26,089 | | 521,011 |
| Orica | | 12,600 | | 241,682 |
| QBE Insurance Group | | 9,300 | | 211,786 |
| | | | | 974,479 |
| Belgium—1.6% | | | | |
| Delhaize Group | | 4,300 | | 358,452 |
| InBev | | 8,526 | | 562,060 |
| | | | | 920,512 |
| Canada—2.4% | | | | |
| Bank of Nova Scotia | | 3,400 | | 151,902 |
| Canadian National Railway | | 6,800 | | 291,966 |
| Cognos | | 4,600 a | | 195,455 |
| IPSCO | | 2,000 | | 187,935 |
| Teck Cominco, Cl. B | | 3,200 | | 241,204 |
| TransCanada | | 4,500 | | 156,708 |
| Yellow Pages Income Fund (Units) | | 16,700 | | 184,306 |
| | | | | 1,409,476 |
| Cayman Islands—1.0% | | | | |
| Seagate Technology | | 22,131 | | 586,472 |
| China—.6% | | | | |
| Foxconn International Holdings | | 113,000 a | | 371,906 |
| Denmark—.9% | | | | |
| Carlsberg, Cl. B | | 2,860 | | 284,035 |
| Novo Nordisk, Cl. B | | 3,300 | | 274,864 |
| | | | | 558,899 |
| Finland—.2% | | | | |
| Neste Oil | | 4,600 | | 139,843 |
| France—5.0% | | | | |
| BNP Paribas | | 4,084 | | 445,571 |
| Capgemini | | 2,600 | | 163,197 |
| Groupe Danone | | 2,000 | | 303,082 |
| PPR | | 1,100 | | 164,372 |
| Sanofi-Aventis | | 1,739 | | 160,574 |
| Schneider Electric | | 2,754 | | 305,737 |
| Societe Generale | | 2,866 | | 486,526 |
The Fund 9
STATEMENT OF INVESTMENTS (continued)
|
| Common Stocks (continued) | | Shares | | Value ($) |
| |
| |
|
| France (continued) | | | | |
| Total | | 6,048 | | 436,305 |
| Vivendi | | 13,145 | | 513,792 |
| | | | | 2,979,156 |
| Germany—2.6% | | | | |
| BASF | | 4,691 | | 457,304 |
| Bayerische Motoren Werke | | 2,600 | | 149,640 |
| E.ON | | 1,450 | | 197,704 |
| MAN | | 2,800 | | 253,037 |
| Merck | | 2,990 | | 310,742 |
| ThyssenKrupp | | 4,049 | | 190,758 |
| | | | | 1,559,185 |
| Greece—.2% | | | | |
| Alpha Bank | | 4,900 | | 148,122 |
| Hong Kong—.9% | | | | |
| China Mobile | | 42,700 | | 369,727 |
| Esprit Holdings | | 16,000 | | 179,062 |
| | | | | 548,789 |
| Ireland—.8% | | | | |
| Allied Irish Banks | | 5,800 | | 172,266 |
| C & C Group | | 16,600 | | 294,726 |
| | | | | 466,992 |
| Italy—1.6% | | | | |
| ENI | | 14,383 | | 483,769 |
| Intesa Sanpaolo | | 60,097 | | 464,085 |
| | | | | 947,854 |
| Japan—12.0% | | | | |
| Ajinomoto | | 12,000 | | 158,615 |
| Canon | | 12,050 | | 678,417 |
| Fujitsu | | 34,000 | | 266,846 |
| Honda Motor | | 16,600 | | 655,603 |
| Matsushita Electric Industrial | | 9,000 | | 179,614 |
| Mitsubishi | | 22,800 | | 429,158 |
| Mitsubishi Electric | | 44,600 | | 407,005 |
| Mitsui & Co. | | 25,000 | | 373,934 |
| Mitsui Chemicals | | 25,000 | | 192,429 |
| Mizuho Financial Group | | 17 | | 121,423 |
| Nikon | | 11,000 | | 241,250 |
| |
| 10 | | | | |
| Common Stocks (continued) | | Shares | | Value ($) |
| |
| |
|
| Japan (continued) | | | | |
| ORIX | | 2,260 | | 654,233 |
| Pacific Management | | 55 | | 120,625 |
| Shin-Etsu Chemical | | 5,900 | | 395,135 |
| SUMCO | | 3,700 | | 312,777 |
| Sumitomo Trust & Banking | | 31,000 | | 325,096 |
| Takeda Pharmaceutical | | 3,600 | | 247,149 |
| TDK | | 1,700 | | 135,137 |
| Tokyo Electron | | 5,500 | | 433,511 |
| Toshiba | | 23,000 | | 149,784 |
| Toyota Motor | | 9,400 | | 628,747 |
| | | | | 7,106,488 |
| Netherlands—2.1% | | | | |
| ASML Holding | | 6,700 a | | 166,627 |
| Heineken | | 3,900 | | 185,489 |
| ING Groep | | 16,152 | | 716,185 |
| SBM Offshore | | 5,200 | | 178,813 |
| | | | | 1,247,114 |
| Norway—1.4% | | | | |
| Orkla | | 4,900 | | 277,409 |
| Telenor | | 28,300 | | 532,168 |
| | | | | 809,577 |
| Spain—2.1% | | | | |
| ACS-Actividades de Construccion y Servicios | | 6,600 | | 372,102 |
| Banco Santander Central Hispano | | 16,593 | | 309,716 |
| Repsol YPF | | 5,011 | | 173,306 |
| Telefonica | | 17,700 | | 376,640 |
| | | | | 1,231,764 |
| Sweden—.6% | | | | |
| Telefonaktiebolaget LM Ericsson, Cl. B | | 40,200 | | 162,363 |
| Volvo, Cl. B | | 2,700 | | 185,957 |
| | | | | 348,320 |
| Switzerland—3.8% | | | | |
| ABB | | 10,200 | | 182,905 |
| Baloise-Holding | | 2,923 | | 292,180 |
| Credit Suisse Group | | 6,367 | | 445,455 |
| Holcim | | 3,000 | | 275,010 |
| Roche Holding | | 5,045 | | 904,664 |
The Fund 11
STATEMENT OF INVESTMENTS (continued)
|
| Common Stocks (continued) | | Shares | | Value ($) |
| |
| |
|
| Switzerland (continued) | | | | |
| Swiss Reinsurance | | 1,800 | | 153,041 |
| | | | | 2,253,255 |
| United Kingdom—11.3% | | | | |
| AstraZeneca | | 4,959 | | 266,432 |
| Aviva | | 11,979 | | 192,797 |
| Barclays | | 14,953 | | 213,727 |
| Barratt Developments | | 7,200 | | 174,104 |
| BP | | 35,227 | | 391,426 |
| British Airways | | 49,400 a | | 510,221 |
| BT Group | | 61,971 | | 365,834 |
| GlaxoSmithKline | | 29,400 | | 773,669 |
| HBOS | | 13,903 | | 308,151 |
| International Power | | 69,711 | | 521,062 |
| J Sainsbury | | 55,000 | | 440,717 |
| Marks & Spencer Group | | 25,400 | | 356,584 |
| Michael Page International | | 29,600 | | 262,107 |
| National Grid | | 14,900 | | 215,012 |
| Next | | 5,700 | | 200,889 |
| Royal Bank of Scotland Group | | 8,800 | | 343,399 |
| Royal Dutch Shell, Cl. A | | 5,847 | | 204,353 |
| Royal Dutch Shell, Cl. B | | 1,600 | | 56,077 |
| Tate & Lyle | | 9,500 | | 142,947 |
| Xstrata | | 15,546 | | 776,189 |
| | | | | 6,715,697 |
| United States—45.1% | | | | |
| Adobe Systems | | 22,300 a | | 916,976 |
| Altria Group | | 10,805 | | 927,285 |
| Apple Computer | | 13,967 a | | 1,184,960 |
| Autodesk | | 13,679 a | | 553,452 |
| Avon Products | | 29,804 | | 984,724 |
| Best Buy | | 12,619 | | 620,729 |
| Bristol-Myers Squibb | | 11,505 | | 302,812 |
| Broadcom, Cl. A | | 9,149 a | | 295,604 |
| Chevron | | 6,600 | | 485,298 |
| Chicago Mercantile Exchange Holdings | | 731 | | 372,627 |
| Cisco Systems | | 55,050 a | | 1,504,516 |
| |
| |
| 12 | | | | |
| Common Stocks (continued) | | Shares | | Value ($) |
| |
| |
|
| United States (continued) | | | | |
| Citigroup | | 7,303 | | 406,777 |
| Colgate-Palmolive | | 10,697 | | 697,872 |
| Continental Airlines, Cl. B | | 10,775 a | | 444,469 |
| Covance | | 5,048 a | | 297,378 |
| Diebold | | 17,520 | | 816,432 |
| Electronic Arts | | 19,394 a | | 976,682 |
| Eli Lilly & Co. | | 5,533 | | 288,269 |
| Exxon Mobil | | 8,259 | | 632,887 |
| Federated Department Stores | | 12,450 | | 474,719 |
| Gap | | 14,957 | | 291,662 |
| General Electric | | 13,258 | | 493,330 |
| Google, Cl. A | | 1,759 a | | 809,984 |
| Hewlett-Packard | | 27,548 | | 1,134,702 |
| JPMorgan Chase & Co. | | 13,369 | | 645,723 |
| KLA-Tencor | | 6,360 | | 316,410 |
| Limited Brands | | 11,768 | | 340,566 |
| Linear Technology | | 13,286 | | 402,832 |
| Marriott International, Cl. A | | 5,254 | | 250,721 |
| Masco | | 14,980 | | 447,453 |
| MedImmune | | 19,948 a | | 645,717 |
| Microsoft | | 24,804 | | 740,647 |
| Nasdaq Stock Market | | 8,108 a | | 249,645 |
| Oracle | | 37,383 a | | 640,745 |
| Peabody Energy | | 5,889 | | 237,974 |
| Procter & Gamble | | 9,490 | | 609,922 |
| SanDisk | | 6,619 a | | 284,816 |
| Schlumberger | | 4,550 | | 287,378 |
| Sun Microsystems | | 56,014 a | | 303,596 |
| Texas Instruments | | 17,629 | | 507,715 |
| Thermo Fisher Scientific | | 13,314 a | | 602,991 |
| Tiffany & Co. | | 16,031 | | 629,056 |
| Wal-Mart Stores | | 19,233 | | 888,180 |
| Walt Disney | | 18,376 | | 629,746 |
| Western Union | | 6,778 | | 151,963 |
| Williams-Sonoma | | 5,742 | | 180,528 |
| Wyeth | | 6,662 | | 339,229 |
The Fund 13
STATEMENT OF INVESTMENTS (continued)
|
| Common Stocks (continued) | | Shares | | Value ($) |
| |
| |
|
| United States (continued) | | | | |
| Yahoo! | | 6,699 a | | 171,092 |
| Zimmer Holdings | | 4,311 a | | 337,896 |
| | | | | 26,756,687 |
| Total Common Stocks | | | | |
| (cost $46,194,736) | | | | 58,080,587 |
| |
| |
|
| |
| Preferred Stocks—1.1% | | | | |
| |
| |
|
| Germany; | | | | |
| Fresenius | | | | |
| (cost $618,423) | | 2,891 | | 618,423 |
| |
| |
|
| Total Investments (cost $46,813,159) | | 98.9% | | 58,699,010 |
| Cash and Receivables (Net) | | 1.1% | | 671,372 |
| Net Assets | | 100.0% | | 59,370,382 |
a Non-income producing security.
|
| Portfolio Summary (Unaudited) † | | | | |
| |
| | | Value (%) | | | | Value (%) |
| |
| |
| |
|
| United States | | 45.1 | | Norway | | 1.4 |
| Japan | | 12.0 | | Cayman Islands | | 1.0 |
| United Kingdom | | 11.3 | | Denmark | | .9 |
| France | | 5.0 | | Hong Kong | | .9 |
| Switzerland | | 3.8 | | Ireland | | .8 |
| Germany | | 3.7 | | China | | .6 |
| Canada | | 2.4 | | Sweden | | .6 |
| Netherlands | | 2.1 | | Finland | | .2 |
| Spain | | 2.1 | | Greece | | .2 |
| Australia | | 1.6 | | Cash & Equivalents | | 1.1 |
| Belgium | | 1.6 | | | | |
| Italy | | 1.6 | | | | 100.0 |
| |
| † Based on net assets. | | | | | | |
| See notes to financial statements. | | | | |
STATEMENT OF ASSETS AND LIABILITIES
December 31, 2006
| | | Cost | | Value |
| |
| |
|
| Assets ($): | | | | |
| Investments in securities—See Statement of Investments | | 46,813,159 | | 58,699,010 |
| Cash | | | | 64,707 |
| Cash denominated in foreign currencies | | 131,404 | | 131,365 |
| Receivable for investment securities sold | | | | 1,109,991 |
| Dividends and interest receivable | | | | 97,775 |
| Receivable for shares of Common Stock subscribed | | | | 4,841 |
| Net unrealized appreciation on forward | | | | |
| currency exchange contracts—Note 4 | | | | 319 |
| Other assets | | | | 124,516 |
| | | | | 60,232,524 |
| |
| |
|
| Liabilities ($): | | | | |
| Due to Founders Asset Management LLC and affiliates—Note 3(c) | | 113,769 |
| Payable for investment securities purchased | | | | 485,583 |
| Directors’ deferred compensation | | | | 124,516 |
| Payable for shares of Common Stock redeemed | | | | 95,171 |
| Interest payable—Note 2 | | | | 70 |
| Accrued expenses | | | | 43,033 |
| | | | | 862,142 |
| |
| |
|
| Net Assets ($) | | | | 59,370,382 |
| |
| |
|
| Composition of Net Assets ($): | | | | |
| Paid-in capital | | | | 98,460,051 |
| Accumulated investment (loss)—net | | | | (87,166) |
| Accumulated net realized gain (loss) on investments | | | | (50,916,322) |
| Accumulated net unrealized appreciation (depreciation) | | | | |
| on investments and foreign currency transactions | | | | 11,913,819 |
| |
| |
|
| Net Assets ($) | | | | 59,370,382 |
| Net Asset Value Per Share | | | | | | | | | | |
| | | Class A | | Class B | | Class C | | Class F | | Class R | | Class T |
| |
| |
| |
| |
| |
| |
|
| Net Assets ($) | | 1,647,317 | | 818,897 | | 384,865 | | 54,157,525 | | 2,336,541 | | 25,237 |
| Shares Outstanding | | 97,393 | | 51,168 | | 24,499 | | 3,193,386 | | 133,246 | | 1,598 |
| |
| |
| |
| |
| |
| |
|
| Net Asset Value | | | | | | | | | | | | |
| Per Share ($) | | 16.91 | | 16.00 | | 15.71 | | 16.96 | | 17.54 | | 15.79 |
| |
| See notes to financial statements. | | | | | | | | | | |
The Fund 15
STATEMENT OF OPERATIONS
Year Ended December 31, 2006
|
| Investment Income ($): | | |
| Income: | | |
| Dividends (net of $79,527 foreign taxes withheld at source): | | |
| Unaffiliated issuers | | 914,126 |
| Affiliated issuers | | 6,842 |
| Interest | | 10,695 |
| Total Income | | 931,663 |
| Expenses: | | |
| Investment advisory fee—Note 3(a) | | 579,025 |
| Shareholder servicing costs—Note 3(c) | | 172,094 |
| Distribution fees—Note 3(b) | | 144,819 |
| Custodian fees—Note 3(c) | | 50,496 |
| Registration fees | | 50,285 |
| Accounting fees—Note 3(c) | | 47,437 |
| Prospectus and shareholders’ reports | | 44,845 |
| Professional fees | | 24,515 |
| Directors’ fees and expenses—Note 3(d) | | 19,517 |
| Loan commitment fees—Note 2 | | 2,068 |
| Interest expense—Note 2 | | 1,255 |
| Miscellaneous | | 41,704 |
| Total Expenses | | 1,178,060 |
| Less—reduction in custody fees | | |
| due to to waiver—Note 3(c) | | (19,899) |
| Less—reduction in custody fees due to | | |
| earnings credits—Note 1(c) | | (4,836) |
| Less—expense offset to | | |
| broker commissions—Note 1 | | (30) |
| Net Expenses | | 1,153,295 |
| Investment (Loss)—Net | | (221,632) |
| |
|
| Realized and Unrealized Gain (Loss) on Investments—Note 4 ($): |
| Net realized gain (loss) on investments | | 9,099,263 |
| Net realized gain (loss) on foreign currency transactions | | 9,713 |
| Net Realized Gain (Loss) | | 9,108,976 |
| Net change in unrealized appreciation (depreciation) | | |
| on investments and foreign currency transactions | | 1,144,647 |
| Net Realized and Unrealized Gain (Loss) on Investments | | 10,253,623 |
| Net Increase in Net Assets Resulting from Operations | | 10,031,991 |
See notes to financial statements.
|
STATEMENT OF CHANGES IN NET ASSETS
| | | Year Ended December 31, |
| |
|
| | | 2006 | | 2005 |
| |
| |
|
| Operations ($): | | | | |
| Investment (loss)—net | | (221,632) | | (38,851) |
| Net realized gain (loss) on investments | | 9,108,976 | | 14,142,515 |
| Net change in unrealized appreciation | | | | |
| (depreciation) on investments | | 1,144,647 | | (6,260,128) |
| Net Increase (Decrease) in Net Assets | | | | |
| Resulting from Operations | | 10,031,991 | | 7,843,536 |
| |
| |
|
| Capital Stock Transactions ($): | | | | |
| Net proceeds from shares sold: | | | | |
| Class A shares | | 984,635 | | 293,185 |
| Class B shares | | 29,902 | | 98,777 |
| Class C shares | | 127,049 | | 128,403 |
| Class F shares | | 2,375,671 | | 2,732,978 |
| Class R shares | | 876,169 | | 3,470,964a |
| Class T shares | | 3,754 | | 100 |
| Cost of shares redeemed: | | | | |
| Class A shares | | (170,595) | | (261,541) |
| Class B shares | | (1,222,465) | | (528,874) |
| Class C shares | | (101,092) | | (119,566) |
| Class F shares | | (10,595,986) | | (16,100,693) |
| Class R shares | | (601,168) | | (28,492,600)a |
| Class T shares | | (13,950) | | (26,382) |
| Increase (Decrease) in Net Assets | | | | |
| from Capital Stock Transactions | | (8,308,076) | | (38,805,249) |
| Total Increase (Decrease) in Net Assets | | 1,723,915 | | (30,961,713) |
| |
| |
|
| Net Assets ($): | | | | |
| Beginning of Period | | 57,646,467 | | 88,608,180 |
| End of Period | | 59,370,382 | | 57,646,467 |
| Accumulated investment (loss)—net | | (87,166) | | (28,758) |
| a On November 30, 2005, the fund disbursed portfolio securities and cash valued at $23,196,136 in payment of a |
| Class R redemption by an affiliate of the fund. |
The Fund 17
STATEMENT OF CHANGES IN NET ASSETS (continued)
|
| | | Year Ended December 31, |
| |
|
| | | 2006 | | 2005 |
| |
| |
|
| Capital Share Transactions: | | | | |
| Class A a | | | | |
| Shares sold | | 64,493 | | 22,521 |
| Shares redeemed | | (10,658) | | (19,415) |
| Net Increase (Decrease) in Shares Outstanding | | 53,835 | | 3,106 |
| |
| |
|
| Class B a | | | | |
| Shares sold | | 2,062 | | 8,028 |
| Shares redeemed | | (83,719) | | (42,268) |
| Net Increase (Decrease) in Shares Outstanding | | (81,657) | | (34,240) |
| |
| |
|
| Class C | | | | |
| Shares sold | | 8,673 | | 10,078 |
| Shares redeemed | | (7,336) | | (9,465) |
| Net Increase (Decrease) in Shares Outstanding | | 1,337 | | 613 |
| |
| |
|
| Class F | | | | |
| Shares sold | | 153,883 | | 210,093 |
| Shares redeemed | | (689,269) | | (1,227,387) |
| Net Increase (Decrease) in Shares Outstanding | | (535,386) | | (1,017,294) |
| |
| |
|
| Class R | | | | |
| Shares sold | | 56,296 | | 256,421 |
| Shares redeemed | | (38,898) | | (2,018,994) |
| Net Increase (Decrease) in Shares Outstanding | | 17,398 | | (1,762,573) |
| |
| |
|
| Class T | | | | |
| Shares sold | | 268 | | 8 |
| Shares redeemed | | (936) | | (2,190) |
| Net Increase (Decrease) in Shares Outstanding | | (668) | | (2,182) |
| a | | During the period ended December 31, 2006, 44,212 Class B shares representing $652,334 were automatically |
| | | converted to 42,063 Class A shares and during the period ended December 31, 2005, 6,350 Class B shares |
| | | representing $77,583 were automatically converted to 6,098 Class A shares. |
| See notes to financial statements. |
The following tables describe the performance for each share class for the fiscal periods indicated.All information (except portfolio turnover rate) reflects financial results for a single fund share.Total return shows how much your investment in the fund would have increased (or decreased) during each period, assuming you had reinvested all dividends and distributions.These figures have been derived from the fund’s financial statements.
| | | | | | | Year Ended December 31, | | |
| | | |
| |
| |
|
| Class A Shares | | 2006 | | 2005 | | 2004 | | 2003 | | 2002 |
| |
| |
| |
| |
| |
|
| Per Share Data ($): | | | | | | | | | | |
| Net asset value, beginning of period | | 14.21 | | 12.82 | | 11.38 | | 8.32 | | 11.71 |
| Investment Operations: | | | | | | | | | | |
| Investment (loss)—net | | (.06)a | | (.02)a | | (.21) | | (.10) | | (.15) |
| Net realized and unrealized | | | | | | | | | | |
| gain (loss) on investments | | 2.76 | | 1.41 | | 1.65 | | 3.16 | | (3.24) |
| Total from Investment Operations | | 2.70 | | 1.39 | | 1.44 | | 3.06 | | (3.39) |
| Net asset value, end of period | | 16.91 | | 14.21 | | 12.82 | | 11.38 | | 8.32 |
| |
| |
| |
| |
| |
|
| Total Return (%) b | | 19.07 | | 10.84 | | 12.65 | | 36.78 | | (28.95) |
| |
| |
| |
| |
| |
|
| Ratios/Supplemental Data (%): | | | | | | | | | | |
| Ratio of total expenses | | | | | | | | | | |
| to average net assets | | 1.97 | | 1.98 | | 1.83 | | 2.04 | | 2.06 |
| Ratio of net expenses | | | | | | | | | | |
| to average net assets | | 1.93 | | 1.92 | | 1.81 | | 2.03 | | 2.06 |
| Ratio of net investment (loss) | | | | | | | | | | |
| to average net assets | | (.39) | | (.19) | | (.18) | | (.55) | | (.77) |
| Portfolio Turnover Rate c | | 114 | | 120 | | 130 | | 138 | | 211 |
| |
| |
| |
| |
| |
|
| Net Assets, end of period ($ x 1,000) | | 1,647 | | 619 | | 519 | | 656 | | 543 |
| |
| a | | Based on average shares outstanding at each month end. | | | | | | | | |
| b | | Exclusive of sales charge. | | | | | | | | | | |
| c | | Portfolio Turnover Rate is a measure of portfolio activity that is calculated by dividing the lesser of purchases or sales |
| | | of securities, excluding securities having maturity dates at acquisition of one year or less, by the average value of the |
| | | portfolio securities held during the period, which is a rolling 12-month period. | | | | | | |
| See notes to financial statements. | | | | | | | | | | |
The Fund 19
FINANCIAL HIGHLIGHTS (continued)
|
| | | | | | | Year Ended December 31, | | |
| | | |
| |
| |
|
| Class B Shares | | 2006 | | 2005 | | 2004 | | 2003 | | 2002 |
| |
| |
| |
| |
| |
|
| Per Share Data ($): | | | | | | | | | | |
| Net asset value, beginning of period | | 13.58 | | 12.33 | | 11.02 | | 8.12 | | 11.52 |
| Investment Operations: | | | | | | | | | | |
| Investment (loss)—net | | (.16)a | | (.11)a | | (.09) | | (.16) | | (.14) |
| Net realized and unrealized | | | | | | | | | | |
| gain (loss) on investments | | 2.58 | | 1.36 | | 1.40 | | 3.06 | | (3.26) |
| Total from Investment Operations | | 2.42 | | 1.25 | | 1.31 | | 2.90 | | (3.40) |
| Net asset value, end of period | | 16.00 | | 13.58 | | 12.33 | | 11.02 | | 8.12 |
| |
| |
| |
| |
| |
|
| Total Return (%) b | | 17.89 | | 10.14 | | 11.89 | | 35.71 | | (29.51) |
| |
| |
| |
| |
| |
|
| Ratios/Supplemental Data (%): | | | | | | | | | | |
| Ratio of total expenses | | | | | | | | | | |
| to average net assets | | 2.84 | | 2.72 | | 2.54 | | 2.82 | | 2.71 |
| Ratio of net expenses | | | | | | | | | | |
| to average net assets | | 2.79 | | 2.66 | | 2.52 | | 2.80 | | 2.70 |
| Ratio of net investment (loss) | | | | | | | | | | |
| to average net assets | | (1.13) | | (.93) | | (.87) | | (1.30) | | (1.41) |
| Portfolio Turnover Rate c | | 114 | | 120 | | 130 | | 138 | | 211 |
| |
| |
| |
| |
| |
|
| Net Assets, end of period ($ x 1,000) | | 819 | | 1,803 | | 2,061 | | 1,821 | | 1,459 |
| |
| a | | Based on average shares outstanding at each month end. | | | | | | | | |
| b | | Exclusive of sales charge. | | | | | | | | | | |
| c | | Portfolio Turnover Rate is a measure of portfolio activity that is calculated by dividing the lesser of purchases or sales |
| | | of securities, excluding securities having maturity dates at acquisition of one year or less, by the average value of the |
| | | portfolio securities held during the period, which is a rolling 12-month period. | | | | | | |
| See notes to financial statements. | | | | | | | | | | |
| | | | | | | Year Ended December 31, | | |
| | | |
| |
| |
|
| Class C Shares | | 2006 | | 2005 | | 2004 | | 2003 | | 2002 |
| |
| |
| |
| |
| |
|
| Per Share Data ($): | | | | | | | | | | |
| Net asset value, beginning of period | | 13.31 | | 12.08 | | 10.81 | | 7.96 | | 11.34 |
| Investment Operations: | | | | | | | | | | |
| Investment (loss)—net | | (.15)a | | (.07)a | | (.20) | | (.20) | | (.30) |
| Net realized and unrealized | | | | | | | | | | |
| gain (loss) on investments | | 2.55 | | 1.30 | | 1.47 | | 3.05 | | (3.08) |
| Total from Investment Operations | | 2.40 | | 1.23 | | 1.27 | | 2.85 | | (3.38) |
| Net asset value, end of period | | 15.71 | | 13.31 | | 12.08 | | 10.81 | | 7.96 |
| |
| |
| |
| |
| |
|
| Total Return (%) b | | 18.03 | | 10.18 | | 11.75 | | 35.80 | | (29.81) |
| |
| |
| |
| |
| |
|
| Ratios/Supplemental Data (%): | | | | | | | | | | |
| Ratio of total expenses | | | | | | | | | | |
| to average net assets | | 2.76 | | 2.72 | | 2.62 | | 2.84 | | 3.40 |
| Ratio of net expenses | | | | | | | | | | |
| to average net assets | | 2.71 | | 2.66 | | 2.59 | | 2.82 | | 3.33 |
| Ratio of net investment (loss) | | | | | | | | | | |
| to average net assets | | (1.10) | | (.93) | | (.97) | | (1.34) | | (2.05) |
| Portfolio Turnover Rate c | | 114 | | 120 | | 130 | | 138 | | 211 |
| |
| |
| |
| |
| |
|
| Net Assets, end of period ($ x 1,000) | | 385 | | 308 | | 272 | | 271 | | 218 |
| |
| a | | Based on average shares outstanding at each month end. | | | | | | | | |
| b | | Exclusive of sales charge. | | | | | | | | | | |
| c | | Portfolio Turnover Rate is a measure of portfolio activity that is calculated by dividing the lesser of purchases or sales |
| | | of securities, excluding securities having maturity dates at acquisition of one year or less, by the average value of the |
| | | portfolio securities held during the period, which is a rolling 12-month period. | | | | | | |
| See notes to financial statements. | | | | | | | | | | |
The Fund 21
FINANCIAL HIGHLIGHTS (continued)
|
| | | | | | | Year Ended December 31, | | |
| | | |
| |
| |
|
| Class F Shares | | 2006 | | 2005 | | 2004 | | 2003 | | 2002 |
| |
| |
| |
| |
| |
|
| Per Share Data ($): | | | | | | | | | | |
| Net asset value, beginning of period | | 14.26 | | 12.86 | | 11.41 | | 8.33 | | 11.72 |
| Investment Operations: | | | | | | | | | | |
| Investment (loss)—net | | (.05)a | | (.02)a | | (.21) | | (.13) | | (.13) |
| Net realized and unrealized | | | | | | | | | | |
| gain (loss) on investments | | 2.75 | | 1.42 | | 1.66 | | 3.21 | | (3.26) |
| Total from Investment Operations | | 2.70 | | 1.40 | | 1.45 | | 3.08 | | (3.39) |
| Net asset value, end of period | | 16.96 | | 14.26 | | 12.86 | | 11.41 | | 8.33 |
| |
| |
| |
| |
| |
|
| Total Return (%) | | 18.93 | | 10.89 | | 12.71 | | 36.97 | | (28.92) |
| |
| |
| |
| |
| |
|
| Ratios/Supplemental Data (%): | | | | | | | | | | |
| Ratio of total expenses | | | | | | | | | | |
| to average net assets | | 2.03 | | 1.96 | | 1.80 | | 1.98 | | 1.84 |
| Ratio of net expenses | | | | | | | | | | |
| to average net assets | | 1.98 | | 1.91 | | 1.77 | | 1.97 | | 1.84 |
| Ratio of net investment (loss) | | | | | | | | | | |
| to average net assets | | (.38) | | (.17) | | (.13) | | (.47) | | (.55) |
| Portfolio Turnover Rate b | | 114 | | 120 | | 130 | | 138 | | 211 |
| |
| |
| |
| |
| |
|
| Net Assets, end of period ($ x 1,000) | | 54,158 | | 53,184 | | 61,038 | | 70,566 | | 59,890 |
| |
| a | | Based on average shares outstanding at each month end. | | | | | | | | |
| b | | Portfolio Turnover Rate is a measure of portfolio activity that is calculated by dividing the lesser of purchases or sales |
| | | of securities, excluding securities having maturity dates at acquisition of one year or less, by the average value of the |
| | | portfolio securities held during the period, which is a rolling 12-month period. | | | | |
| See notes to financial statements. | | | | | | | | | | |
| | | | | | | Year Ended December 31, | | |
| | | |
| |
| |
|
| Class R Shares | | 2006 | | 2005 | | 2004 | | 2003 | | 2002 |
| |
| |
| |
| |
| |
|
| Per Share Data ($): | | | | | | | | | | |
| Net asset value, beginning of period | | 14.69 | | 13.13 | | 11.60 | | 8.44 | | 11.81 |
| Investment Operations: | | | | | | | | | | |
| Investment income (loss)—net | | .01a | | .05a | | .03 | | .00b | | (.01) |
| Net realized and unrealized | | | | | | | | | | |
| gain (loss) on investments | | 2.84 | | 1.51 | | 1.50 | | 3.16 | | (3.36) |
| Total from Investment Operations | | 2.85 | | 1.56 | | 1.53 | | 3.16 | | (3.37) |
| Net asset value, end of period | | 17.54 | | 14.69 | | 13.13 | | 11.60 | | 8.44 |
| |
| |
| |
| |
| |
|
| Total Return (%) | | 19.40 | | 11.88 | | 13.19 | | 37.44 | | (28.54) |
| |
| |
| |
| |
| |
|
| Ratios/Supplemental Data (%): | | | | | | | | | | |
| Ratio of total expenses | | | | | | | | | | |
| to average net assets | | 1.62 | | 1.47 | | 1.39 | | 1.53 | | 1.41 |
| Ratio of net expenses | | | | | | | | | | |
| to average net assets | | 1.58 | | 1.44 | | 1.37 | | 1.51 | | 1.41 |
| Ratio of net investment income | | | | | | | | | | |
| (loss) to average net assets | | .02 | | .35 | | .28 | | (.03) | | (.13) |
| Portfolio Turnover Rate c | | 114 | | 120 | | 130 | | 138 | | 211 |
| |
| |
| |
| |
| |
|
| Net Assets, end of period ($ x 1,000) | | 2,337 | | 1,701 | | 24,665 | | 21,404 | | 14,060 |
| |
| a | | Based on average shares outstanding at each month end. | | | | | | | | |
| b | | Amount represents less than $.01 per share. | | | | | | | | |
| c | | Portfolio Turnover Rate is a measure of portfolio activity that is calculated by dividing the lesser of purchases or sales |
| | | of securities, excluding securities having maturity dates at acquisition of one year or less, by the average value of the |
| | | portfolio securities held during the period, which is a rolling 12-month period. | | | | |
| See notes to financial statements. | | | | | | | | | | |
The Fund 23
FINANCIAL HIGHLIGHTS (continued)
|
| | | | | | | Year Ended December 31, | | |
| | | |
| |
| |
|
| Class T Shares | | 2006 | | 2005 | | 2004 | | 2003 | | 2002 |
| |
| |
| |
| |
| |
|
| Per Share Data ($): | | | | | | | | | | |
| Net asset value, beginning of period | | 13.31 | | 12.05 | | 10.73 | | 7.89 | | 11.46 |
| Investment Operations: | | | | | | | | | | |
| Investment (loss)—net | | (.08)a | | (.07)a | | (.36) | | (.14) | | (.59) |
| Net realized and unrealized | | | | | | | | | | |
| gain (loss) on investments | | 2.56 | | 1.33 | | 1.68 | | 2.98 | | (2.98) |
| Total from Investment Operations | | 2.48 | | 1.26 | | 1.32 | | 2.84 | | (3.57) |
| Net asset value, end of period | | 15.79 | | 13.31 | | 12.05 | | 10.73 | | 7.89 |
| |
| |
| |
| |
| |
|
| Total Return (%) b | | 18.63 | | 10.46 | | 12.30 | | 35.99 | | (31.15) |
| |
| |
| |
| |
| |
|
| Ratios/Supplemental Data (%): | | | | | | | | | | |
| Ratio of total expenses | | | | | | | | | | |
| to average net assets | | 2.23 | | 2.35 | | 2.16 | | 2.56 | | 5.48 |
| Ratio of net expenses | | | | | | | | | | |
| to average net assets | | 2.19 | | 2.30 | | 2.14 | | 2.54 | | 4.60 |
| Ratio of net investment (loss) | | | | | | | | | | |
| to average net assets | | (.57) | | (.56) | | (.50) | | (1.05) | | (2.88) |
| Portfolio Turnover Rate c | | 114 | | 120 | | 130 | | 138 | | 211 |
| |
| |
| |
| |
| |
|
| Net Assets, end of period ($ x 1,000) | | 25 | | 30 | | 54 | | 61 | | 47 |
| |
| a | | Based on average shares outstanding at each month end. | | | | | | | | |
| b | | Exclusive of sales charge. | | | | | | | | | | |
| c | | Portfolio Turnover Rate is a measure of portfolio activity that is calculated by dividing the lesser of purchases or sales |
| | | of securities, excluding securities having maturity dates at acquisition of one year or less, by the average value of the |
| | | portfolio securities held during the period, which is a rolling 12-month period. | | | | | | |
| See notes to financial statements. | | | | | | | | | | |
NOTES TO FINANCIAL STATEMENTS
NOTE 1—Significant Accounting Policies:
Dreyfus Founders Worldwide Growth Fund (the “fund”) is a separate diversified series of Dreyfus Founders Funds, Inc. (the “Company”), which is registered under the Investment Company Act of 1940, as amended (the “Act”), as an open-end management investment company and operates as a series company currently offering eight series, including the fund. The fund’s investment objective is to seek long-term growth of capital through investments in foreign and U.S. companies. Founders Asset Management LLC (the “Manager”or “Founders”) serves as the fund’s investment adviser. Founders is an indirect wholly-owned subsidiary of Mellon Financial Corporation (“Mellon Financial”), a publicly-owned financial services company which provides a comprehensive range of financial products and services in domestic and selected international markets.
On December 4, 2006, Mellon Financial and The Bank of New York Company, Inc. announced that they had entered into a definitive agreement to merge. The new company will be called The Bank of New York Mellon Corporation. As part of this transaction, Founders would become an indirect wholly-owned subsidiary of The Bank of New York Mellon Corporation. The transaction is subject to certain regulatory approvals and the approval of The Bank of New York Company, Inc.’s and Mellon Financial’s shareholders, as well as other customary conditions to closing. Subject to such approvals and the satisfaction of the other conditions, Mellon Financial and The Bank of New York Company, Inc. expect the transaction to be completed in the third quarter of 2007.
Dreyfus Service Corporation (the “Distributor”), the direct owner of Founders and a wholly-owned subsidiary of The Dreyfus Corporation (“Dreyfus”, an affiliate of Founders), is the Distributor of the fund’s shares. The fund is authorized to issue up to 550 million shares of Common Stock, par value $ .01 per share, in the following classes of shares: Class A, Class B, Class C, Class F, Class R and Class T shares. Class A and Class T shares are subject to a sales charge imposed at the time of purchase. Class B shares are subject to a contingent deferred sales charge
The Fund 25
NOTES TO FINANCIAL STATEMENTS (continued)
|
(“CDSC”) imposed on Class B share redemptions made within six years of purchase and automatically convert to Class A shares after six years. Class C shares are subject to a CDSC imposed on Class C shares redeemed within one year of purchase. Class F and Class R shares are sold at net asset value (“NAV”) per share. Class F shares are sold only to Class F grandfathered investors, and Class R shares are sold only to eligible institutional investors. Other differences between the classes include the services offered to and the expenses borne by each class. Income and realized and unrealized gains or losses on investments are allocated to each class of shares based on its relative net assets.
Effective June 1, 2006, the fund no longer offers Class B shares, except in connection with dividend reinvestment and permitted exchanges of Class B shares.
Each class of the fund bears expenses incurred specifically on its behalf and, in addition, each class bears a portion of general expenses based on the relative net assets or the number of shareholder accounts of the class.The type of expense determines the allocation method.
The Company’s Board of Directors has authorized the payment of certain fund expenses with commissions on fund portfolio transactions. These commissions reduce miscellaneous expenses and are included in the expense offset to broker commissions in the Statement of Operations.
The fund’s financial statements are prepared in accordance with U.S. generally accepted accounting principles, which requires the use of management estimates and assumptions. Actual results could differ from those estimates.
In the normal course of business, the fund may enter into contracts and agreements that contain a variety of representations and warranties, and which provide general indemnifications. The maximum exposure to the fund under these arrangements is unknown, as this would involve future claims that may be made against the fund that have not yet occurred. However, based on experience, the fund expects the risks of loss to be remote.
(a) Portfolio valuation: A domestic equity security listed or traded on a securities exchange or in the over-the-counter market is valued at its last sale price on the exchange or market where it is principally traded or, in the case of a security traded on Nasdaq, at its official closing price. Lacking any sales on that day, the security is valued at the current closing bid price, or by quotes from dealers making a market in the security if the closing bid price is not available, or in the case of written call options, at the mean between the highest bid and lowest asked quotations obtained from at least two securities dealers.
A foreign equity security traded on a foreign exchange is valued at the last quoted official closing price available before the time when the fund’s assets are valued, or at the last quoted sales price if the exchange does not provide an official closing price or if the foreign market has not yet closed. Lacking any sales that day, the security is valued at the current closing bid price, or by quotes from dealers making a market in the security if the closing bid price is not available. New York closing exchange rates are used to convert foreign currencies to U.S. dollars.
A debt security with a remaining maturity greater than 60 days at the time of purchase is valued in accordance with the evaluated bid price supplied by a pricing service approved by the Company’s Board of Directors or, if such price is not available, at the mean between the highest bid and lowest asked quotations obtained from at least two securities dealers. A debt security with a remaining maturity of 60 days or less at the time of purchase is valued at amortized cost, which approximates market value, unless it is determined that amortized cost would not represent market value, in which case the securities would be marked to market.
If market quotations or official closing prices are not readily available or are determined not to reflect accurately fair value, securities will be valued at their fair value as determined in good faith by the Company’s Board of Directors or pursuant to procedures approved by the Board of Directors.These situations may include instances where
The Fund 27
NOTES TO FINANCIAL STATEMENTS (continued)
|
an event occurs after the close of the market on which a security is traded but before the fund calculates its NAV, and it is determined that the event has materially affected the value of the security. Fair value of foreign equity securities may be determined with the assistance of a pricing service using correlations between the movement of prices of foreign securities and indexes of domestic securities and other appropriate indicators, such as closing market prices of relevant ADRs and futures contracts.
Investments in registered investment companies are valued at their NAV.
Using fair value to price securities requires the use of estimates, and as such, may result in a value that is different from a security’s most recent closing price and from the prices used by other mutual funds to calculate their NAV’s. In addition, it is possible that the fair value determined for a security may be different from the value that may be realized upon the security’s sale, and that these differences may be material to the NAV of the fund.
On September 20, 2006, the Financial Accounting Standards Board (FASB) released Statement of Financial Accounting Standards No. 157 “Fair Value Measurements” (“FAS 157”). FAS 157 establishes an authoritative definition of fair value, sets out a framework for measuring fair value, and requires additional disclosures about fair value measurements. The application of FAS 157 is required for fiscal years beginning after November 15, 2007 and interim periods within those fiscal years. Management does not believe that the application of this standard will have a material impact on the financial statements of the fund.
(b) Foreign Securities and Currency Transactions:The fund normally will invest a significant portion of its assets in foreign securities. Foreign securities carry more risk than U.S. securities, such as political and currency risks. In the event the fund executes a foreign security transaction, the fund may enter into a foreign currency contract to settle the foreign security transaction.The fund could be exposed to risk if counterpar-ties are unable to meet the terms of the contracts or if the value of the currency changes unfavorably to the U.S. dollar.The resultant foreign
currency gain or loss from the contract is recorded as foreign currency gain or loss and is presented as such in the Statement of Operations.
The accounting records of the fund are maintained in U.S. dollars.The market values of foreign securities, currency holdings and other assets and liabilities are translated into U.S. dollars based on the current exchange rates each business day. Purchases and sales of investment securities and income and expense items denominated in foreign currencies are translated into U.S. dollar amounts on the respective dates of such transactions.
The fund does not isolate that portion of the results of operations resulting from changes in foreign exchange rates on investments from the fluctuations arising from changes in market prices of securities held. Such fluctuations are included with net unrealized appreciation/ (depreciation) from investments and foreign currency transactions on the Statement of Operations.
Reported net realized foreign exchange gains or losses arise from sales of foreign currencies, currency gains or losses realized between the trade and settlement dates on securities transactions, and the difference between the amounts of dividends, interest, and foreign withholding taxes recorded on the fund’s books and the U.S. dollar equivalent of the amounts actually received or paid. Net unrealized appreciation or depreciation on investments and foreign currency translation arises from changes in the values of assets and liabilities, including investments in securities held at the date of the financial statements, resulting from changes in the exchange rates and changes in market prices of securities held.
(c) Securities transactions and investment income: Securities transactions are recorded on a trade date basis. Realized gain and loss from securities transactions are recorded on the identified cost basis. Dividend income is recognized on the ex-dividend date and interest income, including, where applicable, accretion of discount and amortization of premium on investments, is recognized on the accrual basis.
The Fund 29
NOTES TO FINANCIAL STATEMENTS (continued)
|
The fund has an arrangement with the custodian bank, Mellon Bank, N.A. (“Mellon Bank”), which is an affiliate of Founders, whereby the fund receives earnings credits from the custodian when positive cash balances are maintained, which are used to offset custody fees. For financial reporting purposes, the fund includes net earnings credits as an expense offset in the Statement of Operations.
(d) Affiliated issuers: Investments in other investment companies advised by the Manager or its affiliates are defined as “affiliated” in the Act.
(e) Dividends to shareholders: Dividends are recorded on the ex-dividend date. Dividends from investment income-net and dividends from net realized capital gain, if any, are normally declared and paid annually, but the fund may make distributions on a more frequent basis to comply with the distribution requirements of the Internal Revenue Code of 1986, as amended (the “Code”).To the extent that net realized capital gain can be offset by capital loss carryovers, it is the policy of the fund not to distribute such gain. Income and capital gain distributions are determined in accordance with income tax regulations, which may differ from U.S. generally accepted accounting principles.
(f) Federal income taxes: No provision has been made for federal income taxes since it is the policy of the fund to continue to comply with the requirements of Subchapter M of the Code that are applicable to regulated investment companies and to make distributions of income and capital gains sufficient to relieve it from all income taxes.The fund is treated as a separate tax entity for federal income tax purposes.
On July 13, 2006, the FASB released FASB Interpretation No. 48 “Accounting for Uncertainty in Income Taxes” (FIN 48). FIN 48 provides guidance for how uncertain tax positions should be recognized, measured, presented and disclosed in the financial statements. FIN 48 requires the evaluation of tax positions taken or expected to be taken in the course of preparing the fund’s tax returns to determine whether the tax positions are “more-likely-than-not” of being sustained by the applicable tax authority.Tax positions not deemed to meet the more-
likely-than-not threshold would be recorded as a tax benefit or expense in the current year. Adoption of FIN 48 is required for fiscal years beginning after December 15, 2006 and is to be applied to all open tax years as of the effective date.At this time, management is evaluating the implications of FIN 48 and its impact, if any, in the financial statements has not yet been determined.
At December 31, 2006, the components of accumulated earnings on a tax basis were as follows: accumulated capital losses $50,902,883 and unrealized appreciation $11,834,525.
The accumulated capital loss carryover is available to be applied against future net securities profits, if any, realized subsequent to December 31, 2006. If not applied, $25,559,709 of the carryover expires in fiscal 2009, $22,200,649 expires in fiscal 2010 and $3,142,525 expires in fiscal 2011.
During the period ended December 31, 2006, as a result of permanent book to tax differences, primarily due to the tax treatment for foreign currency transactions and net operating losses, the fund increased accumulated undistributed investment income-net $163,224, increased accumulated net realized gain (loss) on investments by $2,070 and decreased paid-in capital by $165,294. Net assets were not affected by this reclassification.
NOTE 2—Bank Line of Credit:
|
The Company has a line of credit arrangement (“LOC”) with State Street Bank and Trust Company, to be used for temporary or emergency purposes, primarily for financing redemption payments. The borrowings by each series of the Company are limited to the lesser of (a) $50 million, or (b) the lesser of 25% of the series’ total net assets or the maximum amount which the series is permitted to borrow pursuant to the prospectus, any law or any other agreement. Combined borrowings are subject to the $50 million cap on the total LOC. Each series agrees to pay annual fees and interest on the unpaid balance based on prevailing market rates as defined in the LOC.
The Fund 31
NOTES TO FINANCIAL STATEMENTS (continued)
|
The average daily amount of borrowings outstanding under the LOC during the period ended December 31, 2006, was approximately $20,500, with a related weighted average annualized interest rate of 6.12% .
NOTE 3—Investment Advisory Fee and Other Transactions With Affiliates:
(a) In accordance with an investment advisory agreement between the Company and Founders, the fund compensates Founders for its services as investment adviser by the payment of fees computed daily and paid monthly at the annual rate equal to a percentage of the average daily value of the fund’s net assets.The fee is 1% of the first $250 million of net assets, .80% of the next $250 million of net assets and .70% of net assets in excess of $500 million.
During the period ended December 31, 2006, the fund was advised that the Distributor retained $296 and $1 from sales commissions earned on sales of the fund’s Class A and Class T shares, respectively, and $3,177 and $649 from CDSC on redemptions of the fund’s Class B and Class C shares, respectively.
(b) Under the Distribution Plan (the “Plan”) adopted pursuant to Rule 12b-1 under the Act, Class B, Class C and Class T shares pay the Distributor for distributing their shares at an annual rate of .75% of the value of their average daily net assets of Class B and Class C shares and .25% of the value of the average daily net assets of Class T shares. During the period ended December 31, 2006, Class B, Class C and Class T shares were charged $9,594, $2,443 and $79, respectively, pursuant to the Plan.
The fund has adopted a Distribution Plan pursuant to Rule 12b-1 under the Act applicable to its Class F shares. Under the plan, the fund is authorized to reimburse the Distributor for expenses paid for distributing or servicing its Class F shares at an annual rate of up to .25% of the value of the average daily net assets of the fund’s Class F shares. During the period ended December 31, 2006, Class F shares were charged $132,703 pursuant to this Distribution Plan.
(c) Under the Shareholder Services Plan, Class A, Class B, Class C and Class T shares pay the Distributor at an annual rate of .25% of the value of their average daily net assets for the provision of certain services.The services provided may include personal services relating to shareholder accounts, such as answering shareholder inquiries regarding the fund and providing reports and other information, and services related to the maintenance of shareholder accounts.The Distributor may make payments to Service Agents (a securities dealer, financial institution or other industry professional) in respect of these services.The Distributor determines the amounts to be paid to Service Agents. During the period ended December 31, 2006, Class A, Class B, Class C and Class T shares were charged $2,897, $3,198, $814 and $79, respectively, pursuant to the Shareholder Services Plan.
The Company has a shareholder services agreement with the Distributor, whereby the fund has agreed to compensate the Distributor for providing certain shareholder servicing functions to holders of Class F shares. The fund paid the Distributor a monthly fee equal, on an annual basis, to $24.00 per Class F shareholder account considered to be an open account at any time during a given month. During the period ended December 31, 2006, Class F shares were charged $70,310 pursuant to this shareholder services agreement.
Dreyfus Transfer, Inc. (“DTI”), a wholly-owned subsidiary of Dreyfus, is the transfer and dividend disbursing agent for all of the fund’s share classes.With the exception of out-of-pocket charges, the fees charged by DTI with respect to the fund’s Class F shares are paid by the Distributor. The out-of-pocket charges from DTI are paid by the fund. During the period ended December 31, 2006, Class F shares were charged $32,250 for out-of-pocket transfer agent charges.
The fees charged by DTI with respect to the fund’s Class A, B, C, R and T shares are paid by the fund.These transfer agency fees, including both the per account fees paid to DTI and out-of-pocket charges, during the period ended December 31, 2006 were $6,101.
The Fund 33
NOTES TO FINANCIAL STATEMENTS (continued)
|
The fund has agreed to compensate Founders for providing accounting services, administration, compliance monitoring, regulatory and shareholder reporting, as well as related facilities, equipment and clerical help.The fee is computed by applying the following rates, as applicable, to the domestic assets and foreign assets, with the proportions of domestic and foreign assets recalculated monthly, plus reasonable out-of-pocket expenses.
| On Assets in | | But Not | | | | |
| Excess of ($) | | Exceeding ($) | | Domestic Fee (%) | | Foreign Fee (%) |
| |
| |
| |
|
| 0 | | 500 million | | 0.06 | | 0.10 |
| 500 million | | 1 billion | | 0.04 | | 0.065 |
| 1 billion | | | | 0.02 | | 0.02 |
Founders has contractually agreed in writing to waive any fees received for these services to the extent they exceed Founders’ costs in providing the services. Effective January 1, 2007, Dreyfus replaced Founders as fund accounting and administrative services agent for the fund pursuant to an agreement containing substantially the same terms.
Mellon Bank serves as custodian for the fund.The fees for the custody services are subject to reduction by credits earned on the cash balances of the fund held by the custodian, which are shown as earnings credits on the Statement of Operations.The fund could have employed these assets elsewhere to produce income had it not entered into this arrangement. The custodian contractually agreed in writing to a fee waiver for the Company during the time period and in the amount set forth below:
| Time Period | | Amount of Waiver ($) |
| |
|
| 9/1/05 to 8/31/06 | | 200,000 |
This fee waiver was allocated among the Company’s series in proportion to their respective shares of the total custodian fee. During the period ended December 31, 2006, the fund’s portion of the waiver was $19,899, which reduced the amount paid to Mellon Bank to $30,597.
The components of Due to Founders Asset Management LLC and affiliates in the Statement of Assets and Liabilities consist of: investment
advisory fees $50,581, Rule 12b-1 distribution plan fees $12,315, shareholder services plan fees $16,779, custodian fees $12,566, accounting fees $8,244 and transfer agency per account fees $13,284.
(d) Annual retainer fees and attendance fees for the Company’s Board of Directors are allocated to each series of the Company based on net assets.The Company’s Board of Directors has adopted a deferred compensation plan for Company directors that enables directors to elect to defer receipt of all or a portion of the annual compensation that they are entitled to receive from the Company. Under the plan, the compensation deferred is invested in shares of one or more of the Company’s series.The amount paid to the director under the plan will be determined based upon the performance of the selected series.The current value of these amounts is included in Other Assets and Directors’ Deferred Compensation on the Statement of Assets and Liabilities. Changes in market value are included in the directors’ fees and expenses and the net change in unrealized appreciation/depreciation of investments on the Statement of Operations. Deferral of directors’ fees under the plan does not affect the net assets of the fund.
Certain officers of the Company are also officers and/or directors of Founders or its affiliates, which pay their compensation.The affairs of the fund, including services provided by Founders, are subject to the supervision and general oversight of the Company’s Board of Directors.
(e) Pursuant to an exemptive order from the SEC, the fund may invest its available cash balances in affiliated money market mutual funds. Management fees of the underlying money market mutual funds have been waived by Dreyfus.
NOTE 4—Securities Transactions:
The aggregate amount of purchases and sales of investment securities, excluding short-term securities and forward currency exchange contracts, during the period ended December 31, 2006, amounted to $67,198,411 and $74,972,336 respectively.
The Fund 35
NOTES TO FINANCIAL STATEMENTS (continued)
|
The fund enters into forward currency exchange contracts in order to hedge its exposure to changes in foreign currency exchange rates on its foreign portfolio holdings and to settle foreign currency transac-tions.When executing forward currency exchange contracts, the fund is obligated to buy or sell a foreign currency at a specified rate on a certain date in the future. With respect to sales of forward currency exchange contracts, the fund would incur a loss if the value of the contract increases between the date the forward contract is opened and the date the forward contract is closed.The fund realizes a gain if the value of the contract decreases between those dates. With respect to purchases of forward currency exchange contracts, the fund would incur a loss if the value of the contract decreases between the date the forward contract is opened and the date the forward contract is closed. The fund realizes a gain if the value of the contract increases between those dates. The fund is also exposed to credit risk associated with counterparty nonperformance on these forward currency exchange contracts which is typically limited to the unrealized gain on each open contract. The following summarizes open forward currency exchange contracts at December 31, 2006:
| | | Foreign | | | | | | |
| Forward Currency | | Currency | | | | | | Unrealized |
| Exchange Contracts | | Amounts | | Proceeds ($) | | Value ($) | | Appreciation ($) |
| |
| |
| |
| |
|
| Sales: | | | | | | | | |
| Canadian Dollar, | | | | | | | | |
| expiring 1/3/2007 | | 230,000 | | 197,549 | | 197,230 | | 319 |
At December 31, 2006, the cost of investments for federal income tax purposes was $46,864,959; accordingly, accumulated net unrealized appreciation on investments was $11,834,051, consisting of $12,316,917 gross unrealized appreciation and $482,866 gross unrealized depreciation.
REPORT OF INDEPENDENT REGISTERED PUBLIC ACCOUNTING FIRM
To the Board of Directors and Shareholders of Dreyfus Founders Funds, Inc.
In our opinion, the accompanying statement of assets and liabilities, including the statement of investments, and the related statements of operations and of changes in net assets and the financial highlights present fairly, in all material respects, the financial position of Dreyfus Founders Worldwide Growth Fund (one of the portfolios constituting Dreyfus Founders Funds, Inc., hereafter referred to as the “Fund”) at December 31, 2006, the results of its operations for the year then ended, the changes in its net assets for each of the two years in the period then ended and the financial highlights for each of the five years in the period then ended, in conformity with accounting principles generally accepted in the United States of America. These financial statements and financial highlights (hereafter referred to as “financial statements”) are the responsibility of the Fund’s management; our responsibility is to express an opinion on these financial statements based on our audits.We conducted our audits of these financial statements in accordance with the standards of the Public Company Accounting Oversight Board (United States). Those standards require that we plan and perform the audit to obtain reasonable assurance about whether the financial statements are free of material misstate-ment.An audit includes examining, on a test basis, evidence supporting the amounts and disclosures in the financial statements, assessing the accounting principles used and significant estimates made by management, and evaluating the overall financial statement presentation. We believe that our audits, which included confirmation of securities at December 31, 2006 by correspondence with the custodian and brokers, provide a reasonable basis for our opinion.
| | PricewaterhouseCoopers LLP
New York, New York
February 23, 2007
|
The Fund 37
FACTORS CONSIDERED IN RENEWING THE ADVISORY AGREEMENT (Unaudited)
At a meeting of the board of directors of Dreyfus Founders Funds, Inc. (the “Funds” and, in reference to any one of the Funds’ portfolios, a “Fund”) held on August 9 and 10, 2006, the Funds’ directors unanimously approved the continuation of the Investment Advisory Agreement (“management agreement”) between each of the Funds and Founders Asset Management LLC, the Funds’ investment adviser (“Founders”), for a one-year term ending August 31, 2007.The board of directors of the Funds (“board”) is comprised entirely of individuals who have no affiliation with Founders or any affiliates of Founders (the “directors”).
Prior to the directors’ August 2006 meeting, Founders had provided the directors with extensive materials related to the renewal of the management agreement, including performance and expense information for other investment companies with similar investment objectives to each Fund derived from data compiled by Lipper Inc., an independent third party (“Lipper”).
During their meeting, the directors discussed the proposed continuance of the management agreement with the senior management personnel of Founders. At the conclusion of these discussions, the directors and their independent counsel met in a private session at which no representatives of Founders were present, to continue their discussion of continuance of the agreement. In determining to continue the management agreement, the directors considered all factors which they believed to be relevant, including the following:
Nature, Extent and Quality of Services Provided and to be Provided by Founders
The directors recognized that they have had the opportunity to evaluate the investment and non-investment related services which Founders provides to the Funds primarily through their quarterly review of all of the operations of the Funds during Fund committee and Fund board meetings held throughout the past twelve months.At each such meeting, extensive discussions of Fund operations are held with senior management personnel of Founders and a large volume of documentation
with respect to these operations is provided to and reviewed by the directors. Such discussions and documentation afford the directors the continual opportunity to evaluate the nature, extent, and quality of the services provided by Founders and its affiliates to the Funds.
The directors were satisfied that Founders is managing the investment of the assets of the Funds in accordance with each Fund’s respective investment objective, policies and restrictions, subject to the directors’ overall supervision.
The directors considered that Founders also provides many non-investment related services to the Funds in fulfilling its responsibilities under the management agreement.
Following their discussion and review, the directors reached the following conclusions:
- That the breadth and quality of investment advisory and other ser- vices being provided to the Funds are satisfactory, as evidenced in part by the performance records of the Funds, to which the direc- tors gave significant attention as indicated below; and
- That the directors are satisfied not only with the research, long-term portfolio management, and trading services being provided to the Funds, but also recognize that Founders or its affiliates have pro- vided the highest quality accounting, compliance and regulatory, administrative, underwriting, custody, shareholder, transfer agent and cash management services to the Funds, while charging fair, reason- able and competitive fees.
On a quarterly basis, the directors hold in-person meetings with representatives of the portfolio management team for each Fund (usually a portfolio manager), during which each representative reviews, among other items, performance information, attribution analyses, and the portfolio manager’s investment outlook.The directors also receive written monthly and quarterly performance information for each Fund.
The Fund 39
FACTORS CONSIDERED IN RENEWING THE
ADVISORY AGREEMENT (Unaudited) (continued)
|
In conjunction with their consideration of renewal of the management agreement, the directors received a more detailed performance report about each Fund from Lipper.These reports compared each Fund’s performance to both a relatively small group of similar funds selected by Lipper (the “Lipper performance group”), as well as to all funds in the applicable Lipper category (the “Lipper performance universe”).
Worldwide Growth Fund’s performance for the one-year period ended December 31, 2005 placed it in the fourth quintile of its Lipper performance group and in the third quintile of its Lipper global large-cap growth fund performance universe. The Fund’s performance for the three-year period ended December 31, 2005 placed it in the second quintile of both its Lipper performance group and universe. For the six-month, one-year and three-year periods ended June 30, 2006, the Fund’s performance placed it in the second quintile of both its Lipper performance group and its Lipper performance universe. The directors deemed these more recent relative performance results to be satisfactory, but stressed the importance to Founders of the need for the Fund to continue to seek to maintain a strong performance record.
After consideration of all relevant information and data, the directors concluded that although past performance cannot be a guaranty of future performance, each Fund and its shareholders would continue to benefit from Founders’ investment management of the Fund. The directors further determined:
- That although certain of the Funds have experienced performance difficulties, Founders has focused its efforts upon improving the per- formance records of the Funds and will continue to seek improve- ment; and
- That the materials provided by Lipper demonstrated that most of the Funds maintained satisfactory performance quintile rankings in their respective comparison groups and comparison universes, with six of the eight Funds placing in the top two quintiles of their respective Lipper performance universes for the three-years ended December 31, 2005, and five of the eight Funds placing in the top two quintiles for the six months ended June 30, 2006.
Costs of the Services to be Provided and Profits to be Realized by Founders and Its Affiliates from Founders’ Relationship With the Funds
The directors recognized that on a quarterly basis, they receive information with respect to each Fund’s expenses. The directors carefully review and discuss the expense ratios for all classes of shares of each Fund at each of their quarterly meetings throughout the year.
In conjunction with their annual consideration of renewal of the Funds’ management agreement and other service arrangements, the directors received information from Lipper which included graphs for each Fund that provided outlines of contractual management fees at common asset levels, actual management fees, actual non-management expenses and actual total Fund expenses, each graph comparing the relevant information of each Fund with each Fund’s Lipper performance group.
The directors noted that for the period ended December 31, 2005, Worldwide Growth Fund’s management fees ranked in the fourth quintile of its Lipper performance group, with the Fund’s fees the 11th lowest of 14 “peer funds.”The Fund’s contractual management fees at a common asset level were determined by Lipper to be lower than four of the 14 funds in its group.The Fund’s management fees were in the fourth quintile of its Lipper expense universe.
The directors also considered a brochure provided by Lipper which included information with respect to the profitability of the mutual fund advisory activities conducted by a number of publicly-held corporations. Lipper also prepared an analysis providing detailed information with respect to the types of services rendered to various mutual fund complexes under their respective investment advisory contracts.
The directors had been provided with extensive materials with respect to the profitability derived by Founders from providing investment advisory and other services to the Funds as a group and to each Fund individually.
The Fund 41
FACTORS CONSIDERED IN RENEWING THE
ADVISORY AGREEMENT (Unaudited) (continued)
|
The directors further considered certain indirect benefits received by Founders and its affiliates from providing investment advisory services to the Funds.These included the following:
- Since Founders manages several non-Fund accounts in a style that is similar to that used for certain of the Funds, Founders and its affil- iates realize certain efficiencies in performing the portfolio manage- ment, trading and operational functions related to those accounts;
- The Funds’ brokerage transactions may be executed with brokers that provide research and brokerage services to Founders and its affiliates. These research and brokerage services may be useful to Founders and its affiliates in providing investment services to any of the clients they advise, not just the Funds; and
- Founders receives fees for providing accounting services to the Funds, and affiliates of Founders receive various fees for providing underwriting, shareholder, transfer agency, custody and cash man- agement services to the Funds.
The directors also reviewed a table listing the Funds and corresponding subadvisory accounts managed by Founders, and their respective fee schedules. In their review of this table, the directors noted that Founders provides many services to the Funds in fulfilling its responsibilities under the management agreement that it does not provide to entities for which Founders has assumed subadvisory duties. The directors concluded that the fees paid to Founders under the management agreement are reasonable in relation to the nature and extent of the services provided by Founders to the Funds under the agreement.
After deliberation and discussion of Fund fees and expenses, the directors determined:
- That upon review of the advisory fee structures of the Funds in comparison with the competitive performance groups selected by Lipper, the levels of investment advisory fees paid by the Funds were deemed to be acceptable;
- That the expense ratios of the Funds are acceptable and that Founders continually reviews each Fund’s total expense ratio and has initiated voluntarily expense caps and fee waivers for certain Funds to reduce their expense ratios;
- That the majority of the Funds’ expense ratios increased in 2005 from those experienced in 2004, primarily as a result of declines in Fund assets; and
- That the comparative fee and expense information included in the materials provided by Lipper supports the determination that the advisory and other fees payable by the Funds to Founders and its affiliates are essentially fees which would be similar to those which would have resulted solely from “arm’s-length” bargaining.
With respect to profitability to Founders, the directors reviewed the adviser profitability analysis provided by Lipper, which demonstrated that Founders’ 2005 profitability from providing management services to the Funds was reasonable in comparison to the entities included in the Lipper analysis.
The directors were also advised by independent counsel of the profitability percentage ranges determined by court cases to be acceptable and determined that Founders’ profitability percentage for providing management and other services to the Funds was reasonable.
The directors concluded that Founders’ profits from providing management services to the Funds were reasonable in relationship to the overall services which Founders provides.
Economies of Scale
The directors reviewed information provided by Founders which summarized the extent, if any, that both Founders and the Funds would achieve certain economies of scale if the assets of the Funds were to increase.
The Fund 43
FACTORS CONSIDERED IN RENEWING THE
ADVISORY AGREEMENT (Unaudited) (continued)
|
After review and discussion, the directors considered the extent to which economies of scale and common management are shared with each Fund, including the economies that would be realized from the growth of each Fund’s assets. After such consideration, the directors determined that all of the Funds have structured breakpoints in their advisory fees, which result in fee reductions as the assets of each Fund reach defined levels, and that such fee reductions, when implemented, would benefit all of the applicable Fund’s shareholders through decreases in the Fund’s expense ratio.
Dedication to Regulatory Requirements and Restrictions
An important factor in the directors’ consideration of renewal of the Funds’ management agreement with Founders included the directors’ recognition of the dedication by Founders of stringent adherence to regulatory requirements and restrictions.The directors determined that Founders is dedicated to compliance with all applicable rules and regulations and that the systems of controls which are in place to ensure that the service providers to the Funds, including Founders, and the Funds themselves, maintain strict adherence to the law are excellent.
The directors determined that they are generally satisfied with the performance of the Funds and with the quality of the advisory and other services being provided by Founders and its affiliates to the Funds. The directors recognized that overall Fund performance has improved in recent years and that efforts are being and will continue to be made to enhance such improvements and to maintain Fund expense ratios at reasonable and acceptable levels.
The directors concluded that continuation of the current management agreement between each Fund and Founders, which would enable each Fund to continue to receive investment advisory services from Founders, is in the best interests of each Fund and its shareholders, the services to be performed under the management agreement are services required for the operations of the Funds, Founders has provided satisfactory investment management services to the Funds in the past, and the fees for the management services which Founders will perform will be within the range of what would have been negotiated at arm’s length in light of the circumstances.
The Fund 45
YOUR BOARD REPRESENTATIVES (Unaudited)
The Board of Directors of the Company oversees all 8 Dreyfus Founders Funds.The business and affairs of the Company are managed under the direction of the Board. The directors serving on the Board perform their responsibilities in the manner which they reasonably believe to be in the best interests of the Funds and their shareholders.
All of the directors,as listed below,are independent directors.They are not affiliated with the Fund ‘s adviser, its parent company, or its affiliates.The directors have no official term of office and generally serve until they retire (normally at age 75, but subject to extension to age 80), resign, or are not re-elected.As you can see from their backgrounds, the directors have broad experience as active or former business and community leaders.
Eugene H.Vaughan, CFA, 73.Year elected to the Board: 1970
Board Chairman. Founding Chairman,Vaughan Nelson Investment Management, LP, an investment counseling firm. Director, Encore Bank, Houston. Founding Chairman, Center for Houston’s Future, a non-profit organization. Founding Chairman and former Governor, CFA Institute. Past Chairman and Trustee, Institute of Chartered Financial Analysts. Past Chairman and Director, Financial Analysts Federation. Chairman-elect, University of Texas Health Science Center.
Alan S. Danson, 67.Year elected to the Board: 1991
Private investor. Formerly, President and Director, D.H. Management, Inc., the general partner of a limited partnership with technology company holdings (1996 to 2003). Director, Gore Range Natural Science School and The Les Streeter Program, Inc., both of which are non-profit organizations.
Robert P. Mastrovita, 62.Year elected to the Board: 1998
Private investor. Chairman of a private charitable foundation (1997 to present). Formerly, Chairman and Director, Hagler, Mastrovita & Hewitt, Inc., a registered investment adviser (1982 to 1997). Member, Boston Society of Security Analysts. Trustee, Partridge Academy.
Trygve E. Myhren, 70.Year elected to the Board: 1996
President, Myhren Media, Inc., a firm that invests in and advises media, telecommunications, Internet and software companies. Special Limited Partner and member of Investment Committee, Megunticook Funds, a venture capital firm (1998 to present). Director,Advanced Marketing Services, Inc.Trustee and Chairman of Finance Committee, the University of Denver.Trustee, Denver Art Museum. Member, Cable
Television Hall of Fame. Formerly, President (1990 to 1996) and Director (1992 to 2001) of the Providence Journal Company, a diversified media and communications company. Formerly, Chairman and Chief Executive Officer of American Television and Communications Corporation (now Timer Warner Cable) (1981 to 1988). Formerly, Chairman of the National Cable Television Association (1986-1987).
George W. Phillips, 68.Year elected to the Board: 1998
Retired.Vice Chairman of the Board, Chairman of the Finance Committee, and Chairman of the Investment Committee, Children’s Medical Center of Boston. Formerly, President and Chief Executive Officer (1992 to 1997) and Director (1992 to 2002) of Warren Bancorp, Inc. Formerly, President, Chief Executive Officer and Director of Warren Five Cents Savings Bank (1992 to 1997).
Martha A. Solis-Turner, 46.Year elected to the Board: 2005
Formerly, Telecommunications Director, Wholesale Markets (1995 to 2001), and Manager (1990 to 1995), Qwest Communications International Inc. Board member and Treasurer, Mile High Montessori Early Learning Centers (2002 to present), and formerly, Board member (1995 to 2004) and Vice President (2002 to 2004), Curtis Park Community Center, both of which are non-profit organizations.
Thomas F. Eggers, 54. President and Principal Executive Officer of the Funds since 2006. Founders’ Chairman of the Board, President and Chief Executive Officer. President, Chief Executive Officer and a Director of Dreyfus. Chairman of the Board and Chief Executive Officer of Dreyfus Service Corporation (“DSC”) since 2005. Formerly, President of Scudder Investments (2002 to 2005). Previously employed by Dreyfus from 1996 to 2002, including as President from 2001 to 2002.
David L. Ray, 49.Vice President of the Funds since 2000, and from 1990 to 1998. Founders’ Senior Vice President, Chief Operating Officer and Treasurer. Vice President of DSC since 2003. Employed by Founders and its predecessor company since 1990. Formerly,Treasurer of the Funds (1990 to 1998).
Kenneth R. Christoffersen, 51. Secretary of the Funds since 2000, and from 1996 to 1998. Founders’ Senior Vice President-Legal, General Counsel and Secretary. Assistant Secretary of DSC since 2003. Employed by Founders and its predecessor company since 1996.
The Fund 47
YOUR BOARD REPRESENTATIVES (Unaudited) (continued)
Jennifer L. Carnes, 35. Treasurer, Principal Financial Officer and Principal Accounting Officer of the Funds since 2006. Manager of Fund Administration for Founders since 2006. Formerly, Founders’ Supervisor of Corporate Actions and Pricing (2002 to 2006), and Corporate Actions and Pricing Specialist (2000 to 2002).
Janelle E. Belcher, 48. Chief Compliance Officer of the Funds since 2004 and Assistant Secretary of the Funds since 2002. Founders’Vice President - Compliance since 2002. Formerly, Founders’ Manager of Compliance (2000 to 2002) and Securities Compliance Examiner, Staff Accountant and Team Leader for the U.S. Securities and Exchange Commission (1990 to 2000).
Eric D. Naviloff, 38. Assistant Treasurer since 2006. Senior Accounting Manager -Taxable Fixed-Income Funds of Dreyfus, and an officer of 91 investment companies (comprised of 205 portfolios) managed by Dreyfus. Employed by Dreyfus since 1992.
Robert S. Robol, 42.Assistant Treasurer since 2006. Senior Accounting Manager -Money Market and Municipal Bond Funds of Dreyfus, and an officer of 91 investment companies (comprised of 205 portfolios) managed by Dreyfus. Employed by Dreyfus since 1988.
Robert Svagna, 39. Assistant Treasurer since 2006. Senior Accounting Manager -Equity Funds of Dreyfus, and an officer of 91 investment companies (comprised of 205 portfolios) managed by Dreyfus. Employed by Dreyfus since 1990.
William G. Germenis, 36.Anti-Money Laundering Compliance Officer (“AMLCO”) for the Class A, Class B, Class C, Class R, and Class T shares of the Funds since 2002 and for the Class F shares of the Funds since 2003.Vice President and AMLCO of MBSC, LLC since 2002.Vice President and AMLCO of DSC and AMLCO of investment companies managed by Dreyfus. Employed by DSC since 1998.
The directors and officers may be contacted at Founders’ address appearing on the back cover, except for Messrs. Eggers, Naviloff, Robol, Svagna and Germenis, who can be contacted at The Dreyfus Corporation, 200 Park Avenue, New York, New York 10166. Additional information about the Company’s directors is available in the Statement of Additional Information, which can be obtained free of charge by calling 1-800-525-2440 (Class F shareholders) or 1-800-554-4611 (all other shareholders).
| For Class F shareholders |
| Telephone Call your financial representative or 1-800-525-2440 |
| Mail Dreyfus Founders Funds, Inc. |
| P.O. Box 55360, Boston, MA 02205-8252 |
For Class A, B, C, R and T shareholders
Telephone Call your financial representative or 1-800-554-4611 Mail Dreyfus Founders Funds, Inc.
144 Glenn Curtiss Boulevard, Uniondale, NY 11556-0144
The fund files its complete schedule of portfolio holdings with the Securities and Exchange Commission (“SEC”) for the first and third quarters of each fiscal year on Form N-Q. The fund’s Forms N-Q are available on the SEC’s website at http://www.sec.gov and may be reviewed and copied at the SEC’s Public Reference Room in Washington, DC. Information on the operation of the Public Reference Room may be obtained by calling 1-800-SEC-0330.
A description of the policies and procedures that the fund uses to determine how to vote proxies relating to portfolio securities, and information regarding how the fund voted these proxies for the 12-month period ended June 30, 2006, is available at http://www.founders.com, http://www.dreyfus.com and on the SEC’s website at http://www.sec.gov. The description of the policies and procedures is also available without charge, upon request, by calling 1-800-645-6561.
This report and the statements it contains are submitted for the general information of our shareholders. The report is not authorized for distribution to prospective investors unless preceded or accompanied by an effective prospectus.
| Founders and Founders Funds are registered trademarks |
| of Founders Asset Management LLC. |
| |
| © 2007 Dreyfus Service Corporation |

(a) As of the end of the period covered by this report, Dreyfus Founders Funds, Inc. (the "Funds") has adopted a code of ethics that applies to the Funds' principal executive officer, principal financial officer, and principal accounting officer.
(c) During the period covered by this report, no amendments have been made to a provision of the code of ethics that applies to the Funds' principal executive officer, principal financial officer, or principal accounting officer, and that relates to any element of the code of ethics definition enumerated in paragraph (b) of Item 2 of Form N-CSR.
(d) During the period covered by this report, the Funds have not granted a waiver, including an implicit waiver, from a provision of the code of ethics to the Funds' principal executive officer, principal financial officer, or principal accounting officer that relates to one or more of the items set forth in paragraph (b) of Item 2 of Form N-CSR.
(f)(1) A copy of the code of ethics is filed as an exhibit to this report, pursuant to Item 12(a)(1) of Form N-CSR.
ITEM 3. AUDIT COMMITTEE FINANCIAL EXPERT
(a)(1) The board of directors of the Funds has determined that the Funds have an "audit committee financial expert" serving on its audit committee, as that term is defined in paragraph (b) of Item 3 of Form N-CSR.
(a)(2) The name of the audit committee financial expert is George W. Phillips. Mr. Phillips is an "independent" member of the audit committee as that term is defined in Item 3(a)(2) of Form N-CSR.
ITEM 4. PRINCIPAL ACCOUNTANT FEES AND SERVICES
(a) Audit Fees - The aggregate fees billed to the Funds by their principal accountant for professional services rendered for the audit of the Funds’ annual financial statements or services that are normally provided by the accountant in connection with statutory and regulatory filings or engagements for the fiscal years ending December 31, 2006 and December 31, 2005 were $346,000 and $244,000, respectively.
(b) Audit-Related Fees – The aggregate fees billed to the Funds by their principal accountant for assurance and related services that are reasonably related to the performance of the audit of the Funds’ financial statements and that are not reported under paragraph (a) of this Item 4 for the fiscal years ending December 31, 2006 and December 31, 2005 were $0 and $5,000, respectively. These fees were for agreed-upon procedures performed relating to trade allocation, initial or secondary public offerings, brokerage commissions, and Rule 17a-7 transactions.
The aggregate fees billed for assurance and related services by the Funds’ principal accountant to the Funds’ investment adviser, and any entity controlling, controlled by, or under
common control with the adviser that provides ongoing services to the Funds (collectively, the “Service Providers”), that were reasonably related to the performance of the annual audit of the Service Provider, which required pre-approval by the Audit Committee for the fiscal years ending December 31, 2006 and December 31, 2005 were $590,000 and $69,000, respectively. These fees were for a SAS 70 review of an affiliate providing trading and research services for the Funds, and a review of the internal controls of the transfer agent.
(c) Tax Fees – The aggregate fees billed to the Funds by their principal accountant for professional services rendered by the accountant for tax compliance, tax advice, and tax planning (“tax fees”) for the fiscal years ending December 31, 2006 and December 31, 2005 were $61,500 and $55,800, respectively. These fees were for excise tax distribution calculations, preparation of tax returns, and related consultations.
The aggregate tax fees billed by the Funds’ principal accountant to the Service Providers for services which required pre-approval by the Audit Committee for the fiscal years ending December 31, 2006 and December 31, 2005 were $0 and $0, respectively.
(d) All Other Fees – The aggregate fees billed to the Funds by their principal accountant for products and services provided by the accountant, other than the services reported in paragraphs (a), (b), and (c) of this Item 4 (“all other fees”), for the fiscal years ending December 31, 2006 and December 31, 2005 were $0 and $0, respectively.
The aggregate of all other fees billed by the Funds’ principal accountant for products and services provided to the Service Providers which required pre-approval by the Audit Committee for the fiscal years ending December 31, 2006 and December 31, 2005 were $102,000 and $124,820, respectively. These fees were for transfer agent fee benchmarking, AIMR verification services, and network vulnerability testing.
(e)(1) Approval is required of all audit and significant permitted non-audit engagements of the Funds’ principal accountant, prior to the commencement of any such engagement, including pre-approval not only of services provided directly to the Funds but also services provided to the Service Providers where the nature of the services provided has a direct relationship to the operations or financial reporting of the Funds; pre-approval may be given up to one year in advance of the audit or non-audit activity for which pre-approval is sought.
In any instance in which it may become necessary or desirable for the audit committee to grant immediate pre-approval of a non-audit service to be provided either by the Funds’ principal accountant or by another audit firm, such pre-approval may be procured in writing from the chair of the Funds’ audit committee or, in the event of his or her unavailability, from the chair of the Funds’ board of directors. Any such pre-approval shall be subject to consideration and review by the audit committee at its next regularly scheduled quarterly meeting.
(e)(2) None of the services described in paragraphs (b) through (d) of this Item 4 were approved by the audit committee pursuant to paragraph (c)(7)(i)(C) of Rule 2-01 of Regulation S-X.
(g) For the fiscal years ending December 31, 2006 and December 31, 2005, the aggregate non-audit fees billed by the Funds’ principal accountant to the Funds and the Service Providers were $1,818,500 and $581,800, respectively.
(h) The Funds’ Audit Committee has considered whether the provision of non-audit services that were rendered to the Service Providers which were not pre-approved (not requiring pre- approval) is compatible with maintaining the principal accountant’s independence.
ITEM 5. AUDIT COMMITTEE OF LISTED REGISTRANTS
ITEM 6. SCHEDULE OF INVESTMENTS
|
Schedule I - Investments in securities of unaffiliated issuers is included as part of the reports to shareholders filed under Item 1 of this report on Form N-CSR.
ITEM 7. DISCLOSURE OF PROXY VOTING POLICIES AND PROCEDURES FOR CLOSED-END MANAGEMENT INVESTMENT COMPANIES
Not applicable.
ITEM 8. PORTFOLIO MANAGERS OF CLOSED-END MANAGEMENT INVESTMENT COMPANIES
ITEM 9. PURCHASE OF EQUITY SECURITIES BY CLOSED-END MANAGEMENT INVESTMENT COMPANY AND AFFILIATED PURCHASERS
ITEM 10. SUBMISSION OF MATTERS TO A VOTE OF SECURITY HOLDERS
No material changes have been made to the procedures by which shareholders may recommend nominees to the board of directors of the Funds, where those changes were implemented after the Funds last provided disclosure in response to the requirements of Item 7(d)(2)(ii)(G) of Schedule 14A or this Item 10.
ITEM 11. CONTROLS AND PROCEDURES
|
(a) Based on an evaluation of the Funds' Disclosure Controls and Procedures as of a date within 90 days of the filing date of this report, the Funds' Principal Executive Officer ("PEO") and Principal Financial Officer ("PFO") have concluded that the Funds' Disclosure Controls and Procedures are effectively designed to ensure that information required to be
disclosed by the Funds in the report is recorded, processed, summarized, and reported within required time periods, and to ensure that information required to be disclosed in the report is accumulated and communicated to the Funds' management, including the Funds' PEO and PFO, or persons performing similar functions, as appropriate to allow timely decisions regarding required disclosure.
(b) During the quarter ended December 31, 2006, there has been no change in the Funds' internal control over financial reporting that has materially affected, or that is reasonably likely to materially affect, the Funds' internal control over financial reporting.
| | (a)(1) Attached hereto as Exhibit EX-99.CODE ETH.
|
| | (a)(2) Attached hereto as Exhibit EX-99.CERT.
|
| | (b) Attached hereto as Exhibit EX-99.906CERT.
|
SIGNATURES
Pursuant to the requirements of the Securities Exchange Act of 1934 and the Investment Company Act of 1940, the registrant has duly caused this report to be signed on its behalf by the undersigned, thereunto duly authorized.
DREYFUS FOUNDERS FUNDS, INC.
| By: | | /s/Thomas F. Eggers |
| | | Thomas F. Eggers, President |
| Date: | | February 27, 2007 |
| |
| Pursuant to the requirements of the Securities Exchange Act of 1934 and the Investment |
| Company Act of 1940, this report has been signed below by the following persons on behalf of |
| the registrant and in the capacities and on the dates indicated. |
| By: | | /s/Thomas F. Eggers |
| | | Thomas F. Eggers, Principal Executive Officer |
| Date: | | February 27, 2007 |
| By: | | /s/Jennifer L. Carnes |
| | | Jennifer L. Carnes, Principal Financial Officer |
| Date: | | February 27, 2007 |