UNITED STATES
SECURITIES AND EXCHANGE COMMISSION
Washington, D.C. 20549
FORM N-CSR
CERTIFIED SHAREHOLDER REPORT OF REGISTERED MANAGEMENT INVESTMENT COMPANIES
Investment Company Act file number_811-00537
__Franklin Custodian Funds
(Exact name of registrant as specified in charter)
One Franklin Parkway, San Mateo, CA 94403-1906
(Address of principal executive offices) (Zip code)
Craig S. Tyle, One Franklin Parkway, San Mateo, CA 94403-1906
(Name and address of agent for service)
Registrant's telephone number, including area code:_650 312-2000
Date of fiscal year end: 9/30
Date of reporting period: _9/30/10
Item 1. Reports to Stockholders.
| SEPTEMBER 30, 2010 ANNUAL REPORT AND SHAREHOLDER LETTER Franklin DynaTech Fund Franklin Growth Fund Franklin Income Fund Franklin U.S. Government Securities Fund Franklin Utilities Fund Sign up for electronic delivery on franklintempleton.com FRANKLIN CUSTODIAN FUNDS |
Contents
| | | | | |
| | | | |
Shareholder Letter | | | 1 | |
Annual Report | | | | |
| Economic and Market Overview | | | 3 | |
| Franklin DynaTech Fund | | | 5 | |
| Franklin Growth Fund | | | 15 | |
| Franklin Income Fund | | | 25 | |
| Franklin U.S. Government Securities Fund | | | 38 | |
| Franklin Utilities Fund | | | 49 | |
| Financial Highlights and Statements of Investments | | | 59 | |
| Financial Statements | | | 111 | |
| Notes to Financial Statements | | | 120 | |
| Report of Independent Registered Public Accounting Firm | | | 143 | |
| Tax Designation | | | 144 | |
| Board Members and Officers | | | 145 | |
| Shareholder Information | | | 150 | |
| 1
Annual Report
Economic and Market Overview
During the 12-month period ended September 30, 2010, the U.S. economy recovered unevenly from the recession, supported by a combination of fundamental improvement in business conditions and government intervention and stimulus. Economic activity as measured by gross domestic product (GDP) expanded at a 5.0% annualized rate in 2009’s fourth quarter. As the effects of temporary stimulus measures faded, construction, industrial production and exports cooled somewhat. As a result, GDP growth slowed to an annualized 3.7% pace in 2010’s first quarter, and then downshifted further to 1.7% annualized in the second quarter and an estimated annualized 2.0% pace in the third quarter.
Challenges such as mixed economic data, elevated debt concerns surrounding the U.S. budget deficit and a growing lack of job prospects for the unemployed also hindered consumer confidence and the economy’s advance. During much of the period, home prices rose in many regions due to low interest rates, a first-time homebuyer tax credit program, and prices dipping to levels that lured buyers. Later in the period, home sales stalled as the homebuyer tax credit program ended, foreclosures mounted and the housing sector overall remained weak.
Amid signs of a demand-led recovery, crude oil prices rose from $71 per barrel at the end of September 2009 to a 17-month high of $87 in early April. But as doubts surfaced about the recovery’s sustainability, oil prices drifted down as low as $66 in late May. Despite an abundant oil supply, a falling U.S. dollar and speculative buying pushed prices to $80 per barrel by the end of September. The September 2010 inflation rate was an annualized 1.1%1 Core inflation, which excludes volatile food and energy costs, rose at a 0.8% annualized rate and toward period-end reached a 44-year low level.1 Despite a lack of significant job gains, the unemployment rate, which had risen from 9.8% at the beginning of the period to a 26-year high of 10.1% in October 2009, was 9.6% in Septe mber 2010 as the labor force participation rate fell.1
| | |
| 1. | | Source: Bureau of Labor Statistics. |
Annual Report | 3
Given few inflationary pressures and uncertainty surrounding the economic recovery, the Federal Open Market Committee (FOMC) made no major changes to its monetary policy. It repeatedly stated it will keep the federal funds target rate in the exceptionally low 0% to 0.25% range “for an extended period” and eventually shifted its focus to its outlook and the status of its current holdings. In September, the FOMC revealed concerns about the subdued recovery and said inflation was below the pace “consistent with its mandate.” Having already lowered interest rates effectively to zero, the FOMC stood ready to buy government debt to stimulate the economy and promote a low level of inflation consistent with healthy economic growth.
Investor confidence shifted with each release of encouraging or discouraging economic, regulatory or political news, stoking considerable volatility among equities. Ultimately, stock market gains made in the first half of the fiscal year gave way to a directionless, nearly flat trend during the latter half as many investors sought the relative safety of precious metals and U.S. Treasury securities. Wary investors favored short-term Treasuries, and Treasury yields dipped to very low levels during the period. The two-year Treasury bill yield decreased from 0.95% to 0.42% over the 12-month period, while the 10-year Treasury note yield fell from 3.31% to 2.53%. Overall, the blue chip stocks of the Dow Jones Industrial Average delivered a +14.12% total return, while the broader Standard & Poor’s 500 Index (S&P 500) posted a +10.16% total return and the technology-heavy NASDAQ Composite Index produced a +12.61% return.2 Performance among the major sectors varied widely, with consumer discretionary, industrials and telecommunication services posting solid gains, while financials had a loss and energy and health care underperformed.
The foregoing information reflects our analysis and opinions as of September 30, 2010. The information is not a complete analysis of every aspect of any market, country, industry, security or fund. Statements of fact are from sources considered reliable.
| | |
| 2. | | Source: © 2010 Morningstar. All Rights Reserved. The information contained herein: (1) is proprietary to Morningstar and/or its content providers; (2) may not be copied or distributed; and (3) is not warranted to be accurate, complete or timely. Neither Morningstar nor its content providers are responsible for any damages or losses arising from any use of this information. Past performance is no guarantee of future results. The Dow Jones Industrial Average is price weighted based on the average market price of 30 blue-chip stocks that are generally industry leaders. The S&P 500 is a market capitalization-weighted index of 500 stocks designed to measure total U.S. equity market performance. STANDARD & POOR’S®, S&P® and S&P 500® are registered trademarks of Standard & Poor’s Financial Services LLC. Standard & Poor’s does not sponsor, endorse, sell or promote any S&P index-based product. The NASDAQ Composite Index is a broad-based market capitalization-weighted index designed to measure all NASDAQ domestic and international based common type stocks listed on The NASDAQ Stock Market. |
4 | Annual Report
Franklin DynaTech Fund
Your Fund’s Goal and Main Investments: Franklin DynaTech Fund seeks capital appreciation by investing substantially in equity securities of companies emphasizing scientific or technological development or that are in fast-growing industries.
Performance data represent past performance, which does not guarantee future results. Investment return and principal value will fluctuate, and you may have a gain or loss when you sell your shares. Current performance may differ from figures shown. Please visit franklintempleton.com or call (800) 342-5236 for most recent month-end performance.
We are pleased to bring you Franklin DynaTech Fund’s annual report for the fiscal year ended September 30, 2010.
Performance Overview
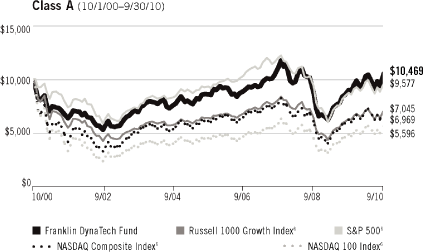
Franklin DynaTech Fund – Class A delivered a +17.07% cumulative total return for the 12 months under review. For the same period, the Fund out-performed the Russell 1000 Growth Index, which produced a +12.65% total return.1 The Fund performed comparably to the NASDAQ 100 Index, which posted a +16.23% total return.2 Also for comparison, the Fund out-performed the Standard & Poor’s 500 Index’s (S&P 500’s) +10.16% total return and the NASDAQ Composite Index’s +12.61% total return.3 The Russell 1000 Growth Index replaced the NASDAQ 100 Index as the Fund’s new broad benchmark because we believe the new benchmark better represents the Fund’s portfolio composition. You can find the Fund ’s long-term performance data in the Performance Summary beginning on page 8.
Investment Strategy
We use fundamental, bottom-up research to seek companies meeting our criteria of growth potential, quality and valuation. In seeking sustainable growth characteristics, we look for companies we believe can produce sustainable earnings and cash flow growth, evaluating the long-term market opportunity and competitive
| | |
| 1. | | Source: © 2010 Morningstar. All Rights Reserved. The information contained herein: (1) is proprietary to Morningstar and/or its content providers; (2) may not be copied or distributed; and (3) is not warranted to be accurate, complete or timely. Neither Morningstar nor its content providers are responsible for any damages or losses arising from any use of this information. The Russell 1000 Growth Index is market capitalization weighted and measures performance of those Russell 1000 Index companies with higher price-to-book ratios and higher forecasted growth values. The index return includes reinvested dividends. |
| | | |
| 2. | | Source: © 2010 Morningstar. The NASDAQ 100 Index is a modified market capitalization-weighted index of the largest and most active domestic and international non-financial companies listed on The NASDAQ Stock Market. The index reflects companies across major industry groups including computer hardware and software, telecommunications, retail/wholesale trade and biotechnology. Return for this index is price-only and does not include reinvested dividends. |
| | | |
| 3. | | Source: © 2010 Morningstar. The S&P 500 is a market capitalization-weighted index of 500 stocks designed to measure total U.S. equity market performance and includes reinvested dividends. The NASDAQ Composite Index is a broad-based, market capitalization-weighted index designed to measure all NASDAQ domestic and international based common type stocks listed on The NASDAQ Stock Market and includes reinvested dividends. |
The indexes are unmanaged. One cannot invest directly in an index, and an index is not representative of the Fund’s portfolio.
The dollar value, number of shares or principal amount, and names of all portfolio holdings are listed in the Fund’s Statement of Investments (SOI). The SOI begins on page 64.
Annual Report | 5
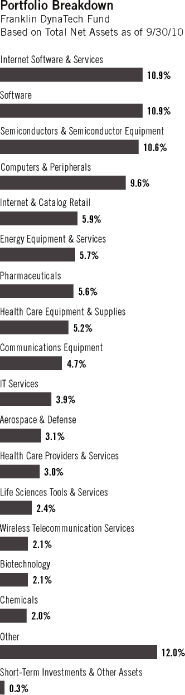
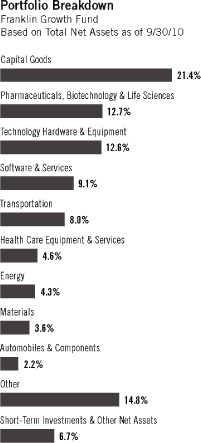
| Portfolio Breakdown Franklin DynaTech Fund Based on Total Net Assets as of 9/30/10 |
structure of an industry to target leaders and emerging leaders. We define quality companies as those with strong and improving competitive positions in attractive markets. We also believe important attributes of quality are experienced and talented management teams as well as financial strength reflected in the capital structure, gross and operating margins, free cash flow generation and returns on capital employed. Our valuation analysis includes a range of potential outcomes based on an assessment of multiple scenarios. In assessing value, we consider whether security prices fully reflect the balance of the sustainable growth opportunities relative to business and financial risks.
Manager’s Discussion
The information technology (IT) sector contributed significantly to Fund performance during the reporting period, driven by global demand for technology.4 A key contributor was Silicon Valley-based computers and peripherals industry leader Apple, which continued its pipeline of successful innovations. Apple’s release of the iPad tablet computer, selling over 4.19 million units in the past quarter, boosted the company’s value and benefited Fund performance. In September, Apple also announced the new, updated Apple TV, which allows viewers to watch high-definition movies and TV for a minimal cost. Another Silicon Valley-based IT company, Salesforce.com, was a leading contributor to the Fund. A software industry provider of applications for sales and customer services, Salesforce.com advanced as its business grew globally. China-bas ed Internet software and services industry company Baidu also helped Fund results. Baidu, a Chinese-language Internet search engine with more than 70% of the local search market, had strong second quarter results. In addition, semiconductor company ARM Holdings aided Fund performance. Based in the U.K., ARM Holdings manufactures chips that allow tasks to be processed simultaneously.
The Fund’s consumer discretionary sector holdings supported the Fund’s results.5 In particular, Priceline.com performed well over the 12-month period as its presence grew in Europe and cost-conscious consumers favored online travel sites. Priceline.com is an Internet and catalog retail industry company that helps users obtain discount rates for travel-related items such as airline tickets and hotel stays.
In contrast, several holdings detracted from Fund performance. Biotechnology company Gilead Sciences, in the health care sector, lost value and was sold during the period.6 Gilead makes products to treat infectious diseases including
| | |
| 4. | | The information technology sector comprises communications equipment; computers and peripherals; electronic equipment, instruments and components; Internet software and services; IT services; semiconductors and semiconductor equipment; and software in the SOI. |
| | | |
| 5. | | The consumer discretionary sector comprises diversified consumer services; hotels, restaurants and leisure; and Internet and catalog retail in the SOI. |
| | | |
| 6. | | The health care sector comprises biotechnology, health care equipment and supplies, health care providers and services, health care technology, life sciences tools and services, and pharmaceuticals in the SOI. |
6 | Annual Report
hepatitis, HIV and infections related to AIDS. The financials sector also hurt performance largely due to the Fund’s holding in global investment banking and securities firm The Goldman Sachs Group.7 Its share price declined amid investor concerns about federal inquires into the company’s business practices. While the IT sector overall benefited the Fund, some individual companies weighed on performance such as semiconductor company and chip designer Silicon Laboratories, Chinese search engine Sohu.com (sold by period-end) and wireless technology developer QUALCOMM.
As managers of Franklin DynaTech Fund, at period-end we were encouraged by the relative abundance of leading science and technology companies that we believe have strong long-term growth prospects trading at what we perceive to be attractive valuations. We believe it is these innovative, thought-leading companies that may promote economic advancement over the longer term.
Thank you for your continued participation in Franklin DynaTech Fund. We look forward to serving your future investment needs.
| | | |
| | |
 
Matthew J. Moberg, CPA | | |
| | | |
 
Rupert H. Johnson, Jr. | | |
| | | |
| Portfolio Management Team | | |
| Franklin DynaTech Fund | | |
The foregoing information reflects our analysis, opinions and portfolio holdings as of September 30, 2010, the end of the reporting period. The way we implement our main investment strategies and the resulting portfolio holdings may change depending on factors such as market and economic conditions. These opinions may not be relied upon as investment advice or an offer for a particular security. The information is not a complete analysis of every aspect of any market, country, industry, security or the Fund. Statements of fact are from sources considered reliable, but the investment manager makes no representation or warranty as to their completeness or accuracy. Although historical performance is no guarantee of future results, these insights may help you understand our investment management philosophy.
| | |
| 7. | | The financials sector comprises capital markets, commercial banks, consumer finance and diversified financial services in the SOI. |
Top 10 Holdings
Franklin DynaTech Fund
9/30/10
| | | | | |
| Company | | % of Total |
| Sector/Industry, Country | | Net Assets |
| |
| Apple Inc. | | | 7.6 | % |
Computers & Peripherals, U.S. | | | | |
| Google Inc., A | | | 3.8 | % |
Internet Software & Services, U.S. | | | | |
| Intel Corp. | | | 3.1 | % |
Semiconductors & Semiconductor Equipment, U.S. | | | | |
| Baidu Inc. | | | 3.0 | % |
Internet Software & Services, China | | | | |
| FMC Technologies Inc. | | | 3.0 | % |
Energy Equipment & Services, U.S. | | | | |
| Teva Pharmaceutical Industries Ltd., ADR | | | 2.7 | % |
Pharmaceuticals, Israel | | | | |
| ARM Holdings PLC | | | 2.4 | % |
Semiconductors & Semiconductor Equipment, U.K. | | | | |
| Salesforce.com Inc. | | | 2.4 | % |
Software, U.S. | | | | |
| Visa Inc., A | | | 2.4 | % |
IT Services, U.S. | | | | |
| Priceline.com Inc. | | | 2.4 | % |
Internet & Catalog Retail, U.S. | | | | |
Annual Report | 7
Performance Summary as of 9/30/10
Franklin DynaTech Fund
Your dividend income will vary depending on dividends or interest paid by securities in the Fund’s portfolio, adjusted for operating expenses of each class. Capital gain distributions are net profits realized from the sale of portfolio securities. The performance table and graphs do not reflect any taxes that a shareholder would pay on Fund dividends, capital gain distributions, if any, or any realized gains on the sale of Fund shares. Total return reflects reinvestment of the Fund’s dividends and capital gain distributions, if any, and any unrealized gains or losses.
Price Information
| | | | | | | | | | | | | |
| Class A (Symbol: FKDNX) | | Change | | 9/30/10 | | 9/30/09 |
| |
| Net Asset Value (NAV) | | | +$3.96 | | | $ | 27.16 | | | $ | 23.20 | |
| | | | | | | | | | | | | |
| Class B (Symbol: FDNBX) | | Change | | 9/30/10 | | 9/30/09 |
| |
| Net Asset Value (NAV) | | | +$3.50 | | | $ | 25.10 | | | $ | 21.60 | |
| | | | | | | | | | | | | |
| Class C (Symbol: FDYNX) | | Change | | 9/30/10 | | 9/30/09 |
| |
| Net Asset Value (NAV) | | | +$3.47 | | | $ | 24.81 | | | $ | 21.34 | |
| | | | | | | | | | | | | |
| Class R (Symbol: n/a) | | Change | | 9/30/10 | | 9/30/09 |
| |
| Net Asset Value (NAV) | | | +$3.89 | | | $ | 27.02 | | | $ | 23.13 | |
| | | | | | | | | | | | | |
| Advisor Class (Symbol: n/a) | | Change | | 9/30/10 | | 9/30/09 |
| |
| Net Asset Value (NAV) | | | +$4.05 | | | $ | 27.33 | | | $ | 23.28 | |
8 | Annual Report
Performance Summary (continued)
Performance
Cumulative total return excludes sales charges. Average annual total returns and value of $10,000 investment include maximum sales charges. Class A: 5.75% maximum initial sales charge; Class B: contingent deferred sales charge (CDSC) declining from 4% to 1% over six years, and eliminated thereafter; Class C: 1% CDSC in first year only; Class R/Advisor Class: no sales charges.
| | | | | | | | | | | | | | | | | |
| Class A | | | | | | 1-Year | | 5-Year | | 10-Year |
| |
Cumulative Total Return1 | | | | | | | +17.07 | % | | | +22.38 | % | | | +11.06 | % |
Average Annual Total Return2 | | | | | | | +10.32 | % | | | +2.90 | % | | | +0.46 | % |
Value of $10,000 Investment3 | | | | | | $ | 11,032 | | | $ | 11,536 | | | $ | 10,469 | |
Total Annual Operating Expenses4 | | | 1.18 | % | | | | | | | | | | | | |
| | | | | | | | | | | | | | | | | |
| Class B | | | | | | 1-Year | | 5-Year | | 10-Year |
| |
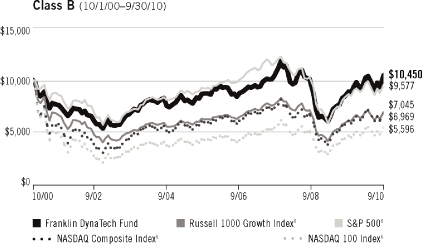
Cumulative Total Return1 | | | | | | | +16.20 | % | | | +17.84 | % | | | +4.50 | % |
Average Annual Total Return2 | | | | | | | +12.20 | % | | | +2.98 | % | | | +0.44 | % |
Value of $10,000 Investment3 | | | | | | $ | 11,220 | | | $ | 11,584 | | | $ | 10,450 | |
Total Annual Operating Expenses4 | | | 1.93 | % | | | | | | | | | | | | |
| | | | | | | | | | | | | | | | | |
| Class C | | | | | | 1-Year | | 5-Year | | 10-Year |
| |
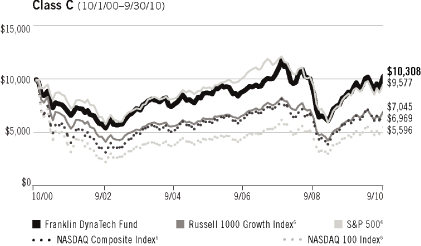
Cumulative Total Return1 | | | | | | | +16.26 | % | | | +17.86 | % | | | +3.08 | % |
Average Annual Total Return2 | | | | | | | +15.26 | % | | | +3.34 | % | | | +0.30 | % |
Value of $10,000 Investment3 | | | | | | $ | 11,526 | | | $ | 11,786 | | | $ | 10,308 | |
Total Annual Operating Expenses4 | | | 1.93 | % | | | | | | | | | | | | |
| | | | | | | | | | | | | | | | | |
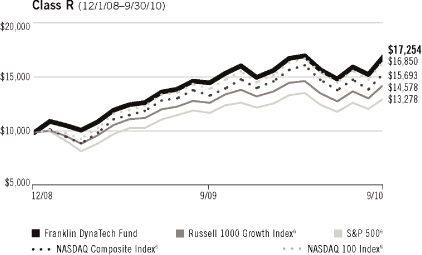
| Class R | | | | | | | | | | 1-Year | | Inception (12/1/08) |
| |
Cumulative Total Return1 | | | | | | | | | | | +16.82 | % | | | +72.54 | % |
Average Annual Total Return2 | | | | | | | | | | | +16.82 | % | | | +34.72 | % |
Value of $10,000 Investment3 | | | | | | | | | | $ | 11,682 | | | $ | 17,254 | |
Total Annual Operating Expenses4 | | | 1.43 | % | | | | | | | | | | | | |
| | | | | | | | | | | | | | | | | |
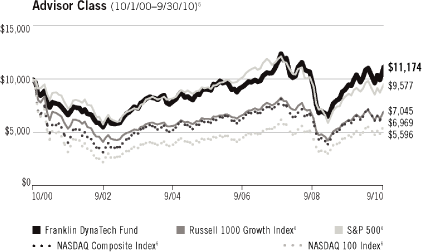
| Advisor Class5 | | | | | | 1-Year | | 5-Year | | 10-Year |
| |
Cumulative Total Return1 | | | | | | | +17.40 | % | | | +23.12 | % | | | +11.74 | % |
Average Annual Total Return2 | | | | | | | +17.40 | % | | | +4.25 | % | | | +1.12 | % |
Value of $10,000 Investment3 | | | | | | $ | 11,740 | | | $ | 12,312 | | | $ | 11,174 | |
Total Annual Operating Expenses4 | | | 0.93 | % | | | | | | | | | | | | |
Performance data represent past performance, which does not guarantee future results. Investment return and principal value will fluctuate, and you may have a gain or loss when you sell your shares. Current performance may differ from figures shown. For most recent month-end performance, go to franklintempleton.com or call (800) 342-5236.
Annual Report | 9
Performance Summary (continued)
Total Return Index Comparison for a Hypothetical $10,000 Investment
Total return represents the change in value of an investment over the periods shown. It includes any current, applicable, maximum sales charge, Fund expenses, account fees and reinvested distributions. The indexes are unmanaged. They differ from the Fund in composition and do not pay management fees or expenses. One cannot invest directly in an index.
Average Annual Total Return
| | | | | |
| Class A | | 9/30/10 |
| |
| 1-Year | | | +10.32 | % |
| 5-Year | | | +2.90 | % |
| 10-Year | | | +0.46 | % |
Average Annual Total Return
| | | | | |
| Class B | | 9/30/10 |
| |
| 1-Year | | | +12.20 | % |
| 5-Year | | | +2.98 | % |
| 10-Year | | | +0.44 | % |
10 | Annual Report
Performance Summary (continued)
Average Annual Total Return
| | | | | |
| Class C | | 9/30/10 |
| |
| 1-Year | | | +15.26 | % |
| 5-Year | | | +3.34 | % |
| 10-Year | | | +0.30 | % |
Aggregate Total Return
| | | | | |
| Class R | | 9/30/10 |
| |
| 1-Year | | | +16.82 | % |
| Since Inception (12/1/08) | | | +34.72 | % |
Annual Report | 11
Performance Summary (continued)
Average Annual Total Return
| | | | | |
| Advisor Class5 | | 9/30/10 |
| |
| 1-Year | | | +17.40 | % |
| 5-Year | | | +4.25 | % |
| 10-Year | | | +1.12 | % |
Endnotes
The Fund’s investments in fast-growing industries, including the technology and telecommunications sectors (which have historically been volatile) could result in increased price fluctuation, especially over the short term, due to the rapid pace of product change and development and changes in government regulation of companies emphasizing scientific or technological advancement. The Fund may also invest in small-capitalization companies, which can be particularly sensitive to changing economic conditions, and their prospects for growth are less certain than those of larger, more established companies. The Fund’s prospectus also includes a description of the main investment risks.
| | | |
| | |
Class B: | | These shares have higher annual fees and expenses than Class A shares. |
| | | |
Class C: | | Prior to 1/1/04, these shares were offered with an initial sales charge; thus actual total returns would have differed. These shares have higher annual fees and expenses than Class A shares. |
| | | |
Class R: | | Shares are available to certain eligible investors as described in the prospectus. These shares have higher annual fees and expenses than Class A shares. |
| | | |
Advisor Class: | | Shares are available to certain eligible investors as described in the prospectus. |
| | |
| 1. | | Cumulative total return represents the change in value of an investment over the periods indicated. |
| | | |
| 2. | | Average annual total return represents the average annual change in value of an investment over the periods indicated. |
| | | |
| 3. | | These figures represent the value of a hypothetical $10,000 investment in the Fund over the periods indicated. |
| | | |
| 4. | | Figures are as stated in the Fund’s prospectus current as of the date of this report. In periods of market volatility, assets may decline significantly, causing total annual Fund operating expenses to become higher than the figures shown. |
| | | |
| 5. | | Effective 5/15/08, the Fund began offering Advisor Class shares, which do not have sales charges or a Rule 12b-1 plan. Performance quotations for this class reflect the following methods of calculation: (a) For periods prior to 5/15/08, a restated figure is used based upon the Fund’s Class A performance, excluding the effect of Class A’s maximum initial sales charge, but reflecting the effect of the Class A Rule 12b-1 fees; and (b) for periods after 5/14/08 actual Advisor Class performance is used reflecting all charges and fees applicable to that class. Since 5/15/08 (commencement of sales), the cumulative and average annual total returns of Advisor Class shares were -4.18% and -1.78%. |
| | | |
| 6. | | Source: © 2010 Morningstar. The Russell 1000 Growth Index is market capitalization weighted and measures performance of those Russell 1000 Index companies with higher price-to-book ratios and higher forecasted growth values. The index return includes reinvested dividends. The NASDAQ 100 Index is a modified market capitalization-weighted index of the largest and most active domestic and international non-financial companies listed on The NASDAQ Stock Market. The index reflects companies across major industry groups including computer hardware and software, telecommunications, retail/wholesale trade and biotechnology. Return for this index is price-only and does not include reinvested dividends. The S&P 500 is a market capitalization-weighted index of 500 stocks designed to measure total U.S. equity market performance. Index return includes reinvested dividends. The NASDAQ Composite Index is a broad-based, market capitalization-weighted index designed to m easure all NASDAQ domestic and international based common type stocks listed on The NASDAQ Stock Market and includes reinvested dividends. |
12 | Annual Report
Your Fund’s Expenses
Franklin DynaTech Fund
As a Fund shareholder, you can incur two types of costs:
| • | | Transaction costs, including sales charges (loads) on Fund purchases; and |
| | | |
| • | | Ongoing Fund costs, including management fees, distribution and service (12b-1) fees, and other Fund expenses. All mutual funds have ongoing costs, sometimes referred to as operating expenses. |
The following table shows ongoing costs of investing in the Fund and can help you understand these costs and compare them with those of other mutual funds. The table assumes a $1,000 investment held for the six months indicated.
Actual Fund Expenses
The first line (Actual) for each share class listed in the table provides actual account values and expenses. The “Ending Account Value” is derived from the Fund’s actual return, which includes the effect of Fund expenses.
You can estimate the expenses you paid during the period by following these steps. Of course, your account value and expenses will differ from those in this illustration:
| 1. | | Divide your account value by $1,000. |
| | | |
| | | If an account had an $8,600 value, then $8,600 ÷ $1,000 = 8.6. |
| | | |
| 2. | | Multiply the result by the number under the heading “Expenses Paid During Period.” |
| | | |
| | | If Expenses Paid During Period were $7.50, then 8.6 x $7.50 = $64.50. |
In this illustration, the estimated expenses paid this period are $64.50.
Hypothetical Example for Comparison with Other Funds
Information in the second line (Hypothetical) for each class in the table can help you compare ongoing costs of investing in the Fund with those of other mutual funds. This information may not be used to estimate the actual ending account balance or expenses you paid during the period. The hypothetical “Ending Account Value” is based on the actual expense ratio for each class and an assumed 5% annual rate of return before expenses, which does not represent the Fund’s actual return. The figure under the heading “Expenses Paid During Period” shows the hypothetical expenses your account would have incurred under this scenario. You can compare this figure with the 5% hypothetical examples that appear in shareholder reports of other funds.
Annual Report | 13
Your Fund’s Expenses (continued)
Please note that expenses shown in the table are meant to highlight ongoing costs and do not reflect any transaction costs, such as sales charges. Therefore, the second line for each class is useful in comparing ongoing costs only, and will not help you compare total costs of owning different funds. In addition, if transaction costs were included, your total costs would have been higher. Please refer to the Fund prospectus for additional information on operating expenses.
| | | | | | | | | | | | | |
| | | Beginning Account | | Ending Account | | Expenses Paid During |
| | | Value 4/1/10 | | Value 9/30/10 | | Period* 4/1/10–9/30/10 |
| |
Class A | | | | | | | | | | | | |
| Actual | | $ | 1,000 | | | $ | 1,022.60 | | | $ | 4.82 | |
| Hypothetical (5% return before expenses) | | $ | 1,000 | | | $ | 1,020.31 | | | $ | 4.81 | |
Class B | | | | | | | | | | | | |
| Actual | | $ | 1,000 | | | $ | 1,018.70 | | | $ | 8.55 | |
| Hypothetical (5% return before expenses) | | $ | 1,000 | | | $ | 1,016.60 | | | $ | 8.54 | |
Class C | | | | | | | | | | | | |
| Actual | | $ | 1,000 | | | $ | 1,018.90 | | | $ | 8.60 | |
| Hypothetical (5% return before expenses) | | $ | 1,000 | | | $ | 1,016.55 | | | $ | 8.59 | |
Class R | | | | | | | | | | | | |
| Actual | | $ | 1,000 | | | $ | 1,021.60 | | | $ | 6.08 | |
| Hypothetical (5% return before expenses) | | $ | 1,000 | | | $ | 1,019.05 | | | $ | 6.07 | |
Advisor Class | | | | | | | | | | | | |
| Actual | | $ | 1,000 | | | $ | 1,024.00 | | | $ | 3.55 | |
| Hypothetical (5% return before expenses) | | $ | 1,000 | | | $ | 1,021.56 | | | $ | 3.55 | |
| | |
| * | | Expenses are calculated using the most recent six-month expense ratio, annualized for each class (A: 0.95%; B: 1.69%; C: 1.70%; R: 1.20%; and Advisor: 0.70%), multiplied by the average account value over the period, multiplied by 183/365 to reflect the one-half year period. |
14 | Annual Report
Franklin Growth Fund
Your Fund’s Goal and Main Investments: Franklin Growth Fund seeks capital appreciation by investing substantially in equity securities of companies that are leaders in their industries.
Performance data represent past performance, which does not guarantee future results. Investment return and principal value will fluctuate, and you may have a gain or loss when you sell your shares. Current performance may differ from figures shown. Please visit franklintempleton.com or call (800) 342-5236 for most recent month-end performance.
We are pleased to bring you Franklin Growth Fund’s annual report for the fiscal year ended September 30, 2010.
Performance Overview
Franklin Growth Fund – Class A delivered a +13.52% cumulative total return for the 12 months under review. The Fund outperformed its benchmark, the Standard & Poor’s 500 Index (S&P 500), which posted a +10.16% total return for the same period.1 You can find the Fund’s long-term performance data in the Performance Summary beginning on page 18.
Investment Strategy
We use fundamental, bottom-up research to seek companies meeting our criteria of growth potential, quality and valuation. In seeking sustainable growth characteristics, we look for companies we believe can produce sustainable earnings and cash flow growth, evaluating the long-term market opportunity and competitive structure of an industry to target leaders and emerging leaders. We define quality companies as those with strong and improving competitive positions in attractive markets. We also believe important attributes of quality are experienced and talented management teams as well as financial strength reflected in the capital structure, gross and operating margins, free cash flow generation and returns on capital employed. Our valuation analysis includes a range of potential outcomes based on an assessment of multiple scenarios. In assessing value, we consider whether security prices fully reflect the b alance of the sustainable growth opportunities relative to business and financial risks.
| | |
| 1. | | Source: © 2010 Morningstar. All Rights Reserved. The information contained herein: (1) is proprietary to Morningstar and/or its content providers; (2) may not be copied or distributed; and (3) is not warranted to be accurate, complete or timely. Neither Morningstar nor its content providers are responsible for any damages or losses arising from any use of this information. The S&P 500 is a market capitalization-weighted index of 500 stocks designed to measure total U.S. equity market performance. The index is unmanaged and includes reinvested dividends. One cannot invest directly in an index, and an index is not representative of the Fund’s portfolio. |
The dollar value, number of shares or principal amount, and names of all portfolio holdings are listed in the Fund’s Statement of Investments (SOI). The SOI begins on page 72.
Annual Report | 15
| Portfolio Breakdown Franklin Growth Fund Based on Total Net Assets as of 9/30/10 |
Manager’s Discussion
Franklin Growth Fund owned shares of 151 companies at period-end. We continue to invest in a broad array of companies of all sizes and in varied industries.
During the 12 months under review, every sector represented in the Fund posted positive results with most individual holdings gaining in value. In terms of contribution to Fund performance, leading sectors included industrials, information technology and health care.2 Within industrials, notable contributors included aerospace and defense contractor Boeing, railroad operator Union Pacific, facilities maintenance products and services company W. W. Grainger, and diversified global technology company Emerson Electric. Among information technology investments, computer hardware and electronic devices maker Apple was a significant contributor, as was information technology services and software provider International Business Machines. Health care sector holdings Millipore (sold by period-end) and Waters, which each make a variety of testing and pr ocessing products for the biotechnology and pharmaceuticals industries, helped performance. In addition, Allergan, a leading manufacturer of eye care, skin care and aesthetic products, boosted results.
The Fund had some individual detractors from performance. Information technology holdings Research In Motion, which makes the BlackBerry smart-phone, Internet services provider Yahoo! and technology company Computer Sciences hindered results. Biotechnology company Amgen in the health care sector, and industrials sector holding AMR, parent company of American Airlines, also hurt results. We sold AMR by period-end.
| | |
| 2. | | The industrials sector comprises capital goods, commercial and professional services, and transportation in the SOI. The information technology sector comprises semiconductors and semiconductor equipment, software and services, and technology hardware and equipment in the SOI. The health care sector comprises health care equipment and services; and pharmaceuticals, biotechnology and life sciences in the SOI. |
16 | Annual Report
Thank you for your continued participation in Franklin Growth Fund. We look forward to serving your future investment needs.
| | | |
| | |
 
V. Jerry Palmieri | | |
| | | |
 
Serena Perin Vinton, CFA | | |
| | | |
| Portfolio Management Team | | |
| Franklin Growth Fund | | |
CFA® is a trademark owned by CFA Institute.
The foregoing information reflects our analysis, opinions and portfolio holdings as of September 30, 2010, the end of the reporting period. The way we implement our main investment strategies and the resulting portfolio holdings may change depending on factors such as market and economic conditions. These opinions may not be relied upon as investment advice or an offer for a particular security. The information is not a complete analysis of every aspect of any market, country, industry, security or the Fund. Statements of fact are from sources considered reliable, but the investment manager makes no representation or warranty as to their completeness or accuracy. Although historical performance is no guarantee of future results, these insights may help you understand our investment management philosophy.
Top 10 Holdings
Franklin Growth Fund
9/30/10
| | | | | |
| Company | | % of Total |
| Sector/Industry | | Net Assets |
| |
| Apple Inc. | | | 6.3 | % |
Technology Hardware & Equipment | | | | |
| International Business Machines Corp. | | | 2.1 | % |
Software & Services | | | | |
| 3M Co. | | | 2.0 | % |
Capital Goods | | | | |
| Johnson & Johnson | | | 2.0 | % |
Pharmaceuticals, Biotechnology & Life Sciences | | | | |
| The Boeing Co. | | | 1.9 | % |
Capital Goods | | | | |
| W. W. Grainger Inc. | | | 1.8 | % |
Capital Goods | | | | |
| Allergan Inc. | | | 1.7 | % |
Pharmaceuticals, Biotechnology & Life Sciences | | | | |
| General Dynamics Corp. | | | 1.7 | % |
Capital Goods | | | | |
| Northrop Grumman Corp. | | | 1.7 | % |
Capital Goods | | | | |
| United Technologies Corp. | | | 1.7 | % |
Capital Goods | | | | |
Annual Report | 17
Performance Summary as of 9/30/10
Franklin Growth Fund
Your dividend income will vary depending on dividends or interest paid by securities in the Fund’s portfolio, adjusted for operating expenses of each class. Capital gain distributions are net profits realized from the sale of portfolio securities. The performance table and graphs do not reflect any taxes that a shareholder would pay on Fund dividends, capital gain distributions, if any, or any realized gains on the sale of Fund shares. Total return reflects reinvestment of the Fund’s dividends and capital gain distributions, if any, and any unrealized gains or losses.
Price and Distribution Information
| | | | | | | | | | | | | | | | | |
| Class A (Symbol: FKGRX) | | | | | | Change | | 9/30/10 | | 9/30/09 |
| |
| Net Asset Value (NAV) | | | | | | | +$4.63 | | | $ | 41.11 | | | $ | 36.48 | |
Distributions (10/1/09–9/30/10) | | | | | | | | | | | | | | | | |
| Dividend Income | | $ | 0.2820 | | | | | | | | | | | | | |
| | | | | | | | | | | | | | | | | |
| Class B (Symbol: FKGBX) | | | | | | Change | | 9/30/10 | | 9/30/09 |
| |
| Net Asset Value (NAV) | | | | | | | +$4.41 | | | $ | 39.34 | | | $ | 34.93 | |
Distributions (10/1/09–9/30/10) | | | | | | | | | | | | | | | | |
| Dividend Income | | $ | 0.0257 | | | | | | | | | | | | | |
| | | | | | | | | | | | | | | | | |
| Class C (Symbol: FRGSX) | | | | | | Change | | 9/30/10 | | 9/30/09 |
| |
| Net Asset Value (NAV) | | | | | | | +$4.31 | | | $ | 38.92 | | | $ | 34.61 | |
Distributions (10/1/09–9/30/10) | | | | | | | | | | | | | | | | |
| Dividend Income | | $ | 0.0672 | | | | | | | | | | | | | |
| | | | | | | | | | | | | | | | | |
| Class R (Symbol: FGSRX) | | | | | | Change | | 9/30/10 | | 9/30/09 |
| |
| Net Asset Value (NAV) | | | | | | | +$4.57 | | | $ | 40.94 | | | $ | 36.37 | |
Distributions (10/1/09–9/30/10) | | | | | | | | | | | | | | | | |
| Dividend Income | | $ | 0.2255 | | | | | | | | | | | | | |
| | | | | | | | | | | | | | | | | |
| Advisor Class (Symbol: FCGAX) | | | | | | Change | | 9/30/10 | | 9/30/09 |
| |
| Net Asset Value (NAV) | | | | | | | +$4.65 | | | $ | 41.18 | | | $ | 36.53 | |
Distributions (10/1/09–9/30/10) | | | | | | | | | | | | | | | | |
| Dividend Income | | $ | 0.3576 | | | | | | | | | | | | | |
18 | Annual Report
Performance Summary (continued)
Performance
Cumulative total return excludes sales charges. Average annual total return and value of $10,000 investment include maximum sales charges. Class A: 5.75% maximum initial sales charge; Class B: contingent deferred sales charge (CDSC) declining from 4% to 1% over six years, and eliminated thereafter; Class C: 1% CDSC in first year only; Class R/Advisor Class: no sales charges.
| | | | | | | | | | | | | | | | | |
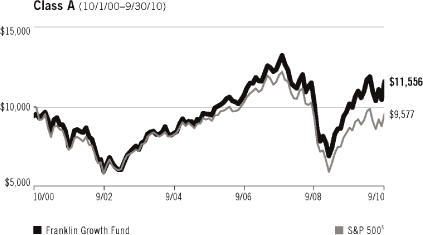
| Class A | | | | | | 1-Year | | 5-Year | | 10-Year |
| |
Cumulative Total Return1 | | | | | | | +13.52 | % | | | +21.16 | % | | | +22.60 | % |
Average Annual Total Return2 | | | | | | | +6.98 | % | | | +2.69 | % | | | +1.46 | % |
Value of $10,000 Investment3 | | | | | | $ | 10,698 | | | $ | 11,421 | | | $ | 11,556 | |
Total Annual Operating Expenses4 | | | 1.00 | % | | | | | | | | | | | | |
| | | | | | | | | | | | | | | | | |
| Class B | | | | | | 1-Year | | 5-Year | | 10-Year |
| |
Cumulative Total Return1 | | | | | | | +12.70 | % | | | +16.71 | % | | | +15.48 | % |
Average Annual Total Return2 | | | | | | | +8.70 | % | | | +2.78 | % | | | +1.45 | % |
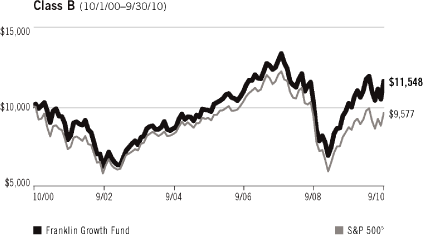
Value of $10,000 Investment3 | | | | | | $ | 10,870 | | | $ | 11,471 | | | $ | 11,548 | |
Total Annual Operating Expenses4 | | | 1.75 | % | | | | | | | | | | | | |
| | | | | | | | | | | | | | | | | |
| Class C | | | | | | 1-Year | | 5-Year | | 10-Year |
| |
Cumulative Total Return1 | | | | | | | +12.69 | % | | | +16.71 | % | | | +13.75 | % |
Average Annual Total Return2 | | | | | | | +11.69 | % | | | +3.14 | % | | | +1.30 | % |
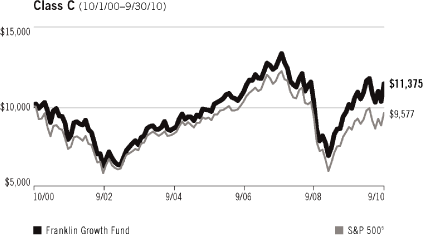
Value of $10,000 Investment3 | | | | | | $ | 11,169 | | | $ | 11,671 | | | $ | 11,375 | |
Total Annual Operating Expenses4 | | | 1.75 | % | | | | | | | | | | | | |
| | | | | | | | | | | | | | | | | |
| Class R | | | | | | 1-Year | | 5-Year | | Inception (1/1/02) |
| |
Cumulative Total Return1 | | | | | | | +13.26 | % | | | +19.66 | % | | | +31.36 | % |
Average Annual Total Return2 | | | | | | | +13.26 | % | | | +3.65 | % | | | +3.17 | % |
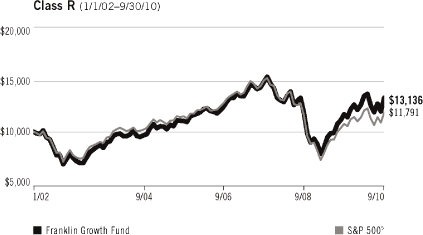
Value of $10,000 Investment3 | | | | | | $ | 11,326 | | | $ | 11,966 | | | $ | 13,136 | |
Total Annual Operating Expenses4 | | | 1.25 | % | | | | | | | | | | | | |
| | | | | | | | | | | | | | | | | |
| Advisor Class | | | | | | 1-Year | | 5-Year | | 10-Year |
| |
Cumulative Total Return1 | | | | | | | +13.82 | % | | | +22.68 | % | | | +25.66 | % |
Average Annual Total Return2 | | | | | | | +13.82 | % | | | +4.17 | % | | | +2.31 | % |
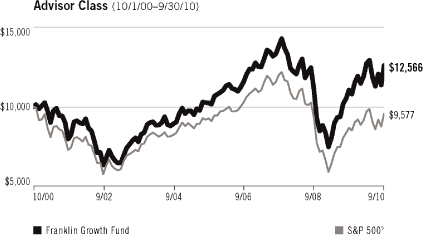
Value of $10,000 Investment3 | | | | | | $ | 11,382 | | | $ | 12,268 | | | $ | 12,566 | |
Total Annual Operating Expenses4 | | | 0.75 | % | | | | | | | | | | | | |
Performance data represent past performance, which does not guarantee future results. Investment return and principal value will fluctuate, and you may have a gain or loss when you sell your shares. Current performance may differ from figures shown. For most recent month-end performance, go to franklintempleton.com or call (800) 342-5236.
Annual Report | 19
Performance Summary (continued)
Total Return Index Comparison for a Hypothetical $10,000 Investment
Total return represents the change in value of an investment over the periods shown. It includes any current, applicable, maximum sales charge, Fund expenses, account fees and reinvested distributions. The unmanaged index includes reinvestment of any income or distributions. It differs from the Fund in composition and does not pay management fees or expenses. One cannot invest directly in an index.
Average Annual Total Return
| | | | | |
| Class A | | 9/30/10 |
| |
| 1-Year | | | +6.98 | % |
| 5-Year | | | +2.69 | % |
| 10-Year | | | +1.46 | % |
Average Annual Total Return
| | | | | |
| Class B | | 9/30/10 |
| |
| 1-Year | | | +8.70 | % |
| 5-Year | | | +2.78 | % |
| 10-Year | | | +1.45 | % |
20 | Annual Report
Performance Summary (continued)
Average Annual Total Return
| | | | | |
| Class C | | 9/30/10 |
| |
| 1-Year | | | +11.69 | % |
| 5-Year | | | +3.14 | % |
| 10-Year | | | +1.30 | % |
Average Annual Total Return
| | | | | |
| Class R | | 9/30/10 |
| |
| 1-Year | | | +13.26 | % |
| 5-Year | | | +3.65 | % |
| Since Inception (1/1/02) | | | +3.17 | % |
Annual Report | 21
Performance Summary (continued)
Average Annual Total Return
| | | | | |
| Advisor Class | | 9/30/10 |
| |
| 1-Year | | | +13.82 | % |
| 5-Year | | | +4.17 | % |
| 10-Year | | | +2.31 | % |
Endnotes
Historically, the Fund has focused on larger companies. The Fund may also invest in small, relatively new and/or unseasoned companies, which involves additional risks, as the price of these securities can be volatile, particularly over the short term. In addition, the Fund may invest up to 40% of its net assets in stocks of foreign companies, which involve special risks, including currency fluctuations and economic as well as political uncertainty. The portfolio includes investments in the technology sector, which has been one of the most volatile sectors of the market. The Fund’s prospectus also includes a description of the main investment risks.
| | | |
| | |
Class B: | | These shares have higher annual fees and expenses than Class A shares. |
| | | |
Class C: | | Prior to 1/1/04, these shares were offered with an initial sales charge; thus actual total returns would have differed. These shares have higher annual fees and expenses than Class A shares. |
| | | |
Class R: | | Shares are available to certain eligible investors as described in the prospectus. These shares have higher annual fees and expenses than Class A shares. |
| | | |
Advisor Class: | | Shares are available to certain eligible investors as described in the prospectus. |
| | |
| 1. | | Cumulative total return represents the change in value of an investment over the periods indicated. |
| | | |
| 2. | | Average annual total return represents the average annual change in value of an investment over the periods indicated. |
| | | |
| 3. | | These figures represent the value of a hypothetical $10,000 investment in the Fund over the periods indicated. |
| | | |
| 4. | | Figures are as stated in the Fund’s prospectus current as of the date of this report. In periods of market volatility, assets may decline significantly, causing total annual Fund operating expenses to become higher than the figures shown. |
| | | |
| 5. | | Source: © 2010 Morningstar. The S&P 500 is a market capitalization-weighted index of 500 stocks designed to measure total U.S. equity market performance. |
22 | Annual Report
Your Fund’s Expenses
Franklin Growth Fund
As a Fund shareholder, you can incur two types of costs:
| • | | Transaction costs, including sales charges (loads) on Fund purchases; and |
| | | |
| • | | Ongoing Fund costs, including management fees, distribution and service (12b-1) fees, and other Fund expenses. All mutual funds have ongoing costs, sometimes referred to as operating expenses. |
The following table shows ongoing costs of investing in the Fund and can help you understand these costs and compare them with those of other mutual funds. The table assumes a $1,000 investment held for the six months indicated.
Actual Fund Expenses
The first line (Actual) for each share class listed in the table provides actual account values and expenses. The “Ending Account Value” is derived from the Fund’s actual return, which includes the effect of Fund expenses.
You can estimate the expenses you paid during the period by following these steps. Of course, your account value and expenses will differ from those in this illustration:
| 1. | | Divide your account value by $1,000. |
| | | |
| | | If an account had an $8,600 value, then $8,600 ÷ $1,000 = 8.6. |
| | | |
| 2. | | Multiply the result by the number under the heading “Expenses Paid During Period.” |
| | | |
| | | If Expenses Paid During Period were $7.50, then 8.6 x $7.50 = $64.50. |
In this illustration, the estimated expenses paid this period are $64.50.
Hypothetical Example for Comparison with Other Funds
Information in the second line (Hypothetical) for each class in the table can help you compare ongoing costs of investing in the Fund with those of other mutual funds. This information may not be used to estimate the actual ending account balance or expenses you paid during the period. The hypothetical “Ending Account Value” is based on the actual expense ratio for each class and an assumed 5% annual rate of return before expenses, which does not represent the Fund’s actual return. The figure under the heading “Expenses Paid During Period” shows the hypothetical expenses your account would have incurred under this scenario. You can compare this figure with the 5% hypothetical examples that appear in shareholder reports of other funds.
Annual Report | 23
Your Fund’s Expenses (continued)
Please note that expenses shown in the table are meant to highlight ongoing costs and do not reflect any transaction costs, such as sales charges. Therefore, the second line for each class is useful in comparing ongoing costs only, and will not help you compare total costs of owning different funds. In addition, if transaction costs were included, your total costs would have been higher. Please refer to the Fund prospectus for additional information on operating expenses.
| | | | | | | | | | | | | |
| | | Beginning Account | | Ending Account | | Expenses Paid During |
| | | Value 4/1/10 | | Value 9/30/10 | | Period* 4/1/10–9/30/10 |
| |
Class A | | | | | | | | | | | | |
| Actual | | $ | 1,000 | | | $ | 988.70 | | | $ | 4.49 | |
| Hypothetical (5% return before expenses) | | $ | 1,000 | | | $ | 1,020.56 | | | $ | 4.56 | |
Class B | | | | | | | | | | | | |
| Actual | | $ | 1,000 | | | $ | 985.00 | | | $ | 8.26 | |
| Hypothetical (5% return before expenses) | | $ | 1,000 | | | $ | 1,016.75 | | | $ | 8.39 | |
Class C | | | | | | | | | | | | |
| Actual | | $ | 1,000 | | | $ | 984.80 | | | $ | 8.21 | |
| Hypothetical (5% return before expenses) | | $ | 1,000 | | | $ | 1,016.80 | | | $ | 8.34 | |
Class R | | | | | | | | | | | | |
| Actual | | $ | 1,000 | | | $ | 987.50 | | | $ | 5.73 | |
| Hypothetical (5% return before expenses) | | $ | 1,000 | | | $ | 1,019.30 | | | $ | 5.82 | |
Advisor Class | | | | | | | | | | | | |
| Actual | | $ | 1,000 | | | $ | 989.90 | | | $ | 3.24 | |
| Hypothetical (5% return before expenses) | | $ | 1,000 | | | $ | 1,021.81 | | | $ | 3.29 | |
| | |
| * | | Expenses are calculated using the most recent six-month expense ratio, annualized for each class (A: 0.90%; B: 1.66%; C: 1.65%; R: 1.15%; and Advisor: 0.65%), multiplied by the average account value over the period, multiplied by 183/365 to reflect the one-half year period. |
24 | Annual Report
Franklin Income Fund
Your Fund’s Goal and Main Investments: Franklin Income Fund seeks to maximize income while maintaining prospects for capital appreciation by investing, under normal market conditions, in a diversified portfolio of debt and equity securities.
Performance data represent past performance, which does not guarantee future results. Investment return and principal value will fluctuate, and you may have a gain or loss when you sell your shares. Current performance may differ from figures shown. Please visit franklintempleton.com or call (800) 342-5236 for most recent month-end performance.
We are pleased to bring you Franklin Income Fund’s annual report for the fiscal year ended September 30, 2010.
Performance Overview
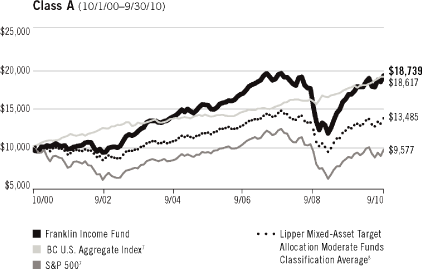
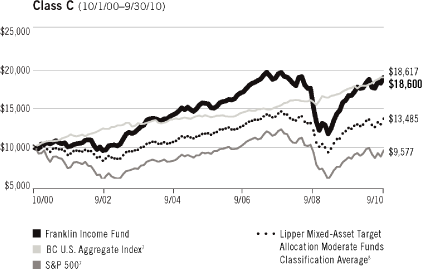
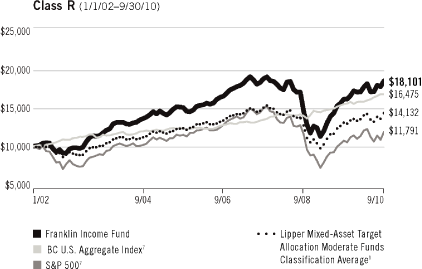
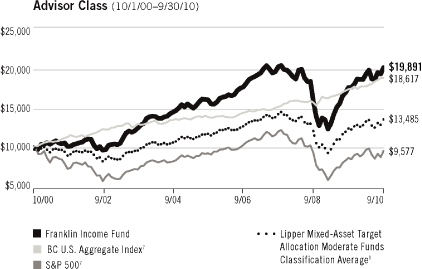
Franklin Income Fund – Class A posted a +13.90% cumulative total return for the 12 months under review. The Fund outperformed its equity benchmark, the Standard & Poor’s 500 Index (S&P 500), which delivered a +10.16% total return; outperformed its fixed income benchmark, the Barclays Capital (BC) U.S. Aggregate Index, which returned +8.16%; and outperformed its peers as measured by the Lipper Mixed-Asset Target Allocation Moderate Funds Classification Average, which produced a +9.26% total return, for the same period.1 You can find the Fund’s long-term performance data in the Performance Summary beginning on page 29.
Investment Strategy
By generally performing independent analysis of debt, convertible and equity securities, we search for undervalued or out-of-favor securities we believe offer opportunities for income today and significant growth tomorrow. We consider
| 1. | | Source: © 2010 Morningstar. All Rights Reserved. The information contained herein: (1) is proprietary to Morningstar and/or its content providers; (2) may not be copied or distributed; and (3) is not warranted to be accurate, complete or timely. Neither Morningstar nor its content providers are responsible for any damages or losses arising from any use of this information. The S&P 500 is a market capitalization-weighted index of 500 stocks designed to measure total U.S. equity market performance. The BC U.S. Aggregate Index is a market capitalization-weighted index representing the U.S. investment-grade, fixed-rate, taxable bond market with index components for government and corporate, mortgage pass-through and asset-backed securities. All issues included are SEC registered, taxable, dollar denominated and nonconvertible, must have at least one year to final maturity and must be rated investment grade (Baa3/BBB-/BBB-or higher) using the m iddle rating of Moody’s, Standard & Poor’s and Fitch, respectively. |
Source: Lipper Inc. The Lipper Mixed-Asset Target Allocation Moderate Funds Classification Average is calculated by averaging the total returns of all funds within the Lipper Mixed-Asset Target Allocation Moderate Funds classification in the Lipper Open-End underlying funds universe. Lipper Mixed-Asset Target Allocation Moderate Funds are defined as funds that, by portfolio practice, maintain a mix of between 40%-60% equity securities, with the remainder invested in bonds, cash and cash equivalents. For the 12-month period ended 9/30/10, there were 500 funds in this category. Lipper calculations do not include sales charges or expense subsidization by a fund’s manager. The Fund’s performance relative to the average may have differed if these and other factors had been considered.
The indexes are unmanaged and include reinvestment of any income or distributions. One cannot invest directly in an index, and an index is not representative of the Fund’s portfolio.
The dollar value, number of shares or principal amount, and names of all portfolio holdings are listed in the Fund’s Statement of Investments (SOI). The SOI begins on page 83.
Annual Report | 25
Dividend Distributions*
Franklin Income Fund
10/1/09–9/30/10
| | | | | | | | | | | | | | | | | | | | | | | | | |
| | | Dividend per Share (cents) |
| Month | | Class A | | Class B | | Class B1** | | Class C | | Class R | | Advisor Class |
| |
| October | | | 1.25 | | | | 1.10 | | | | 1.16 | | | | 1.17 | | | | 1.19 | | | | 1.27 | |
| November | | | 1.25 | | | | 1.10 | | | | 1.16 | | | | 1.17 | | | | 1.19 | | | | 1.27 | |
| December | | | 1.25 | | | | 1.11 | | | | 1.13 | | | | 1.16 | | | | 1.19 | | | | 1.28 | |
| January | | | 1.25 | | | | 1.11 | | | | 1.13 | | | | 1.16 | | | | 1.19 | | | | 1.28 | |
| February | | | 1.20 | | | | 1.06 | | | | 1.08 | | | | 1.11 | | | | 1.14 | | | | 1.23 | |
| March | | | 1.20 | | | | 1.05 | | | | 1.08 | | | | 1.11 | | | | 1.14 | | | | 1.23 | |
| April | | | 1.20 | | | | 1.05 | | | | 1.08 | | | | 1.11 | | | | 1.14 | | | | 1.23 | |
| May | | | 1.20 | | | | 1.05 | | | | 1.08 | | | | 1.11 | | | | 1.14 | | | | 1.23 | |
| June | | | 1.20 | | | | 1.05 | | | | 1.11 | | | | 1.11 | | | | 1.13 | | | | 1.22 | |
| July | | | 1.20 | | | | 1.05 | | | | 1.11 | | | | 1.11 | | | | 1.13 | | | | 1.22 | |
| August | | | 1.20 | | | | 1.05 | | | | 1.11 | | | | 1.11 | | | | 1.13 | | | | 1.22 | |
| September | | | 1.20 | | | | 1.06 | | | | 1.12 | | | | 1.12 | | | | 1.15 | | | | 1.22 | |
| |
Total | | | 14.60 | | | | 12.84 | | | | 13.35 | | | | 13.55 | | | | 13.86 | | | | 14.90 | |
| | |
| * | | All Fund distributions will vary depending upon current market conditions, and past distributions are not indicative of future trends. |
| | | |
| ** | | On November 1, 2001, the Fund closed Class B to new investors and changed the name to Class B1; a new Class B became available to investors. |
such factors as a company’s experience and managerial strength; its responsiveness to changes in interest rates and business conditions; debt maturity schedules and borrowing requirements; a company’s changing financial condition and market recognition of the change; and a security’s relative value based on such factors as anticipated cash flow, interest or dividend coverage, asset coverage and earnings.
Manager’s Discussion
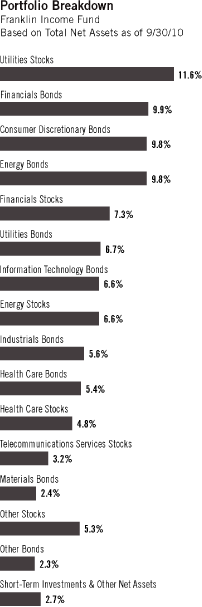
At the start of the period, the Fund’s overall asset allocation favored fixed income securities and reflected our view of the attractive relative valuations that came out of the 2008 financial crisis. We began the period with 66.4% of total net assets in fixed income securities, 30.5% in equity securities and 3.1% in short-term investments and other net assets (cash). As we found opportunities for profit taking in fixed income, particularly in corporate debt securities trading at significant premiums to par value, the Fund’s asset allocation became more balanced and ended the period at 58.5% of total net assets in fixed income securities, 38.8% in equity securities and 2.7% in cash.
26 | Annual Report
During the period under review, the Fund’s strong performance was driven by a combination of strong gains from stock and corporate bond holdings. Stock holdings that performed well included high-dividend-paying companies such as telecommunications service provider Verizon Communications, integrated energy company ConocoPhillips and electric utility The Southern Co. The Fund’s corporate bond holdings, including investment-grade and high yield bonds, benefited from lower corporate credit spreads as well as lower overall long-term interest rates. Yield spreads over Treasuries for investment-grade corporate bonds declined from 218 basis points (bps; 100 basis points equal one percentage point) to 175 bps and spreads for high yield corporate bonds declined from 764 bps to 620 bps.2
Within fixed income, strong contributors to performance included Ford Motor Credit Co. (FMCC), Freescale Semiconductor, JPMorgan Chase & Co. and Chesapeake Energy. FMCC, a wholly owned subsidiary of Ford Motor Company, provides dealer and customer financing. FMCC’s strong fundamental performance during the reporting period and improved access to funding markets prompted independent credit rating agency Moody’s Investors Service to upgrade the holding’s rating from Caa1 at the start of the year to Ba2 at period-end. Freescale Semiconductor, a global leader in the design and manufacture of embedded semiconductors for the automobile, consumer, industrial and networking markets, benefited from improved demand for the company’s products and access to capital markets that enabled the company to extend its upcoming debt maturities and put a more stable capital structure in place. Despite con tinued economic uncertainty and the impact of financial regulatory reform on banks, the junior debt securities of financial services firm JPMorgan Chase & Co. performed well as overall interest rates trended lower. Although natural gas prices weakened during the period, our holding in independent natural gas producer Chesapeake Energy benefited from access to capital through convertible preferred stock offerings and joint venture agreements. This activity enabled the company to selectively repay debts and improved the company’s overall credit profile.
Although corporate bonds generally supported Fund performance during the period, the Fund had several detractors including power generation company Dynegy Holdings. This holding’s performance suffered after Dynegy agreed to be acquired in a leveraged buyout by The Blackstone Group.
2. Sources: Barclays Capital; Credit Suisse.
| Portfolio Breakdown Franklin Income Fund Based on Total Net Assets as of 9/30/10 |
Annual Report | 27
Top 5 Equity Holdings
Franklin Income Fund
9/30/10
| | | | | |
| Company | | % of Total |
| Sector/Industry | | Net Assets |
| |
| Bank of America Corp. | | | 2.1 | % |
Financials | | | | |
| Wells Fargo & Co. | | | 1.8 | % |
Financials | | | | |
| Exxon Mobil Corp. | | | 1.8 | % |
Energy | | | | |
| Merck & Co. Inc. | | | 1.7 | % |
Health Care | | | | |
| The Southern Co. | | | 1.4 | % |
Utilities | | | | |
Top 5 Bond Holdings*
Franklin Income Fund
9/30/10
| | | | | |
| Company | | % of Total |
| Sector/Industry | | Net Assets |
| |
| Texas Competitive Electric Holdings Co. LLC | | | 3.8 | % |
Utilities | | | | |
| CIT Group Inc. | | | 3.8 | % |
Financials | | | | |
| First Data Corp. | | | 2.9 | % |
Information Technology | | | | |
| Freescale Semiconductor Inc. | | | 2.3 | % |
Information Technology | | | | |
| HCA Inc. | | | 2.2 | % |
Health Care | | | | |
| | |
| * | | Does not include convertible bonds. |
Although select dividend-paying sectors and stocks drove strong Fund performance during the reporting period, some sectors negatively impacted results. Common stock holdings in the financials sector, including JPMorgan Chase & Co. and Wells Fargo & Co. detracted from results, mainly due to investors’ fears of renewed economic downturn, heightened regulatory risk and financial sector reform. Despite these challenges, we continue to believe the major banks are well positioned with strong market positions that should enable them to build reserves in excess of regulatory requirements.
We continue to stay focused on opportunities across the capital structure to help us meet the Fund’s investment objective of maximizing income while maintaining prospects for long-term capital appreciation from a wide range of securities including fixed income, equity and convertible securities.
Thank you for your continued participation in Franklin Income Fund. We look forward to serving your future investment needs.
| | | |
| | |
 
Edward Perks, CFA | | |
| | | |
 
Charles B. Johnson | | |
| | | |
| Portfolio Management Team | | |
| Franklin Income Fund | | |
The foregoing information reflects our analysis, opinions and portfolio holdings as of September 30, 2010, the end of the reporting period. The way we implement our main investment strategies and the resulting portfolio holdings may change depending on factors such as market and economic conditions. These opinions may not be relied upon as investment advice or an offer for a particular security. The information is not a complete analysis of every aspect of any market, country, industry, security or the Fund. Statements of fact are from sources considered reliable, but the investment manager makes no representation or warranty as to their completeness or accuracy. Although historical performance is no guarantee of future results, these insights may help you understand our investment management philosophy.
28 | Annual Report
Performance Summary as of 9/30/10
Franklin Income Fund
Your dividend income will vary depending on dividends or interest paid by securities in the Fund’s portfolio, adjusted for operating expenses of each class. Capital gain distributions are net profits realized from the sale of portfolio securities. The performance table and graphs do not reflect any taxes that a shareholder would pay on Fund dividends, capital gain distributions, if any, or any realized gains on the sale of Fund shares. Total return reflects reinvestment of the Fund’s dividends and capital gain distributions, if any, and any unrealized gains or losses.
Price and Distribution Information
| | | | | | | | | | | | | | | | | |
| Class A (Symbol: FKINX) | | | | | | Change | | 9/30/10 | | 9/30/09 |
| |
| Net Asset Value (NAV) | | | | | | | +$0.12 | | | $ | 2.11 | | | $ | 1.99 | |
Distributions (10/1/09–9/30/10) | | | | | | | | | | | | | | | | |
| Dividend Income | | $ | 0.1460 | | | | | | | | | | | | | |
| | | | | | | | | | | | | | | | | |
| Class B (Symbol: FBICX) | | | | | | Change | | 9/30/10 | | 9/30/09 |
| |
| Net Asset Value (NAV) | | | | | | | +$0.12 | | | $ | 2.10 | | | $ | 1.98 | |
Distributions (10/1/09–9/30/10) | | | | | | | | | | | | | | | | |
| Dividend Income | | $ | 0.1284 | | | | | | | | | | | | | |
| | | | | | | | | | | | | | | | | |
| Class B1 (Symbol: FICBX) | | | | | | Change | | 9/30/10 | | 9/30/09 |
| |
| Net Asset Value (NAV) | | | | | | | +$0.13 | | | $ | 2.12 | | | $ | 1.99 | |
Distributions (10/1/09–9/30/10) | | | | | | | | | | | | | | | | |
| Dividend Income | | $ | 0.1335 | | | | | | | | | | | | | |
| | | | | | | | | | | | | | | | | |
| Class C (Symbol: FCISX) | | | | | | Change | | 9/30/10 | | 9/30/09 |
| |
| Net Asset Value (NAV) | | | | | | | +$0.13 | | | $ | 2.13 | | | $ | 2.00 | |
Distributions (10/1/09–9/30/10) | | | | | | | | | | | | | | | | |
| Dividend Income | | $ | 0.1355 | | | | | | | | | | | | | |
| | | | | | | | | | | | | | | | | |
| Class R (Symbol: FISRX) | | | | | | Change | | 9/30/10 | | 9/30/09 |
| |
| Net Asset Value (NAV) | | | | | | | +$0.13 | | | $ | 2.09 | | | $ | 1.96 | |
Distributions (10/1/09–9/30/10) | | | | | | | | | | | | | | | | |
| Dividend Income | | $ | 0.1386 | | | | | | | | | | | | | |
| | | | | | | | | | | | | | | | | |
| Advisor Class (Symbol: FRIAX) | | | | | | Change | | 9/30/10 | | 9/30/09 |
| |
| Net Asset Value (NAV) | | | | | | | +$0.12 | | | $ | 2.10 | | | $ | 1.98 | |
Distributions (10/1/09–9/30/10) | | | | | | | | | | | | | | | | |
| Dividend Income | | $ | 0.1490 | | | | | | | | | | | | | |
Annual Report | 29
Performance Summary (continued)
Performance
Cumulative total return excludes sales charges. Average annual total return and value of $10,000 investment include maximum sales charges. Class A: 4.25% maximum initial sales charge; Class B/B1: contingent deferred sales charge (CDSC) declining from 4% to 1% over six years, and eliminated thereafter; Class C: 1% CDSC in first year only; Class R/Advisor Class: no sales charges.
| | | | | | | | | | | | | | | | | |
| Class A | | | | | | 1-Year | | 5-Year | | 10-Year |
| |
Cumulative Total Return1 | | | | | | | +13.90 | % | | | +24.03 | % | | | +95.36 | % |
Average Annual Total Return2 | | | | | | | +8.97 | % | | | +3.51 | % | | | +6.48 | % |
Value of $10,000 Investment3 | | | | | | $ | 10,897 | | | $ | 11,880 | | | $ | 18,739 | |
Distribution Rate4 | | | 6.55 | % | | | | | | | | | | | | |
30-Day Standardized Yield5 | | | 6.02 | % | | | | | | | | | | | | |
Total Annual Operating Expenses6 | | | 0.68 | % | | | | | | | | | | | | |
| | | | | | | | | | | | | | | | | |
| Class B | | | | | | 1-Year | | 5-Year | | Inception (11/1/01) |
| |
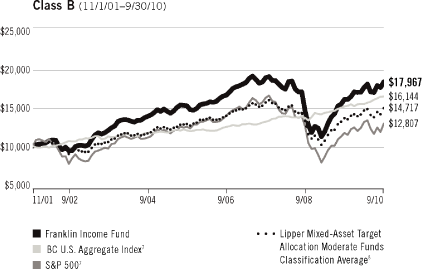
Cumulative Total Return1 | | | | | | | +12.99 | % | | | +18.93 | % | | | +79.67 | % |
Average Annual Total Return2 | | | | | | | +8.99 | % | | | +3.23 | % | | | +6.80 | % |
Value of $10,000 Investment3 | | | | | | $ | 10,899 | | | $ | 11,725 | | | $ | 17,967 | |
Distribution Rate4 | | | 6.06 | % | | | | | | | | | | | | |
30-Day Standardized Yield5 | | | 5.43 | % | | | | | | | | | | | | |
Total Annual Operating Expenses6 | | | 1.53 | % | | | | | | | | | | | | |
| | | | | | | | | | | | | | | | | |
| Class B1 | | | | | | 1-Year | | 5-Year | | 10-Year |
| |
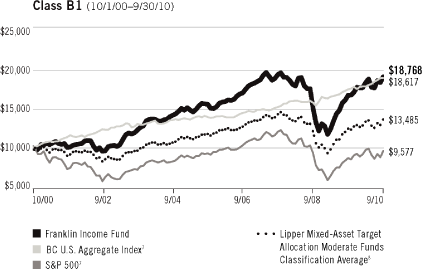
Cumulative Total Return1 | | | | | | | +13.73 | % | | | +21.37 | % | | | +87.68 | % |
Average Annual Total Return2 | | | | | | | +9.73 | % | | | +3.66 | % | | | +6.50 | % |
Value of $10,000 Investment3 | | | | | | $ | 10,973 | | | $ | 11,968 | | | $ | 18,768 | |
Distribution Rate4 | | | 6.34 | % | | | | | | | | | | | | |
30-Day Standardized Yield5 | | | 5.80 | % | | | | | | | | | | | | |
Total Annual Operating Expenses6 | | | 1.17 | % | | | | | | | | | | | | |
| | | | | | | | | | | | | | | | | |
| Class C | | | | | | 1-Year | | 5-Year | | 10-Year |
| |
Cumulative Total Return1 | | | | | | | +13.76 | % | | | +21.30 | % | | | +86.00 | % |
Average Annual Total Return2 | | | | | | | +12.76 | % | | | +3.94 | % | | | +6.40 | % |
Value of $10,000 Investment3 | | | | | | $ | 11,276 | | | $ | 12,130 | | | $ | 18,600 | |
Distribution Rate4 | | | 6.31 | % | | | | | | | | | | | | |
30-Day Standardized Yield5 | | | 5.78 | % | | | | | | | | | | | | |
Total Annual Operating Expenses6 | | | 1.18 | % | | | | | | | | | | | | |
30 | Annual Report
Performance Summary (continued)
Performance (continued)
| | | | | | | | | | | | | | | | | |
| Class R | | | | | | 1-Year | | 5-Year | | Inception (1/1/02) |
| |
Cumulative Total Return1 | | | | | | | +14.23 | % | | | +22.18 | % | | | +81.01 | % |
Average Annual Total Return2 | | | | | | | +14.23 | % | | | +4.09 | % | | | +7.02 | % |
Value of $10,000 Investment3 | | | | | | $ | 11,423 | | | $ | 12,218 | | | $ | 18,101 | |
Distribution Rate4 | | | 6.60 | % | | | | | | | | | | | | |
30-Day Standardized Yield5 | | | 5.92 | % | | | | | | | | | | | | |
Total Annual Operating Expenses6 | | | 1.03 | % | | | | | | | | | | | | |
| | | | | | | | | | | | | | | | | |
| Advisor Class | | | | | | 1-Year | | 5-Year | | 10-Year |
| |
Cumulative Total Return1 | | | | | | | +14.15 | % | | | +25.09 | % | | | +98.91 | % |
Average Annual Total Return2 | | | | | | | +14.15 | % | | | +4.58 | % | | | +7.12 | % |
Value of $10,000 Investment3 | | | | | | $ | 11,415 | | | $ | 12,509 | | | $ | 19,891 | |
Distribution Rate4 | | | 6.97 | % | | | | | | | | | | | | |
30-Day Standardized Yield5 | | | 6.43 | % | | | | | | | | | | | | |
Total Annual Operating Expenses6 | | | 0.53 | % | | | | | | | | | | | | |
Performance data represent past performance, which does not guarantee future results. Investment return and principal value will fluctuate, and you may have a gain or loss when you sell your shares. Current performance may differ from figures shown. For most recent month-end performance, go to franklintempleton.com or call (800) 342-5236.
Annual Report | 31
Performance Summary (continued)
Total Return Index Comparison for a Hypothetical $10,000 Investment
Total return represents the change in value of an investment over the periods shown. It includes any current, applicable, maximum sales charge, Fund expenses, account fees and reinvested distributions. The unmanaged indexes include reinvestment of any income or distributions. They differ from the Fund in composition and do not pay management fees or expenses. One cannot invest directly in an index.
Average Annual Total Return
| | | | | |
| Class A | | 9/30/10 |
| |
| 1-Year | | | +8.97 | % |
| 5-Year | | | +3.51 | % |
| 10-Year | | | +6.48 | % |
Average Annual Total Return
| | | | | |
| Class B | | 9/30/10 |
| |
| 1-Year | | | +8.99 | % |
| 5-Year | | | +3.23 | % |
| Since Inception (11/1/01) | | | +6.80 | % |
32 | Annual Report
Performance Summary (continued)
Average Annual Total Return
| | | | | |
| Class B1 | | 9/30/10 |
| |
| 1-Year | | | +9.73 | % |
| 5-Year | | | +3.66 | % |
| 10-Year | | | +6.50 | % |
Average Annual Total Return
| | | | | |
| Class C | | 9/30/10 |
| |
| 1-Year | | | +12.76 | % |
| 5-Year | | | +3.94 | % |
| 10-Year | | | +6.40 | % |
Annual Report | 33
Performance Summary (continued)
Average Annual Total Return
| | | | | |
| Class R | | 9/30/10 |
| |
| 1-Year | | | +14.23 | % |
| 5-Year | | | +4.09 | % |
| Since Inception (1/1/02) | | | +7.02 | % |
Average Annual Total Return
| | | | | |
| Advisor Class | | 9/30/10 |
| |
| 1-Year | | | +14.15 | % |
| 5-Year | | | +4.58 | % |
| 10-Year | | | +7.12 | % |
34 | Annual Report
Performance Summary (continued)
Endnotes
The Fund’s portfolio includes a substantial portion of higher yielding, lower rated corporate bonds because of the relatively higher yields they offer. These securities carry a greater degree of credit risk relative to investment-grade securities. The Fund’s share price and yield will be affected by interest rate movements. Bond prices generally move in the opposite direction of interest rates. Thus, as prices of bonds in the Fund adjust to a rise in interest rates, the Fund’s share price may decline. While stocks have historically outperformed other asset classes over the long term, they tend to fluctuate more dramatically over the shorter term. The Fund’s prospectus also includes a description of the main investment risks.
| | | |
| | |
Class B: | | These shares have higher annual fees and expenses than Class A shares. |
| | | |
Class B1
(formerly Class B): | |
These shares have higher annual fees and expenses than Class A shares. Effective 11/1/01, closed to new investors. |
| | | |
Class C: | | Prior to 1/1/04, these shares were offered with an initial sales charge; thus actual total returns would have differed. These shares have higher annual fees and expenses than Class A shares. |
| | | |
Class R: | | Shares are available to certain eligible investors as described in the prospectus. These shares have higher annual fees and expenses than Class A shares. |
| | | |
Advisor Class: | | Shares are available to certain eligible investors as described in the prospectus. |
| 1. | | Cumulative total return represents the change in value of an investment over the periods indicated. |
| 2. | | Average annual total return represents the average annual change in value of an investment over the periods indicated. |
| 3. | | These figures represent the value of a hypothetical $10,000 investment in the Fund over the periods indicated. |
| 4. | | Distribution rate is based on an annualization of the respective class’s September dividend and the maximum offering price (NAV for Classes B, B1, C, R and Advisor) per share on 9/30/10. |
| 5. | | The 30-day standardized yield for the 30 days ended 9/30/10 reflects an estimated yield to maturity (assuming all portfolio securities are held to maturity). It should be regarded as an estimate of the Fund’s rate of investment income, and it may not equal the Fund’s actual income distribution rate (which reflects the Fund’s past dividends paid to shareholders) or the income reported in the Fund’s financial statements. |
| 6. | | Figures are as stated in the Fund’s prospectus current as of the date of this report. In periods of market volatility, assets may decline significantly, causing total annual Fund operating expenses to become higher than the figures shown. |
| 7. | | Source: © 2010 Morningstar. The S&P 500 is a market capitalization-weighted index of 500 stocks designed to measure total U.S. equity market performance. The BC U.S. Aggregate Index is a market capitalization-weighted index representing the U.S. investment-grade, fixed-rate, taxable bond market with index components for government and corporate, mortgage pass-through and asset-backed securities. All issues included are SEC registered, taxable, dollar denominated and nonconvertible, must have at least one year to final maturity and must be rated investment grade (Baa3/BBB-/BBB- or higher) using the middle rating of Moody’s, Standard & Poor’s and Fitch, respectively. |
| 8. | | Source: Lipper, Inc. The Lipper Mixed-Asset Target Allocation Moderate Funds Classification Average is calculated by averaging the total returns of all funds within the Lipper Mixed-Asset Target Allocation Moderate Funds classification in the Lipper Open-End underlying funds universe. Lipper Mixed-Asset Target Allocation Moderate Funds are defined as funds that, by portfolio practice, maintain a mix of between 40%-60% equity securities, with the remainder invested in bonds, cash and cash equivalents. For the 12-month period ended 9/30/10, there were 500 funds in this category. Lipper calculations do not include sales charges or expense subsidization by a fund’s manager. The Fund’s performance relative to the average may have differed if these and other factors had been considered. |
Annual Report | 35
Your Fund’s Expenses
Franklin Income Fund
As a Fund shareholder, you can incur two types of costs:
| • | | Transaction costs, including sales charges (loads) on Fund purchases; and |
| • | | Ongoing Fund costs, including management fees, distribution and service (12b-1) fees, and other Fund expenses. All mutual funds have ongoing costs, sometimes referred to as operating expenses. |
The following table shows ongoing costs of investing in the Fund and can help you understand these costs and compare them with those of other mutual funds. The table assumes a $1,000 investment held for the six months indicated.
Actual Fund Expenses
The first line (Actual) for each share class listed in the table provides actual account values and expenses. The “Ending Account Value” is derived from the Fund’s actual return, which includes the effect of Fund expenses.
You can estimate the expenses you paid during the period by following these steps. Of course, your account value and expenses will differ from those in this illustration:
| 1. | | Divide your account value by $1,000. |
| | | |
| | | If an account had an $8,600 value, then $8,600 ÷ $1,000 = 8.6. |
| | | |
| 2. | | Multiply the result by the number under the heading “Expenses Paid During Period.” |
| | | |
| | | If Expenses Paid During Period were $7.50, then 8.6 x $7.50 = $64.50. |
In this illustration, the estimated expenses paid this period are $64.50.
Hypothetical Example for Comparison with Other Funds
Information in the second line (Hypothetical) for each class in the table can help you compare ongoing costs of investing in the Fund with those of other mutual funds. This information may not be used to estimate the actual ending account balance or expenses you paid during the period. The hypothetical “Ending Account Value” is based on the actual expense ratio for each class and an assumed 5% annual rate of return before expenses, which does not represent the Fund’s actual return. The figure under the heading “Expenses Paid During Period” shows the hypothetical expenses your account would have incurred under this scenario. You can compare this figure with the 5% hypothetical examples that appear in shareholder reports of other funds.
36 | Annual Report
Your Fund’s Expenses (continued)
Please note that expenses shown in the table are meant to highlight ongoing costs and do not reflect any transaction costs, such as sales charges. Therefore, the second line for each class is useful in comparing ongoing costs only, and will not help you compare total costs of owning different funds. In addition, if transaction costs were included, your total costs would have been higher. Please refer to the Fund prospectus for additional information on operating expenses.
| | | | | | | | | | | | | |
| | | Beginning Account | | Ending Account | | Expenses Paid During |
| | | Value 4/1/10 | | Value 9/30/10 | | Period* 4/1/10–9/30/10 |
| |
| Class A | | | | | | | | | | | | |
| Actual | | $ | 1,000 | | | $ | 1,040.50 | | | $ | 3.32 | |
| Hypothetical (5% return before expenses) | | $ | 1,000 | | | $ | 1,021.81 | | | $ | 3.29 | |
Class B | | | | | | | | | | | | |
| Actual | | $ | 1,000 | | | $ | 1,036.20 | | | $ | 7.66 | |
| Hypothetical (5% return before expenses) | | $ | 1,000 | | | $ | 1,017.55 | | | $ | 7.59 | |
Class B1 | | | | | | | | | | | | |
| Actual | | $ | 1,000 | | | $ | 1,042.40 | | | $ | 5.84 | |
| Hypothetical (5% return before expenses) | | $ | 1,000 | | | $ | 1,019.35 | | | $ | 5.77 | |
Class C | | | | | | | | | | | | |
| Actual | | $ | 1,000 | | | $ | 1,037.60 | | | $ | 5.87 | |
| Hypothetical (5% return before expenses) | | $ | 1,000 | | | $ | 1,019.30 | | | $ | 5.82 | |
Class R | | | | | | | | | | | | |
| Actual | | $ | 1,000 | | | $ | 1,044.10 | | | $ | 5.12 | |
| Hypothetical (5% return before expenses) | | $ | 1,000 | | | $ | 1,020.05 | | | $ | 5.06 | |
Advisor Class | | | | | | | | | | | | |
| Actual | | $ | 1,000 | | | $ | 1,041.50 | | | $ | 2.56 | |
| Hypothetical (5% return before expenses) | | $ | 1,000 | | | $ | 1,022.56 | | | $ | 2.54 | |
| | |
| * | | Expenses are calculated using the most recent six-month expense ratio, annualized for each class (A: 0.65%; B: 1.50%; B1: 1.14%; C: 1.15%; R: 1.00%; and Advisor: 0.50%), multiplied by the average account value over the period, multiplied by 183/365 to reflect the one-half year period. |
Annual Report | 37
Franklin U.S. Government Securities Fund
Your Fund’s Goal and Main Investments: Franklin U.S. Government Securities Fund seeks income by investing at least 80% of its net assets in U.S. government securities. The Fund presently invests substantially all of its assets in Government National Mortgage Association obligations (Ginnie Maes).
Since 1983, the Fund has invested substantially in Ginnie Mae securities, which carry a guarantee backed by the full faith and credit of the U.S. government as to the timely payment of interest and principal.1 Issued by the Government National Mortgage Association (GNMA), Ginnie Maes have been among the highest yielding U.S. government obligations available.
Performance data represent past performance, which does not guarantee future results. Investment return and principal value will fluctuate, and you may have a gain or loss when you sell your shares. Current performance may differ from figures shown. Please visit franklintempleton.com or call (800) 342-5236 for most recent month-end performance.
This annual report for Franklin U.S. Government Securities Fund covers the fiscal year ended September 30, 2010.
Performance Overview
Franklin U.S. Government Securities Fund – Class A posted a cumulative total return of +5.94% for the 12 months under review. The Fund underperformed the +6.62% total return of its peers as measured by the Lipper GNMA Funds Classification Average.2 In comparison, the Barclays Capital (BC) U.S. Government: Intermediate Index returned +6.19% for the same period.3 The Fund’s return reflects the effect of management fees and expenses, while the BC U.S. Government: Intermediate Index does not have such costs. You can find the Fund’s long-term performance data in the Performance Summary beginning on page 42.
| 1. | | Securities owned by the Fund, but not shares of the Fund, are guaranteed by the U.S. government, its agencies or instrumentalities as to timely payment of principal and interest. The Fund’s yield and share price are not guaranteed and will vary with market conditions. |
| 2. | | Source: Lipper Inc. The Lipper GNMA Funds Classification Average is calculated by averaging the total return for all funds within the Lipper GNMA Funds classification in the Lipper Open-End underlying funds universe for the period indicated. Lipper GNMA Funds are defined as funds that invest primarily in GNMA securities. For the 12-month period ended 9/30/10, there were 66 funds in this category. Lipper calculations do not include sales charges or expense subsidization by a fund’s manager. The Fund’s performance relative to the average may have differed if these or other factors had been considered. |
| 3. | | Source: © 2010 Morningstar. All Rights Reserved. The information contained herein: (1) is proprietary to Morningstar and/or its content providers; (2) may not be copied or distributed; and (3) is not warranted to be accurate, complete or timely. Neither Morningstar nor its content providers are responsible for any damages or losses arising from any use of this information. The BC U.S. Government: Intermediate Index is the intermediate component of the BC U.S. Government Index, which includes public obligations of the U.S. Treasury with at least one year to final maturity and publicly issued debt of U.S. government agencies, quasi-federal corporations, and corporate or foreign debt guaranteed by the U.S. government. |
The indexes are unmanaged and include reinvestment of any income or distributions. One cannot invest directly in an index, and an index is not representative of the Fund’s portfolio.
The dollar value, number of shares or principal amount, and names of all portfolio holdings are listed in the Fund’s Statement of Investments (SOI). The SOI begins on page 102.
38 | Annual Report
Dividend Distributions*
Franklin U.S. Government Securities Fund
10/1/09–9/30/10
| | | | | | | | | | | | | | | | | | | | | |
| | | Dividend per Share |
| Month | | Class A | | Class B | | Class C | | Class R | | Advisor Class |
| |
| October | | 2.39 cents | | 2.10 cents | | 2.13 cents | | 2.20 cents | | 2.47 cents |
| November | | 2.39 cents | | 2.10 cents | | 2.13 cents | | 2.20 cents | | 2.47 cents |
| December | | 2.21 cents | | 1.92 cents | | 1.92 cents | | 2.00 cents | | 2.29 cents |
| January | | 2.21 cents | | 1.92 cents | | 1.92 cents | | 2.00 cents | | 2.29 cents |
| February | | 2.21 cents | | 1.92 cents | | 1.92 cents | | 2.00 cents | | 2.29 cents |
| March | | 2.21 cents | | 1.91 cents | | 1.93 cents | | 2.00 cents | | 2.28 cents |
| April | | 2.21 cents | | 1.91 cents | | 1.93 cents | | 2.00 cents | | 2.28 cents |
| May | | 2.21 cents | | 1.91 cents | | 1.93 cents | | 2.00 cents | | 2.28 cents |
| June | | 2.21 cents | | 1.92 cents | | 1.93 cents | | 2.00 cents | | 2.28 cents |
| July | | 2.21 cents | | 1.92 cents | | 1.93 cents | | 2.00 cents | | 2.28 cents |
| August | | 2.21 cents | | 1.92 cents | | 1.93 cents | | 2.00 cents | | 2.28 cents |
| September | | 2.21 cents | | 1.91 cents | | 1.93 cents | | 2.01 cents | | 2.30 cents |
| |
Total | | 26.88 cents | | 23.36 cents | | 23.53 cents | | 24.41 cents | | 27.79 cents |
| | |
| * | | All Fund distributions will vary depending upon current market conditions, and past distributions are not indicative of future trends. |
Investment Strategy
We currently invest the Fund’s assets predominantly in GNMA (Ginnie Mae) obligations. We analyze securities using proprietary models to help us identify attractive investment opportunities. The Fund’s short-term investments may include short-term government securities and cash or cash equivalents.
Manager’s Discussion
During the first half of the 12-month reporting period, the economy gradually improved as financial systems seemed to stabilize and U.S. gross domestic product growth rates were positive. The economy also experienced other indicators of growth, including a manufacturing rebound, productivity gains and a potential bottoming in the housing market. However, markets fluctuated throughout the second half of the period as signs of economic strength dissipated and a stubbornly high unemployment level and below-trend growth rates persisted. Although the continued subdued inflationary environment kept concerns over potential interest rate increases at bay, we remained cautious about longer term U.S. prospects due to record fiscal deficits and low current yields.
Annual Report | 39
Ginnie Mae (GNMA) mortgage-backed securities (MBS) remained relatively attractive in this environment as the GNMA current coupon yielded 3.22% at period-end, an attractive income opportunity over both 5- and 10-year Treasuries, which yielded 1.26% and 2.53%.
The Federal Reserve Board’s Agency MBS Purchase Program continued to support the mortgage sector until it expired in March 2010. The conclusion of this program had a limited impact on the MBS market, as existing demand levels absorbed low mortgage issuance activity. Despite historically low interest rates, prepayment risk for higher coupon MBS remained relatively contained as home price depreciation, loss of home equity and tighter underwriting standards continued to inhibit mortgage holders’ ability to refinance their homes.
During the period, GNMA MBS outperformed their conventional Fannie Mae (FNMA) and Freddie Mac (FHLMC) MBS counterparts. Within the sector, higher coupon GNMAs (6.0% and 6.5%) were the best performers, while lower- and mid-coupon (4.5% and 5.0%) GNMAs lagged. GNMA I securities (comprising single-issuer pools) outperformed GNMA II securities (comprising multiple-issuer pools) in 5.5% and 6.0% coupons. We slightly decreased the Fund’s allocation to GNMA II securities, as we felt GNMA Is offered better value on a historical price spread basis. We increased the portfolio’s allocation to some lower coupon MBS (4.5%). Our heaviest allocation was in 5.0% through 6.0% coupon securities.
Franklin U.S. Government Securities Fund takes a consistent and disciplined approach to our investment strategy and invests entirely in Ginnie Mae mortgage pass-throughs, which remained the only MBS backed by the full faith and credit of the U.S. government.1 The Fund takes a collateral-intensive research approach to uncover opportunities across the GNMA universe. We believe our experience and continual investment in new technologies can help us identify specified pools and individual securities that offer strong cash flow fundamentals and valuations.
40 | Annual Report
Thank you for your continued participation in Franklin U.S. Government Securities Fund. We welcome your comments and questions and look forward to serving your investment needs in the years ahead.
Roger A. Bayston, CFA
Paul Varunok
Portfolio Management Team
Franklin U.S. Government Securities Fund
The foregoing information reflects our analysis, opinions and portfolio holdings as of September 30, 2010, the end of the reporting period. The way we implement our main investment strategies and the resulting portfolio holdings may change depending on factors such as market and economic conditions. These opinions may not be relied upon as investment advice or an offer for a particular security. The information is not a complete analysis of every aspect of any market, country, industry, security or the Fund. Statements of fact are from sources considered reliable, but the investment manager makes no representation or warranty as to their completeness or accuracy. Although historical performance is no guarantee of future results, these insights may help you understand our investment management philosophy.
Annual Report | 41
Performance Summary as of 9/30/10
Franklin U.S. Government Securities Fund
Your dividend income will vary depending on dividends or interest paid by securities in the Fund’s portfolio, adjusted for operating expenses of each class. Capital gain distributions are net profits realized from the sale of portfolio securities. The performance table and graphs do not reflect any taxes that a shareholder would pay on Fund dividends, capital gain distributions, if any, or any realized gains on the sale of Fund shares. Total return reflects reinvestment of the Fund’s dividends and capital gain distributions, if any, and any unrealized gains or losses.
Price and Distribution Information
| | | | | | | | | | | | | | | | | |
| Class A (Symbol: FKUSX) | | | | | | Change | | 9/30/10 | | 9/30/09 |
| |
| Net Asset Value (NAV) | | | | | | | +$0.12 | | | $ | 6.81 | | | $ | 6.69 | |
Distributions (10/1/09–9/30/10) | | | | | | | | | | | | | | | | |
| Dividend Income | | $ | 0.2688 | | | | | | | | | | | | | |
| | | | | | | | | | | | | | | | | |
| Class B (Symbol: FUGBX) | | | | | | Change | | 9/30/10 | | 9/30/09 |
| |
| Net Asset Value (NAV) | | | | | | | +$0.12 | | | $ | 6.80 | | | $ | 6.68 | |
Distributions (10/1/09–9/30/10) | | | | | | | | | | | | | | | | |
| Dividend Income | | $ | 0.2336 | | | | | | | | | | | | | |
| | | | | | | | | | | | | | | | | |
| Class C (Symbol: FRUGX) | | | | | | Change | | 9/30/10 | | 9/30/09 |
| |
| Net Asset Value (NAV) | | | | | | | +$0.11 | | | $ | 6.77 | | | $ | 6.66 | |
Distributions (10/1/09–9/30/10) | | | | | | | | | | | | | | | | |
| Dividend Income | | $ | 0.2353 | | | | | | | | | | | | | |
| | | | | | | | | | | | | | | | | |
| Class R (Symbol: FUSRX) | | | | | | Change | | 9/30/10 | | 9/30/09 |
| |
| Net Asset Value (NAV) | | | | | | | +$0.12 | | | $ | 6.81 | | | $ | 6.69 | |
Distributions (10/1/09–9/30/10) | | | | | | | | | | | | | | | | |
| Dividend Income | | $ | 0.2441 | | | | | | | | | | | | | |
| | | | | | | | | | | | | | | | | |
| Advisor Class (Symbol: FUSAX) | | | | | | Change | | 9/30/10 | | 9/30/09 |
| |
| Net Asset Value (NAV) | | | | | | | +$0.12 | | | $ | 6.83 | | | $ | 6.71 | |
Distributions (10/1/09–9/30/10) | | | | | | | | | | | | | | | | |
| Dividend Income | | $ | 0.2779 | | | | | | | | | | | | | |
42 | Annual Report
Performance Summary (continued)
Performance
Cumulative total return excludes sales charges. Average annual total return includes maximum sales charges. Class A: 4.25% maximum initial sales charge; Class B: contingent deferred sales charge (CDSC) declining from 4% to 1% over six years, and eliminated thereafter; Class C: 1% CDSC in first year only; Class R/Advisor Class: no sales charges.
| | | | | | | | | | | | | | | | | |
| Class A | | | | | | 1-Year | | 5-Year | | 10-Year |
| |
Cumulative Total Return1 | | | | | | | +5.94 | % | | | +31.82 | % | | | +71.63 | % |
Average Annual Total Return2 | | | | | | | +1.39 | % | | | +4.77 | % | | | +5.10 | % |
Distribution Rate3 | | | 3.73 | % | | | | | | | | | | | | |
30-Day Standardized Yield4 | | | 3.38 | % | | | | | | | | | | | | |
Total Annual Operating Expenses5 | | | 0.75 | % | | | | | | | | | | | | |
| | | | | | | | | | | | | | | | | |
| Class B | | | | | | 1-Year | | 5-Year | | 10-Year |
| |
Cumulative Total Return1 | | | | | | | +5.39 | % | | | +28.49 | % | | | +64.68 | % |
Average Annual Total Return2 | | | | | | | +1.39 | % | | | +4.81 | % | | | +5.11 | % |
Distribution Rate3 | | | 3.37 | % | | | | | | | | | | | | |
30-Day Standardized Yield4 | | | 3.04 | % | | | | | | | | | | | | |
Total Annual Operating Expenses5 | | | 1.26 | % | | | | | | | | | | | | |
| | | | | | | | | | | | | | | | | |
| Class C | | | | | | 1-Year | | 5-Year | | 10-Year |
| |
Cumulative Total Return1 | | | | | | | +5.28 | % | | | +28.48 | % | | | +62.84 | % |
Average Annual Total Return2 | | | | | | | +4.28 | % | | | +5.14 | % | | | +5.00 | % |
Distribution Rate3 | | | 3.42 | % | | | | | | | | | | | | |
30-Day Standardized Yield4 | | | 3.03 | % | | | | | | | | | | | | |
Total Annual Operating Expenses5 | | | 1.26 | % | | | | | | | | | | | | |
| | | | | | | | | | | | | | | | | |
| Class R | | | | | | 1-Year | | 5-Year | | Inception (1/1/02) |
| |
Cumulative Total Return1 | | | | | | | +5.55 | % | | | +29.44 | % | | | +49.43 | % |
Average Annual Total Return2 | | | | | | | +5.55 | % | | | +5.30 | % | | | +4.70 | % |
Distribution Rate3 | | | 3.54 | % | | | | | | | | | | | | |
30-Day Standardized Yield4 | | | 3.18 | % | | | | | | | | | | | | |
Total Annual Operating Expenses5 | | | 1.11 | % | | | | | | | | | | | | |
| | | | | | | | | | | | | | | | | |
| Advisor Class | | | | | | 1-Year | | 5-Year | | 10-Year |
| |
Cumulative Total Return1 | | | | | | | +6.06 | % | | | +32.59 | % | | | +73.85 | % |
Average Annual Total Return2 | | | | | | | +6.06 | % | | | +5.80 | % | | | +5.69 | % |
Distribution Rate3 | | | 4.04 | % | | | | | | | | | | | | |
30-Day Standardized Yield4 | | | 3.67 | % | | | | | | | | | | | | |
Total Annual Operating Expenses5 | | | 0.61 | % | | | | | | | | | | | | |
Performance data represent past performance, which does not guarantee future results. Investment return and principal value will fluctuate, and you may have a gain or loss when you sell your shares. Current performance may differ from figures shown. For most recent month-end performance, go to franklintempleton.com or call (800) 342-5236.
Annual Report | 43
Performance Summary (continued)
Total Return Index Comparison for a Hypothetical $10,000 Investment
Total return represents the change in value of an investment over the periods shown. It includes any current, applicable, maximum sales charge, Fund expenses, account fees and reinvested distributions. The unmanaged indexes include reinvestment of any income or distributions. They differ from the Fund in composition and do not pay management fees or expenses. One cannot invest directly in an index.
Average Annual Total Return
| | | | | |
| Class A | | 9/30/10 |
| |
| 1-Year | | | +1.39 | % |
| 5-Year | | | +4.77 | % |
| 10-Year | | | +5.10 | % |
Average Annual Total Return
| | | | | |
| Class B | | 9/30/10 |
| |
| 1-Year | | | +1.39 | % |
| 5-Year | | | +4.81 | % |
| 10-Year | | | +5.11 | % |
44 | Annual Report
Performance Summary (continued)
Average Annual Total Return
| | | | | |
| Class C | | 9/30/10 |
| |
| 1-Year | | | +4.28 | % |
| 5-Year | | | +5.14 | % |
| 10-Year | | | +5.00 | % |
Average Annual Total Return
| | | | | |
| Class R | | 9/30/10 |
| |
| 1-Year | | | +5.55 | % |
| 5-Year | | | +5.30 | % |
| Since Inception (1/1/02) | | | +4.70 | % |
Annual Report | 45
Performance Summary (continued)
Average Annual Total Return
| | | | | |
| Advisor Class | | 9/30/10 |
| |
| 1-Year | | | +6.06 | % |
| 5-Year | | | +5.80 | % |
| 10-Year | | | +5.69 | % |
Endnotes
The Fund’s share price and yield will be affected by interest rate movements and mortgage prepayments. Bond prices generally move in the opposite direction of interest rates. Thus, as prices of bonds in the Fund adjust to a rise in interest rates, the Fund’s share price may decline. The Fund’s prospectus also includes a description of the main investment risks.
| | | |
| | |
Class B: | | These shares have higher annual fees and expenses than Class A Shares. |
| | | |
Class C: | | Prior to 1/1/04, these shares were offered with an initial sales charge; thus actual total returns would have differed. These shares have higher annual fees and expenses than Class A shares. |
| | | |
Class R: | | Shares are available to certain eligible investors as described in the prospectus. These shares have higher annual fees and expenses than Class A shares. |
| | | |
Advisor Class: | | Shares are available to certain eligible investors as described in the prospectus. |
| 1. | | Cumulative total return represents the change in value of an investment over the periods indicated. |
| 2. | | Average annual total return represents the average annual change in value of an investment over the periods indicated. |
| 3. | | Distribution rate is based on an annualization of the respective class’s September dividend and the maximum offering price (NAV for Classes B, C, R and Advisor) per share on 9/30/10. |
| 4. | | The 30-day standardized yield for the 30 days ended 9/30/10 reflects an estimated yield to maturity (assuming all portfolio securities are held to maturity). It should be regarded as an estimate of the Fund’s rate of investment income, and it may not equal the Fund’s actual income distribution rate (which reflects the Fund’s past dividends paid to shareholders) or the income reported in the Fund’s financial statements. |
| 5. | | Figures are as stated in the Fund’s prospectus current as of the date of this report. In periods of market volatility, assets may decline significantly, causing total annual Fund operating expenses to become higher than the figures shown. |
| 6. | | Source: © 2010 Morningstar. The BC U.S. Government: Intermediate Index is the intermediate component of the BC U.S. Government Index, which includes public obligations of the U.S. Treasury with at least one year to final maturity and publicly issued debt of U.S. government agencies, quasi-federal corporations, and corporate or foreign debt guaranteed by the U.S. government. The Consumer Price Index (CPI), calculated by the U.S. Bureau of Labor Statistics, is a commonly used measure of the inflation rate. |
| 7. | | Source: Lipper Inc. The Lipper GNMA Funds Classification Average is calculated by averaging the total return for all funds within the Lipper GNMA Funds classification in the Lipper Open-End underlying funds universe for the period indicated. Lipper GNMA Funds are defined as funds that invest primarily in GNMA securities. For the 12-month period ended 9/30/10, there were 66 funds in this category. Lipper calculations do not include sales charges or expense subsidization by a fund’s manager. The Fund’s performance relative to the average may have differed if these or other factors had been considered. |
46 | Annual Report
Your Fund’s Expenses
Franklin U.S. Government Securities Fund
As a Fund shareholder, you can incur two types of costs:
| • | | Transaction costs, including sales charges (loads) on Fund purchases; and |
| • | | Ongoing Fund costs, including management fees, distribution and service (12b-1) fees, and other Fund expenses. All mutual funds have ongoing costs, sometimes referred to as operating expenses. |
The following table shows ongoing costs of investing in the Fund and can help you understand these costs and compare them with those of other mutual funds. The table assumes a $1,000 investment held for the six months indicated.
Actual Fund Expenses
The first line (Actual) for each share class listed in the table provides actual account values and expenses. The “Ending Account Value” is derived from the Fund’s actual return, which includes the effect of Fund expenses.
You can estimate the expenses you paid during the period by following these steps. Of course, your account value and expenses will differ from those in this illustration:
| 1. | | Divide your account value by $1,000. |
| | | |
| | | If an account had an $8,600 value, then $8,600 ÷ $1,000 = 8.6. |
| | | |
| 2. | | Multiply the result by the number under the heading “Expenses Paid During Period.” |
| | | |
| | | If Expenses Paid During Period were $7.50, then 8.6 x $7.50 = $64.50. |
In this illustration, the estimated expenses paid this period are $64.50.
Hypothetical Example for Comparison with Other Funds
Information in the second line (Hypothetical) for each class in the table can help you compare ongoing costs of investing in the Fund with those of other mutual funds. This information may not be used to estimate the actual ending account balance or expenses you paid during the period. The hypothetical “Ending Account Value” is based on the actual expense ratio for each class and an assumed 5% annual rate of return before expenses, which does not represent the Fund’s actual return. The figure under the heading “Expenses Paid During Period” shows the hypothetical expenses your account would have incurred under this scenario. You can compare this figure with the 5% hypothetical examples that appear in shareholder reports of other funds.
Annual Report | 47
Your Fund’s Expenses (continued)
Please note that expenses shown in the table are meant to highlight ongoing costs and do not reflect any transaction costs, such as sales charges. Therefore, the second line for each class is useful in comparing ongoing costs only, and will not help you compare total costs of owning different funds. In addition, if transaction costs were included, your total costs would have been higher. Please refer to the Fund prospectus for additional information on operating expenses.
| | | | | | | | | | | | | |
| | | Beginning Account | | Ending Account | | Expenses Paid During |
| | | Value 4/1/10 | | Value 9/30/10 | | Period* 4/1/10–9/30/10 |
| |
| Class A | | | | | | | | | | | | |
| Actual | | $ | 1,000 | | | $ | 1,038.00 | | | $ | 3.78 | |
| Hypothetical (5% return before expenses) | | $ | 1,000 | | | $ | 1,021.36 | | | $ | 3.75 | |
Class B | | | | | | | | | | | | |
| Actual | | $ | 1,000 | | | $ | 1,035.40 | | | $ | 6.33 | |
| Hypothetical (5% return before expenses) | | $ | 1,000 | | | $ | 1,018.85 | | | $ | 6.28 | |
Class C | | | | | | | | | | | | |
| Actual | | $ | 1,000 | | | $ | 1,034.10 | | | $ | 6.32 | |
| Hypothetical (5% return before expenses) | | $ | 1,000 | | | $ | 1,018.85 | | | $ | 6.28 | |
Class R | | | | | | | | | | | | |
| Actual | | $ | 1,000 | | | $ | 1,036.10 | | | $ | 5.56 | |
| Hypothetical (5% return before expenses) | | $ | 1,000 | | | $ | 1,019.60 | | | $ | 5.52 | |
Advisor Class | | | | | | | | | | | | |
| Actual | | $ | 1,000 | | | $ | 1,038.60 | | | $ | 3.02 | |
| Hypothetical (5% return before expenses) | | $ | 1,000 | | | $ | 1,022.11 | | | $ | 2.99 | |
| | |
| * | | Expenses are calculated using the most recent six-month expense ratio, annualized for each class (A: 0.74%; B: 1.24%; C: 1.24%; R: 1.09%; and Advisor: 0.59%), multiplied by the average account value over the period, multiplied by 183/365 to reflect the one-half year period. |
48 | Annual Report
Franklin Utilities Fund
Your Fund’s Goal and Main Investments: Franklin Utilities Fund seeks both capital appreciation and current income by investing at least 80% of its net assets in public utility company securities.
Performance data represent past performance, which does not guarantee future results. Investment return and principal value will fluctuate, and you may have a gain or loss when you sell your shares. Current performance may differ from figures shown. Please visit franklintempleton.com or call (800) 342-5236 for most recent month-end performance.
We are pleased to bring you Franklin Utilities Fund’s annual report for the fiscal year ended September 30, 2010.
Performance Overview
Franklin Utilities Fund – Class A delivered a +12.69% cumulative total return for the 12 months under review. The Fund outperformed its broad benchmark, the Standard & Poor’s 500 (S&P 500) Index, which posted a +10.16% total return for the same period.1 The Fund also outperformed the +11.90% total return of its narrow benchmark, the S&P 500 Utilities Index.2 You can find the Fund’s long-term performance data in the Performance Summary beginning on page 52.
Investment Strategy
We search for the best return opportunities available in the global utilities arena with a specific focus on the U.S. electricity and gas sector. Generally, we look for companies producing a high percentage of earnings from regulated utility franchise operations.
Manager’s Discussion
Of the S&P 500 Index’s 10 sector groups, the utilities sector’s performance during the fiscal year was slightly above average. The Fund’s performance surpassed that of the S&P 500 Utilities Index and the broader S&P 500 Index, primarily due to stock selection.
| 1. | | Source: © 2010 Morningstar. All Rights Reserved. The information contained herein: (1) is proprietary to Morningstar and/or its content providers; (2) may not be copied or distributed; and (3) is not warranted to be accurate, complete or timely. Neither Morningstar nor its content providers are responsible for any damages or losses arising from any use of this information. The S&P 500 Index is a market capitalization-weighted index of 500 stocks designed to measure total U.S. equity market performance. |
| 2. | | Source: © 2010 Morningstar. The S&P 500 Utilities Index is market capitalization weighted and consists of all utility stocks in the S&P 500 Index. |
The indexes are unmanaged and include reinvested dividends. One cannot invest directly in an index, and an index is not representative of the Fund’s portfolio.
The dollar value, number of shares or principal amount, and names of all portfolio holdings are listed in the Fund’s Statement of Investments (SOI). The SOI begins on page 109.
Annual Report | 49
Top 10 Equity Holdings
Franklin Utilities Fund
9/30/10
| | | | | |
| Company | | % of Total |
| Sector/Industry | | Net Assets |
| |
| Sempra Energy | | | 4.9 | % |
Multi-Utilities | | | | |
| The Southern Co. | | | 4.7 | % |
Electric Utilities | | | | |
| Entergy Corp. | | | 3.9 | % |
Electric Utilities | | | | |
| Public Service Enterprise Group Inc. | | | 3.8 | % |
Multi-Utilities | | | | |
| PG&E Corp. | | | 3.8 | % |
Multi-Utilities | | | | |
| American Electric Power Co. Inc. | | | 3.6 | % |
Electric Utilities | | | | |
| Edison International | | | 3.2 | % |
Electric Utilities | | | | |
| PPL Corp. | | | 3.2 | % |
Electric Utilities | | | | |
| Exelon Corp. | | | 3.0 | % |
Electric Utilities | | | | |
| NextEra Energy Inc. | | | 3.0 | % |
Electric Utilities | | | | |
Most portfolio holdings posted strong gains during this annual period. Among the most significant contributors to performance was The Southern Co., one of America’s largest electricity distributors offering a combined generating capacity of nearly 42,000 megawatts and serving more than 4.4 million electricity customers in the southeastern U.S. Southern’s share price increase during the reporting period was supported by the company’s commitment to distributing earnings to investors, as it increased its dividend by 4% on a per-share, annualized basis. Southern was also one of just two U.S. utilities actively developing a new nuclear electricity-generating plant, which we believe could offer many years of capital deployment opportunities. The Fund’s investment in American Electric Power Co. (AEP), a large power generator and distributor serving more than five million customers in 11 states, was another top contributor to returns. Like Southern, AEP was helped by increased investor appetite for electric utilities offering above-average dividend yields that also did not have significant commodity exposure. The Fund’s holdings in Dominion Resources, a Virginia-based electricity and natural gas distributor to 12 states, also provided a significant boost to the Fund’s overall returns. During the year under review, Dominion reduced its commodity sensitivity by selling its natural gas and oil exploration and production business to focus on its move toward a more regulated business model. Dominion also boosted its annual dividend rate by 4.6%.
Although there were few detractors from the Fund’s performance this fiscal year, some holdings fell in value. These included electric utility FirstEnergy, which serves a region including Ohio, Pennsylvania and New Jersey; and Exelon, which distributes electricity to 5.4 million customers in northern Illinois (including Chicago) and southeastern Pennsylvania (including Philadelphia) through subsidiaries Commonwealth Edison (ComEd) and PECO Energy. Declining electricity and natural gas prices hindered these companies’ profitability, as they sell significant volumes of power at market-based pricing. Finally, shares of RWE, a German energy conglomerate that provides electricity and gas to residential and business customers primarily in central and western Europe, also fell in value and hindered the Fund’s overall advance. RWE’s performance was negatively impacted by declining German powe r prices over the past year, as well as by a specific German government initiative to tax future profits made by nuclear energy producers. RWE is one of Germany’s two major producers of nuclear power.
50 | Annual Report
Thank you for your continued participation in Franklin Utilities Fund. We look forward to serving your future investment needs.
John C. Kohli, CFA
J. Blair Schmicker, CFA
Portfolio Management Team
Franklin Utilities Fund
The foregoing information reflects our analysis, opinions and portfolio holdings as of September 30, 2010, the end of the reporting period. The way we implement our main investment strategies and the resulting portfolio holdings may change depending on factors such as market and economic conditions. These opinions may not be relied upon as investment advice or an offer for a particular security. The information is not a complete analysis of every aspect of any market, country, industry, security or the Fund. Statements of fact are from sources considered reliable, but the investment manager makes no representation or warranty as to their completeness or accuracy. Although historical performance is no guarantee of future results, these insights may help you understand our investment management philosophy.
Annual Report | 51
Performance Summary as of 9/30/10
Franklin Utilities Fund
Your dividend income will vary depending on dividends or interest paid by securities in the Fund’s portfolio, adjusted for operating expenses of each class. Capital gain distributions are net profits realized from the sale of portfolio securities. The performance table and graphs do not reflect any taxes that a shareholder would pay on Fund dividends, capital gain distributions, if any, or any realized gains on the sale of Fund shares. Total return reflects reinvestment of the Fund’s dividends and capital gain distributions, if any, and any unrealized gains or losses.
Price and Distribution Information
| | | | | | | | | | | | | | | | | |
| Class A (Symbol: FKUTX) | | | | | | Change | | 9/30/10 | | 9/30/09 |
| |
| Net Asset Value (NAV) | | | | | | | +$0.70 | | | $ | 11.44 | | | $ | 10.74 | |
Distributions (10/1/09–9/30/10) | | | | | | | | | | | | | | | | |
| Dividend Income | | $ | 0.4500 | | | | | | | | | | | | | |
| Long-Term Capital Gain | | $ | 0.1618 | | | | | | | | | | | | | |
Total | | $ | 0.6118 | | | | | | | | | | | | | |
| | | | | | | | | | | | | | | | | |
| Class B (Symbol: FRUBX) | | | | | | Change | | 9/30/10 | | 9/30/09 |
| |
| Net Asset Value (NAV) | | | | | | | +$0.70 | | | $ | 11.44 | | | $ | 10.74 | |
Distributions (10/1/09–9/30/10) | | | | | | | | | | | | | | | | |
| Dividend Income | | $ | 0.3935 | | | | | | | | | | | | | |
| Long-Term Capital Gain | | $ | 0.1618 | | | | | | | | | | | | | |
Total | | $ | 0.5553 | | | | | | | | | | | | | |
| | | | | | | | | | | | | | | | | |
| Class C (Symbol: FRUSX) | | | | | | Change | | 9/30/10 | | 9/30/09 |
| |
| Net Asset Value (NAV) | | | | | | | +$0.69 | | | $ | 11.40 | | | $ | 10.71 | |
Distributions (10/1/09–9/30/10) | | | | | | | | | | | | | | | | |
| Dividend Income | | $ | 0.3972 | | | | | | | | | | | | | |
| Long-Term Capital Gain | | $ | 0.1618 | | | | | | | | | | | | | |
Total | | $ | 0.5590 | | | | | | | | | | | | | |
| | | | | | | | | | | | | | | | | |
| Class R (Symbol: FRURX) | | | | | | Change | | 9/30/10 | | 9/30/09 |
| |
| Net Asset Value (NAV) | | | | | | | +$0.70 | | | $ | 11.41 | | | $ | 10.71 | |
Distributions (10/1/09–9/30/10) | | | | | | | | | | | | | | | | |
| Dividend Income | | $ | 0.4126 | | | | | | | | | | | | | |
| Long-Term Capital Gain | | $ | 0.1618 | | | | | | | | | | | | | |
Total | | $ | 0.5744 | | | | | | | | | | | | | |
| | | | | | | | | | | | | | | | | |
| Advisor Class (Symbol: FRUAX) | | | | | | Change | | 9/30/10 | | 9/30/09 |
| |
| Net Asset Value (NAV) | | | | | | | +$0.71 | | | $ | 11.50 | | | $ | 10.79 | |
Distributions (10/1/09–9/30/10) | | | | | | | | | | | | | | | | |
| Dividend Income | | $ | 0.4664 | | | | | | | | | | | | | |
| Long-Term Capital Gain | | $ | 0.1618 | | | | | | | | | | | | | |
Total | | $ | 0.6282 | | | | | | | | | | | | | |
52 | Annual Report
Performance Summary (continued)
Performance
Cumulative total return excludes sales charges. Average annual total return and value of $10,000 investment include maximum sales charges. Class A: 4.25% maximum initial sales charge; Class B: contingent deferred sales charge (CDSC) declining from 4% to 1% over six years, and eliminated thereafter; Class C: 1% CDSC in first year only; Class R/Advisor Class: no sales charges.
| | | | | | | | | | | | | | | | | |
| Class A | | | | | | 1-Year | | 5-Year | | 10-Year |
| |
Cumulative Total Return1 | | | | | | | +12.69 | % | | | +21.18 | % | | | +83.70 | % |
Average Annual Total Return2 | | | | | | | +7.87 | % | | | +3.02 | % | | | +5.81 | % |
Value of $10,000 Investment3 | | | | | | $ | 10,787 | | | $ | 11,602 | | | $ | 17,595 | |
Distribution Rate4 | | | 3.51 | % | | | | | | | | | | | | |
30-Day Standardized Yield5 | | | 3.16 | % | | | | | | | | | | | | |
Total Annual Operating Expenses6 | | | 0.80 | % | | | | | | | | | | | | |
| | | | | | | | | | | | | | | | | |
| Class B | | | | | | 1-Year | | 5-Year | | 10-Year |
| |
Cumulative Total Return1 | | | | | | | +12.10 | % | | | +18.27 | % | | | +76.47 | % |
Average Annual Total Return2 | | | | | | | +8.10 | % | | | +3.09 | % | | | +5.84 | % |
Value of $10,000 Investment3 | | | | | | $ | 10,810 | | | $ | 11,645 | | | $ | 17,647 | |
Distribution Rate4 | | | 3.17 | % | | | | | | | | | | | | |
30-Day Standardized Yield5 | | | 2.81 | % | | | | | | | | | | | | |
Total Annual Operating Expenses6 | | | 1.30 | % | | | | | | | | | | | | |
| | | | | | | | | | | | | | | | | |
| Class C | | | | | | 1-Year | | 5-Year | | 10-Year |
| |
Cumulative Total Return1 | | | | | | | +12.08 | % | | | +18.23 | % | | | +74.76 | % |
Average Annual Total Return2 | | | | | | | +11.08 | % | | | +3.41 | % | | | +5.74 | % |
Value of $10,000 Investment3 | | | | | | $ | 11,108 | | | $ | 11,823 | | | $ | 17,476 | |
Distribution Rate4 | | | 3.21 | % | | | | | | | | | | | | |
30-Day Standardized Yield5 | | | 2.81 | % | | | | | | | | | | | | |
Total Annual Operating Expenses6 | | | 1.30 | % | | | | | | | | | | | | |
| | | | | | | | | | | | | | | | | |
| Class R | | | | | | 1-Year | | 5-Year | | Inception (1/1/02) |
| |
Cumulative Total Return1 | | | | | | | +12.33 | % | | | +19.09 | % | | | +78.67 | % |
Average Annual Total Return2 | | | | | | | +12.33 | % | | | +3.56 | % | | | +5.90 | % |
Value of $10,000 Investment3 | | | | | | $ | 11,233 | | | $ | 11,909 | | | $ | 17,867 | |
Distribution Rate4 | | | 3.34 | % | | | | | | | | | | | | |
30-Day Standardized Yield5 | | | 2.97 | % | | | | | | | | | | | | |
Total Annual Operating Expenses6 | | | 1.15 | % | | | | | | | | | | | | |
| | | | | | | | | | | | | | | | | |
| Advisor Class | | | | | | 1-Year | | 5-Year | | 10-Year |
| |
Cumulative Total Return1 | | | | | | | +12.89 | % | | | +22.08 | % | | | +86.45 | % |
Average Annual Total Return2 | | | | | | | +12.89 | % | | | +4.07 | % | | | +6.43 | % |
Value of $10,000 Investment3 | | | | | | $ | 11,289 | | | $ | 12,208 | | | $ | 18,645 | |
Distribution Rate4 | | | 3.79 | % | | | | | | | | | | | | |
30-Day Standardized Yield5 | | | 3.45 | % | | | | | | | | | | | | |
Total Annual Operating Expenses6 | | | 0.65 | % | | | | | | | | | | | | |
Performance data represent past performance, which does not guarantee future results. Investment return and principal value will fluctuate, and you may have a gain or loss when you sell your shares. Current performance may differ from figures shown. For most recent month-end performance, go to franklintempleton.com or call (800) 342-5236.
Annual Report | 53
Performance Summary (continued)
Total Return Index Comparison for a Hypothetical $10,000 Investment
Total return represents the change in value of an investment over the periods shown. It includes any current, applicable, maximum sales charge, Fund expenses, account fees and reinvested distributions. The unmanaged indexes include reinvestment of any income or distributions. They differ from the Fund in composition and do not pay management fees or expenses. One cannot invest directly in an index.
Average Annual Total Return
| | | | | |
| Class A | | 9/30/10 |
| |
| 1-Year | | | +7.87 | % |
| 5-Year | | | +3.02 | % |
| 10-Year | | | +5.81 | % |
Average Annual Total Return
| | | | | |
| Class B | | 9/30/10 |
| |
| 1-Year | | | +8.10 | % |
| 5-Year | | | +3.09 | % |
| 10-Year | | | +5.84 | % |
54 | Annual Report
Performance Summary (continued)
Average Annual Total Return
| | | | | |
| Class C | | 9/30/10 |
| |
| 1-Year | | | +11.08 | % |
| 5-Year | | | +3.41 | % |
| 10-Year | | | +5.74 | % |
Average Annual Total Return
| | | | | |
| Class R | | 9/30/10 |
| |
| 1-Year | | | +12.33 | % |
| 5-Year | | | +3.56 | % |
| Since Inception (1/1/02) | | | +5.90 | % |
Annual Report | 55
Performance Summary (continued)
Average Annual Total Return
| | | | | |
| Advisor Class | | 9/30/10 |
| |
| 1-Year | | | +12.89 | % |
| 5-Year | | | +4.07 | % |
| 10-Year | | | +6.43 | % |
Endnotes
In addition to being sensitive to other factors, securities issued by utility companies have been historically sensitive to interest rate changes. When interest rates fall, utility securities prices, and thus a utilities fund’s share price, tend to rise; when interest rates rise, their prices generally fall. The Fund’s prospectus also includes a description of the main investment risks.
| | | |
| | |
Class B: | | These shares have higher annual fees and expenses than Class A shares. |
| | | |
Class C: | | Prior to 1/1/04, these shares were offered with an initial sales charge; thus actual total returns would have differed. These shares have higher annual fees and expenses than Class A shares. |
| | | |
Class R: | | Shares are available to certain eligible investors as described in the prospectus. These shares have higher annual fees and expenses than Class A shares. |
| | | |
Advisor Class: | | Shares are available to certain eligible investors as described in the prospectus. |
| 1. | | Cumulative total return represents the change in value of an investment over the periods indicated. |
| 2. | | Average annual total return represents the average annual change in value of an investment over the periods indicated. |
| 3. | | These figures represent the value of a hypothetical $10,000 investment in the Fund over the periods indicated. |
| 4. | | Distribution rate is based on an annualization of the respective class’s current quarterly dividend and the maximum offering price (NAV for Classes B, C, R and Advisor) per share on 9/30/10. |
| 5. | | The 30-day standardized yield for the 30 days ended 9/30/10 reflects an estimated yield to maturity (assuming all portfolio securities are held to maturity). It should be regarded as an estimate of the Fund’s rate of investment income, and it may not equal the Fund’s actual income distribution rate (which reflects the Fund’s past dividends paid to shareholders) or the income reported in the Fund’s financial statements. |
| 6. | | Figures are as stated in the Fund’s prospectus current as of the date of this report. In periods of market volatility, assets may decline significantly, causing total annual Fund operating expenses to become higher than the figures shown. |
| 7. | | Source: © 2010 Morningstar. The S&P 500 Index is a market capitalization-weighted index of 500 stocks designed to measure total U.S. equity market performance. The S&P 500 Utilities Index is market capitalization weighted and consists of all utility stocks in the S&P 500 Index. |
56 | Annual Report
Your Fund’s Expenses
Franklin Utilities Fund
As a Fund shareholder, you can incur two types of costs:
| • | | Transaction costs, including sales charges (loads) on Fund purchases; and |
| | | |
| • | | Ongoing Fund costs, including management fees, distribution and service (12b-1) fees, and other Fund expenses. All mutual funds have ongoing costs, sometimes referred to as operating expenses. |
The following table shows ongoing costs of investing in the Fund and can help you understand these costs and compare them with those of other mutual funds. The table assumes a $1,000 investment held for the six months indicated.
Actual Fund Expenses
The first line (Actual) for each share class listed in the table provides actual account values and expenses. The “Ending Account Value” is derived from the Fund’s actual return, which includes the effect of Fund expenses.
You can estimate the expenses you paid during the period by following these steps. Of course, your account value and expenses will differ from those in this illustration:
| 1. | | Divide your account value by $1,000. |
| | | |
| | | If an account had an $8,600 value, then $8,600 ÷ $1,000 = 8.6. |
| | | |
| 2. | | Multiply the result by the number under the heading “Expenses Paid During Period.” |
| | | |
| | | If Expenses Paid During Period were $7.50, then 8.6 x $7.50 = $64.50. |
In this illustration, the estimated expenses paid this period are $64.50.
Hypothetical Example for Comparison with Other Funds
Information in the second line (Hypothetical) for each class in the table can help you compare ongoing costs of investing in the Fund with those of other mutual funds. This information may not be used to estimate the actual ending account balance or expenses you paid during the period. The hypothetical “Ending Account Value” is based on the actual expense ratio for each class and an assumed 5% annual rate of return before expenses, which does not represent the Fund’s actual return. The figure under the heading “Expenses Paid During Period” shows the hypothetical expenses your account would have incurred under this scenario. You can compare this figure with the 5% hypothetical examples that appear in shareholder reports of other funds.
Annual Report | 57
Your Fund’s Expenses (continued)
Please note that expenses shown in the table are meant to highlight ongoing costs and do not reflect any transaction costs, such as sales charges. Therefore, the second line for each class is useful in comparing ongoing costs only, and will not help you compare total costs of owning different funds. In addition, if transaction costs were included, your total costs would have been higher. Please refer to the Fund prospectus for additional information on operating expenses.
| | | | | | | | | | | | | |
| | | Beginning Account | | Ending Account | | Expenses Paid During |
| | | Value 4/1/10 | | Value 9/30/10 | | Period* 4/1/10–9/30/10 |
| |
| Class A | | | | | | | | | | | | |
| Actual | | $ | 1,000 | | | $ | 1,070.30 | | | $ | 4.00 | |
| Hypothetical (5% return before expenses) | | $ | 1,000 | | | $ | 1,021.21 | | | $ | 3.90 | |
Class B | | | | | | | | | | | | |
| Actual | | $ | 1,000 | | | $ | 1,067.40 | | | $ | 6.58 | |
| Hypothetical (5% return before expenses) | | $ | 1,000 | | | $ | 1,018.70 | | | $ | 6.43 | |
Class C | | | | | | | | | | | | |
| Actual | | $ | 1,000 | | | $ | 1,067.80 | | | $ | 6.58 | |
| Hypothetical (5% return before expenses) | | $ | 1,000 | | | $ | 1,018.70 | | | $ | 6.43 | |
Class R | | | | | | | | | | | | |
| Actual | | $ | 1,000 | | | $ | 1,068.50 | | | $ | 5.81 | |
| Hypothetical (5% return before expenses) | | $ | 1,000 | | | $ | 1,019.45 | | | $ | 5.67 | |
Advisor Class | | | | | | | | | | | | |
| Actual | | $ | 1,000 | | | $ | 1,071.70 | | | $ | 3.22 | |
| Hypothetical (5% return before expenses) | | $ | 1,000 | | | $ | 1,021.96 | | | $ | 3.14 | |
| | |
| * | | Expenses are calculated using the most recent six-month expense ratio, annualized for each class (A: 0.77%; B: 1.27%; C: 1.27%; R: 1.12%; and Advisor: 0.62%), multiplied by the average account value over the period, multiplied by 183/365 to reflect the one-half year period. |
58 | Annual Report
Franklin Custodian Funds
Financial Highlights
Franklin DynaTech Fund
| | | | | | | | | | | | | | | | | | | | | |
| | | Year Ended September 30, |
| Class A | | 2010 | | 2009 | | 2008 | | 2007 | | 2006 |
| | | |
Per share operating performance
(for a share outstanding throughout the year) | | | | | | | | | | | | | | | | | | | | |
| Net asset value, beginning of year | | $ | 23.20 | | | $ | 24.87 | | | $ | 32.33 | | | $ | 25.80 | | | $ | 24.98 | |
| | | |
Income from investment operationsa: | | | | | | | | | | | | | | | | | | | | |
Net investment income (loss)b | | | (0.11 | ) | | | (0.06 | ) | | | (0.08 | ) | | | (0.08 | ) | | | (0.05 | ) |
| Net realized and unrealized gains (losses) | | | 4.07 | | | | (0.03 | ) | | | (6.67 | ) | | | 6.61 | | | | 0.87 | |
| | | |
| Total from investment operations | | | 3.96 | | | | (0.09 | ) | | | (6.75 | ) | | | 6.53 | | | | 0.82 | |
| | | |
| Less distributions from net realized gains | | | — | | | | (1.58 | ) | | | (0.71 | ) | | | — | | | | — | |
| | | |
Redemption feesc | | | — | | | | — | | | | — | d | | | — | d | | | — | d |
| | | |
| Net asset value, end of year | | $ | 27.16 | | | $ | 23.20 | | | $ | 24.87 | | | $ | 32.33 | | | $ | 25.80 | |
| | | |
| | | | | | | | | | | | | | | | | | | | | |
Total returne | | | 17.07 | % | | | 2.71 | % | | | (21.36 | )% | | | 25.31 | % | | | 3.28 | % |
| | | | | | | | | | | | | | | | | | | | | |
Ratios to average net assets | | | | | | | | | | | | | | | | | | | | |
| Expenses | | | 1.03 | % | | | 1.16 | %f | | | 0.97 | %f | | | 0.99 | %f | | | 0.97 | %f |
| Net investment income (loss) | | | (0.44 | )% | | | (0.34 | )% | | | (0.26 | )% | | | (0.30 | )% | | | (0.20 | )% |
| | | | | | | | | | | | | | | | | | | | | |
Supplemental data | | | | | | | | | | | | | | | | | | | | |
| Net assets, end of year (000’s) | | $ | 566,764 | | | $ | 503,472 | | | $ | 388,843 | | | $ | 553,347 | | | $ | 590,633 | |
| Portfolio turnover rate | | | 31.39 | % | | | 46.05 | % | | | 41.01 | % | | | 18.03 | % | | | 18.61 | % |
| | |
| a | | The amount shown for a share outstanding throughout the period may not correlate with the Statement of Operations for the period due to the timing of sales and repurchases of the Fund shares in relation to income earned and/or fluctuating market value of the investments of the Fund. |
| | | |
| b | | Based on average daily shares outstanding. |
| | | |
| c | | Effective September 1, 2008, the redemption fee was eliminated. |
| | | |
| d | | Amount rounds to less than $0.01 per share. |
| | | |
| e | | Total return does not reflect sales commissions or contingent deferred sales charges, if applicable. |
| | | |
| f | | Benefit of expense reduction rounds to less than 0.01%. |
Annual Report | The accompanying notes are an integral part of these financial statements. | 59
Franklin Custodian Funds
Financial Highlights (continued)
Franklin DynaTech Fund
| | | | | | | | | | | | | | | | | | | | | |
| | | Year Ended September 30, |
| Class B | | 2010 | | 2009 | | 2008 | | 2007 | | 2006 |
| | | |
Per share operating performance
(for a share outstanding throughout the year) | | | | | | | | | | | | | | | | | | | | |
| Net asset value, beginning of year | | $ | 21.60 | | | $ | 23.48 | | | $ | 30.78 | | | $ | 24.75 | | | $ | 24.15 | |
| | | |
Income from investment operationsa: | | | | | | | | | | | | | | | | | | | | |
Net investment income (loss)b | | | (0.28 | ) | | | (0.19 | ) | | | (0.29 | ) | | | (0.28 | ) | | | (0.23 | ) |
| Net realized and unrealized gains (losses) | | | 3.78 | | | | (0.11 | ) | | | (6.30 | ) | | | 6.31 | | | | 0.83 | |
| | | |
| Total from investment operations | | | 3.50 | | | | (0.30 | ) | | | (6.59 | ) | | | 6.03 | | | | 0.60 | |
| | | |
| Less distributions from net realized gains | | | — | | | | (1.58 | ) | | | (0.71 | ) | | | — | | | | — | |
| | | |
Redemption feesc | | | — | | | | — | | | | — | d | | | — | d | | | — | d |
| | | |
| Net asset value, end of year | | $ | 25.10 | | | $ | 21.60 | | | $ | 23.48 | | | $ | 30.78 | | | $ | 24.75 | |
| | | |
| | | | | | | | | | | | | | | | | | | | | |
Total returne | | | 16.20 | % | | | 1.96 | % | | | (21.96 | )% | | | 24.36 | % | | | 2.48 | % |
| | | | | | | | | | | | | | | | | | | | | |
Ratios to average net assets | | | | | | | | | | | | | | | | | | | | |
| Expenses | | | 1.76 | % | | | 1.91 | %f | | | 1.73 | %f | | | 1.75 | %f | | | 1.72 | %f |
| Net investment income (loss) | | | (1.17 | )% | | | (1.09 | )% | | | (1.02 | )% | | | (1.06 | )% | | | (0.95 | )% |
| | | | | | | | | | | | | | | | | | | | | |
Supplemental data | | | | | | | | | | | | | | | | | | | | |
| Net assets, end of year (000’s) | | $ | 10,125 | | | $ | 13,682 | | | $ | 10,704 | | | $ | 16,625 | | | $ | 18,718 | |
| Portfolio turnover rate | | | 31.39 | % | | | 46.05 | % | | | 41.01 | % | | | 18.03 | % | | | 18.61 | % |
| | |
| a | | The amount shown for a share outstanding throughout the period may not correlate with the Statement of Operations for the period due to the timing of sales and repurchases of the Fund shares in relation to income earned and/or fluctuating market value of the investments of the Fund. |
| | | |
| b | | Based on average daily shares outstanding. |
| | | |
| c | | Effective September 1, 2008, the redemption fee was eliminated. |
| | | |
| d | | Amount rounds to less than $0.01 per share. |
| | | |
| e | | Total return does not reflect sales commissions or contingent deferred sales charges, if applicable. |
| | | |
| f | | Benefit of expense reduction rounds to less than 0.01%. |
60 | The accompanying notes are an integral part of these financial statements. | Annual Report
Franklin Custodian Funds
Financial Highlights (continued)
Franklin DynaTech Fund
| | | | | | | | | | | | | | | | | | | | | |
| | | Year Ended September 30, |
| Class C | | 2010 | | 2009 | | 2008 | | 2007 | | 2006 |
| | | |
Per share operating performance
(for a share outstanding throughout the year) | | | | | | | | | | | | | | | | | | | | |
| Net asset value, beginning of year | | $ | 21.34 | | | $ | 23.23 | | | $ | 30.46 | | | $ | 24.50 | | | $ | 23.90 | |
| | | |
Income from investment operationsa: | | | | | | | | | | | | | | | | | | | | |
Net investment income (loss)b | | | (0.28 | ) | | | (0.19 | ) | | | (0.28 | ) | | | (0.28 | ) | | | (0.23 | ) |
| Net realized and unrealized gains (losses) | | | 3.75 | | | | (0.12 | ) | | | (6.24 | ) | | | 6.24 | | | | 0.83 | |
| | | |
| Total from investment operations | | | 3.47 | | | | (0.31 | ) | | | (6.52 | ) | | | 5.96 | | | | 0.60 | |
| | | |
| Less distributions from net realized gains | | | — | | | | (1.58 | ) | | | (0.71 | ) | | | — | | | | — | |
| | | |
Redemption feesc | | | — | | | | — | | | | — | d | | | — | d | | | — | d |
| | | |
| Net asset value, end of year | | $ | 24.81 | | | $ | 21.34 | | | $ | 23.23 | | | $ | 30.46 | | | $ | 24.50 | |
| | | |
| | | | | | | | | | | | | | | | | | | | | |
Total returne | | | 16.26 | % | | | 1.89 | % | | | (21.93 | )% | | | 24.33 | % | | | 2.51 | % |
| | | | | | | | | | | | | | | | | | | | | |
Ratios to average net assets | | | | | | | | | | | | | | | | | | | | |
| Expenses | | | 1.78 | % | | | 1.91 | %f | | | 1.73 | %f | | | 1.74 | %f | | | 1.71 | %f |
| Net investment income (loss) | | | (1.19 | )% | | | (1.09 | )% | | | (1.02 | )% | | | (1.05 | )% | | | (0.94 | )% |
| | | | | | | | | | | | | | | | | | | | | |
Supplemental data | | | | | | | | | | | | | | | | | | | | |
| Net assets, end of year (000’s) | | $ | 93,927 | | | $ | 83,435 | | | $ | 53,289 | | | $ | 70,413 | | | $ | 69,069 | |
| Portfolio turnover rate | | | 31.39 | % | | | 46.05 | % | | | 41.01 | % | | | 18.03 | % | | | 18.61 | % |
| | |
| a | | The amount shown for a share outstanding throughout the period may not correlate with the Statement of Operations for the period due to the timing of sales and repurchases of the Fund shares in relation to income earned and/or fluctuating market value of the investments of the Fund. |
| | | |
| b | | Based on average daily shares outstanding. |
| | | |
| c | | Effective September 1, 2008, the redemption fee was eliminated. |
| | | |
| d | | Amount rounds to less than $0.01 per share. |
| | | |
| e | | Total return does not reflect sales commissions or contingent deferred sales charges, if applicable. |
| | | |
| f | | Benefit of expense reduction rounds to less than 0.01%. |
Annual Report | The accompanying notes are an integral part of these financial statements. | 61
Franklin Custodian Funds
Financial Highlights (continued)
Franklin DynaTech Fund
| | | | | | | | | |
| | | Year Ended September 30, |
| Class R | | 2010 | | 2009a |
| | | |
Per share operating performance
(for a share outstanding throughout the year) | | | | | | | | |
| Net asset value, beginning of year | | $ | 23.13 | | | $ | 15.66 | |
| | | |
Income from investment operationsb: | | | | | | | | |
Net investment income (loss)c | | | (0.17 | ) | | | (0.09 | ) |
| Net realized and unrealized gains (losses) | | | 4.06 | | | | 7.56 | |
| | | |
| Total from investment operations | | | 3.89 | | | | 7.47 | |
| | | |
| Net asset value, end of year | | $ | 27.02 | | | $ | 23.13 | |
| | | |
| | | | | | | | | |
Total returnd | | | 16.82 | % | | | 47.70 | % |
| | | | | | | | | |
Ratios to average net assetse | | | | | | | | |
| Expenses | | | 1.28 | % | | | 1.41 | %f |
| Net investment income (loss) | | | (0.69 | )% | | | (0.59 | )% |
| | | | | | | | | |
Supplemental data | | | | | | | | |
| Net assets, end of year (000’s) | | $ | 7,034 | | | $ | 6,345 | |
| Portfolio turnover rate | | | 31.39 | % | | | 46.05 | % |
| | |
| a | | For the period December 1, 2008 (effective date) to September 30, 2009. |
| | | |
| b | | The amount shown for a share outstanding throughout the period may not correlate with the Statement of Operations for the period due to the timing of sales and repurchases of the Fund shares in relation to income earned and/or fluctuating market value of the investments of the Fund. |
| | | |
| c | | Based on average daily shares outstanding. |
| | | |
| d | | Total return does not reflect sales commissions or contingent deferred sales charges, if applicable, and is not annualized for periods less than one year. |
| | | |
| e | | Ratios are annualized for periods less than one year. |
| | | |
| f | | Benefit of expense reduction rounds to less than 0.01%. |
62 | The accompanying notes are an integral part of these financial statements. | Annual Report
Franklin Custodian Funds
Financial Highlights (continued)
Franklin DynaTech Fund
| | | | | | | | | | | | | |
| | | Year Ended September 30, |
| Advisor Class | | 2010 | | 2009 | | 2008a |
| | | |
Per share operating performance
(for a share outstanding throughout the year) | | | | | | | | | | | | |
| Net asset value, beginning of year | | $ | 23.28 | | | $ | 24.90 | | | $ | 31.40 | |
| | | |
Income from investment operationsb: | | | | | | | | | | | | |
Net investment income (loss)c | | | (0.05 | ) | | | (0.02 | ) | | | (0.01 | ) |
| Net realized and unrealized gains (losses) | | | 4.10 | | | | (0.02 | ) | | | (6.49 | ) |
| | | |
| Total from investment operations | | | 4.05 | | | | (0.04 | ) | | | (6.50 | ) |
| | | |
| Less distributions from net realized gains | | | — | | | | (1.58 | ) | | | — | |
| | | |
Redemption feesd | | | — | | | | — | | | | — | e |
| | | |
| Net asset value, end of year | | $ | 27.33 | | | $ | 23.28 | | | $ | 24.90 | |
| | | |
| | | | | | | | | | | | | |
Total returnf | | | 17.40 | % | | | 2.92 | % | | | (20.70 | )% |
| | | | | | | | | | | | | |
Ratios to average net assetsg | | | | | | | | | | | | |
| Expenses | | | 0.78 | % | | | 0.91 | %h | | | 0.73 | %h |
| Net investment income (loss) | | | (0.19 | )% | | | (0.09 | )% | | | (0.02 | )% |
| | | | | | | | | | | | | |
Supplemental data | | | | | | | | | | | | |
| Net assets, end of year (000’s) | | $ | 11,541 | | | $ | 8,208 | | | $ | 1,938 | |
| Portfolio turnover rate | | | 31.39 | % | | | 46.05 | % | | | 41.01 | % |
| | |
| a | | For the period May 15, 2008 (effective date) to September 30, 2008. |
| | | |
| b | | The amount shown for a share outstanding throughout the period may not correlate with the Statement of Operations for the period due to the timing of sales and repurchases of the Fund shares in relation to income earned and/or fluctuating market value of the investments of the Fund. |
| | | |
| c | | Based on average daily shares outstanding. |
| | | |
| d | | Effective September 1, 2008, the redemption fee was eliminated. |
| | | |
| e | | Amount rounds to less than $0.01 per share. |
| | | |
| f | | Total return is not annualized for periods less than one year. |
| | | |
| g | | Ratios are annualized for periods less than one year. |
| | | |
| h | | Benefit of expense reduction rounds to less than 0.01%. |
Annual Report | The accompanying notes are an integral part of these financial statements. | 63
Franklin Custodian Funds
Statement of Investments, September 30, 2010
| | | | | | | | | | | | | | |
| | Franklin DynaTech Fund | | Country | | Shares | | | Value | |
| | |
| | Common Stocks 99.7% | | | | | | | | | | | | |
| | Aerospace & Defense 3.1% | | | | | | | | | | | | |
| | The Boeing Co. | | United States | | | 110,000 | | | $ | 7,319,400 | |
| | Precision Castparts Corp. | | United States | | | 110,000 | | | | 14,008,500 | |
| | | | | | | | | | | | | |
| | | | | | | | | | | | | 21,327,900 | |
| | | | | | | | | | | | | |
| | Air Freight & Logistics 1.9% | | | | | | | | | | | | |
| | C.H. Robinson Worldwide Inc. | | United States | | | 100,000 | | | | 6,992,000 | |
| | FedEx Corp. | | United States | | | 70,000 | | | | 5,985,000 | |
| | | | | | | | | | | | | |
| | | | | | | | | | | | | 12,977,000 | |
| | | | | | | | | | | | | |
| | Biotechnology 2.1% | | | | | | | | | | | | |
| a | Celgene Corp. | | United States | | | 250,000 | | | | 14,402,500 | |
| | | | | | | | | | | | | |
| | Capital Markets 0.8% | | | | | | | | | | | | |
| | The Goldman Sachs Group Inc. | | United States | | | 40,000 | | | | 5,783,200 | |
| | | | | | | | | | | | | |
| | Chemicals 2.0% | | | | | | | | | | | | |
| | Sigma-Aldrich Corp. | | United States | | | 225,000 | | | | 13,585,500 | |
| | | | | | | | | | | | | |
| | Communications Equipment 4.7% | | | | | | | | | | | | |
| a | Cisco Systems Inc. | | United States | | | 500,000 | | | | 10,950,000 | |
| a | F5 Networks Inc. | | United States | | | 100,000 | | | | 10,381,000 | |
| a | Juniper Networks Inc. | | United States | | | 150,000 | | | | 4,552,500 | |
| | QUALCOMM Inc. | | United States | | | 75,000 | | | | 3,384,000 | |
| | ZTE Corp., H | | China | | | 750,000 | | | | 2,986,815 | |
| | | | | | | | | | | | | |
| | | | | | | | | | | | | 32,254,315 | |
| | | | | | | | | | | | | |
| | Computers & Peripherals 9.6% | | | | | | | | | | | | |
| a | Apple Inc. | | United States | | | 185,000 | | | | 52,493,750 | |
| | Hewlett-Packard Co. | | United States | | | 225,000 | | | | 9,465,750 | |
| a | NetApp Inc. | | United States | | | 85,000 | | | | 4,232,150 | |
| | | | | | | | | | | | | |
| | | | | | | | | | | | | 66,191,650 | |
| | | | | | | | | | | | | |
| | Consumer Finance 0.1% | | | | | | | | | | | | |
| a | Green Dot Corp. | | United States | | | 19,200 | | | | 930,816 | |
| | | | | | | | | | | | | |
| | Diversified Consumer Services 0.3% | | | | | | | | | | | | |
| a | Coinstar Inc. | | United States | | | 40,000 | | | | 1,719,600 | |
| | | | | | | | | | | | | |
| | Diversified Financial Services 0.8% | | | | | | | | | | | | |
| | CME Group Inc. | | United States | | | 21,000 | | | | 5,469,450 | |
| | | | | | | | | | | | | |
| | Electronic Equipment, Instruments & Components 1.6% | | | | | | | | | | | | |
| a | Dolby Laboratories Inc., A | | United States | | | 190,000 | | | | 10,793,900 | |
| | | | | | | | | | | | | |
| | Energy Equipment & Services 5.7% | | | | | | | | | | | | |
| a | FMC Technologies Inc. | | United States | | | 300,000 | | | | 20,487,000 | |
| | National Oilwell Varco Inc. | | United States | | | 150,000 | | | | 6,670,500 | |
| | Schlumberger Ltd. | | United States | | | 200,000 | | | | 12,322,000 | |
| | | | | | | | | | | | | |
| | | | | | | | | | | | | 39,479,500 | |
| | | | | | | | | | | | | |
| | Health Care Equipment & Supplies 5.2% | | | | | | | | | | | | |
| a | Edwards Lifesciences Corp. | | United States | | | 200,000 | | | | 13,410,000 | |
| a | HeartWare International Inc. | | Australia | | | 50,000 | | | | 3,438,000 | |
| a | Intuitive Surgical Inc. | | United States | | | 30,000 | | | | 8,512,200 | |
| | Stryker Corp. | | United States | | | 150,000 | | | | 7,507,500 | |
64 | Annual Report
Franklin Custodian Funds
Statement of Investments, September 30, 2010 (continued)
| | | | | | | | | | | | | | |
| | Franklin DynaTech Fund | | Country | | | Shares | | | Value | |
| | |
| | Common Stocks (continued) | | | | | | | | | | | | |
| | Health Care Equipment & Supplies (continued) | | | | | | | | | | | | |
a | Thoratec Corp. | | United States | | | 80,000 | | | $ | 2,958,400 | |
| | | | | | | | | | | | | |
| | | | | | | | | | | | | 35,826,100 | |
| | | | | | | | | | | | | |
| | Health Care Providers & Services 3.0% | | | | | | | | | | | | |
a | Express Scripts Inc. | | United States | | | 300,000 | | | | 14,610,000 | |
| | McKesson Corp. | | United States | | | 100,000 | | | | 6,178,000 | |
| | | | | | | | | | | | | |
| | | | | | | | | | | | | 20,788,000 | |
| | | | | | | | | | | | | |
| | Health Care Technology 1.8% | | | | | | | | | | | | |
a | Cerner Corp. | | United States | | | 150,000 | | | | 12,598,500 | |
| | | | | | | | | | | | | |
| | Hotels, Restaurants & Leisure 1.0% | | | | | | | | | | | | |
a | Ctrip.com International Ltd., ADR | | China | | | 75,000 | | | | 3,581,250 | |
| | Wynn Resorts Ltd. | | United States | | | 40,000 | | | | 3,470,800 | |
| | | | | | | | | | | | | |
| | | | | | | | | | | | | 7,052,050 | |
| | | | | | | | | | | | | |
| | Industrial Conglomerates 0.8% | | | | | | | | | | | | |
| | General Electric Co. | | United States | | | 150,000 | | | | 2,437,500 | |
| | Koninklijke Philips Electronics NV, N.Y. shs. | | Netherlands | | | 100,000 | | | | 3,132,000 | |
| | | | | | | | | | | | | |
| | | | | | | | | | | | | 5,569,500 | |
| | | | | | | | | | | | | |
| | Internet & Catalog Retail 5.9% | | | | | | | | | | | | |
a | Amazon.com Inc. | | United States | | | 100,000 | | | | 15,706,000 | |
a | Netflix Inc. | | United States | | | 50,000 | | | | 8,108,000 | |
a | Priceline.com Inc. | | United States | | | 47,500 | | | | 16,546,150 | |
| | | | | | | | | | | | | |
| | | | | | | | | | | | | 40,360,150 | |
| | | | | | | | | | | | | |
| | Internet Software & Services 10.9% | | | | | | | | | | | | |
a | Akamai Technologies Inc. | | United States | | | 70,000 | | | | 3,512,600 | |
a | Baidu Inc., ADR | | China | | | 200,000 | | | | 20,524,000 | |
a | Google Inc., A | | United States | | | 50,000 | | | | 26,289,500 | |
a | MercadoLibre Inc. | | Argentina | | | 125,000 | | | | 9,022,500 | |
| | Tencent Holdings Ltd. | | China | | | 500,000 | | | | 10,922,659 | |
a | WebMD Health Corp. | | United States | | | 100,000 | | | | 4,987,000 | |
| | | | | | | | | | | | | |
| | | | | | | | | | | | | 75,258,259 | |
| | | | | | | | | | | | | |
| | IT Services 3.9% | | | | | | | | | | | | |
| | MasterCard Inc., A | | United States | | | 45,000 | | | | 10,080,000 | |
| | Visa Inc., A | | United States | | | 225,000 | | | | 16,708,500 | |
| | | | | | | | | | | | | |
| | | | | | | | | | | | | 26,788,500 | |
| | | | | | | | | | | | | |
| | Life Sciences Tools & Services 2.4% | | | | | | | | | | | | |
a | Thermo Fisher Scientific Inc. | | United States | | | 125,000 | | | | 5,985,000 | |
a | Waters Corp. | | United States | | | 150,000 | | | | 10,617,000 | |
| | | | | | | | | | | | | |
| | | | | | | | | | | | | 16,602,000 | |
| | | | | | | | | | | | | |
| | Machinery 1.6% | | | | | | | | | | | | |
| | Flowserve Corp. | | United States | | | 100,000 | | | | 10,942,000 | |
| | | | | | | | | | | | | |
| | Oil, Gas & Consumable Fuels 1.3% | | | | | | | | | | | | |
| | Noble Energy Inc. | | United States | | | 50,000 | | | | 3,754,500 | |
| | Petroleo Brasileiro SA, ADR | | Brazil | | | 150,000 | | | | 5,440,500 | |
| | | | | | | | | | | | | |
| | | | | | | | | | | | | 9,195,000 | |
| | | | | | | | | | | | | |
Annual Report | 65
Franklin Custodian Funds
Statement of Investments, September 30, 2010 (continued)
| | | | | | | | | | | | | | |
| | Franklin DynaTech Fund | | Country | | Shares | | | Value | |
| | |
| | Common Stocks (continued) | | | | | | | | | | | | |
| | Pharmaceuticals 5.6% | | | | | | | | | | | | |
| | Allergan Inc. | | United States | | | 150,000 | | | $ | 9,979,500 | |
| | Johnson & Johnson | | United States | | | 75,000 | | | | 4,647,000 | |
| | Roche Holding AG | | Switzerland | | | 40,000 | | | | 5,463,613 | |
| | Teva Pharmaceutical Industries Ltd., ADR | | Israel | | | 350,000 | | | | 18,462,500 | |
| | | | | | | | | | | | | |
| | | | | | | | | | | | | 38,552,613 | |
| | | | | | | | | | | | | |
| | Semiconductors & Semiconductor Equipment 10.6% | | | | | | | | | | | | |
| | ARM Holdings PLC, ADR | | United Kingdom | | | 900,000 | | | | 16,884,000 | |
| a | Cree Inc. | | United States | | | 70,000 | | | | 3,800,300 | |
| | First Solar Inc. | | United States | | | 5,000 | | | | 736,750 | |
| a | Hittite Microwave Corp. | | United States | | | 100,000 | | | | 4,765,000 | |
| | Intel Corp. | | United States | | | 1,125,000 | | | | 21,633,750 | |
| a | Lam Research Corp. | | United States | | | 150,000 | | | | 6,277,500 | |
| a | Netlogic Microsystems Inc. | | United States | | | 250,000 | | | | 6,895,000 | |
| | Power Integrations Inc. | | United States | | | 150,000 | | | | 4,768,500 | |
| a | Silicon Laboratories Inc. | | United States | | | 200,000 | | | | 7,330,000 | |
| | | | | | | | | | | | | |
| | | | | | | | | | | | | 73,090,800 | |
| | | | | | | | | | | | | |
| | Software 10.9% | | | | | | | | | | | | |
| a | Adobe Systems Inc. | | United States | | | 175,000 | | | | 4,576,250 | |
| a | ANSYS Inc. | | United States | | | 200,000 | | | | 8,450,000 | |
| a | Check Point Software Technologies Ltd. | | Israel | | | 200,000 | | | | 7,386,000 | |
| b | ChinaCache International Holdings Ltd., ADR | | China | | | 7,300 | | | | 87,600 | |
| a | Citrix Systems Inc. | | United States | | | 65,000 | | | | 4,435,600 | |
| | FactSet Research Systems Inc. | | United States | | | 75,000 | | | | 6,084,750 | |
| a | Informatica Corp. | | United States | | | 150,000 | | | | 5,761,500 | |
| | Microsoft Corp. | | United States | | | 200,000 | | | | 4,898,000 | |
| | Oracle Corp. | | United States | | | 250,000 | | | | 6,712,500 | |
| a | QLIK Technologies Inc. | | United States | | | 52,700 | | | | 1,162,035 | |
| a | Salesforce.com Inc. | | United States | | | 150,000 | | | | 16,770,000 | |
| a | VMware Inc., A | | United States | | | 100,000 | | | | 8,494,000 | |
| | | | | | | | | | | | | |
| | | | | | | | | | | | | 74,818,235 | |
| | | | | | | | | | | | | |
| | Wireless Telecommunication Services 2.1% | | | | | | | | | | | | |
| | America Movil SAB de CV, L, ADR | | Mexico | | | 85,000 | | | | 4,533,050 | |
| a | American Tower Corp., A | | United States | | | 200,000 | | | | 10,252,000 | |
| | | | | | | | | | | | | |
| | | | | | | | | | | | | 14,785,050 | |
| | | | | | | | | | | | | |
| | Total Common Stocks (Cost $364,688,370) | | | | | | | | | | | 687,142,088 | |
| | | | | | | | | | | | | |
| | Short Term Investments (Cost $5,804,707) 0.8% | | | | | | | | | | | | |
| | Money Market Funds 0.8% | | | | | | | | | | | | |
| a,c | Institutional Fiduciary Trust Money Market Portfolio, 0.00% | | United States | | | 5,804,707 | | | | 5,804,707 | |
| | | | | | | | | | | | | |
| | Total Investments (Cost $370,493,077) 100.5% | | | | | | | | | | | 692,946,795 | |
| | Other Assets, less Liabilities (0.5)% | | | | | | | | | | | (3,555,949 | ) |
| | | | | | | | | | | | | |
| | Net Assets 100.0% | | | | | | | | | | $ | 689,390,846 | |
| | | | | | | | | | | | | |
| | | |
| See Abbreviations on page 142. |
|
| | | |
| a | | Non-income producing. |
| | | |
| b | | A portion or all of the security purchased on a delayed delivery basis. See Note 1(d). |
| | | |
| c | | See Note 7 regarding investments in the Institutional Fiduciary Trust Money Market Portfolio. The rate shown is the annualized seven-day yield at period end. |
66 | The accompanying notes are an integral part of these financial statements. | Annual Report
Franklin Custodian Funds
Financial Highlights
Franklin Growth Fund
| | | | | | | | | | | | | | | | | | | | | |
| | | Year Ended September 30, |
| Class A | | 2010 | | 2009 | | 2008 | | 2007 | | 2006 |
| | | |
Per share operating performance
(for a share outstanding throughout the year) | | | | | | | | | | | | | | | | | | | | |
| Net asset value, beginning of year | | $ | 36.48 | | | $ | 37.17 | | | $ | 46.36 | | | $ | 39.10 | | | $ | 34.83 | |
| | | |
Income from investment operationsa: | | | | | | | | | | | | | | | | | | | | |
Net investment incomeb | | | 0.20 | | | | 0.29 | | | | 0.24 | | | | 0.16 | | | | 0.12 | |
| Net realized and unrealized gains (losses) | | | 4.71 | | | | (0.67 | ) | | | (9.30 | ) | | | 7.21 | | | | 4.21 | |
| | | |
| Total from investment operations | | | 4.91 | | | | (0.38 | ) | | | (9.06 | ) | | | 7.37 | | | | 4.33 | |
| | | |
| Less distributions from net investment income | | | (0.28 | ) | | | (0.31 | ) | | | (0.13 | ) | | | (0.11 | ) | | | (0.06 | ) |
| | | |
Redemption feesc | | | — | | | | — | | | | — | d | | | — | d | | | — | d |
| | | |
| Net asset value, end of year | | $ | 41.11 | | | $ | 36.48 | | | $ | 37.17 | | | $ | 46.36 | | | $ | 39.10 | |
| | | |
| | | | | | | | | | | | | | | | | | | | | |
Total returne | | | 13.52 | % | | | (0.71 | )% | | | (19.59 | )% | | | 18.87 | % | | | 12.46 | % |
| | | | | | | | | | | | | | | | | | | | | |
Ratios to average net assets | | | | | | | | | | | | | | | | | | | | |
| Expenses | | | 0.94 | % | | | 1.00 | %f | | | 0.89 | %f | | | 0.93 | %f | | | 0.91 | %f |
| Net investment income | | | 0.50 | % | | | 0.95 | % | | | 0.56 | % | | | 0.37 | % | | | 0.34 | % |
| | | | | | | | | | | | | | | | | | | | | |
Supplemental data | | | | | | | | | | | | | | | | | | | | |
| Net assets, end of year (000’s) | | $ | 2,587,802 | | | $ | 2,173,714 | | | $ | 1,708,612 | | | $ | 2,123,419 | | | $ | 1,695,802 | |
| Portfolio turnover rate | | | 4.36 | % | | | 3.92 | % | | | 5.64 | % | | | 0.37 | % | | | 2.21 | % |
| | |
| a | | The amount shown for a share outstanding throughout the period may not correlate with the Statement of Operations for the period due to the timing of sales and repurchases of the Fund shares in relation to income earned and/or fluctuating market value of the investments of the Fund. |
| | | |
| b | | Based on average daily shares outstanding. |
| | | |
| c | | Effective September 1, 2008, the redemption fee was eliminated. |
| | | |
| d | | Amount rounds to less than $0.01 per share. |
| | | |
| e | | Total return does not reflect sales commissions or contingent deferred sales charges, if applicable. |
| | | |
| f | | Benefit of expense reduction rounds to less than 0.01%. |
Annual Report | The accompanying notes are an integral part of these financial statements. | 67
Franklin Custodian Funds
Financial Highlights (continued)
Franklin Growth Fund
| | | | | | | | | | | | | | | | | | | | | |
| | | Year Ended September 30, |
| Class B | | 2010 | | 2009 | | 2008 | | 2007 | | 2006 |
| | | |
Per share operating performance
(for a share outstanding throughout the year) | | | | | | | | | | | | | | | | | | | | |
| Net asset value, beginning of year | | $ | 34.93 | | | $ | 35.44 | | | $ | 44.42 | | | $ | 37.65 | | | $ | 33.73 | |
| | | |
Income from investment operationsa: | | | | | | | | | | | | | | | | | | | | |
Net investment income (loss)b | | | (0.06 | ) | | | 0.07 | | | | (0.08 | ) | | | (0.16 | ) | | | (0.15 | ) |
| Net realized and unrealized gains (losses) | | | 4.50 | | | | (0.58 | ) | | | (8.90 | ) | | | 6.93 | | | | 4.07 | |
| | | |
| Total from investment operations | | | 4.44 | | | | (0.51 | ) | | | (8.98 | ) | | | 6.77 | | | | 3.92 | |
| | | |
| Less distributions from net investment income | | | (0.03 | ) | | | — | | | | — | | | | — | | | | — | |
| | | |
Redemption feesc | | | — | | | | — | | | | — | d | | | — | d | | | — | d |
| | | |
| Net asset value, end of year | | $ | 39.34 | | | $ | 34.93 | | | $ | 35.44 | | | $ | 44.42 | | | $ | 37.65 | |
| | | |
| | | | | | | | | | | | | | | | | | | | | |
Total returne | | | 12.70 | % | | | (1.44 | )% | | | (20.22 | )% | | | 17.98 | % | | | 11.62 | % |
| | | | | | | | | | | | | | | | | | | | | |
Ratios to average net assets | | | | | | | | | | | | | | | | | | | | |
| Expenses | | | 1.68 | % | | | 1.75 | %f | | | 1.64 | %f | | | 1.69 | %f | | | 1.67 | %f |
| Net investment income (loss) | | | (0.24 | )% | | | 0.20 | % | | | (0.19 | )% | | | (0.39 | )% | | | (0.42 | )% |
| | | | | | | | | | | | | | | | | | | | | |
Supplemental data | | | | | | | | | | | | | | | | | | | | |
| Net assets, end of year (000’s) | | $ | 51,594 | | | $ | 87,790 | | | $ | 89,779 | | | $ | 138,640 | | | $ | 122,871 | |
| Portfolio turnover rate | | | 4.36 | % | | | 3.92 | % | | | 5.64 | % | | | 0.37 | % | | | 2.21 | % |
| | |
| a | | The amount shown for a share outstanding throughout the period may not correlate with the Statement of Operations for the period due to the timing of sales and repurchases of the Fund shares in relation to income earned and/or fluctuating market value of the investments of the Fund. |
| | | |
| b | | Based on average daily shares outstanding. |
| | | |
| c | | Effective September 1, 2008, the redemption fee was eliminated. |
| | | |
| d | | Amount rounds to less than $0.01 per share. |
| | | |
| e | | Total return does not reflect sales commissions or contingent deferred sales charges, if applicable. |
| | | |
| f | | Benefit of expense reduction rounds to less than 0.01%. |
68 | The accompanying notes are an integral part of these financial statements. | Annual Report
Franklin Custodian Funds
Financial Highlights (continued)
Franklin Growth Fund
| | | | | | | | | | | | | | | | | | | | | |
| | | Year Ended September 30, |
| Class C | | 2010 | | 2009 | | 2008 | | 2007 | | 2006 |
| | | |
Per share operating performance | | | | | | | | | | | | | | | | | | | | |
| (for a share outstanding throughout the year) | | | | | | | | | | | | | | | | | | | | |
| Net asset value, beginning of year | | $ | 34.61 | | | $ | 35.14 | | | $ | 44.03 | | | $ | 37.32 | | | $ | 33.43 | |
| | | |
Income from investment operationsa: | | | | | | | | | | | | | | | | | | | | |
Net investment income (loss)b | | | (0.09 | ) | | | 0.06 | | | | (0.08 | ) | | | (0.16 | ) | | | (0.15 | ) |
| Net realized and unrealized gains (losses) | | | 4.47 | | | | (0.57 | ) | | | (8.81 | ) | | | 6.87 | | | | 4.04 | |
| | | |
| Total from investment operations | | | 4.38 | | | | (0.51 | ) | | | (8.89 | ) | | | 6.71 | | | | 3.89 | |
| | | |
| Less distributions from net investment income | | | (0.07 | ) | | | (0.02 | ) | | | — | | | | — | | | | — | |
| | | |
Redemption feesc | | | — | | | | — | | | | — | d | | | — | d | | | — | d |
| | | |
| Net asset value, end of year | | $ | 38.92 | | | $ | 34.61 | | | $ | 35.14 | | | $ | 44.03 | | | $ | 37.32 | |
| | | |
| | | | | | | | | | | | | | | | | | | | | |
Total returne | | | 12.69 | % | | | (1.45 | )% | | | (20.19 | )% | | | 17.98 | % | | | 11.60 | % |
| | | | | | | | | | | | | | | | | | | | | |
Ratios to average net assets | | | | | | | | | | | | | | | | | | | | |
| Expenses | | | 1.69 | % | | | 1.75 | %f | | | 1.64 | %f | | | 1.69 | %f | | | 1.66 | %f |
| Net investment income (loss) | | | (0.25 | )% | | | 0.20 | % | | | (0.19 | )% | | | (0.39 | )% | | | (0.41 | )% |
| | | | | | | | | | | | | | | | | | | | | |
Supplemental data | | | | | | | | | | | | | | | | | | | | |
| Net assets, end of year (000’s) | | $ | 349,188 | | | $ | 315,305 | | | $ | 255,425 | | | $ | 340,671 | | | $ | 273,512 | |
| Portfolio turnover rate | | | 4.36 | % | | | 3.92 | % | | | 5.64 | % | | | 0.37 | % | | | 2.21 | % |
| | |
| a | | The amount shown for a share outstanding throughout the period may not correlate with the Statement of Operations for the period due to the timing of sales and repurchases of the Fund shares in relation to income earned and/or fluctuating market value of the investments of the Fund. |
| | | |
| b | | Based on average daily shares outstanding. |
| | | |
| c | | Effective September 1, 2008, the redemption fee was eliminated. |
| | | |
| d | | Amount rounds to less than $0.01 per share. |
| | | |
| e | | Total return does not reflect sales commissions or contingent deferred sales charges, if applicable. |
| | | |
| f | | Benefit of expense reduction rounds to less than 0.01%. |
Annual Report | The accompanying notes are an integral part of these financial statements. | 69
Franklin Custodian Funds
Financial Highlights (continued)
Franklin Growth Fund
| | | | | | | | | | | | | | | | | | | | | |
| | | Year Ended September 30, |
| Class R | | 2010 | | 2009 | | 2008 | | 2007 | | 2006 |
| | | |
Per share operating performance
(for a share outstanding throughout the year) | | | | | | | | | | | | | | | | | | | | |
| Net asset value, beginning of year | | $ | 36.37 | | | $ | 36.87 | | | $ | 45.99 | | | $ | 38.80 | | | $ | 34.59 | |
| | | |
Income from investment operationsa: | | | | | | | | | | | | | | | | | | | | |
Net investment incomeb | | | 0.08 | | | | 0.20 | | | | 0.14 | | | | 0.04 | | | | 0.02 | |
| Net realized and unrealized gains (losses) | | | 4.72 | | | | (0.59 | ) | | | (9.23 | ) | | | 7.16 | | | | 4.19 | |
| | | |
| Total from investment operations | | | 4.80 | | | | (0.39 | ) | | | (9.09 | ) | | | 7.20 | | | | 4.21 | |
| | | |
| Less distributions from net investment income | | | (0.23 | ) | | | (0.11 | ) | | | (0.03 | ) | | | (0.01 | ) | | | — | c |
| | | |
Redemption feesd | | | — | | | | — | | | | — | c | | | — | c | | | — | c |
| | | |
| Net asset value, end of year | | $ | 40.94 | | | $ | 36.37 | | | $ | 36.87 | | | $ | 45.99 | | | $ | 38.80 | |
| | | |
| | | | | | | | | | | | | | | | | | | | | |
Total returne | | | 13.26 | % | | | (0.98 | )% | | | (19.78 | )% | | | 18.55 | % | | | 12.18 | % |
| | | | | | | | | | | | | | | | | | | | | |
Ratios to average net assets | | | | | | | | | | | | | | | | | | | | |
| Expenses | | | 1.19 | % | | | 1.25 | %f | | | 1.14 | %f | | | 1.19 | %f | | | 1.17 | %f |
| Net investment income | | | 0.25 | % | | | 0.70 | % | | | 0.31 | % | | | 0.11 | % | | | 0.08 | % |
| | | | | | | | | | | | | | | | | | | | | |
Supplemental data | | | | | | | | | | | | | | | | | | | | |
| Net assets, end of year (000’s) | | $ | 117,484 | | | $ | 65,113 | | | $ | 30,175 | | | $ | 53,134 | | | $ | 37,804 | |
| Portfolio turnover rate | | | 4.36 | % | | | 3.92 | % | | | 5.64 | % | | | 0.37 | % | | | 2.21 | % |
| | |
| a | | The amount shown for a share outstanding throughout the period may not correlate with the Statement of Operations for the period due to the timing of sales and repurchases of the Fund shares in relation to income earned and/or fluctuating market value of the investments of the Fund. |
| | | |
| b | | Based on average daily shares outstanding. |
| | | |
| c | | Amount rounds to less than $0.01 per share. |
| | | |
| d | | Effective September 1, 2008, the redemption fee was eliminated. |
| | | |
| e | | Total return does not reflect sales commissions or contingent deferred sales charges, if applicable. |
| | | |
| f | | Benefit of expense reduction rounds to less than 0.01%. |
70 | The accompanying notes are an integral part of these financial statements. | Annual Report
Franklin Custodian Funds
Financial Highlights (continued)
Franklin Growth Fund
| | | | | | | | | | | | | | | | | | | | | |
| | | Year Ended September 30, |
| Advisor Class | | 2010 | | 2009 | | 2008 | | 2007 | | 2006 |
| | | |
Per share operating performance
(for a share outstanding throughout the year) | | | | | | | | | | | | | | | | | | | | |
| Net asset value, beginning of year | | $ | 36.53 | | | $ | 37.25 | | | $ | 46.45 | | | $ | 39.17 | | | $ | 34.89 | |
| | | |
Income from investment operationsa: | | | | | | | | | | | | | | | | | | | | |
Net investment incomeb | | | 0.29 | | | | 0.36 | | | | 0.34 | | | | 0.27 | | | | 0.22 | |
| Net realized and unrealized gains (losses) | | | 4.72 | | | | (0.68 | ) | | | (9.31 | ) | | | 7.21 | | | | 4.21 | |
| | | |
| Total from investment operations | | | 5.01 | | | | (0.32 | ) | | | (8.97 | ) | | | 7.48 | | | | 4.43 | |
| | | |
| Less distributions from net investment income | | | (0.36 | ) | | | (0.40 | ) | | | (0.23 | ) | | | (0.20 | ) | | | (0.15 | ) |
| | | |
Redemption feesc | | | — | | | | — | | | | — | d | | | — | d | | | — | d |
| | | |
| Net asset value, end of year | | $ | 41.18 | | | $ | 36.53 | | | $ | 37.25 | | | $ | 46.45 | | | $ | 39.17 | |
| | | |
| | | | | | | | | | | | | | | | | | | | | |
| Total return | | | 13.82 | % | | | (0.45 | )% | | | (19.39 | )% | | | 19.16 | % | | | 12.73 | % |
| | | | | | | | | | | | | | | | | | | | | |
Ratios to average net assets | | | | | | | | | | | | | | | | | | | | |
| Expenses | | | 0.69 | % | | | 0.75 | %e | | | 0.64 | %e | | | 0.69 | %e | | | 0.67 | %e |
| Net investment income | | | 0.75 | % | | | 1.20 | % | | | 0.81 | % | | | 0.61 | % | | | 0.58 | % |
| | | | | | | | | | | | | | | | | | | | | |
Supplemental data | | | | | | | | | | | | | | | | | | | | |
| Net assets, end of year (000’s) | | $ | 544,936 | | | $ | 430,926 | | | $ | 256,988 | | | $ | 363,221 | | | $ | 274,603 | |
| Portfolio turnover rate | | | 4.36 | % | | | 3.92 | % | | | 5.64 | % | | | 0.37 | % | | | 2.21 | % |
| | |
| a | | The amount shown for a share outstanding throughout the period may not correlate with the Statement of Operations for the period due to the timing of sales and repurchases of the Fund shares in relation to income earned and/or fluctuating market value of the investments of the Fund. |
| | | |
| b | | Based on average daily shares outstanding. |
| | | |
| c | | Effective September 1, 2008, the redemption fee was eliminated. |
| | | |
| d | | Amount rounds to less than $0.01 per share. |
| | | |
| e | | Benefit of expense reduction rounds to less than 0.01%. |
Annual Report | The accompanying notes are an integral part of these financial statements. | 71
Franklin Custodian Funds
Statement of Investments, September 30, 2010
| | | | | | | | | | |
| | Franklin Growth Fund | | Shares | | | Value | |
| | |
| | Common Stocks 93.3% | | | | | | | | |
| | Automobiles & Components 2.2% | | | | | | | | |
| a | Ford Motor Co. | | | 1,100,000 | | | $ | 13,464,000 | |
| | Harley-Davidson Inc. | | | 838,096 | | | | 23,835,450 | |
| | Johnson Controls Inc. | | | 1,400,000 | | | | 42,700,000 | |
| | Toyota Motor Corp., ADR (Japan) | | | 30,000 | | | | 2,147,400 | |
| | | | | | | | | |
| | | | | | | | | 82,146,850 | |
| | | | | | | | | |
| | Banks 0.3% | | | | | | | | |
| | Wells Fargo & Co. | | | 505,600 | | | | 12,705,728 | |
| | | | | | | | | |
| | Capital Goods 21.4% | | | | | | | | |
| | 3M Co. | | | 855,000 | | | | 74,137,050 | |
| a | ABB Ltd., ADR (Switzerland) | | | 850,000 | | | | 17,952,000 | |
| | The Boeing Co. | | | 1,045,000 | | | | 69,534,300 | |
| | Caterpillar Inc. | | | 200,000 | | | | 15,736,000 | |
| | Danaher Corp. | | | 550,000 | | | | 22,335,500 | |
| | Deere & Co. | | | 100,000 | | | | 6,978,000 | |
| | Emerson Electric Co. | | | 1,000,000 | | | | 52,660,000 | |
| | General Dynamics Corp. | | | 1,000,000 | | | | 62,810,000 | |
| | General Electric Co. | | | 720,000 | | | | 11,700,000 | |
| | Illinois Tool Works Inc. | | | 1,000,000 | | | | 47,020,000 | |
| | Ingersoll-Rand PLC. | | | 1,002,000 | | | | 35,781,420 | |
| | Lockheed Martin Corp. | | | 500,000 | | | | 35,640,000 | |
| | Northrop Grumman Corp. | | | 1,000,000 | | | | 60,630,000 | |
| | Pall Corp. | | | 500,000 | | | | 20,820,000 | |
| | Precision Castparts Corp. | | | 240,000 | | | | 30,564,000 | |
| | Raytheon Co. | | | 600,000 | | | | 27,426,000 | |
| | Rockwell Collins Inc. | | | 350,000 | | | | 20,387,500 | |
| | Textron Inc. | | | 1,050,000 | | | | 21,588,000 | |
| a | Thomas & Betts Corp. | | | 500,000 | | | | 20,510,000 | |
| | United Technologies Corp. | | | 850,000 | | | | 60,545,500 | |
| | W.W. Grainger Inc. | | | 550,000 | | | | 65,510,500 | |
| | | | | | | | | |
| | | | | | | | | 780,265,770 | |
| | | | | | | | | |
| | Commercial & Professional Services 1.6% | | | | | | | | |
| | Avery Dennison Corp. | | | 462,000 | | | | 17,149,440 | |
| | Dun & Bradstreet Corp. | | | 122,000 | | | | 9,045,080 | |
| | Equifax Inc. | | | 400,000 | | | | 12,480,000 | |
| | Robert Half International Inc. | | | 150,000 | | | | 3,900,000 | |
| a | Stericycle Inc. | | | 100,000 | | | | 6,948,000 | |
| a | Verisk Analytics Inc., A | | | 300,000 | | | | 8,403,000 | |
| | | | | | | | | |
| | | | | | | | | 57,925,520 | |
| | | | | | | | | |
| | Consumer Durables & Apparel 1.3% | | | | | | | | |
| | NIKE Inc., B | | | 75,000 | | | | 6,010,500 | |
| | VF Corp. | | | 500,000 | | | | 40,510,000 | |
| | | | | | | | | |
| | | | | | | | | 46,520,500 | |
| | | | | | | | | |
72 | Annual Report
Franklin Custodian Funds
Statement of Investments, September 30, 2010 (continued)
| | | | | | | | | | |
| | Franklin Growth Fund | | Shares | | | Value | |
| | |
| | Common Stocks (continued) | | | | | | | | |
| | Consumer Services 1.7% | | | | | | | | |
| a | Apollo Group Inc., A | | | 150,000 | | | $ | 7,702,500 | |
| | Carnival Corp. | | | 1,065,000 | | | | 40,693,650 | |
| a | Interval Leisure Group Inc. | | | 60,020 | | | | 808,469 | |
| | Starwood Hotels & Resorts Worldwide Inc. | | | 250,000 | | | | 13,137,500 | |
| | | | | | | | | |
| | | | | | | | | 62,342,119 | |
| | | | | | | | | |
| | Diversified Financials 1.2% | | | | | | | | |
| | American Express Co. | | | 242,300 | | | | 10,183,869 | |
| | BlackRock Inc. | | | 125,000 | | | | 21,281,250 | |
| | JPMorgan Chase & Co. | | | 334,300 | | | | 12,726,801 | |
| | | | | | | | | |
| | | | | | | | | 44,191,920 | |
| | | | | | | | | |
| | Energy 4.3% | | | | | | | | |
| | BP PLC, ADR (United Kingdom) | | | 350,200 | | | | 14,417,734 | |
| | ConocoPhillips | | | 35,000 | | | | 2,010,050 | |
| | Devon Energy Corp. | | | 290,000 | | | | 18,774,600 | |
| | Exxon Mobil Corp. | | | 70,000 | | | | 4,325,300 | |
| a | FMC Technologies Inc. | | | 300,000 | | | | 20,487,000 | |
| | Halliburton Co. | | | 600,000 | | | | 19,842,000 | |
| | National Oilwell Varco Inc. | | | 175,000 | | | | 7,782,250 | |
| | Occidental Petroleum Corp. | | | 200,000 | | | | 15,660,000 | |
| | Peabody Energy Corp. | | | 350,000 | | | | 17,153,500 | |
| | Royal Dutch Shell PLC, A, ADR (Netherlands) | | | 280,000 | | | | 16,884,000 | |
| | Schlumberger Ltd. | | | 309,100 | | | | 19,043,651 | |
| a | Transocean Ltd. | | | 15,222 | | | | 978,622 | |
| | | | | | | | | |
| | | | | | | | | 157,358,707 | |
| | | | | | | | | |
| | Food & Staples Retailing 0.5% | | | | | | | | |
| | CVS Caremark Corp. | | | 600,000 | | | | 18,882,000 | |
| | | | | | | | | |
| | Food, Beverage & Tobacco 1.3% | | | | | | | | |
| | Bunge Ltd. | | | 211,500 | | | | 12,512,340 | |
| a | Hansen Natural Corp. | | | 300,000 | | | | 13,986,000 | |
| | PepsiCo Inc. | | | 300,000 | | | | 19,932,000 | |
| | | | | | | | | |
| | | | | | | | | 46,430,340 | |
| | | | | | | | | |
| | Health Care Equipment & Services 4.6% | | | | | | | | |
| | Aetna Inc. | | | 400,000 | | | | 12,644,000 | |
| a | Allscripts Healthcare Solutions Inc. | | | 450,000 | | | | 8,311,500 | |
| | Baxter International Inc. | | | 400,000 | | | | 19,084,000 | |
| | Cardinal Health Inc. | | | 300,000 | | | | 9,912,000 | |
| a | CareFusion Corp. | | | 150,000 | | | | 3,726,000 | |
| | Covidien PLC | | | 350,000 | | | | 14,066,500 | |
| a | Edwards Lifesciences Corp. | | | 100,000 | | | | 6,705,000 | |
| a | Intuitive Surgical Inc. | | | 34,000 | | | | 9,647,160 | |
| a | Medco Health Solutions Inc. | | | 96,480 | | | | 5,022,749 | |
| | Medtronic Inc. | | | 60,000 | | | | 2,014,800 | |
| | Quest Diagnostics Inc. | | | 500,000 | | | | 25,235,000 | |
| | Teleflex Inc. | | | 500,000 | | | | 28,390,000 | |
Annual Report | 73
Franklin Custodian Funds
Statement of Investments, September 30, 2010 (continued)
| | | | | | | | | | |
| Franklin Growth Fund | | Shares | | | Value | |
| | |
| Common Stocks (continued) | | | | | | | | |
| Health Care Equipment & Services (continued) | | | | | | | | |
| a | Varian Medical Systems Inc. | | | 300,000 | | | $ | 18,150,000 | |
| a | Zimmer Holdings Inc. | | | 64,000 | | | | 3,349,120 | |
| | | | | | | | | |
| | | | | | | | 166,257,829 | |
| | | | | | | | |
| Household & Personal Products 0.5% | | | | | | | | |
| The Procter & Gamble Co. | | | 335,000 | | | | 20,089,950 | |
| | | | | | | | | |
| Insurance 1.1% | | | | | | | | |
| Aflac Inc. | | | 333,300 | | | | 17,234,943 | |
| a | Berkshire Hathaway Inc., A | | | 184 | | | | 22,908,000 | |
| | | | | | | | |
| | | | | | | | 40,142,943 | |
| | | | | | | | |
| Materials 3.6% | | | | | | | | |
| Air Products and Chemicals Inc. | | | 500,000 | | | | 41,410,000 | |
| Celanese Corp., A | | | 500,000 | | | | 16,050,000 | |
| Ecolab Inc. | | | 353,700 | | | | 17,946,738 | |
| Martin Marietta Materials Inc. | | | 90,000 | | | | 6,927,300 | |
| Praxair Inc. | | | 120,000 | | | | 10,831,200 | |
| Randgold Resources Ltd., ADR (United Kingdom) | | | 150,000 | | | | 15,219,000 | |
| Sigma-Aldrich Corp. | | | 400,000 | | | | 24,152,000 | |
| | | | | | | | |
| | | | | | | | 132,536,238 | |
| | | | | | | | |
| Media 1.6% | | | | | | | | |
| a | Live Nation Entertainment Inc. | | | 88,491 | | | | 874,291 | |
| The Walt Disney Co. | | | 1,687,290 | | | | 55,866,172 | |
| | | | | | | | |
| | | | | | | | 56,740,463 | |
| | | | | | | | |
| Pharmaceuticals, Biotechnology & Life Sciences 12.7% | | | | | | | | |
| Abbott Laboratories | | | 400,000 | | | | 20,896,000 | |
| Allergan Inc. | | | 950,000 | | | | 63,203,500 | |
| a | Amgen Inc. | | | 932,000 | | | | 51,362,520 | |
| a | Biogen Idec Inc. | | | 400,000 | | | | 22,448,000 | |
| a | Celgene Corp. | | | 324,400 | | | | 18,688,684 | |
| a | Covance Inc. | | | 200,000 | | | | 9,358,000 | |
| a | Dionex Corp. | | | 250,000 | | | | 21,610,000 | |
| Eli Lilly & Co. | | | 400,000 | | | | 14,612,000 | |
| a | Gilead Sciences Inc. | | | 250,000 | | | | 8,902,500 | |
| Johnson & Johnson | | | 1,181,010 | | | | 73,175,380 | |
| Merck & Co. Inc. | | | 788,350 | | | | 29,019,163 | |
| a | Mettler-Toledo International Inc. | | | 50,000 | | | | 6,222,000 | |
| Pfizer Inc. | | | 2,761,000 | | | | 47,406,370 | |
| Pharmaceutical Product Development Inc. | | | 300,000 | | | | 7,437,000 | |
| Roche Holding AG, ADR (Switzerland) | | | 530,000 | | | | 18,088,900 | |
| Teva Pharmaceutical Industries Ltd., ADR (Israel) | | | 275,000 | | | | 14,506,250 | |
| a | Waters Corp. | | | 500,000 | | | | 35,390,000 | |
| | | | | | | | |
| | | | | | | | 462,326,267 | |
| | | | | | | | |
| Retailing 0.3% | | | | | | | | |
| a | Amazon.com Inc. | | | 10,000 | | | | 1,570,600 | |
| Expedia Inc. | | | 300,100 | | | | 8,465,821 | |
74 | Annual Report
Franklin Custodian Funds
Statement of Investments, September 30, 2010 (continued)
| | | | | | | | | | |
| Franklin Growth Fund | | Shares | | | Value | |
| | |
| Common Stocks (continued) | | | | | | | | |
| Retailing (continued) | | | | | | | | |
| a | HSN Inc. | | | 60,020 | | | $ | 1,794,598 | |
| | | | | | | | |
| | | | | | | | 11,831,019 | |
| | | | | | | | |
| Semiconductors & Semiconductor Equipment 0.7% | | | | | | | | |
| a | First Solar Inc. | | | 50,000 | | | | 7,367,500 | |
| Intel Corp. | | | 500,000 | | | | 9,615,000 | |
| a | SunPower Corp., A | | | 2,000 | | | | 28,800 | |
| a | SunPower Corp., B | | | 48,000 | | | | 665,280 | |
| Texas Instruments Inc. | | | 250,000 | | | | 6,785,000 | |
| | | | | | | | |
| | | | | | | | 24,461,580 | |
| | | | | | | | |
| Software & Services 9.1% | | | | | | | | |
| a | Adobe Systems Inc. | | | 527,900 | | | | 13,804,585 | |
| a | Autodesk Inc. | | | 800,000 | | | | 25,576,000 | |
| Automatic Data Processing Inc. | | | 700,000 | | | | 29,421,000 | |
| a | Citrix Systems Inc. | | | 200,000 | | | | 13,648,000 | |
| Computer Sciences Corp. | | | 1,000,000 | | | | 46,000,000 | |
| a | Google Inc., A | | | 76,300 | | | | 40,117,777 | |
| a | lAC/lnterActiveCorp | | | 150,050 | | | | 3,941,814 | |
| International Business Machines Corp. | | | 580,000 | | | | 77,801,200 | |
| MasterCard Inc., A | | | 80,000 | | | | 17,920,000 | |
| Microsoft Corp. | | | 325,000 | | | | 7,959,250 | |
| Oracle Corp. | | | 500,000 | | | | 13,425,000 | |
| Visa Inc., A | | | 250,000 | | | | 18,565,000 | |
| a | Yahoo! Inc. | | | 1,600,000 | | | | 22,672,000 | |
| | | | | | | | |
| | | | | | | | 330,851,626 | |
| | | | | | | | |
| Technology Hardware & Equipment 12.6% | | | | | | | | |
| a | Agilent Technologies Inc. | | | 1,150,000 | | | | 38,375,500 | |
| a | Apple Inc. | | | 811,000 | | | | 230,121,250 | |
| a | Cisco Systems Inc. | | | 2,695,000 | | | | 59,020,500 | |
| a | EMC Corp. | | | 1,000,000 | | | | 20,310,000 | |
| Hewlett-Packard Co. | | | 1,156,250 | | | | 48,643,438 | |
| a | Logitech International SA (Switzerland) | | | 150,000 | | | | 2,610,000 | |
| Molex Inc. | | | 71,483 | | | | 1,496,139 | |
| Molex Inc., A | | | 133,100 | | | | 2,326,588 | |
| QUALCOMM Inc. | | | 660,000 | | | | 29,779,200 | |
| a | Research In Motion Ltd. (Canada) | | | 600,000 | | | | 29,214,000 | |
| | | | | | | | |
| | | | | | | | 461,896,615 | |
| | | | | | | | |
| Telecommunication Services 1.4% | | | | | | | | |
| America Movil SAB de CV, L, ADR (Mexico) | | | 259,300 | | | | 13,828,469 | |
| a | American Tower Corp., A | | | 715,000 | | | | 36,650,900 | |
| | | | | | | | |
| | | | | | | | 50,479,369 | |
| | | | | | | | |
| Transportation 8.0% | | | | | | | | |
| a | Air France-KLM, ADR (France) | | | 600,000 | | | | 9,204,000 | |
| a | Alaska Air Group Inc. | | | 600,000 | | | | 30,618,000 | |
| Allegiant Travel Co. | | | 100,000 | | | | 4,232,000 | |
| Arkansas Best Corp. | | | 500,000 | | | | 12,115,000 | |
Annual Report | 75
Franklin Custodian Funds
Statement of Investments, September 30, 2010 (continued)
| | | | | | | | | | |
| | Franklin Growth Fund | | Shares | | | Value | |
| | |
| | Common Stocks (continued) | | | | | | | | |
| | Transportation (continued) | | | | | | | | |
| a | British Airways PLC, ADR (United Kingdom) | | | 1,200,000 | | | $ | 22,704,000 | |
| | C.H. Robinson Worldwide Inc. | | | 267,300 | | | | 18,689,616 | |
| | Canadian National Railway Co. (Canada) | | | 500,000 | | | | 32,010,000 | |
| | Canadian Pacific Railway Ltd. (Canada) | | | 500,000 | | | | 30,465,000 | |
| a | Continental Airlines Inc., B | | | 1,000,000 | | | | 24,840,000 | |
| | Expeditors International of Washington Inc. | | | 404,200 | | | | 18,686,166 | |
| | Forward Air Corp. | | | 495,333 | | | | 12,878,658 | |
| | Heartland Express Inc. | | | 500,000 | | | | 7,435,000 | |
| | Ryanair Holdings PLC, ADR (Ireland) | | | 239,200 | | | | 7,369,752 | |
| | Southwest Airlines Co. | | | 65,200 | | | | 852,164 | |
| | Union Pacific Corp. | | | 600,000 | | | | 49,080,000 | |
| | Werner Enterprises Inc. | | | 462,000 | | | | 9,466,380 | |
| | | | | | | | | |
| | | | | | | | | 290,645,736 | |
| | | | | | | | | |
| | Utilities 1.3% | | | | | | | | |
| | American Water Works Co. Inc. | | | 700,000 | | | | 16,289,000 | |
| | International Power PLC (United Kingdom) | | | 3,058,904 | | | | 18,652,015 | |
| | NextEra Energy Inc. | | | 250,000 | | | | 13,597,500 | |
| | | | | | | | | |
| | | | | | | | | 48,538,515 | |
| | | | | | | | | |
| | Total Common Stocks (Cost $1,745,179,804) | | | | | | | 3,405,567,604 | |
| | | | | | | | | |
| | Short Term Investments 5.8% | | | | | | | | |
| | Money Market Funds (Cost $181,648,270) 5.0% | | | | | | | | |
| a,b | Institutional Fiduciary Trust Money Market Portfolio, 0.00% | | | 181,648,270 | | | | 181,648,270 | |
| | | | | | | | | |
| | | | | | | | | | |
| | | | Principal Amount | | | | | |
| | Repurchase Agreements (Cost $31,822,988) 0.8% | | | | | | | | |
| c | Joint Repurchase Agreement, 0.205%, 10/01/10 (Maturity Value $31,823,169) | | $ | 31,822,988 | | | | 31,822,988 | |
| | Banc of America Securities LLC (Maturity Value $3,874,789) | | | | | | | | |
| | Barclays Capital Inc. (Maturity Value $1,808,192) | | | | | | | | |
| | BNP Paribas Securities Corp. (Maturity Value $6,716,280) | | | | | | | | |
| | Credit Suisse Securities (USA) LLC (Maturity Value $6,458,512) | | | | | | | | |
| | Deutsche Bank Securities Inc. (Maturity Value $2,632,731) | | | | | | | | |
| | HSBC Securities (USA) Inc. (Maturity Value $3,874,789) | | | | | | | | |
| | Morgan Stanley & Co. Inc. (Maturity Value $3,874,789) | | | | | | | | |
| | UBS Securities LLC (Maturity Value $2,583,087) | | | | | | | | |
| | Collateralized by U.S. Government Agency Securities, 0.146% - 6.25%, 2/01/11 - 4/18/17; | | | | | | | | |
| | dU.S. Government Agency Discount Notes, 1/14/11 - 2/28/14 and U.S. Treasury Notes, 0.875% - 10.625%, 2/28/11 - 8/15/15 | | | | | | | | |
| | | | | | | | | |
| | Total Investments (Cost $1,958,651,062) 99.1% | | | | | | | 3,619,038,862 | |
| | Other Assets, less Liabilities 0.9% | | | | | | | 31,965,725 | |
| | | | | | | | | |
| | Net Assets 100.0% | | | | | | $ | 3,651,004,587 | |
| | | | | | | | | |
| | | |
| See Abbreviations on page 142. |
|
| | | |
| a | | Non-income producing. |
| | | |
| b | | See Note 7 regarding investments in the Institutional Fiduciary Trust Money Market Portfolio. The rate shown is the annualized seven-day yield at period end. |
| | | |
| c | | See Note 1(c) regarding joint repurchase agreement. |
| | | |
| d | | The security is traded on a discount basis with no stated coupon rate. |
76 | The accompanying notes are an integral part of these financial statements. | Annual Report
Franklin Custodian Funds
Financial Highlights
Franklin Income Fund
| | | | | | | | | | | | | | | | | | | | | |
| | | Year Ended September 30, |
| Class A | | 2010 | | 2009 | | 2008 | | 2007 | | 2006 |
| | | |
Per share operating performance
(for a share outstanding throughout the year) | | | | | | | | | | | | | | | | | | | | |
| Net asset value, beginning of year | | $ | 1.99 | | | $ | 1.98 | | | $ | 2.74 | | | $ | 2.57 | | | $ | 2.50 | |
| | | |
Income from investment operationsa: | | | | | | | | | | | | | | | | | | | | |
Net investment incomeb | | | 0.13 | | | | 0.13 | | | | 0.16 | | | | 0.14 | | | | 0.14 | |
| Net realized and unrealized gains (losses) | | | 0.14 | | | | 0.04 | | | | (0.71 | ) | | | 0.21 | | | | 0.09 | |
| | | |
| Total from investment operations | | | 0.27 | | | | 0.17 | | | | (0.55 | ) | | | 0.35 | | | | 0.23 | |
| | | |
| Less distributions from: | | | | | | | | | | | | | | | | | | | | |
| Net investment income | | | (0.15 | ) | | | (0.16 | ) | | | (0.15 | ) | | | (0.14 | ) | | | (0.15 | ) |
| Net realized gains | | | — | | | | — | c | | | (0.06 | ) | | | (0.04 | ) | | | (0.01 | ) |
| | | |
| Total distributions | | | (0.15 | ) | | | (0.16 | ) | | | (0.21 | ) | | | (0.18 | ) | | | (0.16 | ) |
| | | |
Redemption feesd | | | — | | | | — | | | | — | c | | | — | c | | | — | c |
| | | |
| Net asset value, end of year | | $ | 2.11 | | | $ | 1.99 | | | $ | 1.98 | | | $ | 2.74 | | | $ | 2.57 | |
| | | |
| | | | | | | | | | | | | | | | | | | | | |
Total returne | | | 13.90 | % | | | 10.56 | % | | | (21.36 | )% | | | 14.14 | % | | | 9.73 | % |
| | | | | | | | | | | | | | | | | | | | | |
Ratios to average net assets | | | | | | | | | | | | | | | | | | | | |
| Expenses | | | 0.65 | %f | | | 0.68 | %f | | | 0.62 | %f | | | 0.63 | %f | | | 0.64 | %g |
| Net investment income | | | 6.40 | % | | | 7.93 | % | | | 6.44 | % | | | 5.31 | % | | | 5.61 | % |
| | | | | | | | | | | | | | | | | | | | | |
Supplemental data | | | | | | | | | | | | | | | | | | | | |
| Net assets, end of year (000’s) | | $ | 32,281,991 | | | $ | 27,773,006 | | | $ | 26,892,973 | | | $ | 35,476,603 | | | $ | 26,641,398 | |
| Portfolio turnover rate | | | 46.85 | % | | | 51.36 | % | | | 39.92 | % | | | 25.45 | % | | | 28.35 | % |
| | |
| a | | The amount shown for a share outstanding throughout the period may not correlate with the Statement of Operations for the period due to the timing of sales and repurchases of the Fund shares in relation to income earned and/or fluctuating market value of the investments of the Fund. |
| | | |
| b | | Based on average daily shares outstanding. |
| | | |
| c | | Amount rounds to less than $0.01 per share. |
| | | |
| d | | Effective September 1, 2008, the redemption fee was eliminated. |
| | | |
| e | | Total return does not reflect sales commissions or contingent deferred sales charges, if applicable. |
| | | |
| f | | Benefit of expense reduction rounds to less than 0.01%. |
| | | |
| g | | Benefit of waiver and payment by affiliate and expense reduction rounds to less than 0.01%. |
Annual Report | The accompanying notes are an integral part of these financial statements. | 77
Franklin Custodian Funds
Financial Highlights (continued)
Franklin Income Fund
| | | | | | | | | | | | | | | | | | | | | |
| | | Year Ended September 30, |
| Class B | | 2010 | | 2009 | | 2008 | | 2007 | | 2006 |
| | | |
Per share operating performance
(for a share outstanding throughout the year) | | | | | | | | | | | | | | | | | | | | |
| Net asset value, beginning of year | | $ | 1.98 | | | $ | 1.97 | | | $ | 2.73 | | | $ | 2.56 | | | $ | 2.49 | |
| | | |
Income from investment operationsa: | | | | | | | | | | | | | | | | | | | | |
Net investment incomeb | | | 0.12 | | | | 0.12 | | | | 0.14 | | | | 0.12 | | | | 0.12 | |
| Net realized and unrealized gains (losses) | | | 0.13 | | | | 0.04 | | | | (0.71 | ) | | | 0.21 | | | | 0.08 | |
| | | |
| Total from investment operations | | | 0.25 | | | | 0.16 | | | | (0.57 | ) | | | 0.33 | | | | 0.20 | |
| | | |
| Less distributions from: | | | | | | | | | | | | | | | | | | | | |
| Net investment income | | | (0.13 | ) | | | (0.15 | ) | | | (0.13 | ) | | | (0.12 | ) | | | (0.12 | ) |
| Net realized gains | | | — | | | | — | c | | | (0.06 | ) | | | (0.04 | ) | | | (0.01 | ) |
| | | |
| Total distributions | | | (0.13 | ) | | | (0.15 | ) | | | (0.19 | ) | | | (0.16 | ) | | | (0.13 | ) |
| | | |
Redemption feesd | | | — | | | | — | | | | — | c | | | — | c | | | — | c |
| | | |
| Net asset value, end of year | | $ | 2.10 | | | $ | 1.98 | | | $ | 1.97 | | | $ | 2.73 | | | $ | 2.56 | |
| | | |
| | | | | | | | | | | | | | | | | | | | | |
Total returne | | | 12.99 | % | | | 9.70 | % | | | (22.13 | )% | | | 13.23 | % | | | 8.83 | % |
| | | | | | | | | | | | | | | | | | | | | |
Ratios to average net assets | | | | | | | | | | | | | | | | | | | | |
| Expenses | | | 1.49 | %f | | | 1.53 | %f | | | 1.47 | %f | | | 1.48 | %f | | | 1.49 | %g |
| Net investment income | | | 5.56 | % | | | 7.08 | % | | | 5.59 | % | | | 4.46 | % | | | 4.76 | % |
| | | | | | | | | | | | | | | | | | | | | |
Supplemental data | | | | | | | | | | | | | | | | | | | | |
| Net assets, end of year (000’s) | | $ | 1,629,726 | | | $ | 2,051,280 | | | $ | 2,428,765 | | | $ | 3,745,636 | | | $ | 3,743,374 | |
| Portfolio turnover rate | | | 46.85 | % | | | 51.36 | % | | | 39.92 | % | | | 25.45 | % | | | 28.35 | % |
| | |
| a | | The amount shown for a share outstanding throughout the period may not correlate with the Statement of Operations for the period due to the timing of sales and repurchases of the Fund shares in relation to income earned and/or fluctuating market value of the investments of the Fund. |
| | | |
| b | | Based on average daily shares outstanding. |
| | | |
| c | | Amount rounds to less than $0.01 per share. |
| | | |
| d | | Effective September 1, 2008, the redemption fee was eliminated. |
| | | |
| e | | Total return does not reflect sales commissions or contingent deferred sales charges, if applicable. |
| | | |
| f | | Benefit of expense reduction rounds to less than 0.01%. |
| | | |
| g | | Benefit of waiver and payment by affiliate and expense reduction rounds to less than 0.01%. |
78 | The accompanying notes are an integral part of these financial statements. | Annual Report
Franklin Custodian Funds
Financial Highlights (continued)
Franklin Income Fund
| | | | | | | | | | | | | | | | | | | | | |
| | | Year Ended September 30, |
| Class B1 | | 2010 | | 2009 | | 2008 | | 2007 | | 2006 |
| | | |
Per share operating performance
(for a share outstanding throughout the year) | | | | | | | | | | | | | | | | | | | | |
| Net asset value, beginning of year | | $ | 1.99 | | | $ | 1.98 | | | $ | 2.74 | | | $ | 2.57 | | | $ | 2.50 | |
| | | |
Income from investment operationsa: | | | | | | | | | | | | | | | | | | | | |
Net investment incomeb | | | 0.13 | | | | 0.13 | | | | 0.15 | | | | 0.13 | | | | 0.13 | |
| Net realized and unrealized gains (losses) | | | 0.13 | | | | 0.03 | | | | (0.71 | ) | | | 0.21 | | | | 0.08 | |
| | | |
| Total from investment operations | | | 0.26 | | | | 0.16 | | | | (0.56 | ) | | | 0.34 | | | | 0.21 | |
| | | |
| Less distributions from: | | | | | | | | | | | | | | | | | | | | |
| Net investment income | | | (0.13 | ) | | | (0.15 | ) | | | (0.14 | ) | | | (0.13 | ) | | | (0.13 | ) |
| Net realized gains | | | — | | | | — | c | | | (0.06 | ) | | | (0.04 | ) | | | (0.01 | ) |
| | | |
| Total distributions | | | (0.13 | ) | | | (0.15 | ) | | | (0.20 | ) | | | (0.30 | ) | | | (0.14 | ) |
| | | |
Redemption feesd | | | — | | | | — | | | | — | c | | | — | c | | | — | c |
| | | |
| Net asset value, end of year | | $ | 2.12 | | | $ | 1.99 | | | $ | 1.98 | | | $ | 2.74 | | | $ | 2.57 | |
| | | |
| | | | | | | | | | | | | | | | | | | | | |
Total returne | | | 13.73 | % | | | 10.03 | % | | | (21.77 | )% | | | 13.57 | % | | | 9.17 | % |
| | | | | | | | | | | | | | | | | | | | | |
Ratios to average net assets | | | | | | | | | | | | | | | | | | | | |
| Expenses | | | 1.14 | %f | | | 1.17 | %f | | | 1.12 | %f | | | 1.13 | %f | | | 1.14 | %g |
| Net investment income | | | 5.91 | % | | | 7.44 | % | | | 5.94 | % | | | 4.81 | % | | | 5.11 | % |
| | | | | | | | | | | | | | | | | | | | | |
Supplemental data | | | | | | | | | | | | | | | | | | | | |
| Net assets, end of year (000’s) | | $ | 23,551 | | | $ | 68,825 | | | $ | 224,713 | | | $ | 397,224 | | | $ | 459,302 | |
| Portfolio turnover rate | | | 46.85 | % | | | 51.36 | % | | | 39.92 | % | | | 25.45 | % | | | 28.35 | % |
| | |
| a | | The amount shown for a share outstanding throughout the period may not correlate with the Statement of Operations for the period due to the timing of sales and repurchases of the Fund shares in relation to income earned and/or fluctuating market value of the investments of the Fund. |
| | | |
| b | | Based on average daily shares outstanding. |
| | | |
| c | | Amount rounds to less than $0.01 per share. |
| | | |
| d | | Effective September 1, 2008, the redemption fee was eliminated. |
| | | |
| e | | Total return does not reflect sales commissions or contingent deferred sales charges, if applicable. |
| | | |
| f | | Benefit of expense reduction rounds to less than 0.01%. |
| | | |
| g | | Benefit of waiver and payment by affiliate and expense reduction rounds to less than 0.01%. |
Annual Report | The accompanying notes are an integral part of these financial statements. | 79
Franklin Custodian Funds
Financial Highlights (continued)
Franklin Income Fund
| | | | | | | | | | | | | | | | | | | | | |
| | | Year Ended September 30, |
| Class C | | 2010 | | 2009 | | 2008 | | 2007 | | 2006 |
Per share operating performance
(for a share outstanding throughout the year) | | | | | | | | | | | | | | | | | | | | |
| Net asset value, beginning of year | | $ | 2.00 | | | $ | 1.99 | | | $ | 2.76 | | | $ | 2.59 | | | $ | 2.51 | |
| | | |
Income from investment operationsa: | | | | | | | | | | | | | | | | | | | | |
Net investment incomeb | | | 0.12 | | | | 0.13 | | | | 0.15 | | | | 0.13 | | | | 0.13 | |
| Net realized and unrealized gains (losses) | | | 0.15 | | | | 0.03 | | | | (0.72 | ) | | | 0.21 | | | | 0.09 | |
| | | |
| Total from investment operations | | | 0.27 | | | | 0.16 | | | | (0.57 | ) | | | 0.34 | | | | 0.22 | |
| | | |
| Less distributions from: | | | | | | | | | | | | | | | | | | | | |
| Net investment income | | | (0.14 | ) | | | (0.15 | ) | | | (0.14 | ) | | | (0.13 | ) | | | (0.13 | ) |
| Net realized gains | | | — | | | | — | c | | | (0.06 | ) | | | (0.04 | ) | | | (0.01 | ) |
| | | |
| Total distributions | | | (0.14 | ) | | | (0.15 | ) | | | (0.20 | ) | | | (0.17 | ) | | | (0.14 | ) |
| | | |
Redemption feesd | | | — | | | | — | | | | — | c | | | — | c | | | — | c |
| | | |
| Net asset value, end of year | | $ | 2.13 | | | $ | 2.00 | | | $ | 1.99 | | | $ | 2.76 | | | $ | 2.59 | |
| | | |
| | | | | | | | | | | | | | | | | | | | | |
Total returne | | | 13.76 | % | | | 9.93 | % | | | (21.98 | )% | | | 13.47 | % | | | 9.56 | % |
| | | | | | | | | | | | | | | | | | | | | |
Ratios to average net assets | | | | | | | | | | | | | | | | | | | | |
| Expenses | | | 1.15 | %f | | | 1.18 | %f | | | 1.12 | %f | | | 1.13 | %f | | | 1.14 | %g |
| Net investment income | | | 5.90 | % | | | 7.43 | % | | | 5.94 | % | | | 4.81 | % | | | 5.11 | % |
| | | | | | | | | | | | | | | | | | | | | |
Supplemental data | | | | | | | | | | | | | | | | | | | | |
| Net assets, end of year (000’s) | | $ | 15,605,055 | | | $ | 13,054,203 | | | $ | 12,443,143 | | | $ | 16,203,796 | | | $ | 12,138,969 | |
| Portfolio turnover rate | | | 46.85 | % | | | 51.36 | % | | | 39.92 | % | | | 25.45 | % | | | 28.35 | % |
| | |
| a | | The amount shown for a share outstanding throughout the period may not correlate with the Statement of Operations for the period due to the timing of sales and repurchases of the Fund shares in relation to income earned and/or fluctuating market value of the investments of the Fund. |
| | | |
| b | | Based on average daily shares outstanding. |
| | | |
| c | | Amount rounds to less than $0.01 per share. |
| | | |
| d | | Effective September 1, 2008, the redemption fee was eliminated. |
| | | |
| e | | Total return does not reflect sales commissions or contingent deferred sales charges, if applicable. |
| | | |
| f | | Benefit of expense reduction rounds to less than 0.01%. |
| | | |
| g | | Benefit of waiver and payment by affiliate and expense reduction rounds to less than 0.01%. |
80 | The accompanying notes are an integral part of these financial statements. | Annual Report
Franklin Custodian Funds
Financial Highlights (continued)
Franklin Income Fund
| | | | | | | | | | | | | | | | | | | | | |
| | | Year Ended September 30, |
| Class R | | 2010 | | 2009 | | 2008 | | 2007 | | 2006 |
Per share operating performance
(for a share outstanding throughout the year) | | | | | | | | | | | | | | | | | | | | |
| Net asset value, beginning of year | | $ | 1.96 | | | $ | 1.95 | | | $ | 2.71 | | | $ | 2.55 | | | $ | 2.48 | |
| | | |
Income from investment operationsa: | | | | | | | | | | | | | | | | | | | | |
Net investment incomeb | | | 0.12 | | | | 0.13 | | | | 0.15 | | | | 0.13 | | | | 0.13 | |
| Net realized and unrealized gains (losses) | | | 0.15 | | | | 0.03 | | | | (0.71 | ) | | | 0.20 | | | | 0.09 | |
| | | |
| Total from investment operations | | | 0.27 | | | | 0.16 | | | | (0.56 | ) | | | 0.33 | | | | 0.22 | |
| | | |
| Less distributions from: | | | | | | | | | | | | | | | | | | | | |
| Net investment income | | | (0.14 | ) | | | (0.15 | ) | | | (0.14 | ) | | | (0.13) | ) | | | (0.14 | ) |
| Net realized gains | | | — | | | | — | c | | | (0.06 | ) | | | (0.04 | ) | | | (0.01 | ) |
| | | |
| Total distributions | | | (0.14 | ) | | | (0.15 | ) | | | (0.20 | ) | | | (0.17 | ) | | | (0.15 | ) |
| | | |
Redemption feesd | | | — | | | | — | | | | — | c | | | — | c | | | — | c |
| | | |
| Net asset value, end of year | | $ | 2.09 | | | $ | 1.96 | | | $ | 1.95 | | | $ | 2.71 | | | $ | 2.55 | |
| | | |
| | | | | | | | | | | | | | | | | | | | | |
Total returne | | | 14.23 | % | | | 10.31 | % | | | (21.91 | )% | | | 13.47 | % | | | 9.43 | % |
| | | | | | | | | | | | | | | | | | | | | |
Ratios to average net assets | | | | | | | | | | | | | | | | | | | | |
| Expenses | | | 1.00 | %f | | | 1.03 | %f | | | 0.97 | %f | | | 0.98 | %f | | | 0.99 | %g |
| Net investment income | | | 6.05 | % | | | 7.58 | % | | | 6.09 | % | | | 4.96 | % | | | 5.26 | % |
| | | | | | | | | | | | | | | | | | | | | |
Supplemental data | | | | | | | | | | | | | | | | | | | | |
| Net assets, end of year (000’s) | | $ | 370,564 | | | $ | 315,298 | | | $ | 267,956 | | | $ | 286,670 | | | $ | 183,609 | |
| Portfolio turnover rate | | | 46.85 | % | | | 51.36 | % | | | 39.92 | % | | | 25.45 | % | | | 28.35 | % |
| | |
| a | | The amount shown for a share outstanding throughout the period may not correlate with the Statement of Operations for the period due to the timing of sales and repurchases of the Fund shares in relation to income earned and/or fluctuating market value of the investments of the Fund. |
| | | |
| b | | Based on average daily shares outstanding. |
| | | |
| c | | Amount rounds to less than $0.01 per share. |
| | | |
| d | | Effective September 1, 2008, the redemption fee was eliminated. |
| | | |
| e | | Total return does not reflect sales commissions or contingent deferred sales charges, if applicable. |
| | | |
| f | | Benefit of expense reduction rounds to less than 0.01%. |
| | | |
| g | | Benefit of waiver and payment by affiliate and expense reduction rounds to less than 0.01%. |
Annual Report | The accompanying notes are an integral part of these financial statements. | 81
Franklin Custodian Funds
Financial Highlights (continued)
Franklin Income Fund
| | | | | | | | | | | | | | | | | | | | | |
| | | Year Ended September 30, |
| Advisor Class | | 2010 | | | 2009 | | | 2008 | | | 2007 | | | 2006 | |
| | | |
Per share operating performance
(for a share outstanding throughout the year) | | | | | | | | | | | | | | | | | | | | |
| Net asset value, beginning of year | | $ | 1.98 | | | $ | 1.97 | | | $ | 2.73 | | | $ | 2.56 | | | $ | 2.49 | |
| | | |
Income from investment operationsa: | | | | | | | | | | | | | | | | | | | | |
Net investment incomeb | | | 0.13 | | | | 0.14 | | | | 0.16 | | | | 0.15 | | | | 0.14 | |
| Net realized and unrealized gains (losses) | | | 0.14 | | | | 0.03 | | | | (0.70 | ) | | | 0.21 | | | | 0.09 | |
| | | |
| Total from investment operations | | | 0.27 | | | | 0.17 | | | | (0.54 | ) | | | 0.36 | | | | 0.23 | |
| | | |
| Less distributions from: | | | | | | | | | | | | | | | | | | | | |
| Net investment income | | | (0.15 | ) | | | (0.16 | ) | | | (0.16 | ) | | | (0.15 | ) | | | (0.15 | ) |
| Net realized gains | | | — | | | | — | c | | | (0.06 | ) | | | (0.04 | ) | | | (0.01 | ) |
| | | |
| Total distributions | | | (0.15 | ) | | | (0.16 | ) | | | (0.22 | ) | | | (0.19 | ) | | | (0.16 | ) |
| | | |
Redemption feesd | | | — | | | | — | | | | — | c | | | — | c | | | — | c |
| | | |
| Net asset value, end of year | | $ | 2.10 | | | $ | 1.98 | | | $ | 1.97 | | | $ | 2.73 | | | $ | 2.56 | |
| | | |
| | | | | | | | | | | | | | | | | | | | | |
| Total return | | | 14.15 | % | | | 10.79 | % | | | (21.33 | )% | | | 14.36 | % | | | 9.94 | % |
| | | | | | | | | | | | | | | | | | | | | |
Ratios to average net assets | | | | | | | | | | | | | | | | | | | | |
| Expenses | | | 0.50 | %e | | | 0.53 | %e | | | 0.47 | %e | | | 0.48 | %e | | | 0.49 | %f |
| Net investment income | | | 6.55 | % | | | 8.08 | % | | | 6.59 | % | | | 5.46 | % | | | 5.76 | % |
| | | | | | | | | | | | | | | | | | | | | |
Supplemental data | | | | | | | | | | | | | | | | | | | | |
| Net assets, end of year (000’s) | | $ | 4,593,709 | | | $ | 4,183,925 | | | $ | 4,259,806 | | | $ | 6,195,966 | | | $ | 3,786,643 | |
| Portfolio turnover rate | | | 46.85 | % | | | 51.36 | % | | | 39.92 | % | | | 25.45 | % | | | 28.35 | % |
| | |
| a | | The amount shown for a share outstanding throughout the period may not correlate with the Statement of Operations for the period due to the timing of sales and repurchases of the Fund shares in relation to income earned and/or fluctuating market value of the investments of the Fund. |
| | | |
| b | | Based on average daily shares outstanding. |
| | | |
| c | | Amount rounds to less than $0.01 per share. |
| | | |
| d | | Effective September 1, 2008, the redemption fee was eliminated. |
| | | |
| e | | Benefit of expense reduction rounds to less than 0.01%. |
| | | |
| f | | Benefit of waiver and payment by affiliate and expense reduction rounds to less than 0.01%. |
82 | The accompanying notes are an integral part of these financial statements. | Annual Report
Franklin Custodian Funds
Statement of Investments, September 30, 2010
| | | | | | | | | | | | | | |
| | Franklin Income Fund | | Country | | Shares/Warrants | | Value | |
| | |
| | Common Stocks and Other Equity Interests 30.4% | | | | | | | | | | | | |
| | Consumer Discretionary 1.2% | | | | | | | | | | | | |
| a | Charter Communications Inc. | | United States | | | 11,871,333 | | | $ | 385,818,322 | |
| a | Charter Communications Inc., A | | United States | | | 4,084,845 | | | | 132,757,463 | |
| a | Charter Communications Inc., wts., 11/30/14 | | United States | | | 2,112,650 | | | | 11,619,575 | |
| a,b | Dex One Corp. | | United States | | | 10,242,757 | | | | 125,781,056 | |
| a | SuperMedia Inc., Litigation Trust | | United States | | | 30,326,101 | | | | 75,815 | |
| | | | | | | | | | | | | |
| | | | | | | | | | | | | 656,052,231 | |
| | | | | | | | | | | | | |
| | Consumer Staples 0.5% | | | | | | | | | | | | |
| | Diageo PLC | | United Kingdom | | | 9,000,000 | | | | 155,159,126 | |
| | PepsiCo Inc. | | United States | | | 1,500,000 | | | | 99,660,000 | |
| | | | | | | | | | | | | |
| | | | | | | | | | | | | 254,819,126 | |
| | | | | | | | | | | | | |
| | Energy 5.1% | | | | | | | | | | | | |
| | BP PLC, ADR | | United Kingdom | | | 6,000,000 | | | | 247,020,000 | |
| a,b | Callon Petroleum Co. | | United States | | | 4,181,258 | | | | 20,697,227 | |
| b | Canadian Oil Sands Trust | | United States | | | 26,000,000 | | | | 643,773,401 | |
| | ConocoPhillips | | United States | | | 8,000,000 | | | | 459,440,000 | |
| | Exxon Mobil Corp. | | United States | | | 16,000,000 | | | | 988,640,000 | |
| | Schlumberger Ltd. | | United States | | | 1,019,000 | | | | 62,780,590 | |
| | Spectra Energy Corp. | | United States | | | 10,000,000 | | | | 225,500,000 | |
| a | Weatherford International Ltd. | | United States | | | 6,315,000 | | | | 107,986,500 | |
| | | | | | | | | | | | | |
| | | | | | | | | | | | | 2,755,837,718 | |
| | | | | | | | | | | | | |
| | Financials 3.7% | | | | | | | | | | | | |
| | Bank of America Corp. | | United States | | | 35,000,000 | | | | 458,850,000 | |
| | Barclays PLC | | United Kingdom | | | 15,000,000 | | | | 70,613,667 | |
| a | CIT Group Inc. | | United States | | | 3,000,000 | | | | 122,460,000 | |
| a | Citigroup Inc. | | United States | | | 22,000,000 | | | | 85,800,000 | |
| b | Colony Financial Inc. | | United States | | | 1,250,000 | | | | 23,100,000 | |
| | HSBC Holdings PLC | | United Kingdom | | | 35,000,000 | | | | 354,832,398 | |
| | JPMorgan Chase & Co. | | United States | | | 10,250,000 | | | | 390,217,500 | |
| c | Wells Fargo & Co. | | United States | | | 19,000,000 | | | | 477,470,000 | |
| | | | | | | | | | | | | |
| | | | | | | | | | | | | 1,983,343,565 | |
| | | | | | | | | | | | | |
| | Health Care 4.4% | | | | | | | | | | | | |
| | Johnson & Johnson | | United States | | | 10,000,000 | | | | 619,600,000 | |
| | Merck & Co. Inc. | | United States | | | 25,000,000 | | | | 920,250,000 | |
| | Pfizer Inc. | | United States | | | 26,750,000 | | | | 459,297,500 | |
| | Roche Holding AG | | Switzerland | | | 3,000,000 | | | | 409,770,992 | |
| | | | | | | | | | | | | |
| | | | | | | | | | | | | 2,408,918,492 | |
| | | | | | | | | | | | | |
| | Industrials 0.2% | | | | | | | | | | | | |
| | General Electric Co. | | United States | | | 7,500,000 | | | | 121,875,000 | |
| a | Nortek Inc. | | United States | | | 40,000 | | | | 1,600,000 | |
| | | | | | | | | | | | | |
| | | | | | | | | | | | | 123,475,000 | |
| | | | | | | | | | | | | |
| | Information Technology 0.2% | | | | | | | | | | | | |
| | Intel Corp. | | United States | | | 5,000,000 | | | | 96,150,000 | |
| | | | | | | | | | | | | |
Annual Report | 83
Franklin Custodian Funds
Statement of Investments, September 30, 2010 (continued)
| | | | | | | | | | | | | | |
| | Franklin Income Fund | | Country | | Shares/Warrants | | Value |
| | |
| | Common Stocks and Other Equity Interests (continued) | | | | | | | | | | | | |
| | Materials 0.5% | | | | | | | | | | | | |
| | AngloGold Ashanti Ltd., ADR | | South Africa | | | 2,677,365 | | | $ | 123,801,358 | |
| | Barrick Gold Corp. | | Canada | | | 2,000,000 | | | | 92,580,000 | |
| | Weyerhaeuser Co. | | United States | | | 4,886,816 | | | | 77,016,220 | |
| | | | | | | | | | | | | |
| | | | | | | | | | | | | 293,397,578 | |
| | | | | | | | | | | | | |
| | Telecommunication Services 3.2% | | | | | | | | | | | | |
| | AT&T Inc. | | United States | | | 18,250,000 | | | | 521,950,000 | |
| | CenturyLink Inc. | | United States | | | 5,000,000 | | | | 197,300,000 | |
| | Frontier Communications Corp. | | United States | | | 10,160,357 | | | | 83,010,117 | |
| | Telstra Corp. Ltd. | | Australia | | | 75,000,000 | | | | 190,005,682 | |
| | Verizon Communications Inc. | | United States | | | 9,000,000 | | | | 293,310,000 | |
| | Vodafone Group PLC | | United Kingdom | | | 180,000,000 | | | | 444,402,885 | |
| | | | | | | | | | | | | |
| | | | | | | | | | | | | 1,729,978,684 | |
| | | | | | | | | | | | | |
| | Utilities 11.4% | | | | | | | | | | | | |
| | AGL Resources Inc. | | United States | | | 2,650,000 | | | | 101,654,000 | |
| | Ameren Corp. | | United States | | | 3,000,000 | | | | 85,200,000 | |
| | American Electric Power Co. Inc. | | United States | | | 10,000,000 | | | | 362,300,000 | |
| | CenterPoint Energy Inc. | | United States | | | 5,500,000 | | | | 86,460,000 | |
| | Consolidated Edison Inc. | | United States | | | 5,300,000 | | | | 255,566,000 | |
| | Dominion Resources Inc. | | United States | | | 10,500,000 | | | | 458,430,000 | |
| | DTE Energy Co. | | United States | | | 2,750,000 | | | | 126,307,500 | |
| | Duke Energy Corp. | | United States | | | 34,000,000 | | | | 602,140,000 | |
| | FirstEnergy Corp. | | United States | | | 2,800,000 | | | | 107,912,000 | |
| | NextEra Energy Inc. | | United States | | | 7,375,000 | | | | 401,126,250 | |
| | NiSource Inc. | | United States | | | 2,500,000 | | | | 43,500,000 | |
| | PG&E Corp. | | United States | | | 11,500,000 | | | | 522,330,000 | |
| | Pinnacle West Capital Corp. | | United States | | | 5,000,000 | | | | 206,350,000 | |
| | Portland General Electric Co. | | United States | | | 2,400,000 | | | | 48,672,000 | |
| | PPL Corp. | | United States | | | 6,665,600 | | | | 181,504,288 | |
| | Progress Energy Inc. | | United States | | | 9,400,000 | | | | 417,548,000 | |
| | Public Service Enterprise Group Inc. | | United States | | | 15,000,000 | | | | 496,200,000 | |
| | Sempra Energy | | United States | | | 6,500,000 | | | | 349,700,000 | |
| | The Southern Co. | | United States | | | 21,000,000 | | | | 782,040,000 | |
| | TECO Energy Inc. | | United States | | | 10,000,000 | | | | 173,200,000 | |
| | Xcel Energy Inc. | | United States | | | 18,500,000 | | | | 424,945,000 | |
| | | | | | | | | | | | | |
| | | | | | | | | | | | | 6,233,085,038 | |
| | | | | | | | | | | | | |
| | Total Common Stocks and Other Equity Interests
(Cost $15,275,214,935) | | | | | | | | | | | 16,535,057,432 | |
| | | | | | | | | | | | | |
| d | Equity-Linked Securities 4.5% | | | | | | | | | | | | |
| | Consumer Discretionary 0.1% | | | | | | | | | | | | |
| e | JPMorgan Chase & Co. into Comcast Corp., 8.00%, 144A | | United States | | | 5,000,000 | | | | 91,108,000 | |
| | | | | | | | | | | | | |
84 | Annual Report
Franklin Custodian Funds
Statement of Investments, September 30, 2010 (continued)
| | | | | | | | | | | | | | |
| | Franklin Income Fund | | Country | | Shares/Warrants | | Value |
| | |
| d | Equity-Linked Securities (continued) | | | | | | | | | | | | |
| | Energy 1.2% | | | | | | | | | | | | |
| e | Barclays Bank PLC into Weatherford International Ltd., 12.00%, 144A | | United States | | | 7,350,000 | | | $ | 130,878,510 | |
| | Credit Suisse into ConocoPhillips, 8.00% | | United States | | | 3,600,000 | | | | 206,832,960 | |
| | Credit Suisse into Schlumberger Ltd., 8.00% | | United States | | | 1,500,000 | | | | 91,560,000 | |
| e | Deutsche Bank AG into Chesapeake Energy Corp., 12.00%, 144A | | United States | | | 6,200,000 | | | | 145,283,980 | |
| e | Morgan Stanley into Baker Hughes Inc., 8.00%, 144A | | United States | | | 2,500,000 | | | | 105,187,500 | |
| | | | | | | | | | | | | |
| | | | | | | | | | | | | 679,742,950 | |
| | | | | | | | | | | | | |
| | Financials 0.7% | | | | | | | | | | | | |
| e | Barclays Capital PLC into Wells Fargo & Co., 8.00%, 144A | | United States | | | 5,406,000 | | | | 138,206,012 | |
| e | Deutsche Bank AG into Citigroup Inc., 10.00%, 144A | | United States | | | 24,500,000 | | | | 105,745,430 | |
| e | JPMorgan Chase & Co. into Bank of America, 9.00%, 144A | | United States | | | 5,000,000 | | | | 70,650,000 | |
| e | JPMorgan Chase & Co. into Citigroup Inc., 10.00%, 144A | | United States | | | 21,276,000 | | | | 86,048,441 | |
| | | | | | | | | | | | | |
| | | | | | | | | | | | | 400,649,883 | |
| | | | | | | | | | | | | |
| | Industrials 0.2% | | | | | | | | | | | | |
| e | JPMorgan Chase & Co. into First Solar Inc., 10.00%, 144A | | United States | | | 687,800 | | | | 93,077,911 | |
| | | | | | | | | | | | | |
| | Information Technology 1.0% | | | | | | | | | | | | |
| e | Barclays Bank PLC into Intel Corp., 8.00%., 144A | | United States | | | 9,653,000 | | | | 189,911,191 | |
| e | The Goldman Sachs Group Inc. into Xerox Corp., 12.00%, 144A | | United States | | | 13,400,000 | | | | 124,442,450 | |
| e | Morgan Stanley into Qualcomm Inc., 7.50%, 144A | | United States | | | 2,500,000 | | | | 109,356,750 | |
| e | Morgan Stanley into Xilinx Inc., 8.00%, 144A | | United States | | | 4,000,000 | | | | 104,354,800 | |
| | | | | | | | | | | | | |
| | | | | | | | | | | | | 528,065,191 | |
| | | | | | | | | | | | | |
| | Materials 1.1% | | | | | | | | | | | | |
| e | Barclays Capital PLC into Newmont Mining Corp., 8.50%, 144A | | United States | | | 3,044,000 | | | | 177,169,628 | |
| | Credit Suisse into Barrick Gold Corp., 9.00% | | United States | | | 4,910,000 | | | | 215,042,288 | |
| e | JPMorgan Chase & Co. into Nucor Corp., 9.00%, 144A | | United States | | | 2,100,000 | | | | 85,007,370 | |
| e | Morgan Stanley into Freeport-Mcmoran Copper & Gold Inc., 9.00%, 144A | | United States | | | 1,250,000 | | | | 104,526,000 | |
| | | | | | | | | | | | | |
| | | | | | | | | | | | | 581,745,286 | |
| | | | | | | | | | | | | |
| | Utilities 0.2% | | | | | | | | | | | | |
| | Credit Suisse into Calpine Corp., 8.00% | | United States | | | 8,000,000 | | | | 96,326,400 | |
| | | | | | | | | | | | | |
| | Total Equity-Linked Securities (Cost $2,447,724,306) | | | | | | | | | | | 2,470,715,621 | |
| | | | | | | | | | | | | |
| | Convertible Preferred Stocks 3.4% | | | | | | | | | | | | |
| | Consumer Discretionary 0.2% | | | | | | | | | | | | |
| a | General Motors Corp., 6.25%, cvt. pfd., C | | United States | | | 11,000,000 | | | | 85,470,000 | |
| | | | | | | | | | | | | |
| | Energy 0.3% | | | | | | | | | | | | |
| e | Chesapeake Energy Corp., 5.75%, cvt. pfd., 144A | | United States | | | 160,000 | | | | 164,739,200 | |
| | | | | | | | | | | | | |
Annual Report | 85
Franklin Custodian Funds
Statement of Investments, September 30, 2010 (continued)
| | | | | | | | | | | | | | |
Franklin Income Fund | | Country | | Shares/Warrants | | Value | |
| |
Convertible Preferred Stocks (continued) | | | | | | | | | | | | | |
Financials 2.4% | | | | | | | | | | | | | |
| Bank of America Corp., 7.25%, cvt. pfd., L | | United States | | | 679,738 | | | $ | 667,842,585 | | |
aFannie Mae, 5.375%, cvt. pfd. | | United States | | | 4,700 | | | | 8,648,000 | | |
aFannie Mae, 8.75%, cvt. pfd. | | United States | | | 3,239,000 | | | | 1,580,405 | | |
aFelcor Lodging Trust Inc., 7.80%, cvt. pfd., A | | United States | | | 3,050,000 | | | | 65,422,500 | | |
eForest City Enterprises Inc., 7.00%, cvt. pfd., 144A | | United States | | | 1,000,000 | | | | 53,799,500 | | |
aLehman Brothers Holdings Inc., 7.25%, cvt. pfd., P | | United States | | | 1,000,650 | | | | 800,520 | | |
aLehman Brothers Holdings Inc., 8.75%, cvt. pfd., Q | | United States | | | 550,000 | | | | 55 | | |
| Wells Fargo & Co., 7.50%, cvt. pfd., A | | United States | | | 512,900 | | | | 515,977,400 | | |
| | | | | | | | | | | | | |
| | | | | | | | | | | | 1,314,070,965 | | |
| | | | | | | | | | | | | |
Health Care 0.4% | | | | | | | | | | | | | |
| Tenet Healthcare Corp., 7.00%, cvt. pfd. | | United States | | | 250,000 | | | | 213,750,000 | | |
| | | | | | | | | | | | | |
Materials 0.1% | | | | | | | | | | | | | |
aAnglogold Ashanti Holdings Finance PLC, 6.00%, cvt. pfd. | | South Africa | | | 1,000,000 | | | | 53,000,000 | | |
| | | | | | | | | | | | | |
Utilities 0.0%† | | | | | | | | | | | | | |
| Nextera Energy Inc., 8.375%, cvt. pfd. | | United States | | | 500,000 | | | | 26,550,000 | | |
| | | | | | | | | | | | | |
Total Convertible Preferred Stocks (Cost $3,945,926,583) | | | | | | | | | | | 1,857,580,165 | | |
| | | | | | | | | | | | | |
Preferred Stocks 0.5% | | | | | | | | | | | | | |
Financials 0.5% | | | | | | | | | | | | | |
aFannie Mae, 6.75%, pfd. | | United States | | | 3,000,000 | | | | 1,050,000 | | |
aFannie Mae, 8.25%, pfd. | | United States | | | 11,784,000 | | | | 5,126,040 | | |
aFannie Mae, 7.625%, pfd., R | | United States | | | 2,399,400 | | | | 890,177 | | |
aFreddie Mac, 8.375%, pfd., Z | | United States | | | 16,608,000 | | | | 7,141,440 | | |
eGMAC Inc., 7.00%, pfd., 144A | | United States | | | 267,636 | | | | 245,556,030 | | |
| | | | | | | | | | | | | |
Total Preferred Stocks (Cost $928,695,780) | | | | | | | | | | | 259,763,687 | | |
| | | | | | | | | | | | | |
| | | | | | | | | | | | | | |
| | | | | | | Principal Amount* | | | | | |
Convertible Bonds 0.6% | | | | | | | | | | | | | |
Financials 0.6% | | | | | | | | | | | | | |
| CapitalSource Inc., cvt., senior sub. note, | | | | | | | | | | | | | |
| 4.00%, 7/15/34 | | United States | | | 118,925,000 | | | | 118,330,375 | | |
| 7.25%, 7/15/37 | | United States | | | 12,676,000 | | | | 12,612,620 | | |
fiStar Financial Inc., cvt., senior note, FRN, 1.033%, 10/01/12 | | United States | | | 240,000,000 | | | | 186,600,000 | | |
| | | | | | | | | | | | | |
| | | | | | | | | | | | 317,542,995 | | |
| | | | | | | | | | | | | |
Information Technology 0.0%† | | | | | | | | | | | | | |
| Advanced Micro Devices Inc., cvt., senior note, 6.00%, 5/01/15 | | United States | | | 17,172,000 | | | | 16,978,815 | | |
| | | | | | | | | | | | | |
Total Convertible Bonds (Cost $380,091,382) | | | | | | | | | | | 334,521,810 | | |
| | | | | | | | | | | | | |
86 | Annual Report
Franklin Custodian Funds
Statement of Investments, September 30, 2010 (continued)
| | | | | | | | | | | | | | |
| | Franklin Income Fund | | Country | | Principal Amount* | | Value |
| | |
| | Corporate Bonds 51.8% | | | | | | | | | | | | |
| | Consumer Discretionary 8.1% | | | | | | | | | | | | |
| | Cablevision Systems Corp., senior note, | | | | | | | | | | | | |
| | 8.625%, 9/15/17 | | United States | | | 100,000,000 | | | $ | 110,500,000 | |
| | 7.75%, 4/15/18 | | United States | | | 200,000,000 | | | | 212,500,000 | |
| | 8.00%, 4/15/20 | | United States | | | 150,000,000 | | | | 162,187,500 | |
| | CCH II LLC/CCH II Capital Corp., senior note, 13.50%, 11/30/16 | | United States | | | 227,347,163 | | | | 271,111,492 | |
| e | CCO Holdings LLC, senior note, 144A, 7.875%, 4/30/18 | | United States | | | 84,900,000 | | | | 88,508,250 | |
| e | Cequel Communications Holdings I LLC, senior note, 144A, 8.625%, 11/15/17 | | United States | | | 60,000,000 | | | | 63,600,000 | |
| e | CKE Restaurants Inc., senior secured note, 144A, 11.375%, 7/15/18 | | United States | | | 66,000,000 | | | | 67,980,000 | |
| | Clear Channel Worldwide Holdings Inc., senior note, | | | | | | | | | | | | |
| | A, 9.25%, 12/15/17 | | United States | | | 24,900,000 | | | | 26,518,500 | |
| | B, 9.25%, 12/15/17 | | United States | | | 116,050,000 | | | | 124,463,625 | |
| | CSC Holdings Inc., senior note, 8.50%, 4/15/14 | | United States | | | 67,300,000 | | | | 74,450,625 | |
| b,g | Dex One Corp., senior sub. note, PIK, 12.00%, 1/29/17 | | United States | | | 81,136,340 | | | | 64,199,129 | |
| | EchoStar DBS Corp., senior note, | | | | | | | | | | | | |
| | 7.75%, 5/31/15 | | United States | | | 40,000,000 | | | | 42,850,000 | |
| | 7.125%, 2/01/16 | | United States | | | 152,000,000 | | | | 160,550,000 | |
| | Ford Motor Credit Co. LLC, | | | | | | | | | | | | |
| | 8.00%, 6/01/14 | | United States | | | 400,000,000 | | | | 437,896,400 | |
| | senior note, 8.70%, 10/01/14 | | United States | | | 40,000,000 | | | | 45,100,000 | |
| | senior note, 7.00%, 4/15/15 | | United States | | | 450,000,000 | | | | 481,514,400 | |
| | senior note, 12.00%, 5/15/15 | | United States | | | 55,000,000 | | | | 69,300,000 | |
| | senior note, 8.125%, 1/15/20 | | United States | | | 47,700,000 | | | | 54,902,128 | |
| h | General Motors Corp., senior deb., 8.375%, 7/15/33 | | United States | | | 510,000,000 | | | | 174,675,000 | |
| | The Goodyear Tire & Rubber Co., senior note, 8.25%, 8/15/20 | | United States | | | 112,700,000 | | | | 119,180,250 | |
| | Harrah’s Operating Co. Inc., | | | | | | | | | | | | |
| | esenior note, 144A, 12.75%, 4/15/18 | | United States | | | 25,000,000 | | | | 23,437,500 | |
| | senior secured note, 11.25%, 6/01/17 | | United States | | | 150,000,000 | | | | 165,000,000 | |
| | Host Hotels & Resorts LP, senior note, | | | | | | | | | | | | |
| | O, 6.375%, 3/15/15 | | United States | | | 100,000,000 | | | | 102,875,000 | |
| | Q, 6.75%, 6/01/16 | | United States | | | 83,000,000 | | | | 86,423,750 | |
| | T, 9.00%, 5/15/17 | | United States | | | 116,750,000 | | | | 130,905,937 | |
| | KB Home, senior note, | | | | | | | | | | | | |
| | 5.75%, 2/01/14 | | United States | | | 75,000,000 | | | | 72,843,750 | |
| | 6.25%, 6/15/15 | | United States | | | 90,000,000 | | | | 86,400,000 | |
| | 9.10%, 9/15/17 | | United States | | | 49,000,000 | | | | 50,592,500 | |
| | 7.25%, 6/15/18 | | United States | | | 70,500,000 | | | | 66,446,250 | |
| | MGM Resorts International, senior note, | | | | | | | | | | | | |
| | 6.75%, 4/01/13 | | United States | | | 70,000,000 | | | | 65,362,500 | |
| | 11.375%, 3/01/18 | | United States | | | 25,000,000 | | | | 23,937,500 | |
| | Michaels Stores Inc., senior note, 10.00%, 11/01/14 | | United States | | | 48,235,000 | | | | 51,068,806 | |
| e,g | Univision Communications Inc., senior note, 144A, PIK, 10.50%, 3/15/15 | | United States | | | 308,967,064 | | | | 296,085,300 | |
| e | UPC Germany GmbH, senior secured note, 144A, | | | | | | | | | | | | |
| | 8.125%, 12/01/17 | | Germany | | | 52,700,000 | | | | 55,302,062 | |
| | 8.125%, 12/01/17 | | Germany | | 43,900,000 | EUR | | | 63,079,624 | |
| | 9.625%, 12/01/19 | | Germany | | 23,100,000 | EUR | | | 34,178,872 | |
Annual Report | 87
Franklin Custodian Funds
Statement of Investments, September 30, 2010 (continued)
| | | | | | | | | | | | | | |
| | Franklin Income Fund | | Country | | Principal Amount* | | Value |
| | |
| | Corporate Bonds (continued) | | | | | | | | | | | | |
| | Consumer Discretionary (continued) | | | | | | | | | | | | |
| | Virgin Media Secured Finance, senior secured note, 7.00%, 1/15/18 | | United Kingdom | | 70,000,000 | GBP | | $ | 116,622,755 | |
| e | Visant Corp., senior note, 144A, 10.00%, 10/01/17 | | United States | | | 46,800,000 | | | | 49,023,000 | |
| | | | | | | | | | | | | |
| | | | | | | | | | | | | 4,391,572,405 | |
| | | | | | | | | | | | | |
| | Consumer Staples 0.5% | | | | | | | | | | | | |
| e | JBS USA LLC, senior note, 144A, 11.625%, 5/01/14 | | United States | | | 134,500,000 | | | | 156,692,500 | |
| | SUPERVALU Inc., senior note, 8.00%, 5/01/16 | | United States | | | 108,500,000 | | | | 109,856,250 | |
| | | | | | | | | | | | | |
| | | | | | | | | | | | | 266,548,750 | |
| | | | | | | | | | | | | |
| | Energy 9.8% | | | | | | | | | | | | |
| | Alon Refining Krotz Springs Inc., senior secured note, 13.50%, 10/15/14 | | United States | | | 30,000,000 | | | | 29,400,000 | |
| | Anadarko Petroleum Corp., senior note, 5.95%, 9/15/16 | | United States | | | 90,000,000 | | | | 98,446,860 | |
| | Antero Resources Finance, senior note, 9.375%, 12/01/17 | | United States | | | 106,200,000 | | | | 113,368,500 | |
| e | ATP Oil & Gas Corp., senior secured note, 144A, 11.875%, 5/01/15 | | United States | | | 125,000,000 | | | | 108,437,500 | |
| b | Callon Petroleum Co., senior secured note, 13.00%, 9/15/16 | | United States | | | 75,000,000 | | | | 75,656,250 | |
| | Chesapeake Energy Corp., senior note, | | | | | | | | | | | | |
| | 9.50%, 2/15/15 | | United States | | | 100,000,000 | | | | 116,250,000 | |
| | 6.50%, 8/15/17 | | United States | | | 183,000,000 | | | | 190,777,500 | |
| | 6.875%, 8/15/18 | | United States | | | 104,000,000 | | | | 109,460,000 | |
| | 7.25%, 12/15/18 | | United States | | | 188,065,000 | | | | 203,580,362 | |
| | 6.875%, 11/15/20 | | United States | | | 143,000,000 | | | | 152,295,000 | |
| e | Consol Energy Inc., senior note, 144A, | | | | | | | | | | | | |
| | 8.00%, 4/01/17 | | United States | | | 42,450,000 | | | | 46,164,375 | |
| | 8.25%, 4/01/20 | | United States | | | 80,850,000 | | | | 88,732,875 | |
| | Crosstex Energy LP/Crosstex Energy Finance Corp., senior note, 8.875%, 2/15/18 | | United States | | | 32,800,000 | | | | 34,522,000 | |
| | Denbury Resources Inc., senior sub. note, 8.25%, 2/15/20 | | United States | | | 72,446,000 | | | | 79,418,928 | |
| | El Paso Corp., | | | | | | | | | | | | |
| | esenior bond, 144A, 6.50%, 9/15/20 | | United States | | | 161,600,000 | | | | 165,236,000 | |
| | senior note, 7.25%, 6/01/18 | | United States | | | 60,000,000 | | | | 64,961,460 | |
| | senior note, MTN, 7.75%, 1/15/32 | | United States | | | 250,000,000 | | | | 260,785,000 | |
| | Energy Transfer Equity LP, senior note, 7.50%, 10/15/20 | | United States | | | 153,700,000 | | | | 162,537,750 | |
| | EXCO Resources Inc., senior note, 7.50%, 9/15/18 | | United States | | | 52,400,000 | | | | 52,007,000 | |
| e | Expro Finance Luxembourg, senior secured note, 144A, 8.50%, 12/15/16 | | United Kingdom | | | 56,800,000 | | | | 54,386,000 | |
| | Forest Oil Corp., senior note, | | | | | | | | | | | | |
| | 8.50%, 2/15/14 | | United States | | | 45,000,000 | | | | 49,387,500 | |
| | 7.25%, 6/15/19 | | United States | | | 47,875,000 | | | | 49,191,563 | |
| | Holly Corp., senior note, 9.875%, 6/15/17 | | United States | | | 35,000,000 | | | | 37,231,250 | |
| e | Linn Energy Corp., senior note, 144A, | | | | | | | | | | | | |
| | 8.625%, 4/15/20 | | United States | | | 100,000,000 | | | | 106,500,000 | |
| | 7.75%, 2/01/21 | | United States | | | 75,000,000 | | | | 76,031,250 | |
| | Newfield Exploration Co., | | | | | | | | | | | | |
| | senior sub. bond, 6.875%, 2/01/20 | | United States | | | 100,000,000 | | | | 106,750,000 | |
| | senior sub. note, 6.625%, 4/15/16 | | United States | | | 42,000,000 | | | | 43,890,000 | |
88 | Annual Report
Franklin Custodian Funds
Statement of Investments, September 30, 2010 (continued)
| | | | | | | | | | | | | | |
Franklin Income Fund | | Country | | Principal Amount* | | Value | |
| |
Corporate Bonds (continued) | | | | | | | | | | | | | |
Energy (continued) | | | | | | | | | | | | | |
eNFR Energy LLC/NFR Finance Corp., senior note, 144A, 9.75%, 2/15/17 | | United States | | | 60,000,000 | | | $ | 60,000,000 | | |
| OPTI Canada Inc., senior note, 7.875%, 12/15/14 | | Canada | | | 70,000,000 | | | | 53,025,000 | | |
| Petrohawk Energy Corp., senior note, | | | | | | | | | | | | | |
| 10.50%, 8/01/14 | | United States | | | 129,050,000 | | | | 145,665,187 | | |
| 7.875%, 6/01/15 | | United States | | | 141,000,000 | | | | 148,402,500 | | |
ePetroplus Finance Ltd., senior note, 144A, | | | | | | | | | | | | | |
| 6.75%, 5/01/14 | | Switzerland | | | 145,000,000 | | | | 133,400,000 | | |
| 7.00%, 5/01/17 | | Switzerland | | | 125,000,000 | | | | 109,375,000 | | |
| 9.375%, 9/15/19 | | Bermuda | | | 94,930,000 | | | | 86,860,950 | | |
| Pioneer Natural Resources Co., senior bond, 6.875%, 5/01/18 | | United States | | | 100,000,000 | | | | 107,518,600 | | |
| Plains Exploration & Production Co., senior note, | | | | | | | | | | | | | |
| 7.75%, 6/15/15 | | United States | | | 95,500,000 | | | | 100,633,125 | | |
| 10.00%, 3/01/16 | | United States | | | 80,000,000 | | | | 91,600,000 | | |
| 8.625%, 10/15/19 | | United States | | | 50,000,000 | | | | 54,875,000 | | |
| Quicksilver Resources Inc., senior note, 9.125%, 8/15/19 | | United States | | | 90,000,000 | | | | 99,112,500 | | |
| Sabine Pass LNG LP, senior secured note, | | | | | | | | | | | | | |
| 7.25%, 11/30/13 | | United States | | | 100,000,000 | | | | 97,000,000 | | |
| 7.50%, 11/30/16 | | United States | | | 240,000,000 | | | | 220,200,000 | | |
| SandRidge Energy Inc., senior note, | | | | | | | | | | | | | |
e144A, 9.875%, 5/15/16 | | United States | | | 106,300,000 | | | | 110,286,250 | | |
e144A, 8.00%, 6/01/18 | | United States | | | 232,500,000 | | | | 227,850,000 | | |
e144A, 8.75%, 1/15/20 | | United States | | | 100,000,000 | | | | 99,500,000 | | |
fFRN, 4.158%, 4/01/14 | | United States | | | 80,000,000 | | | | 74,160,800 | | |
gPIK, 8.625%, 4/01/15 | | United States | | | 120,131,000 | | | | 120,731,655 | | |
| SEACOR Holdings Inc., senior note, 7.375%, 10/01/19 | | United States | | | 23,800,000 | | | | 25,996,669 | | |
| SESI LLC, senior note, 6.875%, 6/01/14 | | United States | | | 117,000,000 | | | | 118,462,500 | | |
| Tesoro Corp., | | | | | | | | | | | | | |
i7.50%, 7/17/12 | | United States | | | 100,000,000 | | | | 94,587,070 | | |
| senior note, 6.50%, 6/01/17 | | United States | | | 16,050,000 | | | | 15,889,500 | | |
| senior note, 9.75%, 6/01/19 | | United States | | | 36,400,000 | | | | 40,222,000 | | |
eW&T Offshore Inc., senior note, 144A, 8.25%, 6/15/14 | | United States | | | 192,500,000 | | | | 184,800,000 | | |
eWestern Refining Inc., | | | | | | | | | | | | | |
fsenior note, 144A, FRN, 10.75%, 6/15/14 | | United States | | | 25,000,000 | | | | 23,875,000 | | |
| senior secured note, 144A, 11.25%, 6/15/17 | | United States | | | 25,000,000 | | | | 23,625,000 | | |
| | | | | | | | | | | | | |
| | | | | | | | | | | | 5,343,059,229 | | |
| | | | | | | | | | | | | |
Financials 9.2% | | | | | | | | | | | | | |
jBank of America Corp., pfd., sub. bond, M, 8.125%, Perpetual | | United States | | | 100,000,000 | | | | 103,279,000 | | |
| CIT Group Inc., senior secured sub. bond, 7.00%, | | | | | | | | | | | | | |
| 5/01/14 | | United States | | | 115,100,000 | | | | 115,100,000 | | |
| 5/01/15 | | United States | | | 475,000,000 | | | | 472,625,000 | | |
| 5/01/16 | | United States | | | 825,000,000 | | | | 816,750,000 | | |
| 5/01/17 | | United States | | | 655,000,000 | | | | 644,356,250 | | |
| FelCor Lodging LP, senior secured note, 10.00%, 10/01/14 | | United States | | | 142,450,000 | | | | 155,626,625 | | |
| Forest City Enterprises Inc., senior note, 7.625%, 6/01/15 | | United States | | | 42,250,000 | | | | 39,503,750 | | |
eGMAC Inc., senior note, 144A, 8.00%, 3/15/20 | | United States | | | 205,000,000 | | | | 224,475,000 | | |
| Hexion U.S. Finance Corp., senior secured note, 8.875%, 2/01/18 | | United States | | | 35,000,000 | | | | 34,475,000 | | |
Annual Report | 89
Franklin Custodian Funds
Statement of Investments, September 30, 2010 (continued)
| | | | | | | | | | | | | | |
| | Franklin Income Fund | | Country | | Principal Amount* | | Value |
| | |
| | Corporate Bonds (continued) | | | | | | | | | | | | |
| | Financials (continued) | | | | | | | | | | | | |
| | International Lease Finance Corp., | | | | | | | | | | | | |
| | senior note, 8.875%, 9/01/17 | | United States | | | 73,300,000 | | | $ | 79,530,500 | |
| | esenior note, 144A, 8.625%, 9/15/15 | | United States | | | 58,300,000 | | | | 62,526,750 | |
| | esenior note, 144A, 8.75%, 3/15/17 | | United States | | | 171,500,000 | | | | 184,362,500 | |
| | esenior secured note, 144A, 6.75%, 9/01/16 | | United States | | | 79,200,000 | | | | 85,140,000 | |
| | esenior secured note, 144A, 7.125%, 9/01/18 | | United States | | | 122,300,000 | | | | 132,389,750 | |
| | iStar Financial Inc., | | | | | | | | | | | | |
| | senior note, 8.625%, 6/01/13 | | United States | | | 190,000,000 | | | | 156,987,500 | |
| | senior secured note, 10.00%, 6/15/14 | | United States | | | 110,000,000 | | | | 110,000,000 | |
| j | JPMorgan Chase & Co., junior sub. note, 1, 7.90%, Perpetual | | United States | | | 865,000,000 | | | | 930,109,415 | |
| e,f | Liberty Mutual Group, junior sub. note, 144A, FRN, 10.75%, 6/15/88 | | United States | | | 100,000,000 | | | | 119,000,000 | |
| j | Wells Fargo Capital XIII, 7.70%, Perpetual | | United States | | | 44,500,000 | | | | 46,391,250 | |
| j | Wells Fargo Capital XV, pfd., 9.75%, Perpetual | | United States | | | 449,600,000 | | | | 496,808,000 | |
| | | | | | | | | | | | | |
| | | | | | | | | | | | | 5,009,436,290 | |
| | | | | | | | | | | | | |
| | Health Care 5.4% | | | | | | | | | | | | |
| | Community Health Systems Inc., senior sub. note, 8.875%, 7/15/15 | | United States | | | 375,000,000 | | | | 399,375,000 | |
| | HCA Inc., | | | | | | | | | | | | |
| | 6.75%, 7/15/13 | | United States | | | 79,320,000 | | | | 81,303,000 | |
| | senior note, 6.375%, 1/15/15 | | United States | | | 169,455,000 | | | | 169,878,638 | |
| | senior note, 6.50%, 2/15/16 | | United States | | | 195,000,000 | | | | 195,975,000 | |
| | senior secured bond, 7.25%, 9/15/20 | | United States | | | 51,700,000 | | | | 55,577,500 | |
| | senior secured note, 9.25%, 11/15/16 | | United States | | | 300,000,000 | | | | 325,500,000 | |
| | senior secured note, 8.50%, 4/15/19 | | United States | | | 190,000,000 | | | | 212,800,000 | |
| | senior secured note, 7.875%, 2/15/20 | | United States | | | 165,000,000 | | | | 181,293,750 | |
| e,g | Quintiles Transnational Corp., senior note, 144A, PIK, 9.50%, 12/30/14 | | United States | | | 100,000,000 | | | | 103,000,000 | |
| | Tenet Healthcare Corp., | | | | | | | | | | | | |
| | senior note, 9.875%, 7/01/14 | | United States | | | 30,000,000 | | | | 32,400,000 | |
| | esenior note, 144A, 8.00%, 8/01/20 | | United States | | | 178,600,000 | | | | 178,600,000 | |
| | fsenior note, FRN, 9.25%, 2/01/15 | | United States | | | 115,000,000 | | | | 124,056,250 | |
| | senior secured note, 9.00%, 5/01/15 | | United States | | | 300,000,000 | | | | 327,750,000 | |
| | senior secured note, 10.00%, 5/01/18 | | United States | | | 300,000,000 | | | | 344,250,000 | |
| f,g | US Oncology Holdings Inc., senior note, PIK, FRN, 6.737%, 3/15/12 | | United States | | | 67,272,000 | | | | 63,877,320 | |
| | US Oncology Inc., senior note, 10.75%, 8/15/14 | | United States | | | 15,000,000 | | | | 15,675,000 | |
| | Vanguard Health Holding Co. II LLC, senior note, 8.00%, 2/01/18 | | United States | | | 151,000,000 | | | | 154,020,000 | |
| | | | | | | | | | | | | |
| | | | | | | | | | | | | 2,965,331,458 | |
| | | | | | | | | | | | | |
| | Industrials 4.9% | | | | | | | | | | | | |
| e | American Airlines Inc., senior secured note, 144A, 10.50%, 10/15/12 | | United States | | | 57,500,000 | | | | 62,531,250 | |
| e | Bombardier Inc., senior note, 144A, 7.75%, 3/15/20 | | Canada | | | 50,000,000 | | | | 54,375,000 | |
| e | Case New Holland Inc., senior note, 144A, 7.875%, 12/01/17 | | United States | | | 255,000,000 | | | | 280,500,000 | |
90 | Annual Report
Franklin Custodian Funds
Statement of Investments, September 30, 2010 (continued)
| | | | | | | | | | | | | | |
| | Franklin Income Fund | | Country | | Principal Amount* | | Value |
| | |
| | Corporate Bonds (continued) | | | | | | | | | | | | |
| | Industrials (continued) | | | | | | | | | | | | |
| e | Ceva Group PLC, senior secured note, 144A, | | | | | | | | | | | | |
| | 11.625%, 10/01/16 | | United Kingdom | | | 11,800,000 | | | $ | 12,595,227 | |
| | 11.50%, 4/01/18 | | United Kingdom | | | 212,525,000 | | | | 222,334,954 | |
| e,k | CHC Helicopter SA, senior secured note, 144A, 9.25%, 10/15/20 | | Canada | | | 196,700,000 | | | | 199,650,500 | |
| e | Delta Air Lines Inc., senior secured note, 144A, 9.50%, 9/15/14 | | United States | | | 61,178,000 | | | | 66,684,020 | |
| g | Diversey Holdings Inc., senior note, PIK, 10.50%, 5/15/20 | | United States | | | 49,200,000 | | | | 54,642,750 | |
| | Diversey Inc., senior note, 8.25%, 11/15/19 | | United States | | | 30,000,000 | | | | 32,250,000 | |
| | Greenbrier Cos. Inc., senior note, 8.375%, 5/15/15 | | United States | | | 31,706,000 | | | | 30,913,350 | |
| | Hertz Corp., | | | | | | | | | | | | |
| | senior note, 8.875%, 1/01/14 | | United States | | | 450,000,000 | | | | 464,062,500 | |
esenior note, 144A, 7.50%, 10/15/18 | | United States | | | 73,900,000 | | | | 74,269,500 | |
| | senior sub. note, 10.50%, 1/01/16 | | United States | | | 140,000,000 | | | | 149,450,000 | |
| | Icahn Enterprises LP, senior note, | | | | | | | | | | | | |
| | 7.75%, 1/15/16 | | United States | | | 85,000,000 | | | | 85,850,000 | |
| | 8.00%, 1/15/18 | | United States | | | 30,000,000 | | | | 30,300,000 | |
| e | Interactive Data Corp., senior note, 144A, 10.25%, 8/01/18 | | United States | | | 39,100,000 | | | | 42,032,500 | |
| | Manitowoc Co. Inc., senior note, 9.50%, 2/15/18 | | United States | | | 63,800,000 | | | | 66,990,000 | |
| | Navistar International Corp., senior note, 8.25%, 11/01/21 | | United States | | | 28,300,000 | | | | 30,351,750 | |
| | Nortek Inc., senior secured note, 11.00%, 12/01/13 | | United States | | | 40,177,777 | | | | 42,889,777 | |
| e | Pinafore LLC/Inc., senior secured note, 144A, 9.00%, 10/01/18 | | United States | | | 35,700,000 | | | | 37,663,500 | |
| | RBS Global & Rexnord Corp., | | | | | | | | | | | | |
| | senior note, 8.50%, 5/01/18 | | United States | | | 144,350,000 | | | | 147,417,438 | |
| | senior sub. note, 11.75%, 8/01/16 | | United States | | | 97,000,000 | | | | 104,275,000 | |
| | RSC Equipment Rental Inc./RSC Holdings III LLC, | | | | | | | | | | | | |
lsenior note, 10.25%, 11/15/19 | | United States | | | 58,000,000 | | | | 61,915,000 | |
esenior secured note, 144A, 10.00%, 7/15/17 | | United States | | | 30,000,000 | | | | 33,525,000 | |
| e | Severstal Columbus LLC, senior secured note, 144A, 10.25%, 2/15/18 | | United States | | | 15,000,000 | | | | 15,825,000 | |
| | Terex Corp., senior sub. note, 8.00%, 11/15/17 | | United States | | | 185,000,000 | | | | 186,156,250 | |
| | Transdigm Inc., senior sub. note, 7.75%, 7/15/14 | | United States | | | 25,000,000 | | | | 25,406,250 | |
| | United Rentals North America Inc., senior sub. note, 7.75%, 11/15/13 | | United States | | | 77,910,000 | | | | 79,078,650 | |
| | | | | | | | | | | | | |
| | | | | | | | | | | | | 2,693,935,166 | |
| | | | | | | | | | | | | |
| | Information Technology 5.3% | | | | | | | | | | | | |
| | Advanced Micro Devices Inc., senior note, | | | | | | | | | | | | |
| | 8.125%, 12/15/17 | | United States | | | 61,700,000 | | | | 65,402,000 | |
e144A, 7.75%, 8/01/20 | | United States | | | 27,700,000 | | | | 28,738,750 | |
| | Ceridian Corp., senior note, 11.25%, 11/15/15 | | United States | | | 75,000,000 | | | | 69,562,500 | |
| | First Data Corp., | | | | | | | | | | | | |
| | senior note, 9.875%, 9/24/15 | | United States | | | 799,822,000 | | | | 655,904,930 | |
| | senior sub. note, 11.25%, 3/31/16 | | United States | | | 409,000,000 | | | | 296,525,000 | |
Annual Report | 91
Franklin Custodian Funds
Statement of Investments, September 30, 2010 (continued)
| | | | | | | | | | | | | | |
| | Franklin Income Fund | | Country | | Principal Amount* | | Value |
| | |
| | Corporate Bonds (continued) | | | | | | | | | | | | |
| | Information Technology (continued) | | | | | | | | | | | | |
| | Freescale Semiconductor Inc., | | | | | | | | | | | | |
| | senior note, 8.875%, 12/15/14 | | United States | | | 490,000,000 | | | $ | 492,450,000 | |
| | senior note, 10.125%, 12/15/16 | | United States | | | 205,000,000 | | | | 187,575,000 | |
esenior note, 144A, 10.75%, 8/01/20 | | United States | | | 200,000,000 | | | | 201,500,000 | |
esenior secured note, 144A, 10.125%, 3/15/18 | | United States | | | 90,000,000 | | | | 96,075,000 | |
esenior secured note, 144A, 9.25%, 4/15/18 | | United States | | | 200,000,000 | | | | 208,000,000 | |
| | Lucent Technologies Inc., 6.45%, 3/15/29 | | United States | | | 95,900,000 | | | | 70,246,750 | |
| e | NXP BV/NXP Funding LLC, senior secured note, 144A, 9.75%, 8/01/18 | | Netherlands | | | 61,800,000 | | | | 66,126,000 | |
| | Sanmina-SCI Corp., senior sub. note, | | | | | | | | | | | | |
| | 6.75%, 3/01/13 | | United States | | | 116,500,000 | | | | 118,247,500 | |
| | 8.125%, 3/01/16 | | United States | | | 100,000,000 | | | | 103,000,000 | |
| | SunGard Data Systems Inc., | | | | | | | | | | | | |
| | senior note, 9.125%, 8/15/13 | | United States | | | 35,000,000 | | | | 35,918,750 | |
| | senior note, 10.625%, 5/15/15 | | United States | | | 55,000,000 | | | | 61,600,000 | |
| | senior sub. note, 10.25%, 8/15/15 | | United States | | | 85,000,000 | | | | 89,887,500 | |
| | ViaSat Inc., senior note, 8.875%, 9/15/16 | | United States | | | 49,250,000 | | | | 53,251,562 | |
| | | | | | | | | | | | | |
| | | | | | | | | | | | | 2,900,011,242 | |
| | | | | | | | | | | | | |
| | Materials 2.3% | | | | | | | | | | | | |
| e | Cemex Finance LLC, senior secured note, 144A, 9.50%, 12/14/16 | | United States | | | 50,000,000 | | | | 50,560,000 | |
| | Huntsman International LLC, | | | | | | | | | | | | |
| | senior note, 5.50%, 6/30/16 | | United States | | | 126,500,000 | | | | 121,756,250 | |
| | senior sub. note, 7.875%, 11/15/14 | | United States | | | 58,400,000 | | | | 60,882,000 | |
| | senior sub. note, 7.375%, 1/01/15 | | United States | | | 27,100,000 | | | | 27,642,000 | |
esenior sub. note, 144A, 8.625%, 3/15/21 | | United States | | | 8,100,000 | | | | 8,424,000 | |
| e | Ineos Finance PLC, senior secured note, 144A, 9.00%, 5/15/15 | | United Kingdom | | | 30,600,000 | | | | 32,130,000 | |
| e | Ineos Group Holdings PLC, senior sub. note, 144A, 7.875%, 2/15/16 | | United Kingdom | | 190,000,000 | EUR | | | 216,982,847 | |
| e | Kerling PLC, senior secured note, 144A, 10.625%, 1/28/17 | | United Kingdom | | 53,700,000 | EUR | | | 77,526,940 | |
| e | LBI Escrow Corp., senior secured note, 144A, 8.00%, 11/01/17 | | United States | | | 80,000,000 | | | | 87,600,000 | |
| | Nalco Co., senior note, 8.25%, 5/15/17 | | United States | | | 21,650,000 | | | | 24,031,500 | |
| | Nalco Finance Holdings LLC, senior note, 9.00%, 2/01/14 | | United States | | | 380,000,000 | | | | 390,450,000 | |
| | NewPage Corp., senior secured note, | | | | | | | | | | | | |
| | 10.00%, 5/01/12 | | United States | | | 52,800,000 | | | | 26,400,000 | |
| | 11.375%, 12/31/14 | | United States | | | 50,000,000 | | | | 45,500,000 | |
| e | Reynolds Group Issuer Inc./LLCA, senior note, 144A, 8.50%, 5/15/18 | | United States | | | 39,200,000 | | | | 38,514,000 | |
| | United States Steel Corp., senior note, 7.375%, 4/01/20 | | United States | | | 40,000,000 | | | | 41,900,000 | |
| | | | | | | | | | | | | |
| | | | | | | | | | | | | 1,250,299,537 | |
| | | | | | | | | | | | | |
| | Telecommunication Services 1.5% | | | | | | | | | | | | |
| e | Clearwire Communications LLC/Finance, senior secured note, 144A, 12.00%, 12/01/15 | | United States | | | 50,000,000 | | | | 54,000,000 | |
| e | Clearwire Corp., senior secured note, 144A, 12.00%, 12/01/15 | | United States | | | 145,000,000 | | | | 156,962,500 | |
| | Cricket Communications Inc., | | | | | | | | | | | | |
| | senior note, 9.375%, 11/01/14 | | United States | | | 65,000,000 | | | | 67,600,000 | |
| | senior secured note, 7.75%, 5/15/16 | | United States | | | 30,000,000 | | | | 31,987,500 | |
92 | Annual Report
Franklin Custodian Funds
Statement of Investments, September 30, 2010 (continued)
| | | | | | | | | | | | | | |
| | Franklin Income Fund | | Country | | Principal Amount* | | Value |
| | |
| | Corporate Bonds (continued) | | | | | | | | | | | | |
| | Telecommunication Services (continued) | | | | | | | | | | | | |
| e | Digicel Group Ltd., senior note, 144A, 8.875%, 1/15/15 | | Jamaica | | | 61,900,000 | | | $ | 63,447,500 | |
| | Frontier Communications Corp., senior note, | | | | | | | | | | | | |
| | 7.875%, 4/15/15 | | United States | | | 47,900,000 | | | | 51,971,500 | |
| | 8.25%, 4/15/17 | | United States | | | 57,975,000 | | | | 63,700,031 | |
| | 8.50%, 4/15/20 | | United States | | | 64,150,000 | | | | 71,126,313 | |
| | 8.75%, 4/15/22 | | United States | | | 63,900,000 | | | | 70,609,500 | |
| | Sprint Nextel Corp., senior note, 8.375%, 8/15/17 | | United States | | | 80,200,000 | | | | 87,418,000 | |
| | Virgin Media Finance PLC, senior note, 1, 9.50%, 8/15/16 | | United Kingdom | | | 74,800,000 | | | | 84,898,000 | |
| | | | | | | | | | | | | |
| | | | | | | | | | | | | 803,720,844 | |
| | | | | | | | | | | | | |
| | Utilities 4.8% | | | | | | | | | | | | |
| | The AES Corp., senior note, 8.00%, 10/15/17 | | United States | | | 80,000,000 | | | | 86,800,000 | |
| e | Calpine Construction Finance, senior secured note, 144A, 8.00%, 6/01/16 | | United States | | | 100,000,000 | | | | 107,500,000 | |
| e | Calpine Corp., senior secured note, 144A, | | | | | | | | | | | | |
| | 7.25%, 10/15/17 | | United States | | | 21,000,000 | | | | 21,472,500 | |
| | 7.875%, 7/31/20 | | United States | | | 61,000,000 | | | | 62,982,500 | |
| | Dynegy Holdings Inc., senior note, | | | | | | | | | | | | |
| | 7.50%, 6/01/15 | | United States | | | 198,500,000 | | | | 157,311,250 | |
| | 8.375%, 5/01/16 | | United States | | | 295,000,000 | | | | 231,575,000 | |
| | 7.75%, 6/01/19 | | United States | | | 105,000,000 | | | | 72,450,000 | |
e144A, 7.50%, 6/01/15 | | United States | | | 150,000,000 | | | | 118,125,000 | |
| | Dynegy Roseton Danskammer Pass Through Trust, secured bond, B, 7.67%, 11/08/16 | | United States | | | 64,500,000 | | | | 59,823,750 | |
| | Energy Future Holdings Corp., senior note, | | | | | | | | | | | | |
| | 10.875%, 11/01/17 | | United States | | | 6,658,000 | | | | 4,028,090 | |
gPIK, 12.00%, 11/01/17 | | United States | | | 77,000,000 | | | | 35,394,590 | |
| | R, 6.55%, 11/15/34 | | United States | | | 141,515,000 | | | | 54,483,275 | |
| e | Intergen NV, senior secured note, 144A, 9.00%, 6/30/17 | | Netherlands | | | 80,000,000 | | | | 85,000,000 | |
| e | Niska Gas Storage U.S./Canada, senior note, 144A, 8.875%, 3/15/18 | | United States | | | 75,000,000 | | | | 80,625,000 | |
| | Public Service Co. of New Mexico, senior note, 7.95%, 5/15/18 | | United States | | | 50,200,000 | | | | 55,532,495 | |
| | Reliant Energy Inc., senior note, | | | | | | | | | | | | |
| | 7.625%, 6/15/14 | | United States | | | 150,000,000 | | | | 149,250,000 | |
| | 7.875%, 6/15/17 | | United States | | | 180,000,000 | | | | 168,750,000 | |
| | Texas Competitive Electric Holdings Co. LLC, senior note, | | | | | | | | | | | | |
| | A, 10.25%, 11/01/15 | | United States | | | 890,700,000 | | | | 587,862,000 | |
| | B, 10.25%, 11/01/15 | | United States | | | 310,000,000 | | | | 204,600,000 | |
gPIK, 11.25%, 11/01/16 | | United States | | | 450,000,000 | | | | 251,537,850 | |
| | | | | | | | | | | | | |
| | | | | | | | | | | | | 2,595,103,300 | |
| | | | | | | | | | | | | |
| | Total Corporate Bonds (Cost $27,005,893,865) | | | | | | | | | | | 28,219,018,221 | |
| | | | | | | | | | | | | |
| f,m | Senior Floating Rate Interests 5.8% | | | | | | | | | | | | |
| | Consumer Discretionary 1.7% | | | | | | | | | | | | |
| | Clear Channel Communications Inc., Term Loan B, 3.906%, 1/29/16 | | United States | | | 537,786,283 | | | | 425,590,619 | |
| b | Dex Media West LLC, Term Loan B, 7.00%, 10/24/14 | | United States | | | 6,393,713 | | | | 5,574,078 | |
| | Harrah’s Operating Co. Inc., Incremental Term Loan, 9.50%, 10/01/16 | | United States | | | 99,250,000 | | | | 101,928,857 | |
Annual Report | 93
Franklin Custodian Funds
Statement of Investments, September 30, 2010 (continued)
| | | | | | | | | | | | | | |
| | Franklin Income Fund | | Country | | Principal Amount* | | Value |
| | |
| f,m | Senior Floating Rate Interests (continued) | | | | | | | | | | | | |
| | Consumer Discretionary (continued) | | | | | | | | | | | | |
| | Jarden Corp., Term Loan B-3, 2.283%, 1/24/12 | | United States | | | 18,518,835 | | | $ | 18,455,093 | |
| b | R.H. Donnelley Inc., Term Loan B, 9.00%, 10/24/14 | | United States | | | 37,206,015 | | | | 31,744,693 | |
| | SuperMedia Inc., Exit Term Loan, 11.00%, 12/31/15 | | United States | | | 24,963,302 | | | | 19,507,048 | |
| | Univision Communications Inc., Initial Term Loan, 2.065% - 2.506%, 9/29/14 | | United States | | | 19,747,651 | | | | 17,349,891 | |
| | Visant Corp. (Jostens), Tranche B Term Loan, 7.00%, 12/22/16 | | United States | | | 300,000,000 | | | | 302,040,000 | |
| | | | | | | | | | | | | |
| | | | | | | | | | | | | 922,190,279 | |
| | | | | | | | | | | | | |
| | Financials 0.1% | | | | | | | | | | | | |
| k | iStar Financial Inc., 2nd Lien Term Loan, 3.25%, 6/28/11 | | United States | | | 45,000,000 | | | | 42,041,250 | |
| | | | | | | | | | | | | |
| | Industrials 0.7% | | | | | | | | | | | | |
| | Allison Transmission Inc., Term Loan B, 3.01% - 3.05%, 8/07/14 | | United States | | | 97,713,223 | | | | 91,942,085 | |
| | Altegrity Inc., | | | | | | | | | | | | |
| | Term Loan B, 3.292%, 2/21/15 | | United States | | | 96,768,652 | | | | 89,027,160 | |
| | Tranche D Term Loan, 7.75%, 2/21/15 | | United States | | | 60,000,000 | | | | 60,112,500 | |
| | Ceva Group PLC, | | | | | | | | | | | | |
| | Dollar Pre-Refunded L/C Commitment, 3.289%, 8/01/12 | | United States | | | 13,684,211 | | | | 12,230,263 | |
| | EGL Term Loans, 3.256%, 8/01/12 | | United States | | | 112,535,526 | | | | 101,141,305 | |
| | Interactive Data Corp., Term Loan B, 6.75%, 1/29/17 | | United States | | | 54,862,500 | | | | 55,645,223 | |
| | | | | | | | | | | | | |
| | | | | | | | | | | | | 410,098,536 | |
| | | | | | | | | | | | | |
| | Information Technology 1.3% | | | | | | | | | | | | |
| k | First Data Corp., | | | | | | | | | | | | |
| | Term Loan B-1, 3.006%, 9/24/14 | | United States | | | 69,805,136 | | | | 61,620,484 | |
| | Term Loan B-2, 3.006%, 9/24/14 | | United States | | | 301,928,548 | | | | 266,414,202 | |
| | Term Loan B-3, 3.006%, 9/24/14 | | United States | | | 357,170,841 | | | | 315,157,906 | |
| | Freescale Semiconductor Inc., Extended Term Loan, 4.509%, 12/01/16 | | United States | | | 61,845,379 | | | | 56,691,618 | |
| | | | | | | | | | | | | |
| | | | | | | | | | | | | 699,884,210 | |
| | | | | | | | | | | | | |
| | Materials 0.1% | | | | | | | | | | | | |
| | Novelis Corp., U.S. Term Loan, 2.26%, 7/07/14 | | United States | | | 62,627,806 | | | | 60,748,972 | |
| | | | | | | | | | | | | |
| | Utilities 1.9% | | | | | | | | | | | | |
| k | Texas Competitive Electric Holdings Co. LLC, | | | | | | | | | | | | |
| | Term Loan, 3.25%, 10/10/14 | | United States | | | 269,911,625 | | | | 208,750,460 | |
| | Term Loan B-1, 3.758% - 3.789%, 10/10/14 | | United States | | | 316,293,749 | | | | 246,204,003 | |
| | Term Loan B-2, 3.758% - 4.066%, 10/10/14 | | United States | | | 317,915,998 | | | | 247,422,576 | |
| | Term Loan B-3, 3.758% - 3.789%, 10/10/14 | | United States | | | 412,374,678 | | | | 319,991,204 | |
| | | | | | | | | | | | | |
| | | | | | | | | | | | | 1,022,368,243 | |
| | | | | | | | | | | | | |
| | Total Senior Floating Rate Interests (Cost $3,376,194,713) | | | | | | | | | | | 3,157,331,490 | |
| | | | | | | | | | | | | |
| | Municipal Bonds (Cost $180,206,433) 0.3% | | | | | | | | | | | | |
| | California State GO, 7.95%, 3/01/36 | | United States | | | 180,000,000 | | | | 193,158,000 | |
| | | | | | | | | | | | | |
| | Total Investments before Short Term Investments
(Cost $53,539,947,997) | | | | | | | | | | | 53,027,146,426 | |
| | | | | | | | | | | | | |
94 | Annual Report
Franklin Custodian Funds
Statement of Investments, September 30, 2010 (continued)
| | | | | | | | | | | | | | |
| | Franklin Income Fund | | Country | | Principal Amount* | | Value |
| | |
| | Short Term Investments 2.3% | | | | | | | | | | | | |
| | U.S. Government and Agency Securities 0.8% | | | | | | | | | | | | |
| n | FHLB 10/01/10 - 10/05/10 | | United States | | | 398,383,000 | | | $ | 398,382,000 | |
| n | FNMA, 10/04/10 | | United States | | | 35,000,000 | | | | 34,999,755 | |
| | | | | | | | | | | | | |
| | Total U.S. Government and Agency Securities
(Cost $433,381,470) | | | | | | | | | | | 433,381,755 | |
| | | | | | | | | | | | | |
| | Total Investments before Money Market Funds and Repurchase Agreements (Cost $53,973,329,467) | | | | | | | | | | | 53,460,528,181 | |
| | | | | | | | | | | | | |
| | | | | | | | | | | | | | |
| | | | | | | | Shares | | | | |
| | Money Market Funds (Cost $330,912,398) 0.6% | | | | | | | | | | | | |
| a,o | Institutional Fiduciary Trust Money Market Portfolio, 0.00% | | United States | | | 330,912,398 | | | | 330,912,398 | |
| | | | | | | | | | | | | |
| | Investments from Cash Collateral Received for Loaned Securities 0.0%† | | | | | | | | | | | | |
| | Money Market Funds 0.0%† | | | | | | | | | | | | |
| a | Bank of New York Institutional Cash Reserve Fund, Series B | | United States | | | 451,668 | | | | 361,334 | |
| p | BNY Mellon Overnight Government Fund, 0.23% | | United States | | | 4,874,000 | | | | 4,874,000 | |
| | | | | | | | | | | | | |
| | Total Investments from Cash Collateral Received for Loaned Securities (Cost $5,325,668) | | | | | | | | | | | 5,235,334 | |
| | | | | | | | | | | | | |
| | | | | | | | | | | | | | |
| | | | | | | | Principal Amount* | | | | |
| | Repurchase Agreements (Cost $490,186,154) 0.9% | | | | | | | | | | | | |
| q | Joint Repurchase Agreement, 0.205%, 10/01/10 (Maturity Value $490,188,945) | | United States | | | 490,186,154 | | | | 490,186,154 | |
| | Banc of America Securities LLC (Maturity Value $59,685,406) | | | | | | | | | | | | |
| | Barclays Capital Inc. (Maturity Value $27,852,536) | | | | | | | | | | | | |
| | BNP Paribas Securities Corp. (Maturity Value $103,454,377) | | | | | | | | | | | | |
| | Credit Suisse Securities (USA) LLC (Maturity Value $99,483,846) | | | | | | | | | | | | |
| | Deutsche Bank Securities Inc. (Maturity Value $40,553,331) | | | | | | | | | | | | |
| | HSBC Securities (USA) Inc. (Maturity Value $59,685,406) | | | | | | | | | | | | |
| | Morgan Stanley & Co. Inc. (Maturity Value $59,685,406) | | | | | | | | | | | | |
| | UBS Securities LLC (Maturity Value $39,788,637) | | | | | | | | | | | | |
| | Collateralized by U.S. Government Agency Securities, 0.146% - 6.25%, 2/01/11 - 4/18/17; n U.S. Government Agency Discount Notes, 1/14/11 - 2/28/14 and U.S. Treasury Notes, 0.875% - 10.625%, 2/28/11 - 8/15/15 | | | | | | | | | | | | |
| | Total Investments (Cost $54,799,753,687) 99.6% | | | | | | | | | | | 54,286,862,067 | |
| | Other Assets, less Liabilities 0.4% | | | | | | | | | | | 217,733,378 | |
| | | | | | | | | | | | | |
| | Net Assets 100.0% | | | | | | | | | | $ | 54,504,595,445 | |
| | | | | | | | | | | | | |
| | | | | | | | | | | | | | |
| | | | | | | | Contracts | | | | |
| | Options Written (Premium Received $40,999) 0.0% | | | | | | | | | | | | |
| | Call Options 0.0% | | | | | | | | | | | | |
| | Financials 0.0% | | | | | | | | | | | | |
| | Wells Fargo & Co., Oct. $35 Calls, 10/16/10 | | United States | | | 1,000 | | | $ | — | |
Annual Report | 95
Franklin Custodian Funds
Statement of Investments, September 30, 2010 (continued)
Franklin Income Fund
See Abbreviations on page 142.
| | |
| * | | The principal amount is stated in U.S. dollars unless otherwise indicated. |
| | | |
| † | | Rounds to less than 0.1% of net assets. |
| | | |
| a | | Non-income producing. |
| | | |
| b | | See Note 10 regarding holdings of 5% voting securities. |
| | | |
| c | | A portion or all of the security is held in connection with written option contracts open at year end. |
| | | |
| d | | See Note 1(f) regarding equity-linked securities. |
| | | |
| e | | Security was purchased pursuant to Rule 144A under the Securities Act of 1933 and may be sold in transactions exempt from registration only to qualified institutional buyers or in a public offering registered under the Securities Act of 1933. These securities have been deemed liquid under guidelines approved by the Trust’s Board of Trustees. At September 30, 2010, the aggregate value of these securities was $8,981,768,999, representing 16.48% of net assets. |
| | | |
| f | | The coupon rate shown represents the rate at period end. |
| | | |
| g | | Income may be received in additional securities and/or cash. |
| | | |
| h | | See Note 8 regarding defaulted securities. |
| | | |
| i | | Security has been deemed illiquid because it may not be able to be sold within seven days. At September 30, 2010, the value of this security was $94,587,070, representing 0.17% of net assets. |
| | | |
| j | | Perpetual security with no stated maturity date. |
| | | |
| k | | A portion or all of the security purchased on a when-issued or delayed delivery basis. See Note 1(d). |
| | | |
| l | | A portion or all of the security is on loan at September 30, 2010. See Note 1(g). |
| | | |
| m | | See Note 1(h) regarding senior floating rate interests. |
| | | |
| n | | The security is traded on a discount basis with no stated coupon rate. |
| | | |
| o | | See Note 7 regarding investments in the Institutional Fiduciary Trust Money Market Portfolio. The rate shown is the annualized seven-day yield at period end. |
| | | |
| p | | The rate shown is the annualized seven-day yield at period end. |
| | | |
| q | | See Note 1(c) regarding joint repurchase agreement. |
96 | The accompanying notes are an integral part of these financial statements. | Annual Report
Franklin Custodian Funds
Financial Highlights
Franklin U.S. Government Securities Fund
| | | | | | | | | | | | | | | | | | | | | |
| | | Year Ended September 30, |
| Class A | | 2010 | | | 2009 | | | 2008 | | | 2007 | | | 2006 | |
| | | |
Per share operating performance
(for a share outstanding throughout the year) | | | | | | | | | | | | | | | | | | | | |
| Net asset value, beginning of year | | $ | 6.69 | | | $ | 6.45 | | | $ | 6.39 | | | $ | 6.43 | | | $ | 6.53 | |
| | | |
Income from investment operationsa: | | | | | | | | | | | | | | | | | | | | |
Net investment incomeb | | | 0.25 | | | | 0.27 | | | | 0.30 | | | | 0.31 | | | | 0.30 | |
| Net realized and unrealized gains (losses) | | | 0.14 | | | | 0.27 | | | | 0.08 | | | | (0.02 | ) | | | (0.09 | ) |
| | | |
| Total from investment operations | | | 0.39 | | | | 0.54 | | | | 0.38 | | | | 0.29 | | | | 0.21 | |
| | | |
| Less distributions from net investment income | | | (0.27 | ) | | | (0.30 | ) | | | (0.32 | ) | | | (0.33 | ) | | | (0.31 | ) |
| | | |
Redemption feesc | | | — | | | | — | | | | — | d | | | — | d | | | — | d |
| | | |
| Net asset value, end of year | | $ | 6.81 | | | $ | 6.69 | | | $ | 6.45 | | | $ | 6.39 | | | $ | 6.43 | |
| | | |
| | | | | | | | | | | | | | | | | | | | | |
Total returne | | | 5.94 | % | | | 8.50 | % | | | 6.00 | % | | | 4.63 | % | | | 3.40 | % |
| | | | | | | | | | | | | | | | | | | | | |
Ratios to average net assets | | | | | | | | | | | | | | | | | | | | |
| Expenses | | | 0.73 | % | | | 0.73 | %f | | | 0.72 | %f | | | 0.72 | %f | | | 0.72 | %f |
| Net investment income | | | 3.70 | % | | | 4.11 | % | | | 4.64 | % | | | 4.78 | % | | | 4.64 | % |
| | | | | | | | | | | | | | | | | | | | | |
Supplemental data | | | | | | | | | | | | | | | | | | | | |
| Net assets, end of year (000’s) | | $ | 6,771,471 | | | $ | 6,275,792 | | | $ | 5,353,961 | | | $ | 5,073,449 | | | $ | 5,291,117 | |
| Portfolio turnover rate | | | 47.41 | % | | | 34.74 | % | | | 21.66 | % | | | 12.34 | % | | | 20.54 | % |
| | |
| a | | The amount shown for a share outstanding throughout the period may not correlate with the Statement of Operations for the period due to the timing of sales and repurchases of the Fund shares in relation to income earned and/or fluctuating market value of the investments of the Fund. |
| | | |
| b | | Based on average daily shares outstanding. |
| | | |
| c | | Effective September 1, 2008, the redemption fee was eliminated. |
| | | |
| d | | Amount rounds to less than $0.01 per share. |
| | | |
| e | | Total return does not reflect sales commissions or contingent deferred sales charges, if applicable. |
| | | |
| f | | Benefit of expense reduction rounds to less than 0.01%. |
Annual Report | The accompanying notes are an integral part of these financial statements. | 97
Franklin Custodian Funds
Financial Highlights (continued)
Franklin U.S. Government Securities Fund
| | | | | | | | | | | | | | | | | | | | | |
| | | Year Ended September 30, |
| Class B | | 2010 | | | 2009 | | | 2008 | | | 2007 | | | 2006 | |
| | | |
Per share operating performance
(for a share outstanding throughout the year) | | | | | | | | | | | | | | | | | | | | |
| Net asset value, beginning of year | | $ | 6.68 | | | $ | 6.44 | | | $ | 6.38 | | | $ | 6.42 | | | $ | 6.52 | |
| | | |
Income from investment operationsa: | | | | | | | | | | | | | | | | | | | | |
Net investment incomeb | | | 0.22 | | | | 0.24 | | | | 0.27 | | | | 0.27 | | | | 0.26 | |
| Net realized and unrealized gains (losses) | | | 0.13 | | | | 0.26 | | | | 0.07 | | | | (0.01 | ) | | | (0.08 | ) |
| | | |
| Total from investment operations | | | 0.35 | | | | 0.50 | | | | 0.34 | | | | 0.26 | | | | 0.18 | |
| | | |
| Less distributions from net investment income | | | (0.23 | ) | | | (0.26 | ) | | | (0.28 | ) | | | (0.30 | ) | | | (0.28 | ) |
| | | |
Redemption feesc | | | — | | | | — | | | | — | d | | | — | d | | | — | d |
| | | |
| Net asset value, end of year | | $ | 6.80 | | | $ | 6.68 | | | $ | 6.44 | | | $ | 6.38 | | | $ | 6.42 | |
| | | |
| | | | | | | | | | | | | | | | | | | | | |
Total returne | | | 5.39 | % | | | 7.79 | % | | | 5.61 | % | | | 4.10 | % | | | 2.87 | % |
| | | | | | | | | | | | | | | | | | | | | |
Ratios to average net assets | | | | | | | | | | | | | | | | | | | | |
| Expenses | | | 1.23 | % | | | 1.24 | %f | | | 1.24 | %f | | | 1.25 | %f | | | 1.24 | %f |
| Net investment income | | | 3.20 | % | | | 3.60 | % | | | 4.12 | % | | | 4.25 | % | | | 4.12 | % |
| | | | | | | | | | | | | | | | | | | | | |
Supplemental data | | | | | | | | | | | | | | | | | | | | |
| Net assets, end of year (000’s) | | $ | 126,803 | | | $ | 230,575 | | | $ | 284,649 | | | $ | 316,720 | | | $ | 388,807 | |
| Portfolio turnover rate | | | 47.41 | % | | | 34.74 | % | | | 21.66 | % | | | 12.34 | % | | | 20.54 | % |
| | |
| a | | The amount shown for a share outstanding throughout the period may not correlate with the Statement of Operations for the period due to the timing of sales and repurchases of the Fund shares in relation to income earned and/or fluctuating market value of the investments of the Fund. |
| | | |
| b | | Based on average daily shares outstanding. |
| | | |
| c | | Effective September 1, 2008, the redemption fee was eliminated. |
| | | |
| d | | Amount rounds to less than $0.01 per share. |
| | | |
| e | | Total return does not reflect sales commissions or contingent deferred sales charges, if applicable. |
| | | |
| f | | Benefit of expense reduction rounds to less than 0.01%. |
98 | The accompanying notes are an integral part of these financial statements. | Annual Report
Franklin Custodian Funds
Financial Highlights (continued)
Franklin U.S. Government Securities Fund
| | | | | | | | | | | | | | | | | | | | | |
| | | Year Ended September 30, |
| Class C | | 2010 | | | 2009 | | | 2008 | | | 2007 | | | 2006 | |
| | | |
Per share operating performance
(for a share outstanding throughout the year) | | | | | | | | | | | | | | | | | | | | |
| Net asset value, beginning of year | | $ | 6.66 | | | $ | 6.42 | | | $ | 6.36 | | | $ | 6.40 | | | $ | 6.50 | |
| | | |
Income from investment operationsa: | | | | | | | | | | | | | | | | | | | | |
Net investment incomeb | | | 0.21 | | | | 0.23 | | | | 0.27 | | | | 0.27 | | | | 0.26 | |
| Net realized and unrealized gains (losses) | | | 0.14 | | | | 0.27 | | | | 0.07 | | | | (0.01 | ) | | | (0.08 | ) |
| | | |
| Total from investment operations | | | 0.35 | | | | 0.50 | | | | 0.34 | | | | 0.26 | | | | 0.18 | |
| | | |
| Less distributions from net investment income | | | (0.24 | ) | | | (0.26 | ) | | | (0.28 | ) | | | (0.30 | ) | | | (0.28 | ) |
| | | |
Redemption feesc | | | — | | | | — | | | | — | d | | | — | d | | | — | d |
| | | |
| Net asset value, end of year | | $ | 6.77 | | | $ | 6.66 | | | $ | 6.42 | | | $ | 6.36 | | | $ | 6.40 | |
| | | |
| | | | | | | | | | | | | | | | | | | | | |
Total returne | | | 5.28 | % | | | 8.01 | % | | | 5.48 | % | | | 4.12 | % | | | 2.88 | % |
| | | | | | | | | | | | | | | | | | | | | |
Ratios to average net assets | | | | | | | | | | | | | | | | | | | | |
| Expenses | | | 1.24 | % | | | 1.24 | %f | | | 1.24 | %f | | | 1.25 | %f | | | 1.23 | %f |
| Net investment income | | | 3.19 | % | | | 3.60 | % | | | 4.12 | % | | | 4.25 | % | | | 4.13 | % |
| | | | | | | | | | | | | | | | | | | | | |
Supplemental data | | | | | | | | | | | | | | | | | | | | |
| Net assets, end of year (000’s) | | $ | 2,484,847 | | | $ | 1,464,614 | | | $ | 610,148 | | | $ | 418,951 | | | $ | 424,462 | |
| Portfolio turnover rate | | | 47.41 | % | | | 34.74 | % | | | 21.66 | % | | | 12.34 | % | | | 20.54 | % |
| | |
| a | | The amount shown for a share outstanding throughout the period may not correlate with the Statement of Operations for the period due to the timing of sales and repurchases of the Fund shares in relation to income earned and/or fluctuating market value of the investments of the Fund. |
| | | |
| b | | Based on average daily shares outstanding. |
| | | |
| c | | Effective September 1, 2008, the redemption fee was eliminated. |
| | | |
| d | | Amount rounds to less than $0.01 per share. |
| | | |
| e | | Total return does not reflect sales commissions or contingent deferred sales charges, if applicable. |
| | | |
| f | | Benefit of expense reduction rounds to less than 0.01%. |
Annual Report | The accompanying notes are an integral part of these financial statements. | 99
Franklin Custodian Funds
Financial Highlights (continued)
Franklin U.S. Government Securities Fund
| | | | | | | | | | | | | | | | | | | | | |
| | Year Ended September 30, |
| Class R | | 2010 | | | 2009 | | | 2008 | | | 2007 | | | 2006 | |
| | | |
Per share operating performance
(for a share outstanding throughout the year) | | | | | | | | | | | | | | | | | | | | |
| Net asset value, beginning of year | | $ | 6.69 | | | $ | 6.45 | | | $ | 6.39 | | | $ | 6.43 | | | $ | 6.53 | |
| | | |
Income from investment operationsa: | | | | | | | | | | | | | | | | | | | | |
Net investment incomeb | | | 0.23 | | | | 0.25 | | | | 0.28 | | | | 0.28 | | | | 0.27 | |
| Net realized and unrealized gains (losses) | | | 0.13 | | | | 0.26 | | | | 0.07 | | | | (0.01 | ) | | | (0.08 | ) |
| | | |
| Total from investment operations | | | 0.36 | | | | 0.51 | | | | 0.35 | | | | 0.27 | | | | 0.19 | |
| | | |
| Less distributions from net investment income | | | (0.24 | ) | | | (0.27 | ) | | | (0.29 | ) | | | (0.31 | ) | | | (0.29 | ) |
| | | |
Redemption feesc | | | — | | | | — | | | | — | d | | | — | d | | | — | d |
| | | |
| Net asset value, end of year | | $ | 6.81 | | | $ | 6.69 | | | $ | 6.45 | | | $ | 6.39 | | | $ | 6.43 | |
| | | |
| | | | | | | | | | | | | | | | | | | | | |
Total returne | | | 5.55 | % | | | 8.12 | % | | | 5.61 | % | | | 4.25 | % | | | 3.01 | % |
| | | | | | | | | | | | | | | | | | | | | |
Ratios to average net assets | | | | | | | | | | | | | | | | | | | | |
| Expenses | | | 1.09 | % | | | 1.09 | %f | | | 1.09 | %f | | | 1.10 | %f | | | 1.09 | %f |
| Net investment income | | | 3.34 | % | | | 3.75 | % | | | 4.27 | % | | | 4.40 | % | | | 4.27 | % |
| | | | | | | | | | | | | | | | | | | | | |
Supplemental data | | | | | | | | | | | | | | | | | | | | |
| Net assets, end of year (000’s) | | $ | 140,147 | | | $ | 138,548 | | | $ | 104,648 | | | $ | 74,537 | | | $ | 71,104 | |
| Portfolio turnover rate | | | 47.41 | % | | | 34.74 | % | | | 21.66 | % | | | 12.34 | % | | | 20.54 | % |
| | |
| a | | The amount shown for a share outstanding throughout the period may not correlate with the Statement of Operations for the period due to the timing of sales and repurchases of the Fund shares in relation to income earned and/or fluctuating market value of the investments of the Fund. |
| | | |
| b | | Based on average daily shares outstanding. |
| | | |
| c | | Effective September 1, 2008, the redemption fee was eliminated. |
| | | |
| d | | Amount rounds to less than $0.01 per share. |
| | | |
| e | | Total return does not reflect sales commissions or contingent deferred sales charges, if applicable. |
| | | |
| f | | Benefit of expense reduction rounds to less than 0.01%. |
100 | The accompanying notes are an integral part of these financial statements. | Annual Report
Franklin Custodian Funds
Financial Highlights (continued)
Franklin U.S. Government Securities Fund
| | | | | | | | | | | | | | | | | | | | | |
| | | Year Ended September 30, |
| Advisor Class | | 2010 | | | 2009 | | | 2008 | | | 2007 | | | 2006 | |
| | | |
Per share operating performance
(for a share outstanding throughout the year) | | | | | | | | | | | | | | | | | | | | |
| Net asset value, beginning of year | | $ | 6.71 | | | $ | 6.47 | | | $ | 6.41 | | | $ | 6.45 | | | $ | 6.55 | |
| | | |
Income from investment operationsa: | | | | | | | | | | | | | | | | | | | | |
Net investment incomeb | | | 0.26 | | | | 0.28 | | | | 0.31 | | | | 0.31 | | | | 0.31 | |
| Net realized and unrealized gains (losses) | | | 0.14 | | | | 0.27 | | | | 0.08 | | | | (0.01 | ) | | | (0.09 | ) |
| | | |
| Total from investment operations | | | 0.40 | | | | 0.55 | | | | 0.39 | | | | 0.30 | | | | 0.22 | |
| | | |
| Less distributions from net investment income | | | (0.28 | ) | | | (0.31 | ) | | | (0.33 | ) | | | (0.34 | ) | | | (0.32 | ) |
| | | |
Redemption feesc | | | — | | | | — | | | | — | d | | | — | d | | | — | d |
| | | |
| Net asset value, end of year | | $ | 6.83 | | | $ | 6.71 | | | $ | 6.47 | | | $ | 6.41 | | | $ | 6.45 | |
| | | |
| | | | | | | | | | | | | | | | | | | | | |
| Total return | | | 6.06 | % | | | 8.63 | % | | | 6.11 | % | | | 4.75 | % | | | 3.53 | % |
| | | | | | | | | | | | | | | | | | | | | |
Ratios to average net assets | | | | | | | | | | | | | | | | | | | | |
| Expenses | | | 0.59 | % | | | 0.59 | %e | | | 0.59 | %e | | | 0.60 | %e | | | 0.59 | %e |
| Net investment income | | | 3.84 | % | | | 4.25 | % | | | 4.77 | % | | | 4.90 | % | | | 4.77 | % |
| | | | | | | | | | | | | | | | | | | | | |
Supplemental data | | | | | | | �� | | | | | | | | | | | | | |
| Net assets, end of year (000’s) | | $ | 1,193,213 | | | $ | 863,951 | | | $ | 612,026 | | | $ | 470,751 | | | $ | 387,239 | |
| Portfolio turnover rate | | | 47.41 | % | | | 34.74 | % | | | 21.66 | % | | | 12.34 | % | | | 20.54 | % |
| | |
| a | | The amount shown for a share outstanding throughout the period may not correlate with the Statement of Operations for the period due to the timing of sales and repurchases of the Fund shares in relation to income earned and/or fluctuating market value of the investments of the Fund. |
| | | |
| b | | Based on average daily shares outstanding. |
| | | |
| c | | Effective September 1, 2008, the redemption fee was eliminated. |
| | | |
| d | | Amount rounds to less than $0.01 per share. |
| | | |
| e | | Benefit of expense reduction rounds to less than 0.01%. |
Annual Report | The accompanying notes are an integral part of these financial statements. | 101
Franklin Custodian Funds
Statement of Investments, September 30, 2010
| | | | | | | | | | |
| | Franklin U.S. Government Securities Fund | | Principal Amount | | | Value | |
| | |
| | Mortgage-Backed Securities 99.1% | | | | | | | | |
| | Government National Mortgage Association (GNMA) Fixed Rate 99.1% | | | | | | | | |
| | GNMA GP 30 Year, 8.25%, 3/15/17 - 10/15/17 | | $ | 85,192 | | | $ | 94,627 | |
| | GNMA GP 30 Year, 9.25%, 5/15/16 - 12/15/16 | | | 187,882 | | | | 204,126 | |
| | GNMA GP 30 Year, 11.25%, 7/15/13 - 12/15/15 | | | 110,902 | | | | 119,696 | |
| | GNMA GP 30 Year, 11.50%, 2/15/13 - 5/15/13 | | | 15,329 | | | | 15,482 | |
| | GNMA GP 30 Year, 11.75%, 7/15/13 - 8/15/13 | | | 11,778 | | | | 11,898 | |
| | GNMA GP 30 Year, 12.75%, 5/15/14 | | | 3,296 | | | | 3,332 | |
| | GNMA I SF 15 Year, 6.50%, 5/15/18 | | | 638,720 | | | | 662,937 | |
| a | GNMA I SF 30 Year, 4.50%, 1/15/39 - 8/15/40 | | | 2,177,065,460 | | | | 2,295,764,910 | |
| | GNMA I SF 30 Year, 4.50%, 8/15/40 | | | 180,006,866 | | | | 189,788,920 | |
| | GNMA I SF 30 Year, 5.00%, 8/15/39 | | | 165,801,680 | | | | 176,838,747 | |
| | GNMA I SF 30 Year, 5.00%, 2/15/33 - 6/15/40 | | | 2,217,634,303 | | | | 2,371,302,036 | |
| | GNMA I SF 30 Year, 5.50%, 2/15/39 | | | 119,288,336 | | | | 128,433,561 | |
| | GNMA I SF 30 Year, 5.50%, 5/15/28 - 2/15/40 | | | 1,250,254,794 | | | | 1,350,099,666 | |
| | GNMA I SF 30 Year, 6.00%, 10/15/23 - 2/15/39 | | | 886,043,857 | | | | 967,803,210 | |
| | GNMA I SF 30 Year, 6.00%, 12/15/39 | | | 100,076,565 | | | | 108,779,075 | |
| | GNMA I SF 30 Year, 6.50%, 5/15/23 - 8/15/37 | | | 215,528,777 | | | | 240,857,326 | |
| | GNMA I SF 30 Year, 6.75%, 3/15/26 | | | 37,865 | | | | 43,002 | |
| | GNMA I SF 30 Year, 7.00%, 4/15/16 - 9/15/32 | | | 132,718,245 | | | | 151,199,123 | |
| | GNMA I SF 30 Year, 7.25%, 11/15/25 - 1/15/26 | | | 461,487 | | | | 523,431 | |
| | GNMA I SF 30 Year, 7.50%, 7/15/16 - 8/15/33 | | | 42,476,915 | | | | 48,540,025 | |
| | GNMA I SF 30 Year, 7.70%, 1/15/21 - 1/15/22 | | | 301,598 | | | | 346,725 | |
| | GNMA I SF 30 Year, 8.00%, 11/15/15 - 9/15/30 | | | 25,406,221 | | | | 28,860,347 | |
| | GNMA I SF 30 Year, 8.50%, 5/15/16 - 6/15/25 | | | 5,540,714 | | | | 6,351,198 | |
| | GNMA I SF 30 Year, 9.00%, 11/15/15 - 7/15/23 | | | 6,833,744 | | | | 7,692,282 | |
| | GNMA I SF 30 Year, 9.50%, 5/15/16 - 8/15/22 | | | 4,229,182 | | | | 4,826,121 | |
| | GNMA I SF 30 Year, 10.00%, 2/15/16 - 3/15/25 | | | 5,492,131 | | | | 6,183,566 | |
| | GNMA I SF 30 Year, 10.50%, 2/15/12 - 10/15/21 | | | 4,121,781 | | | | 4,556,591 | |
| | GNMA I SF 30 Year, 11.00%, 10/15/10 - 5/15/21 | | | 2,420,905 | | | | 2,623,292 | |
| | GNMA I SF 30 Year, 11.50%, 3/15/13 - 2/15/16 | | | 647,766 | | | | 673,493 | |
| | GNMA I SF 30 Year, 12.00%, 5/15/11 - 1/15/18 | | | 3,252,293 | | | | 3,374,908 | |
| | GNMA I SF 30 Year, 12.50%, 11/15/10 - 1/15/16 | | | 1,834,554 | | | | 1,907,468 | |
| | GNMA I SF 30 Year, 13.00%, 1/15/11 - 9/15/15 | | | 2,013,823 | | | | 2,075,411 | |
| | GNMA II GP 30 Year, 8.75%, 3/20/17 - 7/20/17 | | | 34,485 | | | | 37,611 | |
| | GNMA II GP 30 Year, 11.50%, 8/20/13 | | | 8,495 | | | | 8,578 | |
| | GNMA II SF 30 Year, 4.50%, 12/20/39 | | | 133,370,088 | | | | 140,786,205 | |
| | GNMA II SF 30 Year, 4.50%, 5/20/33 - 9/20/40 | | | 356,304,401 | | | | 376,399,243 | |
| | GNMA II SF 30 Year, 5.00%, 9/20/33 | | | 133,664,973 | | | | 143,686,372 | |
| | GNMA II SF 30 Year, 5.00%, 7/20/33 - 5/20/40 | | | 328,258,514 | | | | 351,706,598 | |
| | GNMA II SF 30 Year, 5.00%, 6/20/40 | | | 105,682,870 | | | | 112,932,095 | |
| | GNMA II SF 30 Year, 5.50%, 6/20/34 - 4/20/40 | | | 627,407,100 | | | | 676,508,499 | |
| | GNMA II SF 30 Year, 6.00%, 10/20/23 - 7/20/39 | | | 469,438,705 | | | | 511,338,071 | |
| | GNMA II SF 30 Year, 6.50%, 6/20/24 - 1/20/39 | | | 147,591,157 | | | | 163,017,138 | |
| | GNMA II SF 30 Year, 7.00%, 2/20/28 - 7/20/33 | | | 24,047,951 | | | | 27,352,520 | |
| | GNMA II SF 30 Year, 7.50%, 10/20/22 - 4/20/32 | | | 4,524,388 | | | | 5,149,022 | |
| | GNMA II SF 30 Year, 8.00%, 8/20/16 - 6/20/30 | | | 2,245,570 | | | | 2,597,601 | |
| | GNMA II SF 30 Year, 8.50%, 4/20/16 - 6/20/25 | | | 1,132,243 | | | | 1,295,994 | |
| | GNMA II SF 30 Year, 9.00%, 8/20/16 - 11/20/21 | | | 333,609 | | | | 378,991 | |
| | GNMA II SF 30 Year, 9.50%, 3/20/18 - 4/20/25 | | | 227,008 | | | | 262,639 | |
102 | Annual Report
Franklin Custodian Funds
Statement of Investments, September 30, 2010 (continued)
| | | | | | | | | | |
| | Franklin U.S. Government Securities Fund | Principal Amount | | | Value | | |
| | |
| | Mortgage-Backed Securities (continued) | | | | | | | | |
| | Government National Mortgage Association (GNMA) Fixed Rate (continued) | | | | | | | | |
| | GNMA II SF 30 Year, 10.00%, 8/20/15 - 3/20/21 | $ | 430,651 | | | $ | 497,910 | | |
| | GNMA II SF 30 Year, 10.50%, 8/20/14 - 3/20/21 | | 1,110,607 | | | | 1,238,637 | | |
| | GNMA II SF 30 Year, 11.00%, 8/20/13 - 1/20/21 | | 177,308 | | | | 197,779 | | |
| | GNMA II SF 30 Year, 11.50%, 9/20/13 - 2/20/18 | | 92,602 | | | | 98,334 | | |
| | GNMA II SF 30 Year, 12.00%, 9/20/13 - 2/20/16 | | 149,238 | | | | 160,473 | | |
| | GNMA II SF 30 Year, 12.50%, 10/20/13 - 11/20/15 | | 100,926 | | | | 110,167 | | |
| | GNMA II SF 30 Year, 13.00%, 10/20/13 - 9/20/15 | | 73,289 | | | | 79,674 | | |
| | | | | | | | | |
| | Total Mortgage-Backed Securities (Cost $10,164,106,856) | | | | | | 10,616,396,683 | | |
| | | | | | | | | |
| | | | | | | | | | |
| | | Shares | | | | | | |
| | Short Term Investments (Cost $112,396,476) 1.0% | | | | | | | | |
| | Money Market Funds 1.0% | | | | | | | | |
| b,c | Institutional Fiduciary Trust Money Market Portfolio, 0.00% | | 112,396,476 | | | | 112,396,476 | | |
| | | | | | | | | |
| | Total Investments (Cost $10,276,503,332) 100.1% | | | | | | 10,728,793,159 | | |
| | Other Assets, less Liabilities (0.1)% | | | | | | (12,312,681 | ) | |
| | | | | | | | | |
| | Net Assets 100.0% | | | | | $ | 10,716,480,478 | | |
| | | | | | | | | |
See Abbreviations on page 142.
| | |
| a | | A portion or all of the security purchased on a TBA basis. See Note 1(d). |
| | | |
| b | | Non-income producing. |
| | | |
| c | | See Note 7 regarding investments in the Institutional Fiduciary Trust Money Market Portfolio. The rate shown is the annualized seven-day yield at period end. |
Annual Report | The accompanying notes are an integral part of these financial statements. | 103
Franklin Custodian Funds
Financial Highlights
Franklin Utilities Fund
| | | | | | | | | | | | | | | | | | | | | |
| | | Year Ended September 30, |
| Class A | | 2010 | | | 2009 | | | 2008 | | | 2007 | | | 2006 | |
| | | |
Per share operating performance
(for a share outstanding throughout the year) | | | | | | | | | | | | | | | | | | | | |
| Net asset value, beginning of year | | $ | 10.74 | | | $ | 11.92 | | | $ | 14.58 | | | $ | 12.89 | | | $ | 12.59 | |
| | | |
Income from investment operationsa: | | | | | | | | | | | | | | | | | | | | |
Net investment incomeb | | | 0.43 | | | | 0.43 | | | | 0.41 | | | | 0.40 | | | | 0.43 | |
| Net realized and unrealized gains (losses) | | | 0.88 | | | | (1.11 | ) | | | (1.93 | ) | | | 2.16 | | | | 0.37 | |
| | | |
| Total from investment operations | | | 1.31 | | | | (0.68 | ) | | | (1.52 | ) | | | 2.56 | | | | 0.80 | |
| | | |
| Less distributions from: | | | | | | | | | | | | | | | | | | | | |
| Net investment income | | | (0.45 | ) | | | (0.42 | ) | | | (0.40 | ) | | | (0.40 | ) | | | (0.41 | ) |
| Net realized gains | | | (0.16 | ) | | | (0.08 | ) | | | (0.74 | ) | | | (0.47 | ) | | | (0.09 | ) |
| | | |
| Total distributions | | | (0.61 | ) | | | (0.50 | ) | | | (1.14 | ) | | | (0.87 | ) | | | (0.50 | ) |
| | | |
Redemption feesc | | | — | | | | — | | | | — | d | | | — | d | | | — | d |
| | | |
| Net asset value, end of year | | $ | 11.44 | | | $ | 10.74 | | | $ | 11.92 | | | $ | 14.58 | | | $ | 12.89 | |
| | | |
| | | | | | | | | | | | | | | | | | | | | |
Total returne | | | 12.69 | % | | | (5.20 | )% | | | (11.63 | )% | | | 20.32 | % | | | 6.69 | % |
| | | | | | | | | | | | | | | | | | | | | |
Ratios to average net assets | | | | | | | | | | | | | | | | | | | | |
| Expenses | | | 0.78 | % | | | 0.80 | %f | | | 0.74 | %f | | | 0.75 | %f | | | 0.76 | %f |
| Net investment income | | | 3.91 | % | | | 4.29 | % | | | 2.92 | % | | | 2.83 | % | | | 3.54 | % |
| | | | | | | | | | | | | | | | | | | | | |
Supplemental data | | | | | | | | | | | | | | | | | | | | |
| Net assets, end of year (000’s) | | $ | 1,823,972 | | | $ | 1,543,060 | | | $ | 1,769,397 | | | $ | 2,157,614 | | | $ | 1,926,732 | |
| Portfolio turnover rate | | | 5.27 | % | | | 15.49 | % | | | 8.32 | % | | | 10.84 | % | | | 7.97 | % |
| | |
| a | | The amount shown for a share outstanding throughout the period may not correlate with the Statement of Operations for the period due to the timing of sales and repurchases of the Fund shares in relation to income earned and/or fluctuating market value of the investments of the Fund. |
| | | |
| b | | Based on average daily shares outstanding. |
| | | |
| c | | Effective September 1, 2008, the redemption fee was eliminated. |
| | | |
| d | | Amount rounds to less than $0.01 per share. |
| | | |
| e | | Total return does not reflect sales commissions or contingent deferred sales charges, if applicable. |
| | | |
| f | | Benefit of expense reduction rounds to less than 0.01%. |
104 | The accompanying notes are an integral part of these financial statements. | Annual Report
Franklin Custodian Funds
Financial Highlights (continued)
Franklin Utilities Fund
| | | | | | | | | | | | | | | | | | | | | |
| | | Year Ended September 30, |
| Class B | | 2010 | | | 2009 | | | 2008 | | | 2007 | | | 2006 | |
| | | |
Per share operating performance
(for a share outstanding throughout the year) | | | | | | | | | | | | | | | | | | | | |
| Net asset value, beginning of year | | $ | 10.74 | | | $ | 11.91 | | | $ | 14.56 | | | $ | 12.88 | | | $ | 12.57 | |
Income from investment operationsa: | | | | | | | | | | | | | | | | | | | | |
Net investment incomeb | | | 0.37 | | | | 0.38 | | | | 0.33 | | | | 0.33 | | | | 0.37 | |
| Net realized and unrealized gains (losses) | | | 0.88 | | | | (1.10 | ) | | | (1.91 | ) | | | 2.15 | | | | 0.38 | |
| | | |
| Total from investment operations | | | 1.25 | | | | (0.72 | ) | | | (1.58 | ) | | | 2.48 | | | | 0.75 | |
| | | |
| Less distributions from: | | | | | | | | | | | | | | | | | | | | |
| Net investment income | | | (0.39 | ) | | | (0.37 | ) | | | (0.33 | ) | | | (0.33 | ) | | | (0.35 | ) |
| Net realized gains | | | (0.16 | ) | | | (0.08 | ) | | | (0.74 | ) | | | (0.47 | ) | | | (0.09 | ) |
| | | |
| Total distributions | | | (0.55 | ) | | | (0.45 | ) | | | (1.07 | ) | | | (0.80 | ) | | | (0.44 | ) |
| | | |
Redemption feesc | | | — | | | | — | | | | — | d | | | — | d | | | — | d |
| | | |
| Net asset value, end of year | | $ | 11.44 | | | $ | 10.74 | | | $ | 11.91 | | | $ | 14.56 | | | $ | 12.88 | |
| | | |
| | | | | | | | | | | | | | | | | | | | | |
Total returne | | | 12.10 | % | | | (5.65 | )% | | | (12.04 | )% | | | 19.66 | % | | | 6.25 | % |
| | | | | | | | | | | | | | | | | | | | | |
Ratios to average net assets | | | | | | | | | | | | | | | | | | | | |
| Expenses | | | 1.28 | % | | | 1.30 | %f | | | 1.24 | %f | | | 1.26 | %f | | | 1.26 | %f |
| Net investment income | | | 3.41 | % | | | 3.79 | % | | | 2.42 | % | | | 2.32 | % | | | 3.04 | % |
| | | | | | | | | | | | | | | | | | | | | |
Supplemental data | | | | | | | | | | | | | | | | | | | | |
| Net assets, end of year (000’s) | | $ | 50,439 | | | $ | 64,176 | | | $ | 92,695 | | | $ | 127,587 | | | $ | 133,824 | |
| Portfolio turnover rate | | | 5.27 | % | | | 15.49 | % | | | 8.32 | % | | | 10.84 | % | | | 7.97 | % |
| | |
| a | | The amount shown for a share outstanding throughout the period may not correlate with the Statement of Operations for the period due to the timing of sales and repurchases of the Fund shares in relation to income earned and/or fluctuating market value of the investments of the Fund. |
| | | |
| b | | Based on average daily shares outstanding. |
| | | |
| c | | Effective September 1, 2008, the redemption fee was eliminated. |
| | | |
| d | | Amount rounds to less than $0.01 per share. |
| | | |
| e | | Total return does not reflect sales commissions or contingent deferred sales charges, if applicable. |
| | | |
| f | | Benefit of expense reduction rounds to less than 0.01%. |
Annual Report | The accompanying notes are an integral part of these financial statements. | 105
Franklin Custodian Funds
Financial Highlights (continued)
Franklin Utilities Fund
| | | | | | | | | | | | | | | | | | | | | | |
| | | Year Ended September 30, | |
| Class C | | 2010 | | | 2009 | | | 2008 | | | 2007 | | | 2006 | | |
| | | | |
Per share operating performance
(for a share outstanding throughout the year) | | | | | | | | | | | | | | | | | | | | | |
| Net asset value, beginning of year | | $ | 10.71 | | | $ | 11.88 | | | $ | 14.53 | | | $ | 12.85 | | | $ | 12.55 | | |
| | | | |
Income from investment operationsa: | | | | | | | | | | | | | | | | | | | | | |
Net investment incomeb | | | 0.37 | | | | 0.38 | | | | 0.33 | | | | 0.33 | | | | 0.37 | | |
| Net realized and unrealized gains (losses) | | | 0.88 | | | | (1.10 | ) | | | (1.91 | ) | | | 2.15 | | | | 0.37 | | |
| | | | |
| Total from investment operations | | | 1.25 | | | | (0.72 | ) | | | (1.58 | ) | | | 2.48 | | | | 0.74 | | |
| | | | |
| Less distributions from: | | | | | | | | | | | | | | | | | | | | | |
| Net investment income | | | (0.40 | ) | | | (0.37 | ) | | | (0.33 | ) | | | (0.33 | ) | | | (0.35 | ) | |
| Net realized gains | | | (0.16 | ) | | | (0.08 | ) | | | (0.74 | ) | | | (0.47 | ) | | | (0.09 | ) | |
| | | | |
| Total distributions | | | (0.56 | ) | | | (0.45 | ) | | | (1.07 | ) | | | (0.80 | ) | | | (0.44 | ) | |
| | | | |
Redemption feesc | | | — | | | | — | | | | — | d | | | — | d | | | — | d | |
| | | | |
| Net asset value, end of year | | $ | 11.40 | | | $ | 10.71 | | | $ | 11.88 | | | $ | 14.53 | | | $ | 12.85 | | |
| | | | |
| | | | | | | | | | | | | | | | | | | | | | |
Total returne | | | 12.08 | % | | | (5.64 | )% | | | (12.06 | )% | | | 19.72 | % | | | 6.19 | % | |
| | | | | | | | | | | | | | | | | | | | | | |
Ratios to average net assets | | | | | | | | | | | | | | | | | | | | | |
| Expenses | | | 1.28 | % | | | 1.30 | %f | | | 1.24 | %f | | | 1.26 | %f | | | 1.25 | %f | |
| Net investment income | | | 3.41 | % | | | 3.79 | % | | | 2.42 | % | | | 2.32 | % | | | 3.05 | % | |
| | | | | | | | | | | | | | | | | | | | | | |
Supplemental data | | | | | | | | | | | | | | | | | | | | | |
| Net assets, end of year (000’s) | | $ | 405,024 | | | $ | 300,544 | | | $ | 339,247 | | | $ | 424,977 | | | $ | 391,509 | | |
| Portfolio turnover rate | | | 5.27 | % | | | 15.49 | % | | | 8.32 | % | | | 10.84 | % | | | 7.97 | % | |
| | |
| a | | The amount shown for a share outstanding throughout the period may not correlate with the Statement of Operations for the period due to the timing of sales and repurchases of the Fund shares in relation to income earned and/or fluctuating market value of the investments of the Fund. |
| | | |
| b | | Based on average daily shares outstanding. |
| | | |
| c | | Effective September 1, 2008, the redemption fee was eliminated. |
| | | |
| d | | Amount rounds to less than $0.01 per share. |
| | | |
| e | | Total return does not reflect sales commissions or contingent deferred sales charges, if applicable. |
| | | |
| f | | Benefit of expense reduction rounds to less than 0.01%. |
106 | The accompanying notes are an integral part of these financial statements. | Annual Report
Franklin Custodian Funds
Financial Highlights (continued)
Franklin Utilities Fund
| | | | | | | | | | | | | | | | | | | | | |
| | | Year Ended September 30, |
| Class R | | 2010 | | | 2009 | | | 2008 | | | 2007 | | | 2006 | |
| | | |
Per share operating performance
(for a share outstanding throughout the year) | | | | | | | | | | | | | | | | | | | | |
| Net asset value, beginning of year | | $ | 10.71 | | | $ | 11.89 | | | $ | 14.54 | | | $ | 12.86 | | | $ | 12.57 | |
| | | |
Income from investment operationsa: | | | | | | | | | | | | | | | | | | | | |
Net investment incomeb | | | 0.39 | | | | 0.40 | | | | 0.36 | | | | 0.35 | | | | 0.39 | |
| Net realized and unrealized gains (losses) | | | 0.88 | | | | (1.11 | ) | | | (1.92 | ) | | | 2.16 | | | | 0.36 | |
| | | |
| Total from investment operations | | | 1.27 | | | | (0.71 | ) | | | (1.56 | ) | | | 2.51 | | | | 0.75 | |
| | | |
| Less distributions from: | | | | | | | | | | | | | | | | | | | | |
| Net investment income | | | (0.41 | ) | | | (0.39 | ) | | | (0.35 | ) | | | (0.36 | ) | | | (0.37 | ) |
| Net realized gains | | | (0.16 | ) | | | (0.08 | ) | | | (0.74 | ) | | | (0.47 | ) | | | (0.09 | ) |
| | | |
| Total distributions | | | (0.57 | ) | | | (0.47 | ) | | | (1.09 | ) | | | (0.83 | ) | | | (0.46 | ) |
| | | |
Redemption feesc | | | — | | | | — | | | | — | d | | | — | d | | | — | d |
| | | |
| Net asset value, end of year | | $ | 11.41 | | | $ | 10.71 | | | $ | 11.89 | | | $ | 14.54 | | | $ | 12.86 | |
| | | |
| | | | | | | | | | | | | | | | | | | | | |
Total returne | | | 12.33 | % | | | (5.57 | )% | | | (11.92 | )% | | | 19.92 | % | | | 6.29 | % |
| | | | | | | | | | | | | | | | | | | | | |
Ratios to average net assets | | | | | | | | | | | | | | | | | | | | |
| Expenses | | | 1.13 | % | | | 1.15 | %f | | | 1.09 | %f | | | 1.11 | %f | | | 1.11 | %f |
| Net investment income | | | 3.56 | % | | | 3.94 | % | | | 2.57 | % | | | 2.47 | % | | | 3.19 | % |
| | | | | | | | | | | | | | | | | | | | | |
Supplemental data | | | | | | | | | | | | | | | | | | | | |
| Net assets, end of year (000’s) | | $ | 42,285 | | | $ | 37,795 | | | $ | 36,596 | | | $ | 41,845 | | | $ | 27,736 | |
| Portfolio turnover rate | | | 5.27 | % | | | 15.49 | % | | | 8.32 | % | | | 10.84 | % | | | 7.97 | % |
| | |
| a | | The amount shown for a share outstanding throughout the period may not correlate with the Statement of Operations for the period due to the timing of sales and repurchases of the Fund shares in relation to income earned and/or fluctuating market value of the investments of the Fund. |
| | | |
| b | | Based on average daily shares outstanding. |
| | | |
| c | | Effective September 1, 2008, the redemption fee was eliminated. |
| | | |
| d | | Amount rounds to less than $0.01 per share. |
| | | |
| e | | Total return does not reflect sales commissions or contingent deferred sales charges, if applicable. |
| | | |
| f | | Benefit of expense reduction rounds to less than 0.01%. |
Annual Report | The accompanying notes are an integral part of these financial statements. | 107
Franklin Custodian Funds
Financial Highlights (continued)
Franklin Utilities Fund
| | | | | | | | | | | | | | | | | | | | | |
| | | Year Ended September 30, |
| Advisor Class | | 2010 | | | 2009 | | | 2008 | | | 2007 | | | 2006 | |
| | | |
Per share operating performance (for a share outstanding throughout the year) | | | | | | | | | | | | | | | | | | | | |
| Net asset value, beginning of year | | $ | 10.79 | | | $ | 11.98 | | | $ | 14.64 | | | $ | 12.95 | | | $ | 12.64 | |
| | | |
Income from investment operationsa: | | | | | | | | | | | | | | | | | | | | |
Net investment incomeb | | | 0.45 | | | | 0.45 | | | | 0.42 | | | | 0.42 | | | | 0.45 | |
| Net realized and unrealized gains (losses) | | | 0.89 | | | | (1.12 | ) | | | (1.92 | ) | | | 2.17 | | | | 0.38 | |
| | | |
| Total from investment operations | | | 1.34 | | | | (0.67 | ) | | | (1.50 | ) | | | 2.59 | | | | 0.83 | |
| | | |
| Less distributions from: | | | | | | | | | | | | | | | | | | | | |
| Net investment income | | | (0.47 | ) | | | (0.44 | ) | | | (0.42 | ) | | | (0.43 | ) | | | (0.43 | ) |
| Net realized gains | | | (0.16 | ) | | | (0.08 | ) | | | (0.74 | ) | | | (0.47 | ) | | | (0.09 | ) |
| | | |
| Total distributions | | | (0.63 | ) | | | (0.52 | ) | | | (1.16 | ) | | | (0.90 | ) | | | (0.52 | ) |
| | | |
Redemption feesc | | | — | | | | — | | | | — | d | | | — | d | | | — | d |
| | | |
| Net asset value, end of year | | $ | 11.50 | | | $ | 10.79 | | | $ | 11.98 | | | $ | 14.64 | | | $ | 12.95 | |
| | | |
| | | | | | | | | | | | | | | | | | | | | |
| Total return | | | 12.89 | % | | | (5.12 | )% | | | (11.45 | )% | | | 20.43 | % | | | 6.88 | % |
| | | | | | | | | | | | | | | | | | | | | |
Ratios to average net assets | | | | | | | | | | | | | | | | | | | | |
| Expenses | | | 0.63 | % | | | 0.65 | %e | | | 0.59 | %e | | | 0.61 | %e | | | 0.61 | %e |
| Net investment income | | | 4.06 | % | | | 4.44 | % | | | 3.07 | % | | | 2.97 | % | | | 3.69 | % |
| | | | | | | | | | | | | | | | | | | | | |
Supplemental data | | | | | | | | | | | | | | | | | | | | |
| Net assets, end of year (000’s) | | $ | 222,788 | | | $ | 124,454 | | | $ | 58,817 | | | $ | 86,823 | | | $ | 103,041 | |
| Portfolio turnover rate | | | 5.27 | % | | | 15.49 | % | | | 8.32 | % | | | 10.84 | % | | | 7.97 | % |
| | |
| a | | The amount shown for a share outstanding throughout the period may not correlate with the Statement of Operations for the period due to the timing of sales and repurchases of the Fund shares in relation to income earned and/or fluctuating market value of the investments of the Fund. |
| | | |
| b | | Based on average daily shares outstanding. |
| | | |
| c | | Effective September 1, 2008, the redemption fee was eliminated. |
| | | |
| d | | Amount rounds to less than $0.01 per share. |
| | | |
| e | | Benefit of expense reduction rounds to less than 0.01%. |
108 | The accompanying notes are an integral part of these financial statements. | Annual Report
Franklin Custodian Funds
Statement of Investments, September 30, 2010
| | | | | | | | | | | | |
| | Franklin Utilities Fund | | Country | | Shares | | | Value | |
| | |
| | Common Stocks 95.4% | | | | | | | | | | |
| | Diversified Telecommunication Services 2.4% | | | | | | | | | | |
| | AT&T Inc. | | United States | | | 1,200,000 | | | $ | 34,320,000 | |
| | Frontier Communications Corp. | | United States | | | 192,031 | | | | 1,568,893 | |
| | Verizon Communications Inc. | | United States | | | 800,000 | | | | 26,072,000 | |
| | | | | | | | | | | |
| | | | | | | | | | | 61,960,893 | |
| | | | | | | | | | | |
| | Electric Utilities 48.4% | | | | | | | | | | |
| | Allegheny Energy Inc. | | United States | | | 1,100,000 | | | | 26,972,000 | |
| | American Electric Power Co. Inc. | | United States | | | 2,500,000 | | | | 90,575,000 | |
| | Cleco Corp. | | United States | | | 1,000,000 | | | | 29,620,000 | |
| | Duke Energy Corp. | | United States | | | 3,800,000 | | | | 67,298,000 | |
| | Edison International | | United States | | | 2,400,000 | | | | 82,536,000 | |
| | Entergy Corp. | | United States | | | 1,300,000 | | | | 99,489,000 | |
| | Exelon Corp. | | United States | | | 1,800,000 | | | | 76,644,000 | |
| | FirstEnergy Corp. | | United States | | | 1,700,000 | | | | 65,518,000 | |
| | Great Plains Energy Inc. | | United States | | | 1,400,000 | | | | 26,460,000 | |
| | Hawaiian Electric Industries Inc. | | United States | | | 600,000 | | | | 13,524,000 | |
| | NextEra Energy Inc. | | United States | | | 1,400,000 | | | | 76,146,000 | |
| | Northeast Utilities | | United States | | | 900,000 | | | | 26,613,000 | |
| | NV Energy Inc. | | United States | | | 5,600,000 | | | | 73,640,000 | |
| | Pinnacle West Capital Corp. | | United States | | | 1,200,000 | | | | 49,524,000 | |
| | PNM Resources Inc. | | United States | | | 3,300,000 | | | | 37,587,000 | |
| | Portland General Electric Co. | | United States | | | 1,100,000 | | | | 22,308,000 | |
| | PPL Corp. | | United States | | | 3,030,800 | | | | 82,528,684 | |
| | Progress Energy Inc. | | United States | | | 1,700,000 | | | | 75,514,000 | |
| | Scottish and Southern Energy PLC | | United Kingdom | | | 1,500,000 | | | | 26,402,039 | |
| | The Southern Co. | | United States | | | 3,200,000 | | | | 119,168,000 | |
| | UIL Holdings Corp. | | United States | | | 1,360,000 | | | | 38,297,600 | |
| | Westar Energy Inc. | | United States | | | 1,080,600 | | | | 26,182,938 | |
| | | | | | | | | | | |
| | | | | | | | | | | 1,232,547,261 | |
| | | | | | | | | | | |
| | Gas Utilities 0.6% | | | | | | | | | | |
| | Questar Corp. | | United States | | | 800,000 | | | | 14,024,000 | |
| | | | | | | | | | | |
| | Independent Power Producers & Energy Traders 2.3% | | | | | | | | | | |
| | Constellation Energy Group | | United States | | | 1,800,000 | | | | 58,032,000 | |
| | | | | | | | | | | |
| | Multi-Utilities 37.2% | | | | | | | | | | |
| | Alliant Energy Corp. | | United States | | | 1,500,000 | | | | 54,525,000 | |
| | Ameren Corp. | | United States | | | 200,000 | | | | 5,680,000 | |
| | CenterPoint Energy Inc. | | United States | | | 3,800,000 | | | | 59,736,000 | |
| | CMS Energy Corp. | | United States | | | 1,400,000 | | | | 25,228,000 | |
| | Consolidated Edison Inc. | | United States | | | 1,100,000 | | | | 53,042,000 | |
| | Dominion Resources Inc. | | United States | | | 1,500,000 | | | | 65,490,000 | |
| | DTE Energy Co. | | United States | | | 500,000 | | | | 22,965,000 | |
| | GDF Suez | | France | | | 700,000 | | | | 25,065,695 | |
| | National Grid PLC | | United Kingdom | | | 6,982,857 | | | | 59,313,975 | |
| | NiSource Inc. | | United States | | | 1,800,000 | | | | 31,320,000 | |
| | PG&E Corp. | | United States | | | 2,100,000 | | | | 95,382,000 | |
| | Public Service Enterprise Group Inc. | | United States | | | 2,900,000 | | | | 95,932,000 | |
| | RWE AG | | Germany | | | 300,000 | | | | 20,314,912 | |
| | SCANA Corp. | | United States | | | 775,000 | | | | 31,248,000 | |
| | Sempra Energy | | United States | | | 2,300,000 | | | | 123,740,000 | |
| | TECO Energy Inc. | | United States | | | 1,000,000 | | | | 17,320,000 | |
| | United Utilities Group PLC | | United Kingdom | | | 2,960,189 | | | | 26,679,706 | |
Annual Report | 109
Franklin Custodian Funds
Statement of Investments, September 30, 2010 (continued)
| | | | | | | | | | | | |
| | Franklin Utilities Fund | | Country | | Shares | | | Value | |
| | |
| | Common Stocks (continued) | | | | | | | | | | |
| | Multi-Utilities (continued) | | | | | | | | | | |
| | Vectren Corp. | | United States | | | 800,000 | | | $ | 20,696,000 | |
| | Wisconsin Energy Corp. | | United States | | | 900,000 | | | | 52,020,000 | |
| | Xcel Energy Inc. | | United States | | | 2,600,000 | | | | 59,722,000 | |
| | | | | | | | | | | |
| | | | | | | | | | | 945,420,288 | |
| | | | | | | | | | | |
| | Oil, Gas & Consumable Fuels 2.9% | | | | | | | | | | |
| | Spectra Energy Corp. | | United States | | | 2,197,600 | | | | 49,555,880 | |
| | The Williams Cos. Inc. | | United States | | | 1,300,000 | | | | 24,843,000 | |
| | | | | | | | | | | |
| | | | | | | | | | | 74,398,880 | |
| | | | | | | | | | | |
| | Water Utilities 1.6% | | | | | | | | | | |
| | American Water Works Co. Inc. | | United States | | | 1,800,000 | | | | 41,886,000 | |
| | | | | | | | | | | |
| | Total Common Stocks (Cost $1,843,624,370) | | | | | | | | | 2,428,269,322 | |
| | | | | | | | | | | |
| | | | | | | | | | | | |
| | | | | | Principal Amount | | | | | |
| | Corporate Bonds 3.2% | | | | | | | | | | |
| | Electric Utilities 1.6% | | | | | | | | | | |
| | MidAmerican Energy Holdings Co., senior note, 8.48%, 9/15/28 | | United States | | | 25,000,000 | | | | 33,203,375 | |
| | Northeast Generation Co., senior secured note, B-1, 8.812%, 10/15/26 | | United States | | | 7,048,829 | | | | 7,788,392 | |
| | | | | | | | | | | |
| | | | | | | | | | | 40,991,767 | |
| | | | | | | | | | | |
| | Independent Power Producers & Energy Traders 1.1% | | | | | | | | | | |
| | Energy Future Holdings Corp., | | | | | | | | | | |
| | asecured senior note, 144A, 10.00%, 1/15/20 | | United States | | | 24,225,000 | | | | 24,167,877 | |
| | senior note, R, 6.55%, 11/15/34 | | United States | | | 5,700,000 | | | | 2,194,500 | |
| | | | | | | | | | | |
| | | | | | | | | | | 26,362,377 | |
| | | | | | | | | | | |
| | Multi-Utilities 0.5% | | | | | | | | | | |
| | Aquila Inc., senior note, | | | | | | | | | | |
| | 7.95%, 2/01/11 | | United States | | | 6,000,000 | | | | 6,127,596 | |
| | 8.27%, 11/15/21 | | United States | | | 6,100,000 | | | | 7,159,564 | |
| | | | | | | | | | | |
| | | | | | | | | | | 13,287,160 | |
| | | | | | | | | | | |
| | Total Corporate Bonds (Cost $77,776,007) | | | | | | | | | 80,641,304 | |
| | | | | | | | | | | |
| | Total Investments before Short Term Investments (Cost $1,921,400,377) | | | | | | | | | 2,508,910,626 | |
| | | | | | | | | | | |
| | | | | | | | | | | | |
| | | | | | Shares | | | | | |
| | Short Term Investments (Cost $40,993,986) 1.6% | | | | | | | | | | |
| | Money Market Funds 1.6% | | | | | | | | | | |
| b,c | Institutional Fiduciary Trust Money Market Portfolio, 0.00% | | United States | | | 40,993,986 | | | | 40,993,986 | |
| | | | | | | | | | | |
| | Total Investments (Cost $1,962,394,363) 100.2% | | | | | | | | | 2,549,904,612 | |
| | Other Assets, less Liabilities (0.2)% | | | | | | | | | (5,396,574 | ) |
| | | | | | | | | | | |
| | Net Assets 100.0% | | | | | | | | $ | 2,544,508,038 | |
| | | | | | | | | | | |
| | |
| a | | Security was purchased pursuant to Rule 144A under the Securities Act of 1933 and may be sold in transactions exempt from registration only to qualified institutional buyers or in a public offering registered under the Securities Act of 1933. This security has been deemed liquid under guidelines approved by the Trust’s Board of Trustees. At September 30, 2010, the value of this security was $24,167,877, representing 0.95% of net assets. |
| | | |
| b | | Non-income producing. |
| | | |
| c | | See Note 7 regarding investments in the Institutional Fiduciary Trust Money Market Portfolio. The rate shown is the annualized seven-day yield at period end. |
110 | The accompanying notes are an integral part of these financial statements. | Annual Report
Franklin Custodian Funds
Financial Statements
Statements of Assets and Liabilities
September 30, 2010
| | | | | | | | | | | | | |
| | | Franklin | | Franklin | | Franklin |
| | | DynaTech Fund | | Growth Fund | | Income Fund |
| | | |
| Assets: | | | | | | | | | | | | |
| Investments in securities: | | | | | | | | | | | | |
| Cost — Unaffiliated issuers | | $ | 364,688,370 | | | $ | 1,745,179,804 | | | $ | 52,686,735,686 | |
| Cost — Non-controlled affiliated issuers (Note 10) | | | — | | | | — | | | | 1,291,919,449 | |
| Cost — Sweep Money Fund (Note 7) | | | 5,804,707 | | | | 181,648,270 | | | | 330,912,398 | |
| Cost — Repurchase agreements | | | — | | | | 31,822,988 | | | | 490,186,154 | |
| | | |
| Total cost of investments | | $ | 370,493,077 | | | $ | 1,958,651,062 | | | $ | 54,799,753,687 | |
| | | |
| Value — Unaffiliated issuers | | $ | 687,142,088 | | | $ | 3,405,567,604 | | | $ | 52,475,237,681 | |
| Value — Non-controlled affiliated issuers (Note 10) | | | — | | | | — | | | | 990,525,834 | |
| Value — Sweep Money Fund (Note 7) | | | 5,804,707 | | | | 181,648,270 | | | | 330,912,398 | |
| Value — Repurchase agreements | | | — | | | | 31,822,988 | | | | 490,186,154 | |
| | | |
Total value of investmentsa | | | 692,946,795 | | | | 3,619,038,862 | | | | 54,286,862,067 | |
| Cash | | | 525 | | | | 111,181 | | | | 13,632,118 | |
| Receivables: | | | | | | | | | | | | |
| Investment securities sold | | | — | | | | 5,798,839 | | | | 102,153,529 | |
| Capital shares sold | | | 677,864 | | | | 31,504,660 | | | | 152,145,641 | |
| Dividends and interest | | | 365,176 | | | | 3,951,039 | | | | 671,137,811 | |
| Other assets | | | 764 | | | | 3,151 | | | | 45,993 | |
| | | |
| Total assets | | | 693,991,124 | | | | 3,660,407,732 | | | | 55,225,977,159 | |
| | | |
| Liabilities: | | | | | | | | | | | | |
| Payables: | | | | | | | | | | | | |
| Investment securities purchased | | | 2,612,040 | | | | — | | | | 565,688,334 | |
| Capital shares redeemed | | | 1,034,015 | | | | 5,099,052 | | | | 94,127,646 | |
| Affiliates | | | 752,015 | | | | 3,454,861 | | | | 46,587,269 | |
| Allocator Funds (Note 11) | | | — | | | | 35,929 | | | | 209,972 | |
| Unaffiliated transfer agent fees | | | 120,420 | | | | 533,723 | | | | 5,983,222 | |
| Payable upon return of securities loaned | | | — | | | | — | | | | 5,325,668 | |
| Accrued expenses and other liabilities | | | 81,788 | | | | 279,580 | | | | 3,459,603 | |
| | | |
| Total liabilities | | | 4,600,278 | | | | 9,403,145 | | | | 721,381,714 | |
| | | |
| Net assets, at value | | $ | 689,390,846 | | | $ | 3,651,004,587 | | | $ | 54,504,595,445 | |
| | | |
| Net assets consist of: | | | | | | | | | | | | |
| Paid-in capital | | $ | 405,785,859 | | | $ | 2,072,811,029 | | | $ | 61,811,616,016 | |
| Undistributed net investment income (loss) | | | — | | | | 5,612,427 | | | | — | |
| Distributions in excess of net investment income | | | — | | | | — | | | | (112,725,558 | ) |
| Net unrealized appreciation (depreciation) | | | 322,467,882 | | | | 1,660,386,659 | | | | (512,339,451 | ) |
| Accumulated net realized gain (loss) | | | (38,862,895 | ) | | | (87,805,528 | ) | | | (6,681,955,562 | ) |
| | | |
| Net assets, at value | | $ | 689,390,846 | | | $ | 3,651,004,587 | | | $ | 54,504,595,445 | |
| | | |
| | |
| a | | The Franklin Income Fund includes $5,031,128 of securities loaned. |
Annual Report | The accompanying notes are an integral part of these financial statements. | 111
Franklin Custodian Funds
Financial Statements (continued)
Statements of Assets and Liabilities (continued)
September 30, 2010
| | | | | | | | | | | | | |
| | | Franklin | | Franklin | | Franklin |
| | | DynaTech Fund | | Growth Fund | | Income Fund |
| | | |
Class A: | | | | | | | | | | | | |
| Net assets, at value | | $ | 566,764,085 | | | $ | 2,587,802,201 | | | $ | 32,281,990,803 | |
| | | |
| Shares outstanding | | | 20,866,934 | | | | 62,946,781 | | | | 15,277,623,716 | |
| | | |
Net asset value per sharea | | $ | 27.16 | | | $ | 41.11 | | | $ | 2.11 | |
| | | |
| Maximum offering price per share (net asset value per share ÷ 94.25%, 94.25% and 95.75%, respectively) | | $ | 28.82 | | | $ | 43.62 | | | $ | 2.20 | |
| | | |
Class B: | | | | | | | | | | | | |
| Net assets, at value | | $ | 10,125,386 | | | $ | 51,594,149 | | | $ | 1,629,726,332 | |
| | | |
| Shares outstanding | | | 403,353 | | | | 1,311,541 | | | | 774,930,924 | |
| | | |
Net asset value and maximum offering price per sharea | | $ | 25.10 | | | $ | 39.34 | | | $ | 2.10 | |
| | | |
Class B1: | | | | | | | | | | | | |
| Net assets, at value | | | — | | | | — | | | $ | 23,550,921 | |
| | | |
| Shares outstanding | | | — | | | | — | | | | 11,123,528 | |
| | | |
Net asset value and maximum offering price per sharea | | | — | | | | — | | | $ | 2.12 | |
| | | |
Class C: | | | | | | | | | | | | |
| Net assets, at value | | $ | 93,926,515 | | | $ | 349,188,086 | | | $ | 15,605,054,970 | |
| | | |
| Shares outstanding | | | 3,786,546 | | | | 8,971,595 | | | | 7,324,846,474 | |
| | | |
Net asset value and maximum offering price per sharea | | $ | 24.81 | | | $ | 38.92 | | | $ | 2.13 | |
| | | |
Class R: | | | | | | | | | | | | |
| Net assets, at value | | $ | 7,034,342 | | | $ | 117,484,015 | | | $ | 370,563,846 | |
| | | |
| Shares outstanding | | | 260,365 | | | | 2,869,430 | | | | 177,545,954 | |
| | | |
| Net asset value and maximum offering price per share | | $ | 27.02 | | | $ | 40.94 | | | $ | 2.09 | |
| | | |
Advisor Class: | | | | | | | | | | | | |
| Net assets, at value | | $ | 11,540,518 | | | $ | 544,936,136 | | | $ | 4,593,708,573 | |
| | | |
| Shares outstanding | | | 422,320 | | | | 13,232,344 | | | | 2,186,565,973 | |
| | | |
| Net asset value and maximum offering price per share | | $ | 27.33 | | | $ | 41.18 | | | $ | 2.10 | |
| | | |
| | |
| a | | Redemption price is equal to net asset value less contingent deferred sales charges, if applicable. |
112 | The accompanying notes are an integral part of these financial statements. | Annual Report
Franklin Custodian Funds
Financial Statements (continued)
Statements of Assets and Liabilities (continued)
September 30, 2010
| | | | | | | | | |
| | | Franklin | | |
| | | U.S. Government | | Franklin |
| | | Securities Fund | | Utilities Fund |
| | | |
| Assets: | | | | | | | | |
| Investments in securities: | | | | | | | | |
| Cost — Unaffiliated issuers | | $ | 10,164,106,856 | | | $ | 1,921,400,377 | |
| Cost — Sweep Money Fund (Note 7) | | | 112,396,476 | | | | 40,993,986 | |
| | | |
| Total cost of investments | | $ | 10,276,503,332 | | | $ | 1,962,394,363 | |
| | | |
| Value — Unaffiliated issuers | | $ | 10,616,396,683 | | | $ | 2,508,910,626 | |
| Value — Sweep Money Fund (Note 7) | | | 112,396,476 | | | | 40,993,986 | |
| | | |
| Total value of investments | | | 10,728,793,159 | | | | 2,549,904,612 | |
| Receivables: | | | | | | | | |
| Capital shares sold | | | 33,652,015 | | | | 7,901,358 | |
| Dividends and interest | | | 41,515,320 | | | | 7,621,223 | |
| Other assets | | | 8,499 | | | | 2,188 | |
| | | |
| Total assets | | | 10,803,968,993 | | | | 2,565,429,381 | |
| | | |
| Liabilities: | | | | | | | | |
| Payables: | | | | | | | | |
| Investment securities purchased | | | 44,611,014 | | | | 13,901,790 | |
| Capital shares redeemed | | | 32,305,091 | | | | 4,471,838 | |
| Affiliates | | | 9,016,096 | | | | 2,035,342 | |
| Allocator Funds (Note 11) | | | 41,646 | | | | 10,058 | |
| Unaffiliated transfer agent fees | | | 1,038,149 | | | | 332,420 | |
| Accrued expenses and other liabilities | | | 476,519 | | | | 169,895 | |
| | | |
| Total liabilities | | | 87,488,515 | | | | 20,921,343 | |
| | | |
| Net assets, at value | | $ | 10,716,480,478 | | | $ | 2,544,508,038 | |
| | | |
| Net assets consist of: | | | | | | | | |
| Paid-in capital | | $ | 10,610,268,259 | | | $ | 1,969,219,636 | |
| Undistributed net investment income | | | 22,769,757 | | | | 2,786,464 | |
| Net unrealized appreciation (depreciation) | | | 452,289,827 | | | | 587,523,981 | |
| Accumulated net realized gain (loss) | | | (368,847,365 | ) | | | (15,022,043 | ) |
| | | |
| Net assets, at value | | $ | 10,716,480,478 | | | $ | 2,544,508,038 | |
| | | |
Annual Report | The accompanying notes are an integral part of these financial statements. | 113
Franklin Custodian Funds
Financial Statements (continued)
Statements of Assets and Liabilities (continued)
September 30, 2010
| | | | | | | | | |
| | | Franklin | | |
| | | U.S. Government | | Franklin |
| | | Securities Fund | | Utilities Fund |
| | | |
Class A: | | | | | | | | |
| Net assets, at value | | $ | 6,771,471,155 | | | $ | 1,823,971,732 | |
| | | |
| Shares outstanding | | | 993,976,948 | | | | 159,442,916 | |
| | | |
Net asset value per sharea | | $ | 6.81 | | | $ | 11.44 | |
| | | |
| Maximum offering price per share (net asset value per share ÷ 95.75%) | | $ | 7.11 | | | $ | 11.95 | |
| | | |
Class B: | | | | | | | | |
| Net assets, at value | | $ | 126,802,595 | | | $ | 50,439,368 | |
| | | |
| Shares outstanding | | | 18,640,926 | | | | 4,408,979 | |
| | | |
Net asset value and maximum offering price per sharea | | $ | 6.80 | | | $ | 11.44 | |
| | | |
Class C: | | | | | | | | |
| Net assets, at value | | $ | 2,484,846,921 | | | $ | 405,023,717 | |
| | | |
| Shares outstanding | | | 366,918,168 | | | | 35,527,064 | |
| | | |
Net asset value and maximum offering price per sharea | | $ | 6.77 | | | $ | 11.40 | |
| | | |
Class R: | | | | | | | | |
| Net assets, at value | | $ | 140,146,848 | | | $ | 42,285,227 | |
| | | |
| Shares outstanding | | | 20,589,522 | | | | 3,706,422 | |
| | | |
| Net asset value and maximum offering price per share | | $ | 6.81 | | | $ | 11.41 | |
| | | |
Advisor Class: | | | | | | | | |
| Net assets, at value | | $ | 1,193,212,959 | | | $ | 222,787,994 | |
| | | |
| Shares outstanding | | | 174,675,568 | | | | 19,371,836 | |
| | | |
| Net asset value and maximum offering price per share | | $ | 6.83 | | | $ | 11.50 | |
| | | |
| | |
| a | | Redemption price is equal to net asset value less contingent deferred sales charges, if applicable. |
114 | The accompanying notes are an integral part of these financial statements. | Annual Report
Franklin Custodian Funds
Financial Statements (continued)
Statements of Operations
for the year ended September 30, 2010
| | | | | | | | | | | | | |
| | | Franklin | | Franklin | | Franklin |
| | | DynaTech Fund | | Growth Fund | | Income Fund |
| | | |
| Investment income: | | | | | | | | | | | | |
| Dividends: | | | | | | | | | | | | |
| Unaffiliated issuers | | $ | 3,860,661 | | | $ | 48,415,305 | | | $ | 692,932,013 | |
| Non-controlled affiliated issuers (Note 10) | | | — | | | | — | | | | 50,556,952 | |
| Interest: | | | | | | | | | | | | |
| Unaffiliated issuers | | | — | | | | 14,435 | | | | 2,841,761,749 | |
| Non-controlled affiliated issuers (Note 10) | | | — | | | | — | | | | 52,188,551 | |
| Income from securities loaned | | | — | | | | — | | | | 1,303,497 | |
| | | |
| Total investment income | | | 3,860,661 | | | | 48,429,740 | | | | 3,638,742,762 | |
| | | |
| Expenses: | | | | | | | | | | | | |
| Management fees (Note 3a) | | | 3,175,313 | | | | 15,026,525 | | | | 196,626,526 | |
| Distribution fees: (Note 3c) | | | | | | | | | | | | |
| Class A | | | 1,347,891 | | | | 5,959,116 | | | | 45,111,822 | |
| Class B | | | 118,944 | | | | 706,722 | | | | 18,481,539 | |
| Class B1 | | | — | | | | — | | | | 221,952 | |
| Class C | | | 897,352 | | | | 3,338,340 | | | | 93,323,299 | |
| Class R | | | 32,840 | | | | 428,982 | | | | 1,732,148 | |
| Transfer agent fees (Note 3e) | | | 1,610,275 | | | | 6,705,190 | | | | 45,401,588 | |
| Special servicing agreement fees (Note 11) | | | — | | | | 500,762 | | | | 2,486,688 | |
| Custodian fees (Note 4) | | | 18,824 | | | | 51,703 | | | | 1,000,634 | |
| Reports to shareholders | | | 149,697 | | | | 587,731 | | | | 5,366,622 | |
| Registration and filing fees | | | 88,845 | | | | 159,690 | | | | 1,212,503 | |
| Professional fees | | | 63,942 | | | | 103,311 | | | | 535,264 | |
| Trustees’ fees and expenses | | | 3,754 | | | | 18,750 | | | | 296,318 | |
| Other | | | 14,872 | | | | 65,928 | | | | 1,403,136 | |
| | | |
| Total expenses | | | 7,522,549 | | | | 33,652,750 | | | | 413,200,039 | |
| Expense reductions (Note 4) | | | — | | | | — | | | | (346 | ) |
| | | |
| Net expenses | | | — | | | | — | | | | 413,199,693 | |
| | | |
| Net investment income (loss) | | | (3,661,888 | ) | | | 14,776,990 | | | | 3,225,543,069 | |
| | | |
| Realized and unrealized gains (losses): | | | | | | | | | | | | |
| Net realized gain (loss) from: | | | | | | | | | | | | |
| Investments: | | | | | | | | | | | | |
| Unaffiliated issuers | | | 41,167,617 | | | | 42,757,008 | | | | (917,339,548 | ) |
| Non-controlled affiliated issuers (Note 10) | | | — | | | | — | | | | (309,968,803 | ) |
| Written options | | | — | | | | — | | | | 1,249,390 | |
| Foreign currency transactions | | | 110,404 | | | | 14,111 | | | | 418,347 | |
| | | |
| Net realized gain (loss) | | | 41,278,021 | | | | 42,771,119 | | | | (1,225,640,614 | ) |
| | | |
| Net change in unrealized appreciation (depreciation) on: | | | | | | | | | | | | |
| Investments | | | 64,024,955 | | | | 355,329,494 | | | | 4,660,344,611 | |
| | | |
| Translation of other assets and liabilities denominated in foreign currencies | | | 7,881 | | | | (1,512 | ) | | | 704,061 | |
| | | |
| Net change in unrealized appreciation (depreciation) | | | 64,032,836 | | | | 355,327,982 | | | | 4,661,048,672 | |
| | | |
| Net realized and unrealized gain (loss) | | | 105,310,857 | | | | 398,099,101 | | | | 3,435,408,058 | |
| | | |
| Net increase (decrease) in net assets resulting from operations | | $ | 101,648,969 | | | $ | 412,876,091 | | | $ | 6,660,951,127 | |
| | | |
Annual Report | The accompanying notes are an integral part of these financial statements. | 115
Franklin Custodian Funds
Financial Statements (continued)
Statements of Operations (continued)
for the year ended September 30, 2010
| | | | | | | | | |
| | | Franklin | | | |
| | | U.S. Government | | | Franklin |
| | | Securities Fund | | | Utilities Fund |
| | | |
| Investment income: | | | | | | | | |
| Dividends | | $ | — | | | $ | 99,828,114 | |
| Interest | | | 435,826,400 | | | | 6,485,252 | |
| | | |
| Total investment income | | | 435,826,400 | | | | 106,313,366 | |
| | | |
| Expenses: | | | | | | | | |
| Management fees (Note 3a) | | | 44,164,597 | | | | 10,410,967 | |
| Distribution fees: (Note 3c) | | | | | | | | |
| Class A | | | 8,987,735 | | | | 2,487,659 | |
| Class B | | | 1,149,041 | | | | 373,463 | |
| Class C | | | 12,916,634 | | | | 2,270,093 | |
| Class R | | | 685,783 | | | | 195,135 | |
| Transfer agent fees (Note 3e) | | | 10,856,833 | | | | 3,150,924 | |
| Special servicing agreement fees (Note 11) | | | 405,258 | | | | 95,375 | |
| Custodian fees (Note 4) | | | 145,273 | | | | 52,631 | |
| Reports to shareholders | | | 758,239 | | | | 304,558 | |
| Registration and filing fees | | | 503,906 | | | | 127,175 | |
| Professional fees | | | 149,709 | | | | 60,561 | |
| Trustees’ fees and expenses | | | 55,732 | | | | 12,663 | |
| Other | | | 751,270 | | | | 28,155 | |
| | | |
| Total expenses | | | 81,530,010 | | | | 19,569,359 | |
| | | |
| Net investment income | | | 354,296,390 | | | | 86,744,007 | |
| | | |
| Realized and unrealized gains (losses): | | | | | | | | |
| Net realized gain (loss) from: | | | | | | | | |
| Investments | | | 43,597,077 | | | | (13,905,910 | ) |
| Foreign currency transactions | | | — | | | | 52,511 | |
| | | |
| Net realized gain (loss) | | | 43,597,077 | | | | (13,853,399 | ) |
| | | |
| Net change in unrealized appreciation (depreciation) on: | | | | | | | | |
| Investments | | | 151,179,514 | | | | 195,596,660 | |
| Translation of other assets and liabilities denominated in foreign currencies | | | — | | | | (11,344 | ) |
| | | |
| Net change in unrealized appreciation (depreciation) | | | 151,179,514 | | | | 195,585,316 | |
| | | |
| Net realized and unrealized gain (loss) | | | 194,776,591 | | | | 181,731,917 | |
| | | |
| Net increase (decrease) in net assets resulting from operations | | $ | 549,072,981 | | | $ | 268,475,924 | |
| | | |
116 | The accompanying notes are an integral part of these financial statements. | Annual Report
Franklin Custodian Funds
Financial Statements (continued)
Statements of Changes in Net Assets
| | | | | | | | | | | | | | | | | |
| | | Franklin DynaTech Fund | | Franklin Growth Fund |
| | | Year Ended September 30, | | Year Ended September 30, |
| | | 2010 | | 2009 | | 2010 | | 2009 |
| | | |
| Increase (decrease) in net assets: | | | | | | | | | | | | | | | | |
| Operations: | | | | | | | | | | | | | | | | |
| Net investment income (loss) | | $ | (3,661,888 | ) | | $ | (2,203,451 | ) | | $ | 14,776,990 | | | $ | 19,035,425 | |
| Net realized gain (loss) from investments and foreign currency transactions | | | 41,278,021 | | | | (59,040,251 | ) | | | 42,771,119 | | | | 18,944,348 | |
| Net change in unrealized appreciation (depreciation) on investments and translation of other assets and liabilities denominated in foreign currencies | | | 64,032,836 | | | | 117,993,942 | | | | 355,327,982 | | | | 50,707,596 | |
| | | |
| Net increase (decrease) in net assets resulting from operations | | | 101,648,969 | | | | 56,750,240 | | | | 412,876,091 | | | | 88,687,369 | |
| | | |
| Distributions to shareholders from: | | | | | | | | | | | | | | | | |
| Net investment income: | | | | | | | | | | | | | | | | |
| Class A | | | — | | | | — | | | | (16,704,632 | ) | | | (13,937,611 | ) |
| Class B | | | — | | | | — | | | | (59,099 | ) | | | — | |
| Class C | | | — | | | | — | | | | (605,181 | ) | | | (158,739 | ) |
| Class R | | | — | | | | — | | | | (424,812 | ) | | | (93,243 | ) |
| Advisor Class | | | — | | | | — | | | | (4,186,666 | ) | | | (2,842,374 | ) |
| Net realized gains: | | | | | | | | | | | | | | | | |
| Class A | | | — | | | | (23,817,251 | ) | | | — | | | | — | |
| Class B | | | — | | | | (674,313 | ) | | | — | | | | — | |
| Class C | | | — | | | | (3,500,844 | ) | | | — | | | | — | |
| Advisor Class | | | — | | | | (211,314 | ) | | | — | | | | — | |
| | | |
| Total distributions to shareholders | | | — | | | | (28,203,722 | ) | | | (21,980,390 | ) | | | (17,031,967 | ) |
| | | |
| Capital share transactions: (Note 2) | | | | | | | | | | | | | | | | |
| Class A | | | (20,813,805 | ) | | | 95,693,757 | | | | 137,271,042 | | | | 423,439,580 | |
| Class B | | | (5,373,387 | ) | | | 2,223,304 | | | | (45,199,219 | ) | | | 64,703 | |
| Class C | | | (2,733,120 | ) | | | 24,245,692 | | | | (4,673,037 | ) | | | 55,014,386 | |
| Class R | | | (332,337 | ) | | | 4,561,511 | | | | 42,381,653 | | | | 30,600,261 | |
| Advisor Class | | | 1,852,034 | | | | 5,097,576 | | | | 57,480,773 | | | | 151,094,118 | |
| | | |
| Total capital share transactions | | | (27,400,615 | ) | | | 131,821,840 | | | | 187,261,212 | | | | 660,213,048 | |
| | | |
| Net increase (decrease) in net assets | | | 74,248,354 | | | | 160,368,358 | | | | 578,156,913 | | | | 731,868,450 | |
| Net assets: | | | | | | | | | | | | | | | | |
| Beginning of year | | | 615,142,492 | | | | 454,774,134 | | | | 3,072,847,674 | | | | 2,340,979,224 | |
| | | |
| End of year | | $ | 689,390,846 | | | $ | 615,142,492 | | | $ | 3,651,004,587 | | | $ | 3,072,847,674 | |
| | | |
| Undistributed net investment income included in net assets: | | | | | | | | | | | | | | | | |
| End of year | | $ | — | | | $ | — | | | $ | 5,612,427 | | | $ | 12,735,382 | |
| | | |
Annual Report | The accompanying notes are an integral part of these financial statements. | 117
Franklin Custodian Funds
Financial Statements (continued)
Statements of Changes in Net Assets (continued)
| | | | | | | | | | | | | | | | | |
| | | | | | | | | | | Franklin |
| | | Franklin Income Fund | | U.S. Government Securities Fund |
| | | Year Ended September 30, | | Year Ended September 30, |
| | | 2010 | | 2009 | | 2010 | | 2009 |
| | | |
| Increase (decrease) in net assets: | | | | | | | | | | | | | | | | |
| Operations: | | | | | | | | | | | | | | | | |
| Net investment income | | $ | 3,225,543,069 | | | $ | 3,021,185,783 | | | $ | 354,296,390 | | | $ | 326,946,470 | |
| Net realized gain (loss) from investments, written options and foreign currency transactions | | | (1,225,640,614 | ) | | | (4,679,001,452 | ) | | | 43,597,077 | | | | 8,947,805 | |
| Net change in unrealized appreciation (depreciation) on investments and translation of other assets and liabilities denominated in foreign currencies | | | 4,661,048,672 | | | | 5,364,093,012 | | | | 151,179,514 | | | | 306,262,342 | |
| | | |
| Net increase (decrease) in net assets resulting from operations | | | 6,660,951,127 | | | | 3,706,277,343 | | | | 549,072,981 | | | | 642,156,617 | |
| | | |
| Distributions to shareholders from: | | | | | | | | | | | | | | | | |
| Net investment income: | | | | | | | | | | | | | | | | |
| Class A | | | (2,130,895,815 | ) | | | (2,122,519,292 | ) | | | (258,072,430 | ) | | | (266,824,581 | ) |
| Class B | | | (118,302,615 | ) | | | (162,039,544 | ) | | | (6,345,333 | ) | | | (10,979,232 | ) |
| Class B1 | | | (2,367,258 | ) | | | (12,892,120 | ) | | | — | | | | — | |
| Class C | | | (935,146,104 | ) | | | (924,754,117 | ) | | | (67,975,758 | ) | | | (39,006,086 | ) |
| Class R | | | (23,521,043 | ) | | | (22,649,572 | ) | | | (4,950,161 | ) | | | (5,108,595 | ) |
| Advisor Class | | | (317,015,455 | ) | | | (322,719,140 | ) | | | (41,720,232 | ) | | | (32,473,805 | ) |
| Net realized gains: | | | | | | | | | | | | | | | | |
| Class A | | | — | | | | (15,591,600 | ) | | | — | | | | — | |
| Class B | | | — | | | | (1,384,690 | ) | | | — | | | | — | |
| Class B1 | | | — | | | | (124,160 | ) | | | — | | | | — | |
| Class C | | | — | | | | (7,179,957 | ) | | | — | | | | — | |
| Class R | | | — | | | | (166,198 | ) | | | — | | | | — | |
| Advisor Class | | | — | | | | (2,449,031 | ) | | | — | | | | — | |
| | | |
| Total distributions to shareholders | | | (3,527,248,290 | ) | | | (3,594,469,421 | ) | | | (379,063,914 | ) | | | (354,392,299 | ) |
| | | |
| Capital share transactions: (Note 2) | | | | | | | | | | | | | | | | |
| Class A | | | 2,663,148,549 | | | | 729,974,966 | | | | 382,989,796 | | | | 707,313,300 | |
| Class B | | | (536,384,118 | ) | | | (324,408,642 | ) | | | (106,822,122 | ) | | | (64,174,344 | ) |
| Class B1 | | | (47,563,018 | ) | | | (136,813,461 | ) | | | — | | | | — | |
| Class C | | | 1,661,877,069 | | | | 543,188,709 | | | | 986,641,643 | | | | 820,560,727 | |
| Class R | | | 34,240,036 | | | | 40,235,428 | | | | (628,625 | ) | | | 29,529,703 | |
| Advisor Class | | | 149,037,262 | | | | (24,803,405 | ) | | | 310,809,591 | | | | 227,056,372 | |
| | | |
| Total capital share transactions | | | 3,924,355,780 | | | | 827,373,595 | | | | 1,572,990,283 | | | | 1,720,285,758 | |
| | | |
| Net increase (decrease) in net assets | | | 7,058,058,617 | | | | 939,181,517 | | | | 1,742,999,350 | | | | 2,008,050,076 | |
| Net assets: | | | | | | | | | | | | | | | | |
| Beginning of year | | | 47,446,536,828 | | | | 46,507,355,311 | | | | 8,973,481,128 | | | | 6,965,431,052 | |
| | | |
| End of year | | $ | 54,504,595,445 | | | $ | 47,446,536,828 | | | $ | 10,716,480,478 | | | $ | 8,973,481,128 | |
| | | |
| Undistributed net investment income (distributions in excess of net investment income) included in net assets: | | | | | | | | | | | | | | | | |
| End of year | | $ | (112,725,558 | ) | | $ | (293,103,420 | ) | | $ | 22,769,757 | | | $ | 2,451,318 | |
| | | |
118 | The accompanying notes are an integral part of these financial statements. | Annual Report
Franklin Custodian Funds
Financial Statements (continued)
Statements of Changes in Net Assets (continued)
| | | | | | | | | |
| | | Franklin Utilities Fund |
| | | Year Ended September 30, |
| | | 2010 | | 2009 |
| | | |
| Increase (decrease) in net assets: | | | | | | | | |
| Operations: | | | | | | | | |
| Net investment income | | $ | 86,744,007 | | | $ | 79,810,590 | |
| Net realized gain (loss) from investments and foreign currency transactions | | | (13,853,399 | ) | | | 28,009,600 | |
| Net change in unrealized appreciation (depreciation) on investments and translation of other assets and liabilities denominated in foreign currencies | | | 195,585,316 | | | | (249,432,367 | ) |
| | | |
| Net increase (decrease) in net assets resulting from operations | | | 268,475,924 | | | | (141,612,177 | ) |
| | | |
| Distributions to shareholders from: | | | | | | | | |
| Net investment income: | | | | | | | | |
| Class A | | | (68,149,865 | ) | | | (60,897,517 | ) |
| Class B | | | (2,057,071 | ) | | | (2,457,137 | ) |
| Class C | | | (12,635,206 | ) | | | (10,325,076 | ) |
| Class R | | | (1,462,964 | ) | | | (1,233,300 | ) |
| Advisor Class | | | (6,837,755 | ) | | | (2,775,441 | ) |
| Net realized gains: | | | | | | | | |
| Class A | | | (23,199,153 | ) | | | (11,143,330 | ) |
| Class B | | | (922,593 | ) | | | (556,682 | ) |
| Class C | | | (4,562,415 | ) | | | (2,138,465 | ) |
| Class R | | | (555,438 | ) | | | (236,227 | ) |
| Advisor Class | | | (1,930,079 | ) | | | (407,396 | ) |
| | | |
| Total distributions to shareholders | | | (122,312,539 | ) | | | (92,170,571 | ) |
| | | |
| Capital share transactions: (Note 2) | | | | | | | | |
| Class A | | | 173,810,246 | | | | (47,298,609 | ) |
| Class B | | | (17,162,713 | ) | | | (18,007,546 | ) |
| Class C | | | 81,972,824 | | | | (4,044,700 | ) |
| Class R | | | 1,998,821 | | | | 4,676,850 | |
| Advisor Class | | | 87,695,496 | | | | 71,734,045 | |
| | | |
| Total capital share transactions | | | 328,314,674 | | | | 7,060,040 | |
| | | |
| Net increase (decrease) in net assets | | | 474,478,059 | | | | (226,722,708 | ) |
| Net assets: | | | | | | | | |
| Beginning of year | | | 2,070,029,979 | | | | 2,296,752,687 | |
| | | |
| End of year | | $ | 2,544,508,038 | | | $ | 2,070,029,979 | |
| | | |
| Undistributed net investment income included in net assets: | | | | | | | | |
| End of year | | $ | 2,786,464 | | | $ | 9,424,658 | |
| | | |
Annual Report | The accompanying notes are an integral part of these financial statements. | 119
Franklin Custodian Funds
Notes to Financial Statements
1. Organization and Significant Accounting Policies
Franklin Custodian Funds (Trust) is registered under the Investment Company Act of 1940, as amended, (1940 Act) as an open-end investment company, consisting of five funds (Funds). The classes of shares offered within each of the Funds are indicated below. Each class of shares differs by its initial sales load, contingent deferred sales charges, distribution fees, voting rights on matters affecting a single class and its exchange privilege.
| | | |
| Class A, Class B, Class C, Class R | | Class A, Class B, Class B1, |
| & Advisor Class | | Class C, Class R & Advisor Class |
| |
| Franklin DynaTech Fund | | Franklin Income Fund |
| Franklin Growth Fund | | |
| Franklin U.S. Government Securities Fund | | |
| Franklin Utilities Fund | | |
The following summarizes the Funds’ significant accounting policies.
a. Financial Instrument Valuation
The Funds value their investments in securities and other assets and liabilities carried at fair value daily. Fair value is the price that would be received to sell an asset or paid to transfer a liability in an orderly transaction between market participants on the measurement date. Under procedures approved by the Funds’ Board of Trustees, the Funds may utilize independent pricing services, quotations from securities and financial instrument dealers, and other market sources to determine fair value.
Equity securities and derivative financial instruments listed on an exchange or on the NASDAQ National Market System are valued at the last quoted sale price or the official closing price of the day, respectively. Foreign equity securities are valued as of the close of trading on the foreign stock exchange on which the security is primarily traded, or the NYSE, whichever is earlier. The value is then converted into its U.S. dollar equivalent at the foreign exchange rate in effect at the close of the NYSE on the day that the value of the security is determined. Over-the-counter securities are valued within the range of the most recent quoted bid and ask prices. Securities that trade in multiple markets or on multiple exchanges are valued according to the broadest and most representative market. Certain equity securities are valued based upon fundamental characteristics or relationships to similar securities. Investments in open-end mutual funds and non-registered money market funds are valued at the closing net asset value.
Debt securities generally trade in the over-the-counter market rather than on a securities exchange. The Funds’ pricing services use multiple valuation techniques to determine fair value. In instances where sufficient market activity exists, the pricing services may utilize a market-based approach through which quotes from market makers are used to determine fair value. In instances where sufficient market activity may not exist or is limited, the pricing services also utilize proprietary valuation models which may consider market characteristics such as benchmark yield curves, option-adjusted spreads, credit spreads, estimated default rates, coupon rates, anticipated timing of
120 | Annual Report
Franklin Custodian Funds
Notes to Financial Statements (continued)
1. Organization and Significant Accounting Policies (continued)
a. Financial Instrument Valuation (continued)
principal repayments, underlying collateral, and other unique security features in order to estimate the relevant cash flows, which are then discounted to calculate the fair value. Securities denominated in a foreign currency are converted into their U.S. dollar equivalent at the foreign exchange rate in effect at the close of the NYSE on the date that the values of the foreign debt securities are determined. Repurchase agreements are valued at cost, which approximates market value.
The Funds have procedures to determine the fair value of securities and other financial instruments for which market prices are not readily available or which may not be reliably priced. Under these procedures, the Funds primarily employ a market-based approach which may use related or comparable assets or liabilities, recent transactions, market multiples, book values, and other relevant information for the investment to determine the fair value of the investment. The Funds may also use an income-based valuation approach in which the anticipated future cash flows of the investment are discounted to calculate fair value. Discounts may also be applied due to the nature or duration of any restrictions on the disposition of the investments. Due to the inherent uncertainty of valuations of such investments, the fair values may differ significantly from the values that would have been used had an active market ex isted.
Trading in securities on foreign exchanges and over-the-counter markets may be completed before the daily close of business on the NYSE. Occasionally, events occur between the time at which trading in a foreign security is completed and the close of the NYSE that might call into question the reliability of the value of a portfolio security held by the fund. As a result, differences may arise between the value of the Funds’ portfolio securities as determined at the foreign market close and the latest indications of value at the close of the NYSE. In order to minimize the potential for these differences, the investment manager monitors price movements following the close of trading in foreign stock markets through a series of country specific market proxies (such as baskets of American Depository Receipts, futures contracts and exchange traded funds). These price movements are measured against established trigger thresholds for each specific market proxy to assist in determining if an event has occurred that may call into question the reliability of the values of the foreign securities held by the Funds. If such an event occurs, the securities may be valued using fair value procedures, which may include the use of independent pricing services.
b. Foreign Currency Translation
Portfolio securities and other assets and liabilities denominated in foreign currencies are translated into U.S. dollars based on the exchange rate of such currencies against U.S. dollars on the date of valuation. The Funds may enter into foreign currency exchange contracts to facilitate transactions denominated in a foreign currency. Purchases and sales of securities, income and expense items denominated in foreign currencies are translated into U.S. dollars at the exchange rate in
Annual Report | 121
Franklin Custodian Funds
Notes to Financial Statements (continued)
1. Organization and Significant Accounting Policies (continued)
b. Foreign Currency Translation (continued)
effect on the transaction date. Portfolio securities and assets and liabilities denominated in foreign currencies contain risks that those currencies will decline in value relative to the U.S. dollar. Occasionally, events may impact the availability or reliability of foreign exchange rates used to convert the U.S. dollar equivalent value. If such an event occurs, the foreign exchange rate will be valued at fair value using procedures established and approved by the Trust’s Board of Trustees.
The Funds do not separately report the effect of changes in foreign exchange rates from changes in market prices on securities held. Such changes are included in the net realized and net unrealized gain or loss from investments on the Statement of Operations.
The effect of changes in foreign exchange rates from changes in market prices on securities held are included in net realized and unrealized gain or loss from investments on the Statement of Operations. Realized foreign exchange gains or losses arise from sales of foreign currencies, currency gains or losses realized between the trade and settlement dates on securities transactions and the difference between the recorded amounts of dividends, interest, and foreign withholding taxes and the U.S. dollar equivalent of the amounts actually received or paid. Net unrealized foreign exchange gains and losses arise from changes in foreign exchange rates on foreign denominated assets and liabilities other than investments in securities held at the end of the reporting period.
c. Joint Repurchase Agreement
The Funds may enter into a joint repurchase agreement whereby their uninvested cash balance is deposited into a joint cash account with other funds managed by the investment manager or an affiliate of the investment manager and is used to invest in one or more repurchase agreements. The value and face amount of the joint repurchase agreement are allocated to the funds based on their pro-rata interest. A repurchase agreement is accounted for as a loan by the fund to the seller, collateralized by securities which are delivered to the fund’s custodian. The market value, including accrued interest, of the initial collateralization is required to be at least 102% of the dollar amount invested by the funds, with the value of the underlying securities marked to market daily to maintain coverage of at least 100%. The joint repurchase agreement held by the funds at year end had been entered into on September&nbs p;30, 2010.
d. Securities Purchased on a When-Issued, Delayed Delivery, and TBA Basis
The Funds may purchase securities on a when-issued, delayed delivery, and to-be-announced (TBA) basis, with payment and delivery scheduled for a future date. These transactions are subject to market fluctuations and are subject to the risk that the value at delivery may be more or less than the trade date purchase price. Although the Funds will generally purchase these securities with the intention of holding the securities, they may sell the securities before the settlement date. Sufficient assets have been segregated for these securities.
122 | Annual Report
Franklin Custodian Funds
Notes to Financial Statements (continued)
1. Organization and Significant Accounting Policies (continued)
e. Derivative Financial Instruments
The Franklin Income Fund invests in derivative financial instruments (derivatives) in order to manage risk or gain exposure to various other investments or markets. Derivatives are financial contracts based on an underlying or notional amount, require no initial investment or an initial net investment that is smaller than would normally be required to have a similar response to changes in market factors, and require or permit net settlement. Derivatives may contain various risks including the potential inability of the counterparty to fulfill their obligations under the terms of the contract, the potential for an illiquid secondary market, and the potential for market movements which expose the fund to gains or losses in excess of the amounts shown on the Statement of Assets and Liabilities. Realized gain and loss and unrealized appreciation and depreciation on these contracts for the period are include d in the Statements of Operations.
The Franklin Income Fund purchases or writes option contracts primarily to manage and/or gain exposure to equity price risk. An option is a contract entitling the holder to purchase or sell a specific amount of shares or units of a particular security, currency or index, or notional amount of a swap (swaption), at a specified price. Options purchased are recorded as an asset while options written are recorded as a liability. Upon exercise of an option, the acquisition cost or sales proceeds of the security is adjusted by any premium paid or received. Upon expiration of an option, any premium paid or received is recorded as a realized loss or gain. Upon closing an option other than through expiration or exercise, the difference between the premium and the cost to close the position is recorded as a realized gain or loss.
See Note 9 regarding other derivative information.
f. Equity-Linked Securities
The Franklin Income Fund may invest in equity-linked securities. Equity-linked securities are hybrid financial instruments that generally combine both debt and equity characteristics into a single note form. Income received from equity linked securities is recorded as realized gains in the Statement of Operations and may be based on the performance of an underlying equity security, an equity index, or an option position. The risks of investing in equity-linked securities include unfavorable price movements in the underlying security and the credit risk of the issuing financial institution. There may be no guarantee of a return of principal with equity linked securities and the appreciation potential may be limited. Equity-linked securities may be more volatile and less liquid than other investments held by the Fund.
g. Securities Lending
The Franklin Income Fund participates in an agency based security lending program. The fund receives cash collateral against the loaned securities in an amount equal to at least 102% of the market value of the loaned securities. Collateral is maintained over the life of the loan in an
Annual Report | 123
Franklin Custodian Funds
Notes to Financial Statements (continued)
1. Organization and Significant Accounting Policies (continued)
g. Securities Lending (continued)
amount not less than 100% of the market value of loaned securities, as determined at the close of fund business each day; any additional collateral required due to changes in security values is delivered to the fund on the next business day. The collateral is invested in a non-registered money fund and in a money market fund managed by the fund’s custodian on the fund’s behalf. The fund receives income from the investment of cash collateral, in addition to lending fees and rebates paid by the borrower. The fund bears the market risk with respect to the collateral investment, securities loaned, and the risk that the agent may default on its obligations to the fund. The securities lending agent has agreed to indemnify the fund in the event of default by a third party borrower.
h. Senior Floating Rate Interests
Senior secured corporate loans pay interest at rates which are periodically reset by reference to a base lending rate plus a spread. These base lending rates are generally the prime rate offered by a designated U.S. bank or the London InterBank Offered Rate (LIBOR). Senior secured corporate loans often require prepayment of principal from excess cash flows or at the discretion of the borrower. As a result, actual maturity may be substantially less than the stated maturity.
Senior secured corporate loans in which the fund invests are generally readily marketable, but may be subject to some restrictions on resale.
i. Income Taxes
It is each Fund’s policy to qualify as a regulated investment company under the Internal Revenue Code and to distribute to shareholders substantially all of its taxable income and net realized gains. As a result, no provision for U.S. federal income taxes is required. The Funds file U.S. income tax returns as well as tax returns in certain other jurisdictions. The Funds recognize in their financial statements the effects including penalties and interest, if any, of a tax position taken on tax return (or expected to be taken) when it’s more likely than not (a greater than 50% probability), based on the technical merits, that the tax position will be sustained upon examination by the tax authorities. As of September 30, 2010, and for all open tax years, the Funds have determined that no provision for income tax is required in the Funds’ financial statements. Open tax years are those that re main subject to examination and are based on each tax jurisdiction statute of limitation. The Funds are not aware of any tax position for which it is reasonably possible that the total amounts of unrecognized tax effects will significantly change in the next twelve months.
j. Security Transactions, Investment Income, Expenses and Distributions
Security transactions are accounted for on trade date. Realized gains and losses on security transactions are determined on a specific identification basis. Interest income and estimated expenses are accrued daily. Amortization of premium and accretion of discount on debt securities
124 | Annual Report
Franklin Custodian Funds
Notes to Financial Statements (continued)
1. Organization and Significant Accounting Policies (continued)
j. Security Transactions, Investment Income, Expenses and Distributions (continued)
are included in interest income. Facility fees are recognized as income over the expected term of the loan. Dividend income is recorded on the ex-dividend date. Distributions to shareholders are recorded on the ex-dividend date and are determined according to income tax regulations (tax basis). Distributable earnings determined on a tax basis may differ from earnings recorded in accordance with accounting principles generally accepted in the United States of America. These differences may be permanent or temporary. Permanent differences are reclassified among capital accounts to reflect their tax character. These reclassifications have no impact on net assets or the results of operations. Temporary differences are not reclassified, as they may reverse in subsequent periods.
Common expenses incurred by the Trust are allocated among the Funds based on the ratio of net assets of each fund to the combined net assets of the Trust. Fund specific expenses are charged directly to the fund that incurred the expense.
Realized and unrealized gains and losses and net investment income, not including class specific expenses, are allocated daily to each class of shares based upon the relative proportion of net assets of each class. Differences in per share distributions, by class, are generally due to differences in class specific expenses.
k. Accounting Estimates
The preparation of financial statements in accordance with accounting principles generally accepted in the United States of America requires management to make estimates and assumptions that affect the reported amounts of assets and liabilities at the date of the financial statements and the amounts of income and expenses during the reporting period. Actual results could differ from those estimates.
l. Guarantees and Indemnifications
Under the Trust’s organizational documents, its officers and trustees are indemnified by the Trust against certain liabilities arising out of the performance of their duties to the Trust. Additionally, in the normal course of business, the Trust, on behalf of the Funds, enters into contracts with service providers that contain general indemnification clauses. The Trust’s maximum exposure under these arrangements is unknown as this would involve future claims that may be made against the Trust that have not yet occurred. Currently, the Trust expects the risk of loss to be remote.
Annual Report | 125
Franklin Custodian Funds
Notes to Financial Statements (continued)
2. Shares of Beneficial Interest
At September 30, 2010, there were an unlimited number of shares authorized (without par value). Transactions in the Funds’ shares were as follows:
| | | | | | | | | | | | | | | | | |
| | | Franklin DynaTech Fund | | Franklin Growth Fund |
| | | Shares | | Amount | | Shares | | Amount |
| | | |
Class A Shares: | | | | | | | | | | | | | | | | |
| Year ended September 30, 2010 | | | | | | | | | | | | | | | | |
| Shares sold | | | 3,861,404 | | | $ | 97,617,815 | | | | 15,008,884 | | | $ | 592,373,612 | |
| Shares issued in reinvestment of distributions | | | — | | | | — | | | | 402,846 | | | | 15,404,808 | |
| Shares redeemed | | | (4,698,990 | ) | | | (118,431,620 | ) | | | (12,049,005 | ) | | | (470,507,378 | ) |
| | | |
| Net increase (decrease) | | | (837,586 | ) | | $ | (20,813,805 | ) | | | 3,362,725 | | | $ | 137,271,042 | |
| | | |
| Year ended September 30, 2009 | | | | | | | | | | | | | | | | |
| Shares sold | | | 2,782,002 | | | $ | 53,411,677 | | | | 12,015,889 | | | $ | 359,509,553 | |
| Shares issued on reorganization (Note 12) | | | 7,598,915 | | | | 126,195,671 | | | | 14,593,037 | | | | 451,362,637 | |
| Shares issued in reinvestment of distributions | | | 1,359,432 | | | | 21,288,705 | | | | 486,462 | | | | 12,711,248 | |
| Shares redeemed | | | (5,668,339 | ) | | | (105,202,296 | ) | | | (13,479,108 | ) | | | (400,143,858 | ) |
| | | |
| Net increase (decrease) | | | 6,072,010 | | | $ | 95,693,757 | | | | 13,616,280 | | | $ | 423,439,580 | |
| | | |
Class B Shares: | | | | | | | | | | | | | | | | |
| Year ended September 30, 2010 | | | | | | | | | | | | | | | | |
| Shares sold | | | 39,193 | | | $ | 908,906 | | | | 59,910 | | | $ | 2,278,747 | |
| Shares issued in reinvestment of distributions | | | — | | | | — | | | | 1,489 | | | | 54,809 | |
| Shares redeemed | | | (269,319 | ) | | | (6,282,293 | ) | | | (1,262,819 | ) | | | (47,532,775 | ) |
| | | |
| Net increase (decrease) | | | (230,126 | ) | | $ | (5,373,387 | ) | | | (1,201,420 | ) | | $ | (45,199,219 | ) |
| | | |
| Year ended September 30, 2009 | | | | | | | | | | | | | | | | |
| Shares sold | | | 68,034 | | | $ | 1,166,470 | | | | 269,458 | | | $ | 7,369,648 | |
| Shares issued on reorganization (Note 12) | | | 471,140 | | | | 7,329,289 | | | | 897,036 | | | | 26,650,945 | |
| Shares issued in reinvestment of distributions | | | 39,296 | | | | 576,475 | | | | — | | | | — | |
| Shares redeemed | | | (400,924 | ) | | | (6,848,930 | ) | | | (1,186,449 | ) | | | (33,955,890 | ) |
| | | |
| Net increase (decrease) | | | 177,546 | | | $ | 2,223,304 | | | | (19,955 | ) | | $ | 64,703 | |
| | | |
Class C Shares: | | | | | | | | | | | | | | | | |
| Year ended September 30, 2010 | | | | | | | | | | | | | | | | |
| Shares sold | | | 767,752 | | | $ | 17,728,055 | | | | 1,757,368 | | | $ | 65,780,420 | |
| Shares issued in reinvestment of distributions | | | — | | | | — | | | | 15,351 | | | | 559,243 | |
| Shares redeemed | | | (890,252 | ) | | | (20,461,175 | ) | | | (1,912,255 | ) | | | (71,012,700 | ) |
| | | |
| Net increase (decrease) | | | (122,500 | ) | | $ | (2,733,120 | ) | | | (139,536 | ) | | $ | (4,673,037 | ) |
| | | |
| Year ended September 30, 2009 | | | | | | | | | | | | | | | | |
| Shares sold | | | 610,534 | | | $ | 10,952,317 | | | | 1,769,875 | | | $ | 50,036,992 | |
| Shares issued on reorganization (Note 12) | | | 1,986,027 | | | | 30,539,237 | | | | 2,280,868 | | | | 67,125,954 | |
| Shares issued in reinvestment of distributions | | | 219,790 | | | | 3,186,956 | | | | 5,806 | | | | 144,797 | |
| Shares redeemed | | | (1,201,455 | ) | | | (20,432,818 | ) | | | (2,213,519 | ) | | | (62,293,357 | ) |
| | | |
| Net increase (decrease) | | | 1,614,896 | | | $ | 24,245,692 | | | | 1,843,030 | | | $ | 55,014,386 | |
| | | |
126 | Annual Report
Franklin Custodian Funds
Notes to Financial Statements (continued)
2. Shares of Beneficial Interest (continued)
| | | | | | | | | | | | | | | | | |
| | | Franklin DynaTech Fund | | Franklin Growth Fund |
| | | Shares | | Amount | | Shares | | Amount |
| | | |
Class R Shares: | | | | | | | | | | | | | | | | |
| Year ended September 30, 2010 | | | | | | | | | | | | | | | | |
| Shares sold | | | 84,648 | | | $ | 2,108,343 | | | | 1,596,152 | | | $ | 62,395,159 | |
| Shares issued in reinvestment of distributions | | | — | | | | — | | | | 10,831 | | | | 413,311 | |
| Shares redeemed | | | (98,580 | ) | | | (2,440,680 | ) | | | (527,829 | ) | | | (20,426,817 | ) |
| | | |
| Net increase (decrease) | | | (13,932 | ) | | $ | (332,337 | ) | | | 1,079,154 | | | $ | 42,381,653 | |
| | | |
Year ended September 30, 2009a | | | | | | | | | | | | | | | | |
| Shares sold | | | 105,135 | | | $ | 1,878,341 | | | | 2,050,622 | | | $ | 61,397,829 | |
| Shares issued on reorganization (Note 12) | | | 269,510 | | | | 4,473,861 | | | | 308,381 | | | | 9,519,723 | |
| Shares issued in reinvestment of distributions | | | — | | | | — | | | | 3,545 | | | | 92,515 | |
| Shares redeemed | | | (100,348 | ) | | | (1,790,691 | ) | | | (1,390,720 | ) | | | (40,409,806 | ) |
| | | |
| Net increase (decrease) | | | 274,297 | | | $ | 4,561,511 | | | | 971,828 | | | $ | 30,600,261 | |
| | | |
Advisor Class Shares: | | | | | | | | | | | | | | | | |
| Year ended September 30, 2010 | | | | | | | | | | | | | | | | |
| Shares sold | | | 112,665 | | | $ | 2,925,854 | | | | 6,348,692 | | | $ | 247,260,820 | |
| Shares issued in reinvestment of distributions | | | — | | | | — | | | | 102,177 | | | | 3,905,212 | |
| Shares redeemed | | | (42,936 | ) | | | (1,073,820 | ) | | | (5,016,397 | ) | | | (193,685,259 | ) |
| | | |
| Net increase (decrease) | | | 69,729 | | | $ | 1,852,034 | | | | 1,434,472 | | | $ | 57,480,773 | |
| | | |
| Year ended September 30, 2009 | | | | | | | | | | | | | | | | |
| Shares sold | | | 193,916 | | | $ | 3,835,277 | | | | 1,828,858 | | | $ | 54,651,357 | |
| Shares issued on reorganization (Note 12) | | | 99,151 | | | | 1,649,870 | | | | 4,691,275 | | | | 145,148,039 | |
| Shares issued in reinvestment of distributions | | | 13,467 | | | | 211,295 | | | | 102,244 | | | | 2,668,575 | |
| Shares redeemed | | | (31,772 | ) | | | (598,866 | ) | | | (1,722,646 | ) | | | (51,373,853 | ) |
| | | |
| Net increase (decrease) | | | 274,762 | | | $ | 5,097,576 | | | | 4,899,731 | | | $ | 151,094,118 | |
| | | |
| | |
| a | | For the period December 1, 2008 (effective date) to September 30, 2009, for the Franklin DynaTech Fund. |
| | | | | | | | | | | | | | | | | |
| | | | | | | | | | | Franklin U.S. Government |
| | | Franklin Income Fund | | Securities Fund |
| | | Shares | | Amount | | Shares | | Amount |
| | | |
Class A Shares: | | | | | | | | | | | | | | | | |
| Year ended September 30, 2010 | | | | | | | | | | | | | | | | |
| Shares sold | | | 3,122,047,774 | | | $ | 6,401,965,279 | | | | 255,107,116 | | | $ | 1,722,046,431 | |
| Shares issued in reinvestment of distributions | | | 795,698,609 | | | | 1,618,086,910 | | | | 28,399,723 | | | | 191,100,894 | |
| Shares redeemed | | | (2,616,323,977 | ) | | | (5,356,903,640 | ) | | | (227,148,749 | ) | | | (1,530,157,529 | ) |
| | | |
| Net increase (decrease) | | | 1,301,422,406 | | | $ | 2,663,148,549 | | | | 56,358,090 | | | $ | 382,989,796 | |
| | | |
| Year ended September 30, 2009 | | | | | | | | | | | | | | | | |
| Shares sold | | | 3,194,615,875 | | | $ | 5,446,582,263 | | | | 327,684,616 | | | $ | 2,154,557,471 | |
| Shares issued in reinvestment of distributions | | | 929,761,078 | | | | 1,563,293,948 | | | | 28,818,237 | | | | 189,352,370 | |
| Shares redeemed | | | (3,760,506,184 | ) | | | (6,279,901,245 | ) | | | (248,416,455 | ) | | | (1,636,596,541 | ) |
| | | |
| Net increase (decrease) | | | 363,870,769 | | | $ | 729,974,966 | | | | 108,086,398 | | | $ | 707,313,300 | |
| | | |
Annual Report | 127
Franklin Custodian Funds
Notes to Financial Statements (continued)
2. Shares of Beneficial Interest (continued)
| | | | | | | | | | | | | | | | | |
| | | | | | | | | | | Franklin U.S. Government |
| | | Franklin Income Fund | | Securities Fund |
| | | Shares | | Amount | | Shares | | Amount |
| | | |
Class B Shares: | | | | | | | | | | | | | | | | |
| Year ended September 30, 2010 | | | | | | | | | | | | | | | | |
| Shares sold | | | 13,878,110 | | | $ | 28,322,228 | | | | 1,842,598 | | | $ | 12,415,351 | |
| Shares issued in reinvestment of distributions | | | 40,513,875 | | | | 81,924,023 | | | | 742,529 | | | | 4,985,042 | |
| Shares redeemed | | | (316,412,820 | ) | | | (646,630,369 | ) | | | (18,446,529 | ) | | | (124,222,515 | ) |
| | | |
| Net increase (decrease) | | | (262,020,835 | ) | | $ | (536,384,118 | ) | | | (15,861,402 | ) | | $ | (106,822,122 | ) |
| | | |
| Year ended September 30, 2009 | | | | | | | | | | | | | | | | |
| Shares sold | | | 34,580,449 | | | $ | 58,074,216 | | | | 8,056,168 | | | $ | 52,523,598 | |
| Shares issued in reinvestment of distributions | | | 63,807,057 | | | | 106,531,528 | | | | 1,218,659 | | | | 7,988,052 | |
| Shares redeemed | | | (295,644,541 | ) | | | (489,014,386 | ) | | | (18,942,006 | ) | | | (124,685,994 | ) |
| | | |
| Net increase (decrease) | | | (197,257,035 | ) | | $ | (324,408,642 | ) | | | (9,667,179 | ) | | $ | (64,174,344 | ) |
| | | |
Class B1 Shares: | | | | | | | | | | | | | | | | |
| Year ended September 30, 2010 | | | | | | | | | | | | | | | | |
| Shares sold | | | 223,452 | | | $ | 458,088 | | | | | | | | | |
| Shares issued in reinvestment of distributions | | | 659,909 | | | | 1,334,988 | | | | | | | | | |
| Shares redeemed | | | (24,397,067 | ) | | | (49,356,094 | ) | | | | | | | | |
| | | | | | | | | | | |
| Net increase (decrease) | | | (23,513,706 | ) | | | (47,563,018 | ) | | | | | | | | |
| | | | | | | | | | | |
| Year ended September 30, 2009 | | | | | | | | | | | | | | | | |
| Shares sold | | | 616,259 | | | $ | 1,006,991 | | | | | | | | | |
| Shares issued in reinvestment of distributions | | | 4,478,768 | | | | 7,437,357 | | | | | | | | | |
| Shares redeemed | | | (84,121,447 | ) | | | (145,257,809 | ) | | | | | | | | |
| | | | | | | | | | | |
| Net increase (decrease) | | | (79,026,420 | ) | | | (136,813,461 | ) | | | | | | | | |
| | | | | | | | | | | |
Class C Shares: | | | | | | | | | | | | | | | | |
| Year ended September 30, 2010 | | | | | | | | | | | | | | | | |
| Shares sold | | | 1,596,716,655 | | | $ | 3,301,950,026 | | | | 212,527,927 | | | $ | 1,426,604,550 | |
| Shares issued in reinvestment of distributions | | | 320,155,286 | | | | 656,144,553 | | | | 7,931,210 | | | | 53,125,111 | |
| Shares redeemed | | | (1,112,022,517 | ) | | | (2,296,217,510 | ) | | | (73,580,512 | ) | | | (493,088,018 | ) |
| | | |
| Net increase (decrease) | | | 804,849,424 | | | $ | 1,661,877,069 | | | | 146,878,625 | | | $ | 986,641,643 | |
| | | |
| Year ended September 30, 2009 | | | | | | | | | | | | | | | | |
| Shares sold | | | 1,490,228,499 | | | $ | 2,568,269,575 | | | | 177,348,206 | | | $ | 1,163,765,108 | |
| Shares issued in reinvestment of distributions | | | 372,417,014 | | | | 631,594,234 | | | | 4,298,963 | | | | 28,151,041 | |
| Shares redeemed | | | (1,592,519,479 | ) | | | (2,656,675,100 | ) | | | (56,632,697 | ) | | | (371,355,422 | ) |
| | | |
| Net increase (decrease) | | | 270,126,034 | | | $ | 543,188,709 | | | | 125,014,472 | | | $ | 820,560,727 | |
| | | |
128 | Annual Report
Franklin Custodian Funds
Notes to Financial Statements (continued)
2. Shares of Beneficial Interest (continued)
| | | | | | | | | | | | | | | | | |
| | | | | | | | | | | Franklin U.S. Government | |
| | | Franklin Income Fund | | | Securities Fund | |
| | | Shares | | | Amount | | | Shares | | | Amount | |
| | | |
Class R Shares: | | | | | | | | | | | | | | | | |
| Year ended September 30, 2010 | | | | | | | | | | | | | | | | |
| Shares sold | | | 55,322,582 | | | $ | 111,791,528 | | | | 10,173,157 | | | $ | 68,640,631 | |
| Shares issued in reinvestment of distributions | | | 10,944,621 | | | | 21,995,589 | | | | 713,551 | | | | 4,797,215 | |
| Shares redeemed | | | (49,258,198 | ) | | | (99,547,081 | ) | | | (11,015,574 | ) | | | (74,066,471 | ) |
| | | |
| Net increase (decrease) | | | 17,009,005 | | | $ | 34,240,036 | | | | (128,866 | ) | | $ | (628,625 | ) |
| | | |
| Year ended September 30, 2009 | | | | | | | | | | | | | | | | |
| Shares sold | | | 68,996,085 | | | $ | 115,848,208 | | | | 13,507,302 | | | $ | 88,919,423 | |
| Shares issued in reinvestment of distributions | | | 12,725,193 | | | | 21,140,911 | | | | 758,236 | | | | 4,977,846 | |
| Shares redeemed | | | (58,266,413 | ) | | | (96,753,691 | ) | | | (9,774,179 | ) | | | (64,367,566 | ) |
| | | |
| Net increase (decrease) | | | 23,454,865 | | | $ | 40,235,428 | | | | 4,491,359 | | | $ | 29,529,703 | |
| | | |
Advisor Class Shares: | | | | | | | | | | | | | | | | |
| Year ended September 30, 2010 | | | | | | | | | | | | | | | | |
| Shares sold | | | 476,839,253 | | | $ | 974,685,741 | | | | 68,407,061 | | | $ | 462,448,131 | |
| Shares issued in reinvestment of distributions | | | 139,718,744 | | | | 282,316,193 | | | | 5,162,635 | | | | 34,844,804 | |
| Shares redeemed | | | (546,851,471 | ) | | | (1,107,964,672 | ) | | | (27,638,036 | ) | | | (186,483,344 | ) |
| | | |
| Net increase (decrease) | | | 69,706,526 | | | $ | 149,037,262 | | | | 45,931,660 | | | $ | 310,809,591 | |
| | | |
| Year ended September 30, 2009 | | | | | | | | | | | | | | | | |
| Shares sold | | | 537,139,078 | | | $ | 923,014,317 | | | | 56,386,916 | | | $ | 373,566,694 | |
| Shares issued in reinvestment of distributions | | | 185,103,308 | | | | 309,081,671 | | | | 4,110,288 | | | | 27,061,258 | |
| Shares redeemed | | | (772,328,637 | ) | | | (1,256,899,393 | ) | | | (26,340,863 | ) | | | (173,571,580 | ) |
| | | |
| Net increase (decrease) | | | (50,086,251 | ) | | $ | (24,803,405 | ) | | | 34,156,341 | | | $ | 227,056,372 | |
| | | |
| | | | | | | | | |
| | | Franklin Utilities Fund | |
| | | Shares | | | Amount | |
| | | |
Class A Shares: | | | | | | | | |
| Year ended September 30, 2010 | | | | | | | | |
| Shares sold | | | 35,022,184 | | | $ | 384,837,941 | |
| Shares issued in reinvestment of distributions | | | 7,008,916 | | | | 75,475,936 | |
| Shares redeemed | | | (26,258,647 | ) | | | (286,503,631 | ) |
| | | |
| Net increase (decrease) | | | 15,772,453 | | | $ | 173,810,246 | |
| | | |
| Year ended September 30, 2009 | | | | | | | | |
| Shares sold | | | 21,564,244 | | | $ | 217,252,356 | |
| Shares issued in reinvestment of distributions | | | 5,861,644 | | | | 57,450,592 | |
| Shares redeemed | | | (32,180,738 | ) | | | (322,001,557 | ) |
| | | |
| Net increase (decrease) | | | (4,754,850 | ) | | $ | (47,298,609 | ) |
| | | |
Annual Report | 129
Franklin Custodian Funds
Notes to Financial Statements (continued)
2. Shares of Beneficial Interest (continued)
| | | | | | | | | |
| | | Franklin Utilities Fund |
| | | Shares | | Amount |
| | | |
Class B Shares: | | | | | | | | |
| Year ended September 30, 2010 | | | | | | | | |
| Shares sold | | | 353,630 | | | $ | 3,843,661 | |
| Shares issued in reinvestment of distributions | | | 177,266 | | | | 1,910,217 | |
| Shares redeemed | | | (2,098,673 | ) | | | (22,916,591 | ) |
| | | |
| Net increase (decrease) | | | (1,567,777 | ) | | $ | (17,162,713 | ) |
| | | |
| Year ended September 30, 2009 | | | | | | | | |
| Shares sold | | | 320,985 | | | $ | 3,200,510 | |
| Shares issued in reinvestment of distributions | | | 184,409 | | | | 1,806,989 | |
| Shares redeemed | | | (2,310,669 | ) | | | (23,015,045 | ) |
| | | |
| Net increase (decrease) | | | (1,805,275 | ) | | $ | (18,007,546 | ) |
| | | |
Class C Shares: | | | | | | | | |
| Year ended September 30, 2010 | | | | | | | | |
| Shares sold | | | 12,669,924 | | | $ | 138,793,399 | |
| Shares issued in reinvestment of distributions | | | 998,302 | | | | 10,724,815 | |
| Shares redeemed | | | (6,213,093 | ) | | | (67,545,390 | ) |
| | | |
| Net increase (decrease) | | | 7,455,133 | | | $ | 81,972,824 | |
| | | |
| Year ended September 30, 2009 | | | | | | | | |
| Shares sold | | | 6,347,474 | | | $ | 64,084,256 | |
| Shares issued in reinvestment of distributions | | | 738,883 | | | | 7,227,247 | |
| Shares redeemed | | | (7,568,351 | ) | | | (75,356,203 | ) |
| | | |
| Net increase (decrease) | | | (481,994 | ) | | $ | (4,044,700 | ) |
| | | |
Class R Shares: | | | | | | | | |
| Year ended September 30, 2010 | | | | | | | | |
| Shares sold | | | 1,198,667 | | | $ | 13,083,869 | |
| Shares issued in reinvestment of distributions | | | 185,276 | | | | 1,990,558 | |
| Shares redeemed | | | (1,205,407 | ) | | | (13,075,606 | ) |
| | | |
| Net increase (decrease) | | | 178,536 | | | $ | 1,998,821 | |
| | | |
| Year ended September 30, 2009 | | | | | | | | |
| Shares sold | | | 1,545,267 | | | $ | 15,712,097 | |
| Shares issued in reinvestment of distributions | | | 147,603 | | | | 1,446,259 | |
| Shares redeemed | | | (1,242,997 | ) | | | (12,481,506 | ) |
| | | |
| Net increase (decrease) | | | 449,873 | | | $ | 4,676,850 | |
| | | |
Advisor Class Shares: | | | | | | | | |
| Year ended September 30, 2010 | | | | | | | | |
| Shares sold | | | 10,770,245 | | | $ | 119,820,517 | |
| Shares issued in reinvestment of distributions | | | 689,152 | | | | 7,473,842 | |
| Shares redeemed | | | (3,617,556 | ) | | | (39,598,863 | ) |
| | | |
| Net increase (decrease) | | | 7,841,841 | | | $ | 87,695,496 | |
| | | |
| Year ended September 30, 2009 | | | | | | | | |
| Shares sold | | | 8,908,323 | | | $ | 94,646,702 | |
| Shares issued in reinvestment of distributions | | | 267,630 | | | | 2,655,239 | |
| Shares redeemed | | | (2,556,521 | ) | | | (25,567,896 | ) |
| | | |
| Net increase (decrease) | | | 6,619,432 | | | $ | 71,734,045 | |
| | | |
130 | Annual Report
Franklin Custodian Funds
Notes to Financial Statements (continued)
3. Transactions with Affiliates
Franklin Resources, Inc. is the holding company for various subsidiaries that together are referred to as Franklin Templeton Investments. Certain officers and trustees of the Trust are also officers and/or directors of the following subsidiaries:
| | | |
| Subsidiary | | Affiliation |
| Franklin Advisers, Inc. (Advisers) | | Investment manager |
| Franklin Investment Advisory Services, LLC (Investment Advisory) | | Investment manager |
| Franklin Templeton Services, LLC (FT Services) | | Administrative manager |
| Franklin Templeton Distributors, Inc. (Distributors) | | Principal underwriter |
| Franklin Templeton Investor Services, LLC (Investor Services) | | Transfer agent |
a. Management Fees
Franklin Income Fund and the Franklin Utilities Fund pay an investment management fee to Advisers based on the month-end net assets of each of the funds as follows:
| | | | | |
| Annualized Fee | | Rate Net Assets |
| |
| | 0.625 | % | | Up to and including $100 million |
| | 0.500 | % | | Over $100 million, up to and including $250 million |
| | 0.450 | % | | Over $250 million, up to and including $7.5 billion |
| | 0.440 | % | | Over $7.5 billion, up to and including $10 billion |
| | 0.430 | % | | Over $10 billion, up to and including $12.5 billion |
| | 0.420 | % | | Over $12.5 billion, up to and including $15 billion |
| | 0.400 | % | | Over $15 billion, up to and including $17.5 billion |
| | 0.380 | % | | Over $17.5 billion, up to and including $20 billion |
| | 0.360 | % | | Over $20 billion, up to and including $35 billion |
| | 0.355 | % | | Over $35 billion, up to and including $50 billion |
| | 0.350 | % | | Over $50 billion, up to and including $65 billion |
| | 0.345 | % | | Over $65 billion, up to and including $80 billion |
| | 0.340 | % | | In excess of $80 billion |
The Franklin DynaTech Fund, the Franklin Growth Fund and the Franklin U.S. Government Securities Fund pay an investment management fee to Advisers based on the month-end net assets of each of the funds as follows:
| | | | | |
| Annualized Fee | | Rate Net Assets |
| |
| | 0.625 | % | | Up to and including $100 million |
| | 0.500 | % | | Over $100 million, up to and including $250 million |
| | 0.450 | % | | Over $250 million, up to and including $7.5 billion |
| | 0.440 | % | | Over $7.5 billion, up to and including $10 billion |
| | 0.430 | % | | Over $10 billion, up to and including $12.5 billion |
| | 0.420 | % | | Over $12.5 billion, up to and including $15 billion |
| | 0.400 | % | | Over $15 billion, up to and including $17.5 billion |
| | 0.380 | % | | Over $17.5 billion, up to and including $20 billion |
| | 0.360 | % | | Over $20 billion, up to and including $35 billion |
| | 0.355 | % | | Over $35 billion, up to and including $50 billion |
| | 0.350 | % | | In excess of $50 billion |
Annual Report | 131
Franklin Custodian Funds
Notes to Financial Statements (continued)
3. Transactions with Affiliates (continued)
a. Management Fees (continued)
Under a subadvisory agreement, Investment Advisory, an affiliate of Advisers, provides subadvisory services to the Franklin Growth Fund. The subadvisory fee is paid by Advisers based on the average monthly net assets, and is not an additional expense of the Fund.
b. Administrative Fees
Under an agreement with Advisers, FT Services provides administrative services to the Funds. The fee is paid by Advisers based on average daily net assets, and is not an additional expense of the Funds.
c. Distribution Fees
The Trust’s Board of Trustees has adopted distribution plans for each share class, with the exception of Advisor Class shares, pursuant to Rule 12b-1 under the 1940 Act. Under the Funds’ Class A reimbursement distribution plans, the Funds reimburse Distributors for costs incurred in connection with the servicing, sale and distribution of each fund’s shares up to the maximum annual plan rate. Under the Class A reimbursement distribution plans, costs exceeding the maximum for the current plan year cannot be reimbursed in subsequent periods.
In addition, under the Funds’ Class B, B1, C and R compensation distribution plans, the Funds pay Distributors for costs incurred in connection with the servicing, sale and distribution of each fund’s shares up to the maximum annual plan rate for each class.
The maximum annual plan rates, based on the average daily net assets, for each class, are as follows:
| | | | | | | | | | | | | | | | | | | | | |
| | | | | | | | | | | | | | | Franklin | | |
| | | Franklin | | Franklin | | Franklin | | U.S. Government | | Franklin |
| | | DynaTech | | Growth | | Income | | Securities | | Utilities |
| | | Fund | | Fund | | Fund | | Fund | | Fund |
| | | |
| Reimbursement Plans: | | | | | | | | | | | | | | | | | | | | |
| Class A | | | 0.25 | % | | | 0.25 | % | | | 0.15 | % | | | 0.15 | % | | | 0.15 | % |
| | | | | | | | | | | | | | | | | | | | | |
| Compensation Plans: | | | | | | | | | | | | | | | | | | | | |
| Class B | | | 1.00 | % | | | 1.00 | % | | | 1.00 | % | | | 0.65 | % | | | 0.65 | % |
| Class B1 | | | — | | | | — | | | | 0.65 | % | | | — | | | | — | |
| Class C | | | 1.00 | % | | | 1.00 | % | | | 0.65 | % | | | 0.65 | % | | | 0.65 | % |
| Class R | | | 0.50 | % | | | 0.50 | % | | | 0.50 | % | | | 0.50 | % | | | 0.50 | % |
132 | Annual Report
Franklin Custodian Funds
Notes to Financial Statements (continued)
3. Transactions with Affiliates (continued)
d. Sales Charges/Underwriting Agreements
Distributors has advised the Funds of the following commission transactions related to the sales and redemptions of the Funds’ shares for the year:
| | | | | | | | | | | | | |
| | | Franklin | | Franklin | | Franklin |
| | | DynaTech | | Growth | | Income |
| | | Fund | | Fund | | Fund |
| | | |
| Sales charges retained net of commissions paid to unaffiliated broker/dealers | | $ | 161,584 | | | $ | 1,481,545 | | | $ | 15,294,255 | |
| Contingent deferred sales charges retained | | $ | 11,084 | | | $ | 49,128 | | | $ | 2,135,310 | |
| | | | | | | | | |
| | | Franklin U.S. | | |
| | | Government | | Franklin |
| | | Securities | | Utilities |
| | | Fund | | Fund |
| | | |
| Sales charges retained net of commissions paid to unaffiliated broker/dealers | | $ | 3,332,731 | | | $ | 609,879 | |
| Contingent deferred sales charges retained | | $ | 869,536 | | | $ | 56,370 | |
e. Transfer Agent Fees
For the year ended September 30, 2010, the Funds paid transfer agent fees as noted in the Statements of Operations of which the following amounts were retained by Investor Services:
| | | | | | | | | | | | | | | | | | | | | |
| | | Franklin | | Franklin | | Franklin | | Franklin | | Franklin |
| | | DynaTech | | Growth | | Income | | U.S. Government | | Utilities |
| | | Fund | | Fund | | Fund | | Securities Fund | | Fund |
| | | |
| Transfer agent fees | | $ | 1,132,451 | | | $ | 4,221,956 | | | $ | 22,367,629 | | | $ | 6,376,862 | | | $ | 1,862,442 | |
4. Expense Offset Arrangement
The Funds have entered into an arrangement with their custodian whereby credits realized as a result of uninvested cash balances are used to reduce a portion of the Funds’ custodian expenses. During the year ended September 30, 2010, the custodian fees were reduced as noted in the Statements of Operations.
Annual Report | 133
Franklin Custodian Funds
Notes to Financial Statements (continued)
5. Income Taxes
For tax purposes, capital losses may be carried over to offset future capital gains, if any. At September 30, 2010, the capital loss carryforwards were as follows:
| | | | | | | | | | | | | | | | | |
| | | Franklin | | | | | | | | | | Franklin |
| | | DynaTech | | Franklin | | Franklin | | U.S. Government |
| | | Fund | | Growth Fund | | Income Fund | | Securities Fund |
| | | |
| Capital loss carryforwards expiring in: | | | | | | | | | | | | | | | | |
| 2011 | | $ | — | | | $ | — | | | $ | — | | | $ | 33,556,845 | |
| 2012 | | | — | | | | — | | | | — | | | | 129,102,166 | |
| 2013 | | | — | | | | — | | | | — | | | | 74,283,298 | |
| 2014 | | | — | | | | — | | | | — | | | | 47,763,112 | |
| 2015 | | | — | | | | — | | | | — | | | | 28,034,940 | |
| 2016 | | | 8,729,949 | | | | 84,084,287 | | | | — | | | | 20,514,778 | |
| 2017 | | | 29,338,979 | | | | — | | | | 589,874,490 | | | | 18,668,917 | |
| 2018 | | | — | | | | — | | | | 4,428,035,897 | | | | 16,923,309 | |
| | | |
| | | $ | 38,068,928 | a | | $ | 84,084,287 | b | | $ | 5,017,910,387 | | | $ | 368,847,365 | |
| | | |
| | |
| a | | Includes $34,098,719 from the merged Franklin Global Communications Fund, Franklin Global Health Care Fund and Franklin Technology Fund, which may be carried over to offset future capital gains, subject to certain limitations. |
| | | |
| b | | Includes $84,084,287 from the merged Franklin Capital Growth Fund, which may be carried over to offset future capital gains, subject to certain limitations. |
During the year ended September 30, 2010, the Franklin DynaTech Fund and the Franklin Growth Fund utilized $16,325,833 and $36,137,689, respectively, of capital loss carryforwards.
On September 30, 2010, the Franklin DynaTech Fund and the Franklin U.S. Government Securities Fund had expired capital loss carryforwards of $1,173,700 and $11,768,551, respectively, which were reclassified to paid-in capital.
For tax purposes, realized capital losses occurring subsequent to October 31, may be deferred and treated as occurring on the first day of the following fiscal year. At September 30, 2010, the Franklin Income Fund and the Franklin Utilities Fund deferred realized capital losses of $1,454,309,585 and $12,850,632, respectively.
The tax character of distributions paid during the years ended September 30, 2010 and 2009, was as follows:
| | | | | | | | | | | | | | | | | |
| | | Franklin DynaTech Fund | | Franklin Growth Fund |
| | | 2010 | | 2009 | | 2010 | | 2009 |
| | | |
| Distributions paid from: | | | | | | | | | | | | | | | | |
| Ordinary income | | $ | — | | | $ | — | | | $ | 21,980,390 | | | $ | 17,031,967 | |
| Long term capital gain | | | — | | | | 28,203,722 | | | | — | | | | — | |
| | | |
| | | $ | — | | | $ | 28,203,722 | | | $ | 21,980,390 | | | $ | 17,031,967 | |
| | | |
134 | Annual Report
Franklin Custodian Funds
Notes to Financial Statements (continued)
5. Income Taxes (continued)
| | | | | | | | | | | | | | | | | |
| | | | | | | | | | | Franklin |
| | | Franklin | | U.S. Government |
| | | Income Fund | | Securities Fund |
| | | 2010 | | 2009 | | 2010 | | 2009 |
| | | |
| Distributions paid from — ordinary income | | $ | 3,527,248,290 | | | $ | 3,594,469,421 | | | $ | 379,063,914 | | | $ | 354,392,299 | |
| | | |
| | | | | | | | | |
| | | Franklin Utilities Fund |
| | | 2010 | | 2009 |
| | | |
| Distributions paid from: | | | | | | | | |
| Ordinary income | | $ | 91,153,934 | | | $ | 77,688,471 | |
| Long term capital gain | | | 31,158,605 | | | | 14,482,100 | |
| | | |
| | | $ | 122,312,539 | | | $ | 92,170,571 | |
| | | |
At September 30, 2010, the cost of investments, net unrealized appreciation (depreciation), undistributed ordinary income and undistributed long term capital gains for income tax purposes were as follows:
| | | | | | | | | | | | | |
| | | Franklin | | Franklin | | Franklin |
| | | DynaTech Fund | | Growth Fund | | Income Fund |
| | | |
| Cost of investments | | $ | 371,287,044 | | | $ | 1,967,622,302 | | | $ | 55,125,126,443 | |
| | | |
| | | | | | | | | | | | | |
| Unrealized appreciation | | $ | 325,646,832 | | | $ | 1,717,401,392 | | | $ | 5,420,716,961 | |
| Unrealized depreciation | | | (3,987,081 | ) | | | (65,984,832 | ) | | | (6,258,981,337 | ) |
| | | |
| Net unrealized appreciation (depreciation) | | $ | 321,659,751 | | | $ | 1,651,416,560 | | | $ | (838,264,376 | ) |
| | | |
| | | | | | | | | | | | | |
| Distributable earnings — undistributed ordinary income | | | — | | | $ | 10,862,427 | | | $ | 22,882,152 | |
| | | |
| | | | | | | | | |
| | | Franklin | | |
| | | U.S. Government | | |
| | | Securities | | Franklin |
| | | Fund | | Utilities Fund |
| | | |
| Cost of investments | | $ | 10,276,503,332 | | | $ | 1,963,315,349 | |
| | | |
| | | | | | | | | |
| Unrealized appreciation | | $ | 456,388,073 | | | $ | 636,002,624 | |
| Unrealized depreciation | | | (4,098,246 | ) | | | (49,413,361 | ) |
| | | |
| Net unrealized appreciation (depreciation) | | $ | 452,289,827 | | | $ | 586,589,263 | |
| | | |
| | | | | | | | | |
| Distributable earnings — undistributed ordinary income | | $ | 22,769,777 | | | $ | 1,536,045 | |
| | | |
Net investment income (loss) differs for financial statement and tax purposes primarily due to differing treatments of defaulted securities, foreign currency transactions, paydown losses, payments-in-kind, bond discounts and premiums, corporate actions and regulatory settlements.
Net realized gains (losses) differ for financial statement and tax purposes primarily due to differing treatments of defaulted securities, wash sales, foreign currency transactions, paydown losses, payments-in-kind, bond discounts and premiums, and corporate actions.
Annual Report | 135
Franklin Custodian Funds
Notes to Financial Statements (continued)
6. Investment Transactions
Purchases and sales (excluding short term securities) for the year ended September 30, 2010, were as follows:
| | | | | | | | | | | | | |
| | | Franklin | | Franklin | | Franklin |
| | | DynaTech Fund | | Growth Fund | | Income Fund |
| | | |
| Purchases | | $ | 202,165,615 | | | $ | 139,912,261 | | | $ | 26,917,363,212 | |
| Sales | | $ | 235,343,797 | | | $ | 159,186,308 | | | $ | 23,306,640,917 | |
| | | | | | | | | |
| | | Franklin | | |
| | | U.S. Government | | Franklin |
| | | Securities | | Utilities |
| | | Fund | | Fund |
| | | |
| Purchases | | $ | 6,691,090,530 | | | $ | 420,493,152 | |
| Sales | | $ | 4,542,572,645 | | | $ | 116,885,240 | |
Transactions in options written during the year ended September 30, 2010, were as follows:
| | | | | | | | | |
| | | Number of | | Premiums |
| | | Contracts | | Received |
| | | |
Franklin Income Fund | | | | | | | | |
| Options outstanding at September 30, 2009 | | | — | | | $ | — | |
| Options written | | | 38,796 | | | | 1,290,389 | |
| Options expired | | | (37,796 | ) | | | (1,249,390 | ) |
| Options exercised | | | — | | | | — | |
| Options closed | | | — | | | | — | |
| | | |
| Options outstanding at September 30, 2010 | | | 1,000 | | | $ | 40,999 | |
| | | |
7. Investments in Institutional Fiduciary Trust Money Market Portfolio
The Funds may invest in the Institutional Fiduciary Trust Money Market Portfolio (Sweep Money Fund), an open-end investment company managed by Advisers. Pursuant to a SEC exemptive order specific to the Funds’ investment in the Sweep Money Fund, management fees paid by the Funds are reduced on assets invested in the Sweep Money Fund, in an amount not to exceed the management and administrative fees paid by the Sweep Money Fund.
8. Credit Risk and Defaulted Securities
At September 30, 2010, the Franklin Income Fund had 54.5% of its portfolio invested in high yield, senior secured floating rate notes, or other securities rated below investment grade. These securities may be more sensitive to economic conditions causing greater price volatility and are potentially subject to a greater risk of loss due to default than higher rated securities.
136 | Annual Report
Franklin Custodian Funds
Notes to Financial Statements (continued)
8. Credit Risk and Defaulted Securities (continued)
The Franklin Income Fund held a defaulted security for which the income has been deemed uncollectible. At September 30, 2010, the value of this security was $174,675,000, representing 0.32% of the Fund’s net assets. The Fund discontinues accruing income on securities for which income has been deemed uncollectible and provides an estimate for losses on interest receivable. The security has been identified on the accompanying Statement of Investments.
9. Other Derivative Information
For the period ended September 30, 2010, the effect of derivative contracts on the Franklin Income Fund’s Statement of Operations was as follows:
| | | | | | | | | | | | | | | | | |
| | | | | | | | | | | Change in | | Average |
| | | | | | | | | | | Unrealized | | Amount |
| Derivative Contracts | | | | Realized Gain | | Appreciation | | Outstanding |
| Not Accounted for as | | Statement of Operations | | (Loss) for | | (Depreciation) | | During the |
| Hedging Instruments | | Locations | | the Year | | for the Year | | the Yeara |
| |
| Equity contracts | | Net realized gain (loss) from written options | | $ | 1,249,390 | | | $ | 40,999 | | | $ | 3,869 | |
| | |
| a | | Represents the average number of option contracts or notional amount for other derivative contracts outstanding during the year. |
See Note 1(e) regarding derivative financial instruments.
10. Holdings of 5% Voting Securities of Portfolio Companies
The 1940 Act defines “affiliated companies” to include investments in portfolio companies in which a fund owns 5% or more of the outstanding voting securities. Investments in “affiliated companies” for the Franklin Income Fund for the year ended September 30, 2010, were as shown below.
| | | | | | | | | �� | | | | | | | | | | | | | | | | | | | | |
| | | Number of | | | | | | | | | | Number of | | | | | | | | | | |
| | | Shares/ | | | | | | | | | | Shares/ | | | | | | | | | | Realized |
| | | Principal Held | | | | | | | | | | Principal | | Value | | | | | | Capital |
| | | at Beginning | | Gross | | Gross | | Held at End | | at End | | Investment | | Gain |
| Name of Issuer | | of Year | | Additions | | Reductions | | of Year | | of Year | | Income | | (Loss) |
| |
Franklin Income Fund | | | | | | | | | | | | | | | | | | | | | | | | | | | | |
Non-Controlled Affiliates | | | | | | | | | | | | | | | | | | | | | | | | | | | | |
| Ameren Corp. | | | 12,100,000 | | | | — | | | | 9,100,000 | | | | 3,000,000 | | | $ | — | a | | $ | 12,169,850 | | | $ | (179,462,333 | ) |
| Ameren Corp., senior note, 8.875%, 5/15/14 | | | 58,200,000 | | | | — | | | | 58,200,000 | | | | — | | | | — | a | | | 638,704 | | | | 7,173,310 | |
| Callon Petroleum Co. | | | — | | | | 4,181,258 | | | | — | | | | 4,181,258 | | | | 20,697,227 | | | | — | | | | — | |
| Callon Petroleum Co., senior secured note, 13.00%, 9/15/16 | | | — | | | | 83,625,000 | | | | 8,625,000 | | | | 75,000,000 | | | | 75,656,250 | | | | 11,449,750 | | | | (1,611,596 | ) |
| Canadian Oil Sands Trust | | | 25,847,400 | | | | 152,600 | | | | — | | | | 26,000,000 | | | | 643,773,401 | | | | 37,524,602 | | | | — | |
| Colony Financial Inc. | | | 1,250,000 | | | | — | | | | — | | | | 1,250,000 | | | | 23,100,000 | | | | 862,500 | | | | — | |
Annual Report | 137
Franklin Custodian Funds
Notes to Financial Statements (continued)
10. Holdings of 5% Voting Securities of Portfolio Companies (continued)
| | | | | | | | | | | | | | | | | | | | | | | | | | | | | | |
| | | | Number of | | | | | | | | | | Number of | | | | | | | | | | |
| | | | Shares/ | | | | | | | | | | Shares/ | | | | | | | | | | Realized |
| | | | Principal Held | | | | | | | | | | Principal | | Value | | | | | | Capital |
| | | | at Beginning | | Gross | | Gross | | Held at End | | at End | | Investment | | Gain |
| Name of Issuer | | of Year | | Additions | | Reductions | | of Year | | of Year | | Income | | (Loss) |
| |
| | Franklin Income Fund (continued) | | | | | | | | | | | | | | | | | | | | | | | | | | | | |
| | Non-Controlled Affiliates (continued) | | | | | | | | | | | | | | | | | | | | | | | | | | | | |
| b | Dex Media West LLC, Term Loan B, 7.00%, 10/24/14 | | | — | | | | 7,771,319 | | | | 1,377,606 | | | | 6,393,713 | | | | 5,574,078 | | | | 294,818 | | | | 411,745 | |
| | Dex One Corp. | | | — | | | | 10,242,757 | | | | — | | | | 10,242,757 | | | | 125,781,056 | | | | — | | | | — | |
| | Dex One Corp., senior sub. note, PIK, 12.00%, 1/29/17 | | | — | | | | 81,136,340 | | | | — | | | | 81,136,340 | | | | 64,199,129 | | | | 6,572,044 | | | | — | |
| | iStar Financial Inc. | | | 5,213,500 | | | | — | | | | 5,213,500 | | | | — | | | | — | a | | | — | | | | (131,827,123 | ) |
| | iStar Financial Inc., 8.625%, 6/01/13 | | | 169,100,000 | | | | 20,900,000 | | | | — | | | | 190,000,000 | | | | — | a | | | 15,429,037 | | | | — | |
| | iStar Financial Inc., cvt., senior note, FRN, 1.033%, 10/01/12 | | | 250,000,000 | | | | — | | | | 10,000,000 | | | | 240,000,000 | | | | — | a | | | 2,134,754 | | | | (2,225,000 | ) |
| | iStar Financial Inc., senior secured note, 144A, 8.00%, 3/15/11 | | | — | | | | 20,392,000 | | | | 20,392,000 | | | | — | | | | — | a | | | 236,454 | | | | 461,230 | |
| | iStar Financial Inc.,senior secured note, 10.00%, 6/15/14 | | | 54,850,000 | | | | 92,923,000 | | | | 37,773,000 | | | | 110,000,000 | | | | — | a | | | 13,783,475 | | | | (3,433,103 | ) |
| b | R.H. Donnelley Inc., Term Loan B, 9.00%, 10/24/14 | | | — | | | | 42,659,116 | | | | 5,453,101 | | | | 37,206,015 | | | | 31,744,693 | | | | 1,649,515 | | | | 544,067 | |
| | | | | | | | | | | | | | | | | | | | |
| | Total Affiliated Securities (1.82% of Net Assets) | | | | | | | | | | | | | | | $ | 990,525,834 | | | $ | 102,745,503 | | | $ | (309,968,803 | ) |
| | | | | | | | | | | | | | | | | | | | |
| | |
| a | | As of September 30, 2010, no longer an affiliate. |
| | | |
| b | | Company is a wholly owned subsidiary of Dex One Corp. |
11. Special Servicing Agreement
The Funds, which are eligible underlying investments of one or more of the Franklin Templeton Fund Allocator Series Funds (Allocator Funds), entered into a Special Servicing Agreement (SSA) with the Allocator Funds and certain service providers of the Funds and the Allocator Funds. Under the SSA, the Funds may pay a portion of the Allocator Funds’ expenses (other than any asset allocation, administrative and distribution fees), to the extent such payments are less than the amount of the benefits realized or expected to be realized by the Funds (e.g., due to reduced costs associated with servicing accounts) from the investment in the funds by the Allocator Funds. The Allocator Funds are either managed by Advisers or administered by FT Services. For the year ended September 30, 2010, the funds were held by one or more of the Allocator Funds and the amount of expenses borne by the funds is noted in the Statements of Operations. At September 30, 2010, one or more of the Allocator Funds owned a percentage of the funds’ outstanding shares as follows:
| | | | | | | |
| | | | | Franklin | | |
| Franklin | | Franklin | | U.S. Government | | Franklin |
| Growth Fund | | Income Fund | | Securities Fund | | Utilities Fund |
| |
| 7.85% | | 4.53% | | 3.90% | | 0.95% |
138 | Annual Report
Franklin Custodian Funds
Notes to Financial Statements (continued)
12. Reorganization
On December 3, 2008, the Franklin DynaTech Fund acquired the net assets of the Franklin Global Communications Fund, the Franklin Global Health Care Fund, and the Franklin Technology Fund pursuant to a plan of reorganization approved by the Franklin Global Communications Fund’s, the Franklin Global Health Care Fund’s, and the Franklin Technology Fund’s shareholders. The reorganization was accomplished by a tax free exchange, and the net assets acquired and shares issued were as follows:
| | | | | | | | | | | | | |
| | | | | | | Shares Issued | | Unrealized |
| | | | | | | by Franklin | | Appreciation |
| Fund Name | | Net Assets | | DynaTech Fund | | (Depreciation) |
| |
| Franklin Global Communications Fund | | $ | 47,740,803 | | | | 2,914,752 | | | $ | (18,325,185 | ) |
| Franklin Global Health Care Fund | | | 89,644,203 | | | | 5,503,466 | | | | (8,804,887 | ) |
| Franklin Technology Fund | | | 32,802,922 | | | | 2,006,525 | | | | (10,136,675 | ) |
| | | |
| Total | | $ | 170,187,928 | | | | 10,424,743 | | | $ | (37,266,747 | ) |
| | | |
The combined net assets of the Franklin DynaTech Fund immediately after the reorganization were $475,468,843.
On May 6, 2009, the Franklin Growth Fund acquired the net assets of the Franklin Capital Growth Fund pursuant to a plan of reorganization approved by the Franklin Capital Growth Fund’s shareholders. The reorganization was accomplished by a tax-free exchange of 22,770,597 shares of the Franklin Growth Fund for the net assets of the Franklin Capital Growth Fund which aggregate $699,807,298, including $(9,584,107) of unrealized appreciation (depreciation). The combined net assets of the Franklin Growth Fund immediately after the reorganization were $2,586,155,713.
13. Credit Facility
The Funds, together with other U.S. registered and foreign investment funds (collectively “Borrowers”), managed by Franklin Templeton Investments, are borrowers in a joint syndicated senior unsecured credit facility totaling $750 million (Global Credit Facility) which matures on January 21, 2011. This Global Credit Facility provides a source of funds to the Borrowers for temporary and emergency purposes, including the ability to meet future unanticipated or unusually large redemption requests.
Under the terms of the Global Credit Facility, the Funds shall, in addition to interest charged on any borrowings made by the Funds and other costs incurred by the Funds, pay their share of fees and expenses incurred in connection with the implementation and maintenance of the Global Credit Facility, based upon its relative share of the aggregate net assets of all of the Borrowers, including an annual commitment fee of 0.10% based upon the unused portion of the Global Credit Facility, which is reflected in other expenses on the Statements of Operations. During the year ended September 30, 2010, the Funds did not use the Global Credit Facility.
Annual Report | 139
Franklin Custodian Funds
Notes to Financial Statements (continued)
14. Regulatory and Litigation Matters
During the year ended September 30, 2010, the Franklin Growth Fund received $30,072 resulting from a settlement between the SEC and Advisers relating to market-timing activities, as previously reported in the fund’s financial statements during the years ended September 30, 2003 through September 30, 2008. This payment is included in capital shares transactions on the Statements of Changes in Net Assets.
15. Fair Value Measurements
The Funds follow a fair value hierarchy that distinguishes between market data obtained from independent sources (observable inputs) and the Funds’ own market assumptions (unobservable inputs). These inputs are used in determining the value of the Funds’ investments and are summarized in the following fair value hierarchy:
| | • | | Level 1 — quoted prices in active markets for identical securities |
| | | | |
| | • | | Level 2 — other significant observable inputs (including quoted prices for similar securities, interest rates, prepayment speed, credit risk, etc.) |
| | | | |
| | • | | Level 3 — significant unobservable inputs (including the Funds’ own assumptions in determining the fair value of investments) |
The inputs or methodology used for valuing securities are not an indication of the risk associated with investing in those securities.
For movements between the levels within the fair value hierarchy, the Funds have adopted a policy of recognizing the transfers as of the date of the underlying event which caused the movement.
The following is a summary of the inputs used as of September 30, 2010, in valuing the Funds’ assets and liabilities carried at fair value:
| | | | | | | | | | | | | | | | | |
| | | Level 1 | | Level 2 | | Level 3 | | Total |
| | | |
Franklin DynaTech Fund | | | | | | | | | | | | | | | | |
Assets: | | | | | | | | | | | | | | | | |
| Investments in Securities: | | | | | | | | | | | | | | | | |
Equity Investmentsa | | $ | 687,142,088 | | | $ | — | | | $ | — | | | $ | 687,142,088 | |
| Short Term Investments | | | 5,804,707 | | | | — | | | | — | | | | 5,804,707 | |
| | | |
| Total Investments in Securities | | $ | 692,946,795 | | | $ | — | | | $ | — | | | $ | 692,946,795 | |
| | | |
Franklin Growth Fund | | | | | | | | | | | | | | | | |
Assets: | | | | | | | | | | | | | | | | |
| Investments in Securities: | | | | | | | | | | | | | | | | |
Equity Investmentsa | | $ | 3,405,567,604 | | | $ | — | | | $ | — | | | $ | 3,405,567,604 | |
| Short Term Investments | | | 181,648,270 | | | | 31,822,988 | | | | — | | | | 213,471,258 | |
| | | |
| Total Investments in Securities | | $ | 3,587,215,874 | | | $ | 31,822,988 | | | $ | — | | | $ | 3,619,038,862 | |
| | | |
140 | Annual Report
Franklin Custodian Funds
Notes to Financial Statements (continued)
15. Fair Value Measurements (continued)
| | | | | | | | | | | | | | | | | |
| | | Level 1 | | Level 2 | | Level 3 | | Total |
| | | |
Franklin Income Fund | | | | | | | | | | | | | | | | |
Assets: | | | | | | | | | | | | | | | | |
| Investments in Securities: | | | | | | | | | | | | | | | | |
Equity Investments:b | | | | | | | | | | | | | | | | |
| Consumer Discretionary | | $ | 644,356,841 | | | $ | 97,165,390 | | | $ | — | | | $ | 741,522,231 | |
| Energy | | | 2,112,064,317 | | | | 164,739,200 | | | | — | | | | 2,276,803,517 | |
| Financials | | | 3,247,594,227 | | | | 309,583,990 | | | | — | | | | 3,557,178,217 | |
| Health Care | | | 2,408,918,492 | | | | 213,750,000 | | | | — | | | | 2,622,668,492 | |
| Industrials | | | 121,875,000 | | | | 1,600,000 | | | | — | | | | 123,475,000 | |
Other Equity Investmentsa | | | 8,686,980,426 | | | | — | | | | — | | | | 8,686,980,426 | |
| Equity-Linked Securities | | | — | | | | 2,470,715,621 | | | | — | | | | 2,470,715,621 | |
| Convertible Bonds | | | — | | | | 334,521,810 | | | | — | | | | 334,521,810 | |
| Corporate Bonds | | | — | | | | 28,124,431,151 | | | | 94,587,070 | | | | 28,219,018,221 | |
| Senior Floating Rate Interests | | | — | | | | 3,157,331,490 | | | | — | | | | 3,157,331,490 | |
| Municipal Bonds | | | — | | | | 193,158,000 | | | | — | | | | 193,158,000 | |
| Mutual Funds | | | 643,773,401 | | | | — | | | | — | | | | 643,773,401 | |
| Short Term Investments | | | 335,786,398 | | | | 923,929,243 | | | | — | | | | 1,259,715,641 | |
| | | |
| Total Investments in Securities | | $ | 18,201,349,102 | | | $ | 35,990,925,895 | | | $ | 94,587,070 | | | $ | 54,286,862,067 | |
| | | |
Franklin U.S. Government Securities Fund | | | | | | | | | | | | | | | | |
Assets: | | | | | | | | | | | | | | | | |
| Investments in Securities: | | | | | | | | | | | | | | | | |
| Mortgage-Backed Securities | | $ | — | | | $ | 10,616,396,683 | | | $ | — | | | $ | 10,616,396,683 | |
| Short Term Investments | | | 112,396,476 | | | | — | | | | — | | | | 112,396,476 | |
| | | |
| Total Investments in Securities | | $ | 112,396,476 | | | $ | 10,616,396,683 | | | $ | — | | | $ | 10,728,793,159 | |
| | | |
Franklin Utilities Fund | | | | | | | | | | | | | | | | |
Assets: | | | | | | | | | | | | | | | | |
| Investments in Securities: | | | | | | | | | | | | | | | | |
Equity Investmentsa | | $ | 2,428,269,322 | | | $ | — | | | $ | — | | | $ | 2,428,269,322 | |
| Corporate Bonds | | | — | | | | 80,641,304 | | | | — | | | | 80,641,304 | |
| Short Term Investments | | | 40,993,986 | | | | — | | | | — | | | | 40,993,986 | |
| | | |
| Total Investments in Securities | | $ | 2,469,263,308 | | | $ | 80,641,304 | | | $ | — | | | $ | 2,549,904,612 | |
| | | |
| | |
| a | | For detailed industry descriptions, see the accompanying Statements of Investments. |
| | | |
| b | | Includes common, preferred and convertible preferred stock as well as other equity investments. |
Annual Report | 141
Franklin Custodian Funds
Notes to Financial Statements (continued)
15. Fair Value Measurements (continued)
At September 30, 2010, the reconciliation of assets in which significant unobservable inputs (Level 3) were used in determining the Funds’ fair value, were as follows:
| | | | | | | | | | | | | | | | | | | | | | | | | | | | | |
| | | | | | | | | | | | | | | | | | | | | | | | | | | Net Change |
| | | | | | | | | | | Net Change | | | | | | | | | | | | | | in Unrealized |
| | | | | | | | | | | in | | | | | | | | | | | | | | Appreciation |
| | | Balance at | | Net | | Unrealized | | Net | | Transfer | | Balance | | (Depreciation) |
| | | Beginning | | Realized | | Appreciation | | Purchases | | In (Out) of | | at End | | on Assets Held |
| | | of Year | | Gain (Loss) | | (Depreciation) | | (Sales) | | Level 3 | | of Year | | at Year End |
| | | |
Franklin Income Fund | | | | | | | | | | | | | | | | | | | | | | | | | | | | |
Assets | | | | | | | | | | | | | | | | | | | | | | | | | | | | |
| Corporate Bonds | | $ | — | | | $ | — | | | $ | 2,337,070 | | | $ | 92,250,000 | | | $ | — | | | $ | 94,587,070 | | | $ | 2,337,070 | |
16. Subsequent Events
The Funds have evaluated subsequent events through the issuance of the financial statements and determined that no events have occurred that require disclosure.
| | |
| ABBREVIATIONS |
| | | |
| Currency |
| | | |
| EUR | | — Euro |
| | | |
| GBP | | — British Pound |
| | | |
| Selected Portfolio |
| | | |
| ADR | | — American Depository Receipt |
| | | |
| FHLB | | — Federal Home Loan Bank |
| | | |
| FNMA | | — Federal National Mortgage Association |
| | | |
| FRN | | — Floating Rate Note |
| | | |
| GO | | — General Obligation |
| | | |
| GP | | — Graduated Payment |
| | | |
| L/C | | — Letter of Credit |
| | | |
| MTN | | — Medium Term Note |
| | | |
| PIK | | — Payment-In-Kind |
| | | |
| SF | | — Single Family |
142 | Annual Report
Franklin Custodian Funds
Report of Independent Registered Public Accounting Firm
To the Board of Trustees and Shareholders of Franklin Custodian Funds
In our opinion, the accompanying statements of assets and liabilities, including the statements of investments, and the related statements of operations and of changes in net assets and the financial highlights present fairly, in all material respects, the financial position of the Franklin DynaTech Fund, Franklin Growth Fund, Franklin Income Fund, Franklin U.S. Government Securities Fund and Franklin Utilities Fund, separate portfolios of Franklin Custodian Funds, (hereafter referred to as the “Funds”) at September 30, 2010, the results of each of their operations for the year then ended, the changes in each of their net assets for each of the two years in the period then ended and the financial highlights for each of the periods presented, in conformity with accounting principles generally accepted in the United States of America. These financial statements and financial highlights (hereafte r referred to as “financial statements”) are the responsibility of the Funds’ management. Our responsibility is to express an opinion on these financial statements based on our audits. We conducted our audits of these financial statements in accordance with the standards of the Public Company Accounting Oversight Board (United States). Those standards require that we plan and perform the audit to obtain reasonable assurance about whether the financial statements are free of material misstatement. An audit includes examining, on a test basis, evidence supporting the amounts and disclosures in the financial statements, assessing the accounting principles used and significant estimates made by management, and evaluating the overall financial statement presentation. We believe that our audits, which included confirmation of securities at September 30, 2010 by correspondence with the custodian and brokers, provide a reasonable basis for our opinion.
PricewaterhouseCoopers LLP
San Francisco, California
November 16, 2010
Annual Report | 143
Franklin Custodian Funds
Tax Designation (unaudited)
Under Section 852(b)(3)(C) of the Internal Revenue Code (Code), the Funds designate the maximum amount allowable but no less than the following amounts as long term capital gain dividends for the fiscal year ended September 30, 2010:
| | | | | | | |
| | | Franklin | | | | |
| | | Utilities Fund | | | | |
| | | $31,158,605 | | | | |
Under Section 854(b)(2) of the Code, the Funds designate the following percentage amounts of the ordinary income dividends as income qualifying for the dividends received deduction for the fiscal year ended September 30, 2010:
| | | | | |
| Franklin | | Franklin | | Franklin |
| Growth Fund | | Income Fund | | Utilities Fund |
| |
| 100% | | 17.56% | | 100% |
Under Section 854(b)(2) of the Code, the Funds designate the maximum amount allowable but no less than the following amounts as qualified dividends for purposes of the maximum rate under Section 1(h)(11) of the Code for the fiscal year ended September 30, 2010:
| | | | | | | |
| Franklin | | Franklin | | Franklin | | Franklin |
| DynaTech Fund | | Growth Fund | | Income Fund | | Utilities Fund |
| |
| $3,891,060 | | $48,125,611 | | $666,952,003 | | $100,252,215 |
Distributions, including qualified dividend income, paid during calendar year 2010 will be reported to shareholders on Form 1099-DIV in January 2011. Shareholders are advised to check with their tax advisors for information on the treatment of these amounts on their individual income tax returns.
Under Section 871(k)(1)(C) of the Code, the Funds designate the maximum amount allowable but no less than the following amounts as interest related dividends for purposes of the tax imposed under Section 871(a)(1)(A) of the Code for the fiscal year ended September 30, 2010:
| | | | | | | |
| | | | | Franklin | | |
| Franklin | | Franklin | | U.S. Government | | Franklin |
| Growth Fund | | Income Fund | | Securities Fund | | Utilities Fund |
| |
| $5,426 | | $2,428,161,743 | | $398,328,315 | | $5,389,717 |
144 | Annual Report
Franklin Custodian Funds
Board Members and Officers
The name, year of birth and address of the officers and board members, as well as their affiliations, positions held with the Fund, principal occupations during the past five years and number of portfolios overseen in the Franklin Templeton Investments fund complex are shown below. Generally, each board member serves until that person’s successor is elected and qualified.
Independent Board Members
| | | | | | | | | | | |
| | | | | | | Number of Portfolios in | | |
| Name, Year of Birth | | | | Length of | | Fund Complex Overseen | | |
| and Address | | Position | | Time Served | | by Board Member* | | Other Directorships Held |
| |
Harris J. Ashton (1932) | | Trustee | | Since 1976 | | 129 | | Bar-S Foods (meat packing company)
(1981-2010). |
| One Franklin Parkway | | | | | | | | | | |
| San Mateo, CA 94403-1906 | | | | | | | | | | |
| | | | | | | | | | | |
| Principal Occupation During Past 5 Years: |
| | | | | | | | | | | |
| Director of various companies; and formerly, Director, RBC Holdings, Inc. (bank holding company) (until 2002); and President, Chief Executive Officer and Chairman of the Board, General Host Corporation (nursery and craft centers) (until 1998). |
| | | | | | | | | | | |
Sam Ginn (1937)
One Franklin Parkway
San Mateo, CA 94403-1906 | | Trustee | | Since 2007 | | 106 | | ICO Global Communications (Holdings) Limited (satellite company). |
| | | | | | | | | | | |
| Principal Occupation During Past 5 Years: |
| | | | | | | | | | | |
| Private investor; and formerly, Chairman of the Board, Vodafone AirTouch, PLC (wireless company); Chairman of the Board and Chief Executive Officer, AirTouch Communications (cellular communications) (1993-1998) and Pacific Telesis Group (telephone holding company) (1988-1994). |
| | | | | | | | | | | |
Edith E. Holiday (1952)
One Franklin Parkway
San Mateo, CA 94403-1906 | | Trustee | | Since 1998 | | 129 | | Hess Corporation (exploration and refining of oil and gas), H.J. Heinz Company (processed foods and allied products), RTI International Metals, Inc. (manufacture and distribution of titanium), Canadian National Railway (railroad) and White Mountains Insurance Group, Ltd. (holding company). |
| | | | | | | | | | | |
| Principal Occupation During Past 5 Years: |
| | | | | | | | | | | |
| Director or Trustee of various companies and trusts; and formerly, Assistant to the President of the United States and Secretary of the Cabinet (1990-1993); General Counsel to the United States Treasury Department (1989-1990); and Counselor to the Secretary and Assistant Secretary for Public Affairs and Public Liaison-United States Treasury Department (1988-1989). |
| | | | | | | | | | | |
J. Michael Luttig (1954)
One Franklin Parkway
San Mateo, CA 94403-1906 | | Trustee | | Since December 2009 | | 129 | | Boeing Capital Corporation (aircraft financing). |
| | | | | | | | | | | |
| Principal Occupation During Past 5 Years: |
| | | | | | | | | | | |
| Executive Vice President, General Counsel and member of Executive Council, The Boeing Company; and formerly, Federal Appeals Court Judge, U.S. Court of Appeals for the Fourth Circuit (1991-2006). |
Annual Report | 145
| | | | | | | | | | | |
| | | | | | | Number of Portfolios in | | |
| Name, Year of Birth | | | | Length of | | Fund Complex Overseen | | |
| and Address | | Position | | Time Served | | by Board Member* | | Other Directorships Held |
| |
Frank A. Olson (1932)
One Franklin Parkway | | Trustee | | Since 2005 | | 129 | | Hess Corporation (exploration and refining of oil and gas). |
| San Mateo, CA 94403-1906 | | | | | | | | | | |
| | | | | | | | | | | |
| Principal Occupation During Past 5 Years: |
| | | | | | | | | | | |
| Chairman Emeritus, The Hertz Corporation (car rental) (since 2000) (Chairman of the Board (1980-2000) and Chief Executive Officer (1977-1999)); and formerly, Chairman of the Board, President and Chief Executive Officer, UAL Corporation (airlines). |
| | | | | | | | | | | |
Larry D. Thompson (1945)
One Franklin Parkway
San Mateo, CA 94403-1906 | | Trustee | | Since 2007 | | 137 | | Cbeyond, Inc. (business communications provider) and The Southern Company (energy company). |
| | | | | | | | | | | |
| Principal Occupation During Past 5 Years: |
| | | | | | | | | | | |
| Senior Vice President — Government Affairs, General Counsel and Secretary, PepsiCo, Inc. (consumer products); and formerly, Director, Delta Airlines (aviation) (2003-2005) and Providian Financial Corp. (credit card provider) (1997-2001); Senior Fellow of The Brookings Institution (2003-2004); Visiting Professor, University of Georgia School of Law (2004); and Deputy Attorney General, U.S. Department of Justice (2001-2003). |
| | | | | | | | | | | |
John B. Wilson (1959)
One Franklin Parkway
San Mateo, CA 94403-1906 | | Lead
Independent
Trustee | | Trustee since 2007 and Lead Independent Trustee since 2008 | | 106 | | None |
| | | | | | | | | | | |
| Principal Occupation During Past 5 Years: |
| | | | | | | | | | | |
| President and Founder, Hyannis Port Capital, Inc. (real estate and private equity investing); serves on private and non-profit boards; and formerly, Chief Operating Officer and Executive Vice President, Gap, Inc. (retail) (1996-2000); Chief Financial Officer and Executive Vice President — Finance and Strategy, Staples, Inc. (office supplies) (1992-1996); Senior Vice President — Corporate Planning, Northwest Airlines, Inc. (airlines) (1990-1992); and Vice President and Partner, Bain & Company (consulting firm) (1986-1990). |
Interested Board Members and Officers |
| | | | | | | | | | | |
| | | | | | | Number of Portfolios in | | |
| Name, Year of Birth | | | | Length of | | Fund Complex Overseen | | |
| and Address | | Position | | Time Served | | by Board Member* | | Other Directorships Held |
| |
**Charles B. Johnson (1933)
One Franklin Parkway
San Mateo, CA 94403-1906 | | Trustee and Chairman of the Board | | Trustee since 1969 and Chairman of the Board since 2007 | | 129 | | None |
| | | | | | | | | | | |
| Principal Occupation During Past 5 Years: |
| | | | | | | | | | | |
| Chairman of the Board, Member — Office of the Chairman and Director, Franklin Resources, Inc.; and officer and/or director or trustee, as the case may be, of some of the other subsidiaries of Franklin Resources, Inc. and of 41 of the investment companies in Franklin Templeton Investments. |
146 | Annual Report
| | | | | | | | | | | |
| | | | | | | Number of Portfolios in | | |
| Name, Year of Birth | | | | Length of | | Fund Complex Overseen | | |
| and Address | | Position | | Time Served | | by Board Member* | | Other Directorships Held |
| |
**Rupert H. Johnson, Jr. (1940)
One Franklin Parkway
San Mateo, CA 94403-1906 | | Trustee and Vice President | | Trustee since 1983 and Vice President since 1982 | | 51 | | None |
| | | | | | | | | | | |
| Principal Occupation During Past 5 Years: |
| | | | | | | | | | | |
| Vice Chairman, Member — Office of the Chairman and Director, Franklin Resources, Inc.; Director, Franklin Advisers, Inc.; Senior Vice President, Franklin Advisory Services, LLC; and officer and/or director or trustee, as the case may be, of some of the other subsidiaries of Franklin Resources, Inc. and of 25 of the investment companies in Franklin Templeton Investments. |
| | | | | | | | | | | |
James M. Davis (1952)
One Franklin Parkway
San Mateo, CA 94403-1906 | | Chief Compliance Officer and Vice President — AML Compliance | | Chief Compliance Officer since 2004 and Vice President — AML Compliance since 2006 | | Not Applicable | | Not Applicable |
| Principal Occupation During Past 5 Years: |
| | | | | | | | | | | |
| Director, Global Compliance, Franklin Resources, Inc.; officer of some of the other subsidiaries of Franklin Resources, Inc. and of 45 of the investment companies in Franklin Templeton Investments; and formerly, Director of Compliance, Franklin Resources, Inc. (1994-2001). |
| | | | | | | | | | | |
Laura F. Fergerson (1962)
One Franklin Parkway
San Mateo, CA 94403-1906 | | Chief Executive Officer — Finance and Administration | | Since 2009 | | Not Applicable | | Not Applicable |
| | | | | | | | | | | |
| Principal Occupation During Past 5 Years: |
| | | | | | | | | | | |
| Vice President, Franklin Templeton Services, LLC; officer of 45 of the investment companies in Franklin Templeton Investments; and formerly, Director and member of Audit and Valuation Committees, Runkel Funds, Inc. (2003-2004); Assistant Treasurer of most of the investment companies in Franklin Templeton Investments (1997-2003); and Vice President, Franklin Templeton Services, LLC (1997-2003). |
| | | | | | | | | | | |
Gaston Gardey (1967)
One Franklin Parkway
San Mateo, CA 94403-1906 | | Treasurer, Chief Financial Officer and Chief Accounting Officer | | Since 2009 | | Not Applicable | | Not Applicable |
| | | | | | | | | | | |
| Principal Occupation During Past 5 Years: |
| | | | | | | | | | | |
| Director, Fund Accounting, Franklin Templeton Investments; and officer of 27 of the investment companies in Franklin Templeton Investments. |
| | | | | | | | | | | |
Aliya S. Gordon (1973)
One Franklin Parkway
San Mateo, CA 94403-1906 | | Vice President | | Since 2009 | | Not Applicable | | Not Applicable |
| | | | | | | | | | | |
| Principal Occupation During Past 5 Years: |
| | | | | | | | | | | |
| Associate General Counsel, Franklin Templeton Investments; officer of 45 of the investment companies in Franklin Templeton Investments; and formerly, Litigation Associate, Steefel, Levitt & Weiss, LLP (2000-2004). |
Annual Report | 147
| | | | | | | | | |
| | | | | | | Number of Portfolios in | | |
| Name, Year of Birth | | | | Length of | | Fund Complex Overseen | | |
| and Address | | Position | | Time Served | | by Board Member* | | Other Directorships Held |
| |
David P. Goss (1947)
One Franklin Parkway
San Mateo, CA 94403-1906 | | Vice President | | Since 2000 | | Not Applicable | | Not Applicable |
| | | | | | | | | |
| Principal Occupation During Past 5 Years: |
| | | | | | | | | |
| Senior Associate General Counsel, Franklin Templeton Investments; and officer and/or director, as the case may be, of some of the other subsidiaries of Franklin Resources, Inc. and of 45 of the investment companies in Franklin Templeton Investments. |
| | | | | | | | | |
Steven J. Gray (1955)
One Franklin Parkway
San Mateo, CA 94403-1906 | | Vice President | | Since 2009 | | Not Applicable | | Not Applicable |
| | | | | | | | | |
| Principal Occupation During Past 5 Years: |
| | | | | | | | | |
| Senior Associate General Counsel, Franklin Templeton Investments; Vice President, Franklin Templeton Distributors, Inc.; and officer of 45 of the investment companies in Franklin Templeton Investments. |
| | | | | | | | | |
Edward B. Jamieson (1948)
One Franklin Parkway
San Mateo, CA 94403-1906 | | President and Chief Executive Officer — Investment Management | | Since April 2010 | | Not Applicable | | Not Applicable |
| | | | | | | | | |
| Principal Occupation During Past 5 Years: |
| | | | | | | | | |
| President, Chief Investment Officer and Director, Franklin Advisers, Inc.; Executive Vice President, Franklin Templeton Institutional, LLC; and officer and/or trustee, as the case may be, of some of the other subsidiaries of Franklin Resources, Inc. and of 10 of the investment companies in Franklin Templeton Investments. |
| | | | | | | | | |
Robert C. Rosselot (1960)
500 East Broward Blvd.
Suite 2100
Fort Lauderdale, FL 33394-3091 | | Vice President | | Since 2009 | | Not Applicable | | Not Applicable |
| | | | | | | | | |
| Principal Occupation During Past 5 Years: |
| | | | | | | | | |
| Senior Associate General Counsel, Franklin Templeton Investments; Assistant Secretary, Franklin Resources, Inc.; Vice President and Secretary, Templeton Investment Counsel, LLC; Vice President, Secretary and Trust Officer, Fiduciary Trust International of the South; and officer of 45 of the investment companies in Franklin Templeton Investments. |
| | | | | | | | | |
Karen L. Skidmore (1952)
One Franklin Parkway
San Mateo, CA 94403-1906 | | Vice President and Secretary | | Since 2006 | | Not Applicable | | Not Applicable |
| | | | | | | | | |
| Principal Occupation During Past 5 Years: |
| | | | | | | | | |
| Senior Associate General Counsel, Franklin Templeton Investments; and officer of 45 of the investment companies in Franklin Templeton Investments. |
148 | Annual Report
| | | | | | | | | |
| | | | | | | Number of Portfolios in | | |
| Name, Year of Birth | | | | Length of | | Fund Complex Overseen | | |
| and Address | | Position | | Time Served | | by Board Member* | | Other Directorships Held |
| |
Craig S. Tyle (1960)
One Franklin Parkway
San Mateo, CA 94403-1906 | | Vice President | | Since 2005 | | Not Applicable | | Not Applicable |
| | | | | | | | | |
| Principal Occupation During Past 5 Years: |
| | | | | | | | | |
| General Counsel and Executive Vice President, Franklin Resources, Inc.; officer of some of the other subsidiaries of Franklin Resources, Inc. and of 45 of the investment companies in Franklin Templeton Investments; and formerly, Partner, Shearman & Sterling, LLP (2004-2005); and General Counsel, Investment Company Institute (ICI) (1997-2004). |
| | |
| * | | We base the number of portfolios on each separate series of the U.S. registered investment companies within the Franklin Templeton Investments fund complex. These portfolios have a common investment manager or affiliated investment managers. |
| | | |
| ** | | Charles B. Johnson and Rupert H. Johnson, Jr. are considered to be interested persons of the Fund under the federal securities laws due to their positions as officers and directors and major shareholders of Franklin Resources, Inc., which is the parent company of the Fund’s investment manager and distributor. |
| | | |
| Note 1: | | Charles B. Johnson and Rupert H. Johnson, Jr. are brothers. |
| | | |
| Note 2: | | Officer information is current as of the date of this report. It is possible that after this date, information about officers may change. |
| | | |
| Note 3: | | Prior to September 30, 2010, Robert F. Carlson and Frank W.T. LaHaye each ceased to be a trustee of the Trust. |
The Sarbanes-Oxley Act of 2002 and Rules adopted by the Securities and Exchange Commission require the Fund to disclose whether the Fund’s Audit Committee includes at least one member who is an audit committee financial expert within the meaning of such Act and Rules. The Fund’s Board has determined that there is at least one such financial expert on the Audit Committee and has designated John B. Wilson as its audit committee financial expert. The Board believes that Mr. Wilson qualifies as such an expert in view of his extensive business background and experience, including service as chief financial officer of Staples, Inc. from 1992 to 1996. Mr. Wilson has been a Member and Chairman of the Fund’s Audit Committee since 2007. As a result of such background and experience, the Board believes that Mr. Wilson has acquired an understanding of generally accepted accounting principles and financial statements, the general application of such principles in connection with the accounting estimates, accruals and reserves, and analyzing and evaluating financial statements that present a breadth and level of complexity of accounting issues generally comparable to those of the Fund, as well as an understanding of internal controls and procedures for financial reporting and an understanding of audit committee functions. Mr. Wilson is an independent Board member as that term is defined under the relevant Securities and Exchange Commission Rules and Releases.
The Statement of Additional Information (SAI) includes additional information about the board members and is available, without charge, upon request. Shareholders may call (800) DIAL BEN/(800) 342-5236 to request the SAI.
Annual Report | 149
Franklin Custodian Funds
Shareholder Information
Proxy Voting Policies and Procedures
The Trust’s investment manager has established Proxy Voting Policies and Procedures (Policies) that the Trust uses to determine how to vote proxies relating to portfolio securities. Shareholders may view the Trust’s complete Policies online at franklintempleton.com. Alternatively, shareholders may request copies of the Policies free of charge by calling the Proxy Group collect at (954) 527-7678 or by sending a written request to: Franklin Templeton Companies, LLC, 500 East Broward Boulevard, Suite 1500, Fort Lauderdale, FL 33394, Attention: Proxy Group. Copies of the Trust’s proxy voting records are also made available online at franklintempleton.com and posted on the U.S. Securities and Exchange Commission’s website at sec.gov and reflect the most recent 12-month period ended June 30.
Quarterly Statement of Investments
The Trust files a complete statement of investments with the U.S. Securities and Exchange Commission for the first and third quarters for each fiscal year on Form N-Q. Shareholders may view the filed Form N-Q by visiting the Commission’s website at sec.gov. The filed form may also be viewed and copied at the Commission’s Public Reference Room in Washington, DC. Information regarding the operations of the Public Reference Room may be obtained by calling (800) SEC-0330.
Householding of Reports and Prospectuses
You will receive each Fund’s financial reports every six months as well as an annual updated summary prospectus (prospectus available upon request). To reduce Fund expenses, we try to identify related shareholders in a household and send only one copy of the financial reports and summary prospectus. This process, called “householding,” will continue indefinitely unless you instruct us otherwise. If you prefer not to have these documents householded, please call us at (800) 632-2301. At any time you may view current prospectuses/summary prospectuses and financial reports on our website. If you choose, you may receive these documents through electronic delivery.
150 | Annual Report
This page intentionally left blank.
This page intentionally left blank.
Franklin Templeton Funds
Literature Request. To receive a summary prospectus and/or prospectus, please call us at (800) DIAL BEN/(800) 342-5236 or visit franklintempleton.com. Investors should carefully consider a fund’s investment goals, risks, charges and expenses before investing. The prospectus contains this and other information. Please carefully read a prospectus before investing. To ensure the highest quality of service, we may monitor, record and access telephone calls to or from our service departments. These calls can be identified by the presence of a regular beeping tone.
VALUE
Franklin All Cap Value Fund
Franklin Balance Sheet Investment Fund
Franklin Large Cap Value Fund
Franklin MicroCap Value Fund1
Franklin MidCap Value Fund
Franklin Small Cap Value Fund
Mutual Beacon Fund
Mutual Quest Fund
Mutual Recovery Fund2
Mutual Shares Fund
BLEND
Franklin Focused Core Equity Fund
Franklin Large Cap Equity Fund
Franklin Rising Dividends Fund
GROWTH
Franklin DynaTech Fund
Franklin Flex Cap Growth Fund
Franklin Growth Fund
Franklin Growth Opportunities Fund
Franklin Small Cap Growth Fund
Franklin Small-Mid Cap Growth Fund
SECTOR
Franklin Biotechnology Discovery Fund
Franklin Global Real Estate Fund
Franklin Gold & Precious Metals Fund
Franklin Natural Resources Fund
Franklin Real Estate Securities Fund
Franklin Utilities Fund
Mutual Financial Services Fund
GLOBAL
Mutual Global Discovery Fund
Templeton Global Opportunities Trust
Templeton Global Smaller Companies Fund
Templeton Growth Fund
Templeton World Fund
INTERNATIONAL
Franklin India Growth Fund
Franklin International Growth Fund
Franklin International Small Cap Growth Fund
Mutual European Fund
Mutual International Fund
Templeton BRIC Fund
Templeton China World Fund
Templeton Developing Markets Trust
Templeton Emerging Markets Small Cap Fund
Templeton Foreign Fund
Templeton Foreign Smaller Companies Fund
Templeton Frontier Markets Fund
HYBRID
Franklin Balanced Fund
Franklin Convertible Securities Fund
Franklin Equity Income Fund
Franklin Income Fund
Templeton Income Fund
ASSET ALLOCATION
Franklin Templeton Corefolio®Allocation Fund
Franklin Templeton Founding Funds Allocation Fund
Franklin Templeton Conservative Allocation Fund3
Franklin Templeton Growth Allocation Fund3
Franklin Templeton Moderate Allocation Fund3
Franklin Templeton 2015 Retirement Target Fund
Franklin Templeton 2025 Retirement Target Fund
Franklin Templeton 2035 Retirement Target Fund
Franklin Templeton 2045 Retirement Target Fund
FIXED INCOME
Franklin Adjustable U.S. Government Securities Fund4
Franklin Floating Rate Daily Access Fund
Franklin High Income Fund
Franklin Limited Maturity U.S. Government Securities Fund4
Franklin Low Duration Total Return Fund
Franklin Real Return Fund
Franklin Strategic Income Fund
Franklin Strategic Mortgage Portfolio
Franklin Templeton Hard Currency Fund
Franklin Total Return Fund
Franklin U.S. Government Securities Fund4
Templeton Global Bond Fund
Templeton Global Total Return Fund
Templeton International Bond Fund
TAX-FREE INCOME5
National
Double Tax-Free Income Fund
Federal Tax-Free Income Fund High
Yield Tax-Free Income Fund
Insured Tax-Free Income
Fund6
Limited-/Intermediate-Term
California Intermediate-Term Tax-Free Income Fund
Federal Intermediate-Term Tax-Free Income Fund
Federal Limited-Term Tax-Free Income Fund
New York Intermediate-Term Tax-Free Income Fund
State-Specific
| | | |
| | |
| Alabama | | Michigan8 |
| Arizona | | Minnesota8 |
California7 | | Missouri |
| Colorado | | New Jersey |
| Connecticut | | New York7 |
| Florida | | North Carolina |
| Georgia | | Ohio8 |
| Kentucky | | Oregon |
| Louisiana | | Pennsylvania |
| Maryland | | Tennessee |
Massachusetts8 | | Virginia |
INSURANCE FUNDS
Franklin Templeton Variable Insurance Products Trust9
| | |
| 1. | | The fund is closed to new investors. Existing shareholders and select retirement plans can continue adding to their accounts. |
| | | |
| 2. | | The fund is a continuously offered, closed-end fund. Shares may be purchased daily; there is no daily redemption. However, each quarter, pending board approval, the fund will authorize the repurchase of 5%–25% of the outstanding number of shares. Investors may tender all or a portion of their shares during the tender period. |
| | | |
| 3. | | Effective 5/1/10, the Franklin Templeton Target Funds changed their name to the Franklin Templeton Allocation Funds. The funds’ investment goals and principal investment strategies remained unchanged. |
| | | |
| 4. | | An investment in the fund is neither insured nor guaranteed by the U.S. government or by any other entity or institution. |
| | | |
| 5. | | For investors subject to the alternative minimum tax, a small portion of fund dividends may be taxable. Distributions of capital gains are generally taxable. |
| | | |
| 6. | | The fund invests primarily in insured municipal securities. |
| | | |
| 7. | | These funds are available in three or more variations, including long-term portfolios, intermediate-term portfolios, portfolios of insured securities, a high-yield portfolio (CA only) and a money market portfolio (CA only). |
| | | |
| 8. | | The Board of Trustees approved the elimination of the non-fundamental policy requiring the fund to invest at least 80% of net assets in insured municipal securities and the removal of the word “Insured” from the fund name. The changes became effective 2/15/09. |
| | | |
| 9. | | The funds of the Franklin Templeton Variable Insurance Products Trust are generally available only through insurance company variable contracts. |
| | |
| | | |
| 07/10 | | Not part of the annual report |
| | | |
| | |
| | One Franklin Parkway
San Mateo, CA 94403-1906 |
Sign up for electronic delivery
on franklintempleton.com
Annual Report and Shareholder Letter
Franklin Custodian Funds
Investment Manager
Franklin Advisers, Inc.
Distributor
Franklin Templeton Distributors, Inc.
(800) DIAL BEN®
franklintempleton.com
Shareholder Services
(800) 632-2301
Authorized for distribution only when accompanied or preceded by a summary prospectus and/or prospectus. Investors should carefully consider a fund’s investment goals, risks, charges and expenses before investing. A prospectus contains this and other information; please read it carefully before investing.
To ensure the highest quality of service, telephone calls to or from our service departments may be monitored, recorded and accessed. These calls can be identified by the presence of a regular beeping tone.
© 2010 Franklin Templeton Investments. All rights reserved.
FCF A 11/10
Item 2. Code of Ethics.
(a) The Registrant has adopted a code of ethics that applies to its principal executive officers and principal financial and accounting officer.
(c) N/A
(d) N/A
(f) Pursuant to Item 12(a)(1), the Registrant is attaching as an exhibit a copy of its code of ethics that applies to its principal executive officers and principal financial and accounting officer.
Item 3. Audit Committee Financial Expert.
(a)(1) The Registrant has an audit committee financial expert serving on its audit committee.
(2) The audit committee financial expert is John B. Wilson and he is "independent" as defined under the relevant Securities and Exchange Commission Rules and Releases.
Item 4. Principal Accountant Fees and Services.
(a) Audit Fees
The aggregate fees paid to the principal accountant for professional services rendered by the principal accountant for the audit of the registrant’s annual financial statements or for services that are normally provided by the principal accountant in connection with statutory and regulatory filings or engagements were $372,044 for the fiscal year ended September 30, 2010 and $403,223 for the fiscal year ended September 30, 2009.
(b) Audit-Related Fees
The aggregate fees paid to the principal accountant for assurance and related services rendered by the principal accountant to the registrant that are reasonably related to the performance of the audit of the registrant's financial statements and are not reported under paragraph (a) of Item 4 were $8,307 for the fiscal year ended September 30, 2010 and $2,650 for the fiscal year ended September 30, 2009. The services for which these fees were paid included attestation services.
There were no fees paid to the principal accountant for assurance and related services rendered by the principal accountant to the registrant's investment adviser and any entity controlling, controlled by or under common control with the investment adviser that provides ongoing services to the registrant that are reasonably related to the performance of the audit of their financial statements.
(c) Tax Fees
There were no fees paid to the principal accountant for professional services rendered by the principal accountant to the registrant for tax compliance, tax advice and tax planning.
The aggregate fees paid to the principal accountant for professional services rendered by the principal accountant to the registrant’s investment adviser and any entity controlling, controlled by or under common control with the investment adviser that provides ongoing services to the registrant for tax compliance, tax advice and tax planning were $35,000 for the fiscal year ended September 30, 2010 and $2,000 for the fiscal year ended September 30, 2009. The services for whic h these fees were paid included technical tax consultation for capital gain tax reporting to foreign governments and derivative investments.
(d) All Other Fees
The aggregate fees paid to the principal accountant for products and services rendered by the principal accountant to the registrant not reported in paragraphs (a)-(c) of Item 4 were $26,774 for the fiscal year ended September 30, 2010 and $0 for the fiscal year ended September 30, 2009. The services for which these fees were paid include review of materials provided to the fund Board in connection with the investment management contract renewal process.
The aggregate fees paid to the principal accountant for products and services rendered by the principal accountant to the registrant’s investment adviser and any entity controlling, controlled by or under common control with the investment adviser that provides ongoing services to the registrant not reported in paragraphs (a)-(c) of Item 4 were $118,026 for the fiscal year ended September 30, 2010 and $0 for the fiscal year ended September 30, 2009. The services for which these fees were paid include review of materials provided to the fund Board in connection with the investment management contract renewal process.
(e) (1) The registrant’s audit committee is directly responsible for approving the services to be provided by the auditors, including:
(i) pre-approval of all audit and audit related services;
(ii) pre-approval of all non-audit related services to be provided to the Fund by the auditors;
(iii) pre-approval of all non-audit related services to be provided to the registrant by the auditors to the registrant’s investment adviser or to any entity that controls, is controlled by or is under common control with the registrant’s investment adviser and that provides ongoing services to the registrant where the non-audit services relate directly to the operations or financial reporting of the registrant; and
(iv) establishment by the audit committee, if deemed necessary or appropriate, as an alternative to committee pre-approval of services to be provided by the auditors, as required by paragraphs (ii) and (iii) above, of policies and procedures to permit such services to be pre-approved by other means, such as through establishment of guidelines or by action of a designated member or members of the committee; provided the policies and procedures are detailed as to the particular service and the committee is informed of each service and such policies and procedures do not include delegation of audit committee responsibilities, as contemplated under the Securities Exchange Act of 1934, to management; subject, in the case of (ii) through (iv), to any waivers, exceptions or exemptions that may be available under applicable law or rules.
(e) (2) None of the services provided to the registrant described in paragraphs (b)-(d) of Item 4 were approved by the audit committee pursuant to paragraph (c)(7)(i)(C) of Rule 2-01 of regulation S-X.
(f) No disclosures are required by this Item 4(f).
(g) The aggregate non-audit fees paid to the principal accountant for services rendered by the principal accountant to the registrant and the registrant’s investment adviser and any entity controlling, controlled by or under common control with the investment adviser that provides ongoing services to the registrant were $188,107 for the fiscal year ended September 30, 2010 and $4,650 for the fiscal year ended September 30, 2009.
(h) The registrant’s audit committee of the board has considered whether the provision of non-audit services that were rendered to the registrant’s investment adviser (not including any sub-adviser whose role is primarily portfolio management and is subcontracted with or overseen by another investment adviser), and any entity controlling, controlled by, or under common control with the investment adviser that provides ongoing services to the registrant that were not pre-approved pursuant to paragraph (c)(7)(ii) of Rule 2-01 of Regulation S-X is compatible with maintaining the principal accountant’s independence.
Item 5. Audit Committee of Listed Registrants. N/A
Item 6. Schedule of Investments. N/A
Item 7. Disclosure of Proxy Voting Policies and Procedures for Closed-End Management Investment Companies. N/A
Item 8. Portfolio Managers of Closed-End Management Investment Companies. N/A
Item 9. Purchases of Equity Securities by Closed-End Management Investment Company and Affiliated Purchasers. N/A
Item 10. Submission of Matters to a Vote of Security Holders.
There have been no changes to the procedures by which shareholders may recommend nominees to the Registrant's Board of Trustees that would require disclosure herein.
Item 11. Controls and Procedures.
(a) Evaluation of Disclosure Controls and Procedures. The Registrant maintains disclosure controls and procedures that are designed to ensure that information required to be disclosed in the Registrant’s filings under the Securities Exchange Act of 1934 and the Investment Company Act of 1940 is recorded, processed, summarized and reported within the periods specified in the rules and forms of the Securities and Exchange Commission. Such information is accumulated and communicated to the Registrant’s management, including its principal executive officer and principal financial officer, as appropriate, to allow timely decisions regarding required disclosure. The Registrant’s management, including the principal executive officer and the principal financial officer, recognizes that any set of controls and procedures, no matter how well designed and operated, can provide only reasonable assurance of achieving the desired control objectives.
Within 90 days prior to the filing date of this Shareholder Report on Form N-CSR, the Registrant had carried out an evaluation, under the supervision and with the participation of the Registrant’s management, including the Registrant’s principal executive officer and the Registrant’s principal financial officer, of the effectiveness of the design and operation of the Registrant’s disclosure controls and procedures. Based on such evaluation, the Registrant’s principal executive officer and principal financial officer concluded that the Registrant’s disclosure controls and procedures are effective.
(b) Changes in Internal Controls. There have been no significant changes in the Registrant’s internal controls or in other factors that could significantly affect the internal controls subsequent to the date of their evaluation in connection with the preparation of this Shareholder Report on Form N-CSR.
Item 12. Exhibits.
(a) (1) Code of Ethics
(a) (2) Certifications pursuant to Section 302 of the Sarbanes-Oxley Act of 2002 of Laura F. Fergerson,, Chief Executive Officer - Finance and Administration, and Gaston Gardey, Chief Financial Officer and Chief Accounting Officer
(b) Certifications pursuant to Section 906 of the Sarbanes-Oxley Act of 2002 of Laura F. Fergerson,, Chief Executive Officer - Finance and Administration, and Gaston Gardey, Chief Financial Officer and Chief Accounting Officer
SIGNATURES
Pursuant to the requirements of the Securities Exchange Act of 1934 and the Investment Company Act of 1940, the registrant has duly caused this report to be signed on its behalf by the undersigned, thereunto duly authorized.
FRANKLIN CUSTODIAN FUNDS
By /s/LAURA F. FERGERSON
Laura F. Fergerson
Chief Executive Officer - Finance and Administration
Date November 24, 2010
Pursuant to the requirements of the Securities Exchange Act of 1934 and the Investment Company Act of 1940, this report has been signed below by the following persons on behalf of the registrant and in the capacities and on the dates indicated.
By /s/LAURA F. FERGERSON
Laura F. Fergerson
Chief Executive Officer - Finance and Administration
Date November 24, 2010
By /s/GASTON GARDEY
Gaston Gardey
Chief Financial Officer and
Chief Accounting Officer
Date November 24, 2010