| 1
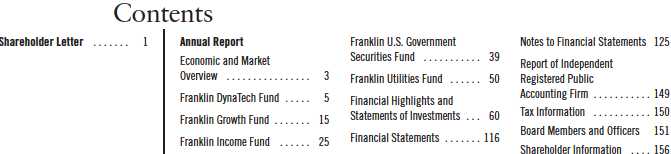
Annual Report
Economic and Market Overview
The U.S. economy, as measured by gross domestic product, grew at a moderate but declining rate during the 12-month period ended September 30, 2012. Encouraging labor market and housing data as well as an expanding services sector helped offset a loss of momentum in the manufacturing sector, a major driver of the U.S. economy. The national unemployment rate declined from 9.1% at the beginning of the period to a 44-month low of 7.8% in September 2012.1 Although prices of some key commodities increased during the period and contributed to higher producer prices, consumer price inflation remained fairly low.
The U.S. Federal Reserve Board (Fed) recognized significant headwinds to the pace of U.S. economic recovery, including the ongoing European fiscal and banking crisis and its potential spillover to U.S. financial markets and institutions, as well as signs of slowing global economic growth. In addition, the looming possibility that U.S. tax increases and government expenditure reductions would come into effect at the beginning of 2013 (the so-called “fiscal cliff”) prompted many businesses to hold off on major investment and hiring decisions. Seeking to support a stronger economic recovery, in September the Fed agreed to purchase additional mortgage-backed securities to provide further quantitative easing (QE3) and to continue extending the average maturity of its Treasury holdings (commonly called Operation Twist). The Fed also anticipated it would maintain historically low interest rates at least through mid-2015.
At the end of the reporting period, the U.S. presidential contest dominated headlines. Significant challenges to the U.S. economy remained, including an elevated although improved level of unemployment, lack of broad public and political agreement on how to achieve U.S. deficit reduction, and uncertainty surrounding deeply indebted European countries. Signs of China’s economic growth slowdown further contributed to pessimism. Long-term resolution of European debt issues remained unclear, but in September the European Central Bank and European leaders established the European Stability Mechanism that, once funded by eurozone members, was expected to provide relief to troubled eurozone countries and banks.
1. Source: Bureau of Labor Statistics.
Annual Report | 3
Global developed and emerging stock markets, as measured by the MSCI All Country World Index, fluctuated as investors apparently reacted to news headlines and shifted between risk taking and risk aversion. Stock markets ultimately generated strong 12-month gains. Not all investors favored stocks, however, and many sought perceived safe havens such as gold bullion, the Japanese yen, the U.S. dollar and U.S. Treasuries. By period-end, the nominal yield on the 10-year U.S. Treasury note had declined to 1.65%.
The foregoing information reflects our analysis and opinions as of September 30, 2012. The information is not a complete analysis of every aspect of any market, country, industry, security or fund. Statements of fact are from sources considered reliable.
4 | Annual Report
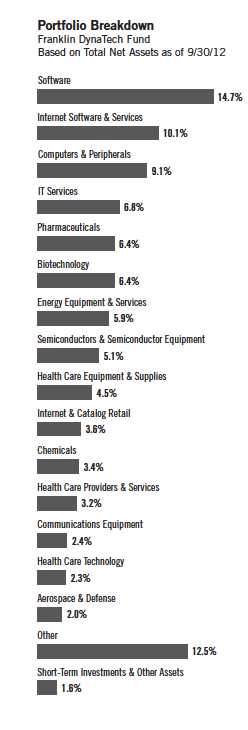
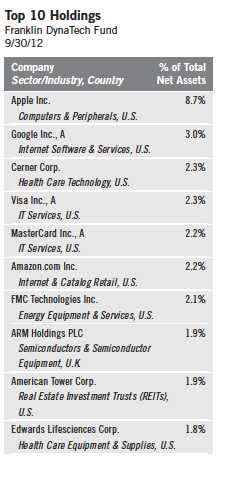
Franklin DynaTech Fund
Your Fund’s Goal and Main Investments: Franklin DynaTech Fund seeks capital
appreciation by investing substantially in equity securities of companies emphasizing scientific or
technological development or that are in fast-growing industries.
Performance data represent past performance, which does not guarantee future results. Investment return and principal value will fluctuate, and you may have a gain or loss when you sell your shares. Current performance may differ from figures shown. Please visit franklintempleton.com or call (800) 342-5236 for most recent month-end performance.
This annual report for Franklin DynaTech Fund covers the fiscal year ended September 30, 2012.
Performance Overview
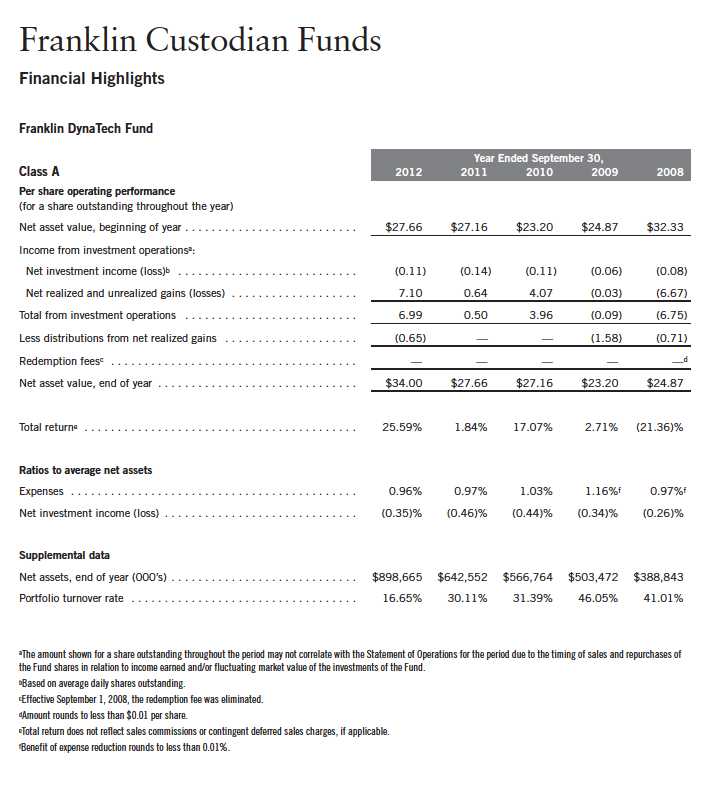
Franklin DynaTech Fund – Class A delivered a +25.59% cumulative total return for the 12 months under review. For the same period, the Fund under-performed the +29.19% total return of the Russell 1000® Growth Index, which measures performance of the largest companies in the Russell 3000® Index with higher price-to-book ratios and higher forecasted growth values.1 Also for comparison, the Fund underperformed the broad U.S. stock market as measured by the +30.20% total return of the Standard & Poor’s® 500 Index (S&P 500®), and underperformed domestic and international-based stocks as measured by the NASDAQ Composite Index’s +30.53% total return.1 You can find the Fund’s long-term performance data in the Performance Summary beginning on page 8.
Investment Strategy
We use fundamental, bottom-up research to seek companies meeting our criteria of growth potential, quality and valuation. In seeking sustainable growth characteristics, we look for companies we believe can produce sustainable earnings and cash flow growth, evaluating the long-term market opportunity and competitive structure of an industry to target leaders and emerging leaders. We define quality companies as those with strong and improving competitive positions in attractive markets. We also believe important attributes of quality are experienced and talented management teams as well as financial strength reflected in the capital structure, gross and operating margins, free cash flow
1. Source: © 2012 Morningstar. All Rights Reserved. The information contained herein: (1) is proprietary to Morningstar and/or its content providers; (2) may not be copied or distributed; and (3) is not warranted to be accurate, complete or timely. Neither Morningstar nor its content providers are responsible for any damages or losses arising from any use of this information. Russell 1000® and Russell 3000® are trademarks of the Frank Russell Company. STANDARD & POOR’S®, S&P® and S&P 500® are registered trademarks of Standard & Poor’s Financial Services LLC. The indexes are unmanaged and include reinvested dividends. One cannot invest directly in an index, and an index is not representative of the Fund’s portfolio.
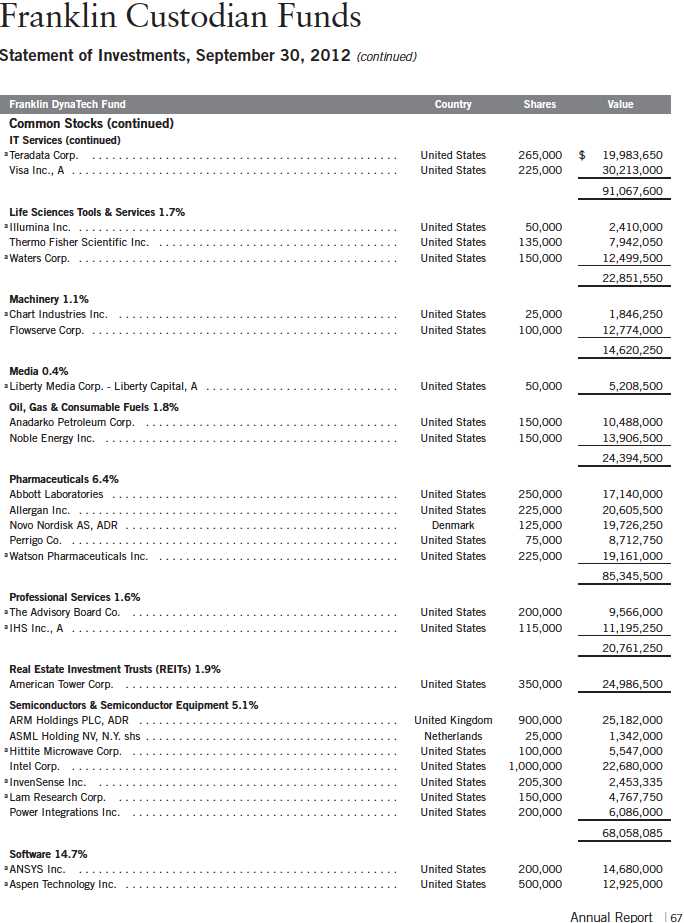
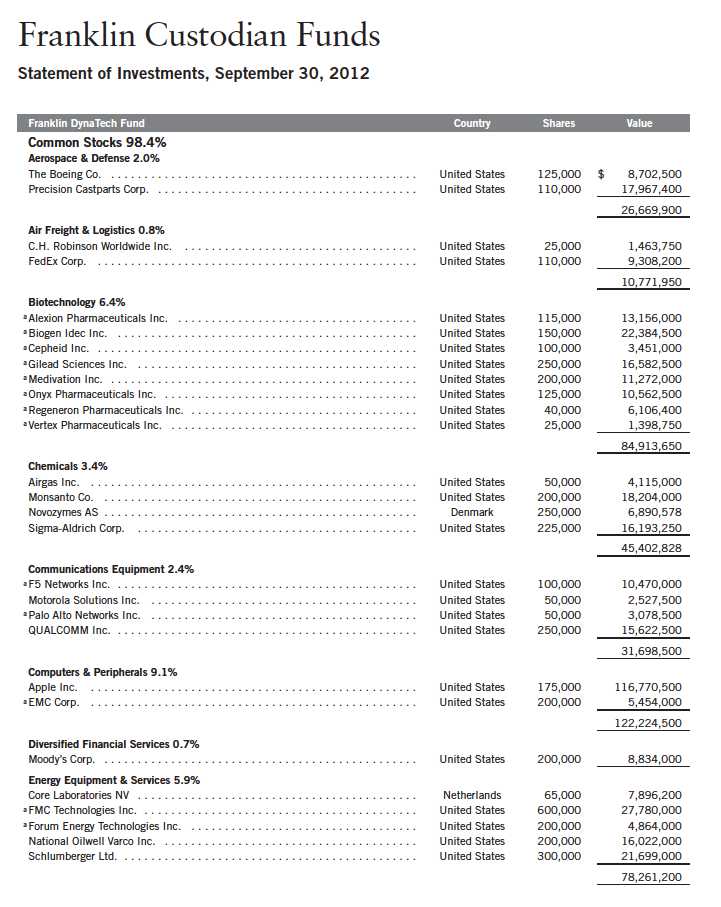
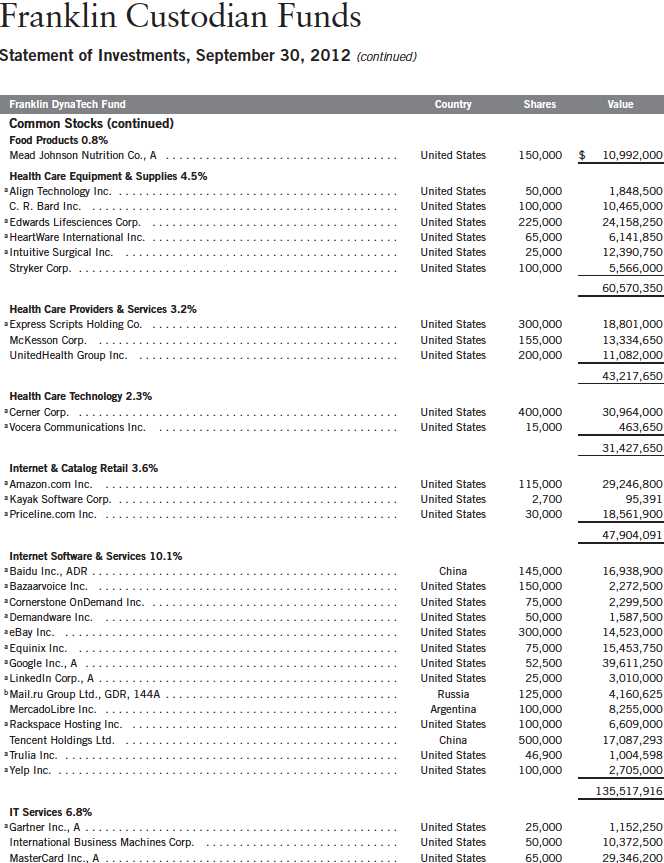
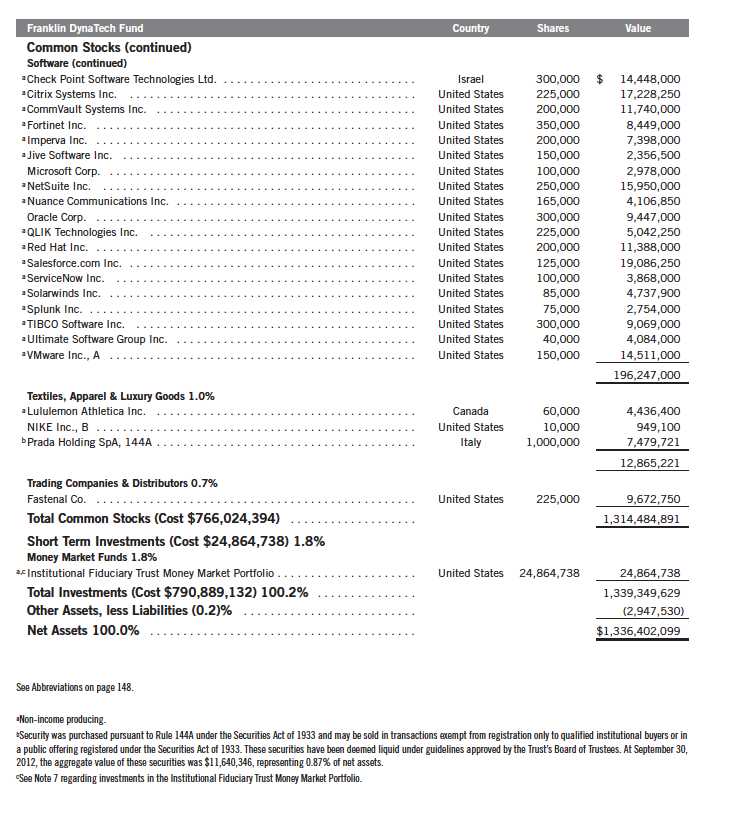
The dollar value, number of shares or principal amount, and names of all portfolio holdings are listed in the Fund’s Statement of Investments (SOI). The SOI begins on page 65.
Annual Report | 5
generation and returns on capital employed. Our valuation analysis includes a range of potential outcomes based on an assessment of multiple scenarios. In assessing value, we consider whether security prices fully reflect the balance of the sustainable growth opportunities relative to business and financial risks.
Manager’s Discussion
The Fund’s information technology (IT) sector drove absolute performance during the reporting period, a combination of our holdings’ robust performance and the Fund’s sizable sector allocation.2 As in recent reporting periods, personal computing and mobile communication device manufacturer Apple was a standout performer and led contributors. During the 12 months ended June 30, 2012, Apple reported year-over-year quarterly sales increases for iPads, iPhones and Macs. iPads and iPhones delivered some triple-digit percentage sales increases, and all three products reached all-time sales records for the quarter ended December 31, 2011. Apple also declared its first quarterly cash dividend in over 16 years and released its new iPhone 5. Payment technology firms Visa and MasterCard also benefited Fund performance, as did web search and advertising innovator Google. Google acquired smartphone and tablet maker Motorola Mobility in May and had strong quarterly earnings during the period. Positions in the health care and energy sectors also generated strong returns, led by pharmacy benefit management company Express Scripts Holdings and by FMC Technologies, a technology products and services provider for the oil and gas industry.3
Although healthy gains for most equities characterized the 12-month period and the IT sector was positive for performance overall, certain Fund holdings in the IT sector declined in value and weighed on performance, such as enterprise data integration and quality software and services provider Informatica, which fell short of its second-quarter earnings estimate due to weak European demand. Other detractors included social networking service Facebook, mobile advertising platform company Millennial Media and electronic commerce provider Rakuten. Patent risk solutions provider RPX in the industrials sector also hindered performance. We sold these holdings by fiscal year-end.
2. The IT sector comprises communications equipment, computers and peripherals, Internet software and services, IT services, semiconductors and semiconductor equipment, and software in the SOI.
3. The health care sector comprises biotechnology, health care equipment and supplies, health care providers and services, health care technology, life sciences tools and services, and pharmaceuticals in the SOI. The energy sector comprises energy equipment and services; and oil, gas and consumable fuels in the SOI.
6 | Annual Report
As managers of Franklin DynaTech Fund, at period-end we were encouraged by the relative abundance of leading science and technology companies that we believe have strong long-term growth prospects trading at what we perceive to be attractive valuations. We believe it is these innovative, thought-leading companies that may promote economic advancement over the longer term.
Thank you for your continued participation in Franklin DynaTech Fund.
We look forward to serving your future investment needs.

The foregoing information reflects our analysis, opinions and portfolio holdings as of September 30, 2012, the end of the reporting period. The way we implement our main investment strategies and the resulting portfolio holdings may change depending on factors such as market and economic conditions. These opinions may not be relied upon as investment advice or an offer for a particular security. The information is not a complete analysis of every aspect of any market, country, industry, security or the Fund. Statements of fact are from sources considered reliable, but the investment manager makes no representation or warranty as to their completeness or accuracy. Although historical performance is no guarantee of future results, these insights may help you understand our investment management philosophy.
Annual Report | 7
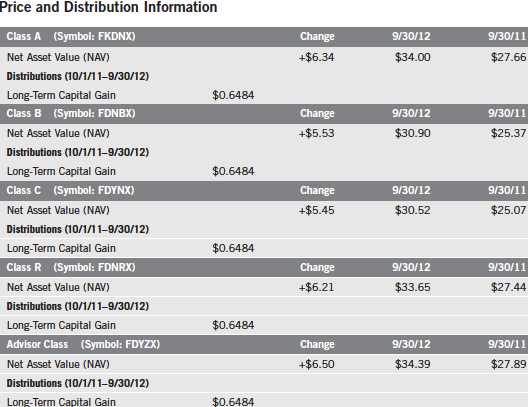
Performance Summary as of 9/30/12
Franklin DynaTech Fund
Your dividend income will vary depending on dividends or interest paid by securities in the Fund’s portfolio, adjusted for operating expenses of each class. Capital gain distributions are net profits realized from the sale of portfolio securities. The performance table and graphs do not reflect any taxes that a shareholder would pay on Fund dividends, capital gain distributions, if any, or any realized gains on the sale of Fund shares. Total return reflects reinvestment of the Fund’s dividends and capital gain distributions, if any, and any unrealized gains or losses.
8 | Annual Report
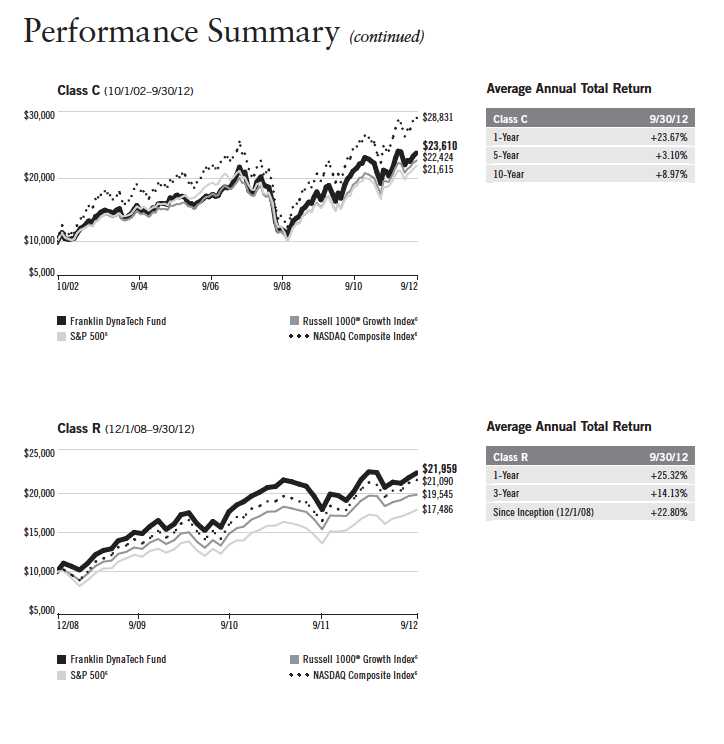
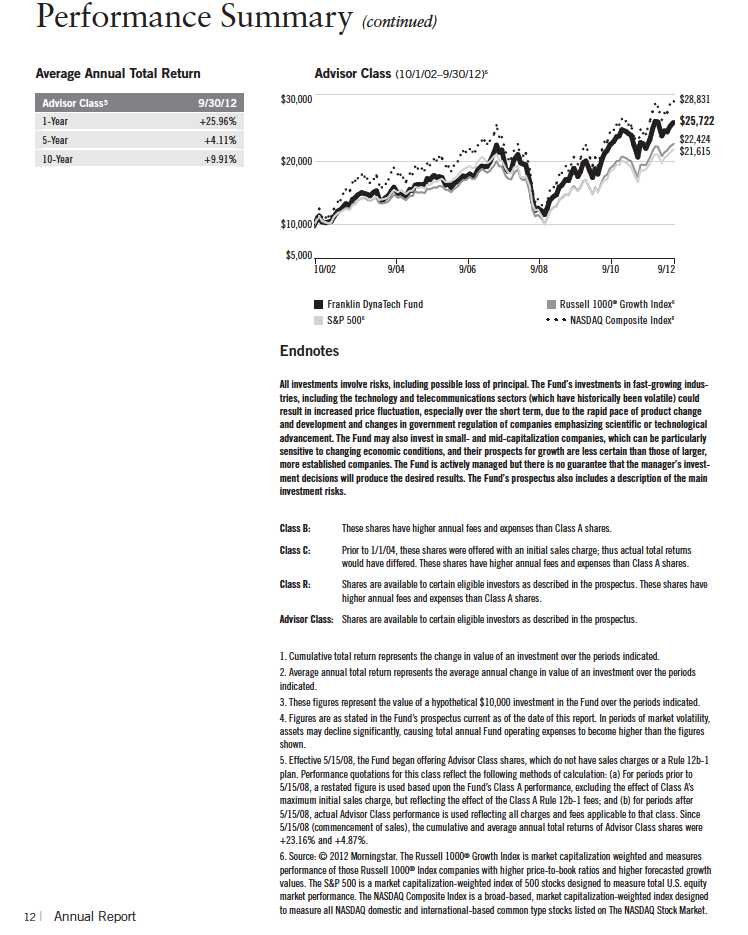
Performance Summary (continued)
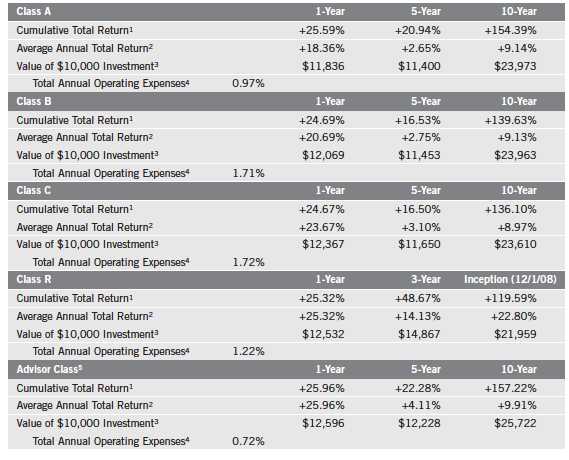
Performance
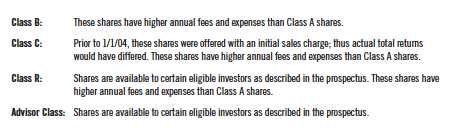
Cumulative total return excludes sales charges. Average annual total returns and value of $10,000 investment include maximum sales charges. Class A: 5.75% maximum initial sales charge; Class B: contingent deferred sales charge (CDSC) declining from 4% to 1% over six years, and eliminated thereafter; Class C: 1% CDSC in first year only;
Class R/Advisor Class: no sales charges.
Performance data represent past performance, which does not guarantee future results. Investment return and principal value will fluctuate, and you may have a gain or loss when you sell your shares. Current performance may differ from figures shown. For most recent month-end performance, go to franklintempleton.com or call (800) 342-5236.
Annual Report | 9
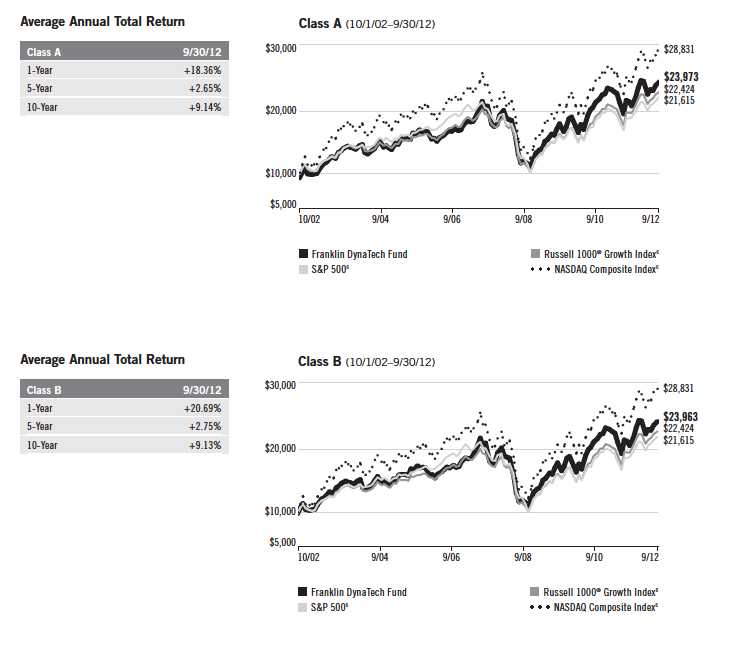
Performance Summary (continued)
Total Return Index Comparison for a Hypothetical $10,000 Investment
Total return represents the change in value of an investment over the periods shown. It includes any current, applicable, maximum sales charge, Fund expenses, account fees and reinvested distributions. The unmanaged indexes include reinvestment of any income or distributions. They differ from the Fund in composition and do not pay management fees or expenses. One cannot invest directly in an index.
10 | Annual Report
Annual Report | 11
Your Fund’s Expenses
Franklin DynaTech Fund
As a Fund shareholder, you can incur two types of costs:
- Transaction costs, including sales charges (loads) on Fund purchases; and
- Ongoing Fund costs, including management fees, distribution and service (12b-1) fees, and other Fund expenses. All mutual funds have ongoing costs, sometimes referred to as operating expenses.
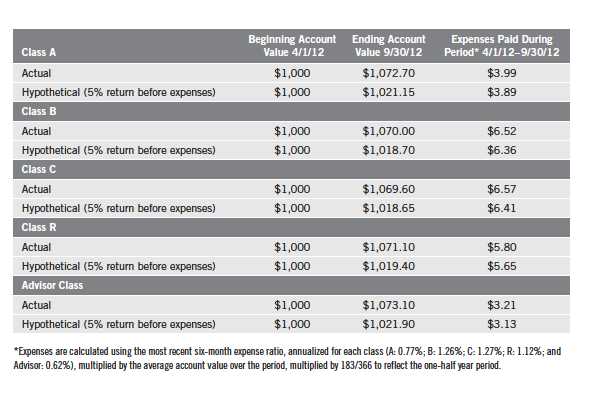
The following table shows ongoing costs of investing in the Fund and can help you understand these costs and compare them with those of other mutual funds. The table assumes a $1,000 investment held for the six months indicated.
Actual Fund Expenses
The first line (Actual) for each share class listed in the table provides actual account values and expenses. The “Ending Account Value” is derived from the Fund’s actual return, which includes the effect of Fund expenses.
You can estimate the expenses you paid during the period by following these steps. Of course, your account value and expenses will differ from those in this illustration:
| 1. | Divide your account value by $1,000. |
| | If an account had an $8,600 value, then $8,600 ÷ $1,000 = 8.6. |
| 2. | Multiply the result by the number under the heading “Expenses Paid During Period.” |
| | If Expenses Paid During Period were $7.50, then 8.6 x $7.50 = $64.50. |
In this illustration, the estimated expenses paid this period are $64.50.
Hypothetical Example for Comparison with Other Funds
Information in the second line (Hypothetical) for each class in the table can help you compare ongoing costs of investing in the Fund with those of other mutual funds. This information may not be used to estimate the actual ending account balance or expenses you paid during the period. The hypothetical “Ending Account Value” is based on the actual expense ratio for each class and an assumed 5% annual rate of return before expenses, which does not represent the Fund’s actual return. The figure under the heading “Expenses Paid During Period” shows the hypothetical expenses your account would have incurred under this scenario. You can compare this figure with the 5% hypothetical examples that appear in shareholder reports of other funds.
Annual Report | 13
Your Fund’s Expenses (continued)
Please note that expenses shown in the table are meant to highlight ongoing costs and do not reflect any transaction costs, such as sales charges. Therefore, the second line for each class is useful in comparing ongoing costs only, and will not help you compare total costs of owning different funds. In addition, if transaction costs were included, your total costs would have been higher. Please refer to the Fund prospectus for additional information on operating expenses.
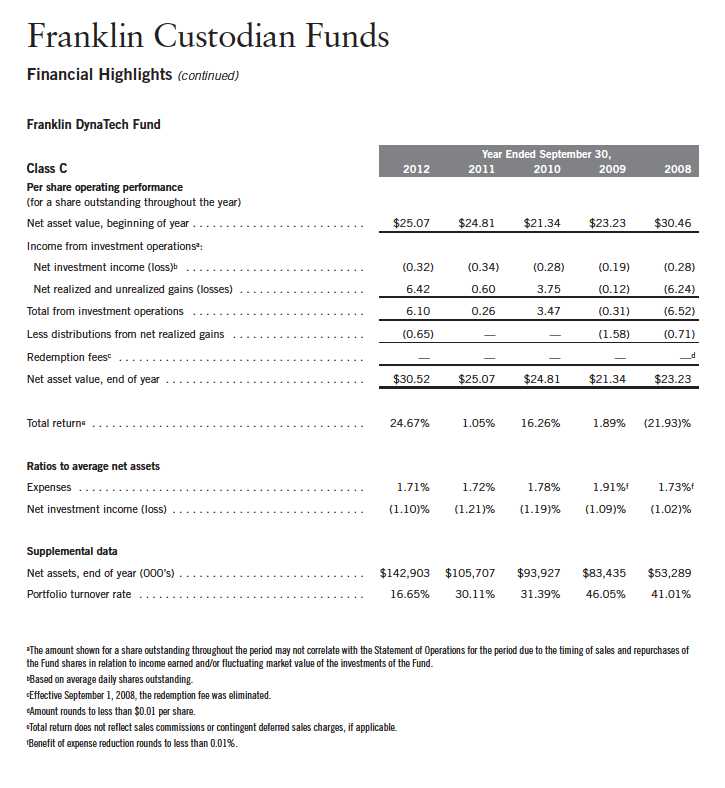
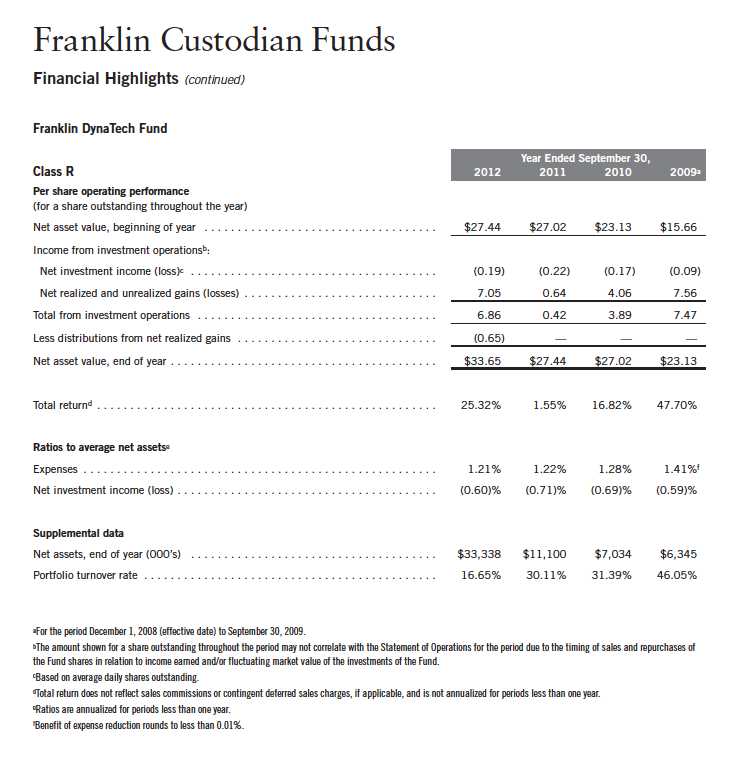
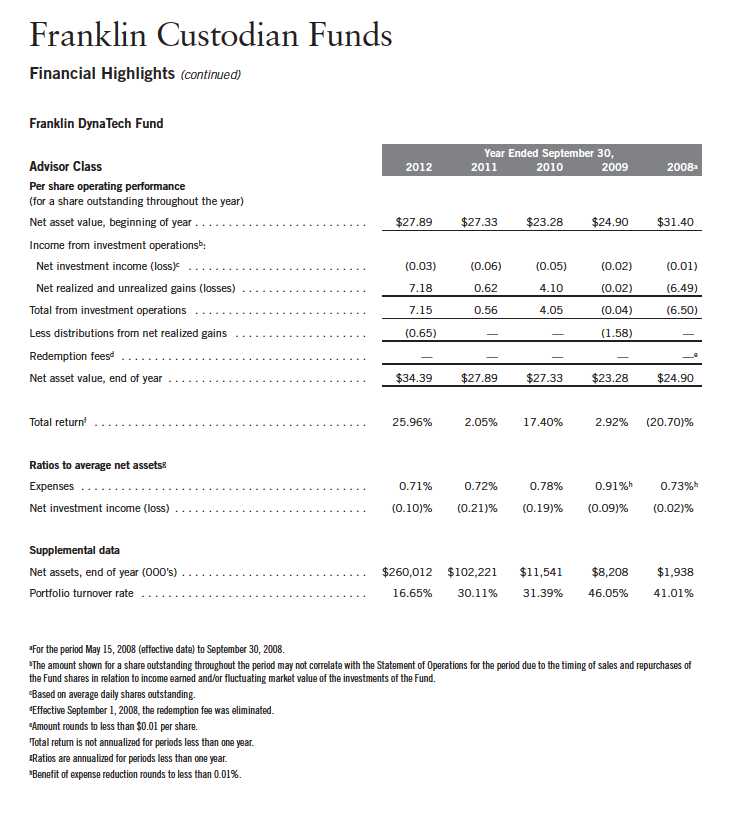
*Expenses are calculated using the most recent six-month expense ratio, annualized for each class (A: 0.96%; B: 1.72%; C: 1.71%; R: 1.21%; and Advisor: 0.71%), multiplied by the average account value over the period, multiplied by 183/366 to reflect the one-half year period.
14 | Annual Report
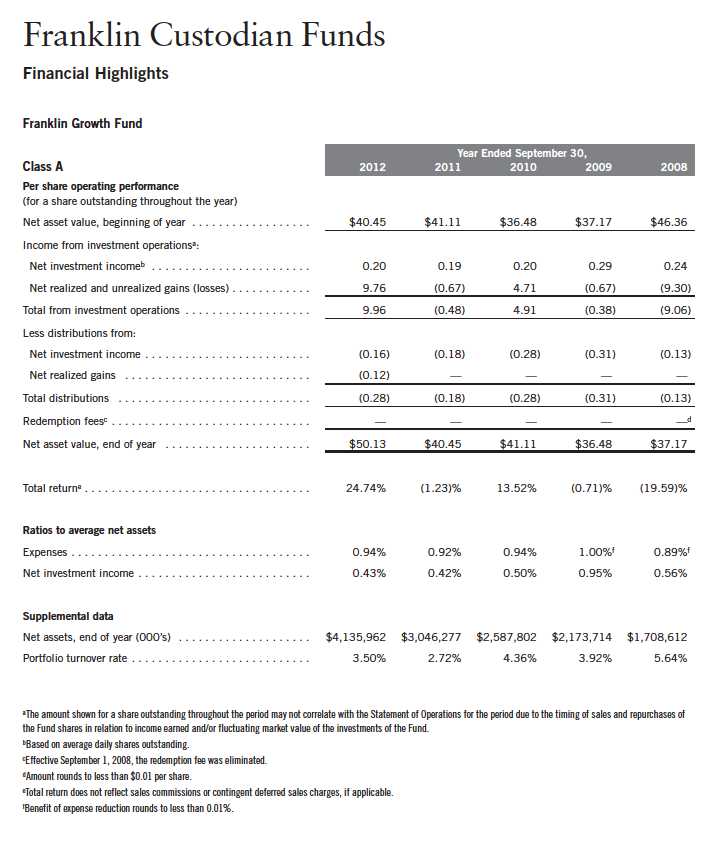
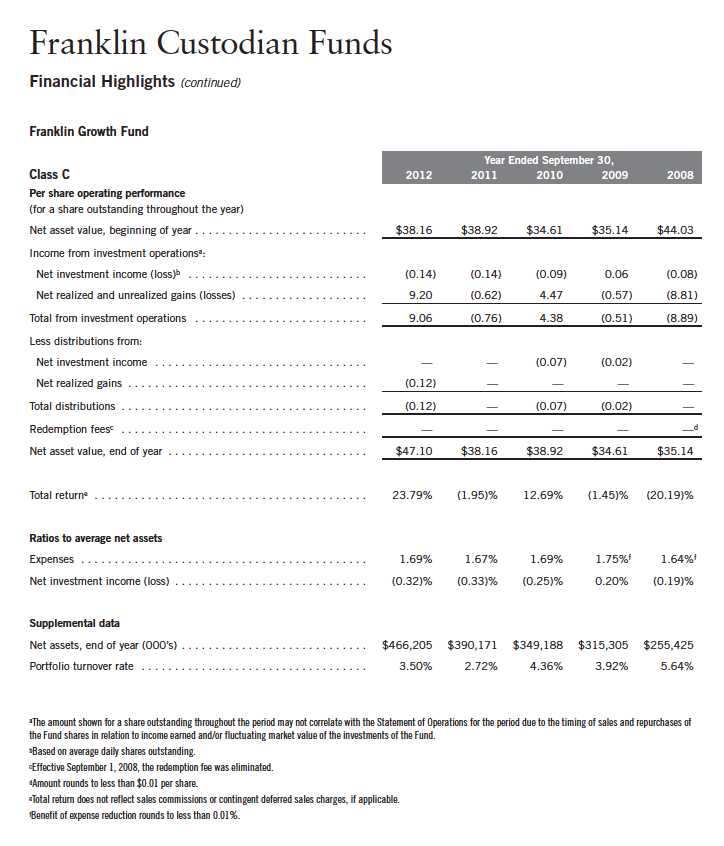
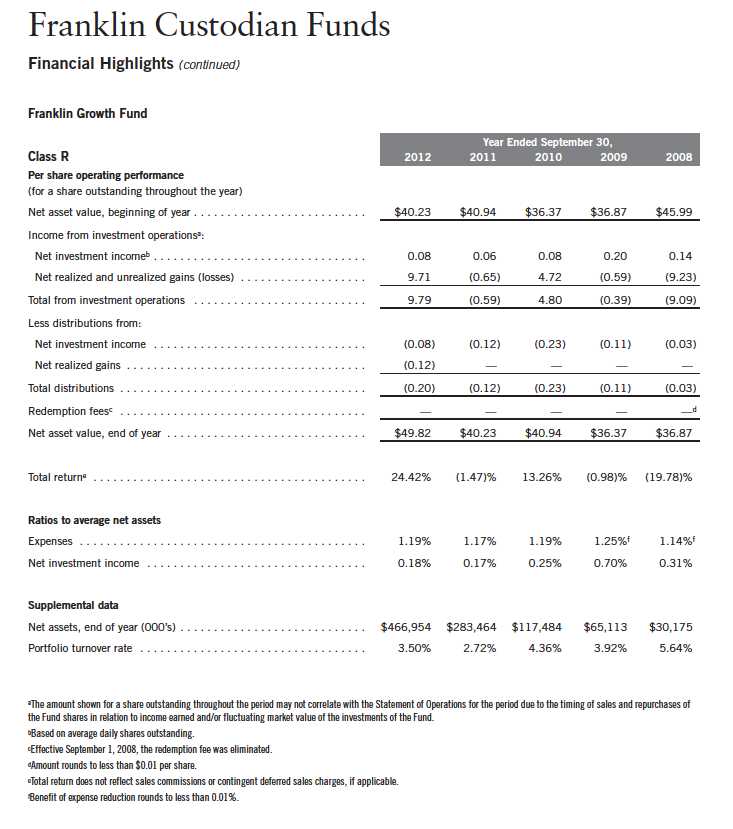
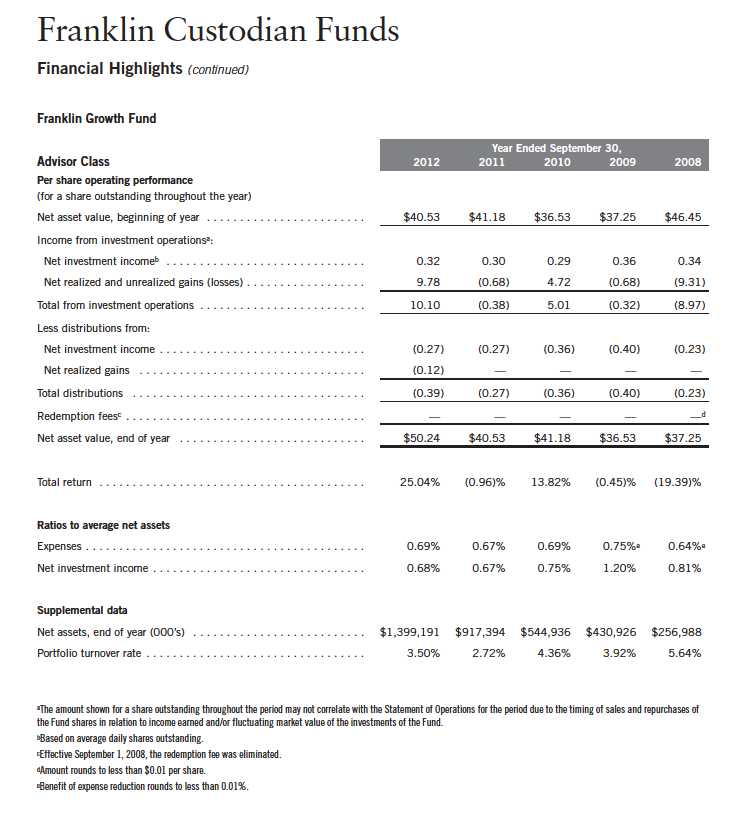
Franklin Growth Fund
Your Fund’s Goal and Main Investments: Franklin Growth Fund seeks capital appreciation
by investing substantially in equity securities of companies that are leaders in their industries.
Performance data represent past performance, which does not guarantee future results. Investment return and principal value will fluctuate, and you may have a gain or loss when you sell your shares. Current performance may differ from figures shown. Please visit franklintempleton.com or call (800) 342-5236 for most recent month-end performance.
This annual report for Franklin Growth Fund covers the fiscal year ended September 30, 2012.
Performance Overview
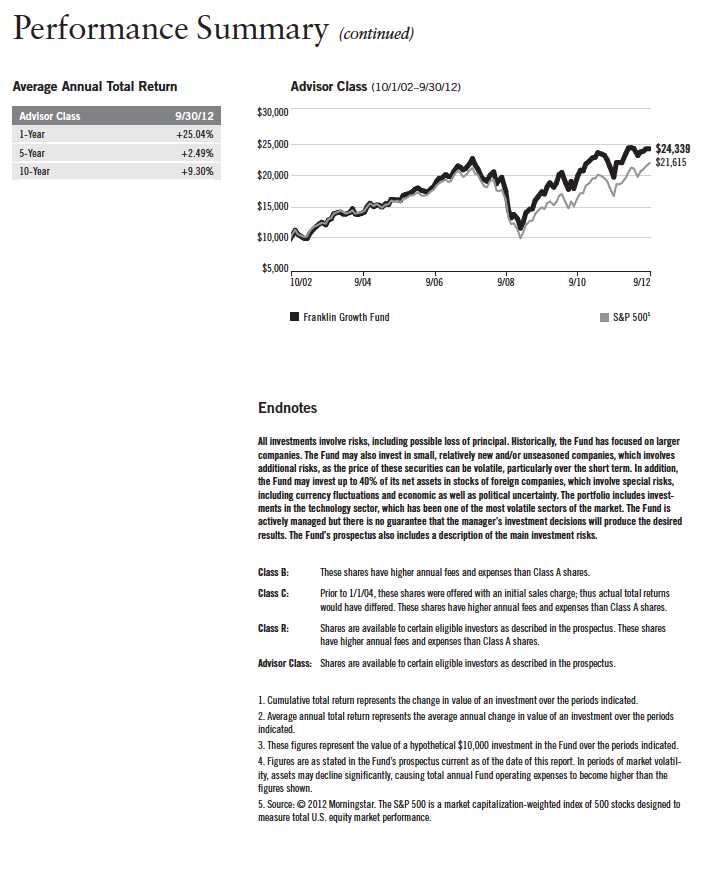
Franklin Growth Fund – Class A delivered a +24.74% cumulative total return for the 12 months under review. The Fund underperformed the +30.20% total return of its benchmark, the Standard & Poor’s 500 Index (S&P 500), which is a broad measure of U.S. stock performance.1 You can find the Fund’s long-term performance data in the Performance Summary beginning on page 18.
Investment Strategy
We use fundamental, bottom-up research to seek companies meeting our criteria of growth potential, quality and valuation. In seeking sustainable growth characteristics, we look for companies we believe can produce sustainable earnings and cash flow growth, evaluating the long-term market opportunity and competitive structure of an industry to target leaders and emerging leaders. We define quality companies as those with strong and improving competitive positions in attractive markets. We also believe important attributes of quality are experienced and talented management teams as well as financial strength reflected in the capital structure, gross and operating margins, free cash flow generation and returns on capital employed. Our valuation analysis includes a range of potential outcomes based on an assessment of multiple scenarios. In assessing value, we consider whether security prices fully reflect the balance of the sustainable growth opportunities relative to business and financial risks.
1. Source: © 2012 Morningstar. All Rights Reserved. The information contained herein: (1) is proprietary to Morningstar and/or its content providers; (2) may not be copied or distributed; and (3) is not warranted to be accurate, complete or timely. Neither Morningstar nor its content providers are responsible for any damages or losses arising from any use of this information. The index is unmanaged and includes reinvested dividends. One cannot invest directly in an index, and an index is not representative of the Fund’s portfolio.
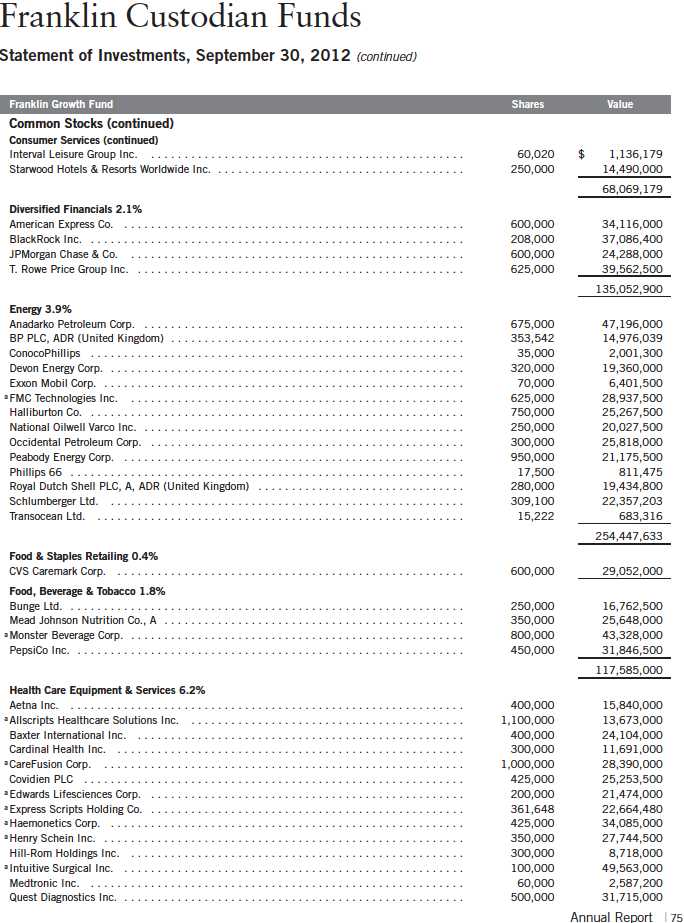
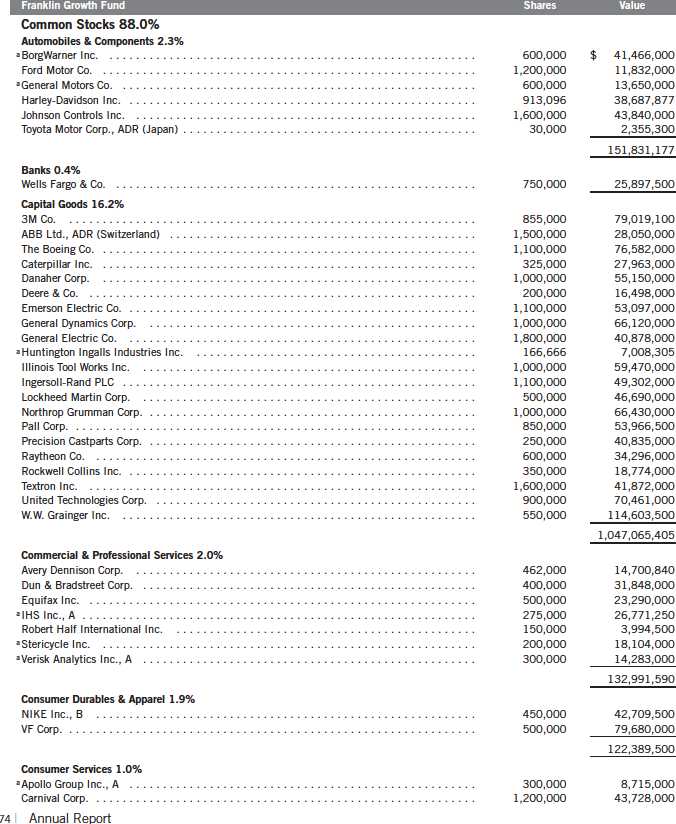
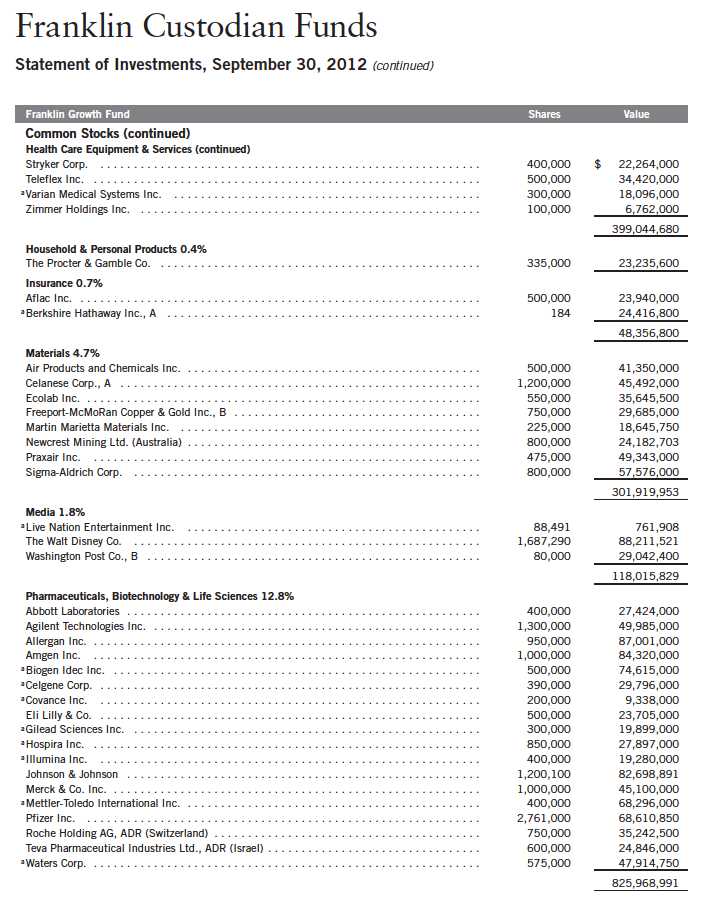
The dollar value, number of shares or principal amount, and names of all portfolio holdings are listed in the Fund’s Statement of Investments (SOI). The SOI begins on page 74.
Annual Report | 15
Manager’s Discussion
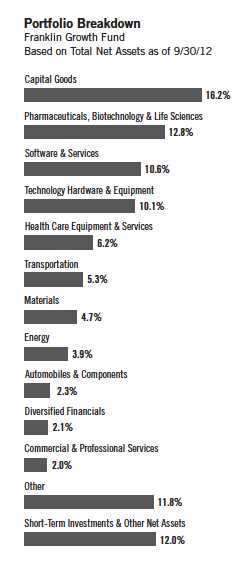
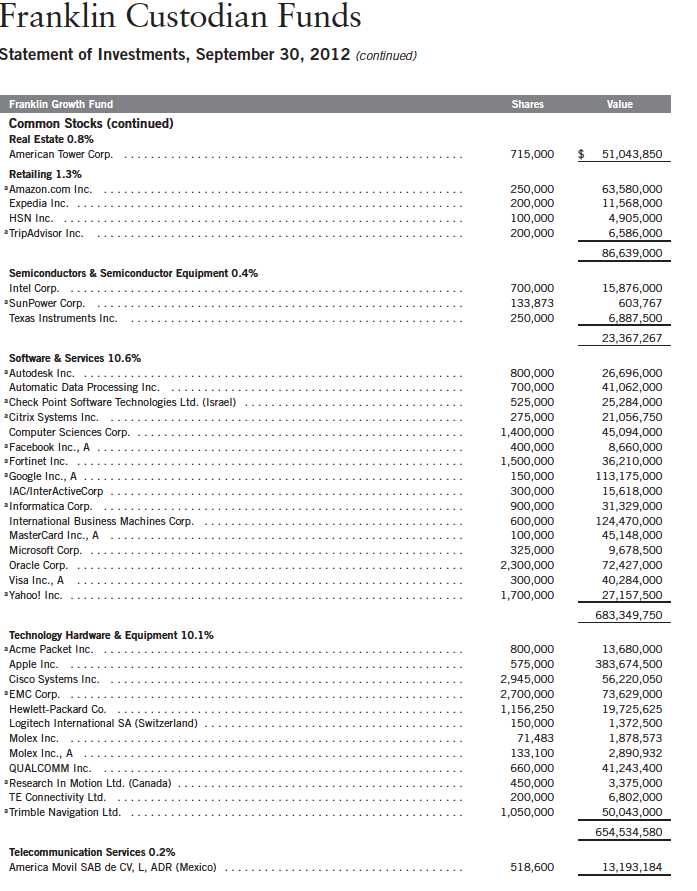
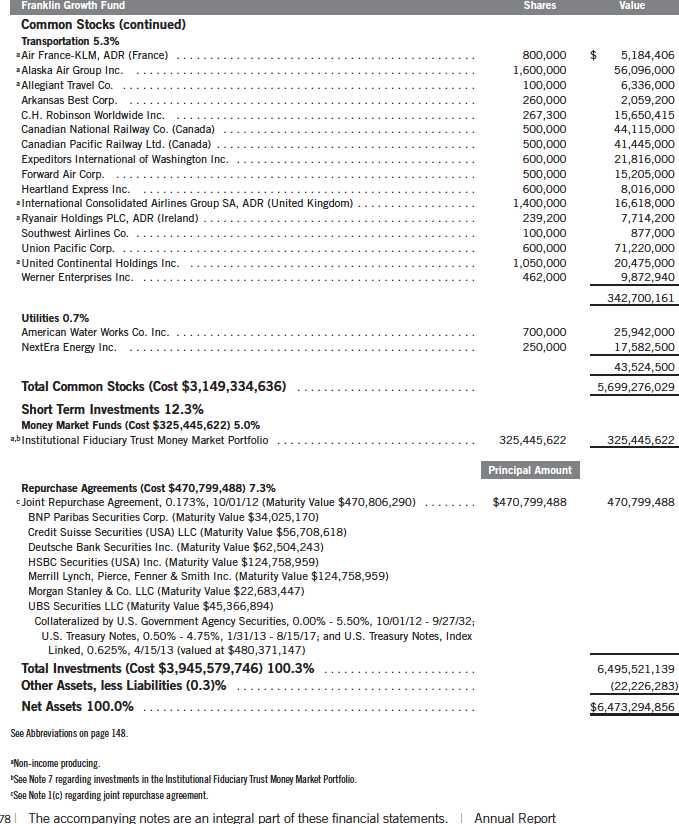
Franklin Growth Fund owned shares of 168 companies at period-end. We continue to invest in a broad array of companies of all sizes and in varied industries.
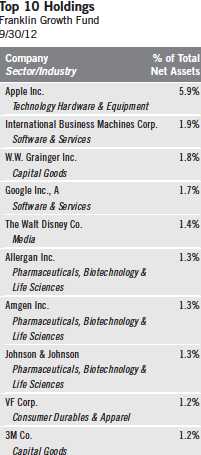
During the 12 months under review, the Fund’s holdings in the industrials, information technology (IT) and health care sectors made key contributions to absolute performance.2 Industrial supply company W.W. Grainger was a robust performer in the industrials sector. W.W. Grainger’s sales and earnings increased in 2012 aided by acquisitions and improved profit margins. Railroad freight transporter Union Pacific reported double-digit growth in quarterly earnings during the period. As in recent reporting periods, in the IT sector, personal computing and mobile communication device manufacturer Apple was a standout performer. During the 12 months ended June 30, 2012, Apple reported year-over-year quarterly sales increases for iPads, iPhones and Macs. iPads and iPhones delivered some triple-digit percentage sales increases, and all three products reached all-time sales records for the quarter ended December 31, 2011. Apple also declared its first quarterly cash dividend in over 16 years and released its new iPhone 5. Web search and advertising innovator Google acquired smartphone and tablet maker Motorola Mobility in May and had strong quarterly earnings growth during the period that benefited performance. In the health care sector, biotechnology firms Amgen and Biogen Idec experienced earnings growth. Amgen benefited from first- and second-quarter increased demand and higher prices, and Biogen Idec had strong product sales in its second quarter. Drug manufacturer Pfizer also aided Fund performance. Outside of these sectors, global entertainment and media firm Walt Disney also made a notable contribution to Fund performance as the firm’s quarterly earnings increased year-over-year and by 31% in its third quarter, ended June 30, 2012, largely due to revenue increases in its cable networks, broadcasting, parks and resorts, and consumer products.
Although the IT and health care sectors contributed to absolute performance, certain positions in these sectors detracted. Two unprofitable quarters for solar module manufacturer First Solar resulted in negative returns and we sold it. Mobile communications hardware and software solutions provider Research In Motion experienced tepid sales for its BlackBerry smartphones and PlayBook tablet computers that weighed on its share price. Network communications equipment firm Acme Packet trimmed its estimates for earnings and sales in
2. The industrials sector comprises capital goods, commercial and professional services, and transportation in the SOI. The IT sector comprises semiconductors and semiconductor equipment, software and services, and technology hardware and equipment in the SOI. The health care sector comprises health care equipment and services; and pharmaceuticals, biotechnology and life sciences in the SOI.
16 | Annual Report
2012. Enterprise data integration and quality software and services provider Informatica fell short of its second-quarter earnings estimate due to weak European demand, and social networking service Facebook also weighed on Fund performance. In health care, clinical software service provider Allscripts Healthcare Solutions lost value resulting from lower-than-expected sales and an unfavorable sales mix. Peabody Energy also hindered performance, as it experienced a second-quarter decline in operating income, partially due to lower coal and natural gas prices and expenses related to its 2011 acquisition of Macarthur Coal.
Thank you for your continued participation in Franklin Growth Fund.
We look forward to serving your future investment needs.

CFA® is a trademark owned by CFA Institute.
The foregoing information reflects our analysis, opinions and portfolio holdings as of September 30, 2012, the end of the reporting period. The way we implement our main investment strategies and the resulting portfolio holdings may change depending on factors such as market and economic conditions. These opinions may not be relied upon as investment advice or an offer for a particular security. The information is not a complete analysis of every aspect of any market, country, industry, security or the Fund. Statements of fact are from sources considered reliable, but the investment manager makes no representation or warranty as to their completeness or accuracy. Although historical performance is no guarantee of future results, these insights may help you understand our investment management philosophy.
Annual Report | 17
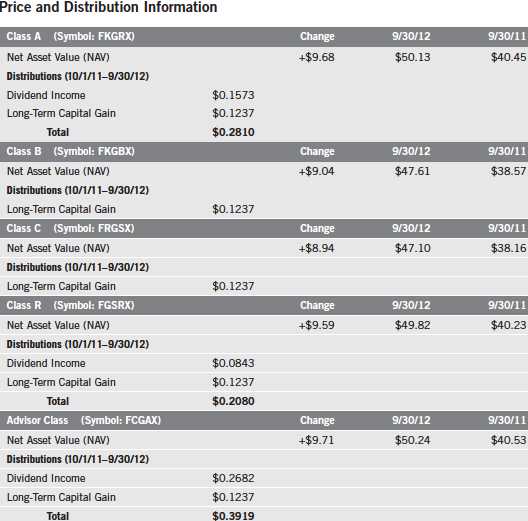
Performance Summary as of 9/30/12
Franklin Growth Fund
Your dividend income will vary depending on dividends or interest paid by securities in the Fund’s portfolio, adjusted for operating expenses of each class. Capital gain distributions are net profits realized from the sale of portfolio securities. The performance table and graphs do not reflect any taxes that a shareholder would pay on Fund dividends, capital gain distributions, if any, or any realized gains on the sale of Fund shares. Total return reflects reinvestment of the Fund’s dividends and capital gain distributions, if any, and any unrealized gains or losses.
18 | Annual Report
Performance Summary (continued)
Performance
Cumulative total return excludes sales charges. Average annual total return and value of $10,000 investment include maximum sales charges. Class A: 5.75% maximum initial sales charge; Class B: contingent deferred sales charge (CDSC) declining from 4% to 1% over six years, and eliminated thereafter; Class C: 1% CDSC in first year only;
Class R/Advisor Class: no sales charges.
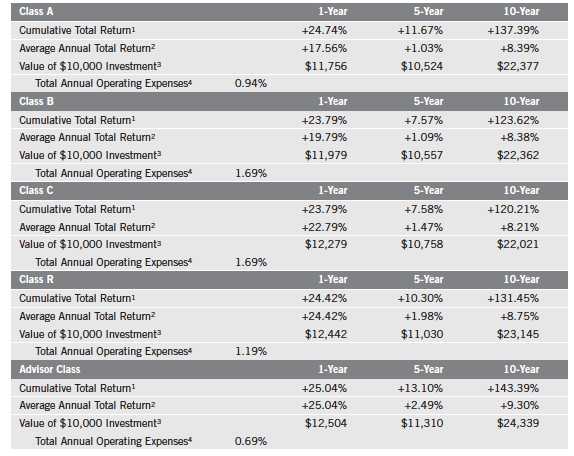
Performance data represent past performance, which does not guarantee future results. Investment return and principal value will fluctuate, and you may have a gain or loss when you sell your shares. Current performance may differ from figures shown. For most recent month-end performance, go to franklintempleton.com or call (800) 342-5236.
Annual Report | 19
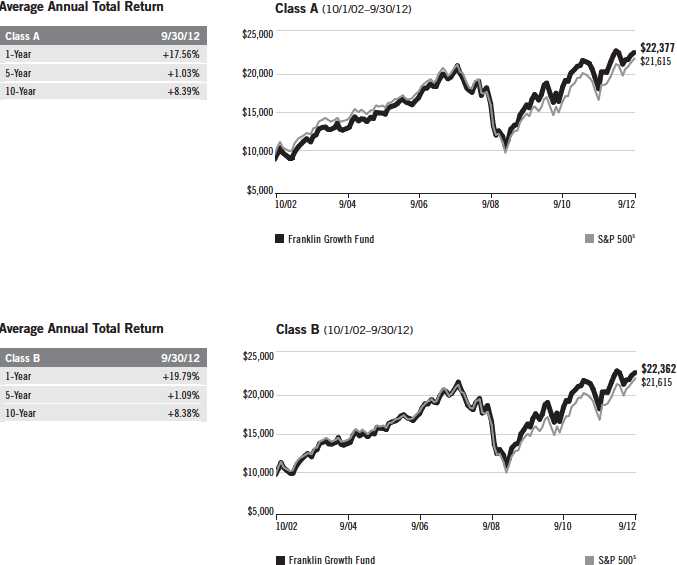
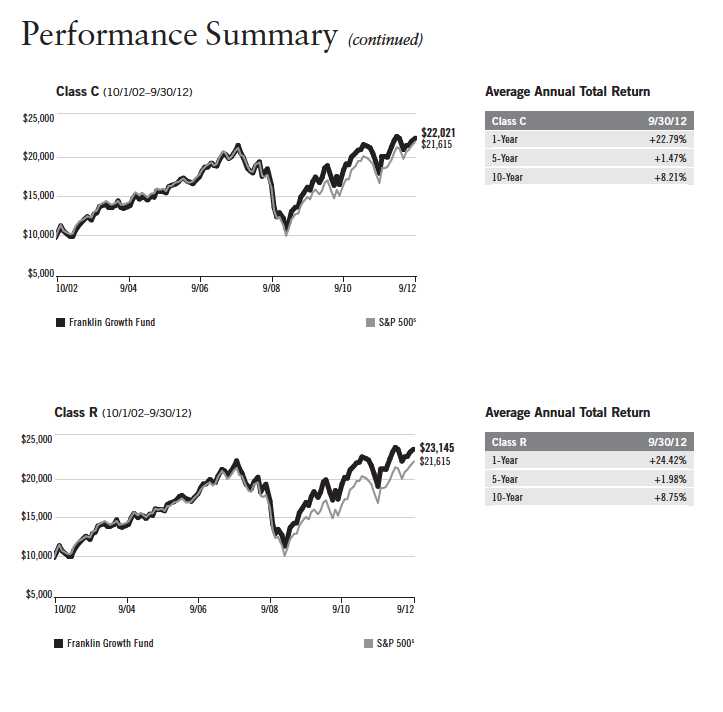
Performance Summary (continued)
Total Return Index Comparison for a Hypothetical $10,000 Investment
Total return represents the change in value of an investment over the periods shown. It includes any current, applicable, maximum sales charge, Fund expenses, account fees and reinvested distributions. The unmanaged index includes reinvestment of any income or distributions. It differs from the Fund in composition and does not pay management fees or expenses. One cannot invest directly in an index.
20 | Annual Report
Annual Report | 21
22 | Annual Report
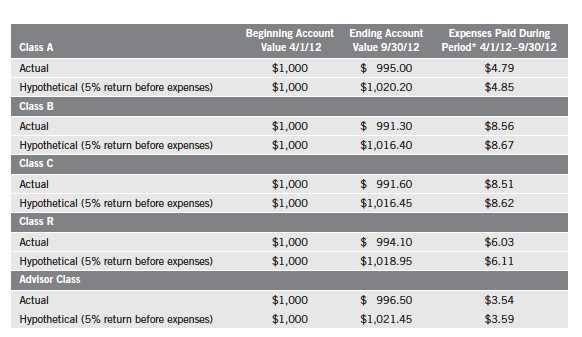
Your Fund’s Expenses
Franklin Growth Fund
As a Fund shareholder, you can incur two types of costs:
- Transaction costs, including sales charges (loads) on Fund purchases; and
- Ongoing Fund costs, including management fees, distribution and service (12b-1) fees, and other Fund expenses. All mutual funds have ongoing costs, sometimes referred to as operating expenses.
The following table shows ongoing costs of investing in the Fund and can help you understand these costs and compare them with those of other mutual funds. The table assumes a $1,000 investment held for the six months indicated.
Actual Fund Expenses
The first line (Actual) for each share class listed in the table provides actual account values and expenses. The “Ending Account Value” is derived from the Fund’s actual return, which includes the effect of Fund expenses.
You can estimate the expenses you paid during the period by following these steps. Of course, your account value and expenses will differ from those in this illustration:
| 1. | Divide your account value by $1,000. |
| | If an account had an $8,600 value, then $8,600 ÷ $1,000 = 8.6. |
| 2. | Multiply the result by the number under the heading “Expenses Paid During Period.” |
| | If Expenses Paid During Period were $7.50, then 8.6 x $7.50 = $64.50. |
In this illustration, the estimated expenses paid this period are $64.50.
Hypothetical Example for Comparison with Other Funds
Information in the second line (Hypothetical) for each class in the table can help you compare ongoing costs of investing in the Fund with those of other mutual funds. This information may not be used to estimate the actual ending account balance or expenses you paid during the period. The hypothetical “Ending Account Value” is based on the actual expense ratio for each class and an assumed 5% annual rate of return before expenses, which does not represent the Fund’s actual return. The figure under the heading “Expenses Paid During Period” shows the hypothetical expenses your account would have incurred under this scenario. You can compare this figure with the 5% hypothetical examples that appear in shareholder reports of other funds.
Annual Report | 23
Your Fund’s Expenses (continued)
Please note that expenses shown in the table are meant to highlight ongoing costs and do not reflect any transaction costs, such as sales charges. Therefore, the second line for each class is useful in comparing ongoing costs only, and will not help you compare total costs of owning different funds. In addition, if transaction costs were included, your total costs would have been higher. Please refer to the Fund prospectus for additional information on operating expenses.
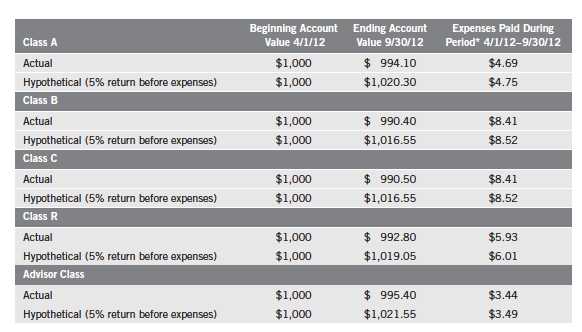
*Expenses are calculated using the most recent six-month expense ratio, annualized for each class (A: 0.94%; B: 1.69%; C: 1.69%; R: 1.19%; and Advisor: 0.69%), multiplied by the average account value over the period, multiplied by 183/366 to reflect the one-half year period.
24 | Annual Report
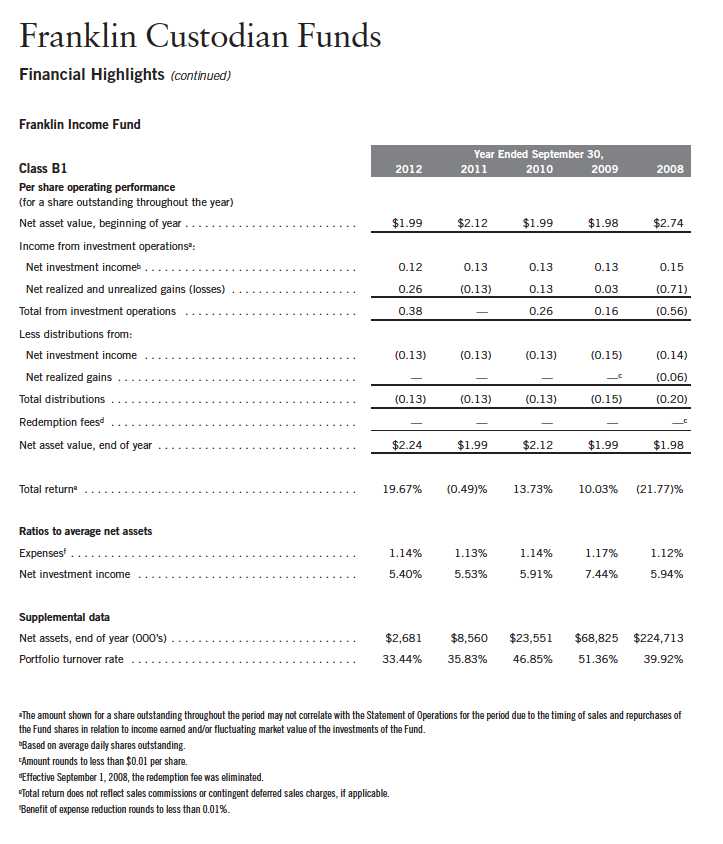
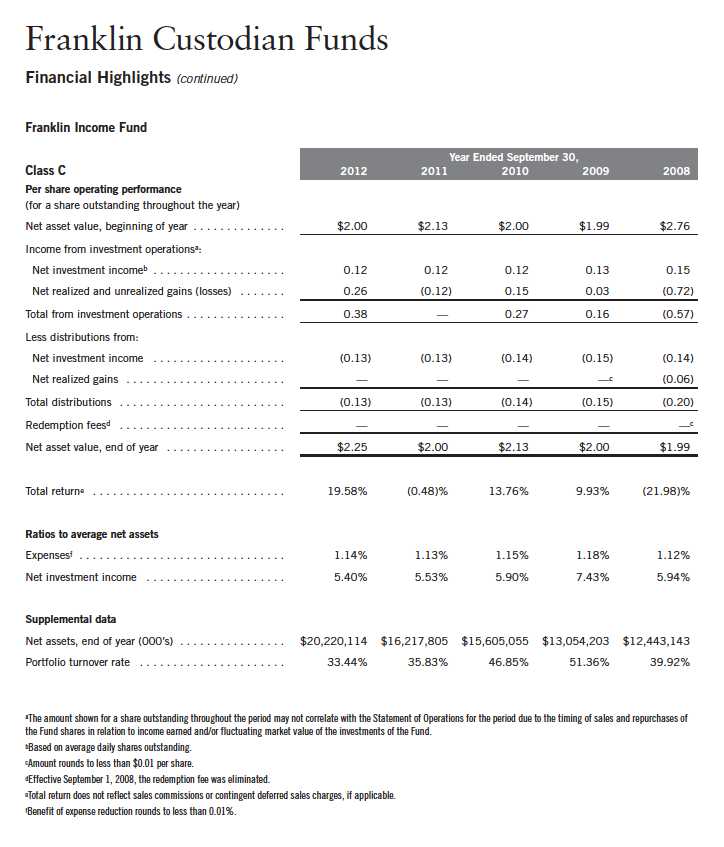
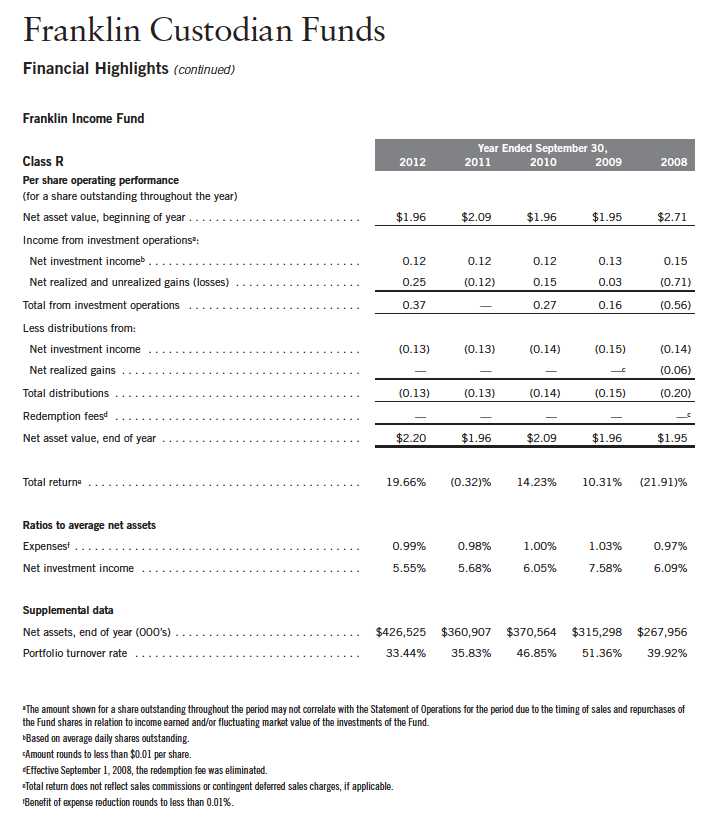
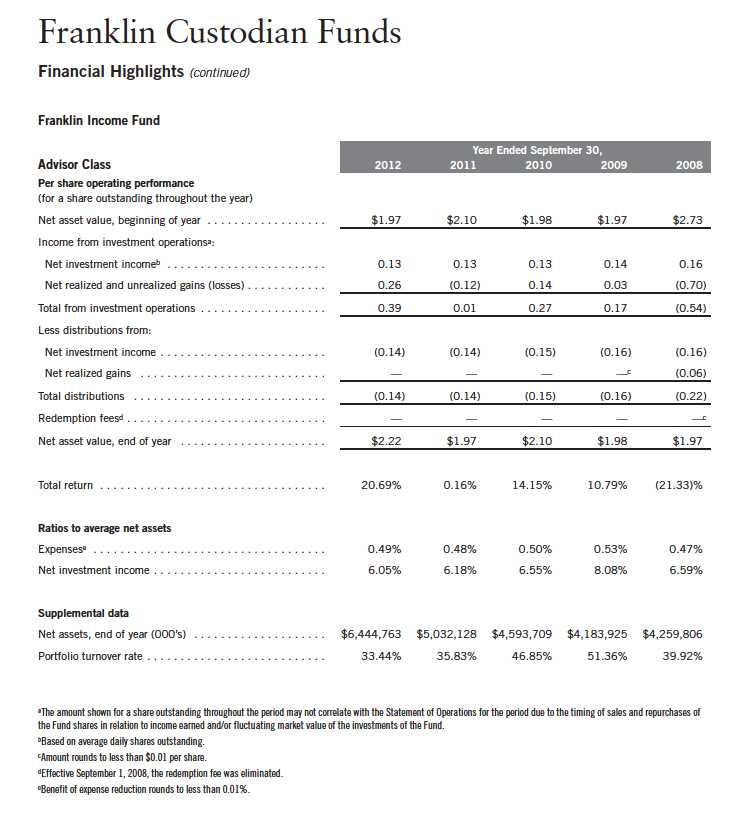
Franklin Income Fund
Your Fund’s Goal and Main Investments: Franklin Income Fund seeks to maximize
income while maintaining prospects for capital appreciation by investing, under normal market
conditions, in a diversified portfolio of debt and equity securities.
Performance data represent past performance, which does not guarantee future results. Investment return and principal value will fluctuate, and you may have a gain or loss when you sell your shares. Current performance may differ from figures shown. Please visit franklintempleton.com or call (800) 342-5236 for most recent month-end performance.
This annual report for Franklin Income Fund covers the fiscal year ended September 30, 2012.
Performance Overview
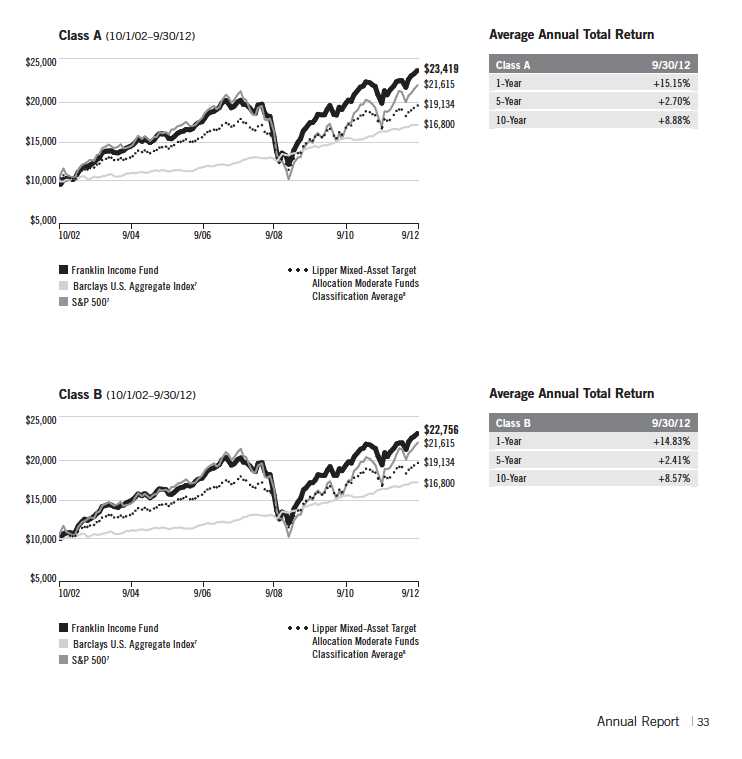
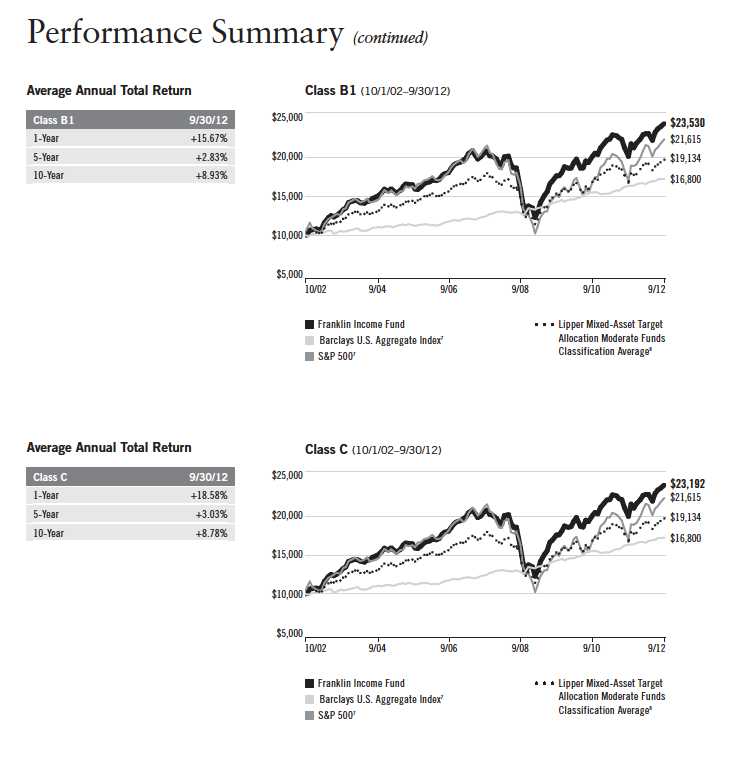
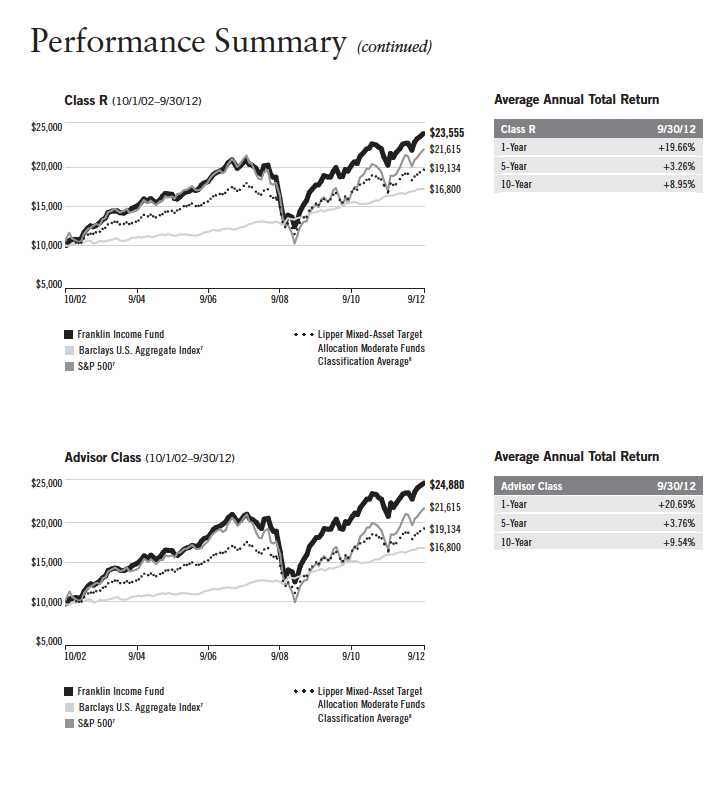
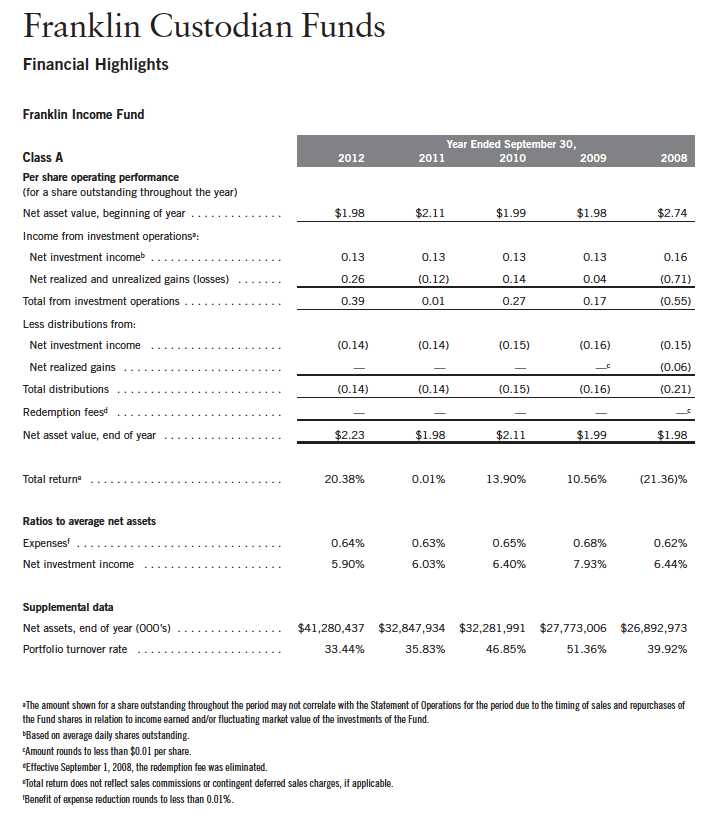
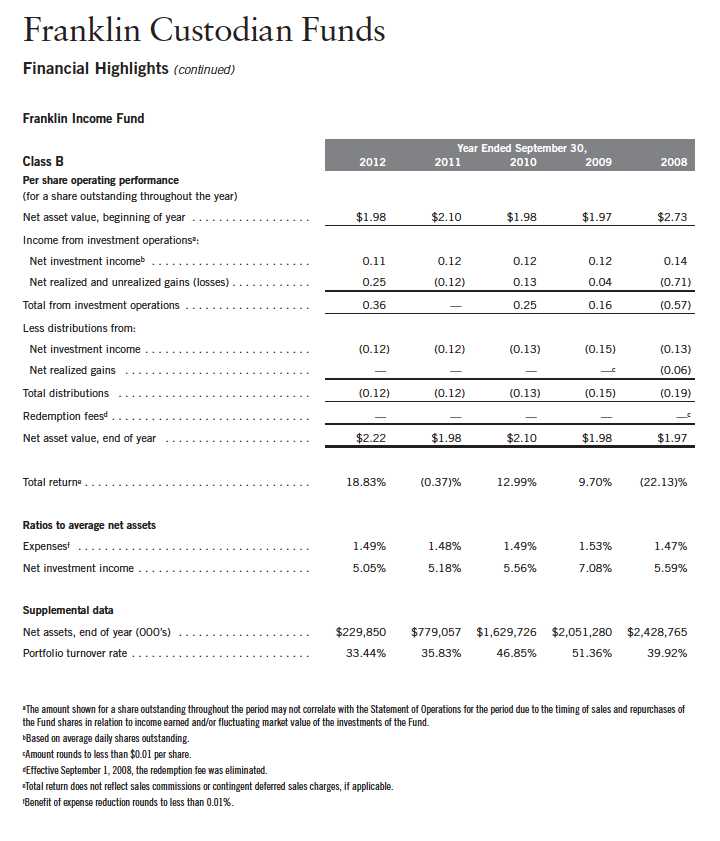
Franklin Income Fund – Class A delivered a +20.38% cumulative total return for the 12 months under review. The Fund underperformed the +30.20% total return of its equity benchmark, the Standard & Poor’s 500 Index (S&P 500), which is a broad measure of U.S. stock performance.1 The Fund outperformed the +5.16% total return of its fixed income benchmark, the Barclays U.S. Aggregate Index, which tracks the U.S. investment-grade, taxable bond market.1 The Fund also outperformed the +16.77% total return of its peers as measured by the Lipper Mixed-Asset Target Allocation Moderate Funds Classification Average, which consists of funds chosen by Lipper that, by practice, maintain a mix of 40% to 60% equity securities, with the remainder in bonds and cash.2 You can find the Fund’s long-term performance data in the Performance Summary beginning on page 30.
Investment Strategy
By generally performing independent analysis of debt, convertible and equity securities, we search for undervalued or out-of-favor securities we believe offer opportunities for income today and significant growth tomorrow. We consider such factors as a company’s experience and managerial strength; its cash flow potential and profitability; its competitive positioning and advantages; its responsiveness to changes in interest rates and business conditions; debt maturity schedules and borrowing requirements; a company’s changing financial
1. Source: © 2012 Morningstar. All Rights Reserved. The information contained herein: (1) is proprietary to Morningstar and/or its content providers; (2) may not be copied or distributed; and (3) is not warranted to be accurate, complete or timely. Neither Morningstar nor its content providers are responsible for any damages or losses arising from any use of this information.
2. Source: Lipper Inc. For the 12-month period ended 9/30/12, this category consisted of 474 funds. Lipper calculations do not include sales charges or expense subsidization by a fund’s manager. The Fund’s performance relative to the average may have differed if these and other factors had been considered.
The indexes are unmanaged and include reinvestment of any income or distributions. One cannot invest directly in an index, and an index is not representative of the Fund’s portfolio.
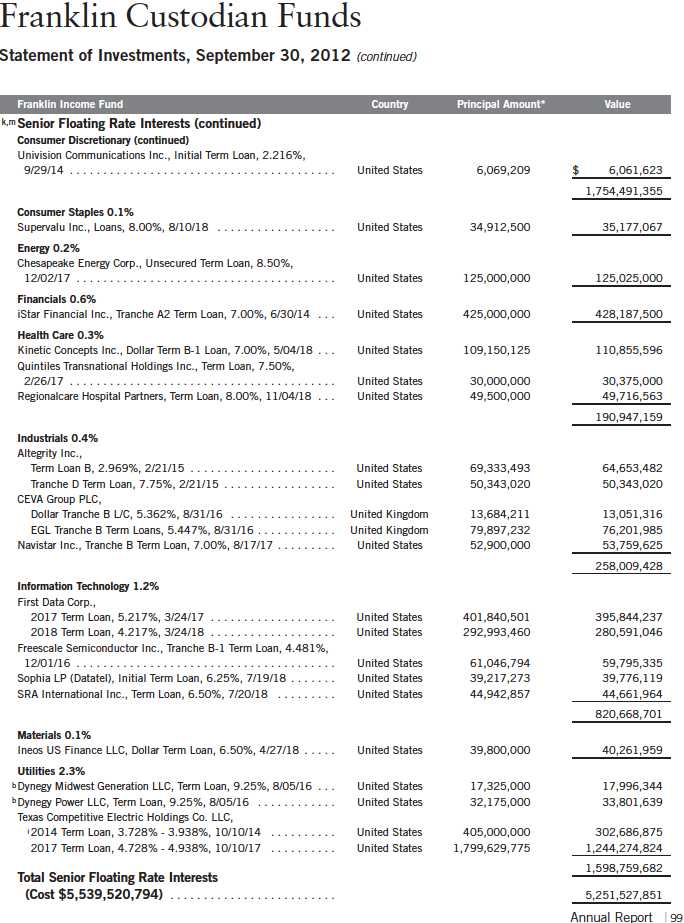
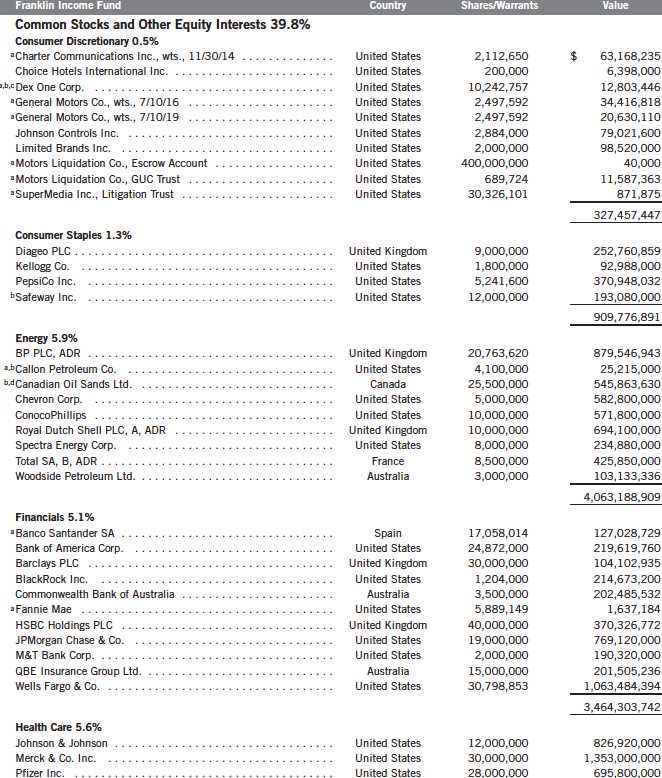
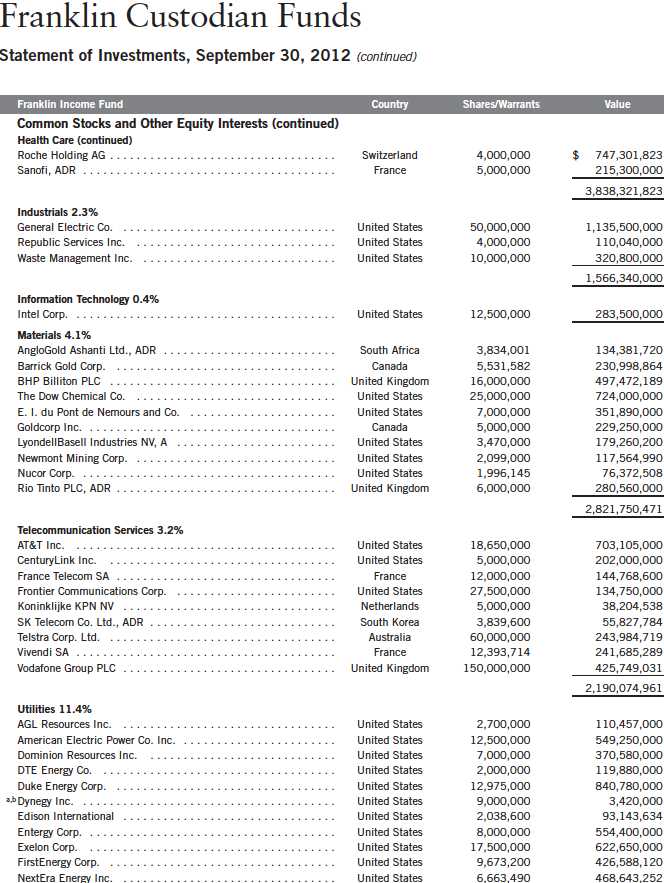
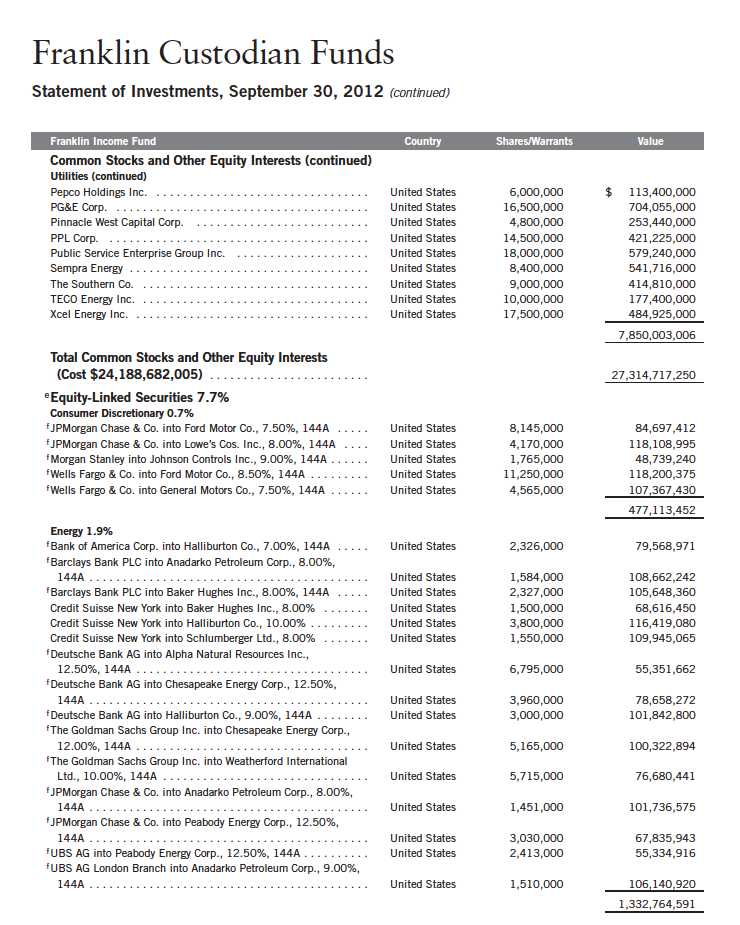
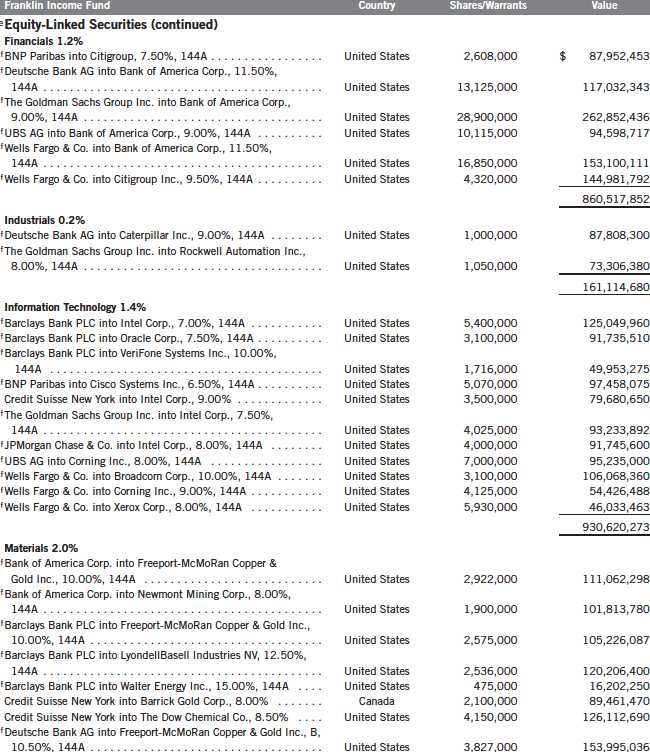
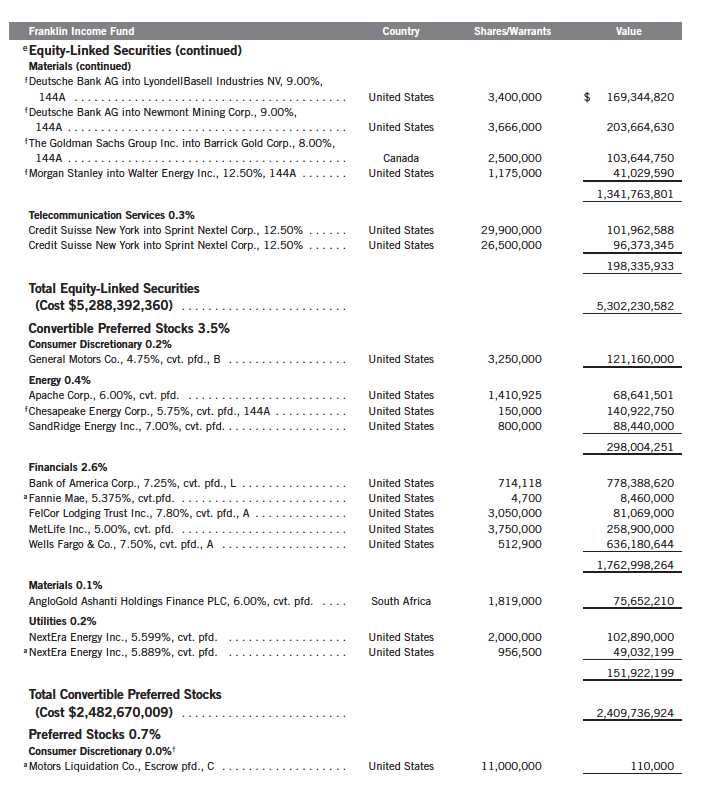
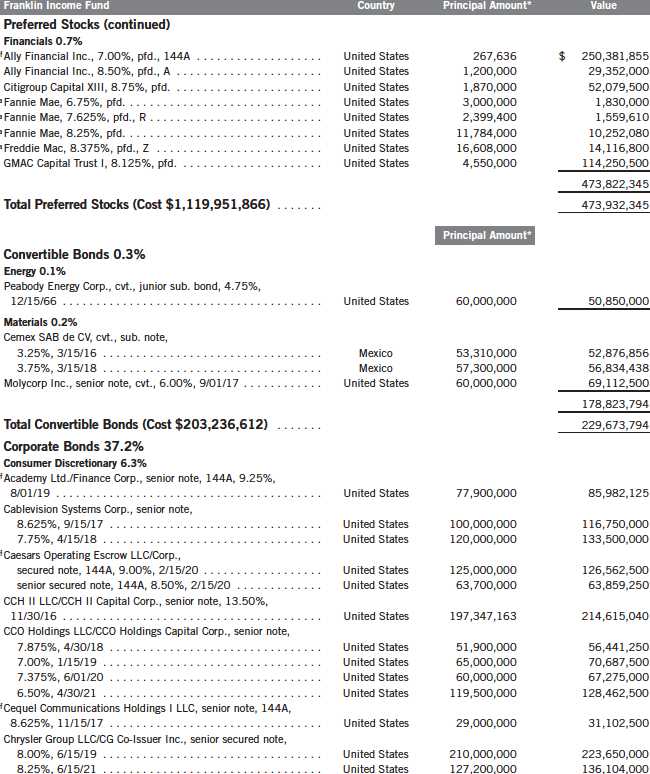
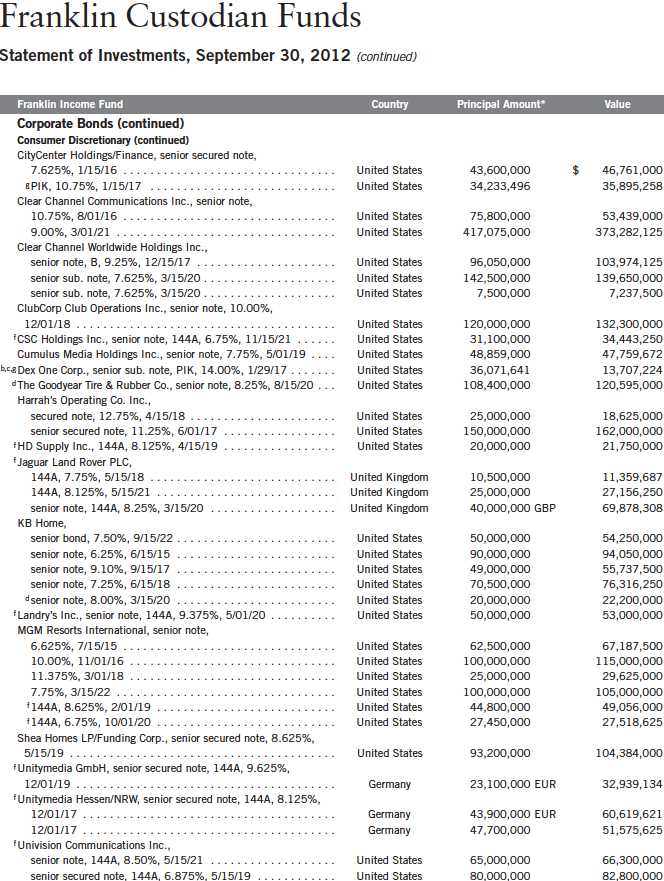
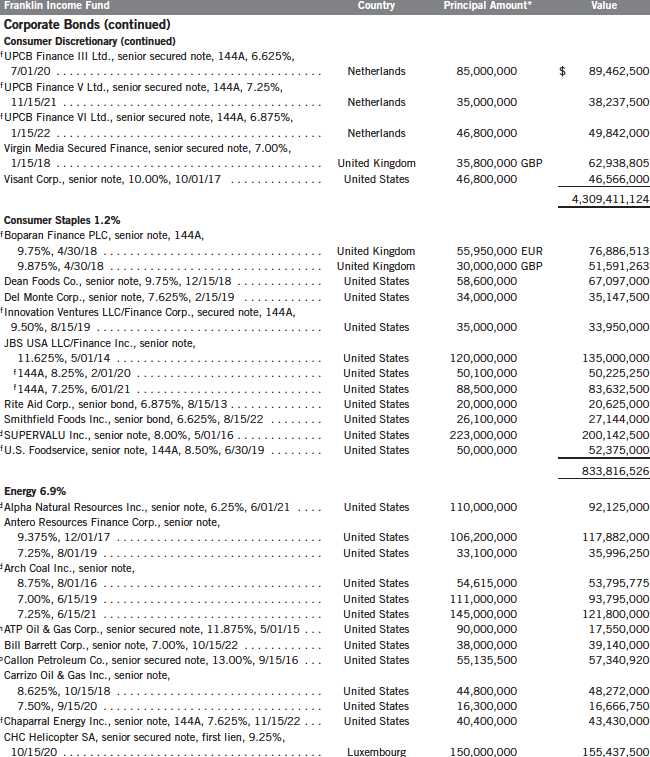
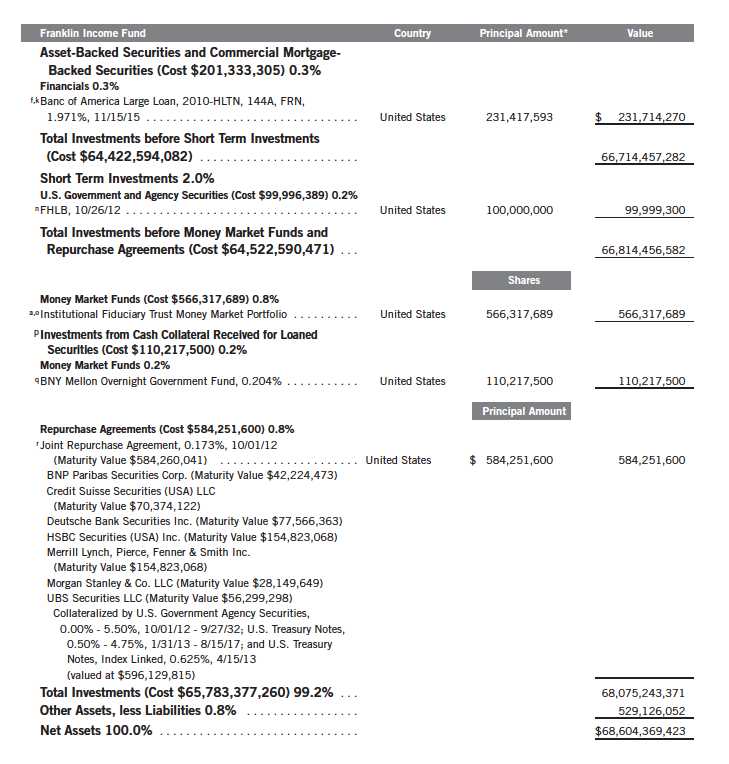
The dollar value, number of shares or principal amount, and names of all portfolio holdings are listed in the Fund’s Statement of Investments (SOI). The SOI begins on page 85.
Annual Report | 25
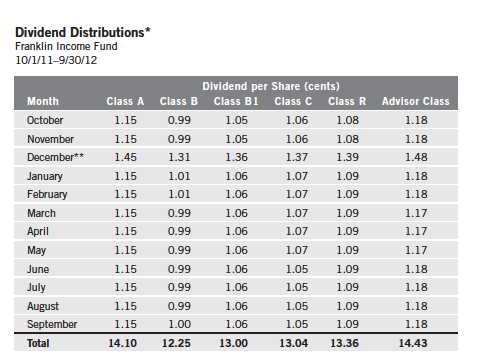
*All Fund distributions will vary depending upon current market conditions, and past distributions are not indicative of future trends.
**Includes an additional 0.30 cent per share distribution to meet excise tax requirements.
condition and market recognition of the change; and a security’s relative value based on such factors as anticipated cash flow, interest or dividend coverage, asset coverage and earnings.
Manager’s Discussion
During the 12 months under review, slowing economic growth and investor perception of heightened risks associated with European and U.S. fiscal challenges contributed to equity market fluctuations. Stocks ultimately generated a robust 12-month gain by period-end. Fixed income markets produced solid returns despite low interest rates.
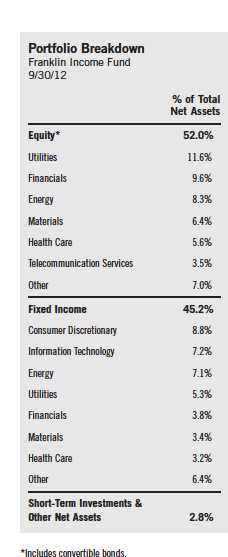
During the period under review, the Fund’s equity weighting increased to 52.0% of total net assets from 42.2%, driven by increased holdings of dividend paying common stocks and, to a lesser extent, convertible securities. The Fund’s fixed income allocation declined to 45.2% from 56.2% of total net assets, largely through a reduction in high yield corporate bonds.
The Fund’s equity and fixed income holdings generally performed well and broadly supported the Fund’s total return during the reporting period. Stocks benefited from modest economic growth as well as continued strong corporate
26 | Annual Report
profit margins and cash flow, increasingly deployed in shareholder friendly ways such as through dividends and share repurchases. Fixed income performance was fueled by strong corporate credit fundamentals, lower interest expense burdens, debt maturity extensions and covenant flexibility, and by the continued decline in long-term interest rates.
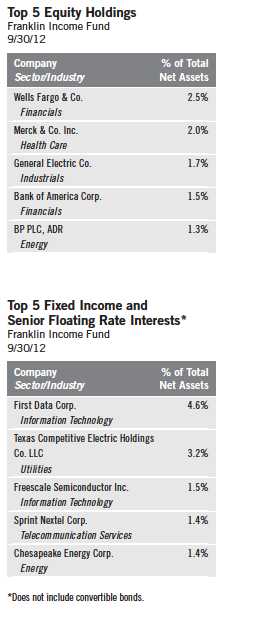
During the reporting period, the Fund’s equity exposure increased in the utilities, financials, energy, materials and industrials sectors while its exposure to the health care and consumer discretionary sectors declined. Top equity performers including financials sector holdings Bank of America, Wells Fargo and JPMorgan Chase & Co. benefited from improved capital positions and in some cases, dividend growth. Health care stocks including Merck & Co., Pfizer and Roche Holding contributed to performance as the pharmaceutical industry gradually moved past the negative impact drug patent expirations have had on its results and investor sentiment over the past several years. Shares of telecommunication services provider AT&T rose, supported by a strong dividend yield and the strength of AT&T’s mobile services offerings. A resurgence in commodity chemical production in North America, driven in part by ready access to cheap natural gas, boosted shares of industrial material manufacturer LyondellBasell Industries. Share price appreciation of integrated oil company BP and industrial company General Electric also contributed to performance.
Equity detractors were not easily categorized. However, the continued decline and overall low level of natural gas prices weighed on certain energy sector holdings including oil and natural gas producer Chesapeake Energy and coal producer Alpha Natural Resources (sold by period-end) as cheap natural gas displaced demand for coal in the power generation process.
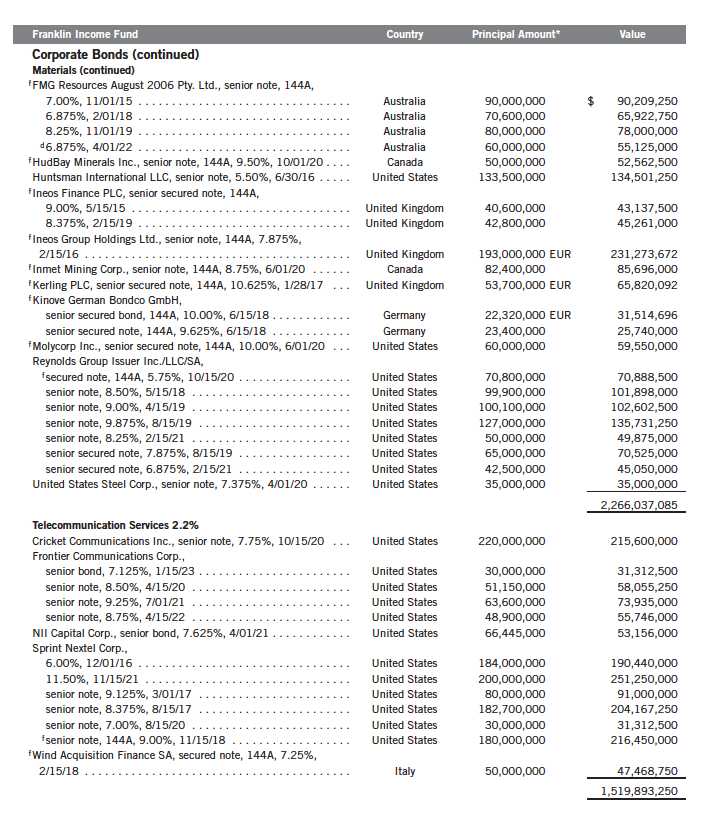
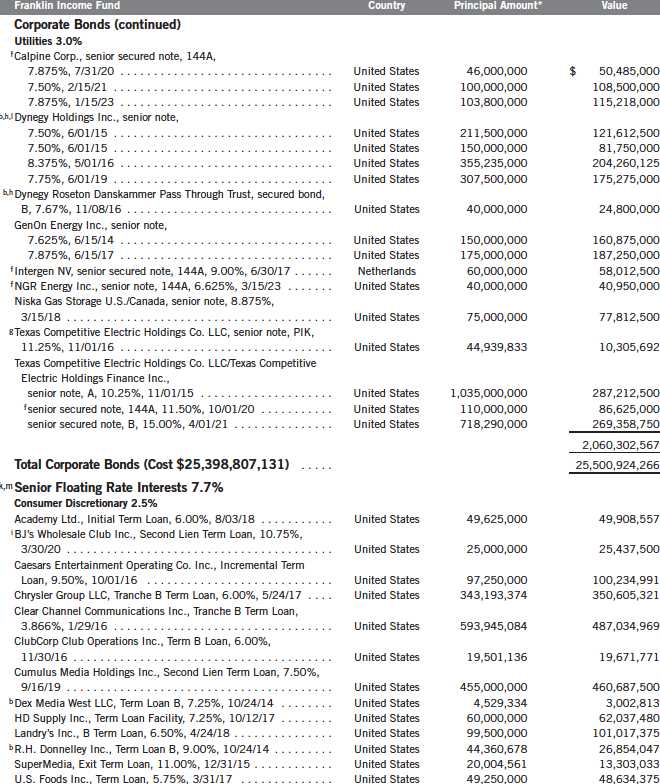
Within the Fund’s fixed income holdings, positions remained largely focused on high yield corporate bonds and floating rate corporate term loans. We believed the outlook for such securities was favorable due to stable corporate profits and investor expectations for a continued period of below-average default levels. The overall fixed income weighting declined substantially as we sold some holdings when risk-reward profiles became less appealing to us and as issuers actively refinanced several bond positions, which were tendered for or called away often at meaningful premiums to par value. Sector exposures remained broadly diversified across the information technology, communications, energy, electric utility, consumer non-cyclical and consumer cyclical sectors.3 Exposure to finance companies declined largely after the refinancing activity of CIT Group, which had been one of the largest holdings at the beginning of the reporting
3. Communications holdings are in consumer discretionary and telecommunication services in the SOI. Electric utility holdings are in utilities in the SOI. Consumer non-cyclical holdings are in consumer discretionary, consumer staples and health care in the SOI. Consumer cyclical holdings are in consumer discretionary, consumer staples, financials and industrials in the SOI.
Annual Report | 27
period. Individual issuers that performed well included First Data, a leading electronic transaction processing company, which benefited from improved fundamentals and capital structure actions the company took to extend its debt; Clear Channel Media Holdings,4 which benefited from modest economic growth and stable advertising markets; and CIT Group, which continued to improve its balance sheet, allowing for lower overall funding costs. Hospital operators HCA Holdings and Tenet Healthcare benefited from efforts related to health care reform, which could reduce the number of uninsured patients. Notable fixed income detractors included coal companies such as Arch Coal and Alpha Natural Resources, which suffered as cheap natural gas displaced coal in the power generation process. Other detractors included PetroPlus Finance, issued by independent European oil refiner PetroPlus Holdings, and independent exploration and production company ATP Oil & Gas.
The Fund’s foreign exposure increased in Europe to 11.28% of total net assets from 9.46% and in Australia to 1.53% from 1.1% during the period. Our European allocation increased after the Fund initiated a position in Vivendi (France) and added shares of BP (U.K.) and Royal Dutch Shell (Netherlands). Our Australian allocation increased after the Fund initiated positions in Commonwealth Bank of Australia and Woodside Petroleum.
4. Clear Channel Media Holdings is the parent of Clear Channel Communications Inc.
28 | Annual Report
Thank you for your continued participation in Franklin Income Fund.
We look forward to serving your future investment needs.

The foregoing information reflects our analysis, opinions and portfolio holdings as of September 30, 2012, the end of the reporting period. The way we implement our main investment strategies and the resulting portfolio holdings may change depending on factors such as market and economic conditions. These opinions may not be relied upon as investment advice or an offer for a particular security. The information is not a complete analysis of every aspect of any market, country, industry, security or the Fund. Statements of fact are from sources considered reliable, but the investment manager makes no representation or warranty as to their completeness or accuracy. Although historical performance is no guarantee of future results, these insights may help you understand our investment management philosophy.
Annual Report | 29
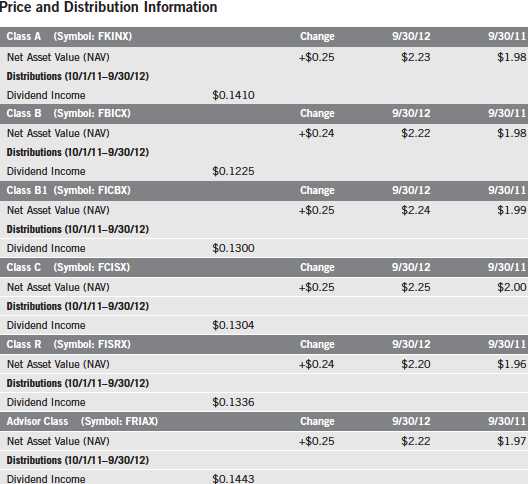
Performance Summary as of 9/30/12
Franklin Income Fund
Your dividend income will vary depending on dividends or interest paid by securities in the Fund’s portfolio, adjusted for operating expenses of each class. Capital gain distributions are net profits realized from the sale of portfolio securities. The performance table and graphs do not reflect any taxes that a shareholder would pay on Fund dividends, capital gain distributions, if any, or any realized gains on the sale of Fund shares. Total return reflects reinvestment of the Fund’s dividends and capital gain distributions, if any, and any unrealized gains or losses.
30 | Annual Report
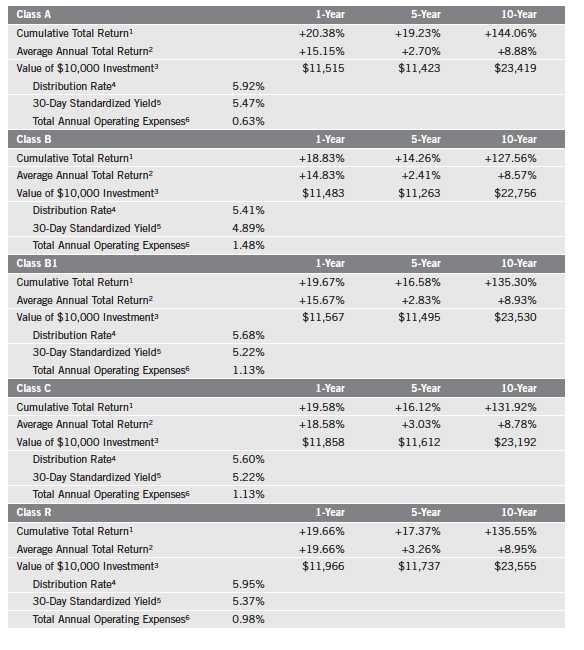
Performance Summary (continued)
Performance
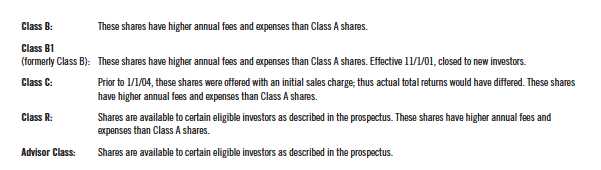
Cumulative total return excludes sales charges. Average annual total return and value of $10,000 investment include maximum sales charges. Class A: 4.25% maximum initial sales charge; Class B/B1: contingent deferred sales charge (CDSC) declining from 4% to 1% over six years, and eliminated thereafter; Class C: 1% CDSC in first year only;
Class R/Advisor Class: no sales charges.
Annual Report | 31
Performance Summary (continued)
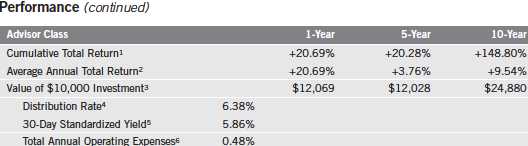
Performance data represent past performance, which does not guarantee future results. Investment return and principal value will fluctuate, and you may have a gain or loss when you sell your shares. Current performance may differ from figures shown. For most recent month-end performance, go to franklintempleton.com or call (800) 342-5236.
32 | Annual Report
Performance Summary (continued)
Total Return Index Comparison for a Hypothetical $10,000 Investment
Total return represents the change in value of an investment over the periods shown. It includes any current, applicable, maximum sales charge, Fund expenses, account fees and reinvested distributions. The unmanaged indexes include reinvestment of any income or distributions. They differ from the Fund in composition and do not pay management fees or expenses. One cannot invest directly in an index.
34 | Annual Report
Annual Report | 35
Performance Summary (continued)
Endnotes
All investments involve risks, including possible loss of principal. The Fund’s share price and yield will be affected by interest rate movements. Bond prices generally move in the opposite direction of interest rates. Thus, as prices of bonds in the Fund adjust to a rise in interest rates, the Fund’s share price may decline. Changes in the financial strength of a bond issuer or in a bond’s credit rating may affect its value. Floating-rate loans are lower rated, higher yielding instruments, which are subject to increased risk of default and can potentially result in loss of principal. These securities carry a greater degree of credit risk relative to investment-grade securities. Stock prices fluctuate, sometimes rapidly and dramatically, due to factors affecting individual companies, particular industries or sectors, or general market conditions. The Fund is actively managed but there is no guarantee that the manager’s investment decisions will produce the desired results. The Fund’s prospectus also includes a description of the main investment risks.
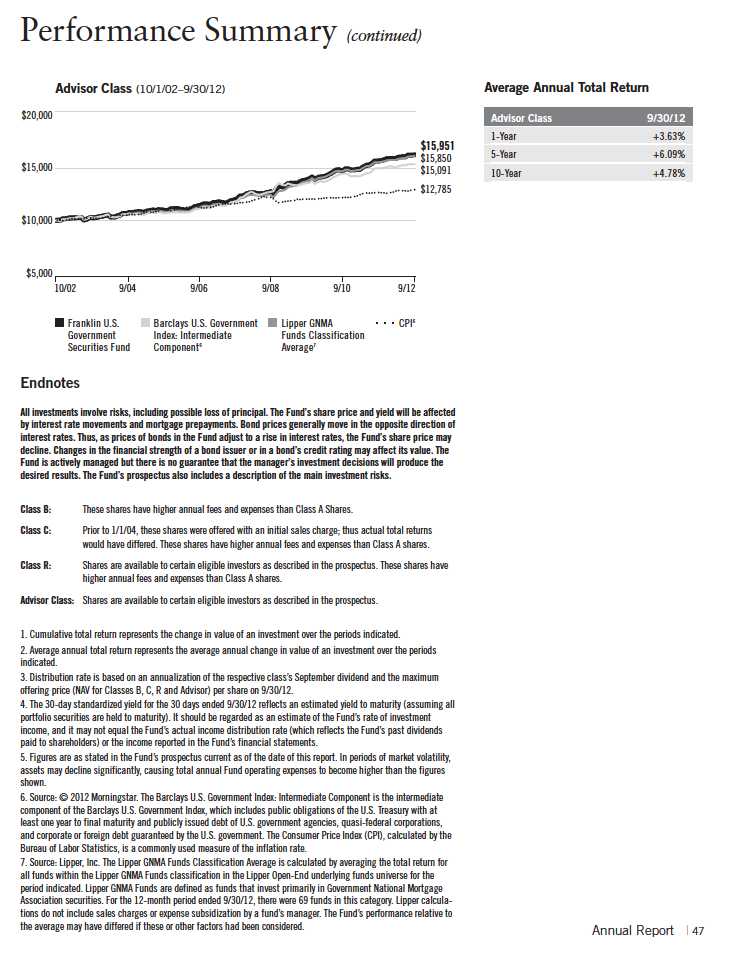
1. Cumulative total return represents the change in value of an investment over the periods indicated.
2. Average annual total return represents the average annual change in value of an investment over the periods indicated. 3. These figures represent the value of a hypothetical $10,000 investment in the Fund over the periods indicated.
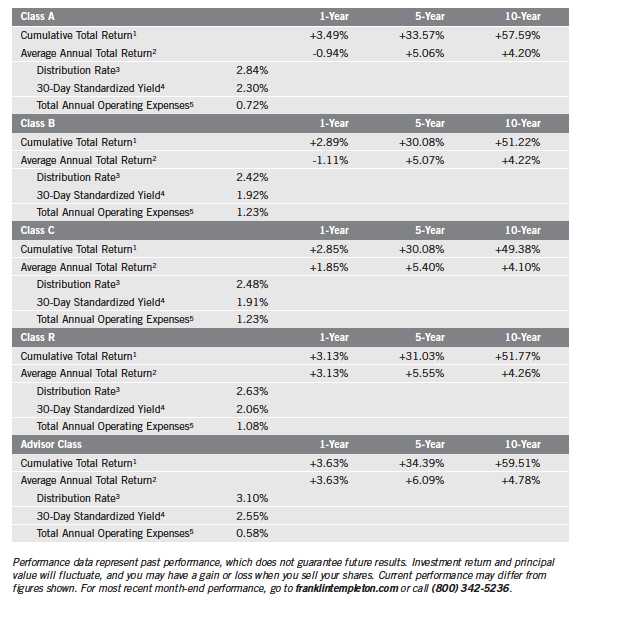
4. Distribution rate is based on an annualization of the respective class’s September dividend and the maximum offering price (NAV for Classes B, B1, C, R and Advisor) per share on 9/30/12.
5. The 30-day standardized yield for the 30 days ended 9/30/12 reflects an estimated yield to maturity (assuming all portfolio securities are held to maturity). It should be regarded as an estimate of the Fund’s rate of investment income, and it may not equal the Fund’s actual income distribution rate (which reflects the Fund’s past dividends paid to shareholders) or the income reported in the Fund’s financial statements.
6. Figures are as stated in the Fund’s prospectus current as of the date of this report. In periods of market volatility, assets may decline significantly, causing total annual Fund operating expenses to become higher than the figures shown.
7. Source: © 2012 Morningstar. The S&P 500 is a market capitalization-weighted index of 500 stocks designed to measure total U.S. equity market performance. The Barclays U.S. Aggregate Index is a market capitalization-weighted index representing the U.S. investment-grade, fixed-rate, taxable bond market with index components for government and corporate, mortgage pass-through and asset-backed securities. All issues included are SEC registered, taxable, dollar denominated and nonconvertible, must have at least one year to final maturity and must be rated investment grade (Baa3/BBB-/BBB- or higher) using the middle rating of Moody’s, Standard & Poor’s and Fitch, respectively.
8. Source: Lipper, Inc. The Lipper Mixed-Asset Target Allocation Moderate Funds Classification Average is calculated by averaging the total returns of all funds within the Lipper Mixed-Asset Target Allocation Moderate Funds classification in the Lipper Open-End underlying funds universe. Lipper Mixed-Asset Target Allocation Moderate Funds are defined as funds that, by portfolio practice, maintain a mix of between 40%-60% equity securities, with the remainder invested in bonds, cash and cash equivalents. For the 12-month period ended 9/30/12, there were 474 funds in this category. Lipper calculations do not include sales charges or expense subsidization by a fund’s manager. The Fund’s performance relative to the average may have differed if these and other factors had been considered.
36 | Annual Report
Your Fund’s Expenses
Franklin Income Fund
As a Fund shareholder, you can incur two types of costs:
- Transaction costs, including sales charges (loads) on Fund purchases; and
- Ongoing Fund costs, including management fees, distribution and service (12b-1) fees, and other Fund expenses. All mutual funds have ongoing costs, sometimes referred to as operating expenses.
The following table shows ongoing costs of investing in the Fund and can help you understand these costs and compare them with those of other mutual funds. The table assumes a $1,000 investment held for the six months indicated.
Actual Fund Expenses
The first line (Actual) for each share class listed in the table provides actual account values and expenses. The “Ending Account Value” is derived from the Fund’s actual return, which includes the effect of Fund expenses.
You can estimate the expenses you paid during the period by following these steps. Of course, your account value and expenses will differ from those in this illustration:
| 1. | Divide your account value by $1,000. |
| | If an account had an $8,600 value, then $8,600 ÷ $1,000 = 8.6. |
| 2. | Multiply the result by the number under the heading “Expenses Paid During Period.” |
| | If Expenses Paid During Period were $7.50, then 8.6 x $7.50 = $64.50. |
In this illustration, the estimated expenses paid this period are $64.50.
Hypothetical Example for Comparison with Other Funds
Information in the second line (Hypothetical) for each class in the table can help you compare ongoing costs of investing in the Fund with those of other mutual funds. This information may not be used to estimate the actual ending account balance or expenses you paid during the period. The hypothetical “Ending Account Value” is based on the actual expense ratio for each class and an assumed 5% annual rate of return before expenses, which does not represent the Fund’s actual return. The figure under the heading “Expenses Paid During Period” shows the hypothetical expenses your account would have incurred under this scenario. You can compare this figure with the 5% hypothetical examples that appear in shareholder reports of other funds.
Annual Report | 37
Your Fund’s Expenses (continued)
Please note that expenses shown in the table are meant to highlight ongoing costs and do not reflect any transaction costs, such as sales charges. Therefore, the second line for each class is useful in comparing ongoing costs only, and will not help you compare total costs of owning different funds. In addition, if transaction costs were included, your total costs would have been higher. Please refer to the Fund prospectus for additional information on operating expenses.
*Expenses are calculated using the most recent six-month expense ratio, annualized for each class (A: 0.64%; B: 1.47%; B1: 1.13%; C: 1.14%; R: 0.99%; and Advisor: 0.49%), multiplied by the average account value over the period, multiplied by 183/366 to reflect the one-half year period.
38 | Annual Report
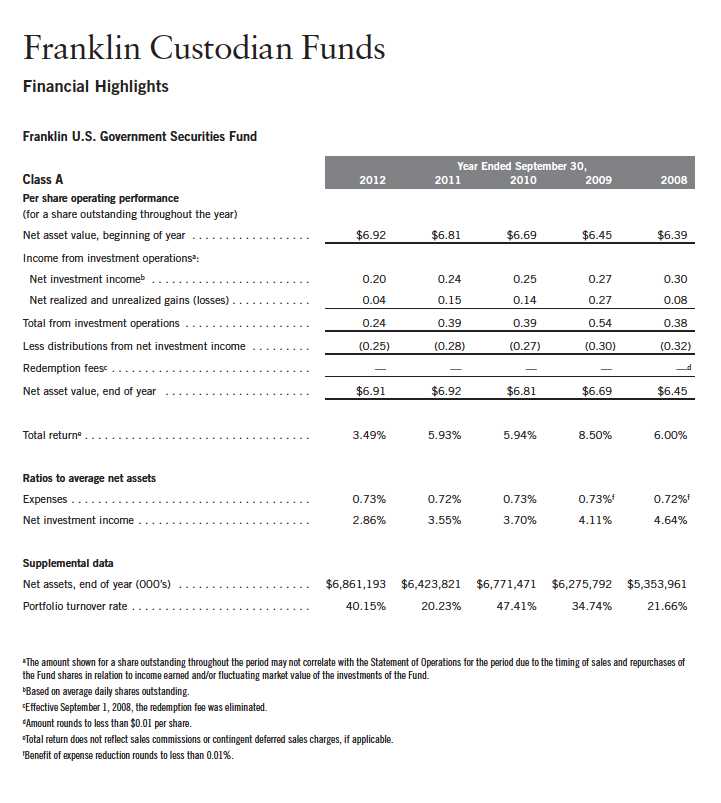
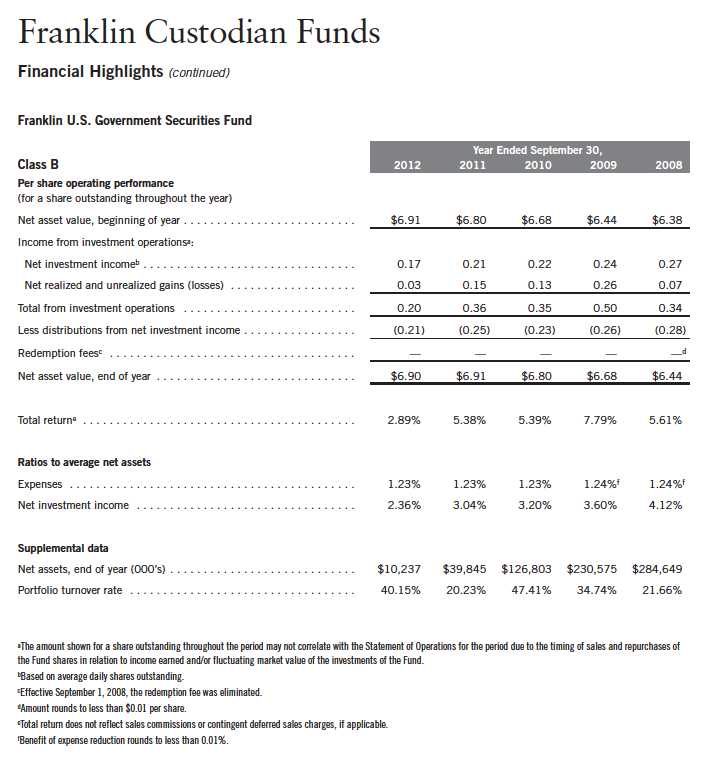
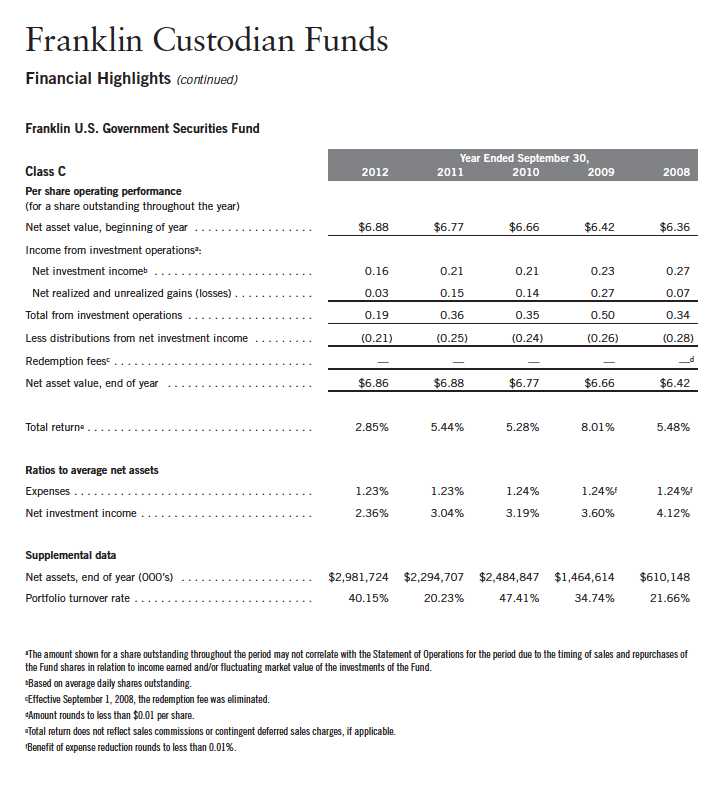
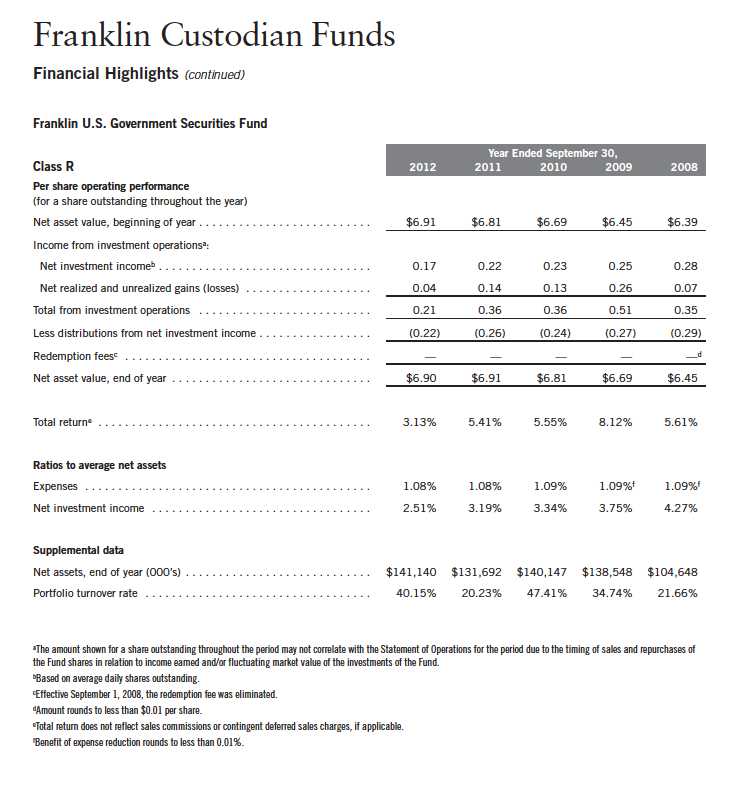
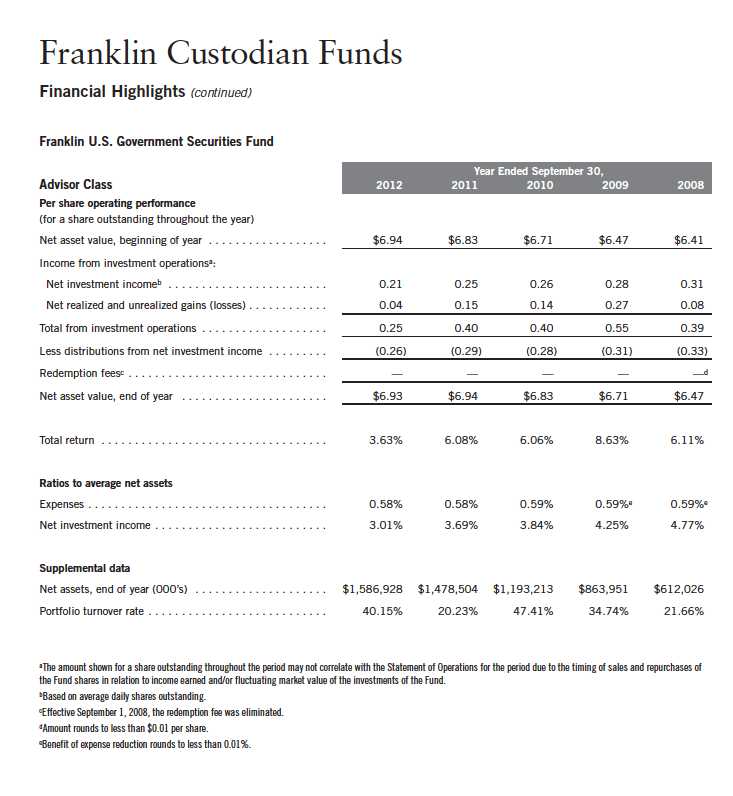
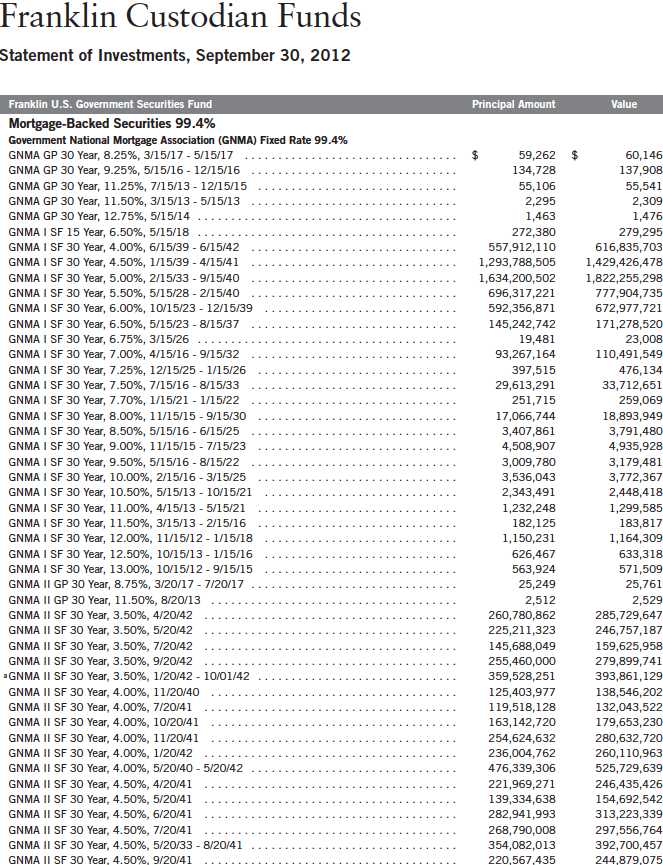
Franklin U.S. Government Securities Fund
Your Fund’s Goal and Main Investments: Franklin U.S. Government Securities Fund seeks income by investing at least 80% of its net assets in U.S. government securities. The Fund presently invests substantially all of its assets in Government National Mortgage Association obligations (Ginnie Maes).
Since 1983, the Fund has invested substantially in Ginnie Mae securities, which carry a guarantee backed by the full faith and credit of the U.S. government as to the timely payment of interest and principal.1 Issued by the Government National Mortgage Association (GNMA), Ginnie Maes have been among the highest yielding U.S. government obligations available
Performance data represent past performance, which does not guarantee future results. Investment return and principal value will fluctuate, and you may have a gain or loss when you sell your shares. Current performance may differ from figures shown. Please visit franklintempleton.com or call (800) 342-5236 for most recent month-end performance.
This annual report for Franklin U.S. Government Securities Fund covers the fiscal year ended September 30, 2012.
Performance Overview
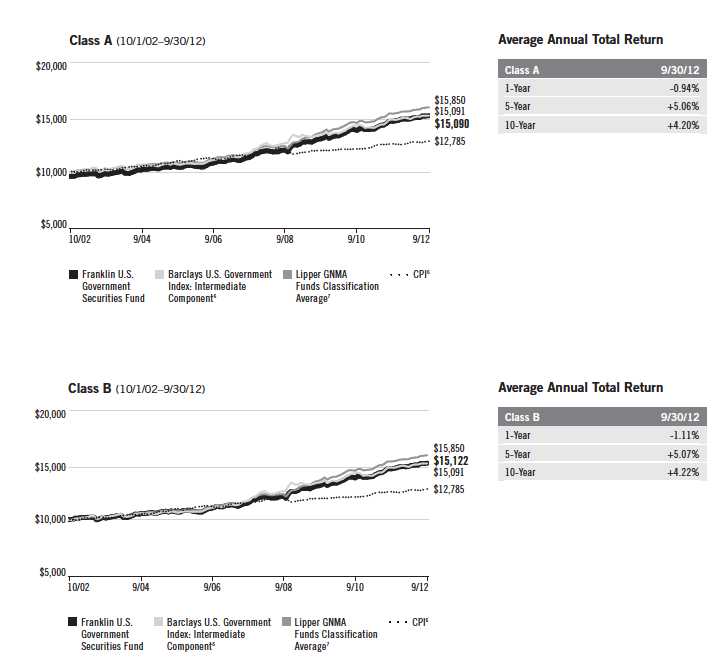
Franklin U.S. Government Securities Fund – Class A posted a cumulative total return of +3.49% for the 12 months under review. The Fund’s results underperformed the +3.77% total return of its peers as measured by the Lipper GNMA Funds Classification Average, which consists of funds chosen by Lipper that invest primarily in GNMAs.2 In comparison, the Barclays U.S. Government Index: Intermediate Component, the intermediate component of the Barclays U.S. Government Index, returned +2.39% for the same period.3 The Fund’s return reflects the effect of management fees and expenses, while the Barclays U.S. Government Index: Intermediate Component does not have such costs. You can find the Fund’s long-term performance data in the Performance Summary beginning on page 43.
Investment Strategy
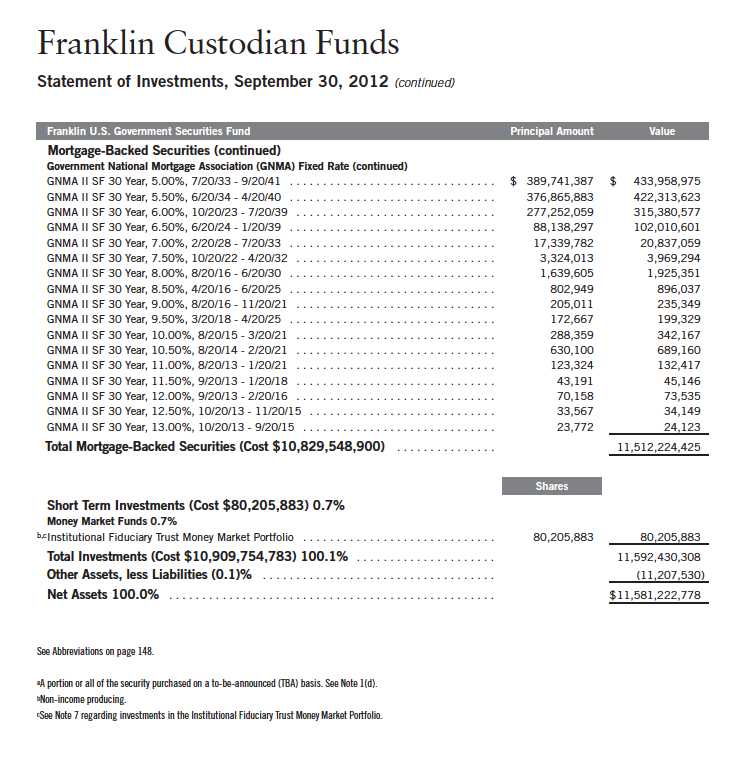
We currently invest the Fund’s assets predominantly in GNMA obligations. We analyze securities using proprietary models to help us identify attractive investment opportunities. The Fund’s short-term investments may include short-term government securities and cash or cash equivalents.
1. Securities owned by the Fund, but not shares of the Fund, are guaranteed by the U.S. government, its agencies or instrumentalities as to timely payment of principal and interest. The Fund’s yield and share price are not guaranteed and will vary with market conditions.
2. Source: Lipper Inc. For the 12-month period ended 9/30/12, this category consisted of 69 funds. Lipper calculations do not include sales charges or expense subsidization by a fund’s manager. The Fund’s performance relative to the average may have differed if these or other factors had been considered.
3. Source: © 2012 Morningstar. All Rights Reserved. The information contained herein: (1) is proprietary to Morningstar and/or its content providers; (2) may not be copied or distributed; and (3) is not warranted to be accurate, complete or timely. Neither Morningstar nor its content providers are responsible for any damages or losses arising from any use of this information.
The indexes are unmanaged and include reinvestment of any income or distributions. One cannot invest directly in an index, and an index is not representative of the Fund’s portfolio.
The dollar value, number of shares or principal amount, and names of all portfolio holdings are listed in the Fund’s Statement of Investments (SOI). The SOI begins on page 107.
Annual Report | 39
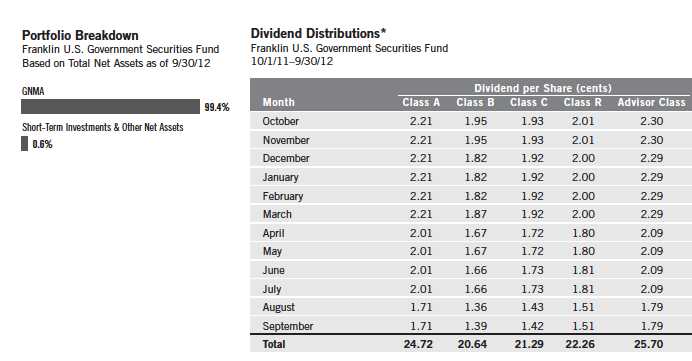
*All Fund distributions will vary depending upon current market conditions, and past distributions are not indicative of future trends.
Manager’s Discussion
During the 12 months under review, the Federal Reserve Board (Fed) extended its long-term Treasury buying program, called Operation Twist, and at period-end, it launched an additional round of quantitative easing known as QE3. The new program included monthly $40 billion purchases of agency mortgage-backed securities (MBS), and provided strong technical support for the markets. Purchases were to continue indefinitely unless the outlook for the labor market improved “substantially.”
Ginnie Mae (GNMA) MBS remained an attractive income opportunity in this environment, as the GNMA current coupon yielded 1.85% at period-end, compared to 5- and 10-year Treasuries, which yielded 0.63% and 1.63%.
40 | Annual Report
Mortgages continued to perform well during the period and outperformed Treasuries. Valuations in the MBS sector were, in our opinion, more fairly valued and received additional support from market conditions including a limited supply of mortgages, additional Fed purchases, reinvestment of pay-downs, and bank and mortgage REIT (real estate investment trust) demand. With mortgage rates at historical lows, we expect prepayments to continue to increase as they did in August and September 2012, although not to the extent reached in past prepayment waves. Factors including a decline in home price appreciation, loss of home equity, tighter underwriting standards and originator processing capacity continued to mitigate prepayment activity.
Based on excess returns, performance of GNMA MBS lagged that of their Fannie Mae conventional MBS counterparts. GNMA MBS, however, outperformed their Freddie Mac MBS counterparts. Within GNMAs, lower coupon 3.0% and 3.5% GNMAs were the best performers from an excess returns perspective, while higher coupon 5.0% and 5.5% GNMAs lagged.
Our exposure to GNMA IIs (comprising multiple-issuer pools) increased over the period and we were fairly evenly weighted between the GNMA I (comprising single-issuer pools) and GNMA II sectors. We increased the portfolio’s allocation to lower coupon 3.5% through 4.5% GNMA IIs. Our heaviest allocation was in 4.0% through 5.0% coupons. The Fund’s allocation to GNMAs with coupons below 4% generally benefited performance, while the Fund’s allocation to 5.0% and 5.5% coupon GNMA securities detracted from performance.
The Fund’s strategy has been consistent over time and continues to focus on investing solely in GNMA MBS, which remain the only MBS that are backed by the full faith and credit of the U.S. government — the same guarantee applicable to U.S. Treasuries.1 The investment team continued to look for strong cash flow fundamentals and valuations to uncover opportunities across the GNMA universe. With prepayment risk as the primary risk for GNMA investors, our strategy seeks to exploit discrepancies between our prepayment expectations and the market’s prepayment valuations. We continued to look for specified pools where we believe our experience, skill and collateral-intensive research process can help us uncover these discrepancies.
Annual Report | 41
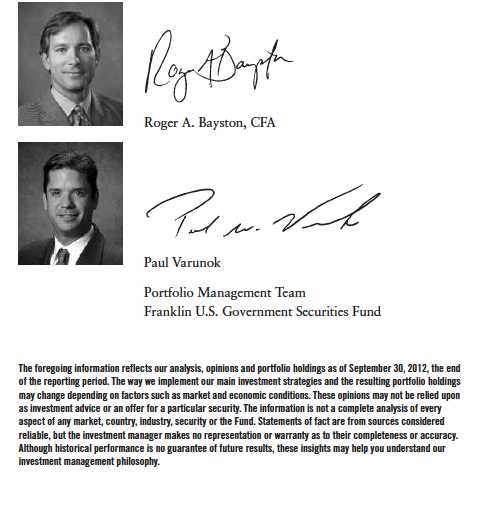
Thank you for your continued participation in Franklin U.S. Government Securities Fund. We welcome your comments and questions and look forward to serving your investment needs in the years ahead.
42 | Annual Report
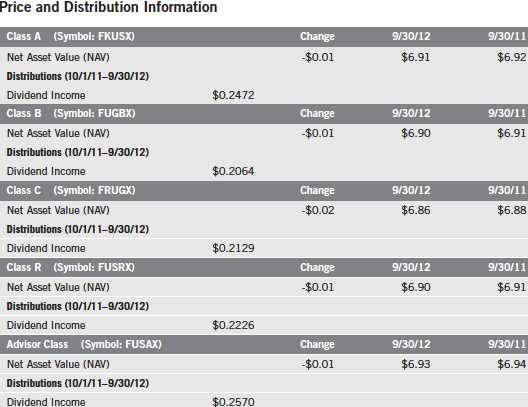
Performance Summary as of 9/30/12
Franklin U.S. Government Securities Fund
Your dividend income will vary depending on dividends or interest paid by securities in the Fund’s portfolio, adjusted for operating expenses of each class. Capital gain distributions are net profits realized from the sale of portfolio securities. The performance table and graphs do not reflect any taxes that a shareholder would pay on Fund dividends, capital gain distributions, if any, or any realized gains on the sale of Fund shares. Total return reflects reinvestment of the Fund’s dividends and capital gain distributions, if any, and any unrealized gains or losses.
Annual Report | 43
Performance Summary (continued)
Performance
Cumulative total return excludes sales charges. Average annual total return includes maximum sales charges. Class A: 4.25% maximum initial sales charge; Class B: contingent deferred sales charge (CDSC) declining from 4% to 1% over six years, and eliminated thereafter; Class C: 1% CDSC in first year only; Class R/Advisor Class: no sales charges.
44 | Annual Report
Performance Summary (continued)
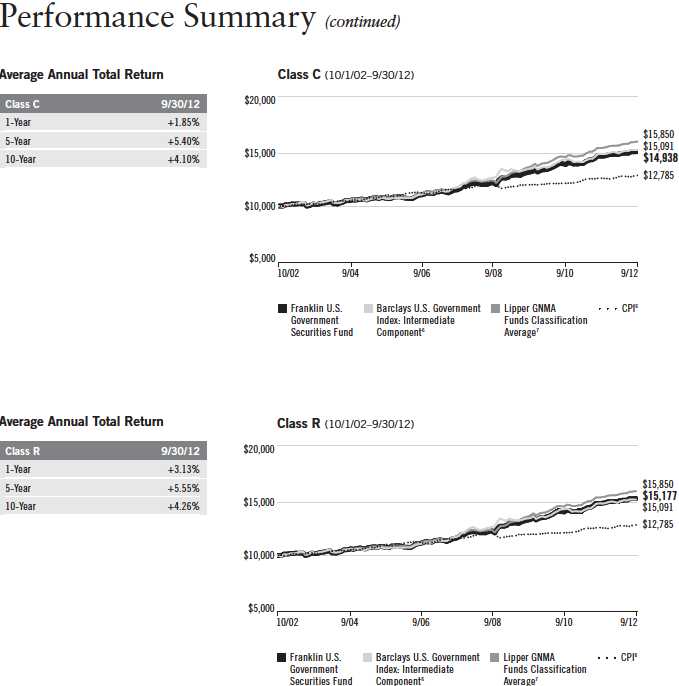
Total Return Index Comparison for a Hypothetical $10,000 Investment
Total return represents the change in value of an investment over the periods shown. It includes any current, applicable, maximum sales charge, Fund expenses, account fees and reinvested distributions. The unmanaged indexes include reinvestment of any income or distributions. They differ from the Fund in composition and do not pay management fees or expenses. One cannot invest directly in an index.
Annual Report | 45
46 | Annual Report
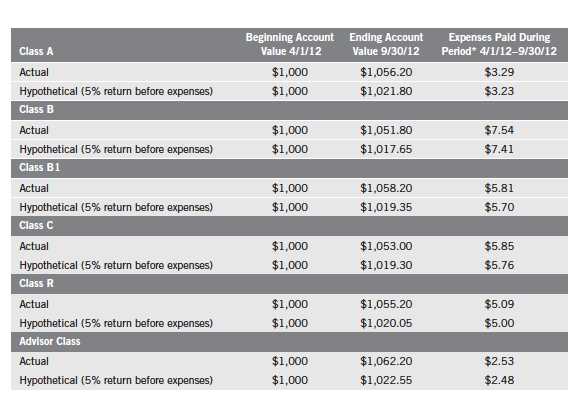
Your Fund’s Expenses
Franklin U.S. Government Securities Fund
As a Fund shareholder, you can incur two types of costs:
- Transaction costs, including sales charges (loads) on Fund purchases; and
- Ongoing Fund costs, including management fees, distribution and service (12b-1) fees, and other Fund expenses. All mutual funds have ongoing costs, sometimes referred to as operating expenses.
The following table shows ongoing costs of investing in the Fund and can help you understand these costs and compare them with those of other mutual funds. The table assumes a $1,000 investment held for the six months indicated.
Actual Fund Expenses
The first line (Actual) for each share class listed in the table provides actual account values and expenses. The “Ending Account Value” is derived from the Fund’s actual return, which includes the effect of Fund expenses.
You can estimate the expenses you paid during the period by following these steps. Of course, your account value and expenses will differ from those in this illustration:
| 1. | Divide your account value by $1,000. |
| | If an account had an $8,600 value, then $8,600 ÷ $1,000 = 8.6. |
| 2. | Multiply the result by the number under the heading “Expenses Paid During Period.” |
| | If Expenses Paid During Period were $7.50, then 8.6 x $7.50 = $64.50. |
In this illustration, the estimated expenses paid this period are $64.50.
Hypothetical Example for Comparison with Other Funds
Information in the second line (Hypothetical) for each class in the table can help you compare ongoing costs of investing in the Fund with those of other mutual funds. This information may not be used to estimate the actual ending account balance or expenses you paid during the period. The hypothetical “Ending Account Value” is based on the actual expense ratio for each class and an assumed 5% annual rate of return before expenses, which does not represent the Fund’s actual return. The figure under the heading “Expenses Paid During Period” shows the hypothetical expenses your account would have incurred under this scenario. You can compare this figure with the 5% hypothetical examples that appear in shareholder reports of other funds.
48 | Annual Report
Your Fund’s Expenses (continued)
Please note that expenses shown in the table are meant to highlight ongoing costs and do not reflect any transaction costs, such as sales charges. Therefore, the second line for each class is useful in comparing ongoing costs only, and will not help you compare total costs of owning different funds. In addition, if transaction costs were included, your total costs would have been higher. Please refer to the Fund prospectus for additional information on operating expenses.
*Expenses are calculated using the most recent six-month expense ratio, annualized for each class (A: 0.74%; B: 1.23%; C: 1.24%; R: 1.09%; and Advisor: 0.59%), multiplied by the average account value over the period, multiplied by 183/366 to reflect the one-half year period.
Annual Report | 49
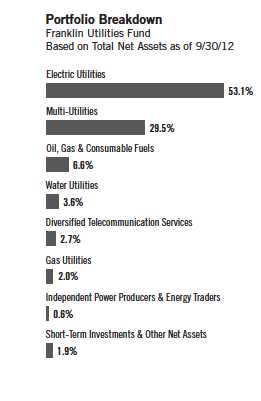
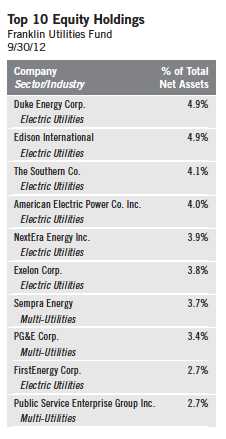
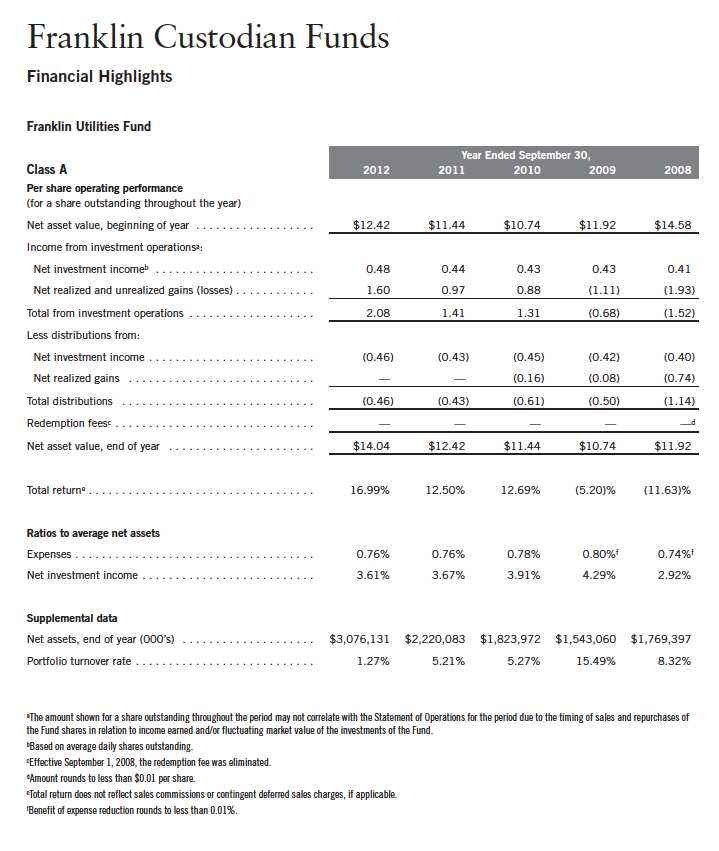
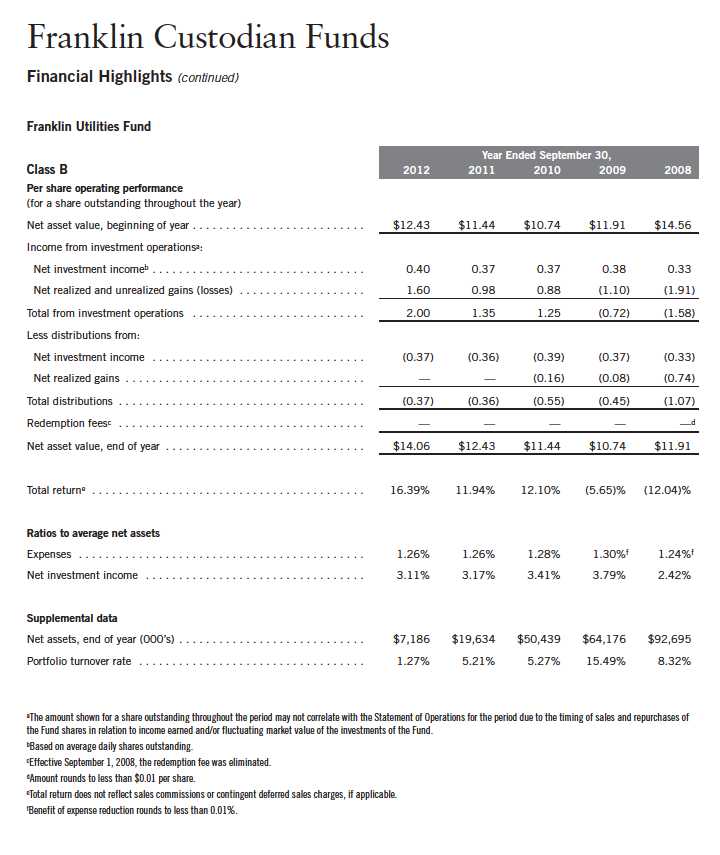
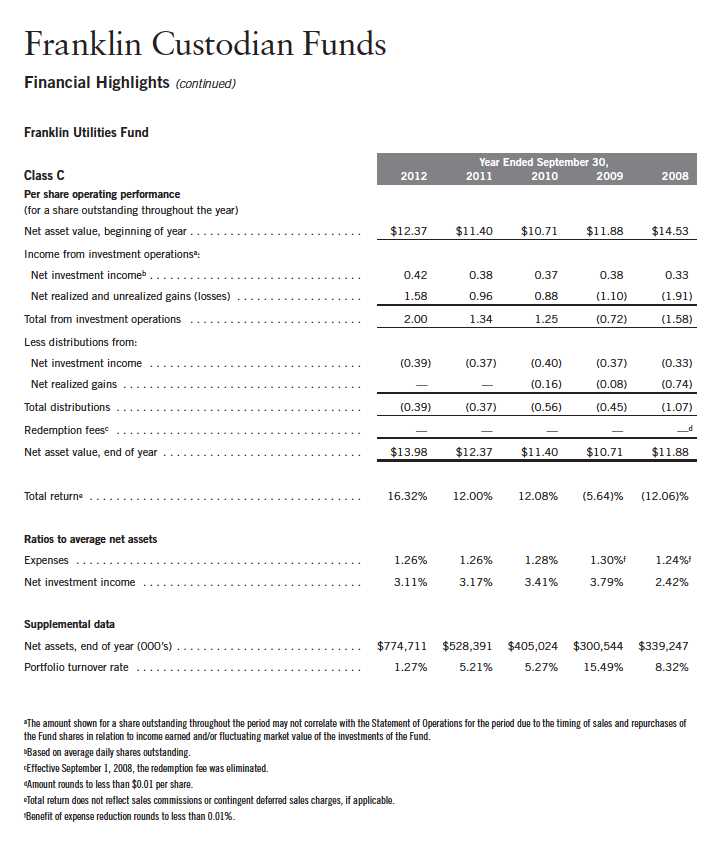
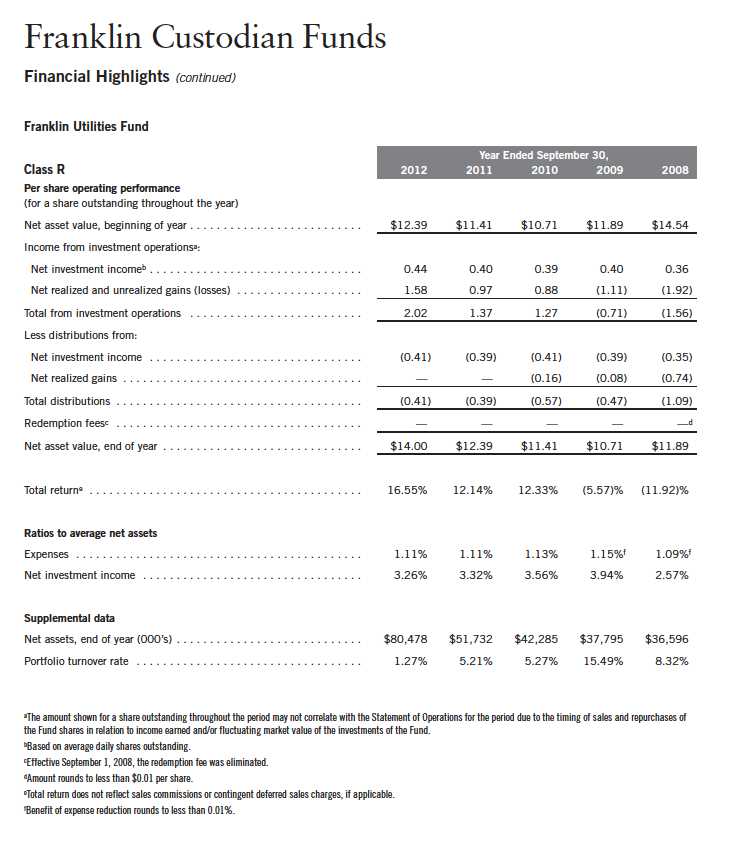
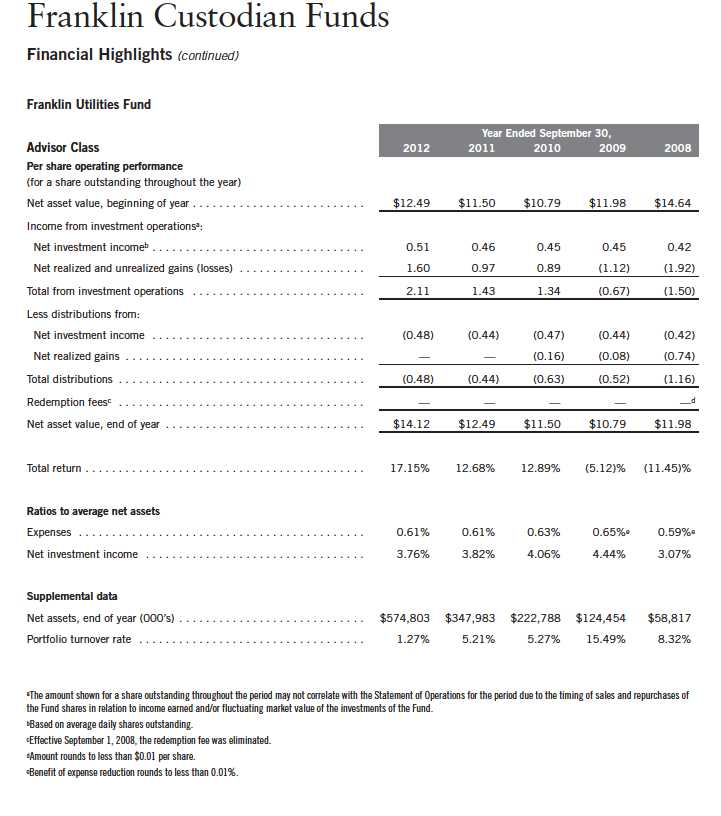
Franklin Utilities Fund
Your Fund’s Goal and Main Investments: Franklin Utilities Fund seeks both capital appreciation and current income by investing at least 80% of its net assets in public utility company securities.
Performance data represent past performance, which does not guarantee future results. Investment return and principal value will fluctuate, and you may have a gain or loss when you sell your shares. Current performance may differ from figures shown. Please visit franklintempleton.com or call (800) 342-5236 for most recent month-end performance.
This annual report for Franklin Utilities Fund covers the fiscal year ended September 30, 2012.
Performance Overview
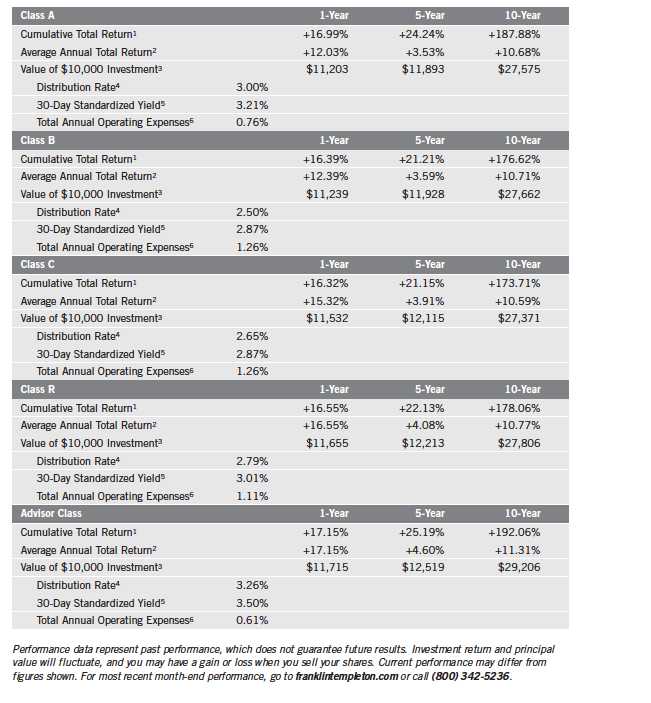
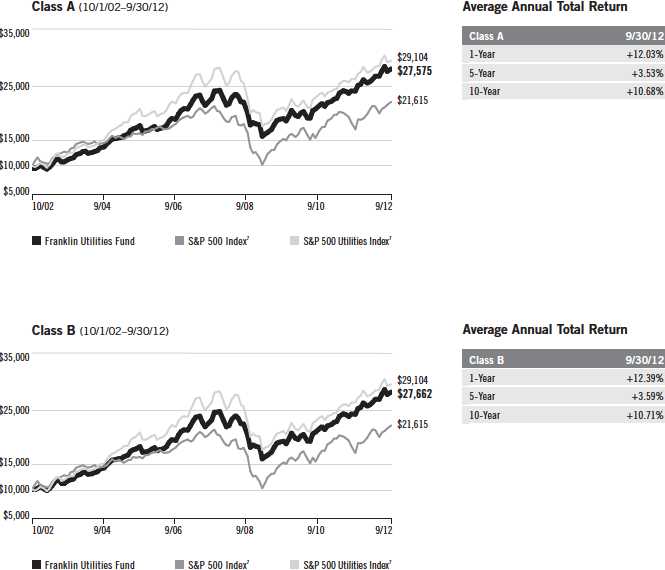
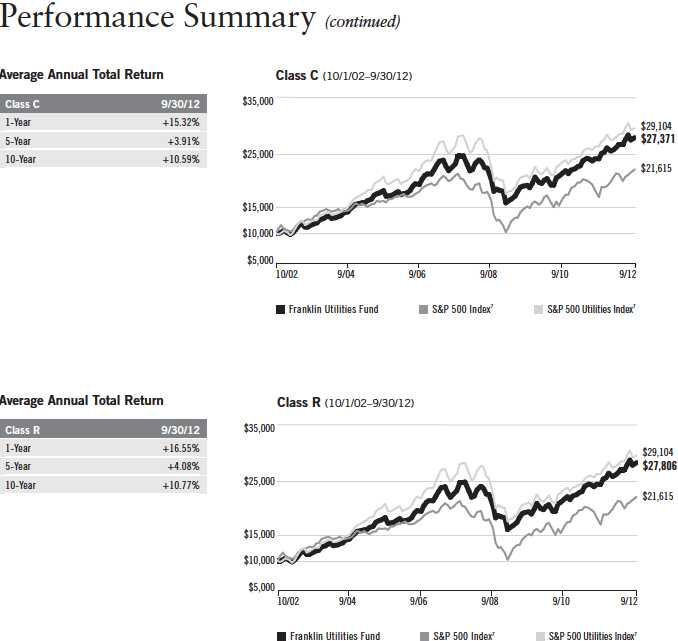
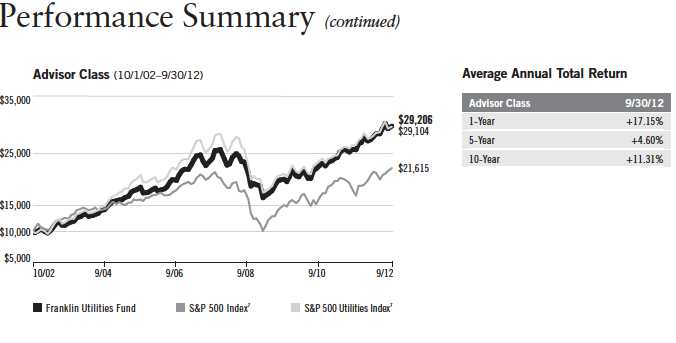
Franklin Utilities Fund – Class A delivered a +16.99% cumulative total return for the 12 months under review. The Fund’s Class A shares underperformed the +30.20% total return of its broad benchmark, the Standard & Poor’s 500 (S&P 500) Index, which is a broad measure of U.S. stock performance.1 The Fund outperformed the +12.90% total return of its narrow benchmark, the S&P 500 Utilities Index, which measures the performance of all utilities stocks in the S&P 500 Index.1 You can find the Fund’s long-term performance data in the Performance Summary beginning on page 53.
Investment Strategy
We search for the best return opportunities available in the global utilities arena with a specific focus on the U.S. electricity and gas sector. Generally, we look for companies producing a high percentage of earnings from regulated utility franchise operations.
Manager’s Discussion
For the 12 months under review, utilities produced the weakest performance of the S&P 500 Index’s 10 major sector groups, a reversal of its leading performer status for the 12-month period ended September 30, 2011, the date of the previous annual report. However, stock selection aided the Fund’s performance relative to the S&P 500 Utilities Index.
1. Source: © 2012 Morningstar. All Rights Reserved. The information contained herein: (1) is proprietary to Morningstar and/or its content providers; (2) may not be copied or distributed; and (3) is not warranted to be accurate, complete or timely. Neither Morningstar nor its content providers are responsible for any damages or losses arising from any use of this information. The indexes are unmanaged and include reinvested dividends. One cannot invest directly in an index, and an index is not representative of the Fund’s portfolio.
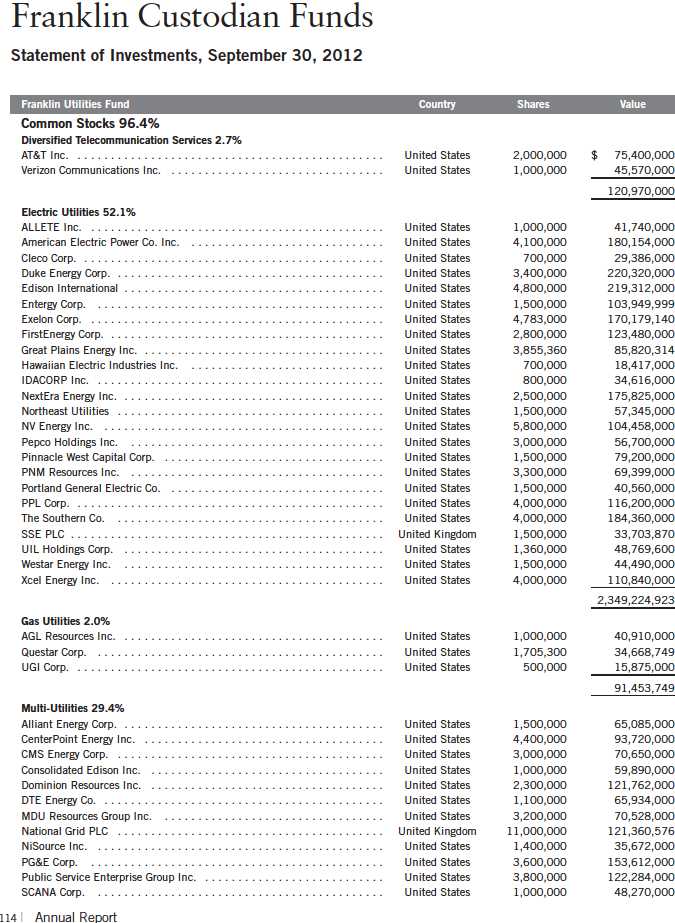
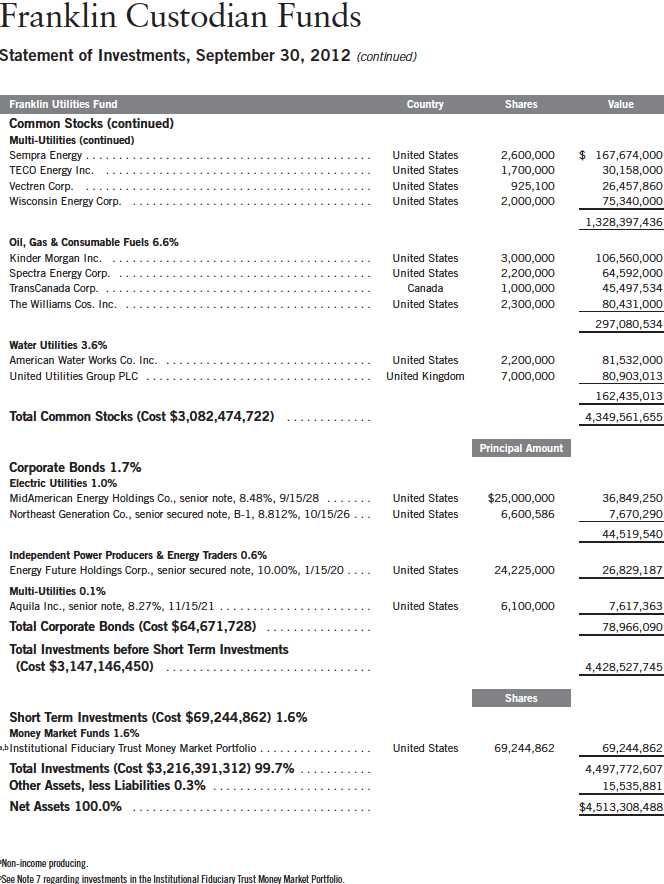
The dollar value, number of shares or principal amount, and names of all portfolio holdings are listed in the Fund’s Statement of Investments (SOI). The SOI begins on page 114.
50 | Annual Report
In the utilities sector, NextEra Energy, North America’s largest producer of solar and wind energy, posted gains as fourth-quarter 2011 earnings doubled and subsequent quarterly earnings increased year-over-year.2 These results stemmed largely from gains in long-term renewable energy contracts, and power generation investments by Florida Power and Light, its regulated utility subsidiary. Infrastructure and utilities firm Sempra Energy appreciated after profits and revenues rose and it announced a dividend increase. However, profits declined later in the period due to a write-down of assets. Electric utilities Edison International and American Electric Power also performed well. Edison International benefited from material capital spending growth within its utility subsidiary, Southern California Edison. American Electric Power reported increased quarterly earnings, largely due to growing industrial demand and favorable weather conditions.
The Fund’s energy and telecommunication services sector holdings boosted Fund performance.3 The Williams Cos., an owner and operator of North American natural gas pipelines, was a leading energy sector contributor. In March, the company acquired Caiman Eastern Midstream, a firm that gathers, treats and transports natural gas and natural gas liquids in areas of West Virginia, Pennsylvania and Ohio, from which Williams expects significant long-term growth potential. The Williams Cos. also announced higher increases in dividend payments through 2014, planned to expand its pipeline capacity in northern Pennsylvania, and signed an agreement to process natural gas and related products in Canada’s oil sands. Telecommunication providers AT&T and Verizon Communications also generated robust returns.
Most Fund holdings benefited absolute performance. A major detractor, however, was utility services provider Exelon, which after acquiring Constellation Energy Group was downgraded from investment grade status by independent credit rating agency Moody’s Investors Service as it expected negative cash flow for the combined entity. Based on Exelon’s sizable capital requirements and dividend, the acquisition weighed on investor sentiment and contributed to 2012 quarterly earnings decreases from the prior year. Other detractors included Constellation Energy Group (no longer held at year-end) and Public Service Enterprise Group.
2. The utilities sector comprises electric utilities, gas utilities, independent power producers and energy traders, and water utilities in the SOI.
3. The energy sector comprises multi-utilities and oil, gas and consumable fuels in the SOI. The telecommunication services sector comprises diversified telecommunication services in the SOI.
Annual Report | 51
52 | Annual Report
Performance Summary as of 9/30/12
Franklin Utilities Fund
Your dividend income will vary depending on dividends or interest paid by securities in the Fund’s portfolio, adjusted for operating expenses of each class. Capital gain distributions are net profits realized from the sale of portfolio securities. The performance table and graphs do not reflect any taxes that a shareholder would pay on Fund dividends, capital gain distributions, if any, or any realized gains on the sale of Fund shares. Total return reflects reinvestment of the Fund’s dividends and capital gain distributions, if any, and any unrealized gains or losses.

Annual Report | 53
Performance Summary (continued)
Performance
Cumulative total return excludes sales charges. Average annual total return and value of $10,000 investment include maximum sales charges. Class A: 4.25% maximum initial sales charge; Class B: contingent deferred sales charge (CDSC) declining from 4% to 1% over six years, and eliminated thereafter; Class C: 1% CDSC in first year only;
Class R/Advisor Class: no sales charges.
54 | Annual Report
Performance Summary (continued)
Total Return Index Comparison for a Hypothetical $10,000 Investment
Total return represents the change in value of an investment over the periods shown. It includes any current, applicable, maximum sales charge, Fund expenses, account fees and reinvested distributions. The unmanaged indexes include reinvestment of any income or distributions. They differ from the Fund in composition and do not pay management fees or expenses. One cannot invest directly in an index.
Annual Report | 55
56 | Annual Report
Endnotes
All investments involve risks, including possible loss of principal. In addition to being sensitive to other factors, securities issued by utility companies have been historically sensitive to interest rate changes. When interest rates fall, utility securities prices, and thus a utilities Fund’s share price, tend to rise; when interest rates rise, their prices generally fall. The Fund is actively managed but there is no guarantee that the manager’s investment decisions will produce the desired results. The Fund’s prospectus also includes a description of the main investment risks.
1. Cumulative total return represents the change in value of an investment over the periods indicated.
2. Average annual total return represents the average annual change in value of an investment over the periods indicated.
3. These figures represent the value of a hypothetical $10,000 investment in the Fund over the periods indicated.
4. Distribution rate is based on an annualization of the respective class’s current quarterly dividend and the maximum offering price (NAV for Classes B, C, R and Advisor) per share on 9/30/12.
5. The 30-day standardized yield for the 30 days ended 9/30/12 reflects an estimated yield to maturity (assuming all portfolio securities are held to maturity). It should be regarded as an estimate of the Fund’s rate of investment income, and it may not equal the Fund’s actual income distribution rate (which reflects the Fund’s past dividends paid to shareholders) or the income reported in the Fund’s financial statements.
6. Figures are as stated in the Fund’s prospectus current as of the date of this report. In periods of market volatility, assets may decline significantly, causing total annual Fund operating expenses to become higher than the figures shown.
7. Source: © 2012 Morningstar. The S&P 500 Index is a market capitalization-weighted index of 500 stocks designed to measure total U.S. equity market performance. The S&P 500 Utilities Index is market capitalization weighted and consists of all utility stocks in the S&P 500 Index.
Annual Report | 57
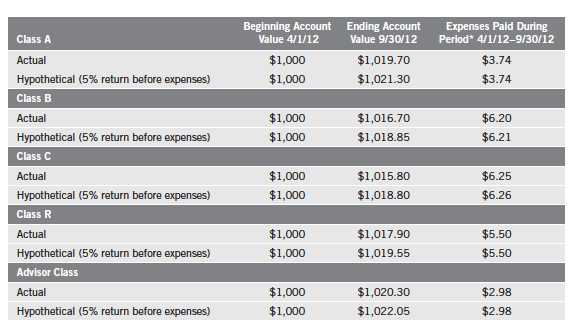
Your Fund’s Expenses
Franklin Utilities Fund
As a Fund shareholder, you can incur two types of costs:
- Transaction costs, including sales charges (loads) on Fund purchases; and
- Ongoing Fund costs, including management fees, distribution and service (12b-1) fees, and other Fund expenses. All mutual funds have ongoing costs, sometimes referred to as operating expenses.
The following table shows ongoing costs of investing in the Fund and can help you understand these costs and compare them with those of other mutual funds. The table assumes a $1,000 investment held for the six months indicated.
Actual Fund Expenses
The first line (Actual) for each share class listed in the table provides actual account values and expenses. The “Ending Account Value” is derived from the Fund’s actual return, which includes the effect of Fund expenses.
You can estimate the expenses you paid during the period by following these steps. Of course, your account value and expenses will differ from those in this illustration:
| 1. | Divide your account value by $1,000. |
| | If an account had an $8,600 value, then $8,600 ÷ $1,000 = 8.6. |
| 2. | Multiply the result by the number under the heading “Expenses Paid During Period.” |
| | If Expenses Paid During Period were $7.50, then 8.6 x $7.50 = $64.50. |
In this illustration, the estimated expenses paid this period are $64.50.
Hypothetical Example for Comparison with Other Funds
Information in the second line (Hypothetical) for each class in the table can help you compare ongoing costs of investing in the Fund with those of other mutual funds. This information may not be used to estimate the actual ending account balance or expenses you paid during the period. The hypothetical “Ending Account Value” is based on the actual expense ratio for each class and an assumed 5% annual rate of return before expenses, which does not represent the Fund’s actual return. The figure under the heading “Expenses Paid During Period” shows the hypothetical expenses your account would have incurred under this scenario. You can compare this figure with the 5% hypothetical examples that appear in shareholder reports of other funds.
58 | Annual Report
Your Fund’s Expenses (continued)
Please note that expenses shown in the table are meant to highlight ongoing costs and do not reflect any transaction costs, such as sales charges. Therefore, the second line for each class is useful in comparing ongoing costs only, and will not help you compare total costs of owning different funds. In addition, if transaction costs were included, your total costs would have been higher. Please refer to the Fund prospectus for additional information on operating expenses.
Annual Report | 59
60 | The accompanying notes are an integral part of these financial statements. | Annual Report
Annual Report | The accompanying notes are an integral part of these financial statements. | 61
62 | The accompanying notes are an integral part of these financial statements. | Annual Report
Annual Report | The accompanying notes are an integral part of these financial statements. | 63
64 | The accompanying notes are an integral part of these financial statements. | Annual Report
Annual Report | 65
66 | Annual Report
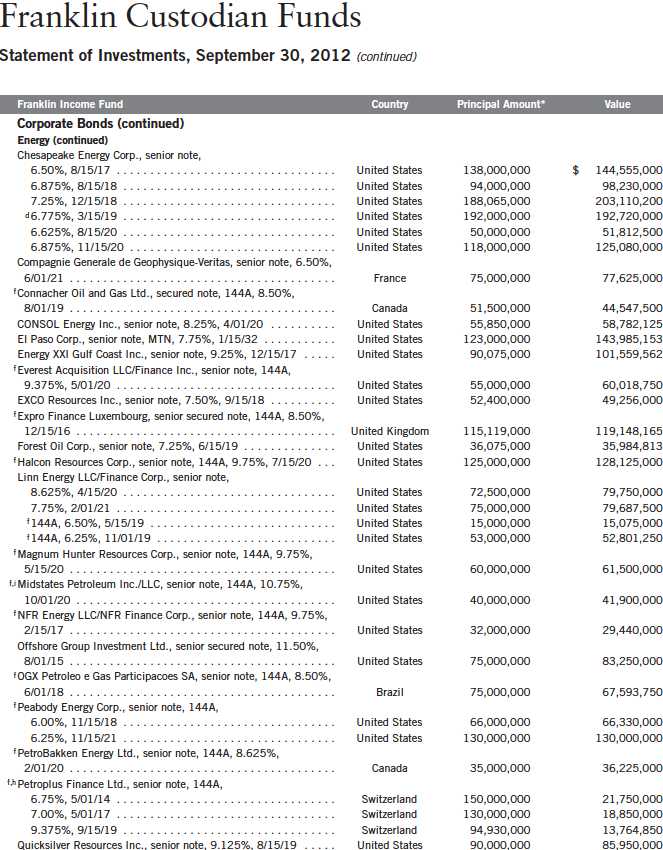
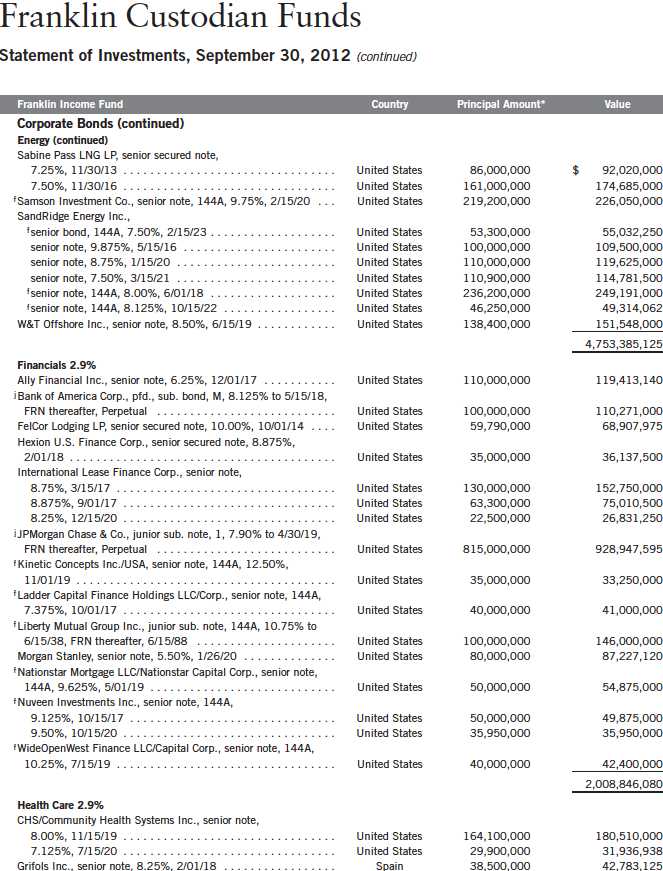
Franklin Custodian Funds
Statement of Investments, September 30, 2012 (continued)
68 | The accompanying notes are an integral part of these financial statements. | Annual Report
Annual Report | The accompanying notes are an integral part of these financial statements. | 69

70 | The accompanying notes are an integral part of these financial statements. | Annual Report
Annual Report | The accompanying notes are an integral part of these financial statements. | 71
72 | The accompanying notes are an integral part of these financial statements. | Annual Report
Annual Report | The accompanying notes are an integral part of these financial statements. | 73
Franklin Custodian Funds
Statement of Investments, September 30, 2012
76 | Annual Report
Annual Report | 77
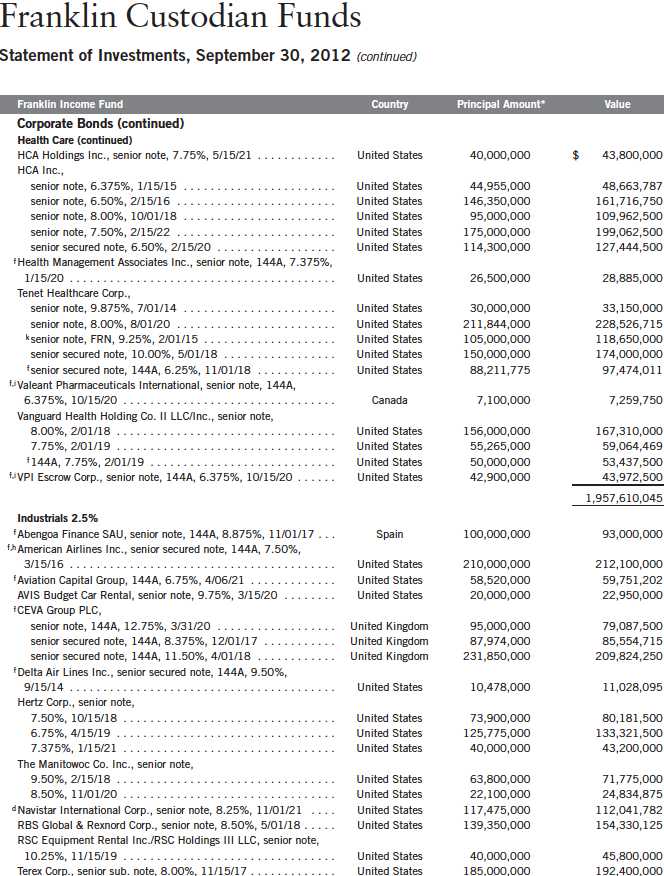
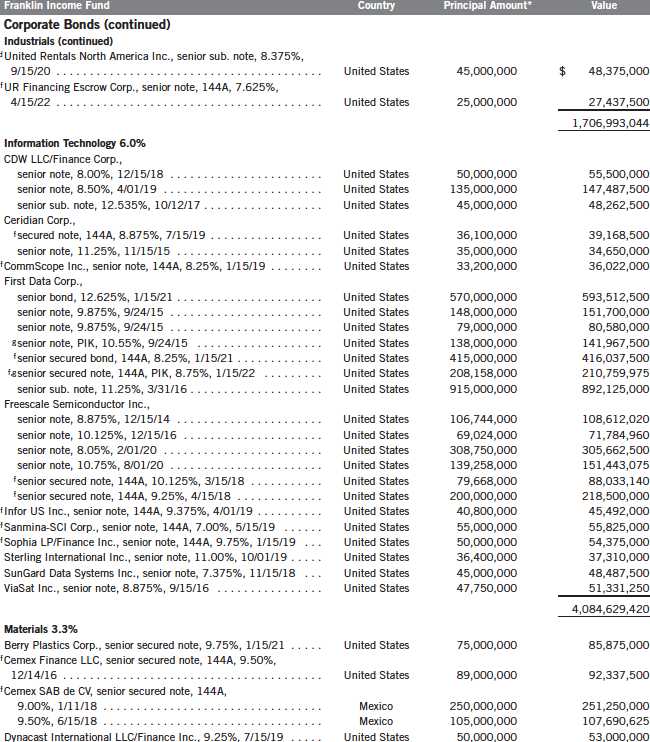
Franklin Custodian Funds
Statement of Investments, September 30, 2012 (continued)
Annual Report | The accompanying notes are an integral part of these financial statements. | 79
80 | The accompanying notes are an integral part of these financial statements. | Annual Report
Annual Report | The accompanying notes are an integral part of these financial statements. | 81
82 | The accompanying notes are an integral part of these financial statements. | Annual Report
Annual Report | The accompanying notes are an integral part of these financial statements. | 83
84 | The accompanying notes are an integral part of these financial statements. | Annual Report
Franklin Custodian Funds
Statement of Investments, September 30, 2012
Annual Report | 85
86 | Annual Report
Annual Report | 87
Franklin Custodian Funds
Statement of Investments, September 30, 2012 (continued)
88 | Annual Report
Franklin Custodian Funds
Statement of Investments, September 30, 2012 (continued)
Annual Report | 89
Franklin Custodian Funds
Statement of Investments, September 30, 2012 (continued)
90 | Annual Report
Annual Report | 91
Franklin Custodian Funds
Statement of Investments, September 30, 2012 (continued)
92 | Annual Report
Annual Report | 93
94 | Annual Report
Annual Report | 95
Franklin Custodian Funds
Statement of Investments, September 30, 2012 (continued)
96 | Annual Report
Franklin Custodian Funds
Statement of Investments, September 30, 2012 (continued)
Annual Report | 97
Franklin Custodian Funds
Statement of Investments, September 30, 2012 (continued)
98 | Annual Report
Franklin Custodian Funds
Statement of Investments, September 30, 2012 (continued)
100 | Annual Report
Annual Report | The accompanying notes are an integral part of these financial statements. | 101
102 | The accompanying notes are an integral part of these financial statements. | Annual Report
Annual Report | The accompanying notes are an integral part of these financial statements. | 103
104 | The accompanying notes are an integral part of these financial statements. | Annual Report
Annual Report | The accompanying notes are an integral part of these financial statements. | 105
106 | The accompanying notes are an integral part of these financial statements. | Annual Report
Annual Report | 107
108 | The accompanying notes are an integral part of these financial statements. | Annual Report
Annual Report | The accompanying notes are an integral part of these financial statements. | 109
110 | The accompanying notes are an integral part of these financial statements. | Annual Report
Annual Report | The accompanying notes are an integral part of these financial statements. | 111
112 | The accompanying notes are an integral part of these financial statements. | Annual Report
Annual Report | The accompanying notes are an integral part of these financial statements. | 113
Annual Report | The accompanying notes are an integral part of these financial statements. | 115
116 | The accompanying notes are an integral part of these financial statements. | Annual Report
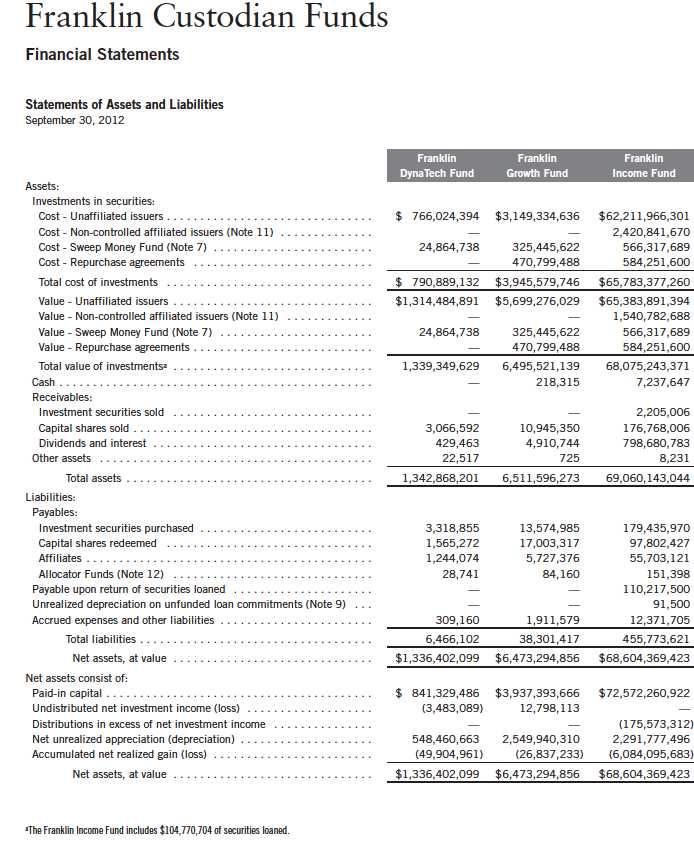
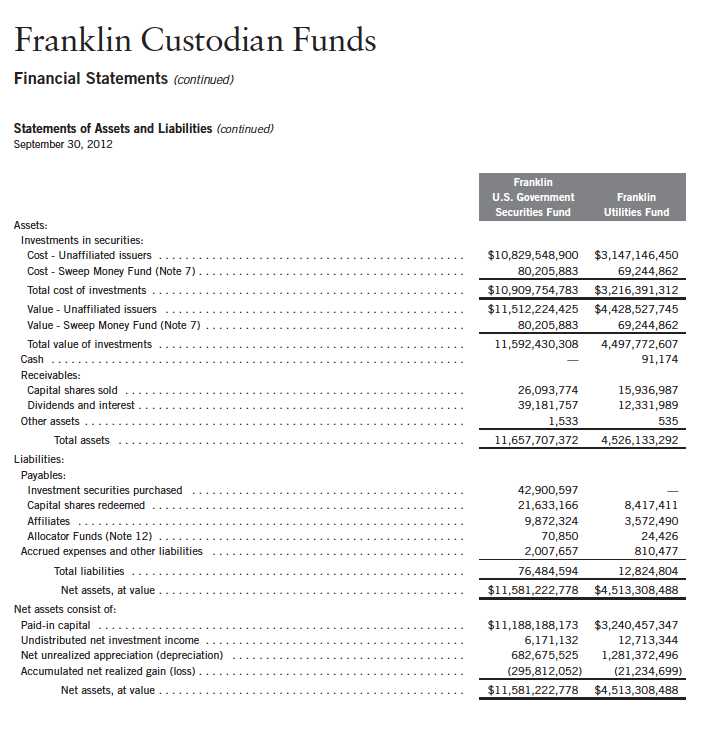
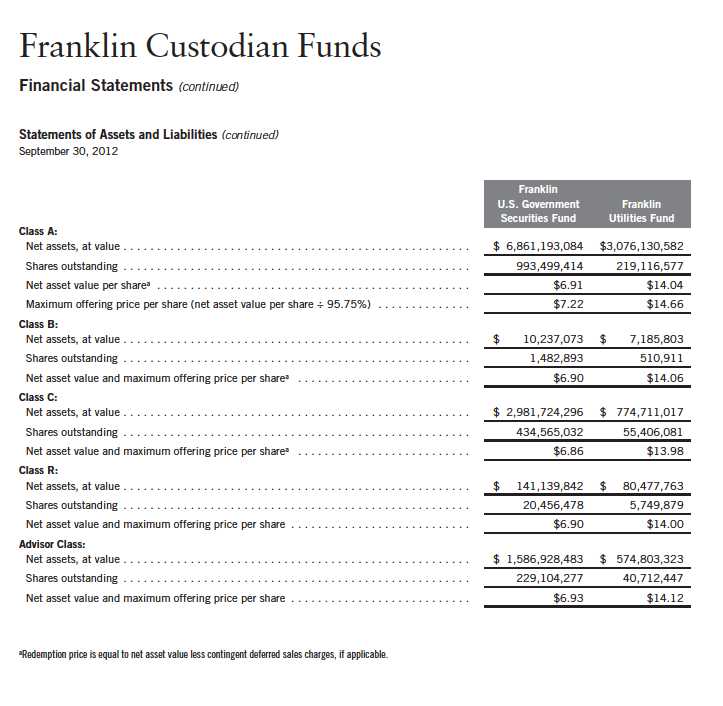
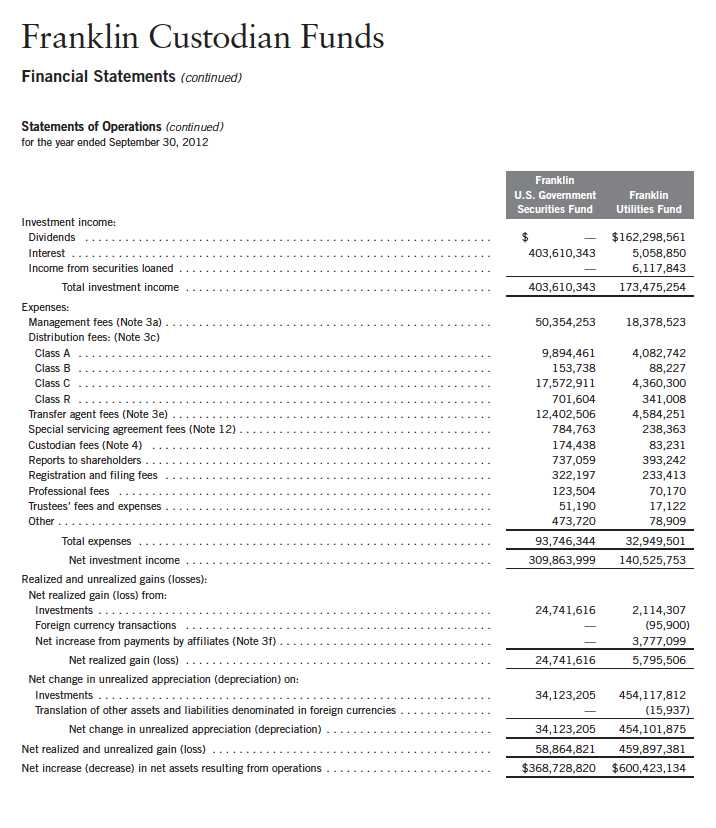
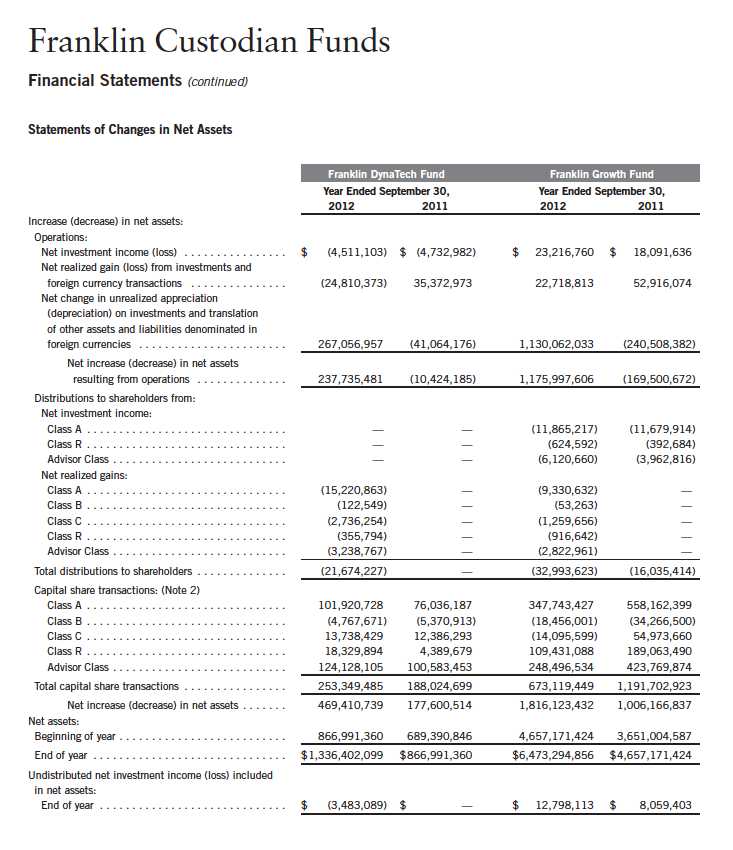
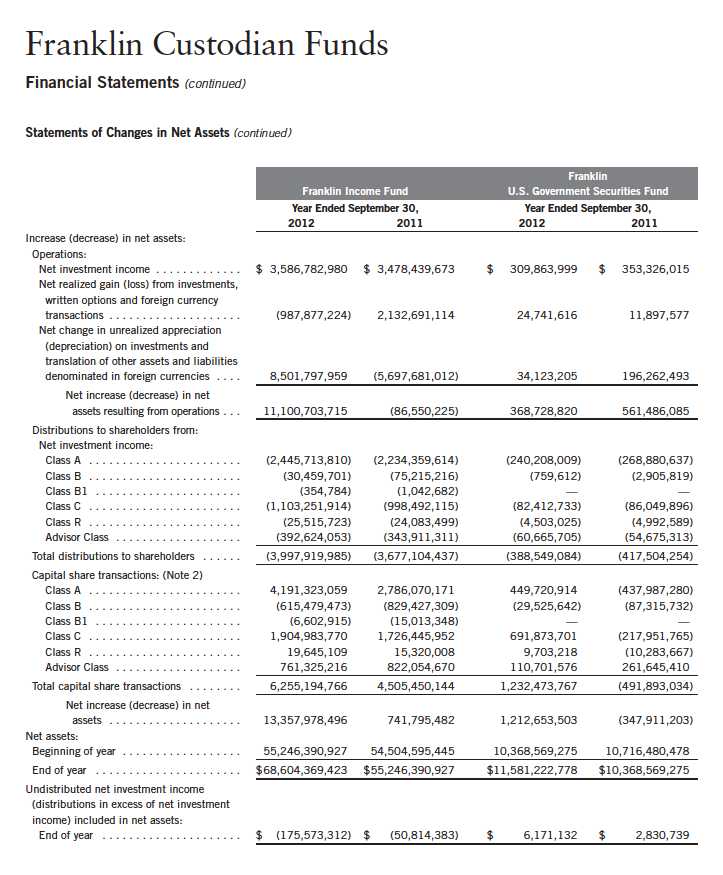
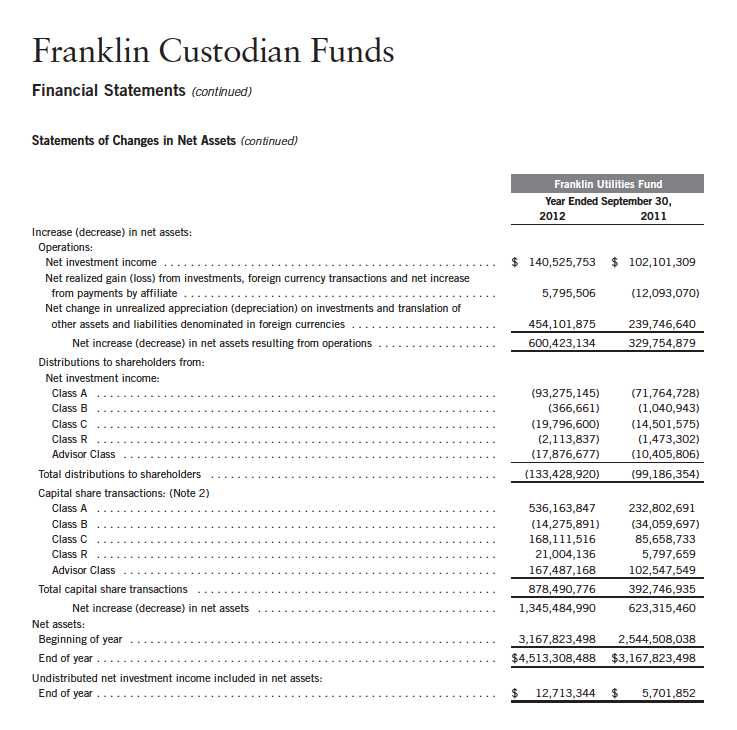
Franklin Custodian Funds
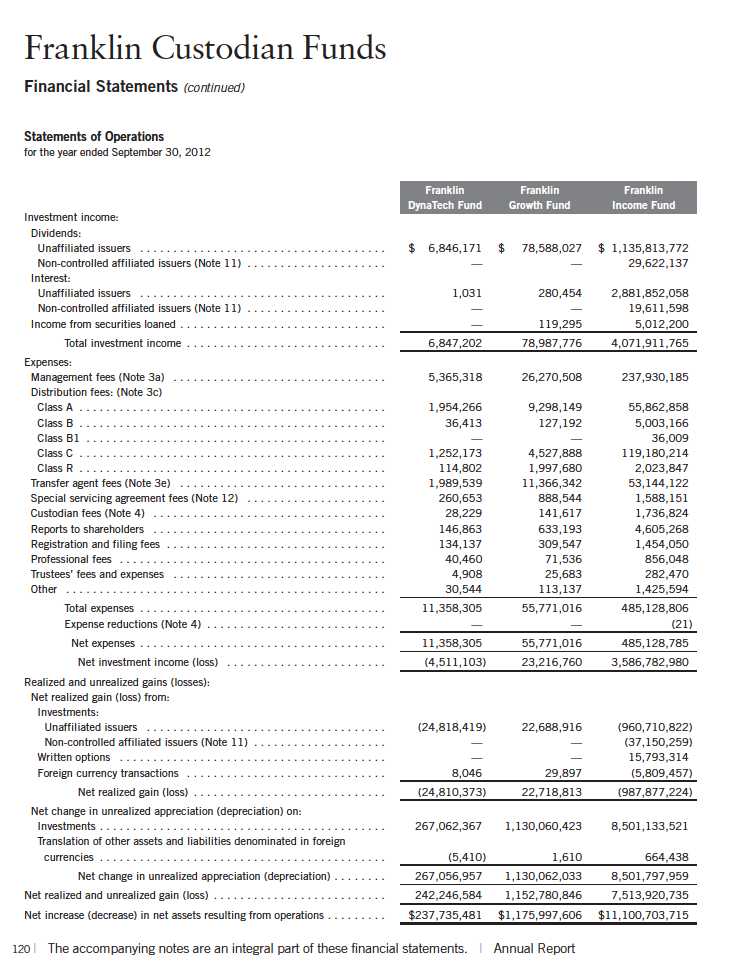
Financial Statements (continued)
Annual Report | The accompanying notes are an integral part of these financial statements. | 117
118 | The accompanying notes are an integral part of these financial statements. | Annual Report
Annual Report | The accompanying notes are an integral part of these financial statements. | 119
Annual Report | The accompanying notes are an integral part of these financial statements. | 121
122 | The accompanying notes are an integral part of these financial statements. | Annual Report
Annual Report | The accompanying notes are an integral part of these financial statements. | 123
124 | The accompanying notes are an integral part of these financial statements. | Annual Report
Franklin Custodian Funds
Notes to Financial Statements
1. ORGANIZATION AND SIGNIFICANT ACCOUNTING POLICIES
Franklin Custodian Funds (Trust) is registered under the Investment Company Act of 1940, as amended, (1940 Act) as an open-end investment company, consisting of five funds (Funds). The classes of shares offered within each of the Funds are indicated below. Each class of shares differs by its initial sales load, contingent deferred sales charges, distribution fees, voting rights on matters affecting a single class and its exchange privilege.

The following summarizes the Funds’ significant accounting policies.
a. Financial Instrument Valuation
The Funds’ investments in financial instruments are carried at fair value daily. Fair value is the price that would be received to sell an asset or paid to transfer a liability in an orderly transaction between market participants on the measurement date. Under procedures approved by the Trust’s Board of Trustees (the Board), the Funds’ administrator, investment manager and other affiliates have formed the Valuation and Liquidity Oversight Committee (VLOC). The VLOC provides administration and oversight of the Funds’ valuation policies and procedures, which are approved annually by the Board. Among other things, these procedures allow the Funds to utilize independent pricing services, quotations from securities and financial instrument dealers, and other market sources to determine fair value.
Equity securities and derivative financial instruments (derivatives) listed on an exchange or on the NASDAQ National Market System are valued at the last quoted sale price or the official closing price of the day, respectively. Foreign equity securities are valued as of the close of trading on the foreign stock exchange on which the security is primarily traded, or the NYSE, whichever is earlier. The value is then converted into its U.S. dollar equivalent at the foreign exchange rate in effect at the close of the NYSE on the day that the value of the security is determined. Over-the-counter (OTC) securities are valued within the range of the most recent quoted bid and ask prices. Securities that trade in multiple markets or on multiple exchanges are valued according to the broadest and most representative market. Certain equity securities are valued based upon fundamental characteristics or relationships to similar securities. Investments in open-end mutual funds and non-registered money market funds are valued at the closing net asset value.
Debt securities generally trade in the OTC market rather than on a securities exchange. The Funds’ pricing services use multiple valuation techniques to determine fair value. In instances where sufficient market activity exists, the pricing services may utilize a market-based approach through which quotes from market makers are used to determine fair value. In instances where sufficient market activity may not exist or is limited, the pricing services also utilize proprietary
Annual Report | 125
Franklin Custodian Funds
Notes to Financial Statements (continued)
| 1. | ORGANIZATION AND SIGNIFICANT ACCOUNTING POLICIES (continued) |
| a. | Financial Instrument Valuation (continued) |
valuation models which may consider market characteristics such as benchmark yield curves, credit spreads, estimated default rates, anticipated market interest rate volatility, coupon rates, anticipated timing of principal repayments, underlying collateral, and other unique security features in order to estimate the relevant cash flows, which are then discounted to calculate the fair value. Securities denominated in a foreign currency are converted into their U.S. dollar equivalent at the foreign exchange rate in effect at the close of the NYSE on the date that the values of the foreign debt securities are determined. Repurchase agreements are valued at cost, which approximates market value.
The Funds have procedures to determine the fair value of financial instruments for which market prices are not reliable or readily available. Under these procedures, the VLOC convenes on a regular basis to review such financial instruments and considers a number of factors, including significant unobservable valuation inputs, when arriving at fair value. The VLOC primarily employs a market-based approach which may use related or comparable assets or liabilities, recent transactions, market multiples, book values, and other relevant information for the investment to determine the fair value of the investment. An income-based valuation approach may also be used in which the anticipated future cash flows of the investment are discounted to calculate fair value. Discounts may also be applied due to the nature or duration of any restrictions on the disposition of the investments. Due to the inherent uncertainty of valuations of such investments, the fair values may differ significantly from the values that would have been used had an active market existed. The VLOC employs various methods for calibrating these valuation approaches including a regular review of key inputs and assumptions, transactional back-testing or disposition analysis, and reviews of any related market activity.
Trading in securities on foreign securities stock exchanges and OTC markets may be completed before the daily close of business on the NYSE. Occasionally, events occur between the time at which trading in a foreign security is completed and the close of the NYSE that might call into question the reliability of the value of a portfolio security held by the fund. As a result, differences may arise between the value of the Funds’ portfolio securities as determined at the foreign market close and the latest indications of value at the close of the NYSE. In order to minimize the potential for these differences, the VLOC monitors price movements following the close of trading in foreign stock markets through a series of country specific market proxies (such as baskets of American Depositary Receipts, futures contracts and exchange traded funds). These price movements are measured against established trigger thresholds for each specific market proxy to assist in determining if an event has occurred that may call into question the reliability of the values of the foreign securities held by the Funds. If such an event occurs, the securities may be valued using fair value procedures, which may include the use of independent pricing services.
126 | Annual Report
Franklin Custodian Funds
Notes to Financial Statements (continued)
| 1. | ORGANIZATION AND SIGNIFICANT ACCOUNTING POLICIES (continued) |
| b. | Foreign Currency Translation |
Portfolio securities and other assets and liabilities denominated in foreign currencies are translated into U.S. dollars based on the exchange rate of such currencies against U.S. dollars on the date of valuation. The Funds may enter into foreign currency exchange contracts to facilitate transactions denominated in a foreign currency. Purchases and sales of securities, income and expense items denominated in foreign currencies are translated into U.S. dollars at the exchange rate in effect on the transaction date. Portfolio securities and assets and liabilities denominated in foreign currencies contain risks that those currencies will decline in value relative to the U.S. dollar. Occasionally, events may impact the availability or reliability of foreign exchange rates used to convert the U.S. dollar equivalent value. If such an event occurs, the foreign exchange rate will be valued at fair value using procedures established and approved by the Board.
The Funds do not separately report the effect of changes in foreign exchange rates from changes in market prices on securities held. Such changes are included in net realized and unrealized gain or loss from investments on the Statement of Operations.
Realized foreign exchange gains or losses arise from sales of foreign currencies, currency gains or losses realized between the trade and settlement dates on securities transactions and the difference between the recorded amounts of dividends, interest, and foreign withholding taxes and the U.S. dollar equivalent of the amounts actually received or paid. Net unrealized foreign exchange gains and losses arise from changes in foreign exchange rates on foreign denominated assets and liabilities other than investments in securities held at the end of the reporting period.
c. Joint Repurchase Agreement
Certain funds enter into a joint repurchase agreement whereby their uninvested cash balance is deposited into a joint cash account with other funds managed by the investment manager or an affiliate of the investment manager and is used to invest in one or more repurchase agreements. The value and face amount of the joint repurchase agreement are allocated to the funds based on their pro-rata interest. A repurchase agreement is accounted for as a loan by the fund to the seller, collateralized by securities which are delivered to the fund’s custodian. The market value, including accrued interest, of the initial collateralization is required to be at least 102% of the dollar amount invested by the funds, with the value of the underlying securities marked to market daily to maintain coverage of at least 100%. The joint repurchase agreement held by the funds at year end had been entered into on September 28, 2012.
d. Securities Purchased on a When-Issued, Delayed Delivery, and TBA Basis
Certain funds purchase securities on a when-issued, delayed delivery, and to-be-announced (TBA) basis, with payment and delivery scheduled for a future date. These transactions are subject to market fluctuations and are subject to the risk that the value at delivery may be more or less than
Annual Report | 127
Franklin Custodian Funds
Notes to Financial Statements (continued)
| 1. | ORGANIZATION AND SIGNIFICANT ACCOUNTING POLICIES (continued) |
| d. | Securities Purchased on a When-Issued, Delayed Delivery, and TBA Basis (continued) |
the trade date purchase price. Although the funds will generally purchase these securities with the intention of holding the securities, they may sell the securities before the settlement date. Sufficient assets have been segregated for these securities.
e. Derivative Financial Instruments
The Franklin Income Fund invested in derivatives in order to manage risk or gain exposure to various other investments or markets. Derivatives are financial contracts based on an underlying or notional amount, require no initial investment or an initial net investment that is smaller than would normally be required to have a similar response to changes in market factors, and require or permit net settlement. Derivatives contain various risks including the potential inability of the counterparty to fulfill their obligations under the terms of the contract, the potential for an illiquid secondary market, and/or the potential for market movements which expose the fund to gains or losses in excess of the amounts shown on the Statements of Assets and Liabilities. Realized gain and loss and unrealized appreciation and depreciation on these contracts for the period are included in the Statements of Operations.
The Franklin Income Fund purchased or wrote exchange traded option contracts primarily to manage exposure to equity price risk. An option is a contract entitling the holder to purchase or sell a specific amount of shares or units of an asset or notional amount of a swap (swaption), at a specified price. Options purchased are recorded as an asset while options written are recorded as a liability. Upon exercise of an option, the acquisition cost or sales proceeds of the underlying investment is adjusted by any premium received or paid. Upon expiration of an option, any premium received or paid is recorded as a realized gain or loss. Upon closing an option other than through expiration or exercise, the difference between the premium and the cost to close the position is recorded as a realized gain or loss. Pursuant to the terms of the written option contract, cash or securities may be required to be deposited as collateral.
See Notes 6 and 10 regarding investment transactions and other derivative information, respectively.
f. Equity-Linked Securities
The Franklin Income Fund invests in equity-linked securities. Equity-linked securities are hybrid financial instruments that generally combine both debt and equity characteristics into a single note form. Income received from equity linked securities is recorded as realized gains in the Statements of Operations and may be based on the performance of an underlying equity security, an equity index, or an option position. The risks of investing in equity-linked securities include unfavorable price movements in the underlying security and the credit risk of the issuing financial institution. There may be no guarantee of a return of principal with equity linked securities and the appreciation potential may be limited. Equity-linked securities may be more volatile and less liquid than other investments held by the fund.
128 | Annual Report
Franklin Custodian Funds
Notes to Financial Statements (continued)
| 1. | ORGANIZATION AND SIGNIFICANT ACCOUNTING POLICIES (continued) |
| g. | Securities Lending |
Certain funds participate in an agency based securities lending program. The fund receives cash collateral against the loaned securities in an amount equal to at least 102% of the market value of the loaned securities. Collateral is maintained over the life of the loan in an amount not less than 100% of the market value of loaned securities, as determined at the close of fund business each day; any additional collateral required due to changes in security values is delivered to the fund on the next business day. The collateral is invested in a non-registered money fund as indicated on the Statement of Investments. The fund receives income from the investment of cash collateral, in addition to lending fees and rebates paid by the borrower. The fund bears the market risk with respect to the collateral investment, securities loaned, and the risk that the agent may default on its obligations to the fund. The securities lending agent has agreed to indemnify the fund in the event of default by a third party borrower.
h. Senior Floating Rate Interests
The Franklin Income Fund invests in senior secured corporate loans that pay interest at rates which are periodically reset by reference to a base lending rate plus a spread. These base lending rates are generally the prime rate offered by a designated U.S. bank or the London InterBank Offered Rate (LIBOR). Senior secured corporate loans often require prepayment of principal from excess cash flows or at the discretion of the borrower. As a result, actual maturity may be substantially less than the stated maturity.
Senior secured corporate loans in which the fund invests are generally readily marketable, but may be subject to some restrictions on resale.
i. Income Taxes
It is each fund’s policy to qualify as a regulated investment company under the Internal Revenue Code. Each fund intends to distribute to shareholders substantially all of its taxable income and net realized gains to relieve it from federal income and excise taxes. As a result, no provision for U.S. federal income taxes is required.
The Funds may be subject to foreign taxation related to income received, capital gains on the sale of securities and certain foreign currency transactions in the foreign jurisdictions in which it invests. Foreign taxes, if any, are recorded based on the tax regulations and rates that exist in the foreign markets in which the Funds invest. When a capital gain tax is determined to apply the Funds record an estimated deferred tax liability in an amount that would be payable if the securities were disposed of on the valuation date.
Each fund recognizes the tax benefits of uncertain tax positions only when the position is “more likely than not” to be sustained upon examination by the tax authorities based on the technical merits of the tax position. As of September 30, 2012, and for all open tax years, each fund has
Annual Report | 129
Franklin Custodian Funds
Notes to Financial Statements (continued)
| 1. | ORGANIZATION AND SIGNIFICANT ACCOUNTING POLICIES (continued) |
| i. | Income Taxes (continued) |
determined that no liability for unrecognized tax benefits is required in each fund’s financial statements related to uncertain tax positions taken on a tax return (or expected to be taken on future tax returns). Open tax years are those that remain subject to examination and are based on each tax jurisdiction statute of limitation.
j. Security Transactions, Investment Income, Expenses and Distributions
Security transactions are accounted for on trade date. Realized gains and losses on security transactions are determined on a specific identification basis. Interest income and estimated expenses are accrued daily. Amortization of premium and accretion of discount on debt securities are included in interest income. Facility fees are recognized as income over the expected term of the loan. Dividend income is recorded on the ex-dividend date except that certain dividends from foreign securities are recognized as soon as the Funds are notified of the ex-dividend date. Distributions to shareholders are recorded on the ex-dividend date and are determined according to income tax regulations (tax basis). Distributable earnings determined on a tax basis may differ from earnings recorded in accordance with accounting principles generally accepted in the United States of America. These differences may be permanent or temporary. Permanent differences are reclassified among capital accounts to reflect their tax character. These reclassifications have no impact on net assets or the results of operations. Temporary differences are not reclassified, as they may reverse in subsequent periods.
Common expenses incurred by the Trust are allocated among the Funds based on the ratio of net assets of each fund to the combined net assets of the Trust. Fund specific expenses are charged directly to the fund that incurred the expense.
Realized and unrealized gains and losses and net investment income, not including class specific expenses, are allocated daily to each class of shares based upon the relative proportion of net assets of each class. Differences in per share distributions, by class, are generally due to differences in class specific expenses.
k. Accounting Estimates
The preparation of financial statements in accordance with accounting principles generally accepted in the United States of America requires management to make estimates and assumptions that affect the reported amounts of assets and liabilities at the date of the financial statements and the amounts of income and expenses during the reporting period. Actual results could differ from those estimates.
130 | Annual Report
Franklin Custodian Funds
Notes to Financial Statements (continued)
| 1. | ORGANIZATION AND SIGNIFICANT ACCOUNTING POLICIES (continued) |
| l. | Guarantees and Indemnifications |
Under the Trust’s organizational documents, its officers and trustees are indemnified by the Trust against certain liabilities arising out of the performance of their duties to the Trust. Additionally, in the normal course of business, the Trust, on behalf of the Funds, enters into contracts with service providers that contain general indemnification clauses. The Trust’s maximum exposure under these arrangements is unknown as this would involve future claims that may be made against the Trust that have not yet occurred. Currently, the Trust expects the risk of loss to be remote.
2. SHARES OF BENEFICIAL INTEREST
At September 30, 2012, there were an unlimited number of shares authorized (without par value).
Transactions in the Funds’ shares were as follows:
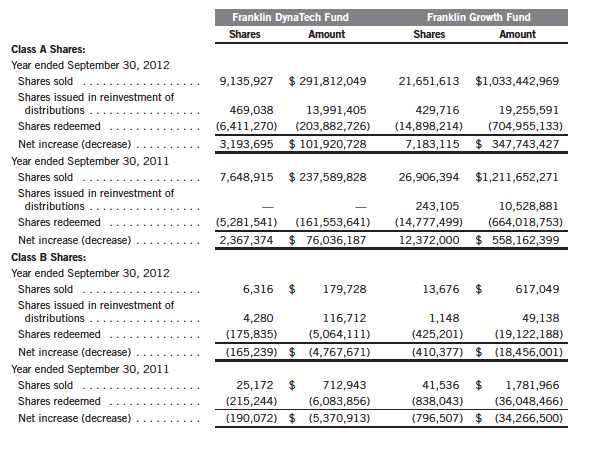
Annual Report | 131
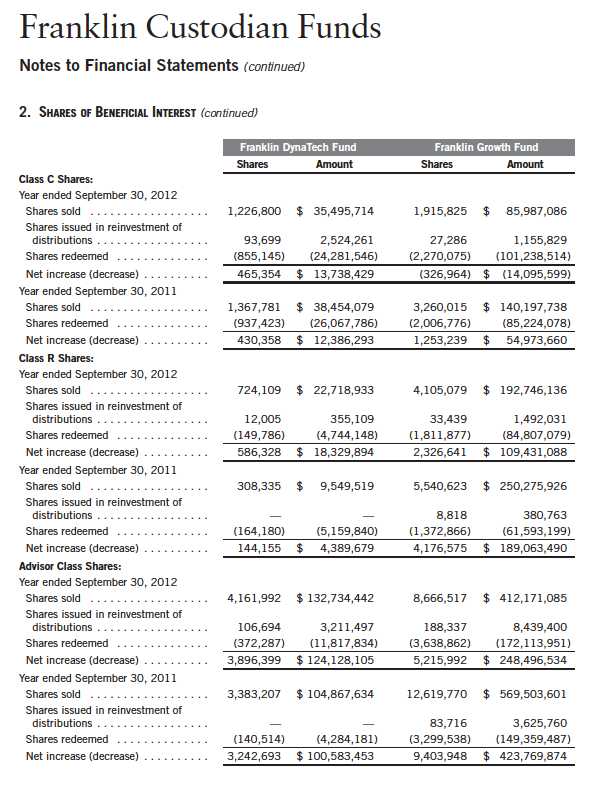
132 | Annual Report
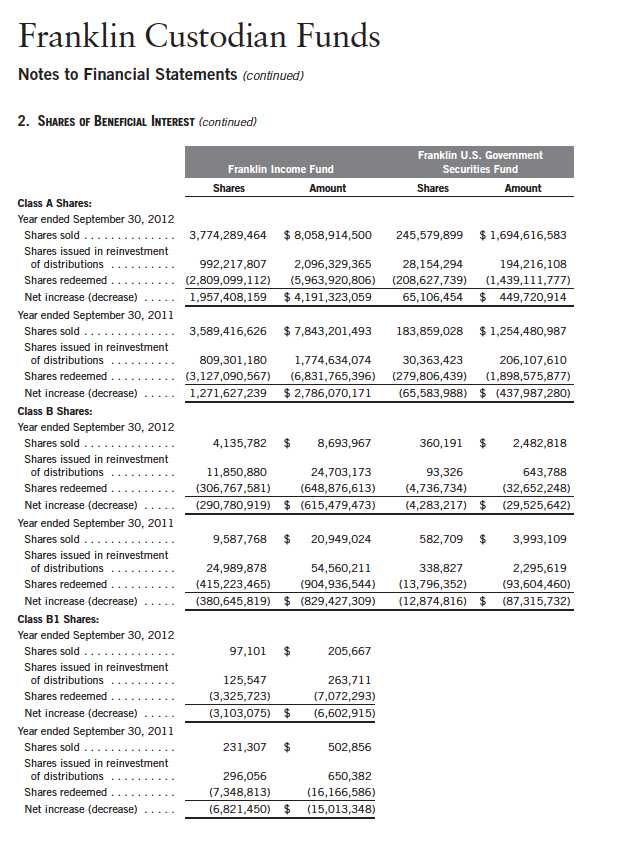
Annual Report | 133
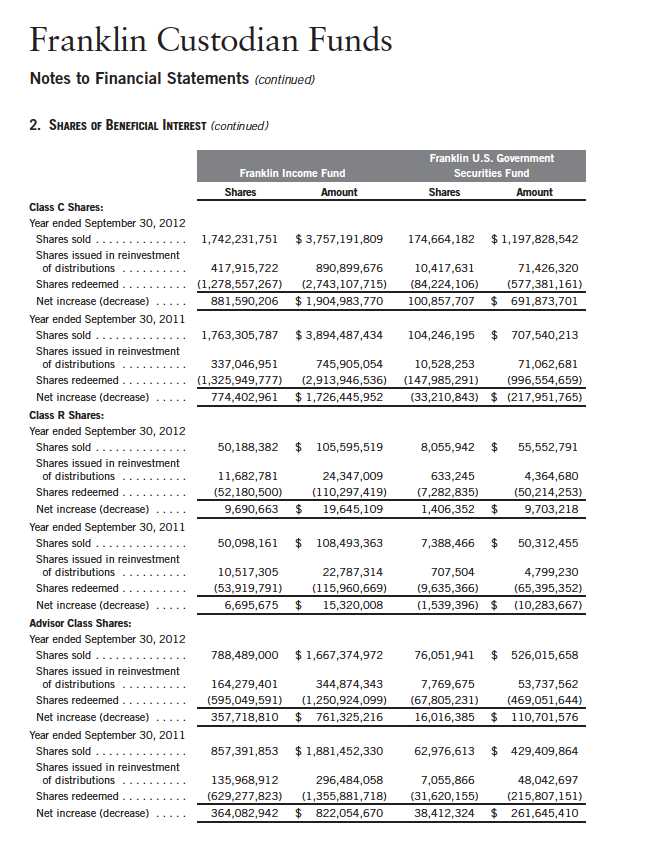
134 | Annual Report
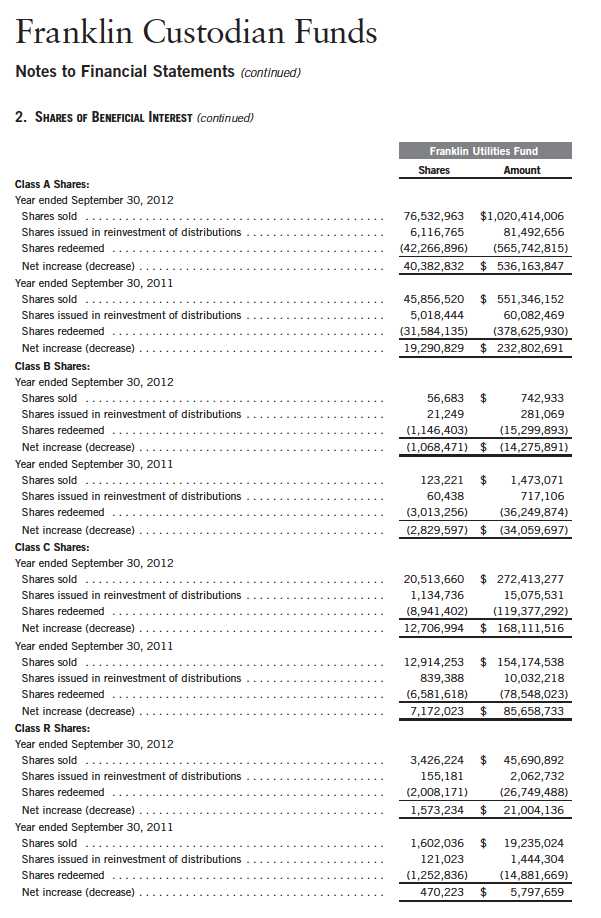
Annual Report | 135
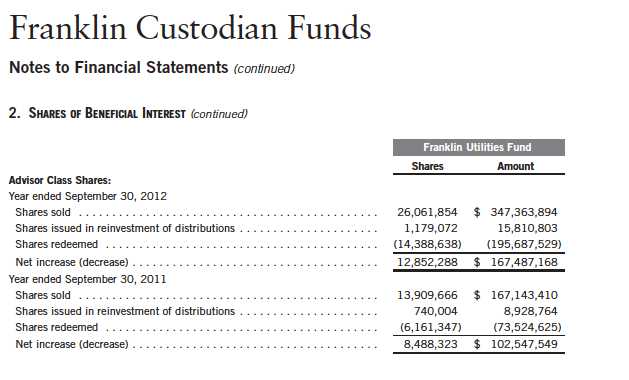
3. TRANSACTIONS WITH AFFILIATES
Franklin Resources, Inc. is the holding company for various subsidiaries that together are referred to as Franklin Templeton Investments. Certain officers and trustees of the Trust are also officers and/or directors of the following subsidiaries:
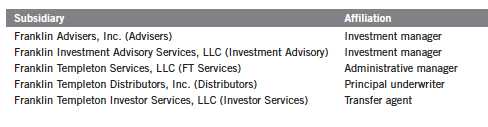
a. Management Fees
The Franklin Income Fund and Franklin Utilities Fund pay an investment management fee to Advisers based on the month-end net assets of each of the funds as follows:
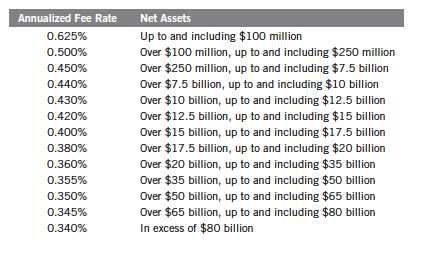
136 | Annual Report
Franklin Custodian Funds
Notes to Financial Statements (continued)
| 3. | TRANSACTIONS WITH AFFILIATES (continued) |
| a. | Management Fees (continued) |
The Franklin DynaTech Fund, the Franklin Growth Fund, and the Franklin U.S. Government Securities Fund pay an investment management fee to Advisers based on the month-end net assets of each of the funds as follows:
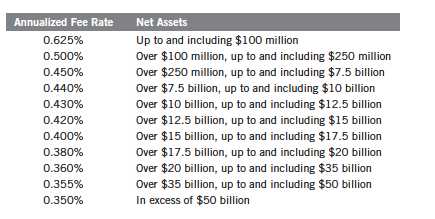
Under a subadvisory agreement, Investment Advisory, an affiliate of Advisers, provides sub-advisory services to the Franklin Growth Fund. The subadvisory fee is paid by Advisers based on the average monthly net assets, and is not an additional expense to the fund.
b. Administrative Fees
Under an agreement with Advisers, FT Services provides administrative services to the Funds. The fee is paid by Advisers based on average daily net assets, and is not an additional expense of the Funds.
c. Distribution Fees
The Board has adopted distribution plans for each share class, with the exception of Advisor Class shares, pursuant to Rule 12b-1 under the 1940 Act. Distribution fees are not charged on shares held by affiliates. Under the Funds’ Class A reimbursement distribution plans, the Funds reimburse Distributors for costs incurred in connection with the servicing, sale and distribution of each fund’s shares up to the maximum annual plan rate for each class. Under the Class A reimbursement distribution plans, costs exceeding the maximum for the current plan year cannot be reimbursed in subsequent periods. In addition, under the Funds’ Class B, B1, C and R compensation distribution plans, the Funds pay Distributors for costs incurred in connection with the servicing, sale and distribution of each fund’s shares up to the maximum annual plan rate for each class.
Annual Report | 137
Franklin Custodian Funds
Notes to Financial Statements (continued)
| 3. | TRANSACTIONS WITH AFFILIATES (continued) |
| c. | Distribution Fees (continued) |
The maximum annual plan rates, based on the average daily net assets, for each class, are as follows:
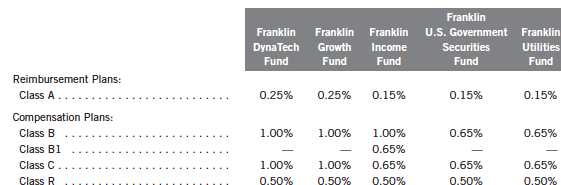
d. Sales Charges/Underwriting Agreements
Front-end sales charges and contingent deferred sales charges (CDSC) do not represent expenses of the Funds. These charges are deducted from the proceeds of sales of fund shares prior to investment or from redemption proceeds prior to remittance, as applicable. Distributors has advised the Funds of the following commission transactions related to the sales and redemptions of the Funds’ shares for the year:
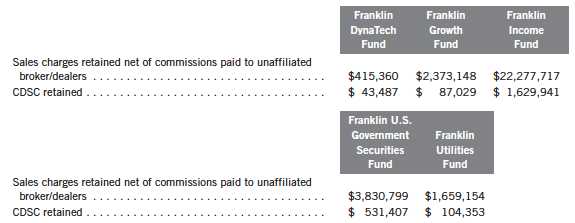
e. Transfer Agent Fees
For the year ended September 30, 2012, the Funds paid transfer agent fees as noted in the Statements of Operations of which the following amounts were retained by Investor Services:
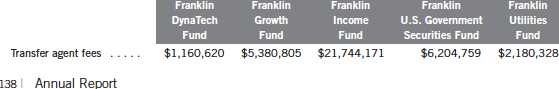
Franklin Custodian Funds
Notes to Financial Statements (continued)
| 3. | TRANSACTIONS WITH AFFILIATES (continued) |
| f. | Payments by Affiliates |
During the year ended September 30, 2012, FT Services reimbursed the Franklin Utilities Fund $3,777,099 for a trading error which occurred during the year. The net effect of losses incurred and the reimbursement by FT Services had no impact on total return.
4. EXPENSE OFFSET ARRANGEMENT
The Funds have entered into an arrangement with their custodian whereby credits realized as a result of uninvested cash balances are used to reduce a portion of the Funds’ custodian expenses. During the year ended September 30, 2012, the custodian fees were reduced as noted in the Statements of Operations.
5. INCOME TAXES
For tax purposes, capital losses may be carried over to offset future capital gains, if any. Under the Regulated Investment Company Modernization Act of 2010, capital losses incurred by the Funds in taxable years beginning after December 22, 2010 are not subject to expiration and such losses retain their character as either short-term or long-term, rather than being considered short-term as under previous law. Post-enactment capital losses must be fully utilized prior to utilizing any losses incurred in pre-enactment tax years.
At September 30, 2012, the capital loss carryforwards were as follows:
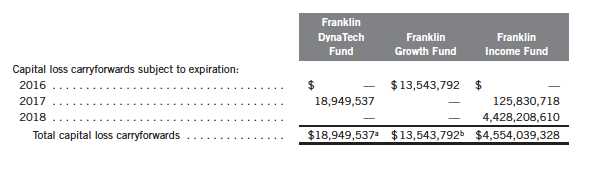
Annual Report | 139
Franklin Custodian Funds
Notes to Financial Statements (continued)
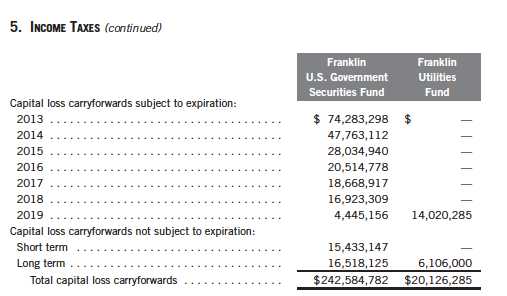
aIncludes $18,949,537 from the merged Franklin Global Communications Fund and Franklin Technology Fund, which may be carried over to offset future capital gains, subject to certain limitations. bIncludes $13,543,792 from the merged Franklin Capital Growth Fund, which may be carried over to offset future capital gains, subject to certain limitations.
During the year ended September 30, 2012, the Funds utilized capital loss carryforwards as follows:
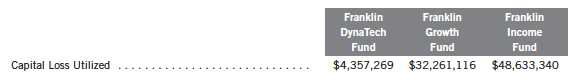
On September 30, 2012, the Franklin U.S. Government Securities Fund had expired pre-enactment capital loss carryforwards of $129,102,166, which were reclassified to paid-in capital.
For tax purposes, the funds may elect to defer any portion of a post-October capital loss or late-year ordinary loss to the first day of the following year. At September 30, 2012, the deferred post-October capital losses and late-year ordinary losses were as follows:
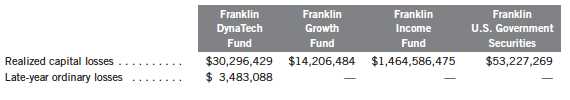
140 | Annual Report
Franklin Custodian Funds
Notes to Financial Statements (continued)
5. INCOME TAXES (continued)
The tax character of distributions paid during the years ended September 30, 2012 and 2011, was as follows:
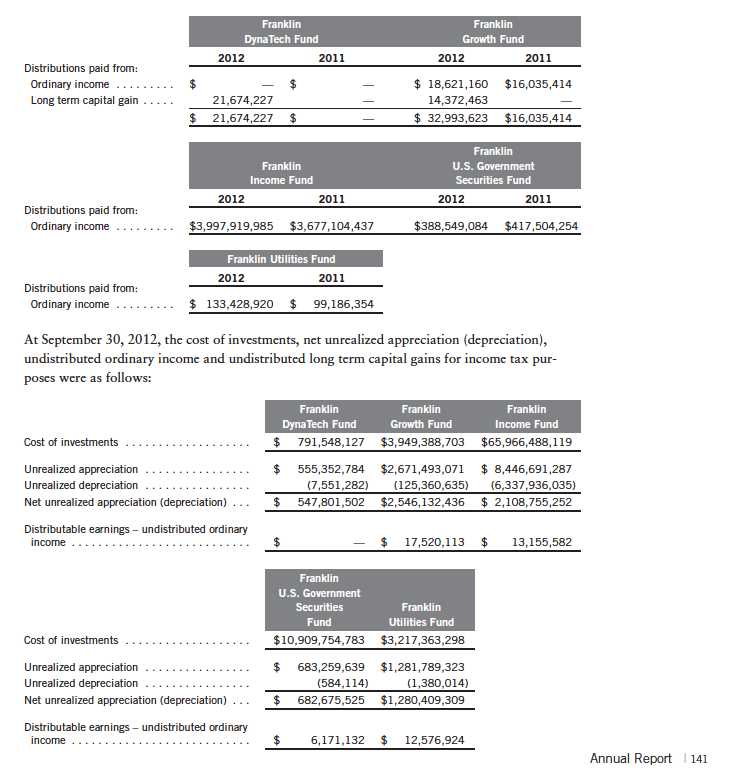
Franklin Custodian Funds
Notes to Financial Statements (continued)
5. INCOME TAXES (continued)
Differences between income and/or capital gains as determined on a book basis and a tax basis are primarily due to differing treatments of defaulted securities, foreign currency transactions, paydown losses, payments-in-kind, bond discounts and premiums, corporate actions, regulatory settlements and wash sales.
6. INVESTMENT TRANSACTIONS
Purchases and sales of investments (excluding short term securities) for the year ended September 30, 2012, were as follows:
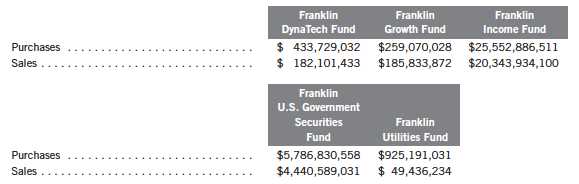
Transactions in options written during the year ended September 30, 2012, were as follows:
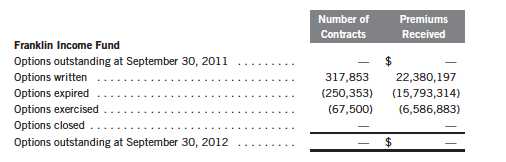
See Notes 1(e) and 10 regarding derivative financial instruments and other derivative information, respectively.
7. INVESTMENTS IN INSTITUTIONAL FIDUCIARY TRUST MONEY MARKET PORTFOLIO
The Funds invest in the Institutional Fiduciary Trust Money Market Portfolio (Sweep Money Fund), an open-end investment company managed by Advisers. Management fees paid by the Funds are reduced on assets invested in the Sweep Money Fund, in an amount not to exceed the management and administrative fees paid by the Sweep Money Fund.
142 | Annual Report
Franklin Custodian Funds
Notes to Financial Statements (continued)
8. CREDIT RISK AND DEFAULTED SECURITIES
At September 30, 2012, the Franklin Income Fund had 45.51% of its portfolio invested in high yield, senior secured floating rate notes, or other securities rated below investment grade. These securities may be more sensitive to economic conditions causing greater price volatility and are potentially subject to a greater risk of loss due to default than higher rated securities.
The Franklin Income Fund held defaulted securities and/or other securities for which the income has been deemed uncollectible. At September 30, 2012, the aggregate value of these securities was $891,712,475, representing 1.30% of the Fund’s net assets. The Fund discontinues accruing income on securities for which income has been deemed uncollectible and provides an estimate for losses on interest receivable. The securities have been identified on the accompanying Statement of Investments.
9. UNFUNDED LOAN COMMITMENTS
The Franklin Income Fund enters into certain credit agreements, all or a portion of which may be unfunded. The fund is obligated to fund these loan commitments at the borrowers’ discretion. Funded portions of credit agreements are presented on the Statement of Investments.
At September 30, 2012, unfunded commitments were as follows:
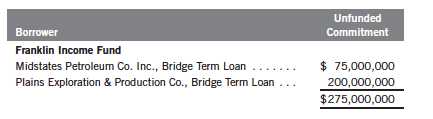
Unfunded loan commitments and funded portions of credit agreements are marked to market daily and any unrealized appreciation or depreciation is included in the Statements of Assets and Liabilities and the Statements of Operations.
10. OTHER DERIVATIVE INFORMATION
For the year ended September 30, 2012, the effect of derivative contracts on the Franklin Income Fund’s Statement of Operations was as follows:
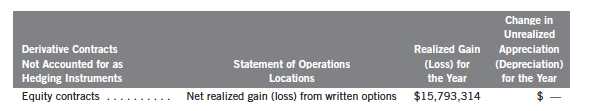
For the year ended September 30, 2012, the average month end market value of derivatives represented less than 0.01% of average month end net assets. The average month end number of open derivative contracts for the year was 4.
Annual Report | 143
Franklin Custodian Funds
Notes to Financial Statements (continued)
10. OTHER DERIVATIVE INFORMATION (continued)
See Notes 1(e) and 6 regarding derivative financial instruments and investment transactions, respectively.
11. HOLDINGS OF 5% VOTING SECURITIES OF PORTFOLIO COMPANIES
The 1940 Act defines “affiliated companies” to include investments in portfolio companies in which a fund owns 5% or more of the outstanding voting securities. Investments in “affiliated companies” for the Franklin Income Fund for the year ended September 30, 2012, were as shown below.
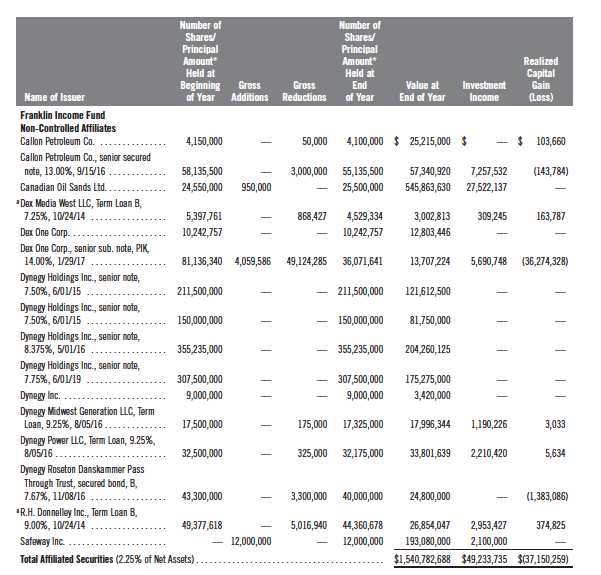
*In U.S. dollars unless otherwise indicated.
aCompany is a wholly owned subsidiary of Dex One Corp.
144 | Annual Report
Franklin Custodian Funds
Notes to Financial Statements (continued)
12. SPECIAL SERVICING AGREEMENT
The Funds, which are eligible underlying investments of one or more of the Franklin Templeton Fund Allocator Series Funds (Allocator Funds), participates in a Special Servicing Agreement (SSA) with the Allocator Funds and certain service providers of the Funds and the Allocator Funds. Under the SSA, the Funds may pay a portion of the Allocator Funds’ expenses (other than any asset allocation, administrative and distribution fees), to the extent such payments are less than the amount of the benefits realized or expected to be realized by the Funds (e.g., due to reduced costs associated with servicing accounts) from the investment in the Funds by the Allocator Funds. The Allocator Funds are either managed by Advisers or administered by FT Services. For the year ended September 30, 2012, the Funds were held by one or more of the Allocator Funds and the amount of expenses borne by the Funds is noted in the Statements of Operations. At September 30, 2012, one or more of the Allocator Funds owned a percentage of the Funds’ outstanding shares as follows:
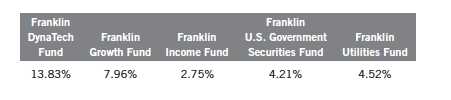
13. CREDIT FACILITY
The Funds, together with other U.S. registered and foreign investment funds (collectively, Borrowers), managed by Franklin Templeton Investments, are borrowers in a joint syndicated senior unsecured credit facility totaling $1.5 billion (Global Credit Facility) which matures on January 18, 2013. This Global Credit Facility provides a source of funds to the Borrowers for temporary and emergency purposes, including the ability to meet future unanticipated or unusually large redemption requests.
Under the terms of the Global Credit Facility, the Funds shall, in addition to interest charged on any borrowings made by the Funds and other costs incurred by the Funds, pay their share of fees and expenses incurred in connection with the implementation and maintenance of the Global Credit Facility, based upon their relative share of the aggregate net assets of all of the Borrowers, including an annual commitment fee of 0.08% based upon the unused portion of the Global Credit Facility, which is reflected in other expenses on the Statements of Operations. During the year ended September 30, 2012, the Funds did not use the Global Credit Facility.
Annual Report | 145
Franklin Custodian Funds
Notes to Financial Statements (continued)
14. FAIR VALUE MEASUREMENTS
The Funds follow a fair value hierarchy that distinguishes between market data obtained from independent sources (observable inputs) and the Funds’ own market assumptions (unobservable inputs). These inputs are used in determining the value of the Funds’ financial instruments and are summarized in the following fair value hierarchy:
- Level 1 – quoted prices in active markets for identical financial instruments
- Level 2 – other significant observable inputs (including quoted prices for similar financial instruments, interest rates, prepayment speed, credit risk, etc.)
- Level 3 – significant unobservable inputs (including the Funds’ own assumptions in deter- mining the fair value of financial instruments)
The inputs or methodology used for valuing financial instruments are not an indication of the risk associated with investing in those financial instruments.
For movements between the levels within the fair value hierarchy, the Fund has adopted a policy of recognizing the transfers as of the date of the underlying event which caused the movement.
A summary of inputs used as of September 30, 2012, in valuing the Funds’ assets and liabilities carried at fair value, is as follows:
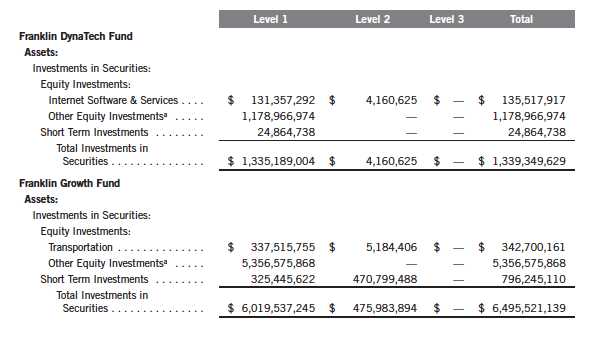
146 | Annual Report
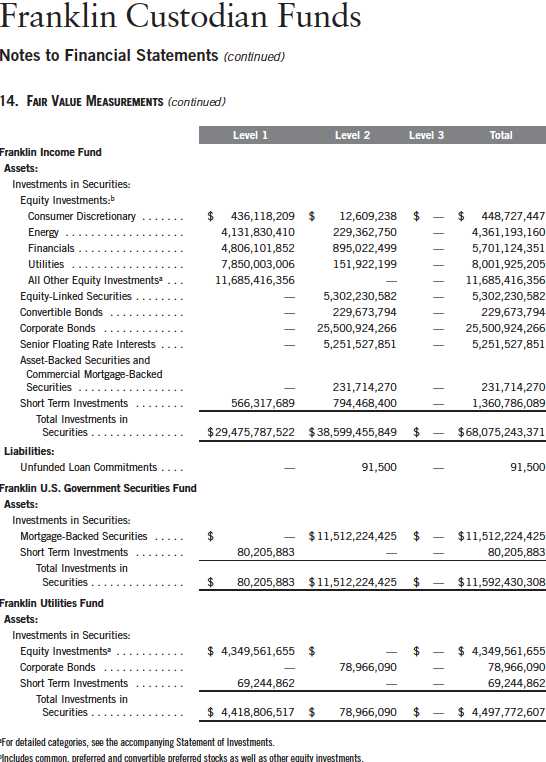
Annual Report | 147
Franklin Custodian Funds
Notes to Financial Statements (continued)
15. NEW ACCOUNTING PRONOUNCEMENTS
In December 2011, the Financial Accounting Standards Board issued Accounting Standards Update (ASU) No. 2011-11, Balance Sheet (Topic 210): Disclosures about Offsetting Assets and Liabilities. The amendments in the ASU enhance disclosures about offsetting of financial assets and liabilities to enable investors to understand the effect of these arrangements on a fund’s financial position. The ASU is effective for interim and annual reporting periods beginning on or after January 1, 2013. The Funds believe the adoption of this ASU will not have a material impact on their financial statements.
16. SUBSEQUENT EVENTS
The Funds have evaluated subsequent events through the issuance of the financial statements and determined that no events have occurred that require disclosure.
148 | Annual Report
Franklin Custodian Funds
Report of Independent Registered Public Accounting Firm
To the Board of Trustees and Shareholders of Franklin Custodian Funds
In our opinion, the accompanying statements of assets and liabilities, including the statements of investments, and the related statements of operations and of changes in net assets and the financial highlights present fairly, in all material respects, the financial position of Franklin DynaTech Fund, Franklin Growth Fund, Franklin Income Fund, Franklin U.S. Government Securities Fund and Franklin Utilities Fund (separate portfolios constituting the Franklin Custodian Funds, hereafter referred to as the “Funds”) at September 30, 2012, the results of each of their operations for the year then ended, the changes in each of their net assets for each of the two years in the period then ended and the financial highlights for each of the periods presented, in conformity with accounting principles generally accepted in the United States of America. These financial statements and financial highlights (hereafter referred to as “financial statements”) are the responsibility of the Funds’ management. Our responsibility is to express an opinion on these financial statements based on our audits. We conducted our audits of these financial statements in accordance with the standards of the Public Company Accounting Oversight Board (United States). Those standards require that we plan and perform the audit to obtain reasonable assurance about whether the financial statements are free of material misstatement. An audit includes examining, on a test basis, evidence supporting the amounts and disclosures in the financial statements, assessing the accounting principles used and significant estimates made by management, and evaluating the overall financial statement presentation.
We believe that our audits, which included confirmation of securities at September 30, 2012 by correspondence with the custodian and brokers, provide a reasonable basis for our opinion.
PricewaterhouseCoopers LLP
San Francisco, California
November 15, 2012
Annual Report | 149
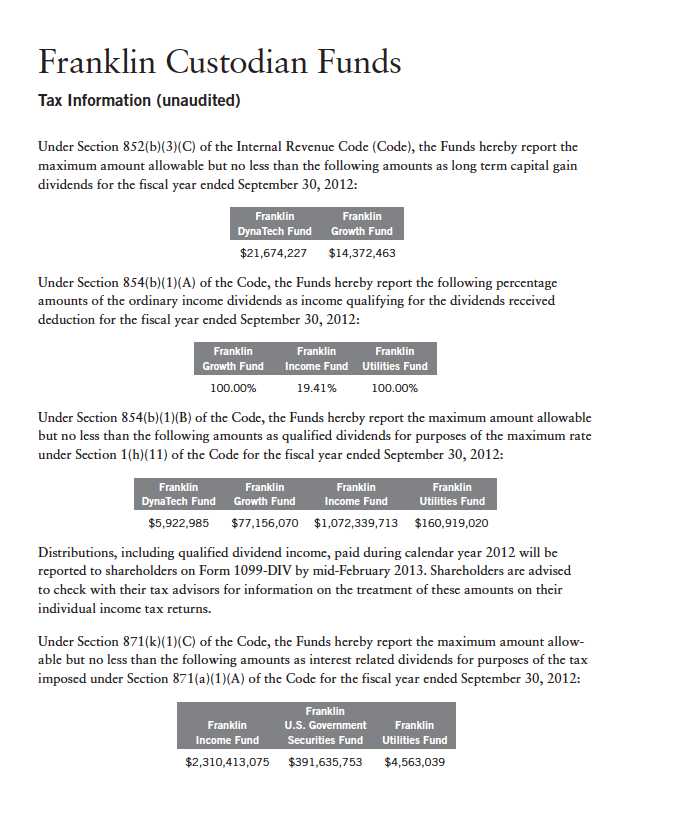
150 | Annual Report
Franklin Custodian Funds
Board Members and Officers
The name, year of birth and address of the officers and board members, as well as their affiliations, positions held with the Trust, principal occupations during at least the past five years and number of portfolios overseen in the Franklin Templeton Investments fund complex are shown below. Generally, each board member serves until that person’s successor is elected and qualified.
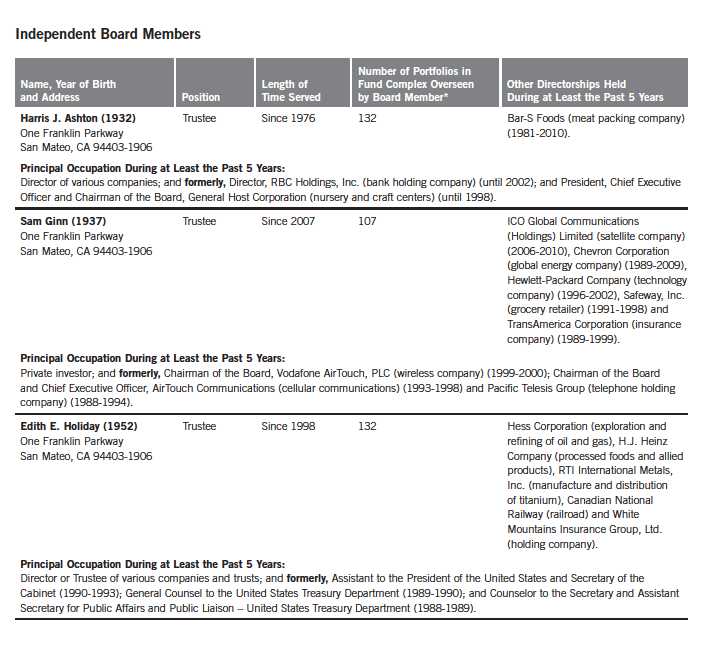
Annual Report | 151
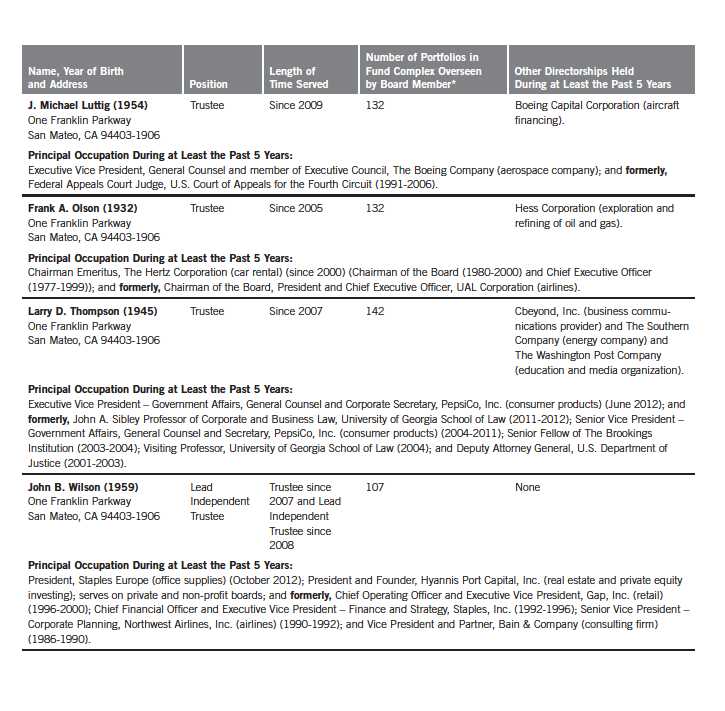
152 | Annual Report
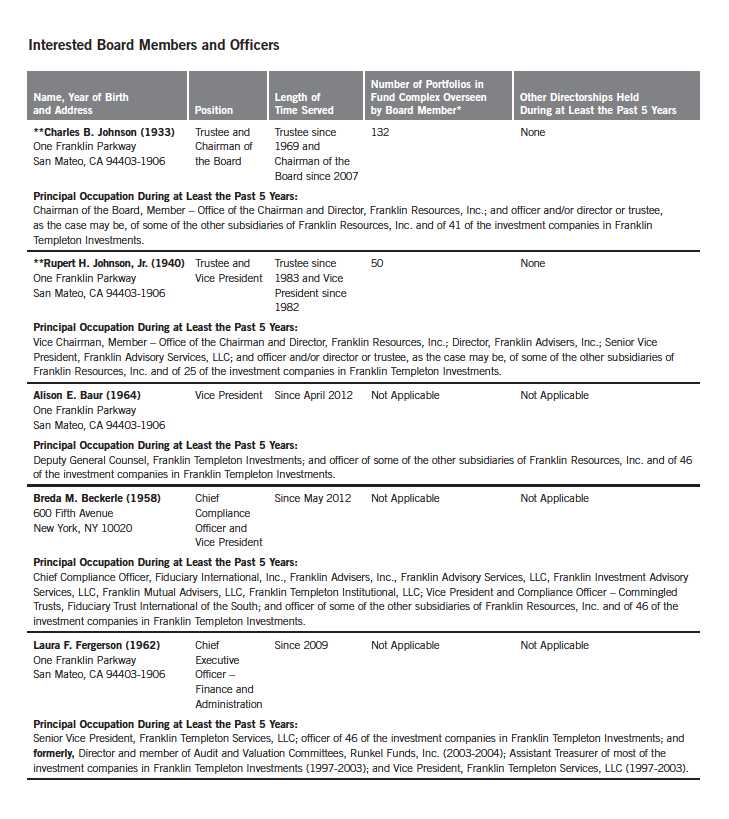
Annual Report | 153
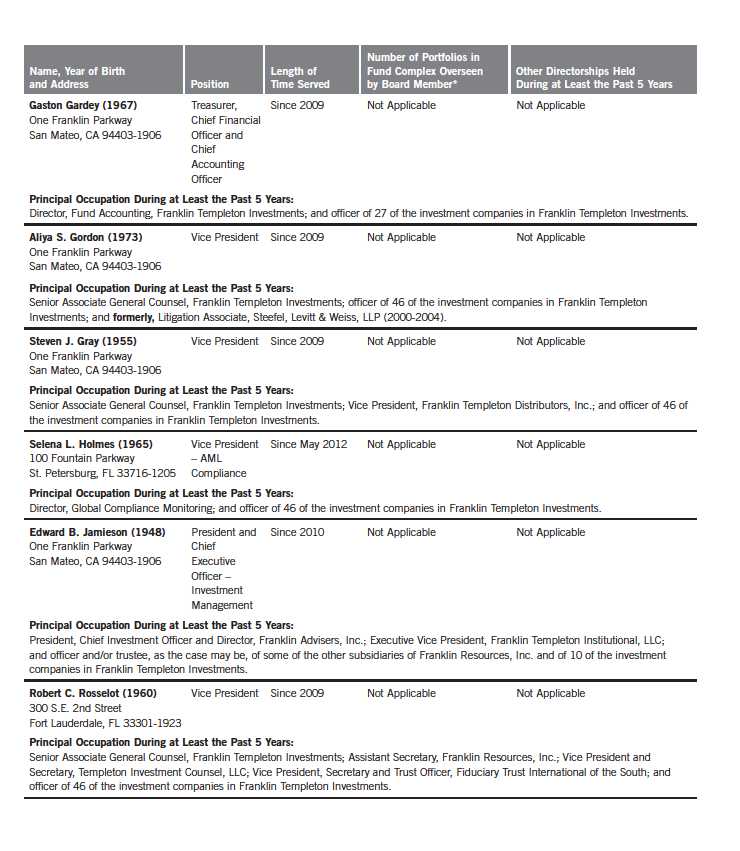
154 | Annual Report
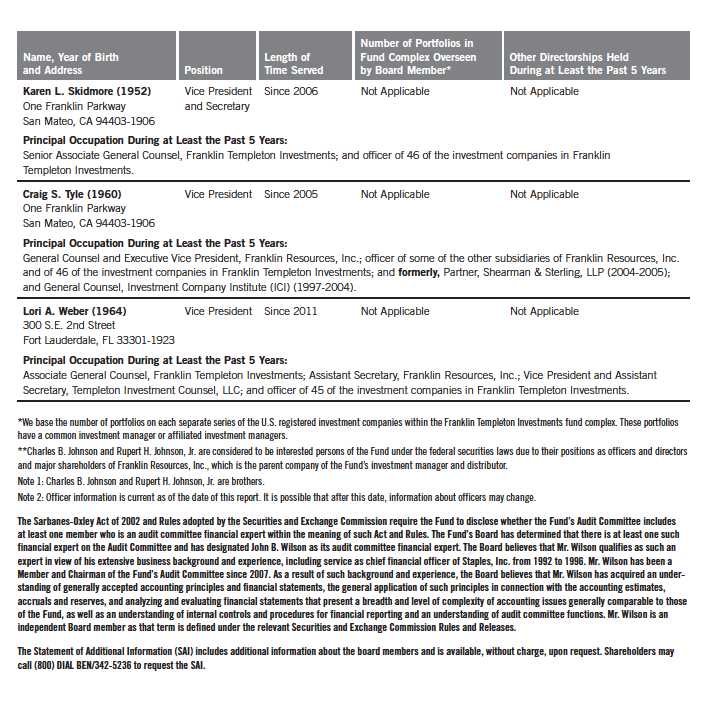
Annual Report | 155
Franklin Custodian Funds
Shareholder Information
Proxy Voting Policies and Procedures
The Trust’s investment manager has established Proxy Voting Policies and Procedures (Policies) that the Trust uses to determine how to vote proxies relating to portfolio securities. Shareholders may view the Trust’s complete Policies online at franklintempleton.com. Alternatively, shareholders may request copies of the Policies free of charge by calling the Proxy Group collect at (954) 527-7678 or by sending a written request to: Franklin Templeton Companies, LLC, 300 S.E. 2nd Street, Fort Lauderdale, FL 33301, Attention: Proxy Group. Copies of the Trust’s proxy voting records are also made available online at franklintempleton.com and posted on the U.S. Securities and Exchange Commission’s website at sec.gov and reflect the most recent 12-month period ended June 30.
Quarterly Statement of Investments
The Trust files a complete statement of investments with the U.S. Securities and Exchange Commission for the first and third quarters for each fiscal year on Form N-Q. Shareholders may view the filed Form N-Q by visiting the Commission’s website at sec.gov. The filed form may also be viewed and copied at the Commission’s Public Reference Room in Washington, DC. Information regarding the operations of the Public Reference Room may be obtained by calling (800) SEC-0330.
Householding of Reports and Prospectuses
You will receive each Fund’s financial reports every six months as well as an annual updated summary prospectus (prospectus available upon request). To reduce Fund expenses, we try to identify related shareholders in a household and send only one copy of the financial reports and summary prospectus. This process, called “householding,” will continue indefinitely unless you instruct us otherwise. If you prefer not to have these documents householded, please call us at (800) 632-2301. At any time you may view current prospectuses/summary prospectuses and financial reports on our website. If you choose, you may receive these documents through electronic delivery.
156 | Annual Report

Item 2. Code of Ethics.
(a) The Registrant has adopted a code of ethics that applies to its principal executive officers and principal financial and accounting officer.
| (c) | N/A |
| (d) | N/A |
| (f) | Pursuant to Item 12(a)(1), the Registrant is attaching as an |
exhibit a copy of its code of ethics that applies to its principal executive officers and principal financial and accounting officer.
Item 3. Audit Committee Financial Expert.
(a)(1) The Registrant has an audit committee financial expert serving on its audit committee.
(2) The audit committee financial expert is John B. Wilson and he is "independent" as defined under the relevant Securities and Exchange Commission Rules and Releases.
Item 4. Principal Accountant Fees and Services.
(a) Audit Fees
The aggregate fees paid to the principal accountant for professional services rendered by the principal accountant for the audit of the registrant’s annual financial statements or for services that are normally provided by the principal accountant in connection with statutory and regulatory filings or engagements were $424,138 for the fiscal year ended September 30, 2012 and $501,187 for the fiscal year ended September 30, 2011.
(b) Audit-Related Fees
The aggregate fees paid to the principal accountant for assurance and related services rendered by the principal accountant to the registrant that are reasonably related to the performance of the audit of the registrant's financial statements and are not reported under paragraph (a) of Item 4 were $8,682 for the fiscal year ended September 30, 2012 and $8,682 for the fiscal year ended September 30, 2011. The services for which these fees were paid included attestation services.
There were no fees paid to the principal accountant for assurance and related services rendered by the principal accountant to the registrant's investment adviser and any entity controlling, controlled by or under common control with the investment adviser that provides ongoing services to the registrant that are reasonably related to the performance of the audit of their financial statements.
There were no fees paid to the principal accountant for professional services rendered by the principal accountant to the registrant for tax compliance, tax advice and tax planning.
The aggregate fees paid to the principal accountant for professional services rendered by the principal accountant to the registrant’s investment adviser and any entity controlling, controlled by or under common control with the investment adviser that provides ongoing services to the registrant for tax compliance, tax advice and tax planning were $29,600 for the fiscal year ended September 30, 2012 and $75,000 for the fiscal year ended September 30, 2011. The services for which these fees were paid included technical tax consultation for capital gain tax reporting to foreign governments, application of local country tax laws to investments and licensing securities with local country offices.
(d) All Other Fees
The aggregate fees paid to the principal accountant for products and services rendered by the principal accountant to the registrant not reported in paragraphs (a)-(c) of Item 4 were $29,714 for the fiscal year ended September 30, 2012 and $0 for the fiscal year ended September 30, 2011. The services for which these fees were paid include review of materials provided to the fund Board in connection with the investment management contract renewal process.
The aggregate fees paid to the principal accountant for products and services rendered by the principal accountant to the registrant’s investment adviser and any entity controlling, controlled by or under common control with the investment adviser that provides ongoing services to the registrant not reported in paragraphs (a)-(c) of Item 4 were $122,736 for the fiscal year ended September 30, 2012 and $0 for the fiscal year ended September 30, 2011. The services for which these fees were paid include review of materials provided to the fund Board in connection with the investment management contract renewal process.
(e) (1) The registrant’s audit committee is directly responsible for approving the services to be provided by the auditors, including:
| (i) | pre-approval of all audit and audit related services; |
| (ii) | pre-approval of all non-audit related services to be provided to the Fund by the auditors; |
(iii) pre-approval of all non-audit related services to be provided to the registrant by the auditors to the registrant’s investment adviser or to any entity that controls, is controlled by or is under common control with the registrant’s investment adviser and that provides ongoing services to the registrant where the non-audit services relate directly to the operations or financial reporting of the registrant; and
(iv) establishment by the audit committee, if deemed necessary or appropriate, as an alternative to committee pre-approval of services to be provided by the auditors, as required by paragraphs (ii) and (iii) above, of policies and procedures to permit such services to be pre-approved by other means, such as through establishment of guidelines or by action of a designated member or members of the
committee; provided the policies and procedures are detailed as to the particular service and the committee is informed of each service and such policies and procedures do not include delegation of audit committee responsibilities, as contemplated under the Securities Exchange Act of 1934, to management; subject, in the case of (ii) through (iv), to any waivers, exceptions or exemptions that may be available under applicable law or rules.
(e) (2) None of the services provided to the registrant described in paragraphs (b)-(d) of Item 4 were approved by the audit committee pursuant to paragraph (c)(7)(i)(C) of Rule 2-01 of regulation S-X.
(f) No disclosures are required by this Item 4(f).
(g) The aggregate non-audit fees paid to the principal accountant for services rendered by the principal accountant to the registrant and the registrant’s investment adviser and any entity controlling, controlled by or under common control with the investment adviser that provides ongoing services to the registrant were $190,732 for the fiscal year ended September 30, 2012 and $83,682 for the fiscal year ended September 30, 2011.
(h) The registrant’s audit committee of the board has considered whether the provision of non-audit services that were rendered to the registrant’s investment adviser (not including any sub-adviser whose role is primarily portfolio management and is subcontracted with or overseen by another investment adviser), and any entity controlling, controlled by, or under common control with the investment adviser that provides ongoing services to the registrant that were not pre-approved pursuant to paragraph (c)(7)(ii) of Rule 2-01 of Regulation S-X is compatible with maintaining the principal accountant’s independence.
Item 5. Audit Committee of Listed Registrants. N/A
Item 6. Schedule of Investments. N/A
Item 7. Disclosure of Proxy Voting Policies and Procedures for Closed-End Management Investment Companies. N/A
Item 8. Portfolio Managers of Closed-End Management Investment Companies. N/A
Item 9. Purchases of Equity Securities by Closed-End Management Investment Company and Affiliated Purchasers. N/A
Item 10. Submission of Matters to a Vote of Security Holders.
There have been no changes to the procedures by which shareholders may recommend nominees to the Registrant's Board of Trustees that would require disclosure herein.
Item 11. Controls and Procedures.
(a) Evaluation of Disclosure Controls and Procedures. The Registrant maintains disclosure controls and procedures that are designed to ensure that information required to be disclosed in the Registrant’s filings under the Securities Exchange Act of 1934 and the Investment Company Act of 1940 is recorded, processed, summarized and reported within the periods specified in the rules and forms of the Securities and Exchange Commission. Such information is accumulated and communicated to the Registrant’s management, including its principal executive officer and principal financial officer, as appropriate, to allow timely decisions regarding required disclosure. The Registrant’s management, including the principal executive officer and the principal financial officer, recognizes that any set of controls and procedures, no matter how well designed and operated, can provide only reasonable assurance of achieving the desired control objectives.
Within 90 days prior to the filing date of this Shareholder Report on Form N-CSR, the Registrant had carried out an evaluation, under the supervision and with the participation of the Registrant’s management, including the Registrant’s principal executive officer and the Registrant’s principal financial officer, of the effectiveness of the design and operation of the Registrant’s disclosure controls and procedures. Based on such evaluation, the Registrant’s principal executive officer and principal financial officer concluded that the Registrant’s disclosure controls and procedures are effective.
(b) Changes in Internal Controls.
There have been no changes in the Registrant’s internal controls or in other factors that could materially affect the internal controls over financial reporting subsequent to the date of their evaluation in connection with the preparation of this Shareholder Report on Form N-CSR.
Item 12. Exhibits.
| (a) | (1) Code of Ethics |
| (a) | (2) Certifications pursuant to Section 302 of the Sarbanes-Oxley Act of 2002 of Laura F. Fergerson, Chief Executive Officer - Finance and Administration, and Gaston Gardey, Chief Financial Officer and Chief Accounting Officer |
(b) Certifications pursuant to Section 906 of the Sarbanes-Oxley Act of 2002 of Laura F. Fergerson, Chief Executive Officer - Finance and Administration, and Gaston Gardey, Chief Financial Officer and Chief Accounting Officer
SIGNATURES
Pursuant to the requirements of the Securities Exchange Act of 1934 and the Investment Company Act of 1940, the registrant has duly caused this report to be signed on its behalf by the undersigned, thereunto duly authorized.
FRANKLIN CUSTODIAN FUNDS
By /s/LAURA F. FERGERSON
Laura F. Fergerson
Chief Executive Officer - Finance and Administration
Date November 27, 2012
Pursuant to the requirements of the Securities Exchange Act of 1934 and
the Investment Company Act of 1940, this report has been signed below
by the following persons on behalf of the registrant and in the
capacities and on the dates indicated.
By /s/LAURA F. FERGERSON
Laura F. Fergerson
Chief Executive Officer - Finance and Administration
Date November 27, 2012
By /s/GASTON GARDEY
Gaston Gardey
Chief Financial Officer and
Chief Accounting Officer
Date November 27, 2012