FRANKLIN CUSTODIAN FUNDS
| 1
Semiannual Report
Economic and Market Overview
The U.S. economy, as measured by gross domestic product growth, expanded during the six-month period ended March 31, 2012. The national unemployment rate for March 2012 stood at 8.2%, compared with 9.0% at the start of the period.1 Jobless claims touched a four-year low in February, and job creation was fairly robust. Consistent with employment trends, industrial production and manufacturing activity increased toward the end of the period. Automobile sales rose to their highest levels since February 2008, and consumer confidence climbed to pre-recession levels. Outside of the U.S., Greece secured bailout financing as bondholders agreed to concessions and the country enacted austerity measures. Although the long-term resolution of the European debt situation remained unclear, the European Central Bank’s plan to increase liquidity through loans was well received and seemed to improve investor sentiment.
At the end of the reporting period, however, challenges to the economy remained, including uncertainty surrounding deeply indebted European countries, soaring gas prices amid political turmoil in the Middle East, indications of reduced economic stimulus from the federal government, and continued malaise in the U.S. housing market. To help support mortgage market conditions, the Federal Reserve Board decided to reinvest principal received from certain debt securities into agency mortgage-backed securities. Additionally, federal lawmakers made efforts to strengthen the real estate market by removing some eligibility restrictions and charges associated with refinancing. Signs of China’s economic growth slowdown contributed to pessimism as, despite a higher overall level of U.S. exports, the U.S. trade deficit widened following decreases in exports to China and the eurozone.
For much of the period, investors sought the perceived safety of U.S. Treasuries. As U.S. economic data improved, however, investors shifted assets into equities, which drove bond prices lower and yields higher. The 10-year Treasury note yield rose from 1.92% on September 30, 2011, to 2.23% on March 31, 2012. U.S. stock markets soared amid the positive economic reports and reached multi-year highs in the first quarter of 2012. The Dow Jones Industrial Average
1. Source: Bureau of Labor Statistics.
Semiannual Report | 3
exceeded the 13,000 level for the first time since 2008, and the NASDAQ Composite Index hit an 11-year high. Sector leaders during the six-month period included financials, information technology and consumer discretionary. Conversely, utilities and telecommunication services lagged the broader market.
The foregoing information reflects our analysis and opinions as of March 31, 2012. The information is not a complete analysis of every aspect of any market, country, industry, security or fund. Statements of fact are from sources considered reliable.
4 | Semiannual Report
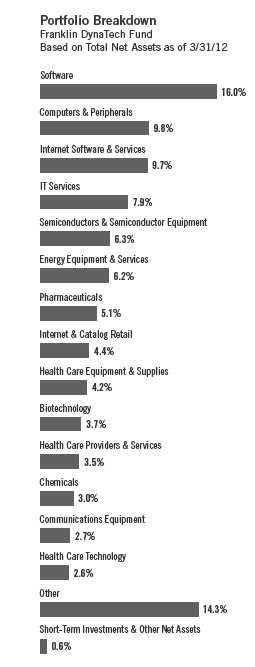
Franklin DynaTech Fund
Your Fund’s Goal and Main Investments: Franklin DynaTech Fund seeks capital
appreciation by investing substantially in equity securities of companies emphasizing scientific or
technological development or that are in fast-growing industries.
Performance data represent past performance, which does not guarantee future results. Investment return and principal value will fluctuate, and you may have a gain or loss when you sell your shares. Current performance may differ from figures shown. Please visit franklintempleton.com or call (800) 342-5236 for most recent month-end performance.
We are pleased to bring you Franklin DynaTech Fund’s semiannual report for the period ended March 31, 2012.
Performance Overview
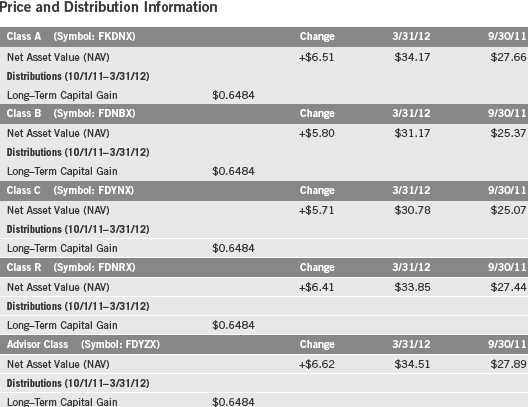
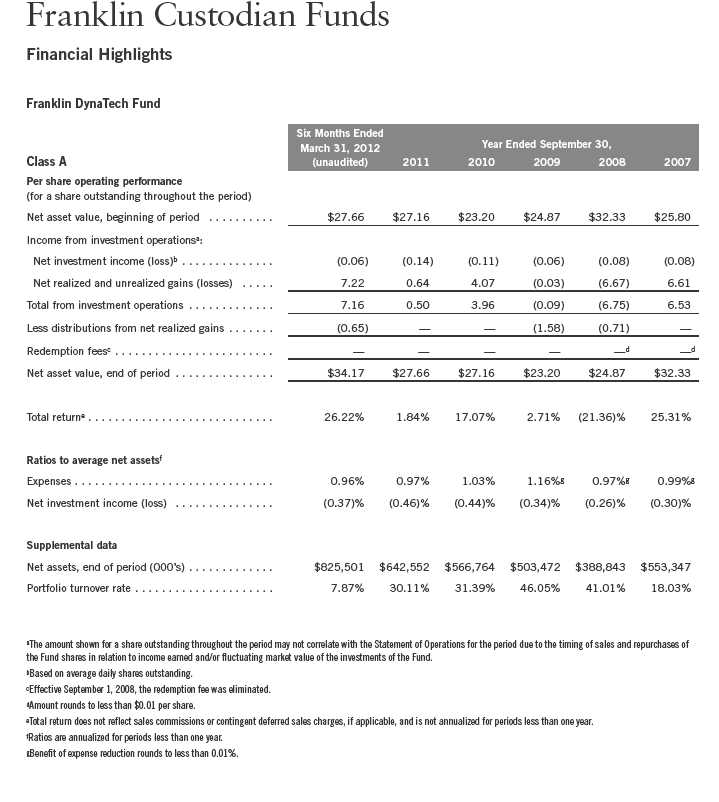
Franklin DynaTech Fund – Class A delivered a +26.22% cumulative total return for the six months under review. For the same period, the Fund performed comparably to the +26.85% total return of the Russell 1000® Growth Index, which measures performance of the largest companies in the Russell 3000® Index with higher price-to-book ratios and higher forecasted growth values.1 Also for comparison, the Fund performed comparably to the broad U.S. stock market as measured by the +25.89% total return of the Standard & Poor’s 500® Index (S&P 500®), but underperformed domestic and international-based stocks as measured by the NASDAQ Composite Index’s +28.70% total return.1 You can find the Fund’s long-term performance data in the Performance Summary beginning on page 8.
Investment Strategy
We use fundamental, bottom-up research to seek companies meeting our criteria of growth potential, quality and valuation. In seeking sustainable growth characteristics, we look for companies we believe can produce sustainable earnings and cash flow growth, evaluating the long-term market opportunity and competitive structure of an industry to target leaders and emerging leaders. We define quality companies as those with strong and improving competitive positions in attractive markets. We also believe important attributes of quality are experienced and talented management teams as well as financial strength reflected in the capital structure, gross and operating margins, free cash flow generation
1. Source: © 2012 Morningstar. All Rights Reserved. The information contained herein: (1) is proprietary to Morningstar and/or its content providers; (2) may not be copied or distributed; and (3) is not warranted to be accurate, complete or timely. Neither Morningstar nor its content providers are responsible for any damages or losses arising from any use of this information. RUSSELL® is a trademark of the Frank Russell Company. STANDARD & POOR’S®, S&P® and S&P 500® are registered trademarks of Standard & Poor’s Financial Services LLC. The indexes are unmanaged and include reinvested dividends. One cannot invest directly in an index, and an index is not representative of the Fund’s portfolio.
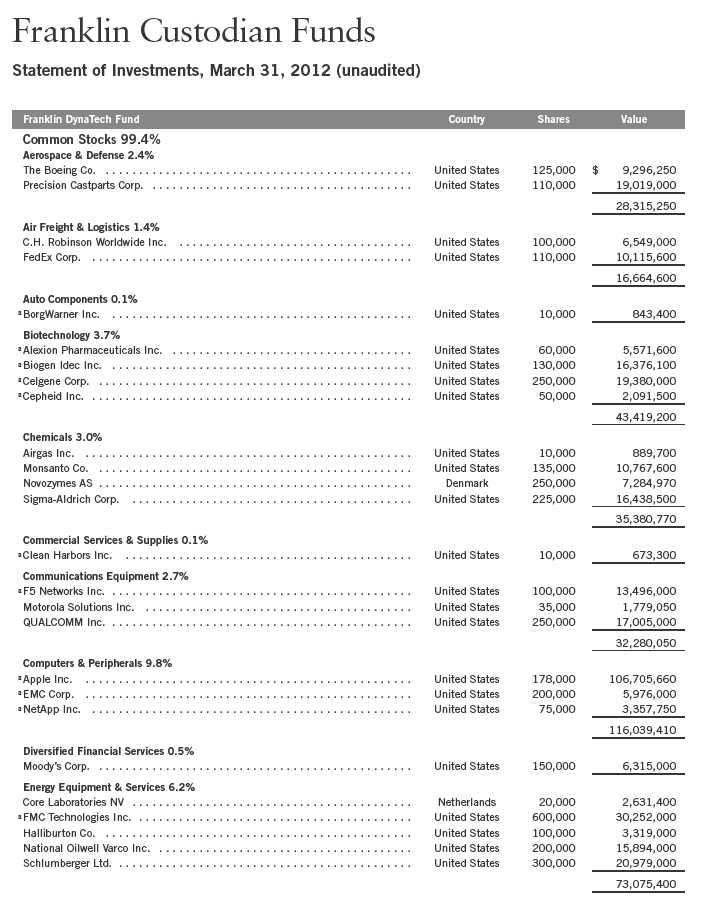
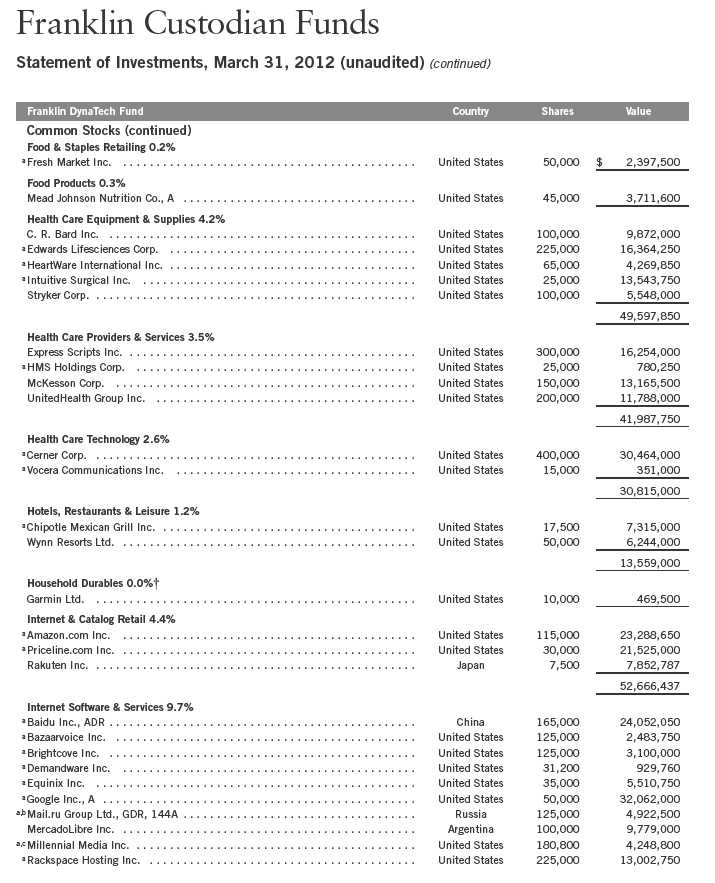
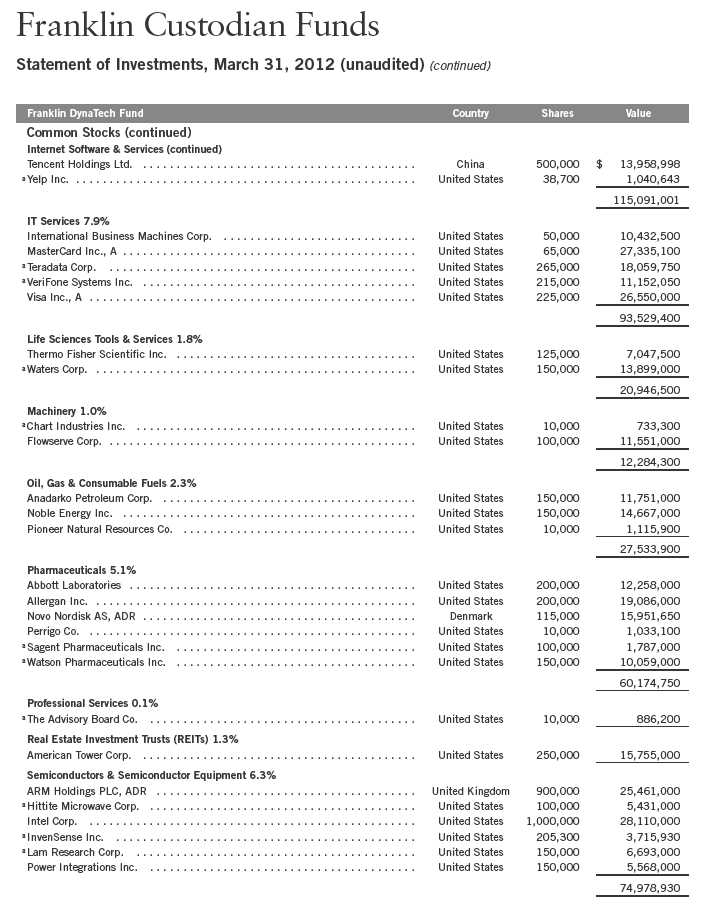
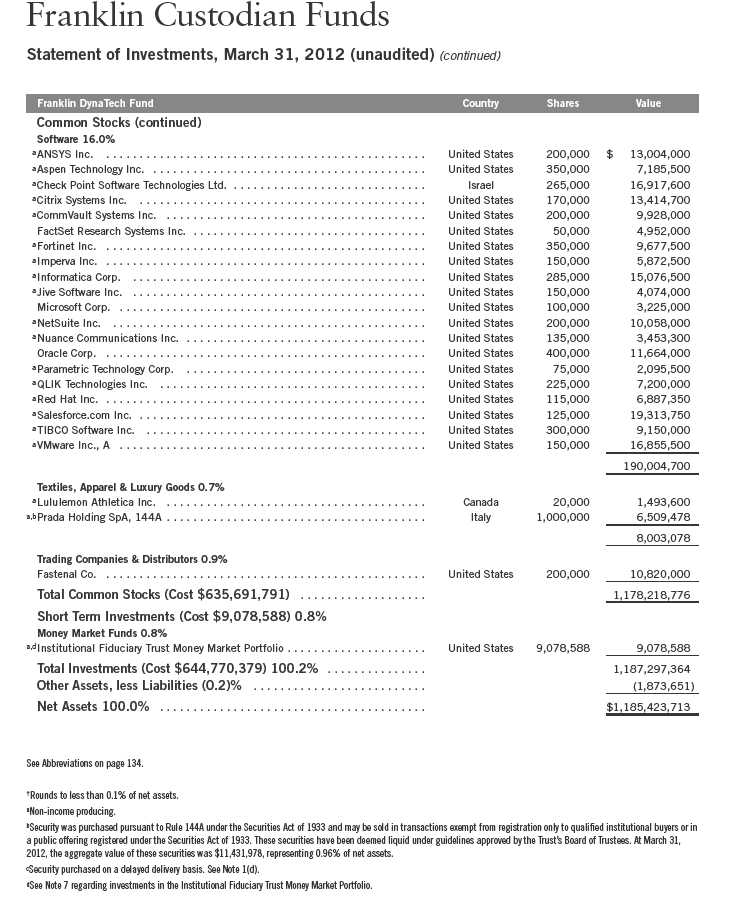
The dollar value, number of shares or principal amount, and names of all portfolio holdings are listed in the Fund’s Statement of Investments (SOI). The SOI begins on page 52.
Semiannual Report | 5
and returns on capital employed. Our valuation analysis includes a range of potential outcomes based on an assessment of multiple scenarios. In assessing value, we consider whether security prices fully reflect the balance of the sustainable growth opportunities relative to business and financial risks.
Manager’s Discussion
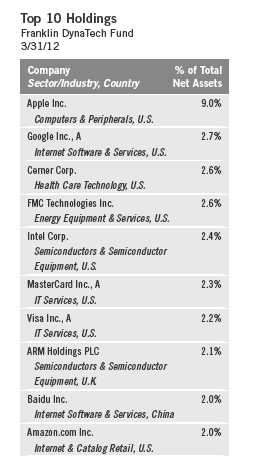
The Fund’s information technology sector drove performance during the reporting period, a combination of our holdings’ robust performance and the Fund’s sizable sector allocation.2 As in the previous reporting period, computer manufacturer Apple was a stalwart performer and led contributors. During the six-month period, the company announced it was initiating a regular dividend on its common stock, and sales of iPhones and iPads more than doubled year-over-year for the quarter ended December 31, 2011. Semiconductor manufacturer Intel also benefited Fund performance, as did payment technology firm Visa. Positions in the health care and energy sectors also generated solid returns, led by pharmaceutical claims processor Express Scripts and FMC Technologies, a technology products and services firm serving the oil and gas industry.3 In the consumer discretionary sector, travel discounter Priceline.com posted impressive results and boosted performance.4
While healthy gains for most equities characterized the six-month period, certain Fund holdings declined in value. Online retailer Amazon.com, risk management provider RPX5 and oil services diagnostic services firm CARBO Ceramics5 were among the positions weighing on performance.
As managers of Franklin DynaTech Fund, at period-end we were encouraged by the relative abundance of leading science and technology companies that we believe have strong long-term growth prospects trading at what we perceive to be attractive valuations. We believe it is these innovative, thought-leading companies that may promote economic advancement over the longer term.
2. The information technology sector comprises communications equipment, computers and peripherals, Internet software and services, IT services, semiconductors and semiconductor equipment, and software in the SOI.
3. The health care sector comprises biotechnology, health care equipment and supplies, health care providers and services, health care technology, life sciences tools and services, and pharmaceuticals in the SOI. The energy sector comprises energy equipment and services; and oil, gas and consumable fuels in the SOI.
4. The consumer discretionary sector comprises auto components; hotels, restaurants and leisure; household durables; Internet and catalog retail; specialty retail; and textiles, apparel and luxury goods in the SOI.
5. Sold by period-end.

Thank you for your continued participation in Franklin DynaTech Fund.
We look forward to serving your future investment needs.

The foregoing information reflects our analysis, opinions and portfolio holdings as of March 31, 2012, the end of the reporting period. The way we implement our main investment strategies and the resulting portfolio holdings may change depending on factors such as market and economic conditions. These opinions may not be relied upon as investment advice or an offer for a particular security. The information is not a complete analysis of every aspect of any market, country, industry, security or the Fund. Statements of fact are from sources considered reliable, but the investment manager makes no representation or warranty as to their completeness or accuracy. Although historical performance is no guarantee of future results, these insights may help you understand our investment management philosophy.
Performance Summary as of 3/31/12
Franklin DynaTech Fund
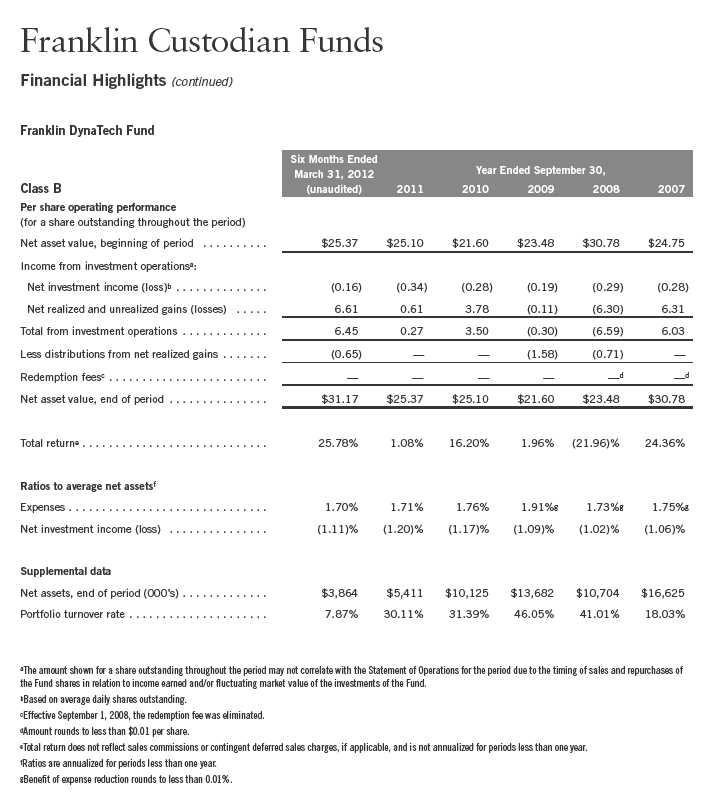
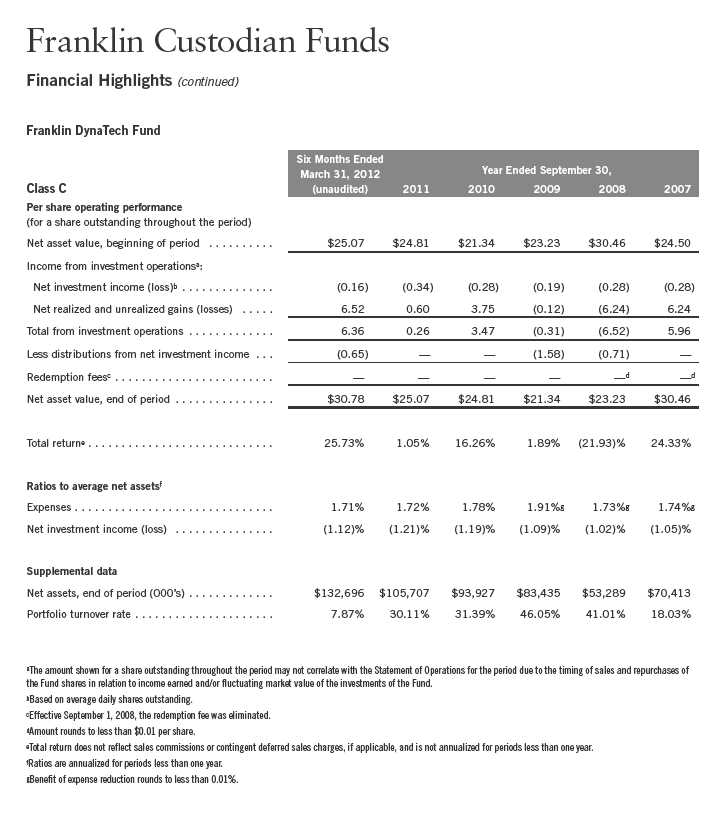
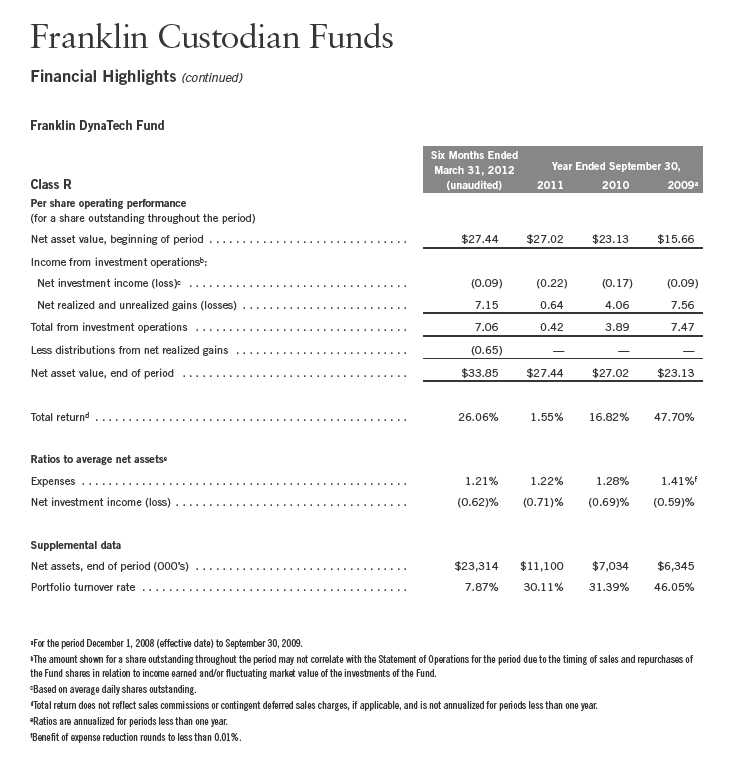
Your dividend income will vary depending on dividends or interest paid by securities in the Fund’s portfolio, adjusted for operating expenses of each class. Capital gain distributions are net profits realized from the sale of portfolio securities. The performance table does not reflect any taxes that a shareholder would pay on Fund dividends, capital gain distributions, if any, or any realized gains on the sale of Fund shares. Total return reflects reinvestment of the Fund’s dividends and capital gain distributions, if any, and any unrealized gains or losses.
8 | Semiannual Report
Performance Summary (continued)
Performance
Cumulative total return excludes sales charges. Average annual total return and value of $10,000 investment include maximum sales charges. Class A: 5.75% maximum initial sales charge; Class B: contingent deferred sales charge (CDSC) declining from 4% to 1% over six years, and eliminated thereafter; Class C: 1% CDSC in first year only; Class R/Advisor Class: no sales charges.

Performance data represent past performance, which does not guarantee future results. Investment return and principal value will fluctuate, and you may have a gain or loss when you sell your shares. Current performance may differ from figures shown. For most recent month-end performance, go to franklintempleton.com or call (800) 342-5236.
Semiannual Report | 9
Performance Summary (continued)
Endnotes
All investments involve risks, including possible loss of principal. The Fund’s investments in fast-growing industries, including the technology and telecommunications sectors (which have historically been volatile) could result in increased price fluctuation, especially over the short term, due to the rapid pace of product change and development and changes in government regulation of companies emphasizing scientific or technological advancement. The Fund may also invest in small- and mid-capitalization companies, which can be particularly sensitive to changing economic conditions, and their prospects for growth are less certain than those of larger, more established companies. The Fund is actively managed but there is no guarantee that the manager’s investment decisions will produce the desired results. The Fund’s prospectus also includes a description of the main investment risks.
Class B: Class C: | These shares have higher annual fees and expenses than Class A shares. Prior to 1/1/04, these shares were offered with an initial sales charge; thus actual total returns would have differed. These shares have higher annual fees and expenses than Class A shares. |
Class R: | Shares are available to certain eligible investors as described in the prospectus. These shares have higher annual fees and expenses than Class A shares. |
Advisor Class: | Shares are available to certain eligible investors as described in the prospectus. |
1. Cumulative total return represents the change in value of an investment over the periods indicated.
2. Average annual total return represents the average annual change in value of an investment over the periods indicated. Six-month return has not been annualized.
3. These figures represent the value of a hypothetical $10,000 investment in the Fund over the periods indicated.
4. Figures are as stated in the Fund’s prospectus current as of the date of this report. In periods of market volatility, assets may decline significantly, causing total annual Fund operating expenses to become higher than the figures shown.
5. Effective 5/15/08, the Fund began offering Advisor Class shares, which do not have sales charges or a Rule 12b-1 plan. Performance quotations for this class reflect the following methods of calculation: (a) For periods prior to 5/15/08, a restated figure is used based upon the Fund’s Class A performance, excluding the effect of Class A’s maximum initial sales charge, but reflecting the effect of the Class A Rule 12b-1 fees; and (b) for periods after 5/15/08, actual Advisor Class performance is used reflecting all charges and fees applicable to that class. Since 5/15/08 (commencement of sales), the cumulative and average annual total returns of Advisor Class shares were +23.59% and +5.62%.
10 | Semiannual Report
Your Fund’s Expenses
Franklin DynaTech Fund
As a Fund shareholder, you can incur two types of costs:
- Transaction costs, including sales charges (loads) on Fund purchases; and
- Ongoing Fund costs, including management fees, distribution and service (12b-1) fees, and other Fund expenses. All mutual funds have ongoing costs, sometimes referred to as operating expenses.
The following table shows ongoing costs of investing in the Fund and can help you understand these costs and compare them with those of other mutual funds. The table assumes a $1,000 investment held for the six months indicated.
Actual Fund Expenses
The first line (Actual) for each share class listed in the table provides actual account values and expenses. The “Ending Account Value” is derived from the Fund’s actual return, which includes the effect of Fund expenses.
You can estimate the expenses you paid during the period by following these steps. Of course, your account value and expenses will differ from those in this illustration:
| 1. | Divide your account value by $1,000. |
| If an account had an $8,600 value, then $8,600 ÷ $1,000 = 8.6. | |
| 2. | Multiply the result by the number under the heading “Expenses Paid During Period.” |
| If Expenses Paid During Period were $7.50, then 8.6 x $7.50 = $64.50. |
In this illustration, the estimated expenses paid this period are $64.50.
Hypothetical Example for Comparison with Other Funds
Information in the second line (Hypothetical) for each class in the table can help you compare ongoing costs of investing in the Fund with those of other mutual funds. This information may not be used to estimate the actual ending account balance or expenses you paid during the period. The hypothetical “Ending Account Value” is based on the actual expense ratio for each class and an assumed 5% annual rate of return before expenses, which does not represent the Fund’s actual return. The figure under the heading “Expenses Paid During Period” shows the hypothetical expenses your account would have incurred under this scenario. You can compare this figure with the 5% hypothetical examples that appear in shareholder reports of other funds.
Semiannual Report | 11
Your Fund’s Expenses (continued)
Please note that expenses shown in the table are meant to highlight ongoing costs and do not reflect any transaction costs, such as sales charges. Therefore, the second line for each class is useful in comparing ongoing costs only, and will not help you compare total costs of owning different funds. In addition, if transaction costs were included, your total costs would have been higher. Please refer to the Fund prospectus for additional information on operating expenses.
*Expenses are calculated using the most recent six-month expense ratio, annualized for each class (A: 0.96%; B: 1.70%; C: 1.71%; R: 1.21%; and Advisor: 0.71%), multiplied by the average account value over the period, multiplied by 183/366 to reflect the one-half year period.
12 | Semiannual Report
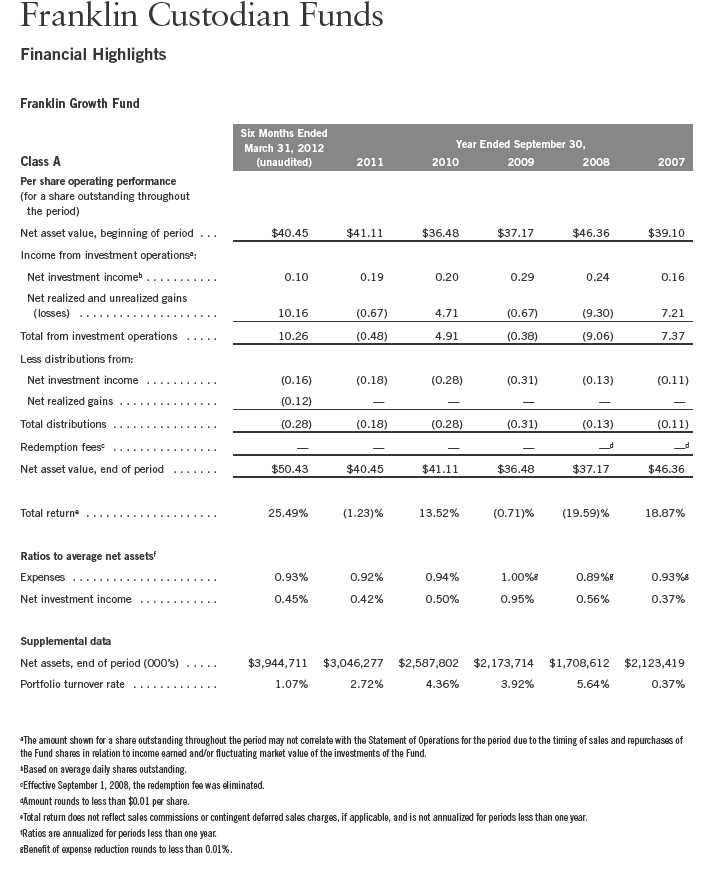
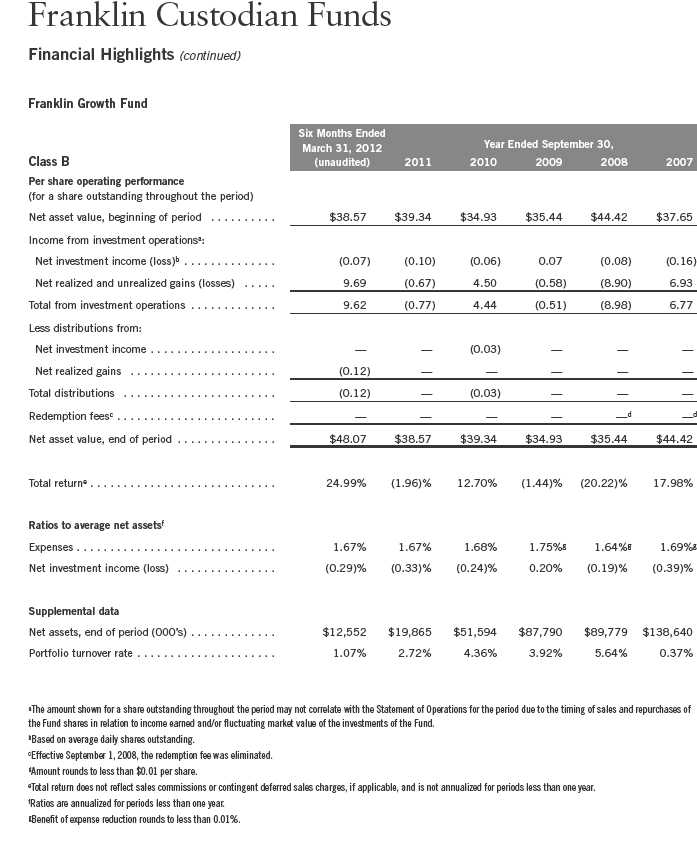
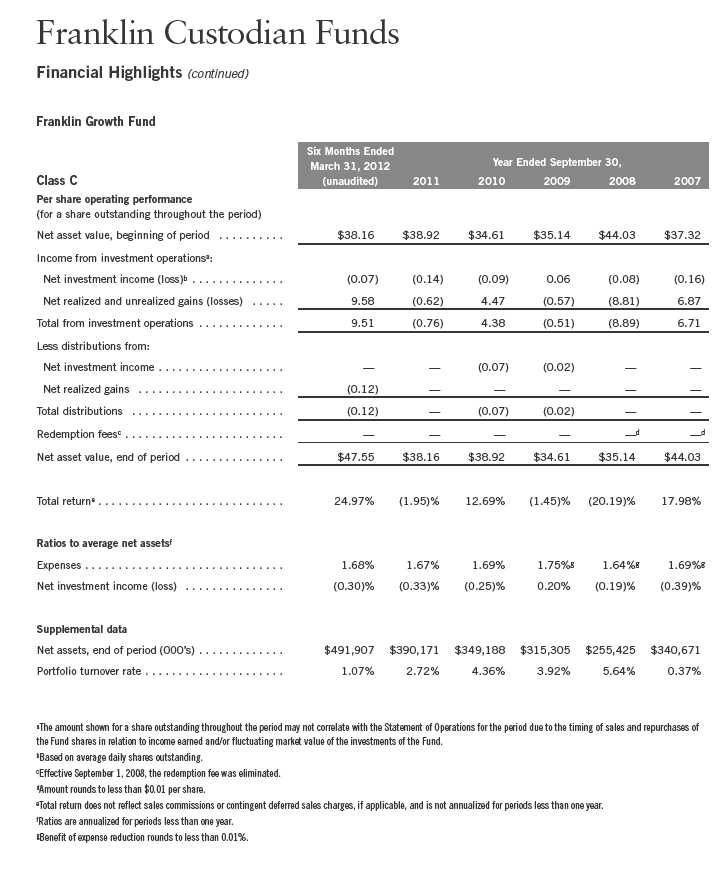
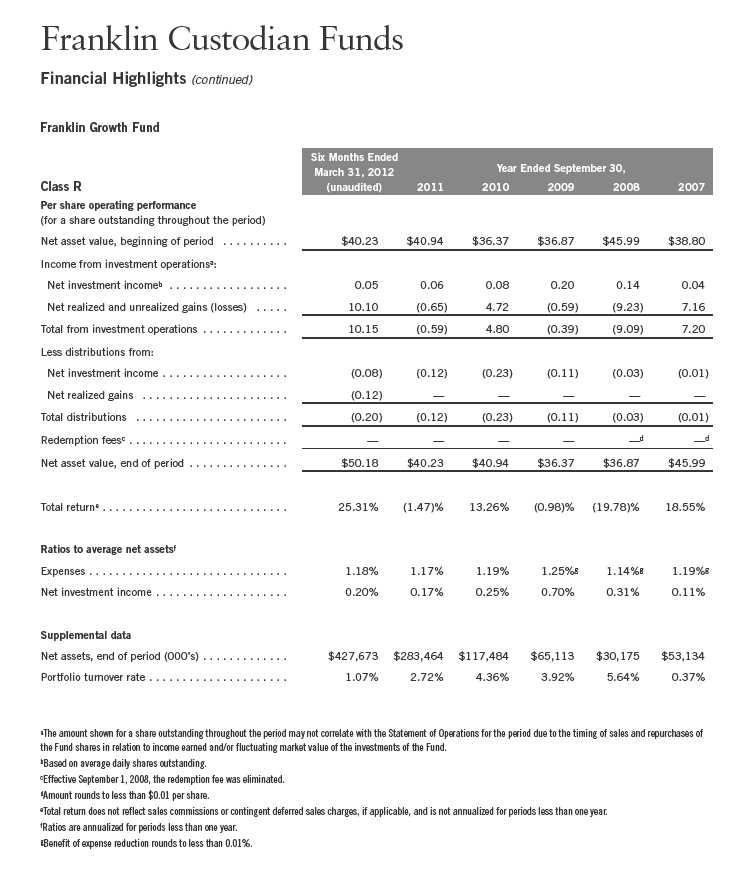
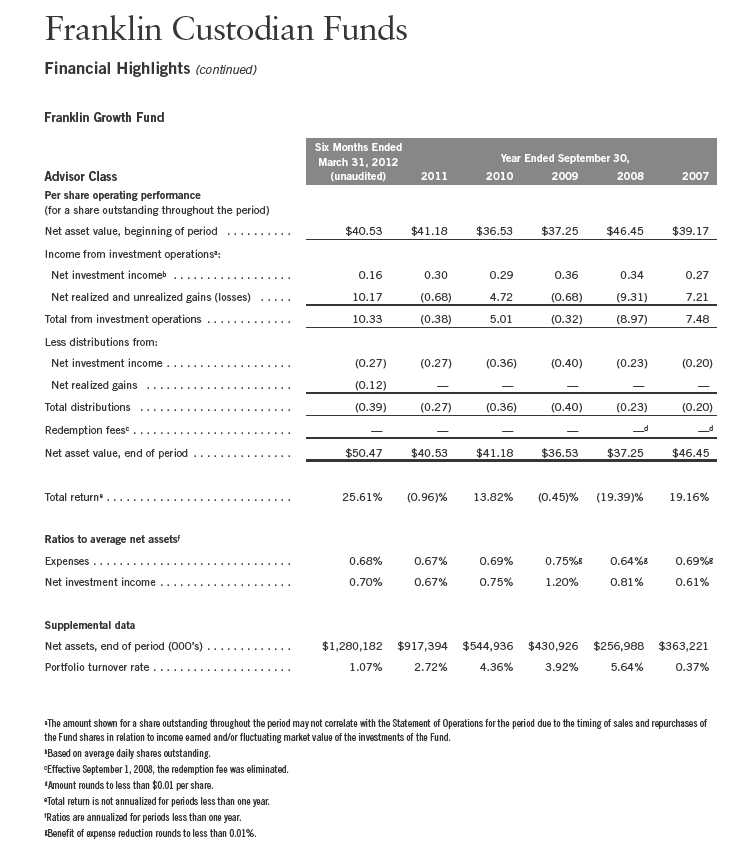
Franklin Growth Fund
Your Fund’s Goal and Main Investments: Franklin Growth Fund seeks capital appreciation by investing substantially in equity securities of companies that are leaders in their industries.
Performance data represent past performance, which does not guarantee future results. Investment return and principal value will fluctuate, and you may have a gain or loss when you sell your shares. Current performance may differ from figures shown. Please visit franklintempleton.com or call (800) 342-5236 for most recent month-end performance.
We are pleased to bring you Franklin Growth Fund’s semiannual report for the period ended March 31, 2012.
Performance Overview
Franklin Growth Fund – Class A delivered a +25.49% cumulative total return for the six months under review. The Fund performed comparably to the +25.89% total return of its benchmark, the Standard & Poor’s 500 Index (S&P 500), which is a broad measure of U.S. stock performance.1 You can find the Fund’s long-term performance data in the Performance Summary beginning on page 16.
Investment Strategy
We use fundamental, bottom-up research to seek companies meeting our criteria of growth potential, quality and valuation. In seeking sustainable growth characteristics, we look for companies we believe can produce sustainable earnings and cash flow growth, evaluating the long-term market opportunity and competitive structure of an industry to target leaders and emerging leaders. We define quality companies as those with strong and improving competitive positions in attractive markets. We also believe important attributes of quality are experienced and talented management teams as well as financial strength reflected in the capital structure, gross and operating margins, free cash flow generation and returns on capital employed. Our valuation analysis includes a range of potential outcomes based on an assessment of multiple scenarios. In assessing value, we consider whether security prices fully reflect the balance of the sustainable growth opportunities relative to business and financial risks.
1. Source: © 2012 Morningstar. All Rights Reserved. The information contained herein: (1) is proprietary to Morningstar and/or its content providers; (2) may not be copied or distributed; and (3) is not warranted to be accurate, complete or timely. Neither Morningstar nor its content providers are responsible for any damages or losses arising from any use of this information. The index is unmanaged and includes reinvested dividends. One cannot invest directly in an index, and an index is not representative of the Fund’s portfolio.
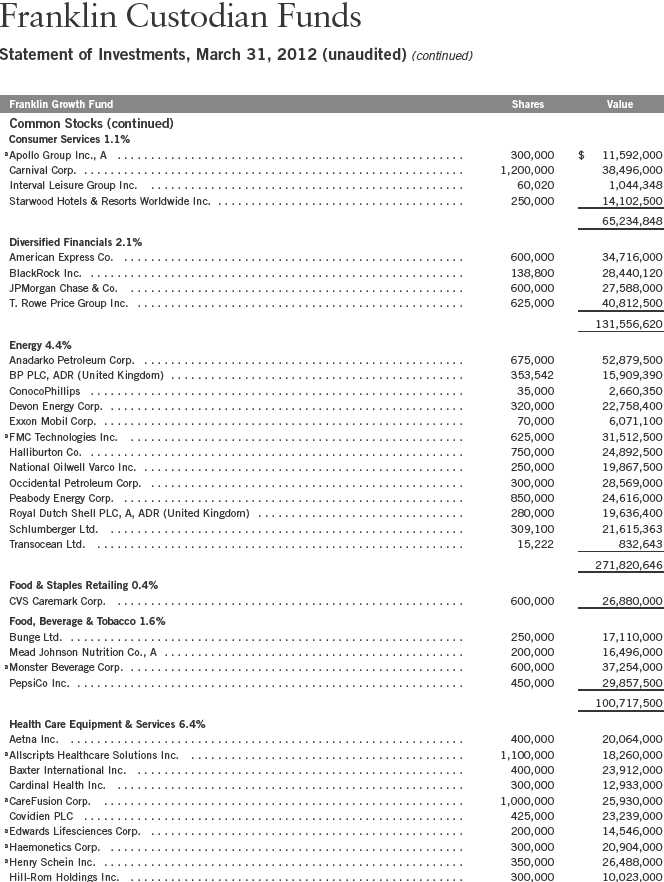
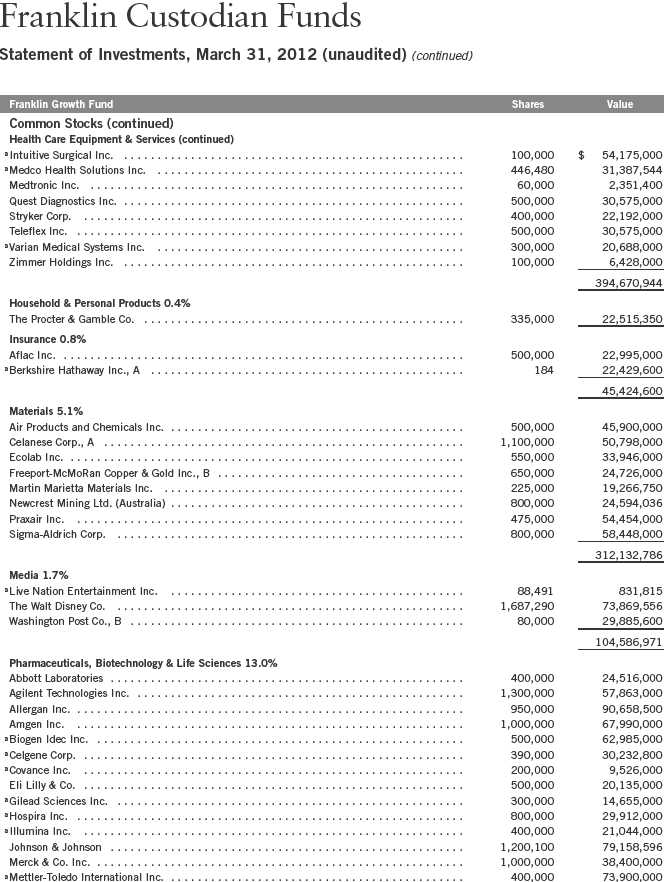
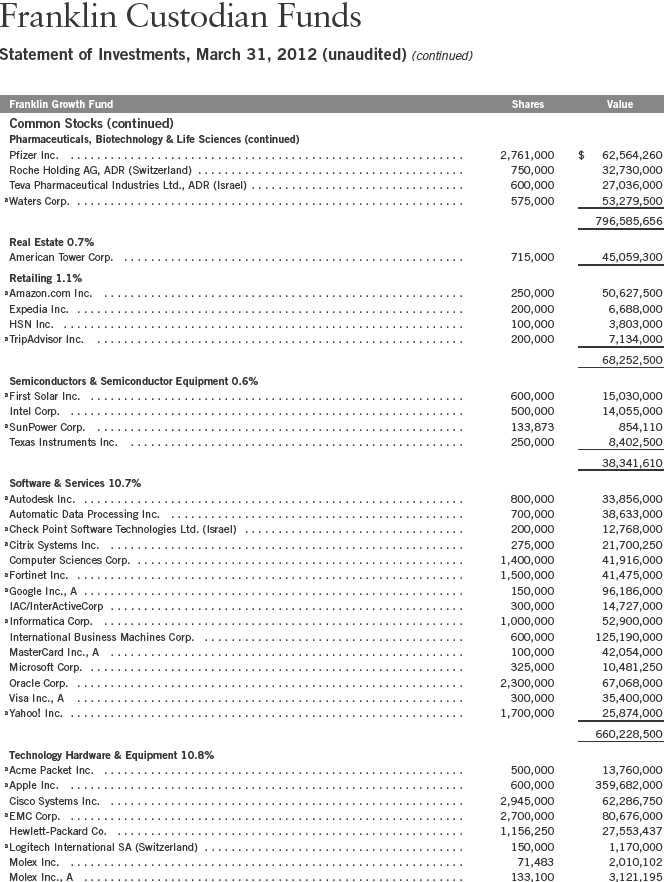
The dollar value, number of shares or principal amount, and names of all portfolio holdings are listed in the Fund’s Statement of Investments (SOI). The SOI begins on page 61.
Semiannual Report | 13
Manager’s Discussion
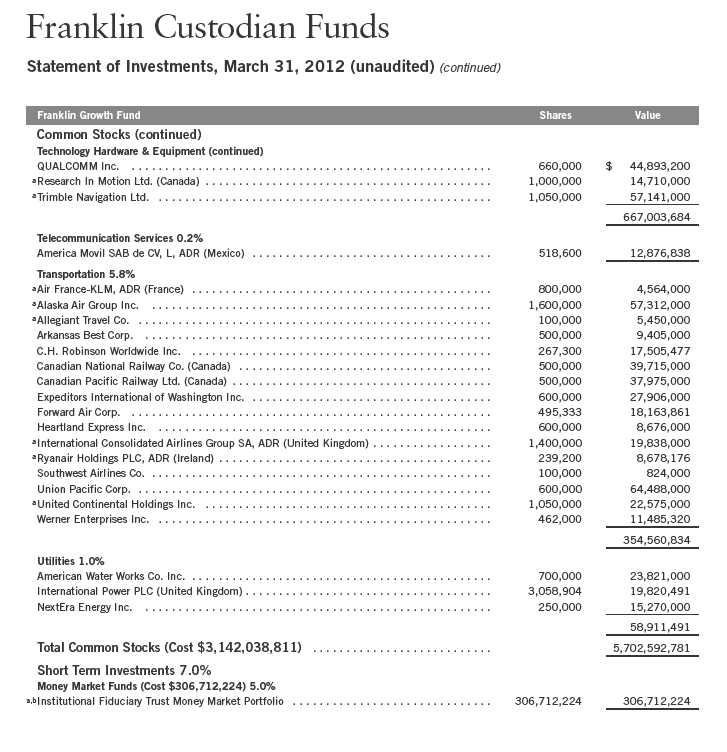
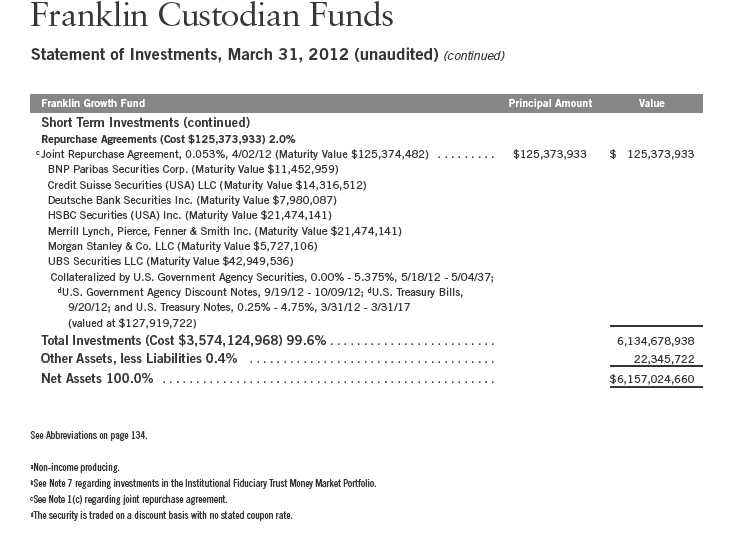
Franklin Growth Fund owned shares of 167 companies at period-end. We continue to invest in a broad array of companies of all sizes and in varied industries.
During the six months under review, the Fund’s holdings in the industrials, information technology and consumer discretionary sectors made key contributions to performance.2 Industrial supply company W.W. Grainger and electrical equipment designer and manufacturer Thomas & Betts were leading performers in the industrials sector. W.W. Grainger sales increased early in 2012 amid strong volume and following acquisitions. In addition, the firm’s quarterly earnings rose as profit margins improved. Thomas & Betts agreed to a purchase offer from Switzerland-based ABB Limited, although the offer was awaiting approval from a forthcoming Thomas & Betts shareholder vote. In the information technology sector, several holdings were major contributors. Personal computer designer and manufacturer Apple benefited from robust demand for its iPhones and iPads. Share prices for EMC, the leading global disk storage systems firm, advanced as the storage support market expanded in the fourth quarter of 2011. GPS and control systems manufacturer Trimble Navigation reported favorable results for the quarter ended December 2011, as the domestic construction market for navigation products showed strength. Measurement products firm Agilent Technologies also boosted returns, as the health care sector firm’s first-quarter profit increased amid rising sales from its chemicals and life sciences division. Outside of these sectors, global entertainment and media firm Walt Disney also made a notable positive contribution to performance as the firm’s first-quarter net income jumped 12%.
Performance was more muted, but still positive, for the Fund’s telecommunication services and utilities holdings. Mexico-based wireless services provider America Movil’s performance trailed that of other Fund holdings as higher debt levels and weakness for the peso contributed to profit levels declining in the fourth quarter. Renewable energy services firm NextEra Energy’s power and gas trading businesses endured low prices and volatility in trading markets, and the firm’s Florida utility froze base rates for customers as the state navigated adverse economic conditions. Certain positions lost value, including BlackBerry smartphone maker Research in Motion. Tepid sales for the company’s handsets
2. The industrials sector comprises capital goods, commercial and professional services, and transportation in the SOI. The information technology sector comprises semiconductors and semiconductor equipment, software and services, and technology hardware and equipment in the SOI. The consumer discretionary sector comprises automobiles and components, consumer durables and apparel, consumer services, media and retailing in the SOI.
14 | Semiannual Report
and PlayBook tablet computers weighed on its share price. Elsewhere, an unprofitable quarter for solar module manufacturer First Solar resulted in negative returns, and network communications equipment firm Acme Packet trimmed its estimates for earnings and sales in 2012. However, few holdings posted negative performance during the six-month period.
Thank you for your continued participation in Franklin Growth Fund. We look forward to serving your future investment needs.
CFA® is a trademark owned by CFA Institute.
The foregoing information reflects our analysis, opinions and portfolio holdings as of March 31, 2012, the end of the reporting period. The way we implement our main investment strategies and the resulting portfolio holdings may change depending on factors such as market and economic conditions. These opinions may not be relied upon as investment advice or an offer for a particular security. The information is not a complete analysis of every aspect of any market, country, industry, security or the Fund. Statements of fact are from sources considered reliable, but the investment manager makes no representation or warranty as to their completeness or accuracy. Although historical performance is no guarantee of future results, these insights may help you understand our investment management philosophy.
Semiannual Report | 15
Performance Summary as of 3/31/12
Franklin Growth Fund
Your dividend income will vary depending on dividends or interest paid by securities in the Fund’s portfolio, adjusted for operating expenses of each class. Capital gain distributions are net profits realized from the sale of portfolio securities. The performance table does not reflect any taxes that a shareholder would pay on Fund dividends, capital gain distributions, if any, or any realized gains on the sale of Fund shares. Total return reflects reinvestment of the Fund’s dividends and capital gain distributions, if any, and any unrealized gains or losses.
16 | Semiannual Report
Performance Summary (continued)
Performance
Cumulative total return excludes sales charges. Average annual total return and value of $10,000 investment include maximum sales charges. Class A: 5.75% maximum initial sales charge; Class B: contingent deferred sales charge (CDSC) declining from 4% to 1% over six years, and eliminated thereafter; Class C: 1% CDSC in first year only;
Class R/Advisor Class: no sales charges.
Performance data represent past performance, which does not guarantee future results. Investment return and principal value will fluctuate, and you may have a gain or loss when you sell your shares. Current performance may differ from figures shown. For most recent month-end performance, go to franklintempleton.com or call (800) 342-5236.
Semiannual Report | 17
Performance Summary (continued)
Endnotes
All investments involve risks, including possible loss of principal. Historically, the Fund has focused on larger companies. The Fund may also invest in small, relatively new and/or unseasoned companies, which involves additional risks, as the price of these securities can be volatile, particularly over the short term. In addition, the Fund may invest up to 40% of its net assets in stocks of foreign companies, which involve special risks, including currency fluctuations and economic as well as political uncertainty. The portfolio includes investments in the technology sector, which has been one of the most volatile sectors of the market. The Fund is actively managed but there is no guarantee that the manager’s investment decisions will produce the desired results. The Fund’s prospectus also includes a description of the main investment risks.
Class B: Class C: | These shares have higher annual fees and expenses than Class A shares. Prior to 1/1/04, these shares were offered with an initial sales charge; thus actual total returns would have differed. These shares have higher annual fees and expenses than Class A shares. |
Class R: | Shares are available to certain eligible investors as described in the prospectus. These shares have higher annual fees and expenses than Class A shares. |
Advisor Class: | Shares are available to certain eligible investors as described in the prospectus. |
1. Cumulative total return represents the change in value of an investment over the periods indicated.
2. Average annual total return represents the average annual change in value of an investment over the periods indicated. Six-month return has not been annualized.
3. These figures represent the value of a hypothetical $10,000 investment in the Fund over the periods indicated.
4. Figures are as stated in the Fund’s prospectus current as of the date of this report. In periods of market volatility, assets may decline significantly, causing total annual Fund operating expenses to become higher than the figures shown.
18 | Semiannual Report
Your Fund’s Expenses
Franklin Growth Fund
As a Fund shareholder, you can incur two types of costs:
- Transaction costs, including sales charges (loads) on Fund purchases; and
- Ongoing Fund costs, including management fees, distribution and service (12b-1) fees, and other Fund expenses. All mutual funds have ongoing costs, sometimes referred to as operating expenses.
The following table shows ongoing costs of investing in the Fund and can help you understand these costs and compare them with those of other mutual funds. The table assumes a $1,000 investment held for the six months indicated.
Actual Fund Expenses
The first line (Actual) for each share class listed in the table provides actual account values and expenses. The “Ending Account Value” is derived from the Fund’s actual return, which includes the effect of Fund expenses.
You can estimate the expenses you paid during the period by following these steps. Of course, your account value and expenses will differ from those in this illustration:
| 1. | Divide your account value by $1,000. |
| If an account had an $8,600 value, then $8,600 ÷ $1,000 = 8.6. | |
| 2. | Multiply the result by the number under the heading “Expenses Paid During Period.” |
| If Expenses Paid During Period were $7.50, then 8.6 x $7.50 = $64.50. |
In this illustration, the estimated expenses paid this period are $64.50.
Hypothetical Example for Comparison with Other Funds
Information in the second line (Hypothetical) for each class in the table can help you compare ongoing costs of investing in the Fund with those of other mutual funds. This information may not be used to estimate the actual ending account balance or expenses you paid during the period. The hypothetical “Ending Account Value” is based on the actual expense ratio for each class and an assumed 5% annual rate of return before expenses, which does not represent the Fund’s actual return. The figure under the heading “Expenses Paid During Period” shows the hypothetical expenses your account would have incurred under this scenario. You can compare this figure with the 5% hypothetical examples that appear in shareholder reports of other funds.
Semiannual Report | 19
Your Fund’s Expenses (continued)
Please note that expenses shown in the table are meant to highlight ongoing costs and do not reflect any transaction costs, such as sales charges. Therefore, the second line for each class is useful in comparing ongoing costs only, and will not help you compare total costs of owning different funds. In addition, if transaction costs were included, your total costs would have been higher. Please refer to the Fund prospectus for additional information on operating expenses.
*Expenses are calculated using the most recent six-month expense ratio, annualized for each class (A: 0.93%; B: 1.67%; C: 1.68%; R: 1.18%; and Advisor: 0.68%), multiplied by the average account value over the period, multiplied by 183/366 to reflect the one-half year period.
20 | Semiannual Report
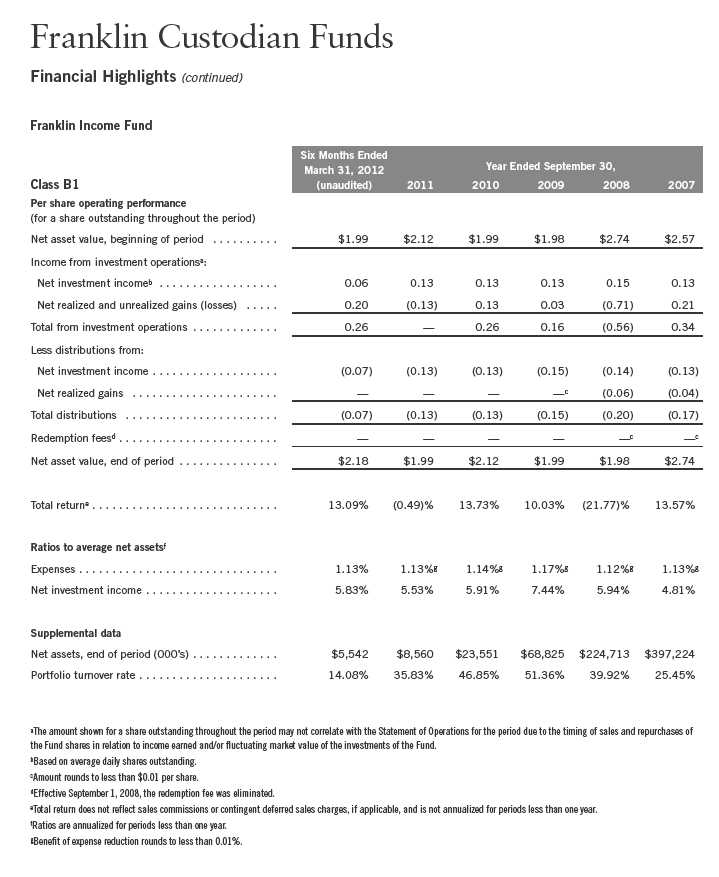
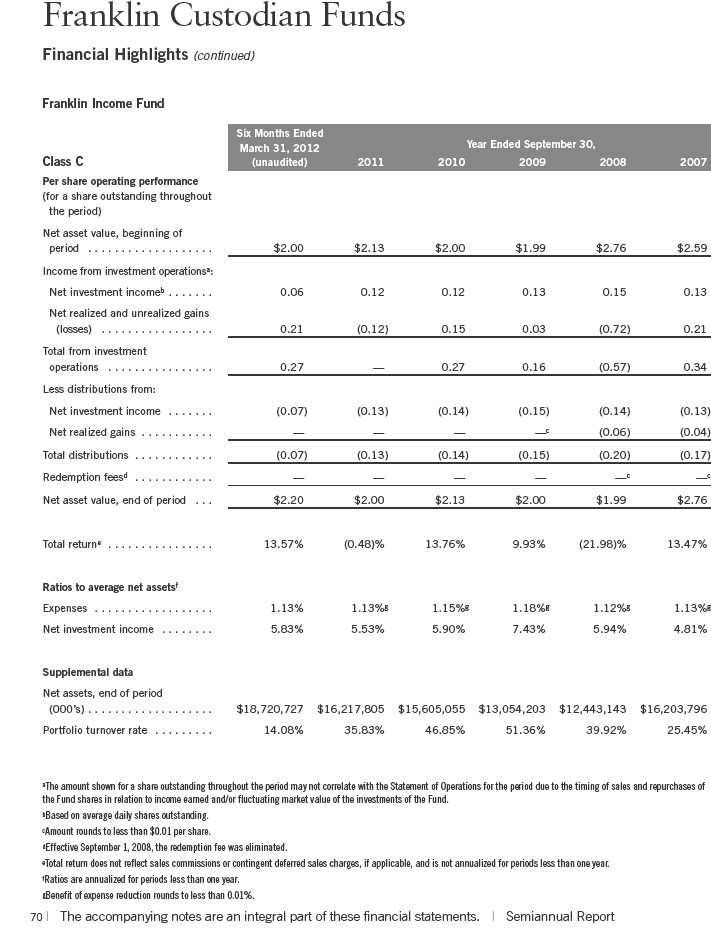
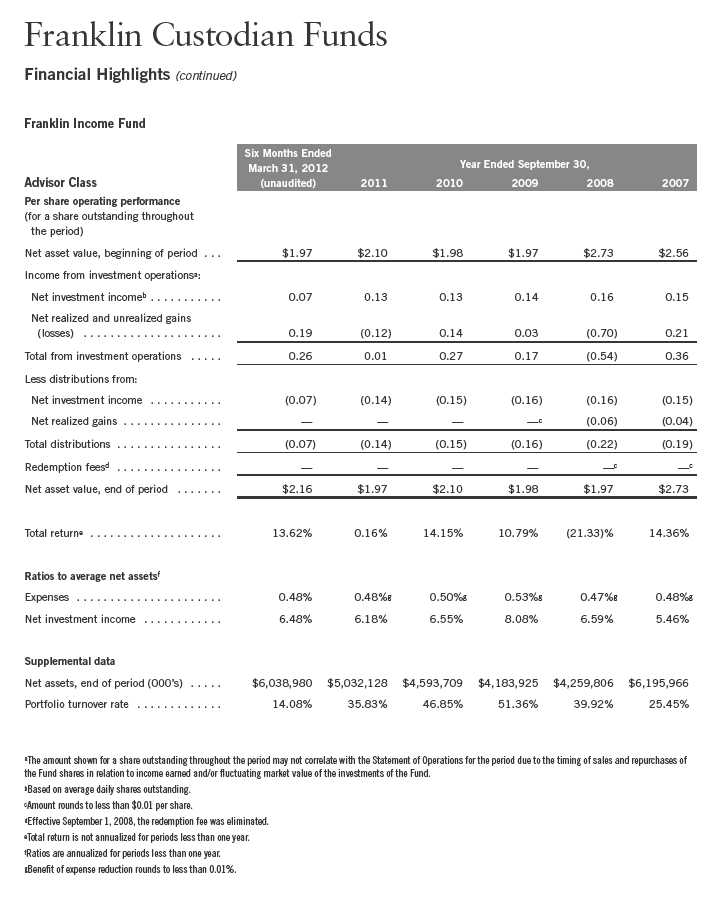
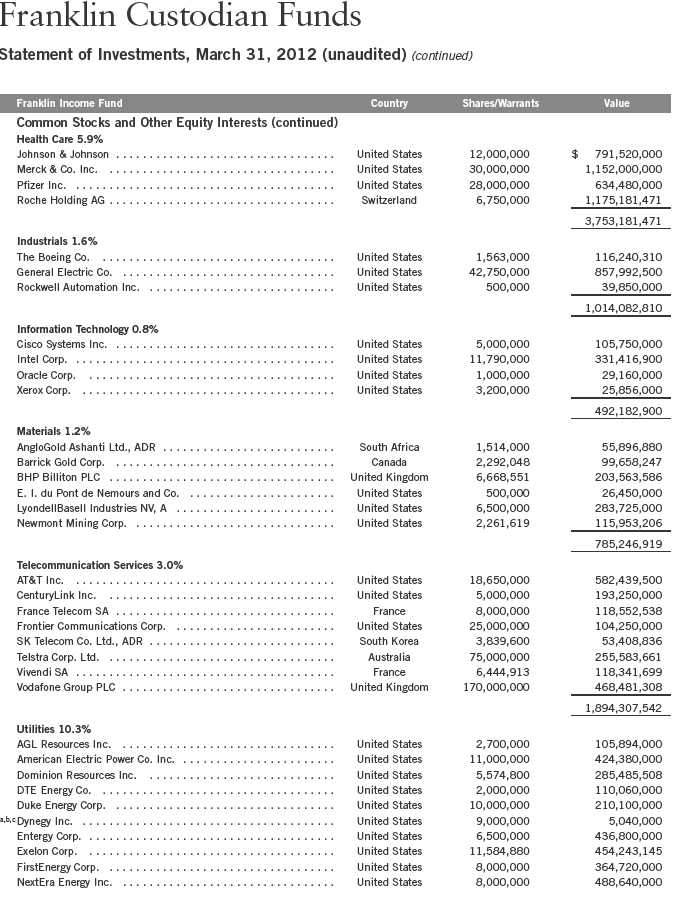
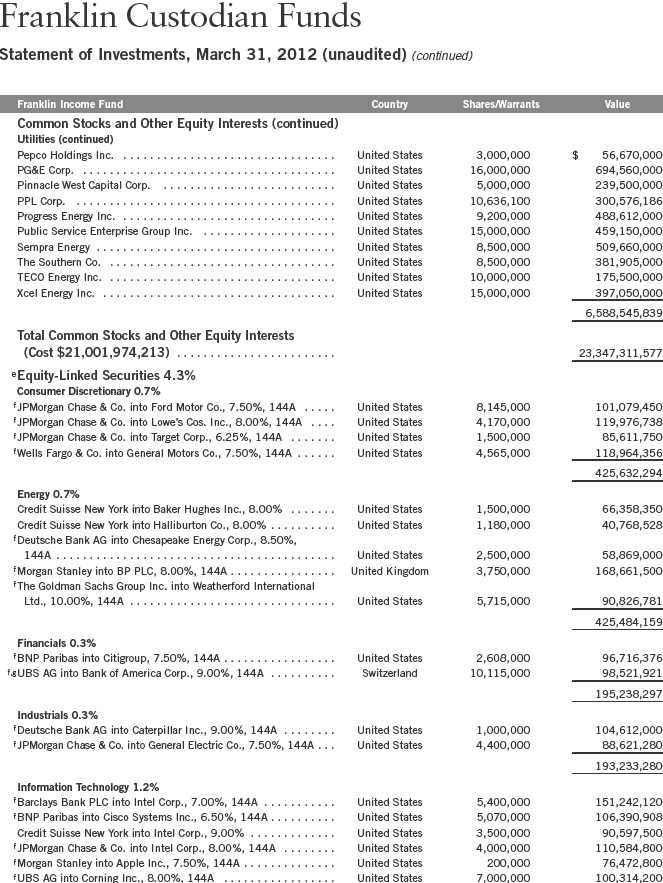
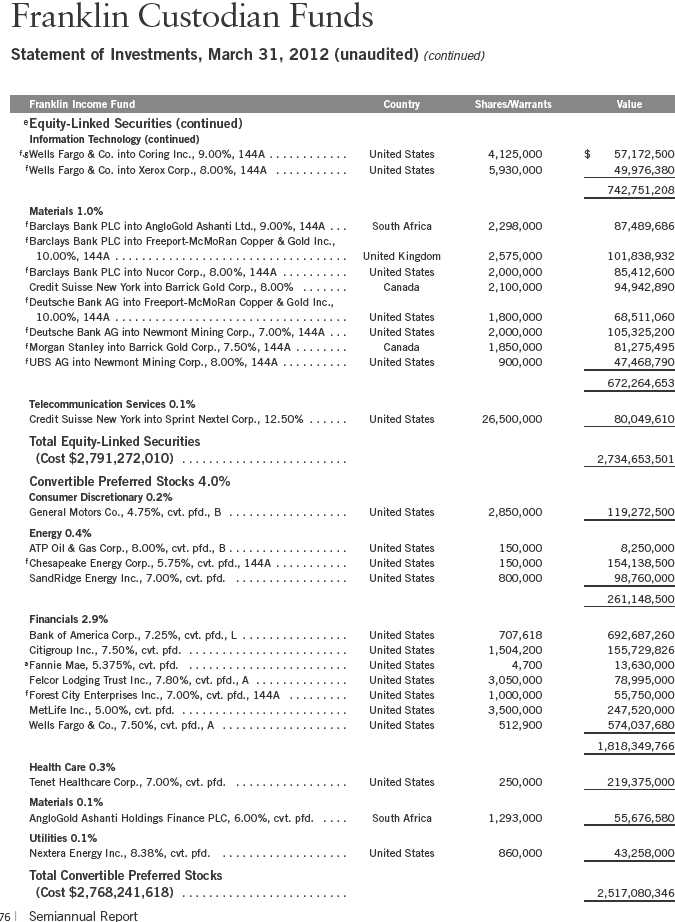
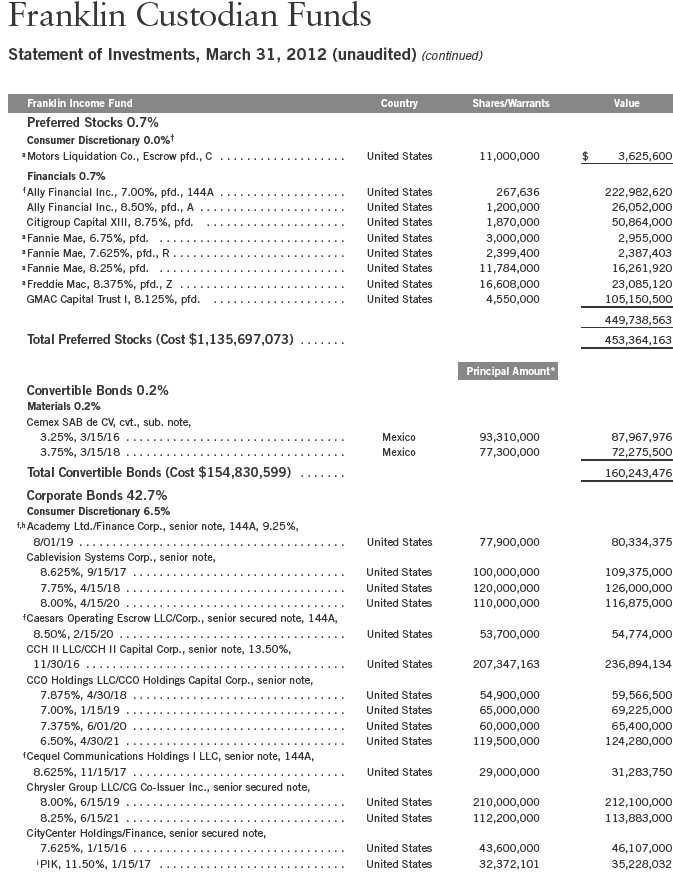
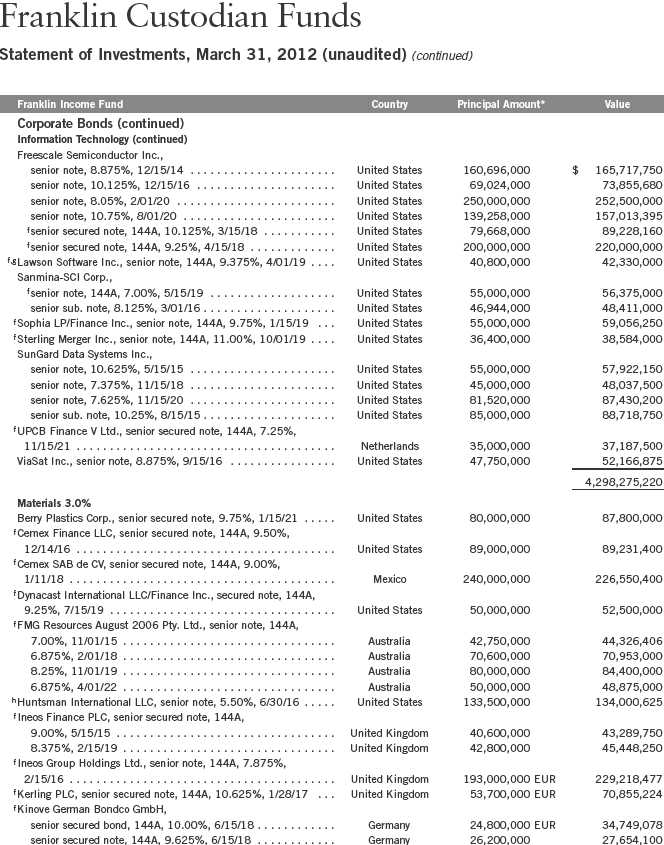
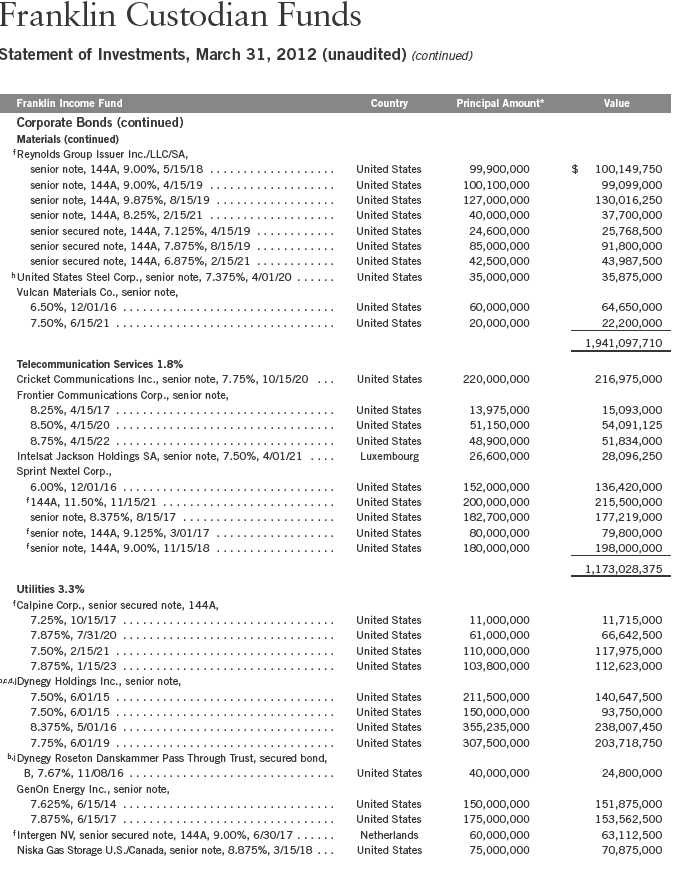
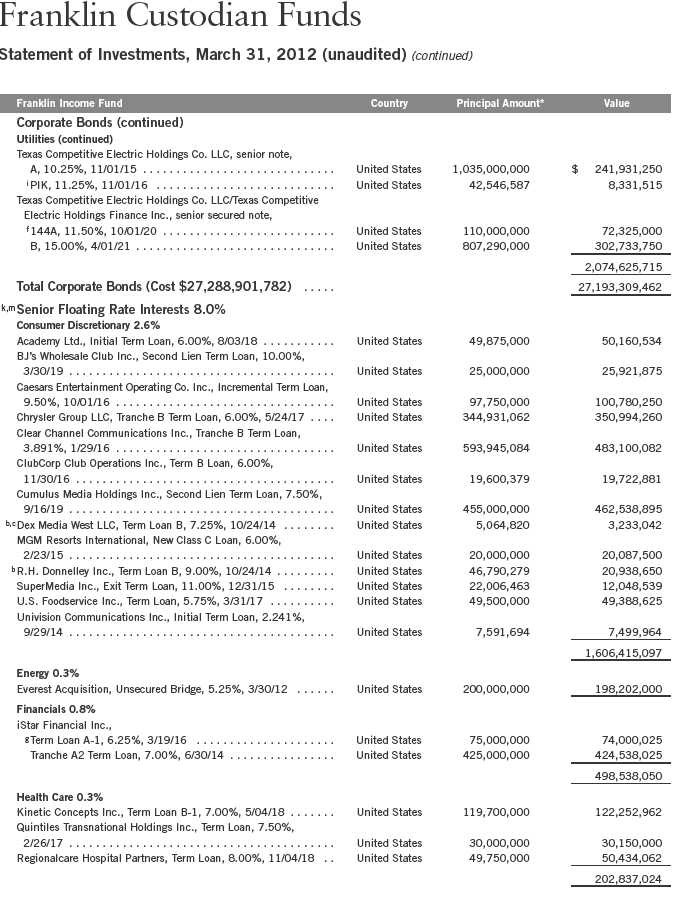
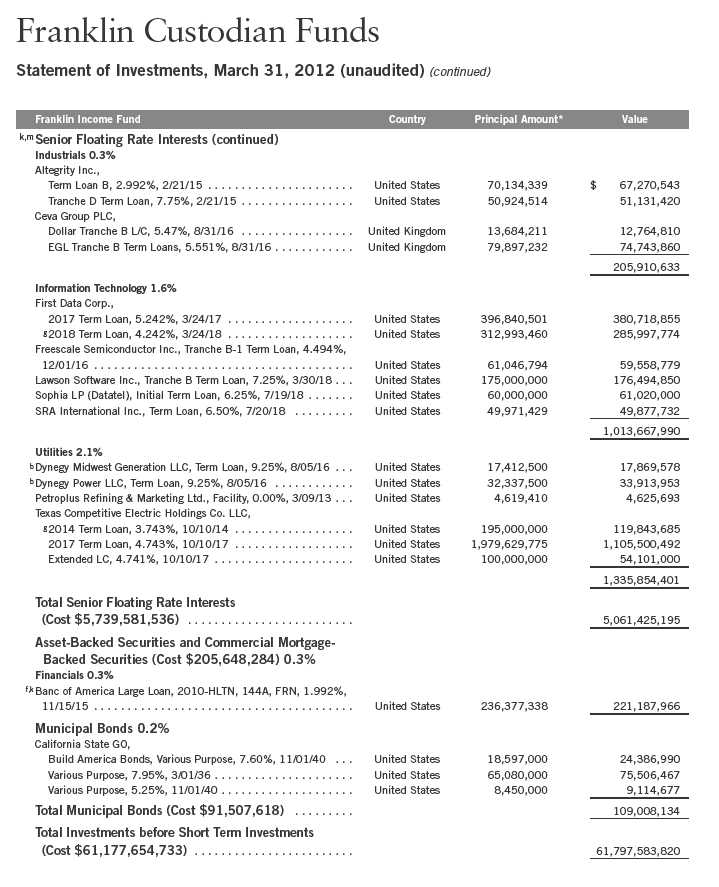
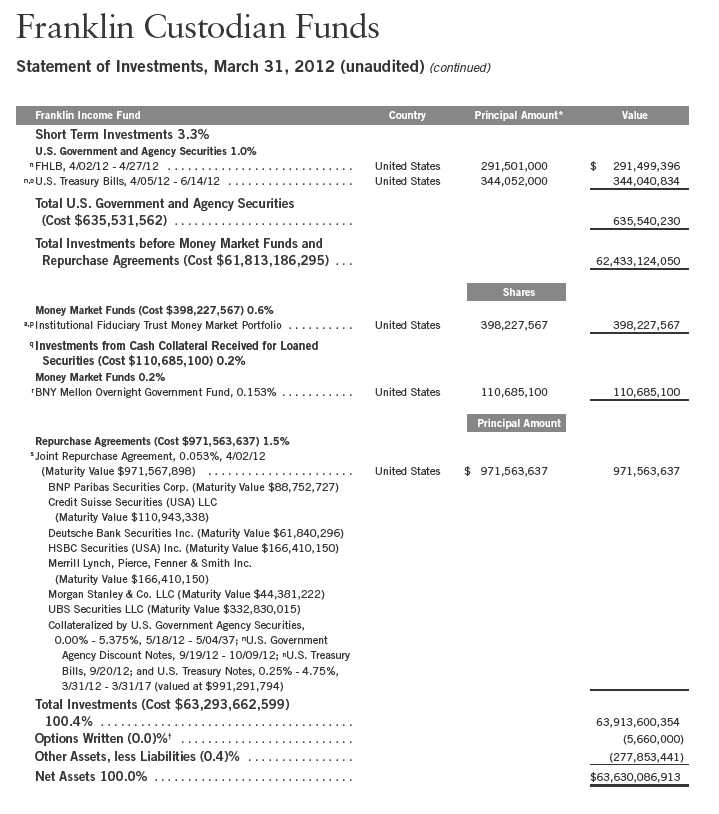
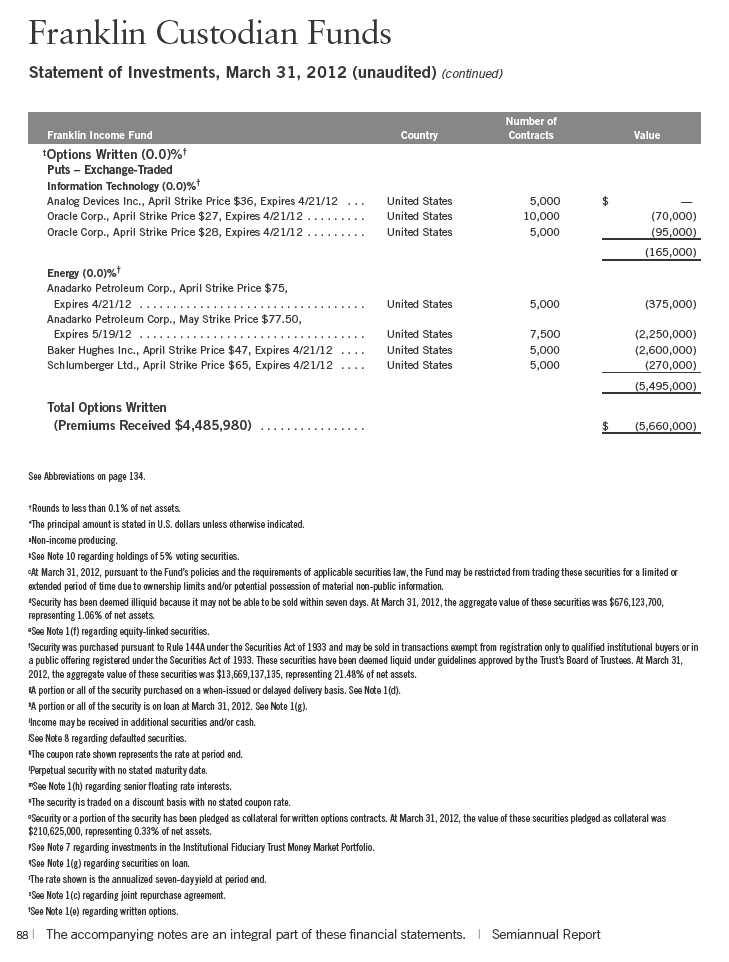
Franklin Income Fund
Your Fund’s Goal and Main Investments: Franklin Income Fund seeks to maximize income while maintaining prospects for capital appreciation by investing, under normal market conditions, in a diversified portfolio of debt and equity securities.
Performance data represent past performance, which does not guarantee future results. Investment return and principal value will fluctuate, and you may have a gain or loss when you sell your shares. Current performance may differ from figures shown. Please visit franklintempleton.com or call (800) 342-5236 for most recent month-end performance.
This semiannual report for Franklin Income Fund covers the period ended March 31, 2012.
Performance Overview
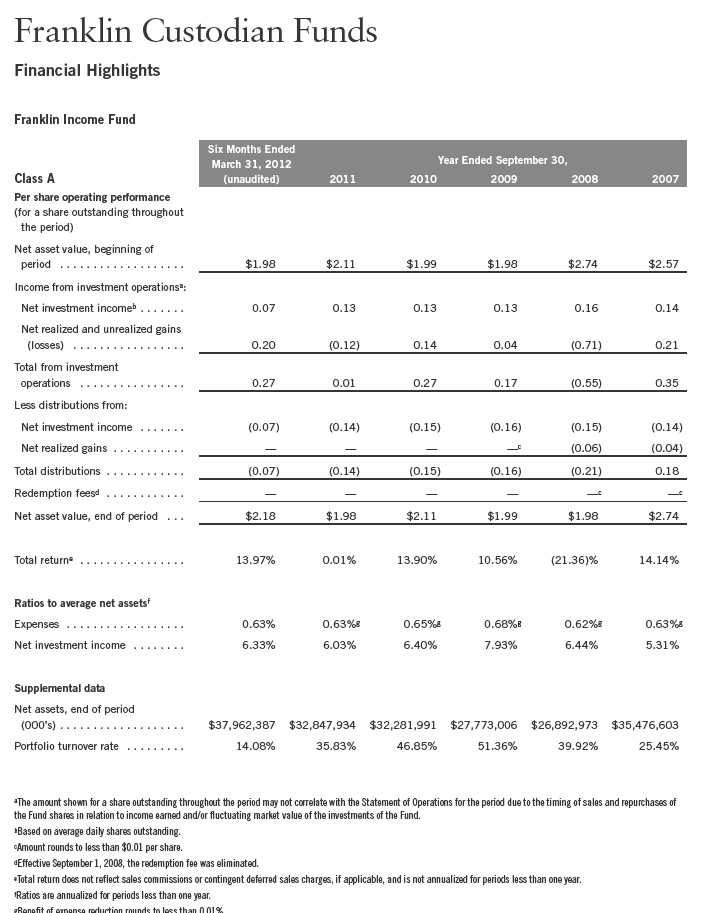
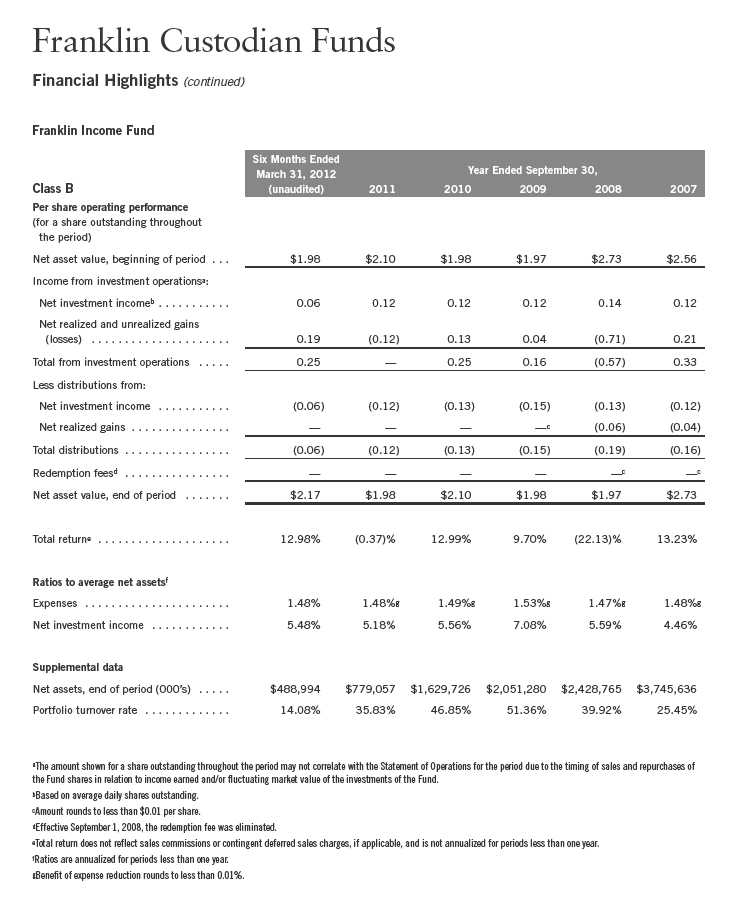
Franklin Income Fund – Class A delivered a +13.97% cumulative total return for the six months under review. The Fund underperformed the +25.89% total return of its equity benchmark, the Standard & Poor’s 500 Index (S&P 500), which is a broad measure of U.S. stock performance.1 The Fund outperformed the +1.43% total return of its fixed income benchmark, the Barclays Capital (BC) U.S. Aggregate Index, which tracks the U.S. investment-grade, taxable bond market.1 The Fund performed comparably to the +13.96% total return of its peers as measured by the Lipper Mixed-Asset Target Allocation Moderate Funds Classification Average, which consists of funds chosen by Lipper that, by practice, maintain a mix of 40% to 60% equity securities, with the remainder in bonds and cash.2 You can find the Fund’s long-term performance data in the Performance Summary beginning on page 26.
Investment Strategy
By generally performing independent analysis of debt, convertible and equity securities, we search for undervalued or out-of-favor securities we believe offer opportunities for income today and significant growth tomorrow. We consider such factors as a company’s experience and managerial strength; its responsiveness to changes in interest rates and business conditions; debt maturity schedules and borrowing requirements; a company’s changing financial condition and market recognition of the change; and a security’s relative value based on such
1. Source: © 2012 Morningstar. All Rights Reserved. The information contained herein: (1) is proprietary to Morningstar and/or its content providers; (2) may not be copied or distributed; and (3) is not warranted to be accurate, complete or timely. Neither Morningstar nor its content providers are responsible for any damages or losses arising from any use of this information.
2. Source: Lipper Inc. For the six-month period ended 3/31/12, this category consisted of 496 funds. Lipper calculations do not include sales charges or expense subsidization by a fund’s manager. The Fund’s performance relative to the average may have differed if these and other factors had been considered.
The indexes are unmanaged and include reinvestment of any income or distributions. One cannot invest directly in an index, and an index is not representative of the Fund’s portfolio.
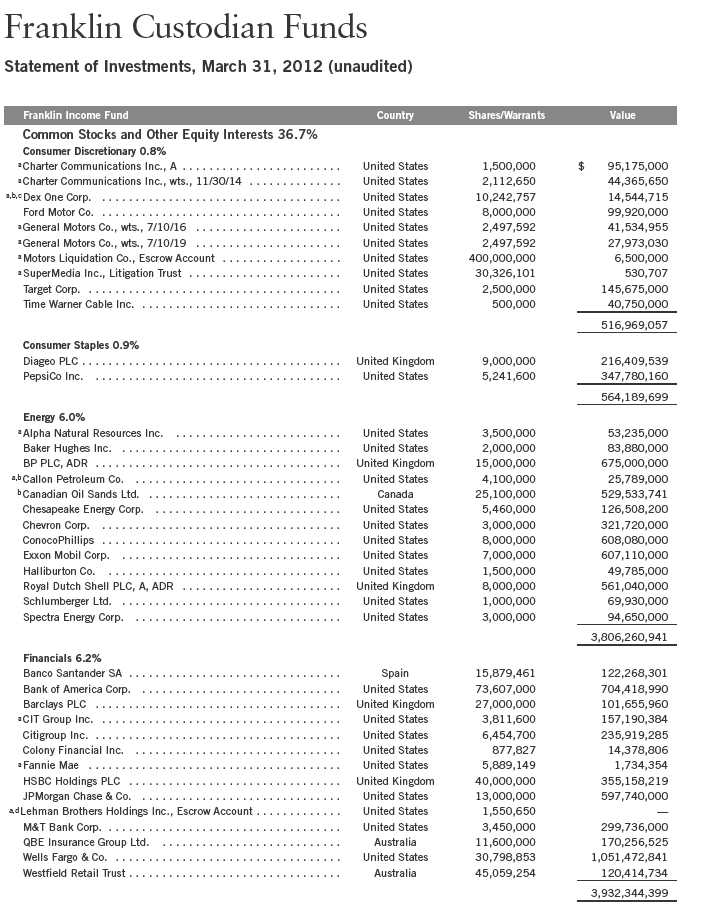
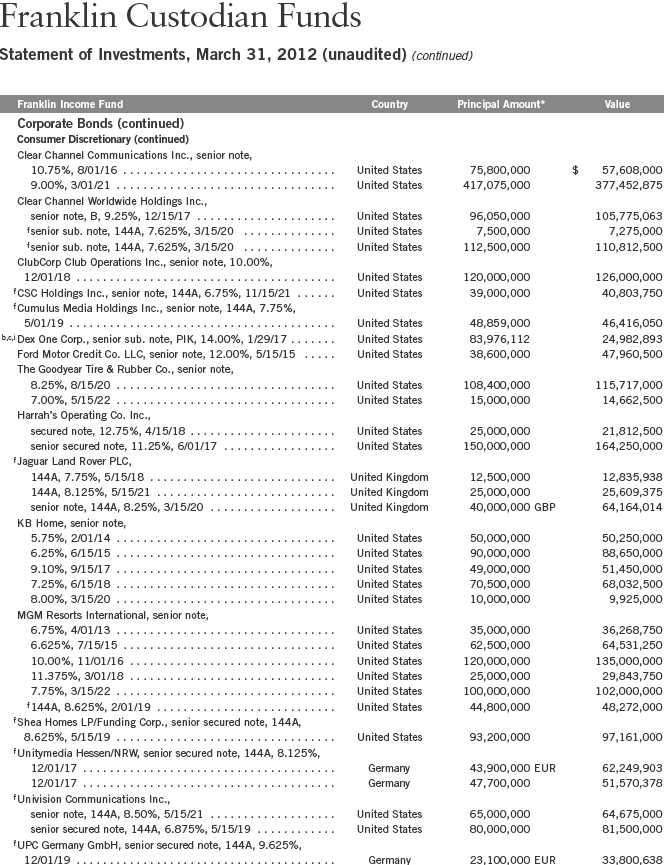
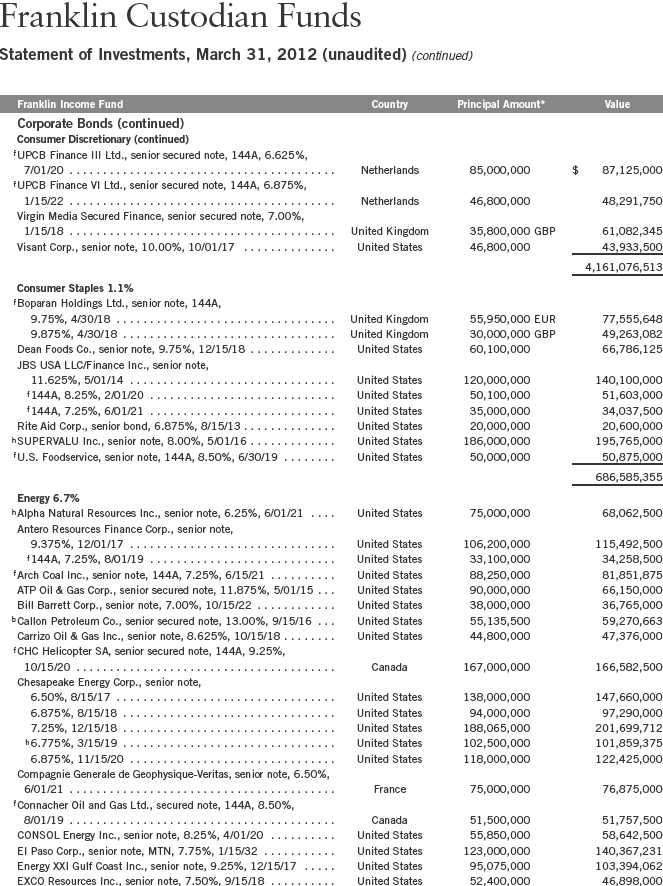
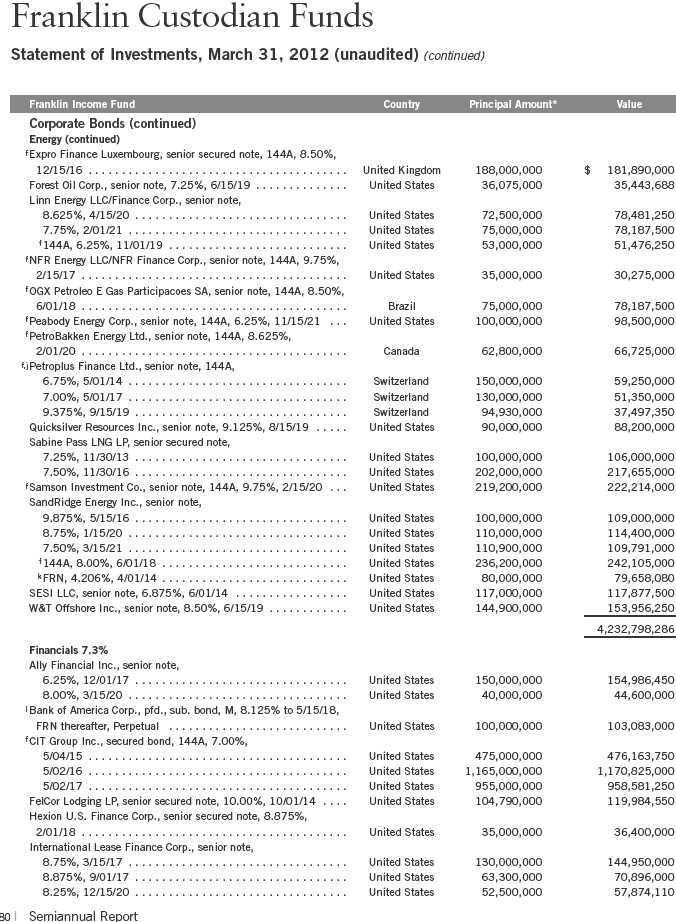
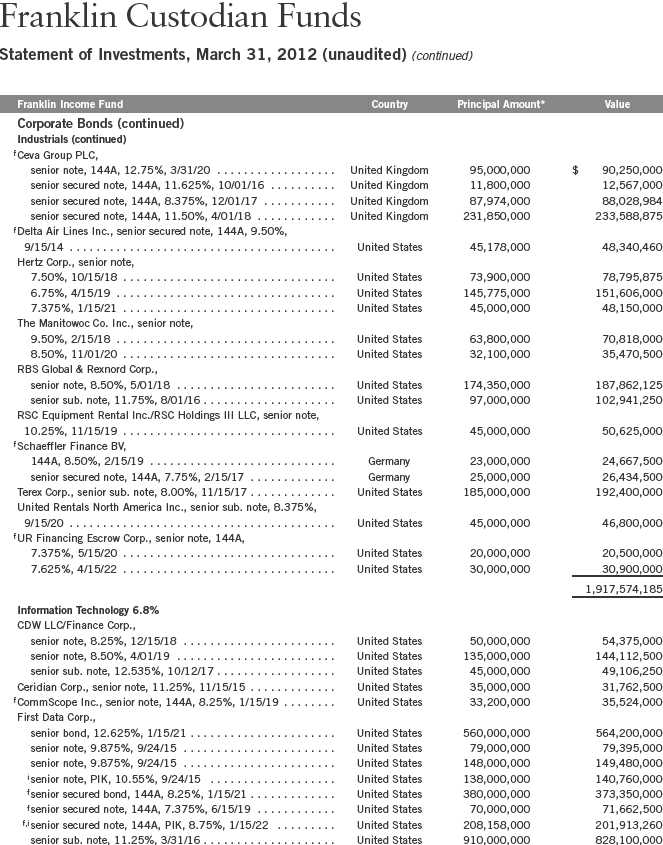
The dollar value, number of shares or principal amount, and names of all portfolio holdings are listed in the Fund’s Statement of Investments (SOI). The SOI begins on page 73.
Semiannual Report | 21
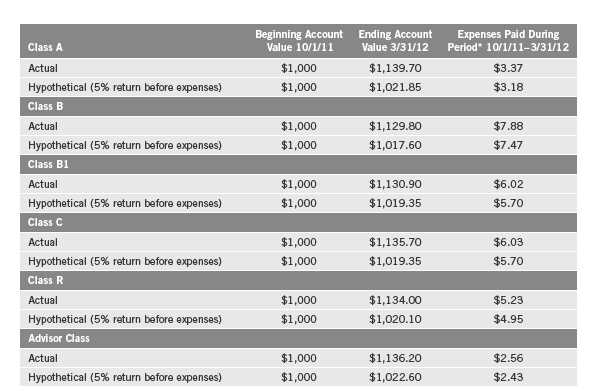
Dividend Distributions*

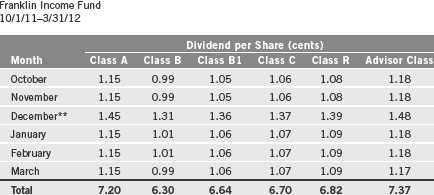
*All Fund distributions will vary depending upon current market conditions, and past distributions are not indicative of future trends.
**Includes an additional 0.30 cent per share distribution to meet excise tax requirements.
factors as anticipated cash flow, interest or dividend coverage, asset coverage and earnings.
Manager’s Discussion
During the six-month reporting period, renewed investor risk tolerance following a period of heightened economic and systemic risk in mid-2011 drove U.S. equity market gains. Although investor perception of heightened risk related to European and U.S. fiscal challenges dominated the markets from July through September 2011, the reality of sustained moderate economic growth and healthy corporate profit levels buoyed stocks from October 2011 through March 2012. Fixed income market returns remained somewhat challenged due to the combined effects of low overall interest rates and the potential negative impact of rising long-term interest rates.
During the period under review, the Fund’s total fixed income exposure decreased to 51.2% from 56.2% of total net assets, and its equity exposure increased to 45.9% from 42.2%. Our cash position increased during the period to 2.9% from 1.6% of total net assets. Within fixed income, the majority of asset declines came from corporate bonds through a combination of profit taking as many long-duration securities traded at significant premiums to par value when corporate spreads tightened, and refinancing because many companies called securities and issued longer maturity debt at lower interest costs. Spread widening pressured high yield markets in August and September 2011, and along with low yields and the broader market’s returns, helped set the bar for a period of stronger performance during the reporting period.
22 | Semiannual Report
Within the Fund’s fixed income investments, corporate bond holdings performed well relative to the broader fixed income market’s lackluster return as favorable credit fundamentals helped drive credit spreads lower and long-term interest rates remained relatively in check. The technology, communications, consumer cyclical and consumer non-cyclical sectors performed well, while the electric utilities sector was a notable laggard.
Within equity securities, our common stock holdings increased, while our convertible security holdings decreased modestly. We favored the relative value of stocks over fixed income investments, a sentiment that was supported by a number of trends including stable, albeit modest, economic growth, high corporate profit margins, improved balance sheets (including large cash balances), and renewed evidence of dividend increases and share buybacks. We view dividend increases and share buybacks as shareholder friendly actions, rather than management-driven actions taken to improve credit profiles. Although we still consider convertible securities to be an attractive asset class for the Fund’s strategy over the long term, opportunities were somewhat limited recently due to the low level of new issuance in that market. The Fund’s equity exposure remained broadly diversified, with the largest weightings in utilities, financials, energy and health care. The Fund’s financials exposure increased meaningfully following a period of price volatility during the summer of 2011.
Although the Fund’s cash position increased slightly during the period, our approach is to look for opportunities to meet the Fund’s objective, rather than structurally looking to hold more cash in the portfolio. We are actively looking for what we consider to be attractive investments for the Fund.
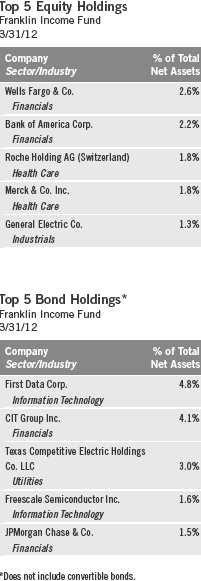
Individual bond issuers that performed well included First Data, a leading electronic transactions processing company, which was a key fixed income contributor. The company benefited from factors including improved spending trends, a better-than-expected outcome related to increased regulation, and specific actions the company took to extend its near-term maturities, providing greater overall balance sheet flexibility. Similarly, our Clear Channel Communications bond holdings benefited from greater demand for advertising services amid the improving economy. Other strong fixed income contributors included CIT Group and JPMorgan Chase & Co. in financials, hospital operators HCA and Tenet Healthcare in health care, and Chrysler Group in consumer discretionary. Chrysler benefited from strengthening auto sales as the economy continued its gradual improvement and from the company’s better offerings, particularly with Jeep models.
Texas Competitive Electric Holdings, a leading electricity generator and retail service provider in Texas, was a major fixed income detractor. Despite robust demand for power over the past year, this coal-based generator’s profitability
Semiannual Report | 23
was hurt by the decline in natural gas prices. Although the company has what we consider to be attractive hedges in place for the next couple of years, we feel long-term improvement will be needed for the company to navigate future debt servicing requirements. Other detractors included Petroplus Finance, an independent refiner in Europe that faced year-end liquidity strains amid weak demand, and Clearwire Communications (sold by period-end), which was pressured by funding concerns as the company sought to build out its network of wireless broadband services.
Among the Fund’s equity holdings, financials led the way with significant gains from Bank of America, Wells Fargo & Co., JPMorgan Chase & Co. and Citigroup. Investors seemed to become more comfortable with capital requirements amid an unpredictable regulatory environment and in the cases of Wells Fargo and JPMorgan Chase & Co., the ability to increase dividends and pursue share buybacks. Other top equity performers included major pharmaceutical companies such as Merck & Co., Pfizer and Roche Holding, which we believe benefited from cheap valuations and attractive dividend yields, as well as the perception that the pharmaceutical industry may finally be moving forward after the negative impact major patent expirations had on its financial results. General Electric and Intel were also key contributors. In our analysis, both holdings are high-quality companies with strong leadership positions and investment-grade quality balance sheets, and could be well positioned to increase dividends.
24 | Semiannual Report
Thank you for your continued participation in Franklin Income Fund.
We look forward to serving your future investment needs.

The foregoing information reflects our analysis, opinions and portfolio holdings as of March 31, 2012, the end of the reporting period. The way we implement our main investment strategies and the resulting portfolio holdings may change depending on factors such as market and economic conditions. These opinions may not be relied upon as investment advice or an offer for a particular security. The information is not a complete analysis of every aspect of any market, country, industry, security or the Fund. Statements of fact are from sources considered reliable, but the investment manager makes no representation or warranty as to their completeness or accuracy. Although historical performance is no guarantee of future results, these insights may help you understand our investment management philosophy.
Semiannual Report | 25
Performance Summary as of 3/31/12
Franklin Income Fund
Your dividend income will vary depending on dividends or interest paid by securities in the Fund’s portfolio, adjusted for operating expenses of each class. Capital gain distributions are net profits realized from the sale of portfolio securities. The performance table does not reflect any taxes that a shareholder would pay on Fund dividends, capital gain distributions, if any, or any realized gains on the sale of Fund shares. Total return reflects reinvestment of the Fund’s dividends and capital gain distributions, if any, and any unrealized gains or losses.
26 | Semiannual Report
Performance Summary (continued)
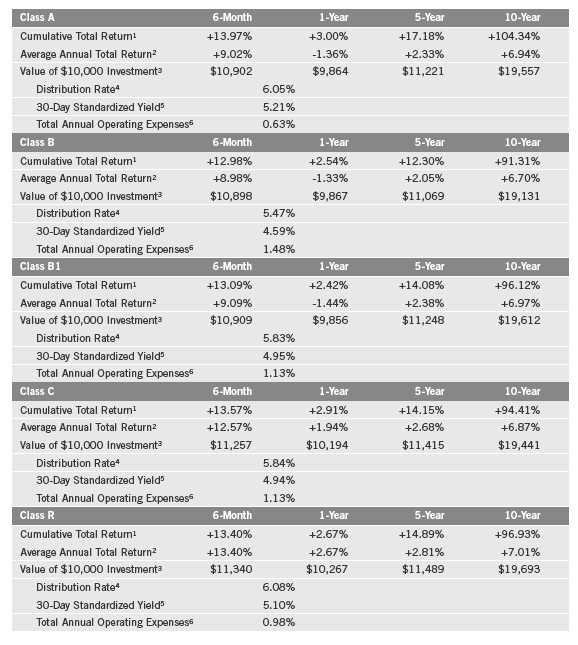
Performance
Cumulative total return excludes sales charges. Average annual total return and value of $10,000 investment include maximum sales charges. Class A: 4.25% maximum initial sales charge; Class B/B1: contingent deferred sales charge (CDSC) declining from 4% to 1% over six years, and eliminated thereafter; Class C: 1% CDSC in first year only;
Class R/Advisor Class: no sales charges.
Semiannual Report | 27
Performance Summary (continued)
Performance data represent past performance, which does not guarantee future results. Investment return and principal value will fluctuate, and you may have a gain or loss when you sell your shares. Current performance may differ from figures shown. For most recent month-end performance, go to franklintempleton.com or call (800) 342-5236.
Endnotes
All investments involve risks, including possible loss of principal. The Fund’s share price and yield will be affected by interest rate movements. Bond prices generally move in the opposite direction of interest rates. Thus, as prices of bonds in the Fund adjust to a rise in interest rates, the Fund’s share price may decline. The Fund’s portfolio includes a substantial portion of higher yielding, lower-rated corporate bonds because of the relatively higher yields they offer. Floating-rate loans are lower rated, higher yielding instruments, which are subject to increased risk of default and can potentially result in loss of principal. These securities carry a greater degree of credit risk relative to investment grade securities. Stock prices fluctuate, sometimes rapidly and dramatically due to factors affecting individual companies, particular industries or sectors, or general market conditions. Changes in the financial strength of a bond issuer or in a bond’s credit rating may affect its value. The Fund is actively managed but there is no guarantee that the manager’s investment decisions will produce the desired results. The Fund’s prospectus also includes a description of the main investment risks.
Class B: Class B1 (formerly Class B): Class C: | These shares have higher annual fees and expenses than Class A shares. These shares have higher annual fees and expenses than Class A shares. Effective 11/1/01, closed to new investors. Prior to 1/1/04, these shares were offered with an initial sales charge; thus actual total returns would have differed. These shares have higher annual fees and expenses than Class A shares. |
Class R: | Shares are available to certain eligible investors as described in the prospectus. These shares have higher annual fees and expenses than Class A shares. |
Advisor Class: | Shares are available to certain eligible investors as described in the prospectus. |
1. Cumulative total return represents the change in value of an investment over the periods indicated.
2. Average annual total return represents the average annual change in value of an investment over the periods indicated. Six-month return has not been annualized.
3. These figures represent the value of a hypothetical $10,000 investment in the Fund over the periods indicated.
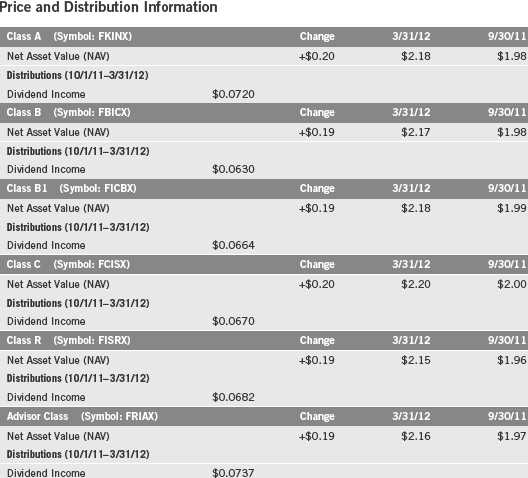
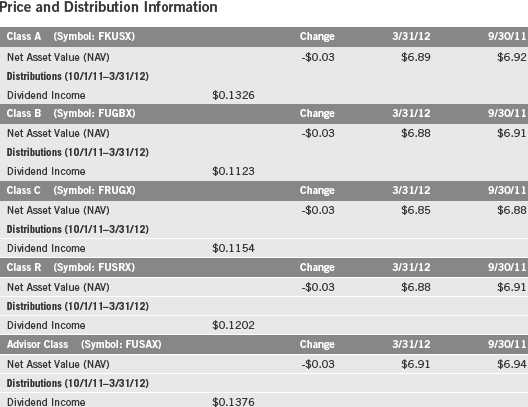
4. Distribution rate is based on an annualization of the respective class’s March dividend and the maximum offering price (NAV for Classes B, B1, C, R and Advisor) per share on 3/31/12.
5. The 30-day standardized yield for the 30 days ended 3/31/12 reflects an estimated yield to maturity (assuming all portfolio securities are held to maturity). It should be regarded as an estimate of the Fund’s rate of investment income, and it may not equal the Fund’s actual income distribution rate (which reflects the Fund’s past dividends paid to shareholders) or the income reported in the Fund’s financial statements.
6. Figures are as stated in the Fund’s prospectus current as of the date of this report. In periods of market volatility, assets may decline significantly, causing total annual Fund operating expenses to become higher than the figures shown.
28 | Semiannual Report
Your Fund’s Expenses
Franklin Income Fund
As a Fund shareholder, you can incur two types of costs:
- Transaction costs, including sales charges (loads) on Fund purchases; and
- Ongoing Fund costs, including management fees, distribution and service (12b-1) fees, and other Fund expenses. All mutual funds have ongoing costs, sometimes referred to as operating expenses.
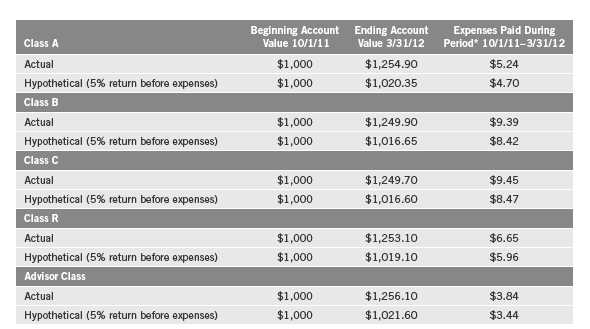
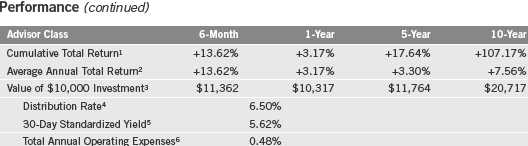
The following table shows ongoing costs of investing in the Fund and can help you understand these costs and compare them with those of other mutual funds. The table assumes a $1,000 investment held for the six months indicated.
Actual Fund Expenses
The first line (Actual) for each share class listed in the table provides actual account values and expenses. The “Ending Account Value” is derived from the Fund’s actual return, which includes the effect of Fund expenses.
You can estimate the expenses you paid during the period by following these steps. Of course, your account value and expenses will differ from those in this illustration:
| 1. | Divide your account value by $1,000. |
| If an account had an $8,600 value, then $8,600 ÷ $1,000 = 8.6. | |
| 2. | Multiply the result by the number under the heading “Expenses Paid During Period.” |
| If Expenses Paid During Period were $7.50, then 8.6 x $7.50 = $64.50. |
In this illustration, the estimated expenses paid this period are $64.50.
Hypothetical Example for Comparison with Other Funds
Information in the second line (Hypothetical) for each class in the table can help you compare ongoing costs of investing in the Fund with those of other mutual funds. This information may not be used to estimate the actual ending account balance or expenses you paid during the period. The hypothetical “Ending Account Value” is based on the actual expense ratio for each class and an assumed 5% annual rate of return before expenses, which does not represent the Fund’s actual return. The figure under the heading “Expenses Paid During Period” shows the hypothetical expenses your account would have incurred under this scenario. You can compare this figure with the 5% hypothetical examples that appear in shareholder reports of other funds.
Semiannual Report | 29
Your Fund’s Expenses (continued)
Please note that expenses shown in the table are meant to highlight ongoing costs and do not reflect any transaction costs, such as sales charges. Therefore, the second line for each class is useful in comparing ongoing costs only, and will not help you compare total costs of owning different funds. In addition, if transaction costs were included, your total costs would have been higher. Please refer to the Fund prospectus for additional information on operating expenses.
*Expenses are calculated using the most recent six-month expense ratio, annualized for each class (A: 0.63%; B: 1.48%; B1: 1.13%; C: 1.13%; R: 0.98%; and Advisor: 0.48%), multiplied by the average account value over the period, multiplied by 183/366 to reflect the one-half year period.
30 | Semiannual Report
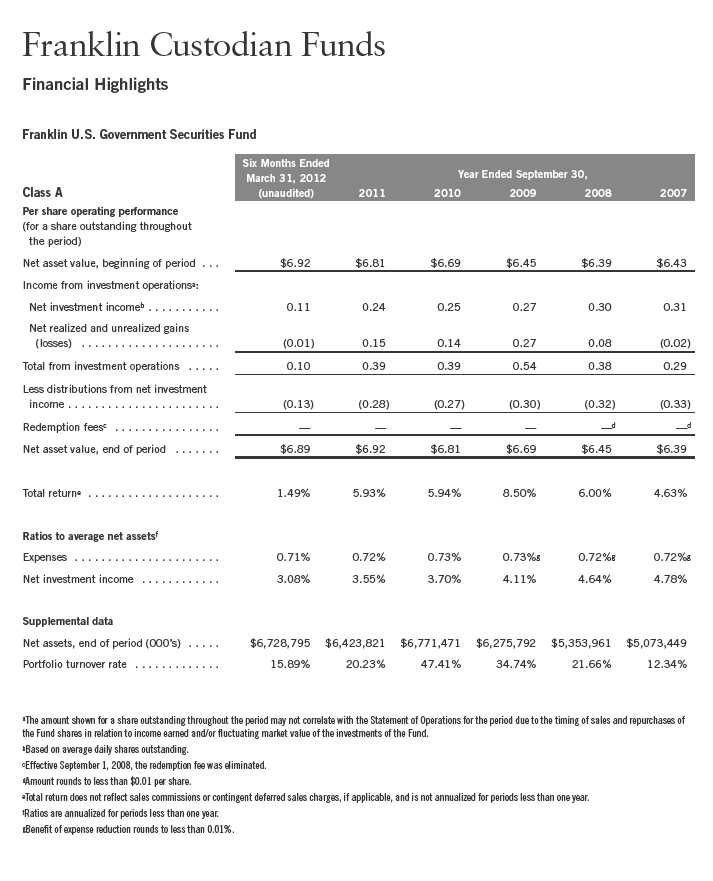
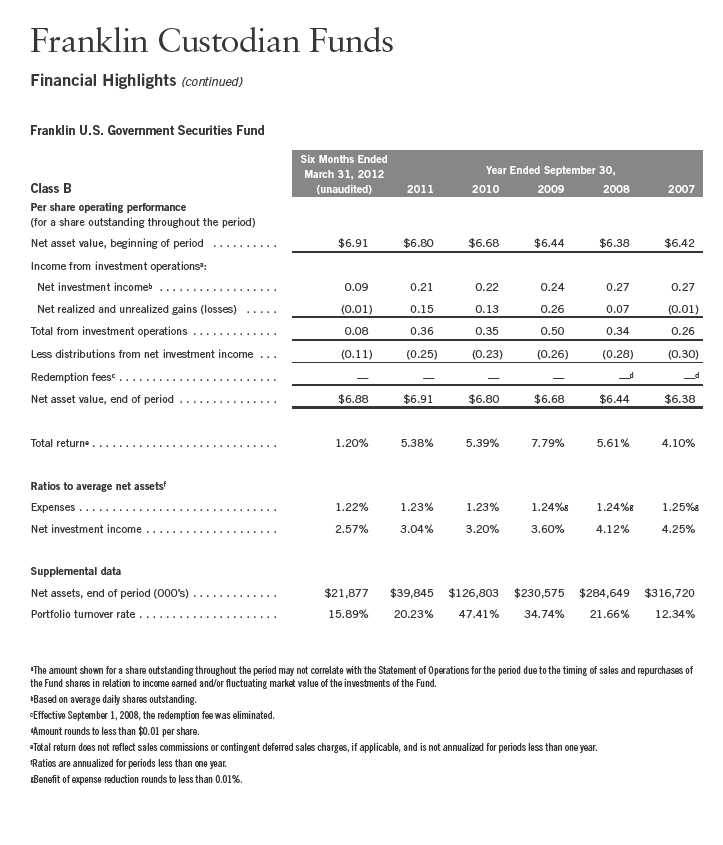
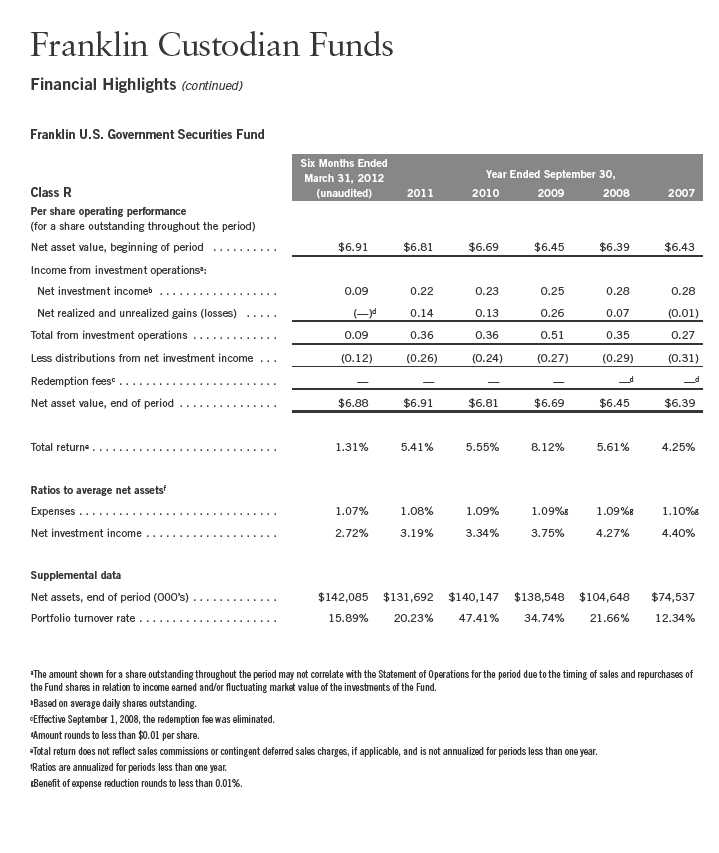
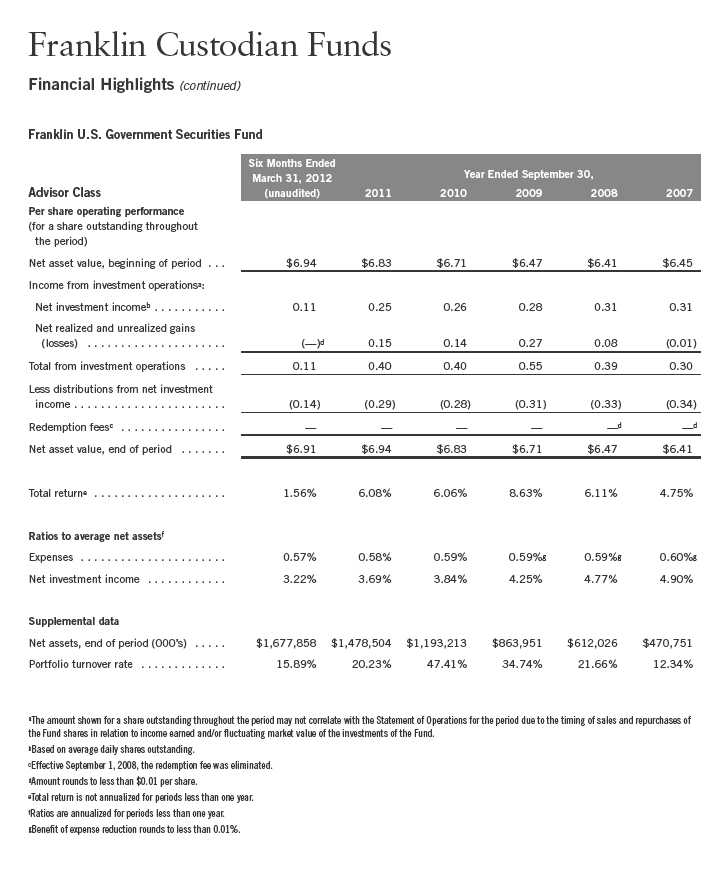
Franklin U.S. Government Securities Fund
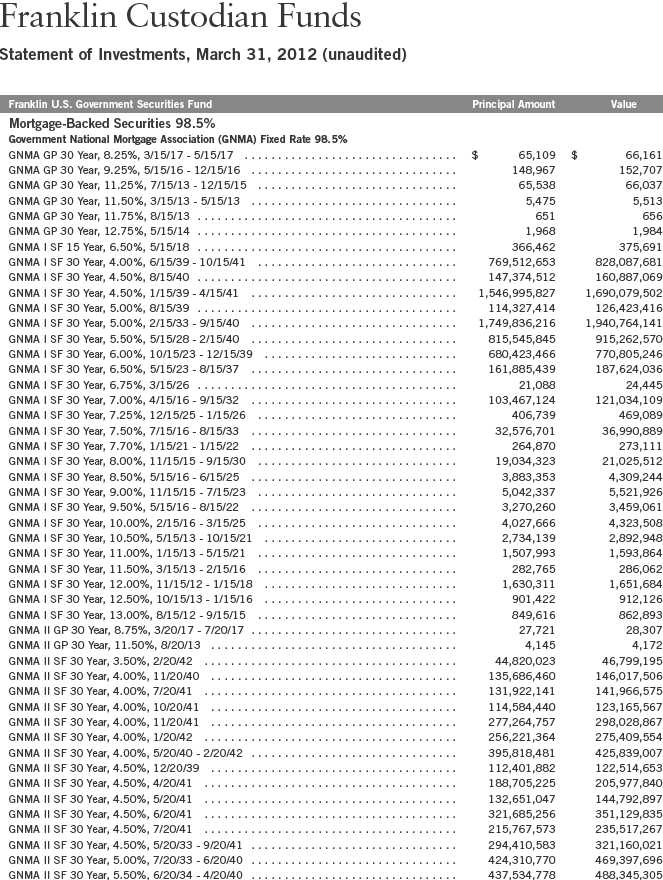
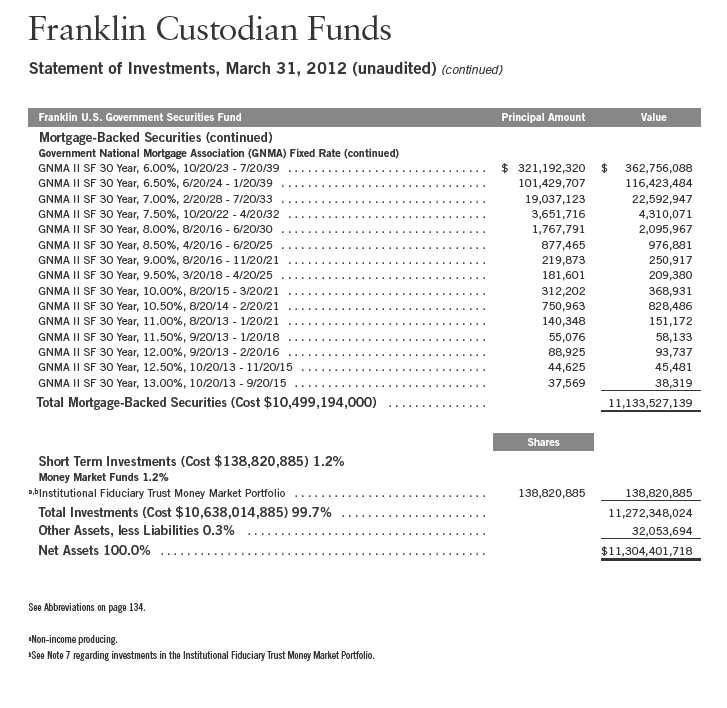
Your Fund’s Goal and Main Investments: Franklin U.S. Government Securities Fund seeks income by investing at least 80% of its net assets in U.S. government securities. The Fund presently invests substantially all of its assets in Government National Mortgage Association obligations (Ginnie Maes).
Since 1983, the Fund has invested substantially in Ginnie Mae securities, which carry a guarantee backed by the full faith and credit of the U.S. government as to the timely payment of interest and principal.1 Issued by the Government National Mortgage Association (GNMA), Ginnie Maes have been among the highest yielding U.S. government obligations available.
Performance data represent past performance, which does not guarantee future results. Investment return and principal value will fluctuate, and you may have a gain or loss when you sell your shares. Current performance may differ from figures shown. Please visit franklintempleton.com or call (800) 342-5236 for most recent month-end performance.
We are pleased to bring you Franklin U.S. Government Securities Fund’s semiannual report for the period ended March 31, 2012.
Performance Overview
Franklin U.S. Government Securities Fund – Class A posted a +1.49% cumulative total return for the six months under review. The Fund performed comparably to the +1.46% total return of its peers as measured by the Lipper GNMA Funds Classification Average, which consists of funds chosen by Lipper that invest primarily in GNMAs.2 In comparison, the Fund outperformed the Barclays Capital (BC) U.S. Government Index: Intermediate Component, the intermediate component of the BC U.S. Government Index, which returned +0.30% for the same period.3 The Fund’s return reflects the effect of management fees and expenses, while the BC U.S. Government Index: Intermediate Component does not have such costs. You can find the Fund’s long-term performance data in the Performance Summary beginning on page 34.
Investment Strategy
We currently invest all the Fund’s assets predominantly in GNMA (Ginnie Mae) obligations. We analyze securities using proprietary models to help us identify attractive investment opportunities. The Fund’s short-term investments may include short-term government securities and cash or cash equivalents.
1. Securities owned by the Fund, but not shares of the Fund, are guaranteed by the U.S. government, its agencies or instrumentalities as to timely payment of principal and interest. The Fund’s yield and share price are not guaranteed and will vary with market conditions.
2. Source: Lipper Inc. For the six-month period ended 3/31/12, this category consisted of 69 funds. Lipper calculations do not include sales charges or expense subsidization by a fund’s manager. The Fund’s performance relative to the average may have differed if these or other factors had been considered.
3. Source: © 2012 Morningstar. All Rights Reserved. The information contained herein: (1) is proprietary to Morningstar and/or its content providers; (2) may not be copied or distributed; and (3) is not warranted to be accurate, complete or timely. Neither Morningstar nor its content providers are responsible for any damages or losses arising from any use of this information.
The indexes are unmanaged and include reinvestment of any income or distributions. One cannot invest directly in an index, and an index is not representative of the Fund’s portfolio.
The dollar value, number of shares or principal amount, and names of all portfolio holdings are listed in the Fund’s Statement of Investments (SOI). The SOI begins on page 94.
Semiannual Report | 31
32 | Semiannual Report
and 4.5% and 5.0% GNMAs lagging. We remained weighted to GNMA I securities (comprising single-issuer pools), although our exposure to GNMA II securities (comprising multiple-issuer pools) increased over the period. We increased the Fund’s allocation to some 4.0% and 4.5% GNMA I’s. Our heaviest allocation remained in 4.0% through 5.0% coupons.
Franklin U.S. Government Securities Fund takes a consistent and disciplined approach and invests in GNMA mortgage pass-throughs, which remained the only MBS backed by the full faith and credit of the U.S. government.1 The Fund takes a collateral-intensive research approach to uncover opportunities across the GNMA universe. We believe our experience and continual investment in new technologies can help us identify specified pools and individual securities that offer strong cash flow fundamentals and valuations.
Thank you for your continued participation in Franklin U.S. Government Securities Fund. We welcome your comments and questions and look forward to serving your investment needs in the years ahead.

The foregoing information reflects our analysis, opinions and portfolio holdings as of March 31, 2012, the end of the reporting period. The way we implement our main investment strategies and the resulting portfolio holdings may change depending on factors such as market and economic conditions. These opinions may not be relied upon as investment advice or an offer for a particular security. The information is not a complete analysis of every aspect of any market, country, industry, security or the Fund. Statements of fact are from sources considered reliable, but the investment manager makes no representation or warranty as to their completeness or accuracy. Although historical performance is no guarantee of future results, these insights may help you understand our investment management philosophy.
Semiannual Report | 33
Performance Summary as of 3/31/12
Franklin U.S. Government Securities Fund
Your dividend income will vary depending on dividends or interest paid by securities in the Fund’s portfolio, adjusted for operating expenses of each class. Capital gain distributions are net profits realized from the sale of portfolio securities. The performance table does not reflect any taxes that a shareholder would pay on Fund dividends, capital gain distributions, if any, or any realized gains on the sale of Fund shares. Total return reflects reinvestment of the Fund’s dividends and capital gain distributions, if any, and any unrealized gains or losses.
34 | Semiannual Report
Performance Summary (continued)
Performance
Cumulative total return excludes sales charges. Average annual total return includes maximum sales charges. Class A: 4.25% maximum initial sales charge; Class B: contingent deferred sales charge (CDSC) declining from 4% to 1% over six years, and eliminated thereafter; Class C: 1% CDSC in first year only; Class R/Advisor Class: no sales charges.
Performance data represent past performance, which does not guarantee future results. Investment return and principal value will fluctuate, and you may have a gain or loss when you sell your shares. Current performance may differ from figures shown. For most recent month-end performance, go to franklintempleton.com or call (800) 342-5236.
Semiannual Report | 35
Performance Summary (continued)
Endnotes
All investments involve risks, including possible loss of principal. The Fund’s share price and yield will be affected by interest rate movements and mortgage prepayments. Bond prices generally move in the opposite direction of interest rates. Thus, as prices of bonds in the Fund adjust to a rise in interest rates, the Fund’s share price may decline. Changes in the financial strength of a bond issuer or in a bond’s credit rating may affect its value. The Fund is actively managed but there is no guarantee that the manager’s investment decisions will produce the desired results. The Fund’s prospectus also includes a description of the main investment risks.
Class B: Class C: | These shares have higher annual fees and expenses than Class A shares. Prior to 1/1/04, these shares were offered with an initial sales charge; thus actual total returns would have differed. These shares have higher annual fees and expenses than Class A shares. |
Class R: | Shares are available to certain eligible investors as described in the prospectus. These shares have higher annual fees and expenses than Class A shares. |
Advisor Class: | Shares are available to certain eligible investors as described in the prospectus. |
1. Cumulative total return represents the change in value of an investment over the periods indicated.
2. Average annual total return represents the average annual change in value of an investment over the periods indicated. Six-month return has not been annualized.
3. Distribution rate is based on an annualization of the respective class’s March dividend and the maximum offering price (NAV for Classes B, C, R and Advisor) per share on 3/31/12.
4. The 30-day standardized yield for the 30 days ended 3/31/12 reflects an estimated yield to maturity (assuming all portfolio securities are held to maturity). It should be regarded as an estimate of the Fund’s rate of investment income, and it may not equal the Fund’s actual income distribution rate (which reflects the Fund’s past dividends paid to shareholders) or the income reported in the Fund’s financial statements.
5. Figures are as stated in the Fund’s prospectus current as of the date of this report. In periods of market volatility, assets may decline significantly, causing total annual Fund operating expenses to become higher than the figures shown.
36 | Semiannual Report
Your Fund’s Expenses
Franklin U.S. Government Securities Fund
As a Fund shareholder, you can incur two types of costs:
- Transaction costs, including sales charges (loads) on Fund purchases; and
- Ongoing Fund costs, including management fees, distribution and service (12b-1) fees, and other Fund expenses. All mutual funds have ongoing costs, sometimes referred to as operating expenses.
The following table shows ongoing costs of investing in the Fund and can help you understand these costs and compare them with those of other mutual funds. The table assumes a $1,000 investment held for the six months indicated.
Actual Fund Expenses
The first line (Actual) for each share class listed in the table provides actual account values and expenses. The “Ending Account Value” is derived from the Fund’s actual return, which includes the effect of Fund expenses.
You can estimate the expenses you paid during the period by following these steps. Of course, your account value and expenses will differ from those in this illustration:
| 1. | Divide your account value by $1,000. |
| If an account had an $8,600 value, then $8,600 ÷ $1,000 = 8.6. | |
| 2. | Multiply the result by the number under the heading “Expenses Paid During Period.” |
| If Expenses Paid During Period were $7.50, then 8.6 x $7.50 = $64.50. |
In this illustration, the estimated expenses paid this period are $64.50.
Hypothetical Example for Comparison with Other Funds
Information in the second line (Hypothetical) for each class in the table can help you compare ongoing costs of investing in the Fund with those of other mutual funds. This information may not be used to estimate the actual ending account balance or expenses you paid during the period. The hypothetical “Ending Account Value” is based on the actual expense ratio for each class and an assumed 5% annual rate of return before expenses, which does not represent the Fund’s actual return. The figure under the heading “Expenses Paid During Period” shows the hypothetical expenses your account would have incurred under this scenario. You can compare this figure with the 5% hypothetical examples that appear in shareholder reports of other funds.
Semiannual Report | 37
Your Fund’s Expenses (continued)
Please note that expenses shown in the table are meant to highlight ongoing costs and do not reflect any transaction costs, such as sales charges. Therefore, the second line for each class is useful in comparing ongoing costs only, and will not help you compare total costs of owning different funds. In addition, if transaction costs were included, your total costs would have been higher. Please refer to the Fund prospectus for additional information on operating expenses.
*Expenses are calculated using the most recent six-month expense ratio, annualized for each class (A: 0.71%; B: 1.22%; C: 1.22%; R: 1.07%; and Advisor: 0.57%), multiplied by the average account value over the period, multiplied by 183/366 to reflect the one-half year period.
38 | Semiannual Report
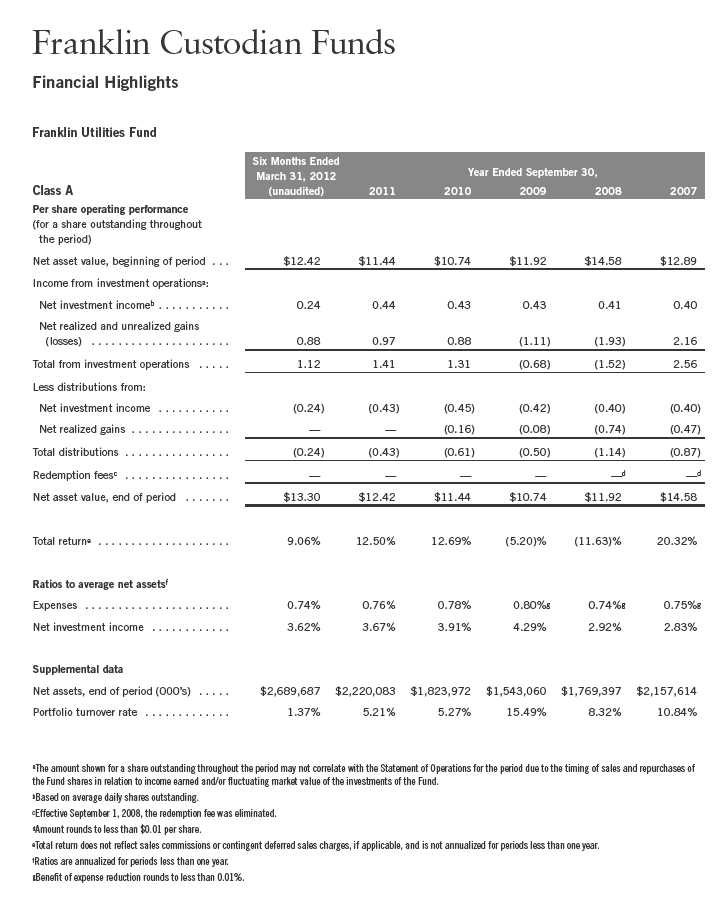
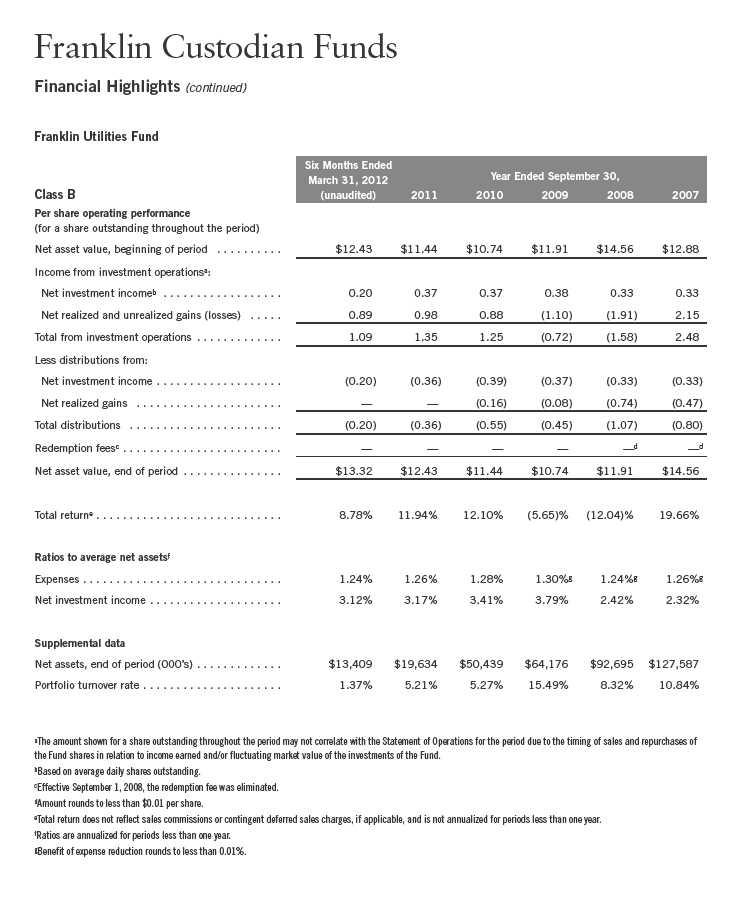
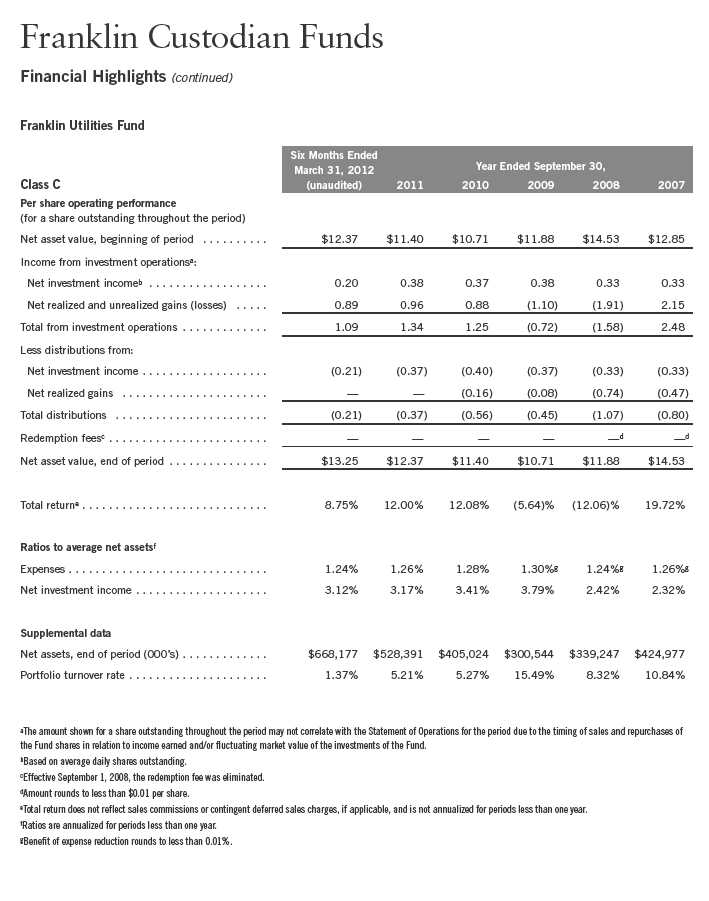
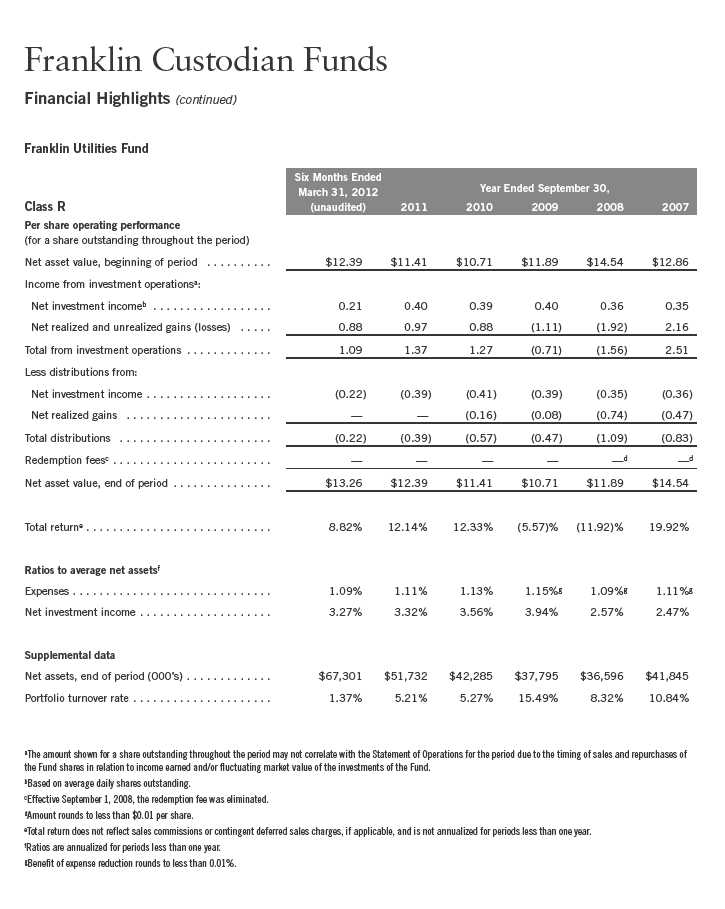
Franklin Utilities Fund
Your Fund’s Goal and Main Investments: Franklin Utilities Fund seeks both capital appreciation and current income by investing at least 80% of its net assets in public utility company securities.
Performance data represent past performance, which does not guarantee future results. Investment return and principal value will fluctuate, and you may have a gain or loss when you sell your shares. Current performance may differ from figures shown. Please visit franklintempleton.com or call (800) 342-5236 for most recent month-end performance.
This semiannual report for Franklin Utilities Fund covers the period ended March 31, 2012.
Performance Overview
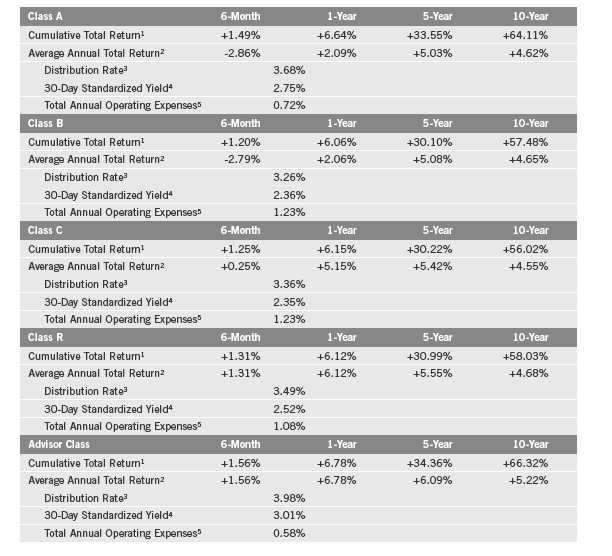
Franklin Utilities Fund – Class A delivered a +9.06% cumulative total return for the six months under review. The Fund’s Class A shares underperformed the +25.89% total return of its broad benchmark, the Standard & Poor’s 500 (S&P 500) Index, which is a broad measure of U.S. stock performance.1 The Fund outperformed the +6.53% total return of its narrow benchmark, the S&P 500 Utilities Index, which measures the performance of all utilities stocks in the S&P 500 Index.1 You can find the Fund’s long-term performance data in the Performance Summary beginning on page 42.
Investment Strategy
We search for the best return opportunities available in the global utilities arena with a specific focus on the U.S. electricity and gas sector. Generally, we look for companies producing a high percentage of earnings from regulated utility franchise operations.
Manager’s Discussion
For the six months under review, utilities produced the weakest performance of the S&P 500 Index’s 10 major sector groups, a reversal of its leading performer status for the 12-month period ended September 30, 2011, the date of the previous annual report. However, stock selection aided the Fund’s performance relative to the S&P 500 Utilities Index.
1. Source: © 2012 Morningstar. All Rights Reserved. The information contained herein: (1) is proprietary to Morningstar and/or its content providers; (2) may not be copied or distributed; and (3) is not warranted to be accurate, complete or timely. Neither Morningstar nor its content providers are responsible for any damages or losses arising from any use of this information. The indexes are unmanaged and include reinvested dividends. One cannot invest directly in an index, and an index is not representative of the Fund’s portfolio.
The dollar value, number of shares or principal amount, and names of all portfolio holdings are listed in the Fund’s Statement of Investments (SOI). The SOI begins on page 101.
Semiannual Report | 39
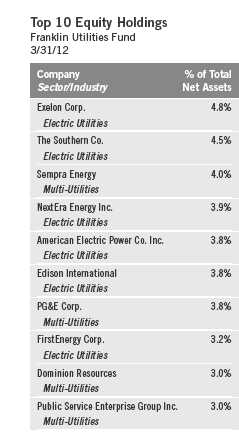
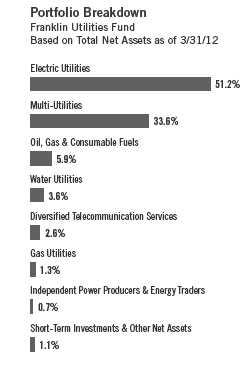
Although the majority of Fund holdings lie within the utilities sector, positions in the energy sector performed particularly well during the six-month reporting period.2 The Williams Cos., which owns and operates natural gas pipelines in North America, was a leading contributor from the energy sector. The firm acquired a company involved in gathering, treating and transporting natural gas. The Williams Cos. also announced higher planned increases in dividend payment. Pipeline transportation and energy storage provider Kinder Morgan’s share price climbed as its announced acquisition of El Paso Corp. was expected to close in the first half of 2012. Infrastructure and utilities firm Sempra Energy posted gains as profits and revenues increased and it announced a dividend increase. In the utilities sector, NextEra Energy, North America’s largest producer of solar and wind energy, posted gains as fourth quarter 2011 earnings doubled compared to the previous year.
Positions that declined in value for the six-month period included Public Service Enterprise Group and Exelon. Public Service Enterprise Group operates gas, nuclear, coal and oil-fired power facilities serving the Northeast and mid-Atlantic regions of the U.S. The firm’s shares fell amid multi-year lows for natural gas prices. Utility services provider Exelon’s investment-grade ratings were downgraded by Moody’s Investor Service, an independent credit rating agency, after Exelon acquired Constellation Energy Group. Moody’s expected negative cash flow for the combined entity, and with Exelon’s sizable capital requirements and dividend, the transaction weighed on investor sentiment.
2. The utilities sector comprises electric utilities, gas utilities and water utilities in the SOI. The energy sector comprises multi-utilities and oil, gas and consumable fuels in the SOI.
40 | Semiannual Report
Thank you for your continued participation in Franklin Utilities Fund.
We look forward to serving your future investment needs.
The foregoing information reflects our analysis, opinions and portfolio holdings as of March 31, 2012, the end of the reporting period. The way we implement our main investment strategies and the resulting portfolio holdings may change depending on factors such as market and economic conditions. These opinions may not be relied upon as investment advice or an offer for a particular security. The information is not a complete analysis of every aspect of any market, country, industry, security or the Fund. Statements of fact are from sources considered reliable, but the investment manager makes no representation or warranty as to their completeness or accuracy. Although historical performance is no guarantee of future results, these insights may help you understand our investment management philosophy.
Semiannual Report | 41
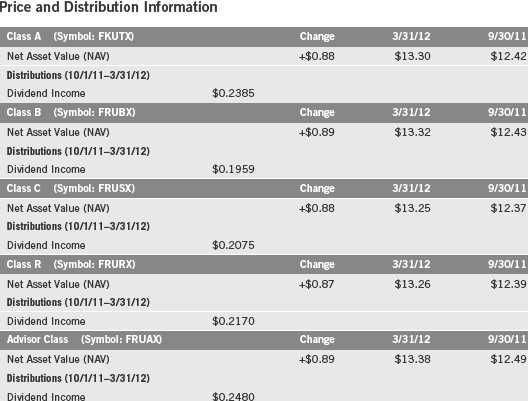
Performance Summary as of 3/31/12
Franklin Utilities Fund
Your dividend income will vary depending on dividends or interest paid by securities in the Fund’s portfolio, adjusted for operating expenses of each class. Capital gain distributions are net profits realized from the sale of portfolio securities. The performance table does not reflect any taxes that a shareholder would pay on Fund dividends, capital gain distributions, if any, or any realized gains on the sale of Fund shares. Total return reflects reinvestment of the Fund’s dividends and capital gain distributions, if any, and any unrealized gains or losses.
42 | Semiannual Report
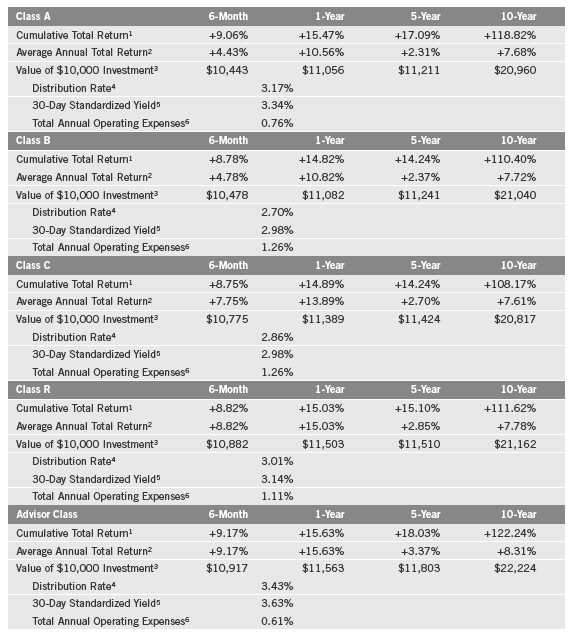
Performance Summary (continued)
Performance
Cumulative total return excludes sales charges. Average annual total return and value of $10,000 investment include maximum sales charges. Class A: 4.25% maximum initial sales charge; Class B: contingent deferred sales charge (CDSC) declining from 4% to 1% over six years, and eliminated thereafter; Class C: 1% CDSC in first year only; Class R/Advisor Class: no sales charges.
Performance data represent past performance, which does not guarantee future results. Investment return and principal value will fluctuate, and you may have a gain or loss when you sell your shares. Current performance may differ from figures shown. For most recent month-end performance, go to franklintempleton.com or call (800) 342-5236.
Semiannual Report | 43
Performance Summary (continued)
Endnotes
All investments involve risks, including possible loss of principal. In addition to being sensitive to other factors, securities issued by utility companies have been historically sensitive to interest rate changes. When interest rates fall, utility securities prices, and thus a utilities fund’s share price, tend to rise; when interest rates rise, their prices generally fall. The Fund is actively managed but there is no guarantee that the manager’s investment decisions will produce the desired results. The Fund’s prospectus also includes a description of the main investment risks.
Class B: Class C: | These shares have higher annual fees and expenses than Class A shares. Prior to 1/1/04, these shares were offered with an initial sales charge; thus actual total returns would have differed. These shares have higher annual fees and expenses than Class A shares. |
Class R: | Shares are available to certain eligible investors as described in the prospectus. These shares have higher annual fees and expenses than Class A shares. |
Advisor Class: | Shares are available to certain eligible investors as described in the prospectus. |
1. Cumulative total return represents the change in value of an investment over the periods indicated.
2. Average annual total return represents the average annual change in value of an investment over the periods indicated. Six-month return has not been annualized.
3. These figures represent the value of a hypothetical $10,000 investment in the Fund over the periods indicated.
4. Distribution rate is based on an annualization of the respective class’s current quarterly dividend and the maximum offering price (NAV for Classes B, C, R and Advisor) per share on 3/31/12.
5. The 30-day standardized yield for the 30 days ended 3/31/12 reflects an estimated yield to maturity (assuming all portfolio securities are held to maturity). It should be regarded as an estimate of the Fund’s rate of investment income, and it may not equal the Fund’s actual income distribution rate (which reflects the Fund’s past dividends paid to shareholders) or the income reported in the Fund’s financial statements.
6. Figures are as stated in the Fund’s prospectus current as of the date of this report. In periods of market volatility, assets may decline significantly, causing total annual Fund operating expenses to become higher than the figures shown.
44 | Semiannual Report
Your Fund’s Expenses
Franklin Utilities Fund
As a Fund shareholder, you can incur two types of costs:
- Transaction costs, including sales charges (loads) on Fund purchases; and
- Ongoing Fund costs, including management fees, distribution and service (12b-1) fees, and other Fund expenses. All mutual funds have ongoing costs, sometimes referred to as operating expenses.
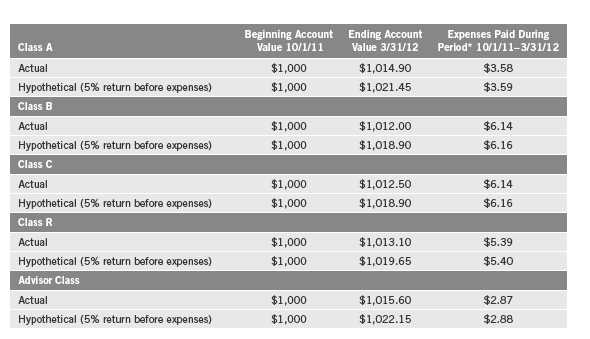
The following table shows ongoing costs of investing in the Fund and can help you understand these costs and compare them with those of other mutual funds. The table assumes a $1,000 investment held for the six months indicated.
Actual Fund Expenses
The first line (Actual) for each share class listed in the table provides actual account values and expenses. The “Ending Account Value” is derived from the Fund’s actual return, which includes the effect of Fund expenses.
You can estimate the expenses you paid during the period by following these steps. Of course, your account value and expenses will differ from those in this illustration:
| 1. | Divide your account value by $1,000. |
| If an account had an $8,600 value, then $8,600 ÷ $1,000 = 8.6. | |
| 2. | Multiply the result by the number under the heading “Expenses Paid During Period.” |
| If Expenses Paid During Period were $7.50, then 8.6 x $7.50 = $64.50. |
In this illustration, the estimated expenses paid this period are $64.50.
Hypothetical Example for Comparison with Other Funds
Information in the second line (Hypothetical) for each class in the table can help you compare ongoing costs of investing in the Fund with those of other mutual funds. This information may not be used to estimate the actual ending account balance or expenses you paid during the period. The hypothetical “Ending Account Value” is based on the actual expense ratio for each class and an assumed 5% annual rate of return before expenses, which does not represent the Fund’s actual return. The figure under the heading “Expenses Paid During Period” shows the hypothetical expenses your account would have incurred under this scenario. You can compare this figure with the 5% hypothetical examples that appear in shareholder reports of other funds.
Semiannual Report | 45
Your Fund’s Expenses (continued)
Please note that expenses shown in the table are meant to highlight ongoing costs and do not reflect any transaction costs, such as sales charges. Therefore, the second line for each class is useful in comparing ongoing costs only, and will not help you compare total costs of owning different funds. In addition, if transaction costs were included, your total costs would have been higher. Please refer to the Fund prospectus for additional information on operating expenses.
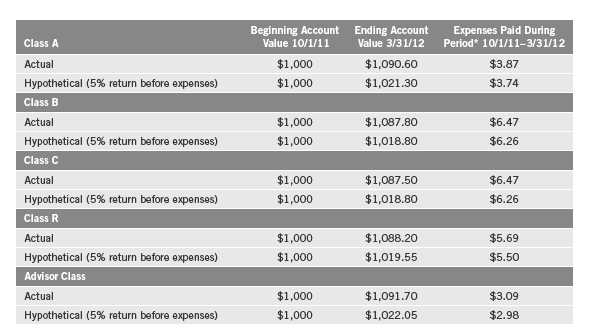
*Expenses are calculated using the most recent six-month expense ratio, annualized for each class (A: 0.74%; B: 1.24%; C: 1.24%; R: 1.09%; and Advisor: 0.59%), multiplied by the average account value over the period, multiplied by 183/366 to reflect the one-half year period.
46 | Semiannual Report
Semiannual Report | The accompanying notes are an integral part of these financial statements. | 47
48 | The accompanying notes are an integral part of these financial statements. | Semiannual Report
Semiannual Report | The accompanying notes are an integral part of these financial statements. | 49
50 | The accompanying notes are an integral part of these financial statements. | Semiannual Report
Semiannual Report | The accompanying notes are an integral part of these financial statements. | 51
52 | Semiannual Report
Semiannual Report | 53
54 | Semiannual Report
Semiannual Report | The accompanying notes are an integral part of these financial statements. | 55
56 | The accompanying notes are an integral part of these financial statements. | Semiannual Report
Semiannual Report | The accompanying notes are an integral part of these financial statements. | 57
58 | The accompanying notes are an integral part of these financial statements. | Semiannual Report
Semiannual Report | The accompanying notes are an integral part of these financial statements. | 59
60 | The accompanying notes are an integral part of these financial statements. | Semiannual Report
Semiannual Report | 61
62 | Semiannual Report
Semiannual Report | 63
64 | Semiannual Report
Semiannual Report | 65
66 | The accompanying notes are an integral part of these financial statements. | Semiannual Report
Semiannual Report | The accompanying notes are an integral part of these financial statements. | 67
68 | The accompanying notes are an integral part of these financial statements. | Semiannual Report
Semiannual Report | The accompanying notes are an integral part of these financial statements. | 69
Semiannual Report | The accompanying notes are an integral part of these financial statements. | 71
72 | The accompanying notes are an integral part of these financial statements. | Semiannual Report
Semiannual Report | 73
74 | Semiannual Report
Semiannual Report | 75
Semiannual Report | 77
78 | Semiannual Report
Semiannual Report | 79
Semiannual Report | 81
82 | Semiannual Report
Semiannual Report | 83
84 | Semiannual Report
Semiannual Report | 85
86 | Semiannual Report
Semiannual Report | 87
Semiannual Report | The accompanying notes are an integral part of these financial statements. | 89
90 | The accompanying notes are an integral part of these financial statements. | Semiannual Report
Semiannual Report | The accompanying notes are an integral part of these financial statements. | 91
92 | The accompanying notes are an integral part of these financial statements. | Semiannual Report
Semiannual Report | The accompanying notes are an integral part of these financial statements. | 93
94 | Semiannual Report
Semiannual Report | The accompanying notes are an integral part of these financial statements. | 95
96 | The accompanying notes are an integral part of these financial statements. | Semiannual Report
Semiannual Report | The accompanying notes are an integral part of these financial statements. | 97
98 | The accompanying notes are an integral part of these financial statements. | Semiannual Report
Semiannual Report | The accompanying notes are an integral part of these financial statements. | 99
100 | The accompanying notes are an integral part of these financial statements. | Semiannual Report
Semiannual Report | The accompanying notes are an integral part of these financial statements. | 103
Franklin Custodian Funds
Financial Statements (continued)
Statements of Assets and Liabilities (continued)
March 31, 2012 (unaudited)
104 | The accompanying notes are an integral part of these financial statements. | Semiannual Report
Semiannual Report | The accompanying notes are an integral part of these financial statements. | 105
106 | The accompanying notes are an integral part of these financial statements. | Semiannual Report
Semiannual Report | The accompanying notes are an integral part of these financial statements. | 107
108 | The accompanying notes are an integral part of these financial statements. | Semiannual Report
Semiannual Report | The accompanying notes are an integral part of these financial statements. | 109
110 | The accompanying notes are an integral part of these financial statements. | Semiannual Report
Semiannual Report | The accompanying notes are an integral part of these financial statements. | 111
Franklin Custodian Funds
Notes to Financial Statements (unaudited)
1. ORGANIZATION AND SIGNIFICANT ACCOUNTING POLICIES
Franklin Custodian Funds (Trust) is registered under the Investment Company Act of 1940, as amended, (1940 Act) as an open-end investment company, consisting of five funds (Funds). The classes of shares offered within each of the Funds are indicated below. Each class of shares differs by its initial sales load, contingent deferred sales charges, distribution fees, voting rights on matters affecting a single class and its exchange privilege.
The following summarizes the Funds’ significant accounting policies.
a. Financial Instrument Valuation
The Funds’ investments in securities and other financial instruments are carried at fair value daily. Fair value is the price that would be received to sell an asset or paid to transfer a liability in an orderly transaction between market participants on the measurement date. Under procedures approved by the Trust’s Board of Trustees (the Board), the Funds’ administrator, investment manager and other affiliates have formed the Valuation and Liquidity Oversight Committee (VLOC). The VLOC provides administration and oversight of the Funds’ valuation policies and procedures, which are approved annually by the Board. Among other things, these procedures allow the Funds to utilize independent pricing services, quotations from securities and financial instrument dealers, and other market sources to determine fair value.
Equity securities and derivative financial instruments (derivatives) listed on an exchange or on the NASDAQ National Market System are valued at the last quoted sale price or the official closing price of the day, respectively. Foreign equity securities are valued as of the close of trading on the foreign stock exchange on which the security is primarily traded, or the NYSE, whichever is earlier. The value is then converted into its U.S. dollar equivalent at the foreign exchange rate in effect at the close of the NYSE on the day that the value of the security is determined. Over-the-counter securities are valued within the range of the most recent quoted bid and ask prices. Securities that trade in multiple markets or on multiple exchanges are valued according to the broadest and most representative market. Certain equity securities are valued based upon fundamental characteristics or relationships to similar securities. Investments in open-end mutual funds and non-registered money market funds are valued at the closing net asset value.
Debt securities generally trade in the over-the-counter market rather than on a securities exchange. The Funds’ pricing services use multiple valuation techniques to determine fair value. In instances where sufficient market activity exists, the pricing services may utilize a market-based approach through which quotes from market makers are used to determine fair value. In instances where sufficient market activity may not exist or is limited, the pricing services also utilize proprietary
112 | Semiannual Report
Franklin Custodian Funds
Notes to Financial Statements (unaudited) (continued)
| 1. | ORGANIZATION AND SIGNIFICANT ACCOUNTING POLICIES (continued) |
| a. | Financial Instrument Valuation (continued) |
valuation models which may consider market characteristics such as benchmark yield curves, credit spreads, estimated default rates, anticipated market interest rate volatility, coupon rates, anticipated timing of principal repayments, underlying collateral, and other unique security features in order to estimate the relevant cash flows, which are then discounted to calculate the fair value. Securities denominated in a foreign currency are converted into their U.S. dollar equivalent at the foreign exchange rate in effect at the close of the NYSE on the date that the values of the foreign debt securities are determined. Repurchase agreements are valued at cost, which approximates market value.
The Funds have procedures to determine the fair value of securities and other financial instruments for which market prices are not reliable or readily available. Under these procedures, the VLOC convenes on a regular basis to review such securities and considers a number of factors, including significant unobservable valuation inputs when arriving at fair value. The VLOC primarily employs a market-based approach which may use related or comparable assets or liabilities, recent transactions, market multiples, book values, and other relevant information for the investment to determine the fair value of the investment. An income-based valuation approach may also be used in which the anticipated future cash flows of the investment are discounted to calculate fair value. Discounts may also be applied due to the nature or duration of any restrictions on the disposition of the investments. Due to the inherent uncertainty of valuations of such investments, the fair values may differ significantly from the values that would have been used had an active market existed. The VLOC employs various methods for calibrating these valuation approaches including a regular review of key inputs and assumptions, transactional back-testing or disposition analysis, and reviews of any related market activity.
Trading in securities on foreign securities stock exchanges and over-the-counter markets may be completed before the daily close of business on the NYSE. Occasionally, events occur between the time at which trading in a foreign security is completed and the close of the NYSE that might call into question the reliability of the value of a portfolio security held by the fund. As a result, differences may arise between the value of the Funds’ portfolio securities as determined at the foreign market close and the latest indications of value at the close of the NYSE. In order to minimize the potential for these differences, the VLOC monitors price movements following the close of trading in foreign stock markets through a series of country specific market proxies (such as baskets of American Depositary Receipts, futures contracts and exchange traded funds). These price movements are measured against established trigger thresholds for each specific market proxy to assist in determining if an event has occurred that may call into question the reliability of the values of the foreign securities held by the Funds. If such an event occurs, the securities may be valued using fair value procedures, which may include the use of independent pricing services.
Semiannual Report | 113
Franklin Custodian Funds
Notes to Financial Statements (unaudited) (continued)
| 1. | ORGANIZATION AND SIGNIFICANT ACCOUNTING POLICIES (continued) |
| b. | Foreign Currency Translation |
Portfolio securities and other assets and liabilities denominated in foreign currencies are translated into U.S. dollars based on the exchange rate of such currencies against U.S. dollars on the date of valuation. The Funds may enter into foreign currency exchange contracts to facilitate transactions denominated in a foreign currency. Purchases and sales of securities, income and expense items denominated in foreign currencies are translated into U.S. dollars at the exchange rate in effect on the transaction date. Portfolio securities and assets and liabilities denominated in foreign currencies contain risks that those currencies will decline in value relative to the U.S. dollar. Occasionally, events may impact the availability or reliability of foreign exchange rates used to convert the U.S. dollar equivalent value. If such an event occurs, the foreign exchange rate will be valued at fair value using procedures established and approved by the Board.
The Funds do not separately report the effect of changes in foreign exchange rates from changes in market prices on securities held. Such changes are included in net realized and unrealized gain or loss from investments on the Statement of Operations.
Realized foreign exchange gains or losses arise from sales of foreign currencies, currency gains or losses realized between the trade and settlement dates on securities transactions and the difference between the recorded amounts of dividends, interest, and foreign withholding taxes and the U.S. dollar equivalent of the amounts actually received or paid. Net unrealized foreign exchange gains and losses arise from changes in foreign exchange rates on foreign denominated assets and liabilities other than investments in securities held at the end of the reporting period.
c. Joint Repurchase Agreement
Certain funds enter into a joint repurchase agreement whereby their uninvested cash balance is deposited into a joint cash account with other funds managed by the investment manager or an affiliate of the investment manager and is used to invest in one or more repurchase agreements. The value and face amount of the joint repurchase agreement are allocated to the funds based on their pro-rata interest. A repurchase agreement is accounted for as a loan by the fund to the seller, collateralized by securities which are delivered to the fund’s custodian. The market value, including accrued interest, of the initial collateralization is required to be at least 102% of the dollar amount invested by the funds, with the value of the underlying securities marked to market daily to maintain coverage of at least 100%. The joint repurchase agreement held by the funds at period end had been entered into on March 30, 2012.
d. Securities Purchased on a When-Issued and Delayed Delivery Basis
Certain funds purchase securities on a when-issued and delayed delivery basis, with payment and delivery scheduled for a future date. These transactions are subject to market fluctuations and are subject to the risk that the value at delivery may be more or less than the trade date purchase
114 | Semiannual Report
Franklin Custodian Funds
Notes to Financial Statements (unaudited) (continued)
| 1. | ORGANIZATION AND SIGNIFICANT ACCOUNTING POLICIES (continued) |
| d. | Securities Purchased on a When-Issued and Delayed Delivery Basis (continued) |
price. Although the funds will generally purchase these securities with the intention of holding the securities, they may sell the securities before the settlement date. Sufficient assets have been segregated for these securities.
e. Derivative Financial Instruments
The Franklin Income Fund invested in derivatives in order to manage risk or gain exposure to various other investments or markets. Derivatives are financial contracts based on an underlying or notional amount, require no initial investment or an initial net investment that is smaller than would normally be required to have a similar response to changes in market factors, and require or permit net settlement. Derivatives contain various risks including the potential inability of the counterparty to fulfill their obligations under the terms of the contract, the potential for an illiquid secondary market, and/or the potential for market movements which expose the fund to gains or losses in excess of the amounts shown on the Statement of Assets and Liabilities. Realized gain and loss and unrealized appreciation and depreciation on these contracts for the period are included in the Statements of Operations.
The Franklin Income Fund purchased or wrote option contracts primarily to manage and/or gain exposure to equity price risk. An option is a contract entitling the holder to purchase or sell a specific amount of shares or units of an asset or notional amount of a swap (swaption), at a specified price. Options purchased are recorded as an asset while options written are recorded as a liability. Upon exercise of an option, the acquisition cost or sales proceeds of the underlying investment is adjusted by any premium received or paid. Upon expiration of an option, any premium received or paid is recorded as a realized gain or loss. Upon closing an option other than through expiration or exercise, the difference between the premium and the cost to close the position is recorded as a realized gain or loss. Pursuant to the terms of the written option contract, cash or securities may be required to be deposited as collateral.
See Notes 6 and 9 regarding investment transactions and other derivative information, respectively.
f. Equity-Linked Securities
The Franklin Income Fund invests in equity-linked securities. Equity-linked securities are hybrid financial instruments that generally combine both debt and equity characteristics into a single note form. Income received from equity linked securities is recorded as realized gains in the Statement of Operations and may be based on the performance of an underlying equity security, an equity index, or an option position. The risks of investing in equity-linked securities include unfavorable price movements in the underlying security and the credit risk of the issuing financial institution. There may be no guarantee of a return of principal with equity linked securities and the appreciation potential may be limited. Equity-linked securities may be more volatile and less liquid than other investments held by the Fund.
Semiannual Report | 115
Franklin Custodian Funds
Notes to Financial Statements (unaudited) (continued)
| 1. | ORGANIZATION AND SIGNIFICANT ACCOUNTING POLICIES (continued) |
| g. | Securities Lending |
Certain funds participate in an agency based securities lending program. The fund receives cash collateral against the loaned securities in an amount equal to at least 102% of the market value of the loaned securities. Collateral is maintained over the life of the loan in an amount not less than 100% of the market value of loaned securities, as determined at the close of fund business each day; any additional collateral required due to changes in security values is delivered to the fund on the next business day. The collateral is invested in a non-registered money fund as indicated on the Statement of Investments. The fund receives income from the investment of cash collateral, in addition to lending fees and rebates paid by the borrower. The fund bears the market risk with respect to the collateral investment, securities loaned, and the risk that the agent may default on its obligations to the fund. The securities lending agent has agreed to indemnify the fund in the event of default by a third party borrower.
h. Senior Floating Rate Interests
The Franklin Income Fund invests in senior secured corporate loans that pay interest at rates which are periodically reset by reference to a base lending rate plus a spread. These base lending rates are generally the prime rate offered by a designated U.S. bank or the London InterBank Offered Rate (LIBOR). Senior secured corporate loans often require prepayment of principal from excess cash flows or at the discretion of the borrower. As a result, actual maturity may be substantially less than the stated maturity.
Senior secured corporate loans in which the fund invests are generally readily marketable, but may be subject to some restrictions on resale.
i. Income Taxes
It is each fund’s policy to qualify as a regulated investment company under the Internal Revenue Code. Each fund intends to distribute to shareholders substantially all of its taxable income and net realized gains to relieve it from federal income and excise taxes. As a result, no provision for U.S. federal income taxes is required.
The Funds may be subject to foreign taxation related to income received, capital gains on the sale of securities and certain foreign currency transactions in the foreign jurisdictions in which it invests. Foreign taxes, if any, are recorded based on the tax regulations and rates that exist in the foreign markets in which the Funds invest. When a capital gain tax is determined to apply the Funds record an estimated deferred tax liability in an amount that would be payable if the securities were disposed of on the valuation date.
Each fund recognizes the tax benefits of uncertain tax positions only when the position is “more likely than not” to be sustained upon examination by the tax authorities based on the technical merits of the tax position. As of March 31, 2012, and for all open tax years, each fund has determined that no liability for unrecognized tax benefits is required in each fund’s financial statements
116 | Semiannual Report
Franklin Custodian Funds
Notes to Financial Statements (unaudited) (continued)
| 1. | ORGANIZATION AND SIGNIFICANT ACCOUNTING POLICIES (continued) |
| i. | Income Taxes (continued) |
related to uncertain tax positions taken on a tax return (or expected to be taken on future tax returns). Open tax years are those that remain subject to examination and are based on each tax jurisdiction statute of limitation.
j. Security Transactions, Investment Income, Expenses and Distributions
Security transactions are accounted for on trade date. Realized gains and losses on security transactions are determined on a specific identification basis. Interest income and estimated expenses are accrued daily. Amortization of premium and accretion of discount on debt securities are included in interest income. Facility fees are recognized as income over the expected term of the loan. Dividend income is recorded on the ex-dividend date except that certain dividends from foreign securities are recognized as soon as the Funds are notified of the ex-dividend date. Distributions to shareholders are recorded on the ex-dividend date and are determined according to income tax regulations (tax basis). Distributable earnings determined on a tax basis may differ from earnings recorded in accordance with accounting principles generally accepted in the United States of America. These differences may be permanent or temporary. Permanent differences are reclassified among capital accounts to reflect their tax character. These reclassifications have no impact on net assets or the results of operations. Temporary differences are not reclassified, as they may reverse in subsequent periods.
Common expenses incurred by the Trust are allocated among the Funds based on the ratio of net assets of each fund to the combined net assets of the Trust. Fund specific expenses are charged directly to the fund that incurred the expense.
Realized and unrealized gains and losses and net investment income, not including class specific expenses, are allocated daily to each class of shares based upon the relative proportion of net assets of each class. Differences in per share distributions, by class, are generally due to differences in class specific expenses.
k. Accounting Estimates
The preparation of financial statements in accordance with accounting principles generally accepted in the United States of America requires management to make estimates and assumptions that affect the reported amounts of assets and liabilities at the date of the financial statements and the amounts of income and expenses during the reporting period. Actual results could differ from those estimates.
l. Guarantees and Indemnifications
Under the Trust’s organizational documents, its officers and trustees are indemnified by the Trust against certain liabilities arising out of the performance of their duties to the Trust. Additionally, in the normal course of business, the Trust, on behalf of the Funds, enters into contracts with service providers that contain general indemnification clauses. The Trust’s maximum exposure under
Semiannual Report | 117
Franklin Custodian Funds
Notes to Financial Statements (unaudited) (continued)
| 1. | ORGANIZATION AND SIGNIFICANT ACCOUNTING POLICIES (continued) |
| l. | Guarantees and Indemnifications (continued) |
these arrangements is unknown as this would involve future claims that may be made against the Trust that have not yet occurred. Currently, the Trust expects the risk of loss to be remote.
2. SHARES OF BENEFICIAL INTEREST
At March 31, 2012, there were an unlimited number of shares authorized (without par value).
Transactions in the Funds’ shares were as follows:
Semiannual Report | 119
120 | Semiannual Report
Semiannual Report | 121
122 | Semiannual Report
Franklin Custodian Funds
Notes to Financial Statements (unaudited) (continued)
3. TRANSACTIONS WITH AFFILIATES
Franklin Resources, Inc. is the holding company for various subsidiaries that together are referred to as Franklin Templeton Investments. Certain officers and trustees of the Trust are also officers and/or directors of the following subsidiaries:
a. Management Fees
The Franklin Income Fund and the Franklin Utilities Fund pay an investment management fee to Advisers based on the month-end net assets of each of the funds as follows:
The Franklin DynaTech Fund, the Franklin Growth Fund, and the Franklin U.S. Government Securities Fund pay an investment management fee to Advisers based on the month-end net assets of each of the funds as follows:
Semiannual Report | 123
Franklin Custodian Funds
Notes to Financial Statements (unaudited) (continued)
| 3. | TRANSACTIONS WITH AFFILIATES (continued) |
| a. | Management Fees (continued) |
Under a subadvisory agreement, Investment Advisory, an affiliate of Advisers, provides subadvi-sory services to the Franklin Growth Fund. The subadvisory fee is paid by Advisers based on the average monthly net assets, and is not an additional expense of the fund.
b. Administrative Fees
Under an agreement with Advisers, FT Services provides administrative services to the Funds. The fee is paid by Advisers based on average daily net assets, and is not an additional expense of the Funds.
c. Distribution Fees
The Board has adopted distribution plans for each share class, with the exception of Advisor Class shares, pursuant to Rule 12b-1 under the 1940 Act. Under the Funds’ Class A reimbursement distribution plans, the Funds reimburse Distributors for costs incurred in connection with the servicing, sale and distribution of each fund’s shares up to the maximum annual plan rate for each class. Under the Class A reimbursement distribution plans, costs exceeding the maximum for the current plan year cannot be reimbursed in subsequent periods.
In addition, under the Funds’ Class B, B1, C, and R compensation distribution plans, the Funds pay Distributors for costs incurred in connection with the servicing, sale and distribution of each fund’s shares up to the maximum annual plan rate for each class.
The maximum annual plan rates, based on the average daily net assets, for each class, are as follows:
124 | Semiannual Report
Franklin Custodian Funds
Notes to Financial Statements (unaudited) (continued)
| 3. | TRANSACTIONS WITH AFFILIATES (continued) |
| d. | Sales Charges/Underwriting Agreements |
Front-end sales charges and contingent deferred sales charges (CDSC) do not represent expenses of the Funds. These charges are deducted from the proceeds of sales of fund shares prior to investment or from redemption proceeds prior to remittance, as applicable. Distributors has advised the Funds of the following commission transactions related to the sales and redemptions of the Funds’ shares for the period:
e. Transfer Agent Fees
For the period ended March 31, 2012, the Funds paid transfer agent fees as noted in the Statements of Operations of which the following amounts were retained by Investor Services:
4. EXPENSE OFFSET ARRANGEMENT
The Funds have entered into an arrangement with their custodian whereby credits realized as a result of uninvested cash balances are used to reduce a portion of the Funds’ custodian expenses. During the period ended March 31, 2012, there were no credits earned.
Semiannual Report | 125
Franklin Custodian Funds
Notes to Financial Statements (unaudited) (continued)
5. INCOME TAXES
For tax purposes, capital losses may be carried over to offset future capital gains, if any. At September 30, 2011, the capital loss carryforwards were as follows:
Under the Regulated Investment Company Modernization Act of 2010, the Funds will be permitted to carry forward capital losses incurred in taxable years beginning after December 22, 2010 for an unlimited period. Post-enactment capital loss carryforwards will retain their character as either short-term or long-term capital losses rather than being considered short-term as under previous law. Any post-enactment capital losses generated will be required to be utilized prior to the losses incurred in pre-enactment tax years.
126 | Semiannual Report
Franklin Custodian Funds
Notes to Financial Statements (unaudited) (continued)
5. INCOME TAXES (continued)
For tax purposes, realized capital losses and realized currency losses occurring subsequent to October 31 may be deferred and treated as occurring on the first day of the following fiscal year. At September 30, 2011, deferred losses were as follows:
At March 31, 2012, the cost of investments and net unrealized appreciation (depreciation) for income tax purposes were as follows:
Differences between income and/or capital gains as determined on a book basis and a tax basis are primarily due to differing treatments of defaulted securities, foreign currency transactions, paydown losses, payments-in-kind, bond discounts and premiums, corporate actions, regulatory settlements, and wash sales.
6. INVESTMENT TRANSACTIONS
Purchases and sales of investments (excluding short term securities) for the period ended March 31, 2012, were as follows:
Semiannual Report | 127
Franklin Custodian Funds
Notes to Financial Statements (unaudited) (continued)
Transactions in options written during the period ended March 31, 2012, were as follows:
See Notes 1e and 9 regarding derivative financial instruments and other derivative information, respectively.
7. INVESTMENTS IN INSTITUTIONAL FIDUCIARY TRUST MONEY MARKET PORTFOLIO
The Funds invest in the Institutional Fiduciary Trust Money Market Portfolio (Sweep Money Fund), an open-end investment company managed by Advisers. Management fees paid by the Funds are reduced on assets invested in the Sweep Money Fund, in an amount not to exceed the management and administrative fees paid by the Sweep Money Fund.
8. CREDIT RISK AND DEFAULTED SECURITIES
At March 31, 2012, the Franklin Income Fund had 47.88% of its portfolio invested in high yield, senior secured floating rate notes, or other securities rated below investment grade. These securities may be more sensitive to economic conditions causing greater price volatility and are potentially subject to a greater risk of loss due to default than higher rated securities.
The Franklin Income Fund held defaulted securities and/or other securities for which the income has been deemed uncollectible. At March 31, 2012, the aggregate value of these securities was $1,035,396,050, representing 1.63% of the Fund’s net assets. The Fund discontinues accruing income on securities for which income has been deemed uncollectible and provides an estimate for losses on interest receivable. The securities have been identified on the accompanying Statement of Investments.
128 | Semiannual Report
Franklin Custodian Funds
Notes to Financial Statements (unaudited) (continued)
9. OTHER DERIVATIVE INFORMATION
At March 31, 2012, the Franklin Income Fund has invested in derivative contracts which are reflected on the Statement of Assets and Liabilities as follows:
For the period ended March 31, 2012, the effect of derivative contracts on the Franklin Income Fund’s Statement of Operations was as follows:
For the period ended March 31, 2012, the average month end market value of derivatives represented less than 0.01% of average month end net assets. The average month end number of open derivative contracts for the period was 6.
10. HOLDINGS OF 5% VOTING SECURITIES OF PORTFOLIO COMPANIES
The 1940 Act defines “affiliated companies” to include investments in portfolio companies in which a fund owns 5% or more of the outstanding voting securities. Investments in “affiliated companies” for the Franklin Income Fund for the period ended March 31, 2012, were as shown below.
Semiannual Report | 129
Franklin Custodian Funds
Notes to Financial Statements (unaudited) (continued)
| 10. | HOLDINGS OF 5% VOTING SECURITIES OF PORTFOLIO COMPANIES (continued) |
11. SPECIAL SERVICING AGREEMENT
The Funds, which are eligible underlying investments of one or more of the Franklin Templeton Fund Allocator Series Funds (Allocator Funds), participates in a Special Servicing Agreement (SSA) with the Allocator Funds and certain service providers of the Funds and the Allocator Funds. Under the SSA, the Funds may pay a portion of the Allocator Funds’ expenses (other than any asset allocation, administrative and distribution fees), to the extent such payments are less than the amount of the benefits realized or expected to be realized by the Funds (e.g., due to reduced costs associated with servicing accounts) from the investment in the Funds by the Allocator Funds. The Allocator Funds are either managed by Advisers or administered by FT Services. For the period ended March 31, 2012, the Funds were held by one or more of the Allocator Funds and
130 | Semiannual Report
Franklin Custodian Funds
Notes to Financial Statements (unaudited) (continued)
11. SPECIAL SERVICING AGREEMENT (continued)
the amount of expenses borne by the Funds is noted in the Statements of Operations. At March 31, 2012, one or more of the Allocator Funds owned a percentage of the Funds’ outstanding shares as follows:
![]()
12. CREDIT FACILITY
The Funds, together with other U.S. registered and foreign investment funds (collectively, Borrowers), managed by Franklin Templeton Investments, are borrowers in a joint syndicated senior unsecured credit facility totaling $1.5 billion (Global Credit Facility) which matures on January 18, 2013. This Global Credit Facility provides a source of funds to the Borrowers for temporary and emergency purposes, including the ability to meet future unanticipated or unusually large redemption requests.
Under the terms of the Global Credit Facility, the Funds shall, in addition to interest charged on any borrowings made by the Funds and other costs incurred by the Funds, pay their share of fees and expenses incurred in connection with the implementation and maintenance of the Global Credit Facility, based upon their relative share of the aggregate net assets of all of the Borrowers, including an annual commitment fee of 0.08% based upon the unused portion of the Global Credit Facility, which is reflected in other expenses on the Statements of Operations. During the period ended March 31, 2012, the Funds did not use the Global Credit Facility.
13. FAIR VALUE MEASUREMENTS
The Funds follow a fair value hierarchy that distinguishes between market data obtained from independent sources (observable inputs) and the Funds’ own market assumptions (unobservable inputs). These inputs are used in determining the value of the Funds’ investments and are summarized in the following fair value hierarchy:
- Level 1 – quoted prices in active markets for identical securities
- Level 2 – other significant observable inputs (including quoted prices for similar securities, interest rates, prepayment speed, credit risk, etc.)
- Level 3 – significant unobservable inputs (including the Funds’ own assumptions in determining the fair value of investments)
The inputs or methodology used for valuing securities are not an indication of the risk associated with investing in those securities.
Semiannual Report | 131
Franklin Custodian Funds
Notes to Financial Statements (unaudited) (continued)
13. FAIR VALUE MEASUREMENTS (continued)
For movements between the levels within the fair value hierarchy, the Fund has adopted a policy of recognizing the transfers as of the date of the underlying event which caused the movement.
A summary of inputs used as of March 31, 2012, in valuing the Funds’ assets and liabilities carried at fair value, is as follows:
132 | Semiannual Report
14. NEW ACCOUNTING PRONOUNCEMENTS
In May 2011, the Financial Accounting Standards Board (FASB) issued Accounting Standards Update (ASU) No. 2011-04, Fair Value Measurement (Topic 820): Amendments to Achieve Common Fair Value Measurement and Disclosure Requirements in U.S. GAAP and IFRSs. The amendments in the ASU will improve the comparability of fair value measurements presented and disclosed in financial statements prepared in accordance with U.S. GAAP (Generally Accepted Accounting Principles) and IFRS (International Financial Reporting Standards) and include new guidance for certain fair value measurement principles and disclosure requirements. The ASU is effective for interim and annual periods beginning after December 15, 2011. The Funds believe the adoption of this ASU will not have a material impact on their financial statements.
In December 2011, FASB issued ASU No. 2011-11, Balance Sheet (Topic 210): Disclosures about Offsetting Assets and Liabilities. The amendments in the ASU enhance disclosures about offsetting of financial assets and liabilities to enable investors to understand the effect of these arrangements on a Fund’s financial position. The ASU is effective for interim and annual reporting periods beginning on or after January 1, 2013. The Funds believe the adoption of this ASU will not have a material impact on their financial statements.
15. SUBSEQUENT EVENTS
The Funds have evaluated subsequent events through the issuance of the financial statements and determined that no events have occurred that require disclosure.
Semiannual Report | 133
Franklin Custodian Funds
Notes to Financial Statements (unaudited) (continued)
134 | Semiannual Report
Franklin Custodian Funds
Shareholder Information
Board Review of Investment Management Agreement
At a meeting held February 28, 2012, the Board of Trustees (Board), including a majority of non-interested or independent Trustees, approved renewal of the investment management agreement for each of the five separate funds within Franklin Custodian Funds (Fund(s)). In reaching this decision, the Board took into account information furnished throughout the year at regular Board meetings, as well as information prepared specifically in connection with the annual renewal review process. Information furnished and discussed throughout the year included investment performance reports and related financial information for each Fund, as well as periodic reports on expenses, shareholder services, legal and compliance matters, pricing, brokerage commissions and execution and other services provided by the Investment Manager (Manager) and its affiliates. Information furnished specifically in connection with the renewal process included a report for each Fund prepared by Lipper, Inc. (Lipper), an independent organization, as well as additional material, including a Fund profitability analysis prepared by management. The Lipper reports compared each Fund’s investment performance and expenses with those of other mutual funds deemed comparable to the Fund as selected by Lipper. The Fund profitability analysis discussed the profitability to Franklin Templeton Investments from its overall U.S. fund operations, as well as on an individual fund-by-fund basis. Additional material accompanying such profitability analysis included information on a fund-by-fund basis listing portfolio managers and other accounts they manage, as well as information on management fees charged by the Manager and its affiliates to U.S. mutual funds and other accounts, including management’s explanation of differences where relevant. Such material also included a memorandum prepared by management describing project initiatives and capital investments relating to the services provided to the Funds by the Franklin Templeton Investments organization, as well as a memorandum relating to economies of scale and an analysis concerning transfer agent fees charged by an affiliate of the Manager.
In considering such materials, the independent Trustees received assistance and advice from and met separately with independent counsel. While the investment management agreements for all Funds were considered at the same Board meeting, the Board dealt with each Fund separately. In approving continuance of the investment management agreement for each Fund, the Board, including a majority of independent Trustees, determined that the existing management fee structure was fair and reasonable and that continuance of the investment management agreement was in the best interests of each Fund and its shareholders. While attention was given to all information furnished, the following discusses some primary factors relevant to the Board’s decision.
NATURE, EXTENT AND QUALITY OF SERVICES. The Board was satisfied with the nature and quality of the overall services provided by the Manager and its affiliates to the Funds and their shareholders. In addition to investment performance and expenses discussed later, the Board’s opinion was based, in part, upon periodic reports furnished it showing that the investment policies and restrictions for each Fund were consistently complied with as well as other reports periodically furnished the Board covering matters such as the compliance of portfolio managers and other
Semiannual Report | 135
Franklin Custodian Funds
Shareholder Information (continued)
Board Review of Investment Management Agreement (continued)
management personnel with the code of ethics adopted throughout the Franklin Templeton fund complex, the adherence to fair value pricing procedures established by the Board, and the accuracy of net asset value calculations. The Board also noted the extent of benefits provided Fund shareholders from being part of the Franklin Templeton family of funds, including the right to exchange investments between the same class of funds without a sales charge, the ability to reinvest Fund dividends into other funds and the right to combine holdings in other funds to obtain a reduced sales charge. Favorable consideration was given to management’s continuous efforts and expenditures in establishing back-up systems and recovery procedures to function in the event of a natural disaster, it being noted by the Board that such systems and procedures had functioned smoothly during the Florida hurricanes and blackouts experienced in previous years. Among other factors taken into account by the Board were the Manager’s best execution trading policies, including a favorable report by an independent portfolio trading analytical firm, which also covered FOREX transactions. Consideration was also given to the experience of each Fund’s portfolio management team, the number of accounts managed and general method of compensation. In this latter respect, the Board noted that a primary factor in management’s determination of a portfolio manager’s bonus compensation was the relative investment performance of the funds he or she managed and that a portion of such bonus was required to be invested in a predesignated list of funds within such person’s fund management area so as to be aligned with the interests of shareholders. The Board also took into account the quality of transfer agent and shareholder services provided Fund shareholders by an affiliate of the Manager and the continuous enhancements to the Franklin Templeton website. Particular attention was given to management’s conservative approach and diligent risk management procedures, including continuous monitoring of counterparty credit risk and attention given to derivatives and other complex instruments including expanded collateralization requirements. The Board also took into account, among other things, management’s efforts in establishing a global credit facility for the benefit of the Funds and other accounts managed by Franklin Templeton Investments to provide a source of cash for temporary and emergency purposes or to meet unusual redemption requests as well as the strong financial position of the Manager’s parent company and its commitment to the mutual fund business as evidenced by its subsidization of money market funds.
INVESTMENT PERFORMANCE. The Board placed significant emphasis on the investment performance of each Fund in view of its importance to shareholders. While consideration was given to performance reports and discussions with portfolio managers at Board meetings during the year, particular attention in assessing performance was given to the Lipper reports furnished for the agreement renewals. The Lipper reports prepared for each individual Fund showed the investment performance of its Class A shares during 2011 and the previous 10 years ended December 31, 2011, in comparison with a performance universe selected by Lipper. Investment performance was shown on a total return basis for all Funds with income return being shown as well for those Funds having income as an investment objective element. The following summarizes the performance results for each Fund.
136 | Semiannual Report
Franklin Custodian Funds
Shareholder Information (continued)
Board Review of Investment Management Agreement (continued)
Franklin DynaTech Fund – This Fund’s investment performance was shown in comparison to a performance universe consisting of the Fund and all retail and institutional multi-cap growth funds as classified by Lipper. The Lipper report showed the Fund’s total return for 2011 to be in the middle quintile of its performance universe and on an annualized basis to be in either the highest or best performing quintile of such universe, or in the next to highest quintile of such universe in each of the previous three-, five- and 10-year periods. The Board was satisfied with the Fund’s overall performance as shown in the Lipper report.
Franklin Growth Fund – The Fund’s investment performance was shown in comparison to a performance universe consisting of all retail and institutional large-cap core funds as classified by Lipper. The Lipper report showed the Fund’s total return during 2011 to be in the second-highest quintile of such performance universe and its total return on an annualized basis to be in the highest or best performing quintile of such universe during each of the previous three-, five- and 10-year periods. The Board was satisfied with the Fund’s performance as shown in the Lipper report.
Franklin Income Fund – The Fund’s investment performance was shown in comparison to a performance universe consisting of the Fund and all other retail and institutional mixed-asset target allocation moderate funds as classified by Lipper. The Lipper report showed the Fund’s income return during 2011 to be in the highest or best performing quintile of its performance universe and its income return on an annualized basis during each of the previous three-, five- and 10-year periods to also be in the highest quintile of such performance universe. The Lipper report showed the Fund’s total return during 2011 to also be in the highest or best performing quintile of its Lipper performance universe, and on an annualized basis to be in the highest quintile of such universe during each of the previous three-, five- and 10-year periods. The Board was satisfied with the Fund’s performance as shown in the Lipper report.
Franklin U.S. Government Securities Fund – This Fund’s investment performance was shown in comparison to a performance universe consisting of all retail and institutional Ginnie Mae funds as classified by Lipper. The Fund’s Lipper report showed its income return during 2011 to be in the second-highest quintile of it Lipper performance universe, and its income return on an annualized basis to be in the highest or best performing quintile of such universe or in the second-highest quintile of such universe during each of the previous three-, five- and 10-year periods. The Fund’s Lipper report showed its total return to be in the middle quintile of its performance universe during 2011, and its total return on an annualized basis to be in the second-lowest quintile of such universe for the previous three- and five-year periods, and in the middle quintile of such universe for the previous 10-year period. The Board found such comparative performance to be acceptable in view of the Fund’s income investment objective and conservative policy of investing only in plain vanilla Ginnie Mae pass-through securities, noting that the Fund’s total return for the annualized three- and five-year periods were respectively within 60 basis points and 20 basis points of the performance universe median for such periods.
Semiannual Report | 137
Franklin Custodian Funds
Shareholder Information (continued)
Board Review of Investment Management Agreement (continued)
Franklin Utilities Fund – This Fund’s investment performance was shown in comparison to a performance universe consisting of all retail and institutional utility funds as classified by Lipper. The Fund’s Lipper report showed its income return during 2011 to be in the highest or best performing quintile of such universe, and its income return on an annualized basis to be in either the highest or second-highest quintile of such performance universe during each of the previous three-, five-and 10-year periods. The Fund’s total return during 2011 also placed it in the highest quintile of its performance universe, and placed it in the highest or second-highest quintile of such universe during each of the previous three-, five- and 10-year periods on an annualized basis. The Board was satisfied with the Fund’s performance as shown in the Lipper report.
COMPARATIVE EXPENSES. Consideration was given to a comparative analysis of the management fees and total expense ratios of each Fund compared with those of a group of other funds selected by Lipper as constituting its appropriate Lipper expense group. Lipper expense data is based upon information taken from each fund’s most recent annual report, which reflects historical asset levels that may be quite different from those currently existing, particularly in a period of market volatility. While recognizing such inherent limitation and the fact that expense ratios generally increase as assets decline and decrease as assets grow, the Board believed the independent analysis conducted by Lipper to be an appropriate measure of comparative expenses. In reviewing comparative costs, Lipper provides information on each Fund’s contractual investment management fee in comparison with the contractual investment management fee that would have been charged by other funds within its Lipper expense group assuming they were similar in size to the Fund, as well as the actual total expenses of the Fund in comparison with those of its Lipper expense group. The Lipper contractual investment management fee analysis considers administrative charges as being part of management fees, and total expenses, for comparative consistency, are shown by Lipper for Fund Class A shares. The results of such expense comparisons showed the contractual investment management fee rate as well as the total expense ratios for each of Franklin DynaTech Fund, Franklin Growth Fund and Franklin Utilities Fund to be in the least expensive quintiles of their respective Lipper expense groups. The Lipper report for Franklin Income Fund showed its contractual investment management fee to be at the median of its five-member Lipper expense group and its expense ratio to be the second lowest within such expense group. The Lipper report for Franklin U.S. Government Securities Fund showed its contractual investment management fee to be within one-half a basis point of the median of its six-member Lipper expense group, and its total expense ratio to be the second lowest within such expense group. Based upon the above, the Board was satisfied with the management fees and total expenses of each Fund in comparison to their respective Lipper expense groups as shown in the Lipper reports.
MANAGEMENT PROFITABILITY. The Board also considered the level of profits realized by the Manager and its affiliates in connection with the operation of each Fund. In this respect, the Board reviewed the Fund profitability analysis that addresses the overall profitability of Franklin Templeton’s U.S. fund business, as well as its profits in providing management and other services
138 | Semiannual Report
Franklin Custodian Funds
Shareholder Information (continued)
Board Review of Investment Management Agreement (continued)
to each of the individual funds during the 12-month period ended September 30, 2011, being the most recent fiscal year-end for Franklin Resources, Inc., the Manager’s parent. In reviewing the analysis, attention was given to the methodology followed in allocating costs to each Fund, it being recognized that allocation methodologies are inherently subjective and various allocation methodologies may each be reasonable while producing different results. In this respect, the Board noted that, while being continuously refined and reflecting changes in the Manager’s own cost accounting, the cost allocation methodology was consistent with that followed in profitability report presentations for the Funds made in prior years and that the Funds’ independent registered public accounting firm had been engaged by the Manager to review the reasonableness of the allocation methodologies solely for use by the Funds’ Board in reference to the profitability analysis. In reviewing and discussing such analysis, management discussed with the Board its belief that costs incurred in establishing the infrastructure necessary for the type of mutual fund operations conducted by the Manager and its affiliates may not be fully reflected in the expenses allocated to each Fund in determining its profitability, as well as the fact that the level of profits, to a certain extent, reflected operational cost savings and efficiencies initiated by management. The Board also took into account management’s expenditures in improving shareholder services provided the Funds, as well as the need to implement systems and meet additional regulatory and compliance requirements resulting from statutes such as the Sarbanes-Oxley and Dodd-Frank Acts and recent SEC and other regulatory requirements. In addition, the Board considered a third-party study comparing the profitability of the Manager’s parent on an overall basis to other publicly held managers broken down to show profitability from management operations exclusive of distribution expenses, as well as profitability including distribution expenses. The Board also considered the extent to which the Manager and its affiliates might derive ancillary benefits from fund operations, including revenues generated from transfer agent services and potential benefits resulting from allocation of fund brokerage and the use of commission dollars to pay for research. Based upon its consideration of all these factors, the Board determined that the level of profits realized by the Manager and its affiliates from providing services to each Fund was not excessive in view of the nature, quality and extent of services provided.
ECONOMIES OF SCALE. The Board also considered whether economies of scale are realized by the Manager as the Funds grow larger and the extent to which this is reflected in the level of management fees charged. While recognizing that any precise determination is inherently subjective, the Board noted that based upon the Fund profitability analysis, it appears that as some funds get larger, at some point economies of scale do result in the Manager realizing a larger profit margin on management services provided such a fund. The Board also noted that economies of scale are shared with each Fund and its shareholders through management fee breakpoints so that as a Fund grows in size, its effective management fee rate declines. The fee structure under the investment management agreement with each Fund provides an initial fee of 0.625% on the first $100 million of assets; 0.50% on the next $150 million of assets; 0.45% on the next $7.25 billion of assets; and
Semiannual Report | 139
Franklin Custodian Funds
Shareholder Information (continued)
Board Review of Investment Management Agreement (continued)
declining thereafter for each subsequent $2.5 billion of assets until reaching a breakpoint of 0.35% for assets in excess of $50 billion, with such breakpoints continuing in the case of Franklin Income Fund and Franklin Utilities Fund to 0.345% on assets in excess of $65 billion and 0.34% on assets in excess of $80 billion. In discussing such overall fee structure, management noted that the asset sizes of all Funds were beneath their last breakpoint levels and stated its view that such fee structures reach a relatively low rate quickly reflecting anticipated economies of scale as a Fund’s assets increase and pointed out the favorable effective management fee and total expense comparisons for each Fund within its Lipper expense group, as previously discussed under “Comparative Expenses.” The Board believed that to the extent economies of scale may be realized by the Manager and its affiliates, the schedule of fees under the investment management agreement for each Fund provides a sharing of benefits with the Fund and its shareholders.
Proxy Voting Policies and Procedures
The Trust’s investment manager has established Proxy Voting Policies and Procedures (Policies) that the Trust uses to determine how to vote proxies relating to portfolio securities. Shareholders may view the Trust’s complete Policies online at franklintempleton.com. Alternatively, shareholders may request copies of the Policies free of charge by calling the Proxy Group collect at (954) 527-7678 or by sending a written request to: Franklin Templeton Companies, LLC, 300 S.E. 2nd Street, Fort Lauderdale, FL 33301, Attention: Proxy Group. Copies of the Trust’s proxy voting records are also made available online at franklintempleton.com and posted on the U.S. Securities and Exchange Commission’s website at sec.gov and reflect the most recent 12-month period ended June 30.
Quarterly Statement of Investments
The Trust files a complete statement of investments with the U.S. Securities and Exchange Commission for the first and third quarters for each fiscal year on Form N-Q. Shareholders may view the filed Form N-Q by visiting the Commission’s website at sec.gov. The filed form may also be viewed and copied at the Commission’s Public Reference Room in Washington, DC. Information regarding the operations of the Public Reference Room may be obtained by calling (800) SEC-0330.
140 | Semiannual Report
Item 2. Code of Ethics.
(a) The Registrant has adopted a code of ethics that applies to its principal executive officers and principal financial and accounting officer.
(c) N/A
(d) N/A
(f) Pursuant to Item 12(a)(1), the Registrant is attaching as an exhibit a copy of its code of ethics that applies to its principal executive officers and principal financial and accounting officer.
Item 3. Audit Committee Financial Expert.
(a)(1) The Registrant has an audit committee financial expert serving on its audit committee.
(2) The audit committee financial expert is John B. Wilson and he is "independent" as defined under the relevant Securities and Exchange Commission Rules and Releases.
Item 4. Principal Accountant Fees and Services. N/A
Item 5. Audit Committee of Listed Registrants. N/A
Item 6. Schedule of Investments. N/A
Item 7. Disclosure of Proxy Voting Policies and Procedures for Closed-End Management Investment Companies. N/A
Item 8. Portfolio Managers of Closed-End Management Investment Companies. N/A
Item 9. Purchases of Equity Securities by Closed-End Management Investment Company and Affiliated Purchasers. N/A
Item 10. Submission of Matters to a Vote of Security Holders.
There have been no changes to the procedures by which shareholders may recommend nominees to the Registrant's Board of Trustees that would require disclosure herein.
Item 11. Controls and Procedures.
(a) Evaluation of Disclosure Controls and Procedures. The Registrant maintains disclosure controls and procedures that are designed to ensure that information required to be disclosed in the Registrant’s
filings under the Securities Exchange Act of 1934 and the Investment Company Act of 1940 is recorded, processed, summarized and reported within the periods specified in the rules and forms of the Securities and Exchange Commission. Such information is accumulated and communicated to the Registrant’s management, including its principal executive officer and principal financial officer, as appropriate, to allow timely decisions regarding required disclosure. The Registrant’s management, including the principal executive officer and the principal financial officer, recognizes that any set of controls and procedures, no matter how well designed and operated, can provide only reasonable assurance of achieving the desired control objectives.
Within 90 days prior to the filing date of this Shareholder Report on Form N-CSR, the Registrant had carried out an evaluation, under the supervision and with the participation of the Registrant’s management, including the Registrant’s principal executive officer and the Registrant’s principal financial officer, of the effectiveness of the design and operation of the Registrant’s disclosure controls and procedures. Based on such evaluation, the Registrant’s principal executive officer and principal financial officer concluded that the Registrant’s disclosure controls and procedures are effective.
(b) Changes in Internal Controls. There have been no significant changes in the Registrant’s internal controls or in other factors that could significantly affect the internal controls subsequent to the date of their evaluation in connection with the preparation of this Shareholder Report on Form N-CSR.
Item 12. Exhibits.
(a)(1) Code of Ethics
(a)(2) Certifications pursuant to Section 302 of the Sarbanes-Oxley Act of 2002 of Laura F. Fergerson, Chief Executive Officer - Finance and Administration, and Gaston Gardey, Chief Financial Officer and Chief Accounting Officer
(b) Certifications pursuant to Section 906 of the Sarbanes-Oxley Act of 2002 of Laura F. Fergerson, Chief Executive Officer - Finance and Administration, and Gaston Gardey, Chief Financial Officer and Chief Accounting Officer
SIGNATURES
Pursuant to the requirements of the Securities Exchange Act of 1934 and the Investment Company Act of 1940, the registrant has duly caused this report to be signed on its behalf by the undersigned, thereunto duly authorized.
FRANKLIN CUSTODIAN FUNDS
By /s/LAURA F. FERGERSON
Laura F. Fergerson
Chief Executive Officer - Finance and Administration
Date May 25, 2012
Pursuant to the requirements of the Securities Exchange Act of 1934 and the Investment Company Act of 1940, this report has been signed below by the following persons on behalf of the registrant and in the capacities and on the dates indicated.
By /s/LAURA F. FERGERSON
Laura F. Fergerson
Chief Executive Officer - Finance and Administration
Date May 25, 2012
By /s/GASTON GARDEY
Gaston Gardey
Chief Financial Officer and Chief Accounting Officer
Date May 25, 2012