UNITED STATES
SECURITIES AND EXCHANGE COMMISSION
Washington, DC 20549
FORM N-CSRS
CERTIFIED SHAREHOLDER REPORT OF REGISTERED MANAGEMENT INVESTMENT COMPANIES
Investment Company Act file number 811-00537
_Franklin Custodian Funds
(Exact name of registrant as specified in charter)
_One Franklin Parkway, San Mateo, CA 94403-1906
(Address of principal executive offices) (Zip code)
Craig S. Tyle, One Franklin Parkway, San Mateo, CA 94403-1906
(Name and address of agent for service)
Registrant's telephone number, including area code: 650 312-2000
Date of fiscal year end: 9/30
Date of reporting period: 3/31/14
Item 1. Reports to Stockholders.
| Contents | |||||||
| Shareholder Letter | 1 | Semiannual Report | Franklin U.S. Government | Notes to | |||
| Securities Fund | 31 | Financial Statements | 122 | ||||
| Economic and Market Overview | 3 | ||||||
| Franklin Utilities Fund | 40 | Shareholder Information | 146 | ||||
| Franklin DynaTech Fund | 5 | ||||||
| Financial Highlights and | |||||||
| Franklin Growth Fund | 14 | Statements of Investments | 48 | ||||
| Franklin Income Fund | 22 | Financial Statements | 112 | ||||
| 1
Semiannual Report
Economic and Market Overview
The U.S. economy showed ongoing signs of recovery during the six-month period ended March 31, 2014, although abnormally cold weather suppressed some economic activity beginning in January. Strong consumer and business spending and rising inventories underpinned economic growth in the fourth quarter of 2013. Historically low mortgage rates and improving sentiment aided the housing market recovery, evidenced by solid home sales, rising home prices, low inventories and multi-year lows in new foreclosures. Manufacturing activity expanded during the six-month period despite a slowdown in early 2014 because of adverse weather. Retail sales for the period generally rose, especially toward the end of 2013, but missed expected levels in 2014. The unemployment rate declined to 6.7% in March from 7.2% in September 2013, and inflation remained well below the U.S. Federal Reserve Board s (Fed s) 2.0% target.1
In October 2013, the federal government temporarily shut down after Congress reached a budget impasse. However, Congress passed a spending bill in January to fund the federal government through September 2014. Congress then approved suspension of the debt ceiling until March 2015. The Fed maintained its monthly bond purchases at $85 billion until January 2014, when it began reducing them, based on continued positive economic and employment data. Although economic data in early 2014 were soft resulting from severe winter weather, Fed Chair Janet Yellen kept the pace of asset-purchase tapering intact in the March meeting while saying the Fed might quicken the expected pace of the central bank s rate-hike cycle and adopting a more qualitative approach to rate-hike guidance. Despite volatility in U.S. equity markets toward period-end arising from geopolitical risks in Ukraine, markets continued to advance as tensions eased.
Investor confidence grew as corporate profits rose and generally favorable economic data indicated continued recovery. However, brief sell-offs flared when markets reacted to the Fed s statements, U.S. budget disputes, political instability in certain emerging markets and China s moderating economy. U.S. stocks generated strong returns for the six months under review as the Standard & Poor s 500 Index (S&P 500®) and Dow Jones Industrial Average reached all-time highs.2
The 10-year Treasury yield rose from 2.64% at the beginning of the period to a high of 3.04% on December 31, 2013, mainly because of an improved economic environment and market certainty about the Fed s plans. However,
Semiannual Report | 3
some weakening economic data, possibly due to bad weather, and increasing political tension in Ukraine contributed to the 10-year U.S. Treasury yield s decline to 2.73% at period-end.
The foregoing information reflects our analysis and opinions as of March 31, 2014. The information is not a complete analysis of every aspect of any market, country, industry, security or fund. Statements of fact are from sources considered reliable.
1. Source: Bureau of Labor Statistics.
2. Copyright © 2014, S&P Dow Jones Indices LLC. All rights reserved. Reproduction of S&P Dow Jones Indices in any form is prohibited except with the prior written permission of S&P. S&P does not guarantee the accuracy, adequacy, completeness or availability of any information and is not responsible for any errors or omissions, regardless of the cause or for the results obtained from the use of such information. S&P DISCLAIMS ANY AND ALL EXPRESS OR IMPLIED WARRANTIES, INCLUDING, BUT NOT LIMITED TO, ANY WARRANTIES OF MERCHANTABILITY OR FITNESS FOR A PARTICULAR PURPOSE OR USE. In no event shall S&P be liable for any direct, indirect, special or consequential damages, costs, expenses, legal fees, or losses (including lost income or lost profit and opportunity costs) in connection with subscriber s or others use of S&P Dow Jones Indices.
4 | Semiannual Report
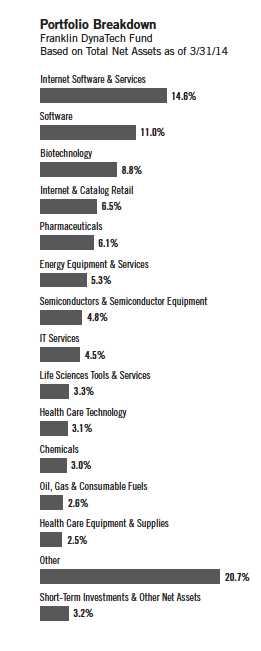
Franklin DynaTech Fund
Your Fund s Goal and Main Investments: Franklin DynaTech Fund seeks capital appreciation by investing substantially in equity securities of companies emphasizing scientific or technological development or that are in fast-growing industries.
Performance data represent past performance, which does not guarantee future results. Investment return and principal value will fluctuate, and you may have a gain or loss when you sell your shares. Current performance may differ from figures shown. Please visit franklintempleton.com or call (800) 342-5236 for most recent month-end performance.
This semiannual report for Franklin DynaTech Fund covers the period ended March 31, 2014.
Performance Overview
Franklin DynaTech Fund Class A delivered a cumulative total return of +8.83% for the six months under review. In comparison, the Russell 1000® Growth Index, which measures performance of the largest companies in the Russell 3000® Index with higher price-to-book ratios and higher forecasted growth values, generated a total return of +11.67%.1, 2 Also for comparison, the broad U.S. stock market as measured by the Standard & Poor s 500 Index (S&P 500),1, 3 produced a +12.51% total return, and domestic and international-based stocks as measured by the NASDAQ Composite Index® posted a +12.02% total return.1 You can find the Fund s long-term performance data in the Performance Summary beginning on page 9.
Investment Strategy
We use fundamental, bottom-up research to seek companies meeting our criteria of growth potential, quality and valuation. In seeking sustainable growth characteristics, we look for companies we believe can produce sustainable earnings and cash flow growth, evaluating the long-term market opportunity and competitive structure of an industry to target leaders and emerging leaders. We define quality companies as those with strong and improving competitive positions in attractive markets. We also believe important attributes of quality are experienced and talented management teams as well as financial strength reflected in the capital structure, gross and operating margins, free cash flow generation and returns on capital employed. Our valuation analysis includes a range of potential outcomes based on an assessment of multiple scenarios. In assessing value, we consider whether security prices fully reflect the balance of the sustainable growth opportunities relative to business and financial risks.
The dollar value, number of shares or principal amount, and names of all portfolio holdings are listed in the Fund s Statement of Investments (SOI). The SOI begins on page 53.
Semiannual Report | 5
Manager s Discussion
The Fund s health care positions contributed notably to absolute performance during the reporting period.4 Although generic and branded pharmaceuticals firm Actavis reported a net operating loss for 2013, its shares were propelled by strong U.S. sales of core branded products aided by its acquisition of specialty drug company Warner Chilcott, and by its launch of new generic drugs. Genetic analysis tools manufacturer Illumina experienced robust performance across all products and geographic regions in 2013 and introduced new products in early 2014 that the company hoped would redefine the direction of genetic research. Illumina issued encouraging future earnings guidance that anticipated double-digit revenue growth in 2014. Health services and information technology provider McKesson experienced increased second- and third-quarter revenue because of growing U.S. pharmaceutical distribution, new customers and growth in Canada, and higher medical-surgical distribution and technology services sales driven by acquisitions and market growth. Biotechnology firm Biogen Idec, a developer of drugs that treat neurodegenerative diseases, exceeded sales expectations for its new multiple sclerosis (MS) drug Tecfidera, which was also recently approved by the European Commission as a first-line oral treatment for the most common type of MS. Biogen Idec also benefited from growing sales of another MS medication, Tysabri, boosted by the com-pany s acquisition of full rights from partner Perrigo.
The Fund s information technology (IT) positions also substantially supported results.5 Web-based search engine and advertising provider Google reported higher fourth-quarter revenue and earnings driven by product improvements and a larger number of paid clicks for advertising coupled with a decreased cost per click. Tencent Holdings, a leading provider of comprehensive Internet services in China, achieved sustained growth in 2013 revenue and earnings, stemming from the development of a mobile platform focusing on value-added services such as online and smartphone games, web chat, online payment services, e-commerce and online advertising. Shares of global payments technology companies Visa and Mastercard rallied as revenue increased during their most recent quarters based on growth in gross dollar and cross-border volumes and processed transactions.
In contrast, some holdings notably weighed on performance. Despite increases in fourth-quarter and full-year 2013 revenue and earnings that exceeded estimates, shares of LinkedIn, the world s largest professional, Internet network, declined after announcing lower-than-expected 2014 earnings guidance and slower growth in its user base. Falling fourth-quarter and full-year 2013 revenue for biopharmaceutical firm Celldex Therapeutics, which specializes in immunology to prevent and treat diseases, occurred primarily because of declining royalty revenue for Rotarix, a rotavirus vaccine for infants. The stock
6 | Semiannual Report
| Top 10 Holdings | ||
| Franklin DynaTech Fund | ||
| 3/31/14 | ||
| Company | % of Total | |
| Sector/Industry | Net Assets | |
| Google Inc., A | 3.1 | % |
| Internet Software & Services | ||
| Actavis PLC | 2.4 | % |
| Pharmaceuticals | ||
| Visa Inc., A | 2.3 | % |
| IT Services | ||
| MasterCard Inc., A | 2.3 | % |
| IT Services | ||
| Amazon.com Inc. | 2.2 | % |
| Internet & Catalog Retail | ||
| Biogen Idec Inc. | 2.1 | % |
| Biotechnology | ||
| ARM Holdings PLC, ADR (U.K.) | 1.8 | % |
| Semiconductors & Semiconductor | ||
| Equipment | ||
| Apple Inc. | 1.7 | % |
| Technology Hardware, Storage | ||
| & Peripherals | ||
| Priceline.com Inc. | 1.7 | % |
| Internet & Catalog Retail | ||
| Gilead Sciences Inc. | 1.6 | % |
| Biotechnology | ||
price of MercadoLibre, Latin America s leading e-commerce technology company, declined because of disappointing third-quarter 2013 earnings as well as concerns about inflation and currency risks in Venezuela and Argentina, in which the company earned about half of its 2013 profits. Despite revenue growth, NetSuite, a leading provider of cloud-based financials, enterprise resource planning and omnichannel commerce software suites, suffered from net operating losses in 2013, resulting from its sales promotion and product development efforts.
As managers of Franklin DynaTech Fund, at period-end we remained encouraged by the relative abundance of companies that we believe have strong long-term growth prospects trading at what we perceive to be attractive valuations. We believe it is these innovative, thought-leading companies that may promote economic advancement over the longer term.
Thank you for your continued participation in Franklin DynaTech Fund.
We look forward to serving your future investment needs.

The foregoing information reflects our analysis, opinions and portfolio holdings as of March 31, 2014, the end of
the reporting period. The way we implement our main investment strategies and the resulting portfolio holdings
may change depending on factors such as market and economic conditions. These opinions may not be relied upon
as investment advice or an offer for a particular security. The information is not a complete analysis of every aspect
of any market, country, industry, security or the Fund. Statements of fact are from sources considered reliable,
but the investment manager makes no representation or warranty as to their completeness or accuracy. Although
historical performance is no guarantee of future results, these insights may help you understand our investment
management philosophy.
Semiannual Report | 7
The indexes are unmanaged and include reinvested dividends. One cannot invest directly in an index, and an index is
not representative of the Fund s portfolio.
1. Source: © 2014 Morningstar. All Rights Reserved. The information contained herein: (1) is proprietary to Morningstar
and/or its content providers; (2) may not be copied or distributed; and (3) is not warranted to be accurate, complete or
timely. Neither Morningstar nor its content providers are responsible for any damages or losses arising from any use of
this information.
2. Russell Investment Group is the source and owner of the trademarks, service marks and copyrights related to the
Russell Indexes. Russell® is a trademark of Russell Investment Group.
3. S&P 500: Copyright © 2014, S&P Dow Jones Indices LLC. All rights reserved. Reproduction of S&P U.S. Index data in
any form is prohibited except with the prior written permission of S&P. S&P does not guarantee the accuracy, adequacy,
completeness or availability of any information and is not responsible for any errors or omissions, regardless of the
cause or for the results obtained from the use of such information. S&P DISCLAIMS ANY AND ALL EXPRESS OR IMPLIED
WARRANTIES, INCLUDING, BUT NOT LIMITED TO, ANY WARRANTIES OF MERCHANTABILITY OR FITNESS FOR A PARTICULAR
PURPOSE OR USE. In no event shall S&P be liable for any direct, indirect, special or consequential damages, costs,
expenses, legal fees, or losses (including lost income or lost profit and opportunity costs) in connection with subscriber s
or others use of S&P U.S. Index data.
4. The health care sector comprises biotechnology, health care equipment and supplies, health care providers and
services, health care technology, life sciences tools and services, and pharmaceuticals in the SOI.
5. The IT sector comprises communications equipment; electronic equipment, instruments and components; Internet
software and services; IT services; semiconductors and semiconductor equipment; software; and technology hardware,
storage and peripherals in the SOI.
8 | Semiannual Report
Performance Summary as of 3/31/14
Franklin DynaTech Fund
Your dividend income will vary depending on dividends or interest paid by securities in the Fund s portfolio, adjusted for operating expenses of each class. Capital gain distributions are net profits realized from the sale of portfolio securities. The performance table does not reflect any taxes that a shareholder would pay on Fund dividends, capital gain distributions, if any, or any realized gains on the sale of Fund shares. Total return reflects reinvestment of the Fund s dividends and capital gain distributions, if any, and any unrealized gains or losses.
| Net Asset Value | ||||||
| Share Class | 3/31/14 | 9/30/13 | Change | |||
| A (FKDNX) | $44.00 | $42.13 | +$1.87 | |||
| C (FDYNX) | $38.85 | $37.53 | +$1.32 | |||
| R (FDNRX) | $43.35 | $41.58 | +$1.77 | |||
| R6 (FDTRX) | $44.76 | $42.74 | +$2.02 | |||
| Advisor (FDYZX) | $44.69 | $42.71 | +$1.98 |
| Distributions | |
| Share Class | Long-Term Capital Gain |
| A (10/1/13-3/31/14) | $1.8063 |
| C (10/1/13-3/31/14) | $1.8063 |
| R (10/1/13-3/31/14) | $1.8063 |
| R6 (10/1/13-3/31/14) | $1.8063 |
| Advisor (10/1/13 3/31/14) | $1.8063 |
Semiannual Report | 9
Performance Summary (continued)
Performance as of 3/31/141
Cumulative total return excludes sales charges. Average annual total return and value of $10,000 investment include maximum sales charges. Class A: 5.75% maximum initial sales charge; Class C: 1% contingent deferred sales charge in first year only; Class R/R6/Advisor Class: no sales charges.
| Value of | ||||||||||
| Cumulative | Average Annual | $ | 10,000 | Total Annual | ||||||
| Share Class | Total Return2 | Total Return3 | Investment4 | Operating Expenses5 | ||||||
| A | 0.94 | % | ||||||||
| 6-Month | + | 8.83 | % | + | 2.58 | % | $ | 10,258 | ||
| 1-Year | + | 27.01 | % | + | 19.72 | % | $ | 11,972 | ||
| 5-Year | + | 171.27 | % | + | 20.66 | % | $ | 25,572 | ||
| 10-Year | + | 131.78 | % | + | 8.13 | % | $ | 21,843 | ||
| C | 1.69 | % | ||||||||
| 6-Month | + | 8.44 | % | + | 7.44 | % | $ | 10,744 | ||
| 1-Year | + | 26.07 | % | + | 25.07 | % | $ | 12,507 | ||
| 5-Year | + | 161.29 | % | + | 21.18 | % | $ | 26,129 | ||
| 10-Year | + | 114.99 | % | + | 7.95 | % | $ | 21,499 | ||
| R | 1.19 | % | ||||||||
| 6-Month | + | 8.70 | % | + | 8.70 | % | $ | 10,870 | ||
| 1-Year | + | 26.72 | % | + | 26.72 | % | $ | 12,672 | ||
| 5-Year | + | 167.92 | % | + | 21.79 | % | $ | 26,792 | ||
| 10-Year | + | 125.31 | % | + | 8.46 | % | $ | 22,531 | ||
| R6 | 0.52 | % | ||||||||
| 6-Month | + | 9.06 | % | + | 9.06 | % | $ | 10,906 | ||
| Since Inception (5/1/13)6 | + | 27.50 | % | + | 27.50 | % | $ | 12,750 | ||
| Advisor7 | 0.69 | % | ||||||||
| 6-Month | + | 8.97 | % | + | 8.97 | % | $ | 10,897 | ||
| 1-Year | + | 27.34 | % | + | 27.34 | % | $ | 12,734 | ||
| 5-Year | + | 174.67 | % | + | 22.39 | % | $ | 27,467 | ||
| 10-Year | + | 135.19 | % | + | 8.93 | % | $ | 23,519 |
Performance data represent past performance, which does not guarantee future results. Investment return and principal value will fluctuate, and you may have a gain or loss when you sell your shares. Current performance may differ from figures shown. For most recent month-end performance, go to franklintempleton.com or call (800) 342-5236.
10 | Semiannual Report
Performance Summary (continued)
All investments involve risks, including possible loss of principal. The Fund s investments in fast-growing industries, including the technology and telecommunications sectors (which have historically been volatile) could result in increased price fluctuation, especially over the short term, due to the rapid pace of product change and development and changes in government regulation of companies emphasizing scientific or technological advancement. The Fund may also invest in small- and mid-capitalization companies, which can be particularly sensitive to changing economic conditions, and their prospects for growth are less certain than those of larger, more established companies. The Fund is actively managed but there is no guarantee that the manager s investment decisions will produce the desired results. The Fund s prospectus also includes a description of the main investment risks.
| Class C: | These shares have higher annual fees and expenses than Class A shares. |
| Class R: | Shares are available to certain eligible investors as described in the prospectus. These shares have higher annual fees and expenses |
| than Class A shares. | |
| Class R6: | Shares are available to certain eligible investors as described in the prospectus. |
| Advisor Class: | Shares are available to certain eligible investors as described in the prospectus. |
1. The Fund has a fee waiver associated with its investments in a Franklin Templeton money fund, contractually guaranteed through at least its
current fiscal year-end. Fund investment results reflect the fee waiver, to the extent applicable; without these reductions, the results would have
been lower.
2. Cumulative total return represents the change in value of an investment over the periods indicated.
3. Average annual total return represents the average annual change in value of an investment over the periods indicated. Six-month return has not
been annualized.
4. These figures represent the value of a hypothetical $10,000 investment in the Fund over the periods indicated.
5. Figures are as stated in the Fund s current prospectus. In periods of market volatility, assets may decline significantly, causing total annual Fund
operating expenses to become higher than the figures shown.
6. Since Class R6 shares have existed for less than one year, performance is shown for the period since inception and is not annualized.
7. Effective 5/15/08, the Fund began offering Advisor Class shares, which do not have sales charges or a Rule 12b-1 plan. Performance quotations
for this class reflect the following methods of calculation: (a) For periods prior to 5/15/08, a restated figure is used based upon the Fund s Class A
performance, excluding the effect of Class A s maximum initial sales charge, but reflecting the effect of the Class A Rule 12b-1 fees; and (b) for peri-
ods after 5/15/08, actual Advisor Class performance is used reflecting all charges and fees applicable to that class. Since 5/15/08 (commencement
of sales), the cumulative and average annual total returns of Advisor Class shares were +66.69% and +9.08%.
Semiannual Report | 11
Your Fund s Expenses
Franklin DynaTech Fund
As a Fund shareholder, you can incur two types of costs:
- Transaction costs, including sales charges (loads) on Fund purchases; and
- Ongoing Fund costs, including management fees, distribution and service (12b-1) fees, and other Fund expenses. All mutual funds have ongoing costs, sometimes referred to as operating expenses.
The following table shows ongoing costs of investing in the Fund and can help you understand these costs and compare them with those of other mutual funds. The table assumes a $1,000 investment held for the six months indicated.
Actual Fund Expenses
The first line (Actual) for each share class listed in the table provides actual account values and expenses. The Ending Account Value is derived from the Fund s actual return, which includes the effect of Fund expenses.
You can estimate the expenses you paid during the period by following these steps. Of course, your account value and expenses will differ from those in this illustration:
| 1. | Divide your account value by $1,000. |
| If an account had an $8,600 value, then $8,600 ÷ $1,000 = 8.6. | |
| 2. | Multiply the result by the number under the heading Expenses Paid During Period. |
| If Expenses Paid During Period were $7.50, then 8.6 x $7.50 = $64.50. |
In this illustration, the estimated expenses paid this period are $64.50.
Hypothetical Example for Comparison with Other Funds
Information in the second line (Hypothetical) for each class in the table can help you compare ongoing costs of investing in the Fund with those of other mutual funds. This information may not be used to estimate the actual ending account balance or expenses you paid during the period. The hypothetical Ending Account Value is based on the actual expense ratio for each class and an assumed 5% annual rate of return before expenses, which does not represent the Fund s actual return. The figure under the heading Expenses Paid During Period shows the hypothetical expenses your account would have incurred under this scenario. You can compare this figure with the 5% hypothetical examples that appear in shareholder reports of other funds.
12 | Semiannual Report
Your Fund s Expenses (continued)
Please note that expenses shown in the table are meant to highlight ongoing costs and do not reflect any transaction costs, such as sales charges. Therefore, the second line for each class is useful in comparing ongoing costs only, and will not help you compare total costs of owning different funds. In addition, if transaction costs were included, your total costs would have been higher. Please refer to the Fund prospectus for additional information on operating expenses.
| Beginning Account | Ending Account | Expenses Paid During | ||||
| Share Class | Value 10/1/13 | Value 3/31/14 | Period* 10/1/13 3/31/14 | |||
| A | ||||||
| Actual | $ | 1,000 | $ | 1,088.30 | $ | 4.63 |
| Hypothetical (5% return before expenses) | $ | 1,000 | $ | 1,020.49 | $ | 4.48 |
| C | ||||||
| Actual | $ | 1,000 | $ | 1,084.40 | $ | 8.52 |
| Hypothetical (5% return before expenses) | $ | 1,000 | $ | 1,016.75 | $ | 8.25 |
| R | ||||||
| Actual | $ | 1,000 | $ | 1,087.00 | $ | 5.93 |
| Hypothetical (5% return before expenses) | $ | 1,000 | $ | 1,019.25 | $ | 5.74 |
| R6 | ||||||
| Actual | $ | 1,000 | $ | 1,090.60 | $ | 2.55 |
| Hypothetical (5% return before expenses) | $ | 1,000 | $ | 1,022.49 | $ | 2.47 |
| Advisor | ||||||
| Actual | $ | 1,000 | $ | 1,089.70 | $ | 3.33 |
| Hypothetical (5% return before expenses) | $ | 1,000 | $ | 1,021.74 | $ | 3.23 |
*Expenses are calculated using the most recent six-month expense ratio, net of expense waivers, annualized for each class (A: 0.89%; C: 1.64%; R: 1.14%; R6: 0.49%; and Advisor: 0.64%), multiplied by the average account value over the period, multiplied by 182/365 to reflect the one-half year period.
Semiannual Report | 13
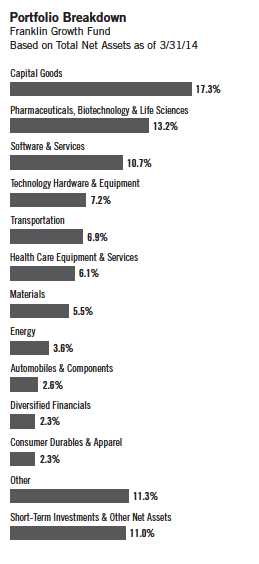
Franklin Growth Fund
Your Fund s Goal and Main Investments: Franklin Growth Fund seeks capital appreciation by investing substantially in equity securities of companies that are leaders in their industries.
Performance data represent past performance, which does not guarantee future results. Investment return and principal value will fluctuate, and you may have a gain or loss when you sell your shares. Current performance may differ from figures shown. Please visit franklintempleton.com or call (800) 342-5236 for most recent month-end performance.
We are pleased to bring you Franklin Growth Fund s semiannual report for the period ended March 31, 2014.
Performance Overview
Franklin Growth Fund Class A delivered a +12.61% cumulative total return for the six months under review. In comparison, the Standard & Poor s 500 Index, which is a broad measure of U.S. stock performance, generated a +12.51% total return.1, 2 You can find the Fund s long-term performance data in the Performance Summary beginning on page 17.
Investment Strategy
We use fundamental, bottom-up research to seek companies meeting our criteria of growth potential, quality and valuation. In seeking sustainable growth characteristics, we look for companies we believe can produce sustainable earnings and cash flow growth, evaluating the long-term market opportunity and competitive structure of an industry to target leaders and emerging leaders. We define quality companies as those with strong and improving competitive positions in attractive markets. We also believe important attributes of quality are experienced and talented management teams as well as financial strength reflected in the capital structure, gross and operating margins, free cash flow generation and returns on capital employed. Our valuation analysis includes a range of potential outcomes based on an assessment of multiple scenarios. In assessing value, we consider whether security prices fully reflect the balance of the sustainable growth opportunities relative to business and financial risks.
Manager s Discussion
Franklin Growth Fund owned shares of 168 companies at period-end. We continue to invest in a broad array of companies of all sizes and in varied industries.
During the six-month period, Fund holdings in all investment sectors benefited absolute performance, particularly industrials, health care and information technology (IT).3 In industrials, air service provider Alaska Air Group experienced
The dollar value, number of shares or principal amount, and names of all portfolio holdings are listed in the Fund s Statement of Investments (SOI). The SOI begins on page 63.
14 | Semiannual Report
record fourth-quarter and full-year 2013 earnings driven by award-winning customer service, industry-leading on-time performance and solid execution by employees. Despite declining sales, defense contractor Northrop Grumman reported higher fourth-quarter earnings supported by superior program performance, effective cash deployment and portfolio alignment. In IT, personal computing and mobile communication device manufacturer Apple generated record revenue from all-time high sales of iPhones and iPads in the first quarter and returned profits to shareholders via cash dividends and share repurchases. The company also benefited from strong performance of its Mac products and growth of its iTunes and software and services products. Web-based search engine and advertising provider Google reported higher fourth-quarter revenue and earnings driven by product improvements and a larger number of paid clicks for advertising coupled with a decreased cost per click. In health care, biotechnology firm Biogen Idec, a developer of drugs that treat neurodegener-ative diseases, exceeded sales expectations for its new multiple sclerosis (MS) drug Tecfidera, which was also recently approved by the European Commission as a first-line oral treatment for the most common type of MS. Biogen Idec also benefited from growing sales of another MS medication, Tysabri, boosted by the company s acquisition of full rights from partner Perrigo. Beauty drug maker Allergan achieved double-digit revenue and earnings growth for 2013, aided by increasing sales of its specialty pharmaceuticals and core medical devices. Allergan also benefited from new patents for its eye lubrication drug, Restasis, as well as a court ruling that protected Lumigan, its eye pressure reduction drug, from generic competition. Genetic analysis tools manufacturer Illumina experienced robust performance across all products and geographic regions in 2013 and introduced new products in early 2014 that the company hoped would redefine the direction of genetic research. Illumina issued encouraging future earnings guidance that anticipated double-digit revenue growth in 2014.
Conversely, some holdings notably weighed on absolute Fund performance. Third-quarter revenue declined for blood management solutions provider Haemonetics, resulting from U.S. hospital implementation of new transfusion standards and blood management programs that lowered demand for blood donation as well as surgical and transfusion disposables. However, management believed the company provided competitive advantages to U.S. hospitals navigating these changes. Despite record natural gas and oil sales, Anadarko Petroleum reported a fourth-quarter net loss and reduced full-year 2013 earnings because of pending litigation against its Kerr-McGee Gathering subsidiary involving potentially substantial environmental cleanup costs in numerous U.S. locations. Revenue increased for biotechnology firm Celgene, whose medications target cancer and immune-inflammatory related diseases, but its shares declined after lower fourth-quarter and full-year 2013 earnings resulting from higher expenses for research and development and new drug launches.
Semiannual Report | 15
| Top 10 Holdings | ||
| Franklin Growth Fund | ||
| 3/31/14 | ||
| Company | % of Total | |
| Sector/Industry | Net Assets | |
| Apple Inc. | 3.1 | % |
| Technology Hardware & Equipment | ||
| Google Inc., A | 1.7 | % |
| Software & Services | ||
| Biogen Idec Inc. | 1.6 | % |
| Pharmaceuticals, Biotechnology & | ||
| Life Sciences | ||
| Alaska Air Group Inc. | 1.5 | % |
| Transportation | ||
| W.W. Grainger Inc. | 1.4 | % |
| Capital Goods | ||
| The Boeing Co. | 1.4 | % |
| Capital Goods | ||
| Northrop Grumman Corp. | 1.4 | % |
| Capital Goods | ||
| The Walt Disney Co. | 1.4 | % |
| Media | ||
| Allergan Inc. | 1.3 | % |
| Pharmaceuticals, Biotechnology & | ||
| Life Sciences | ||
| VF Corp. | 1.3 | % |
| Consumer Durables & Apparel | ||
Technology solutions and cloud computing company Citrix Systems reported lower full-year 2013 earnings partially resulting from higher operating expenses. The company also provided lower-than-expected 2014 earnings guidance and announced plans to replace its retiring chief executive officer.
Shortly after the end of the reporting period, Franklin Growth Fund manager Jerry Palmieri passed away unexpectedly. He was a dedicated employee for more than 50 years. As a company, we will miss his wisdom, knowledge and dedication. For many years, we were co-lead managers for the Fund, supported by a dedicated research staff. Going forward, I will continue to manage Franklin Growth Fund in the same manner, applying the investment philosophy we developed over the years.
Thank you for your continued participation in Franklin Growth Fund.
We look forward to serving your future investment needs.

The foregoing information reflects our analysis, opinions and portfolio holdings as of March 31, 2014, the end of the reporting period. The way we implement our main investment strategies and the resulting portfolio holdings may change depending on factors such as market and economic conditions. These opinions may not be relied upon as investment advice or an offer for a particular security. The information is not a complete analysis of every aspect of any market, country, industry, security or the Fund. Statements of fact are from sources considered reliable, but the investment manager makes no representation or warranty as to their completeness or accuracy. Although historical performance is no guarantee of future results, these insights may help you understand our investment management philosophy.
The index is unmanaged and includes reinvested dividends. One cannot invest directly in an index, and an index is not representative of the Fund s portfolio.
1. Source: © 2014 Morningstar. All Rights Reserved. The information contained herein: (1) is proprietary to Morningstar and/or its content providers; (2) may not be copied or distributed; and (3) is not warranted to be accurate, complete or timely. Neither Morningstar nor its content providers are responsible for any damages or losses arising from any use of this information.
2. Standard & Poor s (S&P) 500 Index: Copyright © 2014, S&P Dow Jones Indices LLC. All rights reserved. Reproduction of S&P U.S. Index data in any form is prohibited except with the prior written permission of S&P. S&P does not guarantee the accuracy, adequacy, completeness or availability of any information and is not responsible for any errors or omissions, regardless of the cause or for the results obtained from the use of such information. S&P DISCLAIMS ANY AND ALL EXPRESS OR IMPLIED WARRANTIES, INCLUDING, BUT NOT LIMITED TO, ANY WARRANTIES OF MERCHANTABILITY OR FITNESS FOR A PARTICULAR PURPOSE OR USE. In no event shall S&P be liable for any direct, indirect, special or consequential damages, costs, expenses, legal fees, or losses (including lost income or lost profit and opportunity costs) in connection with subscriber s or others use of S&P U.S. Index data.
3. The industrials sector comprises capital goods, commercial and professional services, and transportation in the SOI. The health care sector comprises health care equipment and services; and pharmaceuticals, biotechnology and life sciences in the SOI. The IT sector comprises semiconductors and semiconductor equipment, software and services, and technology hardware and equipment in the SOI.
16 | Semiannual Report
Performance Summary as of 3/31/14
Franklin Growth Fund
Your dividend income will vary depending on dividends or interest paid by securities in the Fund s portfolio, adjusted for operating expenses of each class. Capital gain distributions are net profits realized from the sale of portfolio securities. The performance table does not reflect any taxes that a shareholder would pay on Fund dividends, capital gain distributions, if any, or any realized gains on the sale of Fund shares. Total return reflects reinvestment of the Fund s dividends and capital gain distributions, if any, and any unrealized gains or losses.
| Net Asset Value | ||||||
| Share Class | 3/31/14 | 9/30/13 | Change | |||
| A (FKGRX) | $66.68 | $59.49 | +$7.19 | |||
| C (FRGSX) | $62.41 | $55.64 | +$6.77 | |||
| R (FGSRX) | $66.34 | $59.07 | +$7.27 | |||
| R6 (FIFRX) | $66.77 | $59.71 | +$7.06 | |||
| Advisor (FCGAX) | $66.83 | $59.66 | +$7.17 |
| Distributions | ||
| Share Class | Dividend Income | |
| A (10/1/13-3/31/14) | $0.2953 | |
| R (10/1/13-3/31/14) | $0.0961 | |
| R6(10/1/13-3/31/14) | $0.5774 | |
| Advisor (10/1/13-3/31/14) | $0.4175 |
Semiannual Report | 17
Performance Summary (continued)
Performance as of 3/31/141
Cumulative total return excludes sales charges. Average annual total return and value of $10,000 investment include maximum sales charges. Class A: 5.75% maximum initial sales charge; Class C: 1% contingent deferred sales charge in first year only; Class R/R6/Advisor Class: no sales charges.
| Value of | Total Annual | |||||||||||
| Cumulative | Average Annual | $ | 10,000 | Operating Expenses5 | ||||||||
| Share Class | Total Return2 | Total Return3 | Investment4 | (with waiver) | (without waiver) | |||||||
| A | 0.92 | % | 0.93 | % | ||||||||
| 6-Month | + | 12.61 | % | + | 6.13 | % | $ | 10,613 | ||||
| 1-Year | + | 22.60 | % | + | 15.56 | % | $ | 11,556 | ||||
| 5-Year | + | 155.91 | % | + | 19.25 | % | $ | 24,119 | ||||
| 10-Year | + | 130.35 | % | + | 8.06 | % | $ | 21,711 | ||||
| C | 1.67 | % | 1.68 | % | ||||||||
| 6-Month | + | 12.17 | % | + | 11.17 | % | $ | 11,117 | ||||
| 1-Year | + | 21.68 | % | + | 20.68 | % | $ | 12,068 | ||||
| 5-Year | + | 146.49 | % | + | 19.77 | % | $ | 24,649 | ||||
| 10-Year | + | 113.70 | % | + | 7.89 | % | $ | 21,370 | ||||
| R | 1.17 | % | 1.18 | % | ||||||||
| 6-Month | + | 12.48 | % | + | 12.48 | % | $ | 11,248 | ||||
| 1-Year | + | 22.31 | % | + | 22.31 | % | $ | 12,231 | ||||
| 5-Year | + | 152.75 | % | + | 20.38 | % | $ | 25,275 | ||||
| 10-Year | + | 124.66 | % | + | 8.43 | % | $ | 22,466 | ||||
| R6 | 0.49 | % | 0.50 | % | ||||||||
| 6-Month | + | 12.84 | % | + | 12.84 | % | $ | 11,284 | ||||
| Since Inception (5/1/13)6 | + | 23.45 | % | + | 23.45 | % | $ | 12,345 | ||||
| Advisor | 0.67 | % | 0.68 | % | ||||||||
| 6-Month | + | 12.75 | % | + | 12.75 | % | $ | 11,275 | ||||
| 1-Year | + | 22.91 | % | + | 22.91 | % | $ | 12,291 | ||||
| 5-Year | + | 159.12 | % | + | 20.98 | % | $ | 25,912 | ||||
| 10-Year | + | 136.20 | % | + | 8.98 | % | $ | 23,620 | ||||
Performance data represent past performance, which does not guarantee future results. Investment return and principal value will fluctuate, and you may have a gain or loss when you sell your shares. Current performance may differ from figures shown. For most recent month-end performance, go to franklintempleton.com or call (800) 342-5236.
18 | Semiannual Report
Performance Summary (continued)
All investments involve risks, including possible loss of principal. Historically, the Fund has focused on larger companies. The Fund may also invest in small, relatively new and/or unseasoned companies, which involves additional risks, as the price of these securities can be volatile, particularly over the short term. In addition, the Fund may invest up to 40% of its net assets in stocks of foreign companies, which involve special risks, including currency fluctuations and economic as well as political uncertainty. The Fund may focus on particular sectors of the market from time to time, which can carry greater risks of adverse developments in such sectors. The Fund is actively managed but there is no guarantee that the manager s investment decisions will produce the desired results. The Fund s prospectus also includes a description of the main investment risks.
Class C: Class R: | These shares have higher annual fees and expenses than Class A shares. Shares are available to certain eligible investors as described in the prospectus. These shares have higher annual fees and expenses than Class A shares. |
Class R6: Advisor Class: | Shares are available to certain eligible investors as described in the prospectus. Shares are available to certain eligible investors as described in the prospectus. |
1. The Fund has a fee waiver associated with its investments in a Franklin Templeton money fund, contractually guaranteed through at least its current fiscal year-end. Fund investment results reflect the fee waiver, to the extent applicable; without these reductions, the results would have been lower.
2. Cumulative total return represents the change in value of an investment over the periods indicated.
3. Average annual total return represents the average annual change in value of an investment over the periods indicated. Six-month return has not been annualized.
4. These figures represent the value of a hypothetical $10,000 investment in the Fund over the periods indicated.
5. Figures are as stated in the Fund s current prospectus. In periods of market volatility, assets may decline significantly, causing total annual Fund operating expenses to become higher than the figures shown.
6. Since Class R6 shares have existed for less than one year, performance is shown for the period since inception and is not annualized.
Semiannual Report | 19
Your Fund s Expenses
Franklin Growth Fund
As a Fund shareholder, you can incur two types of costs:
- Transaction costs, including sales charges (loads) on Fund purchases; and
- Ongoing Fund costs, including management fees, distribution and service (12b-1) fees, and other Fund expenses. All mutual funds have ongoing costs, sometimes referred to as operating expenses.
The following table shows ongoing costs of investing in the Fund and can help you understand these costs and compare them with those of other mutual funds. The table assumes a $1,000 investment held for the six months indicated.
Actual Fund Expenses
The first line (Actual) for each share class listed in the table provides actual account values and expenses. The Ending Account Value is derived from the Fund s actual return, which includes the effect of Fund expenses.
You can estimate the expenses you paid during the period by following these steps. Of course, your account value and expenses will differ from those in this illustration:
| 1. | Divide your account value by $1,000. |
| If an account had an $8,600 value, then $8,600 ÷ $1,000 = 8.6. | |
| 2. | Multiply the result by the number under the heading Expenses Paid During Period. |
| If Expenses Paid During Period were $7.50, then 8.6 x $7.50 = $64.50. |
In this illustration, the estimated expenses paid this period are $64.50.
Hypothetical Example for Comparison with Other Funds
Information in the second line (Hypothetical) for each class in the table can help you compare ongoing costs of investing in the Fund with those of other mutual funds. This information may not be used to estimate the actual ending account balance or expenses you paid during the period. The hypothetical Ending Account Value is based on the actual expense ratio for each class and an assumed 5% annual rate of return before expenses, which does not represent the Fund s actual return. The figure under the heading Expenses Paid During Period shows the hypothetical expenses your account would have incurred under this scenario. You can compare this figure with the 5% hypothetical examples that appear in shareholder reports of other funds.
20 | Semiannual Report
Your Fund s Expenses (continued)
Please note that expenses shown in the table are meant to highlight ongoing costs and do not reflect any transaction costs, such as sales charges. Therefore, the second line for each class is useful in comparing ongoing costs only, and will not help you compare total costs of owning different funds. In addition, if transaction costs were included, your total costs would have been higher. Please refer to the Fund prospectus for additional information on operating expenses.
| Beginning Account | Ending Account | Expenses Paid During | ||||
| Share Class | Value 10/1/13 | Value 3/31/14 | Period* 10/1/13-3/31/14 | |||
| A | ||||||
| Actual | $ | 1,000 | $ | 1,126.10 | $ | 4.72 |
| Hypothetical (5% return before expenses) | $ | 1,000 | $ | 1,020.49 | $ | 4.48 |
| C | ||||||
| Actual | $ | 1,000 | $ | 1,121.70 | $ | 8.68 |
| Hypothetical (5% return before expenses) | $ | 1,000 | $ | 1,016.75 | $ | 8.25 |
| R | ||||||
| Actual | $ | 1,000 | $ | 1,124.80 | $ | 6.04 |
| Hypothetical (5% return before expenses) | $ | 1,000 | $ | 1,019.25 | $ | 5.74 |
| R6 | ||||||
| Actual | $ | 1,000 | $ | 1,128.40 | $ | 2.49 |
| Hypothetical (5% return before expenses) | $ | 1,000 | $ | 1,022.59 | $ | 2.37 |
| Advisor | ||||||
| Actual | $ | 1,000 | $ | 1,127.50 | $ | 3.39 |
| Hypothetical (5% return before expenses) | $ | 1,000 | $ | 1,021.74 | $ | 3.23 |
*Expenses are calculated using the most recent six-month expense ratio, net of expense waivers, annualized for each class (A: 0.89%; C: 1.64%; R: 1.14%; R6: 0.47%; and Advisor: 0.64%), multiplied by the average account value over the period, multiplied by 182/365 to reflect the one-half year period.
Semiannual Report | 21
Franklin Income Fund
Your Fund s Goal and Main Investments: Franklin Income Fund seeks to maximize income while maintaining prospects for capital appreciation by investing, under normal market conditions, in a diversified portfolio of debt and equity securities.
Performance data represent past performance, which does not guarantee future results. Investment return and principal value will fluctuate, and you may have a gain or loss when you sell your shares. Current performance may differ from figures shown. Please visit franklintempleton.com or call (800) 342-5236 for most recent month-end performance.
This semiannual report for Franklin Income Fund covers the period ended March 31, 2014.
Performance Overview
Franklin Income Fund Class A delivered a +9.68% cumulative total return for the six months under review. The Fund s equity benchmark, the Standard & Poor s 500 (S&P 500) Index, which is a broad measure of U.S. stock performance, posted a +12.51% total return.1, 2 The Fund s fixed income benchmark, the Barclays U.S. Aggregate Index, which tracks the U.S. investment-grade, taxable bond market, returned +1.70%.1, 3 The Fund s peers, as measured by the Lipper Mixed-Asset Target Allocation Moderate Funds Classification Average, which consists of funds chosen by Lipper that, by practice, maintain a mix of 40% to 60% equity securities, with the remainder in bonds and cash, generated a +6.71% total return.4 You can find the Fund s long-term performance data in the Performance Summary beginning on page 26.
Investment Strategy
By generally performing independent analysis of debt, convertible and equity securities, we search for undervalued or out-of-favor securities we believe offer opportunities for income today and significant growth tomorrow. We consider such factors as a company s experience and managerial strength; its cash flow potential and profitability; its competitive positioning and advantages; its responsiveness to changes in interest rates and business conditions; debt maturity schedules and borrowing requirements; a company s changing financial condition and market recognition of the change; and a security s relative value based on such factors as anticipated cash flow, interest or dividend coverage, asset coverage and earnings.
The dollar value, number of shares or principal amount, and names of all portfolio holdings are listed in the Fund s Statement of Investments (SOI). The SOI begins on page 74.
22 | Semiannual Report
| Dividend Distributions* | |||||
| Franklin Income Fund | |||||
| 10/1/13 3/31/14 | |||||
| Dividend per Share (cents) | |||||
| Month | Class A | Class C | Class R | Class R6 | Advisor Class |
| October | 1.05 | 0.95 | 0.98 | 1.09 | 1.08 |
| November | 1.05 | 0.95 | 0.98 | 1.09 | 1.08 |
| December | 1.05 | 0.94 | 0.98 | 1.09 | 1.08 |
| January | 1.05 | 0.94 | 0.98 | 1.09 | 1.08 |
| February | 1.00 | 0.89 | 0.93 | 1.04 | 1.03 |
| March | 1.00 | 0.90 | 0.93 | 1.04 | 1.03 |
| Total | 6.20 | 5.57 | 5.78 | 6.44 | 6.38 |
*All Fund distributions will vary depending upon current market conditions, and past distributions are not indicative of future trends.
| Portfolio Breakdown | ||
| Franklin Income Fund | ||
| 3/31/14 | ||
| % of Total | ||
| Net Assets | ||
| Equity* | 61.8 | % |
| Utilities | 12.2 | % |
| Energy | 11.6 | % |
| Materials | 9.5 | % |
| Financials | 8.0 | % |
| Health Care | 5.8 | % |
| Information Technology | 4.7 | % |
| Industrials | 3.6 | % |
| Consumer Discretionary | 2.6 | % |
| Other | 3.8 | % |
| Fixed Income | 36.8 | % |
| Energy | 8.8 | % |
| Consumer Discretionary | 7.1 | % |
| Telecommunication Services | 4.0 | % |
| Information Technology | 3.7 | % |
| Materials | 3.3 | % |
| Financials | 3.2 | % |
| Health Care | 2.7 | % |
| Other | 4.0 | % |
| Short-Term Investments & | ||
| Other Net Assets | 1.4 | % |
| *Includes convertible bonds. | ||
Manager s Discussion
During the reporting period, the Fund s asset mix remained relatively stable. We continued to favor equity holdings, with 61.8% of total net assets in equities including common stock, preferred stock and equity-linked securities and 36.8% in fixed income securities, which consisted primarily of corporate bonds and floating rate term loans.
The Fund s performance during the period lagged that of the broad equity benchmark, the S&P 500, which delivered a strong gain, but outperformed that of the broad fixed income benchmark, the Barclays U.S. Aggregate Index.
The Fund s largest equity sector positions during the period continued to be in utilities, energy, materials and financials. Our information technology exposure increased during the period from 4.5% to 4.7% of total net assets. The Fund s fixed income exposure remained largely focused on high yield bonds, with an increasing shift toward higher credit quality positions.
The Fund is geographically positioned with 80.2% of total net assets in U.S. securities (including short-term investments and other net assets) and 19.8% of total net assets in foreign securities including the U.K., Canada, France, Switzerland, Mexico and Australia. Foreign securities included common stocks, convertible securities and corporate debt securities.
Semiannual Report | 23
| Top Five Equity Holdings | ||
| Franklin Income Fund | ||
| 3/31/14 | ||
| Company | % of Total | |
| Sector/Industry | Net Assets | |
| Royal Dutch Shell PLC | 2.2 | % |
| Energy | ||
| Wells Fargo & Co. | 1.8 | % |
| Financials | ||
| BP PLC | 1.6 | % |
| Energy | ||
| Merck & Co. Inc. | 1.6 | % |
| Health Care | ||
| The Southern Co. | 1.3 | % |
| Utilities | ||
Our equity positions drove the Fund s overall performance supported by continued corporate profit gains and investor optimism about moderately improved economic conditions. The Fund benefited from broad-based contributions across a wide range of sectors including utilities, health care, materials, industrials and financials. Many of our top performers, in our opinion, were leaders in their industries, had strong operations and cash flow, and showed a firm commitment to shareholders in the form of what we considered were attractive and growing dividend yields. Examples included The Dow Chemical Co., Merck & Co., Wells Fargo, Intel and Rio Tinto. The Fund s top equity contributors were supported by a variety of factors. During the period, cold weather bolstered commodity prices and led to gains for energy companies Royal Dutch Shell, BP and Exelon, while leading financial services companies Wells Fargo & Co. and JPMorgan Chase & Co. rose because of continued favorable capital and credit trends, as well as optimism about the potential for improving loan growth. Although the Fund s equity sector exposure delivered strong overall gains, several positions underperformed during the period. Weakness in the offshore oil and gas drilling industry pressured shares of Transocean, a leading owner and operator of mobile offshore drilling units. Continued coal pricing weakness related to investor uncertainty about the outlook for steel demand pressured Walter Energy partly because of the company s highly leveraged balance sheet.
Fixed income positions continued to benefit the Fund s overall performance given a generally benign environment for corporate bonds during the period, including stable economic conditions and credit conditions that provided ample access to capital. These factors led to low default levels in the high yield markets. Long-term interest rates remained relatively stable during the period, with the 10-year U.S. Treasury trading in a fairly tight range. Leading fixed income contributors during the period included corporate bonds of First Data, CC Media Holdings5 and Sprint Nextel. In contrast, holdings in NII Capital and Walter Energy were leading detractors.
We remained broadly exposed to high yield corporate bonds in our fixed income allocation, although we started to shift away from some of the lower credit quality, short-maturity bonds in favor of slightly longer duration, lower coupon bonds with higher credit quality. In some cases, this shift enabled us to take profits in bonds trading at substantial premiums to par value and then reinvest the proceeds in slightly longer maturity bonds trading at discounts to par value. We believe this was one of the more compelling opportunities in the high yield markets over the past six months, created in part by uncertainty about long-term interest rates.
24 | Semiannual Report
Thank you for your continued participation in Franklin Income Fund.
We look forward to serving your future investment needs.

| Top Five Fixed Income Holdings | ||
| and Senior Floating Rate Interests* | ||
| Franklin Income Fund | ||
| 3/31/14 | ||
| Company | % of Total | |
| Sector/Industry | Net Assets | |
| First Data Corp. | 2.3 | % |
| Information Technology | ||
| Clear Channel Communications Inc. | 1.9 | % |
| Consumer Discretionary | ||
| JPMorgan Chase & Co. | 1.4 | % |
| Financials | ||
| Sprint Nextel Corp. | 1.3 | % |
| Telecommunication Services | ||
| Chesapeake Energy Corp. | 1.2 | % |
| Energy | ||
| *Does not include convertible bonds. | ||
The foregoing information reflects our analysis, opinions and portfolio holdings as of March 31, 2014, the end of the reporting period. The way we implement our main investment strategies and the resulting portfolio holdings may change depending on factors such as market and economic conditions. These opinions may not be relied upon as investment advice or an offer for a particular security. The information is not a complete analysis of every aspect of any market, country, industry, security or the Fund. Statements of fact are from sources considered reliable, but the investment manager makes no representation or warranty as to their completeness or accuracy. Although historical performance is no guarantee of future results, these insights may help you understand our investment management philosophy.
The index is unmanaged and includes reinvestment of any income or distributions. One cannot invest directly in an
index, and an index is not representative of the Fund s portfolio.
1. Source: © 2014 Morningstar. All Rights Reserved. The information contained herein: (1) is proprietary to Morningstar
and/or its content providers; (2) may not be copied or distributed; and (3) is not warranted to be accurate, complete or
timely. Neither Morningstar nor its content providers are responsible for any damages or losses arising from any use of
this information.
2. S&P 500: Copyright © 2014, S&P Dow Jones Indices LLC. All rights reserved. Reproduction of S&P U.S. Index data in
any form is prohibited except with the prior written permission of S&P. S&P does not guarantee the accuracy, adequacy,
completeness or availability of any information and is not responsible for any errors or omissions, regardless of the
cause or for the results obtained from the use of such information. S&P DISCLAIMS ANY AND ALL EXPRESS OR IMPLIED
WARRANTIES, INCLUDING, BUT NOT LIMITED TO, ANY WARRANTIES OF MERCHANTABILITY OR FITNESS FOR A PARTICULAR
PURPOSE OR USE. In no event shall S&P be liable for any direct, indirect, special or consequential damages, costs,
expenses, legal fees, or losses (including lost income or lost profit and opportunity costs) in connection with sub-
scriber s or others use of S&P U.S. Index data.
3. Source: Barclays Global Family of Indices. © 2014 Barclays Capital Inc. Used with permission.
4. Source: Lipper, a Thomson Reuters Company. For the six-month period ended 3/31/14, this category consisted of
534 funds. Lipper calculations do not include sales charges or expense subsidization by a fund s manager. The Fund s
performance relative to the average may have differed if these and other factors had been considered.
5. CC Media Holdings comprises Clear Channel Communications, Inc. and Clear Channel Worldwide Holdings, Inc.
in the SOI.
Semiannual Report | 25
Performance Summary as of 3/31/14
Franklin Income Fund
Your dividend income will vary depending on dividends or interest paid by securities in the Fund s portfolio, adjusted for operating expenses of each class. Capital gain distributions are net profits realized from the sale of portfolio securities. The performance table does not reflect any taxes that a shareholder would pay on Fund dividends, capital gain distributions, if any, or any realized gains on the sale of Fund shares. Total return reflects reinvestment of the Fund s dividends and capital gain distributions, if any, and any unrealized gains or losses.
| Net Asset Value | ||||||
| Share Class | 3/31/14 | 9/30/13 | Change | |||
| A (FKINX) | $2.49 | $2.33 | +$0.16 | |||
| C (FCISX) | $2.52 | $2.35 | +$0.17 | |||
| R (FISRX) | $2.45 | $2.29 | +$0.16 | |||
| R6 (FNCFX) | $2.47 | $2.31 | +$0.16 | |||
| Advisor (FRIAX) | $2.47 | $2.31 | +$0.16 |
| Distributions | ||
| Share Class | Dividend Income | |
| A (10/1/13-3/31/14) | $0.0620 | |
| C (10/1/13-3/31/14) | $0.0557 | |
| R (10/1/13-3/31/14) | $0.0578 | |
| R6 (10/1/13-3/31/14) | $0.0644 | |
| Advisor (10/1/13 3/31/14) | $0.0638 |
26 | Semiannual Report
Performance Summary (continued)
Performance as of 3/31/141
Cumulative total return excludes sales charges. Average annual total return and value of $10,000 investment include maximum sales charges. Class A: 4.25% maximum initial sales charge; Class C: 1% contingent deferred sales charge in first year only; Class R/R6/Advisor Class: no sales charges.
| Value of | ||||||||||
| Cumulative | Average Annual | $ | 10,000 | Total Annual | ||||||
| Share Class | Total Return2 | Total Return3 | Investment4 | Operating Expenses5 | ||||||
| A | 0.62 | % | ||||||||
| 6-Month | + | 9.68 | % | + | 5.17 | % | $ | 10,517 | ||
| 1-Year | + | 12.76 | % | + | 8.12 | % | $ | 10,812 | ||
| 5-Year | + | 123.14 | % | + | 16.38 | % | $ | 21,350 | ||
| 10-Year | + | 107.86 | % | + | 7.11 | % | $ | 19,879 | ||
| C | 1.12 | % | ||||||||
| 6-Month | + | 9.74 | % | + | 8.74 | % | $ | 10,874 | ||
| 1-Year | + | 12.53 | % | + | 11.53 | % | $ | 11,153 | ||
| 5-Year | + | 118.25 | % | + | 16.89 | % | $ | 21,825 | ||
| 10-Year | + | 98.23 | % | + | 7.08 | % | $ | 19,823 | ||
| R | 0.97 | % | ||||||||
| 6-Month | + | 9.65 | % | + | 9.65 | % | $ | 10,965 | ||
| 1-Year | + | 12.58 | % | + | 12.58 | % | $ | 11,258 | ||
| 5-Year | + | 119.53 | % | + | 17.03 | % | $ | 21,953 | ||
| 10-Year | + | 100.71 | % | + | 7.22 | % | $ | 20,071 | ||
| R6 | 0.39 | % | ||||||||
| 6-Month | + | 9.87 | % | + | 9.87 | % | $ | 10,987 | ||
| Since Inception (5/1/13)6 | + | 11.03 | % | + | 11.03 | % | $ | 11,103 | ||
| Advisor | 0.47 | % | ||||||||
| 6-Month | + | 9.85 | % | + | 9.85 | % | $ | 10,985 | ||
| 1-Year | + | 13.04 | % | + | 13.04 | % | $ | 11,304 | ||
| 5-Year | + | 124.93 | % | + | 17.60 | % | $ | 22,493 | ||
| 10-Year | + | 110.95 | % | + | 7.75 | % | $ | 21,095 |
| Distribution | 30-Day Standardized Yield8 | |||||
| Share Class | Rate7 | (with waiver) | (without waiver) | |||
| A | 4.62 | % | 3.22 | % | 3.22 | % |
| C | 4.29 | % | 2.88 | % | 2.88 | % |
| R | 4.56 | % | 3.03 | % | 3.03 | % |
| R6 | 5.05 | % | 3.61 | % | 3.61 | % |
| Advisor | 5.00 | % | 3.52 | % | 3.52 | % |
Performance data represent past performance, which does not guarantee future results. Investment return and principal value will fluctuate, and you may have a gain or loss when you sell your shares. Current performance may differ from figures shown. For most recent month-end performance, go to franklintempleton.com or call (800) 342-5236.
Semiannual Report | 27
Performance Summary (continued)
All investments involve risks, including possible loss of principal. Stock prices fluctuate, sometimes rapidly and dramatically, due to factors affecting individual companies, particular industries or sectors, or general market conditions. The Fund s share price and yield will be affected by interest rate movements. Bond prices generally move in the opposite direction of interest rates. Thus, as prices of bonds in the Fund adjust to a rise in interest rates, the Fund s share price may decline. Changes in the financial strength of a bond issuer or in a bond s credit rating may affect its value. Investments in lower rated, higher yielding instruments include higher risk of default and loss of principal. These securities carry a greater degree of credit risk relative to investment-grade securities. The Fund is actively managed but there is no guarantee that the manager s investment decisions will produce the desired results. The Fund s prospectus also includes a description of the main investment risks.
Class C: Class R: | These shares have higher annual fees and expenses than Class A shares. Shares are available to certain eligible investors as described in the prospectus. These shares have higher annual fees and expenses than Class A shares. |
Class R6: Advisor Class: | Shares are available to certain eligible investors as described in the prospectus. Shares are available to certain eligible investors as described in the prospectus. |
1. The Fund has a fee waiver associated with its investments in a Franklin Templeton money fund, contractually guaranteed through at least its current fiscal year-end. Fund investment results reflect the fee waiver, to the extent applicable; without these reductions, the results would have been lower.
2. Cumulative total return represents the change in value of an investment over the periods indicated.
3. Average annual total return represents the average annual change in value of an investment over the periods indicated. Six-month return has not been annualized.
4. These figures represent the value of a hypothetical $10,000 investment in the Fund over the periods indicated.
5. Figures are as stated in the Fund s current prospectus. In periods of market volatility, assets may decline significantly, causing total annual Fund operating expenses to become higher than the figures shown.
6. Since Class R6 shares have existed for less than one year, performance is shown for the period since inception and is not annualized.
7. Distribution rate is based on an annualization of the respective class s March dividend and the maximum offering price (NAV for Classes C, R, R6 and Advisor) per share on 3/31/14.
8. The 30-day standardized yield for the 30 days ended 3/31/14 reflects an estimated yield to maturity (assuming all portfolio securities are held to maturity). It should be regarded as an estimate of the Fund s rate of investment income, and it may not equal the Fund s actual income distribution rate (which reflects the Fund s past dividends paid to shareholders) or the income reported in the Fund s financial statements.
28 | Semiannual Report
Your Fund s Expenses
Franklin Income Fund
As a Fund shareholder, you can incur two types of costs:
- Transaction costs, including sales charges (loads) on Fund purchases; and
- Ongoing Fund costs, including management fees, distribution and service (12b-1) fees, and other Fund expenses. All mutual funds have ongoing costs, sometimes referred to as operating expenses.
The following table shows ongoing costs of investing in the Fund and can help you understand these costs and compare them with those of other mutual funds. The table assumes a $1,000 investment held for the six months indicated.
Actual Fund Expenses
The first line (Actual) for each share class listed in the table provides actual account values and expenses. The Ending Account Value is derived from the Fund s actual return, which includes the effect of Fund expenses.
You can estimate the expenses you paid during the period by following these steps. Of course, your account value and expenses will differ from those in this illustration:
| 1. | Divide your account value by $1,000. |
| If an account had an $8,600 value, then $8,600 ÷ $1,000 = 8.6. | |
| 2. | Multiply the result by the number under the heading Expenses Paid During Period. |
| If Expenses Paid During Period were $7.50, then 8.6 x $7.50 = $64.50. |
In this illustration, the estimated expenses paid this period are $64.50.
Hypothetical Example for Comparison with Other Funds
Information in the second line (Hypothetical) for each class in the table can help you compare ongoing costs of investing in the Fund with those of other mutual funds. This information may not be used to estimate the actual ending account balance or expenses you paid during the period. The hypothetical Ending Account Value is based on the actual expense ratio for each class and an assumed 5% annual rate of return before expenses, which does not represent the Fund s actual return. The figure under the heading Expenses Paid During Period shows the hypothetical expenses your account would have incurred under this scenario. You can compare this figure with the 5% hypothetical examples that appear in shareholder reports of other funds.
Semiannual Report | 29
Your Fund s Expenses (continued)
Please note that expenses shown in the table are meant to highlight ongoing costs and do not reflect any transaction costs, such as sales charges. Therefore, the second line for each class is useful in comparing ongoing costs only, and will not help you compare total costs of owning different funds. In addition, if transaction costs were included, your total costs would have been higher. Please refer to the Fund prospectus for additional information on operating expenses.
| Beginning Account | Ending Account | Expenses Paid During | ||||
| Share Class | Value 10/1/13 | Value 3/31/14 | Period* 10/1/13 3/31/14 | |||
| A | ||||||
| Actual | $ | 1,000 | $ | 1,096.80 | $ | 3.24 |
| Hypothetical (5% return before expenses) | $ | 1,000 | $ | 1,021.84 | $ | 3.13 |
| C | ||||||
| Actual | $ | 1,000 | $ | 1,097.40 | $ | 5.86 |
| Hypothetical (5% return before expenses) | $ | 1,000 | $ | 1,019.35 | $ | 5.64 |
| R | ||||||
| Actual | $ | 1,000 | $ | 1,096.50 | $ | 5.07 |
| Hypothetical (5% return before expenses) | $ | 1,000 | $ | 1,020.09 | $ | 4.89 |
| R6 | ||||||
| Actual | $ | 1,000 | $ | 1,098.70 | $ | 2.04 |
| Hypothetical (5% return before expenses) | $ | 1,000 | $ | 1,022.99 | $ | 1.97 |
| Advisor | ||||||
| Actual | $ | 1,000 | $ | 1,098.50 | $ | 2.46 |
| Hypothetical (5% return before expenses) | $ | 1,000 | $ | 1,022.59 | $ | 2.37 |
*Expenses are calculated using the most recent six-month expense ratio, net of expense waivers, annualized for each class (A: 0.62%; C: 1.12%; R: 0.97%; R6: 0.39%; and Advisor: 0.47%), multiplied by the average account value over the period, multiplied by 182/365 to reflect the one-half year period.
30 | Semiannual Report
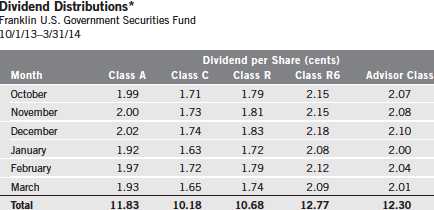
Franklin U.S. Government Securities Fund
Your Fund s Goal and Main Investments: Franklin U.S. Government Securities Fund seeks income by investing at least 80% of its net assets in U.S. government securities. The Fund presently invests substantially all of its assets in Government National Mortgage Association obligations (Ginnie Maes).
Since 1983, the Fund has invested substantially in Ginnie Mae securities, which carry a guarantee backed by the full faith and credit of the U.S. government as to the timely payment of interest and principal.1 Issued by the Government National Mortgage Association (GNMA), Ginnie Maes have been among the highest yielding U.S. government obligations available.
Performance data represent past performance, which does not guarantee future results. Investment return and principal value will fluctuate, and you may have a gain or loss when you sell your shares. Current performance may differ from figures shown. Please visit franklintempleton.com or call (800) 342-5236 for most recent month-end performance.
This semiannual report for Franklin U.S. Government Securities Fund covers the period ended March 31, 2014.
Performance Overview
Franklin U.S. Government Securities Fund Class A delivered a +1.05% cumulative total return for the six months under review. In comparison, its peers, AAA as measured by the Lipper GNMA Funds Classification Average, which consists of funds chosen by Lipper that invest primarily in GNMAs, posted a +1.16% total return.2 The Barclays U.S. Government Index: Intermediate Component, the intermediate component of the Barclays U.S. Government Index, returned +0.21% for the same period.3, 4 The Fund s return reflects the effect of management fees and expenses, while the Barclays U.S. Government Index: Intermediate Component does not have such costs. You can find the Fund s long-term performance data in the Performance Summary beginning on page 35.
The dollar value, number of shares or principal amount, and names of all portfolio holdings are listed in the Fund s Statement of Investments (SOI). The SOI begins on page 100.
Semiannual Report | 31
*All Fund distributions will vary depending upon current market conditions, and past distributions are not indicative of future trends.
Investment Strategy
We currently invest the Fund s assets predominantly in GNMA obligations. We analyze securities using proprietary models to help us identify attractive investment opportunities. The Fund s short-term investments may include short-term government securities and cash or cash equivalents.
Manager s Discussion
Economic indicators over the period broadly supported the U.S. economy s modest recovery. Much of the U.S. economic data released during the first quarter of 2014 was softer than many observers predicted and likely reflected the transitory effects of severe winter weather across much of the nation. However, despite the soft patch, employment data generally indicated continued labor market improvement. Consumers financial situations in the fourth quarter of 2013 also continued to show meaningful improvement, which we thought could support consumption trends. Manufacturing activity rebounded over the period after an initial slowdown attributed to the severe weather experienced in the first quarter of 2014 and an inventory buildup that accumulated late in 2013. Housing data were weaker than expected, which we think also reflected the adverse weather as well as higher mortgage interest rates, although home prices rose compared to the previous year.
In a sign of more confidence in the economic outlook, the U.S. Federal Reserve Board (Fed) revised its quantitative easing policy by reducing its monthly asset purchases starting in January. The reduction was split evenly between mortgage-backed securities (MBS) and Treasuries. The Fed also reiterated that it was not
32 | Semiannual Report
following a preset course and emphasized that future decisions would continue to be contingent on new economic data.
GNMA MBS provided a modest income opportunity over Treasuries as the GNMA current coupon yielded 3.23% at period-end, compared to five- and 10-year Treasuries, which yielded 1.73% and 2.73%.
MBS performance was positive during the period and outperformed similar duration Treasuries. In our view, agency mortgages were fully valued. Investor awareness about the timeline for tapering reduced anxiety. Questions still remained, however, about the demand source for agency MBS after the Fed ends its buying program. We felt demand from banks, mortgage real estate investment trusts, overseas investors and domestic money managers would need to rise to compensate for the Fed s reduced presence in the MBS sector. The recent decline in gross issuance may contribute to tighter spreads, but we believed recent spreads at period-end did not adequately compensate investors for the risks. As interest rates and mortgage rates have moved higher, actual prepayment levels have declined and could, in our opinion, allow investors to keep a greater portion of their income.
Within the agency mortgage pass-through sector, Fannie Mae (FNMA) MBS lagged their Freddie Mac (FHLMC) MBS and GNMA MBS counterparts. Within GNMAs, higher coupon 5.5% and 6.0% securities were the best performers from an excess returns perspective, while lower coupon 3.5% and 4.0% securities underperformed.
Franklin U.S. Government Securities Fund maintains a conservative, disciplined investment strategy and invests entirely in GNMA mortgage pass-throughs, which remain the only MBS that are backed by the full faith and credit of the U.S. government the same guarantee applicable to U.S. Treasuries.1 Our collateral-intensive research approach can allow us to uncover dislocations across the GNMA markets and associated misvaluation of prepayment risk. We continue to focus on specified pools where we believe our experience and continual investment in new technologies help us uncover these discrepancies.
During the period, we were slightly more weighted toward GNMA IIs (pools of mortgages from multiple issuers) than GNMA Is (pools of mortgages from single issuers). Over the period, we added to GNMA II 4.0% coupons while reducing exposure to 3.5% coupons. Our heaviest allocation was in 4.0% through 5.0% coupons. The Fund s overweighted position relative to the benchmark to higher coupon 5.5% to 6.0% GNMA securities benefited performance as did the Fund s underweighting in 3.0% coupon GNMAs, while the Fund s allocation to 4.0% coupon GNMAs generally detracted from performance.
Semiannual Report | 33
Thank you for your continued participation in Franklin U.S. Government Securities Fund. We welcome your comments and questions and look forward to serving your investment needs in the years ahead.

The foregoing information reflects our analysis, opinions and portfolio holdings as of March 31, 2014, the end of the reporting period. The way we implement our main investment strategies and the resulting portfolio holdings may change depending on factors such as market and economic conditions. These opinions may not be relied upon as investment advice or an offer for a particular security. The information is not a complete analysis of every aspect of any market, country, industry, security or the Fund. Statements of fact are from sources considered reliable, but the investment manager makes no representation or warranty as to their completeness or accuracy. Although historical performance is no guarantee of future results, these insights may help you understand our investment management philosophy.
The index is unmanaged and includes reinvestment of any income or distributions. One cannot invest directly in an index, and an index is not representative of the Fund s portfolio.
1. Securities owned by the Fund, but not shares of the Fund, are guaranteed by the U.S. government, its agencies or instrumentalities as to timely payment of principal and interest. The Fund s yield and share price are not guaranteed and will vary with market conditions.
2. Source: Lipper, a Thomson Reuters Company. For the six-month period ended 3/31/14, this category consisted of 67 funds. Lipper calculations do not include sales charges or expense subsidization by a fund s manager. The Fund s performance relative to the average may have differed if these and other factors had been considered.
3. Source: © 2014 Morningstar. All Rights Reserved. The information contained herein: (1) is proprietary to Morningstar and/or its content providers; (2) may not be copied or distributed; and (3) is not warranted to be accurate, complete or timely. Neither Morningstar nor its content providers are responsible for any damages or losses arising from any use of this information.
4. Source: Barclays Global Family of Indices. © 2014 Barclays Capital Inc. Used with permission.
34 | Semiannual Report
Performance Summary as of 3/31/14
Franklin U.S. Government Securities Fund
Your dividend income will vary depending on dividends or interest paid by securities in the Fund s portfolio, adjusted for operating expenses of each class. Capital gain distributions are net profits realized from the sale of portfolio securities. The performance table does not reflect any taxes that a shareholder would pay on Fund dividends, capital gain distributions, if any, or any realized gains on the sale of Fund shares. Total return reflects reinvestment of the Fund s dividends and capital gain distributions, if any, and any unrealized gains or losses.
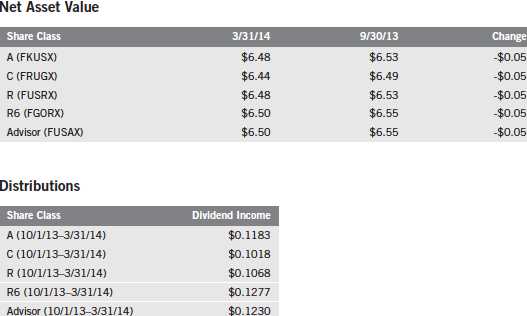
Semiannual Report | 35
Performance Summary (continued)
Performance as of 3/31/141
Cumulative total return excludes sales charges. Average annual total return includes maximum sales charges. Class A: 4.25% maximum initial sales charge; Class C: 1% contingent deferred sales charge in first year only;
Class R/R6/Advisor Class: no sales charges.
| Cumulative | Average Annual | Total Annual | ||||||
| Share Class | Total Return2 | Total Return3 | Operating Expenses4 | |||||
| A | 0.73 | % | ||||||
| 6-Month | + | 1.05 | % | -3.24 | % | |||
| 1-Year | -0.15 | % | -4.41 | % | ||||
| 5-Year | + | 17.66 | % | + | 2.40 | % | ||
| 10-Year | + | 48.81 | % | + | 3.60 | % | ||
| C | 1.23 | % | ||||||
| 6-Month | + | 0.80 | % | -0.19 | % | |||
| 1-Year | -0.66 | % | -1.63 | % | ||||
| 5-Year | + | 14.80 | % | + | 2.80 | % | ||
| 10-Year | + | 41.40 | % | + | 3.53 | % | ||
| R | 1.08 | % | ||||||
| 6-Month | + | 0.87 | % | + | 0.87 | % | ||
| 1-Year | -0.50 | % | -0.50 | % | ||||
| 5-Year | + | 15.74 | % | + | 2.97 | % | ||
| 10-Year | + | 43.50 | % | + | 3.68 | % | ||
| R6 | 0.46 | % | ||||||
| 6-Month | + | 1.19 | % | + | 1.19 | % | ||
| Since Inception (5/1/13)5 | -0.36 | % | -0.36 | % | ||||
| Advisor | 0.58 | % | ||||||
| 6-Month | + | 1.12 | % | + | 1.12 | % | ||
| 1-Year | 0.00 | % | 0.00 | % | ||||
| 5-Year | + | 18.66 | % | + | 3.48 | % | ||
| 10-Year | + | 50.94 | % | + | 4.20 | % |
| Distribution | 30-Day Standardized Yield7 | |||||
| Share Class | Rate6 | (with waiver) | (without waiver) | |||
| A | 3.42 | % | 2.65 | % | 2.65 | % |
| C | 3.07 | % | 2.25 | % | 2.25 | % |
| R | 3.22 | % | 2.41 | % | 2.41 | % |
| R6 | 3.86 | % | 3.07 | % | 3.07 | % |
| Advisor | 3.71 | % | 2.93 | % | 2.93 | % |
Performance data represent past performance, which does not guarantee future results. Investment return and principal value will fluctuate, and you may have a gain or loss when you sell your shares. Current performance may differ from figures shown. For most recent month-end performance, go to franklintempleton.com or call (800) 342-5236.
36 | Semiannual Report
Performance Summary (continued)
All investments involve risks, including possible loss of principal. The Fund s share price and yield will be affected by interest rate movements and mortgage prepayments. Bond prices generally move in the opposite direction of interest rates. Thus, as prices of bonds in the Fund adjust to a rise in interest rates, the Fund s share price may decline. Changes in the financial strength of a bond issuer or in a bond s credit rating may affect its value. The Fund is actively managed but there is no guarantee that the manager s investment decisions will produce the desired results. The Fund s prospectus also includes a description of the main investment risks.
Class C: Class R: | These shares have higher annual fees and expenses than Class A shares. Shares are available to certain eligible investors as described in the prospectus. These shares have higher annual fees and expenses than Class A shares. |
Class R6: Advisor Class: | Shares are available to certain eligible investors as described in the prospectus. Shares are available to certain eligible investors as described in the prospectus. |
1. The Fund has a fee waiver associated with its investments in a Franklin Templeton money fund, contractually guaranteed through at least its current fiscal year-end. Fund investment results reflect the fee waiver, to the extent applicable; without these reductions, the results would have been lower.
2. Cumulative total return represents the change in value of an investment over the periods indicated.
3. Average annual total return represents the average annual change in value of an investment over the periods indicated. Six-month return has not been annualized.
4. Figures are as stated in the Fund s current prospectus. In periods of market volatility, assets may decline significantly, causing total annual Fund operating expenses to become higher than the figures shown.
5. Since Class R6 shares have existed for less than one year, performance is shown for the period since inception and is not annualized.
6. Distribution rate is based on an annualization of the respective class s March dividend and the maximum offering price (NAV for Classes C, R, R6 and Advisor) per share on 3/31/14.
7. The 30-day standardized yield for the 30 days ended 3/31/14 reflects an estimated yield to maturity (assuming all portfolio securities are held to maturity). It should be regarded as an estimate of the Fund s rate of investment income, and it may not equal the Fund s actual income distribution rate (which reflects the Fund s past dividends paid to shareholders) or the income reported in the Fund s financial statements.
Semiannual Report | 37
Your Fund s Expenses
Franklin U.S. Government Securities Fund
As a Fund shareholder, you can incur two types of costs:
- Transaction costs, including sales charges (loads) on Fund purchases; and
- Ongoing Fund costs, including management fees, distribution and service (12b-1) fees, and other Fund expenses. All mutual funds have ongoing costs, sometimes referred to as operating expenses.
The following table shows ongoing costs of investing in the Fund and can help you understand these costs and compare them with those of other mutual funds. The table assumes a $1,000 investment held for the six months indicated.
Actual Fund Expenses
The first line (Actual) for each share class listed in the table provides actual account values and expenses. The Ending Account Value is derived from the Fund s actual return, which includes the effect of Fund expenses.
You can estimate the expenses you paid during the period by following these steps. Of course, your account value and expenses will differ from those in this illustration:
| 1. | Divide your account value by $1,000. |
| If an account had an $8,600 value, then $8,600 ÷ $1,000 = 8.6. | |
| 2. | Multiply the result by the number under the heading Expenses Paid During Period. |
| If Expenses Paid During Period were $7.50, then 8.6 x $7.50 = $64.50. |
In this illustration, the estimated expenses paid this period are $64.50.
Hypothetical Example for Comparison with Other Funds
Information in the second line (Hypothetical) for each class in the table can help you compare ongoing costs of investing in the Fund with those of other mutual funds. This information may not be used to estimate the actual ending account balance or expenses you paid during the period. The hypothetical Ending Account Value is based on the actual expense ratio for each class and an assumed 5% annual rate of return before expenses, which does not represent the Fund s actual return. The figure under the heading Expenses Paid During Period shows the hypothetical expenses your account would have incurred under this scenario. You can compare this figure with the 5% hypothetical examples that appear in shareholder reports of other funds.
38 | Semiannual Report
Your Fund s Expenses (continued)
Please note that expenses shown in the table are meant to highlight ongoing costs and do not reflect any transaction costs, such as sales charges. Therefore, the second line for each class is useful in comparing ongoing costs only, and will not help you compare total costs of owning different funds. In addition, if transaction costs were included, your total costs would have been higher. Please refer to the Fund prospectus for additional information on operating expenses.
| Beginning Account | Ending Account | Expenses Paid During | ||||
| Share Class | Value 10/1/13 | Value 3/31/14 | Period* 10/1/13 3/31/14 | |||
| A | ||||||
| Actual | $ | 1,000 | $ | 1,010.50 | $ | 3.81 |
| Hypothetical (5% return before expenses) | $ | 1,000 | $ | 1,021.14 | $ | 3.83 |
| C | ||||||
| Actual | $ | 1,000 | $ | 1,008.00 | $ | 6.31 |
| Hypothetical (5% return before expenses) | $ | 1,000 | $ | 1,018.65 | $ | 6.34 |
| R | ||||||
| Actual | $ | 1,000 | $ | 1,008.70 | $ | 5.56 |
| Hypothetical (5% return before expenses) | $ | 1,000 | $ | 1,019.40 | $ | 5.59 |
| R6 | ||||||
| Actual | $ | 1,000 | $ | 1,011.90 | $ | 2.36 |
| Hypothetical (5% return before expenses) | $ | 1,000 | $ | 1,022.59 | $ | 2.37 |
| Advisor | ||||||
| Actual | $ | 1,000 | $ | 1,011.20 | $ | 3.06 |
| Hypothetical (5% return before expenses) | $ | 1,000 | $ | 1,021.89 | $ | 3.07 |
*Expenses are calculated using the most recent six-month expense ratio, net of expense waivers, annualized for each class (A: 0.76%; C: 1.26%; R: 1.11%; R6: 0.47%; and Advisor: 0.61%), multiplied by the average account value over the period, multiplied by 182/365 to reflect the one-half year period.
Semiannual Report | 39
Franklin Utilities Fund
Your Fund s Goal and Main Investments: Franklin Utilities Fund seeks both capital appreciation and current income by investing at least 80% of its net assets in public utility company securities.
Performance data represent past performance, which does not guarantee future results. Investment return and principal value will fluctuate, and you may have a gain or loss when you sell your shares. Current performance may differ from figures shown. Please visit franklintempleton.com or call (800) 342-5236 for most recent month-end performance.
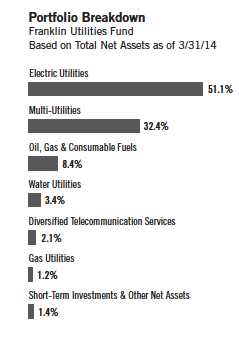
This semiannual report for Franklin Utilities Fund covers the period ended March 31, 2014.
Performance Overview
Franklin Utilities Fund Class A delivered a +12.37% cumulative total return for the six months under review. In comparison, the Standard & Poor s 500 (S&P 500) Index, which is a broad measure of U.S. stock performance, generated a +12.51% total return, and the S&P 500 Utilities Index, which measures the performance of all utilities stocks in the S&P 500 Index, produced a +13.17% total return.1, 2 You can find the Fund s long-term performance data in the Performance Summary beginning on page 43.
Investment Strategy
We search for the best return opportunities available in the global utilities arena with a specific focus on the U.S. electricity and gas sector. Generally, we look for companies producing a high percentage of earnings from regulated utility franchise operations.
Manager s Discussion
For the six months under review, the utilities sector outperformed the S&P 500 Index; however, the energy sector underperformed. Our stock selection in electric utilities and multi-utilities helped the Fund s performance relative to the S&P 500 Utilities Index during the six-month period.3 In contrast, our investments in off-benchmark energy and telecommunication services stocks hindered relative returns.4
Electric utilities led the Fund s notable contributors to absolute performance. Edison International reported healthy earnings for 2013, driven by its Southern California Edison subsidiary s infrastructure investments and operational efficiencies. Edison also issued increased earnings guidance for 2014 based on its
The dollar value, number of shares or principal amount, and names of all portfolio holdings are listed in the Fund s Statement of Investments (SOI). The SOI begins on page 109.
40 | Semiannual Report
expectation of continuing these positive trends. Florida-based utility NextEra Energy, which also is a leading clean energy developer and operator in the U.S. and Canada, accomplished full-year 2013 earnings comparable to those of the prior year. The company also benefited from modernizing its Cape Canaveral plant, strengthening its electric grid against future storms, constructing additional solar power generation and signing new wind power purchase agreements. Shares of American Electric Power rallied resulting from increased 2013 earnings and dividends and reaffirmed 2014 earnings guidance, largely stemming from its investment in core regulated operations, including its transmission business, and from cost savings achieved through sustainable process improvements. Multi-utilities also helped absolute results. Dominion Resources, a supplier of electricity and natural gas to the eastern U.S., reported higher 2013 operating earnings attributable to electric service territory growth and higher revenues resulting from rate adjustments and gas transmission growth projects, as well as lower operations and maintenance expenses. Sempra Energy, owner of electric and natural gas utilities in California and South America as well as natural gas pipelines, storage facilities and terminals in the U.S. and Mexico, reported increased revenue and earnings in 2013 and raised its dividend. Sempra Energy pursued growth by launching an initial public offering for a new energy company in Mexico and planned for the export of liquefied natural gas via Cameron LNG. Electric and gas utility National Grid, which operates electricity and gas transmission in the U.K. and electricity transmission in the northeastern U.S., continued to develop new transmission and generation infrastructure in its regulated utility networks that performed well despite severe winter weather. The company anticipated that its upcoming full fiscal year results would be in line with its goals for good operating performance and sustainable dividend growth.
In contrast, a few Fund holdings declined during the reporting period and hindered absolute Fund performance. Oil and gas transportation company Kinder Morgan, which owns an interest in or operates pipelines and terminals for delivering fuels and other products in the U.S. and Canada, suffered from lower earnings guidance and an investor lawsuit, as well as rumors that one of its publicly traded companies, Kinder Morgan Energy Partners (KMP), understated spending. KMP reported higher earnings, key acquisitions and a Canadian government application to expand pipeline capacity. Kinder Morgan expects KMP s strong performance to help drive growth in 2014. Declining sales and low natural gas prices resulted in falling profits and the first dividend reduction in the 17-year history of FirstEnergy, which owns electricity providers in six eastern states. Increased use of home-generated solar energy by customers, among other factors, led the company to sell power plants, reduce spending and focus on regulated assets that provide more reliable returns than for those selling power to wholesale markets.
Semiannual Report | 41
Thank you for your continued participation in Franklin Utilities Fund.
We look forward to serving your future investment needs.

Portfolio Management Team
Franklin Utilities Fund
The foregoing information reflects our analysis, opinions and portfolio holdings as of March 31, 2014, the end of the reporting period. The way we implement our main investment strategies and the resulting portfolio holdings may change depending on factors such as market and economic conditions. These opinions may not be relied upon as investment advice or an offer for a particular security. The information is not a complete analysis of every aspect of any market, country, industry, security or the Fund. Statements of fact are from sources considered reliable, but the investment manager makes no representation or warranty as to their completeness or accuracy. Although historical performance is no guarantee of future results, these insights may help you understand our investment management philosophy.
The indexes are unmanaged and include reinvested dividends. One cannot invest directly in an index, and an index is not representative of the Fund s portfolio.
1. Source: © 2014 Morningstar. All Rights Reserved. The information contained herein: (1) is proprietary to Morningstar and/or its content providers; (2) may not be copied or distributed; and (3) is not warranted to be accurate, complete or timely. Neither Morningstar nor its content providers are responsible for any damages or losses arising from any use of this information.
2. Copyright © 2014, S&P Dow Jones Indices LLC. All rights reserved. Reproduction of S&P Dow Jones Indices in any form is prohibited except with the prior written permission of S&P. S&P does not guarantee the accuracy, adequacy, completeness or availability of any information and is not responsible for any errors or omissions, regardless of the cause or for the results obtained from the use of such information. S&P DISCLAIMS ANY AND ALL EXPRESS OR IMPLIED WARRANTIES, INCLUDING, BUT NOT LIMITED TO, ANY WARRANTIES OF MERCHANTABILITY OR FITNESS FOR A PARTICULAR PURPOSE OR USE. In no event shall S&P be liable for any direct, indirect, special or consequential damages, costs, expenses, legal fees, or losses (including lost income or lost profit and opportunity costs) in connection with sub-scriber s or others use of S&P index data.
3. The utilities sector comprises electric utilities, gas utilities, multi-utilities and water utilities in the SOI.
4. The energy sector comprises oil, gas and consumable fuels in the SOI. The telecommunication services sector comprises diversified telecommunication services in the SOI.
42 | Semiannual Report
Performance Summary as of 3/31/14
Franklin Utilities Fund
Your dividend income will vary depending on dividends or interest paid by securities in the Fund s portfolio, adjusted for operating expenses of each class. Capital gain distributions are net profits realized from the sale of portfolio securities. The performance table does not reflect any taxes that a shareholder would pay on Fund dividends, capital gain distributions, if any, or any realized gains on the sale of Fund shares. Total return reflects reinvestment of the Fund s dividends and capital gain distributions, if any, and any unrealized gains or losses.
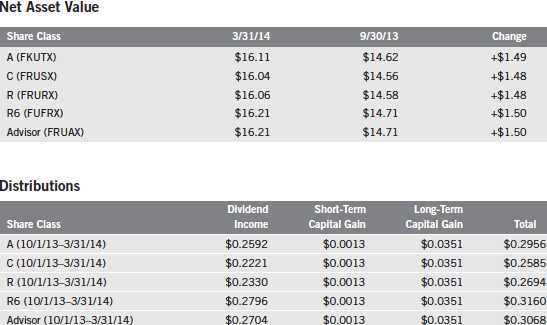
Semiannual Report | 43
Performance Summary (continued)
Performance as of 3/31/141
Cumulative total return excludes sales charges. Average annual total return and value of $10,000 investment include maximum sales charges. Class A: 5.75% maximum initial sales charge; Class C: 1% contingent deferred sales charge in first year only; Class R/R6/Advisor Class: no sales charges.
| Value of | ||||||||||
| Cumulative | Average Annual | $ | 10,000 | Total Annual | ||||||
| Share Class | Total Return2 | Total Return3 | Investment4 | Operating Expenses5 | ||||||
| A | 0.75 | % | ||||||||
| 6-Month | + | 12.37 | % | + | 7.59 | % | $ | 10,759 | ||
| 1-Year | + | 10.39 | % | + | 5.70 | % | $ | 10,570 | ||
| 5-Year | + | 112.20 | % | + | 15.24 | % | $ | 20,323 | ||
| 10-Year | + | 163.92 | % | + | 9.72 | % | $ | 25,282 | ||
| C | 1.25 | % | ||||||||
| 6-Month | + | 12.08 | % | + | 11.08 | % | $ | 11,108 | ||
| 1-Year | + | 9.81 | % | + | 8.81 | % | $ | 10,881 | ||
| 5-Year | + | 106.97 | % | + | 15.66 | % | $ | 20,697 | ||
| 10-Year | + | 150.90 | % | + | 9.64 | % | $ | 25,090 | ||
| R | 1.10 | % | ||||||||
| 6-Month | + | 12.14 | % | + | 12.14 | % | $ | 11,214 | ||
| 1-Year | + | 10.03 | % | + | 10.03 | % | $ | 11,003 | ||
| 5-Year | + | 108.49 | % | + | 15.83 | % | $ | 20,849 | ||
| 10-Year | + | 154.87 | % | + | 9.81 | % | $ | 25,487 | ||
| R6 | 0.48 | % | ||||||||
| 6-Month | + | 12.52 | % | + | 12.52 | % | $ | 11,252 | ||
| Since Inception (5/1/13)6 | + | 6.00 | % | + | 6.00 | % | $ | 10,600 | ||
| Advisor | 0.60 | % | ||||||||
| 6-Month | + | 12.45 | % | + | 12.45 | % | $ | 11,245 | ||
| 1-Year | + | 10.63 | % | + | 10.63 | % | $ | 11,063 | ||
| 5-Year | + | 113.70 | % | + | 16.40 | % | $ | 21,370 | ||
| 10-Year | + | 167.84 | % | + | 10.35 | % | $ | 26,784 |
| Distribution | 30-Day Standardized Yield8 | |||||
| Share Class | Rate7 | (with waiver) | (without waiver) | |||
| A | 2.73 | % | 2.87 | % | 2.87 | % |
| C | 2.40 | % | 2.49 | % | 2.49 | % |
| R | 2.54 | % | 2.64 | % | 2.64 | % |
| R6 | 3.09 | % | 3.26 | % | 3.26 | % |
| Advisor | 2.98 | % | 3.15 | % | 3.15 | % |
Performance data represent past performance, which does not guarantee future results. Investment return and principal value will fluctuate, and you may have a gain or loss when you sell your shares. Current performance may differ from figures shown. For most recent month-end performance, go to franklintempleton.com or call (800) 342-5236.
44 | Semiannual Report
Performance Summary (continued)
All investments involve risks, including possible loss of principal. In addition to being sensitive to other factors, securities issued by utility companies have been historically sensitive to interest rate changes. When interest rates fall, utility securities prices, and thus a utilities fund s share price, tend to rise; when interest rates rise, their prices generally fall. The Fund is actively managed but there is no guarantee that the man-ager s investment decisions will produce the desired results. The Fund s prospectus also includes a description of the main investment risks.
Class C: Class R: | These shares have higher annual fees and expenses than Class A shares. Shares are available to certain eligible investors as described in the prospectus. These shares have higher annual fees and expenses than Class A shares. |
Class R6: | Shares are available to certain eligible investors as described in the prospectus. |
Advisor Class: | Shares are available to certain eligible investors as described in the prospectus. |
1. The Fund has a fee waiver associated with its investments in a Franklin Templeton money fund, contractually guaranteed through at least its current fiscal year-end. Fund investment results reflect the fee waiver, to the extent applicable; without these reductions, the results would have been lower.
2. Cumulative total return represents the change in value of an investment over the periods indicated.
3. Average annual total return represents the average annual change in value of an investment over the periods indicated. Six-month return has not been annualized.
4. These figures represent the value of a hypothetical $10,000 investment in the Fund over the periods indicated.
5. Figures are as stated in the Fund s current prospectus. In periods of market volatility, assets may decline significantly, causing total annual Fund operating expenses to become higher than the figures shown.
6. Since Class R6 shares have existed for less than one year, performance is shown for the period since inception and is not annualized.
7. Distribution rate is based on an annualization of the respective class s current quarterly dividend and the maximum offering price (NAV for Classes C, R, R6 and Advisor) per share on 3/31/14.
8. The 30-day standardized yield for the 30 days ended 3/31/14 reflects an estimated yield to maturity (assuming all portfolio securities are held to maturity). It should be regarded as an estimate of the Fund s rate of investment income, and it may not equal the Fund s actual income distribution rate (which reflects the Fund s past dividends paid to shareholders) or the income reported in the Fund s financial statements.
Semiannual Report | 45
Your Fund s Expenses
Franklin Utilities Fund
As a Fund shareholder, you can incur two types of costs:
- Transaction costs, including sales charges (loads) on Fund purchases; and
- Ongoing Fund costs, including management fees, distribution and service (12b-1) fees, and other Fund expenses. All mutual funds have ongoing costs, sometimes referred to as operating expenses.
The following table shows ongoing costs of investing in the Fund and can help you understand these costs and compare them with those of other mutual funds. The table assumes a $1,000 investment held for the six months indicated.
Actual Fund Expenses
The first line (Actual) for each share class listed in the table provides actual account values and expenses. The Ending Account Value is derived from the Fund s actual return, which includes the effect of Fund expenses.
You can estimate the expenses you paid during the period by following these steps. Of course, your account value and expenses will differ from those in this illustration:
| 1. | Divide your account value by $1,000. |
| If an account had an $8,600 value, then $8,600 ÷ $1,000 = 8.6. | |
| 2. | Multiply the result by the number under the heading Expenses Paid During Period. |
| If Expenses Paid During Period were $7.50, then 8.6 x $7.50 = $64.50. |
In this illustration, the estimated expenses paid this period are $64.50.
Hypothetical Example for Comparison with Other Funds
Information in the second line (Hypothetical) for each class in the table can help you compare ongoing costs of investing in the Fund with those of other mutual funds. This information may not be used to estimate the actual ending account balance or expenses you paid during the period. The hypothetical Ending Account Value is based on the actual expense ratio for each class and an assumed 5% annual rate of return before expenses, which does not represent the Fund s actual return. The figure under the heading Expenses Paid During Period shows the hypothetical expenses your account would have incurred under this scenario. You can compare this figure with the 5% hypothetical examples that appear in shareholder reports of other funds.
46 | Semiannual Report
Your Fund s Expenses (continued)
Please note that expenses shown in the table are meant to highlight ongoing costs and do not reflect any transaction costs, such as sales charges. Therefore, the second line for each class is useful in comparing ongoing costs only, and will not help you compare total costs of owning different funds. In addition, if transaction costs were included, your total costs would have been higher. Please refer to the Fund prospectus for additional information on operating expenses.
| Beginning Account | Ending Account | Expenses Paid During | ||||
| Share Class | Value 10/1/13 | Value 3/31/14 | Period* 10/1/13 3/31/14 | |||
| A | ||||||
| Actual | $ | 1,000 | $ | 1,123.70 | $ | 3.97 |
| Hypothetical (5% return before expenses) | $ | 1,000 | $ | 1,021.19 | $ | 3.78 |
| C | ||||||
| Actual | $ | 1,000 | $ | 1,120.80 | $ | 6.61 |
| Hypothetical (5% return before expenses) | $ | 1,000 | $ | 1,018.70 | $ | 6.29 |
| R | ||||||
| Actual | $ | 1,000 | $ | 1,121.40 | $ | 5.82 |
| Hypothetical (5% return before expenses) | $ | 1,000 | $ | 1,019.45 | $ | 5.54 |
| R6 | ||||||
| Actual | $ | 1,000 | $ | 1,125.20 | $ | 2.54 |
| Hypothetical (5% return before expenses) | $ | 1,000 | $ | 1,022.54 | $ | 2.42 |
| Advisor | ||||||
| Actual | $ | 1,000 | $ | 1,124.50 | $ | 3.18 |
| Hypothetical (5% return before expenses) | $ | 1,000 | $ | 1,021.94 | $ | 3.02 |
*Expenses are calculated using the most recent six-month expense ratio, net of expense waivers, annualized for each class (A: 0.75%; C: 1.25%; R: 1.10%; R6: 0.48%; and Advisor: 0.60%), multiplied by the average account value over the period, multiplied by 182/365 to reflect the one-half year period.
Semiannual Report | 47
| Franklin Custodian Funds | ||||||||||||||||||
| Financial Highlights | ||||||||||||||||||
| Franklin DynaTech Fund | ||||||||||||||||||
| Six Months Ended | ||||||||||||||||||
| March 31, 2014 | Year Ended September 30, | |||||||||||||||||
| Class A | (unaudited) | 2013 | 2012 | 2011 | 2010 | 2009 | ||||||||||||
| Per share operating performance | ||||||||||||||||||
| (for a share outstanding throughout the period) | ||||||||||||||||||
| Net asset value, beginning of period | $ | 42.13 | $ | 34.00 | $ | 27.66 | $ | 27.16 | $ | 23.20 | $ | 24.87 | ||||||
| Income from investment operationsa: | ||||||||||||||||||
| Net investment income (loss)b | (0.11 | ) | (0.12 | ) | (0.11 | ) | (0.14 | ) | (0.11 | ) | (0.06 | ) | ||||||
| Net realized and unrealized gains (losses) | 3.79 | 8.25 | 7.10 | 0.64 | 4.07 | (0.03 | ) | |||||||||||
| Total from investment operations | 3.68 | 8.13 | 6.99 | 0.50 | 3.96 | (0.09 | ) | |||||||||||
| Less distributions from net realized gains | (1.81 | ) | (0.65 | ) | (1.58 | ) | ||||||||||||
| Net asset value, end of period | $ | 44.00 | $ | 42.13 | $ | 34.00 | $ | 27.66 | $ | 27.16 | $ | 23.20 | ||||||
| Total returnc | 8.83 | % | 23.91 | % | 25.59 | % | 1.84 | % | 17.07 | % | 2.71 | % | ||||||
| Ratios to average net assetsd | ||||||||||||||||||
| Expenses | 0.89 | %e,f | 0.94 | % | 0.96 | % | 0.97 | % | 1.03 | % | 1.16 | %f | ||||||
| Net investment income (loss) | (0.47 | )% | (0.34 | )% | (0.35 | )% | (0.46 | )% | (0.44 | )% | (0.34 | )% | ||||||
| Supplemental data | ||||||||||||||||||
| Net assets, end of period (000 s) | $ | 1,410,119 | $ | 1,072,814 | $ | 898,665 | $ | 642,552 | $ | 566,764 | $ | 503,472 | ||||||
| Portfolio turnover rate | 8.61 | % | 35.40 | % | 16.65 | % | 30.11 | % | 31.39 | % | 46.05 | % | ||||||
aThe amount shown for a share outstanding throughout the period may not correlate with the Statement of Operations for the period due to the timing of sales and repurchases of
the Fund shares in relation to income earned and/or fluctuating market value of the investments of the Fund.
bBased on average daily shares outstanding.
cTotal return does not reflect sales commissions or contingent deferred sales charges, if applicable, and is not annualized for periods less than one year.
dRatios are annualized for periods less than one year.
eBenefit of waiver and payments by affiliate rounds to less than 0.01%.
fBenefit of expense reduction rounds to less than 0.01%.
48 | The accompanying notes are an integral part of these financial statements. | Semiannual Report
| Franklin Custodian Funds | ||||||||||||||||||
| Financial Highlights (continued) | ||||||||||||||||||
| Franklin DynaTech Fund | ||||||||||||||||||
| Six Months Ended | ||||||||||||||||||
| March 31, 2014 | Year Ended September 30, | |||||||||||||||||
| Class C | (unaudited) | 2013 | 2012 | 2011 | 2010 | 2009 | ||||||||||||
| Per share operating performance | ||||||||||||||||||
| (for a share outstanding throughout the period) | ||||||||||||||||||
| Net asset value, beginning of period | $ | 37.53 | $ | 30.52 | $ | 25.07 | $ | 24.81 | $ | 21.34 | $ | 23.23 | ||||||
| Income from investment operationsa: | ||||||||||||||||||
| Net investment income (loss)b | (0.24 | ) | (0.35 | ) | (0.32 | ) | (0.34 | ) | (0.28 | ) | (0.19 | ) | ||||||
| Net realized and unrealized gains (losses) | 3.37 | 7.36 | 6.42 | 0.60 | 3.75 | (0.12 | ) | |||||||||||
| Total from investment operations | 3.13 | 7.01 | 6.10 | 0.26 | 3.47 | (0.31 | ) | |||||||||||
| Less distributions from net realized gains | (1.81 | ) | (0.65 | ) | (1.58 | ) | ||||||||||||
| Net asset value, end of period | $ | 38.85 | $ | 37.53 | $ | 30.52 | $ | 25.07 | $ | 24.81 | $ | 21.34 | ||||||
| Total returnc | 8.44 | % | 22.97 | % | 24.67 | % | 1.05 | % | 16.26 | % | 1.89 | % | ||||||
| Ratios to average net assetsd | ||||||||||||||||||
| Expenses | 1.64 | %e,f | 1.69 | % | 1.71 | % | 1.72 | % | 1.78 | % | 1.91 | %f | ||||||
| Net investment income (loss) | (1.22 | )% | (1.09 | )% | (1.10 | )% | (1.21 | )% | (1.19 | )% | (1.09 | )% | ||||||
| Supplemental data | ||||||||||||||||||
| Net assets, end of period (000 s) | $ | 207,019 | $ | 176,556 | $ | 142,903 | $ | 105,707 | $ | 93,927 | $ | 83,435 | ||||||
| Portfolio turnover rate | 8.61 | % | 35.40 | % | 16.65 | % | 30.11 | % | 31.39 | % | 46.05 | % | ||||||
aThe amount shown for a share outstanding throughout the period may not correlate with the Statement of Operations for the period due to the timing of sales and repurchases of
the Fund shares in relation to income earned and/or fluctuating market value of the investments of the Fund.
bBased on average daily shares outstanding.
cTotal return does not reflect sales commissions or contingent deferred sales charges, if applicable, and is not annualized for periods less than one year.
dRatios are annualized for periods less than one year.
eBenefit of waiver and payments by affiliate rounds to less than 0.01%.
fBenefit of expense reduction rounds to less than 0.01%.
Semiannual Report | The accompanying notes are an integral part of these financial statements. | 49
| Franklin Custodian Funds | ||||||||||||||||||
| Financial Highlights (continued) | ||||||||||||||||||
| Franklin DynaTech Fund | ||||||||||||||||||
| Six Months Ended | ||||||||||||||||||
| March 31, 2014 | Year Ended September 30, | |||||||||||||||||
| Class R | (unaudited) | 2013 | 2012 | 2011 | 2010 | 2009 | a | |||||||||||
| Per share operating performance | ||||||||||||||||||
| (for a share outstanding throughout the period) | ||||||||||||||||||
| Net asset value, beginning of period | $ | 41.58 | $ | 33.65 | $ | 27.44 | $ | 27.02 | $ | 23.13 | $ | 15.66 | ||||||
| Income from investment operationsb: | ||||||||||||||||||
| Net investment income (loss)c | (0.16 | ) | (0.21 | ) | (0.19 | ) | (0.22 | ) | (0.17 | ) | (0.09 | ) | ||||||
| Net realized and unrealized gains (losses) | 3.74 | 8.14 | 7.05 | 0.64 | 4.06 | 7.56 | ||||||||||||
| Total from investment operations | 3.58 | 7.93 | 6.86 | 0.42 | 3.89 | 7.47 | ||||||||||||
| Less distributions from net realized gains | (1.81 | ) | (0.65 | ) | ||||||||||||||
| Net asset value, end of period | $ | 43.35 | $ | 41.58 | $ | 33.65 | $ | 27.44 | $ | 27.02 | $ | 23.13 | ||||||
| Total returnd | 8.70 | % | 23.57 | % | 25.32 | % | 1.55 | % | 16.82 | % | 47.70 | % | ||||||
| Ratios to average net assetse | ||||||||||||||||||
| Expenses | 1.14 | %f,g | 1.19 | % | 1.21 | % | 1.22 | % | 1.28 | % | 1.41 | %g | ||||||
| Net investment income (loss) | (0.72 | )% | (0.59 | )% | (0.60 | )% | (0.71 | )% | (0.69 | )% | (0.59 | )% | ||||||
| Supplemental data | ||||||||||||||||||
| Net assets, end of period (000 s) | $ | 43,845 | $ | 41,825 | $ | 33,338 | $ | 11,100 | $ | 7,034 | $ | 6,345 | ||||||
| Portfolio turnover rate | 8.61 | % | 35.40 | % | 16.65 | % | 30.11 | % | 31.39 | % | 46.05 | % | ||||||
aFor the period December 1, 2008 (effective date) to September 30, 2009.
bThe amount shown for a share outstanding throughout the period may not correlate with the Statement of Operations for the period due to the timing of sales and repurchases of
the Fund shares in relation to income earned and/or fluctuating market value of the investments of the Fund.
cBased on average daily shares outstanding.
dTotal return is not annualized for periods less than one year.
eRatios are annualized for periods less than one year.
fBenefit of waiver and payments by affiliate rounds to less than 0.01%.
gBenefit of expense reduction rounds to less than 0.01%.
50 | The accompanying notes are an integral part of these financial statements. | Semiannual Report
| Franklin Custodian Funds | ||||||
| Financial Highlights (continued) | ||||||
| Franklin DynaTech Fund | ||||||
| Six Months Ended | Period Ended | |||||
| March 31, 2014 | September 30, | |||||
| Class R6 | (unaudited) | 2013 | a | |||
| Per share operating performance | ||||||
| (for a share outstanding throughout the period) | ||||||
| Net asset value, beginning of period | $ | 42.74 | $ | 36.56 | ||
| Income from investment operationsb: | ||||||
| Net investment income (loss)c | (0.02 | ) | 0.01 | |||
| Net realized and unrealized gains (losses) | 3.85 | 6.17 | ||||
| Total from investment operations | 3.83 | 6.18 | ||||
| Less distributions from net realized gains | (1.81 | ) | ||||
| Net asset value, end of period | $ | 44.76 | $ | 42.74 | ||
| Total returnd | 9.06 | % | 16.90 | % | ||
| Ratios to average net assetse | ||||||
| Expenses | 0.49 | %f,g | 0.52 | % | ||
| Net investment income (loss) | (0.07 | )% | 0.08 | % | ||
| Supplemental data | ||||||
| Net assets, end of period (000 s) | $ | 338,945 | $ | 317,315 | ||
| Portfolio turnover rate | 8.61 | % | 35.40 | % | ||
aFor the period May 1, 2013 (effective date) to September 30, 2013.
bThe amount shown for a share outstanding throughout the period may not correlate with the Statement of Operations for the period due to the timing of sales and repurchases of
the Fund shares in relation to income earned and/or fluctuating market value of the investments of the Fund.
cBased on average daily shares outstanding.
dTotal return is not annualized for periods less than one year.
eRatios are annualized for periods less than one year.
fBenefit of waiver and payments by affiliate rounds to less than 0.01%.
gBenefit of expense reduction rounds to less than 0.01%.
Semiannual Report | The accompanying notes are an integral part of these financial statements. | 51
| Franklin Custodian Funds | ||||||||||||||||||
| Financial Highlights (continued) | ||||||||||||||||||
| Franklin DynaTech Fund | ||||||||||||||||||
| Six Months Ended | ||||||||||||||||||
| March 31, 2014 | Year Ended September 30, | |||||||||||||||||
| Advisor Class | (unaudited) | 2013 | 2012 | 2011 | 2010 | 2009 | ||||||||||||
| Per share operating performance | ||||||||||||||||||
| (for a share outstanding throughout the period) | ||||||||||||||||||
| Net asset value, beginning of period | $ | 42.71 | $ | 34.39 | $ | 27.89 | $ | 27.33 | $ | 23.28 | $ | 24.90 | ||||||
| Income from investment operationsa: | ||||||||||||||||||
| Net investment income (loss)b | (0.05 | ) | (0.03 | ) | (0.03 | ) | (0.06 | ) | (0.05 | ) | (0.02 | ) | ||||||
| Net realized and unrealized gains (losses) | 3.84 | 8.35 | 7.18 | 0.62 | 4.10 | (0.02 | ) | |||||||||||
| Total from investment operations | 3.79 | 8.32 | 7.15 | 0.56 | 4.05 | (0.04 | ) | |||||||||||
| Less distributions from net realized gains | (1.81 | ) | (0.65 | ) | (1.58 | ) | ||||||||||||
| Net asset value, end of period | $ | 44.69 | $ | 42.71 | $ | 34.39 | $ | 27.89 | $ | 27.33 | $ | 23.28 | ||||||
| Total returnc | 8.97 | % | 24.19 | % | 25.96 | % | 2.05 | % | 17.40 | % | 2.92 | % | ||||||
| Ratios to average net assetsd | ||||||||||||||||||
| Expenses | 0.64 | %e,f | 0.69 | % | 0.71 | % | 0.72 | % | 0.78 | % | 0.91 | %f | ||||||
| Net investment income (loss) | (0.22 | )% | (0.09 | )% | (0.10 | )% | (0.21 | )% | (0.19 | )% | (0.09 | )% | ||||||
| Supplemental data | ||||||||||||||||||
| Net assets, end of period (000 s) | $ | 155,093 | $ | 122,287 | $ | 260,012 | $ | 102,221 | $ | 11,541 | $ | 8,208 | ||||||
| Portfolio turnover rate | 8.61 | % | 35.40 | % | 16.65 | % | 30.11 | % | 31.39 | % | 46.05 | % | ||||||
aThe amount shown for a share outstanding throughout the period may not correlate with the Statement of Operations for the period due to the timing of sales and repurchases of
the Fund shares in relation to income earned and/or fluctuating market value of the investments of the Fund.
bBased on average daily shares outstanding.
cTotal return is not annualized for periods less than one year.
dRatios are annualized for periods less than one year.
eBenefit of waiver and payments by affiliate rounds to less than 0.01%.
fBenefit of expense reduction rounds to less than 0.01%.
52 | The accompanying notes are an integral part of these financial statements. | Semiannual Report
| Franklin Custodian Funds | ||||
| Statement of Investments, March 31, 2014 (unaudited) | ||||
| Franklin DynaTech Fund | Country | Shares | Value | |
| Common Stocks 96.8% | ||||
| Aerospace & Defense 2.2% | ||||
| The Boeing Co. | United States | 150,000 | $ | 18,823,500 |
| Precision Castparts Corp. | United States | 110,000 | 27,803,600 | |
| 46,627,100 | ||||
| Air Freight & Logistics 0.6% | ||||
| FedEx Corp. | United States | 100,000 | 13,256,000 | |
| Biotechnology 8.8% | ||||
| aAlnylam Pharmaceuticals Inc. | United States | 150,000 | 10,071,000 | |
| Amgen Inc. | United States | 150,000 | 18,501,000 | |
| aBiogen Idec Inc. | United States | 150,000 | 45,880,500 | |
| aCelgene Corp. | United States | 175,000 | 24,430,000 | |
| aCelldex Therapeutics Inc. | United States | 350,000 | 6,184,500 | |
| aGilead Sciences Inc. | United States | 500,000 | 35,430,000 | |
| aIncyte Corp. | United States | 200,000 | 10,704,000 | |
| aKaryopharm Therapeutics Inc. | United States | 20,000 | 617,800 | |
| aMedivation Inc. | United States | 400,000 | 25,748,000 | |
| aRegeneron Pharmaceuticals Inc. | United States | 40,000 | 12,011,200 | |
| 189,578,000 | ||||
| Capital Markets 1.2% | ||||
| The Charles Schwab Corp. | United States | 350,000 | 9,565,500 | |
| Financial Engines Inc. | United States | 200,000 | 10,156,000 | |
| The Goldman Sachs Group Inc. | United States | 35,000 | 5,734,750 | |
| 25,456,250 | ||||
| Chemicals 3.0% | ||||
| Cytec Industries Inc. | United States | 200,000 | 19,522,000 | |
| Monsanto Co. | United States | 200,000 | 22,754,000 | |
| Sigma-Aldrich Corp. | United States | 250,000 | 23,345,000 | |
| 65,621,000 | ||||
| Commercial Services & Supplies 0.5% | ||||
| aStericycle Inc. | United States | 100,000 | 11,362,000 | |
| Communications Equipment 1.4% | ||||
| aPalo Alto Networks Inc. | United States | 200,000 | 13,720,000 | |
| QUALCOMM Inc. | United States | 200,000 | 15,772,000 | |
| 29,492,000 | ||||
| Diversified Consumer Services 0.1% | ||||
| a2U Inc. | United States | 116,400 | 1,588,860 | |
| Diversified Financial Services 2.3% | ||||
| IntercontinentalExchange Group Inc. | United States | 100,000 | 19,783,000 | |
| Investment AB Kinnevik, B | Sweden | 250,000 | 9,232,362 | |
| Moody s Corp. | United States | 250,000 | 19,830,000 | |
| 48,845,362 | ||||
| Electrical Equipment 0.1% | ||||
| Acuity Brands Inc. | United States | 10,000 | 1,325,700 | |
Semiannual Report | 53
| Franklin Custodian Funds | ||||
| Statement of Investments, March 31, 2014 (unaudited) (continued) | ||||
| Franklin DynaTech Fund | Country | Shares | Value | |
| Common Stocks (continued) | ||||
| Electronic Equipment, Instruments & Components 0.9% | ||||
| aCognex Corp. | United States | 200,000 | $ | 6,772,000 |
| aTrimble Navigation Ltd. | United States | 300,000 | 11,661,000 | |
| 18,433,000 | ||||
| Energy Equipment & Services 5.3% | ||||
| Core Laboratories NV | United States | 70,000 | 13,890,800 | |
| aFMC Technologies Inc. | United States | 500,000 | 26,145,000 | |
| aForum Energy Technologies Inc. | United States | 250,000 | 7,745,000 | |
| National Oilwell Varco Inc. | United States | 200,000 | 15,574,000 | |
| Oceaneering International Inc. | United States | 300,000 | 21,558,000 | |
| Schlumberger Ltd. | United States | 300,000 | 29,250,000 | |
| 114,162,800 | ||||
| Health Care Equipment & Supplies 2.5% | ||||
| Abbott Laboratories | United States | 350,000 | 13,478,500 | |
| aDexCom Inc. | United States | 350,000 | 14,476,000 | |
| aEdwards Lifesciences Corp. | United States | 100,000 | 7,417,000 | |
| aHeartWare International Inc. | United States | 100,000 | 9,378,000 | |
| Stryker Corp. | United States | 100,000 | 8,147,000 | |
| 52,896,500 | ||||
| Health Care Providers & Services 2.4% | ||||
| aExpress Scripts Holding Co. | United States | 80,000 | 6,007,200 | |
| McKesson Corp. | United States | 200,000 | 35,314,000 | |
| UnitedHealth Group Inc. | United States | 130,000 | 10,658,700 | |
| 51,979,900 | ||||
| Health Care Technology 3.1% | ||||
| aathenahealth Inc. | United States | 200,000 | 32,048,000 | |
| aCastlight Health Inc., Series B | United States | 44,000 | 933,680 | |
| aCerner Corp. | United States | 550,000 | 30,937,500 | |
| aVeeva Systems Inc. | United States | 150,000 | 4,005,000 | |
| 67,924,180 | ||||
| Hotels, Restaurants & Leisure 0.4% | ||||
| Wynn Resorts Ltd. | United States | 40,000 | 8,886,000 | |
| Insurance 0.5% | ||||
| aeHealth Inc. | United States | 200,000 | 10,160,000 | |
| Internet & Catalog Retail 6.5% | ||||
| aAmazon.com Inc. | United States | 140,000 | 47,112,800 | |
| aCoupons.com Inc. | United States | 26,000 | 640,900 | |
| aHomeAway Inc. | United States | 400,000 | 15,068,000 | |
| aLiberty Ventures, A | United States | 150,000 | 19,549,500 | |
| aNetflix Inc. | United States | 55,000 | 19,361,650 | |
| aPriceline.com Inc. | United States | 30,000 | 35,756,700 | |
| aQunar Cayman Islands Ltd., ADR | China | 23,800 | 728,042 | |
| aZulily Inc. | United States | 50,000 | 2,509,500 | |
| 140,727,092 | ||||
54 | Semiannual Report
Franklin Custodian Funds
Statement of Investments, March 31, 2014 (unaudited) (continued)
| Franklin DynaTech Fund | Country | Shares | Value | |
| Common Stocks (continued) | ||||
| Internet Software & Services 14.6% | ||||
| aAutohome Inc., ADR | China | 100,000 | $ | 3,841,000 |
| aBaidu Inc., ADR | China | 100,000 | 15,238,000 | |
| aBorderfree Inc. | United States | 53,100 | 989,784 | |
| aCare.com Inc. | United States | 100,000 | 1,655,000 | |
| aCornerstone OnDemand Inc. | United States | 200,000 | 9,574,000 | |
| aDemandware Inc. | United States | 300,000 | 19,218,000 | |
| aeBay Inc. | United States | 200,000 | 11,048,000 | |
| aFacebook Inc., A | United States | 500,000 | 30,120,000 | |
| aGoogle Inc., A | United States | 60,000 | 66,870,600 | |
| aLinkedIn Corp., A | United States | 130,000 | 24,042,200 | |
| MercadoLibre Inc. | Argentina | 100,000 | 9,511,000 | |
| Naver Corp. | South Korea | 20,000 | 14,536,576 | |
| aQ2 Holdings Inc. | United States | 65,500 | 1,017,215 | |
| aQihoo 360 Technologies Co. Ltd., ADR | China | 200,000 | 19,916,000 | |
| Tencent Holdings Ltd. | China | 500,000 | 34,777,508 | |
| aTwitter Inc. | United States | 100,000 | 4,667,000 | |
| aYahoo! Inc. | United States | 500,000 | 17,950,000 | |
| aYandex NV, A | Russia | 250,000 | 7,547,500 | |
| aYelp Inc. | United States | 300,000 | 23,079,000 | |
| 315,598,383 | ||||
| IT Services 4.5% | ||||
| MasterCard Inc., A | United States | 650,000 | 48,555,000 | |
| Visa Inc., A | United States | 225,000 | 48,568,500 | |
| 97,123,500 | ||||
| Life Sciences Tools & Services 3.3% | ||||
| aFluidigm Corp. | United States | 100,000 | 4,407,000 | |
| aIllumina Inc. | United States | 200,000 | 29,732,000 | |
| Thermo Fisher Scientific Inc. | United States | 200,000 | 24,048,000 | |
| aWaters Corp. | United States | 130,000 | 14,093,300 | |
| 72,280,300 | ||||
| Machinery 1.1% | ||||
| Flowserve Corp. | United States | 300,000 | 23,502,000 | |
| Media 1.5% | ||||
| aLiberty Media Corp., A | United States | 160,000 | 20,916,800 | |
| aStarz, A | United States | 350,000 | 11,298,000 | |
| 32,214,800 | ||||
| Oil, Gas & Consumable Fuels 2.6% | ||||
| Anadarko Petroleum Corp. | United States | 200,000 | 16,952,000 | |
| Noble Energy Inc. | United States | 300,000 | 21,312,000 | |
| Pioneer Natural Resources Co. | United States | 100,000 | 18,714,000 | |
| 56,978,000 | ||||
| Pharmaceuticals 6.1% | ||||
| AbbVie Inc. | United States | 350,000 | 17,990,000 | |
| aActavis PLC | United States | 250,000 | 51,462,500 | |
| Allergan Inc. | United States | 200,000 | 24,820,000 | |
| Semiannual Report | 55 | ||||
| Franklin Custodian Funds | ||||
| Statement of Investments, March 31, 2014 (unaudited) (continued) | ||||
| Franklin DynaTech Fund | Country | Shares | Value | |
| Common Stocks (continued) | ||||
| Pharmaceuticals (continued) | ||||
| Bristol-Myers Squibb Co. | United States | 50,000 | $ | 2,597,500 |
| Perrigo Co. PLC | United States | 140,000 | 21,652,400 | |
| aValeant Pharmaceuticals International Inc. | Canada | 100,000 | 13,157,228 | |
| 131,679,628 | ||||
| Professional Services 0.5% | ||||
| aThe Advisory Board Co. | United States | 150,000 | 9,637,500 | |
| aPaylocity Holding Corp. | United States | 37,000 | 889,850 | |
| 10,527,350 | ||||
| Real Estate Investment Trusts (REITs) 0.9% | ||||
| American Tower Corp. | United States | 250,000 | 20,467,500 | |
| Semiconductors & Semiconductor Equipment 4.8% | ||||
| ARM Holdings PLC, ADR | United Kingdom | 750,000 | 38,227,500 | |
| ASML Holding NV, N.Y. shs | Netherlands | 200,000 | 18,672,000 | |
| Intel Corp. | United States | 900,000 | 23,229,000 | |
| aLam Research Corp. | United States | 300,000 | 16,500,000 | |
| Power Integrations Inc. | United States | 100,000 | 6,578,000 | |
| 103,206,500 | ||||
| Software 11.0% | ||||
| Activision Blizzard Inc. | United States | 50,000 | 1,022,000 | |
| aANSYS Inc. | United States | 200,000 | 15,404,000 | |
| aAspen Technology Inc. | United States | 500,000 | 21,180,000 | |
| aConcur Technologies Inc. | United States | 200,000 | 19,814,000 | |
| aFireEye Inc. | United States | 50,000 | 3,078,500 | |
| aGuidewire Software Inc. | United States | 300,000 | 14,715,000 | |
| aImperva Inc. | United States | 200,000 | 11,140,000 | |
| aNetSuite Inc. | United States | 300,000 | 28,449,000 | |
| aSalesforce.com Inc. | United States | 400,000 | 22,836,000 | |
| aServiceNow Inc. | United States | 500,000 | 29,960,000 | |
| aSplunk Inc. | United States | 350,000 | 25,021,500 | |
| aTableau Software Inc. | United States | 50,000 | 3,804,000 | |
| aUltimate Software Group Inc. | United States | 100,000 | 13,700,000 | |
| aVaronis Systems Inc. | United States | 50,000 | 1,788,000 | |
| aVMware Inc., A | United States | 20,000 | 2,160,400 | |
| aWorkday Inc. | United States | 250,000 | 22,857,500 | |
| 236,929,900 | ||||
| Technology Hardware, Storage & Peripherals 2.2% | ||||
| Apple Inc. | United States | 70,000 | 37,571,800 | |
| aStratasys Ltd. | United States | 100,000 | 10,609,000 | |
| 48,180,800 | ||||
| Textiles, Apparel & Luxury Goods 0.9% | ||||
| NIKE Inc., B | United States | 250,000 | 18,465,000 | |
| Trading Companies & Distributors 0.2% | ||||
| Fastenal Co. | United States | 100,000 | 4,932,000 | |
56 | Semiannual Report
| Franklin Custodian Funds | ||||
| Statement of Investments, March 31, 2014 (unaudited) (continued) | ||||
| Franklin DynaTech Fund | Country | Shares | Value | |
| Common Stocks (continued) | ||||
| Wireless Telecommunication Services 0.8% | ||||
| aSBA Communications Corp. | United States | 100,000 | $ | 9,096,000 |
| SoftBank Corp. | Japan | 100,000 | 7,556,675 | |
| 16,652,675 | ||||
| Total Common Stocks (Cost $1,193,412,034) | 2,087,060,080 | |||
| Short Term Investments (Cost $57,914,104) 2.7% | ||||
| Money Market Funds 2.7% | ||||
| a,bInstitutional Fiduciary Trust Money Market Portfolio | United States | 57,914,104 | 57,914,104 | |
| Total Investments (Cost $1,251,326,138) 99.5% | 2,144,974,184 | |||
| Other Assets, less Liabilities 0.5% | 10,046,801 | |||
| Net Assets 100.0% | $ | 2,155,020,985 | ||
See Abbreviations on page 145.
aNon-income producing.
bSee Note 3(f) regarding investments in the Institutional Fiduciary Trust Money Market Portfolio.
Semiannual Report | The accompanying notes are an integral part of these financial statements. | 57
| Franklin Custodian Funds | ||||||||||||||||||
| Financial Highlights | ||||||||||||||||||
| Franklin Growth Fund | ||||||||||||||||||
| Six Months Ended | ||||||||||||||||||
| March 31, 2014 | Year Ended September 30, | |||||||||||||||||
| Class A | (unaudited) | 2013 | 2012 | 2011 | 2010 | 2009 | ||||||||||||
| Per share operating performance | ||||||||||||||||||
| (for a share outstanding throughout | ||||||||||||||||||
| the period) | ||||||||||||||||||
| Net asset value, beginning of period | $ | 59.49 | $ | 50.13 | $ | 40.45 | $ | 41.11 | $ | 36.48 | $ | 37.17 | ||||||
| Income from investment operationsa: | ||||||||||||||||||
| Net investment incomeb | 0.13 | 0.26 | 0.20 | 0.19 | 0.20 | 0.29 | ||||||||||||
| Net realized and unrealized gains | ||||||||||||||||||
| (losses) | 7.36 | 9.24 | 9.76 | (0.67 | ) | 4.71 | (0.67 | ) | ||||||||||
| Total from investment operations | 7.49 | 9.50 | 9.96 | (0.48 | ) | 4.91 | (0.38 | ) | ||||||||||
| Less distributions from: | ||||||||||||||||||
| Net investment income | (0.30 | ) | (0.14 | ) | (0.16 | ) | (0.18 | ) | (0.28 | ) | (0.31 | ) | ||||||
| Net realized gains | (0.12 | ) | ||||||||||||||||
| Total distributions | (0.30 | ) | (0.14 | ) | (0.28 | ) | (0.18 | ) | (0.28 | ) | (0.31 | ) | ||||||
| Net asset value, end of period | $ | 66.68 | $ | 59.49 | $ | 50.13 | $ | 40.45 | $ | 41.11 | $ | 36.48 | ||||||
| Total returnc | 12.61 | % | 19.01 | % | 24.74 | % | (1.23 | )% | 13.52 | % | (0.71 | )% | ||||||
| Ratios to average net assetsd | ||||||||||||||||||
| Expenses | 0.89 | %e,f | 0.91 | %f | 0.94 | % | 0.92 | % | 0.94 | % | 1.00 | %f | ||||||
| Net investment income | 0.40 | % | 0.49 | % | 0.43 | % | 0.42 | % | 0.50 | % | 0.95 | % | ||||||
| Supplemental data | ||||||||||||||||||
| Net assets, end of period (000 s) | $ | 6,267,655 | $ | 5,305,031 | $ | 4,135,962 | $ | 3,046,277 | $ | 2,587,802 | $ | 2,173,714 | ||||||
| Portfolio turnover rate | 0.67 | % | 0.83 | % | 3.50 | % | 2.72 | % | 4.36 | % | 3.92 | % | ||||||
aThe amount shown for a share outstanding throughout the period may not correlate with the Statement of Operations for the period due to the timing of sales and repurchases of
the Fund shares in relation to income earned and/or fluctuating market value of the investments of the Fund.
bBased on average daily shares outstanding.
cTotal return does not reflect sales commissions or contingent deferred sales charges, if applicable, and is not annualized for periods less than one year.
dRatios are annualized for periods less than one year.
eBenefit of waiver and payments by affiliate rounds to less than 0.01%.
fBenefit of expense reduction rounds to less than 0.01%.
58 | The accompanying notes are an integral part of these financial statements. | Semiannual Report
| Franklin Custodian Funds | ||||||||||||||||||
| Financial Highlights (continued) | ||||||||||||||||||
| Franklin Growth Fund | ||||||||||||||||||
| Six Months Ended | ||||||||||||||||||
| March 31, 2014 | Year Ended September 30, | |||||||||||||||||
| Class C | (unaudited) | 2013 | 2012 | 2011 | 2010 | 2009 | ||||||||||||
| Per share operating performance | ||||||||||||||||||
| (for a share outstanding throughout the period) | ||||||||||||||||||
| Net asset value, beginning of period | $ | 55.64 | $ | 47.10 | $ | 38.16 | $ | 38.92 | $ | 34.61 | $ | 35.14 | ||||||
| Income from investment operationsa: | ||||||||||||||||||
| Net investment income (loss)b | (0.10 | ) | (0.13 | ) | (0.14 | ) | (0.14 | ) | (0.09 | ) | 0.06 | |||||||
| Net realized and unrealized gains (losses) | 6.87 | 8.67 | 9.20 | (0.62 | ) | 4.47 | (0.57 | ) | ||||||||||
| Total from investment operations | 6.77 | 8.54 | 9.06 | (0.76 | ) | 4.38 | (0.51 | ) | ||||||||||
| Less distributions from: | ||||||||||||||||||
| Net investment income | (0.07 | ) | (0.02 | ) | ||||||||||||||
| Net realized gains | (0.12 | ) | ||||||||||||||||
| Total distributions | (0.12 | ) | (0.07 | ) | (0.02 | ) | ||||||||||||
| Net asset value, end of period | $ | 62.41 | $ | 55.64 | $ | 47.10 | $ | 38.16 | $ | 38.92 | $ | 34.61 | ||||||
| Total returnc | 12.17 | % | 18.13 | % | 23.79 | % | (1.95 | )% | 12.69 | % | (1.45 | )% | ||||||
| Ratios to average net assetsd | ||||||||||||||||||
| Expenses | 1.64 | %e,f | 1.66 | %f | 1.69 | % | 1.67 | % | 1.69 | % | 1.75 | %f | ||||||
| Net investment income (loss) | (0.35 | )% | (0.26 | )% | (0.32 | )% | (0.33 | )% | (0.25 | )% | 0.20 | % | ||||||
| Supplemental data | ||||||||||||||||||
| Net assets, end of period (000 s) | $ | 622,309 | $ | 546,505 | $ | 466,205 | $ | 390,171 | $ | 349,188 | $ | 315,305 | ||||||
| Portfolio turnover rate | 0.67 | % | 0.83 | % | 3.50 | % | 2.72 | % | 4.36 | % | 3.92 | % | ||||||
aThe amount shown for a share outstanding throughout the period may not correlate with the Statement of Operations for the period due to the timing of sales and repurchases of
the Fund shares in relation to income earned and/or fluctuating market value of the investments of the Fund.
bBased on average daily shares outstanding.
cTotal return does not reflect sales commissions or contingent deferred sales charges, if applicable, and is not annualized for periods less than one year.
dRatios are annualized for periods less than one year.
eBenefit of waiver and payments by affiliate rounds to less than 0.01%.
fBenefit of expense reduction rounds to less than 0.01%.
Semiannual Report | The accompanying notes are an integral part of these financial statements. | 59
| Franklin Custodian Funds | ||||||||||||||||||
| Financial Highlights (continued) | ||||||||||||||||||
| Franklin Growth Fund | ||||||||||||||||||
| Six Months Ended | ||||||||||||||||||
| March 31, 2014 | Year Ended September 30, | |||||||||||||||||
| Class R | (unaudited) | 2013 | 2012 | 2011 | 2010 | 2009 | ||||||||||||
| Per share operating performance | ||||||||||||||||||
| (for a share outstanding throughout the period) | ||||||||||||||||||
| Net asset value, beginning of period | $ | 59.07 | $ | 49.82 | $ | 40.23 | $ | 40.94 | $ | 36.37 | $ | 36.87 | ||||||
| Income from investment operationsa: | ||||||||||||||||||
| Net investment incomeb | 0.05 | 0.13 | 0.08 | 0.06 | 0.08 | 0.20 | ||||||||||||
| Net realized and unrealized gains (losses) | 7.32 | 9.18 | 9.71 | (0.65 | ) | 4.72 | (0.59 | ) | ||||||||||
| Total from investment operations | 7.37 | 9.31 | 9.79 | (0.59 | ) | 4.80 | (0.39 | ) | ||||||||||
| Less distributions from: | ||||||||||||||||||
| Net investment income | (0.10 | ) | (0.06 | ) | (0.08 | ) | (0.12 | ) | (0.23 | ) | (0.11 | ) | ||||||
| Net realized gains | (0.12 | ) | ||||||||||||||||
| Total distributions | (0.10 | ) | (0.06 | ) | (0.20 | ) | (0.12 | ) | (0.23 | ) | (0.11 | ) | ||||||
| Net asset value, end of period | $ | 66.34 | $ | 59.07 | $ | 49.82 | $ | 40.23 | $ | 40.94 | $ | 36.37 | ||||||
| Total returnc | 12.48 | % | 18.71 | % | 24.42 | % | (1.47 | )% | 13.26 | % | (0.98 | )% | ||||||
| Ratios to average net assetsd | ||||||||||||||||||
| Expenses | 1.14 | %e,f | 1.16 | %f | 1.19 | % | 1.17 | % | 1.19 | % | 1.25 | %f | ||||||
| Net investment income | 0.15 | % | 0.24 | % | 0.18 | % | 0.17 | % | 0.25 | % | 0.70 | % | ||||||
| Supplemental data | ||||||||||||||||||
| Net assets, end of period (000 s) | $ | 567,140 | $ | 552,391 | $ | 466,954 | $ | 283,464 | $ | 117,484 | $ | 65,113 | ||||||
| Portfolio turnover rate | 0.67 | % | 0.83 | % | 3.50 | % | 2.72 | % | 4.36 | % | 3.92 | % | ||||||
aThe amount shown for a share outstanding throughout the period may not correlate with the Statement of Operations for the period due to the timing of sales and repurchases of
the Fund shares in relation to income earned and/or fluctuating market value of the investments of the Fund.
bBased on average daily shares outstanding.
cTotal return is not annualized for periods less than one year.
dRatios are annualized for periods less than one year.
eBenefit of waiver and payments by affiliate rounds to less than 0.01%.
fBenefit of expense reduction rounds to less than 0.01%.
60 | The accompanying notes are an integral part of these financial statements. | Semiannual Report
| Franklin Custodian Funds | ||||||
| Financial Highlights (continued) | ||||||
| Franklin Growth Fund | ||||||
| Six Months Ended | Period Ended | |||||
| March 31, 2014 | September 30, | |||||
| Class R6 | (unaudited) | 2013 | a | |||
| Per share operating performance | ||||||
| (for a share outstanding throughout the period) | ||||||
| Net asset value, beginning of period | $ | 59.71 | $ | 54.58 | ||
| Income from investment operationsb: | ||||||
| Net investment incomec | 0.26 | 0.24 | ||||
| Net realized and unrealized gains (losses) | 7.38 | 4.89 | ||||
| Total from investment operations | 7.64 | 5.13 | ||||
| Less distributions from net investment income | (0.58 | ) | ||||
| Net asset value, end of period | $ | 66.77 | $ | 59.71 | ||
| Total returnd | 12.84 | % | 9.40 | % | ||
| Ratios to average net assetse | ||||||
| Expensesf | 0.47 | %g | 0.48 | % | ||
| Net investment income | 0.82 | % | 0.92 | % | ||
| Supplemental data | ||||||
| Net assets, end of period (000 s) | $ | 1,031,320 | $ | 871,260 | ||
| Portfolio turnover rate | 0.67 | % | 0.83 | % | ||
aFor the period May 1, 2013 (effective date) to September 30, 2013.
bThe amount shown for a share outstanding throughout the period may not correlate with the Statement of Operations for the period due to the timing of sales and repurchases of
the Fund shares in relation to income earned and/or fluctuating market value of the investments of the Fund.
cBased on average daily shares outstanding.
dTotal return is not annualized for periods less than one year.
eRatios are annualized for periods less than one year.
fBenefit of expense reduction rounds to less than 0.01%.
gBenefit of waiver and payments by affiliate rounds to less than 0.01%.
Semiannual Report | The accompanying notes are an integral part of these financial statements. | 61
| Franklin Custodian Funds | ||||||||||||||||||
| Financial Highlights (continued) | ||||||||||||||||||
| Franklin Growth Fund | ||||||||||||||||||
| Six Months Ended | ||||||||||||||||||
| March 31, 2014 | Year Ended September 30, | |||||||||||||||||
| Advisor Class | (unaudited) | 2013 | 2012 | 2011 | 2010 | 2009 | ||||||||||||
| Per share operating performance | ||||||||||||||||||
| (for a share outstanding throughout the period) | ||||||||||||||||||
| Net asset value, beginning of period | $ | 59.66 | $ | 50.24 | $ | 40.53 | $ | 41.18 | $ | 36.53 | $ | 37.25 | ||||||
| Income from investment operationsa: | ||||||||||||||||||
| Net investment incomeb | 0.21 | 0.39 | 0.32 | 0.30 | 0.29 | 0.36 | ||||||||||||
| Net realized and unrealized gains (losses) | 7.38 | 9.26 | 9.78 | (0.68 | ) | 4.72 | (0.68 | ) | ||||||||||
| Total from investment operations | 7.59 | 9.65 | 10.10 | (0.38 | ) | 5.01 | (0.32 | ) | ||||||||||
| Less distributions from: | ||||||||||||||||||
| Net investment income | (0.42 | ) | (0.23 | ) | (0.27 | ) | (0.27 | ) | (0.36 | ) | (0.40 | ) | ||||||
| Net realized gains | - | - | (0.12 | ) | - | - | - | |||||||||||
| Total distributions | (0.42 | ) | (0.23 | ) | (0.39 | ) | (0.27 | ) | (0.36 | ) | (0.40 | ) | ||||||
| Net asset value, end of period | $ | 66.83 | $ | 59.66 | $ | 50.24 | $ | 40.53 | $ | 41.18 | $ | 36.53 | ||||||
| Total returnc | 12.75 | % | 19.29 | % | 25.04 | % | (0.96 | )% | 13.82 | % | (0.45 | )% | ||||||
| Ratios to average net assetsd | ||||||||||||||||||
| Expenses | 0.64 | %e,f | 0.66 | %f | 0.69 | % | 0.67 | % | 0.69 | % | 0.75 | %f | ||||||
| Net investment income | 0.65 | % | 0.74 | % | 0.68 | % | 0.67 | % | 0.75 | % | 1.20 | % | ||||||
| Supplemental data | ||||||||||||||||||
| Net assets, end of period (000 s) | $ | 1,305,799 | $ | 1,080,811 | $ | 1,399,191 | $ | 917,394 | $ | 544,936 | $ | 430,926 | ||||||
| Portfolio turnover rate | 0.67 | % | 0.83 | % | 3.50 | % | 2.72 | % | 4.36 | % | 3.92 | % | ||||||
aThe amount shown for a share outstanding throughout the period may not correlate with the Statement of Operations for the period due to the timing of sales and repurchases of
the Fund shares in relation to income earned and/or fluctuating market value of the investments of the Fund.
bBased on average daily shares outstanding.
cTotal return is not annualized for periods less than one year.
dRatios are annualized for periods less than one year.
eBenefit of waiver and payments by affiliate rounds to less than 0.01%.
fBenefit of expense reduction rounds to less than 0.01%.
62 | The accompanying notes are an integral part of these financial statements. | Semiannual Report
| Franklin Custodian Funds | |||
| Statement of Investments, March 31, 2014 (unaudited) | |||
| Franklin Growth Fund | Shares | Value | |
| Common Stocks 89.0% | |||
| Automobiles & Components 2.6% | |||
| BorgWarner Inc. | 1,200,000 | $ | 73,764,000 |
| Ford Motor Co. | 1,200,000 | 18,720,000 | |
| General Motors Co. | 800,000 | 27,536,000 | |
| Harley-Davidson Inc. | 913,096 | 60,821,325 | |
| Johnson Controls Inc. | 1,600,000 | 75,712,000 | |
| Toyota Motor Corp., ADR (Japan) | 30,000 | 3,387,000 | |
| 259,940,325 | |||
| Banks 0.7% | |||
| JPMorgan Chase & Co. | 600,000 | 36,426,000 | |
| Wells Fargo & Co. | 750,000 | 37,305,000 | |
| 73,731,000 | |||
| Capital Goods 17.3% | |||
| 3M Co. | 855,000 | 115,989,300 | |
| ABB Ltd., ADR (Switzerland) | 1,500,000 | 38,685,000 | |
| Allegion PLC | 366,666 | 19,128,965 | |
| The Boeing Co. | 1,100,000 | 138,039,000 | |
| Caterpillar Inc. | 550,000 | 54,653,500 | |
| Danaher Corp. | 1,000,000 | 75,000,000 | |
| Deere & Co. | 500,000 | 45,400,000 | |
| Emerson Electric Co. | 1,100,000 | 73,480,000 | |
| General Dynamics Corp. | 1,000,000 | 108,920,000 | |
| General Electric Co. | 1,800,000 | 46,602,000 | |
| Huntington Ingalls Industries Inc. | 166,666 | 17,043,265 | |
| Illinois Tool Works Inc. | 1,000,000 | 81,330,000 | |
| Ingersoll-Rand PLC | 1,100,000 | 62,964,000 | |
| Lockheed Martin Corp. | 500,000 | 81,620,000 | |
| Northrop Grumman Corp. | 1,100,000 | 135,718,000 | |
| Pall Corp. | 1,000,000 | 89,470,000 | |
| Precision Castparts Corp. | 250,000 | 63,190,000 | |
| Raytheon Co. | 600,000 | 59,274,000 | |
| Rockwell Collins Inc. | 350,000 | 27,884,500 | |
| Stanley Black & Decker Inc. | 600,000 | 48,744,000 | |
| Textron Inc. | 1,600,000 | 62,864,000 | |
| United Technologies Corp. | 900,000 | 105,156,000 | |
| W.W. Grainger Inc. | 550,000 | 138,963,000 | |
| 1,690,118,530 | |||
| Commercial & Professional Services 1.9% | |||
| Dun & Bradstreet Corp. | 400,000 | 39,740,000 | |
| Equifax Inc. | 500,000 | 34,015,000 | |
| aIHS Inc., A | 450,000 | 54,675,000 | |
| Robert Half International Inc. | 150,000 | 6,292,500 | |
| aStericycle Inc. | 200,000 | 22,724,000 | |
| aVerisk Analytics Inc., A | 425,000 | 25,483,000 | |
| 182,929,500 | |||
Semiannual Report | 63
| Franklin Custodian Funds | |||
| Statement of Investments, March 31, 2014 (unaudited) (continued) | |||
| Franklin Growth Fund | Shares | Value | |
| Common Stocks (continued) | |||
| Consumer Durables & Apparel 2.3% | |||
| NIKE Inc., B | 900,000 | $ | 66,474,000 |
| Ralph Lauren Corp. | 225,000 | 36,209,250 | |
| VF Corp. | 2,000,000 | 123,760,000 | |
| 226,443,250 | |||
| Consumer Services 1.3% | |||
| Carnival Corp. | 1,200,000 | 45,432,000 | |
| Graham Holdings Co., B | 80,000 | 56,300,000 | |
| Interval Leisure Group Inc. | 60,020 | 1,568,923 | |
| Starwood Hotels & Resorts Worldwide Inc. | 250,000 | 19,900,000 | |
| 123,200,923 | |||
| Diversified Financials 2.3% | |||
| American Express Co. | 600,000 | 54,018,000 | |
| aBerkshire Hathaway Inc., A | 184 | 34,472,409 | |
| BlackRock Inc. | 208,000 | 65,411,840 | |
| T. Rowe Price Group Inc. | 900,000 | 74,115,000 | |
| 228,017,249 | |||
| Energy 3.6% | |||
| Anadarko Petroleum Corp. | 675,000 | 57,213,000 | |
| BP PLC, ADR (United Kingdom) | 353,542 | 17,005,370 | |
| ConocoPhillips | 35,000 | 2,462,250 | |
| Devon Energy Corp. | 320,000 | 21,417,600 | |
| Exxon Mobil Corp. | 70,000 | 6,837,600 | |
| aFMC Technologies Inc. | 750,000 | 39,217,500 | |
| Halliburton Co. | 850,000 | 50,056,500 | |
| National Oilwell Varco Inc. | 650,000 | 50,615,500 | |
| Occidental Petroleum Corp. | 300,000 | 28,587,000 | |
| Phillips 66 | 17,500 | 1,348,550 | |
| Royal Dutch Shell PLC, A, ADR (United Kingdom) | 280,000 | 20,456,800 | |
| Schlumberger Ltd. | 550,000 | 53,625,000 | |
| Transocean Ltd. | 15,222 | 629,278 | |
| 349,471,948 | |||
| Food & Staples Retailing 0.5% | |||
| CVS Caremark Corp. | 600,000 | 44,916,000 | |
| Food, Beverage & Tobacco 1.9% | |||
| Bunge Ltd. | 250,000 | 19,877,500 | |
| Mead Johnson Nutrition Co., A | 850,000 | 70,669,000 | |
| aMonster Beverage Corp. | 900,000 | 62,505,000 | |
| PepsiCo Inc. | 450,000 | 37,575,000 | |
| 190,626,500 | |||
| Health Care Equipment & Services 6.1% | |||
| Abbott Laboratories | 900,000 | 34,659,000 | |
| Aetna Inc. | 400,000 | 29,988,000 | |
| aAllscripts Healthcare Solutions Inc. | 1,100,000 | 19,833,000 | |
64 | Semiannual Report
| Franklin Custodian Funds | |||
| Statement of Investments, March 31, 2014 (unaudited) (continued) | |||
| Franklin Growth Fund | Shares | Value | |
| Common Stocks (continued) | |||
| Health Care Equipment & Services (continued) | |||
| Baxter International Inc. | 400,000 | $ | 29,432,000 |
| Cardinal Health Inc. | 300,000 | 20,994,000 | |
| aCareFusion Corp. | 1,000,000 | 40,220,000 | |
| Covidien PLC | 425,000 | 31,305,500 | |
| aEdwards Lifesciences Corp. | 200,000 | 14,834,000 | |
| aEnvision Healthcare Holdings Inc. | 769,200 | 26,022,036 | |
| aExpress Scripts Holding Co. | 361,648 | 27,156,148 | |
| aHaemonetics Corp. | 1,000,000 | 32,590,000 | |
| aHenry Schein Inc. | 350,000 | 41,779,500 | |
| Hill-Rom Holdings Inc. | 300,000 | 11,562,000 | |
| aIntuitive Surgical Inc. | 150,000 | 65,698,500 | |
| Medtronic Inc. | 60,000 | 3,692,400 | |
| Quest Diagnostics Inc. | 900,000 | 52,128,000 | |
| Stryker Corp. | 400,000 | 32,588,000 | |
| Teleflex Inc. | 500,000 | 53,620,000 | |
| aVarian Medical Systems Inc. | 300,000 | 25,197,000 | |
| Zimmer Holdings Inc. | 100,000 | 9,458,000 | |
| 602,757,084 | |||
| Household & Personal Products 0.3% | |||
| The Procter & Gamble Co. | 335,000 | 27,001,000 | |
| Insurance 0.4% | |||
| Aflac Inc. | 600,000 | 37,824,000 | |
| Materials 5.5% | |||
| Air Products and Chemicals Inc. | 500,000 | 59,520,000 | |
| Avery Dennison Corp. | 462,000 | 23,409,540 | |
| Celanese Corp., A | 1,200,000 | 66,612,000 | |
| Cytec Industries Inc. | 1,000,000 | 97,610,000 | |
| Ecolab Inc. | 650,000 | 70,193,500 | |
| Freeport-McMoRan Copper & Gold Inc., B | 1,200,000 | 39,684,000 | |
| Martin Marietta Materials Inc. | 250,000 | 32,087,500 | |
| Praxair Inc. | 550,000 | 72,033,500 | |
| Sigma-Aldrich Corp. | 800,000 | 74,704,000 | |
| 535,854,040 | |||
| Media 1.4% | |||
| aLive Nation Entertainment Inc. | 88,491 | 1,924,679 | |
| The Walt Disney Co. | 1,687,290 | 135,101,311 | |
| 137,025,990 | |||
| Pharmaceuticals, Biotechnology & Life Sciences 13.2% | |||
| AbbVie Inc. | 400,000 | 20,560,000 | |
| Agilent Technologies Inc. | 1,300,000 | 72,696,000 | |
| Allergan Inc. | 1,000,000 | 124,100,000 | |
| Amgen Inc. | 1,000,000 | 123,340,000 | |
| aBiogen Idec Inc. | 500,000 | 152,935,000 | |
| aCelgene Corp. | 390,000 | 54,444,000 | |
Semiannual Report | 65
| Franklin Custodian Funds | |||
| Statement of Investments, March 31, 2014 (unaudited) (continued) | |||
| Franklin Growth Fund | Shares | Value | |
| Common Stocks (continued) | |||
| Pharmaceuticals, Biotechnology & Life Sciences (continued) | |||
| aCovance Inc. | 200,000 | $ | 20,780,000 |
| Eli Lilly & Co. | 1,350,000 | 79,461,000 | |
| aGilead Sciences Inc. | 600,000 | 42,516,000 | |
| aHospira Inc. | 1,350,000 | 58,387,500 | |
| aIllumina Inc. | 400,000 | 59,464,000 | |
| Johnson & Johnson | 1,200,100 | 117,885,823 | |
| Merck & Co. Inc. | 1,000,000 | 56,770,000 | |
| aMettler-Toledo International Inc. | 425,000 | 100,164,000 | |
| Pfizer Inc. | 2,761,000 | 88,683,320 | |
| Roche Holding AG, ADR (Switzerland) | 1,500,000 | 56,580,000 | |
| aWaters Corp. | 575,000 | 62,335,750 | |
| 1,291,102,393 | |||
| Real Estate 0.6% | |||
| American Tower Corp. | 715,000 | 58,537,050 | |
| Retailing 1.3% | |||
| aAmazon.com Inc. | 275,000 | 92,543,000 | |
| Expedia Inc. | 200,000 | 14,500,000 | |
| HSN Inc. | 100,000 | 5,973,000 | |
| aTripAdvisor Inc. | 200,000 | 18,118,000 | |
| 131,134,000 | |||
| Semiconductors & Semiconductor Equipment 0.4% | |||
| Intel Corp. | 1,100,000 | 28,391,000 | |
| aSunPower Corp. | 133,873 | 4,318,743 | |
| Texas Instruments Inc. | 250,000 | 11,787,500 | |
| 44,497,243 | |||
| Software & Services 10.7% | |||
| aAutodesk Inc. | 800,000 | 39,344,000 | |
| Automatic Data Processing Inc. | 700,000 | 54,082,000 | |
| aCheck Point Software Technologies Ltd. (Israel) | 525,000 | 35,505,750 | |
| aCitrix Systems Inc. | 275,000 | 15,793,250 | |
| Computer Sciences Corp. | 1,400,000 | 85,148,000 | |
| aFacebook Inc., A | 400,000 | 24,096,000 | |
| aFortinet Inc. | 1,500,000 | 33,045,000 | |
| aGoogle Inc., A | 150,000 | 167,176,500 | |
| IAC/InterActiveCorp | 300,000 | 21,417,000 | |
| aInformatica Corp. | 800,000 | 30,224,000 | |
| International Business Machines Corp. | 600,000 | 115,494,000 | |
| Intuit Inc. | 1,000,000 | 77,730,000 | |
| MasterCard Inc., A | 1,000,000 | 74,700,000 | |
| Microsoft Corp. | 1,300,000 | 53,287,000 | |
| Oracle Corp. | 2,300,000 | 94,093,000 | |
| Visa Inc., A | 300,000 | 64,758,000 | |
| aYahoo! Inc. | 1,700,000 | 61,030,000 | |
| 1,046,923,500 | |||
66 | Semiannual Report
| Franklin Custodian Funds | ||||
| Statement of Investments, March 31, 2014 (unaudited) (continued) | ||||
| Franklin Growth Fund | Shares | Value | ||
| Common Stocks (continued) | ||||
| Technology Hardware & Equipment 7.2% | ||||
| Apple Inc. | 575,000 | $ | 308,625,500 | |
| aBlackberry Ltd. (Canada) | 450,000 | 3,636,000 | ||
| Cisco Systems Inc. | 2,945,000 | 65,997,450 | ||
| EMC Corp. | 2,700,000 | 74,007,000 | ||
| Hewlett-Packard Co. | 1,156,250 | 37,416,250 | ||
| QUALCOMM Inc. | 660,000 | 52,047,600 | ||
| TE Connectivity Ltd. | 1,200,000 | 72,252,000 | ||
| aTrimble Navigation Ltd. | 2,400,000 | 93,288,000 | ||
| 707,269,800 | ||||
| Transportation 6.9% | ||||
| aAir France-KLM, ADR (France) | 800,000 | 12,056,000 | ||
| Alaska Air Group Inc. | 1,600,000 | 149,296,000 | ||
| Allegiant Travel Co. | 200,000 | 22,386,000 | ||
| Arkansas Best Corp. | 260,000 | 9,607,000 | ||
| C.H. Robinson Worldwide Inc. | 267,300 | 14,003,847 | ||
| Canadian National Railway Co. (Canada) | 1,000,000 | 56,220,000 | ||
| Canadian Pacific Railway Ltd. (Canada) | 500,000 | 75,215,000 | ||
| Expeditors International of Washington Inc. | 600,000 | 23,778,000 | ||
| Forward Air Corp. | 500,000 | 23,055,000 | ||
| Heartland Express Inc. | 600,000 | 13,614,000 | ||
| aInternational Consolidated Airlines Group SA, ADR (United Kingdom) | 1,400,000 | 48,930,000 | ||
| Kansas City Southern | 400,000 | 40,824,000 | ||
| aRyanair Holdings PLC, ADR (Ireland) | 239,200 | 14,067,352 | ||
| Southwest Airlines Co. | 100,000 | 2,361,000 | ||
| Union Pacific Corp. | 600,000 | 112,596,000 | ||
| aUnited Continental Holdings Inc. | 1,050,000 | 46,861,500 | ||
| Werner Enterprises Inc. | 462,000 | 11,785,620 | ||
| 676,656,319 | ||||
| Utilities 0.6% | ||||
| American Water Works Co. Inc. | 700,000 | 31,780,000 | ||
| NextEra Energy Inc. | 250,000 | 23,905,000 | ||
| 55,685,000 | ||||
| Total Common Stocks (Cost $3,774,764,600) | 8,721,662,644 | |||
| Principal Amount | ||||
| Short Term Investments 8.0% | ||||
| U.S. Government and Agency Securities (Cost $100,000,000) 1.0% | ||||
| bFHLB, 4/01/14 | $ | 100,000,000 | 100,000,000 | |
| Total Investments before Money Market Funds and Repurchase Agreements | ||||
| (Cost $3,874,764,600) | 8,821,662,644 | |||
| Shares | ||||
| Money Market Funds (Cost $485,193,678) 5.0% | ||||
| a,cInstitutional Fiduciary Trust Money Market Portfolio | 485,193,678 | 485,193,678 | ||
Semiannual Report | 67
Franklin Custodian Funds
Statement of Investments, March 31, 2014 (unaudited) (continued)
| Franklin Growth Fund | Principal Amount | Value | ||
| Short Term Investments (continued) | ||||
| Repurchase Agreements (Cost $197,401,393) 2.0% | ||||
| dJoint Repurchase Agreement, 0.045%, 4/01/14 (Maturity Value $197,401,641) | $ | 197,401,393 | $ | 197,401,393 |
| BNP Paribas Securities Corp. (Maturity Value $34,519,625) | ||||
| Deutsche Bank Securities Inc. (Maturity Value $21,352,936) | ||||
| HSBC Securities (USA) Inc. (Maturity Value $96,653,765) | ||||
| Merrill Lynch, Pierce, Fenner & Smith Inc. (Maturity Value $44,875,315) | ||||
| Collateralized by U.S. Government Agency Securities, 0.00% - 5.625%, | ||||
| 3/26/15 - 11/23/35; U.S. Government Agency Securities, Strips, 6/01/17; | ||||
| U.S. Treasury Bonds, 7.25% - 10.625%, 8/15/15 - 2/15/19; U.S. Treasury Notes, | ||||
| 0.25% - 4.875%, 5/15/15 - 3/31/19; and U.S. Treasury Notes, Index Linked, 2.375%, | ||||
| 1/15/17 (valued at $201,423,485 ) | ||||
| Total Investments (Cost $4,557,359,671) 97.0% | 9,504,257,715 | |||
| Other Assets, less Liabilities 3.0% | 289,964,839 | |||
| Net Assets 100.0% | $ | 9,794,222,554 |
See Abbreviations on page 145.
aNon-income producing.
bThe security is traded on a discount basis with no stated coupon rate.
cSee Note 3(f) regarding investments in the Institutional Fiduciary Trust Money Market Portfolio.
dSee Note 1(c) regarding joint repurchase agreement.
68 | The accompanying notes are an integral part of these financial statements. | Semiannual Report
| Franklin Custodian Funds | ||||||||||||||||||
| Financial Highlights | ||||||||||||||||||
| Franklin Income Fund | ||||||||||||||||||
| Six Months Ended | ||||||||||||||||||
| March 31, 2014 | Year Ended September 30, | |||||||||||||||||
| Class A | (unaudited) | 2013 | 2012 | 2011 | 2010 | 2009 | ||||||||||||
| Per share operating performance | ||||||||||||||||||
| (for a share outstanding throughout | ||||||||||||||||||
| the period) | ||||||||||||||||||
| Net asset value, beginning of | ||||||||||||||||||
| period | $ | 2.33 | $ | 2.23 | $ | 1.98 | $ | 2.11 | $ | 1.99 | $ | 1.98 | ||||||
| Income from investment operationsa: | ||||||||||||||||||
| Net investment incomeb | 0.05 | 0.11 | 0.13 | 0.13 | 0.13 | 0.13 | ||||||||||||
| Net realized and unrealized gains | ||||||||||||||||||
| (losses) | 0.17 | 0.12 | 0.26 | (0.12 | ) | 0.14 | 0.04 | |||||||||||
| Total from investment | ||||||||||||||||||
| operations | 0.22 | 0.23 | 0.39 | 0.01 | 0.27 | 0.17 | ||||||||||||
| Less distributions from: | ||||||||||||||||||
| Net investment income | (0.06 | ) | (0.13 | ) | (0.14 | ) | (0.14 | ) | (0.15 | ) | (0.16 | ) | ||||||
| Net realized gains | ( )c | |||||||||||||||||
| Total distributions | (0.06 | ) | (0.13 | ) | (0.14 | ) | (0.14 | ) | (0.15 | ) | (0.16 | ) | ||||||
| Net asset value, end of period | $ | 2.49 | $ | 2.33 | $ | 2.23 | $ | 1.98 | $ | 2.11 | $ | 1.99 | ||||||
| Total returnd | 9.68 | % | 10.72 | % | 20.38 | % | 0.01 | % | 13.90 | % | 10.56 | % | ||||||
| Ratios to average net assetse | ||||||||||||||||||
| Expensesf | 0.62 | %g | 0.62 | % | 0.64 | % | 0.63 | % | 0.65 | % | 0.68 | % | ||||||
| Net investment income | 4.46 | % | 4.98 | % | 5.90 | % | 6.03 | % | 6.40 | % | 7.93 | % | ||||||
| Supplemental data | ||||||||||||||||||
| Net assets, end of period | ||||||||||||||||||
| (000 s) | $ | 53,263,858 | $ | 48,320,611 | $ | 41,280,437 | $ | 32,847,934 | $ | 32,281,991 | $ | 27,773,006 | ||||||
| Portfolio turnover rate | 18.49 | % | 37.60 | % | 33.44 | % | 35.83 | % | 46.85 | % | 51.36 | % | ||||||
aThe amount shown for a share outstanding throughout the period may not correlate with the Statement of Operations for the period due to the timing of sales and repurchases of
the Fund shares in relation to income earned and/or fluctuating market value of the investments of the Fund.
bBased on average daily shares outstanding.
cAmount rounds to less than $0.01 per share.
dTotal return does not reflect sales commissions or contingent deferred sales charges, if applicable, and is not annualized for periods less than one year.
eRatios are annualized for periods less than one year.
fBenefit of expense reduction rounds to less than 0.01%.
gBenefit of waiver and payments by affiliate rounds to less than 0.01%.
Semiannual Report | The accompanying notes are an integral part of these financial statements. | 69
| Franklin Custodian Funds | ||||||||||||||||||
| Financial Highlights (continued) | ||||||||||||||||||
| Franklin Income Fund | ||||||||||||||||||
| Six Months Ended | ||||||||||||||||||
| March 31, 2014 | Year Ended September 30, | |||||||||||||||||
| Class C | (unaudited) | 2013 | 2012 | 2011 | 2010 | 2009 | ||||||||||||
| Per share operating performance | ||||||||||||||||||
| (for a share outstanding throughout | ||||||||||||||||||
| the period) | ||||||||||||||||||
| Net asset value, beginning of | ||||||||||||||||||
| period | $ | 2.35 | $ | 2.25 | $ | 2.00 | $ | 2.13 | $ | 2.00 | $ | 1.99 | ||||||
| Income from investment operationsa: | ||||||||||||||||||
| Net investment incomeb | 0.05 | 0.10 | 0.12 | 0.12 | 0.12 | 0.13 | ||||||||||||
| Net realized and unrealized gains | ||||||||||||||||||
| (losses) | 0.18 | 0.12 | 0.26 | (0.12 | ) | 0.15 | 0.03 | |||||||||||
| Total from investment | ||||||||||||||||||
| operations | 0.23 | 0.22 | 0.38 | 0.27 | 0.16 | |||||||||||||
| Less distributions from: | ||||||||||||||||||
| Net investment income | (0.06 | ) | (0.12 | ) | (0.13 | ) | (0.13 | ) | (0.14 | ) | (0.15 | ) | ||||||
| Net realized gains | ( )c | |||||||||||||||||
| Total distributions | (0.06 | ) | (0.12 | ) | (0.13 | ) | (0.13 | ) | (0.14 | ) | (0.15 | ) | ||||||
| Net asset value, end of period | $ | 2.52 | $ | 2.35 | $ | 2.25 | $ | 2.00 | $ | 2.13 | $ | 2.00 | ||||||
| Total returnd | 9.74 | % | 10.07 | % | 19.58 | % | (0.48 | )% | 13.76 | % | 9.93 | % | ||||||
| Ratios to average net assetse | ||||||||||||||||||
| Expensesf | 1.12 | %g | 1.12 | % | 1.14 | % | 1.13 | % | 1.15 | % | 1.18 | % | ||||||
| Net investment income | 3.96 | % | 4.48 | % | 5.40 | % | 5.53 | % | 5.90 | % | 7.43 | % | ||||||
| Supplemental data | ||||||||||||||||||
| Net assets, end of period | ||||||||||||||||||
| (000 s) | $ | 27,352,835 | $ | 24,016,797 | $ | 20,220,114 | $ | 16,217,805 | $ | 15,605,055 | $ | 13,054,203 | ||||||
| Portfolio turnover rate | 18.49 | % | 37.60 | % | 33.44 | % | 35.83 | % | 46.85 | % | 51.36 | % | ||||||
aThe amount shown for a share outstanding throughout the period may not correlate with the Statement of Operations for the period due to the timing of sales and repurchases of
the Fund shares in relation to income earned and/or fluctuating market value of the investments of the Fund.
bBased on average daily shares outstanding.
cAmount rounds to less than $0.01 per share.
dTotal return does not reflect sales commissions or contingent deferred sales charges, if applicable, and is not annualized for periods less than one year.
eRatios are annualized for periods less than one year.
fBenefit of expense reduction rounds to less than 0.01%.
gBenefit of waiver and payments by affiliate rounds to less than 0.01%.
70 | The accompanying notes are an integral part of these financial statements. | Semiannual Report
| Franklin Custodian Funds | ||||||||||||||||||
| Financial Highlights (continued) | ||||||||||||||||||
| Franklin Income Fund | ||||||||||||||||||
| Six Months Ended | ||||||||||||||||||
| March 31, 2014 | Year Ended September 30, | |||||||||||||||||
| Class R | (unaudited) | 2013 | 2012 | 2011 | 2010 | 2009 | ||||||||||||
| Per share operating performance | ||||||||||||||||||
| (for a share outstanding throughout the period) | ||||||||||||||||||
| Net asset value, beginning of period | $ | 2.29 | $ | 2.20 | $ | 1.96 | $ | 2.09 | $ | 1.96 | $ | 1.95 | ||||||
| Income from investment operationsa: | ||||||||||||||||||
| Net investment incomeb | 0.05 | 0.11 | 0.12 | 0.12 | 0.12 | 0.13 | ||||||||||||
| Net realized and unrealized gains (losses) | 0.17 | 0.10 | 0.25 | (0.12 | ) | 0.15 | 0.03 | |||||||||||
| Total from investment operations | 0.22 | 0.21 | 0.37 | 0.27 | 0.16 | |||||||||||||
| Less distributions from: | ||||||||||||||||||
| Net investment income | (0.06 | ) | (0.12 | ) | (0.13 | ) | (0.13 | ) | (0.14 | ) | (0.15 | ) | ||||||
| Net realized gains | ( )c | |||||||||||||||||
| Total distributions | (0.06 | ) | (0.12 | ) | (0.13 | ) | (0.13 | ) | (0.14 | ) | (0.15 | ) | ||||||
| Net asset value, end of period | $ | 2.45 | $ | 2.29 | $ | 2.20 | $ | 1.96 | $ | 2.09 | $ | 1.96 | ||||||
| Total returnd | 9.65 | % | 10.03 | % | 19.66 | % | (0.32 | )% | 14.23 | % | 10.31 | % | ||||||
| Ratios to average net assetse | ||||||||||||||||||
| Expensesf | 0.97 | %g | 0.97 | % | 0.99 | % | 0.98 | % | 1.00 | % | 1.03 | % | ||||||
| Net investment income | 4.11 | % | 4.63 | % | 5.55 | % | 5.68 | % | 6.05 | % | 7.58 | % | ||||||
| Supplemental data | ||||||||||||||||||
| Net assets, end of period (000 s) | $ | 499,690 | $ | 446,463 | $ | 426,525 | $ | 360,907 | $ | 370,564 | $ | 315,298 | ||||||
| Portfolio turnover rate | 18.49 | % | 37.60 | % | 33.44 | % | 35.83 | % | 46.85 | % | 51.36 | % | ||||||
aThe amount shown for a share outstanding throughout the period may not correlate with the Statement of Operations for the period due to the timing of sales and repurchases of
the Fund shares in relation to income earned and/or fluctuating market value of the investments of the Fund.
bBased on average daily shares outstanding.
cAmount rounds to less than $0.01 per share.
dTotal return is not annualized for periods less than one year.
eRatios are annualized for periods less than one year.
fBenefit of expense reduction rounds to less than 0.01%.
gBenefit of waiver and payments by affiliate rounds to less than 0.01%.
Semiannual Report | The accompanying notes are an integral part of these financial statements. | 71
| Franklin Custodian Funds | ||||||
| Financial Highlights (continued) | ||||||
| Franklin Income Fund | ||||||
| Six Months Ended | Period Ended | |||||
| March 31, 2014 | September 30, | |||||
| Class R6 | (unaudited) | 2013 | a | |||
| Per share operating performance | ||||||
| (for a share outstanding throughout the period) | ||||||
| Net asset value, beginning of period | $ | 2.31 | $ | 2.33 | ||
| Income from investment operationsb: | ||||||
| Net investment incomec | 0.06 | 0.04 | ||||
| Net realized and unrealized gains (losses) | 0.16 | (0.02 | ) | |||
| Total from investment operations | 0.22 | 0.02 | ||||
| Less distributions from net investment income | (0.06 | ) | (0.04 | ) | ||
| Net asset value, end of period | $ | 2.47 | $ | 2.31 | ||
| Total returnd | 9.87 | % | 1.06 | % | ||
| Ratios to average net assetse | ||||||
| Expensesf | 0.39 | %g | 0.39 | % | ||
| Net investment income | 4.69 | % | 5.21 | % | ||
| Supplemental data | ||||||
| Net assets, end of period (000 s) | $ | 2,119,867 | $ | 1,921,084 | ||
| Portfolio turnover rate | 18.49 | % | 37.60 | % | ||
aFor the period May 1, 2013 (effective date) to September 30, 2013.
bThe amount shown for a share outstanding throughout the period may not correlate with the Statement of Operations for the period due to the timing of sales and repurchases of
the Fund shares in relation to income earned and/or fluctuating market value of the investments of the Fund.
cBased on average daily shares outstanding.
dTotal return is not annualized for periods less than one year.
eRatios are annualized for periods less than one year.
fBenefit of expense reduction rounds to less than 0.01%.
gBenefit of waiver and payments by affiliate rounds to less than 0.01%.
72 | The accompanying notes are an integral part of these financial statements. | Semiannual Report
| Franklin Custodian Funds | ||||||||||||||||||
| Financial Highlights (continued) | ||||||||||||||||||
| Franklin Income Fund | ||||||||||||||||||
| Six Months Ended | ||||||||||||||||||
| March 31, 2014 | Year Ended September 30, | |||||||||||||||||
| Advisor Class | (unaudited) | 2013 | 2012 | 2011 | 2010 | 2009 | ||||||||||||
| Per share operating performance | ||||||||||||||||||
| (for a share outstanding throughout | ||||||||||||||||||
| the period) | ||||||||||||||||||
| Net asset value, beginning of period | $ | 2.31 | $ | 2.22 | $ | 1.97 | $ | 2.10 | $ | 1.98 | $ | 1.97 | ||||||
| Income from investment operationsa: | ||||||||||||||||||
| Net investment incomeb | 0.05 | 0.12 | 0.13 | 0.13 | 0.13 | 0.14 | ||||||||||||
| Net realized and unrealized gains | ||||||||||||||||||
| (losses) | 0.17 | 0.11 | 0.26 | (0.12 | ) | 0.14 | 0.03 | |||||||||||
| Total from investment operations | 0.22 | 0.23 | 0.39 | 0.01 | 0.27 | 0.17 | ||||||||||||
| Less distributions from: | ||||||||||||||||||
| Net investment income | (0.06 | ) | (0.14 | ) | (0.14 | ) | (0.14 | ) | (0.15 | ) | (0.16 | ) | ||||||
| Net realized gains | ( )c | |||||||||||||||||
| Total distributions | (0.06 | ) | (0.14 | ) | (0.14 | ) | (0.14 | ) | (0.15 | ) | (0.16 | ) | ||||||
| Net asset value, end of period | $ | 2.47 | $ | 2.31 | $ | 2.22 | $ | 1.97 | $ | 2.10 | $ | 1.98 | ||||||
| Total returnd | 9.85 | % | 10.49 | % | 20.69 | % | 0.16 | % | 14.15 | % | 10.79 | % | ||||||
| Ratios to average net assetse | ||||||||||||||||||
| Expensesf | 0.47 | %g | 0.47 | % | 0.49 | % | 0.48 | % | 0.50 | % | 0.53 | % | ||||||
| Net investment income | 4.61 | % | 5.13 | % | 6.05 | % | 6.18 | % | 6.55 | % | 8.08 | % | ||||||
| Supplemental data | ||||||||||||||||||
| Net assets, end of period (000 s) | $ | 7,164,317 | $ | 5,903,701 | $ | 6,444,763 | $ | 5,032,128 | $ | 4,593,709 | $ | 4,183,925 | ||||||
| Portfolio turnover rate | 18.49 | % | 37.60 | % | 33.44 | % | 35.83 | % | 46.85 | % | 51.36 | % | ||||||
aThe amount shown for a share outstanding throughout the period may not correlate with the Statement of Operations for the period due to the timing of sales and repurchases of
the Fund shares in relation to income earned and/or fluctuating market value of the investments of the Fund.
bBased on average daily shares outstanding.
cAmount rounds to less than $0.01 per share.
dTotal return is not annualized for periods less than one year.
eRatios are annualized for periods less than one year.
fBenefit of expense reduction rounds to less than 0.01%.
gBenefit of waiver and payments by affiliate rounds to less than 0.01%.
Semiannual Report | The accompanying notes are an integral part of these financial statements. | 73
Franklin Custodian Funds
Statement of Investments, March 31, 2014 (unaudited)
| Franklin Income Fund | Country | Shares/Warrants | Value | |
| Common Stocks and Other Equity Interests 46.8% | ||||
| Consumer Discretionary 1.7% | ||||
| a,bCBS Outdoor Americas Inc. | United States | 1,243,400 | $ | 36,369,450 |
| Comcast Corp., A | United States | 1,500,000 | 75,030,000 | |
| a,c,dDex Media Inc. | United States | 2,048,551 | 18,846,669 | |
| Ford Motor Co. | United States | 45,000,000 | 702,000,000 | |
| General Motors Co. | United States | 5,000,000 | 172,100,000 | |
| McDonald s Corp. | United States | 1,000,000 | 98,030,000 | |
| Target Corp. | United States | 8,000,000 | 484,080,000 | |
| 1,586,456,119 | ||||
| Consumer Staples 1.1% | ||||
| The Coca-Cola Co. | United States | 10,000,000 | 386,600,000 | |
| PepsiCo Inc. | United States | 7,000,000 | 584,500,000 | |
| 971,100,000 | ||||
| Energy 8.5% | ||||
| BP PLC, ADR | United Kingdom | 30,000,000 | 1,443,000,000 | |
| aCallon Petroleum Co. | United States | 654,357 | 5,476,968 | |
| Canadian Oil Sands Ltd. | Canada | 20,000,000 | 419,576,624 | |
| Chevron Corp. | United States | 9,000,000 | 1,070,190,000 | |
| Devon Energy Corp. | United States | 2,425,000 | 162,305,250 | |
| Exxon Mobil Corp. | United States | 7,500,000 | 732,600,000 | |
| Royal Dutch Shell PLC, A, ADR | United Kingdom | 27,000,000 | 1,972,620,000 | |
| Spectra Energy Corp. | United States | 10,000,000 | 369,400,000 | |
| Total SA, B, ADR | France | 11,980,000 | 785,888,000 | |
| Transocean Ltd. | United States | 7,000,000 | 289,380,000 | |
| The Williams Cos. Inc. | United States | 7,000,000 | 284,060,000 | |
| Woodside Petroleum Ltd. | Australia | 4,000,000 | 144,748,588 | |
| 7,679,245,430 | ||||
| Financials 3.8% | ||||
| Banco Santander SA | Spain | 19,937,863 | 190,122,565 | |
| Barclays PLC | United Kingdom | 30,000,000 | 116,746,337 | |
| Citigroup Inc. | United States | 5,000,000 | 238,000,000 | |
| Commonwealth Bank of Australia | Australia | 3,500,000 | 251,362,490 | |
| Digital Realty Trust Inc. | United States | 2,500,000 | 132,700,000 | |
| HSBC Holdings PLC | United Kingdom | 40,000,000 | 405,084,073 | |
| JPMorgan Chase & Co. | United States | 13,000,000 | 789,230,000 | |
| Royal Bank of Canada | Canada | 4,500,000 | 296,729,691 | |
| Wells Fargo & Co. | United States | 20,000,000 | 994,800,000 | |
| Westfield Retail Trust | Australia | 10,000,000 | 27,636,519 | |
| 3,442,411,675 | ||||
| Health Care 5.8% | ||||
| Eli Lilly & Co. | United States | 12,000,000 | 706,320,000 | |
| Johnson & Johnson | United States | 5,453,100 | 535,658,013 | |
| Merck & Co. Inc. | United States | 25,000,000 | 1,419,250,000 | |
| Pfizer Inc. | United States | 30,000,000 | 963,600,000 | |
| Roche Holding AG | Switzerland | 3,400,000 | 1,019,230,769 | |
| Sanofi, ADR | France | 10,954,162 | 572,683,590 | |
| 5,216,742,372 |
74 | Semiannual Report
Franklin Custodian Funds
Statement of Investments, March 31, 2014 (unaudited) (continued)
| Franklin Income Fund | Country | Shares/Warrants | Value | |
| Common Stocks and Other Equity Interests (continued) | ||||
| Industrials 3.0% | ||||
| a,cCEVA Holdings LLC | United Kingdom | 91,371 | $ | 114,213,825 |
| Deere & Co. | United States | 2,000,000 | 181,600,000 | |
| General Electric Co. | United States | 43,000,000 | 1,113,270,000 | |
| Lockheed Martin Corp. | United States | 3,500,000 | 571,340,000 | |
| Republic Services Inc. | United States | 8,500,000 | 290,360,000 | |
| Waste Management Inc. | United States | 11,500,000 | 483,805,000 | |
| 2,754,588,825 | ||||
| Information Technology 1.5% | ||||
| Cisco Systems Inc. | United States | 15,000,000 | 336,150,000 | |
| eEMC Corp. | United States | 3,000,000 | 82,230,000 | |
| Intel Corp. | United States | 28,700,000 | 740,747,000 | |
| QUALCOMM Inc. | United States | 2,000,000 | 157,720,000 | |
| 1,316,847,000 | ||||
| Materials 7.3% | ||||
| cAgrium Inc. | Canada | 7,500,000 | 731,400,000 | |
| AngloGold Ashanti Ltd., ADR | South Africa | 1,646,291 | 28,118,651 | |
| Barrick Gold Corp. | Canada | 14,065,987 | 250,796,548 | |
| BHP Billiton PLC | United Kingdom | 30,000,000 | 922,392,340 | |
| The Dow Chemical Co. | United States | 18,000,000 | 874,620,000 | |
| E. I. du Pont de Nemours and Co. | United States | 10,000,000 | 671,000,000 | |
| Freeport-McMoRan Copper & Gold Inc., B | United States | 15,387,487 | 508,864,195 | |
| Goldcorp Inc. | Canada | 13,000,000 | 318,240,000 | |
| LyondellBasell Industries NV, A | United States | 8,000,000 | 711,520,000 | |
| The Mosaic Co. | United States | 2,170,000 | 108,500,000 | |
| Newmont Mining Corp. | United States | 12,116,000 | 283,999,040 | |
| Potash Corp. of Saskatchewan Inc. | Canada | 3,000,000 | 108,660,000 | |
| Rio Tinto PLC, ADR | United Kingdom | 19,000,000 | 1,060,770,000 | |
| 6,578,880,774 | ||||
| Telecommunication Services 2.4% | ||||
| AT&T Inc. | United States | 30,000,000 | 1,052,100,000 | |
| BCE Inc. | Canada | 4,250,000 | 183,087,570 | |
| CenturyLink Inc. | United States | 7,500,000 | 246,300,000 | |
| China Mobile Ltd. | China | 5,000,000 | 45,768,361 | |
| Telstra Corp. Ltd. | Australia | 30,000,000 | 141,335,756 | |
| Telus Corp. | Canada | 3,000,000 | 107,553,827 | |
| Verizon Communications Inc. | United States | 5,000,000 | 237,850,000 | |
| Vodafone Group PLC | United Kingdom | 32,727,271 | 120,184,827 | |
| 2,134,180,341 | ||||
| Utilities 11.7% | ||||
| AGL Resources Inc. | United States | 2,000,000 | 97,920,000 | |
| Ameren Corp. | United States | 2,500,000 | 103,000,000 | |
| American Electric Power Co. Inc. | United States | 8,500,000 | 430,610,000 | |
| Dominion Resources Inc. | United States | 8,000,000 | 567,920,000 | |
| DTE Energy Co. | United States | 1,250,000 | 92,862,500 | |
| Duke Energy Corp. | United States | 14,000,000 | 997,080,000 |
Semiannual Report | 75
Franklin Custodian Funds
Statement of Investments, March 31, 2014 (unaudited) (continued)
| Franklin Income Fund | Country | Shares/Warrants | Value | |
| Common Stocks and Other Equity Interests (continued) | ||||
| Utilities (continued) | ||||
| a,c,dDynegy Inc. | United States | 21,000,000 | $ | 523,740,000 |
| a,c,dDynegy Inc., wts., 10/02/17 | United States | 1,143,273 | 2,000,728 | |
| Edison International | United States | 6,000,000 | 339,660,000 | |
| Entergy Corp. | United States | 8,000,000 | 534,800,000 | |
| Exelon Corp. | United States | 33,000,000 | 1,107,480,000 | |
| FirstEnergy Corp. | United States | 6,000,000 | 204,180,000 | |
| aHK Electric Investments/HK Electric Investments Ltd. | Hong Kong | 120,000,000 | 77,354,976 | |
| NextEra Energy Inc. | United States | 3,000,000 | 286,860,000 | |
| Northeast Utilities | United States | 500,000 | 22,750,000 | |
| Pepco Holdings Inc. | United States | 6,000,000 | 122,880,000 | |
| PG&E Corp. | United States | 22,250,000 | 961,200,000 | |
| Pinnacle West Capital Corp. | United States | 4,500,000 | 245,970,000 | |
| PPL Corp. | United States | 18,000,000 | 596,520,000 | |
| Public Service Enterprise Group Inc. | United States | 18,000,000 | 686,520,000 | |
| Sempra Energy | United States | 5,000,000 | 483,800,000 | |
| The Southern Co. | United States | 26,500,000 | 1,164,410,000 | |
| SSE PLC | United Kingdom | 5,000,000 | 122,493,836 | |
| TECO Energy Inc. | United States | 7,000,000 | 120,050,000 | |
| Xcel Energy Inc. | United States | 23,000,000 | 698,280,000 | |
| 10,590,342,040 | ||||
| Total Common Stocks and Other Equity Interests | ||||
| (Cost $35,617,028,169) | 42,270,794,576 | |||
| fEquity-Linked Securities 10.3% | ||||
| Consumer Discretionary 0.4% | ||||
| gDeutsche Bank AG into General Motors Co., 7.50%, 144A | United States | 3,011,000 | 105,917,345 | |
| gJPMorgan Chase & Co. into General Motors Co., 7.50%, | ||||
| 144A | United States | 3,055,000 | 105,678,865 | |
| gWells Fargo & Co. into Ford Motor Co., 8.00%, 144A | United States | 12,200,000 | 184,625,040 | |
| 396,221,250 | ||||
| Consumer Staples 0.3% | ||||
| gBarclays Bank PLC into Safeway Inc., 8.00%, 144A | United States | 3,600,000 | 107,244,720 | |
| gThe Goldman Sachs Group Inc. into Safeway Inc., 7.00%, | ||||
| 144A | United States | 3,100,000 | 115,448,960 | |
| 222,693,680 | ||||
| Energy 2.3% | ||||
| gBank of America Corp. into Schlumberger Ltd., 6.00%, | ||||
| 144A | United States | 1,850,000 | 161,015,305 | |
| gBank of America Corp. into Schlumberger Ltd., 6.00%, | ||||
| 144A | United States | 1,900,000 | 179,522,260 | |
| gBarclays Bank PLC into Peabody Energy Corp., 10.00%, | ||||
| 144A | United States | 4,750,000 | 79,928,250 | |
| gBarclays Bank PLC into Weatherford International Ltd., 9.00%, | ||||
| 144A | United States | 9,957,000 | 134,845,660 | |
| gCitigroup Inc. into Halliburton Co., 6.50%, 144A | United States | 2,550,000 | 112,584,285 | |
| Credit Suisse AG into Anadarko Petroleum Corp., 6.50% | United States | 2,410,000 | 202,566,284 |
76 | Semiannual Report
Franklin Custodian Funds
Statement of Investments, March 31, 2014 (unaudited) (continued)
| Franklin Income Fund | Country | Shares/Warrants | Value | |
| fEquity-Linked Securities (continued) | ||||
| Energy (continued) | ||||
| gCredit Suisse New York into Anadarko Petroleum Corp., 7.00%, | ||||
| 144A | United States | 1,160,000 | $ | 100,564,808 |
| Credit Suisse New York into Chesapeake Energy Corp., | ||||
| 8.50% | United States | 6,390,000 | 158,013,837 | |
| gDeutsche Bank AG into Devon Energy Corp., 6.00%, 144A | United States | 1,600,000 | 105,359,360 | |
| gDeutsche Bank AG into Peabody Energy Corp., 10.00%, | ||||
| 144A | United States | 5,500,000 | 90,267,650 | |
| gDeutsche Bank AG into Schlumberger Ltd., 6.50%, 144A | United States | 1,395,000 | 117,345,586 | |
| gJPMorgan Chase & Co. into Anadarko Petroleum Corp., 7.50%, | ||||
| 144A | United States | 705,000 | 60,021,726 | |
| gJPMorgan Chase & Co. into Devon Energy Corp., 6.00%, | ||||
| 144A | United States | 1,560,000 | 103,293,060 | |
| gJPMorgan Chase & Co. into The Williams Cos. Inc., 7.50%, | ||||
| 144A | United States | 4,420,000 | 176,017,660 | |
| gJPMorgan Chase & Co. into The Williams Cos. Inc., 7.50%, | ||||
| 144A | United States | 2,300,000 | 92,699,660 | |
| gWells Fargo & Co. into Baker Hughes Inc., 6.50%, 144A | United States | 3,600,000 | 197,878,320 | |
| 2,071,923,711 | ||||
| Financials 1.3% | ||||
| gCitigroup Inc. into Bank of America Corp., 7.00%, 144A | United States | 19,600,000 | 272,538,000 | |
| gCitigroup Inc. into Morgan Stanley, 6.50%, 144A | United States | 3,300,000 | 162,012,840 | |
| gDeutsche Bank AG London into Texas Instruments Inc., 6.00%, | ||||
| 144A | United States | 1,455,000 | 66,687,452 | |
| gThe Goldman Sachs Group Inc. into Bank of America Corp., | ||||
| 7.00%, 144A | United States | 7,900,000 | 139,775,490 | |
| gThe Goldman Sachs Group Inc. into Bank of America Corp., | ||||
| 9.00%, 144A | United States | 21,186,000 | 279,292,919 | |
| gJPMorgan Chase & Co. into MetLife Inc., cvt. pfd., 6.00%, | ||||
| 144A | United States | 3,040,000 | 160,403,776 | |
| gMorgan Stanley into Bank of America Corp., 6.50%, 144A | United States | 8,015,000 | 131,081,318 | |
| 1,211,791,795 | ||||
| Industrials 0.3% | ||||
| gBarclays Bank PLC into Caterpillar Inc., 6.50%, 144A | United States | 1,454,000 | 135,085,760 | |
| gCredit Suisse New York into Deere & Co., 6.50%, 144A | United States | 1,650,000 | 150,288,765 | |
| 285,374,525 | ||||
| Information Technology 3.5% | ||||
| gBank of America Corp. into Apple Inc., 8.00%, 144A | United States | 195,000 | 108,477,915 | |
| gBank of America Corp. into Intel Corp., 7.00%, 144A | United States | 9,942,000 | 262,696,472 | |
| gBarclays Bank PLC into Apple Inc., 8.50%, 144A | United States | 312,000 | 148,407,792 | |
| gBarclays Bank PLC into Broadcom Corp., 6.50%, 144A | United States | 3,035,000 | 93,948,425 | |
| gBarclays Bank PLC into Broadcom Corp., 6.50%, 144A | United States | 4,000,000 | 127,405,600 | |
| gBarclays Bank PLC into EMC Corp., 6.00%, 144A | United States | 4,281,000 | 117,840,946 | |
| gCitigroup Inc. into Apple Inc., 7.50%, 144A | United States | 187,500 | 96,966,563 | |
| Credit Suisse New York into Cisco Systems Inc., 6.50% | United States | 6,180,000 | 137,501,910 | |
| Credit Suisse New York into Cisco Systems Inc., 7.50% | United States | 7,360,000 | 167,058,016 | |
| gDeutsche Bank AG into Cisco Systems Inc., 7.00%, 144A | United States | 4,217,000 | 98,110,192 | |
Semiannual Report | 77
Franklin Custodian Funds
Statement of Investments, March 31, 2014 (unaudited) (continued)
| Franklin Income Fund | Country | Shares/Warrants | Value | |
| fEquity-Linked Securities (continued) | ||||
| Information Technology (continued) | ||||
| gDeutsche Bank AG into QUALCOMM Inc., 6.50%, 144A | United States | 1,608,000 | $ | 113,984,849 |
| gThe Goldman Sachs Group Inc. into EMC Corp., 6.00%, | ||||
| 144A | United States | 4,000,000 | 105,224,400 | |
| gThe Goldman Sachs Group Inc. into Microsoft Corp., 6.25%, | ||||
| 144A | United States | 5,600,000 | 225,041,600 | |
| gJPMorgan Chase & Co. into Apple Inc., 7.00%, 144A | United States | 303,000 | 161,254,782 | |
| gJPMorgan Chase & Co. into Intel Corp., 7.00%, 144A | United States | 10,100,000 | 258,855,930 | |
| gMorgan Stanley into Cisco Systems Inc., 7.50%, 144A | United States | 8,018,000 | 186,584,473 | |
| gMorgan Stanley into Intel Corp., 7.50%, 144A | United States | 10,540,000 | 272,245,038 | |
| gWells Fargo & Co. into Apple Inc., 9.00%, 144A | United States | 373,000 | 177,093,126 | |
| gWells Fargo & Co. into Texas Instruments Inc., 6.50%, 144A | United States | 3,435,000 | 142,389,337 | |
| gWells Fargo & Co. into Texas Instruments Inc., 6.50%, 144A | United States | 2,540,000 | 111,113,316 | |
| 3,112,200,682 | ||||
| Materials 2.1% | ||||
| gBarclays Bank PLC into Barrick Gold Corp., 10.00%, 144A | Canada | 5,220,000 | 95,337,558 | |
| gBarclays Bank PLC into The Mosaic Co., 7.50%, 144A | United States | 1,600,000 | 81,640,480 | |
| gBarclays Bank PLC into The Mosaic Co., 6.50%, 144A | United States | 2,046,000 | 102,139,798 | |
| Credit Suisse New York into The Dow Chemical Co., 8.50% | United States | 3,300,000 | 117,790,860 | |
| gCredit Suisse New York into The Dow Chemical Co., 7.50%, | ||||
| 144A | United States | 5,810,000 | 268,094,897 | |
| gDeutsche Bank AG into Rio Tinto PLC, 8.50%, 144A | United Kingdom | 3,800,000 | 212,515,760 | |
| gDeutsche Bank AG/London into AngloGold Ashanti Ltd., | ||||
| 10.00%, 144A | South Africa | 6,000,000 | 104,748,600 | |
| gDeutsche Bank AG/London into Freeport-McMoRan Copper & | ||||
| Gold Inc., 8.00%, 144A | United States | 6,150,000 | 203,569,305 | |
| gDeutsche Bank AG/London into Newmont Mining Corp., 7.50%, | ||||
| 144A | United States | 4,050,000 | 96,264,450 | |
| gThe Goldman Sachs Group Inc. into LyondellBasell Industries NV, | ||||
| 6.00%, 144A | United States | 2,750,000 | 243,806,475 | |
| gJPMorgan Chase & Co. into Barrick Gold Corp., 10.00%, | ||||
| 144A | Canada | 5,123,000 | 99,317,040 | |
| gMorgan Stanley into Freeport-McMoRan Copper & Gold Inc., | ||||
| 10.00%, 144A | United States | 3,515,000 | 116,139,818 | |
| gRoyal Bank of Canada into LyondellBasell Industries NV, 7.00%, | ||||
| 144A | United States | 1,282,000 | 109,454,724 | |
| 1,850,819,765 | ||||
| Telecommunication Services 0.1% | ||||
| gThe Goldman Sachs Group Inc. into Vivendi SA, 9.00%, | ||||
| 144A | France | 6,120,000 | 118,776,348 | |
| Total Equity-Linked Securities | ||||
| (Cost $8,760,707,593) | 9,269,801,756 | |||
| Convertible Preferred Stocks 3.2% | ||||
| Energy 0.6% | ||||
| gChesapeake Energy Corp., 5.75%, cvt. pfd., 144A | United States | 165,500 | 185,463,437 | |
| gChesapeake Energy Corp., 5.75%, cvt. pfd., 144A | United States | 110,000 | 123,543,750 |
78 | Semiannual Report
| Franklin Custodian Funds | |||||
| Statement of Investments, March 31, 2014 (unaudited) (continued) | |||||
| Franklin Income Fund | Country | Shares/Warrants | Value | ||
| Convertible Preferred Stocks (continued) | |||||
| Energy (continued) | |||||
| Halcon Resources Corp., 5.75%, cvt. pfd., A | United States | 108,000 | $ | 88,182,000 | |
| gSanchez Energy Corp., 6.50%, cvt. pfd., B, 144A | United States | 1,200,000 | 93,490,920 | ||
| SandRidge Energy Inc., 7.00%, cvt. pfd. | United States | 800,000 | 81,426,400 | ||
| 572,106,507 | |||||
| Financials 2.0% | |||||
| Bank of America Corp., 7.25%, cvt. pfd., L | United States | 714,118 | 817,100,957 | ||
| FelCor Lodging Trust Inc., 7.80%, cvt. pfd., A | United States | 3,050,000 | 75,823,000 | ||
| aFNMA, 5.38%, cvt. pfd. | United States | 4,700 | 164,500,000 | ||
| MetLife Inc., 5.00%, cvt. pfd. | United States | 3,750,000 | 115,500,000 | ||
| Wells Fargo & Co., 7.50%, cvt. pfd., A | United States | 520,000 | 609,960,000 | ||
| 1,782,883,957 | |||||
| Industrials 0.2% | |||||
| a,cCEVA Holdings LLC, cvt. pfd., A-1 | United Kingdom | 2,897 | 4,838,408 | ||
| a,cCEVA Holdings LLC, cvt. pfd., A-2 | United Kingdom | 110,565 | 138,206,350 | ||
| 143,044,758 | |||||
| Materials 0.0% | |||||
| ArcelorMittal, 6.00%, cvt. pfd. | Luxembourg | 1,200,000 | 29,043,720 | ||
| Utilities 0.4% | |||||
| Dominion Resources Inc., 6.125%, cvt. pfd., A | United States | 1,490,000 | 85,675,000 | ||
| Dominion Resources Inc., 6.00%, cvt. pfd., B | United States | 1,490,000 | 86,077,300 | ||
| NextEra Energy Inc., 5.60%, cvt. pfd. | United States | 2,000,000 | 126,430,000 | ||
| NextEra Energy Inc., 5.89%, cvt. pfd. | United States | 956,500 | 58,662,145 | ||
| NextEra Energy Inc., 5.80%, cvt. pfd. | United States | 1,000,000 | 54,020,000 | ||
| 410,864,445 | |||||
| Total Convertible Preferred Stocks | |||||
| (Cost $2,648,537,444) | 2,937,943,387 | ||||
| Preferred Stocks 0.7% | |||||
| Financials 0.7% | |||||
| gAlly Financial Inc., 7.00%, pfd., 144A | United States | 125,000 | 123,750,000 | ||
| Ally Financial Inc., 8.50%, pfd., A | United States | 813,200 | 22,241,020 | ||
| Citigroup Capital XIII, 8.75%, pfd. | United States | 1,870,000 | 51,873,800 | ||
| aFHLMC, 8.375%, pfd., Z | United States | 16,608,000 | 182,688,000 | ||
| aFNMA, 6.75%, pfd. | United States | 3,000,000 | 26,730,000 | ||
| aFNMA, 7.625%, pfd., R | United States | 2,399,400 | 22,434,390 | ||
| aFNMA, 8.25%, pfd. | United States | 11,784,000 | 123,496,320 | ||
| GMAC Capital Trust I, 8.125%, pfd. | United States | 4,550,000 | 124,215,000 | ||
| Total Preferred Stocks (Cost $1,048,706,482) | 677,428,530 | ||||
| Principal Amount* | |||||
| Convertible Bonds 0.8% | |||||
| Consumer Discretionary 0.4% | |||||
| gVolkswagen International Finance, cvt., sub. note, 144A, 5.50%, | |||||
| 11/09/15 | Germany | 220,000,000 | EUR | 350,041,410 | |
Semiannual Report | 79
| Franklin Custodian Funds | ||||
| Statement of Investments, March 31, 2014 (unaudited) (continued) | ||||
| Franklin Income Fund | Country | Principal Amount* | Value | |
| Convertible Bonds (continued) | ||||
| Energy 0.2% | ||||
| Alpha Natural Resources Inc., cvt., senior note, | ||||
| 3.75%, 12/15/17 | United States | 40,000,000 | $ | 33,750,000 |
| 4.875%, 12/15/20 | United States | 40,000,000 | 32,975,000 | |
| gAmerican Energy - Utica LLC, cvt., sub. note, 144A, 3.50%, | ||||
| 3/01/21 | United States | 35,000,000 | 36,067,500 | |
| Peabody Energy Corp., cvt., junior sub. bond, 4.75%, | ||||
| 12/15/66 | United States | 40,000,000 | 32,550,000 | |
| 135,342,500 | ||||
| Industrials 0.1% | ||||
| Meritor Inc., cvt., senior bond, 7.875%, 3/01/26 | United States | 50,000,000 | 76,562,500 | |
| Materials 0.1% | ||||
| Cemex SAB de CV, cvt., sub. note, | ||||
| 3.25%, 3/15/16 | Mexico | 23,610,000 | 32,495,269 | |
| 3.75%, 3/15/18 | Mexico | 37,300,000 | 53,303,192 | |
| Molycorp Inc., senior note, cvt., 6.00%, 9/01/17 | United States | 60,000,000 | 48,187,500 | |
| 133,985,961 | ||||
| Total Convertible Bonds (Cost $580,584,704) | 695,932,371 | |||
| Corporate Bonds 32.9% | ||||
| Consumer Discretionary 5.9% | ||||
| gAcademy Ltd./Finance Corp., senior note, 144A, 9.25%, | ||||
| 8/01/19 | United States | 67,900,000 | 74,435,375 | |
| AMC Networks Inc., 4.75%, 12/15/22 | United States | 20,000,000 | 20,000,000 | |
| Best Buy Co. Inc., senior note, 5.50%, 3/15/21 | United States | 25,000,000 | 25,187,500 | |
| Cablevision Systems Corp., senior note, | ||||
| 8.625%, 9/15/17 | United States | 80,000,000 | 95,200,000 | |
| 7.75%, 4/15/18 | United States | 120,000,000 | 137,550,000 | |
| Caesars Entertainment Operating Co. Inc., senior secured note, | ||||
| 11.25%, 6/01/17 | United States | 150,000,000 | 144,750,000 | |
| 8.50%, 2/15/20 | United States | 23,700,000 | 21,093,000 | |
| first lien, 9.00%, 2/15/20 | United States | 232,750,000 | 210,056,875 | |
| gCBS Outdoor Americas Capital LLC/CBS Outdoor Americas | ||||
| Capital Corp., | ||||
| senior bond, 144A, 5.625%, 2/15/24 | United States | 22,700,000 | 23,324,250 | |
| senior note, 144A, 5.25%, 2/15/22 | United States | 8,000,000 | 8,220,000 | |
| CCO Holdings LLC/CCO Holdings Capital Corp., | ||||
| senior bond, 5.25%, 9/30/22 | United States | 10,000,000 | 9,912,500 | |
| senior bond, 5.125%, 2/15/23 | United States | 170,000,000 | 164,475,000 | |
| senior bond, 5.75%, 9/01/23 | United States | 62,000,000 | 61,845,000 | |
| senior bond, 5.75%, 1/15/24 | United States | 185,000,000 | 184,075,000 | |
| senior note, 7.375%, 6/01/20 | United States | 60,000,000 | 65,775,000 | |
| senior note, 6.50%, 4/30/21 | United States | 94,500,000 | 100,524,375 | |
| Chrysler Group LLC/CG Co-Issuer Inc., senior secured note, | ||||
| 8.00%, 6/15/19 | United States | 210,000,000 | 231,000,000 | |
| 8.25%, 6/15/21 | United States | 117,200,000 | 133,168,500 | |
| g144A, 8.25%, 6/15/21 | United States | 37,800,000 | 42,950,250 | |
80 | Semiannual Report
| Franklin Custodian Funds | |||||
| Statement of Investments, March 31, 2014 (unaudited) (continued) | |||||
| Franklin Income Fund | Country | Principal Amount* | Value | ||
| Corporate Bonds (continued) | |||||
| Consumer Discretionary (continued) | |||||
| Cinemark USA Inc., | |||||
| senior bond, 4.875%, 6/01/23 | United States | 23,000,000 | $ | 22,223,750 | |
| senior note, 5.125%, 12/15/22 | United States | 50,000,000 | 50,250,000 | ||
| Clear Channel Communications Inc., | |||||
| hsenior note, PIK, 14.00%, 2/01/21 | United States | 124,363,800 | 124,571,114 | ||
| senior secured bond, first lien, 9.00%, 3/01/21 | United States | 339,775,000 | 356,339,031 | ||
| senior secured note, first lien, 9.00%, 12/15/19 | United States | 225,000,000 | 237,375,000 | ||
| senior secured note, first lien, 11.25%, 3/01/21 | United States | 50,000,000 | 55,875,000 | ||
| Clear Channel Worldwide Holdings Inc., senior sub. note, | |||||
| 7.625%, 3/15/20 | United States | 142,500,000 | 154,612,500 | ||
| ClubCorp Club Operations Inc., senior note, 10.00%, | |||||
| 12/01/18 | United States | 77,920,000 | 86,004,200 | ||
| CSC Holdings LLC, senior note, 6.75%, 11/15/21 | United States | 12,800,000 | 14,368,000 | ||
| Cumulus Media Holdings Inc., senior note, 7.75%, 5/01/19 | United States | 50,000,000 | 53,500,000 | ||
| c,hDex Media Inc., senior sub. note, PIK, 12.00%, 1/29/17 | United States | 39,993,271 | 24,095,946 | ||
| DISH DBS Corp., | |||||
| senior bond, 5.00%, 3/15/23 | United States | 240,000,000 | 242,400,000 | ||
| senior note, 5.125%, 5/01/20 | United States | 45,000,000 | 47,025,000 | ||
| senior note, 5.875%, 7/15/22 | United States | 158,000,000 | 169,060,000 | ||
| The Goodyear Tire & Rubber Co., senior note, | |||||
| 8.25%, 8/15/20 | United States | 101,800,000 | 113,888,750 | ||
| 6.50%, 3/01/21 | United States | 62,900,000 | 68,875,500 | ||
| HD Supply Inc., senior note, 7.50%, 7/15/20 | United States | 60,000,000 | 65,775,000 | ||
| gJaguar Land Rover Automotive PLC, | |||||
| 144A, 8.125%, 5/15/21 | United Kingdom | 20,000,000 | 22,908,400 | ||
| senior note, 144A, 8.25%, 3/15/20 | United Kingdom | 40,000,000 | GBP | 75,855,319 | |
| KB Home, | |||||
| senior bond, 7.50%, 9/15/22 | United States | 35,000,000 | 38,500,000 | ||
| senior note, 9.10%, 9/15/17 | United States | 49,000,000 | 58,065,000 | ||
| senior note, 7.25%, 6/15/18 | United States | 70,500,000 | 79,665,000 | ||
| senior note, 8.00%, 3/15/20 | United States | 20,000,000 | 22,800,000 | ||
| senior note, 7.00%, 12/15/21 | United States | 40,000,000 | 43,150,000 | ||
| Lamar Media Corp., senior sub. bond, 5.00%, 5/01/23 | United States | 22,000,000 | 22,110,000 | ||
| gLaureate Education Inc., 144A, 9.25%, 9/01/19 | United States | 25,000,000 | 26,750,000 | ||
| MGM Resorts International, senior note, | |||||
| 6.625%, 7/15/15 | United States | 25,200,000 | 26,838,000 | ||
| 10.00%, 11/01/16 | United States | 90,000,000 | 107,887,500 | ||
| 8.625%, 2/01/19 | United States | 44,800,000 | 53,872,000 | ||
| 5.25%, 3/31/20 | United States | 60,000,000 | 61,950,000 | ||
| 6.75%, 10/01/20 | United States | 27,450,000 | 30,503,813 | ||
| 7.75%, 3/15/22 | United States | 80,000,000 | 93,200,000 | ||
| g,hNew Academy Finance Co. LLC/Corp., senior note, 144A, PIK, | |||||
| 8.00%, 6/15/18 | United States | 20,000,000 | 20,575,000 | ||
| Quebecor Media Inc., senior bond, 5.75%, 1/15/23 | Canada | 75,300,000 | 75,864,750 | ||
| Regal Entertainment Group, senior note, 5.75%, 3/15/22 | United States | 50,000,000 | 51,625,000 | ||
| Shea Homes LP/Funding Corp., senior secured note, 8.625%, | |||||
| 5/15/19 | United States | 93,200,000 | 103,219,000 | ||
Semiannual Report | 81
Franklin Custodian Funds
Statement of Investments, March 31, 2014 (unaudited) (continued)
| Franklin Income Fund | Country | Principal Amount* | Value | ||
| Corporate Bonds (continued) | |||||
| Consumer Discretionary (continued) | |||||
| gSirius XM Holdings Inc., senior note, 144A, | |||||
| 4.25%, 5/15/20 | United States | 10,000,000 | $ | 9,800,000 | |
| 5.875%, 10/01/20 | United States | 50,000,000 | 52,750,000 | ||
| 5.75%, 8/01/21 | United States | 30,000,000 | 31,350,000 | ||
| 4.625%, 5/15/23 | United States | 63,400,000 | 59,913,000 | ||
| Time Warner Cable Inc., senior note, | |||||
| 4.125%, 2/15/21 | United States | 24,000,000 | 25,165,416 | ||
| 4.00%, 9/01/21 | United States | 30,000,000 | 31,174,590 | ||
| gUnivision Communications Inc., | |||||
| senior note, 144A, 8.50%, 5/15/21 | United States | 65,000,000 | 72,312,500 | ||
| senior secured note, 144A, 6.875%, 5/15/19 | United States | 80,000,000 | 86,200,000 | ||
| senior secured note, 144A, 5.125%, 5/15/23 | United States | 84,500,000 | 86,823,750 | ||
| gUPCB Finance III Ltd., senior secured note, 144A, 6.625%, | |||||
| 7/01/20 | Netherlands | 56,000,000 | 60,200,000 | ||
| Videotron Ltd., senior note, 5.00%, 7/15/22 | Canada | 10,000,000 | 10,075,000 | ||
| gVirgin Media Secured Finance PLC, senior secured bond, 144A, | |||||
| 5.50%, 1/15/25 | United Kingdom | 75,000,000 | 75,890,625 | ||
| Visant Corp., senior note, 10.00%, 10/01/17 | United States | 51,066,000 | 51,129,832 | ||
| gWynn Las Vegas LLC/Capital Corp., senior bond, 144A, 4.25%, | |||||
| 5/30/23 | United States | 28,300,000 | 27,380,250 | ||
| gWynn Macau Ltd., senior note, 144A, 5.25%, 10/15/21 | Macau | 25,000,000 | 25,546,875 | ||
| 5,360,832,036 | |||||
| Consumer Staples 0.8% | |||||
| Alliance One International Inc., secured note, second lien, | |||||
| 9.875%, 7/15/21 | United States | 60,000,000 | 61,650,000 | ||
| gBoparan Finance PLC, senior note, 144A, | |||||
| 9.75%, 4/30/18 | United Kingdom | 55,950,000 | EUR | 83,206,768 | |
| 9.875%, 4/30/18 | United Kingdom | 20,000,000 | GBP | 36,031,276 | |
| gESAL GmbH, senior note, 144A, 6.25%, 2/05/23 | Brazil | 50,000,000 | 47,532,750 | ||
| gInnovation Ventures LLC/Finance Corp., secured note, 144A, | |||||
| 9.50%, 8/15/19 | United States | 25,000,000 | 23,812,500 | ||
| gJBS USA LLC/Finance Inc., senior note, 144A, | |||||
| 8.25%, 2/01/20 | United States | 50,100,000 | 55,110,000 | ||
| 7.25%, 6/01/21 | United States | 88,500,000 | 94,695,000 | ||
| 7.25%, 6/01/21 | United States | 59,600,000 | 63,623,000 | ||
| gPost Holdings Inc., senior note, 144A, 6.75%, 12/01/21 | United States | 19,000,000 | 20,163,750 | ||
| Spectrum Brands Inc., senior note, 6.625%, 11/15/22 | United States | 15,000,000 | 16,406,250 | ||
| SUPERVALU Inc., senior note, 8.00%, 5/01/16 | United States | 100,000,000 | 110,750,000 | ||
| U.S. Foods Inc., 8.50%, 6/30/19 | United States | 80,000,000 | 86,660,000 | ||
| 699,641,294 | |||||
| Energy 7.5% | |||||
| Access Midstream Partner LP/ACMP Finance Corp., senior note, | |||||
| 4.875%, 5/15/23 | United States | 76,000,000 | 76,950,000 | ||
| Alpha Natural Resources Inc., senior note, | |||||
| 6.00%, 6/01/19 | United States | 43,000,000 | 33,217,500 | ||
| i6.25%, 6/01/21 | United States | 110,000,000 | 83,325,000 |
82 | Semiannual Report
Franklin Custodian Funds
Statement of Investments, March 31, 2014 (unaudited) (continued)
| Franklin Income Fund | Country | Principal Amount* | Value | |
| Corporate Bonds (continued) | ||||
| Energy (continued) | ||||
| gAntero Resources Corp., senior note, 144A, 5.375%, | ||||
| 11/01/21 | United States | 33,000,000 | $ | 33,515,625 |
| Antero Resources Finance Corp., senior note, 7.25%, | ||||
| 8/01/19 | United States | 21,550,000 | 23,058,500 | |
| Arch Coal Inc., | ||||
| gsecured note, second lien, 144A, 8.00%, 1/15/19 | United States | 20,000,000 | 20,050,000 | |
| senior note, 7.00%, 6/15/19 | United States | 111,000,000 | 86,302,500 | |
| senior note, 7.25%, 6/15/21 | United States | 130,000,000 | 98,800,000 | |
| gAtlas Resource Escrow Co., senior note, 144A, 9.25%, | ||||
| 8/15/21 | United States | 35,000,000 | 38,675,000 | |
| jATP Oil & Gas Corp., senior secured note, 11.875%, | ||||
| 5/01/15 | United States | 50,000,000 | 656,250 | |
| Berry Petroleum Co., senior bond, 6.375%, 9/15/22 | United States | 28,000,000 | 29,120,000 | |
| Bill Barrett Corp., senior note, 7.00%, 10/15/22 | United States | 37,000,000 | 39,127,500 | |
| BreitBurn Energy Partners LP/Finance Corp., senior bond, | ||||
| 7.875%, 4/15/22 | United States | 28,800,000 | 31,320,000 | |
| Callon Petroleum Co., senior secured note, 13.00%, | ||||
| 9/15/16 | United States | 27,552,750 | 28,524,260 | |
| gCalumet Specialty Products Partners LP and Calumet Finance | ||||
| Corp., senior note, 144A, 6.50%, 4/15/21 | United States | 20,000,000 | 20,200,000 | |
| Calumet Specialty Products Partners LP/Finance Corp., | ||||
| senior note, 7.625%, 1/15/22 | United States | 20,000,000 | 21,275,000 | |
| Carrizo Oil & Gas Inc., senior note, | ||||
| 8.625%, 10/15/18 | United States | 44,800,000 | 48,272,000 | |
| 7.50%, 9/15/20 | United States | 21,300,000 | 23,536,500 | |
| CGG, senior note, 6.50%, 6/01/21 | France | 75,000,000 | 76,500,000 | |
| Chaparral Energy Inc., senior note, 7.625%, 11/15/22 | United States | 35,400,000 | 38,497,500 | |
| CHC Helicopter SA, | ||||
| senior note, 9.375%, 6/01/21 | Canada | 52,400,000 | 55,806,000 | |
| senior secured note, first lien, 9.25%, 10/15/20 | Canada | 130,500,000 | 142,245,000 | |
| Chesapeake Energy Corp., senior note, | ||||
| 6.50%, 8/15/17 | United States | 115,000,000 | 129,662,500 | |
| 7.25%, 12/15/18 | United States | 178,065,000 | 208,336,050 | |
| 6.875%, 11/15/20 | United States | 30,500,000 | 34,770,000 | |
| 5.375%, 6/15/21 | United States | 50,000,000 | 52,875,000 | |
| 5.75%, 3/15/23 | United States | 203,150,000 | 216,100,812 | |
| Clayton Williams Energy Inc., senior note, 7.75%, 4/01/19 | United States | 75,000,000 | 80,062,500 | |
| Concho Resources Inc, senior bond, 5.50%, 4/01/23 | United States | 27,000,000 | 28,215,000 | |
| CONSOL Energy Inc., senior note, 8.25%, 4/01/20 | United States | 55,850,000 | 60,946,313 | |
| Denbury Resources Inc., senior sub. note, 4.625%, 7/15/23 | United States | 160,000,000 | 149,600,000 | |
| gDiamondback Energy Inc., senior note, 144A, 7.625%, | ||||
| 10/01/21 | United States | 30,000,000 | 32,550,000 | |
| El Paso Corp., senior note, MTN, 7.75%, 1/15/32 | United States | 123,000,000 | 132,166,944 | |
| Energy Transfer Equity LP, senior bond, 5.875%, 1/15/24 | United States | 65,000,000 | 66,787,500 | |
| Energy Transfer Partners LP, senior bond, 3.60%, 2/01/23 | United States | 25,000,000 | 23,959,875 | |
| Energy XXI Gulf Coast Inc., senior note, 9.25%, 12/15/17 | United States | 70,075,000 | 76,556,937 | |
| EP Energy LLC/Finance Inc., senior note, 9.375%, 5/01/20 | United States | 35,000,000 | 40,643,750 | |
| EXCO Resources Inc., senior note, 7.50%, 9/15/18 | United States | 52,400,000 | 52,924,000 |
Semiannual Report | 83
Franklin Custodian Funds
Statement of Investments, March 31, 2014 (unaudited) (continued)
| Franklin Income Fund | Country | Principal Amount* | Value | |||
| Corporate Bonds (continued) | ||||||
| Energy (continued) | ||||||
| gExpro Finance Luxembourg, senior secured note, 144A, 8.50%, | ||||||
| 12/15/16 | United Kingdom | 115,119,000 | $ | 120,515,203 | ||
| Forest Oil Corp., senior note, 7.25%, 6/15/19 | United States | 18,932,000 | 16,683,825 | |||
| gGibson Energy Inc., senior note, 144A, 6.75%, 7/15/21 | Canada | 35,000,000 | 37,712,500 | |||
| Halcon Resources Corp., senior note, | ||||||
| 9.75%, 7/15/20 | United States | 100,000,000 | 108,250,000 | |||
| 8.875%, 5/15/21 | United States | 28,000,000 | 29,190,000 | |||
| g144A, 9.25%, 2/15/22 | United States | 63,100,000 | 66,097,250 | |||
| gHercules Offshore Inc., senior note, 144A, 8.75%, 7/15/21 | United States | 35,000,000 | 38,150,000 | |||
| gKinder Morgan Inc., | ||||||
| senior secured bond, first lien, 144A, 5.625%, 11/15/23 | United States | 130,300,000 | 129,536,833 | |||
| senior secured note, 144A, 5.00%, 2/15/21 | United States | 36,500,000 | 36,737,944 | |||
| gLaredo Petroleum Inc., senior note, 144A, 5.625%, 1/15/22 | United States | 15,000,000 | 15,206,250 | |||
| gLightstream Resources Ltd., senior note, 144A, 8.625%, | ||||||
| 2/01/20 | Canada | 30,000,000 | 30,150,000 | |||
| Linn Energy LLC/Finance Corp., senior note, | ||||||
| 6.50%, 5/15/19 | United States | 5,000,000 | 5,237,500 | |||
| 8.625%, 4/15/20 | United States | 72,500,000 | 79,115,625 | |||
| 7.75%, 2/01/21 | United States | 75,000,000 | 81,000,000 | |||
| g144A, 6.25%, 11/01/19 | United States | 130,000,000 | 136,175,000 | |||
| Magnum Hunter Resources Corp., senior note, 9.75%, | ||||||
| 5/15/20 | United States | 60,000,000 | 66,750,000 | |||
| gMEG Energy Corp., senior bond, 144A, 7.00%, 3/31/24 | Canada | 100,000,000 | 106,000,000 | |||
| Midstates Petroleum Co. Inc./LLC, senior note, | ||||||
| 10.75%, 10/01/20 | United States | 55,000,000 | 61,050,000 | |||
| 9.25%, 6/01/21 | United States | 38,100,000 | 40,005,000 | |||
| NFR Energy LLC/NFR Finance Corp., 9.75%, 2/15/17 | United States | 25,000,000 | 26,000,000 | |||
| gNGPL PipeCo LLC, secured note, 144A, 7.119%, 12/15/17 | United States | 70,000,000 | 69,125,000 | |||
| gNiska Gas Storage Canada ULC/Finance Corp., senior note, | ||||||
| 144A, 6.50%, 4/01/19 | United States | 75,000,000 | 74,156,250 | |||
| gOcean Rig UDW Inc., senior note, 144A, 7.25%, 4/01/19 | Cyprus | 75,000,000 | 74,953,125 | |||
| Offshore Group Investment Ltd., | ||||||
| senior bond, first lien, 7.125%, 4/01/23 | United States | 32,100,000 | 32,822,250 | |||
| senior secured note, first lien, 7.50%, 11/01/19 | United States | 100,000,000 | 107,312,500 | |||
| Peabody Energy Corp., senior note, | ||||||
| 6.00%, 11/15/18 | United States | 100,000,000 | 105,375,000 | |||
| 6.25%, 11/15/21 | United States | 165,000,000 | 166,237,500 | |||
| Penn Virginia Corp., senior note, 8.50%, 5/01/20 | United States | 150,700,000 | 168,407,250 | |||
| Penn Virginia Resource Partners LP/Finance Corp. II, | ||||||
| senior note, 6.50%, 5/15/21 | United States | 28,000,000 | 30,030,000 | |||
| Petrobras Global Finance BV, senior note, | ||||||
| 4.375%, 5/20/23 | Brazil | 85,000,000 | 77,926,725 | |||
| 6.25%, 3/17/24 | Brazil | 50,000,000 | 51,435,500 | |||
| Petrobras International Finance Co., senior note, 5.375%, | ||||||
| 1/27/21 | Brazil | 65,000,000 | 65,825,500 | |||
| PetroQuest Energy Inc., senior note, 10.00%, 9/01/17 | United States | 60,000,000 | 64,200,000 | |||
| Plains Exploration & Production Co., senior note, | ||||||
| 6.50%, 11/15/20 | United States | 50,000,000 | 55,312,500 | |||
| 6.875%, 2/15/23 | United States | 21,400,000 | 23,914,500 | |||
| 84 | | | Semiannual Report | ||||
| Franklin Custodian Funds | ||||
| Statement of Investments, March 31, 2014 (unaudited) (continued) | ||||
| Franklin Income Fund | Country | Principal Amount* | Value | |
| Corporate Bonds (continued) | ||||
| Energy (continued) | ||||
| Quicksilver Resources Inc., senior note, | ||||
| 9.125%, 8/15/19 | United States | 90,000,000 | $ | 90,000,000 |
| g144A, 11.00%, 7/01/21 | United States | 86,000,000 | 92,665,000 | |
| Range Resources Corp., senior sub. note, 5.00%, 3/15/23 | United States | 12,500,000 | 12,718,750 | |
| Regency Energy Partners LP/Regency Energy Finance Corp., | ||||
| senior bond, 5.50%, 4/15/23 | United States | 46,000,000 | 46,575,000 | |
| senior note, 5.875%, 3/01/22 | United States | 15,400,000 | 16,016,000 | |
| senior note, 4.50%, 11/01/23 | United States | 55,700,000 | 52,079,500 | |
| gRockies Express Pipeline LLC, | ||||
| senior bond, 144A, 6.85%, 7/15/18 | United States | 25,000,000 | 25,937,500 | |
| senior note, 144A, 6.00%, 1/15/19 | United States | 32,200,000 | 32,602,500 | |
| Sabine Pass Liquefaction LLC, first lien, | ||||
| 5.625%, 2/01/21 | United States | 126,200,000 | 130,774,750 | |
| 5.625%, 4/15/23 | United States | 108,800,000 | 108,664,000 | |
| g144A, 6.25%, 3/15/22 | United States | 90,000,000 | 93,937,500 | |
| Sabine Pass LNG LP, | ||||
| first lien, 6.50%, 11/01/20 | United States | 30,000,000 | 31,650,000 | |
| senior secured note, 7.50%, 11/30/16 | United States | 151,000,000 | 167,610,000 | |
| gSamson Investment Co., senior note, 144A, 9.75%, 2/15/20 | United States | 199,200,000 | 218,124,000 | |
| gSanchez Energy Corp., senior note, 144A, 7.75%, 6/15/21 | United States | 74,200,000 | 79,579,500 | |
| SandRidge Energy Inc., senior note, | ||||
| 8.75%, 1/15/20 | United States | 110,000,000 | 119,075,000 | |
| 7.50%, 3/15/21 | United States | 120,000,000 | 128,700,000 | |
| 8.125%, 10/15/22 | United States | 46,250,000 | 50,643,750 | |
| 7.50%, 2/15/23 | United States | 50,000,000 | 53,250,000 | |
| Stone Energy Corp., senior bond, 7.50%, 11/15/22 | United States | 125,000,000 | 135,937,500 | |
| W&T Offshore Inc., senior note, 8.50%, 6/15/19 | United States | 128,400,000 | 139,314,000 | |
| The Williams Cos. Inc., senior bond, 3.70%, 1/15/23 | United States | 55,000,000 | 50,009,740 | |
| WPX Energy Inc., senior note, 6.00%, 1/15/22 | United States | 48,500,000 | 49,955,000 | |
| 6,757,546,836 | ||||
| Financials 3.1% | ||||
| Ally Financial Inc., senior note, 6.25%, 12/01/17 | United States | 46,600,000 | 52,192,000 | |
| kBank of America Corp., junior sub. bond, | ||||
| M, 8.125% to 5/15/18, FRN thereafter, Perpetual | United States | 100,000,000 | 114,797,300 | |
| U, 5.20% to 6/01/23, FRN thereafter, Perpetual | United States | 52,000,000 | 49,140,000 | |
| kBarclays PLC, sub. bond, 8.25% to 12/15/18, FRN thereafter, | ||||
| Perpetual | United Kingdom | 75,000,000 | 78,925,875 | |
| CIT Group Inc., senior bond, 5.00%, 8/01/23 | United States | 60,000,000 | 61,650,000 | |
| kCitigroup Inc., junior sub. bond, | ||||
| 5.35% to 05/15/23, FRN thereafter, Perpetual | United States | 169,195,000 | 157,634,075 | |
| 5.95% to 1/30/23, FRN thereafter, Perpetual | United States | 138,500,000 | 135,556,875 | |
| Crown Castle International Corp., senior bond, 5.25%, | ||||
| 1/15/23 | United States | 21,000,000 | 21,446,250 | |
| E*TRADE Financial Corp., senior note, 6.00%, 11/15/17 | United States | 49,900,000 | 52,706,875 | |
| kFifth Third Bancorp, junior sub. bond, 5.10% to 6/30/23, | ||||
| FRN thereafter, Perpetual | United States | 54,000,000 | 49,815,000 | |
| kGeneral Electric Capital Corp., C, junior sub. bond, 5.25% to | ||||
| 6/15/23, FRN thereafter, Perpetual | United States | 82,400,000 | 80,356,480 | |
| Semiannual Report | 85 | ||||
| Franklin Custodian Funds | ||||
| Statement of Investments, March 31, 2014 (unaudited) (continued) | ||||
| Franklin Income Fund | Country | Principal Amount* | Value | |
| Corporate Bonds (continued) | ||||
| Financials (continued) | ||||
| General Motors Financial Co. Inc., senior bond, 4.25%, | ||||
| 5/15/23 | United States | 55,209,000 | $ | 54,656,910 |
| International Lease Finance Corp., senior note, | ||||
| 8.75%, 3/15/17 | United States | 130,000,000 | 153,075,000 | |
| 8.875%, 9/01/17 | United States | 63,300,000 | 75,643,500 | |
| kJPMorgan Chase & Co., | ||||
| junior sub. bond, 6.00% to 8/01/23, FRN thereafter, | ||||
| Perpetual | United States | 100,000,000 | 99,000,000 | |
| junior sub. bond, 6.125% to 4/30/24, FRN thereafter, | ||||
| Perpetual | United States | 40,000,000 | 39,539,880 | |
| junior sub. bond, 6.75% to 2/01/24, FRN thereafter, | ||||
| Perpetual | United States | 100,000,000 | 105,750,000 | |
| junior sub. note, 1, 7.90% to 4/30/19, FRN thereafter, | ||||
| Perpetual | United States | 815,000,000 | 925,025,000 | |
| Q, junior sub. bond, 5.15% to 5/01/23, FRN thereafter, | ||||
| Perpetual | United States | 100,000,000 | 94,250,000 | |
| Kinetic Concepts Inc./USA, senior note, 12.50%, 11/01/19 | United States | 32,000,000 | 37,520,000 | |
| Morgan Stanley, senior note, 5.50%, 1/26/20 | United States | 80,000,000 | 90,366,400 | |
| Nationstar Mortgage LLC/Nationstar Capital Corp., senior note, | ||||
| 9.625%, 5/01/19 | United States | 35,000,000 | 38,850,000 | |
| gNuveen Investments Inc., senior note, 144A, | ||||
| 9.125%, 10/15/17 | United States | 50,000,000 | 53,125,000 | |
| 9.50%, 10/15/20 | United States | 50,000,000 | 53,500,000 | |
| kPNC Financial Services Group Inc., junior sub. note, 4.85% to | ||||
| 6/01/23, FRN thereafter, Perpetual | United States | 54,000,000 | 50,760,000 | |
| SLM Corp., 6.125%, 3/25/24 | United States | 50,000,000 | 50,062,500 | |
| 2,775,344,920 | ||||
| Health Care 2.6% | ||||
| Alere Inc., senior note, 7.25%, 7/01/18 | United States | 20,800,000 | 22,984,000 | |
| CHS/Community Health Systems Inc., senior note, | ||||
| 8.00%, 11/15/19 | United States | 129,100,000 | 142,494,125 | |
| g144A, 5.125%, 8/01/21 | United States | 42,400,000 | 43,672,000 | |
| g144A, 6.875%, 2/01/22 | United States | 89,000,000 | 93,450,000 | |
| gForest Laboratories Inc., senior note 144A, 5.00%, | ||||
| 12/15/21 | United States | 25,000,000 | 26,500,000 | |
| gGrifols Worldwide Operations Ltd., senior note, 144A, 5.25%, | ||||
| 4/01/22 | Spain | 11,500,000 | 11,787,500 | |
| HCA Holdings Inc., senior note, 6.25%, 2/15/21 | United States | 47,200,000 | 50,645,600 | |
| HCA Inc., | ||||
| secured note, 5.00%, 3/15/24 | United States | 138,900,000 | 139,507,687 | |
| senior note, 6.50%, 2/15/16 | United States | 35,550,000 | 38,660,625 | |
| senior note, 8.00%, 10/01/18 | United States | 60,000,000 | 71,250,000 | |
| senior note, 7.50%, 2/15/22 | United States | 150,000,000 | 171,750,000 | |
| senior note, 5.875%, 5/01/23 | United States | 104,700,000 | 107,971,875 | |
| senior secured bond, first lien, 4.75%, 5/01/23 | United States | 58,500,000 | 57,988,125 | |
| senior secured note, 6.50%, 2/15/20 | United States | 114,300,000 | 128,301,750 | |
86 | Semiannual Report
Franklin Custodian Funds
Statement of Investments, March 31, 2014 (unaudited) (continued)
| Franklin Income Fund | Country | Principal Amount* | Value | |
| Corporate Bonds (continued) | ||||
| Health Care (continued) | ||||
| g,hJaguar Holding Co. I, senior note, 144A, PIK, 9.375%, | ||||
| 10/15/17 | United States | 61,100,000 | $ | 64,536,875 |
| Tenet Healthcare Corp., | ||||
| 4.375%, 10/01/21 | United States | 85,000,000 | 82,450,000 | |
| first lien, 6.25%, 11/01/18 | United States | 88,211,775 | 97,639,408 | |
| senior note, 9.875%, 7/01/14 | United States | 30,000,000 | 30,607,500 | |
| senior note, 8.00%, 8/01/20 | United States | 190,000,000 | 208,050,000 | |
| senior note, 8.125%, 4/01/22 | United States | 360,000,000 | 403,200,000 | |
| gsenior note, 144A, 5.00%, 3/01/19 | United States | 20,450,000 | 20,475,563 | |
| msenior note, FRN, 9.25%, 2/01/15 | United States | 101,300,000 | 107,884,500 | |
| senior secured note, first lien, 4.50%, 4/01/21 | United States | 41,000,000 | 40,231,250 | |
| gValeant Pharmaceuticals International Inc., senior note, 144A, | ||||
| 6.75%, 8/15/18 | United States | 58,900,000 | 65,084,500 | |
| 7.50%, 7/15/21 | United States | 53,900,000 | 60,907,000 | |
| 5.625%, 12/01/21 | United States | 25,650,000 | 26,996,625 | |
| gVPI Escrow Corp., senior note, 144A, 6.375%, 10/15/20 | United States | 42,900,000 | 46,546,500 | |
| 2,361,573,008 | ||||
| Industrials 1.8% | ||||
| gAbengoa Finance SAU, senior note, 144A, | ||||
| 8.875%, 11/01/17 | Spain | 100,000,000 | 112,937,500 | |
| 7.75%, 2/01/20 | Spain | 36,600,000 | 39,711,000 | |
| The ADT Corp., | ||||
| senior bond, 4.125%, 6/15/23 | United States | 95,000,000 | 85,230,770 | |
| senior note, 3.50%, 7/15/22 | United States | 18,000,000 | 15,852,078 | |
| gAhern Rentals Inc., secured note, second lien, 144A, 9.50%, | ||||
| 6/15/18 | United States | 40,000,000 | 44,450,000 | |
| gAlgeco Scotsman Global Finance PLC, | ||||
| senior note, 144A, 10.75%, 10/15/19 | United Kingdom | 40,000,000 | 44,500,000 | |
| senior secured note, first lien, 144A, 8.50%, 10/15/18 | United Kingdom | 98,500,000 | 107,795,938 | |
| gAviation Capital Group, 144A, 6.75%, 4/06/21 | United States | 48,520,000 | 53,959,771 | |
| gBlueline Rental Finance Corp., second lien, 144A, 7.00%, | ||||
| 2/01/19 | United States | 10,800,000 | 11,448,000 | |
| gBombardier Inc., | ||||
| senior bond, 144A, 6.125%, 1/15/23 | Canada | 81,300,000 | 82,519,500 | |
| senior note, 144A, 6.00%, 10/15/22 | Canada | 35,000,000 | 35,000,000 | |
| c,gCEVA Group PLC, | ||||
| first lien, 144A, 7.00%, 3/01/21 | United Kingdom | 15,000,000 | 15,318,750 | |
| secured note, 144A, 9.00%, 9/01/21 | United Kingdom | 20,000,000 | 20,475,000 | |
| senior note, first lien, 144A, 4.00%, 5/01/18 | United Kingdom | 186,778,982 | 173,704,453 | |
| Hertz Corp., senior note, | ||||
| 6.75%, 4/15/19 | United States | 125,775,000 | 135,365,344 | |
| 7.375%, 1/15/21 | United States | 30,000,000 | 33,150,000 | |
| gIcahn Enterprises LP/Icahn Finance Corp., senior note, 144A, | ||||
| 5.875%, 2/01/22 | United States | 50,000,000 | 50,875,000 | |
| Iron Mountain Inc., senior sub. bond, 5.75%, 8/15/24 | United States | 73,000,000 | 71,448,750 | |
| Navistar International Corp., senior note, 8.25%, 11/01/21 | United States | 147,975,000 | 151,489,406 | |
| Nielsen Finance LLC/Co., senior note, 4.50%, 10/01/20 | Netherlands | 15,000,000 | 15,187,500 |
Semiannual Report | 87
Franklin Custodian Funds
Statement of Investments, March 31, 2014 (unaudited) (continued)
| Franklin Income Fund | Country | Principal Amount* | Value | |
| Corporate Bonds (continued) | ||||
| Industrials (continued) | ||||
| gStena AB, senior bond, 144A, 7.00%, 2/01/24 | Sweden | 46,600,000 | $ | 47,532,000 |
| gStena International SA, secured bond, 144A, 5.75%, | ||||
| 3/01/24 | Sweden | 57,900,000 | 58,008,563 | |
| TransDigm Inc., senior sub. note, 5.50%, 10/15/20 | United States | 59,500,000 | 60,838,750 | |
| United Continental Holdings Inc., senior bond, | ||||
| A, 6.00%, 7/15/26 | United States | 40,000,000 | 38,000,000 | |
| B, 6.00%, 7/15/28 | United States | 40,000,000 | 36,900,000 | |
| United Rentals North America Inc., | ||||
| senior bond, 5.75%, 11/15/24 | United States | 69,700,000 | 70,309,875 | |
| senior sub. note, 8.375%, 9/15/20 | United States | 45,000,000 | 50,062,500 | |
| 1,662,070,448 | ||||
| Information Technology 3.1% | ||||
| gAlcatel-Lucent USA Inc., senior note, 144A, 6.75%, | ||||
| 11/15/20 | United States | 55,900,000 | 59,393,750 | |
| gBelden Inc., senior sub. note, 144A, 5.50%, 9/01/22 | United States | 40,000,000 | 40,700,000 | |
| gBMC Software Finance Inc., senior note, 144A, 8.125%, | ||||
| 7/15/21 | United States | 58,200,000 | 61,546,500 | |
| CDW LLC/Finance Corp., | ||||
| senior note, 8.00%, 12/15/18 | United States | 32,372,000 | 35,123,620 | |
| senior note, 8.50%, 4/01/19 | United States | 125,000,000 | 137,500,000 | |
| senior sub. note, 12.535%, 10/12/17 | United States | 2,602,000 | 2,732,100 | |
| Ceridian Corp., | ||||
| gsecured note, 144A, 8.875%, 7/15/19 | United States | 36,100,000 | 41,154,000 | |
| senior note, 11.25%, 11/15/15 | United States | 35,000,000 | 35,350,000 | |
| g,hCommScope Holdings Co. Inc., senior note, 144A, PIK, 6.625%, | ||||
| 6/01/20 | United States | 44,400,000 | 47,175,000 | |
| gCommScope Inc., senior note, 144A, 8.25%, 1/15/19 | United States | 15,166,000 | 16,493,025 | |
| First Data Corp., | ||||
| senior bond, 12.625%, 1/15/21 | United States | 580,000,000 | 693,100,000 | |
| senior note, 10.625%, 6/15/21 | United States | 63,000,000 | 71,190,000 | |
| gsenior secured bond, 144A, 8.25%, 1/15/21 | United States | 425,000,000 | 463,250,000 | |
| g,hsenior secured note, 144A, PIK, 8.75%, 1/15/22 | United States | 208,158,000 | 228,453,405 | |
| gsenior secured note, first lien, 144A, 6.75%, 11/01/20 | United States | 107,000,000 | 115,560,000 | |
| Freescale Semiconductor Inc., | ||||
| gsecured note, 144A, 5.00%, 5/15/21 | United States | 59,450,000 | 60,936,250 | |
| senior note, 8.05%, 2/01/20 | United States | 158,694,000 | 175,158,502 | |
| senior note, 10.75%, 8/01/20 | United States | 119,258,000 | 138,935,570 | |
| gsenior secured note, 144A, 6.00%, 1/15/22 | United States | 41,850,000 | 44,517,938 | |
| g,hHealthcare Technology Inc., senior note, 144A, PIK, 7.375%, | ||||
| 9/01/18 | United States | 40,000,000 | 40,800,000 | |
| IAC/InterActiveCorp, senior note, 4.75%, 12/15/22 | United States | 45,000,000 | 44,268,750 | |
| Infor U.S. Inc., senior note, 9.375%, 4/01/19 | United States | 40,800,000 | 46,155,000 | |
| NCR Corp., senior note, | ||||
| 4.625%, 2/15/21 | United States | 22,000,000 | 22,220,000 | |
| 5.00%, 7/15/22 | United States | 26,000,000 | 26,162,500 | |
| gNCR Escrow Corp., senior note, 144A, 6.375%, 12/15/23 | United States | 70,000,000 | 74,725,000 |
88 | Semiannual Report
Franklin Custodian Funds
Statement of Investments, March 31, 2014 (unaudited) (continued)
| Franklin Income Fund | Country | Principal Amount* | Value | ||
| Corporate Bonds (continued) | |||||
| Information Technology (continued) | |||||
| gNII International Telecom SCA, senior note, 144A, 11.375%, | |||||
| 8/15/19 | United States | 25,000,000 | $ | 17,750,000 | |
| gSanmina Corp., senior note, 144A, 7.00%, 5/15/19 | United States | 55,000,000 | 58,506,250 | ||
| Sterling International Inc., senior note, 11.00%, 10/01/19 | United States | 36,400,000 | 38,493,000 | ||
| 2,837,350,160 | |||||
| Materials 3.2% | |||||
| iAngloGold Ashanti Holdings PLC, senior note, 8.50%, | |||||
| 7/30/20 | South Africa | 35,000,000 | 38,675,000 | ||
| gArdagh Packaging Finance PLC/Ardagh MP Holdings USA Inc., | |||||
| senior note, 144A, | |||||
| 6.25%, 1/31/19 | Ireland | 20,700,000 | 21,683,250 | ||
| 7.00%, 11/15/20 | Ireland | 10,588,235 | 11,177,206 | ||
| 6.75%, 1/31/21 | Ireland | 22,600,000 | 23,744,125 | ||
| Ball Corp., senior bond, 4.00%, 11/15/23 | United States | 90,000,000 | 84,600,000 | ||
| gBeverage Packaging Holdings Luxembourg II SA, senior note, | |||||
| 144A, 5.625%, 12/15/16 | United States | 33,000,000 | 33,907,500 | ||
| gCemex Finance LLC, senior secured note, 144A, | |||||
| 9.375%, 10/12/22 | Mexico | 56,300,000 | 66,363,625 | ||
| b6.00%, 4/01/24 | Mexico | 88,400,000 | 88,676,250 | ||
| gCemex SAB de CV, | |||||
| secured note, 144A, 5.875%, 3/25/19 | Mexico | 18,800,000 | 19,552,000 | ||
| secured note, 144A, 7.25%, 1/15/21 | Mexico | 111,000,000 | 121,614,375 | ||
| senior secured note, 144A, 9.00%, 1/11/18 | Mexico | 232,700,000 | 253,933,875 | ||
| senior secured note, 144A, 9.50%, 6/15/18 | Mexico | 105,000,000 | 121,537,500 | ||
| senior secured note, 144A, 6.50%, 12/10/19 | Mexico | 40,000,000 | 42,625,000 | ||
| Crown Americas LLC/Crown Americas Capital Corp. IV, | |||||
| senior bond, 4.50%, 1/15/23 | United States | 150,000,000 | 144,000,000 | ||
| Dynacast International LLC/Finance Inc., 9.25%, 7/15/19 | United States | 50,000,000 | 55,875,000 | ||
| gFirst Quantum Minerals Ltd., senior note, 144A, | |||||
| 6.75%, 2/15/20 | Canada | 41,630,000 | 42,358,525 | ||
| 7.00%, 2/15/21 | Canada | 63,630,000 | 65,061,675 | ||
| gFMG Resources (August 2006) Pty. Ltd., senior note, 144A, | |||||
| 6.875%, 2/01/18 | Australia | 70,600,000 | 74,571,250 | ||
| i8.25%, 11/01/19 | Australia | 80,000,000 | 88,300,000 | ||
| i6.875%, 4/01/22 | Australia | 60,000,000 | 64,875,000 | ||
| HudBay Minerals Inc., senior note, | |||||
| 9.50%, 10/01/20 | Canada | 50,000,000 | 53,750,000 | ||
| g144A, 9.50%, 10/01/20 | Canada | 39,600,000 | 42,570,000 | ||
| gImperial Metals Corp., senior note, 144A, 7.00%, 3/15/19 | Canada | 20,000,000 | 20,284,119 | ||
| gIneos Finance PLC, senior secured note, 144A, 8.375%, | |||||
| 2/15/19 | Switzerland | 42,800,000 | 47,454,500 | ||
| gIneos Group Holdings SA, senior note, 144A, | |||||
| 5.75%, 2/15/19 | Switzerland | 45,200,000 | EUR | 64,028,092 | |
| 5.875%, 2/15/19 | Luxembourg | 25,700,000 | 26,374,625 | ||
| gKerling PLC, senior secured note, 144A, 10.625%, 2/01/17 | United Kingdom | 53,700,000 | EUR | 78,869,954 |
Semiannual Report | 89
| Franklin Custodian Funds | |||||
| Statement of Investments, March 31, 2014 (unaudited) (continued) | |||||
| Franklin Income Fund | Country | Principal Amount* | Value | ||
| Corporate Bonds (continued) | |||||
| Materials (continued) | |||||
| Molycorp Inc., first lien, 10.00%, 6/01/20 | United States | 65,000,000 | $ | 64,675,000 | |
| gOrion Engineered Carbons Bondco GmbH, | |||||
| senior secured bond, 144A, 10.00%, 6/15/18 | Germany | 22,320,000 | EUR | 33,558,663 | |
| senior secured note, first lien, 144A, 9.625%, 6/15/18 | Germany | 23,400,000 | 25,476,750 | ||
| g,hOrion Engineered Carbons Finance & Co. SCA, senior note, | |||||
| 144A, PIK, 9.25%, 8/01/19 | Germany | 28,200,000 | 29,398,500 | ||
| Reynolds Group Issuer Inc./LLC/SA, | |||||
| first lien, 5.75%, 10/15/20 | United States | 70,800,000 | 74,517,000 | ||
| senior note, 8.50%, 5/15/18 | United States | 99,900,000 | 104,895,000 | ||
| senior note, 9.00%, 4/15/19 | United States | 100,100,000 | 107,607,500 | ||
| senior note, 9.875%, 8/15/19 | United States | 127,000,000 | 142,557,500 | ||
| senior note, 8.25%, 2/15/21 | United States | 45,000,000 | 49,331,250 | ||
| senior secured note, 7.875%, 8/15/19 | United States | 65,000,000 | 71,906,250 | ||
| senior secured note, 6.875%, 2/15/21 | United States | 32,500,000 | 35,262,500 | ||
| gSealed Air Corp., senior bond, 144A, 5.25%, 4/01/23 | United States | 48,000,000 | 48,720,000 | ||
| iUnited States Steel Corp., senior note, 7.375%, 4/01/20 | United States | 35,000,000 | 38,500,000 | ||
| Walter Energy Inc., | |||||
| gfirst lien, 144A, 9.50%, 10/15/19 | United States | 85,000,000 | 86,806,250 | ||
| senior note, 9.875%, 12/15/20 | United States | 105,000,000 | 69,562,500 | ||
| senior note, 8.50%, 4/15/21 | United States | 66,725,000 | 42,370,375 | ||
| gWise Metals Group LLC/Wise Alloys Finance Corp., | |||||
| senior secured note, 144A, 8.75%, 12/15/18 | United States | 25,000,000 | 26,937,500 | ||
| 2,848,544,984 | |||||
| Telecommunication Services 3.9% | |||||
| gAltice Financing SA, secured note, 144A, 6.50%, 1/15/22 | Luxembourg | 24,100,000 | 25,485,750 | ||
| CenturyLink Inc., | |||||
| senior bond, 6.75%, 12/01/23 | United States | 47,600,000 | 50,753,500 | ||
| senior note, 5.80%, 3/15/22 | United States | 63,000,000 | 64,732,500 | ||
| Cricket Communications Inc., senior note, 7.75%, 10/15/20 | United States | 150,000,000 | 171,712,500 | ||
| Frontier Communications Corp., | |||||
| senior bond, 7.625%, 4/15/24 | United States | 75,000,000 | 78,750,000 | ||
| senior note, 8.50%, 4/15/20 | United States | 51,150,000 | 59,717,625 | ||
| senior note, 9.25%, 7/01/21 | United States | 63,600,000 | 75,684,000 | ||
| senior note, 8.75%, 4/15/22 | United States | 48,900,000 | 56,051,625 | ||
| senior note, 7.125%, 1/15/23 | United States | 138,000,000 | 144,555,000 | ||
| gIntelsat Jackson Holdings SA, senior bond, 144A, 5.50%, | |||||
| 8/01/23 | Luxembourg | 130,000,000 | 128,050,000 | ||
| gMillicom International Cellular SA, senior note, 144A, 6.625%, | |||||
| 10/15/21 | Luxembourg | 37,900,000 | 40,505,625 | ||
| NII Capital Corp., senior bond, 7.625%, 4/01/21 | United States | 46,445,000 | 13,236,825 | ||
| gSoftBank Corp., senior note, 144A, 4.50%, 4/15/20 | Japan | 70,000,000 | 69,737,500 | ||
| Sprint Capital Corp., senior bond, 6.875%, 11/15/28 | United States | 126,000,000 | 122,850,000 | ||
| gSprint Corp., | |||||
| senior bond, 144A, 7.125%, 6/15/24 | United States | 245,650,000 | 258,546,625 | ||
| senior note, 144A, 7.875%, 9/15/23 | United States | 187,350,000 | 206,553,375 | ||
90 | Semiannual Report
| Franklin Custodian Funds | |||||
| Statement of Investments, March 31, 2014 (unaudited) (continued) | |||||
| Franklin Income Fund | Country | Principal Amount* | Value | ||
| Corporate Bonds (continued) | |||||
| Telecommunication Services (continued) | |||||
| Sprint Nextel Corp., | |||||
| 6.00%, 12/01/16 | United States | 174,000,000 | $ | 191,182,500 | |
| 11.50%, 11/15/21 | United States | 200,000,000 | 267,000,000 | ||
| senior note, 9.125%, 3/01/17 | United States | 80,000,000 | 95,000,000 | ||
| senior note, 8.375%, 8/15/17 | United States | 182,700,000 | 215,814,375 | ||
| senior note, 7.00%, 8/15/20 | United States | 30,000,000 | 32,850,000 | ||
| senior note, 6.00%, 11/15/22 | United States | 158,000,000 | 161,752,500 | ||
| gsenior note, 144A, 9.00%, 11/15/18 | United States | 180,000,000 | 220,500,000 | ||
| T-Mobile USA Inc., | |||||
| senior bond, 6.625%, 4/01/23 | United States | 50,000,000 | 53,250,000 | ||
| senior bond, 6.50%, 1/15/24 | United States | 32,300,000 | 33,915,000 | ||
| senior note, 6.464%, 4/28/19 | United States | 125,000,000 | 134,062,500 | ||
| senior note, 6.542%, 4/28/20 | United States | 45,000,000 | 48,600,000 | ||
| senior note, 6.25%, 4/01/21 | United States | 100,000,000 | 106,125,000 | ||
| senior note, 6.633%, 4/28/21 | United States | 50,000,000 | 53,937,500 | ||
| senior note, 6.125%, 1/15/22 | United States | 18,300,000 | 19,237,875 | ||
| senior note, 6.731%, 4/28/22 | United States | 50,000,000 | 53,750,000 | ||
| senior note, 6.836%, 4/28/23 | United States | 50,000,000 | 53,812,500 | ||
| Verizon Communications Inc., | |||||
| senior bond, 6.55%, 9/15/43 | United States | 90,000,000 | 109,920,240 | ||
| senior note, 5.15%, 9/15/23 | United States | 102,700,000 | 112,614,247 | ||
| gWind Acquisition Finance SA, secured note, 144A, 7.25%, | |||||
| 2/15/18 | Italy | 35,000,000 | 36,925,000 | ||
| 3,567,171,687 | |||||
| Utilities 1.0% | |||||
| The AES Corp., senior bond, | |||||
| 4.875%, 5/15/23 | United States | 110,000,000 | 105,600,000 | ||
| 5.50%, 3/15/24 | United States | 40,000,000 | 39,800,000 | ||
| gCalpine Corp., | |||||
| senior secured bond, first lien, 144A, 5.875%, 1/15/24 | United States | 58,700,000 | 59,874,000 | ||
| senior secured note, 144A, 7.875%, 7/31/20 | United States | 32,178,000 | 35,556,690 | ||
| senior secured note, 144A, 7.50%, 2/15/21 | United States | 80,040,000 | 87,843,900 | ||
| senior secured note, 144A, 7.875%, 1/15/23 | United States | 60,920,000 | 68,535,000 | ||
| senior secured note, first lien, 144A, 6.00%, 1/15/22 | United States | 28,200,000 | 29,751,000 | ||
| c,gDynegy Inc., senior note, 144A, 5.875%, 6/01/23 | United States | 95,000,000 | 93,812,500 | ||
| GenOn Energy Inc., senior note, 7.875%, 6/15/17 | United States | 125,000,000 | 126,250,000 | ||
| gInterGen NV, | |||||
| secured bond, 144A, 7.00%, 6/30/23 | Netherlands | 130,300,000 | 137,710,813 | ||
| secured note, 144A, 7.50%, 6/30/21 | Netherlands | 25,000,000 | GBP | 44,075,274 | |
| gNGL Energy Partners LP/NGL Energy Finance Corp., senior note, | |||||
| 144A, 6.875%, 10/15/21 | United States | 30,000,000 | 31,350,000 | ||
| NRG Energy Inc., | |||||
| senior bond, 6.625%, 3/15/23 | United States | 20,000,000 | 20,850,000 | ||
| gsenior note, 144A, 6.25%, 7/15/22 | United States | 25,000,000 | 25,812,500 | ||
| 906,821,677 | |||||
| Total Corporate Bonds (Cost $27,446,260,408) | 29,776,897,050 | ||||
Semiannual Report | 91
| Franklin Custodian Funds | |||||
| Statement of Investments, March 31, 2014 (unaudited) (continued) | |||||
| Franklin Income Fund | Country | Principal Amount* | Value | ||
| l,mSenior Floating Rate Interests 3.9% | |||||
| Consumer Discretionary 1.2% | |||||
| Caesars Entertainment Operating Co. Inc., Incremental Term | |||||
| Loan, 9.50%, 10/01/16 | United States | 95,750,000 | $ | 95,663,538 | |
| Clear Channel Communications Inc., | |||||
| Tranche B Term Loan, 3.803%, 1/29/16 | United States | 10,870,233 | 10,752,269 | ||
| Tranche D Term Loan, 6.903%, 1/30/19 | United States | 727,373,595 | 713,417,478 | ||
| Tranche E Term Loan, 7.653%, 7/30/19 | United States | 200,744,256 | 200,869,721 | ||
| cDex Media West LLC, Term Loan B, 8.00%, 12/30/16 | United States | 1,586,623 | 1,286,156 | ||
| cR.H. Donnelley Inc., Term Loan B, 9.75%, 12/30/16 | United States | 38,925,710 | 25,082,754 | ||
| SuperMedia Inc., Exit Term Loan, 11.60%, 12/31/16 | United States | 7,229,270 | 5,435,507 | ||
| TWCC Holding Corp., Second Lien Term Loan, 7.00%, 6/26/20 | United States | 50,000,000 | 48,750,000 | ||
| 1,101,257,423 | |||||
| Consumer Staples 0.1% | |||||
| U.S. Foods Inc., Term Loan, 4.50%, 3/31/19 | United States | 99,250,000 | 99,919,938 | ||
| Energy 1.3% | |||||
| Chesapeake Energy Corp., Senior Unsecured Term Loan, 5.75%, | |||||
| 12/02/17 | United States | 460,000,000 | 471,068,980 | ||
| Drillships Financing Holding Inc., Tranche B-1 Term Loan, | |||||
| 6.00%, 3/31/21 | Marshall Islands | 249,500,000 | 255,165,646 | ||
| Fieldwood Energy LLC, Second Lien Closing Date Loans, | |||||
| 8.375%, 9/30/20 | United States | 219,261,084 | 228,638,442 | ||
| bNGPL Pipeco LLC, Term Loan, 6.75%, 9/15/17 | United States | 68,000,000 | 66,668,356 | ||
| Quicksilver Resources Inc., Second Lien Loans, 7.00%, | |||||
| 6/21/19 | United States | 150,000,000 | 150,000,000 | ||
| 1,171,541,424 | |||||
| Financials 0.1% | |||||
| Stena International SA, Loans, 4.00%, 3/03/21 | Sweden | 100,000,000 | 99,937,500 | ||
| Health Care 0.1% | |||||
| Community Health Systems Inc., 2021 Term D Loan, 4.25%, | |||||
| 1/27/21 | United States | 49,875,000 | 50,357,990 | ||
| Industrials 0.3% | |||||
| Altegrity Inc., | |||||
| Term Loan B, 5.00%, 2/21/15 | United States | 68,532,648 | 67,718,823 | ||
| Tranche D Term Loan, 7.75%, 2/21/15 | United States | 49,761,527 | 49,217,285 | ||
| b,cCEVA Group PLC, | |||||
| Pre-Funded L/C, 7.75%, 3/19/21 | United States | 20,320,197 | 20,282,097 | ||
| U.S. Term Loan, 7.75%, 3/19/21 | United States | 29,556,650 | 29,501,231 | ||
| bCEVA Intercompany B.V., Dutch Term Loan, 7.75%, 3/19/21 | Netherlands | 21,428,571 | 21,427,286 | ||
| bCEVA Logistics Canada ULC, Canadian Term Loan, 7.75%, | |||||
| 3/19/21 | Canada | 3,694,581 | 3,694,360 | ||
| Navistar Inc., Tranche B Term Loan, 5.75%, 8/17/17 | United States | 36,555,232 | 37,103,560 | ||
| 228,944,642 | |||||
| Information Technology 0.6% | |||||
| First Data Corp., | |||||
| 2018 Term Loan, 4.155%, 3/24/18 | United States | 402,993,460 | 404,539,343 | ||
| Second New Dollar Term Loan, 3.655%, 3/24/17 | United States | 128,000,000 | 128,000,000 | ||
| SRA International Inc., Term Loan, 6.50%, 7/20/18 | United States | 44,942,857 | 45,167,571 | ||
| 577,706,914 | |||||
| 92 | Semiannual Report | |||||
Franklin Custodian Funds
Statement of Investments, March 31, 2014 (unaudited) (continued)
| Franklin Income Fund | Country | Principal Amount* | Value | ||
| l,mSenior Floating Rate Interests (continued) | |||||
| Materials 0.1% | |||||
| bArdagh Holdings USA Inc., New Term Loan, 5.25%, 12/17/19 | United States | 20,000,000 | $ | 20,068,760 | |
| bWalter Energy Inc., B Term Loan, 6.75% - 7.25%, 4/01/18 | United States | 99,400,000 | 96,318,600 | ||
| 116,387,360 | |||||
| Telecommunication Services 0.1% | |||||
| Altice Financing SA, Loans, 5.50%, 6/24/19 | Luxembourg | 49,875,000 | 51,012,798 | ||
| Utilities 0.0% | |||||
| Intergen NV, Term Advance, 5.50%, 6/13/20 | Netherlands | 44,650,063 | 45,133,757 | ||
| Total Senior Floating Rate Interests | |||||
| (Cost $3,422,386,722) | 3,542,199,746 | ||||
| Shares | |||||
| Escrows and Litigation Trusts 0.0% | |||||
| a,c,nDynegy Holdings Inc., Escrow Account | United States | 1,024,235,000 | |||
| a,c,nDynegy Roseton Danskammer Pass Through Trust, Escrow | |||||
| Account, B | United States | 40,000,000 | |||
| aMotors Liquidation Co., Escrow Account | United States | 400,000,000 | 40,000 | ||
| aMotors Liquidation Co., Escrow Account, cvt. pfd., C | United States | 11,000,000 | 110,000 | ||
| a,nSuperMedia Inc., Litigation Trust | United States | 30,326,101 | |||
| Total Escrows and Litigation Trusts | |||||
| (Cost $2,757,417) | 150,000 | ||||
| Total Investments before Short Term Investments | |||||
| (Cost $79,526,968,939) | 89,171,147,416 | ||||
| Principal Amount* | |||||
| Short Term Investments 1.0% | |||||
| U.S. Government and Agency Securities 0.7% | |||||
| oFHLB, 4/09/14 - 4/11/14 | United States | 140,200,000 | 140,193,194 | ||
| o,pU.S. Treasury Bills, 4/17/14 - 4/24/14 | United States | 500,000,000 | 499,992,900 | ||
| Total U.S. Government and Agency Securities | |||||
| (Cost $640,184,961) | 640,186,094 | ||||
| Total Investments before Money Market Funds | |||||
| (Cost $80,167,153,900) | 89,811,333,510 | ||||
| Shares | |||||
| Money Market Funds (Cost $206,275,306) 0.2% | |||||
| a,qInstitutional Fiduciary Trust Money Market Portfolio | United States | 206,275,306 | 206,275,306 | ||
| rInvestments from Cash Collateral Received for Loaned | |||||
| Securities (Cost $47,130,120) 0.1% | |||||
| Money Market Funds 0.1% | |||||
| sBNY Mellon Overnight Government Fund, 0.052% | United States | 47,130,120 | 47,130,120 | ||
| Total Investments (Cost $80,420,559,326) 99.6% | 90,064,738,936 | ||||
| Options Written (0.0)% | (1,155,000 | ) | |||
| Other Assets, less Liabilities 0.4% | 336,982,416 | ||||
| Net Assets 100.0% | $ | 90,400,566,352 | |||
Semiannual Report | 93
| Franklin Custodian Funds | |||||
| Statement of Investments, March 31, 2014 (unaudited) (continued) | |||||
| Franklin Income Fund | Country | Number of Contracts | Value | ||
| tOptions Written (0.0)% | |||||
| Calls Exchange-Traded | |||||
| Information Technology (0.0)% | |||||
| EMC Corp., April Strike Price $27, Expires 4/29/14 | United States | 15,000 | $ | (1,035,000 | ) |
| Puts Exchange-Traded | |||||
| Industrials (0.0)% | |||||
| The Boeing Co., April Strike Price $120, Expires 4/19/14 | United States | 2,000 | (120,000 | ) | |
| Total Options Written | |||||
| (Premiums Received $1,274,176) | $ | (1,155,000 | ) | ||
See Abbreviations on page 145.
Rounds to less than 0.1% of net assets.
*The principal amount is stated in U.S. dollars unless otherwise indicated.
aNon-income producing.
bA portion or all of the security purchased on a when-issued or delayed delivery basis. See Note 1(d).
cSee Note 10 regarding holdings of 5% voting securities.
dAt March 31, 2014, pursuant to the Fund s policies and the requirements of applicable securities law, the Fund may be restricted from trading these securities for a limited or
extended period of time due to ownership limits and/or potential possession of material non-public information.
eA portion or all of the security is held in connection with written option contracts open at period end.
fSee Note 1(g) regarding equity-linked securities.
gSecurity was purchased pursuant to Rule 144A under the Securities Act of 1933 and may be sold in transactions exempt from registration only to qualified institutional buyers or
in a public offering registered under the Securities Act of 1933. These securities have been deemed liquid under guidelines approved by the Trust s Board of Trustees. At March 31,
2014, the aggregate value of these securities was $18,435,804,301, representing 20.39% of net assets.
hIncome may be received in additional securities and/or cash.
iA portion or all of the security is on loan at March 31, 2014. See Note 1(h).
jSee Note 7 regarding defaulted securities.
kPerpetual security with no stated maturity date.
lSee Note 1(j) regarding senior floating rate interests.
mThe coupon rate shown represents the rate at period end.
nSecurity has been deemed illiquid because it may not be able to be sold within seven days. At March 31, 2014, the aggregate value of these securities was $-.
oThe security is traded on a discount basis with no stated coupon rate.
pSecurity or a portion of the security has been pledged as collateral for written options contracts. At March 31, 2014, the value of this security and/or cash pledged as collateral was
$499,992,900, representing 0.55% of net assets.
qSee Note 3(f) regarding investments in the Institutional Fiduciary Trust Money Market Portfolio.
rSee Note 1(h) regarding securities on loan.
sThe rate shown is the annualized seven-day yield at period end.
tSee Note 1(e) regarding written options.
94 | The accompanying notes are an integral part of these financial statements. | Semiannual Report
| Franklin Custodian Funds | ||||||||||||||||||
| Financial Highlights | ||||||||||||||||||
| Franklin U.S. Government Securities Fund | ||||||||||||||||||
| Six Months Ended | ||||||||||||||||||
| March 31, 2014 | Year Ended September 30, | |||||||||||||||||
| Class A | (unaudited) | 2013 | 2012 | 2011 | 2010 | 2009 | ||||||||||||
| Per share operating performance | ||||||||||||||||||
| (for a share outstanding throughout | ||||||||||||||||||
| the period) | ||||||||||||||||||
| Net asset value, beginning of period | $ | 6.53 | $ | 6.91 | $ | 6.92 | $ | 6.81 | $ | 6.69 | $ | 6.45 | ||||||
| Income from investment operationsa: | ||||||||||||||||||
| Net investment incomeb | 0.09 | 0.15 | 0.20 | 0.24 | 0.25 | 0.27 | ||||||||||||
| Net realized and unrealized gains | ||||||||||||||||||
| (losses) | (0.02 | ) | (0.29 | ) | 0.04 | 0.15 | 0.14 | 0.27 | ||||||||||
| Total from investment operations | 0.07 | (0.14 | ) | 0.24 | 0.39 | 0.39 | 0.54 | |||||||||||
| Less distributions from net investment | ||||||||||||||||||
| income | (0.12 | ) | (0.24 | ) | (0.25 | ) | (0.28 | ) | (0.27 | ) | (0.30 | ) | ||||||
| Net asset value, end of period | $ | 6.48 | $ | 6.53 | $ | 6.91 | $ | 6.92 | $ | 6.81 | $ | 6.69 | ||||||
| Total returnc | 1.05 | % | (2.03 | )% | 3.49 | % | 5.93 | % | 5.94 | % | 8.50 | % | ||||||
| Ratios to average net assetsd | ||||||||||||||||||
| Expenses | 0.76 | %e,f | 0.73 | % | 0.73 | % | 0.72 | % | 0.73 | % | 0.73 | %f | ||||||
| Net investment income | 2.69 | % | 2.17 | % | 2.86 | % | 3.55 | % | 3.70 | % | 4.11 | % | ||||||
| Supplemental data | ||||||||||||||||||
| Net assets, end of period (000 s) | $ | 4,504,914 | $ | 5,138,613 | $ | 6,861,193 | $ | 6,423,821 | $ | 6,771,471 | $ | 6,275,792 | ||||||
| Portfolio turnover rate | 38.24 | % | 46.16 | % | 40.15 | % | 20.23 | % | 47.41 | % | 34.74 | % | ||||||
| Portfolio turnover rate excluding | ||||||||||||||||||
| mortgage dollar rollsg | 17.20 | % | 40.83 | % | 40.15 | % | 20.23 | % | 47.41 | % | 34.74 | % | ||||||
aThe amount shown for a share outstanding throughout the period may not correlate with the Statement of Operations for the period due to the timing of sales and repurchases of
the Fund shares in relation to income earned and/or fluctuating market value of the investments of the Fund.
bBased on average daily shares outstanding.
cTotal return does not reflect sales commissions or contingent deferred sales charges, if applicable, and is not annualized for periods less than one year.
dRatios are annualized for periods less than one year.
eBenefit of waiver and payments by affiliate rounds to less than 0.01%.
fBenefit of expense reduction rounds to less than 0.01%.
gSee Note 1(i) regarding mortgage dollar rolls.
Semiannual Report | The accompanying notes are an integral part of these financial statements. | 95
| Franklin Custodian Funds | ||||||||||||||||||
| Financial Highlights (continued) | ||||||||||||||||||
| Franklin U.S. Government Securities Fund | ||||||||||||||||||
| Six Months Ended | ||||||||||||||||||
| March 31, 2014 | Year Ended September 30, | |||||||||||||||||
| Class C | (unaudited) | 2013 | 2012 | 2011 | 2010 | 2009 | ||||||||||||
| Per share operating performance | ||||||||||||||||||
| (for a share outstanding throughout | ||||||||||||||||||
| the period) | ||||||||||||||||||
| Net asset value, beginning of period | $ | 6.49 | $ | 6.86 | $ | 6.88 | $ | 6.77 | $ | 6.66 | $ | 6.42 | ||||||
| Income from investment operationsa: | ||||||||||||||||||
| Net investment incomeb | 0.07 | 0.11 | 0.16 | 0.21 | 0.21 | 0.23 | ||||||||||||
| Net realized and unrealized gains | ||||||||||||||||||
| (losses) | (0.02 | ) | (0.28 | ) | 0.03 | 0.15 | 0.14 | 0.27 | ||||||||||
| Total from investment operations | 0.05 | (0.17 | ) | 0.19 | 0.36 | 0.35 | 0.50 | |||||||||||
| Less distributions from net investment | ||||||||||||||||||
| income | (0.10 | ) | (0.20 | ) | (0.21 | ) | (0.25 | ) | (0.24 | ) | (0.26 | ) | ||||||
| Net asset value, end of period | $ | 6.44 | $ | 6.49 | $ | 6.86 | $ | 6.88 | $ | 6.77 | $ | 6.66 | ||||||
| Total returnc | 0.80 | % | (2.45 | )% | 2.85 | % | 5.44 | % | 5.28 | % | 8.01 | % | ||||||
| Ratios to average net assetsd | ||||||||||||||||||
| Expenses | 1.26 | %e,f | 1.23 | % | 1.23 | % | 1.23 | % | 1.24 | % | 1.24 | %f | ||||||
| Net investment income | 2.19 | % | 1.67 | % | 2.36 | % | 3.04 | % | 3.19 | % | 3.60 | % | ||||||
| Supplemental data | ||||||||||||||||||
| Net assets, end of period (000 s) | $ | 1,322,559 | $ | 1,640,787 | $ | 2,981,724 | $ | 2,294,707 | $ | 2,484,847 | $ | 1,464,614 | ||||||
| Portfolio turnover rate | 38.24 | % | 46.16 | % | 40.15 | % | 20.23 | % | 47.41 | % | 34.74 | % | ||||||
| Portfolio turnover rate excluding | ||||||||||||||||||
| mortgage dollar rollsg | 17.20 | % | 40.83 | % | 40.15 | % | 20.23 | % | 47.41 | % | 34.74 | % | ||||||
aThe amount shown for a share outstanding throughout the period may not correlate with the Statement of Operations for the period due to the timing of sales and repurchases of
the Fund shares in relation to income earned and/or fluctuating market value of the investments of the Fund.
bBased on average daily shares outstanding.
cTotal return does not reflect sales commissions or contingent deferred sales charges, if applicable, and is not annualized for periods less than one year.
dRatios are annualized for periods less than one year.
eBenefit of waiver and payments by affiliate rounds to less than 0.01%.
fBenefit of expense reduction rounds to less than 0.01%.
gSee Note 1(i) regarding mortgage dollar rolls.
96 | The accompanying notes are an integral part of these financial statements. | Semiannual Report
| Franklin Custodian Funds | ||||||||||||||||||
| Financial Highlights (continued) | ||||||||||||||||||
| Franklin U.S. Government Securities Fund | ||||||||||||||||||
| Six Months Ended | ||||||||||||||||||
| March 31, 2014 | Year Ended September 30, | |||||||||||||||||
| Class R | (unaudited) | 2013 | 2012 | 2011 | 2010 | 2009 | ||||||||||||
| Per share operating performance | ||||||||||||||||||
| (for a share outstanding throughout the period) | ||||||||||||||||||
| Net asset value, beginning of period | $ | 6.53 | $ | 6.90 | $ | 6.91 | $ | 6.81 | $ | 6.69 | $ | 6.45 | ||||||
| Income from investment operationsa: | ||||||||||||||||||
| Net investment incomeb | 0.08 | 0.12 | 0.17 | 0.22 | 0.23 | 0.25 | ||||||||||||
| Net realized and unrealized gains (losses) | (0.02 | ) | (0.27 | ) | 0.04 | 0.14 | 0.13 | 0.26 | ||||||||||
| Total from investment operations | 0.06 | (0.15 | ) | 0.21 | 0.36 | 0.36 | 0.51 | |||||||||||
| Less distributions from net investment income | (0.11 | ) | (0.22 | ) | (0.22 | ) | (0.26 | ) | (0.24 | ) | (0.27 | ) | ||||||
| Net asset value, end of period | $ | 6.48 | $ | 6.53 | $ | 6.90 | $ | 6.91 | $ | 6.81 | $ | 6.69 | ||||||
| Total returnc | 0.87 | % | (2.27 | )% | 3.13 | % | 5.41 | % | 5.55 | % | 8.12 | % | ||||||
| Ratios to average net assetsd | ||||||||||||||||||
| Expenses | 1.11 | %e,f | 1.08 | % | 1.08 | % | 1.08 | % | 1.09 | % | 1.09 | %f | ||||||
| Net investment income | 2.34 | % | 1.82 | % | 2.51 | % | 3.19 | % | 3.34 | % | 3.75 | % | ||||||
| Supplemental data | ||||||||||||||||||
| Net assets, end of period (000 s) | $ | 78,196 | $ | 94,110 | $ | 141,140 | $ | 131,692 | $ | 140,147 | $ | 138,548 | ||||||
| Portfolio turnover rate | 38.24 | % | 46.16 | % | 40.15 | % | 20.23 | % | 47.41 | % | 34.74 | % | ||||||
| Portfolio turnover rate excluding mortgage dollar | ||||||||||||||||||
| rollsg | 17.20 | % | 40.83 | % | 40.15 | % | 20.23 | % | 47.41 | % | 34.74 | % | ||||||
aThe amount shown for a share outstanding throughout the period may not correlate with the Statement of Operations for the period due to the timing of sales and repurchases of
the Fund shares in relation to income earned and/or fluctuating market value of the investments of the Fund.
bBased on average daily shares outstanding.
cTotal return is not annualized for periods less than one year.
dRatios are annualized for periods less than one year.
eBenefit of waiver and payments by affiliate rounds to less than 0.01%.
fBenefit of expense reduction rounds to less than 0.01%.
gSee Note 1(i) regarding mortgage dollar rolls.
Semiannual Report | The accompanying notes are an integral part of these financial statements. | 97
| Franklin Custodian Funds | ||||||
| Financial Highlights (continued) | ||||||
| Franklin U.S. Government Securities Fund | ||||||
| Six Months Ended | Period Ended | |||||
| March 31, 2014 | September 30, | |||||
| Class R6 | (unaudited) | 2013 | a | |||
| Per share operating performance | ||||||
| (for a share outstanding throughout the period) | ||||||
| Net asset value, beginning of period | $ | 6.55 | $ | 6.76 | ||
| Income from investment operationsb: | ||||||
| Net investment incomec | 0.10 | 0.07 | ||||
| Net realized and unrealized gains (losses) | (0.02 | ) | (0.17 | ) | ||
| Total from investment operations | 0.08 | (0.10 | ) | |||
| Less distributions from net investment income | (0.13 | ) | (0.11 | ) | ||
| Net asset value, end of period | $ | 6.50 | $ | 6.55 | ||
| Total returnd | 1.19 | % | (1.53 | )% | ||
| Ratios to average net assetse | ||||||
| Expenses | 0.47 | %f,g | 0.46 | % | ||
| Net investment income | 2.98 | % | 2.44 | % | ||
| Supplemental data | ||||||
| Net assets, end of period (000 s) | $ | 503,210 | $ | 480,590 | ||
| Portfolio turnover rate | 38.24 | % | 46.16 | % | ||
| Portfolio turnover rate excluding mortgage dollar rollsh | 17.20 | % | 40.83 | % | ||
aFor the period May 1, 2013 (effective date) to September 30, 2013.
bThe amount shown for a share outstanding throughout the period may not correlate with the Statement of Operations for the period due to the timing of sales and repurchases of
the Fund shares in relation to income earned and/or fluctuating market value of the investments of the Fund.
cBased on average daily shares outstanding.
dTotal return is not annualized for periods less than one year.
eRatios are annualized for periods less than one year.
fBenefit of waiver and payments by affiliate rounds to less than 0.01%.
gBenefit of expense reduction rounds to less than 0.01%.
hSee 1(i) regarding mortgage dollar rolls.
98 | The accompanying notes are an integral part of these financial statements. | Semiannual Report
| Franklin Custodian Funds | ||||||||||||||||||
| Financial Highlights (continued) | ||||||||||||||||||
| Franklin U.S. Government Securities Fund | ||||||||||||||||||
| Six Months Ended | ||||||||||||||||||
| March 31, 2014 | Year Ended September 30, | |||||||||||||||||
| Advisor Class | (unaudited) | 2013 | 2012 | 2011 | 2010 | 2009 | ||||||||||||
| Per share operating performance | ||||||||||||||||||
| (for a share outstanding throughout | ||||||||||||||||||
| the period) | ||||||||||||||||||
| Net asset value, beginning of period | $ | 6.55 | $ | 6.93 | $ | 6.94 | $ | 6.83 | $ | 6.71 | $ | 6.47 | ||||||
| Income from investment operationsa: | ||||||||||||||||||
| Net investment incomeb | 0.09 | 0.16 | 0.21 | 0.25 | 0.26 | 0.28 | ||||||||||||
| Net realized and unrealized gains | ||||||||||||||||||
| (losses) | (0.02 | ) | (0.29 | ) | 0.04 | 0.15 | 0.14 | 0.27 | ||||||||||
| Total from investment operations | 0.07 | (0.13 | ) | 0.25 | 0.40 | 0.40 | 0.55 | |||||||||||
| Less distributions from net investment | ||||||||||||||||||
| income | (0.12 | ) | (0.25 | ) | (0.26 | ) | (0.29 | ) | (0.28 | ) | (0.31 | ) | ||||||
| Net asset value, end of period | $ | 6.50 | $ | 6.55 | $ | 6.93 | $ | 6.94 | $ | 6.83 | $ | 6.71 | ||||||
| Total returnc | 1.12 | % | (1.86 | )% | 3.63 | % | 6.08 | % | 6.06 | % | 8.63 | % | ||||||
| Ratios to average net assetsd | ||||||||||||||||||
| Expenses | 0.61 | %e,f | 0.58 | % | 0.58 | % | 0.58 | % | 0.59 | % | 0.59 | %f | ||||||
| Net investment income | 2.84 | % | 2.32 | % | 3.01 | % | 3.69 | % | 3.84 | % | 4.25 | % | ||||||
| Supplemental data | ||||||||||||||||||
| Net assets, end of period (000 s) | $ | 703,546 | $ | 949,085 | $ | 1,586,928 | $ | 1,478,504 | $ | 1,193,213 | $ | 863,951 | ||||||
| Portfolio turnover rate | 38.24 | % | 46.16 | % | 40.15 | % | 20.23 | % | 47.41 | % | 34.74 | % | ||||||
| Portfolio turnover rate excluding | ||||||||||||||||||
| mortgage dollar rollsg | 17.20 | % | 40.83 | % | 40.15 | % | 20.23 | % | 47.41 | % | 34.74 | % | ||||||
aThe amount shown for a share outstanding throughout the period may not correlate with the Statement of Operations for the period due to the timing of sales and repurchases of
the Fund shares in relation to income earned and/or fluctuating market value of the investments of the Fund.
bBased on average daily shares outstanding.
cTotal return is not annualized for periods less than one year.
dRatios are annualized for periods less than one year.
eBenefit of waiver and payments by affiliate rounds to less than 0.01%.
fBenefit of expense reduction rounds to less than 0.01%.
gSee Note 1(i) regarding mortgage dollar rolls.
Semiannual Report | The accompanying notes are an integral part of these financial statements. | 99
| Franklin Custodian Funds | ||||
| Statement of Investments, March 31, 2014 (unaudited) | ||||
| Franklin U.S. Government Securities Fund | Principal Amount | Value | ||
| Mortgage-Backed Securities 102.6% | ||||
| aGovernment National Mortgage Association (GNMA) Adjustable Rate 4.3% | ||||
| GNMA, 1.625%, 3/20/17 - 3/20/34 | $ | 68,023,883 | $ | 70,787,863 |
| GNMA, 1.625%, 3/20/34 - 5/20/35 | 68,199,399 | 70,987,346 | ||
| GNMA, 1.625%, 5/20/35 - 7/20/39 | 52,724,955 | 54,888,426 | ||
| GNMA, 1.625% - 2.00%, 12/20/16 - 11/20/40 | 58,004,443 | 60,130,781 | ||
| GNMA, 2.00% - 4.50%, 1/20/16 - 2/20/42 | 44,387,482 | 46,174,871 | ||
| 302,969,287 | ||||
| Government National Mortgage Association (GNMA) Fixed Rate 98.3% | ||||
| GNMA GP 30 Year, 8.25%, 3/15/17 - 5/15/17 | 40,102 | 40,634 | ||
| GNMA GP 30 Year, 9.25%, 5/15/16 - 12/15/16 | 75,013 | 76,272 | ||
| GNMA GP 30 Year, 11.25%, 10/15/15 - 12/15/15 | 18,889 | 19,036 | ||
| GNMA I SF 15 Year, 6.50%, 5/15/18 | 129,497 | 134,373 | ||
| GNMA I SF 30 Year, 3.50%, 4/15/43 - 5/15/43 | 50,406,264 | 51,544,264 | ||
| GNMA I SF 30 Year, 4.00%, 3/15/39 - 11/15/40 | 64,389,763 | 67,837,354 | ||
| GNMA I SF 30 Year, 4.00%, 11/15/40 - 12/15/40 | 63,313,716 | 66,704,682 | ||
| GNMA I SF 30 Year, 4.00%, 12/15/40 - 8/15/41 | 58,545,097 | 61,668,094 | ||
| GNMA I SF 30 Year, 4.00%, 8/15/41 - 10/15/41 | 65,795,133 | 69,382,350 | ||
| GNMA I SF 30 Year, 4.00%, 10/15/41 - 3/15/44 | 39,139,797 | 41,230,362 | ||
| GNMA I SF 30 Year, 4.50%, 2/15/39 - 6/15/39 | 61,690,319 | 67,228,356 | ||
| GNMA I SF 30 Year, 4.50%, 6/15/39 - 10/15/39 | 64,615,390 | 69,906,614 | ||
| GNMA I SF 30 Year, 4.50%, 10/15/39 - 1/15/40 | 57,162,886 | 61,950,969 | ||
| GNMA I SF 30 Year, 4.50%, 1/15/40 - 4/15/40 | 60,711,554 | 65,812,246 | ||
| GNMA I SF 30 Year, 4.50%, 4/15/40 - 6/15/40 | 59,757,935 | 64,714,140 | ||
| GNMA I SF 30 Year, 4.50%, 6/15/40 | 43,163,135 | 46,913,567 | ||
| GNMA I SF 30 Year, 4.50%, 6/15/40 - 7/15/40 | 51,302,376 | 55,666,613 | ||
| GNMA I SF 30 Year, 4.50%, 7/15/40 | 37,546,005 | 40,848,006 | ||
| GNMA I SF 30 Year, 4.50%, 7/15/40 | 38,526,291 | 41,719,182 | ||
| GNMA I SF 30 Year, 4.50%, 7/15/40 - 8/15/40 | 54,923,879 | 59,462,873 | ||
| GNMA I SF 30 Year, 4.50%, 8/15/40 - 4/15/41 | 64,505,508 | 69,748,286 | ||
| GNMA I SF 30 Year, 4.50%, 4/15/41 - 6/15/41 | 40,814,646 | 44,238,650 | ||
| GNMA I SF 30 Year, 5.00%, 2/15/33 - 9/15/33 | 64,158,094 | 70,841,633 | ||
| GNMA I SF 30 Year, 5.00%, 9/15/33 - 11/15/33 | 61,731,425 | 68,193,269 | ||
| GNMA I SF 30 Year, 5.00%, 11/15/33 - 3/15/35 | 61,593,045 | 67,968,089 | ||
| GNMA I SF 30 Year, 5.00%, 3/15/35 - 6/15/39 | 51,520,276 | 56,626,754 | ||
| GNMA I SF 30 Year, 5.00%, 6/15/39 - 8/15/39 | 52,063,599 | 57,076,980 | ||
| GNMA I SF 30 Year, 5.00%, 8/15/39 - 9/15/39 | 63,579,658 | 69,781,025 | ||
| GNMA I SF 30 Year, 5.00%, 9/15/39 - 10/15/39 | 56,709,761 | 62,255,974 | ||
| GNMA I SF 30 Year, 5.00%, 10/15/39 | 40,586,502 | 44,632,374 | ||
| GNMA I SF 30 Year, 5.00%, 10/15/39 - 11/15/39 | 62,269,596 | 68,490,604 | ||
| GNMA I SF 30 Year, 5.00%, 10/15/39 - 11/15/39 | 54,343,125 | 59,699,641 | ||
| GNMA I SF 30 Year, 5.00%, 11/15/39 - 12/15/39 | 62,200,355 | 68,428,700 | ||
| GNMA I SF 30 Year, 5.00%, 12/15/39 - 2/15/40 | 46,488,243 | 51,097,108 | ||
| GNMA I SF 30 Year, 5.00%, 2/15/40 - 3/15/40 | 63,363,420 | 69,678,040 | ||
| GNMA I SF 30 Year, 5.00%, 3/15/40 - 4/15/40 | 59,921,941 | 65,905,432 | ||
| GNMA I SF 30 Year, 5.00%, 4/15/40 - 5/15/40 | 63,080,058 | 69,357,308 | ||
| GNMA I SF 30 Year, 5.00%, 6/15/40 | 45,600,222 | 50,117,947 | ||
| GNMA I SF 30 Year, 5.00%, 6/15/40 | 22,355,025 | 24,587,508 | ||
| GNMA I SF 30 Year, 5.00%, 9/15/40 | 57,565,252 | 64,168,212 | ||
100 | Semiannual Report
| Franklin Custodian Funds | ||||
| Statement of Investments, March 31, 2014 (unaudited) (continued) | ||||
| Franklin U.S. Government Securities Fund | Principal Amount | Value | ||
| Mortgage-Backed Securities (continued) | ||||
| Government National Mortgage Association (GNMA) Fixed Rate (continued) | ||||
| GNMA I SF 30 Year, 5.50%, 5/15/28 - 3/15/33 | $ | 62,795,468 | $ | 70,066,723 |
| GNMA I SF 30 Year, 5.50%, 3/15/33 - 6/15/33 | 63,572,840 | 70,978,623 | ||
| GNMA I SF 30 Year, 5.50%, 6/15/33 - 3/15/34 | 63,495,540 | 70,954,367 | ||
| GNMA I SF 30 Year, 5.50%, 3/15/34 - 12/15/36 | 53,886,702 | 60,176,398 | ||
| GNMA I SF 30 Year, 5.50%, 12/15/36 - 9/15/38 | 56,930,890 | 63,392,896 | ||
| GNMA I SF 30 Year, 5.50%, 12/15/38 - 2/15/39 | 58,925,183 | 65,373,982 | ||
| GNMA I SF 30 Year, 5.50%, 7/15/39 - 2/15/40 | 46,090,213 | 51,301,386 | ||
| GNMA I SF 30 Year, 6.00%, 10/15/23 - 7/15/32 | 62,023,559 | 70,586,572 | ||
| GNMA I SF 30 Year, 6.00%, 7/15/32 - 11/15/34 | 62,291,078 | 71,079,707 | ||
| GNMA I SF 30 Year, 6.00%, 11/15/34 - 9/15/36 | 59,711,042 | 68,580,174 | ||
| GNMA I SF 30 Year, 6.00%, 9/15/36 - 10/15/37 | 59,793,128 | 67,822,381 | ||
| GNMA I SF 30 Year, 6.00%, 10/15/37 - 11/15/38 | 55,286,397 | 62,162,001 | ||
| GNMA I SF 30 Year, 6.00%, 11/15/38 - 2/15/39 | 41,590,046 | 46,670,201 | ||
| GNMA I SF 30 Year, 6.00%, 12/15/39 | 25,816,330 | 28,940,406 | ||
| GNMA I SF 30 Year, 6.50%, 5/15/23 - 10/15/31 | 62,843,939 | 71,065,932 | ||
| GNMA I SF 30 Year, 6.50%, 10/15/31 - 8/15/37 | 39,923,287 | 45,435,549 | ||
| GNMA I SF 30 Year, 6.75%, 3/15/26 | 13,704 | 15,462 | ||
| GNMA I SF 30 Year, 7.00%, 4/15/16 - 4/15/32 | 61,240,036 | 68,216,985 | ||
| GNMA I SF 30 Year, 7.00%, 4/15/32 - 9/15/32 | 8,242,994 | 9,642,990 | ||
| GNMA I SF 30 Year, 7.25%, 12/15/25 - 1/15/26 | 299,265 | 327,157 | ||
| GNMA I SF 30 Year, 7.50%, 7/15/16 - 8/15/33 | 22,164,480 | 24,535,487 | ||
| GNMA I SF 30 Year, 7.70%, 1/15/21 - 1/15/22 | 140,457 | 141,838 | ||
| GNMA I SF 30 Year, 8.00%, 11/15/15 - 9/15/30 | 11,618,739 | 12,416,093 | ||
| GNMA I SF 30 Year, 8.50%, 6/15/16 - 5/15/25 | 2,429,924 | 2,608,966 | ||
| GNMA I SF 30 Year, 9.00%, 11/15/15 - 7/15/23 | 2,967,336 | 3,138,703 | ||
| GNMA I SF 30 Year, 9.50%, 5/15/16 - 8/15/22 | 2,148,112 | 2,227,941 | ||
| GNMA I SF 30 Year, 10.00%, 2/15/16 - 3/15/25 | 2,303,094 | 2,405,350 | ||
| GNMA I SF 30 Year, 10.50%, 9/15/15 - 10/15/21 | 1,416,623 | 1,472,031 | ||
| GNMA I SF 30 Year, 11.00%, 6/15/14 - 5/15/21 | 477,096 | 489,661 | ||
| GNMA I SF 30 Year, 11.50%, 6/15/14 - 2/15/16 | 44,814 | 45,107 | ||
| GNMA I SF 30 Year, 12.00%, 4/15/14 - 12/15/15 | 214,234 | 216,170 | ||
| GNMA I SF 30 Year, 12.50%, 5/15/14 - 10/15/15 | 93,887 | 94,650 | ||
| GNMA I SF 30 Year, 13.00%, 7/15/14 - 9/15/15 | 84,458 | 85,090 | ||
| GNMA II GP 30 Year, 13.00%, 3/20/17 - 7/20/17 | 17,102 | 17,335 | ||
| bGNMA II SF 30 Year, 3.50%, 10/20/40 - 4/20/42 | 67,782,574 | 69,195,863 | ||
| GNMA II SF 30 Year, 3.50%, 5/20/42 - 6/20/42 | 26,599,697 | 27,196,953 | ||
| GNMA II SF 30 Year, 3.50%, 7/20/42 | 127,600,053 | 130,458,221 | ||
| GNMA II SF 30 Year, 3.50%, 8/20/42 | 40,318,018 | 41,223,918 | ||
| GNMA II SF 30 Year, 3.50%, 9/20/42 | 272,674,286 | 278,782,981 | ||
| GNMA II SF 30 Year, 3.50%, 10/20/42 | 57,063,720 | 58,341,883 | ||
| GNMA II SF 30 Year, 3.50%, 11/20/42 - 2/20/43 | 65,473,448 | 66,944,822 | ||
| GNMA II SF 30 Year, 3.50%, 2/20/43 - 3/20/43 | 19,756,202 | 20,201,058 | ||
| GNMA II SF 30 Year, 3.50%, 4/20/43 - 5/20/43 | 62,616,337 | 64,019,842 | ||
| GNMA II SF 30 Year, 3.50%, 5/20/43 | 77,821,683 | 79,554,887 | ||
| GNMA II SF 30 Year, 3.50%, 6/20/43 | 89,005,666 | 90,988,605 | ||
| GNMA II SF 30 Year, 3.50%, 8/20/43 | 65,464,131 | 66,930,161 | ||
| GNMA II SF 30 Year, 3.50%, 1/20/44 - 3/20/44 | 42,673,881 | 43,648,162 | ||
| GNMA II SF 30 Year, 4.00%, 5/20/40 - 10/20/40 | 30,987,736 | 32,632,827 | ||
| GNMA II SF 30 Year, 4.00%, 11/20/40 | 92,006,461 | 96,889,827 | ||
| GNMA II SF 30 Year, 4.00%, 12/20/40 | 53,723,471 | 56,573,990 | ||
| Semiannual Report | 101 | ||||
| Franklin Custodian Funds | ||||
| Statement of Investments, March 31, 2014 (unaudited) (continued) | ||||
| Franklin U.S. Government Securities Fund | Principal Amount | Value | ||
| Mortgage-Backed Securities (continued) | ||||
| Government National Mortgage Association (GNMA) Fixed Rate (continued) | ||||
| GNMA II SF 30 Year, 4.00%, 1/20/41 - 6/20/41 | $ | 58,731,921 | $ | 61,851,467 |
| GNMA II SF 30 Year, 4.00%, 7/20/41 | 81,357,561 | 85,671,875 | ||
| GNMA II SF 30 Year, 4.00%, 9/20/41 | 92,332,476 | 97,233,548 | ||
| GNMA II SF 30 Year, 4.00%, 10/20/41 | 110,518,352 | 116,378,908 | ||
| GNMA II SF 30 Year, 4.00%, 11/20/41 | 98,278,928 | 103,450,960 | ||
| bGNMA II SF 30 Year, 4.00%, 4/01/42 | 216,241,000 | 227,289,553 | ||
| GNMA II SF 30 Year, 4.00%, 7/20/42 | 23,209,201 | 24,440,453 | ||
| GNMA II SF 30 Year, 4.50%, 5/20/33 - 11/20/39 | 49,983,752 | 54,138,553 | ||
| GNMA II SF 30 Year, 4.50%, 12/20/39 | 69,386,334 | 75,050,069 | ||
| GNMA II SF 30 Year, 4.50%, 1/20/40 - 6/20/40 | 49,494,823 | 53,501,249 | ||
| GNMA II SF 30 Year, 4.50%, 5/20/41 | 90,496,930 | 97,744,593 | ||
| GNMA II SF 30 Year, 4.50%, 7/20/40 - 6/20/41 | 54,679,001 | 59,079,286 | ||
| GNMA II SF 30 Year, 4.50%, 6/20/41 | 110,065,082 | 118,713,641 | ||
| GNMA II SF 30 Year, 4.50%, 7/20/41 | 116,737,362 | 125,882,670 | ||
| GNMA II SF 30 Year, 4.50%, 9/20/41 | 151,831,030 | 163,748,351 | ||
| GNMA II SF 30 Year, 4.50%, 10/20/41 | 114,841,677 | 124,138,073 | ||
| GNMA II SF 30 Year, 4.50%, 8/20/41 - 8/20/42 | 20,367,438 | 22,017,035 | ||
| GNMA II SF 30 Year, 4.50%, 2/20/44 | 75,264,295 | 81,319,841 | ||
| GNMA II SF 30 Year, 5.00%, 7/20/33 - 9/20/33 | 59,674,520 | 65,904,368 | ||
| GNMA II SF 30 Year, 5.00%, 10/20/33 - 12/20/35 | 63,998,512 | 70,561,027 | ||
| GNMA II SF 30 Year, 5.00%, 1/20/36 - 12/20/39 | 62,793,480 | 68,683,427 | ||
| GNMA II SF 30 Year, 5.00%, 4/20/40 - 5/20/40 | 41,904,192 | 45,919,861 | ||
| GNMA II SF 30 Year, 5.00%, 6/20/40 - 9/20/41 | 52,698,759 | 57,750,192 | ||
| GNMA II SF 30 Year, 5.50%, 6/20/34 - 11/20/34 | 56,046,487 | 62,935,849 | ||
| GNMA II SF 30 Year, 5.50%, 12/20/34 - 1/20/35 | 55,735,485 | 62,255,427 | ||
| GNMA II SF 30 Year, 5.50%, 2/20/35 - 2/20/36 | 58,660,371 | 65,397,070 | ||
| GNMA II SF 30 Year, 5.50%, 4/20/36 - 4/20/40 | 54,192,229 | 60,087,466 | ||
| GNMA II SF 30 Year, 6.00%, 10/20/23 - 3/20/35 | 61,742,248 | 70,553,139 | ||
| GNMA II SF 30 Year, 6.00%, 4/20/35 - 12/20/37 | 57,448,337 | 64,660,829 | ||
| GNMA II SF 30 Year, 6.00%, 1/20/38 - 7/20/39 | 46,462,087 | 52,535,942 | ||
| GNMA II SF 30 Year, 6.50%, 6/20/24 - 1/20/39 | 56,082,065 | 63,969,058 | ||
| GNMA II SF 30 Year, 7.00%, 2/20/28 - 7/20/33 | 10,304,868 | 12,135,139 | ||
| GNMA II SF 30 Year, 7.50%, 10/20/22 - 4/20/32 | 2,515,082 | 2,906,611 | ||
| GNMA II SF 30 Year, 8.00%, 8/20/16 - 6/20/30 | 1,240,597 | 1,419,595 | ||
| GNMA II SF 30 Year, 8.50%, 4/20/16 - 6/20/25 | 505,883 | 541,348 | ||
| GNMA II SF 30 Year, 9.00%, 8/20/16 - 11/20/21 | 134,197 | 147,897 | ||
| GNMA II SF 30 Year, 9.50%, 3/20/18 - 4/20/25 | 123,171 | 135,247 | ||
| GNMA II SF 30 Year, 10.00%, 8/20/15 - 3/20/21 | 191,790 | 215,236 | ||
| GNMA II SF 30 Year, 10.50%, 8/20/14 - 1/20/21 | 374,327 | 395,617 | ||
| GNMA II SF 30 Year, 11.00%, 10/20/15 - 1/20/21 | 75,277 | 76,985 | ||
| GNMA II SF 30 Year, 11.50%, 10/20/24 - 1/20/28 | 9,815 | 10,172 | ||
| GNMA II SF 30 Year, 12.00%, 6/20/14 - 2/20/16 | 20,215 | 20,488 | ||
| GNMA II SF 30 Year, 12.50%, 2/20/15 - 11/20/15 | 4,921 | 4,974 | ||
| GNMA II SF 30 Year, 13.00%, 9/20/14 - 3/20/15 | 869 | 875 | ||
| 6,992,895,799 | ||||
| Total Mortgage-Backed Securities (Cost $7,079,036,999) | 7,295,865,086 | |||
102 | Semiannual Report
Franklin Custodian Funds
Statement of Investments, March 31, 2014 (unaudited) (continued)
| Franklin U.S. Government Securities Fund | Shares | Value | ||
| Short Term Investments (Cost $104,422,875) 1.5% | ||||
| Money Market Funds 1.5% | ||||
| c,dInstitutional Fiduciary Trust Money Market Portfolio | 104,422,875 | $ | 104,422,875 | |
| Total Investments (Cost $7,183,459,874) 104.1% | 7,400,287,961 | |||
| Other Assets, less Liabilities (4.1)% | (287,863,463 | ) | ||
| Net Assets 100.0% | $ | 7,112,424,498 | ||
| See Abbreviations on page 145. | ||||
| aThe coupon rate shown represents the rate at period end. | ||||
| bSecurity purchased on a to-be-announced basis. | ||||
| cNon-income producing. | ||||
| dSee Note 3(f) regarding investments in the Institutional Fiduciary Trust Money Market Portfolio. | ||||
Semiannual Report | The accompanying notes are an integral part of these financial statements. | 103
| Franklin Custodian Funds | ||||||||||||||||||
| Financial Highlights | ||||||||||||||||||
| Franklin Utilities Fund | ||||||||||||||||||
| Six Months Ended | ||||||||||||||||||
| March 31, 2014 | Year Ended September 30, | |||||||||||||||||
| Class A | (unaudited) | 2013 | 2012 | 2011 | 2010 | 2009 | ||||||||||||
| Per share operating performance | ||||||||||||||||||
| (for a share outstanding throughout | ||||||||||||||||||
| the period) | ||||||||||||||||||
| Net asset value, beginning of period | $ | 14.62 | $ | 14.04 | $ | 12.42 | $ | 11.44 | $ | 10.74 | $ | 11.92 | ||||||
| Income from investment operationsa: | ||||||||||||||||||
| Net investment incomeb | 0.24 | 0.49 | 0.48 | 0.44 | 0.43 | 0.43 | ||||||||||||
| Net realized and unrealized gains | ||||||||||||||||||
| (losses) | 1.55 | 0.60 | 1.60 | 0.97 | 0.88 | (1.11 | ) | |||||||||||
| Total from investment operations | 1.79 | 1.09 | 2.08 | 1.41 | 1.31 | (0.68 | ) | |||||||||||
| Less distributions from: | ||||||||||||||||||
| Net investment income | (0.26 | ) | (0.51 | ) | (0.46 | ) | (0.43 | ) | (0.45 | ) | (0.42 | ) | ||||||
| Net realized gains | (0.04 | ) | (0.16 | ) | (0.08 | ) | ||||||||||||
| Total distributions | (0.30 | ) | (0.51 | ) | (0.46 | ) | (0.43 | ) | (0.61 | ) | (0.50 | ) | ||||||
| Net asset value, end of period | $ | 16.11 | $ | 14.62 | $ | 14.04 | $ | 12.42 | $ | 11.44 | $ | 10.74 | ||||||
| Total returnc | 12.37 | % | 7.92 | % | 16.99 | % | 12.50 | % | 12.69 | % | (5.20 | )% | ||||||
| Ratios to average net assetsd | ||||||||||||||||||
| Expenses | 0.75 | %e | 0.75 | %f | 0.76 | % | 0.76 | % | 0.78 | % | 0.80 | %f | ||||||
| Net investment income | 3.12 | % | 3.34 | % | 3.61 | % | 3.67 | % | 3.91 | % | 4.29 | % | ||||||
| Supplemental data | ||||||||||||||||||
| Net assets, end of period (000 s) | $ | 3,558,610 | $ | 3,275,129 | $ | 3,076,131 | $ | 2,220,083 | $ | 1,823,972 | $ | 1,543,060 | ||||||
| Portfolio turnover rate | 4.72 | % | 4.57 | % | 1.27 | % | 5.21 | % | 5.27 | % | 15.49 | % | ||||||
aThe amount shown for a share outstanding throughout the period may not correlate with the Statement of Operations for the period due to the timing of sales and repurchases of
the Fund shares in relation to income earned and/or fluctuating market value of the investments of the Fund.
bBased on average daily shares outstanding.
cTotal return does not reflect sales commissions or contingent deferred sales charges, if applicable, and is not annualized for periods less than one year.
dRatios are annualized for periods less than one year.
eBenefit of waiver and payments by affiliate rounds to less than 0.01%.
fBenefit of expense reduction rounds to less than 0.01%.
104 | The accompanying notes are an integral part of these financial statements. | Semiannual Report
| Franklin Custodian Funds | ||||||||||||||||||
| Financial Highlights (continued) | ||||||||||||||||||
| Franklin Utilities Fund | ||||||||||||||||||
| Six Months Ended | ||||||||||||||||||
| March 31, 2014 | Year Ended September 30, | |||||||||||||||||
| Class C | (unaudited) | 2013 | 2012 | 2011 | 2010 | 2009 | ||||||||||||
| Per share operating performance | ||||||||||||||||||
| (for a share outstanding throughout the period) | ||||||||||||||||||
| Net asset value, beginning of period | $ | 14.56 | $ | 13.98 | $ | 12.37 | $ | 11.40 | $ | 10.71 | $ | 11.88 | ||||||
| Income from investment operationsa: | ||||||||||||||||||
| Net investment incomeb | 0.20 | 0.41 | 0.42 | 0.38 | 0.37 | 0.38 | ||||||||||||
| Net realized and unrealized gains (losses) | 1.54 | 0.61 | 1.58 | 0.96 | 0.88 | (1.10 | ) | |||||||||||
| Total from investment operations | 1.74 | 1.02 | 2.00 | 1.34 | 1.25 | (0.72 | ) | |||||||||||
| Less distributions from: | ||||||||||||||||||
| Net investment income | (0.22 | ) | (0.44 | ) | (0.39 | ) | (0.37 | ) | (0.40 | ) | (0.37 | ) | ||||||
| Net realized gains | (0.04 | ) | (0.16 | ) | (0.08 | ) | ||||||||||||
| Total distributions | (0.26 | ) | (0.44 | ) | (0.39 | ) | (0.37 | ) | (0.56 | ) | (0.45 | ) | ||||||
| Net asset value, end of period | $ | 16.04 | $ | 14.56 | $ | 13.98 | $ | 12.37 | $ | 11.40 | $ | 10.71 | ||||||
| Total returnc | 12.08 | % | 7.40 | % | 16.32 | % | 12.00 | % | 12.08 | % | (5.64 | )% | ||||||
| Ratios to average net assetsd | ||||||||||||||||||
| Expenses | 1.25 | %e | 1.25 | %f | 1.26 | % | 1.26 | % | 1.28 | % | 1.30 | %f | ||||||
| Net investment income | 2.62 | % | 2.84 | % | 3.11 | % | 3.17 | % | 3.41 | % | 3.79 | % | ||||||
| Supplemental data | ||||||||||||||||||
| Net assets, end of period (000 s) | $ | 927,715 | $ | 845,173 | $ | 774,711 | $ | 528,391 | $ | 405,024 | $ | 300,544 | ||||||
| Portfolio turnover rate | 4.72 | % | 4.57 | % | 1.27 | % | 5.21 | % | 5.27 | % | 15.49 | % | ||||||
aThe amount shown for a share outstanding throughout the period may not correlate with the Statement of Operations for the period due to the timing of sales and repurchases of
the Fund shares in relation to income earned and/or fluctuating market value of the investments of the Fund.
bBased on average daily shares outstanding.
cTotal return does not reflect sales commissions or contingent deferred sales charges, if applicable, and is not annualized for periods less than one year.
dRatios are annualized for periods less than one year.
eBenefit of waiver and payments by affiliate rounds to less than 0.01%.
fBenefit of expense reduction rounds to less than 0.01%.
Semiannual Report | The accompanying notes are an integral part of these financial statements. | 105
| Franklin Custodian Funds | ||||||||||||||||||
| Financial Highlights (continued) | ||||||||||||||||||
| Franklin Utilities Fund | ||||||||||||||||||
| Six Months Ended | ||||||||||||||||||
| March 31, 2014 | Year Ended September 30, | |||||||||||||||||
| Class R | (unaudited) | 2013 | 2012 | 2011 | 2010 | 2009 | ||||||||||||
| Per share operating performance | ||||||||||||||||||
| (for a share outstanding throughout the period) | ||||||||||||||||||
| Net asset value, beginning of period | $ | 14.58 | $ | 14.00 | $ | 12.39 | $ | 11.41 | $ | 10.71 | $ | 11.89 | ||||||
| Income from investment operationsa: | ||||||||||||||||||
| Net investment incomeb | 0.21 | 0.44 | 0.44 | 0.40 | 0.39 | 0.40 | ||||||||||||
| Net realized and unrealized gains (losses) | 1.54 | 0.60 | 1.58 | 0.97 | 0.88 | (1.11 | ) | |||||||||||
| Total from investment operations | 1.75 | 1.04 | 2.02 | 1.37 | 1.27 | (0.71 | ) | |||||||||||
| Less distributions from: | ||||||||||||||||||
| Net investment income | (0.23 | ) | (0.46 | ) | (0.41 | ) | (0.39 | ) | (0.41 | ) | (0.39 | ) | ||||||
| Net realized gains | (0.04 | ) | (0.16 | ) | (0.08 | ) | ||||||||||||
| Total distributions | (0.27 | ) | (0.46 | ) | (0.41 | ) | (0.39 | ) | (0.57 | ) | (0.47 | ) | ||||||
| Net asset value, end of period | $ | 16.06 | $ | 14.58 | $ | 14.00 | $ | 12.39 | $ | 11.41 | $ | 10.71 | ||||||
| Total returnc | 12.14 | % | 7.56 | % | 16.55 | % | 12.14 | % | 12.33 | % | (5.57 | )% | ||||||
| Ratios to average net assetsd | ||||||||||||||||||
| Expenses | 1.10 | %e | 1.10 | %f | 1.11 | % | 1.11 | % | 1.13 | % | 1.15 | %f | ||||||
| Net investment income | 2.77 | % | 2.99 | % | 3.26 | % | 3.32 | % | 3.56 | % | 3.94 | % | ||||||
| Supplemental data | ||||||||||||||||||
| Net assets, end of period (000 s) | $ | 93,322 | $ | 86,216 | $ | 80,478 | $ | 51,732 | $ | 42,285 | $ | 37,795 | ||||||
| Portfolio turnover rate | 4.72 | % | 4.57 | % | 1.27 | % | 5.21 | % | 5.27 | % | 15.49 | % | ||||||
aThe amount shown for a share outstanding throughout the period may not correlate with the Statement of Operations for the period due to the timing of sales and repurchases of
the Fund shares in relation to income earned and/or fluctuating market value of the investments of the Fund.
bBased on average daily shares outstanding.
cTotal return is not annualized for periods less than one year.
dRatios are annualized for periods less than one year.
eBenefit of waiver and payments by affiliate rounds to less than 0.01%.
fBenefit of expense reduction rounds to less than 0.01%.
106 | The accompanying notes are an integral part of these financial statements. | Semiannual Report
| Franklin Custodian Funds | �� | |||||
| Financial Highlights (continued) | ||||||
| Franklin Utilities Fund | ||||||
| Six Months Ended | Period Ended | |||||
| March 31, 2014 | September 30, | |||||
| Class R6 | (unaudited) | 2013 | a | |||
| Per share operating performance | ||||||
| (for a share outstanding throughout the period) | ||||||
| Net asset value, beginning of period | $ | 14.71 | $ | 15.88 | ||
| Income from investment operationsb: | ||||||
| Net investment incomec | 0.26 | 0.25 | ||||
| Net realized and unrealized gains (losses) | 1.56 | (1.17 | ) | |||
| Total from investment operations | 1.82 | (0.92 | ) | |||
| Less distributions from: | ||||||
| Net investment income | (0.28 | ) | (0.25 | ) | ||
| Net realized gains | (0.04 | ) | ||||
| Total distributions | (0.32 | ) | (0.25 | ) | ||
| Net asset value, end of period | $ | 16.21 | $ | 14.71 | ||
| Total returnd | 12.52 | % | (5.79 | )% | ||
| Ratios to average net assetse | ||||||
| Expenses | 0.48 | %f | 0.48 | %g | ||
| Net investment income | 3.39 | % | 3.61 | % | ||
| Supplemental data | ||||||
| Net assets, end of period (000 s) | $ | 244,154 | $ | 218,746 | ||
| Portfolio turnover rate | 4.72 | % | 4.57 | % | ||
aFor the period May 1, 2013 (effective date) to September 30, 2013.
bThe amount shown for a share outstanding throughout the period may not correlate with the Statement of Operations for the period due to the timing of sales and repurchases of
the Fund shares in relation to income earned and/or fluctuating market value of the investments of the Fund.
cBased on average daily shares outstanding.
dTotal return is not annualized for periods less than one year.
eRatios are annualized for periods less than one year.
fBenefit of waiver and payments by affiliate rounds to less than 0.01%.
gBenefit of expense reduction rounds to less than 0.01%.
Semiannual Report | The accompanying notes are an integral part of these financial statements. | 107
| Franklin Custodian Funds | ||||||||||||||||||
| Financial Highlights (continued) | ||||||||||||||||||
| Franklin Utilities Fund | ||||||||||||||||||
| Six Months Ended | ||||||||||||||||||
| March 31, 2014 | Year Ended September 30, | |||||||||||||||||
| Advisor Class | (unaudited) | 2013 | 2012 | 2011 | 2010 | 2009 | ||||||||||||
| Per share operating performance | ||||||||||||||||||
| (for a share outstanding throughout the period) | ||||||||||||||||||
| Net asset value, beginning of period | $ | 14.71 | $ | 14.12 | $ | 12.49 | $ | 11.50 | $ | 10.79 | $ | 11.98 | ||||||
| Income from investment operationsa: | ||||||||||||||||||
| Net investment incomeb | 0.25 | 0.50 | 0.51 | 0.46 | 0.45 | 0.45 | ||||||||||||
| Net realized and unrealized gains (losses) | 1.56 | 0.62 | 1.60 | 0.97 | 0.89 | (1.12 | ) | |||||||||||
| Total from investment operations | 1.81 | 1.12 | 2.11 | 1.43 | 1.34 | (0.67 | ) | |||||||||||
| Less distributions from: | ||||||||||||||||||
| Net investment income | (0.27 | ) | (0.53 | ) | (0.48 | ) | (0.44 | ) | (0.47 | ) | (0.44 | ) | ||||||
| Net realized gains | (0.04 | ) | (0.16 | ) | (0.08 | ) | ||||||||||||
| Total distributions | (0.31 | ) | (0.53 | ) | (0.48 | ) | (0.44 | ) | (0.63 | ) | (0.52 | ) | ||||||
| Net asset value, end of period | $ | 16.21 | $ | 14.71 | $ | 14.12 | $ | 12.49 | $ | 11.50 | $ | 10.79 | ||||||
| Total returnc | 12.45 | % | 8.11 | % | 17.15 | % | 12.68 | % | 12.89 | % | (5.12 | )% | ||||||
| Ratios to average net assetsd | ||||||||||||||||||
| Expenses | 0.60 | %e | 0.60 | %f | 0.61 | % | 0.61 | % | 0.63 | % | 0.65 | %f | ||||||
| Net investment income | 3.27 | % | 3.49 | % | 3.76 | % | 3.82 | % | 4.06 | % | 4.44 | % | ||||||
| Supplemental data | ||||||||||||||||||
| Net assets, end of period (000 s) | $ | 479,430 | $ | 343,082 | $ | 574,803 | $ | 347,983 | $ | 222,788 | $ | 124,454 | ||||||
| Portfolio turnover rate | 4.72 | % | 4.57 | % | 1.27 | % | 5.21 | % | 5.27 | % | 15.49 | % | ||||||
aThe amount shown for a share outstanding throughout the period may not correlate with the Statement of Operations for the period due to the timing of sales and repurchases of
the Fund shares in relation to income earned and/or fluctuating market value of the investments of the Fund.
bBased on average daily shares outstanding.
cTotal return is not annualized for periods less than one year.
dRatios are annualized for periods less than one year.
eBenefit of waiver and payments by affiliate rounds to less than 0.01%.
fBenefit of expense reduction rounds to less than 0.01%.
108 | The accompanying notes are an integral part of these financial statements. | Semiannual Report
| Franklin Custodian Funds | ||||
| Statement of Investments, March 31, 2014 (unaudited) | ||||
| Franklin Utilities Fund | Country | Shares | Value | |
| Common Stocks 97.2% | ||||
| Diversified Telecommunication Services 2.1% | ||||
| AT&T Inc. | United States | 2,000,000 | $ | 70,140,000 |
| Verizon Communications Inc. | United States | 900,000 | 42,813,000 | |
| 112,953,000 | ||||
| Electric Utilities 49.8% | ||||
| ALLETE Inc. | United States | 1,000,000 | 52,420,000 | |
| American Electric Power Co. Inc. | United States | 4,100,000 | 207,706,000 | |
| Cleco Corp. | United States | 700,000 | 35,406,000 | |
| Duke Energy Corp. | United States | 3,550,000 | 252,831,000 | |
| Edison International | United States | 4,400,000 | 249,084,000 | |
| Entergy Corp. | United States | 1,500,000 | 100,275,000 | |
| Exelon Corp. | United States | 4,900,000 | 164,444,000 | |
| FirstEnergy Corp. | United States | 2,500,000 | 85,075,000 | |
| Great Plains Energy Inc. | United States | 4,200,000 | 113,568,000 | |
| Hawaiian Electric Industries Inc. | United States | 1,200,000 | 30,504,000 | |
| IDACORP Inc. | United States | 400,000 | 22,188,000 | |
| NextEra Energy Inc. | United States | 2,700,000 | 258,174,000 | |
| Northeast Utilities | United States | 1,700,000 | 77,350,000 | |
| OGE Energy Corp. | United States | 1,400,000 | 51,464,000 | |
| Pepco Holdings Inc. | United States | 4,000,000 | 81,920,000 | |
| Pinnacle West Capital Corp. | United States | 1,800,000 | 98,388,000 | |
| PNM Resources Inc. | United States | 3,300,000 | 89,199,000 | |
| Portland General Electric Co. | United States | 2,000,000 | 64,680,000 | |
| PPL Corp. | United States | 4,000,000 | 132,560,000 | |
| The Southern Co. | United States | 4,300,000 | 188,942,000 | |
| SSE PLC | United Kingdom | 1,200,000 | 29,398,521 | |
| UIL Holdings Corp. | United States | 1,360,000 | 50,061,600 | |
| Westar Energy Inc. | United States | 2,200,000 | 77,352,000 | |
| Xcel Energy Inc. | United States | 4,300,000 | 130,548,000 | |
| 2,643,538,121 | ||||
| Gas Utilities 1.2% | ||||
| Northwest Natural Gas Co. | United States | 76,949 | 3,386,526 | |
| aONE Gas Inc. | United States | 500,000 | 17,965,000 | |
| Questar Corp. | United States | 1,705,300 | 40,552,034 | |
| 61,903,560 | ||||
| Multi-Utilities 32.3% | ||||
| Alliant Energy Corp. | United States | 1,500,000 | 85,215,000 | |
| Ameren Corp. | United States | 200,000 | 8,240,000 | |
| CenterPoint Energy Inc. | United States | 4,400,000 | 104,236,000 | |
| CMS Energy Corp. | United States | 4,000,000 | 117,120,000 | |
| Consolidated Edison Inc. | United States | 1,000,000 | 53,650,000 | |
| Dominion Resources Inc. | United States | 3,500,000 | 248,465,000 | |
| DTE Energy Co. | United States | 1,300,000 | 96,577,000 | |
| MDU Resources Group Inc. | United States | 3,000,000 | 102,930,000 | |
| National Grid PLC | United Kingdom | 11,000,000 | 150,789,537 | |
| NiSource Inc. | United States | 1,400,000 | 49,742,000 | |
Semiannual Report | 109
| Franklin Custodian Funds | |||||
| Statement of Investments, March 31, 2014 (unaudited) (continued) | |||||
| Franklin Utilities Fund | Country | Shares | Value | ||
| Common Stocks (continued) | |||||
| Multi-Utilities (continued) | |||||
| PG&E Corp. | United States | 4,300,000 | $ | 185,760,000 | |
| Public Service Enterprise Group Inc. | United States | 3,300,000 | 125,862,000 | ||
| Sempra Energy | United States | 2,400,000 | 232,224,000 | ||
| TECO Energy Inc. | United States | 1,700,000 | 29,155,000 | ||
| Vectren Corp. | United States | 925,100 | 36,439,689 | ||
| Wisconsin Energy Corp. | United States | 1,800,000 | 83,790,000 | ||
| 1,710,195,226 | |||||
| Oil, Gas & Consumable Fuels 8.4% | |||||
| Enbridge Inc. | Canada | 400,000 | 18,168,989 | ||
| Kinder Morgan Inc. | United States | 3,500,000 | 113,715,000 | ||
| Plains GP Holdings LP, A | United States | 1,500,000 | 41,970,000 | ||
| Spectra Energy Corp. | United States | 1,800,000 | 66,492,000 | ||
| TransCanada Corp. | Canada | 1,800,000 | 81,825,583 | ||
| The Williams Cos. Inc. | United States | 3,000,000 | 121,740,000 | ||
| 443,911,572 | |||||
| Water Utilities 3.4% | |||||
| American Water Works Co. Inc. | United States | 2,000,000 | 90,800,000 | ||
| United Utilities Group PLC | United Kingdom | 7,000,000 | 91,930,811 | ||
| 182,730,811 | |||||
| Total Common Stocks (Cost $3,321,604,591) | 5,155,232,290 | ||||
| Principal Amount | |||||
| Corporate Bonds 1.4% | |||||
| Electric Utilities 1.3% | |||||
| bEnergy Future Intermediate Holding Co. LLC/EFIH Finance Inc., first lien, | |||||
| 144A, 10.00%, 12/01/20 | United States | $ | 24,225,000 | 25,648,219 | |
| MidAmerican Energy Holdings Co., senior note, 8.48%, 9/15/28 | United States | 25,000,000 | 34,837,850 | ||
| Northeast Generation Co., senior secured note, B-1, 8.812%, | |||||
| 10/15/26 | United States | 6,357,422 | 6,769,948 | ||
| 67,256,017 | |||||
| Multi-Utilities 0.1% | |||||
| Aquila Inc., senior note, 8.27%, 11/15/21 | United States | 6,100,000 | 7,636,877 | ||
| Total Corporate Bonds (Cost $63,764,427) | 74,892,894 | ||||
| Total Investments before Short Term Investments | |||||
| (Cost $3,385,369,018) | 5,230,125,184 | ||||
| Shares | |||||
| Short Term Investments (Cost $66,217,489) 1.3% | |||||
| Money Market Funds 1.3% | |||||
| a,cInstitutional Fiduciary Trust Money Market Portfolio | United States | 66,217,489 | 66,217,489 | ||
| Total Investments (Cost $3,451,586,507) 99.9% | 5,296,342,673 | ||||
| Other Assets, less Liabilities 0.1% | 6,888,317 | ||||
| Net Assets 100.0% | $ | 5,303,230,990 | |||
110 | Semiannual Report
Franklin Custodian Funds
Statement of Investments, March 31, 2014 (unaudited) (continued)
Franklin Utilities Fund
See Abbreviations on page 145.
aNon-income producing.
bSecurity was purchased pursuant to Rule 144A under the Securities Act of 1933 and may be sold in transactions exempt from registration only to qualified institutional buyers or in
a public offering registered under the Securities Act of 1933. This security has been deemed liquid under guidelines approved by the Fund s Board of Trustees. At March 31, 2014,
the value of this security was $25,648,219, representing 0.48% of net assets.
cSee Note 3(f) regarding investments in the Institutional Fiduciary Trust Money Market Portfolio.
Semiannual Report | The accompanying notes are an integral part of these financial statements. | 111
| Franklin Custodian Funds | |||||||||
| Financial Statements | |||||||||
| Statements of Assets and Liabilities | |||||||||
| March 31, 2014 (unaudited) | |||||||||
| Franklin | Franklin | Franklin | |||||||
| DynaTech Fund | Growth Fund | Income Fund | |||||||
| Assets: | |||||||||
| Investments in securities: | |||||||||
| Cost - Unaffiliated issuers | $ | 1,193,412,034 | $ | 3,874,764,600 | $ | 76,993,909,852 | |||
| Cost - Non-controlled affiliated issuers (Note 10) | 3,220,374,168 | ||||||||
| Cost - Sweep Money Fund (Note 3f) | 57,914,104 | 485,193,678 | 206,275,306 | ||||||
| Cost - Repurchase agreements | -- | 197,401,393 | -- | ||||||
| Total cost of investments | $ | 1,251,326,138 | $ | 4,557,359,671 | $ | 80,420,559,326 | |||
| Value - Unaffiliated issuers | $ | 2,087,060,080 | $ | 8,821,662,644 | $ | 87,921,658,763 | |||
| Value - Non-controlled affiliated issuers (Note 10) | 1,936,804,867 | ||||||||
| Value - Sweep Money Fund (Note 3f) | 57,914,104 | 485,193,678 | 206,275,306 | ||||||
| Value - Repurchase agreements | -- | 197,401,393 | -- | ||||||
| Total value of investmentsa | 2,144,974,184 | 9,504,257,715 | 90,064,738,936 | ||||||
| Cash | 275 | 299,793,342 | 8,836,499 | ||||||
| Receivables: | |||||||||
| Investment securities sold | 7,987,743 | 60,766,826 | |||||||
| Capital shares sold | 9,467,866 | 11,999,019 | 185,368,147 | ||||||
| Dividends and interest | 414,538 | 7,872,467 | 789,046,410 | ||||||
| Unrealized appreciation on unfunded loan commitments (Note 8) | -- | -- | 2,617,742 | ||||||
| Other assets | 1,348 | 6,116 | 55,903 | ||||||
| Total assets | 2,162,845,954 | 9,823,928,659 | 91,111,430,463 | ||||||
| Liabilities: | |||||||||
| Payables: | |||||||||
| Investment securities purchased | 1,513,200 | 1,495,258 | 459,288,662 | ||||||
| Capital shares redeemed | 4,037,800 | 18,234,830 | 124,286,925 | ||||||
| Management fees | 823,734 | 3,642,094 | 27,669,856 | ||||||
| Distribution fees | 952,676 | 3,954,018 | 40,995,261 | ||||||
| Transfer agent fees | 386,907 | 1,983,399 | 7,847,073 | ||||||
| Options written, at value (premiums received $ , $ and | |||||||||
| $1,274,176) | -- | -- | 1,155,000 | ||||||
| Payable upon return of securities loaned | -- | -- | 47,130,120 | ||||||
| Accrued expenses and other liabilities | 110,652 | 396,506 | 2,491,214 | ||||||
| Total liabilities | 7,824,969 | 29,706,105 | 710,864,111 | ||||||
| Net assets, at value | $ | 2,155,020,985 | $ | 9,794,222,554 | $ | 90,400,566,352 | |||
| Net assets consist of: | |||||||||
| Paid-in capital | $ | 1,255,093,442 | $ | 4,917,133,262 | $ | 85,407,949,679 | |||
| Undistributed net investment income (loss) | (8,662,825 | ) | 4,475,533 | ||||||
| Distributions in excess of net investment income | -- | -- | (369,349,992 | ) | |||||
| Net unrealized appreciation (depreciation) | 893,647,831 | 4,946,898,044 | 9,648,822,236 | ||||||
| Accumulated net realized gain (loss) | 14,942,537 | (74,284,285 | ) | (4,286,855,571 | ) | ||||
| Net assets, at value | $ | 2,155,020,985 | $ | 9,794,222,554 | $ | 90,400,566,352 | |||
| aIncludes securities loaned | $ | -- | $ | -- | $ | 45,068,460 | |||
112 | The accompanying notes are an integral part of these financial statements. | Semiannual Report
Franklin Custodian Funds
Financial Statements (continued)
Statements of Assets and Liabilities (continued)
March 31, 2014 (unaudited)
| Franklin | Franklin | Franklin | |||||||
| DynaTech Fund | Growth Fund | Income Fund | |||||||
| Class A: | |||||||||
| Net assets, at value | $ | 1,410,119,091 | $ | 6,267,655,243 | $ | 53,263,857,842 | |||
| Shares outstanding | 32,048,851 | 93,990,604 | 21,375,376,576 | ||||||
| Net asset value per sharea | $ | 44.00 | $ | 66.68 | $ | 2.49 | |||
| Maximum offering price per share (net asset value per share ÷ 94.25%, | |||||||||
| 94.25% and 95.75%, respectively) | $ | 46.68 | $ | 70.75 | $ | 2.60 | |||
| Class C: | |||||||||
| Net assets, at value | $ | 207,018,884 | $ | 622,308,691 | $ | 27,352,834,747 | |||
| Shares outstanding | 5,329,255 | 9,970,508 | 10,865,442,476 | ||||||
| Net asset value and maximum offering price per sharea | $ | 38.85 | $ | 62.41 | $ | 2.52 | |||
| Class R: | |||||||||
| Net assets, at value | $ | 43,844,781 | $ | 567,140,177 | $ | 499,690,003 | |||
| Shares outstanding | 1,011,440 | 8,549,467 | 203,639,352 | ||||||
| Net asset value and maximum offering price per share | $ | 43.35 | $ | 66.34 | $ | 2.45 | |||
| Class R6: | |||||||||
| Net assets, at value | $ | 338,945,045 | $ | 1,031,319,707 | $ | 2,119,867,060 | |||
| Shares outstanding | 7,572,734 | 15,445,069 | 856,735,896 | ||||||
| Net asset value and maximum offering price per share | $ | 44.76 | $ | 66.77 | $ | 2.47 | |||
| Advisor Class: | |||||||||
| Net assets, at value | $ | 155,093,184 | $ | 1,305,798,736 | $ | 7,164,316,700 | |||
| Shares outstanding | 3,470,554 | 19,539,224 | 2,896,138,997 | ||||||
| Net asset value and maximum offering price per share | $ | 44.69 | $ | 66.83 | $ | 2.47 | |||
| aRedemption price is equal to net asset value less contingent deferred sales charges, if applicable. | |||||||||
Semiannual Report | The accompanying notes are an integral part of these financial statements. | 113
| Franklin Custodian Funds | ||||||
| Financial Statements (continued) | ||||||
| Statements of Assets and Liabilities (continued) | ||||||
| March 31, 2014 (unaudited) | ||||||
| Franklin | ||||||
| U.S. Government | Franklin | |||||
| Securities Fund | Utilities Fund | |||||
| Assets: | ||||||
| Investments in securities: | ||||||
| Cost - Unaffiliated issuers | $ | 7,079,036,999 | $ | 3,385,369,018 | ||
| Cost - Sweep Money Fund (Note 3f) | 104,422,875 | 66,217,489 | ||||
| Total cost of investments | $ | 7,183,459,874 | $ | 3,451,586,507 | ||
| Value - Unaffiliated issuers | $ | 7,295,865,086 | $ | 5,230,125,184 | ||
| Value - Sweep Money Fund (Note 3f) | 104,422,875 | 66,217,489 | ||||
| Total value of investments | 7,400,287,961 | 5,296,342,673 | ||||
| Cash | 3,761 | 56 | ||||
| Restricted cash (Note 1f) | 60,000 | -- | ||||
| Receivables: | ||||||
| Capital shares sold | 5,088,860 | 8,532,777 | ||||
| Dividends and interest | 24,569,346 | 13,698,469 | ||||
| Due from brokers | 670,000 | |||||
| Other assets | 5,602 | 3,245 | ||||
| Total assets | 7,430,685,530 | 5,318,577,220 | ||||
| Liabilities: | ||||||
| Payables: | ||||||
| Investment securities purchased | 295,489,242 | 2,269,543 | ||||
| Capital shares redeemed | 12,769,071 | 8,056,389 | ||||
| Management fees | 2,677,535 | 2,005,626 | ||||
| Distribution fees | 2,574,846 | 1,849,259 | ||||
| Transfer agent fees | 1,302,053 | 776,072 | ||||
| Distributions to shareholders | 2,951,155 | -- | ||||
| Due to brokers | 60,000 | -- | ||||
| Accrued expenses and other liabilities | 437,130 | 389,341 | ||||
| Total liabilities | 318,261,032 | 15,346,230 | ||||
| Net assets, at value | $ | 7,112,424,498 | $ | 5,303,230,990 | ||
| Net assets consist of: | ||||||
| Paid-in capital | $ | 7,289,851,509 | $ | 3,362,123,880 | ||
| Distributions in excess of net investment income | (34,237,087 | ) | (732,086 | ) | ||
| Net unrealized appreciation (depreciation) | 216,828,087 | 1,844,786,535 | ||||
| Accumulated net realized gain (loss) | (360,018,011 | ) | 97,052,661 | |||
| Net assets, at value | $ | 7,112,424,498 | $ | 5,303,230,990 | ||
114 | The accompanying notes are an integral part of these financial statements. | Semiannual Report
| Franklin Custodian Funds | ||||||
| Financial Statements (continued) | ||||||
| Statements of Assets and Liabilities (continued) | ||||||
| March 31, 2014 (unaudited) | ||||||
| Franklin | ||||||
| U.S. Government | Franklin | |||||
| Securities Fund | Utilities Fund | |||||
| Class A: | ||||||
| Net assets, at value | $ | 4,504,913,756 | $ | 3,558,609,600 | ||
| Shares outstanding | 694,879,370 | 220,875,629 | ||||
| Net asset value per sharea | $ | 6.48 | $ | 16.11 | ||
| Maximum offering price per share (net asset value per share ÷ 95.75) | $ | 6.77 | $ | 16.83 | ||
| Class C: | ||||||
| Net assets, at value | $ | 1,322,558,566 | $ | 927,715,214 | ||
| Shares outstanding | 205,292,296 | 57,824,324 | ||||
| Net asset value and maximum offering price per sharea | $ | 6.44 | $ | 16.04 | ||
| Class R: | ||||||
| Net assets, at value | $ | 78,196,304 | $ | 93,321,648 | ||
| Shares outstanding | 12,070,049 | 5,810,774 | ||||
| Net asset value and maximum offering price per share | $ | 6.48 | $ | 16.06 | ||
| Class R6: | ||||||
| Net assets, at value | $ | 503,210,308 | $ | 244,154,320 | ||
| Shares outstanding | 77,396,368 | 15,062,153 | ||||
| Net asset value and maximum offering price per share | $ | 6.50 | $ | 16.21 | ||
| Advisor Class: | ||||||
| Net assets, at value | $ | 703,545,564 | $ | 479,430,208 | ||
| Shares outstanding | 108,205,344 | 29,575,244 | ||||
| Net asset value and maximum offering price per share | $ | 6.50 | $ | 16.21 | ||
| aRedemption price is equal to net asset value less contingent deferred sales charges, if applicable. | ||||||
Semiannual Report | The accompanying notes are an integral part of these financial statements. | 115
| Franklin Custodian Funds | |||||||||
| Financial Statements (continued) | |||||||||
| Statements of Operations | |||||||||
| for the six months ended March 31, 2014 (unaudited) | |||||||||
| Franklin | Franklin | Franklin | |||||||
| DynaTech Fund | Growth Fund | Income Fund | |||||||
| Investment income: | |||||||||
| Dividends: | |||||||||
| Unaffiliated issuers | $ | 4,170,704 | $ | 60,067,982 | $ | 911,522,706 | |||
| Non-controlled affiliated issuers (Note 10) | -- | -- | 9,562,500 | ||||||
| Interest: | |||||||||
| Unaffiliated issuers | -- | 116,006 | 1,225,089,418 | ||||||
| Non-controlled affiliated issuers (Note 10) | -- | -- | 14,179,194 | ||||||
| Income from securities loaned | -- | 56,198 | 1,825,869 | ||||||
| Total investment income | 4,170,704 | 60,240,186 | 2,162,179,687 | ||||||
| Expenses: | |||||||||
| Management fees (Note 3a) | 4,681,426 | 21,377,029 | 159,971,438 | ||||||
| Distribution fees: (Note 3c) | |||||||||
| Class A | 1,572,381 | 7,452,055 | 38,092,075 | ||||||
| Class C | 987,132 | 2,955,558 | 83,187,964 | ||||||
| Class R | 109,619 | 1,430,247 | 1,168,778 | ||||||
| Transfer agent fees: (Note 3e) | |||||||||
| Class A | 965,881 | 5,002,265 | 18,991,879 | ||||||
| Class C | 151,286 | 496,161 | 9,569,857 | ||||||
| Class R | 33,596 | 481,156 | 174,829 | ||||||
| Class R6 | 88 | 348 | 510 | ||||||
| Advisor Class | 106,213 | 1,035,313 | 2,427,738 | ||||||
| Custodian fees (Note 4) | 12,469 | 41,294 | 600,974 | ||||||
| Reports to shareholders | 90,509 | 390,033 | 2,749,699 | ||||||
| Registration and filing fees | 62,915 | 103,956 | 1,144,962 | ||||||
| Professional fees | 26,005 | 53,012 | 318,961 | ||||||
| Trustees fees and expenses | 3,116 | 15,874 | 162,124 | ||||||
| Other | 14,448 | 58,634 | 560,266 | ||||||
| Total expenses | 8,817,084 | 40,892,935 | 319,122,054 | ||||||
| Expense reductions (Note 4) | (29 | ) | (66 | ) | (4,002 | ) | |||
| Expenses waived/paid by affiliates (Note 3f) | (18,244 | ) | (192,672 | ) | (210,954 | ) | |||
| Net expenses | 8,798,811 | 40,700,197 | 318,907,098 | ||||||
| Net investment income (loss) | (4,628,107 | ) | 19,539,989 | 1,843,272,589 | |||||
116 | The accompanying notes are an integral part of these financial statements. | Semiannual Report
| Franklin Custodian Funds | |||||||||
| Financial Statements (continued) | |||||||||
| Statements of Operations (continued) | |||||||||
| for the six months ended March 31, 2014 (unaudited) | |||||||||
| Franklin | Franklin | Franklin | |||||||
| DynaTech Fund | Growth Fund | Income Fund | |||||||
| Realized and unrealized gains (losses): | |||||||||
| Net realized gain (loss) from: | |||||||||
| Investments: | |||||||||
| Unaffiliated issuers | $ | 51,075,591 | $ | (17,497,955 | ) | $ | 1,782,398,238 | ||
| Non-controlled affiliated issuers (Note 10) | -- | -- | (77,189,548 | ) | |||||
| Written options | -- | -- | 1,716,323 | ||||||
| Foreign currency transactions | 75,441 | (3,306 | ) | (1,937,493 | ) | ||||
| Net realized gain (loss) | 51,151,032 | (17,501,261 | ) | 1,704,987,520 | |||||
| Net change in unrealized appreciation (depreciation) on: | |||||||||
| Investments | 103,218,632 | 1,088,100,649 | 4,439,641,624 | ||||||
| Translation of other assets and liabilities denominated in foreign | |||||||||
| currencies | (554 | ) | -- | 577,417 | |||||
| Net change in unrealized appreciation (depreciation) | 103,218,078 | 1,088,100,649 | 4,440,219,041 | ||||||
| Net realized and unrealized gain (loss) | 154,369,110 | 1,070,599,388 | 6,145,206,561 | ||||||
| Net increase (decrease) in net assets resulting from operations | $ | 149,741,003 | $ | 1,090,139,377 | $ | 7,988,479,150 | |||
Semiannual Report | The accompanying notes are an integral part of these financial statements. | 117
| Franklin Custodian Funds | ||||||
| Financial Statements (continued) | ||||||
| Statements of Operations (continued) | ||||||
| for the six months ended March 31, 2014 (unaudited) | ||||||
| Franklin | ||||||
| U.S. Government | Franklin | |||||
| Securities Fund | Utilities Fund | |||||
| Investment income: | ||||||
| Dividends | $ | -- | $ | 93,217,048 | ||
| Interest | 157,210,927 | 2,600,309 | ||||
| Paydown loss | (26,962,744 | ) | -- | |||
| Income from securities loaned | -- | 323 | ||||
| Total investment income | 130,248,183 | 95,817,680 | ||||
| Expenses: | ||||||
| Management fees (Note 3a) | 16,875,614 | 11,433,717 | ||||
| Distribution fees: (Note 3c) | ||||||
| Class A | 3,441,625 | 2,510,075 | ||||
| Class C | 4,730,708 | 2,824,868 | ||||
| Class R | 212,504 | 216,237 | ||||
| Transfer agent fees: (Note 3e) | ||||||
| Class A | 3,292,062 | 1,982,380 | ||||
| Class C | 1,013,819 | 514,856 | ||||
| Class R | 59,216 | 51,228 | ||||
| Class R6 | 133 | 153 | ||||
| Advisor Class | 551,540 | 243,683 | ||||
| Custodian fees (Note 4) | 31,411 | 31,881 | ||||
| Reports to shareholders | 393,249 | 245,638 | ||||
| Registration and filing fees | 138,241 | 170,958 | ||||
| Professional fees | 56,319 | 45,441 | ||||
| Trustees fees and expenses | 22,411 | 10,130 | ||||
| Other | 157,615 | 38,606 | ||||
| Total expenses | 30,976,467 | 20,319,851 | ||||
| Expense reductions (Note 4) | (522 | ) | ||||
| Expenses waived/paid by affiliates (Note 3f) | (27,835 | ) | (22,270 | ) | ||
| Net expenses | 30,948,110 | 20,297,581 | ||||
| Net investment income | 99,300,073 | 75,520,099 | ||||
| Realized and unrealized gains (losses): | ||||||
| Net realized gain (loss) from: | ||||||
| Investments | (9,179,201 | ) | 102,408,045 | |||
| Foreign currency transactions | -- | (8,399 | ) | |||
| Net realized gain (loss) | (9,179,201 | ) | 102,399,646 | |||
| Net change in unrealized appreciation (depreciation) on: | ||||||
| Investments | (13,889,170 | ) | 403,840,575 | |||
| Translation of other assets and liabilities denominated in foreign currencies | -- | 10,572 | ||||
| Net change in unrealized appreciation (depreciation) | (13,889,170 | ) | 403,851,147 | |||
| Net realized and unrealized gain (loss) | (23,068,371 | ) | 506,250,793 | |||
| Net increase (decrease) in net assets resulting from operations | $ | 76,231,702 | $ | 581,770,892 | ||
118 | The accompanying notes are an integral part of these financial statements. | Semiannual Report
| Franklin Custodian Funds | ||||||||||||
| Financial Statements (continued) | ||||||||||||
| Statements of Changes in Net Assets | ||||||||||||
| Franklin DynaTech Fund | Franklin Growth Fund | |||||||||||
| Six Months Ended | Six Months Ended | |||||||||||
| March 31, 2014 | Year Ended | March 31, 2014 | Year Ended | |||||||||
| (unaudited) | September 30, 2013 | (unaudited) | September 30, 2013 | |||||||||
| Increase (decrease) in net assets: | ||||||||||||
| Operations: | ||||||||||||
| Net investment income (loss) | $ | (4,628,107 | ) | $ | (5,047,830 | ) | $ | 19,539,989 | $ | 36,230,429 | ||
| Net realized gain (loss) from investments and | ||||||||||||
| foreign currency transactions | 51,151,032 | 90,567,698 | (17,501,261 | ) | (30,028,806 | ) | ||||||
| Net change in unrealized appreciation | ||||||||||||
| (depreciation) on investments and translation | ||||||||||||
| of other assets and liabilities denominated in | ||||||||||||
| foreign currencies | 103,218,078 | 241,969,090 | 1,088,100,649 | 1,308,857,085 | ||||||||
| Net increase (decrease) in net assets | ||||||||||||
| resulting from operations | 149,741,003 | 327,488,958 | 1,090,139,377 | 1,315,058,708 | ||||||||
| Distributions to shareholders from: | ||||||||||||
| Net investment income: | ||||||||||||
| Class A | -- | -- | (27,683,055 | ) | (11,734,418 | ) | ||||||
| Class R | -- | -- | (887,842 | ) | (557,179 | ) | ||||||
| Class R6 | -- | -- | (8,353,795 | ) | ||||||||
| Advisor Class | -- | -- | (8,082,884 | ) | (6,710,810 | ) | ||||||
| Net realized gains: | ||||||||||||
| Class A | (47,796,503 | ) | -- | -- | -- | |||||||
| Class C | (8,696,763 | ) | -- | -- | -- | |||||||
| Class R | (1,742,295 | ) | -- | -- | -- | |||||||
| Class R6 | (13,471,107 | ) | -- | -- | -- | |||||||
| Advisor Class | (5,233,437 | ) | -- | -- | -- | |||||||
| Total distributions to shareholders | (76,940,105 | ) | -- | (45,007,576 | ) | (19,002,407 | ) | |||||
| Capital share transactions: (Note 2) | ||||||||||||
| Class A | 293,494,028 | (33,153,460 | ) | 291,910,870 | 362,579,689 | |||||||
| Class B | (1,458,659 | ) | (5,066,975 | ) | ||||||||
| Class C | 24,521,017 | 1,112,173 | 8,936,769 | (2,375,722 | ) | |||||||
| Class R | 216,835 | 506,847 | (51,703,021 | ) | (1,449,595 | ) | ||||||
| Class R6 | 5,742,273 | 271,926,068 | 55,178,255 | 794,804,450 | ||||||||
| Advisor Class | 27,448,756 | (172,026,848 | ) | 88,769,595 | (561,844,719 | ) | ||||||
| Total capital share transactions | 351,422,909 | 66,906,121 | 393,092,468 | 586,647,128 | ||||||||
| Net increase (decrease) in net assets | 424,223,807 | 394,395,079 | 1,438,224,269 | 1,882,703,429 | ||||||||
| Net assets: | ||||||||||||
| Beginning of period | 1,730,797,178 | 1,336,402,099 | 8,355,998,285 | 6,473,294,856 | ||||||||
| End of period | $ | 2,155,020,985 | $ | 1,730,797,178 | $ | 9,794,222,554 | $ | 8,355,998,285 | ||||
| Undistributed net investment income (loss) | ||||||||||||
| included in net assets: | ||||||||||||
| End of period | $ | (8,662,825 | ) | $ | (4,034,718 | ) | $ | 4,475,533 | $ | 29,943,120 | ||
Semiannual Report | The accompanying notes are an integral part of these financial statements. | 119
| Franklin Custodian Funds | ||||||||||||
| Financial Statements (continued) | ||||||||||||
| Statements of Changes in Net Assets (continued) | ||||||||||||
| Franklin | ||||||||||||
| Franklin Income Fund | U.S. Government Securities Fund | |||||||||||
| Six Months Ended | Six Months Ended | |||||||||||
| March 31, 2014 | Year Ended | March 31, 2014 | Year Ended | |||||||||
| (unaudited) | September 30, 2013 | (unaudited) | September 30, 2013 | |||||||||
| Increase (decrease) in net assets: | ||||||||||||
| Operations: | ||||||||||||
| Net investment income | $ | 1,843,272,589 | $ | 3,621,491,585 | $ | 99,300,073 | $ | 212,843,224 | ||||
| Net realized gain (loss) from | ||||||||||||
| investments, written options and | ||||||||||||
| foreign currency transactions | 1,704,987,520 | 738,643,556 | (9,179,201 | ) | 3,975,468 | |||||||
| Net change in unrealized appreciation | ||||||||||||
| (depreciation) on investments and | ||||||||||||
| translation of other assets and liabilities | ||||||||||||
| denominated in foreign currencies | 4,440,219,041 | 2,916,825,699 | (13,889,170 | ) | (451,958,268 | ) | ||||||
| Net increase (decrease) in net | ||||||||||||
| assets resulting from | ||||||||||||
| operations | 7,988,479,150 | 7,276,960,840 | 76,231,702 | (235,139,576 | ) | |||||||
| Distributions to shareholders from: | ||||||||||||
| Net investment income: | ||||||||||||
| Class A | (1,307,886,265 | ) | (2,581,779,889 | ) | (84,977,399 | ) | (217,743,401 | ) | ||||
| Class B | -- | (3,299,297 | ) | -- | (57,447 | ) | ||||||
| Class B1 | -- | (45,851 | ) | -- | -- | |||||||
| Class C | (584,605,476 | ) | (1,146,093,750 | ) | (22,532,247 | ) | (72,223,410 | ) | ||||
| Class R | (11,356,249 | ) | (24,003,134 | ) | (1,383,061 | ) | (3,733,005 | ) | ||||
| Class R6 | (54,424,961 | ) | (36,053,887 | ) | (9,639,507 | ) | (8,646,493 | ) | ||||
| Advisor Class | (172,135,081 | ) | (383,247,978 | ) | (14,599,092 | ) | (50,301,976 | ) | ||||
| Total distributions to shareholders | (2,130,408,032 | ) | (4,174,523,786 | ) | (133,131,306 | ) | (352,705,732 | ) | ||||
| Capital share transactions: (Note 2) | ||||||||||||
| Class A | 1,465,602,538 | 5,168,627,116 | (598,017,939 | ) | (1,372,889,422 | ) | ||||||
| Class B | -- | (231,175,994 | ) | -- | (10,085,431 | ) | ||||||
| Class B1 | -- | (2,709,559 | ) | -- | - | |||||||
| Class C | 1,571,074,191 | 2,870,279,161 | (307,389,499 | ) | (1,200,126,017 | ) | ||||||
| Class R | 21,153,314 | 2,058,283 | (15,252,724 | ) | (40,235,627 | ) | ||||||
| Class R6 | 60,085,874 | 1,935,471,675 | 26,286,193 | 499,369,403 | ||||||||
| Advisor Class | 815,923,297 | (840,701,139 | ) | (239,488,452 | ) | (566,223,853 | ) | |||||
| Total capital share transactions | 3,933,839,214 | 8,901,849,543 | (1,133,862,421 | ) | (2,690,190,947 | ) | ||||||
| Net increase (decrease) in net | ||||||||||||
| assets | 9,791,910,332 | 12,004,286,597 | (1,190,762,025 | ) | (3,278,036,255 | ) | ||||||
| Net assets: | ||||||||||||
| Beginning of period | 80,608,656,020 | 68,604,369,423 | 8,303,186,523 | 11,581,222,778 | ||||||||
| End of period | $ | 90,400,566,352 | $ | 80,608,656,020 | $ | 7,112,424,498 | $ | 8,303,186,523 | ||||
| Distributions in excess of net investment | ||||||||||||
| income included in net assets: | ||||||||||||
| End of period | $ | (369,349,992 | ) | $ | (82,214,549 | ) | $ | (34,237,087 | ) | $ | (405,854 | ) |
120 | The accompanying notes are an integral part of these financial statements. | Semiannual Report
| Franklin Custodian Funds | ||||||
| Financial Statements (continued) | ||||||
| Statements of Changes in Net Assets (continued) | ||||||
| Franklin Utilities Fund | ||||||
| Six Months Ended | ||||||
| March 31, 2014 | Year Ended | |||||
| (unaudited) | September 30, 2013 | |||||
| Increase (decrease) in net assets: | ||||||
| Operations: | ||||||
| Net investment income | $ | 75,520,099 | $ | 154,477,618 | ||
| Net realized gain (loss) from investments and foreign currency transactions | 102,399,646 | 27,935,185 | ||||
| Net change in unrealized appreciation (depreciation) on investments and translation of | ||||||
| other assets and liabilities denominated in foreign currencies | 403,851,147 | 159,562,892 | ||||
| Net increase (decrease) in net assets resulting from operations | 581,770,892 | 341,975,695 | ||||
| Distributions to shareholders from: | ||||||
| Net investment income: | ||||||
| Class A | (57,200,537 | ) | (112,514,473 | ) | ||
| Class B | -- | (46,771 | ) | |||
| Class C | (12,795,684 | ) | (24,633,189 | ) | ||
| Class R | (1,336,802 | ) | (2,651,385 | ) | ||
| Class R6 | (4,191,495 | ) | (3,625,610 | ) | ||
| Advisor Class | (7,417,478 | ) | (17,207,024 | ) | ||
| Net realized gains: | ||||||
| Class A | (8,070,905 | ) | -- | |||
| Class C | (2,099,362 | ) | -- | |||
| Class R | (208,818 | ) | -- | |||
| Class R6 | (542,905 | ) | -- | |||
| Advisor Class | (948,180 | ) | -- | |||
| Total distributions to shareholders | (94,812,166 | ) | (160,678,452 | ) | ||
| Capital share transactions: (Note 2) | ||||||
| Class A | (45,167,639 | ) | 73,721,098 | |||
| Class B | -- | (7,142,943 | ) | |||
| Class C | (2,907,663 | ) | 38,952,527 | |||
| Class R | (1,413,226 | ) | 2,935,479 | |||
| Class R6 | 2,552,947 | 235,836,017 | ||||
| Advisor Class | 94,860,774 | (270,560,838 | ) | |||
| Total capital share transactions | 47,925,193 | 73,741,340 | ||||
| Net increase (decrease) in net assets | 534,883,919 | 255,038,583 | ||||
| Net assets: | ||||||
| Beginning of period | 4,768,347,071 | 4,513,308,488 | ||||
| End of period | $ | 5,303,230,990 | $ | 4,768,347,071 | ||
| Undistributed net investment income (distributions in excess of net investment income) | ||||||
| included in net assets: | ||||||
| End of period | $ | (732,086 | ) | $ | 6,689,811 | |
Semiannual Report | The accompanying notes are an integral part of these financial statements. | 121
Franklin Custodian Funds
Notes to Financial Statements (unaudited)
1. ORGANIZATION AND SIGNIFICANT ACCOUNTING POLICIES
Franklin Custodian Funds (Trust) is registered under the Investment Company Act of 1940, as amended, (1940 Act) as an open-end management investment company, consisting of five funds (Funds). The Funds offer five classes of shares: Class A, Class C, Class R, Class R6 and Advisor Class. Each class of shares differs by its initial sales load, contingent deferred sales charges, voting rights on matters affecting a single class, its exchange privilege and fees primarily due to differing arrangements for distribution and transfer agent fees.
The following summarizes the Funds significant accounting policies.
a. Financial Instrument Valuation
The Funds investments in financial instruments are carried at fair value daily. Fair value is the price that would be received to sell an asset or paid to transfer a liability in an orderly transaction between market participants on the measurement date. The Funds calculate the net asset value per share at the close of the New York Stock Exchange (NYSE), generally at 4p.m. Eastern time (NYSE close) on each day the NYSE is open for trading. Under procedures approved by the Trust s Board of Trustees (the Board), the Funds administrator, investment manager and other affiliates have formed the Valuation and Liquidity Oversight Committee (VLOC). The VLOC provides administration and oversight of the Funds valuation policies and procedures, which are approved annually by the Board. Among other things, these procedures allow the Funds to utilize independent pricing services, quotations from securities and financial instrument dealers, and other market sources to determine fair value.
Equity securities and derivative financial instruments (derivatives) listed on an exchange or on the NASDAQ National Market System are valued at the last quoted sale price or the official closing price of the day, respectively. Foreign equity securities are valued as of the close of trading on the foreign stock exchange on which the security is primarily traded or as of the NYSE close, whichever is earlier. The value is then converted into its U.S. dollar equivalent at the foreign exchange rate in effect at the NYSE close on the day that the value of the security is determined. Over-the-counter (OTC) securities are valued within the range of the most recent quoted bid and ask prices. Securities that trade in multiple markets or on multiple exchanges are valued according to the broadest and most representative market. Certain equity securities are valued based upon fundamental characteristics or relationships to similar securities. Investments in open-end mutual funds and non-registered money market funds are valued at the closing net asset value.
Debt securities generally trade in the OTC market rather than on a securities exchange. The Funds pricing services use multiple valuation techniques to determine fair value. In instances where sufficient market activity exists, the pricing services may utilize a market-based approach through which quotes from market makers are used to determine fair value. In instances where
122 | Semiannual Report
Franklin Custodian Funds
Notes to Financial Statements (unaudited) (continued)
| 1. | ORGANIZATION AND SIGNIFICANT ACCOUNTING POLICIES (continued) |
| a. | Financial Instrument Valuation (continued) |
sufficient market activity may not exist or is limited, the pricing services also utilize proprietary valuation models which may consider market characteristics such as benchmark yield curves, credit spreads, estimated default rates, anticipated market interest rate volatility, coupon rates, anticipated timing of principal repayments, underlying collateral, and other unique security features in order to estimate the relevant cash flows, which are then discounted to calculate the fair value. Securities denominated in a foreign currency are converted into their U.S. dollar equivalent at the foreign exchange rate in effect at the NYSE close on the date that the values of the foreign debt securities are determined. Repurchase agreements are valued at cost, which approximates market value.
The Funds have procedures to determine the fair value of financial instruments for which market prices are not reliable or readily available. Under these procedures, the VLOC convenes on a regular basis to review such financial instruments and considers a number of factors, including significant unobservable valuation inputs, when arriving at fair value. The VLOC primarily employs a market-based approach which may use related or comparable assets or liabilities, recent transactions, market multiples, book values, and other relevant information for the investment to determine the fair value of the investment. An income-based valuation approach may also be used in which the anticipated future cash flows of the investment are discounted to calculate fair value. Discounts may also be applied due to the nature or duration of any restrictions on the disposition of the investments. Due to the inherent uncertainty of valuations of such investments, the fair values may differ significantly from the values that would have been used had an active market existed. The VLOC employs various methods for calibrating these valuation approaches including a regular review of key inputs and assumptions, transactional back-testing or disposition analysis, and reviews of any related market activity.
Trading in securities on foreign securities stock exchanges and OTC markets may be completed before the daily NYSE close. In addition, trading in certain foreign markets may not take place on every NYSE business day. Occasionally, events occur between the time at which trading in a foreign security is completed and the close of the NYSE that might call into question the reliability of the value of a portfolio security held by the fund. As a result, differences may arise between the value of the Funds portfolio securities as determined at the foreign market close and the latest indications of value at the close of the NYSE. In order to minimize the potential for these differences, the VLOC monitors price movements following the close of trading in foreign stock markets through a series of country specific market proxies (such as baskets of American Depositary Receipts, futures contracts and exchange traded funds). These price movements are measured against established trigger thresholds for each specific market proxy to assist in determining if an event has occurred that may call into question the reliability of the values of the foreign securities held by the Funds. If such an event occurs, the securities may be valued using fair value procedures, which may include the use of independent pricing services.
Semiannual Report | 123
Franklin Custodian Funds
Notes to Financial Statements (unaudited) (continued)
| 1. | ORGANIZATION AND SIGNIFICANT ACCOUNTING POLICIES (continued) |
| a. | Financial Instrument Valuation (continued) |
Also, when the last day of the reporting period is a non-business day, certain foreign markets may be open on those days that the NYSE is closed, which could result in differences between the value of the Funds portfolio securities on the last business day and the last calendar day of the reporting period. Any significant security valuation changes due to an open foreign market are adjusted and reflected by the Funds for financial reporting purposes.
b. Foreign Currency Translation
Portfolio securities and other assets and liabilities denominated in foreign currencies are translated into U.S. dollars based on the exchange rate of such currencies against U.S. dollars on the date of valuation. The Funds may enter into foreign currency exchange contracts to facilitate transactions denominated in a foreign currency. Purchases and sales of securities, income and expense items denominated in foreign currencies are translated into U.S. dollars at the exchange rate in effect on the transaction date. Portfolio securities and assets and liabilities denominated in foreign currencies contain risks that those currencies will decline in value relative to the U.S. dollar. Occasionally, events may impact the availability or reliability of foreign exchange rates used to convert the U.S. dollar equivalent value. If such an event occurs, the foreign exchange rate will be valued at fair value using procedures established and approved by the Board.
The Funds do not separately report the effect of changes in foreign exchange rates from changes in market prices on securities held. Such changes are included in net realized and unrealized gain or loss from investments on the Statements of Operations.
Realized foreign exchange gains or losses arise from sales of foreign currencies, currency gains or losses realized between the trade and settlement dates on securities transactions and the difference between the recorded amounts of dividends, interest, and foreign withholding taxes and the U.S. dollar equivalent of the amounts actually received or paid. Net unrealized foreign exchange gains and losses arise from changes in foreign exchange rates on foreign denominated assets and liabilities other than investments in securities held at the end of the reporting period.
c. Joint Repurchase Agreement
The Franklin Growth Fund enters into a joint repurchase agreement whereby its uninvested cash balance is deposited into a joint cash account with other funds managed by the investment manager or an affiliate of the investment manager and is used to invest in one or more repurchase agreements. The value and face amount of the joint repurchase agreement are allocated to the funds based on their pro-rata interest. A repurchase agreement is accounted for as a loan by the fund to the seller, collateralized by securities which are delivered to the fund s custodian. The market value, including accrued interest, of the initial collateralization is required to be at least 102% of the dollar amount invested by the funds, with the value of the underlying securities marked to market daily to maintain coverage of at least 100%. Repurchase agreements are subject to the terms of Master Repurchase Agreements (MRAs) with approved counterparties
124 | Semiannual Report
Franklin Custodian Funds
Notes to Financial Statements (unaudited) (continued)
| 1. | ORGANIZATION AND SIGNIFICANT ACCOUNTING POLICIES (continued) |
| c. | Joint Repurchase Agreement (continued) |
(sellers). The MRAs contain various provisions, including but not limited to events of default and maintenance of collateral for repurchase agreements. In the event of default by either the seller or the funds, certain MRAs may permit the non-defaulting party to net and close-out all transactions, if any, traded under such agreements. The fund may sell securities it holds as collateral and apply the proceeds towards the repurchase price and any other amounts owed by the seller to the fund in the event of default by the seller. This could involve costs or delays in addition to a loss on the securities if their value falls below the repurchase price owed by the seller. The joint repurchase agreement held by the fund at period end, as indicated in the Statement of Investments, had been entered into on March 31, 2014.
d. Securities Purchased on a When-Issued, Delayed Delivery and TBA Basis
Certain funds purchase securities on a when-issued, delayed delivery and to-be-announced (TBA) basis, with payment and delivery scheduled for a future date. These transactions are subject to market fluctuations and are subject to the risk that the value at delivery may be more or less than the trade date purchase price. Although the funds will generally purchase these securities with the intention of holding the securities, they may sell the securities before the settlement date. Sufficient assets have been segregated for these securities and collateral has been pledged and/or received for open TBA trades.
e. Derivative Financial Instruments
The Franklin Income Fund invested in derivatives in order to manage risk or gain exposure to various other investments or markets. Derivatives are financial contracts based on an underlying or notional amount, require no initial investment or an initial net investment that is smaller than would normally be required to have a similar response to changes in market factors, and require or permit net settlement. Derivatives contain various risks including the potential inability of the counterparty to fulfill their obligations under the terms of the contract, the potential for an illiquid secondary market, and/or the potential for market movements which expose the fund to gains or losses in excess of the amounts shown on the Statements of Assets and Liabilities. Realized gain and loss and unrealized appreciation and depreciation on these contracts for the period are included in the Statements of Operations.
Collateral requirements differ by type of derivative. Collateral or initial margin requirements are set by the broker or exchange clearing house for exchange traded and centrally cleared derivatives. Initial margin deposited is held at the exchange and can be in the form of cash and/or securities.
The Franklin Income Fund purchased or wrote exchange traded option contracts primarily to manage exposure to equity price risk. An option is a contract entitling the holder to purchase or sell a specific amount of shares or units of an asset or notional amount of a swap (swaption), at a specified price. Options purchased are recorded as an asset while options written are recorded as a liability. Upon exercise of an option, the acquisition cost or sales proceeds of the underlying
Semiannual Report | 125
Franklin Custodian Funds
Notes to Financial Statements (unaudited) (continued)
| 1. | ORGANIZATION AND SIGNIFICANT ACCOUNTING POLICIES (continued) |
| e. | Derivative Financial Instruments (continued) |
investment is adjusted by any premium received or paid. Upon expiration of an option, any premium received or paid is recorded as a realized gain or loss. Upon closing an option other than through expiration or exercise, the difference between the premium and the cost to close the position is recorded as a realized gain or loss.
See Notes 6 and 9 regarding investment transactions and other derivative information, respectively.
f. Restricted Cash
At March 31, 2014, the Franklin U.S. Government Securities Fund received restricted cash in connection with investments in certain derivative securities. Restricted cash is held in a segregated account with the fund s custodian and is reflected in the Statements of Assets and Liabilities.
g. Equity-Linked Securities
The Franklin Income Fund invests in equity-linked securities. Equity-linked securities are hybrid financial instruments that generally combine both debt and equity characteristics into a single note form. Income received from equity-linked securities is recorded as realized gains in the Statements of Operations and may be based on the performance of an underlying equity security, an equity index, or an option position. The risks of investing in equity-linked securities include unfavorable price movements in the underlying security and the credit risk of the issuing financial institution. There may be no guarantee of a return of principal with equity-linked securities and the appreciation potential may be limited. Equity-linked securities may be more volatile and less liquid than other investments held by the fund.
h. Securities Lending
Certain funds participate in an agency based securities lending program. The fund receives cash collateral against the loaned securities in an amount equal to at least 102% of the market value of the loaned securities. Collateral is maintained over the life of the loan in an amount not less than 100% of the market value of loaned securities, as determined at the close of fund business each day; any additional collateral required due to changes in security values is delivered to the fund on the next business day. The collateral is invested in a non-registered money fund as indicated on the Statement of Investments. The fund receives income from the investment of cash collateral, in addition to lending fees and rebates paid by the borrower. The fund bears the market risk with respect to the collateral investment, securities loaned, and the risk that the agent may default on its obligations to the fund. The securities lending agent has agreed to indemnify the fund in the event of default by a third party borrower.
126 | Semiannual Report
Franklin Custodian Funds
Notes to Financial Statements (unaudited) (continued)
| 1. | ORGANIZATION AND SIGNIFICANT ACCOUNTING POLICIES (continued) |
| i. | Mortgage Dollar Rolls |
The Franklin U.S. Government Securities Fund enters into mortgage dollar rolls, typically on a TBA basis. Mortgage dollar rolls are agreements between the fund and a financial institution to simultaneously sell and repurchase mortgage-backed securities at a future date. Gains or losses are realized on the initial sale, and the difference between the repurchase price and the sale price is recorded as an unrealized gain or loss to the fund upon entering into the mortgage dollar roll. In addition, the fund may invest the cash proceeds that are received from the initial sale. During the period between the sale and repurchase, the fund is not entitled to principal and interest paid on the mortgage backed securities. The risks of mortgage dollar roll transactions include the potential inability of the counterparty to fulfill its obligations.
j. Senior Floating Rate Interests
The Franklin Income Fund invests in senior secured corporate loans that pay interest at rates which are periodically reset by reference to a base lending rate plus a spread. These base lending rates are generally the prime rate offered by a designated U.S. bank or the London InterBank Offered Rate (LIBOR). Senior secured corporate loans often require prepayment of principal from excess cash flows or at the discretion of the borrower. As a result, actual maturity may be substantially less than the stated maturity.
Senior secured corporate loans in which the fund invests are generally readily marketable, but may be subject to certain restrictions on resale.
k. Income and Deferred Taxes
It is each fund s policy to qualify as a regulated investment company under the Internal Revenue Code. Each fund intends to distribute to shareholders substantially all of its taxable income and net realized gains to relieve it from federal income and excise taxes. As a result, no provision for U.S. federal income taxes is required.
The Funds may be subject to foreign taxation related to income received, capital gains on the sale of securities and certain foreign currency transactions in the foreign jurisdictions in which it invests. Foreign taxes, if any, are recorded based on the tax regulations and rates that exist in the foreign markets in which the Funds invest. When a capital gain tax is determined to apply the Funds record an estimated deferred tax liability in an amount that would be payable if the securities were disposed of on the valuation date.
Each fund recognizes the tax benefits of uncertain tax positions only when the position is more likely than not to be sustained upon examination by the tax authorities based on the technical merits of the tax position. As of March 31, 2014, and for all open tax years, each fund has determined that no liability for unrecognized tax benefits is required in each fund s financial statements related to uncertain tax positions taken on a tax return (or expected to be taken on future tax returns). Open tax years are those that remain subject to examination and are based on each tax jurisdiction statute of limitation.
Semiannual Report | 127
Franklin Custodian Funds
Notes to Financial Statements (unaudited) (continued)
| 1. | ORGANIZATION AND SIGNIFICANT ACCOUNTING POLICIES (continued) |
| l. | Security Transactions, Investment Income, Expenses and Distributions |
Security transactions are accounted for on trade date. Realized gains and losses on security transactions are determined on a specific identification basis. Interest income and estimated expenses are accrued daily. Amortization of premium and accretion of discount on debt securities are included in interest income. Paydown gains and losses are recorded separately on the Statements of Operations. Facility fees are recognized as income over the expected term of the loan. Dividend income is recorded on the ex-dividend date except that certain dividends from foreign securities are recognized as soon as the Funds are notified of the ex-dividend date. Distributions to shareholders are recorded on the ex-dividend date and are determined according to income tax regulations (tax basis). Distributable earnings determined on a tax basis may differ from earnings recorded in accordance with accounting principles generally accepted in the United States of America. These differences may be permanent or temporary. Permanent differences are reclassified among capital accounts to reflect their tax character. These reclassifications have no impact on net assets or the results of operations. Temporary differences are not reclassified, as they may reverse in subsequent periods.
Common expenses incurred by the Trust are allocated among the Funds based on the ratio of net assets of each fund to the combined net assets of the Trust. Fund specific expenses are charged directly to the fund that incurred the expense.
Realized and unrealized gains and losses and net investment income, not including class specific expenses, are allocated daily to each class of shares based upon the relative proportion of net assets of each class. Differences in per share distributions, by class, are generally due to differences in class specific expenses.
m. Accounting Estimates
The preparation of financial statements in accordance with accounting principles generally accepted in the United States of America requires management to make estimates and assumptions that affect the reported amounts of assets and liabilities at the date of the financial statements and the amounts of income and expenses during the reporting period. Actual results could differ from those estimates.
n. Guarantees and Indemnifications
Under the Trust s organizational documents, its officers and trustees are indemnified by the Trust against certain liabilities arising out of the performance of their duties to the Trust. Additionally, in the normal course of business, the Trust, on behalf of the Funds, enters into contracts with service providers that contain general indemnification clauses. The Trust s maximum exposure under these arrangements is unknown as this would involve future claims that may be made against the Trust that have not yet occurred. Currently, the Trust expects the risk of loss to be remote.
128 | Semiannual Report
Franklin Custodian Funds
Notes to Financial Statements (unaudited) (continued)
2. SHARES OF BENEFICIAL INTEREST
At March 31, 2014, there were an unlimited number of shares authorized (without par value).
Transactions in the Funds shares were as follows:
| Franklin DynaTech Fund | Franklin Growth Fund | |||||||||||
| Shares | Amount | Shares | Amount | |||||||||
| Class A Shares: | ||||||||||||
| Six Months ended March 31, 2014 | ||||||||||||
| Shares sold | 12,780,381 | $ | 575,109,722 | 14,003,101 | $ | 880,884,100 | ||||||
| Shares issued in reinvestment of | ||||||||||||
| distributions | 1,036,308 | 44,499,047 | 384,777 | 24,402,552 | ||||||||
| Shares redeemed | (7,234,780 | ) | (326,114,741 | ) | (9,565,037 | ) | (613,375,782 | ) | ||||
| Net increase (decrease) | 6,581,909 | $ | 293,494,028 | 4,822,841 | $ | 291,910,870 | ||||||
| Year ended September 30, 2013 | ||||||||||||
| Shares sold | 6,576,949 | $ | 238,431,019 | 22,371,828 | $ | 1,210,290,819 | ||||||
| Shares issued in reinvestment of | ||||||||||||
| distributions | -- | -- | 214,908 | 10,708,868 | ||||||||
| Shares redeemed | (7,538,010 | ) | (271,584,479 | ) | (15,920,869 | ) | (858,419,998 | ) | ||||
| Net increase (decrease) | (961,061 | ) | $ | (33,153,460 | ) | 6,665,867 | $ | 362,579,689 | ||||
| Class B Shares:a | ||||||||||||
| Year ended September 30, 2013 | ||||||||||||
| Shares sold | 412 | $ | 12,633 | 1,048 | $ | 50,973 | ||||||
| Shares redeemed | (48,454 | ) | (1,471,292 | ) | (105,705 | ) | (5,117,948 | ) | ||||
| Net increase (decrease) | (48,042 | ) | $ | (1,458,659 | ) | (104,657 | ) | $ | (5,066,975 | ) | ||
| Class C Shares: | ||||||||||||
| Six Months ended March 31, 2014 | ||||||||||||
| Shares sold | 862,678 | $ | 34,178,240 | 910,432 | $ | 54,678,161 | ||||||
| Shares issued in reinvestment of | ||||||||||||
| distributions | 212,392 | 8,070,892 | -- | -- | ||||||||
| Shares redeemed | (450,604 | ) | (17,728,115 | ) | (762,955 | ) | (45,741,392 | ) | ||||
| Net increase (decrease) | 624,466 | $ | 24,521,017 | 147,477 | $ | 8,936,769 | ||||||
| Year ended September 30, 2013 | ||||||||||||
| Shares sold | 995,690 | $ | 32,192,314 | 1,812,922 | $ | 92,585,282 | ||||||
| Shares redeemed | (973,159 | ) | (31,080,141 | ) | (1,887,761 | ) | (94,961,004 | ) | ||||
| Net increase (decrease) | 22,531 | $ | 1,112,173 | (74,839 | ) | $ | (2,375,722 | ) | ||||
| Class R Shares: | ||||||||||||
| Six Months ended March 31, 2014 | ||||||||||||
| Shares sold | 128,812 | $ | 5,662,829 | 757,301 | $ | 48,010,427 | ||||||
| Shares issued in reinvestment of | ||||||||||||
| distributions | 40,870 | 1,730,443 | 13,715 | 865,946 | ||||||||
| Shares redeemed | (164,179 | ) | (7,176,437 | ) | (1,572,341 | ) | (100,579,394 | ) | ||||
| Net increase (decrease) | 5,503 | $ | 216,835 | (801,325 | ) | $ | (51,703,021 | ) | ||||
| Year ended September 30, 2013 | ||||||||||||
| Shares sold | 358,720 | $ | 12,574,327 | 2,181,451 | $ | 116,200,527 | ||||||
| Shares issued in reinvestment of | ||||||||||||
| distributions | -- | -- | 10,963 | 543,551 | ||||||||
| Shares redeemed | (343,631 | ) | (12,067,480 | ) | (2,214,268 | ) | (118,193,673 | ) | ||||
| Net increase (decrease) | 15,089 | $ | 506,847 | (21,854 | ) | $ | (1,449,595 | ) | ||||
Semiannual Report | 129
| Franklin Custodian Funds | ||||||||||||
| Notes to Financial Statements (unaudited) (continued) | ||||||||||||
| 2. SHARES OF BENEFICIAL INTEREST (continued) | ||||||||||||
| Franklin DynaTech Fund | Franklin Growth Fund | |||||||||||
| Shares | Amount | Shares | Amount | |||||||||
| Class R6 Shares: | ||||||||||||
| Six Months ended March 31, 2014 | ||||||||||||
| Shares sold | 112,994 | $ | 5,135,675 | 1,337,811 | $ | 86,922,135 | ||||||
| Shares issued on reinvestment of | ||||||||||||
| distributions | 308,823 | 13,470,860 | 131,722 | 8,353,795 | ||||||||
| Shares redeemed | (273,529 | ) | (12,864,262 | ) | (615,207 | ) | (40,097,675 | ) | ||||
| Net increase (decrease) | 148,288 | $ | 5,742,273 | 854,326 | $ | 55,178,255 | ||||||
| Year ended September 30, 2013b | ||||||||||||
| Shares sold | 7,558,399 | $ | 277,192,794 | 15,563,644 | $ | 850,142,284 | ||||||
| Shares redeemed | (133,953 | ) | (5,266,726 | ) | (972,901 | ) | (55,337,834 | ) | ||||
| Net increase (decrease) | 7,424,446 | $ | 271,926,068 | 14,590,743 | $ | 794,804,450 | ||||||
| Advisor Class Shares: | ||||||||||||
| Six Months ended March 31, 2014 | ||||||||||||
| Shares sold | 880,267 | $ | 39,898,578 | 4,746,848 | $ | 302,771,805 | ||||||
| Shares issued in reinvestment of | ||||||||||||
| distributions | 113,735 | 4,955,439 | 117,373 | 7,454,331 | ||||||||
| Shares redeemed | (386,861 | ) | (17,405,261 | ) | (3,440,064 | ) | (221,456,541 | ) | ||||
| Net increase (decrease) | 607,141 | $ | 27,448,756 | 1,424,157 | $ | 88,769,595 | ||||||
| Year ended September 30, 2013 | ||||||||||||
| Shares sold | 3,706,126 | $ | 133,447,083 | 10,652,415 | $ | 549,715,154 | ||||||
| Shares issued in reinvestment of | ||||||||||||
| distributions | -- | -- | 127,618 | 6,364,288 | ||||||||
| Shares redeemed | (8,404,125 | ) | (305,473,931 | ) | (20,517,250 | ) | (1,117,924,161 | ) | ||||
| Net increase (decrease) | (4,697,999 | ) | $ | (172,026,848 | ) | (9,737,217 | ) | $ | (561,844,719 | ) | ||
| Franklin U.S. Government | ||||||||||||
| Franklin Income Fund | Securities Fund | |||||||||||
| Shares | Amount | Shares | Amount | |||||||||
| Class A Shares: | ||||||||||||
| Six Months ended March 31, 2014 | ||||||||||||
| Shares sold | 1,940,846,769 | $ | 4,666,609,079 | 30,541,419 | $ | 199,127,327 | ||||||
| Shares issued in reinvestment of | ||||||||||||
| distributions | 489,601,249 | 1,165,704,329 | 10,861,775 | 70,672,777 | ||||||||
| Shares redeemed | (1,815,362,272 | ) | (4,366,710,870 | ) | (133,122,204 | ) | (867,818,043 | ) | ||||
| Net increase (decrease) | 615,085,746 | $ | 1,465,602,538 | (91,719,010 | ) | $ | (598,017,939 | ) | ||||
| Year ended September 30, 2013 | ||||||||||||
| Shares sold | 4,354,381,598 | $ | 9,978,907,189 | 112,895,641 | $ | 760,106,465 | ||||||
| Shares issued in reinvestment of | ||||||||||||
| distributions | 992,227,951 | 2,260,869,608 | 26,744,178 | 178,796,132 | ||||||||
| Shares redeemed | (3,092,977,833 | ) | (7,071,149,681 | ) | (346,540,853 | ) | (2,311,792,019 | ) | ||||
| Net increase (decrease) | 2,253,631,716 | $ | 5,168,627,116 | (206,901,034 | ) | $ | (1,372,889,422 | ) | ||||
130 | Semiannual Report
| Franklin Custodian Funds | ||||||||||||
| Notes to Financial Statements (unaudited) (continued) | ||||||||||||
| 2. SHARES OF BENEFICIAL INTEREST (continued) | ||||||||||||
| Franklin U.S. Government | ||||||||||||
| Franklin Income Fund | Securities Fund | |||||||||||
| Shares | Amount | Shares | Amount | |||||||||
| Class B Shares:a | ||||||||||||
| Year ended September 30, 2013 | ||||||||||||
| Shares sold | 522,287 | $ | 1,162,670 | 21,355 | $ | 146,093 | ||||||
| Shares issued in reinvestment of | ||||||||||||
| distributions | 1,145,697 | 2,538,261 | 6,365 | 43,518 | ||||||||
| Shares redeemed | (105,172,170 | ) | (234,876,925 | ) | (1,510,613 | ) | (10,275,042 | ) | ||||
| Net increase (decrease) | (103,504,186 | ) | $ | (231,175,994 | ) | (1,482,893 | ) | $ | (10,085,431 | ) | ||
| Class B1 Shares:a | ||||||||||||
| Year ended September 30, 2013 | ||||||||||||
| Shares sold | 3,551 | $ | 7,945 | |||||||||
| Shares issued in reinvestment of | ||||||||||||
| distributions | 14,310 | 32,007 | ||||||||||
| Shares redeemed | (1,216,864 | ) | (2,749,511 | ) | ||||||||
| Net increase (decrease) | (1,199,003 | ) | $ | (2,709,559 | ) | |||||||
| Class C Shares: | ||||||||||||
| Six Months ended March 31, 2014 | ||||||||||||
| Shares sold | 1,187,538,594 | $ | 2,885,678,352 | 6,012,761 | $ | 38,940,046 | ||||||
| Shares issued in reinvestment of | ||||||||||||
| distributions | 204,597,203 | 492,628,137 | 3,057,346 | 19,765,616 | ||||||||
| Shares redeemed | (744,294,251 | ) | (1,807,232,298 | ) | (56,507,265 | ) | (366,095,161 | ) | ||||
| Net increase (decrease) | 647,841,546 | $ | 1,571,074,191 | (47,437,158 | ) | $ | (307,389,499 | ) | ||||
| Year ended September 30, 2013 | ||||||||||||
| Shares sold | 2,239,214,060 | $ | 5,189,545,214 | 42,121,213 | $ | 283,323,130 | ||||||
| Shares issued in reinvestment of | ||||||||||||
| distributions | 412,200,480 | 948,590,529 | 9,486,707 | 63,134,088 | ||||||||
| Shares redeemed | (1,414,653,251 | ) | (3,267,856,582 | ) | (233,443,498 | ) | (1,546,583,235 | ) | ||||
| Net increase (decrease) | 1,236,761,289 | $ | 2,870,279,161 | (181,835,578 | ) | $ | (1,200,126,017 | ) | ||||
| Class R Shares: | ||||||||||||
| Six Months ended March 31, 2014 | ||||||||||||
| Shares sold | 28,147,266 | $ | 66,675,149 | 1,307,130 | $ | 8,510,615 | ||||||
| Shares issued in reinvestment of | ||||||||||||
| distributions | 4,582,963 | 10,758,857 | 203,743 | 1,325,236 | ||||||||
| Shares redeemed | (23,814,167 | ) | (56,280,692 | ) | (3,856,330 | ) | (25,088,575 | ) | ||||
| Net increase (decrease) | 8,916,062 | $ | 21,153,314 | (2,345,457 | ) | $ | (15,252,724 | ) | ||||
| Year ended September 30, 2013 | ||||||||||||
| Shares sold | 52,111,312 | $ | 117,676,371 | 4,467,517 | $ | 29,986,017 | ||||||
| Shares issued in reinvestment of | ||||||||||||
| distributions | 10,136,058 | 22,738,383 | 539,404 | 3,604,935 | ||||||||
| Shares redeemed | (61,456,372 | ) | (138,356,471 | ) | (11,047,893 | ) | (73,826,579 | ) | ||||
| Net increase (decrease) | 790,998 | $ | 2,058,283 | (6,040,972 | ) | $ | (40,235,627 | ) | ||||
Semiannual Report | 131
| Franklin Custodian Funds | |||||||||||
| Notes to Financial Statements (unaudited) (continued) | |||||||||||
| 2. SHARES OF BENEFICIAL INTEREST (continued) | |||||||||||
| Franklin U.S. Government | |||||||||||
| Franklin Income Fund | Securities Fund | ||||||||||
| Shares | Amount | Shares | Amount | ||||||||
| Class R6 Shares: | |||||||||||
| Six Months ended March 31, 2014 | |||||||||||
| Shares sold | 31,734,254 | $ | 75,869,880 | 4,405,373 | $ | 28,681,528 | |||||
| Shares issued on reinvestment of | |||||||||||
| distributions | 23,021,110 | 54,424,961 | 1,477,368 | 9,639,507 | |||||||
| Shares redeemed | (29,177,104 | ) | (70,208,967 | ) | (1,841,953 | ) | (12,034,842 | ) | |||
| Net increase (decrease) | 25,578,260 | $ | 60,085,874 | 4,040,788 | $ | 26,286,193 | |||||
| Year ended September 30, 2013b | |||||||||||
| Shares sold | 815,412,903 | $ | 1,899,422,821 | 90,670,716 | $ | 611,873,567 | |||||
| Shares issued in reinvestment of | |||||||||||
| distributions | 15,746,891 | 36,053,817 | 1,320,809 | 8,646,447 | |||||||
| Shares redeemed | (2,158 | ) | (4,963 | ) | (18,635,945 | ) | (121,150,611 | ) | |||
| Net increase (decrease) | 831,157,636 | $ | 1,935,471,675 | 73,355,580 | $ | 499,369,403 | |||||
| Advisor Class Shares: | |||||||||||
| Six Months ended March 31, 2014 | |||||||||||
| Shares sold | 571,215,918 | $ | 1,364,633,175 | 12,056,242 | $ | 78,769,922 | |||||
| Shares issued in reinvestment of | |||||||||||
| distributions | 61,027,216 | 144,328,787 | 1,967,349 | 12,838,810 | |||||||
| Shares redeemed | (290,555,618 | ) | (693,038,665 | ) | (50,688,474 | ) | (331,097,184 | ) | |||
| Net increase (decrease) | 341,687,516 | $ | 815,923,297 | (36,664,883 | ) | $ | (239,488,452 | ) | |||
| Year ended September 30, 2013 | |||||||||||
| Shares sold | 913,751,325 | $ | 2,083,044,126 | 59,088,551 | $ | 398,312,984 | |||||
| Shares issued in reinvestment of | |||||||||||
| distributions | 147,677,613 | 333,712,924 | 6,572,267 | 44,179,978 | |||||||
| Shares redeemed | (1,415,345,182 | ) | (3,257,458,189 | ) | (149,894,868 | ) | (1,008,716,815 | ) | |||
| Net increase (decrease) | (353,916,244 | ) | $ | (840,701,139 | ) | (84,234,050 | ) | $ | (566,223,853 | ) | |
| Franklin Utilities Fund | |||||||||||
| Shares | Amount | ||||||||||
| Class A Shares: | |||||||||||
| Six Months ended March 31, 2014 | |||||||||||
| Shares sold | 16,972,326 | $ | 258,327,258 | ||||||||
| Shares issued in reinvestment of distributions | 3,931,689 | 58,981,514 | |||||||||
| Shares redeemed | (24,003,374 | ) | (362,476,411 | ) | |||||||
| Net increase (decrease) | �� | (3,099,359 | ) | $ | (45,167,639 | ) | |||||
| Year ended September 30, 2013 | |||||||||||
| Shares sold | 48,622,807 | $ | 709,536,347 | ||||||||
| Shares issued in reinvestment of distributions | 7,063,755 | 100,091,748 | |||||||||
| Shares redeemed | (50,828,151 | ) | (735,906,997 | ) | |||||||
| Net increase (decrease) | 4,858,411 | $ | 73,721,098 | ||||||||
132 | Semiannual Report
| Franklin Custodian Funds | |||||
| Notes to Financial Statements (unaudited) (continued) | |||||
| 2. SHARES OF BENEFICIAL INTEREST (continued) | |||||
| Franklin Utilities Fund | |||||
| Shares | Amount | ||||
| Class B Shares:a | |||||
| Year ended September 30, 2013 | |||||
| Shares sold | 600 | $ | 8,432 | ||
| Shares issued in reinvestment of distributions | 2,747 | 37,416 | |||
| Shares redeemed | (514,258 | ) | (7,188,791 | ) | |
| Net increase (decrease) | (510,911 | ) | $ | (7,142,943 | ) |
| Class C Shares: | |||||
| Six Months ended March 31, 2014 | |||||
| Shares sold | 4,323,967 | $ | 65,410,187 | ||
| Shares issued in reinvestment of distributions | 802,766 | 11,984,445 | |||
| Shares redeemed | (5,337,247 | ) | (80,302,295 | ) | |
| Net increase (decrease) | (210,514 | ) | $ | (2,907,663 | ) |
| Year ended September 30, 2013 | |||||
| Shares sold | 13,688,790 | $ | 199,242,995 | ||
| Shares issued in reinvestment of distributions | 1,376,485 | 19,419,779 | |||
| Shares redeemed | (12,436,518 | ) | (179,710,247 | ) | |
| Net increase (decrease) | 2,628,757 | $ | 38,952,527 | ||
| Class R Shares: | |||||
| Six Months ended March 31, 2014 | |||||
| Shares sold | 946,135 | $ | 14,358,238 | ||
| Shares issued in reinvestment of distributions | 100,112 | 1,496,695 | |||
| Shares redeemed | (1,149,898 | ) | (17,268,159 | ) | |
| Net increase (decrease) | (103,651 | ) | $ | (1,413,226 | ) |
| Year ended September 30, 2013 | |||||
| Shares sold | 2,559,482 | $ | 37,361,769 | ||
| Shares issued in reinvestment of distributions | 181,816 | 2,566,649 | |||
| Shares redeemed | (2,576,752 | ) | (36,992,939 | ) | |
| Net increase (decrease) | 164,546 | $ | 2,935,479 | ||
| Class R6 Shares: | |||||
| Six Months ended March 31, 2014 | |||||
| Shares sold | 371,825 | $ | 5,577,188 | ||
| Shares issued on reinvestment of distributions | 313,613 | 4,734,400 | |||
| Shares redeemed | (493,678 | ) | (7,758,641 | ) | |
| Net increase (decrease) | 191,760 | $ | 2,552,947 | ||
| Year ended September 30, 2013b | |||||
| Shares sold | 14,907,633 | $ | 236,472,707 | ||
| Shares issued in reinvestment of distributions | 248,572 | 3,625,571 | |||
| Shares redeemed | (285,812 | ) | (4,262,261 | ) | |
| Net increase (decrease) | 14,870,393 | $ | 235,836,017 | ||
Semiannual Report | 133
| Franklin Custodian Funds | |||||
| Notes to Financial Statements (unaudited) (continued) | |||||
| 2. SHARES OF BENEFICIAL INTEREST (continued) | |||||
| Franklin Utilities Fund | |||||
| Shares | Amount | ||||
| Advisor Class Shares: | |||||
| Six Months ended March 31, 2014 | |||||
| Shares sold | 10,088,190 | $ | 152,928,273 | ||
| Shares issued in reinvestment of distributions | 493,937 | 7,471,279 | |||
| Shares redeemed | (4,328,524 | ) | (65,538,778 | ) | |
| Net increase (decrease) | 6,253,603 | $ | 94,860,774 | ||
| Year ended September 30, 2013 | |||||
| Shares sold | 12,293,683 | $ | 180,230,567 | ||
| Shares issued in reinvestment of distributions | 1,093,603 | 15,491,381 | |||
| Shares redeemed | (30,778,092 | ) | (466,282,786 | ) | |
| Net increase (decrease) | (17,390,806 | ) | $ | (270,560,838 | ) |
| aEffective March 21, 2013, all Class B shares were converted to Class A. | |||||
| bFor the period May 1, 2013 (effective date) to September 30, 2013. | |||||
3. TRANSACTIONS WITH AFFILIATES
Franklin Resources, Inc. is the holding company for various subsidiaries that together are referred to as Franklin Templeton Investments. Certain officers and trustees of the Trust are also officers and/or directors of the following subsidiaries:
| Subsidiary | Affiliation |
| Franklin Advisers, Inc. (Advisers) | Investment manager |
| Franklin Investment Advisory Services, LLC (Investment Advisory) | Investment manager |
| Templeton Investment Counsel, LLC (TIC) | Investment manager |
| Franklin Templeton Services, LLC (FT Services) | Administrative manager |
| Franklin Templeton Distributors, Inc. (Distributors) | Principal underwriter |
| Franklin Templeton Investor Services, LLC (Investor Services) | Transfer agent |
a. Management Fees
The Franklin Income Fund and Franklin Utilities Fund pay an investment management fee to Advisers based on the month-end net assets of each of the funds as follows:
| Annualized Fee Rate | Net Assets | |
| 0.625 | % | Up to and including $100 million |
| 0.500 | % | Over $100 million, up to and including $250 million |
| 0.450 | % | Over $250 million, up to and including $7.5 billion |
| 0.440 | % | Over $7.5 billion, up to and including $10 billion |
| 0.430 | % | Over $10 billion, up to and including $12.5 billion |
| 0.420 | % | Over $12.5 billion, up to and including $15 billion |
| 0.400 | % | Over $15 billion, up to and including $17.5 billion |
| 0.380 | % | Over $17.5 billion, up to and including $20 billion |
| 0.360 | % | Over $20 billion, up to and including $35 billion |
| 0.355 | % | Over $35 billion, up to and including $50 billion |
| 0.350 | % | Over $50 billion, up to and including $65 billion |
| 0.345 | % | Over $65 billion, up to and including $80 billion |
| 0.340 | % | In excess of $80 billion |
134 | Semiannual Report
Franklin Custodian Funds
Notes to Financial Statements (unaudited) (continued)
| 3. | TRANSACTIONS WITH AFFILIATES (continued) |
| a. | Management Fees (continued) |
The Franklin DynaTech Fund, the Franklin Growth Fund, and the Franklin U.S. Government Securities Fund pay an investment management fee to Advisers based on the month-end net assets of each of the funds as follows:
| Annualized Fee Rate | Net Assets | |
| 0.625 | % | Up to and including $100 million |
| 0.500 | % | Over $100 million, up to and including $250 million |
| 0.450 | % | Over $250 million, up to and including $7.5 billion |
| 0.440 | % | Over $7.5 billion, up to and including $10 billion |
| 0.430 | % | Over $10 billion, up to and including $12.5 billion |
| 0.420 | % | Over $12.5 billion, up to and including $15 billion |
| 0.400 | % | Over $15 billion, up to and including $17.5 billion |
| 0.380 | % | Over $17.5 billion, up to and including $20 billion |
| 0.360 | % | Over $20 billion, up to and including $35 billion |
| 0.355 | % | Over $35 billion, up to and including $50 billion |
| 0.350 | % | In excess of $50 billion |
Under a subadvisory agreement, Investment Advisory, an affiliate of Advisers, provides sub-advisory services to the Franklin Growth Fund. The subadvisory fee is paid by Advisers based on the average monthly net assets, and is not an additional expense of the fund. Effective April 14, 2014, the subadvisory agreement was terminated.
Under a subadvisory agreement, TIC, an affiliate of Advisers, provides subadvisory services to the Franklin Income Fund. The subadvisory fee is paid by Advisers based on the average monthly net assets, and is not an additional expense of the fund. Effective February 1, 2014, the subadvisory agreement was terminated.
b. Administrative Fees
Under an agreement with Advisers, FT Services provides administrative services to the Funds. The fee is paid by Advisers based on the Funds average daily net assets, and is not an additional expense of the Funds.
c. Distribution Fees
The Board has adopted distribution plans for each share class, with the exception of Class R6 and Advisor Class shares, pursuant to Rule 12b-1 under the 1940 Act. Distribution fees are not charged on shares held by affiliates. Under the Funds Class A reimbursement distribution plans, the Funds reimburse Distributors for costs incurred in connection with the servicing, sale and distribution of each fund s shares up to the maximum annual plan rate for each class. Under the Class A reimbursement distribution plans, costs exceeding the maximum for the current plan year cannot be reimbursed in subsequent periods. In addition, under the Funds Class C and R compensation distribution plans, the Funds pay Distributors for costs incurred in connection with the servicing, sale and distribution of each fund s shares up to the maximum annual plan
Semiannual Report | 135
Franklin Custodian Funds
Notes to Financial Statements (unaudited) (continued)
| 3. | TRANSACTIONS WITH AFFILIATES (continued) |
| c. | Distribution Fees (continued) |
rate for each class. The plan year, for purposes of monitoring compliance with the maximum annual plan rates, is February 1 through January 31 for each fund.
The maximum annual plan rates, based on the average daily net assets, for each class, are as follows:
| Franklin | ||||||||||
| Franklin | Franklin | Franklin | U.S. Government | Franklin | ||||||
| DynaTech | Growth | Income | Securities | Utilities | ||||||
| Fund | Fund | Fund | Fund | Fund | ||||||
| Reimbursement Plans: | ||||||||||
| Class A | 0.25 | % | 0.25 | % | 0.15 | % | 0.15 | % | 0.15 | % |
| Compensation Plans: | ||||||||||
| Class C | 1.00 | % | 1.00 | % | 0.65 | % | 0.65 | % | 0.65 | % |
| Class R | 0.50 | % | 0.50 | % | 0.50 | % | 0.50 | % | 0.50 | % |
d. Sales Charges/Underwriting Agreements
Front-end sales charges and contingent deferred sales charges (CDSC) do not represent expenses of the Funds. These charges are deducted from the proceeds of sales of fund shares prior to investment or from redemption proceeds prior to remittance, as applicable. Distributors has advised the Funds of the following commission transactions related to the sales and redemptions of the Funds shares for the period:
| Franklin | Franklin | Franklin | ||||
| DynaTech | Growth | Income | ||||
| Fund | Fund | Fund | ||||
| Sales charges retained net of commissions paid to unaffiliated | ||||||
| broker/dealers | $ | 335,510 | $ | 1,910,552 | $ | 13,586,970 |
| CDSC retained | $ | 7,894 | $ | 43,454 | $ | 1,233,495 |
| Franklin U.S. | ||||||
| Government | Franklin | |||||
| Securities | Utilities | |||||
| Fund | Fund | |||||
| Sales charges retained net of commissions paid to unaffiliated | ||||||
| broker/dealers | $ | 279,290 | $ | 465,388 | ||
| CDSC retained | $ | 179,747 | $ | 47,135 | ||
e. Transfer Agent Fees
Each class of shares, except for Class R6, pays transfer agent fees to Investor Services for its performance of shareholder servicing obligations and reimburses Investor Services for out of pocket expenses incurred, including shareholding servicing fees paid to third parties. These fees are allocated daily based upon their relative proportion of such classes aggregate net assets. The Class R6 pays Investor Services transfer agent fees specific to that class.
136 | Semiannual Report
Franklin Custodian Funds
Notes to Financial Statements (unaudited) (continued)
| 3. | TRANSACTIONS WITH AFFILIATES (continued) |
| e. | Transfer Agent Fees (continued) |
For the period ended March 31, 2014, the Funds paid transfer agent fees as noted in the Statements of Operations of which the following amounts were retained by Investor Services:
| Franklin | Franklin | Franklin | Franklin | Franklin | ||||||
| DynaTech | Growth | Income | U.S. Government | Utilities | ||||||
| Fund | Fund | Fund | Securities Fund | Fund | ||||||
| Transfer agent fees | $ | 639,001 | $ | 3,122,373 | $ | 11,482,480 | $ | 2,580,980 | $ | 1,208,418 |
| f. Investment in Institutional Fiduciary Trust Money Market Portfolio | ||||||||||
The Funds invest in the Institutional Fiduciary Trust Money Market Portfolio (Sweep Money Fund), an affiliated open-end investment company. Management fees paid by the Funds are waived on assets invested in the Sweep Money Fund, in an amount not to exceed the management and administrative fees paid directly or indirectly by the Sweep Money Fund.
g. Waiver and Expense Reimbursements
Investor Services has contractually agreed in advance to waive or limit its fees so that the Class R6 transfer agent fees for the Funds do not exceed 0.01% until January 31, 2015. There were no Class R6 transfer agent fees waived during the period ended March 31, 2014.
h. Other Affiliated Transactions
At March 31, 2014, one or more of the funds in the Franklin Templeton Fund Allocator Series owned a percentage of each fund s outstanding shares as follows:
| Franklin | |||||||||
| Franklin | Franklin | Franklin | U.S. Government | Franklin | |||||
| DynaTech Fund | Growth Fund | Income Fund | Securities Fund | Utilities Fund | |||||
| 15.32 | % | 9.63 | % | 2.28 | % | 6.70 | % | 4.51 | % |
4. EXPENSE OFFSET ARRANGEMENT
The Funds have entered into an arrangement with their custodian whereby credits realized as a result of uninvested cash balances are used to reduce a portion of the Funds custodian expenses. During the period ended March 31, 2014, the custodian fees were reduced as noted in the Statements of Operations.
5. INCOME TAXES
For tax purposes, capital losses may be carried over to offset future capital gains. Capital loss carryforwards with no expiration, if any, must be fully utilized before those losses with expiration dates.
Semiannual Report | 137
Franklin Custodian Funds
Notes to Financial Statements (unaudited) (continued)
5. INCOME TAXES (continued)
At September 30, 2013, capital loss carryforwards were as follows:
| Franklin | ||||||||
| DynaTech | Franklin | Franklin | ||||||
| Fund | Growth Fund | Income Fund | ||||||
| Capital loss carryforwards subject to expiration: | ||||||||
| 2016 | $ | -- | $ | 13,543,792 | $ | -- | ||
| 2017 | 14,592,268 | -- | 125,830,718 | |||||
| 2018 | -- | -- | 4,428,208,610 | |||||
| Capital loss carryforwards not subject to expiration: | ||||||||
| Short term | -- | 11,868,687 | -- | |||||
| Long term | -- | 32,283,585 | 1,291,588,852 | |||||
| Total capital loss carryforwards | $ | 14,592,268 | a | $ | 57,696,064 | b | $ | 5,845,628,180 |
| Franklin | ||
| U.S. Government | ||
| Securities Fund | ||
| Capital loss carryforwards subject to expiration: | ||
| 2014 | $ | 47,763,112 |
| 2015 | 28,034,940 | |
| 2016 | 20,514,778 | |
| 2017 | 18,668,917 | |
| 2018 | 16,923,309 | |
| 2019 | 4,445,156 | |
| Capital loss carryforwards not subject to expiration: | ||
| Short term | 91,986,205 | |
| Long term | 122,502,393 | |
| Total capital loss carryforwards | $ | 350,838,810 |
aIncludes $14,592,268 from the merged Franklin Global Communications Fund and Franklin Technology Fund, which may be carried over to
offset future capital gains, subject to certain limitations.
bIncludes $13,543,792 from the merged Franklin Capital Growth Fund, which may be carried over to offset future capital gains, subject to
certain limitations.
For tax purposes, the Funds may elect to defer any portion of a late-year ordinary loss to the first day of the following fiscal year. At September 30, 2013, the Franklin DynaTech Fund deferred late-year ordinary losses of $4,034,718.
At March 31, 2014, the cost of investments and net unrealized appreciation (depreciation) for income tax purposes were as follows:
| Franklin | Franklin | Franklin | |||||||
| DynaTech Fund | Growth Fund | Income Fund | |||||||
| Cost of investments | $ | 1,252,142,156 | $ | 4,561,696,628 | $ | 80,607,382,331 | |||
| Unrealized appreciation | $ | 901,808,651 | $ | 4,972,150,654 | $ | 12,975,274,888 | |||
| Unrealized depreciation | (8,976,623 | ) | (29,589,567 | ) | (3,517,918,283 | ) | |||
| Net unrealized appreciation (depreciation) | $ | 892,832,028 | $ | 4,942,561,087 | $ | 9,457,356,605 | |||
138 | Semiannual Report
Franklin Custodian Funds
Notes to Financial Statements (unaudited) (continued)
| 5. INCOME TAXES (continued) | ||||||
| Franklin | ||||||
| U.S. Government | ||||||
| Securities | Franklin | |||||
| Fund | Utilities Fund | |||||
| Cost of investments | $ | 7,184,547,706 | $ | 3,453,214,532 | ||
| Unrealized appreciation | $ | 283,782,760 | $ | 1,846,940,023 | ||
| Unrealized depreciation | (68,042,505 | ) | (3,811,882 | ) | ||
| Net unrealized appreciation (depreciation) | $ | 215,740,255 | $ | 1,843,128,141 | ||
Differences between income and/or capital gains as determined on a book basis and a tax basis are primarily due to differing treatments of defaulted securities, foreign currency transactions, paydown losses, payments-in-kind, bond discounts and premiums, corporate actions, regulatory settlements, equity-linked securities and wash sales.
6. INVESTMENT TRANSACTIONS
Purchases and sales of investments (excluding short term securities) for the period ended March 31, 2014, were as follows:
| Franklin | Franklin | Franklin | ||||
| DynaTech Fund | Growth Fund | Income Fund | ||||
| Purchases | $ | 374,042,663 | $ | 276,172,602 | $ | 18,995,855,968 |
| Sales | $ | 166,804,142 | $ | 55,137,830 | $ | 15,564,628,260 |
| Franklin | ||||||
| U.S. Government | ||||||
| Securities | Franklin | |||||
| Fund | Utilities Fund | |||||
| Purchases | $ | 2,993,581,462 | $ | 232,295,958 | ||
| Sales | $ | 4,304,669,005 | $ | 251,355,470 | ||
Transactions in options written during the period ended March 31, 2014, were as follows:
| Number of | Premiums | ||||
| Contracts | Received | ||||
| Franklin Income Fund | |||||
| Options outstanding at September 30, 2013 | -- | $ | -- | ||
| Options written | 66,933 | 6,194,279 | |||
| Options expired | (19,933 | ) | (1,716,323 | ) | |
| Options exercised | (30,000 | ) | (3,203,780 | ) | |
| Options closed | -- | -- | |||
| Options outstanding at March 31, 2014 | 17,000 | $ | 1,274,176 |
See Notes 1(e) and 9 regarding derivative financial instruments and other derivative information, respectively.
Semiannual Report | 139
Franklin Custodian Funds
Notes to Financial Statements (unaudited) (continued)
7. CREDIT RISK AND DEFAULTED SECURITIES
At March 31, 2014, the Franklin Income Fund had 34.42% of its portfolio invested in high yield, senior secured floating rate notes, or other securities rated below investment grade. These securities may be more sensitive to economic conditions causing greater price volatility and are potentially subject to a greater risk of loss due to default than higher rated securities.
The Franklin Income Fund held a defaulted security and/or other securities for which the income has been deemed uncollectible. At March 31, 2014, the value of this security represents less than 0.05% of the fund s net assets. The fund discontinues accruing income on securities for which income has been deemed uncollectible and provides an estimate for losses on interest receivable. The security has been identified on the accompanying Statement of Investments.
8. UNFUNDED LOAN COMMITMENTS
The Franklin Income Fund enters into certain credit agreements, all or a portion of which may be unfunded. The fund is obligated to fund these loan commitments at the borrowers discretion. Funded portions of credit agreements are presented on the Statement of Investments.
At March 31, 2014, unfunded commitments were as follows:
| Unfunded | ||
| Borrower | Commitment | |
| Franklin Income Fund | ||
| American Energy - Utica LLC, Second Lien Loans, 6.50%, | ||
| 9/30/18 | $ | 35,000,000 |
Unfunded loan commitments and funded portions of credit agreements are marked to market daily and any unrealized appreciation or depreciation is included in the Statements of Assets and Liabilities and the Statements of Operations.
9. OTHER DERIVATIVE INFORMATION
At March 31, 2014, the Franklin Income Fund s investments in derivative contracts are reflected on the Statements of Assets and Liabilities as follows:
| Asset Derivatives | Liability Derivatives | ||||
| Derivative Contracts | |||||
| Not Accounted for as | Statement of Assets and | Fair Value | Statement of Assets and | Fair Value | |
| Hedging Instruments | Liabilities Location | Amount | Liabilities Location | Amount | |
| Equity contracts | Investments, at value | $ -- | Options written, at value | $ | 1,155,000 |
140 | Semiannual Report
Franklin Custodian Funds
Notes to Financial Statements (unaudited) (continued)
9. OTHER DERIVATIVE INFORMATION (continued)
For the period ended March 31, 2014, the effect of derivative contracts on the Franklin Income Fund s Statements of Operations was as follows:
| Change in | |||||
| Unrealized | |||||
| Derivative Contracts | Realized Gain | Appreciation | |||
| Not Accounted for as | (Loss) for | (Depreciation) | |||
| Hedging Instruments | Statement of Operations Locations | the Period | for the Period | ||
| Franklin Income Fund | |||||
| Equity contracts | Net realized gain (loss) from written options | $ | 1,716,323 | $ | 119,176 |
For the period ended March 31, 2014, the average month end fair value of derivatives represented less than 0.01% of average month end net assets. The average month end number of open derivative contracts for the period was 1.
See Notes 1(e) and 6 regarding derivative financial instruments and investment transactions, respectively.
10. HOLDINGS OF 5% VOTING SECURITIES OF PORTFOLIO COMPANIES
The 1940 Act defines affiliated companies to include investments in portfolio companies in which a fund owns 5% or more of the outstanding voting securities. Investments in affiliated companies for the Franklin Income Fund for the period ended March 31, 2014, were as shown below.
| Number of | Number of | |||||||||
| Shares/ | Shares/ | |||||||||
| Warrants/ | Warrants/ | |||||||||
| Principal | Principal | |||||||||
| Amount* | Amount* | Realized | ||||||||
| Held at | Held at | Capital | ||||||||
| Beginning | Gross | Gross | End | Value at | Investment | Gain | ||||
| Name of Issuer | of Period | Additions | Reductions | of Period | End of Period | Income | (Loss) | |||
| Franklin Income Fund | ||||||||||
| Non-Controlled Affiliates | ||||||||||
| Agrium Inc. | 7,500,000 | -- | -- | 7,500,000 | $ | 731,400,000 | $ | 9,562,500 | $ | -- |
| Callon Petroleum Co. | 2,957,000 | -- | 2,302,643 | 654,357 | --a | -- | 10,415,918 | |||
| Callon Petroleum Co., senior | ||||||||||
| secured note, 13.00%, 9/15/16 | 55,135,500 | -- | 27,582,750 | 27,552,750 | --a | 2,557,882 | 109,981 | |||
| CEVA Group PLC, Dollar Tranche B | ||||||||||
| L/C, 5.247%, 8/31/16 | 13,684,211 | -- | 13,684,211 | -- | -- | 400,263 | 261,140 | |||
| CEVA Group PLC, first lien, 144A, | ||||||||||
| 7.00%, 3/01/21 | -- | 15,000,000 | -- | 15,000,000 | 15,318,750 | 32,083 | -- | |||
| CEVA Group PLC, Pre-Funded L/C, | ||||||||||
| 7.75%, 3/19/21 | -- | 20,320,197 | -- | 20,320,197 | 20,282,097 | -- | -- | |||
| CEVA Group PLC, secured note, | ||||||||||
| 144A, 9.00%, 9/01/21 | -- | 20,000,000 | -- | 20,000,000 | 20,475,000 | 55,000 | -- |
Semiannual Report | 141
Franklin Custodian Funds
Notes to Financial Statements (unaudited) (continued)
| 10. | HOLDINGS OF 5% VOTING SECURITIES OF PORTFOLIO COMPANIES (continued) |
| Number of | Number of | ||||||||||
| Shares/ | Shares/ | ||||||||||
| Warrants/ | Warrants/ | ||||||||||
| Principal | Principal | ||||||||||
| Amount* | Amount* | Realized | |||||||||
| Held at | Held at | Capital | |||||||||
| Beginning | Gross | Gross | End | Value at | Investment | Gain | |||||
| Name of Issuer | of Period | Additions | Reductions | of Period | End of Period | Income | (Loss) | ||||
| Franklin Income Fund (continued) | |||||||||||
| Non-Controlled Affiliates (continued) | |||||||||||
| CEVA Group PLC, senior note, first | |||||||||||
| lien, 144A, 4.00%, 5/01/18 | 261,778,982 | -- | 75,000,000 | 186,778,982 | $ | 173,704,453 | $ | 5,061,455 | $ | (5,758,487 | ) |
| CEVA Group PLC, U.S. Term Loan, | |||||||||||
| 7.75%, 3/19/21 | -- | 29,556,650 | -- | 29,556,650 | 29,501,231 | -- | -- | ||||
| CEVA Holdings LLC | 91,371 | -- | -- | 91,371 | 114,213,825 | -- | -- | ||||
| CEVA Holdings LLC, cvt. pfd., | |||||||||||
| A-1 | 2,897 | -- | -- | 2,897 | 4,838,408 | -- | -- | ||||
| CEVA Holdings LLC, cvt. pfd., | |||||||||||
| A-2 | 112,565 | -- | 2,000 | 110,565 | 138,206,350 | -- | (1,084,686 | ) | |||
| Dex Media Inc. | 2,048,551 | -- | -- | 2,048,551 | 18,846,669 | -- | -- | ||||
| Dex Media Inc., senior sub. note, | |||||||||||
| PIK, 12.00%, 1/29/17 | 38,640,842 | 1,352,429 | -- | 39,993,271 | 24,095,946 | 1,352,429 | -- | ||||
| Dex Media West LLC, Term Loan B, | |||||||||||
| 8.00%, 12/30/16 | 3,865,349 | -- | 2,278,726 | 1,586,623 | 1,286,156 | 59,565 | (31,533 | ) | |||
| Dynegy Holdings Inc., Escrow | |||||||||||
| Account | 1,024,235,000 | -- | -- | 1,024,235,000 | -- | -- | -- | ||||
| Dynegy Inc. | 25,058,906 | -- | 4,058,906 | 21,000,000 | 523,740,000 | -- | (81,337,703 | ) | |||
| Dynegy Inc., senior note, 144A, | |||||||||||
| 5.875%, 6/01/23 | 75,000,000 | 20,000,000 | -- | 95,000,000 | 93,812,500 | 2,735,139 | -- | ||||
| Dynegy Inc., wts., 10/02/17 | 1,143,273 | -- | -- | 1,143,273 | 2,000,728 | -- | -- | ||||
| Dynegy Roseton Danskammer Pass | |||||||||||
| Through Trust, Escrow Account | 40,000,000 | -- | -- | 40,000,000 | -- | -- | -- | ||||
| b R.H. Donnelley Inc., Term Loan B, | |||||||||||
| 9.75%, 12/30/16 | 40,152,231 | 1,226,521 | 38,925,710 | 25,082,754 | 1,925,378 | 235,822 | |||||
| Total Affiliated Securities (Value is 2.14% of Net Assets) | $ | 1,936,804,867 | $ | 23,741,694 | $ | (77,189,548 | ) | ||||
*In U.S. dollars unless otherwise indicated.
aAs of March 31, 2014, no longer an affiliate.
bCompany is a wholly owned subsidiary of Dex Media Inc.
11. CREDIT FACILITY
The Funds, together with other U.S. registered and foreign investment funds (collectively, Borrowers), managed by Franklin Templeton Investments, are borrowers in a joint syndicated senior unsecured credit facility totaling $1.5 billion (Global Credit Facility) which matures on February 13, 2015. This Global Credit Facility provides a source of funds to the Borrowers for temporary and emergency purposes, including the ability to meet future unanticipated or unusually large redemption requests.
142 | Semiannual Report
Franklin Custodian Funds
Notes to Financial Statements (unaudited) (continued)
11. CREDIT FACILITY (continued)
Under the terms of the Global Credit Facility, the Funds shall, in addition to interest charged on any borrowings made by the Funds and other costs incurred by the Funds, pay their share of fees and expenses incurred in connection with the implementation and maintenance of the Global Credit Facility, based upon their relative share of the aggregate net assets of all of the Borrowers, including an annual commitment fee of 0.07% based upon the unused portion of the Global Credit Facility. These fees are reflected in other expenses on the Statements of Operations. During the period ended March 31, 2014, the Funds did not use the Global Credit Facility.
12. FAIR VALUE MEASUREMENTS
The Funds follow a fair value hierarchy that distinguishes between market data obtained from independent sources (observable inputs) and the Funds own market assumptions (unobservable inputs). These inputs are used in determining the value of the Funds financial instruments and are summarized in the following fair value hierarchy:
- Level 1 quoted prices in active markets for identical financial instruments
- Level 2 other significant observable inputs (including quoted prices for similar financial instruments, interest rates, prepayment speed, credit risk, etc.)
- Level 3 significant unobservable inputs (including the Funds own assumptions in determining the fair value of financial instruments)
The input levels are not necessarily an indication of the risk or liquidity associated with financial instruments at that level.
For movements between the levels within the fair value hierarchy, the Funds have adopted a policy of recognizing the transfers as of the date of the underlying event which caused the movement.
A summary of inputs used as of March 31, 2014, in valuing the Funds assets and liabilities carried at fair value, is as follows:
| Level 1 | Level 2 | Level 3 | Total | ||||||
| Franklin DynaTech Fund | |||||||||
| Assets: | |||||||||
| Investments in Securities: | |||||||||
| Equity Investmentsa | $ | 2,087,060,080 | $ | -- | $ | -- | $ | 2,087,060,080 | |
| Short Term Investments | 57,914,104 | -- | -- | 57,914,104 | |||||
| Total Investments in | |||||||||
| Securities | $ | 2,144,974,184 | $ | -- | $ | -- | $ | 2,144,974,184 |
Semiannual Report | 143
| Franklin Custodian Funds | |||||||||||
| Notes to Financial Statements (unaudited) (continued) | |||||||||||
| 12. FAIR VALUE MEASUREMENTS (continued) | |||||||||||
| Level 1 | Level 2 | Level 3 | Total | ||||||||
| Franklin Growth Fund | |||||||||||
| Assets: | |||||||||||
| Investments in Securities: | |||||||||||
| Equity Investmentsa | $ | 8,721,662,644 | $ | -- | $ | -- | $ | 8,721,662,644 | |||
| Short Term Investments | 485,193,678 | 297,401,393 | -- | 782,595,071 | |||||||
| Total Investments in | |||||||||||
| Securities | $ | 9,206,856,322 | $ | 297,401,393 | $ | -- | $ | 9,504,257,715 | |||
| Franklin Income Fund | |||||||||||
| Assets: | |||||||||||
| Investments in Securities: | |||||||||||
| Equity Investments:a | |||||||||||
| Energy | $ | 7,679,245,430 | $ | 572,106,507 | $ | -- | $ | 8,251,351,937 | |||
| Financials | 5,614,474,162 | 288,250,000 | -- | 5,902,724,162 | |||||||
| Industrials | 2,640,375,000 | 257,258,583 | -- | 2,897,633,583 | |||||||
| Materials | 6,578,880,774 | 29,043,720 | -- | 6,607,924,494 | |||||||
| Utilities | 10,874,776,485 | 126,430,000 | -- | 11,001,206,485 | |||||||
| All Other Equity | |||||||||||
| Investmentsb | 11,225,325,832 | -- | -- | 11,225,325,832 | |||||||
| Equity-Linked Securities | -- | 9,269,801,756 | -- | 9,269,801,756 | |||||||
| Convertible Bonds | -- | 695,932,371 | -- | 695,932,371 | |||||||
| Corporate Bonds | -- | 29,776,897,050 | -- | 29,776,897,050 | |||||||
| Senior Floating Rate Interests | -- | 3,542,199,746 | -- | 3,542,199,746 | |||||||
| Escrows and Litigation Trusts | -- | -- | 150,000 | c | 150,000 | ||||||
| Short Term Investments | 706,268,206 | 187,323,314 | 893,591,520 | ||||||||
| Total Investments in | |||||||||||
| Securities | $ | 45,319,345,889 | $ | 44,745,243,047 | $ | 150,000 | $ | 90,064,738,936 | |||
| Other Financial Instruments | |||||||||||
| Unfunded Loan Commitments | $ | -- | $ | 2,617,742 | $ | -- | $ | 2,617,742 | |||
| Liabilities: | |||||||||||
| Other Financial Instruments | |||||||||||
| Options Written | $ | 1,155,000 | $ | -- | $ | -- | $ | 1,155,000 | |||
| Franklin U.S. Government Securities | |||||||||||
| Fund | |||||||||||
| Assets: | |||||||||||
| Investments in Securities: | |||||||||||
| Mortgage-Backed Securities | $ | -- | $ | 7,295,865,086 | $ | -- | $ | 7,295,865,086 | |||
| Short Term Investments | 104,422,875 | -- | -- | 104,422,875 | |||||||
| Total Investments in | |||||||||||
| Securities | $ | 104,422,875 | $ | 7,295,865,086 | $ | -- | $ | 7,400,287,961 | |||
144 | Semiannual Report
| Franklin Custodian Funds | ||||||||
| Notes to Financial Statements (unaudited) (continued) | ||||||||
| 12. FAIR VALUE MEASUREMENTS (continued) | ||||||||
| Level 1 | Level 2 | Level 3 | Total | |||||
| Franklin Utilities Fund | ||||||||
| Assets: | ||||||||
| Investments in Securities: | ||||||||
| Equity Investmentsa | $ | 5,155,232,290 | $ | -- | $ | -- | $ | 5,155,232,290 |
| Corporate Bonds | -- | 74,892,894 | -- | 74,892,894 | ||||
| Short Term Investments | 66,217,489 | -- | -- | 66,217,489 | ||||
| Total Investments in | ||||||||
| Securities | $ | 5,221,449,779 | $ | 74,892,894 | $ | -- | $ | 5,296,342,673 |
aFor detailed categories, see the accompanying Statement of Investments.
bIncludes common, preferred and convertible preferred stocks as well as other equity investments.
cIncludes securities determined to have no value at March 31, 2014.
13. NEW ACCOUNTING PRONOUNCEMENTS
In June 2013, the Financial Accounting Standards Board issued Accounting Standards Update (ASU) No. 2013-08, Investment Companies (Topic 946): Amendments to the Scope, Measurement, and Disclosure Requirements. The ASU modifies the criteria used in defining an investment company under U.S. Generally Accepted Accounting Principles and also sets forth certain measurement and disclosure requirements. Under the ASU, an entity that is registered under the 1940 Act automatically qualifies as an investment company. The ASU is effective for interim and annual reporting periods beginning after December 15, 2013. Management has reviewed the requirements and believes the adoption of this ASU will not have a material impact on the financial statements.
14. SUBSEQUENT EVENTS
The Funds have evaluated subsequent events through the issuance of the financial statements and determined that no events have occurred that require disclosure other than those already disclosed in the financial statements.
| ABBREVIATIONS | ||||
| Currency | Selected Portfolio | |||
| EUR | -Euro | ADR | - | American Depositary Receipt |
| GBP | - British Pound | FHLB | - | Federal Home Loan Bank |
| FHLMC | - | Federal Home Loan Mortgage Corp. | ||
| FNMA | - | Federal National Mortgage Association | ||
| FRN | - | Floating Rate Note | ||
| GP | - | Graduated Payment | ||
| L/C | - | Letter of Credit | ||
| MTN | - | Medium Term Note | ||
| PIK | - | Payment-In-Kind | ||
| SF | - | SingleFamily | ||
Semiannual Report | 145
Franklin Custodian Funds
Shareholder Information
Board Review of Investment Management Agreement
At a meeting held February 25, 2014, the Board of Trustees (Board), including a majority of non-interested or independent Trustees, approved renewal of the investment management agreement for each of the five separate funds in Franklin Custodian Funds (Fund(s)). In reaching this decision, the Board took into account information furnished throughout the year at regular Board meetings, as well as information prepared specifically in connection with the annual renewal review process. Information furnished and discussed throughout the year included investment performance reports and related financial information for each Fund, along with periodic reports on expenses, shareholder services, legal and compliance matters, pricing, brokerage commissions and execution and other services provided by the Investment Manager (Manager) and its affiliates. Information furnished specifically in connection with the renewal process included a report for each Fund prepared by Lipper, Inc. (Lipper), an independent organization, as well as additional material, including a Fund profitability analysis prepared by management. The Lipper reports compared each Fund s investment performance and expenses with those of other mutual funds deemed comparable to the Fund as selected by Lipper. The Fund profitability analysis discussed the profitability to Franklin Templeton Investments from its overall U.S. fund operations, as well as on an individual fund-by-fund basis. Additional material accompanying such profitability analysis included information on a fund-by-fund basis listing portfolio managers and other accounts they manage, as well as information on management fees charged by the Manager and its affiliates to U.S. mutual funds and other accounts, including management s explanation of differences where relevant. Such material also included a memorandum prepared by management describing project initiatives and capital investments relating to the services provided to the Funds by the Franklin Templeton Investments organization, as well as a memorandum relating to economies of scale and an analysis concerning transfer agent fees charged by an affiliate of the Manager.
In considering such materials, the independent Trustees received assistance and advice from and met separately with independent counsel. While the investment management agreements for all Funds were considered at the same Board meeting, the Board dealt with each Fund separately. In approving continuance of the investment management agreement for each Fund, the Board, including a majority of independent Trustees, determined that the existing management fee structure was fair and reasonable and that continuance of the investment management agreement was in the best interests of each Fund and its shareholders. While attention was given to all information furnished, the following discusses some primary factors relevant to the Board s decision.
NATURE, EXTENT AND QUALITY OF SERVICES. The Board was satisfied with the nature and quality of the overall services provided by the Manager and its affiliates to the Funds and their shareholders. In addition to investment performance and expenses discussed later, the Board s opinion was based, in part, upon periodic reports furnished it showing that the investment policies and restrictions for each Fund were consistently complied with as well as other reports periodically furnished the Board covering matters such as the compliance of portfolio managers and other management personnel with the code of ethics adopted throughout the Franklin Templeton fund complex, the adherence to fair value pricing procedures established by the Board, and the accuracy
146 | Semiannual Report
Franklin Custodian Funds
Shareholder Information (continued)
Board Review of Investment Management Agreement (continued)
of net asset value calculations. The Board also noted the extent of benefits provided Fund shareholders from being part of the Franklin Templeton family of funds, including the right to exchange investments between the same class of funds without a sales charge, the ability to reinvest Fund dividends into other funds and the right to combine holdings in other funds to obtain a reduced sales charge. Favorable consideration was given to management s continuous efforts and expenditures in establishing back-up systems and recovery procedures to function in the event of a natural disaster, it being noted by the Board that such systems and procedures had functioned well during the Florida hurricanes and blackouts experienced in previous years, and that those operations in the New York/New Jersey area ran smoothly during the period of 2012 Hurricane Sandy. Among other factors taken into account by the Board were the Manager s best execution trading policies, including a favorable report by an independent portfolio trading analytical firm, which also covered FOREX transactions. Consideration was also given to the experience of each Fund s portfolio management team, the number of accounts managed and general method of compensation. In this latter respect, the Board noted that a primary factor in management s determination of a portfolio manager s bonus compensation was the relative investment performance of the funds he or she managed and that a portion of such bonus was required to be invested in a predesignated list of funds within such person s fund management area so as to be aligned with the interests of shareholders. The Board also took into account the quality of transfer agent and shareholder services provided Fund shareholders by an affiliate of the Manager and the continuous enhancements to the Franklin Templeton website. Particular attention was given to management s conservative approach and diligent risk management procedures, including continuous monitoring of counterparty credit risk and attention given to derivatives and other complex instruments including expanded collateralization requirements. The Board also took into account, among other things, management s efforts in establishing a global credit facility for the benefit of the Funds and other accounts managed by Franklin Templeton Investments to provide a source of cash for temporary and emergency purposes or to meet unusual redemption requests as well as the strong financial position of the Manager s parent company and its commitment to the mutual fund business as evidenced by its subsidization of money market funds.
INVESTMENT PERFORMANCE. The Board placed significant emphasis on the investment performance of each Fund in view of its importance to shareholders. While consideration was given to performance reports and discussions with portfolio managers at Board meetings during the year, particular attention in assessing performance was given to the Lipper reports furnished for the agreement renewals. The Lipper reports prepared for each individual Fund showed the investment performance of its Class A shares during 2013 and the previous 10-year period ended December 31, 2013, in comparison with a performance universe selected by Lipper. Investment performance was shown on a total return basis for all Funds with income return being shown as well for those Funds having income as an investment objective element. The following summarizes the performance results for each Fund.
Semiannual Report | 147
Franklin Custodian Funds
Shareholder Information (continued)
Board Review of Investment Management Agreement (continued)
Franklin DynaTech Fund This Fund s investment performance was shown in comparison to a performance universe consisting of the Fund and all retail and institutional multi-cap growth funds as classified by Lipper. The Lipper report showed the Fund s total return for 2013 to be in the highest or best performing quintile of its performance universe and on an annualized basis to be in the second-highest performing quintile of such universe for each of the previous three-, five- and 10-year periods. The Board was satisfied with the Fund s performance as shown in the Lipper report.
Franklin Growth Fund The Fund s investment performance was shown in comparison to a performance universe consisting of all retail and institutional multi-cap core funds as classified by Lipper. The Lipper report showed the Fund s total return during 2013 to be in the second-lowest performing quintile of such performance universe and on an annualized basis to be in the middle performing quintile for the previous three- and five-year periods, and in the second-highest performing quintile of such universe for the previous 10-year period. The Board discussed with management the Fund s 2013 underperformance but found the Fund s overall performance as shown in the Lipper report to be acceptable and noted that its total return for 2013 exceeded 29%.
Franklin Income Fund The Fund s investment performance was shown in comparison to a performance universe consisting of the Fund and all other retail and institutional mixed-asset target allocation moderate funds as classified by Lipper. The Lipper report showed the Fund s income return during 2013 to be in the highest or best performing quintile of its performance universe and its income return on an annualized basis during each of the previous three-, five- and 10-year periods to also be in the highest performing quintile of such performance universe. The Lipper report showed the Fund s total return during 2013 to be in the middle performing quintile of its Lipper performance universe, and on an annualized basis to be in either the highest or second-highest performing quintile of such universe during each of the previous three-, five- and 10-year periods. The Board was satisfied with the Fund s performance as shown in the Lipper report.
Franklin U.S. Government Securities Fund This Fund s investment performance was shown in comparison to a performance universe consisting of all retail and institutional Ginnie Mae funds as classified by Lipper. The Fund s Lipper report showed its income return during 2013 to be in the second-highest performing quintile of it Lipper performance universe and its income return on an annualized basis to be in either the highest or second-highest performing quintile of such universe during each of the previous three-, five- and 10-year periods. The Fund s Lipper report showed its total return to be in the highest performing quintile of its performance universe during 2013, and its total return on an annualized basis to be in the middle performing quintiles of such universe for the previous three- and 10-year periods, and in the second-lowest performing quintile of such universe for the previous five-year period. The Board found such comparative performance to be acceptable in view of the Fund s income investment objective and conservative policy of investing only in plain vanilla Ginnie Mae pass-through securities. The Board also noted that the Fund s total return for the annualized five-year period was less than eight basis points below the performance universe median for such period.
148 | Semiannual Report
Franklin Custodian Funds
Shareholder Information (continued)
Board Review of Investment Management Agreement (continued)
Franklin Utilities Fund This Fund s investment performance was shown in comparison to a performance universe consisting of all retail and institutional utility funds as classified by Lipper. The Fund s Lipper report showed its income return during 2013 to be in the second-highest performing quintile of such universe, and its income return on an annualized basis to be in either the highest or second-highest performing quintile of such performance universe during each of the previous three-, five- and 10-year periods. The Fund s total return during 2013 was in the second-lowest performing quintile of its performance universe, and on an annualized basis was in the second-highest performing quintile of such universe during each of the previous three- and 10-year periods, and in the middle performing quintile of such universe during the previous five-year period. The Board discussed with management the reason for the Fund s 2013 total return underperformance but was satisfied with the Fund s overall performance as shown in the Lipper report and noted that the Fund s total return for such year as shown in the Lipper report exceeded 13.5%.
COMPARATIVE EXPENSES. Consideration was given to a comparative analysis of the management fees and total expense ratio of each Fund compared with those of a group of other funds selected by Lipper as constituting its appropriate Lipper expense group. Lipper expense data is based upon information taken from each fund s most recent annual report, which reflects historical asset levels that may be quite different from those currently existing, particularly in a period of market volatility. While recognizing such inherent limitation and the fact that expense ratios generally increase as assets decline and decrease as assets grow, the Board believed the independent analysis conducted by Lipper to be an appropriate measure of comparative expenses. In reviewing comparative costs, Lipper provides information on each Fund s contractual investment management fee in comparison with the contractual investment management fee that would have been charged by other funds within its Lipper expense group assuming they were similar in size to the Fund, as well as the actual total expenses of the Fund in comparison with those of its Lipper expense group. The Lipper contractual investment management fee analysis considers administrative charges as being part of management fees, and total expenses, for comparative consistency, are shown by Lipper for Fund Class A shares. The results of such expense comparisons showed for each Fund that its contractual investment management fee rate was below the median of its Lipper expense group and its actual total expense ratio was in the least expensive quintile of its Lipper expense group. Based upon the above, the Board was satisfied with the management fee and actual total expense ratio of each Fund in comparison to its respective Lipper expense group as shown in the Lipper reports.
MANAGEMENT PROFITABILITY. The Board also considered the level of profits realized by the Manager and its affiliates in connection with the operation of each Fund. In this respect, the Board reviewed the Fund profitability analysis that addresses the overall profitability of Franklin Templeton s U.S. fund business, as well as its profits in providing management and other services to each of the individual funds during the 12-month period ended September 30, 2013, being the most recent fiscal year-end for Franklin Resources, Inc., the Manager s parent. In reviewing the analysis, the Board recognized that allocation methodologies are inherently subjective and various allocation methodologies may be reasonable while producing different results. In this respect, the
Semiannual Report | 149
Franklin Custodian Funds
Shareholder Information (continued)
Board Review of Investment Management Agreement (continued)
Board noted that while management continuously makes refinements to its methodologies in response to organizational and product related changes, the overall approach as defined by the primary drivers and activity measurements has remained consistent with that used in the Funds profitability report presentations from prior years. Additionally, the Funds independent registered public accounting firm had been engaged by the Manager to periodically review the reasonableness of the allocation methodologies to be used solely by the Funds Board in reference to the profitability analysis. In reviewing and discussing such analysis, management discussed with the Board its belief that costs incurred in establishing the infrastructure necessary for the type of mutual fund operations conducted by the Manager and its affiliates may not be fully reflected in the expenses allocated to each Fund in determining its profitability, as well as the fact that the level of profits, to a certain extent, reflected operational cost savings and efficiencies initiated by management. The Board also took into account management s expenditures in improving shareholder services provided the Funds, as well as the need to implement systems and meet additional regulatory and compliance requirements resulting from statutes such as the Sarbanes-Oxley and Dodd-Frank Acts and recent SEC and other regulatory requirements. In addition, the Board considered a third-party study comparing the profitability of the Manager s parent on an overall basis to other publicly held managers broken down to show profitability from management operations exclusive of distribution expenses, as well as profitability including distribution expenses. The Board also considered the extent to which the Manager and its affiliates might derive ancillary benefits from fund operations, including revenues generated from transfer agent services and potential benefits resulting from allocation of fund brokerage and the use of commission dollars to pay for research. Based upon its consideration of all these factors, the Board determined that the level of profits realized by the Manager and its affiliates from providing services to each Fund was not excessive in view of the nature, quality and extent of services provided.
ECONOMIES OF SCALE. The Board also considered whether economies of scale are realized by the Manager as the Funds grow larger and the extent to which this is reflected in the level of management fees charged. While recognizing that any precise determination is inherently subjective, the Board noted that based upon the Fund profitability analysis, it appears that as some funds get larger, at some point economies of scale do result in the Manager realizing a larger profit margin on management services provided such a fund. The Board also noted that economies of scale are shared with each Fund and its shareholders through management fee breakpoints so that as a Fund grows in size, its effective management fee rate declines. The fee structure under the investment management agreement with each Fund provides an initial fee of 0.625% on the first $100 million of assets; 0.50% on the next $150 million of assets; 0.45% on the next $7.25 billion of assets; and declining thereafter until reaching a breakpoint of 0.35% for assets in excess of $50 billion, with such breakpoints continuing in the case of Franklin Income Fund and Franklin Utilities Fund to 0.345% on assets in excess of $65 billion and 0.34% on assets in excess of $80 billion. Existing breakpoints continue beyond the year-end asset size of each Fund other than Franklin Income Fund, whose assets had grown to approximately $86 billion at December 31, 2013. In discussing additional breakpoints for such Fund, management expressed the view that its fee structure reaches
150 | Semiannual Report
Franklin Custodian Funds
Shareholder Information (continued)
Board Review of Investment Management Agreement (continued)
a relatively low rate quickly anticipating economies of scale as assets increase and pointed out the Fund s favorable contractual management fee and total expense comparison within its Lipper expense group as previously discussed under Comparative Expenses. The Board also noted economies of scale are realized from asset growth in excess of a fund s last breakpoint since this results in an overall lower management fee rate. While intending to monitor future growth of Franklin Income Fund, the Board believed that to the extent economies of scale may be realized by the Manager and its affiliates, the schedule of fees under the investment management agreement for this Fund as well as for each of the other Funds provides a sharing of benefits with the Fund and its shareholders.
Proxy Voting Policies and Procedures
The Trust s investment manager has established Proxy Voting Policies and Procedures (Policies) that the Trust uses to determine how to vote proxies relating to portfolio securities. Shareholders may view the Trust s complete Policies online at franklintempleton.com. Alternatively, shareholders may request copies of the Policies free of charge by calling the Proxy Group collect at (954) 527-7678 or by sending a written request to: Franklin Templeton Companies, LLC, 300 S.E. 2nd Street, Fort Lauderdale, FL 33301, Attention: Proxy Group. Copies of the Trust s proxy voting records are also made available online at franklintempleton.com and posted on the U.S. Securities and Exchange Commission s website at sec.gov and reflect the most recent 12-month period ended June 30.
Quarterly Statement of Investments
The Trust files a complete statement of investments with the U.S. Securities and Exchange Commission for the first and third quarters for each fiscal year on Form N-Q. Shareholders may view the filed Form N-Q by visiting the Commission s website at sec.gov. The filed form may also be viewed and copied at the Commission s Public Reference Room in Washington, DC. Information regarding the operations of the Public Reference Room may be obtained by calling (800) SEC-0330.
Semiannual Report | 151
This page intentionally left blank.

Item 2. Code of Ethics.
(a) The Registrant has adopted a code of ethics that applies to its principal executive officers and principal financial and accounting officer.
(c) N/A
(d) N/A
(f) Pursuant to Item 12(a)(1), the Registrant is attaching as an exhibit a copy of its code of ethics that applies to its principal executive officers and principal financial and accounting officer.
Item 3. Audit Committee Financial Expert.
(a)(1) The Registrant has an audit committee financial expert serving on its audit committee.
(2) The audit committee financial expert is John B. Wilson and he is "independent" as defined under the relevant Securities and Exchange Commission Rules and Releases.
Item 4. Principal Accountant Fees and Services. N/A
Item 5. Audit Committee of Listed Registrants. N/A
Item 6. Schedule of Investments. N/A
Item 7. Disclosure of Proxy Voting Policies and Procedures for Closed-End Management Investment Companies. N/A
Item 8. Portfolio Managers of Closed-End Management Investment Companies. N/A
Item 9. Purchases of Equity Securities by Closed-End Management Investment Company and Affiliated Purchasers. N/A
Item 10. Submission of Matters to a Vote of Security Holders.
There have been no changes to the procedures by which shareholders may recommend nominees to the Registrant's Board of Trustees that would require disclosure herein.
Item 11. Controls and Procedures.
(a) Evaluation of Disclosure Controls and Procedures. The Registrant maintains disclosure controls and procedures that are designed to ensure that information required to be disclosed in the Registrant’s filings under the Securities Exchange Act of 1934 and the Investment Company Act of 1940 is recorded, processed, summarized and reported within the periods specified in the rules and forms of the Securities and Exchange Commission. Such information is accumulated and communicated to the Registrant’s management, including its principal executive officer and principal financial officer, as appropriate, to allow timely decisions regarding required disclosure. The Registrant’s management, including the principal executive officer and the principal financial officer, recognizes that any set of controls and procedures, no matter how well designed and operated, can provide only reasonable assurance of achieving the desired control objectives.
Within 90 days prior to the filing date of this Shareholder Report on Form N-CSR, the Registrant had carried out an evaluation, under the supervision and with the participation of the Registrant’s management, including the Registrant’s principal executive officer and the Registrant’s principal financial officer, of the effectiveness of the design and operation of the Registrant’s disclosure controls and procedures. Based on such evaluation, the Registrant’s principal executive officer and principal financial officer concluded that the Registrant’s disclosure controls and procedures are effective.
(b) Changes in Internal Controls. There have been no changes in the Registrant’s internal controls or in other factors that could materially affect the internal controls over financial reporting subsequent to the date of their evaluation in connection with the preparation of this Shareholder Report on Form N-CSR.
Item 12. Exhibits.
(a)(1) Code of Ethics
(a)(2) Certifications pursuant to Section 302 of the Sarbanes-Oxley Act of 2002 of Laura F. Fergerson, Chief Executive Officer - Finance and Administration, and Gaston Gardey, Chief Financial Officer and Chief Accounting Officer
(b) Certifications pursuant to Section 906 of the Sarbanes-Oxley Act of 2002 of Laura F. Fergerson, Chief Executive Officer - Finance and Administration, and Gaston Gardey, Chief Financial Officer and Chief Accounting Officer
SIGNATURES
Pursuant to the requirements of the Securities Exchange Act of 1934 and the Investment Company Act of 1940, the registrant has duly caused this report to be signed on its behalf by the undersigned, thereunto duly authorized.
FRANKLIN CUSTODIAN FUNDS
By /s/LAURA F. FERGERSON
Laura F. Fergerson
Chief Executive Officer - Finance and Administration
Date May 27, 2014
Pursuant to the requirements of the Securities Exchange Act of 1934 and the Investment Company Act of 1940, this report has been signed below by the following persons on behalf of the registrant and in the capacities and on the dates indicated.
By /s/LAURA F. FERGERSON
Laura F. Fergerson
Chief Executive Officer - Finance and Administration
Date May 27, 2014
By /s/GASTON GARDEY
Gaston Gardey
Chief Financial Officer and Chief Accounting Officer
Date May 27, 2014