UNITED STATES
SECURITIES AND EXCHANGE COMMISSION
Washington, DC 20549
FORM N-CSRS
CERTIFIED SHAREHOLDER REPORT OF REGISTERED MANAGEMENT INVESTMENT COMPANIES
Investment Company Act file number_811-00537
Franklin Custodian Funds
(Exact name of registrant as specified in charter)
One Franklin Parkway, San Mateo, CA 94403-1906
(Address of principal executive offices) (Zip code)
Craig S. Tyle, One Franklin Parkway, San Mateo, CA 94403-1906
(Name and address of agent for service)
Registrant's telephone number, including area code:650 312-2000
Date of fiscal year end: 9/30
Date of reporting period: 3/31/17
Item 1. Reports to Stockholders.
| Contents | |
| Semiannual Report | |
| Economic and Market Overview | 3 |
| Franklin DynaTech Fund | 4 |
| Franklin Growth Fund | 10 |
| Franklin Income Fund | 16 |
| Franklin U.S. Government Securities Fund | 23 |
| Franklin Utilities Fund | 28 |
| Financial Highlights and Statements of Investments | 33 |
| Financial Statements | 88 |
| Notes to Financial Statements | 97 |
| Shareholder Information | 118 |
Visit franklintempleton.com for fund updates, to access your account, or to find helpful financial planning tools.
2 Semiannual Report
franklintempleton.com
Semiannual Report
Economic and Market Overview
The U.S. economy continued to grow in 2017’s first quarter, though at a slower pace compared to 2016’s fourth quarter. Strength in business investment, exports, housing and consumer spending was partially offset by declines in private inventory investment and government spending. The manufacturing sector generally expanded, and the services sector continued to grow. The unemployment rate decreased from 4.9% in September 2016 to 4.5% at period-end.1 Monthly retail sales were volatile, but grew during most of the review period. Inflation generally increased during the period, as measured by the Consumer Price Index.
At its December meeting, the U.S. Federal Reserve (Fed) raised its target range for the federal funds rate to 0.50%–0.75%, as policymakers cited improved labor market conditions and higher inflation. The Fed kept its interest rate unchanged at its February meeting, but incoming economic data, along with statements by Fed officials in late February and early March, heightened many investors’ expectations for a March interest-rate hike. The Fed, at its March meeting, made the widely anticipated increase in its federal funds target rate to 0.75%–1.00%.
U.S. equity markets rose during the review period, benefiting from mostly upbeat economic data, encouraging corporate earnings, signs of improvement in the Chinese and European economies, ongoing expansionary monetary policies from key central banks and investor optimism arising from U.S. President Donald Trump’s pro-growth and pro-business policy plans. However, investor concerns about the terms of the U.K.’s exit from the European Union and President Trump’s protectionist policies weighed on market sentiment. The broad U.S. stock market ended the six-month period higher, as measured by the Standard & Poor’s® 500 Index.
The foregoing information reflects our analysis and opinions as of March 31, 2017. The information is not a complete analysis of every aspect of any market, country, industry, security or fund. Statements of fact are from sources considered reliable.
1. Source: Bureau of Labor Statistics.
franklintempleton.com
Semiannual Report 3
Franklin DynaTech Fund
This semiannual report for Franklin DynaTech Fund covers the period ended March 31, 2017.
Your Fund’s Goal and Main Investments
The Fund seeks capital appreciation by investing primarily in equity securities of companies that emphasize innovation and new technologies, have superior management and that benefit from new industry conditions in the dynamically changing global economy.
Performance Overview
The Fund’s Class A shares delivered a +7.85% cumulative total return for the six months under review. In comparison, the Russell 1000® Growth Index, which measures performance of the largest companies in the Russell 3000® Index with higher price-to-book ratios and higher forecasted growth values, generated a total return of +10.01%.1 Also for comparison, the broad U.S. stock market as measured by the Standard & Poor’s 500 Index (S&P 500®), produced a +10.12% return, and domestic and international-based stocks as measured by the NASDAQ Composite Index® had a +11.95% total return.1 You can find the Fund’s long-term performance data in the Performance Summary beginning on page 7.
Performance data represent past performance, which does not guarantee future results. Investment return and principal value will fluctuate, and you may have a gain or loss when you sell your shares. Current performance may differ from figures shown. For most recent month-end performance, go to franklintempleton.com or call (800) 342-5236.
Investment Strategy
We use fundamental, bottom-up research to seek companies meeting our criteria of growth potential, quality and valuation. In seeking sustainable growth characteristics, we look for companies we believe can produce sustainable earnings and cash flow growth, evaluating the long-term market opportunity and competitive structure of an industry to target leaders and emerging leaders. We define quality companies as those with strong and improving competitive positions in attractive markets. We also believe important attributes of quality are experienced and talented management teams as well as financial strength reflected in the capital structure, gross and operating margins, free cash flow generation and returns on capital employed. Our valuation analysis includes a range of potential outcomes based on an assessment of multiple scenarios. In assessing value, we consider whether security prices fully reflect the balance of the sustainable growth opportunities relative to business and financial risks.
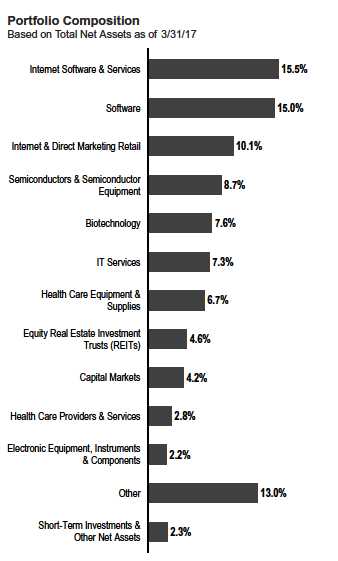
Manager’s Discussion
Several of the Fund’s information technology (IT) holdings contributed significantly to absolute performance during the reporting period.2 During the period, Avago Technologies acquired Broadcom Corp. and Broadcom Limited was formed. The company benefited results as it reported two strong quarters, in which it exceeded consensus expectations. Results were better than expected due to strong execution and the completion of the legacy Broadcom Corp. acquisition. The company announced another acquisition, part of Brocade, in early November 2016, which was well received by the market. Lastly, Broadcom increased its long-term operating margin target model, which could be among the best, in our view, in the entire industry. Facebook helped results amid strong top-and bottom-line performance. Strong user engagement, new ad formats, Instagram and video have been key drivers. Notably, while Snapchat’s initial public offering had been viewed as a concern for many, possibly leading to a renewed focus on millennials’ relationship with Facebook, Snapchat’s slowing user growth in the latter half of 2016 and strong competitive behavior and feature adoption both by Instagram and Facebook shifted the narrative. Mastercard also benefited performance. The company’s fourth-quarter 2016 results were slightly ahead of consensus expectations amid good operating leverage and guidance for expense growth to remain in check. Expectations are for the VocaLink acquisition to close in the second quarter of 2017, which we believe should give Mastercard a point of differentiation versus its peer, Visa. Commentary regarding trends through January 2017 showed modest acceleration in spending, especially as it pertains to the company’s high-margin cross-border business.
1. Source: Morningstar.
The indexes are unmanaged and include reinvestment of any income or distributions. They do not reflect any fees, expenses or sales charges. One cannot invest directly in an
index, and an index is not representative of the Fund’s portfolio.
Russell Investment Group is the source and owner of the trademarks, service marks and copyrights related to the Russell Indexes. Russell® is a trademark of Russell
Investment Group.
2. The IT sector comprises communications equipment; electronic equipment, instruments and components; Internet software and services; IT services; semiconductors and
semiconductor equipment; software; and technology hardware, storage and peripherals in the SOI.
The dollar value, number of shares or principal amount, and names of all portfolio holdings are listed in the Fund’s Statement of Investments (SOI).
The SOI begins on page 38.
4 Semiannual Report
franklintempleton.com
FRANKLIN DYNATECH FUND
The Fund’s consumer discretionary allocation also notably supported performance.3 Within the sector, Netflix benefited results. After seeing elevated subscriber churn during the summer of 2016 as customers were “un-grandfathered” from price increases implemented two years ago, the company saw a stabilization during its third quarter and delivered stronger-than-expected subscriber growth for its full fiscal year. Although U.S. subscriber additions stabilized, international subscriber additions continued to increase year-over-year, leading future global subscriber estimates to increase meaningfully. Additionally, its outlook for the first quarter of 2017 has the large international losses it has generated the past two years reaching a small gain as it embarks on the “generating significant global profits” portion of its growth plan. Amazon.com helped results amid consistent and profitable growth of its Amazon Web Service, which accounted for half of current earnings and about half of the company’s valuation, in our analysis. The company also experienced strong global growth of its Prime subscription service. The company’s shares benefited during the period as investors seemed to look past the current investment cycle, particularly for international retail. Amazon’s impact on traditional retailers seemed to intensify this past holiday season.
The health care sector also aided the Fund’s absolute results.4 Veterinary and pet products and services company IDEXX Laboratories performed well during the reporting period. The company’s shares appreciated as profits in the September and December 2016 quarters exceeded consensus expectations, and as investors gravitated toward consumer-oriented stocks that could benefit from an improving economy. Biotechnology firm Celgene’s strong performance during the review period was mostly driven by the U.S. presidential election. As an industry, biotechnology had underperformed the broader market leading into the November 2016 election as consensus expectations were for a Hillary Clinton victory. With the election of Donald Trump, and more importantly, the Republican sweep in Congress, investors viewed the risk of government intervention on drug pricing as diminished.
In contrast, several holdings detracted from the Fund’s absolute performance during the reporting period, including Edwards Lifesciences, DexCom5 and Illumina in the health care sector. Shares of Edwards Lifesciences, a producer of artificial heart valves and hemodynamic monitoring, fell as investors took
profits in the medical technology industry in late 2016 following strong performance that was driven by a trend of accelerating sales growth that failed to persist in the September quarter. The company’s stock also was negatively affected by the U.S. election, which spurred optimism for accelerating economic growth that led to an investor rotation toward more economically sensitive sectors. Medical devices company DexCom’s stock declined for reasons similar to Edwards Lifesciences. In addition, DexCom’s sales growth matured in the September and December 2016 quarters to an extent that was greater than investor expectations. Biotechnology company Illumina hindered the Fund’s results as the company’s stock
3. The consumer discretionary sector comprises automobiles; Internet and direct marketing retail; media; and textiles, apparel and luxury goods in the SOI.
4. The health care sector comprises biotechnology, health care equipment and supplies, health care providers and services, health care technology, life sciences tools and
services, and pharmaceuticals in the SOI.
5. Sold by period-end.
See www.franklintempletondatasources.com for additional provider information.
franklintempleton.com
Semiannual Report 5
FRANKLIN DYNATECH FUND
underperformed early in the reporting period when placements for one of its instrument lineups came in below market expectations. However, the company launched a new instrument cycle in January, and the stock recovered strongly. We have a positive outlook on sequencing and Illumina’s leadership position in the industry.
Top 10 Holdings
3/31/17
| Company | % of Total | |
| Sector/Industry | Net Assets | |
| Amazon.com Inc. | 6.2 | % |
| Internet & Direct Marketing Retail | ||
| Alphabet Inc. | 5.4 | % |
| Internet Software & Services | ||
| Facebook Inc. | 4.8 | % |
| Internet Software & Services | ||
| Mastercard Inc. | 3.4 | % |
| IT Services | ||
| Visa Inc. | 2.7 | % |
| IT Services | ||
| Celgene Corp. | 2.5 | % |
| Biotechnology | ||
| Equinix Inc. | 2.4 | % |
| Equity Real Estate Investment Trusts (REITs) | ||
| Tencent Holdings Ltd. | 2.2 | % |
| Internet Software & Services | ||
| Salesforce.com Inc. | 2.1 | % |
| Software | ||
| Broadcom Ltd. | 2.0 | % |
| Semiconductors & Semiconductor Equipment |
In the IT sector, security platform solutions provider Palo Alto Networks struggled with sales execution issues during the October 2016 and January 2017 fiscal quarters after a large and ill-conceived sales reorganization during the October quarter.5 We believe the company is also struggling to move down market as Cisco has improved its security portfolio and provided greater incentives to its channel. Although we remain confident that Palo Alto Networks is attractively valued, we have taken a more conservative view on how large this company can be in the future. Twilio, a cloud communications platform provider, also hindered results in the IT sector. Despite strong underlying growth and improving leverage, Twilio fell significantly during the review period as investor expectations were reduced and investors sold shares in the face of a large lock-up expiration. We remain positive on Twilio’s long-term growth prospects and potential to disrupt significant portions of the communications services market.
Elsewhere, LED lighting manufacturer Acuity Brands hindered performance.5 The company experienced three quarterly earnings misses due to slower non-residential construction activity following the November election, manufacturing disruptions in its Mexican facility, an appreciation in the Mexican peso that weighed on margins and concerns about a border adjustment tax.
As managers of Franklin DynaTech Fund, at period-end we remained encouraged by the relative abundance of companies that we believe have strong long-term growth prospects trading at what we perceive to be attractive valuations. We believe it is these innovative, thought-leading companies that may promote economic advancement over the longer term.
Thank you for your continued participation in Franklin DynaTech Fund. We look forward to serving your future investment needs.

The foregoing information reflects our analysis, opinions and portfolio holdings as of March 31, 2017, the end of the reporting period. The way we implement our main investment strategies and the resulting portfolio holdings may change depending on factors such as market and economic conditions. These opinions may not be relied upon as investment advice or an offer for a particular security. The information is not a complete analysis of every aspect of any market, country, industry, security or the Fund. Statements of fact are from sources considered reliable, but the investment manager makes no representation or warranty as to their completeness or accuracy. Although historical performance is no guarantee of future results, these insights may help you understand our investment management philosophy.
6 Semiannual Report
franklintempleton.com
FRANKLIN DYNATECH FUND
Performance Summary as of March 31, 2017
The performance table does not reflect any taxes that a shareholder would pay on Fund dividends, capital gain distributions, if any, or any realized gains on the sale of Fund shares. Total return reflects reinvestment of the Fund’s dividends and capital gain distributions, if any, and any unrealized gains or losses. Your dividend income will vary depending on dividends or interest paid by securities in the Fund’s portfolio, adjusted for operating expenses of each class. Capital gain distributions are net profits realized from the sale of portfolio securities.
Performance as of 3/31/171
Cumulative total return excludes sales charges. Average annual total return includes maximum sales charges. Sales charges will vary depending on the size of the investment and the class of share purchased. The maximum is 5.75% and the minimum is 0%. Class A: 5.75% maximum initial sales charge; Advisor Class: no sales charges. For other share classes, visit franklintempleton.com.
| Cumulative | Average Annual | |||
| Share Class | Total Return2 | Total Return3 | ||
| A | ||||
| 6-Month | +7.85 | % | +1.65 | % |
| 1-Year | +22.17 | % | +15.15 | % |
| 5-Year | +81.35 | % | +11.32 | % |
| 10-Year | +162.09 | % | +9.46 | % |
| Advisor4 | ||||
| 6-Month | +7.99 | % | +7.99 | % |
| 1-Year | +22.49 | % | +22.49 | % |
| 5-Year | +83.64 | % | +12.93 | % |
| 10-Year | +167.95 | % | +10.36 | % |
Performance data represent past performance, which does not guarantee future results. Investment return and principal value will fluctuate, and you may have a gain or loss when you sell your shares. Current performance may differ from figures shown. For most recent month-end performance, go to franklintempleton.com or call (800) 342-5236.
See page 8 for Performance Summary footnotes.
franklintempleton.com
Semiannual Report 7
| FRANKLIN DYNATECH FUND | |||||
| PERFORMANCE SUMMARY | |||||
| Distributions (10/1/16–3/31/17) | |||||
| Long-Term | |||||
| Share Class | Capital Gain | ||||
| A | $ | 1.6945 | |||
| C | $ | 1.6945 | |||
| R | $ | 1.6945 | |||
| R6 | $ | 1.6945 | |||
| Advisor | $ | 1.6945 | |||
| Total Annual Operating Expenses5 | |||||
| Share Class | With Waiver | Without Waiver | |||
| A | 0.91 | % | 0.92 | % | |
| Advisor | 0.66 | % | 0.67 | % | |
Each class of shares is available to certain eligible investors and has different annual fees and expenses, as described in the prospectus.
All investments involve risks, including possible loss of principal. Stocks historically have outperformed other asset classes over the long term, but tend to
fluctuate more dramatically over the short term. Investments in fast-growing industries, like the technology and health care sectors (which have historically been
volatile) could result in increased price fluctuation, especially over the short term, due to the rapid pace of product change and development and changes in
government regulation of companies emphasizing scientific or technological advancement or regulatory approval for new drugs and medical instruments. The
Fund may also invest in small- and mid-capitalization companies, which can be particularly sensitive to changing economic conditions, and their prospects for
growth are less certain than those of larger, more established companies. The Fund is actively managed but there is no guarantee that the manager’s investment
decisions will produce the desired results. The Fund’s prospectus also includes a description of the main investment risks.
1. The Fund has a fee waiver associated with any investment it makes in a Franklin Templeton money fund and/or other Franklin Templeton fund, contractually guaranteed
through 1/31/18. Fund investment results reflect the fee waiver; without this waiver, the results would have been lower.
2. Cumulative total return represents the change in value of an investment over the periods indicated.
3. Average annual total return represents the average annual change in value of an investment over the periods indicated. Return for less than one year, ifany,hasnotbeen
annualized.
4. Effective 5/15/08, the Fund began offering Advisor Class shares, which do not have sales charges or a Rule 12b-1 plan. Performance quotations for this class reflect the
following methods of calculation: (a) For periods prior to 5/15/08, a restated figure is used based upon the Fund’s Class A performance, excluding the effect of Class A’s
maximum initial sales charge, but reflecting the effect of the Class A Rule 12b-1 fees; and (b) for periods after 5/15/08, actual Advisor Class performance is used reflecting all
charges and fees applicable to that class. Since 5/15/08 (commencement of sales), the cumulative and average annual total returns of Advisor Class shares were +126.97%
and +9.67%.
5. Figures are as stated in the Fund’s current prospectus and may differ from the expense ratios disclosed in the Your Fund’s Expenses and Financial Highlights sections in this
report. In periods of market volatility, assets may decline significantly, causing total annual Fund operating expenses to become higher than the figures shown.
8 Semiannual Report
franklintempleton.com
FRANKLIN DYNATECH FUND
Your Fund’s Expenses
As a Fund shareholder, you can incur two types of costs: (1) transaction costs, including sales charges (loads) on Fund purchases and redemptions; and (2) ongoing Fund costs, including management fees, distribution and service (12b-1) fees, and other Fund expenses. All mutual funds have ongoing costs, sometimes referred to as operating expenses. The table below shows ongoing costs of investing in the Fund and can help you understand these costs and compare them with those of other mutual funds. The table assumes a $1,000 investment held for the six months indicated.
Actual Fund Expenses
The table below provides information about actual account values and actual expenses in the columns under the heading “Actual.” In these columns the Fund’s actual return, which includes the effect of Fund expenses, is used to calculate the “Ending Account Value” for each class of shares. You can estimate the expenses you paid during the period by following these steps (of course, your account value and expenses will differ from those in this illustration): Divide your account value by $1,000 (if your account had an $8,600 value, then $8,600 ÷ $1,000 = 8.6). Then multiply the result by the number in the row for your class of shares under the headings “Actual” and “Expenses Paid During Period” (if Actual Expenses Paid During Period were $7.50, then 8.6 x $7.50 = $64.50). In this illustration, the actual expenses paid this period are $64.50.
Hypothetical Example for Comparison with Other Funds
Under the heading “Hypothetical” in the table, information is provided about hypothetical account values and hypothetical expenses based on the Fund’s actual expense ratio and an assumed rate of return of 5% per year before expenses, which is not the Fund’s actual return. This information may not be used to estimate the actual ending account balance or expenses you paid for the period, but it can help you compare ongoing costs of investing in the Fund with those of other funds. To do so, compare this 5% hypothetical example for the class of shares you hold with the 5% hypothetical examples that appear in the shareholder reports of other funds.
Please note that expenses shown in the table are meant to highlight ongoing costs and do not reflect any transactional costs. Therefore, information under the heading “Hypothetical” is useful in comparing ongoing costs only, and will not help you compare total costs of owning different funds. In addition, if transactional costs were included, your total costs would have been higher.
| Actual | Hypothetical | |||||||||||
| (actual return after expenses) | (5% annual return before expenses) | |||||||||||
| Expenses | Expenses | Net | ||||||||||
| Beginning | Ending | Paid During | Ending | Paid During | Annualized | |||||||
| Share | Account | Account | Period | Account | Period | Expense | ||||||
| Class | Value 10/1/16 | Value 3/31/17 | 10/1/16–3/31/171,2 | Value 3/31/17 | 10/1/16–3/31/171,2 | Ratio2 | ||||||
| A | $ | 1,000 | $ | 1,078.50 | $ | 4.66 | $ | 1,020.44 | $ | 4.53 | 0.90 | % |
| C | $ | 1,000 | $ | 1,074.50 | $ | 8.48 | $ | 1,016.75 | $ | 8.25 | 1.64 | % |
| R | $ | 1,000 | $ | 1,077.30 | $ | 5.96 | $ | 1,019.20 | $ | 5.79 | 1.15 | % |
| R6 | $ | 1,000 | $ | 1,080.80 | $ | 2.49 | $ | 1,022.54 | $ | 2.42 | 0.48 | % |
| Advisor | $ | 1,000 | $ | 1,079.90 | $ | 3.37 | $ | 1,021.69 | $ | 3.28 | 0.65 | % |
1. Expenses are equal to the annualized expense ratio for the six-month period as indicated above–in the far right column–multiplied by the simple average account value
over the period indicated, and then multiplied by 182/365 to reflect the one-half year period.
2. Reflects expenses after fee waivers and expense reimbursements. Does not include acquired fund fees and expenses.
franklintempleton.com
Semiannual Report 9
Franklin Growth Fund
This semiannual report for Franklin Growth Fund covers the period ended March 31, 2017.
Your Fund’s Goal and Main Investments
The Fund seeks capital appreciation by investing substantially in equity securities of companies that are leaders in their industries.
Performance Overview
The Fund’s Class A shares delivered a +9.61% cumulative total return for the six months under review. In comparison, the Standard & Poor’s 500 Index (S&P 500), which is a broad measure of U.S. stock performance, had a +10.12% total return.1 You can find the Fund’s long-term performance data in the Performance Summary beginning on page 13.
Performance data represent past performance, which does not guarantee future results. Investment return will fluctuate. Current performance may differ from figures shown. For most recent month-end performance, go to franklintempleton.com or call (800) 342-5236.
Investment Strategy
We use fundamental, bottom-up research to seek companies meeting our criteria of growth potential, quality and valuation. In seeking sustainable growth characteristics, we look for companies we believe can produce sustainable earnings and cash flow growth, evaluating the long-term market opportunity and competitive structure of an industry to target leaders and emerging leaders. We define quality companies as those with strong and improving competitive positions in attractive markets. We also believe important attributes of quality are experienced and talented management teams as well as financial strength reflected in the capital structure, gross and operating margins, free cash flow generation and returns on capital employed. Our valuation analysis includes a range of potential outcomes based on an assessment of multiple scenarios. In assessing value, we consider whether security prices fully reflect the balance of the sustainable growth opportunities relative to business and financial risks.
Manager’s Discussion
Franklin Growth Fund owned shares of 163 companies at period-end. We continue to invest in a broad array of companies of all sizes and in varied industries.
During the period under review, most investment sectors contributed to absolute performance, including industrials,
1. Source: Morningstar.
The index is unmanaged and includes reinvestment of any income or distributions. It does not reflect any fees, expenses or sales charges. One cannot invest directly in an
index, and an index is not representative of the Fund’s portfolio.
The dollar value, number of shares or principal amount, and names of all portfolio holdings are listed in the Fund’s Statement of Investments (SOI).
The SOI begins on page 47.
10 Semiannual Report
franklintempleton.com
FRANKLIN GROWTH FUND
| Top 10 Holdings | ||
| 3/31/17 | ||
| Company | % of Total | |
| Sector/Industry | Net Assets | |
| Apple Inc. | 4.6 | % |
| Technology Hardware & Equipment | ||
| Amazon.com Inc. | 2.4 | % |
| Retailing | ||
| Alaska Air Group Inc. | 2.3 | % |
| Transportation | ||
| Alphabet Inc. | 2.1 | % |
| Software & Services | ||
| Northrop Grumman Corp. | 2.0 | % |
| Capital Goods | ||
| Microsoft Corp. | 1.7 | % |
| Software & Services | ||
| Union Pacific Corp. | 1.7 | % |
| Transportation | ||
| Mettler-Toledo International Inc. | 1.6 | % |
| Pharmaceuticals, Biotechnology & Life Sciences | ||
| The Walt Disney Co. | 1.5 | % |
| Media | ||
| The Boeing Co. | 1.5 | % |
| Capital Goods |
information technology (IT) and health care.2 In industrials, airline operator Alaska Air Group benefited from an improving fare environment across the industry starting in the second half of 2016. It also enjoyed slower competitive capacity growth in its Seattle hub. Finally, the market seemed optimistic about the prospects for Alaska’s merger with Virgin America. Aircraft manufacturer Boeing has performed well recently amid general investor bullishness about economically sensitive companies, driven by the U.S. President Trump administration’s policy promises regarding trade, taxes and foreign corporate cash repatriation. Additionally, airline industry fundamentals, specifically traffic and profits, have remained healthy. Finally, the company has made solid progress on reducing risk around its 787 program.
In IT, technology hardware and software provider Apple performed well as the iPhone 7 cycle turned out to be better than expected. Additionally, Apple’s service revenue has continued to grow and investor anticipation of a strong iPhone 8 cycle is buoying sentiment toward the stock. The Fund’s position in Microsoft, a software and IT services company, also helped results. Microsoft performed well during the period due to a more resilient personal computer spending environment, continued growth in enterprise Office 365 adoption, a rebound in growth of its legacy server business and sustained growth of its Azure cloud offering. We remain positive on Microsoft as the company transitions to the cloud and expands its share of IT spending.
In health care, biotechnology firm Celgene’s strong performance during the review period was mostly driven by the U.S. presidential election. As an industry, biotechnology had underperformed the broader market leading into the November 2016 election as consensus expectations were for a Hillary Clinton victory. With the election of Donald Trump, and more importantly, the Republican sweep in Congress, investors viewed the risk of government intervention on drug pricing as diminished. Mettler-Toledo International’s favorable stock performance reflected the strong results the company delivered in 2016 and the positive 2017 outlook it provided. Mettler’s product portfolio, commercial execution and a successful implementation of a new enterprise resource planning system have enhanced its results. The market has rewarded the level of commercial execution and the optimism about continued results from the consistent reinvestment into the business.
In contrast, the consumer staples sector detracted from the Fund’s absolute performance during the reporting period.3 CVS Health stock underperformed in the period due to increasing scrutiny on the pharmacy benefit manager business model, as well as uncertainty on the drug pricing environment. We believe the vertically integrated business model of CVS Health as a retailer and pharmacy benefits manager offers competitive advantages that could enable the company to capture an increasing share of health care spending in the long term. Monster Beverage also hindered results. The company experienced several production issues in the U.S., which led the company to miss consensus expectations. Additionally, its innovation rollout has been initially slower than expected. However, we view these issues as transitory and expect growth to reaccelerate.
Elsewhere, risk management solutions provider Dun & Bradstreet hindered results in the industrials sector. The company’s management is pursuing a multi-year organic growth enhancement strategy by leveraging its commercial
2. The industrials sector comprises capital goods, commercial and professional services, and transportation in the SOI. The IT sector comprises technology hardware
equipment, software and services, and semiconductors and semiconductor equipment in the SOI. The health care sector comprises health care equipment and services and
pharmaceuticals, biotechnology and life sciences in the SOI.
3. The consumer staples sector comprises food, beverage and tobacco; food and staples retailing; and household and personal products in the SOI.
See www.franklintempletondatasources.com for additional data provider information.
franklintempleton.com
Semiannual Report 11
FRANKLIN GROWTH FUND
credit and contact data in new use cases. This strategy had shown good progress early in 2016, but a sequential deceleration in third-quarter results and the disclosure of a change in the company’s distribution arrangement with partner Salesforce.com in the fourth-quarter results were both setbacks to organic growth improvement. In February, the company’s 2017 guidance was weaker than expected, partly due to investments the business is making to offset the slowing growth from the Salesforce.com partnership. In addition, Dun & Bradstreet acquired a business in 2017’s first quarter that resulted in a credit rating downgrade by S&P and a higher forecasted interest expense in 2017 than was previously expected.
In IT, Palo Alto Networks detracted from results. Palo Alto Networks struggled with sales execution issues during the October 2016 and January 2017 fiscal quarters after a large and ill-conceived sales reorganization during the October quarter. We believe the company is also struggling to move down market as Cisco has improved its security portfolio and provided greater incentives to its channel. Although we remain confident that Palo Alto Networks is attractively valued, we have taken a more conservative view on how large this company can be in the future.
In health care, shares of Edwards Lifesciences, a producer of artificial heart valves and hemodynamic monitoring, fell as investors took profits in the medical technology industry in late 2016 following strong performance that was driven by a trend of accelerating sales growth that failed to persist in the September quarter. The company’s stock also was negatively affected by the U.S. election, which spurred optimism for accelerating economic growth that led to an investor rotation toward more economically sensitive sectors.
Thank you for your participation in Franklin Growth Fund. We look forward to serving your future investment needs.

The foregoing information reflects our analysis, opinions and portfolio holdings as of March 31, 2017, the end of the reporting period. The way we implement our main investment strategies and the resulting portfolio holdings may change depending on factors such as market and economic conditions. These opinions may not be relied upon as investment advice or an offer for a particular security. The information is not a complete analysis of every aspect of any market, country, industry, security or the Fund. Statements of fact are from sources considered reliable, but the investment manager makes no representation or warranty as to their completeness or accuracy. Although historical performance is no guarantee of future results, these insights may help you understand our investment management philosophy.
CFA® is a trademark owned by CFA Institute.
12 Semiannual Report
franklintempleton.com
FRANKLIN GROWTH FUND
Performance Summary as of March 31, 2017
The performance table does not reflect any taxes that a shareholder would pay on Fund dividends, capital gain distributions, if any, or any realized gains on the sale of Fund shares. Total return reflects reinvestment of the Fund’s dividends and capital gain distributions, if any, and any unrealized gains or losses. Your dividend income will vary depending on dividends or interest paid by securities in the Fund’s portfolio, adjusted for operating expenses of each class. Capital gain distributions are net profits realized from the sale of portfolio securities.
Performance as of 3/31/171
Cumulative total return excludes sales charges. Average annual total return includes maximum sales charges. Sales charges will vary depending on the size of the investment and the class of share purchased. The maximum is 5.75% and the minimum is 0%. Class A: 5.75% maximum initial sales charge; Advisor Class: no sales charges. For other share classes, visit franklintempleton.com.
| Cumulative | Average Annual | |||
| Share Class | Total Return2 | Total Return3 | ||
| A | ||||
| 6-Month | +9.61 | % | +3.31 | % |
| 1-Year | +17.09 | % | +10.35 | % |
| 5-Year | +78.91 | % | +11.01 | % |
| 10-Year | +121.38 | % | +7.63 | % |
| Advisor | ||||
| 6-Month | +9.74 | % | +9.74 | % |
| 1-Year | +17.36 | % | +17.36 | % |
| 5-Year | +81.16 | % | +12.62 | % |
| 10-Year | +126.99 | % | +8.54 | % |
Performance data represent past performance, which does not guarantee future results. Investment return and principal value will fluctuate, and you may have a gain or loss when you sell your shares. Current performance may differ from figures shown. For most recent month-end performance, go to franklintempleton.com or call (800) 342-5236.
See page 14 for Performance Summary footnotes.
franklintempleton.com
Semiannual Report 13
| FRANKLIN GROWTH FUND | ||||||||
| PERFORMANCE SUMMARY | ||||||||
| Distributions (10/1/16–3/31/17) | ||||||||
| Net Investment | Long-Term | |||||||
| Share Class | Income | Capital Gain | Total | |||||
| A | $ | 0.3928 | $ | 2.4961 | $ | 2.8889 | ||
| C | — | $ | 2.4961 | $ | 2.4961 | |||
| R | $ | 0.2050 | $ | 2.4961 | $ | 2.7011 | ||
| R6 | $ | 0.7176 | $ | 2.4961 | $ | 3.2137 | ||
| Advisor | $ | 0.6071 | $ | 2.4961 | $ | 3.1032 | ||
| Total Annual Operating Expenses4 | ||||||||
| Share Class | With Waiver | Without Waiver | ||||||
| A | 0.88 | % | 0.90 | % | ||||
| Advisor | 0.63 | % | 0.65 | % | ||||
Each class of shares is available to certain eligible investors and has different annual fees and expenses, as described in the prospectus.
All investments involve risks, including possible loss of principal. Historically, the Fund has focused on larger companies. The Fund may also invest in small,
relatively new and/or unseasoned companies, which involves additional risks, as the price of these securities can be volatile, particularly over the short term. The
Fund may focus on particular sectors of the market from time to time, which can carry greater risks of adverse developments in such sectors. In addition, the
Fund may invest up to 40% of its net assets in stocks of foreign companies, which involve special risks, including currency fluctuations and economic as well as
political uncertainty. The Fund is actively managed but there is no guarantee that the manager’s investment decisions will produce the desired results. The Fund’s
prospectus also includes a description of the main investment risks.
1. The Fund has a fee waiver associated with any investment it makes in a Franklin Templeton money fund and/or other Franklin Templeton fund, contractually guaranteed
through 1/31/18. Fund investment results reflect the fee waiver; without this waiver, the results would have been lower.
2. Cumulative total return represents the change in value of an investment over the periods indicated.
3. Average annual total return represents the average annual change in value of an investment over the periods indicated. Return for less than one year, ifany,hasnotbeen
annualized.
4. Figures are as stated in the Fund’s current prospectus and may differ from the expense ratios disclosed in the Your Fund’s Expenses and Financial Highlights sections in this
report. In periods of market volatility, assets may decline significantly, causing total annual Fund operating expenses to become higher than the figures shown.
14 Semiannual Report
franklintempleton.com
FRANKLIN GROWTH FUND
Your Fund’s Expenses
As a Fund shareholder, you can incur two types of costs: (1) transaction costs, including sales charges (loads) on Fund purchases and redemptions; and (2) ongoing Fund costs, including management fees, distribution and service (12b-1) fees, and other Fund expenses. All mutual funds have ongoing costs, sometimes referred to as operating expenses. The table below shows ongoing costs of investing in the Fund and can help you understand these costs and compare them with those of other mutual funds. The table assumes a $1,000 investment held for the six months indicated.
Actual Fund Expenses
The table below provides information about actual account values and actual expenses in the columns under the heading “Actual.” In these columns the Fund’s actual return, which includes the effect of Fund expenses, is used to calculate the “Ending Account Value” for each class of shares. You can estimate the expenses you paid during the period by following these steps (of course, your account value and expenses will differ from those in this illustration): Divide your account value by $1,000 (if your account had an $8,600 value, then $8,600 ÷ $1,000 = 8.6). Then multiply the result by the number in the row for your class of shares under the headings “Actual” and “Expenses Paid During Period” (if Actual Expenses Paid During Period were $7.50, then 8.6 x $7.50 = $64.50). In this illustration, the actual expenses paid this period are $64.50.
Hypothetical Example for Comparison with Other Funds
Under the heading “Hypothetical” in the table, information is provided about hypothetical account values and hypothetical expenses based on the Fund’s actual expense ratio and an assumed rate of return of 5% per year before expenses, which is not the Fund’s actual return. This information may not be used to estimate the actual ending account balance or expenses you paid for the period, but it can help you compare ongoing costs of investing in the Fund with those of other funds. To do so, compare this 5% hypothetical example for the class of shares you hold with the 5% hypothetical examples that appear in the shareholder reports of other funds.
Please note that expenses shown in the table are meant to highlight ongoing costs and do not reflect any transactional costs. Therefore, information under the heading “Hypothetical” is useful in comparing ongoing costs only, and will not help you compare total costs of owning different funds. In addition, if transactional costs were included, your total costs would have been higher.
| Actual | Hypothetical | |||||||||||
| (actual return after expenses) | (5% annual return before expenses) | |||||||||||
| Expenses | Expenses | Net | ||||||||||
| Beginning | Ending | Paid During | Ending | Paid During | Annualized | |||||||
| Share | Account | Account | Period | Account | Period | Expense | ||||||
| Class | Value 10/1/16 | Value 3/31/17 | 10/1/16–3/31/171,2 | Value 3/31/17 | 10/1/16–3/31/171,2 | Ratio2 | ||||||
| A | $ | 1,000 | $ | 1,096.10 | $ | 4.49 | $ | 1,020.64 | $ | 4.33 | 0.86 | % |
| C | $ | 1,000 | $ | 1,091.90 | $ | 8.40 | $ | 1,016.90 | $ | 8.10 | 1.61 | % |
| R | $ | 1,000 | $ | 1,094.60 | $ | 5.80 | $ | 1,019.40 | $ | 5.59 | 1.11 | % |
| R6 | $ | 1,000 | $ | 1,098.20 | $ | 2.35 | $ | 1,022.69 | $ | 2.27 | 0.45 | % |
| Advisor | $ | 1,000 | $ | 1,097.40 | $ | 3.19 | $ | 1,021.89 | $ | 3.07 | 0.61 | % |
1. Expenses are equal to the annualized expense ratio for the six-month period as indicated above–in the far right column–multiplied by the simple average account value
over the period indicated, and then multiplied by 182/365 to reflect the one-half year period.
2. Reflects expenses after fee waivers and expense reimbursements. Does not include acquired fund fees and expenses.
franklintempleton.com
Semiannual Report 15
Franklin Income Fund
This semiannual report for Franklin Income Fund covers the period ended March 31, 2017.
Your Fund’s Goal and Main Investments
The Fund seeks to maximize income, while maintaining prospects for capital appreciation by investing, under normal market conditions, in a diversified portfolio of debt and equity securities.
Performance Overview
The Fund’s Class A shares delivered a cumulative total return of +7.68% for the six months under review. In comparison, the Fund’s equity benchmark, the Standard & Poor’s 500 Index (S&P 500), which is a broad measure of U.S. stock performance, returned +10.12%.1 The Fund’s fixed income benchmark, the Bloomberg Barclays U.S. Aggregate Bond Index, which tracks the U.S. investment-grade, taxable bond market, posted a -2.18% total return.1 The Fund’s peers, as measured by the Lipper Mixed-Asset Target Allocation Moderate Funds Classification Average, which consists of funds chosen by Lipper that, by practice, maintain a mix of 40% to 60% equity securities, with the remainder in bonds and cash, returned +4.33%.2 You can find the Fund’s long-term performance data in the Performance Summary beginning on page 20.
Performance data represent past performance, which does not guarantee future results. Investment return will fluctuate. Current performance may differ from figures shown. For most recent month-end performance, go to franklintempleton.com or call (800) 342-5236.
Investment Strategy
By generally performing independent analysis of debt, convertible and equity securities, we search for undervalued or out-of-favor securities we believe offer opportunities for income today and significant growth tomorrow. We consider such factors as a company’s experience and managerial strength; its cash flow potential and profitability; its competitive positioning and advantages; its responsiveness to changes in interest rates and business conditions; debt maturity schedules and borrowing requirements; a company’s changing
| Distributions* | |||||
| 10/1/16–3/31/17 | |||||
| Distributions per Share (cents) | |||||
| Advisor | |||||
| Month | Class A | Class C | Class R | Class R6 | Class |
| October | 1.00 | 0.90 | 0.93 | 1.03 | 1.02 |
| November | 1.00 | 0.90 | 0.93 | 1.03 | 1.02 |
| December | 1.00 | 0.90 | 0.93 | 1.03 | 1.02 |
| January | 1.00 | 0.90 | 0.93 | 1.03 | 1.02 |
| February | 1.00 | 0.90 | 0.93 | 1.03 | 1.02 |
| March | 1.00 | 0.90 | 0.93 | 1.03 | 1.02 |
| Total | 6.00 | 5.40 | 5.58 | 6.18 | 6.12 |
*The distribution amount is the sum of all distributions to shareholders for the period
shown and includes only estimated tax-basis net investment income. All Fund
distributions will vary depending upon current market conditions, and past
distributions are not indicative of future trends.
financial condition and market recognition of the change; and a security’s relative value based on such factors as anticipated cash flow, interest or dividend coverage, asset coverage and earnings.
Manager’s Discussion
The Fund continued to pursue its long-term strategy of investing across asset classes to generate attractive income, while seeking opportunities for capital appreciation. During the six months under review, our actions and movements in equity and fixed income markets resulted in a modest decline in equity holdings from 57.8% to 55.7%, while fixed income holdings were relatively flat at 40.1%. The flexibility to use market volatility to invest in different asset classes remains a core strategy of the Fund.
In the months following the U.S. presidential election, equity markets have performed well. The prospects of higher interest rates, an accelerating economy that could benefit from less regulation, the possibility of a large infrastructure bill and a focus on job creation all contributed to investor optimism and pushed equity values higher.
Among equities, the largest contributor during the period under review was the financials sector as the Federal Reserve raised interest rates in December and inflation expectations rose in the
1. Source: Morningstar.
2. Source: Lipper, a Thomson Reuters Company. For the six-month period ended 3/31/17, this category consisted of 591 funds. Lipper calculations do not include sales charges
or expense subsidization by a fund’s manager. The Fund’s performance relative to the average may have differed if these and other factors had been considered. The indexes
are unmanaged and include reinvestment of any income or distributions. They do not reflect any fees, expenses or sales charges. One cannot invest directly in an index, and an
index is not representative of the Fund’s portfolio.
See www.franklintempletondatasources.com for additional provider information.
The dollar value, number of shares or principal amount, and names of all portfolio holdings are listed in the Fund’s Statement of Investments (SOI).
The SOI begins on page 57.
16 Semiannual Report
franklintempleton.com
FRANKLIN INCOME FUND
| Portfolio Composition | ||
| 3/31/17 | ||
| % of Total | ||
| Net Assets | ||
| Equity* | 55.7 | % |
| Energy | 9.3 | % |
| Financials** | 8.2 | % |
| Health Care | 7.0 | % |
| Utilities | 6.0 | % |
| Information Technology | 5.7 | % |
| Industrials | 5.0 | % |
| Materials | 4.4 | % |
| Consumer Discretionary | 4.2 | % |
| Consumer Staples | 3.8 | % |
| Telecommunication Services | 1.3 | % |
| Real Estate | 0.8 | % |
| Fixed Income*** | 40.1 | % |
| Health Care | 8.5 | % |
| Energy | 7.3 | % |
| Consumer Discretionary | 5.9 | % |
| Financials | 4.5 | % |
| Telecommunication Services | 3.0 | % |
| Utilities | 2.9 | % |
| Industrials | 2.4 | % |
| Materials | 2.4 | % |
| Information Technology | 2.3 | % |
| Real Estate | 0.5 | % |
| Consumer Staples | 0.4 | % |
| Short-Term Investments & Other Net Assets | 4.2 | % |
*Includes convertible bonds.
**Includes options purchased.
***Includes senior floating rate interests.
fourth quarter. The Fund began to increase its weightings across the sector in early 2016 as we believed that fears of slower growth and deteriorating credit concerns would dissipate and that financial companies would continue to grow book value. Our holdings in global banks JPMorgan Chase and Wells Fargo were the largest contributors to performance. JPMorgan reported strong performance during the period helped by results within their fixed income currencies and commodities business and lower legal costs, while strong performance at Wells Fargo was driven by mortgage-origination income. Earnings at both companies benefited from improved net interest income, which resulted from the increase in long-term interest rates, while investor optimism about accelerating economic growth also supported share gains. Similarly, insurance companies Metlife and AXA were also significant contributors to performance.
The materials sector contributed to Fund performance with strong results from chemical manufacturers Dow Chemical and BASF. BASF continued to show healthy cash flow generation and a diversified portfolio across products and geographies, which enabled favorable product development. Similarly, Dow has shown consistently promising results in recent years and their pending merger with DuPont could drive additional value over time. A recovery in commodity prices and ongoing cost containment efforts lifted shares of mining conglomerate Rio Tinto.
In recent years, the Fund has seen an increasing number of opportunities in the information technology sector, a sector which saw solid gains during the period under review. Microsoft was the largest contributor as it posted two impressive quarters within the period, showing continued strong execution in the shift of enterprise customers to their Office 365 platform and robust growth in their cloud-computing solution Azure. Apple was also a standout contributor as iPhone sales continued to beat analyst expectations and their services business continued to grow.
| Top Five Equity Holdings | ||
| 3/31/17 | ||
| Company | % of Total | |
| Sector/Industry | Net Assets | |
| Royal Dutch Shell PLC | 2.2 | % |
| Energy | ||
| Wells Fargo & Co. | 1.7 | % |
| Financials | ||
| The Dow Chemical Co. | 1.5 | % |
| Materials | ||
| BASF SE | 1.4 | % |
| Materials | ||
| General Electric Co. | 1.3 | % |
| Industrials |
Other significant contributors included the Fund’s performance within the industrials sector as companies benefited from anticipated prospects of an improvement in the economy, the potential for a large infrastructure spending measure and increased focus by the Trump administration on bringing manufacturing jobs to the US.
The telecommunication services sector was the one sector in equities that detracted from performance, albeit only in a small way. Individual equity positions that detracted from performance included the retail chain Target, in the consumer discretionary sector. Target’s fourth quarter results were negatively impacted by softer traffic in-store and its weak guidance for 2017 was emblematic of many brick-and-mortar retailer’s struggles in competing with online competitors.
franklintempleton.com
Semiannual Report 17
FRANKLIN INCOME FUND
Within consumer staples, Anheuser Busch saw soft results in their South American business overshadow strength in Mexico and an improvement in their stable U.S. business. Within the equity energy sector, Occidental Petroleum suffered from near-term production disruptions, while Halcon Resources looked to regain investor support after emerging from bankruptcy. The company made a transformative equity-funded acquisition into the Permian Basin of west Texas in January of 2017 at what we considered an attractive valuation. However, given this is a new basin for the company, we believe the equity market is looking for solid execution before giving the company credit for their expanding and improving asset footprint.
Other declines within individual equity positions included Teva Pharmaceuticals, which had a soft quarterly performance and saw patent challenges hurt its share price performance. Additional health care holdings, AstraZeneca and Gilead, were also impacted by slower sales trends in key products.
The Fund continues to use equity derivatives to seek to mitigate volatility and enhance total returns. No individual derivative positions significantly impacted performance.
| Top Five Fixed Income Holdings | ||
| and Senior Floating Rate Interests* | ||
| 3/31/17 | ||
| Company | % of Total | |
| Sector/Industry | Net Assets | |
| CHS/Community Health Systems Inc. | 2.5 | % |
| Health Care | ||
| Chesapeake Energy Corp. | 2.1 | % |
| Energy | ||
| Tenet Healthcare Corp. | 2.0 | % |
| Health Care | ||
| JPMorgan Chase & Co. | 1.7 | % |
| Financials | ||
| iHeartCommunications Inc. | 1.5 | % |
| Consumer Discretionary | ||
| *Does not include convertible bonds. |
Fixed income holdings, particularly those in the energy sector, added to Fund performance. The Fund seeks opportunities to engage with companies to help them solve potential financing needs such as reducing debt and extending maturities. These situations can lead to improved financial flexibility for the company, while allowing the Fund to participate in securities that have an attractive income and total return profile. Strong energy sector contributors during the period, Weatherford, Chesapeake Energy and W&T Offshore were among the many situations where the Fund has worked closely with a company to achieve those goals. For the sixth-month period, a more constructive commodity price environment that served as a tailwind for the industry as a whole and the decision by the Organization of Petroleum Exporting Countries to remove production from the market in November provided catalysts that helped bond prices. Weatherford, an oil and gas service company, had several positive announcements after accessing the capital markets and bolstering their liquidity. It announced two strategic joint ventures with solid counterparties, outlined a credible debt reduction strategy, as well as hired a new chief executive officer from bellwether Halliburton. The market appeared to have gained confidence in Weatherford’s ability to pay down their long-term debt, causing the bonds to rally. Similarly, Chesapeake executed particularly well in the past six months by accessing the capital markets, selling non-core assets and addressing near-term maturities.
Within the telecommunication services sector, Sprint bonds performed well as confidence in its operational turnaround continued to increase, bolstered by positive earnings performance in the September and December quarters. In addition, there was increased speculation that Sprint would be involved in an industry consolidation. In the consumer discretionary sector, our position with iHeart Communications contributed to performance, as investors gained comfort from the company’s operating results, as well as from a bond exchange offer to address balance sheet and debt maturities. Our position in Echostar, the parent company of DISH, a global provider of satellite communications, also performed well within this category.
The fixed income financial sector, particularly banks, continued to perform well due to expectations of higher rates and a steeper yield curve. Our large positions in JP Morgan and Citigroup benefited, particularly in the first quarter. JPMorgan is one of several examples of how the Fund invests across the capital structure of a company we view positively. Individual fixed income health care positions that significantly contributed to Fund performance included Tenet Healthcare, which outperformed as hospital names rallied after concerns about the potential repeal of the Affordable Care Act receded. Tenet’s USPI and Conifer divisions both performed well.
Individual fixed income health care positions that significantly detracted from performance included pharmaceutical companies Concordia and Valeant Pharmaceuticals. Concordia underperformed during the period, as investors became concerned about legislative and regulatory actions targeting some generic companies in the U.K. Earnings were also weak with several products encountering competition, significant
18 Semiannual Report
franklintempleton.com
FRANKLIN INCOME FUND
foreign exchange headwinds, and poor commentary around 2017 guidance. Valeant was a modest underperformer during the period, as 2017 guidance came in lower than expectations and asset sales took longer to materialize than some had hoped. After rallying in February, longer dated Valeant bonds declined in March after a refinancing that pushed some nearer-term maturities out to 2022.
Other individual fixed income detractors included retailers, which was a major detractor in both high yield bonds and leveraged loans during the past six months. The sector underperformed during the period, as investors worried about the accelerating decline in sales and the higher fixed cost structure that characterizes traditional brick and mortar retailers, as consumers increasingly shop online. Department stores such as Belk and Neiman Marcus in particular languished as well as apparel companies. Retailers with meaningful exposure in the oil and gas markets (e.g. Texas, Oklahoma and Louisiana) also suffered due to consumer weakness, this included sporting goods store Academy and Neiman Marcus. The Fund has generally underweighted retailers with little exposure to high yield bonds. Our modest exposure has been mostly in senior secured loans, which we believe provide some downside protection due to their potential for asset recovery.
Thank you for your continued participation in Franklin Income Fund. We look forward to serving your future investment needs.

The foregoing information reflects our analysis, opinions and portfolio holdings as of March 31, 2017, the end of the reporting period. The way we implement our main investment strategies and the resulting portfolio holdings may change depending on factors such as market and economic conditions. These opinions may not be relied upon as investment advice or an offer for a particular security. The information is not a complete analysis of every aspect of any market, country, industry, security or the Fund. Statements of fact are from sources considered reliable, but the investment manager makes no representation or warranty as to their completeness or accuracy. Although historical performance is no guarantee of future results, these insights may help you understand our investment management philosophy.
Richard Hsu is a vice president, portfolio manager and research analyst in the Franklin Templeton Fixed Income Group. He is also a member of the firm’s Fixed Income Policy Committee. Mr. Hsu assists in the managing of bank loan credit strategies and research for the Franklin Income Fund and other corporate credit products that have allocations to floating rate debt. Mr. Hsu joined the firm in 1996 and helped create the floating rate bank loan group in 1997. Mr. Hsu holds both a B.A. with Honors and M.A. from Stanford University. He is a Chartered Financial Analyst (CFA) charterholder, as well as a member of the CFA Society of San Francisco (CFASF) and the CFA Institute.
Todd Brighton is a vice president, portfolio manager and research analyst for Franklin Equity Group. Mr. Brighton analyzes equity and equity-linked investments for the core/hybrid team and specializes in the development of volatility-based strategies. Mr. Brighton joined Franklin Templeton Investments in 2000. His prior responsibilities included the trading of equities, equity derivatives, convertibles and high yield bonds. Mr. Brighton earned his B.S. degree in Managerial Economics from the University of California, Davis. He is a Chartered Financial Analyst (CFA) charterholder and a member of the CFA Institute and the CFA Society of San Francisco.
franklintempleton.com
Semiannual Report 19
FRANKLIN INCOME FUND
Performance Summary as of March 31, 2017
The performance tables do not reflect any taxes that a shareholder would pay on Fund dividends, capital gain distributions, if any, or any realized gains on the sale of Fund shares. Total return reflects reinvestment of the Fund’s dividends and capital gain distributions, if any, and any unrealized gains or losses. Your dividend income will vary depending on dividends or interest paid by securities in the Fund’s portfolio, adjusted for operating expenses of each class. Capital gain distributions are net profits realized from the sale of portfolio securities.
Performance as of 3/31/171
Cumulative total return excludes sales charges. Average annual total return includes maximum sales charges. Sales charges will vary depending on the size of the investment and the class of share purchased. The maximum is 4.25% and the minimum is 0%. Class A: 4.25% maximum initial sales charge; Advisor Class: no sales charges. For other share classes, visit franklintempleton.com.
| Cumulative | Average Annual | |||
| Share Class | Total Return2 | Total Return3 | ||
| A | ||||
| 6-Month | +7.68 | % | +3.10 | % |
| 1-Year | +18.02 | % | +13.20 | % |
| 5-Year | +42.18 | % | +6.33 | % |
| 10-Year | +66.60 | % | +4.78 | % |
| Advisor | ||||
| 6-Month | +7.80 | % | +7.80 | % |
| 1-Year | +17.77 | % | +17.77 | % |
| 5-Year | +43.61 | % | +7.51 | % |
| 10-Year | +68.94 | % | +5.38 | % |
| 30-Day Standardized Yield5 | ||||||
| Distribution | ||||||
| Share Class | Rate4 | (with waiver) | (without waiver) | |||
| A | 4.88 | % | 3.40 | % | 3.39 | % |
| Advisor | 5.23 | % | 3.70 | % | 3.70 | % |
Performance data represent past performance, which does not guarantee future results. Investment return and principal value will fluctuate, and you may have a gain or loss when you sell your shares. Current performance may differ from figures shown. For most recent month-end performance, go to franklintempleton.com or call (800) 342-5236.
See page 21 for Performance Summary footnotes.
20 Semiannual Report
franklintempleton.com
| FRANKLIN INCOME FUND |
| PERFORMANCE SUMMARY |
| Net Asset Value | ||||||
| Share Class (Symbol) | 3/31/17 | 9/30/16 | Change | |||
| A (FKINX) | $ | 2.36 | $ | 2.25 | +$0.11 | |
| C (FCISX) | $ | 2.38 | $ | 2.27 | +$0.11 | |
| R (FISRX) | $ | 2.31 | $ | 2.21 | +$0.10 | |
| R6 (FNCFX) | $ | 2.34 | $ | 2.23 | +$0.11 | |
| Advisor (FRIAX) | $ | 2.34 | $ | 2.23 | +$0.11 | |
| Distributions (10/1/16–3/31/17) | ||||||
| Net Investment | ||||||
| Share Class | Income | |||||
| A | $ | 0.0600 | ||||
| C | $ | 0.0540 | ||||
| R | $ | 0.0558 | ||||
| R6 | $ | 0.0618 | ||||
| Advisor | $ | 0.0612 | ||||
| Total Annual Operating Expenses6 | ||||||
| Share Class | ||||||
| A | 0.61 | % | ||||
| Advisor | 0.46 | % | ||||
Each class of shares is available to certain investors and has different annual fees and expenses, as described in the prospectus.
All investments involve risks, including possible loss of principal. The Fund’s share price and yield will be affected by interest rate movements. Bond prices
generally move in the opposite direction of interest rates. Thus, as prices of bonds in the Fund adjust to a rise in interest rates, the Fund’s share price may
decline. Changes in the financial strength of a bond issuer or in a bond’s credit rating may affect its value. The Fund’s portfolio includes a substantial portion of
higher yielding, lower rated corporate bonds because of the relatively higher yields they offer. Floating-rate loans are lower rated, higher yielding instruments,
which are subject to increased risk of default and can potentially result in loss of principal. These securities carry a greater degree of credit risk relative to
investment-grade securities. Stock prices fluctuate, sometimes rapidly and dramatically, due to factors affecting individual companies, particular industries or
sectors, or general market conditions. The Fund is actively managed but there is no guarantee that the manager’s investment decisions will produce the desired
results. The Fund’s prospectus also includes a description of the main investment risks.
1. The Fund has a fee waiver associated with any investment it makes in a Franklin Templeton money fund and/or other Franklin Templeton fund, contractually guaranteed
through 1/31/18. Fund investment results reflect the fee waiver; without this waiver, the results would have been lower.
2. Cumulative total return represents the change in value of an investment over the periods indicated.
3. Average annual total return represents the average annual change in value of an investment over the periods indicated. Return for less than one year, ifany,hasnotbeen
annualized.
4. Distribution rate is based on an annualization of the respective class’s March dividend and the maximum offering price (NAV for Advisor Class) per share on 3/31/17.
5. The Fund’s 30-day standardized yield is calculated over a trailing 30-day period using the yield to maturity on bonds and/or the dividends accrued on stocks. It may not equal
the Fund’s actual income distribution rate, which reflects the Fund’s past dividends paid to shareholders.
6. Figures are as stated in the Fund’s current prospectus and may differ from the expense ratios disclosed in the Your Fund’s Expenses and Financial Highlights sections in this
report. In periods of market volatility, assets may decline significantly, causing total annual Fund operating expenses to become higher than the figures shown.
franklintempleton.com
Semiannual Report 21
FRANKLIN INCOME FUND
Your Fund’s Expenses
As a Fund shareholder, you can incur two types of costs: (1) transaction costs, including sales charges (loads) on Fund purchases and redemptions; and (2) ongoing Fund costs, including management fees, distribution and service (12b-1) fees, and other Fund expenses. All mutual funds have ongoing costs, sometimes referred to as operating expenses. The table below shows ongoing costs of investing in the Fund and can help you understand these costs and compare them with those of other mutual funds. The table assumes a $1,000 investment held for the six months indicated.
Actual Fund Expenses
The table below provides information about actual account values and actual expenses in the columns under the heading “Actual.” In these columns the Fund’s actual return, which includes the effect of Fund expenses, is used to calculate the “Ending Account Value” for each class of shares. You can estimate the expenses you paid during the period by following these steps (of course, your account value and expenses will differ from those in this illustration): Divide your account value by $1,000 (if your account had an $8,600 value, then $8,600 ÷ $1,000 = 8.6). Then multiply the result by the number in the row for your class of shares under the headings “Actual” and “Expenses Paid During Period” (if Actual Expenses Paid During Period were $7.50, then 8.6 x $7.50 = $64.50). In this illustration, the actual expenses paid this period are $64.50.
Hypothetical Example for Comparison with Other Funds
Under the heading “Hypothetical” in the table, information is provided about hypothetical account values and hypothetical expenses based on the Fund’s actual expense ratio and an assumed rate of return of 5% per year before expenses, which is not the Fund’s actual return. This information may not be used to estimate the actual ending account balance or expenses you paid for the period, but it can help you compare ongoing costs of investing in the Fund with those of other funds. To do so, compare this 5% hypothetical example for the class of shares you hold with the 5% hypothetical examples that appear in the shareholder reports of other funds.
Please note that expenses shown in the table are meant to highlight ongoing costs and do not reflect any transactional costs. Therefore, information under the heading “Hypothetical” is useful in comparing ongoing costs only, and will not help you compare total costs of owning different funds. In addition, if transactional costs were included, your total costs would have been higher.
| Actual | Hypothetical | |||||||||||
| (actual return after expenses) | (5% annual return before expenses) | |||||||||||
| Expenses | Expenses | Net | ||||||||||
| Beginning | Ending | Paid During | Ending | Paid During | Annualized | |||||||
| Share | Account | Account | Period | Account | Period | Expense | ||||||
| Class | Value 10/1/16 | Value 3/31/17 | 10/1/16–3/31/171,2 | Value 3/31/17 | 10/1/16–3/31/171,2 | Ratio2 | ||||||
| A | $ | 1,000 | $ | 1,076.80 | $ | 3.21 | $ | 1,021.84 | $ | 3.13 | 0.62 | % |
| C | $ | 1,000 | $ | 1,073.20 | $ | 5.79 | $ | 1,019.35 | $ | 5.64 | 1.12 | % |
| R | $ | 1,000 | $ | 1,071.50 | $ | 5.01 | $ | 1,020.09 | $ | 4.89 | 0.97 | % |
| R6 | $ | 1,000 | $ | 1,078.30 | $ | 2.02 | $ | 1,022.99 | $ | 1.97 | 0.39 | % |
| Advisor | $ | 1,000 | $ | 1,078.00 | $ | 2.43 | $ | 1,022.59 | $ | 2.37 | 0.47 | % |
1. Expenses are equal to the annualized expense ratio for the six-month period as indicated above–in the far right column–multiplied by the simple average account value
over the period indicated, and then multiplied by 182/365 to reflect the one-half year period.
2. Reflects expenses after fee waivers and expense reimbursements. Does not include acquired fund fees and expenses.
22 Semiannual Report
franklintempleton.com
Franklin U.S. Government Securities Fund
This semiannual report for Franklin U.S. Government Securities Fund covers the period ended March 31, 2017.
Your Fund’s Goal and Main Investments
The Fund seeks income by investing at least 80% of its net assets in U.S. government securities. The Fund presently invests substantially all of its assets in Government National Mortgage Association obligations (Ginnie Maes).
Since 1983, the Fund has invested substantially in Ginnie Mae securities, which carry a guarantee backed by the full faith and credit of the U.S. government as to the timely payment of interest and principal.1 Issued by the Government National Mortgage Association (GNMA), Ginnie Maes have been among the highest yielding U.S. government obligations available.
| Portfolio Composition | ||
| Based on Total Net Assets as of 3/31/17 | ||
| GNMA | 98.7 | % |
| Short-Term Investments & Other Net Assets | 1.3 | % |
Performance Overview
The Fund’s Class A shares generated a -1.48% cumulative total return for the six months under review. In comparison, the Fund’s peers, as measured by the Lipper GNMA Funds Classification Average, which consists of funds chosen by Lipper that invest primarily in GNMAs, posted a -1.31% total return.2 The Bloomberg Barclays U.S. Government Index: Intermediate Component, the intermediate component of the Bloomberg Barclays U.S. Government Index, returned -1.65% for the same period.3 You can find the Fund’s long-term performance data in the Performance Summary beginning on page 25.
Performance data represent past performance, which does not guarantee future results. Investment return and principal value will fluctuate, and you may have a gain or loss when you sell your shares. Current performance may differ from figures shown. For most recent month-end performance, go to franklintempleton.com or call (800) 342-5236.
Investment Strategy
We currently invest the Fund’s assets predominantly in GNMA obligations. We analyze securities using proprietary models to help us identify attractive investment opportunities. The Fund’s short-term investments may include short-term government securities and cash or cash equivalents.
| Distributions* | |||||
| 10/1/16–3/31/17 | |||||
| Distributions per Share (cents) | |||||
| Advisor | |||||
| Month | Class A | Class C | Class R | Class R6 | Class |
| October | 1.69 | 1.42 | 1.50 | 1.84 | 1.77 |
| November | 1.51 | 1.25 | 1.34 | 1.66 | 1.59 |
| December | 1.61 | 1.35 | 1.43 | 1.76 | 1.69 |
| January | 1.60 | 1.34 | 1.41 | 1.75 | 1.68 |
| February | 1.63 | 1.39 | 1.46 | 1.77 | 1.70 |
| March | 1.59 | 1.33 | 1.38 | 1.74 | 1.67 |
| Total | 9.63 | 8.08 | 8.52 | 10.52 | 10.10 |
*The distribution amount is the sum of all distributions to shareholders for the period
shown and includes only estimated tax-basis net investment income. All Fund
distributions will vary depending upon current market conditions, and past
distributions are not indicative of future trends.
Manager’s Discussion
U.S. economic indicators were generally encouraging during the reporting period. Steady growth in the services sector created new jobs and boosted employment levels. Retail sales grew for most of the period. Low energy prices pulled inflation lower. In this environment, home sales grew for most of the period, but slowed in February because of low supply levels and rising prices.
GNMA mortgage-backed securities (MBS) produced negative excess returns and underperformed Treasuries.
In our view, agency MBS remained fully valued. The Fed’s participation in agency MBS has, in our view, kept mortgage valuations high. Questions persist about the demand source for agency MBS once the Fed moves closer to ceasing reinvestment in MBS. We felt demand from banks, mortgage
1. Securities owned by the Fund, but not shares of the Fund, are guaranteed by the U.S. government, its agencies or instrumentalities as to timely payment of principal and
interest. The Fund’s yield and share price are not guaranteed and will vary with market conditions.
2. Source: Lipper, a Thomson Reuters Company. For the six-month period ended 3/31/17, there were 63 funds in this category. Lipper calculations do not include sales charges
or expense subsidization by a fund’s manager. The Fund’s performance relative to the average may have differed if these or other factors had been considered.
3. Source: Morningstar.
The indexes are unmanaged and include reinvestment of any income or distributions. They do not reflect any fees, expenses or sales charges. One cannot invest directly in an
index, and an index is not representative of the Fund’s portfolio.
See www.franklintempletondatasources.com for additional data provider information.
The dollar value, number of shares or principal amount, and names of all portfolio holdings are listed in the Fund’s Statement of Investments (SOI).
The SOI begins on page 78.
franklintempleton.com
Semiannual Report 23
FRANKLIN U.S. GOVERNMENT SECURITIES FUND
real estate investment trusts, overseas investors and domestic money managers would need to rise to compensate for the Fed’s reduced presence in the MBS sector. We believed prepayment levels could moderate with mortgage rates staying in the same range and underwriting standards remaining tight.
Within the agency mortgage pass-through sector, GNMA MBS underperformed their Freddie Mac MBS and Fannie Mae MBS counterparts. On a total return basis, GNMA 4.0% coupons had the least negative returns, while 3.0% coupons had the largest negative returns.
The Fund maintains a conservative, disciplined investment strategy and invests entirely in GNMA mortgage pass-throughs, which remain the only MBS that are backed by the full faith and credit of the U.S. government—the same guarantee applicable to U.S. Treasuries.1 Our collateral-intensive research approach can allow us to uncover dislocations across the GNMA markets and associated misvaluation of prepayment risk. We continue to focus on specified pools where we believe our experience and continual investment in new technologies help us uncover these discrepancies.
During the period, we were more weighted toward GNMA IIs (pools of mortgages from multiple issuers) than GNMA Is (pools of mortgages from single issuers). Over the period, we added to GNMA II 3.5% coupons, while reducing exposure to 4.0% coupons. Our heaviest allocation was in 3.5%, 4.5% and 5.0% coupons at period-end. The Fund’s position in 3.0% coupon GNMA securities significantly benefited performance, while our allocation to 4.5% coupon GNMAs detracted slightly from performance.
Thank you for your continued participation in Franklin U.S. Government Securities Fund. We welcome your comments and questions and look forward to serving your investment needs in the years ahead.

The foregoing information reflects our analysis, opinions and portfolio holdings as of March 31, 2017, the end of the reporting period. The way we implement our main investment strategies and the resulting portfolio holdings may change depending on factors such as market and economic conditions. These opinions may not be relied upon as investment advice or an offer for a particular security. The information is not a complete analysis of every aspect of any market, country, industry, security or the Fund. Statements of fact are from sources considered reliable, but the investment manager makes no representation or warranty as to their completeness or accuracy. Although historical performance is no guarantee of future results, these insights may help you understand our investment management philosophy.
24 Semiannual Report
franklintempleton.com
FRANKLIN U.S. GOVERNMENT SECURITIES FUND
Performance Summary as of March 31, 2017
The performance table does not reflect any taxes that a shareholder would pay on Fund dividends, capital gain distributions, if any, or any realized gains on the sale of Fund shares. Total return reflects reinvestment of the Fund’s dividends and capital gain distributions, if any, and any unrealized gains or losses. Your dividend income will vary depending on dividends or interest paid by securities in the Fund’s portfolio, adjusted for operating expenses of each class. Capital gain distributions are net profits realized from the sale of portfolio securities.
Performance as of 3/31/171
Cumulative total return excludes sales charges. Average annual total returns include maximum sales charges. Sales charges will vary depending on the size of the investment and the class of share purchased. The maximum is 4.25% and the minimum is 0%. Class A: 4.25% maximum initial sales charge; Advisor Class: no sales charges. For other share classes, visit franklintempleton.com.
| Cumulative | Average Annual | |||
| Share Class | Total Return2 | Total Return3 | ||
| A | ||||
| 6-Month | -1.48 | % | -5.64 | % |
| 1-Year | -0.29 | % | -4.49 | % |
| 5-Year | +5.70 | % | +0.23 | % |
| 10-Year | +41.16 | % | +3.05 | % |
| Advisor | ||||
| 6-Month | -1.24 | % | -1.24 | % |
| 1-Year | +0.02 | % | +0.02 | % |
| 5-Year | +6.65 | % | +1.30 | % |
| 10-Year | +43.30 | % | +3.66 | % |
| 30-Day Standardized Yield5 | ||||||
| Distribution | ||||||
| Share Class | Rate4 | (with waiver) | (without waiver) | |||
| A | 2.97 | % | 2.26 | % | 2.26 | % |
| Advisor | 3.24 | % | 2.51 | % | 2.50 | % |
Performance data represent past performance, which does not guarantee future results. Investment return and principal value will fluctuate, and you may have a gain or loss when you sell your shares. Current performance may differ from figures shown. For most recent month-end performance, go to franklintempleton.com or call (800) 342-5236.
See page 26 for Performance Summary footnotes.
franklintempleton.com
Semiannual Report 25
| FRANKLIN U.S. GOVERNMENT SECURITIES FUND | |||||
| PERFORMANCE SUMMARY | |||||
| Distributions (10/1/16–3/31/17) | |||||
| Net Investment | |||||
| Share Class | Income | ||||
| A | $ | 0.0963 | |||
| C | $ | 0.0808 | |||
| R | $ | 0.0852 | |||
| R6 | $ | 0.1052 | |||
| Advisor | $ | 0.1010 | |||
| Total Annual Operating Expenses6 | |||||
| Share Class | With Waiver | Without Waiver | |||
| A | 0.77 | % | 0.78 | % | |
| Advisor | 0.62 | % | 0.63 | % | |
Each class of shares is available to certain eligible investors and has different annual fees and expenses, as described in the prospectus.
All investments involve risks, including possible loss of principal. The Fund’s share price and yield will be affected by interest rate movements and mortgage
prepayments. Bond prices generally move in the opposite direction of interest rates. Thus, as prices of bonds in the Fund adjust to a rise in interest rates, the
Fund’s share price may decline. Changes in the financial strength of a bond issuer or in a bond’s credit rating may affect its value. The Fund is actively managed
but there is no guarantee that the manager’s investment decisions will produce the desired results. The Fund’s prospectus also includes a description of themain
investment risks.
1. The Fund has a fee waiver associated with any investment it makes in a Franklin Templeton money fund and/or other Franklin Templeton fund, contractually guaranteed
through 1/31/18. Fund investment results reflect the fee waiver; without this waiver, the results would have been lower.
2. Cumulative total return represents the change in value of an investment over the periods indicated.
3. Average annual total return represents the average annual change in value of an investment over the periods indicated. Return for less than one year, ifany,hasnotbeen
annualized.
4. Distribution rate is based on an annualization of the respective class’s March dividend and the maximum offering price (NAV for Advisor Class) per share on 3/31/17.
5. The Fund’s 30-day standardized yield is calculated over a trailing 30-day period using the yield to maturity on bonds and/or the dividends accrued on stocks. It may not equal
the Fund’s actual income distribution rate, which reflects the Fund’s past dividends paid to shareholders.
6. Figures are as stated in the Fund’s current prospectus and may differ from the expense ratios disclosed in the Your Fund’s Expenses and Financial Highlights sections in this
report. In periods of market volatility, assets may decline significantly, causing total annual Fund operating expenses to become higher than the figures shown.
26 Semiannual Report
franklintempleton.com
FRANKLIN U.S. GOVERNMENT SECURITIES FUND
Your Fund’s Expenses
As a Fund shareholder, you can incur two types of costs: (1) transaction costs, including sales charges (loads) on Fund purchases and redemptions; and (2) ongoing Fund costs, including management fees, distribution and service (12b-1) fees, and other Fund expenses. All mutual funds have ongoing costs, sometimes referred to as operating expenses. The table below shows ongoing costs of investing in the Fund and can help you understand these costs and compare them with those of other mutual funds. The table assumes a $1,000 investment held for the six months indicated.
Actual Fund Expenses
The table below provides information about actual account values and actual expenses in the columns under the heading “Actual.” In these columns the Fund’s actual return, which includes the effect of Fund expenses, is used to calculate the “Ending Account Value” for each class of shares. You can estimate the expenses you paid during the period by following these steps (of course, your account value and expenses will differ from those in this illustration): Divide your account value by $1,000 (if your account had an $8,600 value, then $8,600 ÷ $1,000 = 8.6). Then multiply the result by the number in the row for your class of shares under the headings “Actual” and “Expenses Paid During Period” (if Actual Expenses Paid During Period were $7.50, then 8.6 x $7.50 = $64.50). In this illustration, the actual expenses paid this period are $64.50.
Hypothetical Example for Comparison with Other Funds
Under the heading “Hypothetical” in the table, information is provided about hypothetical account values and hypothetical expenses based on the Fund’s actual expense ratio and an assumed rate of return of 5% per year before expenses, which is not the Fund’s actual return. This information may not be used to estimate the actual ending account balance or expenses you paid for the period, but it can help you compare ongoing costs of investing in the Fund with those of other funds. To do so, compare this 5% hypothetical example for the class of shares you hold with the 5% hypothetical examples that appear in the shareholder reports of other funds.
Please note that expenses shown in the table are meant to highlight ongoing costs and do not reflect any transactional costs. Therefore, information under the heading “Hypothetical” is useful in comparing ongoing costs only, and will not help you compare total costs of owning different funds. In addition, if transactional costs were included, your total costs would have been higher.
| Actual | Hypothetical | |||||||||||
| (actual return after expenses) | (5% annual return before expenses) | |||||||||||
| Expenses | Expenses | Net | ||||||||||
| Beginning | Ending | Paid During | Ending | Paid During | Annualized | |||||||
| Share | Account | Account | Period | Account | Period | Expense | ||||||
| Class | Value 10/1/16 | Value 3/31/17 | 10/1/16–3/31/171,2 | Value 3/31/17 | 10/1/16–3/31/171,2 | Ratio2 | ||||||
| A | $ | 1,000 | $ | 985.20 | $ | 3.76 | $ | 1,021.14 | $ | 3.83 | 0.76 | % |
| C | $ | 1,000 | $ | 984.20 | $ | 6.23 | $ | 1,018.65 | $ | 6.34 | 1.26 | % |
| R | $ | 1,000 | $ | 985.00 | $ | 5.44 | $ | 1,019.45 | $ | 5.54 | 1.10 | % |
| R6 | $ | 1,000 | $ | 986.70 | $ | 2.38 | $ | 1,022.54 | $ | 2.42 | 0.48 | % |
| Advisor | $ | 1,000 | $ | 987.60 | $ | 3.02 | $ | 1,021.89 | $ | 3.07 | 0.61 | % |
1. Expenses are equal to the annualized expense ratio for the six-month period as indicated above–in the far right column–multiplied by the simple average account value
over the period indicated, and then multiplied by 182/365 to reflect the one-half year period.
2. Reflects expenses after fee waivers and expense reimbursements. Does not include acquired fund fees and expenses.
franklintempleton.com
Semiannual Report 27
Franklin Utilities Fund
This semiannual report for Franklin Utilities Fund covers the period ended March 31, 2017.
Your Fund’s Goal and Main Investments
The Fund seeks both capital appreciation and current income by investing at least 80% of its net assets in public utility company securities.
Performance Overview
The Fund’s Class A shares delivered a +5.91% cumulative total return for the six months under review. In comparison, the Standard & Poor’s 500 (S&P 500) Index, which is a broad measure of U.S. stock performance, generated a +10.12% total return, and the S&P 500 Utilities Index, which measures the performance of all utilities stocks in the S&P 500 Index, produced a +6.54% total return.1 You can find the Fund’s long-term performance data in the Performance Summary beginning on page 30.
Performance data represent past performance, which does not guarantee future results. Investment return will fluctuate. Current performance may differ from figures shown. For most recent month-end performance, go to franklintempleton.com or call (800) 342-5236.
Investment Strategy
We search for the best return opportunities available in the global utilities arena with a specific focus on the U.S. electricity and gas sector. Generally, we look for companies producing a high percentage of earnings from regulated utility franchise operations.
Manager’s Discussion
During the reporting period, the Fund’s utilities sector holdings contributed to its absolute performance.2 Within the sector, our positions in Edison International, CenterPoint Energy and PG&E helped results. Edison and PG&E performed well as a cost-of-capital regulatory settlement in California extended earnings clarity in the state for the companies, giving investors greater confidence in sustainable performance for California utilities. CenterPoint’s performance continued to recover from
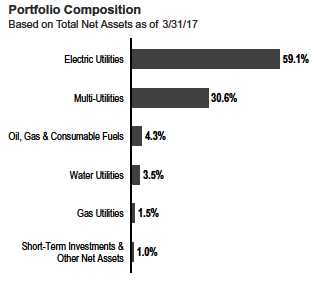
2015 weakness, when lower commodity prices negatively impacted the performance of the company’s investment in Enable, a gas-oriented master limited partnership.
In contrast, the energy sector detracted from the Fund’s absolute results.3 Petroleum products producer Kinder Morgan hindered performance in the sector. In our analysis, the company tends to be less sensitive to commodity price recovery compared to other pipeline companies, dampening investor optimism relative to other opportunities.
In the utilities sector, National Grid and Westar Energy weighed on the Fund’s absolute performance. Shares of U.K.-based electricity and natural gas distribution company National Grid suffered amid weakness of the British pound relative to the U.S. dollar. In addition, increased global inflationary growth expectations following the November 2016 U.S. election had a negative impact on the stock performance of U.K.’s regulated utilities. Electricity company Westar Energy declined due largely to uncertainty about whether regulatory approvals can be attained for Great Plains Energy’s acquisition of Westar. A decision in Kansas expected by the end of April should give better clarity into the potential completion of the merger.
1. Source: Morningstar.
The indexes are unmanaged and include reinvested dividends. They do not reflect any fees, expenses or sales charges. One cannot invest directly in an index, and an index is
not representative of the Fund’s portfolio.
2. The utilities sector comprises electric utilities, gas utilities, multi-utilities and water utilities in the SOI.
3. The energy sector comprises oil, gas and consumable fuels in the SOI.
See www.franklintempletondatasources.com for additional data provider information.
The dollar value, number of shares or principal amount, and names of all portfolio holdings are listed in the Fund’s Statement of Investments (SOI).
The SOI begins on page 86.
28 Semiannual Report
franklintempleton.com
FRANKLIN UTILITIES FUND
| Top 10 Holdings | ||
| 3/31/17 | ||
| Company | % of Total | |
| Sector/Industry | Net Assets | |
| NextEra Energy Inc. | 5.9 | % |
| Electric Utilities | ||
| Edison International | 5.1 | % |
| Electric Utilities | ||
| Dominion Resources Inc. | 5.1 | % |
| Multi-Utilities | ||
| PG&E Corp. | 4.9 | % |
| Electric Utilities | ||
| Sempra Energy | 4.9 | % |
| Multi-Utilities | ||
| Duke Energy Corp. | 4.4 | % |
| Electric Utilities | ||
| American Electric Power Co. Inc. | 4.1 | % |
| Electric Utilities | ||
| Exelon Corp. | 3.8 | % |
| Electric Utilities | ||
| The Southern Co. | 3.5 | % |
| Electric Utilities | ||
| CMS Energy Corp. | 3.4 | % |
| Multi-Utilities |
Thank you for your continued participation in Franklin Utilities Fund. We look forward to serving your future investment needs.

The foregoing information reflects our analysis, opinions and portfolio holdings as of March 31, 2017, the end of the reporting period. The way we implement our main investment strategies and the resulting portfolio holdings may change depending on factors such as market and economic conditions. These opinions may not be relied upon as investment advice or an offer for a particular security. The information is not a complete analysis of every aspect of any market, country, industry, security or the Fund. Statements of fact are from sources considered reliable, but the investment manager makes no representation or warranty as to their completeness or accuracy. Although historical performance is no guarantee of future results, these insights may help you understand our investment management philosophy.
franklintempleton.com
Semiannual Report 29
FRANKLIN UTILITIES FUND
Performance Summary as of March 31, 2017
The performance tables do not reflect any taxes that a shareholder would pay on Fund dividends, capital gain distributions, if any, or any realized gains on the sale of Fund shares. Total return reflects reinvestment of the Fund’s dividends and capital gain distributions, if any, and any unrealized gains or losses. Your dividend income will vary depending on dividends or interest paid by securities in the Fund’s portfolio, adjusted for operating expenses of each class. Capital gain distributions are net profits realized from the sale of portfolio securities.
Performance as of 3/31/171
Cumulative total return excludes sales charges. Average annual total return includes maximum sales charges. Sales charges will vary depending on the size of the investment and the class of share purchased. The maximum is 4.25% and the minimum is 0%. Class A: 4.25% maximum initial sales charge; Advisor Class: no sales charges. For other share classes, visit franklintempleton.com.
| Cumulative | Average Annual | |||||
| Share Class | Total Return2 | Total Return3 | ||||
| A | ||||||
| 6-Month | +5.91 | % | +1.42 | % | ||
| 1-Year | +9.01 | % | +4.37 | % | ||
| 5-Year | +73.67 | % | +10.71 | % | ||
| 10-Year | +103.35 | % | +6.89 | % | ||
| Advisor | ||||||
| 6-Month | +6.06 | % | +6.06 | % | ||
| 1-Year | +9.22 | % | +9.22 | % | ||
| 5-Year | +75.00 | % | +11.84 | % | ||
| 10-Year | +106.55 | % | +7.52 | % | ||
| 30-Day Standardized Yield5 | ||||||
| Distribution | ||||||
| Share Class | Rate4 | (with waiver) | (without waiver) | |||
| A | 2.36 | % | 2.54 | % | 2.54 | % |
| Advisor | 2.59 | % | 2.81 | % | 2.80 | % |
Performance data represent past performance, which does not guarantee future results. Investment return and principal value will fluctuate, and you may have a gain or loss when you sell your shares. Current performance may differ from figures shown. For most recent month-end performance, go to franklintempleton.com or call (800) 342-5236.
See page 31 for Performance Summary footnotes.
30 Semiannual Report
franklintempleton.com
FRANKLIN UTILITIES FUND
PERFORMANCE SUMMARY
| Net Asset Value | |||||||
| Share Class (Symbol) | 3/31/17 | 9/30/16 | Change | ||||
| A (FKUTX) | $ | 18.63 | $ | 17.85 | +$ | 0.78 | |
| C (FRUSX) | $ | 18.54 | $ | 17.76 | +$ | 0.78 | |
| R (FRURX) | $ | 18.57 | $ | 17.78 | +$ | 0.79 | |
| R6 (FUFRX) | $ | 18.76 | $ | 17.97 | +$ | 0.79 | |
| Advisor (FRUAX) | $ | 18.77 | $ | 17.97 | +$ | 0.80 | |
| Distributions (10/1/16–3/31/17) | |||||||
| Net Investment | Short-Term | ||||||
| Share Class | Income | Capital Gain | Total | ||||
| A | $ | 0.2466 | $ | 0.0102 | $ | 0.2568 | |
| C | $ | 0.2021 | $ | 0.0102 | $ | 0.2123 | |
| R | $ | 0.2154 | $ | 0.0102 | $ | 0.2256 | |
| R6 | $ | 0.2694 | $ | 0.0102 | $ | 0.2796 | |
| Advisor | $ | 0.2600 | $ | 0.0102 | $ | 0.2702 | |
| Total Annual Operating Expenses6 | |||||||
| Share Class | |||||||
| A | 0.73 | % | |||||
| Advisor | 0.58 | % | |||||
Each class of shares is available to certain eligible investors and has different annual fees and expenses, as described in the prospectus.
All investments involve risks, including possible loss of principal. Investing in a fund concentrating in the utilities sector involves special risks, including
increased susceptibility to adverse economic and regulatory developments affecting the sector. Stocks historically have outperformed other asset classes over
the long term, but tend to fluctuate more dramatically over the short term. Securities issued by utility companies have been historically sensitive to interest rate
changes. When interest rates fall, utility securities prices, and thus a utilities fund’s share price, tend to rise; when interest rates rise, their prices generally fall.
The Fund is actively managed but there is no guarantee that the manager’s investment decisions will produce the desired results. The Fund’s prospectus also
includes a description of the main investment risks.
1. The Fund has a fee waiver associated with any investment it makes in a Franklin Templeton money fund and/or other Franklin Templeton fund, contractually guaranteed
through 1/31/18. Fund investment results reflect the fee waiver; without this waiver, the results would have been lower.
2. Cumulative total return represents the change in value of an investment over the periods indicated.
3. Average annual total return represents the average annual change in value of an investment over the periods indicated. Return for less than one year, ifany,hasnotbeen
annualized.
4. Distribution rate is based on an annualization of the respective class’s current quarterly dividend and the maximum offering price (NAV for Advisor Class) per share on
3/31/17.
5. The Fund’s 30-day standardized yield is calculated over a trailing 30-day period using the yield to maturity on bonds and/or the dividends accrued on stocks. It may not equal
the Fund’s actual income distribution rate, which reflects the Fund’s past dividends paid to shareholders.
6. Figures are as stated in the Fund’s current prospectus and may differ from the expense ratios disclosed in the Your Fund’s Expenses and Financial Highlights sections in this
report. In periods of market volatility, assets may decline significantly, causing total annual Fund operating expenses to become higher than the figures shown.
franklintempleton.com
Semiannual Report 31
FRANKLIN UTILITIES FUND
Your Fund’s Expenses
As a Fund shareholder, you can incur two types of costs: (1) transaction costs, including sales charges (loads) on Fund purchases and redemptions; and (2) ongoing Fund costs, including management fees, distribution and service (12b-1) fees, and other Fund expenses. All mutual funds have ongoing costs, sometimes referred to as operating expenses. The table below shows ongoing costs of investing in the Fund and can help you understand these costs and compare them with those of other mutual funds. The table assumes a $1,000 investment held for the six months indicated.
Actual Fund Expenses
The table below provides information about actual account values and actual expenses in the columns under the heading “Actual.” In these columns the Fund’s actual return, which includes the effect of Fund expenses, is used to calculate the “Ending Account Value” for each class of shares. You can estimate the expenses you paid during the period by following these steps (of course, your account value and expenses will differ from those in this illustration): Divide your account value by $1,000 (if your account had an $8,600 value, then $8,600 ÷ $1,000 = 8.6). Then multiply the result by the number in the row for your class of shares under the headings “Actual” and “Expenses Paid During Period” (if Actual Expenses Paid During Period were $7.50, then 8.6 x $7.50 = $64.50). In this illustration, the actual expenses paid this period are $64.50.
Hypothetical Example for Comparison with Other Funds
Under the heading “Hypothetical” in the table, information is provided about hypothetical account values and hypothetical expenses based on the Fund’s actual expense ratio and an assumed rate of return of 5% per year before expenses, which is not the Fund’s actual return. This information may not be used to estimate the actual ending account balance or expenses you paid for the period, but it can help you compare ongoing costs of investing in the Fund with those of other funds. To do so, compare this 5% hypothetical example for the class of shares you hold with the 5% hypothetical examples that appear in the shareholder reports of other funds.
Please note that expenses shown in the table are meant to highlight ongoing costs and do not reflect any transactional costs. Therefore, information under the heading “Hypothetical” is useful in comparing ongoing costs only, and will not help you compare total costs of owning different funds. In addition, if transactional costs were included, your total costs would have been higher.
| Actual | Hypothetical | |||||||||||
| (actual return after expenses) | (5% annual return before expenses) | |||||||||||
| Expenses | Expenses | Net | ||||||||||
| Beginning | Ending | Paid During | Ending | Paid During | Annualized | |||||||
| Share | Account | Account | Period | Account | Period | Expense | ||||||
| Class | Value 10/1/16 | Value 3/31/17 | 10/1/16–3/31/171,2 | Value 3/31/17 | 10/1/16–3/31/171,2 | Ratio2 | ||||||
| A | $ | 1,000 | $ | 1,059.10 | $ | 3.75 | $ | 1,021.29 | $ | 3.68 | 0.73 | % |
| C | $ | 1,000 | $ | 1,056.70 | $ | 6.31 | $ | 1,018.80 | $ | 6.19 | 1.23 | % |
| R | $ | 1,000 | $ | 1,058.00 | $ | 5.54 | $ | 1,019.55 | $ | 5.44 | 1.08 | % |
| R6 | $ | 1,000 | $ | 1,061.10 | $ | 2.42 | $ | 1,022.59 | $ | 2.37 | 0.47 | % |
| Advisor | $ | 1,000 | $ | 1,060.60 | $ | 2.98 | $ | 1,022.04 | $ | 2.92 | 0.58 | % |
1. Expenses are equal to the annualized expense ratio for the six-month period as indicated above–in the far right column–multiplied by the simple average account value
over the period indicated, and then multiplied by 182/365 to reflect the one-half year period.
2. Reflects expenses after fee waivers and expense reimbursements. Does not include acquired fund fees and expenses.
32 Semiannual Report
franklintempleton.com
FRANKLIN CUSTODIAN FUNDS
| Financial Highlights | ||||||||||||||||||
| Franklin DynaTech Fund | ||||||||||||||||||
| Six Months Ended | ||||||||||||||||||
| March 31, 2017 | Year Ended September 30, | |||||||||||||||||
| (unaudited) | 2016 | 2015 | 2014 | 2013 | 2012 | |||||||||||||
| Class A | ||||||||||||||||||
| Per share operating performance | ||||||||||||||||||
| (for a share outstanding throughout the period) | ||||||||||||||||||
| Net asset value, beginning of period | $ | 52.05 | $ | 46.04 | $ | 46.08 | $ | 42.13 | $ | 34.00 | $ | 27.66 | ||||||
| Income from investment operationsa: | ||||||||||||||||||
| Net investment income (loss)b | (0.08 | ) | (0.14 | ) | (0.21 | ) | (0.18 | ) | (0.12 | ) | (0.11 | ) | ||||||
| Net realized and unrealized gains (losses) | 3.88 | 7.35 | 1.78 | 5.94 | 8.25 | 7.10 | ||||||||||||
| Total from investment operations | 3.80 | 7.21 | 1.57 | 5.76 | 8.13 | 6.99 | ||||||||||||
| Less distributions from net realized gains. | (1.69 | ) | (1.20 | ) | (1.61 | ) | (1.81 | ) | — | (0.65 | ) | |||||||
| Net asset value, end of period | $ | 54.16 | $ | 52.05 | $ | 46.04 | $ | 46.08 | $ | 42.13 | $ | 34.00 | ||||||
| Total returnc | 7.85 | % | 15.73 | % | 3.40 | % | 13.98 | % | 23.91 | % | 25.59 | % | ||||||
| Ratios to average net assetsd | ||||||||||||||||||
| Expenses before waiver and payments by | ||||||||||||||||||
| affiliates | 0.90 | % | 0.91 | % | 0.89 | % | 0.89 | % | 0.94 | % | 0.96 | % | ||||||
| Expenses net of waiver and payments by | ||||||||||||||||||
| affiliates | 0.90 | %e,f | 0.90 | % | 0.89 | %e | 0.89 | %e,f | 0.94 | % | 0.96 | % | ||||||
| Net investment income (loss) | (0.33 | )% | (0.30 | )% | (0.44 | )% | (0.41 | )% | (0.34 | )% | (0.35 | )% | ||||||
| Supplemental data | ||||||||||||||||||
| Net assets, end of period (000’s) | $ | 2,111,416 | $ | 2,123,082 | $ | 1,857,570 | $ | 1,504,338 | $ | 1,072,814 | $ | 898,665 | ||||||
| Portfolio turnover rate | 13.07 | % | 22.42 | % | 31.02 | % | 26.43 | % | 35.40 | % | 16.65 | % | ||||||
aThe amount shown for a share outstanding throughout the period may not correlate with the Statement of Operations for the period due to the timing of sales and
repurchases of the Fund’s shares in relation to income earned and/or fluctuating fair value of the investments of the Fund.
bBased on average daily shares outstanding.
cTotal return does not reflect sales commissions or contingent deferred sales charges, if applicable, and is not annualized for periods less than one year.
dRatios are annualized for periods less than one year.
eBenefit of waiver and payments by affiliates rounds to less than 0.01%.
fBenefit of expense reduction rounds to less than 0.01%.
franklintempleton.com The accompanying notes are an integral part of these financial statements. | Semiannual Report 33
| FRANKLIN CUSTODIAN FUNDS | ||||||||||||||||||
| FINANCIAL HIGHLIGHTS | ||||||||||||||||||
| Franklin DynaTech Fund (continued) | ||||||||||||||||||
| Six Months Ended | ||||||||||||||||||
| March 31, 2017 | Year Ended September 30, | |||||||||||||||||
| (unaudited) | 2016 | 2015 | 2014 | 2013 | 2012 | |||||||||||||
| Class C | ||||||||||||||||||
| Per share operating performance | ||||||||||||||||||
| (for a share outstanding throughout the period) | ||||||||||||||||||
| Net asset value, beginning of period | $ | 44.71 | $ | 40.00 | $ | 40.53 | $ | 37.53 | $ | 30.52 | $ | 25.07 | ||||||
| Income from investment operationsa: | ||||||||||||||||||
| Net investment income (loss)b | (0.23 | ) | (0.43 | ) | (0.50 | ) | (0.46 | ) | (0.35 | ) | (0.32 | ) | ||||||
| Net realized and unrealized gains (losses) | 3.30 | 6.34 | 1.58 | 5.27 | 7.36 | 6.42 | ||||||||||||
| Total from investment operations | 3.07 | 5.91 | 1.08 | 4.81 | 7.01 | 6.10 | ||||||||||||
| Less distributions from net realized gains. | (1.69 | ) | (1.20 | ) | (1.61 | ) | (1.81 | ) | — | (0.65 | ) | |||||||
| Net asset value, end of period | $ | 46.09 | $ | 44.71 | $ | 40.00 | $ | 40.53 | $ | 37.53 | $ | 30.52 | ||||||
| Total returnc | 7.45 | % | 14.86 | % | 2.63 | % | 13.13 | % | 22.97 | % | 24.67 | % | ||||||
| Ratios to average net assetsd | ||||||||||||||||||
| Expenses before waiver and payments by | ||||||||||||||||||
| affiliates | 1.64 | % | 1.66 | % | 1.64 | % | 1.64 | % | 1.69 | % | 1.71 | % | ||||||
| Expenses net of waiver and payments by | ||||||||||||||||||
| affiliates | 1.64 | %e,f | 1.65 | % | 1.64 | %e | 1.64 | %e,f | 1.69 | % | 1.71 | % | ||||||
| Net investment income (loss) | (1.07 | )% | (1.05 | )% | (1.19 | )% | (1.16 | )% | (1.09 | )% | (1.10 | )% | ||||||
| Supplemental data | ||||||||||||||||||
| Net assets, end of period (000’s) | $ | 318,812 | $ | 318,896 | $ | 270,961 | $ | 212,961 | $ | 176,556 | $ | 142,903 | ||||||
| Portfolio turnover rate | 13.07 | % | 22.42 | % | 31.02 | % | 26.43 | % | 35.40 | % | 16.65 | % | ||||||
aThe amount shown for a share outstanding throughout the period may not correlate with the Statement of Operations for the period due to the timing of sales and
repurchases of the Fund’s shares in relation to income earned and/or fluctuating fair value of the investments of the Fund.
bBased on average daily shares outstanding.
cTotal return does not reflect sales commissions or contingent deferred sales charges, if applicable, and is not annualized for periods less than one year.
dRatios are annualized for periods less than one year.
eBenefit of waiver and payments by affiliates rounds to less than 0.01%.
fBenefit of expense reduction rounds to less than 0.01%.
34 Semiannual Report | The accompanying notes are an integral part of these financial statements. franklintempleton.com
| FRANKLIN CUSTODIAN FUNDS | ||||||||||||||||||
| FINANCIAL HIGHLIGHTS | ||||||||||||||||||
| Franklin DynaTech Fund (continued) | ||||||||||||||||||
| Six Months Ended | ||||||||||||||||||
| March 31, 2017 | Year Ended September 30, | |||||||||||||||||
| (unaudited) | 2016 | 2015 | 2014 | 2013 | 2012 | |||||||||||||
| Class R | ||||||||||||||||||
| Per share operating performance | ||||||||||||||||||
| (for a share outstanding throughout the period) | ||||||||||||||||||
| Net asset value, beginning of period | $ | 50.90 | $ | 45.16 | $ | 45.35 | $ | 41.58 | $ | 33.65 | $ | 27.44 | ||||||
| Income from investment operationsa: | ||||||||||||||||||
| Net investment income (loss)b | (0.14 | ) | (0.26 | ) | (0.32 | ) | (0.29 | ) | (0.21 | ) | (0.19 | ) | ||||||
| Net realized and unrealized gains (losses) | 3.79 | 7.20 | 1.74 | 5.87 | 8.14 | 7.05 | ||||||||||||
| Total from investment operations | 3.65 | 6.94 | 1.42 | 5.58 | 7.93 | 6.86 | ||||||||||||
| Less distributions from net realized gains. | (1.69 | ) | (1.20 | ) | (1.61 | ) | (1.81 | ) | — | (0.65 | ) | |||||||
| Net asset value, end of period | $ | 52.86 | $ | 50.90 | $ | 45.16 | $ | 45.35 | $ | 41.58 | $ | 33.65 | ||||||
| Total returnc | 7.73 | % | 15.43 | % | 3.11 | % | 13.72 | % | 23.57 | % | 25.32 | % | ||||||
| Ratios to average net assetsd | ||||||||||||||||||
| Expenses before waiver and payments by | ||||||||||||||||||
| affiliates | 1.15 | % | 1.16 | % | 1.14 | % | 1.14 | % | 1.19 | % | 1.21 | % | ||||||
| Expenses net of waiver and payments by | ||||||||||||||||||
| affiliates | 1.15 | %e,f | 1.15 | % | 1.14 | %e | 1.14 | %e,f | 1.19 | % | 1.21 | % | ||||||
| Net investment income (loss) | (0.58 | )% | (0.55 | )% | (0.69 | )% | (0.66 | )% | (0.59 | )% | (0.60 | )% | ||||||
| Supplemental data | ||||||||||||||||||
| Net assets, end of period (000’s) | $ | 36,675 | $ | 38,862 | $ | 43,001 | $ | 45,230 | $ | 41,825 | $ | 33,338 | ||||||
| Portfolio turnover rate | 13.07 | % | 22.42 | % | 31.02 | % | 26.43 | % | 35.40 | % | 16.65 | % | ||||||
aThe amount shown for a share outstanding throughout the period may not correlate with the Statement of Operations for the period due to the timing of sales and
repurchases of the Fund’s shares in relation to income earned and/or fluctuating fair value of the investments of the Fund.
bBased on average daily shares outstanding.
cTotal return is not annualized for periods less than one year.
dRatios are annualized for periods less than one year.
eBenefit of waiver and payments by affiliates rounds to less than 0.01%.
fBenefit of expense reduction rounds to less than 0.01%.
franklintempleton.com The accompanying notes are an integral part of these financial statements. | Semiannual Report 35
| FRANKLIN CUSTODIAN FUNDS | |||||||||||||||
| FINANCIAL HIGHLIGHTS | |||||||||||||||
| Franklin DynaTech Fund (continued) | |||||||||||||||
| Six Months Ended | |||||||||||||||
| March 31, 2017 | Year Ended September 30, | ||||||||||||||
| (unaudited) | 2016 | 2015 | 2014 | 2013 | a | ||||||||||
| Class R6 | |||||||||||||||
| Per share operating performance | |||||||||||||||
| (for a share outstanding throughout the period) | |||||||||||||||
| Net asset value, beginning of period | $ | 53.56 | $ | 47.15 | $ | 46.97 | $ | 42.74 | $ | 36.56 | |||||
| Income from investment operationsb: | |||||||||||||||
| Net investment income (loss)c | 0.02 | 0.06 | (0.01 | ) | (0.01 | ) | 0.01 | ||||||||
| Net realized and unrealized gains (losses) | 4.02 | 7.55 | 1.80 | 6.05 | 6.17 | ||||||||||
| Total from investment operations. | 4.04 | 7.61 | 1.79 | 6.04 | 6.18 | ||||||||||
| Less distributions from net realized gains | (1.69 | ) | (1.20 | ) | (1.61 | ) | (1.81 | ) | — | ||||||
| Net asset value, end of period. | $ | 55.91 | $ | 53.56 | $ | 47.15 | $ | 46.97 | $ | 42.74 | |||||
| Total returnd | 8.08 | % | 16.21 | % | 3.81 | % | 14.45 | % | 16.90 | % | |||||
| Ratios to average net assetse | |||||||||||||||
| Expenses before waiver and payments by affiliates | 0.48 | % | 0.49 | % | 0.48 | % | 0.49 | % | 0.52 | % | |||||
| Expenses net of waiver and payments by affiliates | 0.48 | %f,g | 0.48 | % | 0.48 | %f | 0.49 | %f,g | 0.52 | % | |||||
| Net investment income (loss) | 0.09 | % | 0.12 | % | (0.03 | )% | (0.01 | )% | 0.08 | % | |||||
| Supplemental data | |||||||||||||||
| Net assets, end of period (000’s) | $ | 430,241 | $ | 359,505 | $ | 362,627 | $ | 342,466 | $ | 317,315 | |||||
| Portfolio turnover rate | 13.07 | % | 22.42 | % | 31.02 | % | 26.43 | % | 35.40 | % | |||||
aFor the period May 1, 2013 (effective date) to September 30, 2013.
bThe amount shown for a share outstanding throughout the period may not correlate with the Statement of Operations for the period due to the timing of sales and
repurchases of the Fund’s shares in relation to income earned and/or fluctuating fair value of the investments of the Fund.
cBased on average daily shares outstanding.
dTotal return is not annualized for periods less than one year.
eRatios are annualized for periods less than one year.
fBenefit of waiver and payments by affiliates rounds to less than 0.01%.
gBenefit of expense reduction rounds to less than 0.01%.
36 Semiannual Report | The accompanying notes are an integral part of these financial statements. franklintempleton.com
| FRANKLIN CUSTODIAN FUNDS | ||||||||||||||||||
| FINANCIAL HIGHLIGHTS | ||||||||||||||||||
| Franklin DynaTech Fund (continued) | ||||||||||||||||||
| Six Months Ended | ||||||||||||||||||
| March 31, 2017 | Year Ended September 30, | |||||||||||||||||
| (unaudited) | 2016 | 2015 | 2014 | 2013 | 2012 | |||||||||||||
| Advisor Class | ||||||||||||||||||
| Per share operating performance | ||||||||||||||||||
| (for a share outstanding throughout the period) | ||||||||||||||||||
| Net asset value, beginning of period | $ | 53.25 | $ | 46.96 | $ | 46.87 | $ | 42.71 | $ | 34.39 | $ | 27.89 | ||||||
| Income from investment operationsa: | ||||||||||||||||||
| Net investment income (loss)b | (0.02 | ) | (0.03 | ) | (0.09 | ) | (0.07 | ) | (0.03 | ) | (0.03 | ) | ||||||
| Net realized and unrealized gains (losses) | 3.99 | 7.52 | 1.79 | 6.04 | 8.35 | 7.18 | ||||||||||||
| Total from investment operations | 3.97 | 7.49 | 1.70 | 5.97 | 8.32 | 7.15 | ||||||||||||
| Less distributions from net realized gains. | (1.69 | ) | (1.20 | ) | (1.61 | ) | (1.81 | ) | — | (0.65 | ) | |||||||
| Net asset value, end of period | $ | 55.53 | $ | 53.25 | $ | 46.96 | $ | 46.87 | $ | 42.71 | $ | 34.39 | ||||||
| Total returnc | 7.99 | % | 16.02 | % | 3.62 | % | 14.29 | % | 24.19 | % | 25.96 | % | ||||||
| Ratios to average net assetsd | ||||||||||||||||||
| Expenses before waiver and payments by | ||||||||||||||||||
| affiliates | 0.65 | % | 0.66 | % | 0.64 | % | 0.64 | % | 0.69 | % | 0.71 | % | ||||||
| Expenses net of waiver and payments by | ||||||||||||||||||
| affiliates | 0.65 | %e,f | 0.65 | % | 0.64 | %e | 0.64 | %e,f | 0.69 | % | 0.71 | % | ||||||
| Net investment income (loss) | (0.08 | )% | (0.05 | )% | (0.19 | )% | (0.16 | )% | (0.09 | )% | (0.10 | )% | ||||||
| Supplemental data | ||||||||||||||||||
| Net assets, end of period (000’s) | $ | 390,727 | $ | 203,443 | $ | 176,090 | $ | 159,180 | $ | 122,287 | $ | 260,012 | ||||||
| Portfolio turnover rate | 13.07 | % | 22.42 | % | 31.02 | % | 26.43 | % | 35.40 | % | 16.65 | % | ||||||
aThe amount shown for a share outstanding throughout the period may not correlate with the Statement of Operations for the period due to the timing of sales and
repurchases of the Fund’s shares in relation to income earned and/or fluctuating fair value of the investments of the Fund.
bBased on average daily shares outstanding.
cTotal return is not annualized for periods less than one year.
dRatios are annualized for periods less than one year.
eBenefit of waiver and payments by affiliates rounds to less than 0.01%.
fBenefit of expense reduction rounds to less than 0.01%.
franklintempleton.com The accompanying notes are an integral part of these financial statements. | Semiannual Report 37
| FRANKLIN CUSTODIAN FUNDS | ||||
| Statement of Investments, March 31, 2017 (unaudited) | ||||
| Franklin DynaTech Fund | ||||
| Country | Shares | Value | ||
| Common Stocks 97.7% | ||||
| Aerospace & Defense 1.9% | ||||
| The Boeing Co | United States | 130,000 | $ | 22,991,800 |
| Raytheon Co | United States | 250,000 | 38,125,000 | |
| 61,116,800 | ||||
| Air Freight & Logistics 0.7% | ||||
| FedEx Corp | United States | 120,000 | 23,418,000 | |
| Automobiles 0.2% | ||||
| a Tesla Inc | United States | 25,000 | 6,957,500 | |
| Biotechnology 7.6% | ||||
| Amgen Inc | United States | 100,000 | 16,407,000 | |
| a Array BioPharma Inc | United States | 300,000 | 2,682,000 | |
| a Biogen Inc | United States | 100,000 | 27,342,000 | |
| a Bioverativ Inc | United States | 50,000 | 2,723,000 | |
| a Bluebird Bio Inc | United States | 40,000 | 3,636,000 | |
| a Celgene Corp | United States | 650,000 | 80,879,500 | |
| a Incyte Corp | United States | 300,000 | 40,101,000 | |
| a Neurocrine Biosciences Inc | United States | 100,000 | 4,330,000 | |
| a Regeneron Pharmaceuticals Inc | United States | 105,000 | 40,688,550 | |
| a Tesaro Inc | United States | 200,000 | 30,774,000 | |
| 249,563,050 | ||||
| Capital Markets 4.2% | ||||
| The Charles Schwab Corp | United States | 300,000 | 12,243,000 | |
| The Goldman Sachs Group Inc | United States | 40,000 | 9,188,800 | |
| Intercontinental Exchange Inc | United States | 750,000 | 44,902,500 | |
| MarketAxess Holdings Inc | United States | 120,000 | 22,498,800 | |
| Moody’s Corp | United States | 300,000 | 33,612,000 | |
| MSCI Inc | United States | 165,000 | 16,036,350 | |
| 138,481,450 | ||||
| Communications Equipment 0.1% | ||||
| a Arista Networks Inc | United States | 30,000 | 3,968,100 | |
| Electrical Equipment 0.3% | ||||
| Rockwell Automation Inc | United States | 70,000 | 10,899,700 | |
| Electronic Equipment, Instruments & Components 2.2% | ||||
| Amphenol Corp., A | United States | 500,000 | 35,585,000 | |
| Cognex Corp | United States | 85,000 | 7,135,750 | |
| a Coherent Inc | United States | 70,000 | 14,394,800 | |
| Keyence Corp | Japan | 40,000 | 16,020,124 | |
| 73,135,674 | ||||
| Energy Equipment & Services 1.5% | ||||
| Core Laboratories NV | United States | 75,000 | 8,664,000 | |
| Schlumberger Ltd | United States | 500,000 | 39,050,000 | |
| 47,714,000 | ||||
| Equity Real Estate Investment Trusts (REITs) 4.6% | ||||
| American Tower Corp | United States | 300,000 | 36,462,000 | |
| Equinix Inc | United States | 200,000 | 80,074,000 | |
| a SBA Communications Corp | United States | 300,000 | 36,111,000 | |
| 152,647,000 | ||||
38 Semiannual Report
franklintempleton.com
FRANKLIN CUSTODIAN FUNDS
STATEMENT OF INVESTMENTS (UNAUDITED)
| Franklin DynaTech Fund (continued) | ||||
| Country | Shares | Value | ||
| Common Stocks (continued) | ||||
| Health Care Equipment & Supplies 6.7% | ||||
| Abbott Laboratories | United States | 300,000 | $ | 13,323,000 |
| a Align Technology Inc | United States | 40,000 | 4,588,400 | |
| CR Bard Inc | United States | 150,000 | 37,281,000 | |
| Danaher Corp | United States | 75,000 | 6,414,750 | |
| a Edwards Lifesciences Corp | United States | 400,000 | 37,628,000 | |
| a IDEXX Laboratories Inc | United States | 380,000 | 58,751,800 | |
| a Intuitive Surgical Inc | United States | 11,000 | 8,431,170 | |
| Ion Beam Applications | Belgium | 115,000 | 6,291,770 | |
| a iRhythm Technologies Inc | United States | 60,000 | 2,256,000 | |
| a Nevro Corp | United States | 130,000 | 12,181,000 | |
| Stryker Corp | United States | 250,000 | 32,912,500 | |
| 220,059,390 | ||||
| Health Care Providers & Services 2.8% | ||||
| a Henry Schein Inc | United States | 200,000 | 33,994,000 | |
| UnitedHealth Group Inc | United States | 350,000 | 57,403,500 | |
| 91,397,500 | ||||
| Health Care Technology 0.9% | ||||
| a Veeva Systems Inc | United States | 600,000 | 30,768,000 | |
| Internet & Direct Marketing Retail 10.1% | ||||
| a Amazon.com Inc | United States | 230,000 | 203,904,200 | |
| a Liberty Expedia Holdings Inc | United States | 220,000 | 10,005,600 | |
| a Liberty Ventures, A | United States | 330,000 | 14,678,400 | |
| a Netflix Inc | United States | 200,000 | 29,562,000 | |
| a The Priceline Group Inc | United States | 30,000 | 53,399,100 | |
| Start Today Co. Ltd | Japan | 900,000 | 19,914,653 | |
| 331,463,953 | ||||
| Internet Software & Services 15.5% | ||||
| a 2U Inc | United States | 350,000 | 13,881,000 | |
| a Alarm.com Holdings Inc | United States | 200,000 | 6,148,000 | |
| a Alibaba Group Holding Ltd., ADR | China | 110,000 | 11,861,300 | |
| a Alphabet Inc., A | United States | 150,000 | 127,170,000 | |
| a Alphabet Inc., C | United States | 62,170 | 51,573,745 | |
| a CommerceHub Inc., A | United States | 325,000 | 5,031,000 | |
| a CommerceHub Inc., C. | United States | 110,000 | 1,708,300 | |
| a CoStar Group Inc | United States | 20,000 | 4,144,400 | |
| a Coupa Software Inc | United States | 23,100 | 586,740 | |
| a Facebook Inc., A | United States | 1,100,000 | 156,255,000 | |
| MercadoLibre Inc | Argentina | 100,000 | 21,147,000 | |
| a MuleSoft Inc | United States | 68,800 | 1,673,904 | |
| NetEase Inc., ADR | China | 100,000 | 28,400,000 | |
| a Q2 Holdings Inc | United States | 100,000 | 3,485,000 | |
| a Shopify Inc., A | Canada | 20,000 | 1,364,163 | |
| Tencent Holdings Ltd | China | 2,500,000 | 71,671,674 | |
| a Twilio Inc., A | United States | 100,000 | 2,887,000 | |
| 508,988,226 | ||||
| IT Services 7.3% | ||||
| a Fiserv Inc | United States | 300,000 | 34,593,000 | |
| Mastercard Inc., A | United States | 1,000,000 | 112,470,000 | |
| a Square Inc., A | United States | 150,000 | 2,592,000 | |
franklintempleton.com
Semiannual Report 39
FRANKLIN CUSTODIAN FUNDS
STATEMENT OF INVESTMENTS (UNAUDITED)
| Franklin DynaTech Fund (continued) | ||||
| Country | Shares | Value | ||
| Common Stocks (continued) | ||||
| IT Services (continued) | ||||
| Visa Inc., A | United States | 1,000,000 | $ | 88,870,000 |
| 238,525,000 | ||||
| Life Sciences Tools & Services 1.8% | ||||
| a Illumina Inc | United States | 75,000 | 12,798,000 | |
| Thermo Fisher Scientific Inc | United States | 200,000 | 30,720,000 | |
| a Waters Corp | United States | 100,000 | 15,631,000 | |
| 59,149,000 | ||||
| Machinery 0.6% | ||||
| Fortive Corp | United States | 150,000 | 9,033,000 | |
| KUKA AG | Germany | 100,000 | 10,784,337 | |
| 19,817,337 | ||||
| Media 1.6% | ||||
| a Liberty Broadband Corp., A | United States | 300,000 | 25,527,000 | |
| a Liberty Broadband Corp., C | United States | 130,907 | 11,310,365 | |
| Naspers Ltd., N | South Africa | 100,000 | 17,253,330 | |
| 54,090,695 | ||||
| Oil, Gas & Consumable Fuels 0.3% | ||||
| Pioneer Natural Resources Co | United States | 50,000 | 9,311,500 | |
| Pharmaceuticals 0.9% | ||||
| Merck KGaA | Germany | 250,000 | 28,480,890 | |
| Semiconductors & Semiconductor Equipment 8.7% | ||||
| Analog Devices Inc | United States | 185,000 | 15,160,750 | |
| Applied Materials Inc | United States | 175,000 | 6,807,500 | |
| ASML Holding NV, N.Y. shs | Netherlands | 200,000 | 26,560,000 | |
| Broadcom Ltd | Singapore | 300,000 | 65,688,000 | |
| a Inphi Corp | United States | 130,000 | 6,346,600 | |
| Intel Corp | United States | 800,000 | 28,856,000 | |
| KLA-Tencor Corp | United States | 110,000 | 10,457,700 | |
| Lam Research Corp | United States | 350,000 | 44,926,000 | |
| a MACOM Technology Solutions Holdings Inc | United States | 250,000 | 12,075,000 | |
| Monolithic Power Systems | United States | 200,000 | 18,420,000 | |
| NVIDIA Corp | United States | 350,000 | 38,125,500 | |
| Xilinx Inc | United States | 245,000 | 14,183,050 | |
| 287,606,100 | ||||
| Software 15.0% | ||||
| Activision Blizzard Inc | United States | 25,000 | 1,246,500 | |
| a Adobe Systems Inc | United States | 500,000 | 65,065,000 | |
| a ANSYS Inc | United States | 200,000 | 21,374,000 | |
| a Aspen Technology Inc | United States | 500,000 | 29,460,000 | |
| a Atlassian Corp. PLC | Australia | 300,000 | 8,985,000 | |
| a Autodesk Inc | United States | 140,000 | 12,105,800 | |
| a Blackline Inc | United States | 140,000 | 4,166,400 | |
| a Cadence Design Systems Inc | United States | 160,000 | 5,024,000 | |
| a Electronic Arts Inc | United States | 450,000 | 40,284,000 | |
| a Ellie Mae Inc | United States | 125,000 | 12,533,750 | |
| a Hubspot Inc | United States | 250,000 | 15,137,500 | |
| Intuit Inc | United States | 250,000 | 28,997,500 | |
| Microsoft Corp | United States | 750,000 | 49,395,000 | |
| a PTC Inc | United States | 100,000 | 5,255,000 | |
| a Salesforce.com Inc | United States | 850,000 | 70,116,500 | |
40 Semiannual Report
franklintempleton.com
FRANKLIN CUSTODIAN FUNDS
STATEMENT OF INVESTMENTS (UNAUDITED)
| Franklin DynaTech Fund (continued) | |||||
| Country | Shares | Value | |||
| Common Stocks (continued) | |||||
| Software (continued) | |||||
| a ServiceNow Inc | United States | 500,000 | $ | 43,735,000 | |
| a Snap Inc | United States | 100,000 | 2,253,000 | ||
| a Splunk Inc | United States | 100,000 | 6,229,000 | ||
| a Tyler Technologies Inc | United States | 80,000 | 12,364,800 | ||
| a Ultimate Software Group Inc | United States | 165,000 | 32,209,650 | ||
| a Workday Inc., A | United States | 200,000 | 16,656,000 | ||
| a Zendesk Inc | United States | 325,000 | 9,113,000 | ||
| 491,706,400 | |||||
| Technology Hardware, Storage & Peripherals 1.8% | |||||
| Apple Inc | United States | 400,000 | 57,464,000 | ||
| Textiles, Apparel & Luxury Goods 0.4% | |||||
| NIKE Inc., B | United States | 250,000 | 13,932,500 | ||
| Total Common Stocks (Cost $1,761,308,613) | 3,210,661,765 | ||||
| Short Term Investments (Cost $90,022,341) 2.7% | |||||
| Money Market Funds 2.7% | |||||
| b,c Institutional Fiduciary Trust Money Market Portfolio, 0.32% | United States | 90,022,341 | 90,022,341 | ||
| Total Investments (Cost $1,851,330,954) 100.4% | 3,300,684,106 | ||||
| Other Assets, less Liabilities (0.4)% | (12,813,855 | ) | |||
| Net Assets 100.0% | $ | 3,287,870,251 | |||
See Abbreviations on page 117.
aNon-income producing.
bSee Note 3(f) regarding investments in affiliated management investment companies.
cThe rate shown is the annualized seven-day yield at period end.
franklintempleton.com The accompanying notes are an integral part of these financial statements. | Semiannual Report 41
FRANKLIN CUSTODIAN FUNDS
| Financial Highlights | ||||||||||||||||||
| Franklin Growth Fund | ||||||||||||||||||
| Six Months Ended | ||||||||||||||||||
| March 31, 2017 | Year Ended September 30, | |||||||||||||||||
| (unaudited) | 2016 | 2015 | 2014 | 2013 | 2012 | |||||||||||||
| Class A | ||||||||||||||||||
| Per share operating performance | ||||||||||||||||||
| (for a share outstanding throughout the period) | ||||||||||||||||||
| Net asset value, beginning of period | $ | 78.54 | $ | 72.40 | $ | 70.51 | $ | 59.49 | $ | 50.13 | $ | 40.45 | ||||||
| Income from investment operationsa: | ||||||||||||||||||
| Net investment incomeb | 0.20 | 0.47 | c | 0.29 | 0.26 | 0.26 | 0.20 | |||||||||||
| Net realized and unrealized gains (losses) | 7.06 | 8.51 | 1.79 | 11.06 | 9.24 | 9.76 | ||||||||||||
| Total from investment operations | 7.26 | 8.98 | 2.08 | 11.32 | 9.50 | 9.96 | ||||||||||||
| Less distributions from: | ||||||||||||||||||
| Net investment income. | (0.39 | ) | (0.47 | ) | (0.19 | ) | (0.30 | ) | (0.14 | ) | (0.16 | ) | ||||||
| Net realized gains | (2.50 | ) | (2.37 | ) | — | — | — | (0.12 | ) | |||||||||
| Total distributions | (2.89 | ) | (2.84 | ) | (0.19 | ) | (0.30 | ) | (0.14 | ) | (0.28 | ) | ||||||
| Net asset value, end of period | $ | 82.91 | $ | 78.54 | $ | 72.40 | $ | 70.51 | $ | 59.49 | $ | 50.13 | ||||||
| Total returnd | 9.61 | % | 12.57 | % | 2.94 | % | 19.08 | % | 19.01 | % | 24.74 | % | ||||||
| Ratios to average net assetse | ||||||||||||||||||
| Expenses before waiver and payments by | ||||||||||||||||||
| affiliates | 0.87 | % | 0.88 | % | 0.88 | % | 0.90 | % | 0.91 | % | 0.94 | % | ||||||
| Expenses net of waiver and payments by | ||||||||||||||||||
| affiliates | 0.86 | %f | 0.86 | %f | 0.88 | %f,g | 0.90 | %f,g | 0.91 | %f | 0.94 | % | ||||||
| Net investment income | 0.51 | % | 0.63 | %c | 0.38 | % | 0.40 | % | 0.49 | % | 0.43 | % | ||||||
| Supplemental data | ||||||||||||||||||
| Net assets, end of period (000’s) | $ | 7,612,273 | $ | 7,628,523 | $ | 7,185,665 | $ | 6,611,073 | $ | 5,305,031 | $ | 4,135,962 | ||||||
| Portfolio turnover rate | 2.74 | % | 7.53 | % | 5.05 | % | 1.50 | % | 0.83 | % | 3.50 | % | ||||||
aThe amount shown for a share outstanding throughout the period may not correlate with the Statement of Operations for the period due to the timing of sales and
repurchases of the Fund’s shares in relation to income earned and/or fluctuating fair value of the investments of the Fund.
bBased on average daily shares outstanding.
cNet investment income per share includes approximately $0.10 per share related to income received in the form of special dividends in connection with certain Fund
holdings. Excluding this amount, the ratio of net investment income to average net assets would have been 0.50%.
dTotal return does not reflect sales commissions or contingent deferred sales charges, if applicable, and is not annualized for periods less than one year.
eRatios are annualized for periods less than one year.
fBenefit of expense reduction rounds to less than 0.01%.
gBenefit of waiver and payments by affiliates rounds to less than 0.01%.
42 Semiannual Report | The accompanying notes are an integral part of these financial statements. franklintempleton.com
| FRANKLIN CUSTODIAN FUNDS | ||||||||||||||||||
| FINANCIAL HIGHLIGHTS | ||||||||||||||||||
| Franklin Growth Fund (continued) | ||||||||||||||||||
| Six Months Ended | ||||||||||||||||||
| March 31, 2017 | Year Ended September 30, | |||||||||||||||||
| (unaudited) | 2016 | 2015 | 2014 | 2013 | 2012 | |||||||||||||
| Class C | ||||||||||||||||||
| Per share operating performance | ||||||||||||||||||
| (for a share outstanding throughout the period) | ||||||||||||||||||
| Net asset value, beginning of period | $ | 72.60 | $ | 67.17 | $ | 65.75 | $ | 55.64 | $ | 47.10 | $ | 38.16 | ||||||
| Income from investment operationsa: | ||||||||||||||||||
| Net investment income (loss)b | (0.09 | ) | (0.08 | )c | (0.26 | ) | (0.22 | ) | (0.13 | ) | (0.14 | ) | ||||||
| Net realized and unrealized gains (losses) | 6.53 | 7.88 | 1.68 | 10.33 | 8.67 | 9.20 | ||||||||||||
| Total from investment operations | 6.44 | 7.80 | 1.42 | 10.11 | 8.54 | 9.06 | ||||||||||||
| Less distributions from net realized gains. | (2.50 | ) | (2.37 | ) | — | — | — | (0.12 | ) | |||||||||
| Net asset value, end of period | $ | 76.54 | $ | 72.60 | $ | 67.17 | $ | 65.75 | $ | 55.64 | $ | 47.10 | ||||||
| Total returnd | 9.19 | % | 11.74 | % | 2.16 | % | 18.17 | % | 18.13 | % | 23.79 | % | ||||||
| Ratios to average net assetse | ||||||||||||||||||
| Expenses before waiver and payments by | ||||||||||||||||||
| affiliates | 1.62 | % | 1.63 | % | �� | 1.63 | % | 1.65 | % | 1.66 | % | 1.69 | % | |||||
| Expenses net of waiver and payments by | ||||||||||||||||||
| affiliates | 1.61 | %f | 1.61 | %f | 1.63 | %f,g | 1.65 | %f,g | 1.66 | %f | 1.69 | % | ||||||
| Net investment income (loss) | (0.24 | )% | (0.12 | )%c | (0.37 | )% | (0.35 | )% | (0.26 | )% | (0.32 | )% | ||||||
| Supplemental data | ||||||||||||||||||
| Net assets, end of period (000’s) | $ | 891,448 | $ | 846,965 | $ | 777,570 | $ | 662,548 | $ | 546,505 | $ | 466,205 | ||||||
| Portfolio turnover rate | 2.74 | % | 7.53 | % | 5.05 | % | 1.50 | % | 0.83 | % | 3.50 | % | ||||||
aThe amount shown for a share outstanding throughout the period may not correlate with the Statement of Operations for the period due to the timing of sales and
repurchases of the Fund’s shares in relation to income earned and/or fluctuating fair value of the investments of the Fund.
bBased on average daily shares outstanding.
cNet investment income per share includes approximately $0.10 per share related to income received in the form of special dividends in connection with certain Fund
holdings. Excluding this amount, the ratio of net investment income to average net assets would have been (0.25)%.
dTotal return does not reflect sales commissions or contingent deferred sales charges, if applicable, and is not annualized for periods less than one year.
eRatios are annualized for periods less than one year.
fBenefit of expense reduction rounds to less than 0.01%.
gBenefit of waiver and payments by affiliates rounds to less than 0.01%.
franklintempleton.com The accompanying notes are an integral part of these financial statements. | Semiannual Report 43
| FRANKLIN CUSTODIAN FUNDS | ||||||||||||||||||
| FINANCIAL HIGHLIGHTS | ||||||||||||||||||
| Franklin Growth Fund (continued) | ||||||||||||||||||
| Six Months Ended | ||||||||||||||||||
| March 31, 2017 | Year Ended September 30, | |||||||||||||||||
| (unaudited) | 2016 | 2015 | 2014 | 2013 | 2012 | |||||||||||||
| Class R | ||||||||||||||||||
| Per share operating performance | ||||||||||||||||||
| (for a share outstanding throughout the period) | ||||||||||||||||||
| Net asset value, beginning of period | $ | 78.14 | $ | 71.93 | $ | 70.05 | $ | 59.07 | $ | 49.82 | $ | 40.23 | ||||||
| Income from investment operationsa: | ||||||||||||||||||
| Net investment incomeb | 0.11 | 0.29 | c | 0.10 | 0.10 | 0.13 | 0.08 | |||||||||||
| Net realized and unrealized gains (losses) | 7.03 | 8.45 | 1.78 | 10.98 | 9.18 | 9.71 | ||||||||||||
| Total from investment operations | 7.14 | 8.74 | 1.88 | 11.08 | 9.31 | 9.79 | ||||||||||||
| Less distributions from: | ||||||||||||||||||
| Net investment income. | (0.21 | ) | (0.16 | ) | — | (0.10 | ) | (0.06 | ) | (0.08 | ) | |||||||
| Net realized gains | (2.50 | ) | (2.37 | ) | — | — | — | (0.12 | ) | |||||||||
| Total distributions | (2.71 | ) | (2.53 | ) | — | (0.10 | ) | (0.06 | ) | (0.20 | ) | |||||||
| Net asset value, end of period | $ | 82.57 | $ | 78.14 | $ | 71.93 | $ | 70.05 | $ | 59.07 | $ | 49.82 | ||||||
| Total returnd | 9.46 | % | 12.29 | % | 2.68 | % | 18.77 | % | 18.71 | % | 24.42 | % | ||||||
| Ratios to average net assetse | ||||||||||||||||||
| Expenses before waiver and payments by | ||||||||||||||||||
| affiliates | 1.12 | % | 1.13 | % | 1.13 | % | 1.15 | % | 1.16 | % | 1.19 | % | ||||||
| Expenses net of waiver and payments by | ||||||||||||||||||
| affiliates | 1.11 | %f | 1.11 | %f | 1.13 | %f,g | 1.15 | %f,g | 1.16 | %f | 1.19 | % | ||||||
| Net investment income | 0.26 | % | 0.38 | %c | 0.13 | % | 0.15 | % | 0.24 | % | 0.18 | % | ||||||
| Supplemental data | ||||||||||||||||||
| Net assets, end of period (000’s) | $ | 493,636 | $ | 477,221 | $ | 501,813 | $ | 565,634 | $ | 552,391 | $ | 466,954 | ||||||
| Portfolio turnover rate | 2.74 | % | 7.53 | % | 5.05 | % | 1.50 | % | 0.83 | % | 3.50 | % | ||||||
aThe amount shown for a share outstanding throughout the period may not correlate with the Statement of Operations for the period due to the timing of sales and
repurchases of the Fund’s shares in relation to income earned and/or fluctuating fair value of the investments of the Fund.
bBased on average daily shares outstanding.
cNet investment income per share includes approximately $0.10 per share related to income received in the form of special dividends in connection with certain Fund
holdings. Excluding this amount, the ratio of net investment income to average net assets would have been 0.25%.
dTotal return is not annualized for periods less than one year.
eRatios are annualized for periods less than one year.
fBenefit of expense reduction rounds to less than 0.01%.
gBenefit of waiver and payments by affiliates rounds to less than 0.01%.
44 Semiannual Report | The accompanying notes are an integral part of these financial statements. franklintempleton.com
| FRANKLIN CUSTODIAN FUNDS | |||||||||||||||
| FINANCIAL HIGHLIGHTS | |||||||||||||||
| Franklin Growth Fund (continued) | |||||||||||||||
| Six Months Ended | |||||||||||||||
| March 31, 2017 | Year Ended September 30, | ||||||||||||||
| (unaudited) | 2016 | 2015 | 2014 | 2013 | a | ||||||||||
| Class R6 | |||||||||||||||
| Per share operating performance | |||||||||||||||
| (for a share outstanding throughout the period) | |||||||||||||||
| Net asset value, beginning of period | $ | 78.79 | $ | 72.69 | $ | 70.76 | $ | 59.71 | $ | 54.58 | |||||
| Income from investment operationsb: | |||||||||||||||
| Net investment incomec | 0.36 | 0.78 | d | 0.61 | 0.55 | 0.24 | |||||||||
| Net realized and unrealized gains (losses) | 7.06 | 8.56 | 1.79 | 11.08 | 4.89 | ||||||||||
| Total from investment operations. | 7.42 | 9.34 | 2.40 | 11.63 | 5.13 | ||||||||||
| Less distributions from: | |||||||||||||||
| Net investment income | (0.72 | ) | (0.87 | ) | (0.47 | ) | (0.58 | ) | — | ||||||
| Net realized gains | (2.50 | ) | (2.37 | ) | — | — | — | ||||||||
| Total distributions | (3.22 | ) | (3.24 | ) | (0.47 | ) | (0.58 | ) | — | ||||||
| Net asset value, end of period. | $ | 82.99 | $ | 78.79 | $ | 72.69 | $ | 70.76 | $ | 59.71 | |||||
| Total returne | 9.82 | % | 13.05 | % | 3.37 | % | 19.59 | % | 9.40 | % | |||||
| Ratios to average net assetsf | |||||||||||||||
| Expenses before waiver and payments by affiliates | 0.46 | % | 0.46 | % | 0.46 | % | 0.47 | % | 0.48 | % | |||||
| Expenses net of waiver and payments by affiliatesg | 0.45 | % | 0.44 | % | 0.46 | %h | 0.47 | %h | 0.48 | % | |||||
| Net investment income. | 0.92 | % | 1.05 | %d | 0.80 | % | 0.83 | % | 0.92 | % | |||||
| Supplemental data | |||||||||||||||
| Net assets, end of period (000’s) | $ | 1,530,534 | $ | 1,247,825 | $ | 1,163,362 | $ | 1,107,887 | $ | 871,260 | |||||
| Portfolio turnover rate | 2.74 | % | 7.53 | % | 5.05 | % | 1.50 | % | 0.83 | % | |||||
aFor the period May 1, 2013 (effective date) to September 30, 2013.
bThe amount shown for a share outstanding throughout the period may not correlate with the Statement of Operations for the period due to the timing of sales and
repurchases of the Fund’s shares in relation to income earned and/or fluctuating fair value of the investments of the Fund.
cBased on average daily shares outstanding.
dNet investment income per share includes approximately $0.10 per share related to income received in the form of special dividends in connection with certain Fund
holdings. Excluding this amount, the ratio of net investment income to average net assets would have been 0.92%.
eTotal return is not annualized for periods less than one year.
fRatios are annualized for periods less than one year.
gBenefit of expense reduction rounds to less than 0.01%.
hBenefit of waiver and payments by affiliates rounds to less than 0.01%.
franklintempleton.com The accompanying notes are an integral part of these financial statements. | Semiannual Report 45
| FRANKLIN CUSTODIAN FUNDS | ||||||||||||||||||
| FINANCIAL HIGHLIGHTS | ||||||||||||||||||
| Franklin Growth Fund (continued) | ||||||||||||||||||
| Six Months Ended | ||||||||||||||||||
| March 31, 2017 | Year Ended September 30, | |||||||||||||||||
| (unaudited) | 2016 | 2015 | 2014 | 2013 | 2012 | |||||||||||||
| Advisor Class | ||||||||||||||||||
| Per share operating performance | ||||||||||||||||||
| (for a share outstanding throughout the period) | ||||||||||||||||||
| Net asset value, beginning of period | $ | 78.80 | $ | 72.67 | $ | 70.75 | $ | 59.66 | $ | 50.24 | $ | 40.53 | ||||||
| Income from investment operationsa: | ||||||||||||||||||
| Net investment incomeb | 0.30 | 0.65 | c | 0.48 | 0.43 | 0.39 | 0.32 | |||||||||||
| Net realized and unrealized gains (losses) | 7.07 | 8.56 | 1.79 | 11.08 | 9.26 | 9.78 | ||||||||||||
| Total from investment operations | 7.37 | 9.21 | 2.27 | 11.51 | 9.65 | 10.10 | ||||||||||||
| Less distributions from: | ||||||||||||||||||
| Net investment income. | (0.61 | ) | (0.71 | ) | (0.35 | ) | (0.42 | ) | (0.23 | ) | (0.27 | ) | ||||||
| Net realized gains | (2.50 | ) | (2.37 | ) | — | — | — | (0.12 | ) | |||||||||
| Total distributions | (3.11 | ) | (3.08 | ) | (0.35 | ) | (0.42 | ) | (0.23 | ) | (0.39 | ) | ||||||
| Net asset value, end of period | $ | 83.06 | $ | 78.80 | $ | 72.67 | $ | 70.75 | $ | 59.66 | $ | 50.24 | ||||||
| Total returnd | 9.74 | % | 12.85 | % | 3.20 | % | 19.37 | % | 19.29 | % | 25.04 | % | ||||||
| Ratios to average net assetse | ||||||||||||||||||
| Expenses before waiver and payments by | ||||||||||||||||||
| affiliates | 0.62 | % | 0.63 | % | 0.63 | % | 0.65 | % | 0.66 | % | 0.69 | % | ||||||
| Expenses net of waiver and payments by | ||||||||||||||||||
| affiliates | 0.61 | %f | 0.61 | %f | 0.63 | %f,g | 0.65 | %f,g | 0.66 | %f | 0.69 | % | ||||||
| Net investment income | 0.76 | % | 0.88 | %c | 0.63 | % | 0.65 | % | 0.74 | % | 0.68 | % | ||||||
| Supplemental data | ||||||||||||||||||
| Net assets, end of period (000’s) | $ | 2,351,193 | $ | 1,998,483 | $ | 1,514,492 | $ | 1,414,980 | $ | 1,080,811 | $ | 1,399,191 | ||||||
| Portfolio turnover rate | 2.74 | % | 7.53 | % | 5.05 | % | 1.50 | % | 0.83 | % | 3.50 | % | ||||||
aThe amount shown for a share outstanding throughout the period may not correlate with the Statement of Operations for the period due to the timing of sales and
repurchases of the Fund’s shares in relation to income earned and/or fluctuating fair value of the investments of the Fund.
bBased on average daily shares outstanding.
cNet investment income per share includes approximately $0.10 per share related to income received in the form of special dividends in connection with certain Fund
holdings. Excluding this amount, the ratio of net investment income to average net assets would have been 0.75%.
dTotal return is not annualized for periods less than one year.
eRatios are annualized for periods less than one year.
fBenefit of expense reduction rounds to less than 0.01%.
gBenefit of waiver and payments by affiliates rounds to less than 0.01%.
46 Semiannual Report | The accompanying notes are an integral part of these financial statements. franklintempleton.com
FRANKLIN CUSTODIAN FUNDS
| Statement of Investments, March 31, 2017 (unaudited) | ||||
| Franklin Growth Fund | ||||
| Country | Shares | Value | ||
| Common Stocks 96.3% | ||||
| Automobiles & Components 1.1% | ||||
| Adient PLC | United States | 133,712 | $ | 9,716,851 |
| BorgWarner Inc | United States | 1,650,000 | 68,953,500 | |
| Ford Motor Co | United States | 1,200,000 | 13,968,000 | |
| Harley-Davidson Inc | United States | 913,096 | 55,242,308 | |
| 147,880,659 | ||||
| Banks 0.4% | ||||
| a Signature Bank | United States | 23,000 | 3,412,970 | |
| U.S. Bancorp | United States | 100,000 | 5,150,000 | |
| Wells Fargo & Co | United States | 750,000 | 41,745,000 | |
| 50,307,970 | ||||
| Capital Goods 18.0% | ||||
| 3M Co | United States | 855,000 | 163,587,150 | |
| Allegion PLC. | United States | 700,000 | 52,990,000 | |
| AMETEK Inc | United States | 700,000 | 37,856,000 | |
| The Boeing Co | United States | 1,100,000 | 194,546,000 | |
| Caterpillar Inc | United States | 550,000 | 51,018,000 | |
| Deere & Co | United States | 500,000 | 54,430,000 | |
| Emerson Electric Co | United States | 1,100,000 | 65,846,000 | |
| Fortive Corp | United States | 525,000 | 31,615,500 | |
| General Dynamics Corp | United States | 1,000,000 | 187,200,000 | |
| General Electric Co | United States | 1,800,000 | 53,640,000 | |
| Huntington Ingalls Industries Inc | United States | 425,000 | 85,102,000 | |
| Illinois Tool Works Inc | United States | 1,000,000 | 132,470,000 | |
| Ingersoll-Rand PLC | United States | 1,100,000 | 89,452,000 | |
| Johnson Controls International PLC | United States | 1,337,120 | 56,319,495 | |
| Lockheed Martin Corp | United States | 500,000 | 133,800,000 | |
| Northrop Grumman Corp | United States | 1,100,000 | 261,624,000 | |
| Raytheon Co | United States | 600,000 | 91,500,000 | |
| Rockwell Collins Inc | United States | 350,000 | 34,006,000 | |
| a Sensata Technologies Holding NV | United States | 3,200,000 | 139,744,000 | |
| Stanley Black & Decker Inc | United States | 650,000 | 86,365,500 | |
| Textron Inc | United States | 1,600,000 | 76,144,000 | |
| United Technologies Corp | United States | 930,000 | 104,355,300 | |
| W.W. Grainger Inc | United States | 550,000 | 128,018,000 | |
| 2,311,628,945 | ||||
| Commercial & Professional Services 3.2% | ||||
| Dun & Bradstreet Corp | United States | 675,000 | 72,859,500 | |
| Equifax Inc | United States | 550,000 | 75,207,000 | |
| a IHS Markit Ltd | United States | 3,556,600 | 149,199,370 | |
| a Stericycle Inc | United States | 500,000 | 41,445,000 | |
| a Verisk Analytics Inc | United States | 850,000 | 68,969,000 | |
| 407,679,870 | ||||
| Consumer Durables & Apparel 0.8% | ||||
| NIKE Inc., B | United States | 1,880,000 | 104,772,400 | |
| Consumer Services 1.1% | ||||
| Carnival Corp | United States | 1,200,000 | 70,692,000 | |
| Graham Holdings Co., B | United States | 80,000 | 47,964,000 | |
| Marriott International Inc., A | United States | 200,000 | 18,836,000 | |
| Starbucks Corp | United States | 78,000 | 4,554,420 | |
| 142,046,420 | ||||
franklintempleton.com
Semiannual Report 47
FRANKLIN CUSTODIAN FUNDS
STATEMENT OF INVESTMENTS (UNAUDITED)
| Franklin Growth Fund (continued) | ||||
| Country | Shares | Value | ||
| Common Stocks (continued) | ||||
| Diversified Financials 3.5% | ||||
| American Express Co | United States | 600,000 | $ | 47,466,000 |
| a Berkshire Hathaway Inc., A | United States | 184 | 45,972,400 | |
| BlackRock Inc | United States | 225,000 | 86,289,750 | |
| The Charles Schwab Corp | United States | 3,000,000 | 122,430,000 | |
| Intercontinental Exchange Inc | United States | 1,400,000 | 83,818,000 | |
| T. Rowe Price Group Inc | United States | 900,000 | 61,335,000 | |
| 447,311,150 | ||||
| Energy 2.3% | ||||
| Anadarko Petroleum Corp | United States | 1,250,000 | 77,500,000 | |
| Cabot Oil & Gas Corp., A | United States | 1,700,000 | 40,647,000 | |
| Halliburton Co | United States | 850,000 | 41,828,500 | |
| Occidental Petroleum Corp | United States | 300,000 | 19,008,000 | |
| Royal Dutch Shell PLC, A, ADR | United Kingdom | 345,000 | 18,191,850 | |
| Schlumberger Ltd | United States | 573,700 | 44,805,970 | |
| a TechnipFMC PLC | United Kingdom | 1,500,000 | 48,750,000 | |
| 290,731,320 | ||||
| Food & Staples Retailing 0.4% | ||||
| Costco Wholesale Corp | United States | 28,000 | 4,695,320 | |
| CVS Health Corp | United States | 656,000 | 51,496,000 | |
| 56,191,320 | ||||
| Food, Beverage & Tobacco 3.3% | ||||
| Anheuser-Busch InBev SA/NV, ADR | Belgium | 350,000 | 38,416,000 | |
| Brown-Forman Corp., B | United States | 1,300,000 | 60,034,000 | |
| Constellation Brands Inc., A | United States | 400,000 | 64,828,000 | |
| Mondelez International Inc., A | United States | 1,500,000 | 64,620,000 | |
| a Monster Beverage Corp | United States | 2,700,000 | 124,659,000 | |
| PepsiCo Inc | United States | 650,000 | 72,709,000 | |
| 425,266,000 | ||||
| Health Care Equipment & Services 7.4% | ||||
| Abbott Laboratories | United States | 1,350,000 | 59,953,500 | |
| Aetna Inc | United States | 650,000 | 82,907,500 | |
| Baxter International Inc | United States | 400,000 | 20,744,000 | |
| Becton, Dickinson and Co | United States | 77,700 | 14,253,288 | |
| Cardinal Health Inc | United States | 300,000 | 24,465,000 | |
| Danaher Corp | United States | 1,050,000 | 89,806,500 | |
| a Edwards Lifesciences Corp | United States | 400,000 | 37,628,000 | |
| a Haemonetics Corp | United States | 1,000,000 | 40,570,000 | |
| a Henry Schein Inc | United States | 350,000 | 59,489,500 | |
| Hill-Rom Holdings Inc | United States | 300,000 | 21,180,000 | |
| a Intuitive Surgical Inc | United States | 150,000 | 114,970,500 | |
| a Laboratory Corp. of America Holdings | United States | 500,000 | 71,735,000 | |
| Medtronic PLC | United States | 406,300 | 32,731,528 | |
| Quest Diagnostics Inc | United States | 900,000 | 88,371,000 | |
| Stryker Corp | United States | 400,000 | 52,660,000 | |
| Teleflex Inc | United States | 500,000 | 96,865,000 | |
| a Varex Imaging Corp | United States | 120,000 | 4,032,000 | |
| a Varian Medical Systems Inc | United States | 300,000 | 27,339,000 | |
| Zimmer Biomet Holdings Inc | United States | 100,000 | 12,211,000 | |
| 951,912,316 | ||||
48 Semiannual Report
franklintempleton.com
FRANKLIN CUSTODIAN FUNDS
STATEMENT OF INVESTMENTS (UNAUDITED)
| Franklin Growth Fund (continued) | ||||
| Country | Shares | Value | ||
| Common Stocks (continued) | ||||
| Household & Personal Products 0.2% | ||||
| The Procter & Gamble Co | United States | 335,000 | $ | 30,099,750 |
| Insurance 0.3% | ||||
| Aflac Inc | United States | 600,000 | 43,452,000 | |
| Materials 4.4% | ||||
| Air Products and Chemicals Inc | United States | 500,000 | 67,645,000 | |
| a Axalta Coating Systems Ltd | United States | 3,400,000 | 109,480,000 | |
| Celanese Corp., A | United States | 1,250,000 | 112,312,500 | |
| The Dow Chemical Co | United States | 90,000 | 5,718,600 | |
| Ecolab Inc | United States | 920,000 | 115,312,800 | |
| Martin Marietta Materials Inc | United States | 400,000 | 87,300,000 | |
| Praxair Inc | United States | 575,000 | 68,195,000 | |
| 565,963,900 | ||||
| Media 1.9% | ||||
| Cable One Inc | United States | 80,000 | 49,957,600 | |
| Comcast Corp., A | United States | 110,000 | 4,134,900 | |
| The Walt Disney Co | United States | 1,724,290 | 195,517,243 | |
| 249,609,743 | ||||
| Pharmaceuticals, Biotechnology & Life Sciences 13.8% | ||||
| AbbVie Inc | United States | 460,000 | 29,973,600 | |
| Agilent Technologies Inc | United States | 1,300,000 | 68,731,000 | |
| Allergan PLC | United States | 400,000 | 95,568,000 | |
| Amgen Inc | United States | 1,000,000 | 164,070,000 | |
| a Biogen Inc | United States | 500,000 | 136,710,000 | |
| a Bioverativ Inc | United States | 250,000 | 13,615,000 | |
| a Bluebird Bio Inc | United States | 400,000 | 36,360,000 | |
| a Catalent Inc | United States | 3,400,000 | 96,288,000 | |
| a Celgene Corp | United States | 1,300,000 | 161,759,000 | |
| Eli Lilly & Co | United States | 1,450,000 | 121,959,500 | |
| Gilead Sciences Inc | United States | 650,000 | 44,148,000 | |
| a Illumina Inc | United States | 525,000 | 89,586,000 | |
| Johnson & Johnson | United States | 1,200,100 | 149,472,455 | |
| Merck & Co. Inc | United States | 1,000,000 | 63,540,000 | |
| a Mettler-Toledo International Inc | United States | 425,000 | 203,536,750 | |
| a Neurocrine Biosciences Inc | United States | 300,000 | 12,990,000 | |
| Pfizer Inc | United States | 2,761,000 | 94,453,810 | |
| Roche Holding AG, ADR | Switzerland | 1,700,000 | 54,451,000 | |
| Shire PLC, ADR | United Kingdom | 59,280 | 10,328,354 | |
| a Tesaro Inc | United States | 200,000 | 30,774,000 | |
| a Waters Corp | United States | 625,000 | 97,693,750 | |
| 1,776,008,219 | ||||
| Real Estate 1.3% | ||||
| American Tower Corp | United States | 900,000 | 109,386,000 | |
| Equinix Inc | United States | 150,000 | 60,055,500 | |
| 169,441,500 | ||||
| Retailing 2.7% | ||||
| a Amazon.com Inc | United States | 350,000 | 310,289,000 | |
| Expedia Inc | United States | 200,000 | 25,234,000 | |
| Lowe’s Cos. Inc | United States | 60,000 | 4,932,600 | |
| The TJX Cos. Inc | United States | 40,000 | 3,163,200 | |
| 343,618,800 | ||||
franklintempleton.com
Semiannual Report 49
FRANKLIN CUSTODIAN FUNDS
STATEMENT OF INVESTMENTS (UNAUDITED)
| Franklin Growth Fund (continued) | ||||
| Country | Shares | Value | ||
| Common Stocks (continued) | ||||
| Semiconductors & Semiconductor Equipment 2.3% | ||||
| ASML Holding NV, N.Y. shs | Netherlands | 650,000 | $ | 86,320,000 |
| Broadcom Ltd | Singapore | 20,000 | 4,379,200 | |
| Intel Corp | United States | 1,100,000 | 39,677,000 | |
| Lam Research Corp | United States | 30,000 | 3,850,800 | |
| Microchip Technology Inc | United States | 45,000 | 3,320,100 | |
| QUALCOMM Inc | United States | 660,000 | 37,844,400 | |
| Texas Instruments Inc | United States | 1,400,000 | 112,784,000 | |
| a Versum Materials Inc | United States | 250,000 | 7,650,000 | |
| 295,825,500 | ||||
| Software & Services 13.6% | ||||
| a Alibaba Group Holding Ltd., ADR | China | 480,400 | 51,801,532 | |
| a Alphabet Inc., A | United States | 165,000 | 139,887,000 | |
| a Alphabet Inc., C | United States | 158,432 | 131,428,850 | |
| a Autodesk Inc | United States | 800,000 | 69,176,000 | |
| Automatic Data Processing Inc | United States | 700,000 | 71,673,000 | |
| CDK Global LLC | United States | 233,333 | 15,168,978 | |
| a Check Point Software Technologies Ltd | Israel | 525,000 | 53,896,500 | |
| Computer Sciences Corp | United States | 1,400,000 | 96,614,000 | |
| CSRA Inc | United States | 2,300,000 | 67,367,000 | |
| a Facebook Inc., A | United States | 600,000 | 85,230,000 | |
| a IAC/InterActiveCorp | United States | 300,000 | 22,116,000 | |
| International Business Machines Corp | United States | 600,000 | 104,484,000 | |
| Intuit Inc | United States | 1,000,000 | 115,990,000 | |
| Mastercard Inc., A | United States | 1,400,000 | 157,458,000 | |
| Microsoft Corp | United States | 3,400,000 | 223,924,000 | |
| Oracle Corp | United States | 1,000,000 | 44,610,000 | |
| a Salesforce.com Inc | United States | 61,000 | 5,031,890 | |
| a ServiceNow Inc | United States | 1,000,000 | 87,470,000 | |
| Visa Inc., A. | United States | 1,400,000 | 124,418,000 | |
| a Yahoo! Inc | United States | 1,700,000 | 78,897,000 | |
| 1,746,641,750 | ||||
| Technology Hardware & Equipment 7.4% | ||||
| Apple Inc | United States | 4,086,000 | 586,994,760 | |
| Cisco Systems Inc | United States | 2,945,000 | 99,541,000 | |
| a Keysight Technologies Inc | United States | 650,000 | 23,491,000 | |
| a Palo Alto Networks Inc | United States | 300,000 | 33,804,000 | |
| TE Connectivity Ltd | United States | 1,650,000 | 123,007,500 | |
| a Trimble Inc | United States | 2,700,000 | 86,427,000 | |
| 953,265,260 | ||||
| Transportation 6.2% | ||||
| Alaska Air Group Inc | United States | 3,200,000 | 295,104,000 | |
| Allegiant Travel Co | United States | 200,000 | 32,050,000 | |
| Canadian National Railway Co | Canada | 1,000,000 | 73,930,000 | |
| Canadian Pacific Railway Ltd | Canada | 500,000 | 73,460,000 | |
| Expeditors International of Washington Inc | United States | 600,000 | 33,894,000 | |
| J.B. Hunt Transport Services Inc | United States | 200,000 | 18,348,000 | |
| Kansas City Southern | United States | 450,000 | 38,592,000 | |
| a Ryanair Holdings PLC, ADR | Ireland | 233,220 | 19,352,596 | |
| Union Pacific Corp | United States | 2,030,000 | 215,017,600 | |
| 799,748,196 | ||||
50 Semiannual Report
franklintempleton.com
FRANKLIN CUSTODIAN FUNDS
STATEMENT OF INVESTMENTS (UNAUDITED)
| Franklin Growth Fund (continued) | ||||
| Country | Shares | Value | ||
| Common Stocks (continued) | ||||
| Utilities 0.7% | ||||
| American Water Works Co. Inc | United States | 700,000 | $ | 54,439,000 |
| NextEra Energy Inc | United States | 250,000 | 32,092,500 | |
| 86,531,500 | ||||
| Total Common Stocks (Cost $5,210,993,263) | 12,395,934,488 | |||
| Short Term Investments (Cost $429,623,522) 3.3% | ||||
| Money Market Funds 3.3% | ||||
| b,c Institutional Fiduciary Trust Money Market Portfolio, 0.32% | United States | 429,623,522 | 429,623,522 | |
| Total Investments (Cost $5,640,616,785) 99.6% | 12,825,558,010 | |||
| Other Assets, less Liabilities 0.4% | 53,525,568 | |||
| Net Assets 100.0% | $ | 12,879,083,578 | ||
See Abbreviations on page 117.
aNon-income producing.
bSee Note 3(f) regarding investments in affiliated management investment companies.
cThe rate shown is the annualized seven-day yield at period end.
franklintempleton.com The accompanying notes are an integral part of these financial statements. | Semiannual Report 51
FRANKLIN CUSTODIAN FUNDS
| Financial Highlights | ||||||||||||||||||
| Franklin Income Fund | ||||||||||||||||||
| Six Months Ended | ||||||||||||||||||
| March 31, 2017 | Year Ended September 30, | |||||||||||||||||
| (unaudited) | 2016 | 2015 | 2014 | 2013 | 2012 | |||||||||||||
| Class A | ||||||||||||||||||
| Per share operating performance | ||||||||||||||||||
| (for a share outstanding throughout the period) | ||||||||||||||||||
| Net asset value, beginning of period | $ | 2.25 | $ | 2.10 | $ | 2.48 | $ | 2.33 | $ | 2.23 | $ | 1.98 | ||||||
| Income from investment operationsa: | ||||||||||||||||||
| Net investment incomeb | 0.05 | 0.10 | 0.10 | 0.11 | 0.11 | 0.13 | ||||||||||||
| Net realized and unrealized gains (losses) | 0.12 | 0.17 | (0.36 | ) | 0.16 | 0.12 | 0.26 | |||||||||||
| Total from investment operations | 0.17 | 0.27 | (0.26 | ) | 0.27 | 0.23 | 0.39 | |||||||||||
| Less distributions from net investment income . | (0.06 | ) | (0.12 | ) | (0.12 | ) | (0.12 | ) | (0.13 | ) | (0.14 | ) | ||||||
| Net asset value, end of period | $ | 2.36 | $ | 2.25 | $ | 2.10 | $ | 2.48 | $ | 2.33 | $ | 2.23 | ||||||
| Total returnc | 7.68 | % | 13.31 | % | (10.93 | )% | 11.86 | % | 10.72 | % | 20.38 | % | ||||||
| Ratios to average net assetsd | ||||||||||||||||||
| Expensese | 0.62 | %f | 0.61 | %f | 0.61 | %f | 0.61 | %f | 0.62 | % | 0.64 | % | ||||||
| Net investment income | 4.21 | % | 4.57 | % | 4.43 | % | 4.28 | % | 4.98 | % | 5.90 | % | ||||||
| Supplemental data | ||||||||||||||||||
| Net assets, end of period (000’s) | $ | 46,224,872 | $ | 45,515,127 | $ | 44,886,127 | $ | 53,823,921 | $ | 48,320,611 | $ | 41,280,437 | ||||||
| Portfolio turnover rate | 19.98 | % | 61.26 | % | 44.81 | % | 36.03 | % | 37.60 | % | 33.44 | % | ||||||
aThe amount shown for a share outstanding throughout the period may not correlate with the Statement of Operations for the period due to the timing of sales and
repurchases of the Fund’s shares in relation to income earned and/or fluctuating fair value of the investments of the Fund.
bBased on average daily shares outstanding.
cTotal return does not reflect sales commissions or contingent deferred sales charges, if applicable, and is not annualized for periods less than one year.
dRatios are annualized for periods less than one year.
eBenefit of expense reduction rounds to less than 0.01%.
fBenefit of waiver and payments by affiliates rounds to less than 0.01%.
52 Semiannual Report | The accompanying notes are an integral part of these financial statements. franklintempleton.com
| FRANKLIN CUSTODIAN FUNDS | ||||||||||||||||||
| FINANCIAL HIGHLIGHTS | ||||||||||||||||||
| Franklin Income Fund (continued) | ||||||||||||||||||
| Six Months Ended | ||||||||||||||||||
| March 31, 2017 | Year Ended September 30, | |||||||||||||||||
| (unaudited) | 2016 | 2015 | 2014 | 2013 | 2012 | |||||||||||||
| Class C | ||||||||||||||||||
| Per share operating performance | ||||||||||||||||||
| (for a share outstanding throughout the period) | ||||||||||||||||||
| Net asset value, beginning of period | $ | 2.27 | $ | 2.13 | $ | 2.50 | $ | 2.35 | $ | 2.25 | $ | 2.00 | ||||||
| Income from investment operationsa: | ||||||||||||||||||
| Net investment incomeb | 0.04 | 0.09 | 0.09 | 0.09 | 0.10 | 0.12 | ||||||||||||
| Net realized and unrealized gains (losses) | 0.12 | 0.16 | (0.35 | ) | 0.17 | 0.12 | 0.26 | |||||||||||
| Total from investment operations | 0.16 | 0.25 | (0.26 | ) | 0.26 | 0.22 | 0.38 | |||||||||||
| Less distributions from net investment income . | (0.05 | ) | (0.11 | ) | (0.11 | ) | (0.11 | ) | (0.12 | ) | (0.13 | ) | ||||||
| Net asset value, end of period | $ | 2.38 | $ | 2.27 | $ | 2.13 | $ | 2.50 | $ | 2.35 | $ | 2.25 | ||||||
| Total returnc | 7.32 | % | 12.07 | % | (10.89 | )% | 11.19 | % | 10.07 | % | 19.58 | % | ||||||
| Ratios to average net assetsd | ||||||||||||||||||
| Expensese | 1.12 | %f | 1.11 | %f | 1.11 | %f | 1.11 | %f | 1.12 | % | 1.14 | % | ||||||
| Net investment income | 3.71 | % | 4.07 | % | 3.93 | % | 3.78 | % | 4.48 | % | 5.40 | % | ||||||
| Supplemental data | ||||||||||||||||||
| Net assets, end of period (000’s) | $ | 24,112,232 | $ | 23,841,466 | $ | 24,091,638 | $ | 28,802,209 | $ | 24,016,797 | $ | 20,220,114 | ||||||
| Portfolio turnover rate | 19.98 | % | 61.26 | % | 44.81 | % | 36.03 | % | 37.60 | % | 33.44 | % | ||||||
aThe amount shown for a share outstanding throughout the period may not correlate with the Statement of Operations for the period due to the timing of sales and
repurchases of the Fund’s shares in relation to income earned and/or fluctuating fair value of the investments of the Fund.
bBased on average daily shares outstanding.
cTotal return does not reflect sales commissions or contingent deferred sales charges, if applicable, and is not annualized for periods less than one year.
dRatios are annualized for periods less than one year.
eBenefit of expense reduction rounds to less than 0.01%.
fBenefit of waiver and payments by affiliates rounds to less than 0.01%.
franklintempleton.com The accompanying notes are an integral part of these financial statements. | Semiannual Report 53
| FRANKLIN CUSTODIAN FUNDS | ||||||||||||||||||
| FINANCIAL HIGHLIGHTS | ||||||||||||||||||
| Franklin Income Fund (continued) | ||||||||||||||||||
| Six Months Ended | ||||||||||||||||||
| March 31, 2017 | Year Ended September 30, | |||||||||||||||||
| (unaudited) | 2016 | 2015 | 2014 | 2013 | 2012 | |||||||||||||
| Class R | ||||||||||||||||||
| Per share operating performance | ||||||||||||||||||
| (for a share outstanding throughout the period) | ||||||||||||||||||
| Net asset value, beginning of period | $ | 2.21 | $ | 2.07 | $ | 2.44 | $ | 2.29 | $ | 2.20 | $ | 1.96 | ||||||
| Income from investment operationsa: | ||||||||||||||||||
| Net investment incomeb | 0.04 | 0.09 | 0.10 | 0.10 | 0.11 | 0.12 | ||||||||||||
| Net realized and unrealized gains (losses) | 0.12 | 0.16 | (0.36 | ) | 0.16 | 0.10 | 0.25 | |||||||||||
| Total from investment operations | 0.16 | 0.25 | (0.26 | ) | 0.26 | 0.21 | 0.37 | |||||||||||
| Less distributions from net investment income . | (0.06 | ) | (0.11 | ) | (0.11 | ) | (0.11 | ) | (0.12 | ) | (0.13 | ) | ||||||
| Net asset value, end of period | $ | 2.31 | $ | 2.21 | $ | 2.07 | $ | 2.44 | $ | 2.29 | $ | 2.20 | ||||||
| Total returnc | 7.15 | % | 12.62 | % | (10.99 | )% | 11.66 | % | 10.03 | % | 19.66 | % | ||||||
| Ratios to average net assetsd | ||||||||||||||||||
| Expensese | 0.97 | %f | 0.96 | %f | 0.96 | %f | 0.96 | %f | 0.97 | % | 0.99 | % | ||||||
| Net investment income | 3.86 | % | 4.22 | % | 4.08 | % | 3.93 | % | 4.63 | % | 5.55 | % | ||||||
| Supplemental data | ||||||||||||||||||
| Net assets, end of period (000’s) | $ | 393,016 | $ | 396,107 | $ | 416,653 | $ | 514,892 | $ | 446,463 | $ | 426,525 | ||||||
| Portfolio turnover rate | 19.98 | % | 61.26 | % | 44.81 | % | 36.03 | % | 37.60 | % | 33.44 | % | ||||||
aThe amount shown for a share outstanding throughout the period may not correlate with the Statement of Operations for the period due to the timing of sales and
repurchases of the Fund’s shares in relation to income earned and/or fluctuating fair value of the investments of the Fund.
bBased on average daily shares outstanding.
cTotal return is not annualized for periods less than one year.
dRatios are annualized for periods less than one year.
eBenefit of expense reduction rounds to less than 0.01%.
fBenefit of waiver and payments by affiliates rounds to less than 0.01%.
54 Semiannual Report | The accompanying notes are an integral part of these financial statements. franklintempleton.com
| FRANKLIN CUSTODIAN FUNDS | |||||||||||||||
| FINANCIAL HIGHLIGHTS | |||||||||||||||
| Franklin Income Fund (continued) | |||||||||||||||
| Six Months Ended | |||||||||||||||
| March 31, 2017 | Year Ended September 30, | ||||||||||||||
| (unaudited) | 2016 | 2015 | 2014 | 2013 | a | ||||||||||
| Class R6 | |||||||||||||||
| Per share operating performance | |||||||||||||||
| (for a share outstanding throughout the period) | |||||||||||||||
| Net asset value, beginning of period | $ | 2.23 | $ | 2.09 | $ | 2.46 | $ | 2.31 | $ | 2.33 | |||||
| Income from investment operationsb: | |||||||||||||||
| Net investment incomec | 0.05 | 0.10 | 0.11 | 0.11 | 0.04 | ||||||||||
| Net realized and unrealized gains (losses) | 0.12 | 0.16 | (0.35 | ) | 0.17 | (0.02 | ) | ||||||||
| Total from investment operations. | 0.17 | 0.26 | (0.24 | ) | 0.28 | 0.02 | |||||||||
| Less distributions from net investment income | (0.06 | ) | (0.12 | ) | (0.13 | ) | (0.13 | ) | (0.04 | ) | |||||
| Net asset value, end of period. | $ | 2.34 | $ | 2.23 | $ | 2.09 | $ | 2.46 | $ | 2.31 | |||||
| Total returnd | 7.83 | % | 13.15 | % | (10.39 | )% | 12.19 | % | 1.06 | % | |||||
| Ratios to average net assetse | |||||||||||||||
| Expensesf | 0.39 | %g | 0.38 | %g | 0.38 | %g | 0.38 | %g | 0.39 | % | |||||
| Net investment income. | 4.44 | % | 4.80 | % | 4.66 | % | 4.50 | % | 5.21 | % | |||||
| Supplemental data | |||||||||||||||
| Net assets, end of period (000’s) | $ | 1,804,331 | $ | 1,737,577 | $ | 1,744,718 | $ | 2,108,076 | $ | 1,921,084 | |||||
| Portfolio turnover rate | 19.98 | % | 61.26 | % | 44.81 | % | 36.03 | % | 37.60 | % | |||||
aFor the period May 1, 2013 (effective date) to September 30, 2013.
bThe amount shown for a share outstanding throughout the period may not correlate with the Statement of Operations for the period due to the timing of sales and
repurchases of the Fund’s shares in relation to income earned and/or fluctuating fair value of the investments of the Fund.
cBased on average daily shares outstanding.
dTotal return is not annualized for periods less than one year.
eRatios are annualized for periods less than one year.
fBenefit of expense reduction rounds to less than 0.01%.
gBenefit of waiver and payments by affiliates rounds to less than 0.01%.
franklintempleton.com The accompanying notes are an integral part of these financial statements. | Semiannual Report 55
| FRANKLIN CUSTODIAN FUNDS | ||||||||||||||||||
| FINANCIAL HIGHLIGHTS | ||||||||||||||||||
| Franklin Income Fund (continued) | ||||||||||||||||||
| Six Months Ended | ||||||||||||||||||
| March 31, 2017 | Year Ended September 30, | |||||||||||||||||
| (unaudited) | 2016 | 2015 | 2014 | 2013 | 2012 | |||||||||||||
| Advisor Class | ||||||||||||||||||
| Per share operating performance | ||||||||||||||||||
| (for a share outstanding throughout the period) | ||||||||||||||||||
| Net asset value, beginning of period | $ | 2.23 | $ | 2.09 | $ | 2.46 | $ | 2.31 | $ | 2.22 | $ | 1.97 | ||||||
| Income from investment operationsa: | ||||||||||||||||||
| Net investment incomeb | 0.05 | 0.10 | 0.11 | 0.11 | 0.12 | 0.13 | ||||||||||||
| Net realized and unrealized gains (losses) | 0.12 | 0.16 | (0.36 | ) | 0.17 | 0.11 | 0.26 | |||||||||||
| Total from investment operations | 0.17 | 0.26 | (0.25 | ) | 0.28 | 0.23 | 0.39 | |||||||||||
| Less distributions from net investment income . | (0.06 | ) | (0.12 | ) | (0.12 | ) | (0.13 | ) | (0.14 | ) | (0.14 | ) | ||||||
| Net asset value, end of period | $ | 2.34 | $ | 2.23 | $ | 2.09 | $ | 2.46 | $ | 2.31 | $ | 2.22 | ||||||
| Total returnc | 7.80 | % | 13.06 | % | (10.46 | )% | 12.12 | % | 10.49 | % | 20.69 | % | ||||||
| Ratios to average net assetsd | ||||||||||||||||||
| Expensese | 0.47 | %f | 0.46 | %f | 0.46 | %f | 0.46 | %f | 0.47 | % | 0.49 | % | ||||||
| Net investment income | 4.36 | % | 4.72 | % | 4.58 | % | 4.43 | % | 5.13 | % | 6.05 | % | ||||||
| Supplemental data | ||||||||||||||||||
| Net assets, end of period (000’s) | $ | 10,398,892 | $ | 8,143,479 | $ | 7,754,475 | $ | 9,096,269 | $ | 5,903,701 | $ | 6,444,763 | ||||||
| Portfolio turnover rate | 19.98 | % | 61.26 | % | 44.81 | % | 36.03 | % | 37.60 | % | 33.44 | % | ||||||
aThe amount shown for a share outstanding throughout the period may not correlate with the Statement of Operations for the period due to the timing of sales and
repurchases of the Fund’s shares in relation to income earned and/or fluctuating fair value of the investments of the Fund.
bBased on average daily shares outstanding.
cTotal return is not annualized for periods less than one year.
dRatios are annualized for periods less than one year.
eBenefit of expense reduction rounds to less than 0.01%.
fBenefit of waiver and payments by affiliates rounds to less than 0.01%.
56 Semiannual Report | The accompanying notes are an integral part of these financial statements. franklintempleton.com
| FRANKLIN CUSTODIAN FUNDS | ||||
| Statement of Investments, March 31, 2017 (unaudited) | ||||
| Franklin Income Fund | ||||
| Country | Shares | Value | ||
| Common Stocks 39.3% | ||||
| Consumer Discretionary 2.9% | ||||
| Daimler AG | Germany | 8,000,000 | $ | 590,525,122 |
| Ford Motor Co | United States | 68,814,601 | 801,001,956 | |
| a General Motors Co | United States | 10,000,000 | 353,600,000 | |
| Target Corp | United States | 12,406,000 | 684,687,140 | |
| 2,429,814,218 | ||||
| Consumer Staples 3.8% | ||||
| Anheuser-Busch InBev SA/NV, ADR | Belgium | 7,000,000 | 768,320,000 | |
| The Coca-Cola Co | United States | 25,000,000 | 1,061,000,000 | |
| PepsiCo Inc | United States | 5,500,000 | 615,230,000 | |
| Philip Morris International Inc | United States | 5,500,000 | 620,950,000 | |
| Woolworths Ltd | Australia | 6,500,000 | 131,633,447 | |
| 3,197,133,447 | ||||
| Energy 7.3% | ||||
| Anadarko Petroleum Corp | United States | 1,000,000 | 62,000,000 | |
| Baker Hughes Inc | United States | 10,000,000 | 598,200,000 | |
| BP PLC, ADR | United Kingdom | 18,000,000 | 621,360,000 | |
| Chevron Corp | United States | 8,000,000 | 858,960,000 | |
| b,c Energy XXI Gulf Coast Inc | United States | 7,259,184 | 217,557,744 | |
| Exxon Mobil Corp | United States | 3,056,588 | 250,670,782 | |
| b,c Goodrich Petroleum Corp | United States | 2,260,859 | 31,821,590 | |
| b,c,d Halcon Resources Corp | United States | 28,306,773 | 213,895,771 | |
| Occidental Petroleum Corp | United States | 6,500,000 | 411,840,000 | |
| b PetroQuest Energy Inc | United States | 663,286 | 1,817,404 | |
| b Rex Energy Corp | United States | 2,520,000 | 1,183,140 | |
| Royal Dutch Shell PLC, A, ADR | United Kingdom | 34,000,000 | 1,792,820,000 | |
| b,c Stone Energy Corp | United States | 6,151,402 | 134,346,620 | |
| Total SA, B, ADR | France | 10,000,000 | 504,200,000 | |
| b,c W&T Offshore Inc | United States | 26,153,000 | 72,443,810 | |
| a,b Weatherford International PLC | United States | 40,000,000 | 266,000,000 | |
| 6,039,116,861 | ||||
| Financials 4.8% | ||||
| AXA SA | France | 22,000,000 | 569,201,790 | |
| Bank of America Corp | United States | 7,500,000 | 176,925,000 | |
| HSBC Holdings PLC | United Kingdom | 55,000,000 | 448,603,539 | |
| JPMorgan Chase & Co | United States | 6,000,000 | 527,040,000 | |
| MetLife Inc | United States | 11,000,000 | 581,020,000 | |
| U.S. Bancorp. | United States | 10,500,000 | 540,750,000 | |
| Wells Fargo & Co | United States | 20,000,000 | 1,113,200,000 | |
| 3,956,740,329 | ||||
| Health Care 4.6% | ||||
| AstraZeneca PLC | United Kingdom | 10,000,000 | 615,585,381 | |
| a Eli Lilly & Co | United States | 3,430,000 | 288,497,300 | |
| Medtronic PLC | United States | 5,430,098 | 437,448,695 | |
| Merck & Co. Inc | United States | 1,000,000 | 63,540,000 | |
| b Mylan NV | United States | 8,387,400 | 327,024,726 | |
| Pfizer Inc | United States | 25,000,000 | 855,250,000 | |
| Roche Holding AG | Switzerland | 1,297,022 | 331,149,045 | |
| Sanofi, ADR | France | 18,000,000 | 814,500,000 | |
| b Tenet Healthcare Corp | United States | 4,000,000 | 70,840,000 | |
| 3,803,835,147 | ||||
franklintempleton.com
Semiannual Report 57
FRANKLIN CUSTODIAN FUNDS
STATEMENT OF INVESTMENTS (UNAUDITED)
| Franklin Income Fund (continued) | ||||
| Country | Shares | Value | ||
| Common Stocks (continued) | ||||
| Industrials 3.2% | ||||
| b,c,e CEVA Holdings LLC | United States | 91,371 | $ | 18,274,212 |
| a Deere & Co | United States | 1,410,400 | 153,536,144 | |
| General Electric Co | United States | 36,250,000 | 1,080,250,000 | |
| Republic Services Inc | United States | 6,500,000 | 408,265,000 | |
| Union Pacific Corp | United States | 5,000,000 | 529,600,000 | |
| a United Technologies Corp | United States | 4,000,000 | 448,840,000 | |
| 2,638,765,356 | ||||
| Information Technology 1.6% | ||||
| Apple Inc | United States | 2,110,000 | 303,122,600 | |
| a Microsoft Corp | United States | 12,000,000 | 790,320,000 | |
| a Oracle Corp | United States | 4,846,000 | 216,180,060 | |
| 1,309,622,660 | ||||
| Materials 3.7% | ||||
| BASF SE | Germany | 12,000,000 | 1,189,413,173 | |
| a The Dow Chemical Co | United States | 20,000,000 | 1,270,800,000 | |
| a Rio Tinto PLC, ADR | United Kingdom | 14,715,000 | 598,606,200 | |
| 3,058,819,373 | ||||
| Real Estate 0.7% | ||||
| Host Hotels & Resorts Inc | United States | 30,000,000 | 559,800,000 | |
| Outfront Media Inc | United States | 2,416,764 | 64,165,084 | |
| 623,965,084 | ||||
| Telecommunication Services 1.3% | ||||
| BCE Inc | Canada | 6,000,000 | 265,644,033 | |
| Telstra Corp. Ltd | Australia | 30,000,000 | 106,835,158 | |
| TELUS Corp | Canada | 2,500,000 | 81,152,718 | |
| Verizon Communications Inc | United States | 12,500,000 | 609,375,000 | |
| 1,063,006,909 | ||||
| Utilities 5.4% | ||||
| Dominion Resources Inc | United States | 12,000,000 | 930,840,000 | |
| Duke Energy Corp | United States | 5,000,000 | 410,050,000 | |
| Great Plains Energy Inc | United States | 4,667,500 | 136,384,350 | |
| NextEra Energy Inc | United States | 2,500,000 | 320,925,000 | |
| PG&E Corp | United States | 10,000,000 | 663,600,000 | |
| PPL Corp | United States | 7,000,000 | 261,730,000 | |
| Public Service Enterprise Group Inc | United States | 4,000,000 | 177,400,000 | |
| Sempra Energy | United States | 4,500,000 | 497,250,000 | |
| The Southern Co | United States | 15,000,000 | 746,700,000 | |
| Xcel Energy Inc | United States | 7,000,000 | 311,150,000 | |
| 4,456,029,350 | ||||
| Total Common Stocks (Cost $28,768,663,279) | 32,576,848,734 | |||
| f Equity-Linked Securities 12.7% | ||||
| Consumer Discretionary 1.3% | ||||
| g Citigroup Global Markets Holdings Inc. into General Motors Co., 9.00%, | ||||
| 144A | United States | 6,785,000 | 245,834,120 | |
| g Credit Suisse AG into General Motors Co., 9.50%, 144A | United States | 6,687,000 | 242,851,779 | |
| g Merrill Lynch International & Co. CV into Ford Motor Co., 9.50%, 144A | United States | 20,300,000 | 242,546,430 | |
| g Morgan Stanley into Nordstrom Inc., 8.00%, 144A | United States | 3,000,000 | 140,311,200 | |
58 Semiannual Report
franklintempleton.com
FRANKLIN CUSTODIAN FUNDS
STATEMENT OF INVESTMENTS (UNAUDITED)
| Franklin Income Fund (continued) | ||||
| Country | Shares | Value | ||
| f Equity-Linked Securities (continued) | ||||
| Consumer Discretionary (continued) | ||||
| g UBS AG into Target Corp., 6.00%, 144A | United States | 2,868,000 | $ | 159,846,833 |
| 1,031,390,362 | ||||
| Energy 1.5% | ||||
| g Credit Suisse New York into Halliburton Co., 8.00%, 144A | United States | 4,484,000 | 214,436,987 | |
| g Credit Suisse New York into Schlumberger Ltd., 7.50%, 144A. | United States | 2,665,000 | 208,850,720 | |
| g JPMorgan Chase & Co. into Anadarko Petroleum Corp., 9.00%, 144A | United States | 3,475,000 | 227,881,812 | |
| g JPMorgan Chase & Co. into Halliburton Co., 8.00%, 144A | United States | 4,952,000 | 226,610,453 | |
| g Royal Bank of Canada into Anadarko Petroleum Corp., 7.50%, 144A. | United States | 3,382,000 | 204,091,187 | |
| g Wells Fargo Bank National Assn. into Anadarko Petroleum Corp., 8.00%, | ||||
| 144A | United States | 2,807,000 | 183,038,014 | |
| 1,264,909,173 | ||||
| Financials 1.8% | ||||
| g Barclays Bank PLC into Bank of America Corp., 7.00%, 144A. | United States | 10,600,000 | 175,717,260 | |
| g Barclays Bank PLC into Morgan Stanley, 8.00%, 144A | United States | 7,327,000 | 226,316,376 | |
| g BNP Paribas Arbitrage Issuance BV into JPMorgan Chase & Co., 6.50%, | ||||
| 144A | United States | 3,124,000 | 227,214,768 | |
| g BNP Paribas into Bank of America Corp., 7.00%, 144A | United States | 8,810,000 | 161,513,730 | |
| g BNP Paribas into Bank of America Corp., 8.00%, 144A | United States | 6,465,000 | 154,190,250 | |
| g Citigroup Global Markets Holdings Inc. into MetLife Inc., 8.00%, 144A | United States | 3,502,000 | 169,974,123 | |
| g Merrill Lynch International & Co. CV into Morgan Stanley, 7.50%, 144A | United States | 6,600,000 | 224,559,060 | |
| g Wells Fargo Bank National Assn. into MetLife Inc., 8.50%, 144A | United States | 3,659,000 | 168,148,613 | |
| 1,507,634,180 | ||||
| Health Care 1.5% | ||||
| g Barclays Bank PLC into Gilead Sciences Inc., 8.50%, 144A | United States | 3,333,000 | 234,343,230 | |
| g Credit Suisse AG into Merck & Co. Inc., 7.50%, 144A | United States | 4,008,000 | 255,721,622 | |
| g,h Deutsche Bank AG into Medtronic PLC, 6.00%, 144A | United States | 1,858,000 | 150,230,448 | |
| g JPMorgan Chase & Co. into Merck & Co. Inc., 6.25%, 144A | United States | 2,540,000 | 156,292,550 | |
| g Morgan Stanley into Eli Lilly & Co., 6.00%, 144A | United States | 2,380,000 | 200,242,014 | |
| g Royal Bank of Canada into Eli Lilly & Co., 6.50%, 144A | United States | 2,600,000 | 214,319,560 | |
| 1,211,149,424 | ||||
| Industrials 1.8% | ||||
| g Deutsche Bank AG into Union Pacific Corp., 7.00%, 144A | United States | 968,000 | 102,723,192 | |
| g Merrill Lynch International & Co. CV into Deere & Co., 7.00%, 144A | United States | 1,887,000 | 204,131,886 | |
| g Merrill Lynch International & Co. CV into Deere & Co., 7.00%, 144A | United States | 1,949,000 | 210,500,770 | |
| g Merrill Lynch International & Co. CV into Deere & Co., 7.50%, 144A | United States | 2,440,000 | 224,259,180 | |
| g Morgan Stanley into Union Pacific Corp., 6.50%, 144A | United States | 910,000 | 97,142,500 | |
| g Royal Bank of Canada into General Electric Co., 6.00%, 144A | United States | 8,330,000 | 250,671,358 | |
| g UBS AG London into Cummins Inc., 7.00%, 144A | United States | 1,061,000 | 158,850,798 | |
| g Wells Fargo Bank National Assn. into Deere & Co., 7.00%, 144A | United States | 2,285,000 | 249,158,685 | |
| 1,497,438,369 | ||||
| Information Technology 4.1% | ||||
| g Barclays Bank PLC into Cisco Systems Inc., 7.00%, 144A | United States | 8,250,000 | 270,371,475 | |
| g Barclays Bank PLC into Microsoft Corp., 7.00%, 144A | United States | 6,060,000 | 345,669,672 | |
| g Citigroup Global Markets Holdings Inc. into Intel Corp., 7.00%, 144A | United States | 6,797,000 | 250,814,058 | |
| g Credit Suisse AG/London into Apple Inc., 6.50%, 144A | United States | 2,274,000 | 301,318,644 | |
| g JP Morgan Chase Bank NA into Apple Inc., 6.50%, 144A | United States | 1,840,000 | 259,600,080 | |
| g JPMorgan Chase & Co. into Intel Corp., 6.50%, 144A | United States | 7,040,000 | 254,660,032 | |
| g JPMorgan Chase & Co. into Microsoft Corp., 6.00%, 144A | United States | 3,891,000 | 254,696,300 | |
| g Morgan Stanley into Analog Devices Inc., 6.50%, 144A | United States | 2,030,000 | 159,314,400 | |
| g Morgan Stanley into QUALCOMM Inc., 8.00%, 144A | United States | 3,949,000 | 223,705,321 | |
franklintempleton.com
Semiannual Report 59
FRANKLIN CUSTODIAN FUNDS
STATEMENT OF INVESTMENTS (UNAUDITED)
| Franklin Income Fund (continued) | |||||
| Country | Shares | Value | |||
| f Equity-Linked Securities (continued) | |||||
| Information Technology (continued) | |||||
| g Royal Bank of Canada into Apple Inc., 7.00%, 144A | United States | 1,703,000 | $ | 222,798,381 | |
| g Royal Bank of Canada into Microsoft Corp., 7.00%, 144A. | United States | 5,080,000 | 283,693,108 | ||
| g Societe Generale SA into Alliances Development Immobilier SA, 6.00%, | |||||
| 144A | United States | 1,580,000 | 128,823,720 | ||
| g Wells Fargo Bank National Assn. into Intel Corp., 7.00%, 144A | United States | 5,804,000 | 208,591,117 | ||
| g Wells Fargo Bank National Assn. into Texas Instruments Inc., 6.50%, | |||||
| 144A | United States | 3,535,000 | 224,098,143 | ||
| 3,388,154,451 | |||||
| Materials 0.7% | |||||
| g Citigroup Global Markets Holdings Inc. into The Mosaic Co., 12.00%, | |||||
| 144A | United States | 6,405,000 | 192,255,683 | ||
| g The Goldman Sachs Group Inc. into Rio Tinto PLC, 11.00%, 144A | United Kingdom | 4,900,000 | 199,490,760 | ||
| g Wells Fargo Bank National Assn. into The Mosaic Co., 10.00%, 144A | United States | 6,620,000 | 199,320,256 | ||
| 591,066,699 | |||||
| Total Equity-Linked Securities (Cost $10,129,009,170) | 10,491,742,658 | ||||
| Convertible Preferred Stocks 2.6% | |||||
| Financials 1.3% | |||||
| Bank of America Corp., 7.25%, cvt. pfd., L | United States | 570,218 | 681,444,723 | ||
| b FNMA, 5.375%, cvt. pfd | United States | 4,250 | 97,962,500 | ||
| Wells Fargo & Co., 7.50%, cvt. pfd., A | United States | 235,097 | 291,520,280 | ||
| 1,070,927,503 | |||||
| Health Care 0.6% | |||||
| Allergan PLC, 5.50%, cvt. pfd | United States | 200,000 | 169,956,000 | ||
| Teva Pharmaceutical Industries Ltd., 7.00%, cvt. pfd | Israel | 525,000 | 302,925,000 | ||
| 472,881,000 | |||||
| Industrials 0.0%† | |||||
| b,c,e CEVA Holdings LLC, cvt. pfd., A-1 | United States | 2,897 | 1,014,038 | ||
| b,c,e CEVA Holdings LLC, cvt. pfd., A-2 | United States | 110,565 | 27,641,270 | ||
| 28,655,308 | |||||
| Real Estate 0.1% | |||||
| FelCor Lodging Trust Inc., 7.80%, cvt. pfd., A | United States | 2,183,637 | 53,237,070 | ||
| Utilities 0.6% | |||||
| Dominion Resources Inc., 6.375%, cvt. pfd., A | United States | 2,500,000 | 125,750,000 | ||
| Exelon Corp., 6.50%, cvt. pfd | United States | 2,250,000 | 111,060,000 | ||
| Great Plains Energy Inc., 7.00%, cvt. pfd | United States | 1,080,000 | 58,028,400 | ||
| NextEra Energy Inc., 6.371%, cvt. pfd | United States | 3,650,000 | 220,387,000 | ||
| 515,225,400 | |||||
| Total Convertible Preferred Stocks | |||||
| (Cost $2,312,119,292) | 2,140,926,281 | ||||
| Preferred Stocks 0.2% | |||||
| Financials 0.2% | |||||
| b FHLMC, 8.375%, pfd., Z | United States | 8,132,009 | 50,825,056 | ||
| b FNMA, 8.25%, pfd., S | United States | 6,000,000 | 39,540,000 | ||
| Morgan Stanley, 6.375%, pfd., I | United States | 1,977,655 | 54,701,937 | ||
| Total Preferred Stocks (Cost $390,689,948) | 145,066,993 | ||||
60 Semiannual Report
franklintempleton.com
FRANKLIN CUSTODIAN FUNDS
STATEMENT OF INVESTMENTS (UNAUDITED)
| Franklin Income Fund (continued) | |||||
| Principal | |||||
| Country | Amount* | Value | |||
| Convertible Bonds 0.8% | |||||
| Energy 0.5% | |||||
| g Chesapeake Energy Corp., senior note, 144A, cvt., 5.50%, 9/15/26 | United States | 75,000,000 | $ | 78,046,875 | |
| Cobalt International Energy Inc., | |||||
| cvt., senior bond, 3.125%, 5/15/24 | United States | 59,954,000 | 15,588,040 | ||
| cvt., senior note, 2.625%, 12/01/19 | United States | 70,000,000 | 22,750,000 | ||
| Weatherford International Ltd., cvt., senior note, 5.875%, 7/01/21 | United States | 220,000,000 | 283,112,500 | ||
| 399,497,415 | |||||
| Health Care 0.3% | |||||
| g Bayer Capital Corp BV, cvt., junior sub. note, 144A, 5.625%, 11/22/19 | Germany | 200,000,000 | EUR | 246,450,369 | |
| Impax Laboratories Inc., cvt., senior note, 2.00%, 6/15/22 | United States | 60,000,000 | 48,712,500 | ||
| 295,162,869 | |||||
| Total Convertible Bonds (Cost $694,394,456) | 694,660,284 | ||||
| Corporate Bonds 36.2% | |||||
| Consumer Discretionary 4.1% | |||||
| g 24 Hour Holdings III LLC, senior note, 144A, 8.00%, 6/01/22. | United States | 110,000,000 | 92,125,000 | ||
| g Altice Financing SA, | |||||
| secured bond, 144A, 7.50%, 5/15/26 | Luxembourg | 50,000,000 | 53,250,000 | ||
| secured note, 144A, 6.625%, 2/15/23 | Luxembourg | 35,000,000 | 36,575,000 | ||
| AMC Networks Inc., 4.75%, 12/15/22 | United States | 23,600,000 | 23,777,000 | ||
| CCO Holdings LLC/CCO Holdings Capital Corp., | |||||
| senior bond, 5.125%, 2/15/23 | United States | 105,000,000 | 108,400,950 | ||
| senior bond, 5.75%, 9/01/23 | United States | 67,000,000 | 69,847,500 | ||
| senior bond, 5.75%, 1/15/24 | United States | 105,000,000 | 109,462,500 | ||
| g senior bond, 144A, 5.50%, 5/01/26 | United States | 60,000,000 | 62,250,000 | ||
| g senior bond, 144A, 5.125%, 5/01/27 | United States | 50,000,000 | 50,468,750 | ||
| Charter Communications Operating LLC/Charter Communications | |||||
| Operating Capital Corp., senior secured note, first lien, 4.908%, 7/23/25 | United States | 30,000,000 | 31,730,580 | ||
| Cinemark USA Inc., | |||||
| senior bond, 4.875%, 6/01/23 | United States | 21,000,000 | 21,325,500 | ||
| senior note, 5.125%, 12/15/22 | United States | 50,000,000 | 51,250,000 | ||
| g CSC Holdings LLC, | |||||
| senior bond, 144A, 10.875%, 10/15/25 | United States | 15,900,000 | 19,119,750 | ||
| senior note, 144A, 10.125%, 1/15/23 | United States | 75,000,000 | 87,255,000 | ||
| DISH DBS Corp., | |||||
| senior bond, 5.00%, 3/15/23 | United States | 300,000,000 | 302,100,000 | ||
| senior note, 5.125%, 5/01/20 | United States | 60,000,000 | 62,700,000 | ||
| senior note, 6.75%, 6/01/21 | United States | 75,000,000 | 81,140,625 | ||
| senior note, 5.875%, 7/15/22 | United States | 322,500,000 | 339,631,200 | ||
| senior note, 5.875%, 11/15/24 | United States | 128,200,000 | 135,090,750 | ||
| senior note, 7.75%, 7/01/26 | United States | 30,000,000 | 34,950,000 | ||
| Fiat Chrysler Automobiles NV, senior note, 5.25%, 4/15/23 | United Kingdom | 67,600,000 | 69,508,348 | ||
| iHeartCommunications Inc., senior secured note, first lien, 9.00%, | |||||
| 12/15/19 | United States | 328,800,000 | 280,713,000 | ||
| g International Game Technology PLC, senior secured note, 144A, 6.25%, | |||||
| 2/15/22 | United States | 46,600,000 | 49,862,000 | ||
| KB Home, | |||||
| senior bond, 7.50%, 9/15/22 | United States | 50,000,000 | 55,125,000 | ||
| senior note, 7.00%, 12/15/21 | United States | 50,000,000 | 55,250,000 | ||
franklintempleton.com
Semiannual Report 61
FRANKLIN CUSTODIAN FUNDS
STATEMENT OF INVESTMENTS (UNAUDITED)
| Franklin Income Fund (continued) | ||||
| Principal | ||||
| Country | Amount* | Value | ||
| Corporate Bonds (continued) | ||||
| Consumer Discretionary (continued) | ||||
| g PetSmart Inc., senior note, 144A, 7.125%, 3/15/23 | United States | 44,600,000 | $ | 42,481,500 |
| Quebecor Media Inc., senior bond, 5.75%, 1/15/23 | Canada | 70,300,000 | 73,551,375 | |
| Regal Entertainment Group, senior note, 5.75%, 3/15/22 | United States | 30,000,000 | 31,387,500 | |
| g ROC Finance LLC/ROC Finance 1 Corp., senior secured note, first lien, | ||||
| 144A, 6.75%, 11/15/21 | United States | 50,000,000 | 51,875,000 | |
| g Shea Homes LP/Shea Homes Funding Corp., | ||||
| senior bond, 144A, 6.125%, 4/01/25 | United States | 90,000,000 | 90,450,000 | |
| senior note, 144A, 5.875%, 4/01/23 | United States | 80,000,000 | 80,800,000 | |
| g Sirius XM Radio Inc., | ||||
| senior bond, 144A, 6.00%, 7/15/24 | United States | 90,000,000 | 96,750,000 | |
| senior note, 144A, 4.625%, 5/15/23 | United States | 88,400,000 | 90,720,500 | |
| g Univision Communications Inc., | ||||
| senior secured note, first lien, 144A, 5.125%, 5/15/23 | United States | 137,000,000 | 137,000,000 | |
| senior secured note, first lien, 144A, 5.125%, 2/15/25 | United States | 99,020,000 | 97,782,250 | |
| g Virgin Media Secured Finance PLC, senior secured bond, first lien, 144A, | ||||
| 5.50%, 1/15/25 | United Kingdom | 80,000,000 | 82,200,000 | |
| g Wynn Las Vegas LLC/Wynn Las Vegas Capital Corp., | ||||
| senior bond, 144A, 4.25%, 5/30/23 | United States | 84,000,000 | 82,870,200 | |
| senior bond, 144A, 5.50%, 3/01/25 | United States | 107,000,000 | 109,006,250 | |
| g Wynn Macau Ltd., senior note, 144A, 5.25%, 10/15/21. | Macau | 47,000,000 | 48,292,500 | |
| g Ziggo Secured Finance BV, secured bond, 144A, 5.50%, 1/15/27 | Netherlands | 35,000,000 | 35,000,000 | |
| 3,433,075,528 | ||||
| Consumer Staples 0.4% | ||||
| Cott Beverages Inc., senior note, 5.375%, 7/01/22 | United States | 49,377,000 | 50,549,704 | |
| g JBS USA LLC/Finance Inc., | ||||
| senior bond, 144A, 5.875%, 7/15/24 | United States | 101,180,000 | 104,721,300 | |
| senior note, 144A, 7.25%, 6/01/21 | United States | 108,500,000 | 112,026,250 | |
| senior note, 144A, 5.75%, 6/15/25 | United States | 55,000,000 | 55,825,000 | |
| 323,122,254 | ||||
| Energy 6.9% | ||||
| g,i Ascent Resources Utica Holdings LLC/ARU Finance Corp., senior note, | ||||
| 144A, 10.00%, 4/01/22 | United States | 225,000,000 | 233,718,750 | |
| Bill Barrett Corp., | ||||
| senior note, 7.625%, 10/01/19 | United States | 165,676,000 | 164,019,240 | |
| senior note, 7.00%, 10/15/22 | United States | 184,150,000 | 174,942,500 | |
| Calumet Specialty Products Partners LP/Calumet Finance Corp., | ||||
| senior note, 6.50%, 4/15/21 | United States | 94,500,000 | 80,443,125 | |
| g senior note, 144A, 11.50%, 1/15/21 | United States | 52,200,000 | 60,552,000 | |
| Chesapeake Energy Corp., | ||||
| g secured note, second lien, 144A, 8.00%, 12/15/22 | United States | 670,000,000 | 704,337,500 | |
| j senior bond, 6.125%, 2/15/21 | United States | 226,000,000 | 220,350,000 | |
| senior note, 6.625%, 8/15/20 | United States | 192,500,000 | 193,221,875 | |
| senior note, 6.875%, 11/15/20 | United States | 95,000,000 | 95,237,500 | |
| senior note, 4.875%, 4/15/22 | United States | 43,000,000 | 38,915,000 | |
| senior note, 5.75%, 3/15/23 | United States | 49,600,000 | 45,384,000 | |
| g,j senior note, 144A, 8.00%, 1/15/25 | United States | 184,500,000 | 185,191,875 | |
| k senior note, FRN, 4.272%, 4/15/19 | United States | 154,000,000 | 154,000,000 | |
62 Semiannual Report
franklintempleton.com
FRANKLIN CUSTODIAN FUNDS
STATEMENT OF INVESTMENTS (UNAUDITED)
| Franklin Income Fund (continued) | ||||
| Principal | ||||
| Country | Amount* | Value | ||
| Corporate Bonds (continued) | ||||
| Energy (continued) | ||||
| g Denbury Resources Inc., senior secured note, 144A, 9.00%, 5/15/21. | United States | 105,567,000 | $ | 111,901,020 |
| g Diamondback Energy Inc., senior note, 144A, 5.375%, 5/31/25 | United States | 50,000,000 | 51,500,000 | |
| Energy Transfer Equity LP, senior secured bond, first lien, 5.50%, 6/01/27 . | United States | 150,000,000 | 157,500,000 | |
| Ferrellgas LP/Ferrellgas Finance Corp., | ||||
| senior note, 6.50%, 5/01/21 | United States | 78,795,000 | 75,249,225 | |
| senior note, 6.75%, 1/15/22 | United States | 70,000,000 | 66,500,000 | |
| senior note, 6.75%, 6/15/23 | United States | 52,900,000 | 49,990,500 | |
| g Ferrellgas Partners LP/Ferrellgas Partners Finance Corp., senior note, | ||||
| 144A, 8.625%, 6/15/20 | United States | 49,900,000 | 48,028,750 | |
| g Gulfport Energy Corp., senior note, 144A, 6.375%, 5/15/25 | United States | 50,000,000 | 49,250,000 | |
| c,g Halcon Resources Corp., senior note, 144A, 6.75%, 2/15/25. | United States | 97,000,000 | 95,739,000 | |
| Kinder Morgan Inc., | ||||
| senior bond, 7.75%, 1/15/32 | United States | 118,000,000 | 147,514,632 | |
| g senior secured bond, first lien, 144A, 5.625%, 11/15/23 | United States | 100,000,000 | 109,884,000 | |
| g McDermott International Inc., second lien, 144A, 8.00%, 5/01/21 | United States | 145,270,000 | 148,901,750 | |
| g NGPL PipeCo LLC, secured note, 144A, 7.119%, 12/15/17 | United States | 53,000,000 | 54,722,500 | |
| Oasis Petroleum Inc., senior note, 6.875%, 3/15/22 | United States | 10,000,000 | 10,275,000 | |
| g PetroQuest Energy Inc., | ||||
| secured note, second lien, 144A, 10.00%, 2/15/21 | United States | 12,093,000 | 10,339,515 | |
| l secured note, second lien, 144A, PIK, 10.00%, 2/15/21. | United States | 60,751,012 | 45,563,259 | |
| Rex Energy Corp., second lien, 1.00% to 10/01/17, 8.00% thereafter, | ||||
| 10/01/20 | United States | 109,000,000 | 55,590,000 | |
| g Rockies Express Pipeline LLC, senior bond, 144A, 5.625%, 4/15/20 | United States | 60,000,000 | 63,450,000 | |
| Sabine Pass Liquefaction LLC, | ||||
| first lien, 6.25%, 3/15/22 | United States | 75,000,000 | 83,232,900 | |
| first lien, 5.625%, 4/15/23 | United States | 124,450,000 | 135,166,390 | |
| g senior secured bond, 144A, 5.875%, 6/30/26 | United States | 20,000,000 | 22,087,780 | |
| g senior secured bond, 144A, 5.00%, 3/15/27. | United States | 36,000,000 | 37,670,436 | |
| senior secured note, first lien, 5.75%, 5/15/24 | United States | 75,000,000 | 81,865,275 | |
| Sanchez Energy Corp., | ||||
| senior note, 7.75%, 6/15/21 | United States | 219,790,000 | 218,141,575 | |
| senior note, 6.125%, 1/15/23 | United States | 110,000,000 | 102,575,000 | |
| c Stone Energy Corp., senior note, 7.50%, 5/31/22. | United States | 72,845,556 | 71,388,645 | |
| g Transocean Inc., senior note, 144A, 9.00%, 7/15/23 | United States | 50,000,000 | 53,625,000 | |
| c,g,l W&T Offshore Inc., | ||||
| second lien, 144A, PIK, 10.75%, 5/15/20. | United States | 75,645,453 | 62,879,702 | |
| senior secured note, third lien, 144A, PIK, 10.00%, 6/15/21 | United States | 67,697,026 | 50,635,768 | |
| Weatherford International Ltd., | ||||
| senior note, 5.125%, 9/15/20 | United States | 91,000,000 | 92,137,500 | |
| senior note, 7.75%, 6/15/21 | United States | 293,000,000 | 317,172,500 | |
| j senior note, 4.50%, 4/15/22 | United States | 250,000,000 | 240,625,000 | |
| senior note, 8.25%, 6/15/23 | United States | 212,100,000 | 231,189,000 | |
| g senior note, 144A, 9.875%, 2/15/24 | United States | 95,000,000 | 110,437,500 | |
| The Williams Cos. Inc., senior bond, 3.70%, 1/15/23 | United States | 60,700,000 | 59,941,250 | |
| 5,672,983,737 | ||||
| Financials 4.2% | ||||
| m Bank of America Corp., | ||||
| junior sub. bond, AA, 6.10% to 3/17/25, FRN thereafter, Perpetual | United States | 80,000,000 | 84,860,000 | |
| junior sub. bond, M, 8.125% to 5/15/18, FRN thereafter, Perpetual | United States | 100,000,000 | 104,375,000 | |
| junior sub. bond, U, 5.20% to 6/01/23, FRN thereafter, Perpetual | United States | 80,000,000 | 79,900,000 | |
| junior sub. bond, X, 6.25% to 9/05/24, FRN thereafter, Perpetual | United States | 85,000,000 | 89,568,750 | |
franklintempleton.com
Semiannual Report 63
FRANKLIN CUSTODIAN FUNDS
STATEMENT OF INVESTMENTS (UNAUDITED)
| Franklin Income Fund (continued) | ||||
| Principal | ||||
| Country | Amount* | Value | ||
| Corporate Bonds (continued) | ||||
| Financials (continued) | ||||
| m Barclays PLC, sub. bond, 8.25% to 12/15/18, FRN thereafter, Perpetual | United Kingdom | 75,000,000 | $ | 79,035,375 |
| CIT Group Inc., senior bond, 5.00%, 8/01/23. | United States | 60,000,000 | 62,700,000 | |
| m Citigroup Inc., | ||||
| junior sub. bond, 5.35% to 5/15/23, FRN thereafter, Perpetual | United States | 179,195,000 | 179,418,994 | |
| junior sub. bond, 5.90% to 2/15/23, FRN thereafter, Perpetual | United States | 33,000,000 | 34,526,250 | |
| junior sub. bond, 5.95% to 1/30/23, FRN thereafter, Perpetual | United States | 230,000,000 | 240,350,000 | |
| junior sub. bond, M, 6.30% to 5/15/24, FRN thereafter, Perpetual | United States | 250,000,000 | 260,937,500 | |
| junior sub. bond, O, 5.875% to 3/27/20, FRN thereafter, Perpetual | United States | 160,000,000 | 165,700,000 | |
| junior sub. bond, P, 5.95% to 5/15/25, FRN thereafter, Perpetual. | United States | 25,000,000 | 26,062,750 | |
| junior sub. bond, Q, 5.95% to 8/15/20, FRN thereafter, Perpetual | United States | 120,000,000 | 124,950,000 | |
| sub. bond, T, 6.25% to 8/15/26, FRN thereafter, Perpetual | United States | 50,000,000 | 54,000,000 | |
| m Fifth Third Bancorp, junior sub. bond, 5.10% to 6/30/23, FRN thereafter, | ||||
| Perpetual | United States | 54,000,000 | 53,595,000 | |
| m The Goldman Sachs Group Inc., junior sub. note, 5.70% to 5/10/19, FRN | ||||
| thereafter, Perpetual | United States | 30,000,000 | 31,054,500 | |
| m HSBC Holdings PLC, junior sub. bond, 6.375% to 9/17/24, FRN thereafter, | ||||
| Perpetual | United Kingdom | 40,000,000 | 40,334,400 | |
| m JPMorgan Chase & Co., | ||||
| junior sub. bond, 6.125% to 4/30/24, FRN thereafter, Perpetual | United States | 60,000,000 | 63,675,000 | |
| junior sub. bond, 6.75% to 2/01/24, FRN thereafter, Perpetual | United States | 100,000,000 | 110,375,000 | |
| junior sub. bond, I, 7.90% to 4/30/19, FRN thereafter, Perpetual | United States | 700,000,000 | 726,250,000 | |
| junior sub. bond, Q, 5.15% to 5/01/23, FRN thereafter, Perpetual | United States | 100,000,000 | 101,125,000 | |
| junior sub. bond, R, 6.00% to 8/01/23, FRN thereafter, Perpetual | United States | 105,000,000 | 109,756,500 | |
| junior sub. bond, V, 5.00% to 7/30/19, FRN thereafter, Perpetual | United States | 200,000,000 | 202,500,000 | |
| junior sub. bond, X, 6.10% to 10/01/24, FRN thereafter, Perpetual | United States | 80,000,000 | 84,640,000 | |
| m Morgan Stanley, junior sub. bond, 5.55% to 7/15/20, FRN thereafter, | ||||
| Perpetual | United States | 58,000,000 | 59,742,900 | |
| Navient Corp., senior note, 6.125%, 3/25/24 | United States | 35,000,000 | 33,512,500 | |
| g OneMain Financial Holdings Inc., | ||||
| senior note, 144A, 6.75%, 12/15/19 | United States | 50,000,000 | 52,437,500 | |
| senior note, 144A, 7.25%, 12/15/21 | United States | 45,700,000 | 48,099,250 | |
| m PNC Financial Services Group Inc., junior sub. note, 4.85% to 6/01/23, | ||||
| FRN thereafter, Perpetual | United States | 54,000,000 | 53,848,260 | |
| m Wells Fargo & Co., junior sub. bond, S, 5.90% to 6/15/24, FRN thereafter, | ||||
| Perpetual | United States | 129,500,000 | 135,372,825 | |
| 3,492,703,254 | ||||
| Health Care 8.0% | ||||
| g AMAG Pharmaceuticals Inc., senior note, 144A, 7.875%, 9/01/23 | United States | 48,100,000 | 45,815,250 | |
| CHS/Community Health Systems Inc., | ||||
| senior note, 8.00%, 11/15/19 | United States | 908,600,000 | 893,835,250 | |
| senior note, 7.125%, 7/15/20 | United States | 375,895,000 | 345,823,400 | |
| senior note, 6.875%, 2/01/22 | United States | 720,000,000 | 619,200,000 | |
| senior secured note, 5.125%, 8/01/21 | United States | 20,000,000 | 19,850,000 | |
| senior secured note, first lien, 6.25%, 3/31/23 | United States | 155,900,000 | 159,602,625 | |
| DaVita Inc., | ||||
| senior bond, 5.125%, 7/15/24 | United States | 96,000,000 | 97,140,000 | |
| senior bond, 5.00%, 5/01/25 | United States | 56,000,000 | 55,965,280 | |
| g Endo Finance LLC, senior note, 144A, 5.75%, 1/15/22 | United States | 121,000,000 | 110,715,000 | |
| g Endo Finance LLC/Endo Ltd./Endo Finco Inc., | ||||
| senior bond, 144A, 6.00%, 2/01/25 | United States | 108,700,000 | 93,210,250 | |
| senior note, 144A, 6.00%, 7/15/23 | United States | 203,025,000 | 178,662,000 | |
64 Semiannual Report
franklintempleton.com
FRANKLIN CUSTODIAN FUNDS
STATEMENT OF INVESTMENTS (UNAUDITED)
| Franklin Income Fund (continued) | ||||
| Principal | ||||
| Country | Amount* | Value | ||
| Corporate Bonds (continued) | ||||
| Health Care (continued) | ||||
| HCA Inc., | ||||
| senior bond, 5.875%, 5/01/23 | United States | 120,000,000 | $ | 129,900,000 |
| senior note, 7.50%, 2/15/22 | United States | 150,000,000 | 171,937,500 | |
| senior secured note, first lien, 5.00%, 3/15/24 | United States | 134,800,000 | 141,708,500 | |
| Horizon Pharma Inc., senior note, 6.625%, 5/01/23 | United States | 94,512,000 | 93,094,320 | |
| g Horizon Pharma Inc./Horizon Pharma USA Inc., senior note, 144A, 8.75%, | ||||
| 11/01/24 | United States | 24,800,000 | 25,947,000 | |
| g Jaguar Holding Co. II/Pharmaceutical Product Development LLC, senior | ||||
| note, 144A, 6.375%, 8/01/23 | United States | 56,765,000 | 59,461,338 | |
| Kindred Healthcare Inc., | ||||
| senior note, 8.00%, 1/15/20 | United States | 33,845,000 | 34,564,206 | |
| j senior note, 8.75%, 1/15/23 | United States | 50,000,000 | 50,312,500 | |
| Mallinckrodt International Finance SA, senior bond, 4.75%, 4/15/23 | United States | 66,000,000 | 56,265,000 | |
| g Mallinckrodt International Finance SA/Mallinckrodt CB LLC, | ||||
| senior note, 144A, 4.875%, 4/15/20 | United States | 101,600,000 | 102,235,000 | |
| j senior note, 144A, 5.75%, 8/01/22 | United States | 277,525,000 | 274,888,512 | |
| senior note, 144A, 5.625%, 10/15/23 | United States | 252,050,000 | 240,707,750 | |
| senior note, 144A, 5.50%, 4/15/25 | United States | 129,000,000 | 119,325,000 | |
| Tenet Healthcare Corp., | ||||
| 4.375%, 10/01/21 | United States | 140,000,000 | 140,700,000 | |
| senior note, 5.00%, 3/01/19 | United States | 130,000,000 | 130,848,900 | |
| senior note, 5.50%, 3/01/19 | United States | 50,000,000 | 50,875,000 | |
| senior note, 8.00%, 8/01/20 | United States | 228,703,000 | 231,561,787 | |
| senior note, 8.125%, 4/01/22 | United States | 612,500,000 | 641,593,750 | |
| j senior note, 6.75%, 6/15/23 | United States | 395,700,000 | 389,764,500 | |
| g senior secured note, second lien, 144A, 7.50%, 1/01/22 | United States | 36,700,000 | 39,727,750 | |
| g Valeant Pharmaceuticals International, senior note, 144A, 6.375%, | ||||
| 10/15/20 | United States | 263,500,000 | 239,785,000 | |
| g Valeant Pharmaceuticals International Inc., | ||||
| first lien, 144A, 6.50%, 3/15/22. | United States | 50,500,000 | 52,078,125 | |
| senior bond, 144A, 6.125%, 4/15/25 | United States | 122,400,000 | 94,707,000 | |
| senior note, 144A, 6.75%, 8/15/18 | United States | 29,101,000 | 29,210,129 | |
| senior note, 144A, 5.375%, 3/15/20 | United States | 285,000,000 | 256,143,750 | |
| senior note, 144A, 5.875%, 5/15/23 | United States | 153,500,000 | 119,921,875 | |
| senior note, 144A, 7.00%, 3/15/24 | United States | 77,300,000 | 79,522,375 | |
| 6,616,605,622 | ||||
| Industrials 2.0% | ||||
| g Ahern Rentals Inc., secured note, second lien, 144A, 7.375%, 5/15/23. | United States | 50,000,000 | 43,250,000 | |
| g Bombardier Inc., | ||||
| senior bond, 144A, 6.125%, 1/15/23 | Canada | 81,300,000 | 79,877,250 | |
| senior bond, 144A, 7.50%, 3/15/25 | Canada | 25,100,000 | 25,853,000 | |
| senior note, 144A, 6.00%, 10/15/22 | Canada | 35,000,000 | 34,632,500 | |
| g CEVA Group PLC, senior note, first lien, 144A, 4.00%, 5/01/18 | United Kingdom | 158,778,982 | 153,420,191 | |
| g Cloud Crane LLC, secured note, second lien, 144A, 10.125%, 8/01/24. | United States | 29,500,000 | 31,565,000 | |
| g Cortes NP Acquisition Corp., senior note, 144A, 9.25%, 10/15/24 | United States | 77,700,000 | 83,527,500 | |
| m General Electric Co., junior sub. bond, 5.00% to 1/21/21, FRN thereafter, | ||||
| Perpetual | United States | 90,153,000 | 95,111,415 | |
| Hertz Corp., senior note, 6.75%, 4/15/19 | United States | 46,582,000 | 46,698,455 | |
| Navistar International Corp., senior bond, 8.25%, 11/01/21 | United States | 80,000,000 | 80,399,200 | |
franklintempleton.com
Semiannual Report 65
FRANKLIN CUSTODIAN FUNDS
STATEMENT OF INVESTMENTS (UNAUDITED)
| Franklin Income Fund (continued) | ||||
| Principal | ||||
| Country | Amount* | Value | ||
| Corporate Bonds (continued) | ||||
| Industrials (continued) | ||||
| TransDigm Inc., | ||||
| senior sub. bond, 6.50%, 7/15/24 | United States | 130,000,000 | $ | 131,950,000 |
| senior sub. bond, 6.375%, 6/15/26 | United States | 120,000,000 | 120,370,800 | |
| senior sub. note, 6.00%, 7/15/22 | United States | 107,800,000 | 109,481,680 | |
| United Rentals North America Inc., | ||||
| senior bond, 6.125%, 6/15/23 | United States | 120,000,000 | 125,850,000 | |
| senior bond, 5.75%, 11/15/24 | United States | 121,700,000 | 127,328,625 | |
| senior bond, 5.875%, 9/15/26 | United States | 13,700,000 | 14,333,625 | |
| senior bond, 5.50%, 5/15/27 | United States | 35,600,000 | 36,045,000 | |
| g XPO Logistics Inc., senior note, 144A, 6.50%, 6/15/22 | United States | 330,000,000 | 347,737,500 | |
| 1,687,431,741 | ||||
| Information Technology 2.1% | ||||
| g Belden Inc., senior sub. note, 144A, 5.50%, 9/01/22. | United States | 40,000,000 | 41,000,000 | |
| g BMC Software Finance Inc., senior note, 144A, 8.125%, 7/15/21. | United States | 130,805,000 | 132,440,062 | |
| g,l Boxer Parent Co. Inc., senior note, 144A, PIK, 9.00%, 10/15/19 | United States | 55,000,000 | 55,137,500 | |
| g CommScope Inc., senior bond, 144A, 5.50%, 6/15/24 | United States | 100,000,000 | 103,782,000 | |
| g CommScope Technologies LLC, senior bond, 144A, 6.00%, 6/15/25 | United States | 74,200,000 | 78,095,500 | |
| g Diamond 1 Finance Corp./Diamond 2 Finance Corp., | ||||
| senior note, 144A, 5.875%, 6/15/21 | United States | 22,800,000 | 23,976,571 | |
| senior note, 144A, 7.125%, 6/15/24 | United States | 27,100,000 | 29,972,898 | |
| senior secured bond, first lien, 144A, 6.02%, 6/15/26 | United States | 53,750,000 | 58,809,541 | |
| senior secured note, first lien, 144A, 4.42%, 6/15/21 | United States | 41,400,000 | 43,330,358 | |
| senior secured note, first lien, 144A, 5.45%, 6/15/23 | United States | 69,750,000 | 75,343,811 | |
| g First Data Corp., | ||||
| second lien, 144A, 5.75%, 1/15/24 | United States | 70,000,000 | 72,467,500 | |
| senior note, 144A, 7.00%, 12/01/23 | United States | 275,000,000 | 295,625,000 | |
| senior secured note, first lien, 144A, 5.375%, 8/15/23 | United States | 50,000,000 | 52,187,500 | |
| Infor (U.S.) Inc., senior note, 6.50%, 5/15/22 | United States | 52,500,000 | 54,211,500 | |
| g,l Infor Software Parent LLC/Inc., senior note, 144A, PIK, 7.125%, 5/01/21 | United States | 24,650,000 | 25,327,875 | |
| g Inmarsat Finance PLC, senior note, 144A, 4.875%, 5/15/22 | United Kingdom | 39,000,000 | 38,668,149 | |
| g Microsemi Corp., senior note, 144A, 9.125%, 4/15/23 | United States | 50,600,000 | 58,379,750 | |
| NCR Corp., | ||||
| senior note, 5.00%, 7/15/22 | United States | 40,000,000 | 40,800,000 | |
| senior note, 6.375%, 12/15/23 | United States | 35,000,000 | 36,925,000 | |
| Qorvo Inc., senior note, 6.75%, 12/01/23 | United States | 40,000,000 | 43,550,000 | |
| Western Digital Corp., | ||||
| senior note, 10.50%, 4/01/24 | United States | 240,000,000 | 283,200,000 | |
| g senior secured note, 144A, 7.375%, 4/01/23 | United States | 100,000,000 | 109,875,000 | |
| 1,753,105,515 | ||||
| Materials 2.2% | ||||
| g Ardagh Packaging Finance PLC/Ardagh MP Holdings USA Inc., | ||||
| senior note, 144A, 6.00%, 6/30/21 | Luxembourg | 30,000,000 | 30,975,000 | |
| senior note, 144A, 4.625%, 5/15/23 | Luxembourg | 44,900,000 | 45,461,250 | |
| senior note, 144A, 7.25%, 5/15/24 | Luxembourg | 46,500,000 | 49,871,250 | |
| senior note, 144A, 6.00%, 2/15/25 | Luxembourg | 25,000,000 | 25,437,500 | |
| Ball Corp., senior bond, 4.00%, 11/15/23 | United States | 100,000,000 | 100,500,000 | |
| g BWAY Holding Co., | ||||
| i secured note, 144A, 5.50%, 4/15/24 | United States | 75,000,000 | 75,750,000 | |
| senior note, 144A, 9.125%, 8/15/21 | United States | 55,000,000 | 60,222,250 | |
| i senior note, 144A, 7.25%, 4/15/25 | United States | 176,800,000 | 177,242,000 | |
66 Semiannual Report
franklintempleton.com
FRANKLIN CUSTODIAN FUNDS
STATEMENT OF INVESTMENTS (UNAUDITED)
| Franklin Income Fund (continued) | ||||
| Principal | ||||
| Country | Amount* | Value | ||
| Corporate Bonds (continued) | ||||
| Materials (continued) | ||||
| g Cemex Finance LLC, senior secured note, first lien, 144A, 6.00%, 4/01/24 . | Mexico | 88,400,000 | $ | 93,068,846 |
| g Cemex SAB de CV, | ||||
| first lien, 144A, 5.70%, 1/11/25. | Mexico | 70,000,000 | 72,612,050 | |
| secured note, 144A, 7.25%, 1/15/21 | Mexico | 111,000,000 | 118,741,695 | |
| senior secured bond, 144A, 7.75%, 4/16/26. | Mexico | 75,100,000 | 84,623,431 | |
| The Chemours Co., senior note, 6.625%, 5/15/23 | United States | 54,900,000 | 58,468,500 | |
| Crown Americas LLC/Crown Americas Capital Corp. IV, senior bond, | ||||
| 4.50%, 1/15/23 | United States | 105,000,000 | 107,625,000 | |
| g First Quantum Minerals Ltd., senior note, 144A, 6.75%, 2/15/20 | Canada | 50,000,000 | 51,735,000 | |
| g FMG Resources (August 2006) Pty. Ltd., senior secured note, 144A, | ||||
| 9.75%, 3/01/22 | Australia | 500,000,000 | 575,000,000 | |
| g Platform Specialty Products Corp., senior note, 144A, 6.50%, 2/01/22 | United States | 45,000,000 | 46,912,500 | |
| g Reynolds Group Issuer Inc./Reynolds Group Issuer LLC/Reynolds Group | ||||
| Issuer Luxembourg SA, | ||||
| first lien, 144A, 5.125%, 7/15/23 | United States | 21,800,000 | 22,426,750 | |
| k senior secured note, first lien, 144A, FRN, 4.523%, 7/15/21. | United States | 30,400,000 | 31,179,152 | |
| 1,827,852,174 | ||||
| Real Estate 0.5% | ||||
| g Crescent Communities LLC/Crescent Ventures Inc., secured note, 144A, | ||||
| 8.875%, 10/15/21. | United States | 35,000,000 | 36,575,000 | |
| Equinix Inc., senior bond, 5.375%, 5/15/27 | United States | 170,000,000 | 175,950,000 | |
| Iron Mountain Inc., senior sub. bond, 5.75%, 8/15/24 | United States | 80,000,000 | 82,000,000 | |
| iStar Financial Inc., senior note, 6.00%, 4/01/22 | United States | 37,500,000 | 38,156,250 | |
| iStar Inc., senior note, 5.00%, 7/01/19 | United States | 100,000,000 | 101,250,000 | |
| 433,931,250 | ||||
| Telecommunication Services 3.0% | ||||
| CenturyLink Inc., | ||||
| senior note, 5.80%, 3/15/22 | United States | 73,000,000 | 75,505,360 | |
| senior note, 7.50%, 4/01/24 | United States | 41,600,000 | 44,083,104 | |
| Consolidated Communications Inc., senior note, 6.50%, 10/01/22 | United States | 76,200,000 | 73,533,000 | |
| g Digicel Ltd., senior note, 144A, 6.75%, 3/01/23 | Bermuda | 68,300,000 | 61,449,510 | |
| Frontier Communications Corp., | ||||
| senior bond, 8.75%, 4/15/22 | United States | 43,900,000 | 42,692,750 | |
| senior note, 9.25%, 7/01/21 | United States | 63,600,000 | 64,554,000 | |
| senior note, 10.50%, 9/15/22 | United States | 20,000,000 | 20,350,000 | |
| senior note, 7.125%, 1/15/23 | United States | 115,850,000 | 102,201,712 | |
| senior note, 11.00%, 9/15/25 | United States | 20,000,000 | 19,487,500 | |
| Intelsat Jackson Holdings SA, senior bond, 5.50%, 8/01/23 | Luxembourg | 69,000,000 | 57,183,750 | |
| g SFR Group SA, secured bond, 144A, 7.375%, 5/01/26. | France | 50,000,000 | 51,640,250 | |
| Sprint Capital Corp., senior note, 6.90%, 5/01/19 | United States | 220,000,000 | 235,400,000 | |
| Sprint Communications Inc., | ||||
| 11.50%, 11/15/21 | United States | 200,000,000 | 252,000,000 | |
| senior note, 8.375%, 8/15/17 | United States | 135,000,000 | 138,138,750 | |
| senior note, 7.00%, 8/15/20 | United States | 102,500,000 | 110,315,625 | |
| senior note, 6.00%, 11/15/22 | United States | 193,000,000 | 197,825,000 | |
| g senior note, 144A, 9.00%, 11/15/18 | United States | 70,000,000 | 76,387,500 | |
| Sprint Corp., | ||||
| senior bond, 7.875%, 9/15/23 | United States | 187,350,000 | 207,958,500 | |
| senior bond, 7.125%, 6/15/24 | United States | 190,650,000 | 203,995,500 | |
| senior note, 7.625%, 2/15/25 | United States | 50,000,000 | 54,750,000 | |
franklintempleton.com
Semiannual Report 67
FRANKLIN CUSTODIAN FUNDS
STATEMENT OF INVESTMENTS (UNAUDITED)
| Franklin Income Fund (continued) | |||||
| Principal | |||||
| Country | Amount* | Value | |||
| Corporate Bonds (continued) | |||||
| Telecommunication Services (continued) | |||||
| T-Mobile USA Inc., | |||||
| senior note, 6.633%, 4/28/21 | United States | 80,000,000 | $ | 82,880,000 | |
| senior note, 6.00%, 3/01/23 | United States | 30,000,000 | 32,109,000 | ||
| g Wind Acquisition Finance SA, secured note, second lien, 144A, 7.375%, | |||||
| 4/23/21 | Italy | 200,000,000 | 208,224,000 | ||
| Zayo Group LLC/Zayo Capital Inc., | |||||
| senior note, 6.00%, 4/01/23 | United States | 77,000,000 | 81,716,250 | ||
| g senior note, 144A, 5.75%, 1/15/27 | United States | 21,500,000 | 22,731,950 | ||
| 2,517,113,011 | |||||
| Utilities 2.8% | |||||
| The AES Corp., | |||||
| senior bond, 4.875%, 5/15/23 | United States | 90,000,000 | 90,000,000 | ||
| senior bond, 5.50%, 3/15/24 | United States | 50,000,000 | 51,000,000 | ||
| Calpine Corp., | |||||
| senior bond, 5.75%, 1/15/25 | United States | 342,000,000 | 341,103,960 | ||
| senior note, 5.375%, 1/15/23 | United States | 325,000,000 | 330,687,500 | ||
| senior note, 5.50%, 2/01/24 | United States | 176,500,000 | 176,445,285 | ||
| g senior secured bond, 144A, 5.25%, 6/01/26. | United States | 60,000,000 | 61,200,000 | ||
| Dynegy Inc., | |||||
| senior bond, 8.034%, 2/02/24 | United States | 50,983,407 | 48,434,237 | ||
| senior note, 6.75%, 11/01/19 | United States | 470,000,000 | 485,275,000 | ||
| senior note, 7.375%, 11/01/22 | United States | 361,500,000 | 359,692,500 | ||
| senior note, 5.875%, 6/01/23 | United States | 130,000,000 | 119,762,500 | ||
| g senior note, 144A, 8.00%, 1/15/25 | United States | 58,300,000 | 56,113,750 | ||
| g InterGen NV, | |||||
| secured bond, 144A, 7.00%, 6/30/23 | Netherlands | 143,700,000 | 128,791,125 | ||
| secured note, 144A, 7.50%, 6/30/21 | Netherlands | 35,800,000 | GBP | 41,802,807 | |
| 2,290,308,664 | |||||
| Total Corporate Bonds (Cost $28,689,861,143) | 30,048,232,750 | ||||
| k,n Senior Floating Rate Interests 3.9% | |||||
| Consumer Discretionary 1.8% | |||||
| 24 Hour Fitness Worldwide Inc., Term Loan, 4.897%, 5/28/21 | United States | 45,095,904 | 45,122,962 | ||
| Academy Ltd., Initial Term Loan, 5.00% - 5.102%, 7/02/22 | United States | 112,999,105 | 84,443,327 | ||
| Belk Inc., Closing Date Term Loan, 5.76%, 12/12/22 | United States | 247,500,000 | 211,251,645 | ||
| h BJ’s Wholesale Club Inc., | |||||
| Second Lien Initial Term Loans, 10.38%, 3/24/25 | United States | 16,697,949 | 16,343,118 | ||
| Tranche B Term Loans, 6.63%, 3/27/24 | United States | 10,000,000 | 9,800,000 | ||
| Global Eagle Entertainment Inc., Initial Term Loans, 7.322%, 1/06/23 | United States | 107,950,000 | 101,877,812 | ||
| h iHeartCommunications Inc., | |||||
| Tranche D Term Loan, 7.732%, 1/30/19 | United States | 918,185,548 | 792,699,883 | ||
| Tranche E Term Loan, 8.482%, 7/30/19. | United States | 241,744,256 | 207,295,700 | ||
| Neiman Marcus Group Ltd. Inc., Term Loan, 4.25%, 10/25/20 | United States | 71,083,970 | 57,378,127 | ||
| 1,526,212,574 | |||||
| Energy 0.4% | |||||
| Chesapeake Energy Corp., Class A Loans, 8.553%, 8/23/21 | United States | 80,000,000 | 85,375,040 | ||
| McDermott Finance LLC, Term Loan, 8.397%, 4/16/19 | United States | 9,351,495 | 9,497,613 | ||
| PetroQuest Energy Inc., Multidraw Term Loan Facility, 10.00%, 10/17/20 | United States | 30,000,000 | 30,150,000 | ||
68 Semiannual Report
franklintempleton.com
FRANKLIN CUSTODIAN FUNDS
STATEMENT OF INVESTMENTS (UNAUDITED)
| Franklin Income Fund (continued) | ||||
| Principal | ||||
| Country | Amount* | Value | ||
| k,n Senior Floating Rate Interests (continued) | ||||
| Energy (continued) | ||||
| c W&T Offshore Inc., | ||||
| Second Lien Term Loan, 9.00%, 5/15/20 | United States | 161,850,000 | $ | 145,665,000 |
| senior secured, 1.5 lien Term Loan, 11.00%, 11/15/19 | United States | 75,000,000 | 77,262,000 | |
| 347,949,653 | ||||
| Financials 0.3% | ||||
| First Eagle Investment Management, Initial Term Loans, 5.147%, | ||||
| 12/01/22 | United States | 157,999,813 | 159,036,766 | |
| Russell Investments US Institutional Holdco Inc., Initial Term Loan, 6.75%, | ||||
| 6/01/23 | United States | 64,750,000 | 65,397,500 | |
| 224,434,266 | ||||
| Health Care 0.5% | ||||
| Concordia International Corp., Initial Dollar Term Loan, 5.25%, 10/21/21 | Canada | 44,268,750 | 31,209,469 | |
| Horizon Pharma Inc., | ||||
| Incremental Term B-1 Loan, 5.50%, 5/07/21 | United States | 50,000,000 | 50,187,500 | |
| h Term Loan B, 6.63%, 3/29/24 | United States | 5,000,000 | 5,037,500 | |
| Lannett Co. Inc., Initial Tranche B Term Loans, 6.375%, 11/25/22 | United States | 60,937,500 | 60,861,328 | |
| MPH Acquisition Holdings LLC, Initial Term Loan, 4.897%, 6/07/23 | United States | 54,726,225 | 55,484,402 | |
| U.S. Renal Care Inc., Initial Term Loan, 5.397%, 12/31/22 | United States | 59,250,000 | 55,695,000 | |
| Vizient Inc., Term Loan, 5.00%, 2/11/23 | United States | 175,970,588 | 177,876,877 | |
| 436,352,076 | ||||
| Industrials 0.4% | ||||
| CEVA Group PLC, Pre-Funded L/C, 6.50%, 3/19/21 | United Kingdom | 18,246,603 | 16,142,551 | |
| CEVA Intercompany BV, Dutch BV Term Loan, 6.539%, 3/19/21 | United Kingdom | 18,664,616 | 16,512,362 | |
| CEVA Logistics Canada ULC, Canadian Term Loan, 6.539%, 3/19/21 | Canada | 3,218,038 | 2,846,959 | |
| CEVA Logistics U.S. Holdings Inc., U.S. Term Loan, 6.539%, 3/19/21 | United Kingdom | 25,744,299 | 22,775,672 | |
| Commercial Barge Line Co., Initial Term Loan, 9.75%, 11/12/20 | United States | 133,000,000 | 123,690,000 | |
| Navistar Inc., Tranche B Term Loans, 5.00%, 8/07/20. | United States | 36,133,392 | 36,600,127 | |
| Vertiv Group Corp., Term B Loans, 5.00% - 5.039%, 11/30/23. | United States | 147,086,207 | 148,557,069 | |
| 367,124,740 | ||||
| Information Technology 0.2% | ||||
| BMC Software Finance Inc., Initial U.S. Term Loans, 5.00%, 9/10/20 | United States | 87,208,592 | 87,411,004 | |
| Uber Technologies Inc., Term Loan, 5.00%, 7/13/23. | United States | 54,862,500 | 54,896,789 | |
| 142,307,793 | ||||
| Materials 0.2% | ||||
| Avantor Performance Materials Holdings Inc., | ||||
| Initial Term Loans, 5.00%, 3/10/24 | United States | 47,979,798 | 48,384,651 | |
| h Second Lien Initial Term Loans, 9.25%, 3/10/25 | United States | 36,821,053 | 37,005,158 | |
| FMG America Finance Inc. (Fortescue Metals Group), Loans, 3.75%, | ||||
| 6/30/19 | Australia | 41,329,801 | 41,603,611 | |
| 126,993,420 | ||||
| Utilities 0.1% | ||||
| Intergen NV, Term Advance, 5.65%, 6/13/20 | Netherlands | 43,300,439 | 43,246,313 | |
| Talen Energy Supply LLC, Term Loan, 6.06%, 12/06/23 | United States | 54,862,500 | 55,788,305 | |
| 99,034,618 | ||||
| Total Senior Floating Rate Interests | ||||
| (Cost $3,382,360,753) | 3,270,409,140 | |||
franklintempleton.com
Semiannual Report 69
FRANKLIN CUSTODIAN FUNDS
STATEMENT OF INVESTMENTS (UNAUDITED)
| Franklin Income Fund (continued) | ||||
| Country | Shares | Value | ||
| Escrows and Litigation Trusts 0.0% | ||||
| b,e Motors Liquidation Co., Escrow Account. | United States | 400,000,000 | $ | — |
| b,e Motors Liquidation Co., Escrow Account, cvt. pfd., C | United States | 11,000,000 | — | |
| Total Escrows and Litigation Trusts | ||||
| (Cost $2,416,248) | — | |||
| Number of | ||||
| Contracts | ||||
| Options Purchased 0.1% | ||||
| Calls - Exchange-Traded | ||||
| Financials 0.0%† | ||||
| CBOE SPX Volatility Index, May Strike Price $18, Expires 5/17/17. | 50,000 | 3,500,000 | ||
| Puts - Exchange-Traded | ||||
| Financials 0.1% | ||||
| S&P 500 Index, July Strike Price $2,350, Expires 7/21/17 | 10,000 | 54,900,000 | ||
| S&P 500 Index, May Srike Price $2,300, Expires 5/19/17 | 10,000 | 17,200,000 | ||
| Total Options Purchased | ||||
| (Cost $101,908,604) | 75,600,000 | |||
| Total Investments before Short Term Investments | ||||
| (Cost $74,471,422,893) | 79,443,486,840 | |||
| Principal | ||||
| Country | Amount* | |||
| Short Term Investments 4.1% | ||||
| U.S. Government and Agency Securities 0.7% | ||||
| o FHLB, 4/05/17 - 4/21/17 | United States | 75,000,000 | 74,982,050 | |
| o U.S. Treasury Bill, 4/13/17 - 5/18/17 | United States | 500,000,000 | 499,754,900 | |
| Total U.S. Government and Agency Securities | ||||
| (Cost $574,698,342) | 574,736,950 | |||
| Total Investments before Money Market Funds and | ||||
| Repurchase Agreement | ||||
| (Cost $75,046,121,235) | 80,018,223,790 | |||
| Shares | ||||
| Money Market Funds (Cost $2,759,266,968) 3.3% | ||||
| p,q Institutional Fiduciary Trust Money Market Portfolio, 0.32% | United States | 2,759,266,968 | 2,759,266,968 | |
| r Investments from Cash Collateral Received for Loaned | ||||
| Securities 0.1% | ||||
| Money Market Funds (Cost $61,626,000) 0.1% | ||||
| p,q Institutional Fiduciary Trust Money Market Portfolio, 0.32% | United States | 61,626,000 | 61,626,000 | |
70 Semiannual Report
franklintempleton.com
FRANKLIN CUSTODIAN FUNDS
STATEMENT OF INVESTMENTS (UNAUDITED)
| Franklin Income Fund (continued) | ||||||
| Principal | ||||||
| Country | Amount* | Value | ||||
| Repurchase Agreement (Cost $15,765,070) 0.0%† | ||||||
| s Joint Repurchase Agreement, 0.80%, 4/03/17 | ||||||
| (Maturity Value $15,766,121) | ||||||
| J.P. Morgan Securities LLC | ||||||
| Collateralized by U.S. Treasury Note, Index Linked, 0.125% - 2.625%, | ||||||
| 7/15/17–7/15/21 (valued at$16,080,976) | United States | 15,765,070 | $ | 15,765,070 | ||
| Total Investments from Cash Collateral Received for | ||||||
| Loaned Securities (Cost $77,391,070) | 77,391,070 | |||||
| Total Investments (Cost $77,882,779,273) 99.9% | 82,854,881,828 | |||||
| Options Written (0.0)%† | (14,229,630 | ) | ||||
| Other Assets, less Liabilities 0.1%. | 92,691,485 | |||||
| Net Assets 100.0% | $ | 82,933,343,683 | ||||
| Number of | ||||||
| Contracts | ||||||
| t Options Written (0.0)%† | ||||||
| Calls - Exchange-Traded | ||||||
| Consumer Discretionary (0.0)%† | ||||||
| General Motors Co., April Strike Price $39, Expires 4/21/17 | 15,000 | (30,000 | ) | |||
| Energy (0.0)%† | ||||||
| Weatherford International PLC, June Strike Price $8, Expires 6/16/17 | 50,000 | (1,200,000 | ) | |||
| Financials (0.0)%† | ||||||
| CBOE SPX Volatility Index, May Strike Price $30, Expires 5/17/17. | 50,000 | (750,000 | ) | |||
| Health Care (0.0)%† | ||||||
| Eli Lilly & Co., May Strike Price $87.50, Expires 5/19/17 | 10,000 | (890,000 | ) | |||
| Industrials (0.0)%† | ||||||
| Deere & Co., April Strike Price $115, Expires 4/21/17. | 14,000 | (182,000 | ) | |||
| United Technologies Corp., April Strike Price $115, Expires 4/21/17. | 20,000 | (500,000 | ) | |||
| (682,000 | ) | |||||
| Information Technology (0.0)%† | ||||||
| Microsoft Corp., June Strike Price $67.50, Expires 6/16/17 | 15,000 | (1,860,000 | ) | |||
| Microsoft Corp., May Strike Price $67.50, Expires 5/19/17 | 15,000 | (1,485,000 | ) | |||
| Oracle Corp., May Strike Price $45, Expires 5/19/17 | 15,000 | (930,000 | ) | |||
| (4,275,000 | ) | |||||
| Materials (0.0)%† | ||||||
| Rio Tinto PLC, May Strike Price $47.50, Expires 5/19/17 | 20,000 | (400,000 | ) | |||
| The Dow Chemical Co., June Strike Price $67.50, Expires 6/16/17 | 15,000 | (960,000 | ) | |||
| (1,360,000 | ) | |||||
| Puts - Exchange-Traded | ||||||
| Consumer Discretionary (0.0)%† | ||||||
| Amazon.com Inc., May Strike Price $800, Expires 5/19/17 | 1,500 | (895,500 | ) | |||
| Industrials (0.0)%† | ||||||
| General Dynamics Corp., May Strike Price $180, Expires 5/19/17 | 12,500 | (2,937,500 | ) | |||
| Northrop Grumman Corp., May Strike Price $225, Expires 5/19/17 | 1,000 | (165,000 | ) | |||
| Raytheon Co., May Strike Price $145, Expires 5/19/17 | 7,738 | (1,044,630 | ) | |||
| (4,147,130 | ) | |||||
| Total Options Written (Premiums received $21,612,989) . | $ | (14,229,630 | ) | |||
franklintempleton.com
Semiannual Report 71
FRANKLIN CUSTODIAN FUNDS
STATEMENT OF INVESTMENTS (UNAUDITED)
Franklin Income Fund (continued)
See Abbreviations on page 117.
†Rounds to less than 0.1% of net assets.
*The principal amount is stated in U.S. dollars unless otherwise indicated.
aA portion or all of the security is held in connection with written option contracts open at period end.
bNon-income producing.
cSee Note 11 regarding holdings of 5% voting securities.
dSee Note 8 regarding restricted securities.
eSecurity has been deemed illiquid because it may not be able to be sold within seven days. At March 31, 2017, the aggregate value of these securities was $46,929,520,
representing 0.1% of net assets.
fSee Note 1(f) regarding equity-linked securities.
gSecurity was purchased pursuant to Rule 144A under the Securities Act of 1933 and may be sold in transactions exempt from registration only to qualified institutional buyers
or in a public offering registered under the Securities Act of 1933. These securities have been deemed liquid under guidelines approved by the Trust’s Board of Trustees. At
March 31, 2017, the aggregate value of these securities was $21,558,418,633, representing 26.0% of net assets.
hA portion or all of the security purchased on a delayed delivery basis. See Note 1(d).
iSecurity purchased on a when-issued basis. See Note 1(d).
jA portion or all of the security is on loan at March 31, 2017. See Note 1(g).
kThe coupon rate shown represents the rate at period end.
lIncome may be received in additional securities and/or cash.
mPerpetual security with no stated maturity date.
nSee Note 1(i) regarding senior floating rate interests.
oThe security was issued on a discount basis with no stated coupon rate.
pSee Note 3(f) regarding investments in affiliated management investment companies.
qThe rate shown is the annualized seven-day yield at period end.
rSee Note 1(g) regarding securities on loan.
sSee Note 1(c) regarding joint repurchase agreement.
tSee Note 1(e) regarding written options.
72 Semiannual Report | The accompanying notes are an integral part of these financial statements. franklintempleton.com
FRANKLIN CUSTODIAN FUNDS
| Financial Highlights | ||||||||||||||||||
| Franklin U.S. Government Securities Fund | ||||||||||||||||||
| Six Months Ended | ||||||||||||||||||
| March 31, 2017 | Year Ended September 30, | |||||||||||||||||
| (unaudited) | 2016 | 2015 | 2014 | 2013 | 2012 | |||||||||||||
| Class A | ||||||||||||||||||
| Per share operating performance | ||||||||||||||||||
| (for a share outstanding throughout the period) | ||||||||||||||||||
| Net asset value, beginning of period | $ | 6.35 | $ | 6.40 | $ | 6.48 | $ | 6.53 | $ | 6.91 | $ | 6.92 | ||||||
| Income from investment operationsa: | ||||||||||||||||||
| Net investment incomeb | 0.06 | 0.14 | 0.15 | 0.17 | 0.15 | 0.20 | ||||||||||||
| Net realized and unrealized gains (losses) | (0.15 | ) | 0.01 | (0.02 | ) | 0.01 | (0.29 | ) | 0.04 | |||||||||
| Total from investment operations | (0.09 | ) | 0.15 | 0.13 | 0.18 | (0.14 | ) | 0.24 | ||||||||||
| Less distributions from net investment income . | (0.10 | ) | (0.20 | ) | (0.21 | ) | (0.23 | ) | (0.24 | ) | (0.25 | ) | ||||||
| Net asset value, end of period | $ | 6.16 | $ | 6.35 | $ | 6.40 | $ | 6.48 | $ | 6.53 | $ | 6.91 | ||||||
| Total returnc | (1.48 | )% | 2.35 | % | 2.07 | % | 2.80 | % | (2.03 | )% | 3.49 | % | ||||||
| Ratios to average net assetsd | ||||||||||||||||||
| Expenses. | 0.76 | %e | 0.76 | %e | 0.76 | %e | 0.75 | %e | 0.73 | % | 0.73 | % | ||||||
| Net investment income | 2.06 | % | 2.21 | % | 2.28 | % | 2.62 | % | 2.17 | % | 2.86 | % | ||||||
| Supplemental data | ||||||||||||||||||
| Net assets, end of period (000’s) | $ | 3,799,507 | $ | 4,235,819 | $ | 4,167,639 | $ | 4,323,990 | $ | 5,138,613 | $ | 6,861,193 | ||||||
| Portfolio turnover rate | 43.89 | % | 92.18 | % | 69.10 | % | 69.73 | % | 46.16 | % | 40.15 | % | ||||||
| Portfolio turnover rate excluding mortgage | ||||||||||||||||||
| dollar rollsf | 43.89 | % | 92.18 | % | 58.70 | % | 38.79 | % | 40.83 | % | 40.15 | % | ||||||
aThe amount shown for a share outstanding throughout the period may not correlate with the Statement of Operations for the period due to the timing of sales and
repurchases of the Fund’s shares in relation to income earned and/or fluctuating fair value of the investments of the Fund.
bBased on average daily shares outstanding.
cTotal return does not reflect sales commissions or contingent deferred sales charges, if applicable, and is not annualized for periods less than one year.
dRatios are annualized for periods less than one year.
eBenefit of waiver and payments by affiliates and expense reduction rounds to less than 0.01%.
fSee Note 1(h) regarding mortgage dollar rolls.
franklintempleton.com The accompanying notes are an integral part of these financial statements. | Semiannual Report 73
| FRANKLIN CUSTODIAN FUNDS | ||||||||||||||||||
| FINANCIAL HIGHLIGHTS | ||||||||||||||||||
| Franklin U.S. Government Securities Fund (continued) | ||||||||||||||||||
| Six Months Ended | ||||||||||||||||||
| March 31, 2017 | Year Ended September 30, | |||||||||||||||||
| (unaudited) | 2016 | 2015 | 2014 | 2013 | 2012 | |||||||||||||
| Class C | ||||||||||||||||||
| Per share operating performance | ||||||||||||||||||
| (for a share outstanding throughout the period) | ||||||||||||||||||
| Net asset value, beginning of period | $ | 6.30 | $ | 6.36 | $ | 6.44 | $ | 6.49 | $ | 6.86 | $ | 6.88 | ||||||
| Income from investment operationsa: | ||||||||||||||||||
| Net investment incomeb | 0.05 | 0.11 | 0.11 | 0.14 | 0.11 | 0.16 | ||||||||||||
| Net realized and unrealized gains (losses) | (0.15 | ) | —c | (0.01 | ) | 0.01 | (0.28 | ) | 0.03 | |||||||||
| Total from investment operations | (0.10 | ) | 0.11 | 0.10 | 0.15 | (0.17 | ) | 0.19 | ||||||||||
| Less distributions from net investment income . | (0.08 | ) | (0.17 | ) | (0.18 | ) | (0.20 | ) | (0.20 | ) | (0.21 | ) | ||||||
| Net asset value, end of period | $ | 6.12 | $ | 6.30 | $ | 6.36 | $ | 6.44 | $ | 6.49 | $ | 6.86 | ||||||
| Total returnd | (1.58 | )% | 1.70 | % | 1.57 | % | 2.30 | % | (2.45 | )% | 2.85 | % | ||||||
| Ratios to average net assetse | ||||||||||||||||||
| Expenses. | 1.26 | %f | 1.26 | %f | 1.26 | %f | 1.25 | %f | 1.23 | % | 1.23 | % | ||||||
| Net investment income | 1.56 | % | 1.71 | % | 1.78 | % | 2.12 | % | 1.67 | % | 2.36 | % | ||||||
| Supplemental data | ||||||||||||||||||
| Net assets, end of period (000’s) | $ | 894,990 | $ | 1,034,410 | $ | 1,040,294 | $ | 1,190,720 | $ | 1,640,787 | $ | 2,981,724 | ||||||
| Portfolio turnover rate | 43.89 | % | 92.18 | % | 69.10 | % | 69.73 | % | 46.16 | % | 40.15 | % | ||||||
| Portfolio turnover rate excluding mortgage | ||||||||||||||||||
| dollar rollsg | 43.89 | % | 92.18 | % | 58.70 | % | 38.79 | % | 40.83 | % | 40.15 | % | ||||||
aThe amount shown for a share outstanding throughout the period may not correlate with the Statement of Operations for the period due to the timing of sales and
repurchases of the Fund’s shares in relation to income earned and/or fluctuating fair value of the investments of the Fund.
bBased on average daily shares outstanding.
cAmount rounds to less than $0.01 per share.
dTotal return does not reflect sales commissions or contingent deferred sales charges, if applicable, and is not annualized for periods less than one year.
eRatios are annualized for periods less than one year.
fBenefit of waiver and payments by affiliates and expense reduction rounds to less than 0.01%.
gSee Note 1(h) regarding mortgage dollar rolls.
74 Semiannual Report | The accompanying notes are an integral part of these financial statements. franklintempleton.com
| FRANKLIN CUSTODIAN FUNDS | ||||||||||||||||||
| FINANCIAL HIGHLIGHTS | ||||||||||||||||||
| Franklin U.S. Government Securities Fund (continued) | ||||||||||||||||||
| Six Months Ended | ||||||||||||||||||
| March 31, 2017 | Year Ended September 30, | |||||||||||||||||
| (unaudited) | 2016 | 2015 | 2014 | 2013 | 2012 | |||||||||||||
| Class R | ||||||||||||||||||
| Per share operating performance | ||||||||||||||||||
| (for a share outstanding throughout the period) | ||||||||||||||||||
| Net asset value, beginning of period | $ | 6.34 | $ | 6.40 | $ | 6.48 | $ | 6.53 | $ | 6.90 | $ | 6.91 | ||||||
| Income from investment operationsa: | ||||||||||||||||||
| Net investment incomeb | 0.05 | 0.12 | 0.13 | 0.15 | 0.12 | 0.17 | ||||||||||||
| Net realized and unrealized gains (losses) | (0.14 | ) | —c | (0.02 | ) | 0.01 | (0.27 | ) | 0.04 | |||||||||
| Total from investment operations | (0.09 | ) | 0.12 | 0.11 | 0.16 | (0.15 | ) | 0.21 | ||||||||||
| Less distributions from net investment income . | (0.09 | ) | (0.18 | ) | (0.19 | ) | (0.21 | ) | (0.22 | ) | (0.22 | ) | ||||||
| Net asset value, end of period | $ | 6.16 | $ | 6.34 | $ | 6.40 | $ | 6.48 | $ | 6.53 | $ | 6.90 | ||||||
| Total returnd | (1.50 | )% | 1.84 | % | 1.71 | % | 2.44 | % | (2.27 | )% | 3.13 | % | ||||||
| Ratios to average net assetse | ||||||||||||||||||
| Expenses. | 1.10 | %f | 1.11 | %f | 1.11 | %f | 1.10 | %f | 1.08 | % | 1.08 | % | ||||||
| Net investment income | 1.72 | % | 1.86 | % | 1.93 | % | 2.27 | % | 1.82 | % | 2.51 | % | ||||||
| Supplemental data | ||||||||||||||||||
| Net assets, end of period (000’s) | $ | 44,016 | $ | 59,785 | $ | 64,689 | $ | 74,442 | $ | 94,110 | $ | 141,140 | ||||||
| Portfolio turnover rate | 43.89 | % | 92.18 | % | 69.10 | % | 69.73 | % | 46.16 | % | 40.15 | % | ||||||
| Portfolio turnover rate excluding mortgage | ||||||||||||||||||
| dollar rollsg | 43.89 | % | 92.18 | % | 58.70 | % | 38.79 | % | 40.83 | % | 40.15 | % | ||||||
aThe amount shown for a share outstanding throughout the period may not correlate with the Statement of Operations for the period due to the timing of sales and
repurchases of the Fund’s shares in relation to income earned and/or fluctuating fair value of the investments of the Fund.
bBased on average daily shares outstanding.
cAmount rounds to less than $0.01 per share.
dTotal return is not annualized for periods less than one year.
eRatios are annualized for periods less than one year.
fBenefit of waiver and payments by affiliates and expense reduction rounds to less than 0.01%.
gSee Note 1(h) regarding mortgage dollar rolls.
franklintempleton.com The accompanying notes are an integral part of these financial statements. | Semiannual Report 75
| FRANKLIN CUSTODIAN FUNDS | |||||||||||||||
| FINANCIAL HIGHLIGHTS | |||||||||||||||
| Franklin U.S. Government Securities Fund (continued) | |||||||||||||||
| Six Months Ended | |||||||||||||||
| March 31, 2017 | Year Ended September 30, | ||||||||||||||
| (unaudited) | 2016 | 2015 | 2014 | 2013 | a | ||||||||||
| Class R6 | |||||||||||||||
| Per share operating performance | |||||||||||||||
| (for a share outstanding throughout the period) | |||||||||||||||
| Net asset value, beginning of period | $ | 6.37 | $ | 6.42 | $ | 6.50 | $ | 6.55 | $ | 6.76 | |||||
| Income from investment operationsb: | |||||||||||||||
| Net investment incomec | 0.07 | 0.16 | 0.17 | 0.19 | 0.07 | ||||||||||
| Net realized and unrealized gains (losses) | (0.15 | ) | 0.01 | (0.02 | ) | 0.01 | (0.17 | ) | |||||||
| Total from investment operations. | (0.08 | ) | 0.17 | 0.15 | 0.20 | (0.10 | ) | ||||||||
| Less distributions from net investment income | (0.11 | ) | (0.22 | ) | (0.23 | ) | (0.25 | ) | (0.11 | ) | |||||
| Net asset value, end of period. | $ | 6.18 | $ | 6.37 | $ | 6.42 | $ | 6.50 | $ | 6.55 | |||||
| Total returnd | (1.33 | )% | 2.63 | % | 2.35 | % | 3.08 | % | (1.53 | )% | |||||
| Ratios to average net assetse | |||||||||||||||
| Expenses | 0.48 | %f | 0.48 | %f | 0.47 | %f | 0.47 | %f | 0.46 | % | |||||
| Net investment income. | 2.34 | % | 2.49 | % | 2.57 | % | 2.90 | % | 2.44 | % | |||||
| Supplemental data | |||||||||||||||
| Net assets, end of period (000’s) | $ | 449,710 | $ | 624,619 | $ | 375,644 | $ | 497,246 | $ | 480,590 | |||||
| Portfolio turnover rate | 43.89 | % | 92.18 | % | 69.10 | % | 69.73 | % | 46.16 | % | |||||
| Portfolio turnover rate excluding mortgage dollar rollsg | 43.89 | % | 92.18 | % | 58.70 | % | 38.79 | % | 40.83 | % | |||||
aFor the period May 1, 2013 (effective date) to September 30, 2013.
bThe amount shown for a share outstanding throughout the period may not correlate with the Statement of Operations for the period due to the timing of sales and
repurchases of the Fund’s shares in relation to income earned and/or fluctuating fair value of the investments of the Fund.
cBased on average daily shares outstanding.
dTotal return is not annualized for periods less than one year.
eRatios are annualized for periods less than one year.
fBenefit of waiver and payments by affiliates and expense reduction rounds to less than 0.01%.
gSee Note 1(h) regarding mortgage dollar rolls.
76 Semiannual Report | The accompanying notes are an integral part of these financial statements. franklintempleton.com
| FRANKLIN CUSTODIAN FUNDS | ||||||||||||||||||
| FINANCIAL HIGHLIGHTS | ||||||||||||||||||
| Franklin U.S. Government Securities Fund (continued) | ||||||||||||||||||
| Six Months Ended | ||||||||||||||||||
| March 31, 2017 | Year Ended September 30, | |||||||||||||||||
| (unaudited) | 2016 | 2015 | 2014 | 2013 | 2012 | |||||||||||||
| Advisor Class | ||||||||||||||||||
| Per share operating performance | ||||||||||||||||||
| (for a share outstanding throughout the period) | ||||||||||||||||||
| Net asset value, beginning of period | $ | 6.37 | $ | 6.42 | $ | 6.50 | $ | 6.55 | $ | 6.93 | $ | 6.94 | ||||||
| Income from investment operationsa: | ||||||||||||||||||
| Net investment incomeb | 0.07 | 0.15 | 0.16 | 0.18 | 0.16 | 0.21 | ||||||||||||
| Net realized and unrealized gains (losses) | (0.15 | ) | 0.01 | (0.02 | ) | 0.01 | (0.29 | ) | 0.04 | |||||||||
| Total from investment operations | (0.08 | ) | 0.16 | 0.14 | 0.19 | (0.13 | ) | 0.25 | ||||||||||
| Less distributions from net investment income . | (0.10 | ) | (0.21 | ) | (0.22 | ) | (0.24 | ) | (0.25 | ) | (0.26 | ) | ||||||
| Net asset value, end of period | $ | 6.19 | $ | 6.37 | $ | 6.42 | $ | 6.50 | $ | 6.55 | $ | 6.93 | ||||||
| Total returnc | (1.24 | )% | 2.49 | % | 2.21 | % | 2.94 | % | (1.86 | )% | 3.63 | % | ||||||
| Ratios to average net assetsd | ||||||||||||||||||
| Expenses. | 0.61 | %e | 0.61 | %e | 0.61 | %e | 0.60 | %e | 0.58 | % | 0.58 | % | ||||||
| Net investment income | 2.21 | % | 2.36 | % | 2.43 | % | 2.77 | % | 2.32 | % | 3.01 | % | ||||||
| Supplemental data | ||||||||||||||||||
| Net assets, end of period (000’s) | $ | 788,515 | $ | 718,975 | $ | 622,339 | $ | 652,737 | $ | 949,085 | $ | 1,586,928 | ||||||
| Portfolio turnover rate | 43.89 | % | 92.18 | % | 69.10 | % | 69.73 | % | 46.16 | % | 40.15 | % | ||||||
| Portfolio turnover rate excluding mortgage | ||||||||||||||||||
| dollar rollsf | 43.89 | % | 92.18 | % | 58.70 | % | 38.79 | % | 40.83 | % | 40.15 | % | ||||||
aThe amount shown for a share outstanding throughout the period may not correlate with the Statement of Operations for the period due to the timing of sales and
repurchases of the Fund’s shares in relation to income earned and/or fluctuating fair value of the investments of the Fund.
bBased on average daily shares outstanding.
cTotal return is not annualized for periods less than one year.
dRatios are annualized for periods less than one year.
eBenefit of waiver and payments by affiliates and expense reduction rounds to less than 0.01%.
fSee Note 1(h) regarding mortgage dollar rolls.
franklintempleton.com The accompanying notes are an integral part of these financial statements. | Semiannual Report 77
| FRANKLIN CUSTODIAN FUNDS | ||||
| Statement of Investments, March 31, 2017 (unaudited) | ||||
| Franklin U.S. Government Securities Fund | ||||
| Principal | ||||
| Amount | Value | |||
| Mortgage-Backed Securities 98.7% | ||||
| Government National Mortgage Association (GNMA) Fixed Rate 98.7% | ||||
| GNMA I SF 15 Year, 6.50%, 5/15/18 | $ | 1,142 | $ | 1,143 |
| GNMA I SF 30 Year, 3.50%, 4/15/43 - 5/15/43 | 35,165,778 | 36,652,031 | ||
| GNMA I SF 30 Year, 4.00%, 10/15/40 - 1/15/45 | 55,890,522 | 59,439,177 | ||
| GNMA I SF 30 Year, 4.00%, 8/15/44 | 21,951,122 | 23,368,385 | ||
| GNMA I SF 30 Year, 4.00%, 1/15/45 - 9/15/45 | 55,920,818 | 59,505,997 | ||
| GNMA I SF 30 Year, 4.00%, 10/15/45 - 8/15/46 | 7,952,619 | 8,467,377 | ||
| GNMA I SF 30 Year, 4.50%, 2/15/39 - 11/15/39 | 54,349,010 | 58,552,408 | ||
| GNMA I SF 30 Year, 4.50%, 3/15/39 | 22,316,247 | 24,131,730 | ||
| GNMA I SF 30 Year, 4.50%, 12/15/39 - 4/15/40 | 51,173,151 | 55,048,895 | ||
| GNMA I SF 30 Year, 4.50%, 4/15/40 - 7/15/40 | 46,876,446 | 50,308,472 | ||
| GNMA I SF 30 Year, 4.50%, 6/15/40 | 17,876,998 | 19,324,361 | ||
| GNMA I SF 30 Year, 4.50%, 7/15/40 | 19,465,261 | 20,851,162 | ||
| GNMA I SF 30 Year, 4.50%, 7/15/40 - 8/15/40 | 44,367,604 | 47,624,755 | ||
| GNMA I SF 30 Year, 4.50%, 8/15/40 - 6/15/41 | 37,948,258 | 41,078,713 | ||
| GNMA I SF 30 Year, 5.00%, 2/15/33 - 10/15/33 | 54,042,970 | 59,716,009 | ||
| GNMA I SF 30 Year, 5.00%, 10/15/33 - 8/15/35 | 53,484,557 | 59,102,681 | ||
| GNMA I SF 30 Year, 5.00%, 8/15/35 - 10/15/39 | 53,358,490 | 58,815,297 | ||
| GNMA I SF 30 Year, 5.00%, 8/15/39 | 27,029,962 | 29,830,517 | ||
| GNMA I SF 30 Year, 5.00%, 10/15/39 | 18,982,179 | 21,125,968 | ||
| GNMA I SF 30 Year, 5.00%, 10/15/39 | 26,028,404 | 28,964,672 | ||
| GNMA I SF 30 Year, 5.00%, 10/15/39 - 12/15/39. | 50,580,135 | 56,105,209 | ||
| GNMA I SF 30 Year, 5.00%, 11/15/39 | 32,205,597 | 35,855,965 | ||
| GNMA I SF 30 Year, 5.00%, 12/15/39 - 5/15/40 | 53,788,839 | 59,519,355 | ||
| GNMA I SF 30 Year, 5.00%, 2/15/40 | 17,531,575 | 19,515,281 | ||
| GNMA I SF 30 Year, 5.00%, 3/15/40 | 20,846,374 | 23,190,664 | ||
| GNMA I SF 30 Year, 5.00%, 5/15/40 - 6/15/40 | 45,829,681 | 50,951,714 | ||
| GNMA I SF 30 Year, 5.00%, 6/15/40 | 11,979,101 | 13,340,293 | ||
| GNMA I SF 30 Year, 5.00%, 9/15/40 | 28,134,288 | 31,064,804 | ||
| GNMA I SF 30 Year, 5.50%, 5/15/28 - 5/15/33 | 52,981,398 | 59,708,245 | ||
| GNMA I SF 30 Year, 5.50%, 5/15/33 - 12/15/34 | 53,001,541 | 59,665,065 | ||
| GNMA I SF 30 Year, 5.50%, 12/15/34 - 12/15/38. | 51,647,282 | 58,334,875 | ||
| GNMA I SF 30 Year, 5.50%, 12/15/38 - 2/15/40 | 43,644,573 | 48,943,137 | ||
| GNMA I SF 30 Year, 6.00%, 10/15/23 - 2/15/33 | 52,098,931 | 59,665,164 | ||
| GNMA I SF 30 Year, 6.00%, 2/15/33 - 12/15/36 | 51,670,360 | 59,599,567 | ||
| GNMA I SF 30 Year, 6.00%, 12/15/36 - 11/15/38. | 51,837,072 | 59,170,010 | ||
| GNMA I SF 30 Year, 6.00%, 11/15/38 - 12/15/39. | 22,000,717 | 24,912,405 | ||
| GNMA I SF 30 Year, 6.50%, 5/15/23 - 10/15/36 | 52,464,459 | 59,728,473 | ||
| GNMA I SF 30 Year, 6.50%, 11/15/36 - 8/15/37 | 3,779,375 | 4,306,536 | ||
| GNMA I SF 30 Year, 6.75%, 3/15/26 | 914 | 1,037 | ||
| GNMA I SF 30 Year, 7.00%, 4/15/17 - 9/15/32 | 38,609,696 | 42,738,916 | ||
| GNMA I SF 30 Year, 7.25%, 12/15/25 - 1/15/26 | 96,058 | 98,544 | ||
| GNMA I SF 30 Year, 7.50%, 4/15/17 - 8/15/33 | 11,432,473 | 12,451,966 | ||
| GNMA I SF 30 Year, 7.70%, 1/15/21 - 10/15/21 | 63,130 | 63,325 | ||
| GNMA I SF 30 Year, 8.00%, 4/15/17 - 9/15/30 | 4,597,865 | 4,804,282 | ||
| GNMA I SF 30 Year, 8.50%, 4/15/17 - 5/15/25 | 879,509 | 922,760 | ||
| GNMA I SF 30 Year, 9.00%, 5/15/17 - 7/15/23 | 815,901 | 841,422 | ||
| GNMA I SF 30 Year, 9.50%, 6/15/17 - 8/15/22 | 817,145 | 829,002 | ||
| GNMA I SF 30 Year, 10.00%, 7/15/17 - 3/15/25 | 537,130 | 544,567 | ||
| GNMA I SF 30 Year, 10.50%, 6/15/17 - 10/15/21. | 264,934 | 268,107 | ||
| GNMA I SF 30 Year, 11.00%, 11/15/17 - 5/15/21. | 42,089 | 42,543 | ||
| GNMA II SF 30 Year, 3.00%, 2/20/45 | 11,397,893 | 11,514,831 | ||
| GNMA II SF 30 Year, 3.00%, 9/20/46 | 24,364,498 | 24,614,468 | ||
78 Semiannual Report
franklintempleton.com
FRANKLIN CUSTODIAN FUNDS
STATEMENT OF INVESTMENTS (UNAUDITED)
| Franklin U.S. Government Securities Fund (continued) | ||||
| Principal | ||||
| Amount | Value | |||
| Mortgage-Backed Securities (continued) | ||||
| Government National Mortgage Association (GNMA) Fixed Rate (continued) | ||||
| GNMA II SF 30 Year, 3.00%, 10/20/46 | $ | 38,347,602 | $ | 38,741,033 |
| GNMA II SF 30 Year, 3.00%, 11/20/46 | 24,719,597 | 24,973,210 | ||
| GNMA II SF 30 Year, 3.00%, 2/20/47 | 165,618,356 | 167,317,532 | ||
| GNMA II SF 30 Year, 3.50%, 10/20/40 - 5/20/43 | 43,212,845 | 44,996,380 | ||
| GNMA II SF 30 Year, 3.50%, 7/20/42 | 67,954,922 | 70,776,742 | ||
| GNMA II SF 30 Year, 3.50%, 8/20/42 | 23,338,628 | 24,307,761 | ||
| GNMA II SF 30 Year, 3.50%, 9/20/42 | 153,525,338 | 159,900,514 | ||
| GNMA II SF 30 Year, 3.50%, 10/20/42 | 31,633,483 | 32,947,087 | ||
| GNMA II SF 30 Year, 3.50%, 11/20/42 | 26,280,253 | 27,371,571 | ||
| GNMA II SF 30 Year, 3.50%, 4/20/43 | 32,708,908 | 34,067,250 | ||
| GNMA II SF 30 Year, 3.50%, 5/20/43 | 43,741,413 | 45,557,919 | ||
| GNMA II SF 30 Year, 3.50%, 6/20/43 | 50,603,063 | 52,704,540 | ||
| GNMA II SF 30 Year, 3.50%, 8/20/43 | 36,655,752 | 38,178,075 | ||
| GNMA II SF 30 Year, 3.50%, 9/20/46 | 69,705,968 | 72,371,809 | ||
| GNMA II SF 30 Year, 3.50%, 10/20/46 | 647,506,589 | 672,269,883 | ||
| GNMA II SF 30 Year, 3.50%, 11/20/46 | 73,431,967 | 76,240,305 | ||
| GNMA II SF 30 Year, 3.50%, 12/20/46 | 286,530,450 | 297,488,544 | ||
| GNMA II SF 30 Year, 3.50%, 2/20/47 | 853,884,747 | 886,540,784 | ||
| GNMA II SF 30 Year, 4.00%, 5/20/40 - 2/20/44 | 28,961,569 | 30,885,188 | ||
| GNMA II SF 30 Year, 4.00%, 11/20/40 | 45,095,956 | 48,294,660 | ||
| GNMA II SF 30 Year, 4.00%, 12/20/40 | 26,461,245 | 28,198,330 | ||
| GNMA II SF 30 Year, 4.00%, 1/20/41 | 29,178,633 | 31,112,899 | ||
| GNMA II SF 30 Year, 4.00%, 7/20/41 | 36,861,215 | 39,209,747 | ||
| GNMA II SF 30 Year, 4.00%, 9/20/41 | 43,457,190 | 46,204,421 | ||
| GNMA II SF 30 Year, 4.00%, 10/20/41 | 52,960,397 | 56,296,933 | ||
| GNMA II SF 30 Year, 4.00%, 11/20/41 | 48,439,790 | 51,478,805 | ||
| GNMA II SF 30 Year, 4.00%, 2/20/44 | 28,620,859 | 30,441,841 | ||
| GNMA II SF 30 Year, 4.00%, 3/20/47 | 262,423,056 | 277,571,996 | ||
| GNMA II SF 30 Year, 4.50%, 5/20/33 - 6/20/40 | 44,443,015 | 48,025,154 | ||
| GNMA II SF 30 Year, 4.50%, 12/20/39 | 30,968,565 | 33,542,396 | ||
| GNMA II SF 30 Year, 4.50%, 7/20/40 - 8/20/42 | 33,414,476 | 36,140,835 | ||
| GNMA II SF 30 Year, 4.50%, 5/20/41 | 40,666,110 | 43,914,879 | ||
| GNMA II SF 30 Year, 4.50%, 6/20/41 | 49,254,509 | 53,189,483 | ||
| GNMA II SF 30 Year, 4.50%, 7/20/41 | 53,499,521 | 57,773,661 | ||
| GNMA II SF 30 Year, 4.50%, 9/20/41 | 71,198,148 | 76,892,119 | ||
| GNMA II SF 30 Year, 4.50%, 10/20/41 | 53,380,449 | 57,645,118 | ||
| GNMA II SF 30 Year, 4.50%, 2/20/44 | 29,411,638 | 31,441,302 | ||
| GNMA II SF 30 Year, 5.00%, 7/20/33 - 12/20/39 | 45,413,237 | 50,469,540 | ||
| GNMA II SF 30 Year, 5.00%, 9/20/33 | 29,075,899 | 32,403,521 | ||
| GNMA II SF 30 Year, 5.00%, 7/20/39 | 17,887,824 | 19,542,561 | ||
| GNMA II SF 30 Year, 5.00%, 4/20/40 - 9/20/41 | 21,417,444 | 23,640,729 | ||
| GNMA II SF 30 Year, 5.00%, 6/20/40 | 21,044,779 | 23,269,919 | ||
| GNMA II SF 30 Year, 5.50%, 6/20/34 - 5/20/35 | 51,700,043 | 57,978,511 | ||
| GNMA II SF 30 Year, 5.50%, 12/20/34 | 18,406,460 | 20,676,717 | ||
| GNMA II SF 30 Year, 5.50%, 6/20/35 - 4/20/40 | 41,266,093 | 45,887,245 | ||
| GNMA II SF 30 Year, 6.00%, 10/20/23 - 2/20/36 | 51,024,312 | 58,720,614 | ||
| GNMA II SF 30 Year, 6.00%, 3/20/36 - 7/20/39 | 31,473,574 | 35,843,439 | ||
| GNMA II SF 30 Year, 6.50%, 6/20/24 - 1/20/39 | 28,350,738 | 32,537,417 | ||
| GNMA II SF 30 Year, 7.00%, 2/20/28 - 7/20/33 | 6,532,440 | 7,802,599 | ||
| GNMA II SF 30 Year, 7.50%, 10/20/22 - 4/20/32 | 1,437,321 | 1,643,412 | ||
| GNMA II SF 30 Year, 8.00%, 5/20/17 - 6/20/30 | 682,916 | 804,278 | ||
| GNMA II SF 30 Year, 8.50%, 6/20/17 - 6/20/25 | 196,044 | 206,833 | ||
franklintempleton.com
Semiannual Report 79
FRANKLIN CUSTODIAN FUNDS
STATEMENT OF INVESTMENTS (UNAUDITED)
| Franklin U.S. Government Securities Fund (continued) | ||||
| Principal | ||||
| Amount | Value | |||
| Mortgage-Backed Securities (continued) | ||||
| Government National Mortgage Association (GNMA) Fixed Rate (continued) | ||||
| GNMA II SF 30 Year, 9.00%, 11/20/17 - 11/20/21 | $ | 38,419 | $ | 41,363 |
| GNMA II SF 30 Year, 9.50%, 3/20/18 - 4/20/25 | 66,290 | 69,185 | ||
| GNMA II SF 30 Year, 10.00%, 10/20/17 - 3/20/21 | 76,931 | 81,809 | ||
| GNMA II SF 30 Year, 10.50%, 10/20/17 - 1/20/21 | 69,977 | 70,626 | ||
| GNMA II SF 30 Year, 11.00%, 7/20/18 - 1/20/21 | 15,456 | 15,554 | ||
| Total Mortgage-Backed Securities (Cost $5,799,846,370) | 5,901,938,860 | |||
| Shares | ||||
| Short Term Investments (Cost $69,369,882) 1.2% | ||||
| Money Market Funds 1.2% | ||||
| a,b Institutional Fiduciary Trust Money Market Portfolio, 0.32% | 69,369,882 | 69,369,882 | ||
| Total Investments (Cost $5,869,216,252) 99.9%. | 5,971,308,742 | |||
| Other Assets, less Liabilities 0.1% | 5,428,558 | |||
| Net Assets 100.0% | $ | 5,976,737,300 | ||
See Abbreviations on page 117.
aSee Note 3(f) regarding investments in affiliated management investment companies.
bThe rate shown is the annualized seven-day yield at period end.
80 Semiannual Report | The accompanying notes are an integral part of these financial statements. franklintempleton.com
FRANKLIN CUSTODIAN FUNDS
| Financial Highlights | ||||||||||||||||||
| Franklin Utilities Fund | ||||||||||||||||||
| Six Months Ended | ||||||||||||||||||
| March 31, 2017 | Year Ended September 30, | |||||||||||||||||
| (unaudited) | 2016 | 2015 | 2014 | 2013 | 2012 | |||||||||||||
| Class A | ||||||||||||||||||
| Per share operating performance | ||||||||||||||||||
| (for a share outstanding throughout the period) | ||||||||||||||||||
| Net asset value, beginning of period | $ | 17.85 | $ | 16.08 | $ | 16.58 | $ | 14.62 | $ | 14.04 | $ | 12.42 | ||||||
| Income from investment operationsa: | ||||||||||||||||||
| Net investment incomeb | 0.24 | 0.48 | 0.49 | 0.49 | 0.49 | 0.48 | ||||||||||||
| Net realized and unrealized gains (losses) | 0.80 | 2.31 | (0.09 | ) | 2.00 | 0.60 | 1.60 | |||||||||||
| Total from investment operations | 1.04 | 2.79 | 0.40 | 2.49 | 1.09 | 2.08 | ||||||||||||
| Less distributions from: | ||||||||||||||||||
| Net investment income. | (0.25 | ) | (0.50 | ) | (0.48 | ) | (0.49 | ) | (0.51 | ) | (0.46 | ) | ||||||
| Net realized gains | (0.01 | ) | (0.52 | ) | (0.42 | ) | (0.04 | ) | — | — | ||||||||
| Total distributions | (0.26 | ) | (1.02 | ) | (0.90 | ) | (0.53 | ) | (0.51 | ) | (0.46 | ) | ||||||
| Net asset value, end of period | $ | 18.63 | $ | 17.85 | $ | 16.08 | $ | 16.58 | $ | 14.62 | $ | 14.04 | ||||||
| Total returnc | 5.91 | % | 18.23 | % | 2.19 | % | 17.24 | % | 7.92 | % | 16.99 | % | ||||||
| Ratios to average net assetsd | ||||||||||||||||||
| Expenses. | 0.73 | %e,f | 0.73 | %e,f | 0.73 | %e | 0.75 | %e,f | 0.75 | %f | 0.76 | % | ||||||
| Net investment income | 2.73 | % | 2.81 | % | 2.88 | % | 3.05 | % | 3.34 | % | 3.61 | % | ||||||
| Supplemental data | ||||||||||||||||||
| Net assets, end of period (000’s) | $ | 4,125,112 | $ | 4,180,124 | $ | 3,524,835 | $ | 3,717,397 | $ | 3,275,129 | $ | 3,076,131 | ||||||
| Portfolio turnover rate | 0.34 | % | 7.17 | % | 9.55 | % | 8.10 | % | 4.57 | % | 1.27 | % | ||||||
aThe amount shown for a share outstanding throughout the period may not correlate with the Statement of Operations for the period due to the timing of sales and
repurchases of the Fund’s shares in relation to income earned and/or fluctuating fair value of the investments of the Fund.
bBased on average daily shares outstanding.
cTotal return does not reflect sales commissions or contingent deferred sales charges, if applicable, and is not annualized for periods less than one year.
dRatios are annualized for periods less than one year.
eBenefit of waiver and payments by affiliates rounds to less than 0.01%.
fBenefit of expense reduction rounds to less than 0.01%.
franklintempleton.com The accompanying notes are an integral part of these financial statements. | Semiannual Report 81
| FRANKLIN CUSTODIAN FUNDS | ||||||||||||||||||
| FINANCIAL HIGHLIGHTS | ||||||||||||||||||
| Franklin Utilities Fund (continued) | ||||||||||||||||||
| Six Months Ended | ||||||||||||||||||
| March 31, 2017 | Year Ended September 30, | |||||||||||||||||
| (unaudited) | 2016 | 2015 | 2014 | 2013 | 2012 | |||||||||||||
| Class C | ||||||||||||||||||
| Per share operating performance | ||||||||||||||||||
| (for a share outstanding throughout the period) | ||||||||||||||||||
| Net asset value, beginning of period | $ | 17.76 | $ | 16.01 | $ | 16.50 | $ | 14.56 | $ | 13.98 | $ | 12.37 | ||||||
| Income from investment operationsa: | ||||||||||||||||||
| Net investment incomeb | 0.20 | 0.39 | 0.40 | 0.41 | 0.41 | 0.42 | ||||||||||||
| Net realized and unrealized gains (losses) | 0.79 | 2.30 | (0.08 | ) | 1.98 | 0.61 | 1.58 | |||||||||||
| Total from investment operations | 0.99 | 2.69 | 0.32 | 2.39 | 1.02 | 2.00 | ||||||||||||
| Less distributions from: | ||||||||||||||||||
| Net investment income. | (0.20 | ) | (0.42 | ) | (0.39 | ) | (0.41 | ) | (0.44 | ) | (0.39 | ) | ||||||
| Net realized gains | (0.01 | ) | (0.52 | ) | (0.42 | ) | (0.04 | ) | — | — | ||||||||
| Total distributions | (0.21 | ) | (0.94 | ) | (0.81 | ) | (0.45 | ) | (0.44 | ) | (0.39 | ) | ||||||
| Net asset value, end of period | $ | 18.54 | $ | 17.76 | $ | 16.01 | $ | 16.50 | $ | 14.56 | $ | 13.98 | ||||||
| Total returnc | 5.67 | % | 17.59 | % | 1.74 | % | 16.61 | % | 7.40 | % | 16.32 | % | ||||||
| Ratios to average net assetsd | ||||||||||||||||||
| Expenses. | 1.23 | %e,f | 1.23 | %e,f | 1.23 | %e | 1.25 | %e,f | 1.25 | %f | 1.26 | % | ||||||
| Net investment income | 2.23 | % | 2.31 | % | 2.38 | % | 2.55 | % | 2.84 | % | 3.11 | % | ||||||
| Supplemental data | ||||||||||||||||||
| Net assets, end of period (000’s) | $ | 1,039,401 | $ | 1,064,065 | $ | 931,800 | $ | 986,318 | $ | 845,173 | $ | 774,711 | ||||||
| Portfolio turnover rate | 0.34 | % | 7.17 | % | 9.55 | % | 8.10 | % | 4.57 | % | 1.27 | % | ||||||
aThe amount shown for a share outstanding throughout the period may not correlate with the Statement of Operations for the period due to the timing of sales and
repurchases of the Fund’s shares in relation to income earned and/or fluctuating fair value of the investments of the Fund.
bBased on average daily shares outstanding.
cTotal return does not reflect sales commissions or contingent deferred sales charges, if applicable, and is not annualized for periods less than one year.
dRatios are annualized for periods less than one year.
eBenefit of waiver and payments by affiliates rounds to less than 0.01%.
fBenefit of expense reduction rounds to less than 0.01%.
82 Semiannual Report | The accompanying notes are an integral part of these financial statements. franklintempleton.com
| FRANKLIN CUSTODIAN FUNDS | ||||||||||||||||||
| FINANCIAL HIGHLIGHTS | ||||||||||||||||||
| Franklin Utilities Fund (continued) | ||||||||||||||||||
| Six Months Ended | ||||||||||||||||||
| March 31, 2017 | Year Ended September 30, | |||||||||||||||||
| (unaudited) | 2016 | 2015 | 2014 | 2013 | 2012 | |||||||||||||
| Class R | ||||||||||||||||||
| Per share operating performance | ||||||||||||||||||
| (for a share outstanding throughout the period) | ||||||||||||||||||
| Net asset value, beginning of period | $ | 17.78 | $ | 16.02 | $ | 16.52 | $ | 14.58 | $ | 14.00 | $ | 12.39 | ||||||
| Income from investment operationsa: | ||||||||||||||||||
| Net investment incomeb | 0.21 | 0.42 | 0.42 | 0.43 | 0.44 | 0.44 | ||||||||||||
| Net realized and unrealized gains (losses) | 0.81 | 2.30 | (0.09 | ) | 1.99 | 0.60 | 1.58 | |||||||||||
| Total from investment operations | 1.02 | 2.72 | 0.33 | 2.42 | 1.04 | 2.02 | ||||||||||||
| Less distributions from: | ||||||||||||||||||
| Net investment income. | (0.22 | ) | (0.44 | ) | (0.41 | ) | (0.44 | ) | (0.46 | ) | (0.41 | ) | ||||||
| Net realized gains | (0.01 | ) | (0.52 | ) | (0.42 | ) | (0.04 | ) | — | — | ||||||||
| Total distributions | (0.23 | ) | (0.96 | ) | (0.83 | ) | (0.48 | ) | (0.46 | ) | (0.41 | ) | ||||||
| Net asset value, end of period | $ | 18.57 | $ | 17.78 | $ | 16.02 | $ | 16.52 | $ | 14.58 | $ | 14.00 | ||||||
| Total returnc | 5.80 | % | 17.81 | % | 1.83 | % | 16.75 | % | 7.56 | % | 16.55 | % | ||||||
| Ratios to average net assetsd | ||||||||||||||||||
| Expenses. | 1.08 | %e,f | 1.08 | %e,f | 1.08 | %e | 1.10 | %e,f | 1.10 | %f | 1.11 | % | ||||||
| Net investment income | 2.38 | % | 2.46 | % | 2.53 | % | 2.70 | % | 2.99 | % | 3.26 | % | ||||||
| Supplemental data | ||||||||||||||||||
| Net assets, end of period (000’s) | $ | 99,345 | $ | 103,247 | $ | 83,271 | $ | 95,498 | $ | 86,216 | $ | 80,478 | ||||||
| Portfolio turnover rate | 0.34 | % | 7.17 | % | 9.55 | % | 8.10 | % | 4.57 | % | 1.27 | % | ||||||
aThe amount shown for a share outstanding throughout the period may not correlate with the Statement of Operations for the period due to the timing of sales and
repurchases of the Fund’s shares in relation to income earned and/or fluctuating fair value of the investments of the Fund.
bBased on average daily shares outstanding.
cTotal return is not annualized for periods less than one year.
dRatios are annualized for periods less than one year.
eBenefit of waiver and payments by affiliates rounds to less than 0.01%.
fBenefit of expense reduction rounds to less than 0.01%.
franklintempleton.com The accompanying notes are an integral part of these financial statements. | Semiannual Report 83
| FRANKLIN CUSTODIAN FUNDS | |||||||||||||||
| FINANCIAL HIGHLIGHTS | |||||||||||||||
| Franklin Utilities Fund (continued) | |||||||||||||||
| Six Months Ended | |||||||||||||||
| March 31, 2017 | Year Ended September 30, | ||||||||||||||
| (unaudited) | 2016 | 2015 | 2014 | 2013 | a | ||||||||||
| Class R6 | |||||||||||||||
| Per share operating performance | |||||||||||||||
| (for a share outstanding throughout the period) | |||||||||||||||
| Net asset value, beginning of period | $ | 17.97 | $ | 16.18 | $ | 16.68 | $ | 14.71 | $ | 15.88 | |||||
| Income from investment operationsb: | |||||||||||||||
| Net investment incomec | 0.27 | 0.53 | 0.53 | 0.53 | 0.25 | ||||||||||
| Net realized and unrealized gains (losses) | 0.80 | 2.32 | (0.09 | ) | 2.01 | (1.17 | ) | ||||||||
| Total from investment operations. | 1.07 | 2.85 | 0.44 | 2.54 | (0.92 | ) | |||||||||
| Less distributions from: | |||||||||||||||
| Net investment income | (0.27 | ) | (0.54 | ) | (0.52 | ) | (0.53 | ) | (0.25 | ) | |||||
| Net realized gains | (0.01 | ) | (0.52 | ) | (0.42 | ) | (0.04 | ) | — | ||||||
| Total distributions | (0.28 | ) | (1.06 | ) | (0.94 | ) | (0.57 | ) | (0.25 | ) | |||||
| Net asset value, end of period. | $ | 18.76 | $ | 17.97 | $ | 16.18 | $ | 16.68 | $ | 14.71 | |||||
| Total returnd | 6.11 | % | 18.55 | % | 2.45 | % | 17.51 | % | (5.79 | )% | |||||
| Ratios to average net assetse | |||||||||||||||
| Expenses | 0.47 | %f,g | 0.47 | %f,g | 0.47 | %f | 0.48 | %f,g | 0.48 | %g | |||||
| Net investment income. | 2.99 | % | 3.07 | % | 3.14 | % | 3.32 | % | 3.61 | % | |||||
| Supplemental data | |||||||||||||||
| Net assets, end of period (000’s) | $ | 239,273 | $ | 219,587 | $ | 201,225 | $ | 236,437 | $ | 218,746 | |||||
| Portfolio turnover rate | 0.34 | % | 7.17 | % | 9.55 | % | 8.10 | % | 4.57 | % | |||||
aFor the period May 1, 2013 (effective date) to September 30, 2013.
bThe amount shown for a share outstanding throughout the period may not correlate with the Statement of Operations for the period due to the timing of sales and
repurchases of the Fund’s shares in relation to income earned and/or fluctuating fair value of the investments of the Fund.
cBased on average daily shares outstanding.
dTotal return is not annualized for periods less than one year.
eRatios are annualized for periods less than one year.
fBenefit of waiver and payments by affiliates rounds to less than 0.01%.
gBenefit of expense reduction rounds to less than 0.01%.
84 Semiannual Report | The accompanying notes are an integral part of these financial statements. franklintempleton.com
| FRANKLIN CUSTODIAN FUNDS | ||||||||||||||||||
| FINANCIAL HIGHLIGHTS | ||||||||||||||||||
| Franklin Utilities Fund (continued) | ||||||||||||||||||
| Six Months Ended | ||||||||||||||||||
| March 31, 2017 | Year Ended September 30, | |||||||||||||||||
| (unaudited) | 2016 | 2015 | 2014 | 2013 | 2012 | |||||||||||||
| Advisor Class | ||||||||||||||||||
| Per share operating performance | ||||||||||||||||||
| (for a share outstanding throughout the period) | ||||||||||||||||||
| Net asset value, beginning of period | $ | 17.97 | $ | 16.19 | $ | 16.68 | $ | 14.71 | $ | 14.12 | $ | 12.49 | ||||||
| Income from investment operationsa: | ||||||||||||||||||
| Net investment incomeb | 0.26 | 0.51 | 0.52 | 0.52 | 0.50 | 0.51 | ||||||||||||
| Net realized and unrealized gains (losses) | 0.81 | 2.32 | (0.09 | ) | 2.00 | 0.62 | 1.60 | |||||||||||
| Total from investment operations | 1.07 | 2.83 | 0.43 | 2.52 | 1.12 | 2.11 | ||||||||||||
| Less distributions from: | ||||||||||||||||||
| Net investment income. | (0.26 | ) | (0.53 | ) | (0.50 | ) | (0.51 | ) | (0.53 | ) | (0.48 | ) | ||||||
| Net realized gains | (0.01 | ) | (0.52 | ) | (0.42 | ) | (0.04 | ) | — | — | ||||||||
| Total distributions | (0.27 | ) | (1.05 | ) | (0.92 | ) | (0.55 | ) | (0.53 | ) | (0.48 | ) | ||||||
| Net asset value, end of period | $ | 18.77 | $ | 17.97 | $ | 16.19 | $ | 16.68 | $ | 14.71 | $ | 14.12 | ||||||
| Total returnc | 6.06 | % | 18.34 | % | 2.40 | % | 17.37 | % | 8.11 | % | 17.15 | % | ||||||
| Ratios to average net assetsd | ||||||||||||||||||
| Expenses. | 0.58 | %e,f | 0.58 | %e,f | 0.58 | %e | 0.60 | %e,f | 0.60 | %f | 0.61 | % | ||||||
| Net investment income | 2.88 | % | 2.96 | % | 3.03 | % | 3.20 | % | 3.49 | % | 3.76 | % | ||||||
| Supplemental data | ||||||||||||||||||
| Net assets, end of period (000’s) | $ | 849,170 | $ | 755,484 | $ | 549,371 | $ | 562,202 | $ | 343,082 | $ | 574,803 | ||||||
| Portfolio turnover rate | 0.34 | % | 7.17 | % | 9.55 | % | 8.10 | % | 4.57 | % | 1.27 | % | ||||||
aThe amount shown for a share outstanding throughout the period may not correlate with the Statement of Operations for the period due to the timing of sales and
repurchases of the Fund’s shares in relation to income earned and/or fluctuating fair value of the investments of the Fund.
bBased on average daily shares outstanding.
cTotal return is not annualized for periods less than one year.
dRatios are annualized for periods less than one year.
eBenefit of waiver and payments by affiliates rounds to less than 0.01%.
fBenefit of expense reduction rounds to less than 0.01%.
franklintempleton.com The accompanying notes are an integral part of these financial statements. | Semiannual Report 85
| FRANKLIN CUSTODIAN FUNDS | ||||
| Statement of Investments, March 31, 2017 (unaudited) | ||||
| Franklin Utilities Fund | ||||
| Country | Shares | Value | ||
| Common Stocks 98.2% | ||||
| Electric Utilities 59.0% | ||||
| ALLETE Inc | United States | 600,000 | $ | 40,626,000 |
| Alliant Energy Corp | United States | 3,800,000 | 150,518,000 | |
| American Electric Power Co. Inc | United States | 3,900,000 | 261,807,000 | |
| Duke Energy Corp | United States | 3,400,000 | 278,834,000 | |
| Edison International | United States | 4,100,000 | 326,401,000 | |
| Emera Inc | Canada | 2,000,000 | 70,651,929 | |
| Entergy Corp | United States | 1,275,000 | 96,849,000 | |
| Eversource Energy | United States | 2,000,000 | 117,560,000 | |
| Exelon Corp | United States | 6,700,000 | 241,066,000 | |
| FirstEnergy Corp | United States | 5,200,000 | 165,464,000 | |
| Great Plains Energy Inc | United States | 5,100,000 | 149,022,000 | |
| a Hydro One Ltd., 144A | Canada | 2,000,000 | 36,468,907 | |
| IDACORP Inc | United States | 100,000 | 8,296,000 | |
| NextEra Energy Inc | United States | 2,900,000 | 372,273,000 | |
| OGE Energy Corp | United States | 1,875,000 | 65,587,500 | |
| PG&E Corp | United States | 4,700,000 | 311,892,000 | |
| Pinnacle West Capital Corp | United States | 1,900,000 | 158,422,000 | |
| PNM Resources Inc | United States | 3,000,000 | 111,000,000 | |
| Portland General Electric Co | United States | 1,800,000 | 79,956,000 | |
| PPL Corp | United States | 4,400,000 | 164,516,000 | |
| The Southern Co | United States | 4,500,000 | 224,010,000 | |
| Westar Energy Inc | United States | 2,000,000 | 108,540,000 | |
| Xcel Energy Inc | United States | 4,600,000 | 204,470,000 | |
| 3,744,230,336 | ||||
| Gas Utilities 1.5% | ||||
| ONE Gas Inc | United States | 438,181 | 29,621,036 | |
| Spire Inc | United States | 1,000,000 | 67,500,000 | |
| 97,121,036 | ||||
| Multi-Utilities 29.9% | ||||
| Ameren Corp | United States | 900,000 | 49,131,000 | |
| Black Hills Corp | United States | 500,000 | 33,235,000 | |
| CenterPoint Energy Inc | United States | 5,500,000 | 151,635,000 | |
| CMS Energy Corp | United States | 4,865,000 | 217,660,100 | |
| Consolidated Edison Inc | United States | 1,250,000 | 97,075,000 | |
| Dominion Resources Inc | United States | 4,200,000 | 325,794,000 | |
| DTE Energy Co | United States | 1,800,000 | 183,798,000 | |
| National Grid PLC | United Kingdom | 11,000,000 | 139,701,855 | |
| NiSource Inc | United States | 2,000,000 | 47,580,000 | |
| NorthWestern Corp | United States | 596,800 | 35,032,160 | |
| Public Service Enterprise Group Inc | United States | 2,900,000 | 128,615,000 | |
| Sempra Energy | United States | 2,800,000 | 309,400,000 | |
| Vectren Corp | United States | 925,100 | 54,220,111 | |
| WEC Energy Group Inc | United States | 2,100,000 | 127,323,000 | |
| 1,900,200,226 | ||||
| Oil, Gas & Consumable Fuels 4.3% | ||||
| Enbridge Inc. (CAD Traded) | Canada | 847,200 | 35,489,519 | |
| Enbridge Inc. (USD Traded) | Canada | 984,000 | 41,170,560 | |
| Kinder Morgan Inc | United States | 3,700,000 | 80,438,000 | |
| Plains GP Holdings LP, A | United States | 551,042 | 17,225,573 | |
| TransCanada Corp | Canada | 1,000,000 | 46,146,327 | |
86 Semiannual Report
franklintempleton.com
FRANKLIN CUSTODIAN FUNDS
STATEMENT OF INVESTMENTS (UNAUDITED)
| Franklin Utilities Fund (continued) | ||||||
| Country | Shares | Value | ||||
| Common Stocks (continued) | ||||||
| Oil, Gas & Consumable Fuels (continued) | ||||||
| The Williams Cos. Inc | United States | 1,800,000 | $ | 53,262,000 | ||
| 273,731,979 | ||||||
| Water Utilities 3.5% | ||||||
| American Water Works Co. Inc | United States | 1,800,000 | 139,986,000 | |||
| United Utilities Group PLC | United Kingdom | 6,700,000 | 83,411,976 | |||
| 223,397,976 | ||||||
| Total Common Stocks (Cost $3,545,211,990) | 6,238,681,553 | |||||
| Principal | ||||||
| Amount | ||||||
| Corporate Bonds 0.8% | ||||||
| Electric Utilities 0.1% | ||||||
| Northeast Generation Co., senior secured note, B-1, 8.812%, 10/15/26 | United States | $ | 5,964,844 | 6,364,285 | ||
| Multi-Utilities 0.7% | ||||||
| Aquila Inc., senior note, 8.27%, 11/15/21 | United States | 6,100,000 | 7,188,600 | |||
| MidAmerican Energy Holdings Co., senior note, 8.48%, 9/15/28 | United States | 25,000,000 | 36,427,675 | |||
| 43,616,275 | ||||||
| Total Corporate Bonds (Cost $37,169,620) | 49,980,560 | |||||
| Total Investments before Short Term Investments | ||||||
| (Cost $3,582,381,610) | 6,288,662,113 | |||||
| Shares | ||||||
| Short Term Investments (Cost $70,339,372) 1.1% | ||||||
| Money Market Funds 1.1% | ||||||
| b,c Institutional Fiduciary Trust Money Market Portfolio, 0.32% | United States | 70,339,372 | 70,339,372 | |||
| Total Investments (Cost $3,652,720,982) 100.1% | 6,359,001,485 | |||||
| Other Assets, less Liabilities (0.1)% | (6,700,672 | ) | ||||
| Net Assets 100.0% | $ | 6,352,300,813 | ||||
See Abbreviations on page 117.
aSecurity was purchased pursuant to Rule 144A under the Securities Act of 1933 and may be sold in transactions exempt from registration only to qualified institutional buyers
or in a public offering registered under the Securities Act of 1933. This security has been deemed liquid under guidelines approved by the Trust’s Board of Trustees. At
March 31, 2017, the value of this security was $36,468,907, representing 0.6% of net assets.
bSee Note 3(f) regarding investments in affiliated management investment companies.
cThe rate shown is the annualized seven-day yield at period end.
franklintempleton.com The accompanying notes are an integral part of these financial statements. | Semiannual Report 87
| FRANKLIN CUSTODIAN FUNDS | ||||||||
| Financial Statements | ||||||||
| Statements of Assets and Liabilities | ||||||||
| March 31, 2017 (unaudited) | ||||||||
| Franklin | Franklin | Franklin | ||||||
| DynaTech Fund | Growth Fund | Income Fund | ||||||
| Assets: | ||||||||
| Investments in securities: | ||||||||
| Cost - Unaffiliated issuers | $ | 1,761,308,613 | $ | 5,210,993,263 | $ | 73,122,503,189 | ||
| Cost - Non-controlled affiliates (Note 3f and 11) | 90,022,341 | 429,623,522 | 4,744,511,014 | |||||
| Cost - Repurchase agreements | — | — | 15,765,070 | |||||
| Total cost of investments | $ | 1,851,330,954 | $ | 5,640,616,785 | $ | 77,882,779,273 | ||
| Value - Unaffiliated issuers | $ | 3,210,661,765 | $ | 12,395,934,488 | $ | 78,797,658,620 | ||
| Value - Non-controlled affiliates (Note 3f and 11) | 90,022,341 | 429,623,522 | 4,041,458,138 | |||||
| Value - Repurchase agreements. | — | — | 15,765,070 | |||||
| Total value of investments* | 3,300,684,106 | 12,825,558,010 | 82,854,881,828 | |||||
| Cash. | — | 815,061 | 39,404,971 | |||||
| Receivables: | ||||||||
| Investment securities sold | — | — | 257,474,059 | |||||
| Capital shares sold | 11,203,926 | 93,252,049 | 116,347,767 | |||||
| Dividends and interest | 800,704 | 8,185,703 | 807,455,956 | |||||
| Unrealized appreciation on unfunded loan commitments (Note 9) | — | — | 134,834 | |||||
| Other assets | 2,756 | 11,240 | 74,695 | |||||
| Total assets | 3,312,691,492 | 12,927,822,063 | 84,075,774,110 | |||||
| Liabilities: | ||||||||
| Payables: | ||||||||
| Investment securities purchased | 12,850,502 | — | 840,189,874 | |||||
| Capital shares redeemed | 8,513,786 | 35,629,377 | 133,997,287 | |||||
| Management fees | 1,226,194 | 4,640,051 | 25,056,816 | |||||
| Distribution fees | 1,368,345 | 4,905,769 | 36,820,390 | |||||
| Transfer agent fees | 726,816 | 2,969,268 | 10,755,083 | |||||
| Trustees’ fees and expenses | 725 | 3,322 | 19,434 | |||||
| Options written, at value (premiums received $—, $— and $21,612,989, | ||||||||
| respectively) | — | — | 14,229,630 | |||||
| Payable upon return of securities loaned | — | — | 77,391,070 | |||||
| Accrued expenses and other liabilities. | 134,873 | 590,698 | 3,970,843 | |||||
| Total liabilities | 24,821,241 | 48,738,485 | 1,142,430,427 | |||||
| Net assets, at value | $ | 3,287,870,251 | $ | 12,879,083,578 | $ | 82,933,343,683 | ||
| Net assets consist of: | ||||||||
| Paid-in capital | $ | 1,801,495,402 | $ | 5,521,169,880 | $ | 83,914,922,408 | ||
| Undistributed net investment income. | — | 4,865,454 | — | |||||
| Distributions in excess of net investment income | — | — | (474,815,345 | ) | ||||
| Accumulated net investment loss | (12,454,456 | ) | — | — | ||||
| Net unrealized appreciation (depreciation) | 1,449,356,458 | 7,184,941,196 | 4,978,398,440 | |||||
| Accumulated net realized gain (loss) | 49,472,847 | 168,107,048 | (5,485,161,820 | ) | ||||
| Net assets, at value | $ | 3,287,870,251 | $ | 12,879,083,578 | $ | 82,933,343,683 | ||
| *Includes securities loaned | $ | — | $ | — | $ | 75,060,009 | ||
88 Semiannual Report | The accompanying notes are an integral part of these financial statements. franklintempleton.com
| FRANKLIN CUSTODIAN FUNDS | ||||||||
| FINANCIAL STATEMENTS | ||||||||
| Statements of Assets and Liabilities (continued) | ||||||||
| March 31, 2017 (unaudited) | ||||||||
| Franklin | Franklin | Franklin | ||||||
| DynaTech Fund | Growth Fund | Income Fund | ||||||
| Class A: | ||||||||
| Net assets, at value | $ | 2,111,415,543 | $ | 7,612,272,648 | $ | 46,224,872,210 | ||
| Shares outstanding. | 38,983,647 | 91,817,772 | 19,625,582,704 | |||||
| Net asset value per sharea | $ | 54.16 | $ | 82.91 | $ | 2.36 | ||
| Maximum offering price per share (net asset value per share ÷ 94.25%, | ||||||||
| 94.25% and 95.75%, respectively) | $ | 57.46 | $ | 87.97 | $ | 2.46 | ||
| Class C: | ||||||||
| Net assets, at value | $ | 318,812,255 | $ | 891,447,847 | $ | 24,112,232,344 | ||
| Shares outstanding. | 6,917,881 | 11,647,476 | 10,111,984,610 | |||||
| Net asset value and maximum offering price per sharea | $ | 46.09 | $ | 76.54 | $ | 2.38 | ||
| Class R: | ||||||||
| Net assets, at value | $ | 36,675,162 | $ | 493,635,843 | $ | 393,016,406 | ||
| Shares outstanding. | 693,795 | 5,978,139 | 169,835,930 | |||||
| Net asset value and maximum offering price per share | $ | 52.86 | $ | 82.57 | $ | 2.31 | ||
| Class R6: | ||||||||
| Net assets, at value | $ | 430,240,658 | $ | 1,530,534,058 | $ | 1,804,330,798 | ||
| Shares outstanding. | 7,695,663 | 18,441,707 | 772,000,906 | |||||
| Net asset value and maximum offering price per share | $ | 55.91 | $ | 82.99 | $ | 2.34 | ||
| Advisor Class: | ||||||||
| Net assets, at value | $ | 390,726,633 | $ | 2,351,193,182 | $ | 10,398,891,925 | ||
| Shares outstanding. | 7,036,544 | 28,306,007 | 4,450,810,184 | |||||
| Net asset value and maximum offering price per share | $ | 55.53 | $ | 83.06 | $ | 2.34 | ||
aRedemption price is equal to net asset value less contingent deferred sales charges, if applicable.
franklintempleton.com The accompanying notes are an integral part of these financial statements. | Semiannual Report 89
| FRANKLIN CUSTODIAN FUNDS | |||||
| FINANCIAL STATEMENTS | |||||
| Statements of Assets and Liabilities (continued) | |||||
| March 31, 2017 (unaudited) | |||||
| Franklin | |||||
| U.S. Government | Franklin | ||||
| Securities Fund | Utilities Fund | ||||
| Assets: | |||||
| Investments in securities: | |||||
| Cost - Unaffiliated issuers | $ | 5,799,846,370 | $ | 3,582,381,610 | |
| Cost - Non-controlled affiliates (Note 3f) | 69,369,882 | 70,339,372 | |||
| Total cost of investments | $ | 5,869,216,252 | $ | 3,652,720,982 | |
| Value - Unaffiliated issuers | $ | 5,901,938,860 | $ | 6,288,662,113 | |
| Value - Non-controlled affiliates (Note 3f) | 69,369,882 | 70,339,372 | |||
| Total value of investments. | 5,971,308,742 | 6,359,001,485 | |||
| Receivables: | |||||
| Investment securities sold | 1,535 | — | |||
| Capital shares sold | 6,336,470 | 7,266,764 | |||
| Dividends and interest | 18,572,104 | 14,688,136 | |||
| Other assets | 5,694 | 5,601 | |||
| Total assets. | 5,996,224,545 | 6,380,961,986 | |||
| Liabilities: | |||||
| Payables: | |||||
| Investment securities purchased | — | 13,210,968 | |||
| Capital shares redeemed | 11,874,087 | 9,782,592 | |||
| Management fees | 2,239,847 | 2,391,453 | |||
| Distribution fees. | 1,920,058 | 2,142,982 | |||
| Transfer agent fees | 1,055,975 | 896,046 | |||
| Trustees’ fees and expenses | 1,335 | 503 | |||
| Distributions to shareholders | 1,863,193 | — | |||
| Accrued expenses and other liabilities | 532,750 | 236,629 | |||
| Total liabilities | 19,487,245 | 28,661,173 | |||
| Net assets, at value | $ | 5,976,737,300 | $ | 6,352,300,813 | |
| Net assets consist of: | |||||
| Paid-in capital | $ | 6,378,338,608 | $ | 3,571,217,789 | |
| Undistributed net investment income | — | 3,592,957 | |||
| Distributions in excess of net investment income | (31,850,667 | ) | — | ||
| Net unrealized appreciation (depreciation) | 102,092,490 | 2,706,283,100 | |||
| Accumulated net realized gain (loss) | (471,843,131 | ) | 71,206,967 | ||
| Net assets, at value | $ | 5,976,737,300 | $ | 6,352,300,813 | |
90 Semiannual Report | The accompanying notes are an integral part of these financial statements. franklintempleton.com
| FRANKLIN CUSTODIAN FUNDS | |||||
| FINANCIAL STATEMENTS | |||||
| Statements of Assets and Liabilities (continued) | |||||
| March 31, 2017 (unaudited) | |||||
| Franklin | |||||
| U.S. Government | Franklin | ||||
| Securities Fund | Utilities Fund | ||||
| Class A: | |||||
| Net assets, at value | $ | 3,799,506,985 | $ | 4,125,111,760 | |
| Shares outstanding | 616,353,478 | 221,363,731 | |||
| Net asset value per sharea | $ | 6.16 | $ | 18.63 | |
| Maximum offering price per share (net asset value per share ÷ 95.75%) | $ | 6.43 | $ | 19.46 | |
| Class C: | |||||
| Net assets, at value | $ | 894,989,816 | $ | 1,039,401,411 | |
| Shares outstanding | 146,191,716 | 56,049,392 | |||
| Net asset value and maximum offering price per sharea | $ | 6.12 | $ | 18.54 | |
| Class R: | |||||
| Net assets, at value | $ | 44,015,587 | $ | 99,345,093 | |
| Shares outstanding | 7,144,252 | 5,350,409 | |||
| Net asset value and maximum offering price per share. | $ | 6.16 | $ | 18.57 | |
| Class R6: | |||||
| Net assets, at value | $ | 449,710,346 | $ | 239,272,867 | |
| Shares outstanding | 72,729,846 | 12,751,021 | |||
| Net asset value and maximum offering price per share. | $ | 6.18 | $ | 18.76 | |
| Advisor Class: | |||||
| Net assets, at value | $ | 788,514,566 | $ | 849,169,682 | |
| Shares outstanding | 127,487,422 | 45,243,448 | |||
| Net asset value and maximum offering price per share. | $ | 6.19 | $ | 18.77 | |
aRedemption price is equal to net asset value less contingent deferred sales charges, if applicable.
franklintempleton.com The accompanying notes are an integral part of these financial statements. | Semiannual Report 91
| FRANKLIN CUSTODIAN FUNDS | |||||||||
| FINANCIAL STATEMENTS | |||||||||
| Statements of Operations | |||||||||
| for the six months ended March 31, 2017 (unaudited) | |||||||||
| Franklin | Franklin | Franklin | |||||||
| DynaTech Fund | Growth Fund | Income Fund | |||||||
| Investment income: | |||||||||
| Dividends: | |||||||||
| Unaffiliated issuers | $ | 8,567,469 | $ | 83,646,943 | $ | 804,274,118 | |||
| Non-controlled affiliates (Note 3f) | 24,484 | 216,262 | 910,394 | ||||||
| Interest: | |||||||||
| Unaffiliated issuers | — | — | 1,117,008,375 | ||||||
| Non-controlled affiliates (Note 11) | — | — | 24,187,022 | ||||||
| Income from securities loaned (net of fees and rebates) | — | — | 1,106,291 | ||||||
| Total investment income | 8,591,953 | 83,863,205 | 1,947,486,200 | ||||||
| Expenses: | |||||||||
| Management fees (Note 3a) | 6,937,031 | 27,414,467 | 150,640,611 | ||||||
| Distribution fees: (Note 3c) | |||||||||
| Class A | 2,527,165 | 9,332,229 | 34,253,100 | ||||||
| Class C | 1,516,236 | 4,257,195 | 77,349,790 | ||||||
| Class R | 92,185 | 1,189,001 | 976,170 | ||||||
| Transfer agent fees: (Note 3e) | |||||||||
| Class A | 1,694,757 | 5,913,758 | 17,662,737 | ||||||
| Class C | 255,076 | 674,392 | 9,203,012 | ||||||
| Class R | 31,041 | 377,999 | 151,785 | ||||||
| Class R6 | 563 | 2,254 | 2,614 | ||||||
| Advisor Class | 228,197 | 1,673,663 | 3,460,168 | ||||||
| Custodian fees (Note 4) | 21,791 | 53,112 | 546,776 | ||||||
| Reports to shareholders | 168,357 | 483,371 | 2,460,721 | ||||||
| Registration and filing fees | 85,147 | 184,019 | 567,761 | ||||||
| Professional fees | 28,902 | 76,722 | 3,037,555 | ||||||
| Trustees’ fees and expenses | 6,551 | 27,187 | 176,834 | ||||||
| Other | 26,648 | 101,447 | 1,011,108 | ||||||
| Total expenses | 13,619,647 | 51,760,816 | 301,500,742 | ||||||
| Expense reductions (Note 4) | (10 | ) | (54 | ) | (34,075 | ) | |||
| Expenses waived/paid by affiliates (Note 3f) | (60,070 | ) | (917,781 | ) | (2,829,702 | ) | |||
| Net expenses | 13,559,567 | 50,842,981 | 298,636,965 | ||||||
| Net investment income (loss) | (4,967,614 | ) | 33,020,224 | 1,648,849,235 | |||||
| Realized and unrealized gains (losses): | |||||||||
| Net realized gain (loss) from: | |||||||||
| Investments: | |||||||||
| Unaffiliated issuers | 89,160,527 | 145,121,466 | 1,233,271,235 | ||||||
| Non-controlled affiliates (Note 11) | — | — | 22,269,422 | ||||||
| Written options | — | — | 33,142,894 | ||||||
| Foreign currency transactions | 2,325 | (12,837 | ) | 99,422 | |||||
| Net realized gain (loss) | 89,162,852 | 145,108,629 | 1,288,782,973 | ||||||
| Net change in unrealized appreciation (depreciation) on: | |||||||||
| Investments | 147,053,159 | 953,423,287 | 2,933,458,260 | ||||||
| Translation of other assets and liabilities | |||||||||
| denominated in foreign currencies | 3,153 | 781 | (1,029,203 | ) | |||||
| Written options | — | — | (1,186,333 | ) | |||||
| Net change in unrealized appreciation (depreciation) | 147,056,312 | 953,424,068 | 2,931,242,724 | ||||||
| Net realized and unrealized gain (loss) | 236,219,164 | 1,098,532,697 | 4,220,025,697 | ||||||
| Net increase (decrease) in net assets resulting from operations | $ | 231,251,550 | $ | 1,131,552,921 | $ | 5,868,874,932 | |||
92 Semiannual Report | The accompanying notes are an integral part of these financial statements. franklintempleton.com
| FRANKLIN CUSTODIAN FUNDS | ||||||
| FINANCIAL STATEMENTS | ||||||
| Statements of Operations (continued) | ||||||
| for the six months ended March 31, 2017 (unaudited) | ||||||
| Franklin | ||||||
| U.S. Government | Franklin | |||||
| Securities Fund | Utilities Fund | |||||
| Investment income: | ||||||
| Dividends: | ||||||
| Unaffiliated issuers | $ | — | $ | 104,330,759 | ||
| Non-controlled affiliates (Note 3f) | 35,162 | 16,198 | ||||
| Interest | 120,495,587 | 1,565,504 | ||||
| Paydown gain (loss) | (31,302,938 | ) | — | |||
| Total investment income. | 89,227,811 | 105,912,461 | ||||
| Expenses: | ||||||
| Management fees (Note 3a) | 14,271,942 | 14,085,030 | ||||
| Distribution fees: (Note 3c) | ||||||
| Class A | 2,982,946 | 3,015,748 | ||||
| Class C | 3,133,233 | 3,303,126 | ||||
| Class R | 137,166 | 244,198 | ||||
| Transfer agent fees: (Note 3e) | ||||||
| Class A | 2,666,607 | 2,192,148 | ||||
| Class C | 643,317 | 554,003 | ||||
| Class R | 37,061 | 53,353 | ||||
| Class R6 | 843 | 3,976 | ||||
| Advisor Class | 498,172 | 407,643 | ||||
| Custodian fees (Note 4) | 27,222 | 40,896 | ||||
| Reports to shareholders | 234,694 | 191,898 | ||||
| Registration and filing fees | 119,279 | 107,382 | ||||
| Professional fees | 44,119 | 37,125 | ||||
| Trustees’ fees and expenses | 14,394 | 12,791 | ||||
| Other. | 487,486 | 51,504 | ||||
| Total expenses | 25,298,481 | 24,300,821 | ||||
| Expense reductions (Note 4) | (1,257 | ) | (1,957 | ) | ||
| Expenses waived/paid by affiliates (Note 3f) | (138,703 | ) | (39,915 | ) | ||
| Net expenses | 25,158,521 | 24,258,949 | ||||
| Net investment income | 64,069,290 | 81,653,512 | ||||
| Realized and unrealized gains (losses): | ||||||
| Net realized gain (loss) from: | ||||||
| Investments | (43,984,248 | ) | 71,791,307 | |||
| Foreign currency transactions | — | (139,756 | ) | |||
| Net realized gain (loss) | (43,984,248 | ) | 71,651,551 | |||
| Net change in unrealized appreciation (depreciation) on: | ||||||
| Investments | (112,626,912 | ) | 197,740,782 | |||
| Translation of other assets and liabilities | ||||||
| denominated in foreign currencies | — | (14 | ) | |||
| Net change in unrealized appreciation (depreciation) | (112,626,912 | ) | 197,740,768 | |||
| Net realized and unrealized gain (loss) | (156,611,160 | ) | 269,392,319 | |||
| Net increase (decrease) in net assets resulting from operations | $ | (92,541,870 | ) | $ | 351,045,831 | |
franklintempleton.com The accompanying notes are an integral part of these financial statements. | Semiannual Report 93
| FRANKLIN CUSTODIAN FUNDS | ||||||||||||||
| FINANCIAL STATEMENTS | ||||||||||||||
| Statements of Changes in Net Assets | ||||||||||||||
| Franklin DynaTech Fund | Franklin Growth Fund | |||||||||||||
| Six Months Ended | Six Months Ended | |||||||||||||
| March 31, 2017 | Year Ended | March 31, 2017 | Year Ended | |||||||||||
| (unaudited) | September 30, 2016 | (unaudited) | September 30, 2016 | |||||||||||
| Increase (decrease) in net assets: | ||||||||||||||
| Operations: | ||||||||||||||
| Net investment income (loss) | $ | (4,967,614 | ) | $ | (9,206,276 | ) | $ | 33,020,224 | $ | 75,775,891 | ||||
| Net realized gain (loss) | 89,162,852 | 60,919,154 | 145,108,629 | 403,618,703 | ||||||||||
| Net change in unrealized | ||||||||||||||
| appreciation (depreciation) | 147,056,312 | 365,745,675 | 953,424,068 | 915,148,381 | ||||||||||
| Net increase (decrease) in net | ||||||||||||||
| assets resulting from | ||||||||||||||
| operations | 231,251,550 | 417,458,553 | 1,131,552,921 | 1,394,542,975 | ||||||||||
| Distributions to shareholders from: | ||||||||||||||
| Net investment income: | ||||||||||||||
| Class A | — | — | (36,899,436 | ) | (47,314,338 | ) | ||||||||
| Class R | — | — | (1,230,884 | ) | (1,070,343 | ) | ||||||||
| Class R6 | — | — | (11,177,576 | ) | (13,934,302 | ) | ||||||||
| Advisor Class | — | — | (15,699,121 | ) | (14,692,811 | ) | ||||||||
| Net realized gains: | ||||||||||||||
| Class A | (67,256,048 | ) | (50,280,433 | ) | (234,476,144 | ) | (236,451,446 | ) | ||||||
| Class C | (11,758,906 | ) | (8,550,949 | ) | (28,671,535 | ) | (27,988,492 | ) | ||||||
| Class R | (1,284,067 | ) | (1,147,436 | ) | (14,987,345 | ) | (15,909,617 | ) | ||||||
| Class R6 | (11,046,724 | ) | (9,395,944 | ) | (38,880,082 | ) | (38,078,959 | ) | ||||||
| Advisor Class | (7,824,210 | ) | (4,536,946 | ) | (64,547,147 | ) | (49,398,589 | ) | ||||||
| Total distributions to shareholders | (99,169,955 | ) | (73,911,708 | ) | (446,569,270 | ) | (444,838,897 | ) | ||||||
| Capital share transactions: (Note 2) | ||||||||||||||
| Class A | (95,620,001 | ) | 22,189,136 | (430,936,162 | ) | (162,965,732 | ) | |||||||
| Class C | (9,990,807 | ) | 15,466,910 | (2,471,423 | ) | 6,510,834 | ||||||||
| Class R | (3,587,652 | ) | (8,874,020 | ) | (10,854,360 | ) | (63,665,280 | ) | ||||||
| Class R6 | 52,758,839 | (47,875,928 | ) | 206,650,505 | (12,272,599 | ) | ||||||||
| Advisor Class | 168,439,664 | 9,087,518 | 232,693,526 | 338,804,621 | ||||||||||
| Total capital share transactions | 112,000,043 | (10,006,384 | ) | (4,917,914 | ) | 106,411,844 | ||||||||
| Net increase (decrease) in net | ||||||||||||||
| assets | 244,081,638 | 333,540,461 | 680,065,737 | 1,056,115,922 | ||||||||||
| Net assets: | ||||||||||||||
| Beginning of period | 3,043,788,613 | 2,710,248,152 | 12,199,017,841 | 11,142,901,919 | ||||||||||
| End of period. | $ | 3,287,870,251 | $ | 3,043,788,613 | $ | 12,879,083,578 | $ | 12,199,017,841 | ||||||
| Undistributed net investment income | ||||||||||||||
| included in net assets: | ||||||||||||||
| End of period. | $ | — | $ | — | $ | 4,865,454 | $ | 36,852,247 | ||||||
| Accumulated net investment loss | ||||||||||||||
| included in net assets: | ||||||||||||||
| End of period. | $ | (12,454,456 | ) | $ | (7,486,842 | ) | $ | — | $ | — | ||||
94 Semiannual Report | The accompanying notes are an integral part of these financial statements. franklintempleton.com
| FRANKLIN CUSTODIAN FUNDS | |||||||||||||||
| FINANCIAL STATEMENTS | |||||||||||||||
| Statements of Changes in Net Assets (continued) | |||||||||||||||
| Franklin Income Fund | Franklin U.S. Government Securities Fund | ||||||||||||||
| Six Months Ended | Six Months Ended | ||||||||||||||
| March 31, 2017 | Year Ended | March 31, 2017 | Year Ended | ||||||||||||
| (unaudited) | September 30, 2016 | (unaudited) | September 30, 2016 | ||||||||||||
| Increase (decrease) in net assets: | |||||||||||||||
| Operations: | |||||||||||||||
| Net investment income. | $ | 1,648,849,235 | $ | 3,438,938,686 | $ | 64,069,290 | $ | 139,492,462 | |||||||
| Net realized gain (loss) | 1,288,782,973 | (1,282,009,421 | ) | (43,984,248 | ) | 10,586,197 | |||||||||
| Net change in unrealized | |||||||||||||||
| appreciation (depreciation) | 2,931,242,724 | 7,225,707,762 | (112,626,912 | ) | (6,613,115 | ) | |||||||||
| Net increase (decrease) in net | |||||||||||||||
| assets resulting from | |||||||||||||||
| operations | 5,868,874,932 | 9,382,637,027 | (92,541,870 | ) | 143,465,544 | ||||||||||
| Distributions to shareholders from: | |||||||||||||||
| Net investment income: | |||||||||||||||
| Class A | (1,201,765,518 | ) | (2,485,275,665 | ) | (61,576,022 | ) | (131,450,457 | ) | |||||||
| Class C | (556,740,960 | ) | (1,181,223,007 | ) | (12,517,606 | ) | (27,370,513 | ) | |||||||
| Class R | (9,783,565 | ) | (21,375,115 | ) | (750,155 | ) | (1,712,479 | ) | |||||||
| Class R6 | (47,677,508 | ) | (101,566,652 | ) | (9,228,922 | ) | (16,335,592 | ) | |||||||
| Advisor Class | (237,350,871 | ) | (434,811,841 | ) | (12,214,827 | ) | (21,257,710 | ) | |||||||
| Total distributions to shareholders | (2,053,318,422 | ) | (4,224,252,280 | ) | (96,287,532 | ) | (198,126,751 | ) | |||||||
| Capital share transactions: (Note 2) | |||||||||||||||
| Class A | (1,447,520,464 | ) | (2,328,656,181 | ) | (316,752,871 | ) | 103,644,563 | ||||||||
| Class C | (862,664,997 | ) | (1,818,661,369 | ) | (110,336,372 | ) | 3,123,563 | ||||||||
| Class R | (21,526,924 | ) | (46,109,223 | ) | (14,023,247 | ) | (4,370,596 | ) | |||||||
| Class R6 | (16,396,721 | ) | (116,842,625 | ) | (158,175,112 | ) | 253,127,815 | ||||||||
| Advisor Class | 1,832,139,821 | (107,969,590 | ) | 91,245,455 | 102,139,643 | ||||||||||
| Total capital share transactions | (515,969,285 | ) | (4,418,238,988 | ) | (508,042,147 | ) | 457,664,988 | ||||||||
| Net increase (decrease) in net | |||||||||||||||
| assets | 3,299,587,225 | 740,145,759 | (696,871,549 | ) | 403,003,781 | ||||||||||
| Net assets: | |||||||||||||||
| Beginning of period | 79,633,756,458 | 78,893,610,699 | 6,673,608,849 | 6,270,605,068 | |||||||||||
| End of period. | $ | 82,933,343,683 | $ | 79,633,756,458 | $ | 5,976,737,300 | $ | 6,673,608,849 | |||||||
| Undistributed net investment income | |||||||||||||||
| included in net assets: | |||||||||||||||
| End of period. | $ | — | $ | — | $ | — | $ | 367,575 | |||||||
| Distributions in excess of net investment | |||||||||||||||
| income included in net assets: | |||||||||||||||
| End of period. | $ | (474,815,345 | ) | $ | (70,346,158 | ) | $ | (31,850,667 | ) | $ | — | ||||
franklintempleton.com The accompanying notes are an integral part of these financial statements. | Semiannual Report 95
| FRANKLIN CUSTODIAN FUNDS | ||||||
| FINANCIAL STATEMENTS | ||||||
| Statements of Changes in Net Assets (continued) | ||||||
| Franklin Utilities Fund | ||||||
| Six Months Ended | ||||||
| March 31, 2017 | Year Ended | |||||
| (unaudited) | September 30, 2016 | |||||
| Increase (decrease) in net assets: | ||||||
| Operations: | ||||||
| Net investment income | $ | 81,653,512 | $ | 160,415,989 | ||
| Net realized gain (loss) | 71,651,551 | 10,054,627 | ||||
| Net change in unrealized appreciation (depreciation) | 197,740,768 | 775,675,049 | ||||
| Net increase (decrease) in net assets resulting from operations | 351,045,831 | 946,145,665 | ||||
| Distributions to shareholders from: | ||||||
| Net investment income: | ||||||
| Class A | (55,787,982 | ) | (112,834,284 | ) | ||
| Class C | (11,646,815 | ) | (24,515,967 | ) | ||
| Class R | (1,195,634 | ) | (2,379,943 | ) | ||
| Class R6 | (3,372,493 | ) | (7,365,000 | ) | ||
| Advisor Class | (11,106,537 | ) | (19,769,621 | ) | ||
| Net realized gains: | ||||||
| Class A | (2,346,125 | ) | (112,737,319 | ) | ||
| Class C | (595,963 | ) | (29,873,670 | ) | ||
| Class R | (58,200 | ) | (2,659,792 | ) | ||
| Class R6 | (124,605 | ) | (6,346,334 | ) | ||
| Advisor Class | (418,502 | ) | (17,570,610 | ) | ||
| Total distributions to shareholders | (86,652,856 | ) | (336,052,540 | ) | ||
| Capital share transactions: (Note 2) | ||||||
| Class A | (227,511,127 | ) | 250,100,796 | |||
| Class C | (68,016,126 | ) | 26,911,855 | |||
| Class R | (7,928,774 | ) | 10,837,743 | |||
| Class R6 | 9,145,951 | (5,556,096 | ) | |||
| Advisor Class | 59,709,889 | 139,619,686 | ||||
| Total capital share transactions | (234,600,187 | ) | 421,913,984 | |||
| Net increase (decrease) in net assets | 29,792,788 | 1,032,007,109 | ||||
| Net assets: | ||||||
| Beginning of period | 6,322,508,025 | 5,290,500,916 | ||||
| End of period. | $ | 6,352,300,813 | $ | 6,322,508,025 | ||
| Undistributed net investment income included in net assets: | ||||||
| End of period. | $ | 3,592,957 | $ | 5,048,906 | ||
96 Semiannual Report | The accompanying notes are an integral part of these financial statements. franklintempleton.com
FRANKLIN CUSTODIAN FUNDS
Notes to Financial Statements (unaudited)
1. Organization and Significant Accounting Policies
Franklin Custodian Funds (Trust) is registered under the Investment Company Act of 1940 (1940 Act) as an open-end management investment company, consisting of six separate funds, five of which are included in this report (Funds) and applies the specialized accounting and reporting guidance in U.S. Generally Accepted Accounting Principles (U.S. GAAP). The financial statements of the remaining fund in the Trust are presented separately. The Funds offer five classes of shares: Class A, Class C, Class R, Class R6, and Advisor Class. Each class of shares differs by its initial sales load, contingent deferred sales charges, voting rights on matters affecting a single class, its exchange privilege and fees primarily due to differing arrangements for distribution and transfer agent fees.
The following summarizes the Funds’ significant accounting policies.
a. Financial Instrument Valuation
The Funds’ investments in financial instruments are carried at fair value daily. Fair value is the price that would be received to sell an asset or paid to transfer a liability in an orderly transaction between market participants on the measurement date. The Funds calculate the net asset value (NAV) per share as of 4 p.m. Eastern time each day the New York Stock Exchange (NYSE) is open for trading. Under compliance policies and procedures approved by the Trust’s Board of Trustees (the Board), the Funds’ administrator has responsibility for oversight of valuation, including leading the cross-functional Valuation Committee (VC). The VC provides administration and oversight of the Funds’ valuation policies and procedures, which are approved annually by the Board. Among other things, these procedures allow the Funds to utilize independent pricing services, quotations from securities and financial instrument dealers, and other market sources to determine fair value.
Equity securities and derivative financial instruments listed on an exchange or on the NASDAQ National Market System are valued at the last quoted sale price or the official closing price of the day, respectively. Foreign equity securities are valued as of the close of trading on the foreign stock exchange on which the security is primarily traded, or as of 4 p.m. Eastern time. The value is then converted into its U.S. dollar equivalent at the foreign exchange rate in effect at 4 p.m. Eastern time on the day that the value of the security is determined. Over-the-counter (OTC) securities are valued within the range of the most recent quoted bid and ask prices. Securities that trade in multiple markets or on multiple exchanges are valued according to the broadest and most representative market. Certain equity securities are valued based upon fundamental characteristics or relationships to similar securities.
Debt securities generally trade in the OTC market rather than on a securities exchange. The Funds’ pricing services use multiple valuation techniques to determine fair value. In instances where sufficient market activity exists, the pricing services may utilize a market-based approach through which quotes from market makers are used to determine fair value. In instances where sufficient market activity may not exist or is limited, the pricing services also utilize proprietary valuation models which may consider market characteristics such as benchmark yield curves, credit spreads, estimated default rates, anticipated market interest rate volatility, coupon rates, anticipated timing of principal repayments, underlying collateral, and other unique security features in order to estimate the relevant cash flows, which are then discounted to calculate the fair value. Securities denominated in a foreign currency are converted into their U.S. dollar equivalent at the foreign exchange rate in effect at 4 p.m. Eastern time on the date that the values of the foreign debt securities are determined.
Investments in open-end mutual funds are valued at the closing NAV. Investments in repurchase agreements are valued at cost, which approximates fair value.
The Funds have procedures to determine the fair value of financial instruments for which market prices are not reliable or readily available. Under these procedures, the VC convenes on a regular basis to review such financial instruments and considers a number of factors, including significant unobservable valuation inputs, when arriving at fair value. The VC primarily employs a market-based approach which may use related or comparable assets or liabilities, recent transactions, market multiples, book values, and other relevant information for the investment to determine the fair value of the investment. An income-based valuation approach may also be used in which the anticipated future cash flows of the investment are discounted to calculate fair value. Discounts may also be applied due to the nature or duration of any restrictions on the disposition of the investments. Due to the inherent uncertainty of valuations of such investments, the fair values may differ significantly from the values that would have been used had an active market existed. The VC employs various methods for
franklintempleton.com
Semiannual Report 97
FRANKLIN CUSTODIAN FUNDS
NOTES TO FINANCIAL STATEMENTS (UNAUDITED)
1. Organization and Significant Accounting
Policies (continued)
a. Financial Instrument Valuation (continued)
calibrating these valuation approaches including a regular review of key inputs and assumptions, transactional back-testing or disposition analysis, and reviews of any related market activity.
Trading in securities on foreign securities stock exchanges and OTC markets may be completed before 4 p.m. Eastern time. In addition, trading in certain foreign markets may not take place on every Funds’ business day. Occasionally, events occur between the time at which trading in a foreign security is completed and 4 p.m. Eastern time that might call into question the reliability of the value of a portfolio security held by the Fund. As a result, differences may arise between the value of the Funds’ portfolio securities as determined at the foreign market close and the latest indications of value at 4 p.m. Eastern time. In order to minimize the potential for these differences, the VC monitors price movements following the close of trading in foreign stock markets through a series of country specific market proxies (such as baskets of American Depositary Receipts, futures contracts and exchange traded funds). These price movements are measured against established trigger thresholds for each specific market proxy to assist in determining if an event has occurred that may call into question the reliability of the values of the foreign securities held by the Funds. If such an event occurs, the securities may be valued using fair value procedures, which may include the use of independent pricing services.
When the last day of the reporting period is a non-business day, certain foreign markets may be open on those days that the Funds’ NAV is not calculated, which could result in differences between the value of the Funds’ portfolio securities on the last business day and the last calendar day of the reporting period. Any significant security valuation changes due to an open foreign market are adjusted and reflected by the Funds for financial reporting purposes.
b. Foreign Currency Translation
Portfolio securities and other assets and liabilities denominated in foreign currencies are translated into U.S. dollars based on the exchange rate of such currencies against U.S. dollars on the date of valuation. The Funds may enter into foreign currency exchange contracts to facilitate transactions denominated in a foreign currency. Purchases and sales of securities, income and expense items denominated in foreign currencies are translated into U.S. dollars at the exchange rate in effect on the transaction date. Portfolio securities and assets and liabilities denominated in foreign currencies contain risks that those currencies will decline in value relative to the U.S. dollar. Occasionally, events may impact the availability or reliability of foreign exchange rates used to convert the U.S. dollar equivalent value. If such an event occurs, the foreign exchange rate will be valued at fair value using procedures established and approved by the Board.
The Funds do not separately report the effect of changes in foreign exchange rates from changes in market prices on securities held. Such changes are included in net realized and unrealized gain or loss from investments in the Statements of Operations.
Realized foreign exchange gains or losses arise from sales of foreign currencies, currency gains or losses realized between the trade and settlement dates on securities transactions and the difference between the recorded amounts of dividends, interest, and foreign withholding taxes and the U.S. dollar equivalent of the amounts actually received or paid. Net unrealized foreign exchange gains and losses arise from changes in foreign exchange rates on foreign denominated assets and liabilities other than investments in securities held at the end of the reporting period.
c. Joint Repurchase Agreement
Certain or all Funds enter into a joint repurchase agreement whereby their uninvested cash balance is deposited into a joint cash account with other funds managed by the investment manager or an affiliate of the investment manager and is used to invest in one or more repurchase agreements. The value and face amount of the joint repurchase agreement are allocated to the funds based on their pro-rata interest. A repurchase agreement is accounted for as a loan by the Fund to the seller, collateralized by securities which are delivered to the Funds’ custodian. The fair value, including accrued interest, of the initial collateralization is required to be at least 102% of the dollar amount invested by the funds, with the value of the underlying securities marked to market daily to maintain coverage of at least 100%. Repurchase agreements are subject to the terms of Master Repurchase Agreements (MRAs) with approved counterparties (sellers). The MRAs contain various provisions, including but not limited to events of default and maintenance of collateral for repurchase agreements. In the
98 Semiannual Report
franklintempleton.com
FRANKLIN CUSTODIAN FUNDS
NOTES TO FINANCIAL STATEMENTS (UNAUDITED)
event of default by either the seller or the Funds, certain MRAs may permit the non-defaulting party to net and close-out all transactions, if any, traded under such agreements. The Funds may sell securities it holds as collateral and apply the proceeds towards the repurchase price and any other amounts owed by the seller to the Funds in the event of default by the seller. This could involve costs or delays in addition to a loss on the securities if their value falls below the repurchase price owed by the seller. The joint repurchase agreement held by the Funds at period end, as indicated in the Statements of Investments, had been entered into on March 31, 2017.
d. Securities Purchased on a When-Issued or Delayed Delivery Basis
Certain or all Funds purchase securities on a when-issued or delayed delivery basis, with payment and delivery scheduled for a future date. These transactions are subject to market fluctuations and are subject to the risk that the value at delivery may be more or less than the trade date purchase price. Although the Funds will generally purchase these securities with the intention of holding the securities, they may sell the securities before the settlement date. Sufficient assets have been segregated for these securities.
e. Derivative Financial Instruments
Certain or all Funds invested in derivative financial instruments in order to manage risk or gain exposure to various other investments or markets. Derivatives are financial contracts based on an underlying or notional amount, require no initial investment or an initial net investment that is smaller than would normally be required to have a similar response to changes in market factors, and require or permit net settlement. Derivatives contain various risks including the potential inability of the counterparty to fulfill their obligations under the terms of the contract, the potential for an illiquid secondary market, and/or the potential for market movements which expose the Fund to gains or losses in excess of the amounts shown in the Statements of Assets and Liabilities. Realized gain and loss and unrealized appreciation and depreciation on these contracts for the period are included in the Statements of Operations.
Collateral requirements differ by type of derivative. Collateral or initial margin requirements are set by the broker or exchange clearing house for exchange traded and centrally cleared derivatives. Initial margin deposited is held at the exchange and can be in the form of cash and/or securities.
Certain or all Funds purchased or wrote exchange traded option contracts primarily to manage exposure to equity price risk. An option is a contract entitling the holder to purchase or sell a specific amount of shares or units of an asset or notional amount of a swap (swaption), at a specified price. When an option is purchased or written, an amount equal to the premium paid or received is recorded as an asset or liability, respectively. Upon exercise of an option, the acquisition cost or sales proceeds of the underlying investment is adjusted by any premium received or paid. Upon expiration of an option, any premium received or paid is recorded as a realized gain or loss. Upon closing an option other than through expiration or exercise, the difference between the premium received or paid and the cost to close the position is recorded as a realized gain or loss.
See Notes 6 and 10 regarding investment transactions and other derivative information, respectively.
f. Equity-Linked Securities
Certain or all Funds invest in equity-linked securities. Equity-linked securities are hybrid financial instruments that generally combine both debt and equity characteristics into a single note form. Income received from equity-linked securities is recorded as realized gains in the Statements of Operations and may be based on the performance of an underlying equity security, an equity index, or an option position. The risks of investing in equity-linked securities include unfavorable price movements in the underlying security and the credit risk of the issuing financial institution. There may be no guarantee of a return of principal with equity-linked securities and the appreciation potential may be limited. Equity-linked securities may be more volatile and less liquid than other investments held by the Funds.
g. Securities Lending
Certain or all Funds participate in an agency based securities lending program to earn additional income. The Fund receives cash collateral against the loaned securities in an amount equal to at least 102% of the fair value of the loaned securities. Collateral is maintained over the life of the loan in an amount not less than 100% of the fair value of loaned securities, as determined at the close of Fund business each day; any additional collateral required due to changes in security values is delivered to the Fund on the next business day. The collateral is deposited into a joint cash account with other funds and is used to invest in a money market fund managed by Franklin Advisers, Inc., an affiliate of the Funds, and/or a joint
franklintempleton.com
Semiannual Report 99
FRANKLIN CUSTODIAN FUNDS
NOTES TO FINANCIAL STATEMENTS (UNAUDITED)
1. Organization and Significant Accounting
Policies (continued)
g. Securities Lending (continued)
repurchase agreement. The Fund may receive income from the investment of cash collateral, in addition to lending fees and rebates paid by the borrower. Income from securities loaned, net of fees paid to the securities lending agent and/or third-party vendor, is reported separately in the Statements of Operations. The Fund bears the market risk with respect to the collateral investment, securities loaned, and the risk that the agent may default on its obligations to the Fund. If the borrower defaults on its obligation to return the securities loaned, the Fund has the right to repurchase the securities in the open market using the collateral received. The securities lending agent has agreed to indemnify the Fund in the event of default by a third party borrower.
h. Mortgage Dollar Rolls
Certain or all Funds enter into mortgage dollar rolls, typically on a to-be-announced basis. Mortgage dollar rolls are agreements between the Fund and a financial institution where the Fund sells (or buys) mortgage-backed securities for delivery on a specified date and simultaneously contracts to repurchase (or sell) substantially similar (same type, coupon, and maturity) securities at a future date and at a predetermined price. Gains or losses are realized on the initial sale, and the difference between the repurchase price and the sale price is recorded as an unrealized gain or loss to the Fund upon entering into the mortgage dollar roll. In addition, the Fund may invest the cash proceeds that are received from the initial sale. During the period between the sale and repurchase, the Fund is not entitled to principal and interest paid on the mortgage backed securities. Transactions in mortgage dollar rolls are accounted for as purchases and sales and may result in an increase to the Fund’s portfolio turnover rate. The risks of mortgage dollar roll transactions include the potential inability of the counterparty to fulfill its obligations.
i. Senior Floating Rate Interests
Certain or all Funds invest in senior secured corporate loans that pay interest at rates which are periodically reset by reference to a base lending rate plus a spread. These base lending rates are generally the prime rate offered by a designated U.S. bank or the London InterBank Offered Rate (LIBOR). Senior secured corporate loans often require prepayment of principal from excess cash flows or at the discretion of the borrower. As a result, actual maturity may be substantially less than the stated maturity. Senior secured corporate loans in which the Funds invest are generally readily marketable, but may be subject to certain restrictions on resale.
j. Income and Deferred Taxes
It is each Fund’s policy to qualify as a regulated investment company under the Internal Revenue Code. Each Fund intends to distribute to shareholders substantially all of its taxable income and net realized gains to relieve it from federal income and excise taxes. As a result, no provision for U.S. federal income taxes is required.
The Funds may be subject to foreign taxation related to income received, capital gains on the sale of securities and certain foreign currency transactions in the foreign jurisdictions in which the Funds invest. Foreign taxes, if any, are recorded based on the tax regulations and rates that exist in the foreign markets in which the Funds invest. When a capital gain tax is determined to apply, certain or all Funds record an estimated deferred tax liability in an amount that would be payable if the securities were disposed of on the valuation date. As a result of several court cases, in certain countries across the European Union, certain or all Funds filed additional tax reclaims for previously withheld taxes on dividends earned in those countries (EU reclaims). These additional filings are subject to various administrative proceedings by the local jurisdictions’ tax authorities within the European Union, as well as a number of related judicial proceedings. Income recognized, if any, for EU reclaims is reflected as other income in the Statements of Operations and any related receivable, if any, is reflected as European Union tax reclaims in the Statements of Assets and Liabilities. When uncertainty exists as to the ultimate resolution of these proceedings, the likelihood of receipt of these EU reclaims, and the potential timing of payment, no amounts are reflected in the financial statements. For U.S. income tax purposes, EU reclaims received by the Funds, if any, reduce the amounts of foreign taxes Fund shareholders can use as tax credits in their individual income tax returns.
Each Fund may recognize an income tax liability related to its uncertain tax positions under U.S. GAAP when the uncertain tax position has a less than 50% probability that it will be sustained upon examination by the tax authorities based on its technical merits. As of March 31, 2017, each Fund has determined that no tax liability is required in its financial
100 Semiannual Report
franklintempleton.com
FRANKLIN CUSTODIAN FUNDS
NOTES TO FINANCIAL STATEMENTS (UNAUDITED)
statements related to uncertain tax positions for any open tax years (or expected to be taken in future tax years). Open tax years are those that remain subject to examination and are based on each tax jurisdiction’s statute of limitation.
k. Security Transactions, Investment Income, Expenses and Distributions
Security transactions are accounted for on trade date. Realized gains and losses on security transactions are determined on a specific identification basis. Interest income and estimated expenses are accrued daily. Amortization of premium and accretion of discount on debt securities are included in interest income. Paydown gains and losses are recorded separately in the Statements of Operations. Facility fees are recognized as income over the expected term of the loan. Dividend income is recorded on the ex-dividend date except for certain dividends from securities where the dividend rate is not available. In such cases, the dividend is recorded as soon as the information is received by the Funds. Distributions to shareholders are recorded on the ex-dividend date and are determined according to income tax regulations (tax basis). Distributable earnings determined on a tax basis may differ from earnings recorded in accordance with U.S. GAAP. These differences may be permanent or temporary. Permanent differences are reclassified among capital accounts to reflect their tax character. These reclassifications have no impact on net assets or the results of operations. Temporary differences are not reclassified, as they may reverse in subsequent periods.
Common expenses incurred by the Trust are allocated among the Funds based on the ratio of net assets of each Fund to the combined net assets of the Trust. Fund specific expenses are charged directly to the Fund that incurred the expense.
Realized and unrealized gains and losses and net investment income, not including class specific expenses, are allocated daily to each class of shares based upon the relative proportion of net assets of each class. Differences in per share distributions, by class, are generally due to differences in class specific expenses.
l. Accounting Estimates
The preparation of financial statements in accordance with U.S. GAAP requires management to make estimates and assumptions that affect the reported amounts of assets and liabilities at the date of the financial statements and the amounts of income and expenses during the reporting period. Actual results could differ from those estimates.
m. Guarantees and Indemnifications
Under the Trust’s organizational documents, its officers and trustees are indemnified by the Trust against certain liabilities arising out of the performance of their duties to the Trust. Additionally, in the normal course of business, the Trust, on behalf of the Funds, enters into contracts with service providers that contain general indemnification clauses. The Trust’s maximum exposure under these arrangements is unknown as this would involve future claims that may be made against the Trust that have not yet occurred. Currently, the Trust expect the risk of loss to be remote.
franklintempleton.com
Semiannual Report 101
FRANKLIN CUSTODIAN FUNDS
NOTES TO FINANCIAL STATEMENTS (UNAUDITED)
2. Shares of Beneficial Interest
At March 31, 2017, there were an unlimited number of shares authorized (without par value). Transactions in the Funds’ shares were as follows:
| Franklin DynaTech | Franklin Growth | |||||||||||
| Fund | Fund | |||||||||||
| Shares | Amount | Shares | Amount | |||||||||
| Class A Shares: | ||||||||||||
| Six Months ended March 31, 2017 | ||||||||||||
| Shares sold | 3,937,312 | $ | 201,154,661 | 7,873,756 | $ | 625,559,721 | ||||||
| Shares issued in reinvestment of distributions. | 1,325,934 | 62,305,646 | 3,311,504 | 249,919,231 | ||||||||
| Shares redeemed | (7,068,636 | ) | (359,080,308 | ) | (16,496,395 | ) | (1,306,415,114 | ) | ||||
| Net increase (decrease) | (1,805,390 | ) | $ | (95,620,001 | ) | (5,311,135 | ) | $ | (430,936,162 | ) | ||
| Year ended September 30, 2016 | ||||||||||||
| Shares sold | 11,719,604 | $ | 557,476,346 | 14,730,591 | $ | 1,091,538,193 | ||||||
| Shares issued in reinvestment of distributions. | 934,047 | 46,730,383 | 3,458,561 | 261,017,574 | ||||||||
| Shares issued on reorganization | — | — | 314,663 | 18,982,031 | ||||||||
| Shares redeemed | (12,214,975 | ) | (582,017,593 | ) | (20,629,135 | ) | (1,534,503,530 | ) | ||||
| Net increase (decrease) | 438,676 | $ | 22,189,136 | (2,125,320 | ) | $ | (162,965,732 | ) | ||||
| Class C Shares: | ||||||||||||
| Six Months ended March 31, 2017 | ||||||||||||
| Shares sold | 642,636 | $ | 28,006,212 | 1,176,270 | $ | 86,202,078 | ||||||
| Shares issued in reinvestment of distributions. | 278,097 | 11,146,149 | 378,292 | 26,423,733 | ||||||||
| Shares redeemed | (1,134,627 | ) | (49,143,168 | ) | (1,573,465 | ) | (115,097,234 | ) | ||||
| Net increase (decrease) | (213,894 | ) | $ | (9,990,807 | ) | (18,903 | ) | $ | (2,471,423 | ) | ||
| Year ended September 30, 2016 | ||||||||||||
| Shares sold | 2,087,492 | $ | 85,801,474 | 2,416,582 | $ | 166,119,695 | ||||||
| Shares issued in reinvestment of distributions. | 187,219 | 8,097,222 | 364,920 | 25,617,358 | ||||||||
| Shares issued on reorganization | — | — | 57,203 | 3,204,287 | ||||||||
| Shares redeemed | (1,917,133 | ) | (78,431,786 | ) | (2,748,828 | ) | (188,430,506 | ) | ||||
| Net increase (decrease) | 357,578 | $ | 15,466,910 | 89,877 | $ | 6,510,834 | ||||||
| Class R Shares: | ||||||||||||
| Six Months ended March 31, 2017 | ||||||||||||
| Shares sold | 83,393 | $ | 4,162,568 | 375,995 | $ | 29,690,092 | ||||||
| Shares issued in reinvestment of distributions. | 27,272 | 1,251,781 | 210,204 | 15,813,630 | ||||||||
| Shares redeemed | (180,286 | ) | (9,002,001 | ) | (715,046 | ) | (56,358,082 | ) | ||||
| Net increase (decrease) | (69,621 | ) | $ | (3,587,652 | ) | (128,847 | ) | $ | (10,854,360 | ) | ||
| Year ended September 30, 2016 | ||||||||||||
| Shares sold | 165,591 | $ | 7,698,887 | 922,209 | $ | 67,929,360 | ||||||
| Shares issued in reinvestment of distributions. | 23,085 | 1,131,862 | 220,024 | 16,556,807 | ||||||||
| Shares issued on reorganization | — | — | 137 | 7,135 | ||||||||
| Shares redeemed | (377,470 | ) | (17,704,769 | ) | (2,012,219 | ) | (148,158,582 | ) | ||||
| Net increase (decrease) | (188,794 | ) | $ | (8,874,020 | ) | (869,849 | ) | $ | (63,665,280 | ) | ||
102 Semiannual Report
franklintempleton.com
| FRANKLIN CUSTODIAN FUNDS | ||||||||||||
| NOTES TO FINANCIAL STATEMENTS (UNAUDITED) | ||||||||||||
| Franklin DynaTech | Franklin Growth | |||||||||||
| Fund | Fund | |||||||||||
| Shares | Amount | Shares | Amount | |||||||||
| Class R6 Shares: | ||||||||||||
| Six Months ended March 31, 2017 | ||||||||||||
| Shares sold | 1,394,393 | $ | 75,536,692 | 3,689,086 | $ | 295,553,990 | ||||||
| Shares issued in reinvestment of distributions. | 228,050 | 11,046,724 | 613,371 | 46,278,808 | ||||||||
| Shares redeemed | (638,780 | ) | (33,824,577 | ) | (1,698,633 | ) | (135,182,293 | ) | ||||
| Net increase (decrease) | 983,663 | $ | 52,758,839 | 2,603,824 | $ | 206,650,505 | ||||||
| Year ended September 30, 2016 | ||||||||||||
| Shares sold | 1,005,677 | $ | 48,126,111 | 2,209,612 | $ | 166,757,883 | ||||||
| Shares issued in reinvestment of distributions. | 183,157 | 9,395,944 | 637,359 | 48,088,702 | ||||||||
| Shares redeemed | (2,168,287 | ) | (105,397,983 | ) | (3,013,600 | ) | (227,119,184 | ) | ||||
| Net increase (decrease) | (979,453 | ) | $ | (47,875,928 | ) | (166,629 | ) | $ | (12,272,599 | ) | ||
| Advisor Class Shares: | ||||||||||||
| Six Months ended March 31, 2017 | ||||||||||||
| Shares sold | 4,148,071 | $ | 217,294,701 | 6,376,409 | $ | 506,373,479 | ||||||
| Shares issued in reinvestment of distributions. | 155,933 | 7,506,593 | 998,990 | 75,473,718 | ||||||||
| Shares redeemed | (1,087,770 | ) | (56,361,630 | ) | (4,430,296 | ) | (349,153,671 | ) | ||||
| Net increase (decrease) | 3,216,234 | $ | 168,439,664 | 2,945,103 | $ | 232,693,526 | ||||||
| Year ended September 30, 2016 | ||||||||||||
| Shares sold | 2,188,873 | $ | 109,144,348 | 6,862,211 | $ | 545,996,733 | ||||||
| Shares issued in reinvestment of distributions. | 84,067 | 4,294,126 | 801,298 | 60,554,117 | ||||||||
| Shares issued on reorganization | — | — | 2,254,565 | 136,327,485 | ||||||||
| Shares redeemed | (2,202,327 | ) | (104,350,956 | ) | (5,398,462 | ) | (404,073,714 | ) | ||||
| Net increase (decrease) | 70,613 | $ | 9,087,518 | 4,519,612 | $ | 338,804,621 | ||||||
| Franklin Income | Franklin U.S. Government | |||||||||||
| Fund | Securities Fund | |||||||||||
| Shares | Amount | Shares | Amount | |||||||||
| Class A Shares: | ||||||||||||
| Six Months ended March 31, 2017 | ||||||||||||
| Shares sold | 1,159,554,907 | $ | 2,665,135,864 | 48,429,708 | $ | 302,132,177 | ||||||
| Shares issued in reinvestment of distributions | 484,339,931 | 1,105,001,340 | 8,451,050 | 52,523,690 | ||||||||
| Shares redeemed | (2,271,955,811 | ) | (5,217,657,668 | ) | (107,875,766 | ) | (671,408,738 | ) | ||||
| Net increase (decrease) | (628,060,973 | ) | $ | (1,447,520,464 | ) | (50,995,008 | ) | $ | (316,752,871 | ) | ||
| Year ended September 30, 2016 | ||||||||||||
| Shares sold | 2,296,688,306 | $ | 4,899,239,525 | 129,588,253 | $ | 826,285,803 | ||||||
| Shares issued in reinvestment of distributions | 1,066,919,722 | 2,280,635,347 | 17,544,573 | 111,672,956 | ||||||||
| Shares redeemed | (4,454,843,889 | ) | (9,508,531,053 | ) | (130,888,179 | ) | (834,314,196 | ) | ||||
| Net increase (decrease) | (1,091,235,861 | ) | $ | (2,328,656,181 | ) | 16,244,647 | $ | 103,644,563 | ||||
franklintempleton.com
Semiannual Report 103
FRANKLIN CUSTODIAN FUNDS
NOTES TO FINANCIAL STATEMENTS (UNAUDITED)
| 2. Shares of Beneficial Interest (continued) | ||||||||||
| Franklin Income | Franklin U.S. Government | |||||||||
| Fund | Securities Fund | |||||||||
| Shares | Amount | Shares | Amount | |||||||
| Class C Shares: | ||||||||||
| Six Months ended March 31, 2017 | ||||||||||
| Shares sold | 515,277,315 | $ | 1,199,281,036 | 8,980,693 | $ | 55,723,396 | ||||
| Shares issued in reinvestment of distributions | 211,626,160 | 488,809,479 | 1,813,679 | 11,196,970 | ||||||
| Shares redeemed | (1,099,238,618 | ) | (2,550,755,512 | ) | (28,689,317 | ) | (177,256,738 | ) | ||
| Net increase (decrease) | (372,335,143 | ) | $ | (862,664,997 | ) | (17,894,945 | ) | $ | (110,336,372 | ) |
| Year ended September 30, 2016 | ||||||||||
| Shares sold | 1,068,954,930 | $ | 2,309,517,092 | 36,439,976 | $ | 230,732,462 | ||||
| Shares issued in reinvestment of distributions | 475,083,681 | 1,027,055,245 | 3,842,286 | 24,293,961 | ||||||
| Shares redeemed | (2,389,581,028 | ) | (5,155,233,706 | ) | (39,789,996 | ) | (251,902,860 | ) | ||
| Net increase (decrease) | (845,542,417 | ) | $ | (1,818,661,369 | ) | 492,266 | $ | 3,123,563 | ||
| Class R Shares: | ||||||||||
| Six Months ended March 31, 2017 | ||||||||||
| Shares sold | 16,555,180 | $ | 37,488,527 | 1,560,283 | $ | 9,753,095 | ||||
| Shares issued in reinvestment of distributions | 4,114,887 | 9,228,681 | 115,245 | 715,950 | ||||||
| Shares redeemed | (30,192,439 | ) | (68,244,132 | ) | (3,956,790 | ) | (24,492,292 | ) | ||
| Net increase (decrease) | (9,522,372 | ) | $ | (21,526,924 | ) | (2,281,262 | ) | $ | (14,023,247 | ) |
| Year ended September 30, 2016 | ||||||||||
| Shares sold | 32,442,666 | $ | 68,219,741 | 4,014,644 | $ | 25,582,929 | ||||
| Shares issued in reinvestment of distributions | 9,659,507 | 20,294,130 | 256,237 | 1,629,788 | ||||||
| Shares redeemed | (64,184,548 | ) | (134,623,094 | ) | (4,958,227 | ) | (31,583,313 | ) | ||
| Net increase (decrease) | (22,082,375 | ) | $ | (46,109,223 | ) | (687,346 | ) | $ | (4,370,596 | ) |
| Class R6 Shares: | ||||||||||
| Six Months ended March 31, 2017 | ||||||||||
| Shares sold | 20,889,478 | $ | 47,848,781 | 2,998,333 | $ | 18,831,742 | ||||
| Shares issued in reinvestment of distributions | 20,069,133 | 45,425,850 | 1,479,929 | 9,228,922 | ||||||
| Shares redeemed | (48,293,178 | ) | (109,671,352 | ) | (29,847,624 | ) | (186,235,776 | ) | ||
| Net increase (decrease) | (7,334,567 | ) | $ | (16,396,721 | ) | (25,369,362 | ) | $ | (158,175,112 | ) |
| Year ended September 30, 2016 | ||||||||||
| Shares sold | 27,601,182 | $ | 58,603,240 | 56,484,578 | $ | 361,101,116 | ||||
| Shares issued in reinvestment of distributions | 45,946,719 | 97,311,080 | 2,472,810 | 15,785,553 | ||||||
| Shares redeemed | (130,160,220 | ) | (272,756,945 | ) | (19,368,048 | ) | (123,758,854 | ) | ||
| Net increase (decrease) | (56,612,319 | ) | $ | (116,842,625 | ) | 39,589,340 | $ | 253,127,815 | ||
| Advisor Class Shares: | ||||||||||
| Six Months ended March 31, 2017 | ||||||||||
| Shares sold | 1,244,245,042 | $ | 2,848,972,412 | 36,761,948 | $ | 229,779,312 | ||||
| Shares issued in reinvestment of distributions | 92,202,175 | 208,983,541 | 1,766,327 | 11,010,382 | ||||||
| Shares redeemed | (539,464,085 | ) | (1,225,816,132 | ) | (23,946,956 | ) | (149,544,239 | ) | ||
| Net increase (decrease) | 796,983,132 | $ | 1,832,139,821 | 14,581,319 | $ | 91,245,455 | ||||
| Year ended September 30, 2016 | ||||||||||
| Shares sold | 1,067,594,317 | $ | 2,275,707,421 | 40,939,883 | $ | 261,734,567 | ||||
| Shares issued in reinvestment of distributions | 178,298,784 | 377,867,092 | 2,904,764 | 18,546,418 | ||||||
| Shares redeemed | (1,308,652,167 | ) | (2,761,544,103 | ) | (27,863,916 | ) | (178,141,342 | ) | ||
| Net increase (decrease) | (62,759,066 | ) | $ | (107,969,590 | ) | 15,980,731 | $ | 102,139,643 | ||
104 Semiannual Report
franklintempleton.com
FRANKLIN CUSTODIAN FUNDS
NOTES TO FINANCIAL STATEMENTS (UNAUDITED)
| Franklin Utilities | ||||||
| Fund | ||||||
| Shares | Amount | |||||
| Class A Shares: | ||||||
| Six Months ended March 31, 2017 | ||||||
| Shares sold | 17,891,761 | $ | 316,056,332 | |||
| Shares issued in reinvestment of distributions | 3,034,471 | 53,089,499 | ||||
| Shares redeemed | (33,777,246 | ) | (596,656,958 | ) | ||
| Net increase (decrease) | (12,851,014 | ) | $ | (227,511,127 | ) | |
| Year ended September 30, 2016 | ||||||
| Shares sold | 50,469,532 | $ | 868,419,143 | |||
| Shares issued in reinvestment of distributions | 13,069,421 | 208,694,820 | ||||
| Shares redeemed | (48,540,425 | ) | (827,013,167 | ) | ||
| Net increase (decrease) | 14,998,528 | $ | 250,100,796 | |||
| Class C Shares: | ||||||
| Six Months ended March 31, 2017 | ||||||
| Shares sold | 2,844,785 | $ | 50,082,327 | |||
| Shares issued in reinvestment of distributions | 605,776 | 10,543,915 | ||||
| Shares redeemed | (7,310,287 | ) | (128,642,368 | ) | ||
| Net increase (decrease) | (3,859,726 | ) | $ | (68,016,126 | ) | |
| Year ended September 30, 2016 | ||||||
| Shares sold | 10,472,053 | $ | 177,587,549 | |||
| Shares issued in reinvestment of distributions | 2,911,810 | 46,120,996 | ||||
| Shares redeemed | (11,691,443 | ) | (196,796,690 | ) | ||
| Net increase (decrease) | 1,692,420 | $ | 26,911,855 | |||
| Class R Shares: | ||||||
| Six Months ended March 31, 2017 | ||||||
| Shares sold | 1,026,515 | $ | 18,086,936 | |||
| Shares issued in reinvestment of distributions | 69,662 | 1,212,928 | ||||
| Shares redeemed | (1,551,589 | ) | (27,228,638 | ) | ||
| Net increase (decrease) | (455,412 | ) | $ | (7,928,774 | ) | |
| Year ended September 30, 2016 | ||||||
| Shares sold | 2,558,079 | $ | 44,212,218 | |||
| Shares issued in reinvestment of distributions | 307,591 | 4,887,986 | ||||
| Shares redeemed | (2,256,335 | ) | (38,262,461 | ) | ||
| Net increase (decrease) | 609,335 | $ | 10,837,743 | |||
| Class R6 Shares: | ||||||
| Six Months ended March 31, 2017 | ||||||
| Shares sold | 2,128,839 | $ | 37,891,566 | |||
| Shares issued in reinvestment of distributions | 198,101 | 3,497,098 | ||||
| Shares redeemed | (1,795,414 | ) | (32,242,713 | ) | ||
| Net increase (decrease) | 531,526 | $ | 9,145,951 | |||
| Year ended September 30, 2016 | ||||||
| Shares sold | 4,569,794 | $ | 80,441,620 | |||
| Shares issued in reinvestment of distributions | 849,533 | 13,711,334 | ||||
| Shares redeemed | (5,632,978 | ) | (99,709,050 | ) | ||
| Net increase (decrease) | (213,651 | ) | $ | (5,556,096 | ) | |
franklintempleton.com
Semiannual Report 105
FRANKLIN CUSTODIAN FUNDS
NOTES TO FINANCIAL STATEMENTS (UNAUDITED)
| 2. Shares of Beneficial Interest (continued) | |||||
| Franklin Utilities | |||||
| Fund | |||||
| Shares | Amount | ||||
| Advisor Class Shares: | |||||
| Six Months ended March 31, 2017 | |||||
| Shares sold | 11,819,019 | $ | 212,217,854 | ||
| Shares issued in reinvestment of distributions | 606,859 | 10,725,940 | |||
| Shares redeemed | (9,215,348 | ) | (163,233,905 | ) | |
| Net increase (decrease) | 3,210,530 | $ | 59,709,889 | ||
| Year ended September 30, 2016 | |||||
| Shares sold | 17,376,033 | $ | 302,116,278 | ||
| Shares issued in reinvestment of distributions | 2,161,976 | 34,915,765 | |||
| Shares redeemed | (11,446,675 | ) | (197,412,357 | ) | |
| Net increase (decrease) | 8,091,334 | $ | 139,619,686 | ||
3. Transactions with Affiliates
Franklin Resources, Inc. is the holding company for various subsidiaries that together are referred to as Franklin Templeton Investments. Certain officers and trustees of the Trust are also officers and/or directors of the following subsidiaries:
| Subsidiary | Affiliation |
| Franklin Advisers, Inc. (Advisers) | Investment manager |
| Franklin Templeton Services, LLC (FT Services) | Administrative manager |
| Franklin Templeton Distributors, Inc. (Distributors) | Principal underwriter |
| Franklin Templeton Investor Services, LLC (Investor Services) | Transfer agent |
106 Semiannual Report
franklintempleton.com
FRANKLIN CUSTODIAN FUNDS
NOTES TO FINANCIAL STATEMENTS (UNAUDITED)
a. Management Fees
Franklin Income Fund and Franklin Utilities Fund pay an investment management fee to Advisers based on the month-end net assets of each of the Funds as follows:
| Annualized Fee Rate | Net Assets | |
| 0.625 | % | Up to and including $100 million |
| 0.500 | % | Over $100 million, up to and including $250 million |
| 0.450 | % | Over $250 million, up to and including $7.5 billion |
| 0.440 | % | Over $7.5 billion, up to and including $10 billion |
| 0.430 | % | Over $10 billion, up to and including $12.5 billion |
| 0.420 | % | Over $12.5 billion, up to and including $15 billion |
| 0.400 | % | Over $15 billion, up to and including $17.5 billion |
| 0.380 | % | Over $17.5 billion, up to and including $20 billion |
| 0.360 | % | Over $20 billion, up to and including $35 billion |
| 0.355 | % | Over $35 billion, up to and including $50 billion |
| 0.350 | % | Over $50 billion, up to and including $65 billion |
| 0.345 | % | Over $65 billion, up to and including $80 billion |
| 0.340 | % | In excess of $80 billion |
Franklin DynaTech Fund, Franklin Growth Fund and Franklin U.S. Government Securities Fund pay an investment management fee to Advisers based on the month-end net assets of each of the Funds as follows:
| Annualized Fee Rate | Net Assets | |
| 0.625 | % | Up to and including $100 million |
| 0.500 | % | Over $100 million, up to and including $250 million |
| 0.450 | % | Over $250 million, up to and including $7.5 billion |
| 0.440 | % | Over $7.5 billion, up to and including $10 billion |
| 0.430 | % | Over $10 billion, up to and including $12.5 billion |
| 0.420 | % | Over $12.5 billion, up to and including $15 billion |
| 0.400 | % | Over $15 billion, up to and including $17.5 billion |
| 0.380 | % | Over $17.5 billion, up to and including $20 billion |
| 0.360 | % | Over $20 billion, up to and including $35 billion |
| 0.355 | % | Over $35 billion, up to and including $50 billion |
| 0.350 | % | In excess of $50 billion |
For the period ended March 31, 2017, each Fund’s annualized effective investment management fee rate based on average daily net assets was as follows:
| Franklin | ||||||||||
| Franklin | Franklin | Franklin | U.S. Government | Franklin | ||||||
| DynaTech Fund | Growth Fund | Income Fund | Securities Fund | Utilities Fund | ||||||
| 0.462 | % | 0.448 | % | 0.373 | % | 0.450 | % | 0.460 | % | |
| b. | Administrative Fees | |||||||||
Under an agreement with Advisers, FT Services provides administrative services to the Funds. The fee is paid by Advisers based on each of the Funds’ average daily net assets, and is not an additional expense of the Funds.
franklintempleton.com
Semiannual Report 107
FRANKLIN CUSTODIAN FUNDS
NOTES TO FINANCIAL STATEMENTS (UNAUDITED)
| 3. | Transactions with Affiliates (continued) |
| c. | Distribution Fees |
The Board has adopted distribution plans for each share class, with the exception of Class R6 and Advisor Class shares, pursuant to Rule 12b-1 under the 1940 Act. Under the Funds’ Class A reimbursement distribution plans, the Funds reimburse Distributors for costs incurred in connection with the servicing, sale and distribution of each Fund’s shares up to the maximum annual plan rate for each class. Under the Class A reimbursement distribution plans, costs exceeding the maximum for the current plan year cannot be reimbursed in subsequent periods. In addition, under the Funds’ Class C and R compensation distribution plans, the Funds pay Distributors for costs incurred in connection with the servicing, sale and distribution of each Fund’s shares up to the maximum annual plan rate for each class. The plan year, for purposes of monitoring compliance with the maximum annual plan rates, is February 1 through January 31 for each Fund.
The maximum annual plan rates, based on the average daily net assets, for each class, are as follows:
| Franklin | ||||||||||
| Franklin | Franklin | Franklin | U.S. Government | Franklin | ||||||
| DynaTech Fund | Growth Fund | Income Fund | Securities Fund | Utilities Fund | ||||||
| Reimbursement Plans: | ||||||||||
| Class A | 0.25 | % | 0.25 | % | 0.15 | % | 0.15 | % | 0.15 | % |
| Compensation Plans: | ||||||||||
| Class C | 1.00 | % | 1.00 | % | 0.65 | % | 0.65 | % | 0.65 | % |
| Class R | 0.50 | % | 0.50 | % | 0.50 | % | 0.50 | % | 0.50 | % |
d. Sales Charges/Underwriting Agreements
Front-end sales charges and contingent deferred sales charges (CDSC) do not represent expenses of the Funds. These charges are deducted from the proceeds of sales of fund shares prior to investment or from redemption proceeds prior to remittance, as applicable. Distributors has advised the Funds of the following commission transactions related to the sales and redemptions of the Funds’ shares for the period:
| Franklin | ||||||||||
| Franklin | Franklin | Franklin | U.S. Government | Franklin | ||||||
| DynaTech Fund | Growth Fund | Income Fund | Securities Fund | Utilities Fund | ||||||
| Sales charges retained net of | ||||||||||
| commissions paid to | ||||||||||
| unaffiliated brokers/dealers . | $ | 380,035 | $ | 1,017,655 | $ | 6,292,800 | $ | 370,084 | $ | 377,704 |
| CDSC retained. | $ | 35,130 | $ | 62,364 | $ | 634,113 | $ | 84,690 | $ | 34,742 |
e. Transfer Agent Fees
Each class of shares, except for Class R6, pays transfer agent fees to Investor Services for its performance of shareholder servicing obligations and reimburses Investor Services for out of pocket expenses incurred, including shareholder servicing fees paid to third parties. These fees are allocated daily based upon their relative proportion of such classes’ aggregate net assets. Class R6 pays Investor Services transfer agent fees specific to that class.
For the period ended March 31, 2017, the Funds paid transfer agent fees as noted in the Statements of Operations of which the following amounts were retained by Investor Services:
| Franklin | ||||||||||
| Franklin | Franklin | Franklin | U.S. Government | Franklin | ||||||
| DynaTech Fund | Growth Fund | Income Fund | Securities Fund | Utilities Fund | ||||||
| Transfer agent fees. | $ | 952,842 | $ | 3,602,159 | $ | 10,481,310 | $ | 1,945,479 | $ | 1,388,098 |
108 Semiannual Report
franklintempleton.com
FRANKLIN CUSTODIAN FUNDS
NOTES TO FINANCIAL STATEMENTS (UNAUDITED)
f. Investments in Affiliated Management Investment Companies
Certain or all Funds invest in one or more affiliated management investment companies for purposes other than exercising a controlling influence over the management or policies. Management fees paid by the Funds are waived on assets invested in the affiliated management investment companies, as noted in the Statements of Operations, in an amount not to exceed the management and administrative fees paid directly or indirectly by each affiliate. Prior to October 1, 2013, the waiver was accounted for as a reduction to management fees. During the period ended March 31, 2017, investments in affiliated management investment companies were as follows:
| % of | ||||||||||||
| Affiliated | ||||||||||||
| Number of | Number of | Fund Shares | ||||||||||
| Shares Held | Shares | Value | Outstanding | |||||||||
| at Beginning | Gross | Gross | Held at End | at End | Investment | Realized | Held at End | |||||
| of Period | Additions | Reductions | of Period | of Period | Income | Gain (Loss) | of Period | |||||
| Non-Controlled Affiliates | ||||||||||||
| Franklin DynaTech Fund | ||||||||||||
| Institutional | ||||||||||||
| Fiduciary Trust | ||||||||||||
| Money Market | ||||||||||||
| Portfolio, 0.32% | 17,719,400 | 263,802,853 | (191,499,912 | ) | 90,022,341 | $ | 90,022,341 | $ | 24,484 | $– | 0.4 | % |
| Franklin Growth Fund | ||||||||||||
| Institutional | ||||||||||||
| Fiduciary Trust | ||||||||||||
| Money Market | ||||||||||||
| Portfolio, 0.32% | 856,457,573 | 355,421,383 | (782,255,434 | ) | 429,623,522 | $ | 429,623,522 | $ | 216,262 | $– | 2.0 | % |
| Franklin Income Fund | ||||||||||||
| Institutional | ||||||||||||
| Fiduciary Trust | ||||||||||||
| Money Market | ||||||||||||
| Portfolio, 0.32% | 1,087,361,640 | 8,799,968,610 | (7,066,437,282 | ) | 2,820,892,968 | $ | 2,820,892,968 | $ | 910,394 | $– | 13.3 | % |
| Franklin U.S. Government | ||||||||||||
| Securities Fund | ||||||||||||
| Institutional | ||||||||||||
| Fiduciary Trust | ||||||||||||
| Money Market | ||||||||||||
| Portfolio, 0.32% | 100,549,302 | 575,677,307 | (606,856,727 | ) | 69,369,882 | $ | 69,369,882 | $ | 35,162 | $– | 0.3 | % |
| Franklin Utilities Fund | ||||||||||||
| Institutional | ||||||||||||
| Fiduciary Trust | ||||||||||||
| Money Market | ||||||||||||
| Portfolio, 0.32% | 35,157,723 | 238,339,176 | (203,157,527 | ) | 70,339,372 | $ | 70,339,372 | $ | 16,198 | $– | 0.3 | % |
| g. Waiver and Expense Reimbursements | ||||||||||||
Investor Services has contractually agreed in advance to waive or limit its fees so that the Class R6 transfer agent fees do not exceed 0.01% until January 31, 2018. There were no Class R6 transfer agent fees waived during the period ended March 31, 2017.
h. Other Affiliated Transactions
At March 31, 2017, one or more of the funds in Franklin Fund Allocator Series owned a percentage of the following Funds’ outstanding shares:
| Franklin | |||||||||
| Franklin | Franklin | Franklin | U.S. Government | Franklin | |||||
| DynaTech Fund | Growth Fund | Income Fund | Securities Fund | Utilities Fund | |||||
| 11.7 | % | 7.7 | % | 2.0 | % | 5.7 | % | 2.6 | % |
franklintempleton.com
Semiannual Report 109
FRANKLIN CUSTODIAN FUNDS
NOTES TO FINANCIAL STATEMENTS (UNAUDITED)
3. Transactions with Affiliates (continued)
i. Interfund Transactions
Franklin Income Fund engaged in purchases and sales of investments with funds or other accounts that have common investment managers (or affiliated investment managers), directors, trustees or officers. During the period ended March 31, 2017, the purchase and sale transactions aggregated $12,745,008 and $0, respectively.
4. Expense Offset Arrangement
The Funds have entered into an arrangement with their custodian whereby credits realized as a result of uninvested cash balances are used to reduce a portion of the Funds’ custodian expenses. During the period ended March 31, 2017, the custodian fees were reduced as noted in the Statements of Operations.
5. Income Taxes
For tax purposes, capital losses may be carried over to offset future capital gains. Capital loss carryforwards with no expiration, if any, must be fully utilized before those losses with expiration dates.
At September 30, 2016, the capital loss carryforwards were as follows:
| Franklin | ||||
| Franklin | U.S. Government | |||
| Income Fund | Securities Fund | |||
| Capital loss carryforwards subject to expiration: | ||||
| 2017 | $ | — | $ | 18,668,917 |
| 2018 | 2,298,838,256 | 16,923,310 | ||
| 2019 | — | 4,445,156 | ||
| Capital loss carryforwards not subject to expiration: | ||||
| Short term | 2,026,929,166 | 123,119,594 | ||
| Long term | 2,197,385,271 | 264,701,909 | ||
| Total capital loss carryforwards. | $ | 6,523,152,693 | $ | 427,858,886 |
For tax purposes, the Funds may elect to defer any portion of a post-October capital loss or late-year ordinary loss to the first day of the following fiscal year. At September 30, 2016, Franklin Utilities Fund deferred post-October capital losses of $971,183, and Franklin DynaTech Fund and Franklin Income Fund deferred late-year ordinary losses of $7,486,840 and $14,041,004, respectively.
At March 31, 2017, the cost of investments and net unrealized appreciation (depreciation) for income tax purposes were as follows:
| Franklin | Franklin | Franklin | |||||||
| DynaTech Fund | Growth Fund | Income Fund | |||||||
| Cost of investments | $ | 1,852,967,419 | $ | 5,644,959,068 | $ | 78,186,535,618 | |||
| Unrealized appreciation | $ | 1,451,950,144 | $ | 7,265,360,989 | $ | 8,291,305,712 | |||
| Unrealized depreciation | (4,233,457 | ) | (84,762,047 | ) | (3,622,959,502 | ) | |||
| Net unrealized appreciation (depreciation) | $ | 1,447,716,687 | $ | 7,180,598,942 | $ | 4,668,346,210 | |||
110 Semiannual Report
franklintempleton.com
FRANKLIN CUSTODIAN FUNDS
NOTES TO FINANCIAL STATEMENTS (UNAUDITED)
| Franklin | ||||||
| U.S. Government | Franklin | |||||
| Securities Fund | Utilities Fund | |||||
| Cost of investments | $ | 5,869,231,788 | $ | 3,652,455,263 | ||
| Unrealized appreciation | $ | 152,046,756 | $ | 2,756,816,137 | ||
| Unrealized depreciation | (49,969,802 | ) | (50,269,915 | ) | ||
| Net unrealized appreciation (depreciation) | $ | 102,076,954 | $ | 2,706,546,222 | ||
Differences between income and/or capital gains as determined on a book basis and a tax basis are primarily due to differing treatments of paydown losses, bond discounts and premiums, corporate actions, equity-linked securities and wash sales.
6. Investment Transactions
Purchases and sales of investments (excluding short term securities) for the period ended March 31, 2017, were as follows:
| Franklin | ||||||||||||
| Franklin | Franklin | Franklin | U.S. Government | Franklin | ||||||||
| DynaTech Fund | Growth Fund | Income Fund | Securities Fund | Utilities Fund | ||||||||
| Purchases | $ | 390,529,161 | $ | 320,199,960 | $ | 15,661,269,702 | $ | 2,746,627,570 | $ | 20,772,691 | ||
| Sales | $ | 443,203,814 | $ | 389,593,373 | $ | 18,561,976,567 | $ | 3,223,195,001 | $ | 302,765,287 | ||
| Transactions in options written during the period ended March 31, 2017, were as follows: | ||||||||||||
| Number of | Premiums | |||||||||||
| Contracts | Received | |||||||||||
| Franklin Income Fund | ||||||||||||
| Options outstanding at September 30, 2016 | 35,000 | $ | 10,304,692 | |||||||||
| Options written | 523,238 | 65,269,827 | ||||||||||
| Options expired | (116,639 | ) | (9,654,430 | ) | ||||||||
| Options exercised | (94,861 | ) | (14,684,416 | ) | ||||||||
| Options closed | (85,000 | ) | (29,622,684 | ) | ||||||||
| Options outstanding at March 31, 2017 | 261,738 | $ | 21,612,989 | |||||||||
See Notes 1(e) and 10 regarding derivative financial instruments and other derivative information, respectively.
At March 31, 2017, in connection with securities lending transactions, Franklin Income Fund loaned corporate bonds and notes and received $77,391,070 of cash collateral. The gross amount of recognized liability for such transactions is included in payable upon return of securities loaned in the Statement of Assets and Liabilities. The agreements can be terminated at any time.
7. Credit Risk
At March 31, 2017, Franklin Income Fund had 35.6% of its portfolio invested in high yield securities, senior secured floating rate notes, or other securities rated below investment grade and unrated securities, if any. These securities may be more sensitive to economic conditions causing greater price volatility and are potentially subject to a greater risk of loss due to default than higher rated securities.
franklintempleton.com
Semiannual Report 111
FRANKLIN CUSTODIAN FUNDS
NOTES TO FINANCIAL STATEMENTS (UNAUDITED)
8. Restricted Securities
Certain or all Funds invest in securities that are restricted under the Securities Act of 1933 (1933 Act) or which are subject to legal, contractual, or other agreed upon restrictions on resale. Restricted securities are often purchased in private placement transactions, and cannot be sold without prior registration unless the sale is pursuant to an exemption under the 1933 Act. Disposal of these securities may require greater effort and expense, and prompt sale at an acceptable price may be difficult. The Funds may have registration rights for restricted securities. The issuer generally incurs all registration costs.
At March 31, 2017, investments in restricted securities, excluding certain securities exempt from registration under the 1933 Act deemed to be liquid, were as follows:
| Acquisition | |||||
| Shares Issuer | Date | Cost | Value | ||
| Franklin Income Fund | |||||
| 28,306,773 a Halcon Resources Corp. (Value is 0.3% of Net Assets) | 6/29/12 - 10/23/15 | $ | 383,820,185 | $ | 213,895,771 |
| aThe Fund also invests in unrestricted securities or other investments in the issuer, valued at $ 95,739,000 as of March 31, 2017. | |||||
9. Unfunded Loan Commitments
Certain or all Funds enter into certain credit agreements, all or a portion of which may be unfunded. The Funds are obligated to fund these loan commitments at the borrowers’ discretion. Unfunded loan commitments and funded portions of credit agreements are marked to market daily and any unrealized appreciation or depreciation is included in the Statements of Assets and Liabilities and the Statements of Operations. Funded portions of credit agreements are presented in the Statements of Investments.
| At March 31, 2017, unfunded commitments were as follows: | ||
| Unfunded | ||
| Borrower | Commitment | |
| Franklin Income Fund | ||
| American Axle & Manufacturing, Inc., Initial Loan Bridge | $ | 80,000,000 |
| Avantor Performance Materials Holdings, Inc, 2nd Lien Delayed Draw Term | ||
| Loan | 884,211 | |
| Avantor Performance Materials Holdings, Inc, Delayed Draw Term Loan | 2,020,202 | |
| PetroQuest Energy, Inc., Multidraw Term Loan Facility | 20,000,000 | |
| $ | 102,904,413 | |
10. Other Derivative Information
At March 31, 2017, Franklin Income Fund’s investments in derivative contracts are reflected in the Statements of Assets and Liabilities as follows:
| Asset Derivatives | Liability Derivatives | ||||||
| Derivative Contracts | Statement of | Statement of | |||||
| Not Accounted for as | Assets and Liabilities | Assets and Liabilities | |||||
| Hedging Instruments | Location | Fair Value | Location | Fair Value | |||
| Equity contracts. | Investments in securities, at | $ | 75,600,000 | a | Options written, at value | $ | 14,229,630 |
| value | |||||||
| aPurchased option contracts are included in investments in securities, at value in the Statements of Assets and Liabilities. | |||||||
112 Semiannual Report
franklintempleton.com
FRANKLIN CUSTODIAN FUNDS
NOTES TO FINANCIAL STATEMENTS (UNAUDITED)
For the period ended March 31, 2017, the effect of derivative contracts in Franklin Income Fund’s Statements of Operations was as follows:
| Net Change in | |||||||
| Unrealized | |||||||
| Derivative Contracts | Net Realized | Appreciation | |||||
| Not Accounted for as | Statement of | Gain (Loss) for | Statement of | (Depreciation) | |||
| Hedging Instruments | Operations Locations | the Period | Operations Locations | for the Period | |||
| Net realized gain (loss) from: | Net change in unrealized | ||||||
| appreciation (depreciation) on: | |||||||
| Equity contracts | Investments | $ | —a | Investments | $ | 12,030,397 | a |
| Written options | 33,142,894 | Written options | (1,186,333 | ) | |||
| Totals | $ | 33,142,894 | $ | 10,844,064 | |||
aPurchased option contracts are included in net realized gain (loss) from investments and net change in unrealized appreciation (depreciation) on investments in the Statements of Operations.
For the period ended March 31, 2017, the average month end fair value of derivatives represented less than 0.1% of average month end net assets. The average month end number of open derivatives contracts for the period was 8.
See Note 1(e) and 6 regarding derivative financial instruments and investment transactions, respectively.
11. Holdings of 5% Voting Securities of Portfolio Companies
The 1940 Act defines "affiliated companies" to include investments in portfolio companies in which a fund owns 5% or more of the outstanding voting securities. During the period ended March 31, 2017, investments in “affiliated companies” were as follows:
| Number of | Number of | |||||||||||
| Shares/ | Shares/ | |||||||||||
| Principal | Principal | |||||||||||
| Amount* | Amount* | |||||||||||
| Held at | Held at | |||||||||||
| Beginning | Gross | Gross | End | Value at | Investment | Realized | ||||||
| Name of Issuer | of Period | Additions | Reductions | of Period | End of Period | Income | Gain (Loss) | |||||
| Franklin Income Fund | ||||||||||||
| Non-Controlled Affiliates | ||||||||||||
| CEVA Holdings LLC | 91,371 | — | — | 91,371 | $ | 18,274,212 | $ | — | $ | — | ||
| CEVA Holdings LLC, cvt. | ||||||||||||
| pfd., A-1 | 2,897 | — | — | 2,897 | 1,014,038 | — | — | |||||
| CEVA Holdings LLC, cvt. | ||||||||||||
| pfd., A-2 | 110,565 | — | — | 110,565 | 27,641,270 | — | — | |||||
| Energy XXI Gulf Coast Inc . | — | 7,259,184 | a | — | 7,259,184 | 217,557,744 | — | — | ||||
| Goodrich Petroleum Corp | — | 2,303,000 | a | 42,141 | 2,260,859 | 31,821,590 | — | 215,729 | ||||
| Halcon Resources Corp | 28,306,773 | — | — | 28,306,773 | 213,895,771 | — | — | |||||
| Halcon Resources Corp., | ||||||||||||
| senior note, 144A, 6.75%, | ||||||||||||
| 2/15/25 | — | 97,000,000 | — | 97,000,000 | 95,739,000 | 1,024,313 | — | |||||
| Halcon Resources Corp., | ||||||||||||
| secured note, second lien, | ||||||||||||
| 144A, 8.625%, 2/01/20 | 190,000,000 | — | 190,000,000 | a | — | — | 7,693,021 | 25,380,040 | ||||
| PetroQuest Energy Inc | 1,283,318 | — | 620,032 | 663,286 | —b | — | 197,371 | |||||
| PetroQuest Energy Inc., | ||||||||||||
| secured note, second lien, | ||||||||||||
| 144A, PIK, 10.00%, | ||||||||||||
| 2/15/21 | 58,725,000 | 2,026,012 | — | 60,751,012 | —b | — | — | |||||
| Rex Energy Corp | 2,520,000 | — | — | 2,520,000 | —b | — | — | |||||
| Rex Energy Corp | 6,194,262 | — | 6,194,262 | — | — | — | 411,262 | |||||
franklintempleton.com
Semiannual Report 113
FRANKLIN CUSTODIAN FUNDS
NOTES TO FINANCIAL STATEMENTS (UNAUDITED)
| 11. | Holdings of 5% Voting Securities of Portfolio Companies (continued) |
| Number of | Number of | |||||||||||
| Shares/ | Shares/ | |||||||||||
| Principal | Principal | |||||||||||
| Amount* | Amount* | |||||||||||
| Held at | Held at | |||||||||||
| Beginning | Gross | Gross | End | Value at | Investment | Realized | ||||||
| Name of Issuer | of Period | Additions | Reductions | of Period | End of Period | Income | Gain (Loss) | |||||
| Franklin Income Fund (continued) | ||||||||||||
| Non-Controlled Affiliates (continued) | ||||||||||||
| Rex Energy Corp., second | ||||||||||||
| lien, 1.00% to 10/01/17, | ||||||||||||
| 8.00% thereafter, 10/01/20 . 110,000,000 | — | 1,000,000 | 109,000,000 | $ | —b | $ | — | $ | 385,809 | |||
| Stone Energy Corp | — | 6,151,402 | a | — | 6,151,402 | 134,346,620 | — | — | ||||
| Stone Energy Corp., senior | ||||||||||||
| note, 7.50%, 5/31/22 | — | 72,845,556 | a | — | 72,845,556 | 71,388,645 | 455,285 | — | ||||
| W&T Offshore Inc | 28,041,726 | — | 1,888,726 | 26,153,000 | 72,443,810 | — | (4,320,789 | ) | ||||
| W&T Offshore Inc., Second | ||||||||||||
| Lien Term Loan, 9.00%, | ||||||||||||
| 5/15/20 | 151,850,000 | 10,000,000 | — | 161,850,000 | 145,665,000 | 6,861,829 | — | |||||
| W&T Offshore Inc., second | ||||||||||||
| lien, 144A, PIK, 10.75%, | ||||||||||||
| 5/15/20 | 74,140,000 | 1,505,453 | — | 75,645,453 | 62,879,702 | 2,553,615 | — | |||||
| W&T Offshore Inc., senior | ||||||||||||
| secured, 1.5 lien Term | ||||||||||||
| Loan, 11.00%, 11/15/19 | 75,000,000 | — | — | 75,000,000 | 77,262,000 | 4,108,017 | — | |||||
| W&T Offshore Inc., senior | ||||||||||||
| secured note, third lien, | ||||||||||||
| 144A, PIK, 10.00%, | ||||||||||||
| 6/15/21 | 65,903,000 | 1,794,026 | — | 67,697,026 | 50,635,768 | 1,490,942 | — | |||||
| Total Affiliated Securities (Value is 1.5% of Net Assets) | $ | 1,220,565,170 | $ | 24,187,022 | $ | 22,269,422 | ||||||
*In U.S. dollars unless otherwise indicated.
aGross addition/reduction was the result of various corporate actions.
bAs of March 31, 2017, no longer an affiliate.
12. Credit Facility
The Funds, together with other U.S. registered and foreign investment funds (collectively, Borrowers), managed by Franklin Templeton Investments, are borrowers in a joint syndicated senior unsecured credit facility totaling $2 billion (Global Credit Facility) which matures on February 9, 2018. This Global Credit Facility provides a source of funds to the Borrowers for temporary and emergency purposes, including the ability to meet future unanticipated or unusually large redemption requests.
Under the terms of the Global Credit Facility, the Funds shall, in addition to interest charged on any borrowings made by the Funds and other costs incurred by the Funds, pay their share of fees and expenses incurred in connection with the implementation and maintenance of the Global Credit Facility, based upon their relative share of the aggregate net assets of all of the Borrowers, including an annual commitment fee of 0.15% based upon the unused portion of the Global Credit Facility. These fees are reflected in other expenses in the Statements of Operations. During the period ended March 31, 2017, the Funds did not use the Global Credit Facility.
114 Semiannual Report
franklintempleton.com
FRANKLIN CUSTODIAN FUNDS
NOTES TO FINANCIAL STATEMENTS (UNAUDITED)
13. Fair Value Measurements
The Funds follows a fair value hierarchy that distinguishes between market data obtained from independent sources (observable inputs) and the Funds’ own market assumptions (unobservable inputs). These inputs are used in determining the value of the Funds’ financial instruments and are summarized in the following fair value hierarchy:
- Level 1 – quoted prices in active markets for identical financial instruments
- Level 2 – other significant observable inputs (including quoted prices for similar financial instruments, interest rates, prepayment speed, credit risk, etc.)
- Level 3 – significant unobservable inputs (including the Funds’ own assumptions in determining the fair value of financial instruments)
The input levels are not necessarily an indication of the risk or liquidity associated with financial instruments at that level.
For movements between the levels within the fair value hierarchy, the Funds have adopted a policy of recognizing the transfers as of the date of the underlying event which caused the movement.
A summary of inputs used as of March 31, 2017, in valuing the Funds’ assets and liabilities carried at fair value, is as follows:
| Level 1 | Level 2 | Level 3 | Total | |||||
| Franklin DynaTech Fund | ||||||||
| Assets: | ||||||||
| Investments in Securities: | ||||||||
| Equity Investmentsa | $ | 3,210,661,765 | $ | — | $ | — | $ | 3,210,661,765 |
| Short Term Investments | 90,022,341 | — | — | 90,022,341 | ||||
| Total Investments in Securities | $ | 3,300,684,106 | $ | — | $ | — | $ | 3,300,684,106 |
| Franklin Growth Fund | ||||||||
| Assets: | ||||||||
| Investments in Securities: | ||||||||
| Equity Investmentsa | $ | 12,395,934,488 | $ | — | $ | — | $ | 12,395,934,488 |
| Short Term Investments | 429,623,522 | — | — | 429,623,522 | ||||
| Total Investments in Securities | $ | 12,825,558,010 | $ | — | $ | — | $ | 12,825,558,010 |
| Franklin Income Fund | ||||||||
| Assets: | ||||||||
| Investments in Securities: | ||||||||
| Equity Investments:b | ||||||||
| Energy. | $ | 5,825,221,090 | $ | — | $ | 213,895,771 | $ | 6,039,116,861 |
| Financials | 5,074,772,325 | 97,962,500 | — | 5,172,734,825 | ||||
| Industrials | 2,620,491,144 | 46,929,520 | — | 2,667,420,664 | ||||
| All Other Equity Investmentsa | 20,983,569,658 | — | — | 20,983,569,658 | ||||
| Equity-Linked Securities | — | 10,491,742,658 | — | 10,491,742,658 | ||||
| Convertible Bonds | — | 694,660,284 | — | 694,660,284 | ||||
| Corporate Bonds | — | 30,048,232,750 | — | 30,048,232,750 | ||||
| Senior Floating Rate Interests | — | 3,270,409,140 | — | 3,270,409,140 | ||||
| Escrows and Litigation Trusts | — | — | —c | — | ||||
| Options Purchased | 75,600,000 | — | — | 75,600,000 | ||||
| Short Term Investments | 3,320,647,868 | 90,747,120 | — | 3,411,394,988 | ||||
| Total Investments in Securities | $ | 37,900,302,085 | $ | 44,740,683,972 | $ | 213,895,771 | $ | 82,854,881,828 |
| Other Financial Instruments: | ||||||||
| Unfunded Loan Commitments. | $ | — | $ | 134,834 | $ | — | $ | 134,834 |
franklintempleton.com
Semiannual Report 115
FRANKLIN CUSTODIAN FUNDS
NOTES TO FINANCIAL STATEMENTS (UNAUDITED)
| 13. Fair Value Measurements (continued) | ||||||||
| Level 1 | Level 2 | Level 3 | Total | |||||
| Liabilities: | ||||||||
| Other Financial Instruments: | ||||||||
| Options Written | $ | 14,229,630 | $ | — | $ | — | $ | 14,229,630 |
| Franklin U.S. Government Securities Fund | ||||||||
| Assets: | ||||||||
| Investments in Securities: | ||||||||
| Mortgage-Backed Securities | $ | — | $ | 5,901,938,860 | $ | — | $ | 5,901,938,860 |
| Short Term Investments | 69,369,882 | — | — | 69,369,882 | ||||
| Total Investments in Securities | $ | 69,369,882 | $ | 5,901,938,860 | $ | — | $ | 5,971,308,742 |
| Franklin Utilities Fund | ||||||||
| Assets: | ||||||||
| Investments in Securities: | ||||||||
| Equity Investmentsa | $ | 6,238,681,553 | $ | — | $ | — | $ | 6,238,681,553 |
| Corporate Bonds | — | 49,980,560 | — | 49,980,560 | ||||
| Short Term Investments | 70,339,372 | — | — | 70,339,372 | ||||
| Total Investments in Securities | $ | 6,309,020,925 | $ | 49,980,560 | $ | — | $ | 6,359,001,485 |
aFor detailed categories, see the accompanying Statement of Investments.
bIncludes common, preferred and convertible preferred stocks as well as other equity investments.
cIncludes securities determined to have no value at March 31, 2017.
A reconciliation of assets in which Level 3 inputs are used in determining fair value is presented when there are significant Level 3 financial instruments at the end of the period.
14. New Accounting Pronouncements
In March 2017, the Financial Accounting Standards Board (FASB) issued Accounting Standards Update (ASU) No. 2017-08, Receivables—Nonrefundable Fees and Other Costs (Subtopic 310-20): Premium Amortization on Purchased Callable Debt Securities. The amendments in the ASU shorten the amortization period for certain callable debt securities, held at a premium, to be amortized to the earliest call date. The ASU does not require an accounting change for securities held at a discount; which continues to be amortized to maturity. The ASU is effective for fiscal years and interim periods within those fiscal years beginning after December 15, 2018. Management is currently evaluating the impact, if any, of applying this provision.
15. Investment Company Reporting Modernization
In October 2016, the U.S. Securities and Exchange Commission adopted new rules and amended existing rules (together, final rules) intended to modernize the reporting and disclosure of information by registered investment companies. In part, the final rules amend Regulation S-X and require standardized, enhanced disclosures about derivatives in investment company financial statements, as well as other amendments. The compliance date for the amendments to Regulation S-X is August 1, 2017. Management is currently evaluating the impact that the adoption of the amendments to Regulation S-X will have on the Funds’ financial statements and related disclosures.
16. Subsequent Events
The Funds have evaluated subsequent events through the issuance of the financial statements and determined that no events have occurred that require disclosure.
116 Semiannual Report
franklintempleton.com
FRANKLIN CUSTODIAN FUNDS
NOTES TO FINANCIAL STATEMENTS (UNAUDITED)
| Abbreviations | |||
| Currency | Selected Portfolio | ||
| CAD | Canadian Dollar | ADR | American Depositary Receipt |
| EUR | Euro | FHLB | Federal Home Loan Bank |
| GBP | British Pound | FHLMC | Federal Home Loan Mortgage Corp. |
| USD | United States Dollar | FNMA | Federal National Mortgage Association |
| FRN | Floating Rate Note | ||
| GP | Graduated Payment | ||
| L/C | Letter of Credit | ||
| PIK | Payment-In-Kind | ||
| SF | Single Family | ||
franklintempleton.com
Semiannual Report 117
FRANKLIN CUSTODIAN FUNDS
Shareholder Information
Board Approval of Investment Management
Agreements
FRANKLIN CUSTODIAN FUNDS
Franklin DynaTech Fund
Franklin Growth Fund
Franklin Income Fund
Franklin U.S. Government Securities Fund
Franklin Utilities Fund
(each a Fund)
At an in-person meeting held on February 28, 2017 (Meeting), the Board of Trustees (Board) of Franklin Custodian Funds, including a majority of the trustees who are not “interested persons” as defined in the Investment Company Act of 1940 (Independent Trustees), reviewed and approved the continuance of the investment management agreement between Franklin Advisers, Inc. (Manager) and each Fund (each a Management Agreement) for an additional one-year period. The Independent Trustees received advice from and met separately with Independent Trustee counsel in considering whether to approve the continuation of each Management Agreement. Although the Management Agreements for the Funds were considered at the same Board meeting, the Board considered the information provided to it about the Funds together and with respect to each Fund separately as the Board deemed appropriate.
In considering the continuation of each Management Agreement, the Board reviewed and considered information provided by the Manager at the Meeting and throughout the year at meetings of the Board and its committees. The Board also reviewed and considered information provided in response to a detailed set of requests for information submitted to the Manager by Independent Trustee counsel on behalf of the Independent Trustees in connection with the annual contract renewal process. In addition, prior to the Meeting, the Independent Trustees held a telephonic contract renewal meeting at which the Independent Trustees conferred amongst themselves and Independent Trustee counsel about contract renewal matters. The Board reviewed and considered all of the factors it deemed relevant in approving the continuance of each Management Agreement, including, but not limited to: (i) the nature, extent, and quality of the services provided by the Manager; (ii) the investment performance of each Fund; (iii) the costs of the services provided and profits realized by the Manager and its affiliates from the relationship with each Fund; (iv) the extent to which economies of scale are realized as each Fund grows; and (v) whether fee levels reflect these economies of scale for the benefit of Fund investors.
In approving the continuance of each Management Agreement, the Board, including a majority of the Independent Trustees, determined that the existing management fees are fair and reasonable and that the continuance of such Management Agreement is in the interests of the applicable Fund and its shareholders. While attention was given to all information furnished, the following discusses some primary factors relevant to the Board’s determination.
Nature, Extent and Quality of Services
The Board reviewed and considered information regarding the nature, extent and quality of investment management services provided by the Manager and its affiliates to the Funds and their shareholders. This information included, among other things, the qualifications, background and experience of the senior management and investment personnel of the Manager; the structure of investment personnel compensation; oversight of third-party service providers; investment performance reports and related financial information for each Fund; reports on expenses, shareholder services, marketing support payments made to financial intermediaries and third party servicing arrangements; legal and compliance matters; risk controls; pricing and other services provided by the Manager and its affiliates; and management fees charged by the Manager and its affiliates to U.S. funds and other accounts, including management’s explanation of differences among accounts where relevant. The Board noted management’s continual efforts and expenditures in establishing effective business continuity plans and developing strategies to address areas of heightened concern in the mutual fund industry, such as cybersecurity, derivatives and liquidity risk management.
The Board also reviewed and considered the benefits provided to Fund shareholders of investing in a fund that is part of the Franklin Templeton family of funds. The Board noted the financial position of Franklin Resources, Inc. (FRI), the Manager’s parent, and its commitment to the mutual fund business as evidenced by its continued introduction of new funds, reassessment of the fund offerings in response to the market environment and project initiatives and capital investments relating to the services provided to the Funds by the Franklin Templeton Investments (FTI) organization.
Following consideration of such information, the Board was satisfied with the nature, extent and quality of services provided by the Manager and its affiliates to the Funds and their shareholders.
118 Semiannual Report franklintempleton.com
FRANKLIN CUSTODIAN FUNDS
SHAREHOLDER INFORMATION
Fund Performance
The Board reviewed and considered the performance results of each Fund over various time periods ended December 31, 2016. The Board considered the performance returns for each Fund in comparison to the performance returns of mutual funds deemed comparable to the Fund included in a universe (Performance Universe) selected by Broadridge Financial Solutions, Inc. (Broadridge), an independent provider of investment company data. The Board received a description of the methodology used by Broadridge to select the mutual funds included in a Performance Universe. The Board also reviewed and considered Fund performance reports provided and discussions that occurred with portfolio managers at Board meetings throughout the year. A summary of each Fund’s performance results is below.
Franklin DynaTech Fund - The Performance Universe for this Fund included the Fund and all retail and institutional multi-cap growth funds. The Board noted that the Fund’s annualized total return for the one-year period was below the median of its Performance Universe, but for the three-, five- and 10-year periods was above the median of its Performance Universe. The Board concluded that the Fund’s performance was satisfactory.
Franklin Growth Fund - The Performance Universe for this Fund included the Fund and all retail and institutional multi-cap core funds. The Board noted that the Fund’s annualized total return for the one- and five-year periods was below the median of its Performance Universe, but for the three- and 10-year periods was above the median of its Performance Universe. Observing that, although the performance was below the median of its Performance Universe in the one- and five-year periods, it was above 8.0% and 13.0%, respectively, during these periods. The Board concluded that the Fund’s performance was satisfactory.
Franklin Income Fund - The Performance Universe for this Fund included the Fund and all retail and institutional mixed-asset target allocation moderate funds. The Board noted that the Fund’s annualized income return and annualized total return for the one-, three-, five- and 10-year periods were above the medians of its Performance Universe. The Board concluded that the Fund’s performance was satisfactory.
Franklin U.S. Government Securities Fund - The Performance Universe for this Fund included the Fund and all retail and institutional Government National Mortgage Association (Ginnie Mae) funds. The Board noted that the Fund’s annualized income return for the one-, three-, five- and 10-year periods was above the median of its Performance Universe. The Board also noted that the Fund’s annualized total return for the one-, three-, five- and 10-year periods was below the median of its Performance Universe. Given the Fund’s income-oriented investment objective and conservative policy of investing substantially all of its assets in Ginnie Mae obligations, the Board concluded that the Fund’s performance was acceptable.
Franklin Utilities Fund - The Performance Universe for this Fund included the Fund and all retail and institutional utility funds. The Board noted that the Fund’s annualized income return and annualized total return for the one-, three-, five- and 10-year periods were above the medians of its Performance Universe. The Board concluded that the Fund’s performance was satisfactory.
Comparative Fees and Expenses
The Board reviewed and considered information regarding each Fund’s actual total expense ratio and its various components, including, as applicable, management fees; transfer agent expenses; underlying fund expenses; Rule 12b-1 and non-Rule 12b-1 service fees; and other non-management fees. The Board also noted that at its February meeting each year, it receives an annual report on all marketing support payments made by FTI to financial intermediaries. The Board considered the actual total expense ratio and, separately, the contractual management fee rate, without the effect of fee waivers, if any (Management Rate) of each Fund in comparison to the median ratio and median Management Rate, respectively, of other mutual funds deemed comparable to and with a similar expense structure as the Fund selected by Broadridge (Expense Group). Broadridge fee and expense data is based upon information taken from each fund’s most recent annual report, which reflects historical asset levels that may be quite different from those currently existing, particularly in a period of market volatility. While recognizing such inherent limitation and the fact that expense ratios and Management Rates generally increase as assets decline and decrease as assets grow, the Board believed the independent analysis conducted by Broadridge to be an appropriate measure of comparative fees and expenses. The Broadridge Management Rate includes administrative charges, and the actual total expense ratio, for comparative consistency, was shown for Class A shares for funds with multiple classes of shares. The Board received a description of the methodology used by Broadridge to select the mutual funds included in an Expense Group.
Franklin DynaTech Fund, Franklin Growth Fund, Franklin Income Fund and Franklin Utilities Fund - The Expense Group for the Franklin DynaTech Fund included the Fund and 13
franklintempleton.com
Semiannual Report 119
FRANKLIN CUSTODIAN FUNDS
SHAREHOLDER INFORMATION
other multi-cap growth funds. The Expense Group for the Franklin Growth Fund included the Fund and 10 other multi-cap core funds. The Expense Group for the Franklin Income Fund included the Fund and seven other mixed-asset target allocation moderate funds. The Expense Group for the Franklin Utilities Fund included the Fund and six other utility funds. The Board noted that the Management Rates and actual total expense ratios for these Funds were below the medians of their respective Expense Groups. The Board concluded that the Management Rates charged to these Funds are fair and reasonable.
Franklin U.S. Government Securities Fund - The Expense Group for the Fund included the Fund, five other GNMA funds and four U.S. mortgage funds. The Board noted that the Management Rate for the Fund was above the median of its Expense Group, but its actual total expense ratio was below the median of its Expense Group. The Board also noted that the Management Rate had declined over time due to breakpoints in the fee schedule and concluded that such rate charged to the Fund is fair and reasonable.
Profitability
The Board reviewed and considered information regarding the profits realized by the Manager and its affiliates in connection with the operation of each Fund. In this respect, the Board considered the Fund profitability analysis provided by the Manager that addresses the overall profitability of FTI’s U.S. fund business, as well as its profits in providing investment management and other services to each of the individual funds during the 12-month period ended September 30, 2016, being the most recent fiscal year-end for FRI. The Board noted that although management continually makes refinements to its methodologies used in calculating profitability in response to organizational and product related changes, the overall methodology has remained consistent with that used in the Funds’ profitability report presentations from prior years. Additionally, the Funds’ independent registered public accounting firm has been engaged by the Manager to periodically review the reasonableness of the allocation methodologies to be used solely by the Funds’ Board with respect to the profitability analysis.
The Board noted management’s belief that costs incurred in establishing the infrastructure necessary for the type of mutual fund operations conducted by the Manager and its affiliates may not be fully reflected in the expenses allocated to each Fund in determining its profitability, as well as the fact that the level of profits, to a certain extent, reflected operational cost savings and efficiencies initiated by management. The Board also noted management’s expenditures in improving shareholder services provided to the Funds, as well as the need to implement systems and meet additional regulatory and compliance requirements resulting from recent SEC and other regulatory requirements.
The Board also considered the extent to which the Manager and its affiliates might derive ancillary benefits from fund operations, including revenues generated from transfer agent services, potential benefits resulting from personnel and systems enhancements necessitated by fund growth, as well as increased leverage with service providers and counterparties. Based upon its consideration of all these factors, the Board concluded that the level of profits realized by the Manager and its affiliates from providing services to each Fund was not excessive in view of the nature, quality and extent of services provided to each Fund.
Economies of Scale
The Board reviewed and considered the extent to which the Manager may realize economies of scale, if any, as each Fund grows larger and whether the Fund’s management fee structure reflects any economies of scale for the benefit of shareholders. With respect to possible economies of scale, the Board noted the existence of management fee breakpoints, which operate generally to share any economies of scale with a Fund’s shareholders by reducing the Fund’s effective management fees as the Fund grows in size. The Board considered the Manager’s view that any analyses of potential economies of scale in managing a particular fund are inherently limited in light of the joint and common costs and investments the Manager incurs across the Franklin Templeton family of funds as a whole. The Board concluded that to the extent economies of scale may be realized by the Manager and its affiliates, each Fund’s management fee structure provided a sharing of benefits with the Fund and its shareholders as the Fund grows.
Conclusion
Based on its review, consideration and evaluation of all factors it believed relevant, including the above-described factors and conclusions, the Board unanimously approved the continuation of each Management Agreement for an additional one-year period.
Proxy Voting Policies and Procedures
The Trust’s investment manager has established Proxy Voting Policies and Procedures (Policies) that the Trust uses to determine how to vote proxies relating to portfolio securities.
120 Semiannual Report
franklintempleton.com
FRANKLIN CUSTODIAN FUNDS
SHAREHOLDER INFORMATION
Shareholders may view the Trust’s complete Policies online at
franklintempleton.com. Alternatively, shareholders may request
copies of the Policies free of charge by calling the Proxy Group
collect at (954) 527-7678 or by sending a written request
to: Franklin Templeton Companies, LLC, 300 S.E. 2nd Street,
Fort Lauderdale, FL 33301, Attention: Proxy Group. Copies of
the Trust’s proxy voting records are also made available online
at franklintempleton.com and posted on the U.S. Securities and
Exchange Commission’s website at sec.gov and reflect the
most recent 12-month period ended June 30.
Quarterly Statement of Investments
The Trust files a complete statement of investments with the
U.S. Securities and Exchange Commission for the first and
third quarters for each fiscal year on Form N-Q. Shareholders
may view the filed Form N-Q by visiting the Commission’s
website at sec.gov. The filed form may also be viewed and
copied at the Commission’s Public Reference Room in
Washington, DC. Information regarding the operations of the
Public Reference Room may be obtained by calling (800)
SEC-0330.
franklintempleton.com
Semiannual Report 121
This page intentionally left blank.
This page intentionally left blank.
This page intentionally left blank.
| Contents | |
| Franklin Focused Growth Fund | 2 |
| Performance Summary | 6 |
| Your Fund's Expenses | 8 |
| Financial Highlights and Statement of Investments | 9 |
| Financial Statements | 12 |
| Notes to Financial Statements | 15 |
| Shareholder Information | 21 |
| 1 | Semiannual Report |
Franklin Focused Growth Fund
This semiannual report for Franklin Focused Growth Fund covers the period ended March 31, 2017.
Your Fund’s Goal and Main Investments
The Fund seeks capital appreciation by investing in a focused portfolio of approximately 20–50 stocks that the investment manager believes have favorable growth, quality and valuation characteristics.
Performance Overview
For the period under review, the Fund’s Advisor Class shares delivered a cumulative total return of +6.97%. In comparison, the Russell 1000® Growth Index, which measures performance of those Russell 1000® Index companies with higher price-to-book ratios and higher forecasted growth values, generated a +10.01% total return.1 You can find more of the Fund’s performance data in the Performance Summary beginning on page 6.
Performance data represent past performance, which does not guarantee future results. Investment return and principal value will fluctuate, and you may have a gain or loss when you sell your shares. Current performance may differ from figures shown.
Economic and Market Overview
The U.S. economy continued to grow in 2017’s first quarter, though at a slower pace compared to the 2016’s fourth quarter. Strength in business investment, exports, housing and consumer spending was partially offset by declines in private inventory investment and government spending. The manufacturing sector generally expanded, and the services sector continued to grow. The unemployment rate decreased from 4.9% in September 2016 to 4.5% at period-end.2 Monthly retail sales were volatile, but grew during most of the review period. Inflation generally increased during the period, as measured by the Consumer Price Index.
At its December meeting, the U.S. Federal Reserve (Fed) raised its target range for the federal funds rate to 0.50%–0.75%, as policymakers cited improved labor market conditions and higher inflation. The Fed kept its interest rate unchanged at its February meeting, but incoming economic data, along with
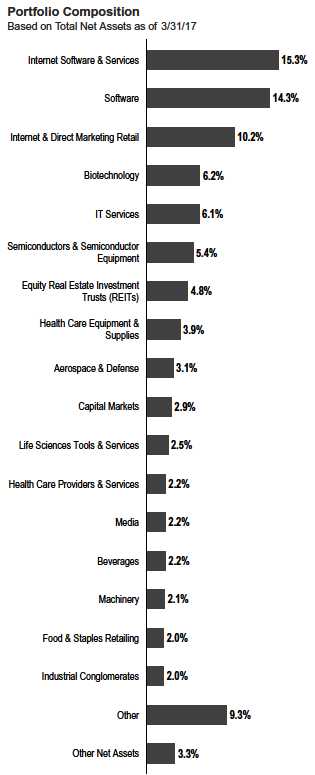
1. Source: Morningstar. Russell Investment Group is the source and owner of the trademarks, service marks and copyrights related to the Russell Indexes. Russell® is a
trademark of Russell Investment Group.
The index is unmanaged and includes reinvestment of any income or distributions. It does not reflect any fees, expenses or sales charges. One cannot invest directly in an
index, and an index is not representative of the Fund’s portfolio.
2. Source: Bureau of Labor Statistics.
The dollar value, number of shares or principal amount, and names of all portfolio holdings are listed in the Fund’s Statement of Investments (SOI).
The SOI begins on page 10.
Semiannual Report 2
FRANKLIN FOCUSED GROWTH FUND
statements by Fed officials in late February and early March, heightened many investors’ expectations for a March interest-rate hike. The Fed, at its March meeting, made the widely anticipated increase in its federal funds target rate to 0.75%–1.00%.
U.S. equity markets rose during the review period, benefiting from mostly upbeat economic data, encouraging corporate earnings, signs of improvement in the Chinese and European economies, ongoing expansionary monetary policies from key central banks and investor optimism arising from U.S. President Donald Trump’s pro-growth and pro-business policy plans. However, investor concerns about the terms of the U.K.’s exit from the European Union and President Trump’s protectionist policies weighed on market sentiment. The broad U.S. stock market ended the six-month period higher, as measured by the Standard & Poor’s® 500 Index.
Investment Strategy
We are research-driven, bottom-up, fundamental investors. Under normal market conditions, we will invest predominantly in equity securities of companies that we believe offer compelling growth opportunities. The equity securities in which we will invest are predominantly common stock. We may invest in companies of any size, including small and medium capitalization companies. In addition to our main investments, we may invest a portion (up to 25%) of net assets in foreign securities. We will generally seek to maintain a portfolio consisting of securities of approximately 20–50 companies. Although we seek investments across a number of sectors, from time to time, based on economic conditions, we may have significant positions in particular sectors.
Manager’s Discussion
During the period under review, most investment sectors contributed to absolute performance, including information technology (IT), consumer discretionary and health care.3 In IT, the Fund’s position in Microsoft, a software and IT services company, helped results. Microsoft performed well during the period due to a more resilient personal computer spending environment, continued growth in enterprise Office 365 adoption, a rebound in growth of its legacy server business and sustained growth of its Azure cloud offering. We remain positive on Microsoft as the company transitions to the cloud and expands its share of IT spending. Diversified software company Adobe Systems performed well, driven by sustained
| Top 10 Holdings | ||
| 3/31/17 | ||
| Company | % of Total | |
| Sector/Industry | Net Assets | |
| Amazon.com Inc. | 6.7 | % |
| Internet & Direct Marketing Retail | ||
| Visa Inc. | 6.1 | % |
| IT Services | ||
| Facebook Inc. | 5.9 | % |
| Internet Software & Services | ||
| Alphabet Inc. | 5.8 | % |
| Internet Software & Services | ||
| Microsoft Corp. | 4.5 | % |
| Software | ||
| Celgene Corp. | 4.3 | % |
| Biotechnology | ||
| Adobe Systems Inc. | 3.6 | % |
| Software | ||
| Salesforce.com Inc. | 3.4 | % |
| Software | ||
| Raytheon Co. | 3.1 | % |
| Aerospace & Defense | ||
| Equinix Inc. | 2.8 | % |
| Equity Real Estate Investment Trusts (REITs) |
growth in its Creative Cloud product, a reacceleration of its digital marketing segment and significant operating margin expansion, which led to better-than-expected earnings-per-share and free cash flow growth. Facebook helped results amid strong top- and bottom-line performance. Strong user engagement, new ad formats, Instagram and video have been key drivers. Notably, while Snapchat’s initial public offering had been viewed as a concern for many, possibly leading to a renewed focus on millennials’ relationship with Facebook, Snapchat’s slowing user growth in the latter half of 2016 and strong competitive behavior and feature adoption by both Instagram and Facebook shifted the narrative.
In consumer discretionary, Priceline Group contributed to the Fund’s absolute performance. Travel trends improved as we moved into the latter part of 2016 and early 2017. Priceline’s Booking.com site benefited from a stronger leisure travel environment in Europe. The company continued to make inroads on its vacation rentals listings, leading to less concerns about competition from Airbnb and others.
In health care, biotechnology firm Celgene’s strong performance during the review period was mostly driven by the U.S. presidential election. As an industry, biotechnology had
3. The IT sector comprises internet software and services and software in the SOI. The consumer discretionary sector comprises Internet and direct marketing retail in the SOI.
The health care sector comprises biotechnology and health care equipment and supplies in the SOI.
| 3 | Semiannual Report |
FRANKLIN FOCUSED GROWTH FUND
underperformed the broader market leading into the November 2016 election as consensus expectations were for a Hillary Clinton victory. With the election of Donald Trump, and more importantly, the Republican sweep in Congress, investors viewed the risk of government intervention on drug pricing as diminished. Veterinary and pet products and services company IDEXX Laboratories performed well during the reporting period. The company’s shares appreciated as profits in the September and December 2016 quarters exceeded consensus expectations, and as investors gravitated toward consumer-oriented stocks that could benefit from an improving economy.
In contrast, the consumer staples and energy sectors detracted from the Fund’s absolute performance during the reporting period.4 In consumer staples, Monster Beverage hindered returns.5 The company experienced several production issues in the U.S., which led the company to miss consensus expectations. Additionally, its innovation rollout has been initially slower than expected. However, we view these issues as transitory and expect growth to reaccelerate. Beverages firm Constellation Brands also hindered results. Its shares have been under pressure since the U.S. election in November despite the company’s consistently generating excellent results. Investors have been worried about the implications of a border-adjustment tax given that the company’s beer segment includes primarily imported products from Mexico. We view this risk as manageable due to the company’s ability to source a variety of inputs from the U.S. and also its strong pricing power. We expect investors to begin refocusing on fundamental operating trends.
In energy, independent oil and natural gas company Concho Resources hindered the Fund’s performance. The company’s shares fell during the period. Crude oil prices recovered from early-2016 lows, which helped Concho’s shares. However, the subsequent plateau of oil prices during the reporting period led the company’s shares to decline from their prior highs. Concho made a couple of recent acquisitions, including the purchase of private oil producer Reliance Energy, whose Permian Basin oil assets increased Concho’s footprint in the low cost region of West Texas. The deal required the use of cash and issuance of shares, which also pressured Concho’s shares.
Elsewhere, Palo Alto Networks5 and Workday detracted from results in the IT sector. Palo Alto Networks struggled with sales execution issues during the October 2016 and January 2017 fiscal quarters after a large and ill-conceived sales reorganization during the October quarter. Although we remain confident that Palo Alto Networks is attractively valued, we have taken a more conservative view on how large this company can be in the future. Workday, a provider of enterprise cloud applications for finance and human resources, hindered the Fund’s results. The company gave a cautious outlook at its fiscal third-quarter conference call in November 2016 due to concerns about the geopolitical environment, which had led some prospects to delay decisions. Subsequently, the stock has mostly rebounded following better-than-expected fourth-quarter 2016 results, as well as a significant win at Wal-Mart, which intends to transition human resources to the cloud.
In health care, shares of Edwards Lifesciences, a producer of artificial heart valves and hemodynamic monitoring, fell as investors took profits in the medical technology industry in late 2016 following strong performance that was driven by a trend of accelerating sales growth that failed to persist in the September quarter.5 The company’s stock also was negatively affected by the U.S. election, which spurred optimism for accelerating economic growth that led to an investor rotation toward more economically sensitive sectors. Medical devices company Dexcom’s5 stock declined for reasons similar to Edwards Lifesciences. In addition, Dexcom’s sales growth matured in the September and December 2016 quarters to an extent that was greater than investor expectations.

4. The consumer staples sector comprises beverages in the SOI. The energy sector comprises oil, gas and consumable fuels in the SOI.
5. No longer held at period-end.
See www.franklintempletondatasources.com for additional data provider information.
Semiannual Report 4
FRANKLIN FOCUSED GROWTH FUND
The foregoing information reflects our analysis, opinions and portfolio holdings as of March 31, 2017, the end of the reporting period. The way we implement our main investment strategies and the resulting portfolio holdings may change depending on factors such as market and economic conditions. These opinions may not be relied upon as investment advice or an offer for a particular security. The information is not a complete analysis of every aspect of any market, country, industry, security or the Fund. Statements of fact are from sources considered reliable, but the investment manager makes no representation or warranty as to their completeness or accuracy. Although historical performance is no guarantee of future results, these insights may help you understand our investment management philosophy.
| 5 | Semiannual Report |
FRANKLIN FOCUSED GROWTH FUND
Performance Summary as of March 31, 2017
The performance table does not reflect any taxes that a shareholder would pay on Fund dividends, capital gain distributions, if any, or any realized gains on the sale of Fund shares. Total return reflects reinvestment of the Fund’s dividends and capital gain distributions, if any, and any unrealized gains or losses. Your dividend income will vary depending on dividends or interest paid by securities in the Fund’s portfolio, adjusted for operating expenses. Capital gain distributions are net profits realized from the sale of portfolio securities.
Performance as of 3/31/171
Cumulative total return excludes sales charges. Average annual total return includes maximum sales charges. Sales charges will vary depending on the size of the investment and the class of share purchased. Advisor Class shares are offered without sales charges.
| Cumulative | Average Annual | |||
| Share Class | Total Return2 | Total Return3 | ||
| Advisor | ||||
| 6-Month | +6.97 | % | +6.97 | % |
| Since Inception (4/12/16) | +16.81 | % | +16.81 | % |
Performance data represent past performance, which does not guarantee future results. Investment return and principal value will fluctuate, and you may have a gain or loss when you sell your shares. Current performance may differ from figures shown.
See page 7 for Performance Summary footnotes.
Semiannual Report 6
| FRANKLIN FOCUSED GROWTH FUND | |||||
| PERFORMANCE SUMMARY | |||||
| Distributions (10/1/16–3/31/17) | |||||
| Net Investment | |||||
| Share Class | Income | ||||
| Advisor | $ | 0.0103 | |||
| Total Annual Operating Expenses4 | |||||
| Share Class | With Waiver | Without Waiver | |||
| Advisor | 1.00 | % | 4.76 | % | |
All investments involve risks, including possible loss of principal. The market values of securities or other investments owned by the Fund will go up or down,
sometimes rapidly or unpredictably. Growth stock prices reflect projections of future earnings or revenues, and can, therefore, fall dramatically if the company
fails to meet those projections. To the extent the Fund focuses on particular countries, regions, industries, sectors or types of investment from time totime,itmay
be subject to greater risks of adverse developments in such areas of focus than a fund that invests in a wider variety of countries, regions, industries, sectors or
investments. Foreign securities involve special risks, including currency fluctuations and economic and political uncertainties. The Fund is actively managed but
there is no guarantee that the manager’s investment decisions will produce the desired results. The Fund’s prospectus also includes a description of the main
investment risks.
1. The Fund has an expense reduction contractually guaranteed through 1/31/18. Fund investment results reflect the expense reduction; without this reduction the results would
have been lower.
2. Cumulative total return represents the change in value of an investment over the periods indicated.
3. Average annual total return represents the average annual change in value of an investment over the periods indicated. Return for less than one year, ifany,hasnotbeen
annualized.
4. Figures are as stated in the Fund’s current prospectus and may differ from the expense ratios disclosed in the Your Fund’s Expenses and Financial Highlights sections in this
report. In periods of market volatility, assets may decline significantly, causing total annual Fund operating expenses to become higher than the figures shown.
| 7 | Semiannual Report |
FRANKLIN FOCUSED GROWTH FUND
Your Fund’s Expenses
As a Fund shareholder, you can incur two types of costs: (1) transaction costs, including sales charges (loads) on Fund purchases and redemptions; and (2) ongoing Fund costs, including management fees, distribution and service (12b-1) fees, and other Fund expenses. All mutual funds have ongoing costs, sometimes referred to as operating expenses. The table below shows ongoing costs of investing in the Fund and can help you understand these costs and compare them with those of other mutual funds. The table assumes a $1,000 investment held for the six months indicated.
Actual Fund Expenses
The table below provides information about actual account values and actual expenses in the columns under the heading “Actual.” In these columns the Fund’s actual return, which includes the effect of Fund expenses, is used to calculate the “Ending Account Value.” You can estimate the expenses you paid during the period by following these steps (of course, your account value and expenses will differ from those in this illustration): Divide your account value by $1,000 (if your account had an $8,600 value, then $8,600 ÷ $1,000 = 8.6). Then multiply the result by the number in the row for your class of shares under the headings “Actual” and “Expenses Paid During Period” (if Actual Expenses Paid During Period were $7.50, then 8.6 x $7.50 = $64.50). In this illustration, the actual expenses paid this period are $64.50.
Hypothetical Example for Comparison with Other Funds
Under the heading “Hypothetical” in the table, information is provided about hypothetical account values and hypothetical expenses based on the Fund’s actual expense ratio and an assumed rate of return of 5% per year before expenses, which is not the Fund’s actual return. This information may not be used to estimate the actual ending account balance or expenses you paid for the period, but it can help you compare ongoing costs of investing in the Fund with those of other funds. To do so, compare this 5% hypothetical example for the class of shares you hold with the 5% hypothetical examples that appear in the shareholder reports of other funds.
Please note that expenses shown in the table are meant to highlight ongoing costs and do not reflect any transactional costs. Therefore, information under the heading “Hypothetical” is useful in comparing ongoing costs only, and will not help you compare total costs of owning different funds. In addition, if transactional costs were included, your total costs would have been higher.
| Actual | Hypothetical | |||||||||||
| (actual return after expenses) | (5% annual return before expenses) | |||||||||||
| Expenses | Expenses | Net | ||||||||||
| Beginning | Ending | Paid During | Ending | Paid During | Annualized | |||||||
| Share | Account | Account | Period | Account | Period | Expense | ||||||
| Class | Value | Value 3/31/17 | 10/1/6-3/31/171,2 | Value 3/31/17 | 10/1/16–3/31/171,2 | Ratio2 | ||||||
| Advisor | $ | 1,000 | $ | 1,069.70 | $ | 5.16 | $ | 1,019.95 | $ | 5.04 | 1.00 | % |
1. Expenses are equal to the annualized expense ratio for the six-month period as indicated above–in the far right column–multiplied by the simple average account value
over the period indicated, and then multiplied by 182/365 to reflect the one-half year period.
2. Reflects expenses after fee waivers and expense reimbursements.
Semiannual Report 8
| FRANKLIN CUSTODIAN FUNDS | ||||||
| Financial Highlights | ||||||
| Franklin Focused Growth Fund | ||||||
| Six Months Ended | Year Ended | |||||
| March 31, 2017 | September 30, | |||||
| (unaudited) | 2016 | a | ||||
| Advisor Class | ||||||
| Per share operating performance | ||||||
| (for a share outstanding throughout the period) | ||||||
| Net asset value, beginning of period | $ | 10.93 | $ | 10.00 | ||
| Income from investment operationsb: | ||||||
| Net investment income (loss)c | (0.01 | ) | (0.01 | ) | ||
| Net realized and unrealized gains (losses) | 0.76 | 0.94 | ||||
| Total from investment operations | 0.75 | 0.93 | ||||
| Less distributions from: | ||||||
| Net investment income. | (0.01 | ) | — | |||
| Net realized gains | (0.03 | ) | — | |||
| Total distributions | (0.04 | ) | — | |||
| Net asset value, end of period | $ | 11.64 | $ | 10.93 | ||
| Total returnd | 6.97 | % | 9.30 | % | ||
| Ratios to average net assetse | ||||||
| Expenses before waiver and payments by affiliates. | 3.28 | % | 4.76 | % | ||
| Expenses net of waiver and payments by affiliates | 1.00 | % | 1.00 | % | ||
| Net investment income (loss) | (0.25 | )% | (0.18 | )% | ||
| Supplemental data | ||||||
| Net assets, end of period (000’s) | $ | 2,909 | $ | 2,732 | ||
| Portfolio turnover rate | 21.48 | % | 7.46 | % | ||
aFor the period April 12, 2016 (commencement of operations) to September 30, 2016.
bThe amount shown for a share outstanding throughout the period may not correlate with the Statement of Operations for the period due to the timing of sales and
repurchases of the Fund’s shares in relation to income earned and/or fluctuating fair value of the investments of the Fund.
cBased on average daily shares outstanding.
dTotal return is not annualized for periods less than one year.
eRatios are annualized for periods less than one year, except for non-recurring expenses, if any.
| 9 | Semiannual Report | The accompanying notes are an integral part of these financial statements. |
FRANKLIN CUSTODIAN FUNDS
| Statement of Investments, March 31, 2017 (unaudited) | |||
| Franklin Focused Growth Fund | |||
| Shares | Value | ||
| Common Stocks 96.7% | |||
| Aerospace & Defense 3.1% | |||
| Raytheon Co | 600 | $ | 91,500 |
| Banks 1.3% | |||
| First Republic Bank/CA | 400 | 37,524 | |
| Beverages 2.2% | |||
| Constellation Brands Inc., A | 400 | 64,828 | |
| Biotechnology 6.2% | |||
| a Celgene Corp | 1,000 | 124,430 | |
| a Incyte Corp | 200 | 26,734 | |
| a Tesaro Inc | 200 | 30,774 | |
| 181,938 | |||
| Capital Markets 2.9% | |||
| The Goldman Sachs Group Inc | 200 | 45,944 | |
| MarketAxess Holdings Inc | 200 | 37,498 | |
| 83,442 | |||
| Construction Materials 0.9% | |||
| Martin Marietta Materials Inc | 120 | 26,190 | |
| Electrical Equipment 1.1% | |||
| Rockwell Automation Inc | 200 | 31,142 | |
| Equity Real Estate Investment Trusts (REITs) 4.8% | |||
| American Tower Corp | 500 | 60,770 | |
| Equinix Inc | 200 | 80,074 | |
| 140,844 | |||
| Food & Staples Retailing 2.0% | |||
| Costco Wholesale Corp | 350 | 58,692 | |
| Health Care Equipment & Supplies 3.9% | |||
| Danaher Corp | 700 | 59,871 | |
| a IDEXX Laboratories Inc | 350 | 54,113 | |
| 113,984 | |||
| Health Care Providers & Services 2.2% | |||
| UnitedHealth Group Inc | 400 | 65,604 | |
| Hotels, Restaurants & Leisure 1.2% | |||
| Starbucks Corp | 600 | 35,034 | |
| Industrial Conglomerates 2.0% | |||
| 3M Co | 300 | 57,399 | |
| Internet & Direct Marketing Retail 10.2% | |||
| a Amazon.com Inc | 220 | 195,039 | |
| a Netflix Inc | 200 | 29,562 | |
| a The Priceline Group Inc | 40 | 71,199 | |
| 295,800 | |||
| Internet Software & Services 15.3% | |||
| a Alibaba Group Holding Ltd., ADR (China) | 300 | 32,349 | |
| a Alphabet Inc., A | 200 | 169,560 | |
| a Facebook Inc., A | 1,200 | 170,460 | |
| a MuleSoft Inc | 90 | 2,190 | |
| Tencent Holdings Ltd. (China) | 2,500 | 71,671 | |
| 446,230 | |||
| IT Services 6.1% | |||
| Visa Inc., A | 2,000 | 177,740 | |
Semiannual Report 10
FRANKLIN CUSTODIAN FUNDS
STATEMENT OF INVESTMENTS (UNAUDITED)
| Franklin Focused Growth Fund (continued) | |||
| Shares | Value | ||
| Common Stocks (continued) | |||
| Life Sciences Tools & Services 2.5% | |||
| a Mettler-Toledo International Inc | 150 | $ | 71,836 |
| Machinery 2.1% | |||
| Fortive Corp | 1,000 | 60,220 | |
| Media 2.2% | |||
| a Charter Communications Inc., A | 200 | 65,464 | |
| Oil, Gas & Consumable Fuels 1.8% | |||
| a Concho Resources Inc | 400 | 51,336 | |
| Personal Products 1.0% | |||
| Estee Lauder Cos. Inc., A | 330 | 27,981 | |
| Professional Services 1.0% | |||
| a Verisk Analytics Inc | 350 | 28,399 | |
| Semiconductors & Semiconductor Equipment 5.4% | |||
| Analog Devices Inc | 800 | 65,560 | |
| NVIDIA Corp | 300 | 32,679 | |
| Xilinx Inc | 1,000 | 57,890 | |
| 156,129 | |||
| Software 14.3% | |||
| Activision Blizzard Inc | 600 | 29,916 | |
| a Adobe Systems Inc | 800 | 104,104 | |
| Microsoft Corp | 2,000 | 131,720 | |
| a Salesforce.com Inc | 1,200 | 98,988 | |
| a Workday Inc., A | 600 | 49,968 | |
| 414,696 | |||
| Textiles, Apparel & Luxury Goods 1.0% | |||
| NIKE Inc., B | 500 | 27,865 | |
| Total Common Stocks (Cost $2,384,963) | 2,811,817 | ||
| Other Assets, less Liabilities 3.3% | 97,049 | ||
| Net Assets 100.0%. | $ | 2,908,866 | |
See Abbreviations on page 20.
aNon-income producing.
| 11 | Semiannual Report | The accompanying notes are an integral part of these financial statements. |
FRANKLIN CUSTODIAN FUNDS
Financial Statements
Statement of Assets and Liabilities
March 31, 2017 (unaudited)
| Franklin Focused Growth Fund | |||
| Assets: | |||
| Investments in securities: | |||
| Cost - Unaffiliated issuers | $ | 2,384,963 | |
| Value - Unaffiliated issuers | $ | 2,811,817 | |
| Cash | 111,848 | ||
| Receivables: | |||
| Dividends | 368 | ||
| Affiliates. | 33,610 | ||
| Offering costs. | 1,643 | ||
| Other assets | 2 | ||
| Total assets | 2,959,288 | ||
| Liabilities: | |||
| Payables: | |||
| Professional fees | 50,417 | ||
| Accrued expenses and other liabilities | 5 | ||
| Total liabilities | 50,422 | ||
| Net assets, at value | $ | 2,908,866 | |
| Net assets consist of: | |||
| Paid-in capital | $ | 2,495,247 | |
| Accumulated net investment loss | (3,472 | ) | |
| Net unrealized appreciation (depreciation) | 426,854 | ||
| Accumulated net realized gain (loss) | (9,763 | ) | |
| Net assets, at value | $ | 2,908,866 | |
| Shares outstanding | 250,000 | ||
| Net asset value and maximum offering price per share | $ | 11.64 | |
The accompanying notes are an integral part of these financial statements. | Semiannual Report 12
| FRANKLIN CUSTODIAN FUNDS |
| FINANCIAL STATEMENTS |
Statement of Operations
for the period ended March 31, 2017 (unaudited)
| Franklin Focused Growth Fund | |||
| Investment income: | |||
| Dividends | $ | 10,200 | |
| Expenses: | |||
| Management fees (Note 3a) | 11,624 | ||
| Custodian fees (Note 4) | 7 | ||
| Reports to shareholders | 1,786 | ||
| Professional fees | 18,059 | ||
| Amortization of offering costs | 24,932 | ||
| Other | 875 | ||
| Total expenses | 57,283 | ||
| Expenses waived/paid by affiliates (Note 3e) | (43,610 | ) | |
| Net expenses | 13,673 | ||
| Net investment income (loss) | (3,473 | ) | |
| Realized and unrealized gains (losses): | |||
| Net realized gain (loss) from investments | (9,751 | ) | |
| Net change in unrealized appreciation (depreciation) on investments | 199,493 | ||
| Net realized and unrealized gain (loss) | 189,742 | ||
| Net increase (decrease) in net assets resulting from operations | $ | 186,269 | |
| 13 | Semiannual Report | The accompanying notes are an integral part of these financial statements. |
| FRANKLIN CUSTODIAN FUNDS | |||||||
| FINANCIAL STATEMENTS | |||||||
| Statements of Changes in Net Assets | |||||||
| Franklin Focused Growth Fund | |||||||
| Six Months Ended | |||||||
| March 31, 2017 | Year Ended | ||||||
| (unaudited) | September 30, 2016a | ||||||
| Increase (decrease) in net assets: | |||||||
| Operations: | |||||||
| Net investment income (loss) | $ | (3,473 | ) | $ | (2,200 | ) | |
| Net realized gain (loss) | (9,751 | ) | 6,911 | ||||
| Net change in unrealized appreciation (depreciation) | 199,493 | 227,361 | |||||
| Net increase (decrease) in net assets resulting from operations | 186,269 | 232,072 | |||||
| Distributions to shareholders from: | |||||||
| Net investment income. | (2,575 | ) | — | ||||
| Net realized gains | (6,900 | ) | — | ||||
| Total distributions to shareholders | (9,475 | ) | — | ||||
| Capital share transactions (Note 2) | — | 2,500,000 | |||||
| Net increase (decrease) in net assets | 176,794 | 2,732,072 | |||||
| Net assets: | |||||||
| Beginning of period | 2,732,072 | — | |||||
| End of period | $ | 2,908,866 | $ | 2,732,072 | |||
| Undistributed net investment income included in net assets: | |||||||
| End of period | $ | — | $ | 2,576 | |||
| Accumulated net investment loss included in net assets: | |||||||
| End of period | $ | (3,472 | ) | $ | — | ||
aFor the period April 12, 2016 (commencement of operations) to September 30, 2016.
The accompanying notes are an integral part of these financial statements. | Semiannual Report 14
FRANKLIN CUSTODIAN FUNDS
Notes to Financial Statements (unaudited)
Franklin Focused Growth Fund
1. Organization and Significant Accounting Policies
Franklin Custodian Funds (Trust) is registered under the Investment Company Act of 1940 (1940 Act) as an open-end management investment company, consisting of six separate funds and applies the specialized accounting and reporting guidance in U.S. Generally Accepted Accounting Principles (U.S. GAAP). Franklin Focused Growth Fund (Fund) is included in this report. The financial statements of the remaining funds in the Trust are presented separately. The Fund has five classes of shares: Class A, Class C, Class R, Class R6 and Advisor Class. Each class of shares differs by its initial sales load, contingent deferred sales charges, voting rights on matters affecting a single class, its exchange privilege and fees primarily due to differing arrangements for distribution and transfer agent fees.
The Fund currently operates with one class of shares, Advisor Class.
The following summarizes the Fund’s significant accounting policies.
a. Financial Instrument Valuation
The Fund’s investments in financial instruments are carried at fair value daily. Fair value is the price that would be received to sell an asset or paid to transfer a liability in an orderly transaction between market participants on the measurement date. The Fund calculates the net asset value (NAV) per share as of 4 p.m. Eastern time each day the New York Stock Exchange (NYSE) is open for trading. Under compliance policies and procedures approved by the Fund’s Board of Trustees (the Board), the Fund’s administrator has responsibility for oversight of valuation, including leading the cross-functional Valuation Committee (VC). The VC provides administration and oversight of the Fund’s valuation policies and procedures, which are approved annually by the Board. Among other things, these procedures allow the Fund to utilize independent pricing services, quotations from securities and financial instrument dealers, and other market sources to determine fair value.
Equity securities listed on an exchange or on the NASDAQ National Market System are valued at the last quoted sale price or the official closing price of the day, respectively. Foreign equity securities are valued as of the close of trading on the foreign stock exchange on which the security is primarily traded, or as of 4 p.m. Eastern time. The value is then converted into its U.S. dollar equivalent at the foreign exchange rate in effect at 4 p.m. Eastern time on the day that the value of the security is determined. Over-the-counter (OTC) securities are valued within the range of the most recent quoted bid and ask prices. Securities that trade in multiple markets or on multiple exchanges are valued according to the broadest and most representative market. Certain equity securities are valued based upon fundamental characteristics or relationships to similar securities.
The Fund has procedures to determine the fair value of financial instruments for which market prices are not reliable or readily available. Under these procedures, the VC convenes on a regular basis to review such financial instruments and considers a number of factors, including significant unobservable valuation inputs, when arriving at fair value. The VC primarily employs a market-based approach which may use related or comparable assets or liabilities, recent transactions, market multiples, book values, and other relevant information for the investment to determine the fair value of the investment. An income-based valuation approach may also be used in which the anticipated future cash flows of the investment are discounted to calculate fair value. Discounts may also be applied due to the nature or duration of any restrictions on the disposition of the investments. Due to the inherent uncertainty of valuations of such investments, the fair values may differ significantly from the values that would have been used had an active market existed. The VC employs various methods for calibrating these valuation approaches including a regular review of key inputs and assumptions, transactional back-testing or disposition analysis, and reviews of any related market activity.
Trading in securities on foreign securities stock exchanges and OTC markets may be completed before 4 p.m. Eastern time. In addition, trading in certain foreign markets may not take place on every Fund’s business day. Occasionally, events occur between the time at which trading in a foreign security is completed and 4 p.m. Eastern time that might call into question the reliability of the value of a portfolio security held by the Fund. As a result, differences may arise between the value of the Fund’s portfolio securities as determined at the foreign market close and the latest indications of value at 4 p.m. Eastern time. In order to minimize the potential for these differences, the VC monitors price movements following the close of trading in foreign stock markets through a series of country specific market proxies (such as baskets of American
| 15 | Semiannual Report |
FRANKLIN CUSTODIAN FUNDS
NOTES TO FINANCIAL STATEMENTS (UNAUDITED)
Franklin Focused Growth Fund (continued)
Depositary Receipts, futures contracts and exchange traded funds). These price movements are measured against established trigger thresholds for each specific market proxy to assist in determining if an event has occurred that may call into question the reliability of the values of the foreign securities held by the Fund. If such an event occurs, the securities may be valued using fair value procedures, which may include the use of independent pricing services.
When the last day of the reporting period is a non-business day, certain foreign markets may be open on those days that the Fund’s NAV is not calculated, which could result in differences between the value of the Fund’s portfolio securities on the last business day and the last calendar day of the reporting period. Any significant security valuation changes due to an open foreign market are adjusted and reflected by the Fund for financial reporting purposes.
b. Foreign Currency Translation
Portfolio securities and other assets and liabilities denominated in foreign currencies are translated into U.S. dollars based on the exchange rate of such currencies against U.S. dollars on the date of valuation. The Fund may enter into foreign currency exchange contracts to facilitate transactions denominated in a foreign currency. Purchases and sales of securities, income and expense items denominated in foreign currencies are translated into U.S. dollars at the exchange rate in effect on the transaction date. Portfolio securities and assets and liabilities denominated in foreign currencies contain risks that those currencies will decline in value relative to the U.S. dollar. Occasionally, events may impact the availability or reliability of foreign exchange rates used to convert the U.S. dollar equivalent value. If such an event occurs, the foreign exchange rate will be valued at fair value using procedures established and approved by the Board.
The Fund does not separately report the effect of changes in foreign exchange rates from changes in market prices on securities held. Such changes are included in net realized and unrealized gain or loss from investments in the Statement of Operations.
Realized foreign exchange gains or losses arise from sales of foreign currencies, currency gains or losses realized between the trade and settlement dates on securities transactions and the difference between the recorded amounts of dividends, interest, and foreign withholding taxes and the U.S. dollar equivalent of the amounts actually received or paid. Net unrealized foreign exchange gains and losses arise from changes in foreign exchange rates on foreign denominated assets and liabilities other than investments in securities held at the end of the reporting period.
c. Income and Deferred Taxes
It is the Fund’s policy to qualify as a regulated investment company under the Internal Revenue Code. The Fund intends to distribute to shareholders substantially all of its taxable income and net realized gains to relieve it from federal income and excise taxes. As a result, no provision for U.S. federal income taxes is required.
The Fund may be subject to foreign taxation related to income received, capital gains on the sale of securities and certain foreign currency transactions in the foreign jurisdictions in which it invests. Foreign taxes, if any, are recorded based on the tax regulations and rates that exist in the foreign markets in which the Fund invests. When a capital gain tax is determined to apply, the Fund records an estimated deferred tax liability in an amount that would be payable if the securities were disposed of on the valuation date.
The Fund may recognize an income tax liability related to its uncertain tax positions under U.S. GAAP when the uncertain tax position has a less than 50% probability that it will be sustained upon examination by the tax authorities based on its technical merits. As of March 31, 2017, the Fund has determined that no tax liability is required in its financial statements related to uncertain tax positions for any open tax years (or expected to be taken in future tax years). Open tax years are those that remain subject to examination and are based on each tax jurisdiction’s statute of limitation.
d. Security Transactions, Investment Income, Expenses and Distributions
Security transactions are accounted for on trade date. Realized gains and losses on security transactions are determined on a specific identification basis. Estimated expenses are accrued daily. Dividend income is recorded on the ex-dividend date except for certain dividends from securities where the dividend rate is not available. In such cases, the dividend is recorded as soon as the information is received by the Fund. Distributions to shareholders are recorded on the ex-dividend date and are determined according to income tax regulations (tax basis). Distributable earnings determined on a tax basis may differ from earnings recorded in accordance with U.S. GAAP. These
Semiannual Report 16
FRANKLIN CUSTODIAN FUNDS
NOTES TO FINANCIAL STATEMENTS (UNAUDITED)
Franklin Focused Growth Fund (continued)
1. Organization and Significant Accounting
Policies (continued)
d. Security Transactions, Investment Income, Expenses and Distributions (continued)
differences may be permanent or temporary. Permanent differences are reclassified among capital accounts to reflect their tax character. These reclassifications have no impact on net assets or the results of operations. Temporary differences are not reclassified, as they may reverse in subsequent periods.
Common expenses incurred by the Trust are allocated among the Funds based on the ratio of net assets of each Fund to the combined net assets of the Trust. Fund specific expenses are charged directly to the Fund that incurred the expense.
Realized and unrealized gains and losses and net investment income, not including class specific expenses, are allocated daily to each class of shares based upon the relative proportion of net assets of each class. Differences in per share distributions, by class, are generally due to differences in class specific expenses.
e. Offering Costs
Offering costs are amortized on a straight line basis over twelve months.
2. Shares of Beneficial Interest
f. Accounting Estimates
The preparation of financial statements in accordance with U.S. GAAP requires management to make estimates and assumptions that affect the reported amounts of assets and liabilities at the date of the financial statements and the amounts of income and expenses during the reporting period. Actual results could differ from those estimates.
g. Guarantees and Indemnifications
Under the Trust’s organizational documents, its officers and trustees are indemnified by the Trust against certain liabilities arising out of the performance of their duties to the Trust. Additionally, in the normal course of business, the Trust, on behalf of the Fund, enters into contracts with service providers that contain general indemnification clauses. The Trust’s maximum exposure under these arrangements is unknown as this would involve future claims that may be made against the Trust that have not yet occurred. Currently, the Trust expects the risk of loss to be remote.
At March 31, 2017, there were an unlimited number of shares authorized (without par value). Transactions in the Fund’s shares were as follows:
| Six Months Ended | Year Ended | ||||
| March 31, 2017 | September 30, 2016a | ||||
| Shares | Amount | Shares | Amount | ||
| Shares sold | — | $— | 250,000 | $ | 2,500,000 |
| aFor the period April 12, 2016 (commencement of operations) to September 30, 2016. | |||||
3. Transactions with Affiliates
Franklin Resources, Inc. is the holding company for various subsidiaries that together are referred to as Franklin Templeton Investments. Certain officers and trustees of the Trust are also officers and/or directors of the following subsidiaries:
| Subsidiary | Affiliation |
| Franklin Advisers, Inc. (Advisers) | Investment manager |
| Franklin Templeton Services, LLC (FT Services) | Administrative manager |
| Franklin Templeton Distributors, Inc. (Distributors) | Principal underwriter |
| Franklin Templeton Investor Services, LLC (Investor Services) | Transfer agent |
| 17 | Semiannual Report |
FRANKLIN CUSTODIAN FUNDS
NOTES TO FINANCIAL STATEMENTS (UNAUDITED)
Franklin Focused Growth Fund (continued)
a. Management Fees
The Fund pays an investment management fee to Advisers based on the average daily net assets of the Fund as follows:
| Annualized Fee Rate | Net Assets | |
| 0.850 | % | Up to and including $500 million |
| 0.800 | % | Over $500 million, up to and including $1 billion |
| 0.750 | % | Over $1 billion, up to and including $3 billion |
| 0.730 | % | Over $3 billion, up to and including $5 billion |
| 0.700 | % | In excess of $5 billion |
For the period ended March 31, 2017, the annualized effective investment management fee rate was 0.850% of the Fund’s average daily net assets.
b. Administrative Fees
Under an agreement with Advisers, FT Services provides administrative services to the Fund. The fee is paid by Advisers based on the Fund’s average daily net assets, and is not an additional expense of the Fund.
c. Distribution Fees
The Board has adopted distribution plans for each share class, with the exception of Class R6 and Advisor Class shares, pursuant to Rule 12b-1 under the 1940 Act. Under the Fund’s Class A reimbursement distribution plan, the Fund reimburses Distributors for costs incurred in connection with the servicing, sale and distribution of the Fund’s shares up to the maximum annual plan rate. Under the Class A reimbursement distribution plan, costs exceeding the maximum for the current plan year cannot be reimbursed in subsequent periods. In addition, under the Fund’s Class C and R compensation distribution plans, the Fund pays Distributors for costs incurred in connection with the servicing, sale and distribution of the Fund’s shares up to the maximum annual plan rate for each class. The plan year, for purposes of monitoring compliance with the maximum annual plan rates, is February 1 through January 31.
The maximum annual plan rates, based on the average daily net assets, for each class, are as follows:
| Class A | 0.25 | % |
| Class C | 1.00 | % |
| Class R | 0.50 | % |
| d. Transfer Agent Fees | ||
Each class of shares, except for Class R6, pays transfer agent fees to Investor Services for its performance of shareholder servicing obligations and reimburses Investor Services for out of pocket expenses incurred, including shareholder servicing fees paid to third parties. These fees are allocated daily based upon their relative proportion of such classes’ aggregate net assets. Class R6 pays Investor Services transfer agent fees specific to that class.
e. Waiver and Expense Reimbursements
Advisers and FT Services contractually agreed in advance to waive or limit their respective fees and to assume as their own expense certain expenses otherwise payable by the Fund so that the expenses (excluding distribution fees, acquired fund fees and expenses) of the Fund do not exceed 1.00% based on the average net assets of each class (other than certain non-routine expenses or costs, including those relating to litigation, indemnification, reorganizations, and liquidations) until January 31, 2018. Total expenses waived or paid are not subject to recapture subsequent to the Fund’s fiscal year end.
Semiannual Report 18
FRANKLIN CUSTODIAN FUNDS
NOTES TO FINANCIAL STATEMENTS (UNAUDITED)
Franklin Focused Growth Fund (continued) 3. Transactions with Affiliates (continued) f. Other Affiliated Transactions
At March 31, 2017, Franklin Resources Inc. owned 100% of the Fund’s outstanding shares. Investment activities of this shareholder could have a material impact on the Fund.
4. Expense Offset Arrangement
The Fund has entered into an arrangement with its custodian whereby credits realized as a result of uninvested cash balances are used to reduce a portion of the Fund’s custodian expenses. During the period ended March 31, 2017, there were no credits earned.
5. Income Taxes
At March 31, 2017, the cost of investments and net unrealized appreciation (depreciation) for income tax purposes were as follows:
| Cost of investments | $ | 2,384,963 | |
| Unrealized appreciation | $ | 439,952 | |
| Unrealized depreciation | (13,098 | ) | |
| Net unrealized appreciation (depreciation) | $ | 426,854 | |
Differences between income and/or capital gains as determined on a book basis and a tax basis are primarily due to differing treatment of offering costs.
6. Investment Transactions
Purchases and sales of investments (excluding short term securities) for the period ended March 31, 2017, aggregated $578,195 and $622,593, respectively.
7. Credit Facility
The Fund, together with other U.S. registered and foreign investment funds (collectively, Borrowers), managed by Franklin Templeton Investments, are borrowers in a joint syndicated senior unsecured credit facility totaling $2 billion (Global Credit Facility) which matures on February 9, 2018. This Global Credit Facility provides a source of funds to the Borrowers for temporary and emergency purposes, including the ability to meet future unanticipated or unusually large redemption requests. The Fund began participating in the Global Credit Facility on February 10, 2017.
Under the terms of the Global Credit Facility, the Fund shall, in addition to interest charged on any borrowings made by the Fund and other costs incurred by the Fund, pay its share of fees and expenses incurred in connection with the implementation and maintenance of the Global Credit Facility, based upon its relative share of the aggregate net assets of all of the Borrowers, including an annual commitment fee of 0.15% based upon the unused portion of the Global Credit Facility. These fees are reflected in other expenses in the Statement of Operations. During the period ended March 31, 2017, the Fund did not use the Global Credit Facility.
| 19 | Semiannual Report |
FRANKLIN CUSTODIAN FUNDS
NOTES TO FINANCIAL STATEMENTS (UNAUDITED)
Franklin Focused Growth Fund (continued)
8. Fair Value Measurements
The Fund follows a fair value hierarchy that distinguishes between market data obtained from independent sources (observable inputs) and the Fund’s own market assumptions (unobservable inputs). These inputs are used in determining the value of the Fund’s financial instruments and are summarized in the following fair value hierarchy:
- Level 1 – quoted prices in active markets for identical financial instruments
- Level 2 – other significant observable inputs (including quoted prices for similar financial instruments, interest rates, prepayment speed, credit risk, etc.)
- Level 3 – significant unobservable inputs (including the Fund’s own assumptions in determining the fair value of financial instruments)
The input levels are not necessarily an indication of the risk or liquidity associated with financial instruments at that level.
For movements between the levels within the fair value hierarchy, the Fund has adopted a policy of recognizing the transfers as of the date of the underlying event which caused the movement.
At March 31, 2017, all of the Fund’s investments in financial instruments carried at fair value were valued using Level 1 inputs.
9. Investment Company Reporting Modernization
In October 2016, the U.S. Securities and Exchange Commission adopted new rules and amended existing rules (together, final rules) intended to modernize the reporting and disclosure of information by registered investment companies. In part, the final rules amend Regulation S-X and require standardized, enhanced disclosures about derivatives in investment company financial statements, as well as other amendments. The compliance date for the amendments to Regulation S-X is August 1, 2017. Management is currently evaluating the impact that the adoption of the amendments to Regulation S-X will have on the Fund’s financial statements and related disclosures.
10. Subsequent Events
The Fund has evaluated subsequent events through the issuance of the financial statements and determined that no events have occurred that require disclosure.
| Abbreviations |
| Selected Portfolio |
| ADR American Depository Receipt |
Semiannual Report 20
FRANKLIN CUSTODIAN FUNDS FRANKLIN FOCUSED GROWTH FUND
Shareholder Information
Proxy Voting Policies and Procedures
The Fund’s investment manager has established Proxy Voting Policies and Procedures (Policies) that the Fund uses to determine how to vote proxies relating to portfolio securities. Shareholders may view the Fund’s complete Policies online at franklintempleton.com. Alternatively, shareholders may request copies of the Policies free of charge by calling the Proxy Group collect at (954) 527-7678 or by sending a written request to: Franklin Templeton Companies, LLC, 300 S.E. 2nd Street, Fort Lauderdale, FL 33301, Attention: Proxy Group. Copies of the Fund’s proxy voting records are also made available online at franklintempleton.com and posted on the U.S. Securities and Exchange Commission’s website at sec.gov and reflect the most recent 12-month period ended June 30.
Quarterly Statement of Investments
The Trust, on behalf of the Fund, files a complete statement of investments with the U.S. Securities and Exchange Commission for the first and third quarters for each fiscal year on Form N-Q. Shareholders may view the filed Form N-Q by visiting the Commission’s website at sec.gov. The filed form may also be viewed and copied at the Commission’s Public Reference Room in Washington, DC. Information regarding the operations of the Public Reference Room may be obtained by calling (800) SEC-0330.
| 21 | Semiannual Report |
Item 2. Code of Ethics.
(a) The Registrant has adopted a code of ethics that applies to its principal executive officers and principal financial and accounting officer.
(c) N/A
(d) N/A
(f) Pursuant to Item 12(a)(1), the Registrant is attaching as an exhibit a copy of its code of ethics that applies to its principal executive officers and principal financial and accounting officer.
Item 3. Audit Committee Financial Expert.
(a)(1) The Registrant has an audit committee financial expert serving on its audit committee.
(2) The audit committee financial expert is John B. Wilson and he is "independent" as defined under the relevant Securities and Exchange Commission Rules and Releases.
Item 4. Principal Accountant Fees and Services. N/A
Item 5. Audit Committee of Listed Registrants. N/A
Item 6. Schedule of Investments. N/A
Item 7. Disclosure of Proxy Voting Policies and Procedures for Closed-End Management Investment Companies. N/A
Item 8. Portfolio Managers of Closed-End Management Investment Companies. N/A
Item 9. Purchases of Equity Securities by Closed-End Management Investment Company and Affiliated Purchasers. N/A
Item 10. Submission of Matters to a Vote of Security Holders.
There have been no changes to the procedures by which shareholders may recommend nominees to the Registrant's Board of Trustees that would require disclosure herein.
Item 11. Controls and Procedures.
(a) Evaluation of Disclosure Controls and Procedures. The Registrant maintains disclosure controls and procedures that are designed to ensure that information required to be disclosed in the Registrant’s filings under the Securities Exchange Act of 1934 and the Investment Company Act of 1940 is recorded, processed, summarized and reported within the periods specified in the rules and forms of the Securities and Exchange Commission. Such information is accumulated and communicated to the Registrant’s management, including its principal executive officer and principal financial officer, as appropriate, to allow timely decisions regarding required disclosure. The Registrant’s management, including the principal executive officer and the principal financial officer, recognizes that any set of controls and procedures, no matter how well designed and operated, can provide only reasonable assurance of achieving the desired control objectives.
Within 90 days prior to the filing date of this Shareholder Report on Form N-CSR, the Registrant had carried out an evaluation, under the supervision and with the participation of the Registrant’s management, including the Registrant’s principal executive officer and the Registrant’s principal financial officer, of the effectiveness of the design and operation of the Registrant’s disclosure controls and procedures. Based on such evaluation, the Registrant’s principal executive officer and principal financial officer concluded that the Registrant’s disclosure controls and procedures are effective.
(b) Changes in Internal Controls. There have been no significant changes in the Registrant’s internal controls or in other factors that could significantly affect the internal controls subsequent to the date of their evaluation in connection with the preparation of this Shareholder Report on Form N-CSR.
Item 12. Exhibits.
(a)(1) Code of Ethics
(a)(2) Certifications pursuant to Section 302 of the Sarbanes-Oxley Act of 2002 of Laura F. Fergerson, Chief Executive Officer - Finance and Administration, and Gaston Gardey, Chief Financial Officer and Chief Accounting Officer
(b) Certifications pursuant to Section 906 of the Sarbanes-Oxley Act of 2002 of Laura F. Fergerson, Chief Executive Officer - Finance and Administration, and Gaston Gardey, Chief Financial Officer and Chief Accounting Officer
SIGNATURES
Pursuant to the requirements of the Securities Exchange Act of 1934 and the Investment Company Act of 1940, the registrant has duly caused this report to be signed on its behalf by the undersigned, thereunto duly authorized.
FRANKLIN CUSTODIAN FUNDS
By /s/Laura F. Fergerson
Laura F. Fergerson
Chief Executive Officer - Finance and Administration
Date May 25, 2017
Pursuant to the requirements of the Securities Exchange Act of 1934 and the Investment Company Act of 1940, this report has been signed below by the following persons on behalf of the registrant and in the capacities and on the dates indicated.
By /s/Laura F. Fergerson
Laura F. Fergerson
Chief Executive Officer - Finance and Administration
Date May 25, 2017
By /s/Gaston Gardey
Gaston Gardey
Chief Financial Officer and Chief Accounting Officer
Date May 25, 2017