UNITED STATES
SECURITIES AND EXCHANGE COMMISSION
Washington, DC 20549
FORMN-CSRS
CERTIFIED SHAREHOLDER REPORT OF REGISTERED
MANAGEMENT INVESTMENT COMPANIES
Investment Company Act file number811-00537
Franklin Custodian Funds
(Exact name of registrant as specified in charter)
One Franklin Parkway, San Mateo, CA 94403-1906
(Address of principal executive offices) (Zip code)
Craig S. Tyle, One Franklin Parkway, San Mateo, CA 94403-1906
(Name and address of agent for service)
Registrant’s telephone number, including area code:_650312-2000
Date of fiscal year end: 9/30
Date of reporting period: 3/31/20
Item 1. Reports to Stockholders.
Franklin DynaTech Fund
| Franklin U.S. Government Securities Fund
| |||||
|
| |||||
Franklin Growth Fund
| Franklin Utilities Fund
| |||||
|
| |||||
Franklin Income Fund
| ||||||
| ||||||
Sign up for electronic delivery at franklintempleton.com/edelivery
Internet Delivery of Fund Reports Unless You Request Paper Copies:Effective January 1, 2021, as permitted by the SEC, paper copies of the Fund’s shareholder reports will no longer be sent by mail, unless you specifically request them from the Fund or your financial intermediary. Instead, the reports will be made available on a website, and you will be notified by mail each time a report is posted and provided with a website link to access the report.
If you already elected to receive shareholder reports electronically, you will not be affected by this change and you need not take any action. If you have not signed up for electronic delivery, we would encourage you to join fellow shareholders who have. You may elect to receive shareholder reports and other communications electronically from the Fund by calling (800)632-2301 or by contacting your financial intermediary.
You may elect to continue to receive paper copies of all your future shareholder reports free of charge by contacting your financial intermediary or, if you invest directly with a Fund, calling (800)632-2301 to let the Fund know of your request. Your election to receive reports in paper will apply to all funds held in your account.
SHAREHOLDER LETTER
Dear Shareholder:
During 2019’s last quarter, the U.S. economy continued to grow moderately, mainly due to concerns about trade. To support the economy, the U.S. Federal Reserve (Fed) lowered the federal funds rate by 0.25% at its October 2019 meeting. However, amid larger economic risks posed by the novel coronavirus(COVID-19) outbreak towardperiod-end, the Fed lowered its key rate again by 0.50% on March 3 and further by 1.00% on March 15, decreasing the rate during the period from 2.00% to 0.25%. In its efforts to support U.S. economic activity, the Fed also announced a plan to purchase government, government-backed and corporate bonds, which would significantly expand its balance sheet.
The10-year U.S. Treasury yield was 1.68% on September 30, 2019 and decreased to 0.70% at the end of March 2020. In this environment, the prices of U.S. stocks, as measured by the Standard & Poor’s® 500 Index (S&P 500®), dropped 13.17%, (the index decreasing from 2,976.74 to 2,584.59).1,2 Investment-grade bonds, as measured by the Bloomberg Barclays U.S. Aggregate Bond Index (Bloomberg Index), posted a +3.33% total return (an index increase from 2,221.00 to 2,295.05), which includes reinvestment of income and distributions.3
We are committed to our long-term perspective and disciplined investment approach as we conduct a rigorous, fundamental analysis of securities with a regular emphasis on investment risk management.
We believe active, professional investment management serves investors well. We also recognize the important role of financial advisors in today’s markets and encourage investors to continue to seek their advice. Amid changing
markets and economic conditions, we are confident investors with a well-diversified portfolio and a patient, long-term outlook should be well-positioned for the years ahead.
Franklin Custodian Funds’ semiannual report, covering Franklin DynaTech Fund, Franklin Growth Fund, Franklin Income Fund, Franklin U.S. Government Securities Fund and Franklin Utilities Fund, includes more detail about prevailing conditions and a discussion about investment decisions during the period. Please remember all securities markets fluctuate, as do mutual fund share prices.
We thank you for investing with Franklin, welcome your questions and comments, and look forward to serving your future investment needs.
Sincerely,

Rupert H. Johnson, Jr.
Chairman
Franklin Custodian Funds
This letter reflects our analysis and opinions as of March 31, 2020, unless otherwise indicated. The information is not a complete analysis of every aspect of any market, country, industry, security or fund. Statements of fact are from sources considered reliable.
1. Source: Copyright© 2020, S&P Dow Jones Indices LLC. All rights reserved.
2. Source: Morningstar. The changes in index prices shown for the S&P 500 do not include reinvestments of income and distributions, which are included in its total return, which was: S&P 500-12.31% (index total return resulting in a decrease from 6,008.59 to 5,269.20).
3. Sources: Morningstar and Bloomberg Barclays Indices. For the Bloomberg Index, only total return as shown is available, not price change without the inclusion of reinvested income and distributions.
See www.franklintempletondatasources.com for additional data provider information.
Not FDIC Insured | May Lose Value | No Bank Guarantee
|
| franklintempleton.com | Not part of the semiannual report | 1 | ||
| 3 | ||||
| 4 | ||||
| 10 | ||||
| 16 | ||||
| 24 | ||||
| 29 | ||||
| 35 | ||||
| 93 | ||||
| 103 | ||||
| 128 | ||||
| Visitfranklintempleton.comfor fund updates, to access your account, or to find helpful financial planning tools. |
2 | Semiannual Report | franklintempleton.com | ||
U.S. equities, as measured by the Standard & Poor’s® 500 Index (S&P 500®), declined significantly during the six months under review. Equities posted strong gains throughout much of the reporting period, aided by relatively steady economic growth, easing trade tensions and the U.S. Federal Reserve’s (Fed’s) supportive monetary policy. However, a sharp selloff began in late February 2020 amid fears of a global economic slowdown due to the novel coronavirus(COVID-19) pandemic. Concerns about global supply chain disruptions, business and personal restrictions, and subdued consumer spending drove many investors to sell equity holdings in favor of perceived safe investments such as government bonds and cash.
The Fed lowered the federal funds target rate in October for the third time in 2019, to a range of 1.50%–1.75%. The labor market remained strong through February 2020 and supported consumer spending, though some parts of the economy struggled as annual industrial production contracted and capital spending declined.
However, economic activity weakened considerably as theCOVID-19 pandemic spread across the U.S. and many state and local governments issuedstay-at-home orders, which included business closures and restrictions. Weekly unemployment claims surged nearperiod-end, reflecting layoffs in many industries, particularly retail, restaurant and hospitality. As a result, the unemployment rate jumped from a50-year low of 3.5% in February 2020 to 4.4% atperiod-end, and the economy contracted in the first quarter, following an expansion that last more than a decade.1
Market volatility persisted at a heightened level throughout March 2020, as social distancing measures intended to mitigate the pandemic severely weakened the economy. In an effort to boost the U.S. economy and aid businesses and individuals directly impacted by the pandemic, the federal government passed an unprecedented $2 trillion stimulus package. Furthermore, the Fed cut the federal funds target rate to a range of 0.00%–0.25% and announced sweeping quantitative easing measures aimed at stimulating lending and credit availability. Many investors were encouraged by policymakers’ swift and decisive fiscal and stimulus measures. U.S. stocks, as measured by the S&P 500, bounced from multi-year lows, but still finished the reporting period with negative returns.
1. Source: Bureau of Labor Statistics.
| franklintempleton.com | Semiannual Report | 3 | ||
This semiannual report for Franklin DynaTech Fund covers the period ended March 31, 2020.
Your Fund’s Goal and Main Investments
The Fund seeks capital appreciation by investing primarily in equity securities of companies that emphasize innovation and new technologies, have superior management and that benefit from new industry conditions in the dynamically changing global economy.
Performance Overview
The Fund’s Class A shares posted a-2.86% cumulative total return for the six months under review. In comparison, the Russell 1000® Growth Index, which is market capitalization weighted and measures performance of those Russell 1000® Index companies with relatively higherprice-to-book ratios and higher forecasted growth rates, posted a total return of
-4.98%.1 Also for comparison, the broad U.S. stock market as measured by the Standard & Poor’s 500 Index (S&P 500), posted a-12.31% return.1 You can find the Fund’s long-term performance data in the Performance Summary beginning on page 7.
Performance data represent past performance, which does not guarantee future results. Investment return and principal value will fluctuate, and you may have a gain or loss when you sell your shares. Current performance may differ from figures shown. For most recentmonth-end performance, go tofranklintempleton.comor call(800)342-5236.
Investment Strategy
We use fundamental,bottom-up research to seek companies meeting our criteria of growth potential, quality and valuation. In seeking sustainable growth characteristics, we look for companies we believe can produce sustainable earnings and cash flow growth, evaluating the long-term market opportunity and competitive structure of an industry to target leaders and emerging leaders. We define quality companies as those with strong and improving competitive positions in attractive markets. We also believe important attributes of quality are experienced and talented management teams as well as financial strength reflected in
Portfolio Composition
Based on Total Net Assets as of 3/31/20
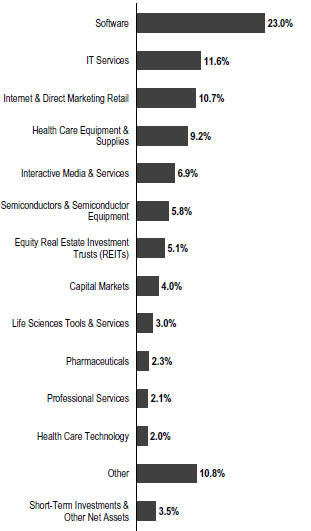
the capital structure, gross and operating margins, free cash flow generation and returns on capital employed. Our valuation analysis includes a range of potential outcomes based on an assessment of multiple scenarios. In assessing value, we consider whether security prices fully reflect the
1. Source: Morningstar.
The indexes are unmanaged and include reinvestment of any income or distributions. They do not reflect any fees, expenses or sales charges. One cannot invest directly in an index, and an index is not representative of the Fund’s portfolio.
Frank Russell Company is the source and owner of the trademarks, service marks and copyrights related to the Russell Indexes. Russell® is a trademark of Frank Russell Company.
The dollar value, number of shares or principal amount, and names of all portfolio holdings are listed in the Fund’s Statement of Investments (SOI). The SOI begins on page 40.
4 | Semiannual Report | franklintempleton.com | ||
FRANKLIN DYNATECH FUND
balance of the sustainable growth opportunities relative to business and financial risks.
We may invest in companies in any economic sector or of any market capitalization and may invest in companies both inside and outside of the U.S. Although we search for investments across a large number of sectors, we expect to have significant positions in particular sectors including, for example, technology and health care.
Manager’s Discussion
During the reporting period, the sectors that contributed most to the Fund’s absolute performance were consumer discretionary, information technology (IT) and financials.2
In consumer discretionary, online marketplace Amazon.com contributed to absolute results as shares of the company rose during theCOVID-19 outbreak in 2020’s first quarter. People increasingly turned to the online retailer for basic goods as they spent increasing amounts of time at home, boosting sales. The company also benefited from the increase in remote working, which has made more companies reliant on technology infrastructure provided by Amazon Web Services.
In IT, information software and services firm Microsoft and ecommerce platform Shopify contributed to absolute returns. Microsoft’s shares rose during the period on strong earnings reports for the third and fourth quarters of 2019, with their Intelligent Cloud line of products performing particularly well. The company also benefited from news that the U.S. Department of Defense had awarded Microsoft a lucrative contract to provide cloud computing services. Shares of Shopify were boosted by better-than-expected third and fourth quarter 2019 earnings reports and increased guidance for 2020. Highlights included strong growth in both the value of transactions made over the platform and new international retailers. Semiconductor company NVIDIA also helped performance.
In financials, index and portfolio risk and performance analytics provider MSCI benefited absolute performance.
In contrast, the industrials, health care and communication services sectors detracted from absolute performance.3
In industrials, aerospace firm Boeing detracted from absolute performance. The company has been hard hit by both theCOVID-19 outbreak, which has drastically cut international travel, and continued safety concerns about Boeing’s flagship 737 MAX passenger airliner. Both of these factors have led to significant order cancellations for the 737 MAX. Aerospace and electronics supplier HEICO detracted from results as its shares were also hit hard by the steep decline in commercial air travel caused byCOVID-19, which should lead to a drop in demand for plane parts. Defense contractor Raytheon hurt results as well.
Top 10 Holdings
3/31/20
Company Sector/Industry
| % of Total
| |||
Amazon.com Inc. Internet & Direct Marketing Retail
| 7.3 | % | ||
Microsoft Corp. Software
| 4.4 | % | ||
Alphabet Inc. Interactive Media & Services
| 3.4 | % | ||
Mastercard Inc. IT Services
| 2.5 | % | ||
ServiceNow Inc. Software
| 2.2 | % | ||
Visa Inc. IT Services
| 2.2 | % | ||
Shopify Inc. IT Services
| 2.0 | % | ||
Adobe Inc. Software
| 1.7 | % | ||
Facebook Inc. Interactive Media & Services
| 1.6 | % | ||
Alibaba Group Holding Ltd. Internet & Direct Marketing Retail
| 1.6 | % | ||
In health care, medical technology company Stryker hurt absolute performance.
Elsewhere, financial technology company Mastercard hurt absolute returns. Shares slid after the company issued a warning that theCOVID-19 outbreak and the accompanying economic slowdown would likely hurt 2020 revenues.
2. The consumer discretionary sector comprises automobiles; diversified consumer services; internet and direct marketing retail; and textiles, apparel and luxury goods in the SOI. The IT sector comprises communications equipment; electronic equipment, instruments and components; IT services; semiconductors and semiconductor equipment; software; and technology hardware, storage and peripherals in the SOI. The financials sector comprises capital markets in the SOI.
3. The industrials sector comprises aerospace and defense, industrial conglomerates, machinery and professional services in the SOI. The health care sector comprises biotechnology, health care equipment and supplies, health care providers and services, health care technology, life sciences tools and services, and pharmaceuticals in the SOI. The communication services sector comprises entertainment, interactive media and services, and media in the SOI.
See www.franklintempletondatasources.com for additional data provider information.
| franklintempleton.com | Semiannual Report | 5 | ||
FRANKLIN DYNATECH FUND
Thank you for your continued participation in Franklin DynaTech Fund. We look forward to serving your future investment needs.
|
Matthew J. Moberg, CPA
| |
 |
Rupert H. Johnson, Jr.
Portfolio Management Team |


The foregoing information reflects our analysis, opinions and portfolio holdings as of March 31, 2020, the end of the reporting period. The way we implement our main investment strategies and the resulting portfolio holdings may change depending on factors such as market and economic conditions. These opinions may not be relied upon as investment advice or an offer for a particular security. The information is not a complete analysis of every aspect of any market, country, industry, security or the Fund. Statements of fact are from sources considered reliable, but the investment manager makes no representation or warranty as to their completeness or accuracy. Although historical performance is no guarantee of future results, these insights may help you understand our investment management philosophy.
6 | Semiannual Report | franklintempleton.com | ||
FRANKLIN DYNATECH FUND
Performance Summary as of March 31, 2020
The performance table does not reflect any taxes that a shareholder would pay on Fund dividends, capital gain distributions, if any, or any realized gains on the sale of Fund shares. Total return reflects reinvestment of the Fund’s dividends and capital gain distributions, if any, and any unrealized gains or losses. Your dividend income will vary depending on dividends or interest paid by securities in the Fund’s portfolio, adjusted for operating expenses of each class. Capital gain distributions are net profits realized from the sale of portfolio securities.
Performance as of 3/31/201
Cumulative total return excludes sales charges. Average annual total return includes maximum sales charges. Sales charges will vary depending on the size of the investment and the class of share purchased. The maximum is 5.50% and the minimum is 0%.Class A:5.50% maximum initial sales charge;Advisor Class:no sales charges. For other share classes, visitfranklintempleton.com.
| Share Class | Cumulative Total Return2 | Average Annual Total Return3 | ||||
A4 | ||||||
6-Month | -2.86% | -8.20% | ||||
1-Year | +0.83% | -4.72% | ||||
5-Year | +83.36% | +11.62% | ||||
10-Year | +269.99% | +13.33% | ||||
Advisor | ||||||
6-Month | -2.74% | -2.74% | ||||
1-Year | +1.09% | +1.09% | ||||
5-Year | +85.66% | +13.17% | ||||
10-Year | +279.33% | +14.26% | ||||
Performance data represent past performance, which does not guarantee future results. Investment return and principal value will fluctuate, and you may have a gain or loss when you sell your shares. Current performance may differ from figures shown. For most recentmonth-end performance, go tofranklintempleton.comor call(800)342-5236.
See page 8 for Performance Summary footnotes.
| franklintempleton.com | Semiannual Report | 7 | ||
FRANKLIN DYNATECH FUND
PERFORMANCE SUMMARY
Distributions(10/1/19–3/31/20)
| Share Class | Long-Term Capital Gain | |||
| A | $0.6598 | |||
| C | $0.6598 | |||
| R | $0.6598 | |||
| R6 | $0.6598 | |||
| Advisor | $0.6598 | |||
Total Annual Operating Expenses5
| Share Class | With Fee Waiver | Without Fee Waiver | ||||||||||
| A | 0.86% | 0.87 | % | |||||||||
| Advisor | 0.61% | 0.62 | % | |||||||||
Each class of shares is available to certain eligible investors and has different annual fees and expenses, as described in the prospectus.
All investments involve risks, including possible loss of principal. Stocks historically have outperformed other asset classes over the long term, but tend to fluctuate more dramatically over the short term. Investments in fast-growing industries, like the technology and health care sectors (which have historically been volatile) could result in increased price fluctuation, especially over the short term, due to the rapid pace of product change and development and changes in government regulation of companies emphasizing scientific or technological advancement or regulatory approval for new drugs and medical instruments. The Fund may also invest in small- andmid-capitalization companies, which can be particularly sensitive to changing economic conditions, and their prospects for growth are less certain than those of larger, more established companies. Unexpected events and their aftermaths, such as the spread of deadly diseases; natural, environmental orman-made disasters; financial, political or social disruptions; terrorism and war; and other tragedies or catastrophes, can cause investor fear and panic, which can adversely affect the economies of many companies, sectors, nations, regions and the market in general, in ways that cannot necessarily be foreseen. The Fund’s prospectus also includes a description of the main investment risks.
1. The Fund has a fee waiver associated with any investment it makes in a Franklin Templeton money fund and/or other Franklin Templeton fund, contractually guaranteed through 1/31/21. Fund investment results reflect the fee waiver; without this waiver, the results would have been lower.
2. Cumulative total return represents the change in value of an investment over the periods indicated.
3. Average annual total return represents the average annual change in value of an investment over the periods indicated. Return for less than one year, if any, has not been annualized.
4. Prior to 9/10/18, these shares were offered at a higher initial sales charge of 5.75%, thus actual returns (with sales charges) would have differed. Average annual total returns (with sales charges) have been restated to reflect the current maximum initial sales charge of 5.50%.
5. Figures are as stated in the Fund’s current prospectus and may differ from the expense ratios disclosed in the Your Fund’s Expenses and Financial Highlights sections in this report. In periods of market volatility, assets may decline significantly, causing total annual Fund operating expenses to become higher than the figures shown.
8 | Semiannual Report | franklintempleton.com | ||
FRANKLIN DYNATECH FUND
Your Fund’s Expenses
As a Fund shareholder, you can incur two types of costs: (1) transaction costs, including sales charges (loads) on Fund purchases and redemptions; and (2) ongoing Fund costs, including management fees, distribution and service(12b-1) fees, and other Fund expenses. All mutual funds have ongoing costs, sometimes referred to as operating expenses. The table below shows ongoing costs of investing in the Fund and can help you understand these costs and compare them with those of other mutual funds. The table assumes a $1,000 investment held for the six months indicated.
Actual Fund Expenses
The table below provides information about actual account values and actual expenses in the columns under the heading “Actual.” In these columns the Fund’s actual return, which includes the effect of Fund expenses, is used to calculate the “Ending Account Value” for each class of shares. You can estimate the expenses you paid during the period by following these steps (of course, your account value and expenses will differ from those in this illustration): Divide your account value by $1,000 (if your account had an $8,600 value, then $8,600÷ $1,000 = 8.6). Then multiply the result by the number in the row for your class of shares under the headings “Actual” and “Expenses Paid During Period” (if Actual Expenses Paid During Period were $7.50, then 8.6 x $7.50 = $64.50). In this illustration, the actual expenses paid this period are $64.50.
Hypothetical Example for Comparison with Other Funds
Under the heading “Hypothetical” in the table, information is provided about hypothetical account values and hypothetical expenses based on the Fund’s actual expense ratio and an assumed rate of return of 5% per year before expenses, which is not the Fund’s actual return. This information may not be used to estimate the actual ending account balance or expenses you paid for the period, but it can help you compare ongoing costs of investing in the Fund with those of other funds. To do so, compare this 5% hypothetical example for the class of shares you hold with the 5% hypothetical examples that appear in the shareholder reports of other funds.
Please note that expenses shown in the table are meant to highlight ongoing costs and do not reflect any transactional costs. Therefore, information under the heading “Hypothetical” is useful in comparing ongoing costs only, and will not help you compare total costs of owning different funds. In addition, if transactional costs were included, your total costs would have been higher.
| Actual | Hypothetical | |||||||||||
| (actual return after expenses) | (5% annual return before expenses) | |||||||||||
|
| |||||||||||
Share Class | Beginning Account Value 10/1/19 | Ending Account Value 3/31/20 | Expenses Paid During Period 10/1/19–3/31/201, 2 | Ending Account Value 3/31/20 | Expenses Paid During 10/1/19–3/31/201,2 | Net Annualized Expense Ratio2 | ||||||
|
|
|
| |||||||||
A | $1,000 | $971.40 | $4.09 | $1,020.85 | $4.19 | 0.83% | ||||||
C | $1,000 | $967.80 | $7.77 | $1,017.10 | $7.97 | 1.58% | ||||||
R | $1,000 | $970.20 | $5.32 | $1,019.60 | $5.45 | 1.08% | ||||||
R6 | $1,000 | $973.10 | $2.37 | $1,022.60 | $2.43 | 0.48% | ||||||
Advisor | $1,000 | $972.60 | $2.86 | $1,022.10 | $2.93 | 0.58% | ||||||
1. Expenses are equal to the annualized expense ratio for thesix-month period as indicated above—in the far right column—multiplied by the simple average account value over the period indicated, and then multiplied by 183/366 to reflect theone-half year period.
2. Reflects expenses after fee waivers and expense reimbursements. Does not include acquired fund fees and expenses.
| franklintempleton.com | Semiannual Report | 9 | ||
This semiannual report for Franklin Growth Fund covers the period ended March 31, 2020.
Your Fund’s Goal and Main Investments
The Fund seeks capital appreciation by investing substantially in equity securities of companies that are leaders in their industries.
Performance Overview
The Fund’s Class A shares posted a-9.39% cumulative total return for the six months under review. In comparison, the Standard & Poor’s 500 Index (S&P 500), which is a broad measure of U.S. stock performance, posted a-12.31% total return.1 You can find the Fund’s long-term performance data in the Performance Summary beginning on page 13.
Performance data represent past performance, which does not guarantee future results. Investment return will fluctuate. Current performance may differ from figures shown. For most recentmonth-end performance, go tofranklintempleton.comor call(800)342-5236.
Investment Strategy
We use fundamental,bottom-up research to seek companies meeting our criteria of growth potential, quality and valuation. In seeking sustainable growth characteristics, we look for companies we believe can produce sustainable earnings and cash flow growth, evaluating the long-term market opportunity and competitive structure of an industry to target leaders and emerging leaders. We define quality companies as those with strong and improving competitive positions in attractive markets. We also believe important attributes of quality are experienced and talented management teams as well as financial strength reflected in the capital structure, gross and operating margins, free cash flow generation and returns on capital employed. Our valuation analysis includes a range of potential outcomes based on an assessment of multiple scenarios. In assessing value, we consider whether security prices fully reflect the balance of the sustainable growth opportunities relative to business and financial risks. The investment manager’s process generally includes an assessment of the potential impacts of any material environmental, social and
Portfolio Composition
Based on Total Net Assets as of 3/31/20
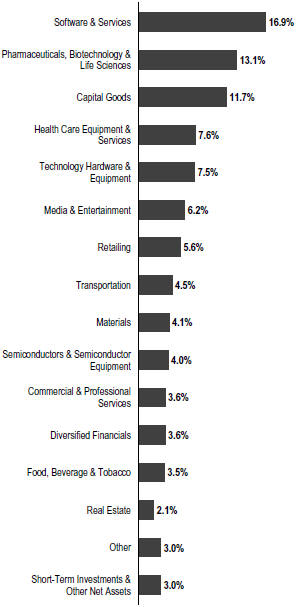
governance (“ESG”) factors on the long-term risk and return profile of a company.
1. Source: Morningstar.
The index is unmanaged and includes reinvestment of any income or distributions. It does not reflect any fees, expenses or sales charges. One cannot invest directly in an index, and an index is not representative of the Fund’s portfolio.
The dollar value, number of shares or principal amount, and names of all portfolio holdings are listed in the Fund’s Statement of Investments (SOI). The SOI begins on page 50.
10 | Semiannual Report | franklintempleton.com | ||
FRANKLIN GROWTH FUND
Manager’s Discussion
During the period under review, the consumer discretionary sector notably contributed to performance, led by online marketplace Amazon.com, as shares of the company rose during theCOVID-19 outbreak in 2020’s first quarter.2 People increasingly turned to the online retailer for basic goods as they spent increasing amounts of time at home, boosting sales. The company also benefited from the increase in remote working, which has made more companies reliant on technology infrastructure provided by Amazon Web Services.
Other key contributors included personal computing device manufacturer and service provider Apple, information software and services firm Microsoft, 3D graphics products designer NVIDIA, cable and broadband communications provider Cable One and pharmaceutical products manufacturer Eli Lilly. Apple reported a solid end to its fiscal year, strong first quarter 2020 results and second quarter earnings guidance. Apple’s supply chain has remained intact, as evidenced by new product launches, and demand for the company’s products and services, particularly wearable technology, has continued amid theCOVID-19 pandemic. Microsoft’s shares rose during the period based on strong earnings reports for 2019’s third and fourth quarters, with their Intelligent Cloud line of products performing particularly well. The company also benefited from news that the U.S. Department of Defense had awarded Microsoft a lucrative contract to provide cloud computing services.
In contrast, the industrials, materials and health care sectors detracted from Fund performance.3 In the industrials sector, aerospace companies Boeing, Northrop Grumman and General Dynamics were key detractors. Boeing has been hard hit by both theCOVID-19 outbreak, which has drastically cut international travel, and continued safety concerns about Boeing’s flagship 737 MAX passenger airliner. Both factors have led to significant order cancellations for the 737 MAX. Aerospace, defense and cybersecurity company Northrop Grumman reported increased fourth-quarter and fiscal year (FY) 2019 sales and stable related earnings, but the company’s earnings guidance continued to disappoint investors as bookings and organic growth started to lag. In the materials sector, Ecolab, which engages in the provision of products and services in the field of water, hygiene and energy, and specialty
Top 10 Holdings
3/31/20
Company Sector/Industry | % of Total Net Assets | |||
Apple Inc. Technology Hardware & Equipment
| 5.1 | % | ||
Amazon.com Inc. Retailing
| 4.8 | % | ||
Microsoft Corp. Software & Services
| 3.8 | % | ||
Alphabet Inc. Media & Entertainment
| 2.6 | % | ||
Mastercard Inc. Software & Services
| 2.4 | % | ||
Northrop Grumman Corp. Capital Goods
| 2.3 | % | ||
Mettler-Toledo International Inc. Pharmaceuticals, Biotechnology & Life Sciences
| 2.1 | % | ||
ServiceNow Inc. Software & Services
| 2.0 | % | ||
Union Pacific Corp. Transportation
| 2.0 | % | ||
Intuit Inc. Software & Services
| 1.6 | % | ||
materials company Celanese were notable detractors. Ecolab performed well during the period through the first quarter of fiscal year 2020. However, despite the company’s health care business, the slowdown in business activity for its core hotel and restaurant customers amid theCOVID-19 pandemic and the company’s recent issuance of long-term debt concerned investors. In the health care sector, medical technology products provider Teleflex hindered results. In other sectors, connectivity and sensors manufacturer TE Connectivity also hurt performance.
2. The consumer discretionary sector comprises automobiles and components, consumer durables and apparel, consumer services and retailing in the SOI.
3. The industrials sector comprises capital goods, commercial and professional services, and transportation in the SOI. The health care sector comprises health care equipment and services and pharmaceuticals, biotechnology and life sciences in the SOI.
See www.franklintempletondatasources.com for additional data provider information.
| franklintempleton.com | Semiannual Report | 11 | ||
FRANKLIN GROWTH FUND
Thank you for your continued participation in Franklin Growth Fund. We look forward to serving your future investment needs.
 |
Serena Perin Vinton, CFA Lead Portfolio Manager | |
| Chris Anderson | ||
| Robert Rendler, CFA | ||
| Portfolio Management Team | ||

The foregoing information reflects our analysis, opinions and portfolio holdings as of March 31, 2020, the end of the reporting period. The way we implement our main investment strategies and the resulting portfolio holdings may change depending on factors such as market and economic conditions. These opinions may not be relied upon as investment advice or an offer for a particular security. The information is not a complete analysis of every aspect of any market, country, industry, security or the Fund. Statements of fact are from sources considered reliable, but the investment manager makes no representation or warranty as to their completeness or accuracy. Although historical performance is no guarantee of future results, these insights may help you understand our investment management philosophy.
CFA® is a trademark owned by CFA Institute.
12 | Semiannual Report | franklintempleton.com | ||
FRANKLIN GROWTH FUND
Performance Summary as of March 31, 2020
The performance table does not reflect any taxes that a shareholder would pay on Fund dividends, capital gain distributions, if any, or any realized gains on the sale of Fund shares. Total return reflects reinvestment of the Fund’s dividends and capital gain distributions, if any, and any unrealized gains or losses. Your dividend income will vary depending on dividends or interest paid by securities in the Fund’s portfolio, adjusted for operating expenses of each class. Capital gain distributions are net profits realized from the sale of portfolio securities.
Performance as of 3/31/201
Cumulative total return excludes sales charges. Average annual total return includes maximum sales charges. Sales charges will vary depending on the size of the investment and the class of share purchased. The maximum is 5.50% and the minimum is 0%.Class A:5.50% maximum initial sales charge;Advisor Class:no sales charges. For other share classes, visitfranklintempleton.com.
| Share Class | Cumulative Total Return2 | Average Annual Total Return3 | ||||||
A4 | ||||||||
6-Month | -9.39 | % | -14.37 | % | ||||
1-Year | -3.81 | % | -9.10 | % | ||||
5-Year | +45.24 | % | +6.54 | % | ||||
10-Year | +175.06 | % | +10.02 | % | ||||
Advisor | ||||||||
6-Month | -9.27 | % | -9.27 | % | ||||
1-Year | -3.56 | % | -3.56 | % | ||||
5-Year | +47.08 | % | +8.02 | % | ||||
10-Year | +182.04 | % | +10.93 | % | ||||
Performance data represent past performance, which does not guarantee future results. Investment return and principal value will fluctuate, and you may have a gain or loss when you sell your shares. Current performance may differ from figures shown. For most recentmonth-end performance, go tofranklintempleton.comor call(800)342-5236.
See page 14 for Performance Summary footnotes.
| franklintempleton.com | Semiannual Report | 13 | ||
FRANKLIN GROWTH FUND
PERFORMANCE SUMMARY
Distributions(10/1/19–3/31/20)
| Share Class | Net Investment Income | Long-Term Capital Gain | Total | |||||||||
| A | $0.4554 | $5.9943 | $6.4497 | |||||||||
| C | $ — | $5.9943 | $5.9943 | |||||||||
| R | $0.1320 | $5.9943 | $6.1263 | |||||||||
| R6 | $0.8426 | $5.9943 | $6.8369 | |||||||||
| Advisor | $0.7272 | $5.9943 | $6.7215 | |||||||||
Total Annual Operating Expenses5
| Share Class | With Fee Waiver | Without Fee Waiver | ||||
| A | 0.84% | 0.84% | ||||
Advisor | 0.59% | 0.59% |
Each class of shares is available to certain eligible investors and has different annual fees and expenses, as described in the prospectus.
All investments involve risks, including possible loss of principal. Historically, the Fund has focused on larger companies. The Fund may also invest in small, relatively new and/or unseasoned companies, which involves additional risks, as the price of these securities can be volatile, particularly over the short term. The Fund may focus on particular sectors of the market from time to time, which can carry greater risks of adverse developments in such sectors. In addition, the Fund may invest up to 40% of its net assets in stocks of foreign companies, which involve special risks, including currency fluctuations and economic as well as political uncertainty. Unexpected events and their aftermaths, such as the spread of deadly diseases; natural, environmental orman-made disasters; financial, political or social disruptions; terrorism and war; and other tragedies or catastrophes, can cause investor fear and panic, which can adversely affect the economies of many companies, sectors, nations, regions and the market in general, in ways that cannot necessarily be foreseen. The Fund’s prospectus also includes a description of the main investment risks.
1. The Fund has a fee waiver associated with any investment it makes in a Franklin Templeton money fund and/or other Franklin Templeton fund, contractually guaranteed through 1/31/21. Fund investment results reflect the fee waiver; without this waiver, the results would have been lower.
2. Cumulative total return represents the change in value of an investment over the periods indicated.
3. Average annual total return represents the average annual change in value of an investment over the periods indicated. Return for less than one year, if any, has not been annualized.
4. Prior to 9/10/18, these shares were offered at a higher initial sales charge of 5.75%, thus actual returns (with sales charges) would have differed. Average annual total returns (with sales charges) have been restated to reflect the current maximum initial sales charge of 5.50%.
5. Figures are as stated in the Fund’s current prospectus and may differ from the expense ratios disclosed in the Your Fund’s Expenses and Financial Highlights sections in this report. In periods of market volatility, assets may decline significantly, causing total annual Fund operating expenses to become higher than the figures shown.
14 | Semiannual Report | franklintempleton.com | ||
FRANKLIN GROWTH FUND
Your Fund’s Expenses
As a Fund shareholder, you can incur two types of costs: (1) transaction costs, including sales charges (loads) on Fund purchases and redemptions; and (2) ongoing Fund costs, including management fees, distribution and service(12b-1) fees, and other Fund expenses. All mutual funds have ongoing costs, sometimes referred to as operating expenses. The table below shows ongoing costs of investing in the Fund and can help you understand these costs and compare them with those of other mutual funds. The table assumes a $1,000 investment held for the six months indicated.
Actual Fund Expenses
The table below provides information about actual account values and actual expenses in the columns under the heading “Actual.” In these columns the Fund’s actual return, which includes the effect of Fund expenses, is used to calculate the “Ending Account Value” for each class of shares. You can estimate the expenses you paid during the period by following these steps (ofcourse, your account value and expenses will differ from those in this illustration):Divide your account value by $1,000 (ifyour account had an $8,600 value, then $8,600÷ $1,000 = 8.6). Then multiply the result by the number in the row for your class of shares under the headings “Actual” and “Expenses Paid During Period” (ifActual Expenses Paid During Period were $7.50, then 8.6 x $7.50 = $64.50). In this illustration, the actual expenses paid this period are $64.50.
Hypothetical Example for Comparison with Other Funds
Under the heading “Hypothetical” in the table, information is provided about hypothetical account values and hypothetical expenses based on the Fund’s actual expense ratio and an assumed rate of return of 5% per year before expenses, which is not the Fund’s actual return. This information may not be used to estimate the actual ending account balance or expenses you paid for the period, but it can help you compare ongoing costs of investing in the Fund with those of other funds. To do so, compare this 5% hypothetical example for the class of shares you hold with the 5% hypothetical examples that appear in the shareholder reports of other funds.
Please note that expenses shown in the table are meant to highlight ongoing costs and do not reflect any transactional costs. Therefore, information under the heading “Hypothetical” is useful in comparing ongoing costs only, and will not help you compare total costs of owning different funds. In addition, if transactional costs were included, your total costs would have been higher.
Actual (actual return after expenses) | Hypothetical (5% annual return before expenses) | |||||||||||
|
| |||||||||||
| Share Class | Beginning Account Value 10/1/19 | Ending Account Value 3/31/20 | Expenses Paid During 10/1/19–3/31/201, 2 | Ending Account Value 3/31/20 | Expenses Paid During 10/1/19–3/31/201,2 | Net Annualized Expense Ratio2 | ||||||
|
|
|
| |||||||||
A | $1,000 | $906.10 | $3.86 | $1,020.95 | $4.09 | 0.81% | ||||||
C | $1,000 | $902.80 | $7.42 | $1,017.20 | $7.87 | 1.56% | ||||||
R | $1,000 | $904.90 | $5.05 | $1,019.70 | $5.35 | 1.06% | ||||||
R6 | $1,000 | $907.80 | $2.24 | $1,022.65 | $2.38 | 0.47% | ||||||
Advisor | $1,000 | $907.30 | $2.67 | $1,022.20 | $2.83 | 0.56% | ||||||
1. Expenses are equal to the annualized expense ratio for thesix-month period as indicated above—in the far right column—multiplied by the simple average account value over the period indicated, and then multiplied by 183/366 to reflect theone-half year period.
2. Reflects expenses after fee waivers and expense reimbursements. Does not include acquired fund fees and expenses.
| franklintempleton.com | Semiannual Report | 15 | ||
This semiannual report for Franklin Income Fund covers the period ended March 31, 2020.
Your Fund’s Goal and Main Investments
The Fund seeks to maximize income, while maintaining prospects for capital appreciation by investing, under normal market conditions, in a diversified portfolio of debt and equity securities.
Performance Overview
The Fund’s Class A shares posted a cumulative total return of-13.46% for the six months under review. In comparison, the Fund’s equity benchmark, the Standard & Poor’s 500 Index (S&P 500), which is a broad measure of U.S. stock performance, posted a-12.31% total return.1 The Fund’s secondary benchmark, the blended 50% MSCI USD High Dividend Yield Index + 25% Bloomberg Barclays High Yield Very Liquid Index + 25% Bloomberg Barclays U.S. Aggregate Index (Blended Benchmark), which is a combination of leading stock and bond indexes, posted a-10.34% total return.2 The Fund’s peers, as measured by the Lipper Mixed-Asset Target Allocation Moderate Funds Classification Average, which consists of funds chosen by Lipper that, by practice, maintain a mix of 40% to 60% equity securities, with the remainder in bonds and cash, posted a-9.90% total return.3 You can find the Fund’s long-term performance data in the Performance Summary beginning on page 20.
Performance data represent past performance, which does not guarantee future results. Investment return will fluctuate. Current performance may differ from figures shown. For most recentmonth-end performance, go tofranklintempleton.comor call(800)342-5236.
Investment Strategy
In analyzing debt and equity securities, we consider such factors as a company’s experience and managerial strength; responsiveness to changes in interest rates and business conditions; debt maturity schedules and borrowing
Dividend Distributions*
10/1/19–3/31/20
| Dividend per Share (cents) | ||||||||||||||||||||||||
| Month | Class A | Class A1 | Class C | Class R | Class R6 | Advisor Class | ||||||||||||||||||
October | 0.98 | 1.00 | 0.90 | 0.93 | 1.03 | 1.02 | ||||||||||||||||||
November | 0.98 | 1.00 | 0.90 | 0.93 | 1.03 | 1.02 | ||||||||||||||||||
December | 0.98 | 1.00 | 0.90 | 0.93 | 1.03 | 1.02 | ||||||||||||||||||
January | 0.98 | 1.00 | 0.90 | 0.93 | 1.03 | 1.02 | ||||||||||||||||||
February | 0.98 | 1.00 | 0.90 | 0.93 | 1.03 | 1.02 | ||||||||||||||||||
March | 0.98 | 1.00 | 0.90 | 0.93 | 1.03 | 1.02 | ||||||||||||||||||
Total | 5.88 | 6.00 | 5.40 | 5.58 | 6.18 | 6.12 | ||||||||||||||||||
*The distribution amount is the sum of all estimatedtax-basis net investment income distributions for the period shown. A portion or all of the distribution may be reclassified as return of capital or short-term or long-term capital gains once final tax designations are known. All Fund distributions will vary depending upon current market conditions, and past distributions are not indicative of future trends.
requirements; changing financial condition and market recognition of the change; and a security’s relative value based on such factors as anticipated cash flow, interest or dividend coverage, asset coverage and earnings. When choosing investments for the Fund, we apply abottom-up, value oriented, long-term approach, focusing on the market price of a company’s securities relative to the investment manager’s evaluation of the company’s long-term earning, asset value and cash flow potential.
Manager’s Discussion
During the period under review, our equity weighting increased from 47.8% to 52.0%, and our fixed income weighting decreased from 50.0% to 45.8%. The Fund’s cash position remained unchanged at 2.2% of total net assets.
The period under review was characterized by significant shifts in sentiment and fundamentals that ultimately led to meaningful declines across risk assets. Slowing growth and rising recessionary fears in many economies at the start of the period gradually gave way to signs of improving growth as trade tensions eased, particularly between the U.S. and
1. Source: Morningstar.
2. Source: Factset. The Fund’s Blended Benchmark was calculated internally and rebalanced monthly.
3. Source: Lipper, a Thomson Reuters Company. For thesix-month period ended 3/31/20, this category consisted of 598 funds. Lipper calculations do not include sales charges or expense subsidization by a fund’s manager. The Fund’s performance relative to the average may have differed if these and other factors had been considered. The indexes are unmanaged and include reinvestment of any income or distributions. They do not reflect any fees, expenses or sales charges. One cannot invest directly in an index, and an index is not representative of the Fund’s portfolio.
See www.franklintempletondatasources.com for additional data provider information.
The dollar value, number of shares or principal amount, and names of all portfolio holdings are listed in the Fund’s Statement of Investments (SOI).
The SOI begins on page 61.
16 | Semiannual Report | franklintempleton.com | ||
FRANKLIN INCOME FUND
China. Equities rose to start the new year buoyed by the prospects for a resumption of revenue and earnings growth before ultimately succumbing to the devastating human and economic effects of theCOVID-19 pandemic.
Atperiod-end, the global economy remained largely sidelined due to broadshelter-in-place restrictions designed to curtail the spread ofCOVID-19. Recessionary conditions were widespread and we believe it will continue into the second quarter of 2020.
Weakening demand for energy due to the sharp contraction in economic activity as a result of the pandemic was also compounded by a market share battle, which resulted as negotiations broke down between major oil producers within the Organization of the Petroleum Exporting Countries (collectively OPEC+, including Saudi Arabia and Russia). Oil prices collapsed as a result, falling more than 60% during the period.
The CBOE Volatility Index (VIX) closed at anall-time high of 82.69 on March 16, 2020, eclipsing the previous record high of 80.86 on November 20, 2008, as markets struggled with record levels of volatility. Risk-free assets, U.S. Treasury securities in particular, rallied as investors sought havens from the turmoil dominating global markets. The yield on10-year U.S. Treasuries declined from 1.68% at the start of the period to 0.67% atperiod-end.
The Fund declined during the period with losses experienced during the final five weeks asCOVID-19 triggered the fastest bear market on record from a previousall-time record high. Dividend stocks, particularly value-oriented sectors such as financials and energy, underperformed and the equity component of the Fund’s Blended Benchmark declined with the MSCI USD High Dividend Yield Index posting negative returns atperiod-end. Corporate credit struggled to adjust to the rapid deterioration, which impacted both investment-grade and noninvestment-grade bonds during the period. Buoyed by the rally in U.S. Treasuries, the benchmark Bloomberg Barclays U.S. Aggregate Index posted positive returns, while the Bloomberg Barclays High Yield Very Liquid Index declined.
The Fund entered the period with a fairly balanced weighting across fixed-income and equity securities, while also holding a portion in cash equivalents, which helped to mute losses experienced in equities and corporate debt securities.
Fixed income holdings declined slightly during the period as outperformance (relative to equities) was offset by shifts in asset allocation as we reduced holdings of U.S. Treasuries
Portfolio Composition
3/31/20
| % of Total Net Assets | ||
Equity* | 52.0% | |
Financials | 9.5% | |
Information Technology | 8.2% | |
Health Care | 7.4% | |
Utilities | 5.0% | |
Energy | 4.4% | |
Communication Services | 4.1% | |
Industrials | 3.9% | |
Consumer Discretionary | 3.6% | |
Consumer Staples | 2.8% | |
Materials | 2.7% | |
Real Estate | 0.4% | |
Fixed Income** | 45.8% | |
Financials | 16.8% | |
Health Care | 13.6% | |
Communication Services | 5.8% | |
Energy | 2.8% | |
Consumer Discretionary | 2.3% | |
Materials | 1.2% | |
Consumer Staples | 1.0% | |
Real Estate | 0.6% | |
Utilities | 0.6% | |
Industrials | 0.6% | |
Information Technology | 0.5% | |
Short-Term Investments & Other Net Assets | 2.2% | |
*Includes convertible bonds.
**Includes senior floating rate interests and index-linked notes.
and Agency MBS to take advantage of what we considered lower equity prices and valuations.
U.S. Treasury holdings and Agency MBS generated positive gains during the period, while all other corporate sectors experienced negative returns.
Corporate bond weakness was felt most acutely in the energy sector due to the double hit from an extreme lack of demand as a result ofCOVID-19 and rising supplies due to the market share war following the breakdown in negotiations with the OPEC+ oil producers during the period. Energy sector fixed-income holdings declined over the period with the most substantial declines experienced by Chesapeake Energy, Weatherford International and HighPoint Operating Corporation.
| franklintempleton.com | Semiannual Report | 17 | ||
FRANKLIN INCOME FUND
Other meaningful detractors from absolute returns during the period among fixed-income sectors included health care, consumer discretionary and financials.
Within health care, holdings in hospital companies CHS/Community Health Systems and Tenet Healthcare came under modest pressure during the period and detracted from total returns. Offsetting that weakness, holdings in pharmaceutical companies including Endo, Bristol-Myers Squibb, Abbvie and AstraZeneca generated modest positive total returns.
Top Five Equity Holdings*
3/31/20
Company Sector/Industry | % of Total Net Assets | |
Intel Corp. | 2.1% | |
Information Technology | ||
The Southern Co. | 1.9% | |
Utilities | ||
Bristol-Myers Squibb Co. | 1.7% | |
Health Care | ||
Dominion Energy Inc. | 1.7% | |
Utilities | ||
Bank of America Corp. | 1.6% | |
Financials | ||
*Includes convertible bonds.
Consumer discretionary holdings struggled as businesses across the country succumbed toCOVID-19 containment measures causing many businesses to shut completely, while consumers were urged to stay home to stop the spread. As a result, holdings such as24-Hour Fitness Worldwide and Belk department stores suffered losses and auto manufacturers Ford Motor and General Motors ceased auto production and saw sales decline as the shutdown gripped the U.S. economy.
Financials also came under pressure as interest rates collapsed and fears of rising credit losses negatively impacted the sector. The Fund experienced modest losses in fixed-income holdings of JPMorgan Chase, Citigroup, Prudential Financial and Capital One Financial.
Turning to equities, our holdings increased slightly during the period. As an asset-class, equities underperformed during the period. We used the weakness and volatility during the month of March 2020 to shift assets out of areas that outperformed including U.S. Treasuries and Agency MBS, while adding to common stocks, convertible securities and equity linked notes.
Top Five Fixed Income Holdings*
3/31/20
Company Sector/Industry | % of Total Net Assets | |
U.S. Treasury Note | 6.0% | |
Financials | ||
CHS/Community Health Systems Inc. | 5.5% | |
Health Care | ||
Tenet Healthcare Corp. | 3.1% | |
Health Care | ||
U.S. Treasury Bond | 2.6% | |
Financials | ||
GNMA II SF 30 Year | 1.7% | |
Financials | ||
*Includes senior floating rate interests and index-linked notes.
All sectors were negative during the period with significant weakness experienced in energy, financials and consumer discretionary, while declines were more modest in information technology and health care.
The Fund’s weighting in the energy sector declined over the period as losses in energy companies were widespread during the period with minimal differentiation related to long-term viability. Losses were extreme among both oil and gas producers and oilfield service companies, with sharp declines experienced by Occidental Petroleum (not held atperiod-end), Schlumberger, Weatherford International and Royal Dutch Shell.
Financials sector holdings struggled with rapidly falling interest rates and fears of elevated credit losses as recessionary conditions took hold due to the pandemic. Holdings of Wells Fargo, Bank of America, MetLife and JPMorgan Chase all negatively impacted Fund results.
The speed of the contraction in economic activity severely challenged global auto manufacturers, leading to sharp declines among equity holdings in Ford Motor, General Motors and Daimler Benz (not held atperiod-end).
Offsetting some of the weakness in equities were positive total returns among a handful of information technology companies including Intel, NVIDIA and Microsoft. Similarly, select holdings in health care generated positive returns including pharmaceutical positions in Bristol-Myers Squibb, AstraZeneca and Gilead Sciences.
During the period, the Fund used derivatives such as equity call and put options to sell and reduce positions and/or initiate and add to positions. The Fund also used equity index put spreads, which generated gains byperiod-end.
18 | Semiannual Report | franklintempleton.com | ||
FRANKLIN INCOME FUND
Thank you for your continued participation in Franklin Income Fund. We look forward to serving your future investment needs.
 |
Edward Perks, CFA Lead Portfolio Manager | |
| Brendan Circle, CFA | ||
| Todd Brighton, CFA | ||
| Portfolio Management Team | ||

The foregoing information reflects our analysis, opinions and portfolio holdings as of March 31, 2020, the end of the reporting period. The way we implement our main investment strategies and the resulting portfolio holdings may change depending on factors such as market and economic conditions. These opinions may not be relied upon as investment advice or an offer for a particular security. The information is not a complete analysis of every aspect of any market, country, industry, security or the Fund. Statements of fact are from sources considered reliable, but the investment manager makes no representation or warranty as to their completeness or accuracy. Although historical performance is no guarantee of future results, these insights may help you understand our investment management philosophy.
| franklintempleton.com | Semiannual Report | 19 | ||
FRANKLIN INCOME FUND
Performance Summary as of March 31, 2020
The performance tables do not reflect any taxes that a shareholder would pay on Fund dividends, capital gain distributions, if any, or any realized gains on the sale of Fund shares. Total return reflects reinvestment of the Fund’s dividends and capital gain distributions, if any, and any unrealized gains or losses. Your dividend income will vary depending on dividends or interest paid by securities in the Fund’s portfolio, adjusted for operating expenses of each class. Capital gain distributions are net profits realized from the sale of portfolio securities.
Performance as of 3/31/201
Cumulative total return excludes sales charges. Average annual total return includes maximum sales charges. Sales charges will vary depending on the size of the investment and the class of share purchased. The maximum is 3.75% and the minimum is 0%.Class A:3.75% maximum initial sales charge;Advisor Class:no sales charges. For other share classes, visitfranklintempleton.com.
| Share Class | Cumulative Total Return2 | Average Annual Total Return3 | ||
A4,5 | ||||
6-Month | -13.46% | -16.70% | ||
1-Year | -11.60% | -14.91% | ||
5-Year | +5.49% | +0.30% | ||
10-Year | +61.63% | +4.52% | ||
Advisor | ||||
6-Month | -13.49% | -13.49% | ||
1-Year | -11.91% | -11.91% | ||
5-Year | +6.36% | +1.24% | ||
10-Year | +63.98% | +5.07% | ||
| Distribution | 30-Day Standardized Yield7 | |||||||
| Share Class | Rate6 | (with fee waiver) | (without fee waiver) | |||||
A | 5.82% | 3.68% | 3.67% | |||||
Advisor | 6.38% | 4.11% | 4.10% | |||||
Performance data represent past performance, which does not guarantee future results. Investment return and principal value will fluctuate, and you may have a gain or loss when you sell your shares. Current performance may differ from figures shown. For most recentmonth-end performance, go tofranklintempleton.comor call(800)342-5236.
See Page 22 for Performance Summary footnotes
20 | Semiannual Report | franklintempleton.com | ||
FRANKLIN INCOME FUND
PERFORMANCE SUMMARY
Net Asset Value
| Share Class(Symbol) | 3/31/20 | 9/30/19 | Change | |||
| A (FKIQX) | $1.93 | $2.30 | -$0.37 | |||
| A1(FKINX) | $1.94 | $2.30 | -$0.36 | |||
| C (FCISX) | $1.97 | $2.34 | -$ 0.37 | |||
| R (FISRX) | $1.90 | $2.26 | -$0.36 | |||
| R6(FNCFX) | $1.92 | $2.29 | -$0.37 | |||
| Advisor(FRIAX) | $1.92 | $2.28 | -$ 0.36 | |||
| Distributions(10/1/19–3/31/20) | ||||||
| Share Class | Net Investment Income | |||||
| A | $0.0588 | |||||
| A1 | $0.0600 | |||||
| C | $0.0540 | |||||
| R | $0.0558 | |||||
| R6 | $0.0618 | |||||
| Advisor | $0.0612 | |||||
| Total Annual Operating Expenses8 | ||||||
| Share Class | With Fee Waiver | Without Fee Waiver | ||||
| A | 0.72% | 0.72% | ||||
| Advisor | 0.47% | 0.47% | ||||
See page 22 for Performance Summary footnotes.
| franklintempleton.com | Semiannual Report | 21 | ||
FRANKLIN INCOME FUND
PERFORMANCE SUMMARY
Each class of shares is available to certain investors and has different annual fees and expenses, as described in the prospectus.
All investments involve risks, including possible loss of principal. The Fund’s portfolio includes a substantial portion of higher-yielding, lower-rated corporate bonds and some floating rate loans, which are also higher-yielding and lower-rated. These investments have more credit risk than investment-grade securities and are subject to increased risk of default and potential loss of principal. The Fund’s share price and yield will be affected by interest rate movements. Bond prices generally move in the opposite direction of interest rates. Thus, as prices of bonds in the Fund adjust to a rise in interest rates, the Fund’s share price may decline. Changes in the financial strength of a bond issuer or in a bond’s credit rating may affect its value. Stock prices fluctuate, sometimes rapidly and dramatically, due to factors affecting individual companies, particular industries or sectors, or general market conditions. Foreign investing involves additional risks such as currency and market volatility, as well as political and social instability. Unexpected events and their aftermaths, such as the spread of deadly diseases; natural, environmental orman-made disasters; financial, political or social disruptions; terrorism and war; and other tragedies or catastrophes, can cause investor fear and panic, which can adversely affect the economies of many companies, sectors, nations, regions and the market in general, in ways that cannot necessarily be foreseen. The Fund’s prospectus also includes a description of the main investment risks.
1. The Fund has a fee waiver associated with any investment it makes in a Franklin Templeton money fund and/or other Franklin Templeton fund, contractually guaranteed through 1/31/21. Fund investment results reflect the fee waiver; without this waiver, the results would have been lower.
2. Cumulative total return represents the change in value of an investment over the periods indicated.
3. Average annual total return represents the average annual change in value of an investment over the periods indicated. Return for less than one year, if any, has not been annualized.
4. Effective 9/10/18, Class A shares closed to new investors, were renamed Class A1 shares, and a new Class A share with a different expense structure became available. Class A performance shown has been calculated as follows: (a) for periods prior to 9/10/18, a restated figure is used based on the Fund’s Class A1 performance that includes any Rule12b-1 rate differential that exists between Class A1 and Class A; and (b) for periods after 9/10/18, actual Class A performance is used, reflecting all charges and fees applicable to that class.
5. Prior to 3/1/19, these shares were offered at a higher initial sales charge of 4.25%, thus actual returns (with sales charges) would have differed. Average annual total returns (with sales charges) have been restated to reflect the current maximum initial sales charge of 3.75%.
6. Distribution rate is based on an annualization of the respective class’s March dividend and the maximum offering price (NAV for Advisor Class) per share on 3/31/20.
7. The Fund’s30-day standardized yield is calculated over a trailing30-day period using the yield to maturity on bonds and/or the dividends accrued on stocks. It may not equal the Fund’s actual income distribution rate, which reflects the Fund’s past dividends paid to shareholders.
8. Figures are as stated in the Fund’s current prospectus and may differ from the expense ratios disclosed in the Your Fund’s Expenses and Financial Highlights sections in this report. In periods of market volatility, assets may decline significantly, causing total annual Fund operating expenses to become higher than the figures shown.
22 | Semiannual Report | franklintempleton.com | ||
FRANKLIN INCOME FUND
Your Fund’s Expenses
As a Fund shareholder, you can incur two types of costs: (1) transaction costs, including sales charges (loads) on Fund purchases and redemptions; and (2) ongoing Fund costs, including management fees, distribution and service(12b-1) fees, and other Fund expenses. All mutual funds have ongoing costs, sometimes referred to as operating expenses. The table below shows ongoing costs of investing in the Fund and can help you understand these costs and compare them with those of other mutual funds. The table assumes a $1,000 investment held for the six months indicated.
Actual Fund Expenses
The table below provides information about actual account values and actual expenses in the columns under the heading “Actual.” In these columns the Fund’s actual return, which includes the effect of Fund expenses, is used to calculate the “Ending Account Value” for each class of shares. You can estimate the expenses you paid during the period by following these steps (of course, your account value and expenses will differ from those in this illustration): Divide your account value by $1,000 (if your account had an $8,600 value, then $8,600÷ $1,000 = 8.6). Then multiply the result by the number in the row for your class of shares under the headings “Actual” and “Expenses Paid During Period” (if Actual Expenses Paid During Period were $7.50, then 8.6 x $7.50 = $64.50). In this illustration, the actual expenses paid this period are $64.50.
Hypothetical Example for Comparison with Other Funds
Under the heading “Hypothetical” in the table, information is provided about hypothetical account values and hypothetical expenses based on the Fund’s actual expense ratio and an assumed rate of return of 5% per year before expenses, which is not the Fund’s actual return. This information may not be used to estimate the actual ending account balance or expenses you paid for the period, but it can help you compare ongoing costs of investing in the Fund with those of other funds. To do so, compare this 5% hypothetical example for the class of shares you hold with the 5% hypothetical examples that appear in the shareholder reports of other funds.
Please note that expenses shown in the table are meant to highlight ongoing costs and do not reflect any transactional costs. Therefore, information under the heading “Hypothetical” is useful in comparing ongoing costs only, and will not help you compare total costs of owning different funds. In addition, if transactional costs were included, your total costs would have been higher.
Actual (actual return after expenses) | Hypothetical (5% annual return before expenses) | |||||||||||
|
| |||||||||||
| Share Class | Beginning Account Value 10/1/19 | Ending Account Value 3/31/20 | Expenses Paid During 10/1/19–3/31/201,2 | Ending Account | Expenses Paid During Period 10/1/19–3/31/201,2 | Net Annualized Expense Ratio2 | ||||||
|
|
|
| |||||||||
A | $1,000 | $865.40 | $3.26 | $1,021.50 | $3.54 | 0.70% | ||||||
A1 | $1,000 | $865.80 | $2.80 | $1,022.00 | $3.03 | 0.60% | ||||||
C | $1,000 | $861.60 | $5.12 | $1,019.50 | $5.55 | 1.10% | ||||||
R | $1,000 | $861.80 | $4.42 | $1,020.25 | $4.80 | 0.95% | ||||||
R6 | $1,000 | $866.00 | $1.77 | $1,023.10 | $1.92 | 0.38% | ||||||
Advisor | $1,000 | $865.10 | $2.10 | $1,022.75 | $2.28 | 0.45% | ||||||
1. Expenses are equal to the annualized expense ratio for thesix-month period as indicated above—in the far right column—multiplied by the simple average account value over the period indicated, and then multiplied by 183/366 to reflect theone-half year period.
2. Reflects expenses after fee waivers and expense reimbursements. Does not include acquired fund fees and expenses.
| franklintempleton.com | Semiannual Report | 23 | ||
Franklin U.S. Government Securities Fund
This semiannual report for Franklin U.S. Government Securities Fund covers the period ended March 31, 2020.
Your Fund’s Goal and Main Investments
The Fund seeks income by investing at least 80% of its net assets in U.S. government securities. The Fund presently invests substantially all of its assets in Government National Mortgage Association obligations (Ginnie Maes).
Since 1983, the Fund has invested substantially in Ginnie Mae securities, which carry a guarantee backed by the full faith and credit of the U.S. government as to the timely payment of interest and principal.1 Issued by the Government National Mortgage Association (GNMA), Ginnie Maes have been among the highest yielding U.S. government obligations available.
Portfolio Composition
Based on Total Net Assets as of 3/31/20
GNMA | 96.5 | % | ||
U.S. Government and Agency Securities | 0.5 | % | ||
Short-Term Investments & Other Net Assets | 3.0 | % |
Performance Overview
The Fund’s Class A shares posted a +2.71% cumulative total return for the six months under review. In comparison, the Bloomberg Barclays U.S. Government Intermediate Index, the intermediate component of the Bloomberg Barclays U.S. Government Index, posted a +5.19% total return.2 You can find the Fund’s long-term performance data in the Performance Summary beginning on page 26.
Performance data represent past performance, which does not guarantee future results. Investment return and principal value will fluctuate, and you may have a gain or loss when you sell your shares. Current performance may differ from figures shown. For most recentmonth-end performance, go tofranklintempleton.comor call(800)342-5236.
Investment Strategy
We currently invest the Fund’s assets substantially in GNMA obligations. We analyze securities using proprietary models to help us identify attractive investment opportunities.
Dividend Distributions*
10/1/19–3/31/20
| Dividend per Share (cents) | ||||||||||||||||||||||||
| Month | Class A | Class A1 | Class C | Class R | Class R6 | Advisor Class | ||||||||||||||||||
October | 1.40 | 1.43 | 1.18 | 1.26 | 1.57 | 1.51 | ||||||||||||||||||
November | 1.33 | 1.37 | 1.13 | 1.19 | 1.51 | 1.45 | ||||||||||||||||||
December | 1.40 | 1.45 | 1.19 | 1.27 | 1.59 | 1.52 | ||||||||||||||||||
January | 1.39 | 1.44 | 1.18 | 1.26 | 1.57 | 1.51 | ||||||||||||||||||
February | 1.39 | 1.43 | 1.19 | 1.28 | 1.56 | 1.50 | ||||||||||||||||||
March | 1.41 | 1.44 | 1.19 | 1.26 | 1.57 | 1.51 | ||||||||||||||||||
Total | 8.32 | 8.56 | 7.06 | 7.52 | 9.37 | 9.00 | ||||||||||||||||||
*The distribution amount is the sum of all estimatedtax-basis net investment income distributions for the period shown. A portion or all of the distribution may be reclassified as return of capital or short-term or long-term capital gains once final tax designations are known. All Fund distributions will vary depending upon current market conditions, and past distributions are not indicative of future trends.
Manager’s Discussion
Given the market shock related toCOVID-19, the U.S. Federal Reserve (Fed) has actively been participating in the agency MBS market to minimize disruption and ensure smooth functioning of the market. The Fed announced on March 15, 2020 a massive and what we believe to be well-crafted policy response to the coronavirus. Since the announcement, the Fed has been actively participating in the agency MBS markets and shortly afterperiod-end had purchased approximately $550 billion worth of securities, a significant amount in a very short period of time. From a supply and demand perspective, the Fed should absorb a large percentage of the market supply. This is a tailwind for agency MBS and could lead to spreads tightening and remaining rangebound in the summer months when supply typically increases.
1. Securities owned by the Fund, but not shares of the Fund, are guaranteed by the U.S. government, its agencies or instrumentalities as to the timely payment of principal and interest. The Fund’s yield and share price are not guaranteed and will vary with market conditions.
2. Source: Morningstar.
The index is unmanaged and includes reinvestment of any income or distributions. It does not reflect any fees, expenses or sales charges. One cannot invest directly in an index, and an index is not representative of the Fund’s portfolio.
See www.franklintempletondatasources.com for additional data provider information.
The dollar value, number of shares or principal amount, and names of all portfolio holdings are listed in the Fund’s Statement of Investments (SOI).
The SOI begins on page 82.
24 | Semiannual Report | franklintempleton.com | ||
FRANKLIN U.S. GOVERNMENT SECURITIES FUND
As mortgage rates hit historically low levels, over half of the agency MBS universe may be eligible to refinance. We believe mortgage rates could remain low and rangebound, leading to refinance risk remaining elevated. Conversely, we have seen a pickup in forbearance requests related to theCOVID-19 crisis, which could keep prepayments muted over the short-term. Capacity constraints in the market, combined with the disruptions andshelter-in-place restrictions related toCOVID-19 could also lead to a lower number of refinance applications being processed each month. This could lead to slower prepayments over the near term, but once the market recovers and capacity is restored, we believe we could see an increase in prepayments.
The Fund maintains a conservative, disciplined investment strategy and invests primarily in GNMA mortgage pass-throughs, which remain the only MBS that are backed by the full faith and credit of the U.S. government—the same guarantee applicable to U.S. Treasuries.1 We believe our collateral-intensive research approach can allow us to uncover dislocations across the GNMA markets and associated mispricing of prepayment risk. We continue to focus on specified pools where we believe our experience and continual investment in new technologies help us uncover these discrepancies.
During the period, we were more weighted toward GNMA IIs (pools of mortgages from multiple issuers) than GNMA Is (pools of mortgages from single issuers). Over the period, we added to GNMA II 3.0% and 4.0% coupons, while reducing exposure to GNMA II 3.5% coupons. Our heaviest allocation was in GNMA II 3.5%, 3.0% and 4.0% coupons atperiod-end.
On a total return basis, agency mortgage sectors generally performed in line with one another but could not keep pace with the strong performance of U.S. Treasuries. Ginnie Mae (GMNA) MBS delivered 3.50% positive total returns, followed by Freddie Mac (FHLMC) MBS and Fannie Mae (FNMA) MBS, which returned 3.57% and 3.55%, respectively. Within the GNMA sector, lower 3.0% coupons were the best performers, while higher 5.0% coupons and GNMA II 4.0% and 4.5% coupons generally lagged.
The Fund’s underweight positions relative to the index in 3.0% coupons, the best performing coupon, detracted from performance. Additionally, allocation to GNMA II 3.5% through 5.0% coupons and security selection in GNMA I 5.0% coupons were negative contributors. Conversely, our allocation to GNMA I 4.0% though 5.0% coupons benefited returns, as did security selection in GNMA II 4.0% coupons.
Thank you for your continued participation in Franklin U.S. Government Securities Fund. We welcome your comments and questions and look forward to serving your investment needs in the years ahead.
 |  | |
| Paul Varunok | ||
| Co-Lead Portfolio Manager |
 |  | |
| Neil Dhruv | ||
| Co-Lead Portfolio Manager |
The foregoing information reflects our analysis, opinions and portfolio holdings as of March 31, 2020, the end of the reporting period. The way we implement our main investment strategies and the resulting portfolio holdings may change depending on factors such as market and economic conditions. These opinions may not be relied upon as investment advice or an offer for a particular security. The information is not a complete analysis of every aspect of any market, country, industry, security or the Fund.
Statements of fact are from sources considered reliable, but the investment manager makes no representation or warranty as to their completeness or accuracy. Although historical performance is no guarantee of future results, these insights may help you understand our investment management philosophy.
| franklintempleton.com | Semiannual Report | 25 | ||
FRANKLIN U.S. GOVERNMENT SECURITIES FUND
Performance Summary as of March 31, 2020
The performance tables do not reflect any taxes that a shareholder would pay on Fund dividends, capital gain distributions, if any, or any realized gains on the sale of Fund shares. Total return reflects reinvestment of the Fund’s dividends and capital gain distributions, if any, and any unrealized gains or losses. Your dividend income will vary depending on dividends or interest paid by securities in the Fund’s portfolio, adjusted for operating expenses of each class. Capital gain distributions are net profits realized from the sale of portfolio securities.
Performance as of 3/31/201
Cumulative total return excludes sales charges. Average annual total return includes maximum sales charges. Sales charges will vary depending on the size of the investment and the class of share purchased. The maximum is 3.75% and the minimum is 0%.Class A:3.75% maximum initial sales charge;Advisor Class:no sales charges. For other share classes, visitfranklintempleton.com.
| Share Class | Cumulative Total Return2 | Average Annual Total Return3 | ||||||
A4,5 | ||||||||
6-Month | +2.71 | % | -1.14 | % | ||||
1-Year | +6.11 | % | +2.13 | % | ||||
5-Year | +9.97 | % | +1.14 | % | ||||
10-Year | +28.71 | % | +2.16 | % | ||||
Advisor | ||||||||
6-Month | +2.99 | % | +2.99 | % | ||||
1-Year | +6.50 | % | +6.50 | % | ||||
5-Year | +11.05 | % | +2.12 | % | ||||
10-Year | +30.93 | % | +2.73 | % | ||||
| Distribution | 30-Day Standardized Yield7 | |||||||
| Share Class | Rate6 | (with fee waiver) | (without fee waiver) | |||||
A | 2.65% | 1.83% | 1.81% | |||||
Advisor | 2.93% | 2.14% | 2.13% | |||||
Performance data represent past performance, which does not guarantee future results. Investment return and principal value will fluctuate, and you may have a gain or loss when you sell your shares. Current performance may differ from figures shown. For most recentmonth-end performance, go tofranklintempleton.comor call(800)342-5236.
See page 27 for Performance Summary footnotes.
26 | Semiannual Report | franklintempleton.com | ||
FRANKLIN U.S. GOVERNMENT SECURITIES FUND
PERFORMANCE SUMMARY
Distributions(10/1/19–3/31/20)
| Share Class | Net Investment Income | |||||
| A | $0.0832 | |||||
| A1 | $0.0856 | |||||
| C | $0.0706 | |||||
| R | $0.0752 | |||||
| R6 | $0.0937 | |||||
| Advisor | $0.0900 | |||||
Total Annual Operating Expenses8
| Share Class | With Fee Waiver | Without Fee Waiver | ||||
| A | 0.89% | 0.90% | ||||
| Advisor | 0.64% | 0.65% | ||||
Each class of shares is available to certain eligible investors and has different annual fees and expenses, as described in the prospectus.
All investments involve risks, including loss of principal. The Fund’s share price and yield will be affected by interest rate movements and mortgage prepayments. Bond prices generally move in the opposite direction of interest rates. Thus, as the prices of bonds in the Fund adjust to a rise in interest rates, the Fund’s share price may decline. Changes in the financial strength of a bond issuer or in a bond’s credit rating may affect its value. Unexpected events and their aftermaths, such as the spread of deadly diseases; natural, environmental orman-made disasters; financial, political or social disruptions; terrorism and war; and other tragedies or catastrophes, can cause investor fear and panic, which can adversely affect the economies of many companies, sectors, nations, regions and the market in general, in ways that cannot necessarily be foreseen. The Fund’s prospectus also includes a description of the main investment risks.
1. The Fund has a fee waiver associated with any investment it makes in a Franklin Templeton money fund and/or other Franklin Templeton fund, contractually guaranteed through 1/31/21. Fund investment results reflect the fee waiver; without this waiver, the results would have been lower.
2. Cumulative total return represents the change in value of an investment over the periods indicated.
3. Average annual total return represents the average annual change in value of an investment over the periods indicated. Return for less than one year, if any, has not been annualized.
4. Effective 9/10/18, Class A shares closed to new investors, were renamed Class A1 shares, and a new Class A share with a different expense structure became available. Class A performance shown has been calculated as follows: (a) for periods prior to 9/10/18, a restated figure is used based on the Fund’s Class A1 performance that includes any Rule12b-1 rate differential that exists between Class A1 and Class A; and (b) for periods after 9/10/18, actual Class A performance is used, reflecting all charges and fees applicable to that class.
5. Prior to 3/1/19, these shares were offered at a higher initial sales charge of 4.25%, thus actual returns (with sales charges) would have differed. Average annual total returns (with sales charges) have been restated to reflect the current maximum initial sales charge of 3.75%.
6. Distribution rate is based on an annualization of the respective class’s March dividend and the maximum offering price (NAV for Advisor Class) per share on 3/31/20.
7. The Fund’s30-day standardized yield is calculated over a trailing30-day period using the yield to maturity on bonds and/or the dividends accrued on stocks. It may not equal the Fund’s actual income distribution rate, which reflects the Fund’s past dividends paid to shareholders.
8. Figures are as stated in the Fund’s current prospectus and may differ from the expense ratios disclosed in the Your Fund’s Expenses and Financial Highlights sections in this report. In periods of market volatility, assets may decline significantly, causing total annual Fund operating expenses to become higher than the figures shown.
| franklintempleton.com | Semiannual Report | 27 | ||
FRANKLIN U.S. GOVERNMENT SECURITIES FUND
Your Fund’s Expenses
As a Fund shareholder, you can incur two types of costs: (1) transaction costs, including sales charges (loads) on Fund purchases and redemptions; and (2) ongoing Fund costs, including management fees, distribution and service(12b-1) fees, and other Fund expenses. All mutual funds have ongoing costs, sometimes referred to as operating expenses. The table below shows ongoing costs of investing in the Fund and can help you understand these costs and compare them with those of other mutual funds. The table assumes a $1,000 investment held for the six months indicated.
Actual Fund Expenses
The table below provides information about actual account values and actual expenses in the columns under the heading “Actual.” In these columns the Fund’s actual return, which includes the effect of Fund expenses, is used to calculate the “Ending Account Value” for each class of shares. You can estimate the expenses you paid during the period by following these steps (of course, your account value and expenses will differ from those in this illustration): Divide your account value by $1,000 (if your account had an $8,600 value, then $8,600÷ $1,000 = 8.6). Then multiply the result by the number in the row for your class of shares under the headings “Actual” and “Expenses Paid During Period” (if Actual Expenses Paid During Period were $7.50, then 8.6 x $7.50 = $64.50). In this illustration, the actual expenses paid this period are $64.50.
Hypothetical Example for Comparison with Other Funds
Under the heading “Hypothetical” in the table, information is provided about hypothetical account values and hypothetical expenses based on the Fund’s actual expense ratio and an assumed rate of return of 5% per year before expenses, which is not the Fund’s actual return. This information may not be used to estimate the actual ending account balance or expenses you paid for the period, but it can help you compare ongoing costs of investing in the Fund with those of other funds. To do so, compare this 5% hypothetical example for the class of shares you hold with the 5% hypothetical examples that appear in the shareholder reports of other funds.
Please note that expenses shown in the table are meant to highlight ongoing costs and do not reflect any transactional costs. Therefore, information under the heading “Hypothetical” is useful in comparing ongoing costs only, and will not help you compare total costs of owning different funds. In addition, if transactional costs were included, your total costs would have been higher.
| Actual (actual return after expenses) | Hypothetical (5% annual return before expenses) | |||||||||||
|
| |||||||||||
| Share Class | Beginning Account Value 10/1/19 | Ending Account Value 3/31/20 | Expenses 10/1/19–3/31/201, 2 | Ending Account Value 3/31/20 | Expenses Paid During Period 10/1/19–3/31/201,2 | Net Annualized Expense Ratio2 | ||||||
|
|
|
| |||||||||
A | $1,000 | $1,027.10 | $4.46 | $1,020.60 | $4.45 | 0.88% | ||||||
A1 | $1,000 | $1,029.20 | $3.96 | $1,021.10 | $3.94 | 0.78% | ||||||
C | $1,000 | $1,025.20 | $6.48 | $1,018.60 | $6.46 | 1.28% | ||||||
R | $1,000 | $1,025.80 | $5.67 | $1,019.40 | $5.65 | 1.12% | ||||||
R6 | $1,000 | $1,028.80 | $2.59 | $1,022.45 | $2.58 | 0.51% | ||||||
Advisor | $1,000 | $1,029.90 | $3.20 | $1,021.85 | $3.18 | 0.63% | ||||||
1. Expenses are equal to the annualized expense ratio for thesix-month period as indicated above—in the far right column—multiplied by the simple average account value over the period indicated, and then multiplied by 183/366 to reflect theone-half year period.
2. Reflects expenses after fee waivers and expense reimbursements. Does not include acquired fund fees and expenses.
28 | Semiannual Report | franklintempleton.com | ||
This semiannual report for Franklin Utilities Fund covers the period ended March 31, 2020.
Your Fund’s Goal and Main Investments
The Fund seeks both capital appreciation and current income by investing at least 80% of its net assets in the securities of public utility companies. These are companies that provide electricity, natural gas, water, and communications services to the public and companies that provide services to public utilities companies. The Fund concentrates (invests more than 25% of its total assets) in companies operating in the utilities industry. The Fund invests primarily in equity securities, which consist mainly of common stocks.
Performance Overview
The Fund’s Class A shares posted a-14.62% cumulative total return for the six months under review. In comparison, the S&P 500 Utilities Index, which measures the performance of all utilities stocks in the S&P 500, posted a-12.85% total return1 and the Standard & Poor’s 500 Index (S&P 500), which is a broad measure of U.S. stock performance, posted a-12.31% total return. You can find the Fund’s long-term performance data in the Performance Summary beginning on page 31.
Performance data represent past performance, which does not guarantee future results. Investment return will fluctuate. Current performance may differ from figures shown. For most recentmonth-end performance, go tofranklintempleton.comor call(800)342-5236.
Investment Strategy
We search for the best return opportunities available in the global utilities arena with a specific focus on the U.S. electricity and gas sector. Generally, we seek to invest in companies producing a high percentage of earnings from their regulated operations.
Portfolio Composition
Based on Total Net Assets as of 3/31/20
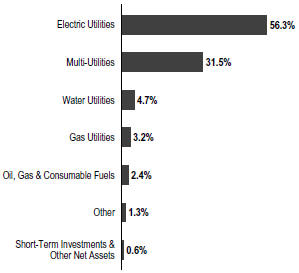
Manager’s Discussion
During the six months under review, the utilities sector detracted from Fund performance.2 CenterPoint Energy, a holding company that engages in the business of power generation and distribution was a key detractor. Exelon, a utility services holding company, which engages in the energy generation, power marketing, and energy delivery business detracted from Fund results as a federal investigation into lobbying practices impacted earnings. Edison International, a renewable energy company, which generates and distributes electric power, had shares impacted by ongoing mitigation of the 2017–2018 Southern California wildfires, also detracted from Fund results.
In contrast, notable individual contributors within utilities included NextEra Energy, United Utilities and National Grid. NextEra Energy, an electric power and energy infrastructure company, benefited from superior organic growth potential as well as modest value from expected investment opportunities related to future acquisitions. The company’s renewable energy goals and additional cost-cutting initiatives are slated
1. Source: Morningstar.
The indexes are unmanaged and include reinvestment of any income or distributions. They do not reflect any fees, expenses or sales charges. One cannot invest directly in an index, and an index is not representative of the Fund’s portfolio.
2. The utilities sector comprises electric utilities, gas utilities, independent power and renewable electricity producers, multi-utilities and water utilities and multi-utilities in the SOI.
See www.franklintempletondatasources.com for additional data provider information.
The dollar value, number of shares or principal amount, and names of all portfolio holdings are listed in the Fund’s Statement of Investments (SOI). The SOI begins on page 91.
| franklintempleton.com | Semiannual Report | 29 | ||
FRANKLIN UTILITIES FUND
to line up with a strengthenedearnings-per-share plan to drive growth. Other individual contributors to Fund results included, water and wastewater services company United Utilities and National Grid, an electrical and gas distribution company.
Top 10 Holdings
3/31/20
Company Sector/Industry | % of Total Net Assets | |
NextEra Energy Inc. Electric Utilities | 10.7% | |
Dominion Energy Inc. Multi-Utilities | 5.2% | |
CMS Energy Corp. Multi-Utilities | 5.0% | |
Exelon Corp. Electric Utilities | 4.3% | |
Duke Energy Corp. Electric Utilities | 4.1% | |
American Electric Power Co. Inc. Electric Utilities | 4.1% | |
Sempra Energy Multi-Utilities | 3.8% | |
The Southern Co. Electric Utilities | 3.7% | |
Edison International Electric Utilities | 3.7% | |
Xcel Energy Inc. Electric Utilities | 3.6% | |
Thank you for your continued participation in Franklin Utilities Fund. We look forward to serving your future investment needs.
 |  | |
| John C. Kohli, CFA | ||
 |  | |
| J. Blair Schmicker, CFA | ||
| Portfolio Management Team | ||
The foregoing information reflects our analysis, opinions and portfolio holdings as of March 31, 2020, the end of the reporting period. The way we implement our main investment strategies and the resulting portfolio holdings may change depending on factors such as market and economic conditions. These opinions may not be relied upon as investment advice or an offer for a particular security. The information is not a complete analysis of every aspect of any market, country, industry, security or the Fund. Statements of fact are from sources considered reliable, but the investment manager makes no representation or warranty as to their completeness or accuracy. Although historical performance is no guarantee of future results, these insights may help you understand our investment management philosophy.
30 | Semiannual Report | franklintempleton.com | ||
FRANKLIN UTILITIES FUND
Performance Summary as of March 31, 2020
The performance tables do not reflect any taxes that a shareholder would pay on Fund dividends, capital gain distributions, if any, or any realized gains on the sale of Fund shares. Total return reflects reinvestment of the Fund’s dividends and capital gain distributions, if any, and any unrealized gains or losses. Your dividend income will vary depending on dividends or interest paid by securities in the Fund’s portfolio, adjusted for operating expenses of each class. Capital gain distributions are net profits realized from the sale of portfolio securities.
Performance as of 3/31/201
Cumulative total return excludes sales charges. Average annual total return includes maximum sales charges. Sales charges will vary depending on the size of the investment and the class of share purchased. The maximum is 3.75% and the minimum is 0%.Class A:3.75% maximum initial sales charge;Advisor Class:no sales charges. For other share classes, visitfranklintempleton.com.
| Share Class | Cumulative Total Return2 | Average Annual Total Return3 | ||
A4,5 | ||||
6-Month | -14.62% | -17.82% | ||
1-Year | -4.12% | -7.71% | ||
5-Year | +38.91% | +5.98% | ||
10-Year | +162.82% | +9.72% | ||
Advisor | ||||
6-Month | -14.55% | -14.55% | ||
1-Year | -3.89% | -3.89% | ||
5-Year | +40.20% | +6.99% | ||
10-Year | +167.54% | +10.34% | ||
| Distribution | 30-Day Standardized Yield7 | |||||||
| Share Class | Rate6 | (with fee waiver) | (without fee waiver) | |||||
A | 2.35% | 2.76% | 2.76% | |||||
Advisor | 2.73% | 3.14% | 3.14% | |||||
Performance data represent past performance, which does not guarantee future results. Investment return and principal value will fluctuate, and you may have a gain or loss when you sell your shares. Current performance may differ from figures shown. For most recentmonth-end performance, go tofranklintempleton.comor call(800)342-5236.
See page 33 for Performance Summary footnotes.
| franklintempleton.com | Semiannual Report | 31 | ||
FRANKLIN UTILITIES FUND
PERFORMANCE SUMMARY
Net Asset Value
| Share Class(Symbol) | 3/31/20 | 9/30/19 | Change | |||||||||||
| A (FKUQX) | $18.69 | $22.53 | -$3.84 | |||||||||||
| A1 (FKUTX) | $18.70 | $22.54 | -$3.84 | |||||||||||
| C (FRUSX) | $18.59 | $22.42 | -$3.83 | |||||||||||
| R (FRURX) | $18.62 | $22.45 | -$3.83 | |||||||||||
| R6(FUFRX) | $18.85 | $22.73 | -$3.88 | |||||||||||
| Advisor (FRUAX) | $18.85 | $22.73 | -$3.88 | |||||||||||
Distributions(10/1/19–3/31/20)
|
| |||||||||||||
| Share Class | Net Investment Income | Short-Term Capital Gain | Long-Term Capital Gain | Total | ||||||||||
| A | $0.2744 | $0.0293 | $0.3160 | $0.6197 | ||||||||||
| A1 | $0.2859 | $0.0293 | $0.3160 | $0.6312 | ||||||||||
| C | $0.2292 | $0.0293 | $0.3160 | $0.5745 | ||||||||||
| R | $0.2461 | $0.0293 | $0.3160 | $0.5914 | ||||||||||
| R6 | $0.3115 | $0.0293 | $0.3160 | $0.6568 | ||||||||||
| Advisor | $0.3029 | $0.0293 | $0.3160 | $0.6482 | ||||||||||
Total Annual Operating Expenses8
|
| |||||||||||||
| Share Class | With Fee Waiver | Without Fee Waiver | ||||||||||||
| A | 0.83% | 0.83% | ||||||||||||
| Advisor | 0.58% | 0.58% | ||||||||||||
See page 33 for Performance Summary footnotes.
32 | Semiannual Report | franklintempleton.com | ||
FRANKLIN UTILITIES FUND
PERFORMANCE SUMMARY
Each class of shares is available to certain eligible investors and has different annual fees and expenses, as described in the prospectus.
All investments involve risks, including loss of principal. Investing in a Fund concentrating in the utilities sector involves special risks, including increased susceptibility to adverse economic and regulatory developments affecting the sector. Stocks historically have outperformed other asset classes over the long term, but tend to fluctuate more dramatically over the short term. Securities issued by utility companies have been historically sensitive to interest rate changes. When interest rates fall, utility securities prices, and thus a utilities Fund’s share price, tend to rise; when interest rates rise, their prices generally fall. Unexpected events and their aftermaths, such as the spread of deadly diseases; natural, environmental orman-made disasters; financial, political or social disruptions; terrorism and war; and other tragedies or catastrophes, can cause investor fear and panic, which can adversely affect the economies of many companies, sectors, nations, regions and the market in general, in ways that cannot necessarily be foreseen. The Fund’s prospectus also includes a description of the main investment risks.
1. The Fund has a fee waiver associated with any investment it makes in a Franklin Templeton money fund and/or other Franklin Templeton fund, contractually guaranteed through 1/31/21. Fund investment results reflect the fee waiver; without this waiver, the results would have been lower.
2. Cumulative total return represents the change in value of an investment over the periods indicated.
3. Average annual total return represents the average annual change in value of an investment over the periods indicated. Return for less than one year, if any, has not been annualized.
4. Effective 9/10/18, Class A shares closed to new investors, were renamed Class A1 shares, and a new Class A share with a different expense structure became available. Class A performance shown has been calculated as follows: (a) for periods prior to 9/10/18, a restated figure is used based on the Fund’s Class A1 performance that includes any Rule12b-1 rate differential that exists between Class A1 and Class A; and (b) for periods after 9/10/18, actual Class A performance is used, reflecting all charges and fees applicable to that class.
5. Prior to 3/1/19, these shares were offered at a higher initial sales charge of 4.25%, thus actual returns (with sales charges) would have differed. Average annual total returns (with sales charges) have been restated to reflect the current maximum initial sales charge of 3.75%.
6. Distribution rate is based on an annualization of the respective class’s current quarterly dividend and the maximum offering price (NAV for Advisor Class) per share on 3/31/20.
7. The Fund’s30-day standardized yield is calculated over a trailing30-day period using the yield to maturity on bonds and/or the dividends accrued on stocks. It may not equal the Fund’s actual income distribution rate, which reflects the Fund’s past dividends paid to shareholders.
8. Figures are as stated in the Fund’s current prospectus and may differ from the expense ratios disclosed in the Your Fund’s Expenses and Financial Highlights sections in this report. In periods of market volatility, assets may decline significantly, causing total annual Fund operating expenses to become higher than the figures shown.
| franklintempleton.com | Semiannual Report | 33 | ||
FRANKLIN UTILITIES FUND
Your Fund’s Expenses
As a Fund shareholder, you can incur two types of costs: (1) transaction costs, including sales charges (loads) on Fund purchases and redemptions; and (2) ongoing Fund costs, including management fees, distribution and service(12b-1) fees, and other Fund expenses. All mutual funds have ongoing costs, sometimes referred to as operating expenses. The table below shows ongoing costs of investing in the Fund and can help you understand these costs and compare them with those of other mutual funds. The table assumes a $1,000 investment held for the six months indicated.
Actual Fund Expenses
The table below provides information about actual account values and actual expenses in the columns under the heading “Actual.” In these columns the Fund’s actual return, which includes the effect of Fund expenses, is used to calculate the “Ending Account Value” for each class of shares. You can estimate the expenses you paid during the period by following these steps (of course, your account value and expenses will differ from those in this illustration): Divide your account value by $1,000 (if your account had an $8,600 value, then $8,600÷ $1,000 = 8.6). Then multiply the result by the number in the row for your class of shares under the headings “Actual” and “Expenses Paid During Period” (if Actual Expenses Paid During Period were $7.50, then 8.6 x $7.50 = $64.50). In this illustration, the actual expenses paid this period are $64.50.
Hypothetical Example for Comparison with Other Funds
Under the heading “Hypothetical” in the table, information is provided about hypothetical account values and hypothetical expenses based on the Fund’s actual expense ratio and an assumed rate of return of 5% per year before expenses, which is not the Fund’s actual return. This information may not be used to estimate the actual ending account balance or expenses you paid for the period, but it can help you compare ongoing costs of investing in the Fund with those of other funds. To do so, compare this 5% hypothetical example for the class of shares you hold with the 5% hypothetical examples that appear in the shareholder reports of other funds.
Please note that expenses shown in the table are meant to highlight ongoing costs and do not reflect any transactional costs. Therefore, information under the heading “Hypothetical” is useful in comparing ongoing costs only, and will not help you compare total costs of owning different funds. In addition, if transactional costs were included, your total costs would have been higher.
Actual (actual return after expenses) | Hypothetical (5% annual return before expenses) | |||||||||||
|
| |||||||||||
| Share Class | Beginning Account Value 10/1/19 | Ending Account Value 3/31/20 | Expenses Paid During Period 10/1/19–3/31/201, 2 | Ending Account Value 3/31/20 | Expenses Paid During 10/1/19–3/31/201, 2 | Net Annualized Expense Ratio2 | ||||||
|
|
|
| |||||||||
A | $1,000 | $853.80 | $3.75 | $1,020.95 | $4.09 | 0.81% | ||||||
A1 | $1,000 | $854.30 | $3.29 | $1,021.45 | $3.59 | 0.71% | ||||||
C | $1,000 | $851.80 | $5.60 | $1,018.95 | $6.11 | 1.21% | ||||||
R | $1,000 | $852.70 | $4.91 | $1,019.70 | $5.35 | 1.06% | ||||||
R6 | $1,000 | $854.80 | $2.27 | $1,022.55 | $2.48 | 0.49% | ||||||
Advisor | $1,000 | $854.50 | $2.60 | $1,022.20 | $2.83 | 0.56% | ||||||
1. Expenses are equal to the annualized expense ratio for thesix-month period as indicated above—in the far right column—multiplied by the simple average account value over the period indicated, and then multiplied by 183/366 to reflect theone-half year period.
2. Reflects expenses after fee waivers and expense reimbursements. Does not include acquired fund fees and expenses.
34 | Semiannual Report | franklintempleton.com | ||
FRANKLIN CUSTODIAN FUNDS
Franklin DynaTech Fund
| Six Months Ended March 31, 2020 | Year Ended September 30, | |||||||||||||||||||||||
| (unaudited) | 2019 | 2018 | 2017 | 2016 | 2015 | |||||||||||||||||||
| ||||||||||||||||||||||||
Class A | ||||||||||||||||||||||||
Per share operating performance (for a share outstanding throughout the period) | ||||||||||||||||||||||||
Net asset value, beginning of period | $82.84 | $81.16 | $63.10 | $52.05 | $46.04 | $46.08 | ||||||||||||||||||
|
| |||||||||||||||||||||||
Income from investment operationsa: | ||||||||||||||||||||||||
Net investment income (loss)b | (0.12) | (0.20 | ) | (0.23 | ) | (0.18 | ) | (0.14 | ) | (0.21) | ||||||||||||||
Net realized and unrealized gains (losses) | (2.20) | 3.79 | 19.45 | 12.92 | 7.35 | 1.78 | ||||||||||||||||||
|
| |||||||||||||||||||||||
Total from investment operations | (2.32) | 3.59 | 19.22 | 12.74 | 7.21 | 1.57 | ||||||||||||||||||
|
| |||||||||||||||||||||||
Less distributions from: | ||||||||||||||||||||||||
Net realized gains | (0.66) | (1.91 | ) | (1.16 | ) | (1.69 | ) | (1.20 | ) | (1.61) | ||||||||||||||
|
| |||||||||||||||||||||||
Net asset value, end of period | $79.86 | $82.84 | $81.16 | $63.10 | $52.05 | $46.04 | ||||||||||||||||||
|
| |||||||||||||||||||||||
Total returnc | (2.86)% | 4.77% | 30.88% | 25.67% | 15.73% | 3.40% | ||||||||||||||||||
Ratios to average net assetsd | ||||||||||||||||||||||||
Expenses before waiver and payments by affiliates | 0.84% | 0.86% | 0.86% | 0.92% | 0.91% | 0.89% | ||||||||||||||||||
Expenses net of waiver and payments by affiliates | 0.83% | 0.85% | e | 0.86% | e,f | 0.91% | e | 0.90% | 0.89%f | |||||||||||||||
Net investment income (loss) | (0.27)% | (0.26)% | (0.32)% | (0.33)% | (0.30)% | (0.44)% | ||||||||||||||||||
Supplemental data | ||||||||||||||||||||||||
Net assets, end of period (000’s) | $4,709,601 | $4,504,434 | $3,741,562 | $2,498,393 | $2,123,082 | $1,857,570 | ||||||||||||||||||
Portfolio turnover rate | 3.68% | 20.01% | 17.22% | 19.85% | 22.42% | 31.02% | ||||||||||||||||||
a The amount shown for a share outstanding throughout the period may not correlate with the Statement of Operations for the period due to the timing of sales and repurchases of the Fund’s shares in relation to income earned and/or fluctuating fair value of the investments of the Fund.
b Based on average daily shares outstanding.
c Total return does not reflect sales commissions or contingent deferred sales charges, if applicable, and is not annualized for periods less than one year.
d Ratios are annualized for periods less than one year.
e Benefit of expense reduction rounds to less than 0.01%.
f Benefit of waiver and payments by affiliates rounds to less than 0.01%.
| franklintempleton.com | The accompanying notes are an integral part of these financial statements. | Semiannual Report | 35 | ||
FRANKLIN CUSTODIAN FUNDS
FINANCIAL HIGHLIGHTS
Franklin DynaTech Fund(continued)
| Six Months Ended March 31, 2020 | Year Ended September 30, | |||||||||||||||||||||||
| (unaudited) | 2019 | 2018 | 2017 | 2016 | 2015 | |||||||||||||||||||
| ||||||||||||||||||||||||
Class C | ||||||||||||||||||||||||
Per share operating performance (for a share outstanding throughout the period) | ||||||||||||||||||||||||
Net asset value, beginning of period | $68.60 | $68.07 | $53.49 | $44.71 | $40.00 | $40.53 | ||||||||||||||||||
|
| |||||||||||||||||||||||
Income from investment operationsa: | ||||||||||||||||||||||||
Net investment income (loss)b | (0.37) | (0.66 | ) | (0.65 | ) | (0.50 | ) | (0.43 | ) | (0.50) | ||||||||||||||
Net realized and unrealized gains (losses) | (1.79) | 3.10 | 16.39 | 10.97 | 6.34 | 1.58 | ||||||||||||||||||
|
| |||||||||||||||||||||||
Total from investment operations | (2.16) | 2.44 | 15.74 | 10.47 | 5.91 | 1.08 | ||||||||||||||||||
|
| |||||||||||||||||||||||
Less distributions from: | ||||||||||||||||||||||||
Net realized gains | (0.66) | (1.91 | ) | (1.16 | ) | (1.69 | ) | (1.20 | ) | (1.61) | ||||||||||||||
|
| |||||||||||||||||||||||
Net asset value, end of period | $65.78 | $68.60 | $68.07 | $53.49 | $44.71 | $40.00 | ||||||||||||||||||
|
| |||||||||||||||||||||||
Total returnc | (3.22)% | 3.97% | 29.93% | 24.72% | 14.86% | 2.63% | ||||||||||||||||||
Ratios to average net assetsd | ||||||||||||||||||||||||
Expenses before waiver and payments by affiliates | 1.59% | 1.61% | 1.61% | 1.67% | 1.66% | 1.64% | ||||||||||||||||||
Expenses net of waiver and payments by affiliates | 1.58% | 1.60% | e | 1.61% | e,f | 1.66% | e | 1.65% | 1.64%f | |||||||||||||||
Net investment income (loss) | (1.02)% | (1.01)% | (1.07)% | (1.08)% | (1.05)% | (1.19)% | ||||||||||||||||||
Supplemental data | ||||||||||||||||||||||||
Net assets, end of period (000’s) | $632,513 | $597,927 | $611,221 | $374,502 | $318,896 | $270,961 | ||||||||||||||||||
Portfolio turnover rate | 3.68% | 20.01% | 17.22% | 19.85% | 22.42% | 31.02% | ||||||||||||||||||
a The amount shown for a share outstanding throughout the period may not correlate with the Statement of Operations for the period due to the timing of sales and repurchases of the Fund’s shares in relation to income earned and/or fluctuating fair value of the investments of the Fund.
b Based on average daily shares outstanding.
c Total return does not reflect sales commissions or contingent deferred sales charges, if applicable, and is not annualized for periods less than one year.
d Ratios are annualized for periods less than one year.
e Benefit of expense reduction rounds to less than 0.01%.
fBenefit of waiver and payments by affiliates rounds to less than 0.01%.
36 | Semiannual Report | The accompanying notes are an integral part of these financial statements. | franklintempleton.com | ||
FRANKLIN CUSTODIAN FUNDS
FINANCIAL HIGHLIGHTS
Franklin DynaTech Fund Fund(continued)
| Six Months Ended March 31, 2020 | Year Ended September 30, | |||||||||||||||||||||||
| (unaudited) | 2019 | 2018 | 2017 | 2016 | 2015 | |||||||||||||||||||
| ||||||||||||||||||||||||
Class R | ||||||||||||||||||||||||
Per share operating performance (for a share outstanding throughout the period) | ||||||||||||||||||||||||
Net asset value, beginning of period | $80.26 | $78.88 | $61.51 | $50.90 | $45.16 | $45.35 | ||||||||||||||||||
|
| |||||||||||||||||||||||
Income from investment operationsa: | ||||||||||||||||||||||||
Net investment income (loss)b | (0.22) | (0.39 | ) | (0.40 | ) | (0.31 | ) | (0.26 | ) | (0.32) | ||||||||||||||
Net realized and unrealized gains (losses) | (2.13) | 3.68 | 18.93 | 12.61 | 7.20 | 1.74 | ||||||||||||||||||
|
| |||||||||||||||||||||||
Total from investment operations | (2.35) | 3.29 | 18.53 | 12.30 | 6.94 | 1.42 | ||||||||||||||||||
|
| |||||||||||||||||||||||
Less distributions from: | ||||||||||||||||||||||||
Net realized gains | (0.66) | (1.91 | ) | (1.16 | ) | (1.69 | ) | (1.20 | ) | (1.61) | ||||||||||||||
|
| |||||||||||||||||||||||
Net asset value, end of period | $77.25 | $80.26 | $78.88 | $61.51 | $50.90 | $45.16 | ||||||||||||||||||
|
| |||||||||||||||||||||||
Total returnc | (2.98)% | 4.52% | 30.57% | 25.36% | 15.43% | 3.11% | ||||||||||||||||||
Ratios to average net assetsd | ||||||||||||||||||||||||
Expenses before waiver and payments by affiliates | 1.09% | 1.11% | 1.11% | 1.17% | 1.16% | 1.14% | ||||||||||||||||||
Expenses net of waiver and payments by affiliates | 1.08% | 1.10% | e | 1.11% | e,f | 1.16% | e | 1.15% | 1.14%f | |||||||||||||||
Net investment income (loss) | (0.52)% | (0.51)% | (0.57)% | (0.58)% | (0.55)% | (0.69)% | ||||||||||||||||||
Supplemental data | ||||||||||||||||||||||||
Net assets, end of period (000’s) | $129,638 | $123,721 | $95,925 | $47,860 | $38,862 | $43,001 | ||||||||||||||||||
Portfolio turnover rate | 3.68% | 20.01% | 17.22% | 19.85% | 22.42% | 31.02% | ||||||||||||||||||
a The amount shown for a share outstanding throughout the period may not correlate with the Statement of Operations for the period due to the timing of sales and repurchases of the Fund’s shares in relation to income earned and/or fluctuating fair value of the investments of the Fund.
b Based on average daily shares outstanding.
c Total return is not annualized for periods less than one year.
d Ratios are annualized for periods less than one year.
e Benefit of expense reduction rounds to less than 0.01%.
f Benefit of waiver and payments by affiliates rounds to less than 0.01%.
| franklintempleton.com | The accompanying notes are an integral part of these financial statements. | Semiannual Report | 37 | ||
FRANKLIN CUSTODIAN FUNDS
FINANCIAL HIGHLIGHTS
Franklin DynaTech Fund(continued)
| Six Months Ended March 31, 2020 | Year Ended September 30, | |||||||||||||||||||||||
| (unaudited) | 2019 | 2018 | 2017 | 2016 | 2015 | |||||||||||||||||||
| ||||||||||||||||||||||||
Class R6 | ||||||||||||||||||||||||
Per share operating performance (for a share outstanding throughout the period) | ||||||||||||||||||||||||
Net asset value, beginning of period | $86.46 | $84.31 | $65.28 | $53.56 | $47.15 | $46.97 | ||||||||||||||||||
|
| |||||||||||||||||||||||
Income from investment operationsa: | ||||||||||||||||||||||||
Net investment income (loss)b | 0.03 | 0.07 | 0.04 | 0.06 | 0.06 | (0.01) | ||||||||||||||||||
Net realized and unrealized gains (losses) | (2.31) | 3.99 | 20.15 | 13.35 | 7.55 | 1.80 | ||||||||||||||||||
|
| |||||||||||||||||||||||
Total from investment operations | (2.28) | 4.06 | 20.19 | 13.41 | 7.61 | 1.79 | ||||||||||||||||||
|
| |||||||||||||||||||||||
Less distributions from: | ||||||||||||||||||||||||
Net realized gains. | (0.66) | (1.91 | ) | (1.16 | ) | (1.69 | ) | (1.20 | ) | (1.61) | ||||||||||||||
|
| |||||||||||||||||||||||
Net asset value, end of period | $83.52 | $86.46 | $84.31 | $65.28 | $53.56 | $47.15 | ||||||||||||||||||
|
| |||||||||||||||||||||||
Total returnc | (2.69)% | 5.15% | 31.38% | 26.17% | 16.21% | 3.81% | ||||||||||||||||||
Ratios to average net assetsd | ||||||||||||||||||||||||
Expenses before waiver and payments by affiliates | 0.49% | 0.51% | 0.50% | 0.49% | 0.49% | 0.48% | ||||||||||||||||||
Expenses net of waiver and payments by affiliates | 0.48% | 0.50% | e | 0.50% | e,f | 0.48% | e | 0.48% | 0.48%f | |||||||||||||||
Net investment income (loss) | 0.08% | 0.09% | 0.04% | 0.10% | 0.12% | (0.03)% | ||||||||||||||||||
Supplemental data | ||||||||||||||||||||||||
Net assets, end of period (000’s) | $2,833,759 | $2,473,942 | $1,688,595 | $457,846 | $359,505 | $362,627 | ||||||||||||||||||
Portfolio turnover rate. | 3.68% | 20.01% | 17.22% | 19.85% | 22.42% | 31.02% | ||||||||||||||||||
a The amount shown for a share outstanding throughout the period may not correlate with the Statement of Operations for the period due to the timing of sales and repurchases of the Fund’s shares in relation to income earned and/or fluctuating fair value of the investments of the Fund.
b Based on average daily shares outstanding.
c Total return is not annualized for periods less than one year.
d Ratios are annualized for periods less than one year.
e Benefit of expense reduction rounds to less than 0.01%.
f Benefit of waiver and payments by affiliates rounds to less than 0.01%.
38 | Semiannual Report | The accompanying notes are an integral part of these financial statements. | franklintempleton.com | ||
FRANKLIN CUSTODIAN FUNDS
FINANCIAL HIGHLIGHTS
Franklin DynaTech Fund(continued)
| Six Months Ended March 31, 2020 | Year Ended September 30, | |||||||||||||||||||||||
| (unaudited) | 2019 | 2018 | 2017 | 2016 | 2015 | |||||||||||||||||||
| ||||||||||||||||||||||||
Advisor Class | ||||||||||||||||||||||||
Per share operating performance (for a share outstanding throughout the period) | ||||||||||||||||||||||||
Net asset value, beginning of period | $85.58 | $83.56 | $64.78 | $53.25 | $46.96 | $46.87 | ||||||||||||||||||
|
| |||||||||||||||||||||||
Income from investment operationsa: | ||||||||||||||||||||||||
Net investment income (loss)b | (0.01) | (0.01 | ) | (0.06 | ) | (0.04 | ) | (0.03 | ) | (0.09) | ||||||||||||||
Net realized and unrealized gains (losses) | (2.29) | 3.94 | 20.00 | 13.26 | 7.52 | 1.79 | ||||||||||||||||||
|
| |||||||||||||||||||||||
Total from investment operations | (2.30) | 3.93 | 19.94 | 13.22 | 7.49 | 1.70 | ||||||||||||||||||
|
| |||||||||||||||||||||||
Less distributions from: | ||||||||||||||||||||||||
Net realized gains | (0.66) | (1.91 | ) | (1.16 | ) | (1.69 | ) | (1.20 | ) | (1.61) | ||||||||||||||
|
| |||||||||||||||||||||||
Net asset value, end of period | $82.62 | $85.58 | $83.56 | $64.78 | $53.25 | $46.96 | ||||||||||||||||||
|
| |||||||||||||||||||||||
Total returnc | (2.74)% | 5.04% | 31.21% | 25.98% | 16.02% | 3.62% | ||||||||||||||||||
Ratios to average net assetsd | ||||||||||||||||||||||||
Expenses before waiver and payments by affiliates | 0.59% | 0.61% | 0.61% | 0.67% | 0.66% | 0.64% | ||||||||||||||||||
Expenses net of waiver and payments by affiliates | 0.58% | 0.60% | e | 0.61% | e,f | 0.66% | e | 0.65% | 0.64%f | |||||||||||||||
Net investment income (loss) | (0.02)% | (0.01)% | (0.07)% | (0.08)% | (0.05)% | (0.19)% | ||||||||||||||||||
Supplemental data | ||||||||||||||||||||||||
Net assets, end of period (000’s) | $1,318,399 | $1,154,604 | $680,066 | $712,762 | $203,443 | $176,090 | ||||||||||||||||||
Portfolio turnover rate | 3.68% | 20.01% | 17.22% | 19.85% | 22.42% | 31.02% | ||||||||||||||||||
a The amount shown for a share outstanding throughout the period may not correlate with the Statement of Operations for the period due to the timing of sales and repurchases of the Fund’s shares in relation to income earned and/or fluctuating fair value of the investments of the Fund.
b Based on average daily shares outstanding.
c Total return is not annualized for periods less than one year.
d Ratios are annualized for periods less than one year.
e Benefit of expense reduction rounds to less than 0.01%.
f Benefit of waiver and payments by affiliates rounds to less than 0.01%.
| franklintempleton.com | The accompanying notes are an integral part of these financial statements. | Semiannual Report �� | 39 | ||
FRANKLIN CUSTODIAN FUNDS
Statement of Investments, March 31, 2020 (unaudited)
Franklin DynaTech Fund
| Country | Shares | Value | ||||||||||||||
Common Stocks 96.5% | ||||||||||||||||
Aerospace & Defense 1.3% | ||||||||||||||||
The Boeing Co. | United States | 100,000 | $ | 14,914,000 | ||||||||||||
HEICO Corp. | United States | 800,000 | 59,688,000 | |||||||||||||
aMercury Systems Inc. | United States | 125,000 | 8,917,500 | |||||||||||||
Raytheon Co. | United States | 350,000 | 45,902,500 | |||||||||||||
|
| |||||||||||||||
| 129,422,000 | ||||||||||||||||
|
| |||||||||||||||
Automobiles 0.2% | ||||||||||||||||
aTesla Inc. | United States | 30,000 | 15,720,000 | |||||||||||||
|
| |||||||||||||||
Biotechnology 1.2% | ||||||||||||||||
aArgenx SE | Netherlands | 100,000 | 13,159,596 | |||||||||||||
aCRISPR Therapeutics AG | Switzerland | 50,000 | 2,120,500 | |||||||||||||
aDeciphera Pharmaceuticals Inc. | United States | 300,000 | 12,351,000 | |||||||||||||
aIovance Biotherapeutics Inc. | United States | 600,000 | 17,961,000 | |||||||||||||
aNeurocrine Biosciences Inc. | United States | 500,000 | 43,275,000 | |||||||||||||
aPTC Therapeutics Inc. | United States | 300,000 | 13,383,000 | |||||||||||||
auniQure NV | Netherlands | 200,000 | 9,490,000 | |||||||||||||
|
| |||||||||||||||
| 111,740,096 | ||||||||||||||||
|
| |||||||||||||||
Capital Markets 4.0% | ||||||||||||||||
CME Group Inc. | United States | 175,000 | 30,259,250 | |||||||||||||
Intercontinental Exchange Inc. | United States | 1,000,000 | 80,750,000 | |||||||||||||
Moody’s Corp. | United States | 350,000 | 74,025,000 | |||||||||||||
MSCI Inc. | United States | 525,000 | 151,704,000 | |||||||||||||
Tradeweb Markets Inc. | United States | 1,050,000 | 44,142,000 | |||||||||||||
|
| |||||||||||||||
| 380,880,250 | ||||||||||||||||
| �� |
|
| ||||||||||||||
Communications Equipment 0.1% | ||||||||||||||||
Motorola Solutions Inc. | United States | 45,000 | 5,981,400 | |||||||||||||
|
| |||||||||||||||
Diversified Consumer Services 0.3% | ||||||||||||||||
aBright Horizons Family Solutions Inc. | United States | 300,000 | 30,600,000 | |||||||||||||
aChegg Inc. | United States | 75,000 | 2,683,500 | |||||||||||||
|
| |||||||||||||||
| 33,283,500 | ||||||||||||||||
|
| |||||||||||||||
Electric Utilities 0.2% | ||||||||||||||||
NextEra Energy Inc. | United States | 65,000 | 15,640,300 | |||||||||||||
|
| |||||||||||||||
Electronic Equipment, Instruments & Components 1.7% | ||||||||||||||||
Amphenol Corp., A | United States | 850,000 | 61,948,000 | |||||||||||||
Keyence Corp. | Japan | 100,000 | 32,386,443 | |||||||||||||
aKeysight Technologies Inc. | United States | 820,000 | 68,617,600 | |||||||||||||
|
| |||||||||||||||
| 162,952,043 | ||||||||||||||||
|
| |||||||||||||||
Entertainment 1.1% | ||||||||||||||||
aNetflix Inc. | United States | 115,000 | 43,182,500 | |||||||||||||
aSea Ltd., ADR | Taiwan | 1,450,000 | 64,249,500 | |||||||||||||
|
| |||||||||||||||
| 107,432,000 | ||||||||||||||||
|
| |||||||||||||||
Equity Real Estate Investment Trusts (REITs) 5.1% | ||||||||||||||||
American Tower Corp. | United States | 500,000 | 108,875,000 | |||||||||||||
Crown Castle International Corp. | United States | 500,000 | 72,200,000 | |||||||||||||
Digital Realty Trust Inc. | United States | 530,025 | 73,625,773 | |||||||||||||
40 | Semiannual Report | franklintempleton.com | ||
FRANKLIN CUSTODIAN FUNDS
STATEMENT OF INVESTMENTS (UNAUDITED)
Franklin DynaTech Fund(continued)
| Country | Shares | Value | ||||||||||||||
Common Stocks(continued) | ||||||||||||||||
Equity Real Estate Investment Trusts (REITs)(continued) | ||||||||||||||||
Equinix Inc. | United States | 165,000 | $ | 103,054,050 | ||||||||||||
SBA Communications Corp., A | United States | 500,000 | 134,985,000 | |||||||||||||
|
| |||||||||||||||
| 492,739,823 | ||||||||||||||||
|
| |||||||||||||||
Health Care Equipment & Supplies 9.2% | ||||||||||||||||
Abbott Laboratories | United States | 1,300,000 | 102,583,000 | |||||||||||||
aAlcon Inc. | Switzerland | 330,000 | 16,770,600 | |||||||||||||
Baxter International Inc. | United States | 250,000 | 20,297,500 | |||||||||||||
Becton, Dickinson and Co. | United States | 250,000 | 57,442,500 | |||||||||||||
Danaher Corp. | United States | 1,050,000 | 145,330,500 | |||||||||||||
aEdwards Lifesciences Corp. | United States | 450,000 | 84,879,000 | |||||||||||||
aIDEXX Laboratories Inc. | United States | 500,000 | 121,120,000 | |||||||||||||
aIntuitive Surgical Inc. | United States | 200,000 | 99,042,000 | |||||||||||||
aiRhythm Technologies Inc. | United States | 80,000 | 6,508,000 | |||||||||||||
ResMed Inc. | United States | 400,000 | 58,916,000 | |||||||||||||
Siemens Healthineers AG | Germany | 550,000 | 21,255,315 | |||||||||||||
STERIS PLC | United States | 500,000 | 69,985,000 | |||||||||||||
Stryker Corp. | United States | 500,000 | 83,245,000 | |||||||||||||
|
| |||||||||||||||
| 887,374,415 | ||||||||||||||||
|
| |||||||||||||||
Health Care Providers & Services 0.6% | ||||||||||||||||
aGuardant Health Inc. | United States | 100,000 | 6,960,000 | |||||||||||||
UnitedHealth Group Inc. | United States | 200,000 | 49,876,000 | |||||||||||||
|
| |||||||||||||||
| 56,836,000 | ||||||||||||||||
|
| |||||||||||||||
Health Care Technology 2.0% | ||||||||||||||||
aInspire Medical Systems Inc. | United States | 600,000 | 36,168,000 | |||||||||||||
aTeladoc Inc. | United States | 25,000 | 3,875,250 | |||||||||||||
aVeeva Systems Inc. | United States | 1,000,000 | 156,370,000 | |||||||||||||
|
| |||||||||||||||
| 196,413,250 | ||||||||||||||||
|
| |||||||||||||||
Industrial Conglomerates 0.8% | ||||||||||||||||
Roper Technologies Inc. | United States | 250,000 | 77,952,500 | |||||||||||||
|
| |||||||||||||||
Interactive Media & Services 6.9% | ||||||||||||||||
aAdevinta ASA, B | France | 1,100,000 | 9,979,305 | |||||||||||||
aAlphabet Inc., A | United States | 220,000 | 255,629,000 | |||||||||||||
aAlphabet Inc., C | United States | 62,170 | 72,291,898 | |||||||||||||
aFacebook Inc., A | United States | 950,000 | 158,460,000 | |||||||||||||
a,bMatch Group Inc. | United States | 600,000 | 39,624,000 | |||||||||||||
Tencent Holdings Ltd. | China | 2,600,000 | 127,507,368 | |||||||||||||
|
| |||||||||||||||
| 663,491,571 | ||||||||||||||||
|
| |||||||||||||||
Internet & Direct Marketing Retail 10.7% | ||||||||||||||||
aAlibaba Group Holding Ltd., ADR | China | 810,000 | 157,528,800 | |||||||||||||
aAmazon.com Inc. | United States | 360,000 | 701,899,200 | |||||||||||||
aBooking Holdings Inc. | United States | 20,000 | 26,906,400 | |||||||||||||
aChewy Inc., A | United States | 135,000 | 5,061,150 | |||||||||||||
aDelivery Hero SE | Germany | 500,000 | 36,752,053 | |||||||||||||
aMercadoLibre Inc. | Argentina | 210,000 | 102,601,800 | |||||||||||||
| franklintempleton.com | Semiannual Report | 41 | ||
FRANKLIN CUSTODIAN FUNDS
STATEMENT OF INVESTMENTS (UNAUDITED)
Franklin DynaTech Fund(continued)
| Country | Shares | Value | ||||||||||||||
Common Stocks(continued) | ||||||||||||||||
Internet & Direct Marketing Retail(continued) | ||||||||||||||||
aZalando SE | Germany | 75,000 | $ | 2,825,987 | ||||||||||||
|
| |||||||||||||||
| 1,033,575,390 | ||||||||||||||||
|
| |||||||||||||||
IT Services 11.6% | ||||||||||||||||
aAdyen NV | Netherlands | 120,000 | 102,490,940 | |||||||||||||
aEPAM Systems Inc. | United States | 160,000 | 29,705,600 | |||||||||||||
aFiserv Inc. | United States | 600,000 | 56,994,000 | |||||||||||||
Jack Henry & Associates Inc. | United States | 165,000 | 25,614,600 | |||||||||||||
Mastercard Inc., A | United States | 1,000,000 | 241,560,000 | |||||||||||||
aMongoDB Inc. | United States | 500,000 | 68,270,000 | |||||||||||||
aNetwork International Holdings Ltd. | United Arab Emirates | 1,000,000 | 4,859,671 | |||||||||||||
aOkta Inc., A | United States | 415,000 | 50,737,900 | |||||||||||||
aPayPal Holdings Inc. | United States | 1,225,000 | 117,281,500 | |||||||||||||
aShopify Inc., A | Canada | 450,000 | 188,510,835 | |||||||||||||
aTwilio Inc., A | United States | 285,000 | 25,504,650 | |||||||||||||
Visa Inc., A | United States | 1,300,000 | 209,456,000 | |||||||||||||
|
| |||||||||||||||
| 1,120,985,696 | ||||||||||||||||
|
| |||||||||||||||
Life Sciences Tools & Services 3.0% | ||||||||||||||||
a10X Genomics Inc., A | United States | 30,200 | 1,882,064 | |||||||||||||
aCharles River Laboratories International Inc. | United States | 100,000 | 12,621,000 | |||||||||||||
aEvotec SE | Germany | 325,000 | 7,053,772 | |||||||||||||
aIllumina Inc. | United States | 250,000 | 68,280,000 | |||||||||||||
aIQVIA Holdings Inc. | United States | 150,000 | 16,179,000 | |||||||||||||
Lonza Group AG | Switzerland | 60,000 | 24,666,613 | |||||||||||||
aMedpace Holdings Inc. | United States | 110,000 | 8,071,800 | |||||||||||||
aRepligen Corp. | United States | 375,000 | 36,202,500 | |||||||||||||
Thermo Fisher Scientific Inc. | United States | 310,000 | 87,916,000 | |||||||||||||
aWaters Corp. | United States | 75,000 | 13,653,750 | |||||||||||||
aWuXi Biologics (Cayman) Inc. | China | 1,050,000 | 13,611,475 | |||||||||||||
|
| |||||||||||||||
| 290,137,974 | ||||||||||||||||
|
| |||||||||||||||
Machinery 0.6% | ||||||||||||||||
Fortive Corp. | United States | 1,000,000 | 55,190,000 | |||||||||||||
|
| |||||||||||||||
Media 1.3% | ||||||||||||||||
aCharter Communications Inc., A | United States | 100,000 | 43,631,000 | |||||||||||||
aLiberty Broadband Corp., A | United States | 750,000 | 80,250,000 | |||||||||||||
|
| |||||||||||||||
| 123,881,000 | ||||||||||||||||
|
| |||||||||||||||
Pharmaceuticals 2.3% | ||||||||||||||||
AstraZeneca PLC | United Kingdom | 1,000,000 | 89,048,669 | |||||||||||||
aCatalent Inc. | United States | 475,000 | 24,676,250 | |||||||||||||
Merck KGaA | Germany | 500,000 | 50,467,318 | |||||||||||||
aReata Pharmaceuticals Inc. | United States | 100,000 | 14,434,000 | |||||||||||||
Zoetis Inc. | United States | 335,000 | 39,426,150 | |||||||||||||
|
| |||||||||||||||
| 218,052,387 | ||||||||||||||||
|
| |||||||||||||||
42 | Semiannual Report | franklintempleton.com | ||
FRANKLIN CUSTODIAN FUNDS
STATEMENT OF INVESTMENTS (UNAUDITED)
Franklin DynaTech Fund(continued)
| Country | Shares | Value | ||||||||||||||
Common Stocks(continued) | ||||||||||||||||
Professional Services 2.1% | ||||||||||||||||
aCoStar Group Inc. | United States | 165,000 | $ | 96,889,650 | ||||||||||||
TransUnion | United States | 500,000 | 33,090,000 | |||||||||||||
Verisk Analytics Inc. | United States | 500,000 | 69,690,000 | |||||||||||||
|
| |||||||||||||||
| 199,669,650 | ||||||||||||||||
|
| |||||||||||||||
Semiconductors & Semiconductor Equipment 5.8% | ||||||||||||||||
Analog Devices Inc. | United States | 700,000 | 62,755,000 | |||||||||||||
ASML Holding NV, N.Y. shs | Netherlands | 210,000 | 54,944,400 | |||||||||||||
Intel Corp. | United States | 800,000 | 43,296,000 | |||||||||||||
KLA Corp. | United States | 260,000 | 37,372,400 | |||||||||||||
Lam Research Corp. | United States | 350,000 | 84,000,000 | |||||||||||||
Monolithic Power Systems. | United States | 450,000 | 75,357,000 | |||||||||||||
NVIDIA Corp. | United States | 500,000 | 131,800,000 | |||||||||||||
Teradyne Inc. | United States | 25,000 | 1,354,250 | |||||||||||||
Xilinx Inc. | United States | 900,000 | 70,146,000 | |||||||||||||
|
| |||||||||||||||
| 561,025,050 | ||||||||||||||||
|
| |||||||||||||||
Software 23.0% | ||||||||||||||||
aAdobe Inc. | United States | 500,000 | 159,120,000 | |||||||||||||
aAlteryx Inc. | United States | 575,000 | 54,722,750 | |||||||||||||
aANSYS Inc. | United States | 400,000 | 92,988,000 | |||||||||||||
aAspen Technology Inc. | United States | 500,000 | 47,535,000 | |||||||||||||
aAtlassian Corp. PLC | United States | 550,000 | 75,493,000 | |||||||||||||
aAutodesk Inc. | United States | 500,000 | 78,050,000 | |||||||||||||
aAvalara Inc. | United States | 300,000 | 22,380,000 | |||||||||||||
a,bBill.Com Holdings Inc. | United States | 225,000 | 7,695,000 | |||||||||||||
aCadence Design Systems Inc. | United States | 800,000 | 52,832,000 | |||||||||||||
Constellation Software Inc. | Canada | 63,000 | 57,249,208 | |||||||||||||
aCoupa Software Inc. | United States | 500,000 | 69,865,000 | |||||||||||||
aDatadog Inc., A | United States | 200,000 | 7,196,000 | |||||||||||||
aDocuSign Inc. | United States | 365,000 | 33,726,000 | |||||||||||||
aGlobant SA | Argentina | 150,000 | 13,182,000 | |||||||||||||
aGuidewire Software Inc. | United States | 500,000 | 39,655,000 | |||||||||||||
aHubspot Inc. | United States | 500,000 | 66,595,000 | |||||||||||||
Intuit Inc. | United States | 500,000 | 115,000,000 | |||||||||||||
Microsoft Corp. | United States | 2,700,000 | 425,817,000 | |||||||||||||
aPaycom Software Inc. | United States | 140,000 | 28,281,400 | |||||||||||||
aPaylocity Holding Corp. | United States | 170,000 | 15,014,400 | |||||||||||||
aQ2 Holdings Inc. | United States | 725,000 | 42,818,500 | |||||||||||||
aRingCentral Inc., A | United States | 250,000 | 52,977,500 | |||||||||||||
asalesforce.com Inc. | United States | 1,000,000 | 143,980,000 | |||||||||||||
aServiceNow Inc. | United States | 735,000 | 210,636,300 | |||||||||||||
aSlack Technologies Inc. | United States | 75,000 | 2,013,000 | |||||||||||||
aSmartsheet Inc., A | United States | 600,000 | 24,906,000 | |||||||||||||
aSynopsys Inc. | United States | 540,000 | 69,546,600 | |||||||||||||
aTyler Technologies Inc. | United States | 210,000 | 62,277,600 | |||||||||||||
aWorkday Inc., A | United States | 600,000 | 78,132,000 | |||||||||||||
aXero Ltd. | New Zealand | 105,000 | 4,380,297 | |||||||||||||
aZendesk Inc. | United States | 650,000 | 41,606,500 | |||||||||||||
| franklintempleton.com | Semiannual Report | 43 | ||
FRANKLIN CUSTODIAN FUNDS
STATEMENT OF INVESTMENTS (UNAUDITED)
Franklin DynaTech Fund(continued)
| Country | Shares | Value | ||||||||||||||
Common Stocks(continued) | ||||||||||||||||
Software(continued) | ||||||||||||||||
aZoom Video Communications Inc., A | United States | 150,000 | $ | 21,918,000 | ||||||||||||
|
| |||||||||||||||
| 2,217,589,055 | ||||||||||||||||
|
| |||||||||||||||
Technology Hardware, Storage & Peripherals 1.1% | ||||||||||||||||
Apple Inc. | United States | 400,000 | 101,716,000 | |||||||||||||
|
| |||||||||||||||
Textiles, Apparel & Luxury Goods 0.3% | ||||||||||||||||
NIKE Inc., B | United States | 300,000 | 24,822,000 | |||||||||||||
|
| |||||||||||||||
Total Common Stocks (Cost $5,929,936,448) | 9,284,503,350 | |||||||||||||||
|
| |||||||||||||||
Short Term Investments 3.3% | ||||||||||||||||
Money Market Funds (Cost $273,100,737) 2.8% | ||||||||||||||||
c,dInstitutional Fiduciary Trust Money Market Portfolio, 0.32% | United States | 273,100,737 | 273,100,737 | |||||||||||||
|
| |||||||||||||||
eInvestments from Cash Collateral Received for Loaned Securities 0.5% | ||||||||||||||||
Money Market Funds (Cost $39,481,000) 0.4% | ||||||||||||||||
c,dInstitutional Fiduciary Trust Money Market Portfolio, 0.32% | United States | 39,481,000 | 39,481,000 | |||||||||||||
|
| |||||||||||||||
| Principal Amount | ||||||||||||||||
Repurchase Agreements 0.1% | ||||||||||||||||
fJoint Repurchase Agreement, 0.01%, 4/01/20 (Maturity Value $6,006,160) | ||||||||||||||||
Collateralized bygU.S. Treasury Bills, 4/07/20; U.S. Treasury Notes, | United States | $ | 6,006,158 | 6,006,158 | ||||||||||||
fJoint Repurchase Agreement, 0.01%, 4/01/20 (Maturity Value $1,064,157) | ||||||||||||||||
Collateralized by U.S. Treasury Notes, 2.75%, 11/15/23 (valued at $1,085,444) | United States | 1,064,157 | 1,064,157 | |||||||||||||
|
| |||||||||||||||
Total Repurchase Agreements (Cost $7,070,315) | 7,070,315 | |||||||||||||||
|
| |||||||||||||||
Total Investments from Cash Collateral Received for Loaned Securities (Cost $46,551,315) | 46,551,315 | |||||||||||||||
|
| |||||||||||||||
Total Investments (Cost $6,249,588,500) 99.8% | 9,604,155,402 | |||||||||||||||
Other Assets, less Liabilities 0.2% | 19,754,679 | |||||||||||||||
|
| |||||||||||||||
Net Assets 100.0%. | $ | 9,623,910,081 | ||||||||||||||
|
| |||||||||||||||
See Abbreviations on page 127.
aNon-income producing.
bA portion or all of the security is on loan at March 31, 2020. See Note 1(i).
cSee Note 3(f) regarding investments in affiliated management investment companies.
dThe rate shown is the annualizedseven-day effective yield at period end.
eSee Note 1(i) regarding securities on loan.
fSee Note 1(c) regarding joint repurchase agreement.
gThe security was issued on a discount basis with no stated coupon rate.
44 | Semiannual Report | The accompanying notes are an integral part of these financial statements. | franklintempleton.com | ||
FRANKLIN CUSTODIAN FUNDS
Financial Highlights
Franklin Growth Fund
Six Months Ended March 31, 2020 (unaudited) | ||||||||||||||||||||||||
| Year Ended September 30, | ||||||||||||||||||||||||
| 2019 | 2018 | 2017 | 2016 | 2015 | ||||||||||||||||||||
| ||||||||||||||||||||||||
Class A | ||||||||||||||||||||||||
Per share operating performance (for a share outstanding throughout the period) | ||||||||||||||||||||||||
Net asset value, beginning of period | $110.04 | $107.59 | $ 91.61 | $78.54 | $72.40 | $70.51 | ||||||||||||||||||
|
| |||||||||||||||||||||||
Income from investment operationsa: | ||||||||||||||||||||||||
Net investment incomeb | 0.22 | 0.46 | 0.41 | 0.40 | 0.47 | c | 0.29 | |||||||||||||||||
Net realized and unrealized gains (losses) | (9.71 | ) | 3.47 | 18.18 | 15.56 | 8.51 | 1.79 | |||||||||||||||||
|
| |||||||||||||||||||||||
Total from investment operations | (9.49 | ) | 3.93 | 18.59 | 15.96 | 8.98 | 2.08 | |||||||||||||||||
|
| |||||||||||||||||||||||
Less distributions from: | ||||||||||||||||||||||||
Net investment income | (0.46 | ) | (0.44 | ) | (0.36 | ) | (0.39 | ) | (0.47 | ) | (0.19) | |||||||||||||
Net realized gains | (5.99 | ) | (1.04 | ) | (2.25 | ) | (2.50 | ) | (2.37 | ) | — | |||||||||||||
|
| |||||||||||||||||||||||
Total distributions | (6.45 | ) | (1.48 | ) | (2.61 | ) | (2.89 | ) | (2.84 | ) | (0.19) | |||||||||||||
|
| |||||||||||||||||||||||
Net asset value, end of period | $ 94.10 | $110.04 | $107.59 | $91.61 | $78.54 | $72.40 | ||||||||||||||||||
|
| |||||||||||||||||||||||
Total returnd | (9.39)% | 3.79% | 20.72% | 21.12% | 12.57% | 2.94% | ||||||||||||||||||
Ratios to average net assetse | ||||||||||||||||||||||||
Expenses before waiver and payments by affiliates | 0.81% | 0.83% | 0.83% | 0.88% | 0.88% | 0.88% | ||||||||||||||||||
Expenses net of waiver and payments by affiliatesf | 0.81% | g | 0.83% | g | 0.83% | g | 0.87% | 0.86% | 0.88%g | |||||||||||||||
Net investment income | 0.40% | 0.45% | 0.41% | 0.47% | 0.63% | c | 0.38% | |||||||||||||||||
Supplemental data | ||||||||||||||||||||||||
Net assets, end of period (000’s) | $8,149,798 | $9,157,154 | $9,044,834 | $8,051,641 | $7,628,523 | $7,185,665 | ||||||||||||||||||
Portfolio turnover rate | 4.44% | 4.91% | h | 6.05% | h | 5.60% | 7.53% | 5.05% | ||||||||||||||||
aThe amount shown for a share outstanding throughout the period may not correlate with the Statement of Operations for the period due to the timing of sales and repurchases of the Fund’s shares in relation to income earned and/or fluctuating fair value of the investments of the Fund.
bBased on average daily shares outstanding.
cNet investment income per share includes approximately $0.10 per share related to income received in the form of special dividends in connection with certain Fund holdings. Excluding this amount, the ratio of net investment income to average net assets would have been 0.50%.
dTotal return does not reflect sales commissions or contingent deferred sales charges, if applicable, and is not annualized for periods less than one year.
eRatios are annualized for periods less than one year.
fBenefit of expense reduction rounds to less than 0.01%.
gBenefit of waiver and payments by affiliates rounds to less than 0.01%.
hExcludes the value of portfolio securities delivered as a result of a redemptionin-kind. See Note 12.
| franklintempleton.com | The accompanying notes are an integral part of these financial statements. | Semiannual Report | 45 | ||
FRANKLIN CUSTODIAN FUNDS
FINANCIAL HIGHLIGHTS
Franklin Growth Fund(continued)
Six Months Ended March 31, 2020 (unaudited) | ||||||||||||||||||||||||
| Year Ended September 30, | ||||||||||||||||||||||||
| 2019 | 2018 | 2017 | 2016 | 2015 | ||||||||||||||||||||
| ||||||||||||||||||||||||
Class C | ||||||||||||||||||||||||
Per share operating performance (for a share outstanding throughout the period) | ||||||||||||||||||||||||
Net asset value, beginning of period | $100.21 | $ 98.38 | $84.25 | $72.60 | $67.17 | $65.75 | ||||||||||||||||||
|
| |||||||||||||||||||||||
Income from investment operationsa: | ||||||||||||||||||||||||
Net investment income (loss)b | (0.17 | ) | (0.29 | ) | (0.30 | ) | (0.21 | ) | (0.08 | )c | (0.26) | |||||||||||||
Net realized and unrealized gains (losses) | (8.78 | ) | 3.16 | 16.68 | 14.36 | 7.88 | 1.68 | |||||||||||||||||
|
| |||||||||||||||||||||||
Total from investment operations | (8.95 | ) | 2.87 | 16.38 | 14.15 | 7.80 | 1.42 | |||||||||||||||||
|
| |||||||||||||||||||||||
Less distributions from: | ||||||||||||||||||||||||
Net realized gains | (5.99 | ) | (1.04 | ) | (2.25 | ) | (2.50 | ) | (2.37 | ) | — | |||||||||||||
|
| |||||||||||||||||||||||
Net asset value, end of period | $ 85.27 | $100.21 | $98.38 | $84.25 | $72.60 | $67.17 | ||||||||||||||||||
|
| |||||||||||||||||||||||
Total returnd | (9.72)% | 3.02% | 19.82% | 20.21% | 11.74% | 2.16% | ||||||||||||||||||
Ratios to average net assetse | ||||||||||||||||||||||||
Expenses before waiver and payments by affiliates | 1.56% | 1.58% | 1.58% | 1.63% | 1.63% | 1.63% | ||||||||||||||||||
Expenses net of waiver and payments by affiliatesf | 1.56% | g | 1.58% | g | 1.58% | g | 1.62% | 1.61% | 1.63%g | |||||||||||||||
Net investment income (loss) | (0.35)% | (0.30)% | (0.34)% | (0.28)% | (0.12)%c | (0.37)% | ||||||||||||||||||
Supplemental data | ||||||||||||||||||||||||
Net assets, end of period (000’s) | $601,887 | $704,217 | $1,060,258 | $930,751 | $846,965 | $777,570 | ||||||||||||||||||
Portfolio turnover rate | 4.44% | 4.91% | h | 6.05% | h | 5.60% | 7.53% | 5.05% | ||||||||||||||||
aThe amount shown for a share outstanding throughout the period may not correlate with the Statement of Operations for the period due to the timing of sales and repurchases of the Fund’s shares in relation to income earned and/or fluctuating fair value of the investments of the Fund.
bBased on average daily shares outstanding.
cNet investment income per share includes approximately $0.10 per share related to income received in the form of special dividends in connection with certain Fund holdings. Excluding this amount, the ratio of net investment income to average net assets would have been (0.25)%.
dTotal return does not reflect sales commissions or contingent deferred sales charges, if applicable, and is not annualized for periods less than one year.
eRatios are annualized for periods less than one year.
fBenefit of expense reduction rounds to less than 0.01%.
gBenefit of waiver and payments by affiliates rounds to less than 0.01%.
hExcludes the value of portfolio securities delivered as a result of a redemptionin-kind. See Note 12.
46 | Semiannual Report | The accompanying notes are an integral part of these financial statements. | franklintempleton.com | ||
FRANKLIN CUSTODIAN FUNDS
FINANCIAL HIGHLIGHTS
Franklin Growth Fund(continued)
Six Months Ended March 31, 2020 (unaudited) | ||||||||||||||||||||||||
| Year Ended September 30, | ||||||||||||||||||||||||
| 2019 | 2018 | 2017 | 2016 | 2015 | ||||||||||||||||||||
| ||||||||||||||||||||||||
Class R | ||||||||||||||||||||||||
Per share operating performance (for a share outstanding throughout the period) | ||||||||||||||||||||||||
Net asset value, beginning of period | $109.49 | $107.00 | $ 91.13 | $78.14 | $71.93 | $70.05 | ||||||||||||||||||
|
| |||||||||||||||||||||||
Income from investment operationsa: | ||||||||||||||||||||||||
Net investment incomeb | 0.08 | 0.21 | 0.16 | 0.19 | 0.29 | c | 0.10 | |||||||||||||||||
Net realized and unrealized gains (losses) | (9.68 | ) | 3.46 | 18.09 | 15.51 | 8.45 | 1.78 | |||||||||||||||||
|
| |||||||||||||||||||||||
Total from investment operations | (9.60 | ) | 3.67 | 18.25 | 15.70 | 8.74 | 1.88 | |||||||||||||||||
|
| |||||||||||||||||||||||
Less distributions from: | ||||||||||||||||||||||||
Net investment income | (0.13 | ) | (0.14 | ) | (0.13 | ) | (0.21 | ) | (0.16 | ) | — | |||||||||||||
Net realized gains | (5.99 | ) | (1.04 | ) | (2.25 | ) | (2.50 | ) | (2.37 | ) | — | |||||||||||||
|
| |||||||||||||||||||||||
Total distributions | (6.12 | ) | (1.18 | ) | (2.38 | ) | (2.71 | ) | (2.53 | ) | — | |||||||||||||
|
| |||||||||||||||||||||||
Net asset value, end of period | $ 93.77 | $109.49 | $107.00 | $91.13 | $78.14 | $71.93 | ||||||||||||||||||
|
| |||||||||||||||||||||||
Total returnd | (9.51)% | 3.54% | 20.42% | 20.81% | 12.29% | 2.68% | ||||||||||||||||||
Ratios to average net assetse | ||||||||||||||||||||||||
Expenses before waiver and payments by affiliates | 1.06% | 1.08% | 1.08% | 1.13% | 1.13% | 1.13% | ||||||||||||||||||
Expenses net of waiver and payments by affiliatesf | 1.06% | g | 1.08% | g | 1.08% | g | 1.12% | 1.11% | 1.13%g | |||||||||||||||
Net investment income | 0.15% | 0.20% | 0.16% | 0.22% | 0.38% | c | 0.13% | |||||||||||||||||
Supplemental data | ||||||||||||||||||||||||
Net assets, end of period (000’s) | $335,276 | $435,331 | $524,960 | $510,317 | $477,221 | $501,813 | ||||||||||||||||||
Portfolio turnover rate | 4.44% | 4.91% | h | 6.05% | h | 5.60% | 7.53% | 5.05% | ||||||||||||||||
aThe amount shown for a share outstanding throughout the period may not correlate with the Statement of Operations for the period due to the timing of sales and repurchases of the Fund’s shares in relation to income earned and/or fluctuating fair value of the investments of the Fund.
bBased on average daily shares outstanding.
cNet investment income per share includes approximately $0.10 per share related to income received in the form of special dividends in connection with certain Fund holdings. Excluding this amount, the ratio of net investment income to average net assets would have been 0.25%.
dTotal return is not annualized for periods less than one year.
eRatios are annualized for periods less than one year.
fBenefit of expense reduction rounds to less than 0.01%.
gBenefit of waiver and payments by affiliates rounds to less than 0.01%.
hExcludes the value of portfolio securities delivered as a result of a redemptionin-kind. See Note 12.
| franklintempleton.com | The accompanying notes are an integral part of these financial statements. | Semiannual Report | 47 | ||
FRANKLIN CUSTODIAN FUNDS
FINANCIAL HIGHLIGHTS
Franklin Growth Fund(continued)
Six Months Ended March 31, 2020 (unaudited) | Year Ended September 30, | |||||||||||||||||||||||
| 2019 | 2018 | 2017 | 2016 | 2015 | ||||||||||||||||||||
| ||||||||||||||||||||||||
Class R6 | ||||||||||||||||||||||||
Per share operating performance (for a share outstanding throughout the period) | ||||||||||||||||||||||||
Net asset value, beginning of period | $110.37 | $107.90 | $ 91.90 | $78.79 | $72.69 | $70.76 | ||||||||||||||||||
|
| |||||||||||||||||||||||
Income from investment operationsa: | ||||||||||||||||||||||||
Net investment incomeb | 0.41 | 0.83 | 0.77 | 0.74 | 0.78 | c | 0.61 | |||||||||||||||||
Net realized and unrealized gains (losses) | (9.71 | ) | 3.47 | 18.22 | 15.59 | 8.56 | 1.79 | |||||||||||||||||
|
| |||||||||||||||||||||||
Total from investment operations | (9.30 | ) | 4.30 | 18.99 | 16.33 | 9.34 | 2.40 | |||||||||||||||||
|
| |||||||||||||||||||||||
Less distributions from: | ||||||||||||||||||||||||
Net investment income | (0.84 | ) | (0.79 | ) | (0.74 | ) | (0.72 | ) | (0.87 | ) | (0.47) | |||||||||||||
Net realized gains | (5.99 | ) | (1.04 | ) | (2.25 | ) | (2.50 | ) | (2.37 | ) | — | |||||||||||||
|
| |||||||||||||||||||||||
Total distributions | (6.83 | ) | (1.83 | ) | (2.99 | ) | (3.22 | ) | (3.24 | ) | (0.47) | |||||||||||||
|
| |||||||||||||||||||||||
Net asset value, end of period | $ 94.24 | $110.37 | $107.90 | $91.90 | $78.79 | $72.69 | ||||||||||||||||||
|
| |||||||||||||||||||||||
Total returnd | (9.22)% | 4.16% | 21.17% | 21.61% | 13.05% | 3.37% | ||||||||||||||||||
Ratios to average net assetse | ||||||||||||||||||||||||
Expenses before waiver and payments by affiliates | 0.47% | 0.48% | 0.47% | 0.46% | 0.46% | 0.46% | ||||||||||||||||||
Expenses net of waiver and payments by affiliatesf | 0.47% | g | 0.48% | g | 0.46% | 0.45% | 0.44% | 0.46%g | ||||||||||||||||
Net investment income | 0.74% | 0.80% | 0.78% | 0.89% | 1.05%c | 0.80% | ||||||||||||||||||
Supplemental data | ||||||||||||||||||||||||
Net assets, end of period (000’s) | $2,309,813 | $2,545,800 | $2,634,455 | $1,700,993 | $1,247,825 | $1,163,362 | ||||||||||||||||||
Portfolio turnover rate | 4.44% | 4.91% | h | 6.05% | h | 5.60% | 7.53% | 5.05% | ||||||||||||||||
aThe amount shown for a share outstanding throughout the period may not correlate with the Statement of Operations for the period due to the timing of sales and repurchases of the Fund’s shares in relation to income earned and/or fluctuating fair value of the investments of the Fund.
bBased on average daily shares outstanding.
cNet investment income per share includes approximately $0.10 per share related to income received in the form of special dividends in connection with certain Fund holdings. Excluding this amount, the ratio of net investment income to average net assets would have been 0.92%.
dTotal return is not annualized for periods less than one year.
eRatios are annualized for periods less than one year.
fBenefit of expense reduction rounds to less than 0.01%.
gBenefit of waiver and payments by affiliates rounds to less than 0.01%.
hExcludes the value of portfolio securities delivered as a result of a redemptionin-kind. See Note 12.
48 | Semiannual Report | The accompanying notes are an integral part of these financial statements. | franklintempleton.com | ||
FRANKLIN CUSTODIAN FUNDS
FINANCIAL HIGHLIGHTS
Franklin Growth Fund(continued)
Six Months Ended March 31, 2020 (unaudited) | Year Ended September 30, | |||||||||||||||||||||||
| 2019 | 2018 | 2017 | 2016 | 2015 | ||||||||||||||||||||
| ||||||||||||||||||||||||
Advisor Class | ||||||||||||||||||||||||
Per share operating performance (for a share outstanding throughout the period) | ||||||||||||||||||||||||
Net asset value, beginning of period | $110.41 | $107.95 | $ 91.90 | $78.80 | $72.67 | $70.75 | ||||||||||||||||||
|
| |||||||||||||||||||||||
Income from investment operationsa: | ||||||||||||||||||||||||
Net investment incomeb | 0.36 | 0.72 | 0.66 | 0.60 | 0.65 | c | 0.48 | |||||||||||||||||
Net realized and unrealized gains (losses) | (9.72 | ) | 3.47 | 18.23 | 15.61 | 8.56 | 1.79 | |||||||||||||||||
|
| |||||||||||||||||||||||
Total from investment operations | (9.36 | ) | 4.19 | 18.89 | 16.21 | 9.21 | 2.27 | |||||||||||||||||
|
| |||||||||||||||||||||||
Less distributions from: | ||||||||||||||||||||||||
Net investment income | (0.73 | ) | (0.69 | ) | (0.59 | ) | (0.61 | ) | (0.71 | ) | (0.35) | |||||||||||||
Net realized gains | (5.99 | ) | (1.04 | ) | (2.25 | ) | (2.50 | ) | (2.37 | ) | — | |||||||||||||
|
| |||||||||||||||||||||||
Total distributions | (6.72 | ) | (1.73 | ) | (2.84 | ) | (3.11 | ) | (3.08 | ) | (0.35) | |||||||||||||
|
| |||||||||||||||||||||||
Net asset value, end of period | $ 94.33 | $110.41 | $107.95 | $91.90 | $78.80 | $72.67 | ||||||||||||||||||
|
| |||||||||||||||||||||||
Total returnd | (9.27)% | 4.05% | 21.02% | 21.43% | 12.85% | 3.20% | ||||||||||||||||||
Ratios to average net assetse | ||||||||||||||||||||||||
Expenses before waiver and payments by affiliates | 0.56% | 0.58% | 0.58% | 0.63% | 0.63% | 0.63% | ||||||||||||||||||
Expenses net of waiver and payments by affiliatesf | 0.56% | g | 0.58% | g | 0.58% | g | 0.62% | 0.61% | 0.63%g | |||||||||||||||
Net investment income | 0.65% | 0.70% | 0.66% | 0.72% | 0.88%c | 0.63% | ||||||||||||||||||
Supplemental data | ||||||||||||||||||||||||
Net assets, end of period (000’s) | $2,818,823 | $3,154,342 | $3,139,208 | $2,801,153 | $1,998,483 | $1,514,492 | ||||||||||||||||||
Portfolio turnover rate | 4.44% | 4.91% | h | 6.05% | h | 5.60% | 7.53% | 5.05% | ||||||||||||||||
aThe amount shown for a share outstanding throughout the period may not correlate with the Statement of Operations for the period due to the timing of sales and repurchases of the Fund’s shares in relation to income earned and/or fluctuating fair value of the investments of the Fund.
bBased on average daily shares outstanding.
cNet investment income per share includes approximately $0.10 per share related to income received in the form of special dividends in connection with certain Fund holdings. Excluding this amount, the ratio of net investment income to average net assets would have been 0.75%.
dTotal return is not annualized for periods less than one year.
eRatios are annualized for periods less than one year.
fBenefit of expense reduction rounds to less than 0.01%.
gBenefit of waiver and payments by affiliates rounds to less than 0.01%.
hExcludes the value of portfolio securities delivered as a result of a redemptionin-kind. See Note 12.
| franklintempleton.com | The accompanying notes are an integral part of these financial statements. | Semiannual Report | 49 | ||
FRANKLIN CUSTODIAN FUNDS
Statement of Investments, March 31, 2020 (unaudited)
Franklin Growth Fund
| Country | Shares | Value | ||||||||||||||
Common Stocks 97.0% | ||||||||||||||||
Automobiles & Components 0.0%† | ||||||||||||||||
Aptiv PLC | United States | 14,860 | $ | 731,706 | ||||||||||||
|
| |||||||||||||||
Capital Goods 11.7% | ||||||||||||||||
Allegion PLC | United States | 692,923 | 63,762,774 | |||||||||||||
AMETEK Inc. | United States | 692,923 | 49,904,314 | |||||||||||||
The Boeing Co. | United States | 366,979 | 54,731,248 | |||||||||||||
BWX Technologies Inc. | United States | 1,711,122 | 83,348,753 | |||||||||||||
Caterpillar Inc. | United States | 544,440 | 63,176,818 | |||||||||||||
Deere & Co. | United States | 494,945 | 68,381,601 | |||||||||||||
Emerson Electric Co. | United States | 1,088,879 | 51,885,084 | |||||||||||||
Fastenal Co. | United States | 1,838,300 | 57,446,875 | |||||||||||||
Fortive Corp. | United States | 547,922 | 30,239,815 | |||||||||||||
General Dynamics Corp. | United States | 989,889 | 130,972,214 | |||||||||||||
Illinois Tool Works Inc. | United States | 989,889 | 140,683,025 | |||||||||||||
aIngersoll-Rand Inc. | United States | 960,826 | 23,828,485 | |||||||||||||
Lockheed Martin Corp. | United States | 494,945 | 167,761,608 | |||||||||||||
Northrop Grumman Corp. | United States | 1,088,879 | 329,440,341 | |||||||||||||
Raytheon Co. | United States | 604,924 | 79,335,783 | |||||||||||||
Stanley Black & Decker Inc. | United States | 785,829 | 78,582,900 | |||||||||||||
Trane Technologies PLC | United States | 1,088,879 | 89,930,517 | |||||||||||||
United Technologies Corp. | United States | 1,050,607 | 99,103,758 | |||||||||||||
|
| |||||||||||||||
| 1,662,515,913 | ||||||||||||||||
|
| |||||||||||||||
Commercial & Professional Services 3.6% | ||||||||||||||||
Equifax Inc. | United States | 544,440 | 65,033,358 | |||||||||||||
IHS Markit Ltd. | United States | 3,520,639 | 211,238,340 | |||||||||||||
Republic Services Inc. | United States | 427,800 | 32,110,668 | |||||||||||||
Verisk Analytics Inc. | United States | 1,501,824 | 209,324,229 | |||||||||||||
|
| |||||||||||||||
| 517,706,595 | ||||||||||||||||
|
| |||||||||||||||
Consumer Durables & Apparel 1.1% | ||||||||||||||||
NIKE Inc., B | United States | 1,886,312 | 156,073,455 | |||||||||||||
|
| |||||||||||||||
Consumer Services 0.4% | ||||||||||||||||
Las Vegas Sands Corp. | United States | 1,337,600 | 56,807,872 | |||||||||||||
|
| |||||||||||||||
Diversified Financials 3.6% | ||||||||||||||||
American Express Co. | United States | 593,934 | 50,846,690 | |||||||||||||
aBerkshire Hathaway Inc., A | United States | 183 | 49,776,000 | |||||||||||||
BlackRock Inc. | United States | 227,796 | 100,223,406 | |||||||||||||
The Charles Schwab Corp. | United States | 3,019,527 | 101,516,498 | |||||||||||||
Intercontinental Exchange Inc. | United States | 1,410,905 | 113,930,579 | |||||||||||||
S&P Global Inc. | United States | 9,180 | 2,249,559 | |||||||||||||
T. Rowe Price Group Inc. | United States | 890,901 | 86,996,482 | |||||||||||||
|
| |||||||||||||||
| 505,539,214 | ||||||||||||||||
|
| |||||||||||||||
Food, Beverage & Tobacco 3.5% | ||||||||||||||||
Brown-Forman Corp., B | United States | 1,608,570 | 89,291,721 | |||||||||||||
Constellation Brands Inc., A | United States | 552,040 | 79,140,454 | |||||||||||||
Lamb Weston Holdings Inc. | United States | 542,780 | 30,992,738 | |||||||||||||
Mondelez International Inc., A | United States | 1,484,834 | 74,360,487 | |||||||||||||
50 | Semiannual Report | franklintempleton.com | ||
FRANKLIN CUSTODIAN FUNDS
STATEMENT OF INVESTMENTS (UNAUDITED)
Franklin Growth Fund(continued)
| Country | Shares | Value | ||||||||||||||
Common Stocks(continued) | ||||||||||||||||
Food, Beverage & Tobacco(continued) | ||||||||||||||||
aMonster Beverage Corp. | United States | 2,696,800 | $ | 151,721,968 | ||||||||||||
PepsiCo Inc. | United States | 643,429 | 77,275,823 | |||||||||||||
|
| |||||||||||||||
| 502,783,191 | ||||||||||||||||
|
| |||||||||||||||
Health Care Equipment & Services 7.6% | ||||||||||||||||
Abbott Laboratories | United States | 1,336,351 | 105,451,457 | |||||||||||||
Baxter International Inc. | United States | 395,957 | 32,147,749 | |||||||||||||
Becton, Dickinson and Co. | United States | 76,915 | 17,672,760 | |||||||||||||
Danaher Corp. | United States | 1,099,884 | 152,234,944 | |||||||||||||
aEdwards Lifesciences Corp. | United States | 395,957 | 74,685,409 | |||||||||||||
aHaemonetics Corp. | United States | 989,889 | 98,652,338 | |||||||||||||
aIntuitive Surgical Inc. | United States | 445,451 | 220,591,790 | |||||||||||||
aLaboratory Corp. of America Holdings | United States | 494,945 | 62,556,099 | |||||||||||||
Quest Diagnostics Inc. | United States | 890,901 | 71,539,350 | |||||||||||||
Stryker Corp. | United States | 406,347 | 67,652,712 | |||||||||||||
Teleflex Inc. | United States | 501,695 | 146,926,398 | |||||||||||||
UnitedHealth Group Inc. | United States | 9,100 | 2,269,358 | |||||||||||||
aVarian Medical Systems Inc. | United States | 296,967 | 30,486,632 | |||||||||||||
|
| |||||||||||||||
| 1,082,866,996 | ||||||||||||||||
|
| |||||||||||||||
Household & Personal Products 0.0%† | ||||||||||||||||
Estee Lauder Cos. Inc., A | United States | 8,820 | 1,405,379 | |||||||||||||
|
| |||||||||||||||
Materials 4.1% | ||||||||||||||||
Air Products and Chemicals Inc. | United States | 494,945 | 98,795,972 | |||||||||||||
aAxalta Coating Systems Ltd. | United States | 3,365,622 | 58,124,292 | |||||||||||||
Celanese Corp. | United States | 1,237,362 | 90,809,997 | |||||||||||||
Ecolab Inc. | United States | 617,359 | 96,203,053 | |||||||||||||
International Flavors & Fragrances Inc. | United States | 400,000 | 40,832,000 | |||||||||||||
Linde PLC | United Kingdom | 687,987 | 119,021,751 | |||||||||||||
Martin Marietta Materials Inc. | United States | 395,957 | 74,926,943 | |||||||||||||
|
| |||||||||||||||
| 578,714,008 | ||||||||||||||||
|
| |||||||||||||||
Media & Entertainment 6.2% | ||||||||||||||||
aAlphabet Inc., A | United States | 166,053 | 192,945,283 | |||||||||||||
aAlphabet Inc., C | United States | 156,831 | 182,364,655 | |||||||||||||
Cable One Inc. | United States | 79,192 | 130,192,440 | |||||||||||||
Comcast Corp., A | United States | 795,018 | 27,332,719 | |||||||||||||
aFacebook Inc., A | United States | 798,200 | 133,139,760 | |||||||||||||
aIAC/InterActiveCorp | United States | 296,967 | 53,225,395 | |||||||||||||
The Walt Disney Co. | United States | 1,724,626 | 166,598,872 | |||||||||||||
|
| |||||||||||||||
| 885,799,124 | ||||||||||||||||
|
| |||||||||||||||
Pharmaceuticals, Biotechnology & Life Sciences 13.1% | ||||||||||||||||
a10X Genomics Inc., A | United States | 54,500 | 3,396,440 | |||||||||||||
AbbVie Inc. | United States | 455,350 | 34,693,116 | |||||||||||||
Agilent Technologies Inc. | United States | 1,286,856 | 92,164,627 | |||||||||||||
Amgen Inc. | United States | 989,889 | 200,680,197 | |||||||||||||
AstraZeneca PLC, ADR | United Kingdom | 2,030,908 | 90,700,351 | |||||||||||||
aCatalent Inc. | United States | 3,365,622 | 174,844,063 | |||||||||||||
| franklintempleton.com | Semiannual Report | 51 | ||
FRANKLIN CUSTODIAN FUNDS
STATEMENT OF INVESTMENTS (UNAUDITED)
Franklin Growth Fund(continued)
| Country | Shares | Value | ||||||||||||||
Common Stocks(continued) | ||||||||||||||||
Pharmaceuticals, Biotechnology & Life Sciences(continued) | ||||||||||||||||
aDeciphera Pharmaceuticals Inc. | United States | 577,400 | $ | 23,771,558 | ||||||||||||
aElanco Animal Health Inc. | United States | 1,487,105 | 33,296,281 | |||||||||||||
Eli Lilly & Co. | United States | 1,240,175 | 172,037,076 | |||||||||||||
Gilead Sciences Inc. | United States | 643,429 | 48,102,752 | |||||||||||||
aGW Pharmaceuticals PLC, ADR | United Kingdom | 204,657 | 17,921,813 | |||||||||||||
aIllumina Inc. | United States | 524,952 | 143,374,890 | |||||||||||||
Johnson & Johnson | United States | 1,187,967 | 155,778,113 | |||||||||||||
Merck & Co. Inc. | United States | 989,889 | 76,162,060 | |||||||||||||
aMettler-Toledo International Inc. | United States | 423,824 | 292,654,710 | |||||||||||||
aNeurocrine Biosciences Inc. | United States | 494,945 | 42,837,490 | |||||||||||||
Pfizer Inc. | United States | 2,733,084 | 89,207,862 | |||||||||||||
aPTC Therapeutics Inc. | United States | 971,300 | 43,329,693 | |||||||||||||
aReata Pharmaceuticals Inc. | United States | 96,100 | 13,871,074 | |||||||||||||
aWaters Corp. | United States | 625,792 | 113,925,434 | |||||||||||||
|
| |||||||||||||||
| 1,862,749,600 | ||||||||||||||||
|
| |||||||||||||||
Real Estate 2.1% | ||||||||||||||||
Crown Castle International Corp. | United States | 1,132,500 | 163,533,000 | |||||||||||||
Digital Realty Trust Inc. | United States | 20,875 | 2,899,746 | |||||||||||||
Equinix Inc. | United States | 198,755 | 124,136,411 | |||||||||||||
SBA Communications Corp., A | United States | 10,230 | 2,761,793 | |||||||||||||
|
| |||||||||||||||
| 293,330,950 | ||||||||||||||||
|
| |||||||||||||||
Retailing 5.6% | ||||||||||||||||
aAlibaba Group Holding Ltd., ADR | China | 488,554 | 95,013,982 | |||||||||||||
aAmazon.com Inc. | United States | 348,852 | 680,163,721 | |||||||||||||
Expedia Group Inc. | United States | 346,462 | 19,495,417 | |||||||||||||
|
| |||||||||||||||
| 794,673,120 | ||||||||||||||||
|
| |||||||||||||||
Semiconductors & Semiconductor Equipment 4.0% | ||||||||||||||||
Analog Devices Inc. | United States | 26,400 | 2,366,760 | |||||||||||||
Applied Materials Inc. | United States | 45,630 | 2,090,767 | |||||||||||||
ASML Holding NV, N.Y. shs | Netherlands | 643,429 | 168,346,763 | |||||||||||||
Lam Research Corp. | United States | 29,697 | 7,127,280 | |||||||||||||
Monolithic Power Systems | United States | 445,451 | 74,595,224 | |||||||||||||
NVIDIA Corp. | United States | 509,040 | 134,182,944 | |||||||||||||
NXP Semiconductors NV | Netherlands | 558,700 | 46,332,991 | |||||||||||||
Texas Instruments Inc. | United States | 1,385,845 | 138,487,491 | |||||||||||||
|
| |||||||||||||||
| 573,530,220 | ||||||||||||||||
|
| |||||||||||||||
Software & Services 16.9% | ||||||||||||||||
aAdobe Inc. | United States | 150,000 | 47,736,000 | |||||||||||||
aAdyen NV | Netherlands | 59,955 | 51,207,036 | |||||||||||||
aAtlassian Corp. PLC | United States | 122,600 | 16,828,076 | |||||||||||||
aAutodesk Inc. | United States | 853,512 | 133,233,223 | |||||||||||||
Automatic Data Processing Inc. | United States | 692,923 | 94,708,716 | |||||||||||||
a,bBill.Com Holdings Inc. | United States | 573,000 | 19,596,600 | |||||||||||||
Intuit Inc. | United States | 989,889 | 227,674,470 | |||||||||||||
Mastercard Inc., A | United States | 1,397,305 | 337,532,996 | |||||||||||||
Microsoft Corp. | United States | 3,395,452 | 535,496,735 | |||||||||||||
52 | Semiannual Report | franklintempleton.com | ||
FRANKLIN CUSTODIAN FUNDS
STATEMENT OF INVESTMENTS (UNAUDITED)
Franklin Growth Fund(continued)
| Country | Shares | Value | ||||||||||||||
Common Stocks(continued) | ||||||||||||||||
Software & Services(continued) | ||||||||||||||||
aPayPal Holdings Inc. | United States | 518,700 | $ | 49,660,338 | ||||||||||||
aPTC Inc. | United States | 1,192,028 | 72,964,034 | |||||||||||||
asalesforce.com Inc. | United States | 558,120 | 80,358,118 | |||||||||||||
aServiceNow Inc. | United States | 999,769 | 286,513,800 | |||||||||||||
aSynopsys Inc. | United States | 446,900 | 57,556,251 | |||||||||||||
aTwilio Inc., A | United States | 397,509 | 35,573,080 | |||||||||||||
aTyler Technologies Inc. | United States | 179,452 | 53,218,285 | |||||||||||||
Visa Inc., A | United States | 1,385,845 | 223,287,346 | |||||||||||||
aWorkday Inc., A | United States | 649,628 | 84,594,558 | |||||||||||||
|
| |||||||||||||||
| 2,407,739,662 | ||||||||||||||||
|
| |||||||||||||||
Technology Hardware & Equipment 7.5% | ||||||||||||||||
Amphenol Corp., A | United States | 1,290,535 | 94,054,191 | |||||||||||||
Apple Inc. | United States | 2,867,065 | 729,065,959 | |||||||||||||
Cisco Systems Inc. | United States | 1,448,123 | 56,925,715 | |||||||||||||
Cognex Corp. | United States | 413,136 | 17,442,602 | |||||||||||||
aKeysight Technologies Inc. | United States | 643,429 | 53,842,138 | |||||||||||||
TE Connectivity Ltd. | United States | 1,850,000 | 116,513,000 | |||||||||||||
|
| |||||||||||||||
| 1,067,843,605 | ||||||||||||||||
|
| |||||||||||||||
Transportation 4.5% | ||||||||||||||||
Canadian National Railway Co. | Canada | 989,889 | 76,845,083 | |||||||||||||
Canadian Pacific Railway Ltd. | Canada | 494,945 | 108,684,973 | |||||||||||||
J.B. Hunt Transport Services Inc. | United States | 494,945 | 45,648,777 | |||||||||||||
Kansas City Southern | United States | 742,417 | 94,420,594 | |||||||||||||
aUber Technologies Inc. | United States | 1,008,700 | 28,162,904 | |||||||||||||
Union Pacific Corp. | United States | 2,009,475 | 283,416,354 | |||||||||||||
|
| |||||||||||||||
| 637,178,685 | ||||||||||||||||
|
| |||||||||||||||
Utilities 1.5% | ||||||||||||||||
American Water Works Co. Inc. | United States | 692,923 | 82,845,874 | |||||||||||||
NextEra Energy Inc. | United States | 508,055 | 122,248,194 | |||||||||||||
|
| |||||||||||||||
| 205,094,068 | ||||||||||||||||
|
| |||||||||||||||
Total Common Stocks (Cost $5,383,939,962) | 13,793,083,363 | |||||||||||||||
|
| |||||||||||||||
Short Term Investments 2.8% | ||||||||||||||||
Money Market Funds (Cost $371,382,516) 2.6% | ||||||||||||||||
c,dInstitutional Fiduciary Trust Money Market Portfolio, 0.32% | United States | 371,382,516 | 371,382,516 | |||||||||||||
|
| |||||||||||||||
Investments from Cash Collateral Received for Loaned Securities 0.2% | ||||||||||||||||
Money Market Funds (Cost $11,384,000) 0.1% | ||||||||||||||||
c,dInstitutional Fiduciary Trust Money Market Portfolio, 0.32% | United States | 11,384,000 | 11,384,000 | |||||||||||||
|
| |||||||||||||||
| franklintempleton.com | Semiannual Report | 53 | ||
FRANKLIN CUSTODIAN FUNDS
STATEMENT OF INVESTMENTS (UNAUDITED)
Franklin Growth Fund(continued)
| Country | Principal Amount | Value | ||||||||||
Short Term Investments(continued) | ||||||||||||
Investments from Cash Collateral Received for Loaned Securities(continued) | ||||||||||||
Repurchase Agreements (Cost $8,421,871) 0.1% | ||||||||||||
eJoint Repurchase Agreement, 0.01%, 4/01/20 (Maturity Value $8,421,873) | ||||||||||||
J.P. Morgan Securities LLC | ||||||||||||
Collateralized byfU.S. Treasury Bills, 4/21/20 – 3/25/21; U.S. Treasury Notes, 1.125% – 2.75%, 4/30/20 – 9/09/49 (valued at $8,590,309) | United States | $ | 8,421,871 | $ | 8,421,871 | |||||||
|
| |||||||||||
Total Investments from Cash Collateral Received for Loaned Securities |
| 19,805,871 | ||||||||||
|
| |||||||||||
Total Investments (Cost $5,775,128,349) 99.8% | 14,184,271,750 | |||||||||||
Other Assets, less Liabilities 0.2% | 31,325,175 | |||||||||||
|
| |||||||||||
Net Assets 100.0% | $ | 14,215,596,925 | ||||||||||
|
| |||||||||||
See Abbreviations on page 127.
†Rounds to less than 0.1% of net assets.
aNon-income producing.
bA portion or all of the security is on loan at March 31, 2020. See Note 1(i).
cSee Note 3(f) regarding investments in affiliated management investment companies.
dThe rate shown is the annualizedseven-day effective yield at period end.
eSee Note 1 (c) regarding joint repurchase agreement.
fThe security was issued on a discount basis with no stated coupon rate.
54 | Semiannual Report | The accompanying notes are an integral part of these financial statements. | franklintempleton.com | ||
FRANKLIN CUSTODIAN FUNDS
Financial Highlights
Franklin Income Fund
| Six Months Ended March 31, 2020 | Year Ended September 30, | |||||||||||
| (unaudited) | 2019 | 2018a | ||||||||||
| ||||||||||||
Class A | ||||||||||||
Per share operating performance (for a share outstanding throughout the period) | ||||||||||||
Net asset value, beginning of period | $ 2.30 | $ 2.32 | $ 2.31 | |||||||||
|
| |||||||||||
Income from investment operationsb: | ||||||||||||
Net investment income (loss)c | 0.04 | 0.08 | (0.04) | |||||||||
Net realized and unrealized gains (losses) | (0.35 | ) | 0.02 | 0.05 | ||||||||
|
| |||||||||||
Total from investment operations | (0.31 | ) | 0.10 | 0.01 | ||||||||
|
| |||||||||||
Less distributions from: | ||||||||||||
Net investment income | (0.06 | ) | (0.12 | ) | — | |||||||
|
| |||||||||||
Net asset value, end of period | $ 1.93 | $ 2.30 | $ 2.32 | |||||||||
|
| |||||||||||
Total returnd | (13.46 | )% | 4.40% | 0.43% | ||||||||
Ratios to average net assetse | ||||||||||||
Expenses before waiver and payments by affiliates | 0.71% | 0.72% | 0.71% | |||||||||
Expenses net of waiver and payments by affiliatesf | 0.70% | 0.72% | g | 0.71%g | ||||||||
Net investment income | 3.83% | 3.92% | 3.89% | |||||||||
Supplemental data | ||||||||||||
Net assets, end of period (000’s) | $7,486,376 | $7,427,468 | $107,057 | |||||||||
Portfolio turnover rate | 37.48% | 43.63% | 49.95% | |||||||||
a For the period September 10, 2018 (effective date) to September 30, 2018.
b The amount shown for a share outstanding throughout the period may not correlate with the Statement of Operations for the period due to the timing of sales and repurchases of the Fund’s shares in relation to income earned and/or fluctuating fair value of the investments of the Fund.
c Based on average daily shares outstanding.
d Total return does not reflect sales commissions or contingent deferred sales charges, if applicable, and is not annualized for periods less than one year.
e Ratios are annualized for periods less than one year, except fornon-recurring expenses, if any.
f Benefit of expense reduction rounds to less than 0.01%.
g Benefit of waiver and payments by affiliates rounds to less than 0.01%.
| franklintempleton.com | The accompanying notes are an integral part of these financial statements. | Semiannual Report | 55 | ||
FRANKLIN CUSTODIAN FUNDS
FINANCIAL HIGHLIGHTS
Franklin Income Fund(continued)
| Six Months Ended March 31, 2020 | Year Ended September 30, | |||||||||||||||||||||||
| (unaudited) | 2019 | 2018 | 2017 | 2016 | 2015 | |||||||||||||||||||
| �� | |||||||||||||||||||||||
Class A1 | ||||||||||||||||||||||||
Per share operating performance (for a share outstanding throughout the period) | ||||||||||||||||||||||||
Net asset value, beginning of period | $ 2.30 | $ 2.32 | $ 2.39 | $ 2.25 | $ 2.10 | $ 2.48 | ||||||||||||||||||
|
| |||||||||||||||||||||||
Income from investment operationsa: | ||||||||||||||||||||||||
Net investment incomeb | 0.04 | 0.09 | 0.09 | 0.10 | 0.10 | 0.10 | ||||||||||||||||||
Net realized and unrealized gains (losses) | (0.34 | ) | 0.01 | (0.04 | ) | 0.16 | 0.17 | (0.36) | ||||||||||||||||
|
| |||||||||||||||||||||||
Total from investment operations | (0.30 | ) | 0.10 | 0.05 | 0.26 | 0.27 | (0.26) | |||||||||||||||||
|
| |||||||||||||||||||||||
Less distributions from: | ||||||||||||||||||||||||
Net investment income | (0.06 | ) | (0.12 | ) | (0.12 | ) | (0.12 | ) | (0.12 | ) | (0.12) | |||||||||||||
|
| |||||||||||||||||||||||
Net asset value, end of period | $ 1.94 | $ 2.30 | $ 2.32 | $ 2.39 | $ 2.25 | $ 2.10 | ||||||||||||||||||
|
| |||||||||||||||||||||||
Total returnc | (13.42)% | 4.50% | 2.18% | 11.86% | 13.31% | (10.93)% | ||||||||||||||||||
Ratios to average net assetsd | ||||||||||||||||||||||||
Expenses before waiver and payments by affiliates | 0.61% | 0.62% | 0.61% | 0.62% | 0.61% | 0.61% | ||||||||||||||||||
Expenses net of waiver and payments by affiliatese | 0.60% | 0.62% | f | 0.61% | f | 0.61% | 0.61% | f | 0.61%f | |||||||||||||||
Net investment income | 3.93% | 4.02% | 3.99% | 4.22% | 4.57% | 4.43% | ||||||||||||||||||
Supplemental data | ||||||||||||||||||||||||
Net assets, end of period (000’s) | $31,730,369 | $39,625,649 | $42,929,573 | $46,505,632 | $45,515,127 | $44,886,127 | ||||||||||||||||||
Portfolio turnover rate | 37.48% | 43.63% | 49.95% | 34.12% | 61.26% | 44.81% | ||||||||||||||||||
a The amount shown for a share outstanding throughout the period may not correlate with the Statement of Operations for the period due to the timing ofsales and repurchases of the Fund’s shares in relation to income earned and/or fluctuating fair value of the investments of the Fund.
b Based on average daily shares outstanding.
c Total return does not reflect sales commissions or contingent deferred sales charges, if applicable, and is not annualized for periods less than one year.
d Ratios are annualized for periods less than one year, except fornon-recurring expenses, if any.
e Benefit of expense reduction rounds to less than 0.01%.
f Benefit of waiver and payments by affiliates rounds to less than 0.01%.
56 | Semiannual Report | The accompanying notes are an integral part of these financial statements. | franklintempleton.com | ||
FRANKLIN CUSTODIAN FUNDS
FINANCIAL HIGHLIGHTS
Franklin Income Fund(continued)
| Six Months Ended March 31, 2020 | Year Ended September 30, | |||||||||||||||||||||||
| (unaudited) | 2019 | 2018 | 2017 | 2016 | 2015 | |||||||||||||||||||
| ||||||||||||||||||||||||
Class C | ||||||||||||||||||||||||
Per share operating performance (for a share outstanding throughout the period) | ||||||||||||||||||||||||
Net asset value, beginning of period | $ 2.34 | $ 2.35 | $ 2.42 | $ 2.27 | $ 2.13 | $ 2.50 | ||||||||||||||||||
|
| |||||||||||||||||||||||
Income from investment operationsa: | ||||||||||||||||||||||||
Net investment incomeb | 0.04 | 0.08 | 0.08 | 0.09 | 0.09 | 0.09 | ||||||||||||||||||
Net realized and unrealized gains (losses) | (0.36 | ) | 0.02 | (0.04 | ) | 0.17 | 0.16 | (0.35) | ||||||||||||||||
|
| |||||||||||||||||||||||
Total from investment operations | (0.32 | ) | 0.10 | 0.04 | 0.26 | 0.25 | (0.26) | |||||||||||||||||
|
| |||||||||||||||||||||||
Less distributions from: | ||||||||||||||||||||||||
Net investment income | (0.05 | ) | (0.11 | ) | (0.11 | ) | (0.11 | ) | (0.11 | ) | (0.11) | |||||||||||||
|
| |||||||||||||||||||||||
Net asset value, end of period | $ 1.97 | $ 2.34 | $ 2.35 | $ 2.42 | $ 2.27 | $ 2.13 | ||||||||||||||||||
|
| |||||||||||||||||||||||
Total returnc | (13.84)% | 4.35% | 1.61% | 11.63% | 12.07% | (10.89)% | ||||||||||||||||||
Ratios to average net assetsd | ||||||||||||||||||||||||
Expenses before waiver and payments by affiliates | 1.11% | 1.12% | 1.11% | 1.12% | 1.11% | 1.11% | ||||||||||||||||||
Expenses net of waiver and payments by affiliatese | 1.10% | 1.12% | f | 1.11% | f | 1.11% | 1.11% | f | 1.11%f | |||||||||||||||
Net investment income | 3.43% | 3.52% | 3.49% | 3.72% | 4.07% | 3.93% | ||||||||||||||||||
Supplemental data | ||||||||||||||||||||||||
Net assets, end of period (000’s) | $10,488,849 | $13,488,627 | $19,895,441 | $23,036,875 | $23,841,466 | $24,091,638 | ||||||||||||||||||
Portfolio turnover rate | 37.48% | 43.63% | 49.95% | 34.12% | 61.26% | 44.81% | ||||||||||||||||||
a The amount shown for a share outstanding throughout the period may not correlate with the Statement of Operations for the period due to the timing of sales and repurchases of the Fund’s shares in relation to income earned and/or fluctuating fair value of the investments of the Fund.
b Based on average daily shares outstanding.
c Total return does not reflect sales commissions or contingent deferred sales charges, if applicable, and is not annualized for periods less than one year.
d Ratios are annualized for periods less than one year, except fornon-recurring expenses, if any.
e Benefit of expense reduction rounds to less than 0.01%.
f Benefit of waiver and payments by affiliates rounds to less than 0.01%.
| franklintempleton.com | The accompanying notes are an integral part of these financial statements. | Semiannual Report | 57 | ||
FRANKLIN CUSTODIAN FUNDS
FINANCIAL HIGHLIGHTS
Franklin Income Fund(continued)
| Six Months Ended March 31, 2020 | Year Ended September 30, | |||||||||||||||||||||||
| (unaudited) | 2019 | 2018 | 2017 | 2016 | 2015 | |||||||||||||||||||
| ||||||||||||||||||||||||
Class R | ||||||||||||||||||||||||
Per share operating performance (for a share outstanding throughout the period) | ||||||||||||||||||||||||
Net asset value, beginning of period | $ 2.26 | $ 2.28 | $ 2.35 | $ 2.21 | $ 2.07 | $ 2.44 | ||||||||||||||||||
|
| |||||||||||||||||||||||
Income from investment operationsa: | ||||||||||||||||||||||||
Net investment incomeb | 0.04 | 0.08 | 0.08 | 0.09 | 0.09 | 0.10 | ||||||||||||||||||
Net realized and unrealized gains (losses) | (0.34 | ) | 0.01 | (0.04 | ) | 0.16 | 0.16 | (0.36) | ||||||||||||||||
|
| |||||||||||||||||||||||
Total from investment operations | (0.30 | ) | 0.09 | 0.04 | 0.25 | 0.25 | (0.26) | |||||||||||||||||
|
| |||||||||||||||||||||||
Less distributions from: | ||||||||||||||||||||||||
Net investment income | (0.06 | ) | (0.11 | ) | (0.11 | ) | (0.11 | ) | (0.11 | ) | (0.11) | |||||||||||||
|
| |||||||||||||||||||||||
Net asset value, end of period | $ 1.90 | $ 2.26 | $ 2.28 | $ 2.35 | $ 2.21 | $ 2.07 | ||||||||||||||||||
|
| |||||||||||||||||||||||
Total returnc | (13.82)% | 4.20% | 1.86% | 11.67% | 12.62% | (10.99)% | ||||||||||||||||||
Ratios to average net assetsd | ||||||||||||||||||||||||
Expenses before waiver and payments by affiliates | 0.96% | 0.97% | 0.96% | 0.97% | 0.96% | 0.96% | ||||||||||||||||||
Expenses net of waiver and payments by affiliatese | 0.95% | 0.97% | f | 0.96% | f | 0.96% | 0.96% | f | 0.96%f | |||||||||||||||
Net investment income | 3.58% | 3.67% | 3.64% | 3.87% | 4.22% | 4.08% | ||||||||||||||||||
Supplemental data | ||||||||||||||||||||||||
Net assets, end of period (000’s) | $214,502 | $265,531 | $296,098 | $361,603 | $396,107 | $416,653 | ||||||||||||||||||
Portfolio turnover rate | 37.48% | 43.63% | 49.95% | 34.12% | 61.26% | 44.81% | ||||||||||||||||||
a The amount shown for a share outstanding throughout the period may not correlate with the Statement of Operations for the period due to the timing of sales and repurchases of the Fund’s shares in relation to income earned and/or fluctuating fair value of the investments of the Fund.
b Based on average daily shares outstanding.
c Total return is not annualized for periods less than one year.
d Ratios are annualized for periods less than one year, except fornon-recurring expenses, if any.
e Benefit of expense reduction rounds to less than 0.01%.
f Benefit of waiver and payments by affiliates rounds to less than 0.01%.
58 | Semiannual Report | The accompanying notes are an integral part of these financial statements. | franklintempleton.com | ||
FRANKLIN CUSTODIAN FUNDS
FINANCIAL HIGHLIGHTS
Franklin Income Fund(continued)
| Six Months Ended March 31, 2020 | Year Ended September 30, | |||||||||||||||||||||||
| (unaudited) | 2019 | 2018 | 2017 | 2016 | 2015 | |||||||||||||||||||
| ||||||||||||||||||||||||
Class R6 | ||||||||||||||||||||||||
Per share operating performance (for a share outstanding throughout the period) | ||||||||||||||||||||||||
Net asset value, beginning of period | $ 2.29 | $ 2.30 | $ 2.37 | $ 2.23 | $ 2.09 | $ 2.46 | ||||||||||||||||||
|
| |||||||||||||||||||||||
Income from investment operationsa: | ||||||||||||||||||||||||
Net investment incomeb | 0.05 | 0.10 | 0.10 | 0.11 | 0.10 | 0.11 | ||||||||||||||||||
Net realized and unrealized gains (losses) | (0.36 | ) | 0.01 | (0.05 | ) | 0.15 | 0.16 | (0.35) | ||||||||||||||||
|
| |||||||||||||||||||||||
Total from investment operations | (0.31 | ) | 0.11 | 0.05 | 0.26 | 0.26 | (0.24) | |||||||||||||||||
|
| |||||||||||||||||||||||
Less distributions from: | ||||||||||||||||||||||||
Net investment income | (0.06 | ) | (0.12 | ) | (0.12 | ) | (0.12 | ) | (0.12 | ) | (0.13) | |||||||||||||
|
| |||||||||||||||||||||||
Net asset value, end of period | $ 1.92 | $ 2.29 | $ 2.30 | $ 2.37 | $ 2.23 | $ 2.09 | ||||||||||||||||||
|
| |||||||||||||||||||||||
Total returnc | (13.40)% | 5.17% | 2.40% | 12.15% | 13.15% | (10.39)% | ||||||||||||||||||
Ratios to average net assetsd | ||||||||||||||||||||||||
Expenses before waiver and payments by affiliates | 0.40% | 0.41% | 0.39% | 0.39% | 0.38% | 0.38% | ||||||||||||||||||
Expenses net of waiver and payments by affiliatese | 0.38% | 0.40% | 0.39% | f | 0.38% | 0.38% | f | 0.38%f | ||||||||||||||||
Net investment income | 4.15% | 4.24% | 4.21% | 4.45% | 4.80% | 4.66% | ||||||||||||||||||
Supplemental data | ||||||||||||||||||||||||
Net assets, end of period (000’s) | $1,569,104 | $1,902,027 | $2,062,334 | $1,815,977 | $1,737,577 | $1,744,718 | ||||||||||||||||||
Portfolio turnover rate | 37.48% | 43.63% | 49.95% | 34.12% | 61.26% | 44.81% | ||||||||||||||||||
a The amount shown for a share outstanding throughout the period may not correlate with the Statement of Operations for the period due to the timing of sales and repurchases of the Fund’s shares in relation to income earned and/or fluctuating fair value of the investments of the Fund.
b Based on average daily shares outstanding.
c Total return is not annualized for periods less than one year.
d Ratios are annualized for periods less than one year, except fornon-recurring expenses, if any.
e Benefit of expense reduction rounds to less than 0.01%.
f Benefit of waiver and payments by affiliates rounds to less than 0.01%.
| franklintempleton.com | The accompanying notes are an integral part of these financial statements. | Semiannual Report | 59 | ||
FRANKLIN CUSTODIAN FUNDS
FINANCIAL HIGHLIGHTS
Franklin Income Fund(continued)
| Six Months Ended March 31, 2020 | Year Ended September 30, | |||||||||||||||||||||||
| (unaudited) | 2019 | 2018 | 2017 | 2016 | 2015 | |||||||||||||||||||
| ||||||||||||||||||||||||
Advisor Class | ||||||||||||||||||||||||
Per share operating performance (for a share outstanding throughout the period) | ||||||||||||||||||||||||
Net asset value, beginning of period | $ 2.28 | $ 2.30 | $ 2.37 | $ 2.23 | $ 2.09 | $ 2.46 | ||||||||||||||||||
|
| |||||||||||||||||||||||
Income from investment operationsa: | ||||||||||||||||||||||||
Net investment incomeb | 0.05 | 0.09 | 0.10 | 0.10 | 0.10 | 0.11 | ||||||||||||||||||
Net realized and unrealized gains (losses) | (0.35 | ) | 0.01 | (0.05 | ) | 0.16 | 0.16 | (0.36) | ||||||||||||||||
|
| |||||||||||||||||||||||
Total from investment operations | (0.30 | ) | 0.10 | 0.05 | 0.26 | 0.26 | (0.25) | |||||||||||||||||
|
| |||||||||||||||||||||||
Less distributions from: | ||||||||||||||||||||||||
Net investment income | (0.06 | ) | (0.12 | ) | (0.12 | ) | (0.12 | ) | (0.12 | ) | (0.12) | |||||||||||||
|
| |||||||||||||||||||||||
Net asset value, end of period | $ 1.92 | $ 2.28 | $ 2.30 | $ 2.37 | $ 2.23 | $ 2.09 | ||||||||||||||||||
|
| |||||||||||||||||||||||
Total returnc | (13.49)% | 4.65% | 2.34% | 12.09% | 13.06% | (10.46)% | ||||||||||||||||||
Ratios to average net assetsd | ||||||||||||||||||||||||
Expenses before waiver and payments by affiliates | 0.46% | 0.47% | 0.46% | 0.47% | 0.46% | 0.46% | ||||||||||||||||||
Expenses net of waiver and payments by affiliatese | 0.45% | 0.47% | f | 0.46% | f | 0.46% | 0.46% | f | 0.46% | f | ||||||||||||||
Net investment income | 4.08% | 4.17% | 4.14% | 4.37% | 4.72% | 4.58% | ||||||||||||||||||
Supplemental data | ||||||||||||||||||||||||
Net assets, end of period (000’s) | $9,539,686 | $11,816,599 | $11,328,761 | $11,671,173 | $8,143,479 | $7,754,475 | ||||||||||||||||||
Portfolio turnover rate | 37.48% | 43.63% | 49.95% | 34.12% | 61.26% | 44.81% | ||||||||||||||||||
a The amount shown for a share outstanding throughout the period may not correlate with the Statement of Operations for the period due to the timing of sales and repurchases of the Fund’s shares in relation to income earned and/or fluctuating fair value of the investments of the Fund.
b Based on average daily shares outstanding.
c Total return is not annualized for periods less than one year.
d Ratios are annualized for periods less than one year, except fornon-recurring expenses, if any.
e Benefit of expense reduction rounds to less than 0.01%.
f Benefit of waiver and payments by affiliates rounds to less than 0.01%.
60 | Semiannual Report | The accompanying notes are an integral part of these financial statements. | franklintempleton.com | ||
FRANKLIN CUSTODIAN FUNDS
Statement of Investments, March 31, 2020 (unaudited)
Franklin Income Fund
| Country | Shares | Value | ||||||||
Common Stocks 29.3% | ||||||||||
Communication Services 2.9% | ||||||||||
a,bAlphabet Inc., A | United States | 250,000 | $ | 290,487,500 | ||||||
AT&T Inc. | United States | 2,000,000 | 58,300,000 | |||||||
BCE Inc. | Canada | 5,000,000 | 205,079,929 | |||||||
Comcast Corp., A | United States | 10,000,000 | 343,800,000 | |||||||
Deutsche Telekom AG | Germany | 5,000,000 | 64,559,583 | |||||||
Verizon Communications Inc. | United States | 12,000,000 | 644,760,000 | |||||||
Vodafone Group PLC | United Kingdom | 50,000,000 | 69,133,238 | |||||||
The Walt Disney Co. | United States | 955,000 | 92,253,000 | |||||||
|
| |||||||||
| 1,768,373,250 | ||||||||||
|
| |||||||||
Consumer Discretionary 0.5% | ||||||||||
bMcDonald’s Corp. | United States | 600,000 | 99,210,000 | |||||||
Target Corp. | United States | 2,000,000 | 185,940,000 | |||||||
|
| |||||||||
| 285,150,000 | ||||||||||
|
| |||||||||
Consumer Staples 2.8% | ||||||||||
The Coca-Cola Co. | United States | 7,000,000 | 309,750,000 | |||||||
bPepsiCo Inc. | United States | 4,500,000 | 540,450,000 | |||||||
bPhilip Morris International Inc. | United States | 4,000,000 | 291,840,000 | |||||||
bThe Procter & Gamble Co. | United States | 4,000,000 | 440,000,000 | |||||||
Unilever PLC | United Kingdom | 3,000,000 | 151,205,290 | |||||||
|
| |||||||||
| 1,733,245,290 | ||||||||||
|
| |||||||||
Energy 3.8% | ||||||||||
BP PLC, ADR. | United Kingdom | 9,000,000 | 219,510,000 | |||||||
Chevron Corp. | United States | 7,500,000 | 543,450,000 | |||||||
Exxon Mobil Corp. | United States | 13,500,000 | 512,595,000 | |||||||
Halliburton Co. | United States | 6,000,000 | 41,100,000 | |||||||
Royal Dutch Shell PLC, A, ADR | United Kingdom | 15,000,000 | 523,350,000 | |||||||
Schlumberger Ltd. | United States | 12,500,000 | 168,625,000 | |||||||
a,cWeatherford International PLC | United States | 15,000,000 | 89,250,000 | |||||||
The Williams Cos. Inc. | United States | 14,299,300 | 202,335,095 | |||||||
|
| |||||||||
| 2,300,215,095 | ||||||||||
|
| |||||||||
Financials 4.2% | ||||||||||
Bank of America Corp. | United States | 6,000,000 | 127,380,000 | |||||||
Barclays PLC | United Kingdom | 200,000,000 | 227,158,334 | |||||||
Citigroup Inc. | United States | 1,000,000 | 42,120,000 | |||||||
JPMorgan Chase & Co. | United States | 7,000,000 | 630,210,000 | |||||||
MetLife Inc. | United States | 9,000,000 | 275,130,000 | |||||||
Morgan Stanley | United States | 5,960,000 | 202,640,000 | |||||||
Owl Rock Capital Corp. | United States | 900,000 | 10,386,000 | |||||||
Truist Financial Corp. | United States | 7,000,000 | 215,880,000 | |||||||
U.S. Bancorp | United States | 6,000,000 | 206,700,000 | |||||||
Wells Fargo & Co. | United States | 22,197,153 | 637,058,291 | |||||||
|
| |||||||||
| 2,574,662,625 | ||||||||||
|
| |||||||||
| franklintempleton.com | Semiannual Report | 61 | ||
FRANKLIN CUSTODIAN FUNDS
STATEMENT OF INVESTMENTS (UNAUDITED)
Franklin Income Fund(continued)
| Country | Shares | Value | ||||||||||
Common Stocks(continued) | ||||||||||||
Health Care 4.3% | ||||||||||||
AstraZeneca PLC | United Kingdom | 7,000,000 | $ | 623,340,685 | ||||||||
Bayer AG | Germany | 3,500,000 | 200,490,105 | |||||||||
Bristol-Myers Squibb Co. | United States | 4,350,000 | 242,469,000 | |||||||||
CVS Health Corp. | United States | 5,000,000 | 296,650,000 | |||||||||
bJohnson & Johnson | United States | 4,000,000 | 524,520,000 | |||||||||
Merck & Co. Inc. | United States | 3,000,000 | 230,820,000 | |||||||||
Pfizer Inc. | United States | 15,000,000 | 489,600,000 | |||||||||
|
| |||||||||||
| 2,607,889,790 | ||||||||||||
|
| |||||||||||
Industrials 2.8% | ||||||||||||
General Dynamics Corp. | United States | 1,000,000 | 132,310,000 | |||||||||
Honeywell International Inc. | United States | 2,500,000 | 334,475,000 | |||||||||
Raytheon Co. | United States | 2,000,000 | 262,300,000 | |||||||||
Union Pacific Corp. | United States | 3,200,000 | 451,328,000 | |||||||||
United Parcel Service Inc., B | United States | 2,500,000 | 233,550,000 | |||||||||
United Technologies Corp. | United States | 3,000,000 | 282,990,000 | |||||||||
|
| |||||||||||
| 1,696,953,000 | ||||||||||||
|
| |||||||||||
Information Technology 1.3% | ||||||||||||
Analog Devices Inc. | United States | 620,000 | 55,583,000 | |||||||||
Broadcom Inc. | United States | 250,000 | 59,275,000 | |||||||||
Cisco Systems Inc. | United States | 5,000,000 | 196,550,000 | |||||||||
bIntel Corp. | United States | 2,700,000 | 146,124,000 | |||||||||
NortonLifeLock Inc. | United States | 5,000,000 | 93,550,000 | |||||||||
Texas Instruments Inc. | United States | 2,764,000 | 276,206,520 | |||||||||
|
| |||||||||||
| 827,288,520 | ||||||||||||
|
| |||||||||||
Materials 1.7% | ||||||||||||
Air Products and Chemicals Inc. | United States | 750,000 | 149,707,500 | |||||||||
BASF SE | Germany | 10,000,000 | 467,292,310 | |||||||||
Rio Tinto PLC, ADR | Australia | 9,650,000 | 439,654,000 | |||||||||
|
| |||||||||||
| 1,056,653,810 | ||||||||||||
|
| |||||||||||
Real Estate 0.4% | ||||||||||||
Host Hotels & Resorts Inc. | United States | 20,000,000 | 220,800,000 | |||||||||
|
| |||||||||||
Utilities 4.6% | ||||||||||||
Dominion Energy Inc. | United States | 14,000,000 | 1,010,660,000 | |||||||||
DTE Energy Co. | United States | 1,000,000 | 94,970,000 | |||||||||
Duke Energy Corp. | United States | 6,000,000 | 485,280,000 | |||||||||
Sempra Energy | United States | 1,132,578 | 127,969,988 | |||||||||
The Southern Co. | United States | 19,860,688 | 1,075,257,648 | |||||||||
|
| |||||||||||
| 2,794,137,636 | ||||||||||||
|
| |||||||||||
Total Common Stocks (Cost $18,829,251,028) | 17,865,369,016 | |||||||||||
|
| |||||||||||
dEquity-Linked Securities 18.5% | ||||||||||||
Communication Services 1.2% | ||||||||||||
eCitigroup Global Markets Inc. into Alphabet Inc., 7.50%, 144A | United States | 259,000 | 314,829,161 | |||||||||
eGoldman Sachs International into Facebook Inc., 9.00%, 144A | United States | 2,590,000 | 425,053,124 | |||||||||
|
| |||||||||||
| 739,882,285 | ||||||||||||
|
| |||||||||||
62 | Semiannual Report | franklintempleton.com | ||
FRANKLIN CUSTODIAN FUNDS
STATEMENT OF INVESTMENTS (UNAUDITED)
Franklin Income Fund(continued)
| Country | Shares | Value | ||||||||||||
dEquity-Linked Securities(continued) | ||||||||||||||
Consumer Discretionary 3.1% | ||||||||||||||
eBNP Paribas Issuance BV into Home Depot Inc., 7.00%, 144A | United States | �� | 1,680,000 | $ | 323,227,420 | |||||||||
eCitigroup Global Markets Holdings Inc. into Amazon.com Inc., 8.00%, 144A | United States | 169,100 | 307,046,291 | |||||||||||
eGoldman Sachs International into Amazon.com Inc., 7.50%, 144A | United States | 190,000 | 354,606,641 | |||||||||||
eMerrill Lynch International & Co. CV into Target Corp., 8.00%, 144A | United States | 3,075,000 | 269,435,676 | |||||||||||
eSociete Generale SA into Ford Motor Co., 12.00%, 144A | United States | 37,800,000 | 193,497,520 | |||||||||||
eWells Fargo Bank NA into General Motors Co., 8.50%, 144A | United States | 6,512,000 | 148,172,680 | |||||||||||
eWells Fargo Bank NA into General Motors Co., 9.00%, 144A | United States | 13,580,000 | 292,836,404 | |||||||||||
|
| |||||||||||||
| 1,888,822,632 | ||||||||||||||
|
| |||||||||||||
Energy 0.6% | ||||||||||||||
eBarclays Bank PLC into Schlumberger Limited, 9.00%, 144A | United States | 7,150,000 | 120,778,465 | |||||||||||
eJPMorgan Chase Bank NA into Baker Hughes Co., 8.50%, A, 144A | United States | 11,360,000 | 125,660,571 | |||||||||||
eWells Fargo Bank National Assn. into Halliburton Co., 10.00%, 144A | United States | 12,700,000 | 121,863,358 | |||||||||||
|
| |||||||||||||
| 368,302,394 | ||||||||||||||
|
| |||||||||||||
Financials 2.2% | ||||||||||||||
eBarclays Bank PLC into Bank of America Corp., 8.50%, 144A | United States | 9,040,000 | 202,649,780 | |||||||||||
eCredit Suisse AG London into Bank of America Corp., 7.00%, 144A | United States | 8,550,000 | 190,843,934 | |||||||||||
eCredit Suisse AG London into Wells Fargo & Co., 8.00%, 144A | United States | 5,640,000 | 172,271,262 | |||||||||||
eGoldman Sachs International into Metlife Inc., 7.50%, 144A | United States | 5,210,000 | 165,498,562 | |||||||||||
eJPMorgan Chase Bank NA into Morgan Stanley, 8.50%, 144A | United States | 5,100,000 | 181,477,691 | |||||||||||
eRoyal Bank of Canada into MetLife Inc., 7.50%, 144A | United States | 5,350,000 | 166,483,547 | |||||||||||
Wells Fargo Bank NA into CVS Health Corp., 9.50% | United States | 4,600,000 | 270,223,992 | |||||||||||
|
| |||||||||||||
| 1,349,448,768 | ||||||||||||||
|
| |||||||||||||
Health Care 3.1% | ||||||||||||||
eCitigroup Global Markets Holdings Inc. into AbbVie Inc., 10.00%, 144A | United States | 3,520,000 | 253,867,275 | |||||||||||
eCredit Suisse AG London into Bristol-Myers Squibb Co., 8.50%, 144A | United States | 5,405,000 | 275,906,635 | |||||||||||
eCredit Suisse AG London into CVS Health Corp., 8.50%, 144A | United States | 4,000,000 | 227,189,924 | |||||||||||
eGoldman Sachs International into Bristol-Myers Squibb Co., 8.00%, 144A | United States | 3,984,000 | 227,723,261 | |||||||||||
eGoldman Sachs International into Bristol-Myers Squibb Co., 8.00%, 144A | United States | 5,000,000 | 266,263,840 | |||||||||||
eMerrill Lynch International & Co. CV into Gilead Sciences Inc., 9.00%, 144A | United States | 2,540,000 | 167,815,425 | |||||||||||
eRoyal Bank of Canada into AbbVie Inc., 9.00%, 144A | United States | 2,900,000 | 227,157,972 | |||||||||||
eRoyal Bank of Canada into Merck & Co. Inc., 7.00%, 144A | United States | 3,220,000 | 260,477,501 | |||||||||||
| �� |
|
| ||||||||||||
| 1,906,401,833 | ||||||||||||||
|
| |||||||||||||
Industrials 1.1% | ||||||||||||||
eCredit Suisse AG London into Cummins Inc., 8.00%, 144A | United States | 1,700,000 | 237,471,999 | |||||||||||
eRoyal Bank of Canada into Boeing Co., 8.50%, 144A | United States | 847,000 | 138,281,983 | |||||||||||
e,fUBS AG London into Caterpillar Inc., 9.50%, 144A | United States | 1,428,600 | 162,860,400 | |||||||||||
eWells Fargo Bank National Assn. into Delta Air Lines, 10.00%, 144A | United States | 3,150,000 | 95,436,602 | |||||||||||
|
| |||||||||||||
| 634,050,984 | ||||||||||||||
|
| |||||||||||||
Information Technology 6.2% | ||||||||||||||
eBarclays Bank PLC into International Business Machines Corp., 8.00%, 144A | United States | 2,000,000 | 220,979,558 | |||||||||||
eCitigroup Global Markets Holdings Inc. into Apple Inc., 8.00%, 144A | United States | 1,180,000 | 302,854,888 | |||||||||||
eCitigroup Global Markets Holdings Inc. into Microsoft Corp., 8.00%, 144A | United States | 2,200,000 | 340,554,439 | |||||||||||
e,fCredit Suisse AG London into Broadcom Inc., 10.00%, 144A | United States | 1,275,000 | 290,609,314 | |||||||||||
eJPMorgan Chase Bank NA into Cisco, 7.50%, 144A | United States | 6,050,000 | 246,028,502 | |||||||||||
eJPMorgan Chase Bank NA into NVIDIA Corp., 10.00%, 144A | United States | 1,786,000 | 338,951,590 | |||||||||||
| franklintempleton.com | Semiannual Report | 63 | ||
FRANKLIN CUSTODIAN FUNDS
STATEMENT OF INVESTMENTS (UNAUDITED)
Franklin Income Fund(continued)
| Country | Shares | Value | ||||||||||
d Equity-Linked Securities(continued) | ||||||||||||
Information Technology(continued) | ||||||||||||
eJPMorgan Chase Bank NA into Texas Instruments Inc., 9.00%, 144A | United States | 2,236,000 | $ | 228,277,571 | ||||||||
eMerrill Lynch International & Co. CV into Apple Inc., 7.50%, 144A | United States | 1,475,000 | 316,322,883 | |||||||||
eMerrill Lynch International & Co. CV into Intel Corp., 8.00%, 144A | United States | 4,583,000 | 260,379,052 | |||||||||
eMorgan Stanley Finance LLC into Intel Corp., 8.50%, 144A | United States | 7,300,000 | 370,461,335 | |||||||||
eRoyal Bank of Canada into Analog Devices Inc., 8.50%, 144A | United States | 1,700,000 | 158,308,129 | |||||||||
eRoyal Bank of Canada into Intel Corp., 8.00%, 144A | United States | 3,700,000 | 204,720,789 | |||||||||
eRoyal Bank of Canada into Intel Corp., 8.00%, 144A | United States | 5,070,000 | 270,699,858 | |||||||||
e,fUBS AG London into Oracle Corp., 9.00%, 144A | United States | 4,303,900 | 216,062,869 | |||||||||
|
| |||||||||||
| 3,765,210,777 | ||||||||||||
|
| |||||||||||
Materials 1.0% | ||||||||||||
eBarclays Bank PLC into International Paper Co., 9.00%, 144A | United States | 5,634,000 | 174,724,892 | |||||||||
eBarclays Bank PLC into Rio Tinto PLC, 10.00%, 144A | Australia | 5,000,000 | 226,299,115 | |||||||||
eJPMorgan Chase Bank NA into Barrick Gold Corp., 10.00%, 144A | Canada | 13,200,000 | 231,270,719 | |||||||||
|
| |||||||||||
| 632,294,726 | ||||||||||||
|
| |||||||||||
Total Equity-Linked Securities (Cost $13,382,685,142) | 11,284,414,399 | |||||||||||
|
| |||||||||||
Convertible Preferred Stocks 2.0% | ||||||||||||
Energy 0.0%† | ||||||||||||
Chesapeake Energy Corp., 5.75%, cvt. pfd. | United States | 75,224 | 2,518,542 | |||||||||
|
| |||||||||||
Financials 0.9% | ||||||||||||
Bank of America Corp., 7.25%, cvt. pfd., L | United States | 379,968 | 481,047,088 | |||||||||
aFNMA, 5.375%, cvt. pfd | United States | 4,250 | 77,562,500 | |||||||||
|
| |||||||||||
| 558,609,588 | ||||||||||||
|
| |||||||||||
Industrials 0.0%† | ||||||||||||
Fortive Corp., 5.00%, cvt. pfd., A | United States | 31,266 | 22,503,078 | |||||||||
|
| |||||||||||
Information Technology 0.7% | ||||||||||||
Broadcom Inc., 8.00%, cvt. pfd., A | United States | 420,000 | 392,431,200 | |||||||||
|
| |||||||||||
Utilities 0.4% | ||||||||||||
aNextEra Energy Inc., 5.279%, cvt. pfd. | United States | 1,622,000 | 71,513,980 | |||||||||
Sempra Energy, 6.00%, cvt. pfd., A | United States | 400,000 | 37,008,000 | |||||||||
Sempra Energy, 6.75%, cvt. pfd., B | United States | 739,000 | 69,414,270 | |||||||||
The Southern Co., 6.75%, cvt. pfd | United States | 1,600,000 | 71,040,000 | |||||||||
|
| |||||||||||
| 248,976,250 | ||||||||||||
|
| |||||||||||
Total Convertible Preferred Stocks (Cost $1,392,871,924) | 1,225,038,658 | |||||||||||
|
| |||||||||||
Preferred Stocks 0.3% | ||||||||||||
Financials 0.3% | ||||||||||||
aFHLMC, 8.375%, pfd., Z | United States | 6,500,000 | 39,585,000 | |||||||||
aFNMA, 8.25%, pfd., S | United States | 4,500,000 | 28,485,000 | |||||||||
gJPMorgan Chase & Co., 6.00%, pfd., EE | United States | 3,000,000 | 78,450,000 | |||||||||
|
| |||||||||||
Total Preferred Stocks (Cost $338,043,876) | 146,520,000 | |||||||||||
|
| |||||||||||
64 | Semiannual Report | franklintempleton.com | ||
FRANKLIN CUSTODIAN FUNDS
STATEMENT OF INVESTMENTS (UNAUDITED)
Franklin Income Fund(continued)
| Country | Units | Value | ||||||||||
hIndex-Linked Notes 0.2% | ||||||||||||
Financials 0.2% | ||||||||||||
iCredit Suisse AG, senior note, 8.962%, 2/08/21 | United States | 33,000 | $ | 79,454,760 | ||||||||
e,iUBS AG London Branch, senior note, 144A, 17.40%, 5/07/21 | United States | 75,000 | 62,996,250 | |||||||||
|
| |||||||||||
Total Index-Linked Notes (Cost $174,480,150) | 142,451,010 | |||||||||||
|
| |||||||||||
| Principal Amount* | ||||||||||||
Convertible Bonds (Cost $93,120,772) 0.0%† | ||||||||||||
Energy 0.0%† | ||||||||||||
Chesapeake Energy Corp., cvt., senior note, 5.50%, 9/15/26 | United States | $ | 203,359,000 | 11,184,745 | ||||||||
|
| |||||||||||
Corporate Bonds 33.5% | ||||||||||||
Communication Services 5.5% | ||||||||||||
AMC Entertainment Holdings Inc., senior sub. note, 5.875%, 11/15/26 | United States | 65,200,000 | 27,512,281 | |||||||||
AT&T Inc., | ||||||||||||
senior bond, 4.125%, 2/17/26 | United States | 90,000,000 | 96,218,837 | |||||||||
senior note, 3.00%, 6/30/22 | United States | 90,000,000 | 90,870,934 | |||||||||
eCCO Holdings LLC/CCO Holdings Capital Corp., | ||||||||||||
senior bond, 144A, 5.50%, 5/01/26 | United States | 40,000,000 | 40,782,700 | |||||||||
senior bond, 144A, 5.125%, 5/01/27 | United States | 40,000,000 | 40,480,800 | |||||||||
Comcast Corp., senior note, 3.95%, 10/15/25 | United States | 30,000,000 | 33,094,288 | |||||||||
eDiamond Sports Group LLC/Diamond Sports Finance Co., first lien, 144A, 5.375%, 8/15/26 | United States | 84,977,000 | 69,523,253 | |||||||||
DISH DBS Corp., | ||||||||||||
senior bond, 5.875%, 7/15/22 | United States | 391,500,000 | 383,341,140 | |||||||||
senior bond, 5.00%, 3/15/23 | United States | 300,000,000 | 290,256,000 | |||||||||
senior note, 5.875%, 11/15/24 | United States | 128,200,000 | 125,646,897 | |||||||||
Netflix Inc., | ||||||||||||
senior bond, 4.375%, 11/15/26 | United States | 100,000,000 | 100,805,000 | |||||||||
senior bond, 4.875%, 4/15/28 | United States | 79,300,000 | 81,486,698 | |||||||||
senior bond, 5.875%, 11/15/28 | United States | 50,000,000 | 53,777,500 | |||||||||
eSirius XM Radio Inc., senior note, 144A, 4.625%, 5/15/23 | United States | 56,200,000 | 55,988,969 | |||||||||
Sprint Communications Inc., | ||||||||||||
senior bond, 11.50%, 11/15/21 | United States | 200,000,000 | 221,592,000 | |||||||||
senior note, 7.00%, 8/15/20 | United States | 102,500,000 | 103,499,375 | |||||||||
senior note, 6.00%, 11/15/22 | United States | 367,700,000 | 384,592,138 | |||||||||
Sprint Corp., | ||||||||||||
senior bond, 7.875%, 9/15/23 | United States | 187,350,000 | 207,702,767 | |||||||||
senior bond, 7.125%, 6/15/24 | United States | 190,650,000 | 210,665,390 | |||||||||
senior note, 7.625%, 3/01/26 | United States | 96,300,000 | 109,526,805 | |||||||||
eSprint Spectrum Co. LLC, senior secured bond, first lien, 144A, 5.152%, 9/20/29 | United States | 220,000,000 | 236,179,350 | |||||||||
eUnivision Communications Inc., | ||||||||||||
senior secured note, first lien, 144A, 5.125%, 5/15/23 | United States | 175,000,000 | 156,187,500 | |||||||||
senior secured note, first lien, 144A, 5.125%, 2/15/25 | United States | 202,220,000 | 173,909,200 | |||||||||
Verizon Communications Inc., | ||||||||||||
senior bond, 3.50%, 11/01/24 | United States | 25,000,000 | 26,641,569 | |||||||||
senior bond, 2.625%, 8/15/26 | United States | 5,800,000 | 6,003,625 | |||||||||
|
| |||||||||||
| 3,326,285,016 | ||||||||||||
|
| |||||||||||
| franklintempleton.com | Semiannual Report | 65 | ||
FRANKLIN CUSTODIAN FUNDS
STATEMENT OF INVESTMENTS (UNAUDITED)
Franklin Income Fund(continued)
| Country | Principal Amount* | Value | ||||||||||
Corporate Bonds(continued) | ||||||||||||
Consumer Discretionary 2.1% | ||||||||||||
e24 Hour Holdings III LLC, senior note, 144A, 8.00%, 6/01/22 | United States | $ | 197,630,000 | $ | 21,430,207 | |||||||
Alibaba Group Holding Ltd., senior note, 3.40%, 12/06/27 | China | 50,000,000 | 52,579,752 | |||||||||
eAllison Transmission Inc., senior bond, 144A, 5.875%, 6/01/29 | United States | 25,000,000 | 24,674,188 | |||||||||
Ford Motor Co., | ||||||||||||
senior bond, 4.75%, 1/15/43 | United States | 60,000,000 | 34,350,000 | |||||||||
senior note, 4.346%, 12/08/26 | United States | 131,000,000 | 101,525,000 | |||||||||
Ford Motor Credit Co. LLC, | ||||||||||||
senior note, 3.336%, 3/18/21 | United States | 48,000,000 | 46,080,000 | |||||||||
senior note, 4.134%, 8/04/25 | United States | 145,000,000 | 129,340,000 | |||||||||
senior note, 5.113%, 5/03/29 | United States | 115,000,000 | 98,612,500 | |||||||||
General Motors Co., senior bond, 5.15%, 4/01/38 | United States | 165,000,000 | 119,866,167 | |||||||||
General Motors Financial Co. Inc., senior note, 4.15%, 6/19/23 | United States | 75,000,000 | 68,304,394 | |||||||||
eGolden Nugget Inc., senior note, 144A, 6.75%, 10/15/24 | United States | 70,000,000 | 44,615,200 | |||||||||
eHanesbrands Inc., senior bond, 144A, 4.875%, 5/15/26 | United States | 10,000,000 | 9,880,500 | |||||||||
MGM Resorts International, senior note, 5.50%, 4/15/27 | United States | 22,852,000 | 20,922,149 | |||||||||
eShea Homes LP/Shea Homes Funding Corp., | ||||||||||||
senior bond, 144A, 6.125%, 4/01/25 | United States | 100,500,000 | 100,373,872 | |||||||||
senior note, 144A, 5.875%, 4/01/23 | United States | 100,975,000 | 102,458,323 | |||||||||
eWynn Las Vegas LLC/Wynn Las Vegas Capital Corp., | ||||||||||||
senior bond, 144A, 4.25%, 5/30/23 | United States | 84,000,000 | 78,747,480 | |||||||||
senior bond, 144A, 5.50%, 3/01/25 | United States | 157,500,000 | 147,651,525 | |||||||||
senior bond, 144A, 5.25%, 5/15/27 | United States | 99,827,000 | 90,717,786 | |||||||||
|
| |||||||||||
| 1,292,129,043 | ||||||||||||
|
| |||||||||||
Consumer Staples 1.0% | ||||||||||||
Anheuser-Busch Cos. LLC/InBev Worldwide Inc., senior bond, 4.90%, 2/01/46 | Belgium | 20,000,000 | 21,928,209 | |||||||||
Anheuser-Busch InBev Worldwide Inc., senior bond, 4.00%, 4/13/28 | Belgium | 25,000,000 | 26,449,806 | |||||||||
BAT Capital Corp., | ||||||||||||
senior note, 3.222%, 8/15/24 | United Kingdom | 88,500,000 | 89,063,532 | |||||||||
senior note, 3.557%, 8/15/27 | United Kingdom | 170,000,000 | 160,469,426 | |||||||||
Kraft Heinz Foods Co., | ||||||||||||
senior bond, 3.95%, 7/15/25 | United States | 60,000,000 | 59,101,241 | |||||||||
senior bond, 4.625%, 1/30/29 | United States | 30,000,000 | 30,305,688 | |||||||||
ePost Holdings Inc., | ||||||||||||
senior bond, 144A, 5.00%, 8/15/26 | United States | 87,000,000 | 90,018,900 | |||||||||
senior bond, 144A, 5.625%, 1/15/28 | United States | 65,000,000 | 66,498,250 | |||||||||
Walmart Inc., | ||||||||||||
senior note, 3.40%, 6/26/23 | United States | 40,000,000 | 42,618,016 | |||||||||
senior note, 3.55%, 6/26/25 | United States | 45,000,000 | 49,214,924 | |||||||||
|
| |||||||||||
| 635,667,992 | ||||||||||||
|
| |||||||||||
Energy 2.7% | ||||||||||||
eAscent Resources Utica Holdings LLC/ARU Finance Corp., senior note, 144A, 10.00%, 4/01/22 | United States | 60,000,000 | 32,548,830 | |||||||||
Calumet Specialty Products Partners LP/Calumet Finance Corp., | ||||||||||||
senior note, 7.625%, 1/15/22 | United States | 165,665,000 | 129,787,925 | |||||||||
senior note, 7.75%, 4/15/23 | United States | 138,085,000 | 96,486,203 | |||||||||
esenior note, 144A, 11.00%, 4/15/25 | United States | 290,380,000 | 211,344,372 | |||||||||
66 | Semiannual Report | franklintempleton.com | ||
FRANKLIN CUSTODIAN FUNDS
STATEMENT OF INVESTMENTS (UNAUDITED)
Franklin Income Fund(continued)
| Country | Principal Amount* | Value | ||||||||||
Corporate Bonds(continued) | ||||||||||||
Energy(continued) | ||||||||||||
Chesapeake Energy Corp., | ||||||||||||
e secured note, second lien, 144A, 11.50%, 1/01/25 | United States | $ | 1,084,523,000 | $ | 184,368,910 | |||||||
senior note, 7.00%, 10/01/24 | United States | 410,000,000 | 34,850,000 | |||||||||
e CNX Resources Corp., senior note, 144A, 7.25%, 3/14/27 | United States | 70,400,000 | 50,229,344 | |||||||||
HighPoint Operating Corp., | ||||||||||||
senior bond, 7.00%, 10/15/22 | United States | 205,783,000 | 107,714,230 | |||||||||
senior note, 8.75%, 6/15/25 | United States | 175,845,000 | 82,647,150 | |||||||||
Kinder Morgan Inc., | ||||||||||||
senior bond, 7.75%, 1/15/32 | United States | 118,000,000 | 136,320,361 | |||||||||
e senior secured bond, first lien, 144A, 5.625%, 11/15/23 | United States | 66,200,000 | 69,275,945 | |||||||||
Matador Resources Co., senior note, 5.875%, 9/15/26 | United States | 5,100,000 | 1,464,848 | |||||||||
e PBF Holding Co LLC/PBF Finance Corp., senior note, 144A, 6.00%, 2/15/28 | United States | 50,000,000 | 34,000,000 | |||||||||
Sunoco LP/Sunoco Finance Corp., senior note, 5.50%, 2/15/26 | United States | 74,775,000 | 65,340,077 | |||||||||
e Weatherford International Ltd., senior note, 144A, 11.00%, 12/01/24 | United States | 675,113,000 | 412,156,487 | |||||||||
|
| |||||||||||
| 1,648,534,682 | ||||||||||||
|
| |||||||||||
Financials 5.1% | ||||||||||||
Bank of America Corp., | ||||||||||||
j junior sub. bond, AA, 6.10% to 3/17/25, FRN thereafter, Perpetual | United States | 80,000,000 | 80,855,600 | |||||||||
j junior sub. bond, U, 5.20% to 6/01/23, FRN thereafter, Perpetual | United States | 75,000,000 | 71,963,250 | |||||||||
j junior sub. bond, X, 6.25% to 9/05/24, FRN thereafter, Perpetual | United States | 85,000,000 | 86,334,075 | |||||||||
senior bond, 3.419% to 12/20/27, FRN thereafter, 12/20/28 | United States | 135,000,000 | 139,673,812 | |||||||||
senior note, 3.004% to 12/20/22, FRN thereafter, 12/20/23 | United States | 50,000,000 | 51,007,364 | |||||||||
Barclays PLC, | ||||||||||||
senior note, 3.65%, 3/16/25 | United Kingdom | 50,000,000 | 49,420,986 | |||||||||
senior note, 4.375%, 1/12/26 | United Kingdom | 125,000,000 | 127,578,125 | |||||||||
senior note, 3.932% to 5/07/24, FRN thereafter, 5/07/25 | United Kingdom | 50,000,000 | 48,055,467 | |||||||||
senior note, 4.61% to 2/14/22, FRN thereafter, 2/15/23 | United Kingdom | 50,000,000 | 50,917,207 | |||||||||
Capital One Financial Corp., | ||||||||||||
senior sub. note, 4.20%, 10/29/25 | United States | 123,000,000 | 122,809,378 | |||||||||
sub. note, 3.75%, 7/28/26 | United States | 110,200,000 | 104,273,872 | |||||||||
Citigroup Inc., | ||||||||||||
j junior sub. bond, 5.35% to 5/15/23, FRN thereafter, Perpetual | United States | 150,000,000 | 133,573,500 | |||||||||
j junior sub. bond, 5.95% to 1/30/23, FRN thereafter, Perpetual | United States | 155,000,000 | 149,991,950 | |||||||||
j junior sub. bond, M, 6.30% to 5/15/24, FRN thereafter, Perpetual | United States | 140,000,000 | 132,432,300 | |||||||||
j junior sub. bond, Q, 5.95% to 8/15/20, FRN thereafter, Perpetual | United States | 120,000,000 | 105,625,800 | |||||||||
sub. bond, 4.125%, 7/25/28 | United States | 165,000,000 | 169,686,162 | |||||||||
sub. note, 3.50%, 5/15/23 | United States | 25,000,000 | 25,786,470 | |||||||||
The Goldman Sachs Group Inc., | ||||||||||||
senior note, 3.50%, 11/16/26 | United States | 50,227,000 | 51,443,456 | |||||||||
senior note, 2.876% to 10/31/21, FRN thereafter, 10/31/22 | United States | 115,000,000 | 115,684,101 | |||||||||
senior note, 3.272% to 9/29/24, FRN thereafter, 9/29/25 | United States | 100,000,000 | 102,147,251 | |||||||||
HSBC Holdings PLC, | ||||||||||||
senior note, 3.40%, 3/08/21 | United Kingdom | 25,000,000 | 25,145,588 | |||||||||
senior note, 4.292% to 9/12/25, FRN thereafter, 9/12/26 | United Kingdom | 125,000,000 | 130,931,012 | |||||||||
| franklintempleton.com | Semiannual Report | 67 | ||
FRANKLIN CUSTODIAN FUNDS
STATEMENT OF INVESTMENTS (UNAUDITED)
Franklin Income Fund(continued)
| Country | Principal Amount* | Value | ||||||||||
Corporate Bonds(continued) | ||||||||||||
Financials(continued) | ||||||||||||
jJPMorgan Chase & Co., | ||||||||||||
junior sub. bond, 6.125% to 4/30/24, FRN thereafter, Perpetual | United States | $ | 60,000,000 | $ | 57,041,700 | |||||||
junior sub. bond, 6.75% to 2/01/24, FRN thereafter, Perpetual | United States | 100,000,000 | 104,569,500 | |||||||||
kjunior sub. bond, FRN, 5.24%,(3-month USD LIBOR + 3.47%), Perpetual | United States | 204,959,000 | 185,333,151 | |||||||||
junior sub. bond, Q, 5.15% to 5/01/23, FRN thereafter, Perpetual | United States | 100,000,000 | 95,049,000 | |||||||||
junior sub. bond, R, 6.00% to 8/01/23, FRN thereafter, Perpetual | United States | 105,000,000 | 105,072,975 | |||||||||
kjunior sub. bond, V, FRN, 5.229%,(3-month USD LIBOR + 3.32%), Perpetual | United States | 195,100,000 | 169,687,249 | |||||||||
junior sub. bond, X, 6.10% to 10/01/24, FRN thereafter, Perpetual | United States | 80,000,000 | 81,575,600 | |||||||||
jMorgan Stanley, junior sub. bond, 5.55% to 7/15/20, FRN thereafter, Perpetual | United States | 58,000,000 | 51,026,660 | |||||||||
Prudential Financial Inc., junior sub. bond, 5.70% to 9/15/28, FRN thereafter, 9/15/48 | United States | 100,000,000 | 92,923,529 | |||||||||
jWells Fargo & Co., junior sub. bond, S, 5.90% to 6/15/24, FRN thereafter, Perpetual | United States | 125,000,000 | 122,938,125 | |||||||||
|
| |||||||||||
| 3,140,554,215 | ||||||||||||
|
| |||||||||||
Health Care 13.6% | ||||||||||||
AbbVie Inc., | ||||||||||||
senior bond, 3.20%, 5/14/26 | United States | 35,000,000 | 36,339,487 | |||||||||
senior note, 2.90%, 11/06/22 | United States | 35,000,000 | 35,452,523 | |||||||||
Allergan Funding SCS, senior bond, 3.80%, 3/15/25 | United States | 100,000,000 | 102,577,397 | |||||||||
AstraZeneca PLC, | ||||||||||||
senior note, 2.375%, 11/16/20 | United Kingdom | 25,000,000 | 24,941,879 | |||||||||
senior note, 2.375%, 6/12/22 | United Kingdom | 31,500,000 | 31,759,361 | |||||||||
eBausch Health Americas Inc., senior note, 144A, 9.25%, 4/01/26 | United States | 200,000,000 | 209,890,000 | |||||||||
eBausch Health Cos. Inc., | ||||||||||||
senior bond, 144A, 6.125%, 4/15/25 | United States | 122,400,000 | 121,329,612 | |||||||||
senior bond, 144A, 7.25%, 5/30/29 | United States | 40,000,000 | 41,734,000 | |||||||||
senior note, 144A, 5.50%, 3/01/23 | United States | 52,984,000 | 52,387,665 | |||||||||
senior note, 144A, 5.875%, 5/15/23 | United States | 54,822,000 | 54,376,571 | |||||||||
senior note, 144A, 9.00%, 12/15/25 | United States | 105,000,000 | 111,478,500 | |||||||||
senior note, 144A, 8.50%, 1/31/27 | United States | 50,000,000 | 52,527,500 | |||||||||
senior note, 144A, 7.00%, 1/15/28 | United States | 40,000,000 | 41,702,000 | |||||||||
senior note, first lien, 144A, 7.00%, 3/15/24 | United States | 87,300,000 | 90,028,562 | |||||||||
senior secured note, first lien, 144A, 6.50%, 3/15/22 | United States | 70,203,000 | 71,168,291 | |||||||||
senior secured note, first lien, 144A, 5.50%, 11/01/25 | United States | 91,000,000 | 92,506,505 | |||||||||
eBayer U.S. Finance II LLC, senior note, 144A, 4.25%, 12/15/25 | Germany | 75,000,000 | 78,087,571 | |||||||||
eBristol-Myers Squibb Co., | ||||||||||||
senior bond, 144A, 3.40%, 7/26/29 | United States | 50,000,000 | 55,074,824 | |||||||||
senior bond, 144A, 4.25%, 10/26/49 | United States | 16,700,000 | 21,023,259 | |||||||||
eCentene Corp., senior bond, 144A, 4.625%, 12/15/29 | United States | 60,000,000 | 60,633,000 | |||||||||
CHS/Community Health Systems Inc., | ||||||||||||
senior note, 6.875%, 2/01/22 | United States | 29,766,000 | 22,547,745 | |||||||||
esenior note, 144A, 9.875%, 6/30/23 | United States | 1,385,000,000 | 1,092,411,825 | |||||||||
esenior note, 144A, 8.125%, 6/30/24 | United States | 740,000,000 | 518,259,000 | |||||||||
esenior note, 144A, 8.00%, 12/15/27 | United States | 570,000,000 | 528,675,000 | |||||||||
esenior note, 144A, 6.875%, 4/01/28 | United States | 1,400,000,000 | 567,000,000 | |||||||||
esenior secured note, 144A, 6.625%, 2/15/25 | United States | 300,000,000 | 279,750,000 | |||||||||
esenior secured note, 144A, 8.00%, 3/15/26 | United States | 396,500,000 | 378,904,123 | |||||||||
68 | Semiannual Report | franklintempleton.com | ||
FRANKLIN CUSTODIAN FUNDS
STATEMENT OF INVESTMENTS (UNAUDITED)
Franklin Income Fund(continued)
| Country | Principal Amount* | Value | ||||||||||
Corporate Bonds(continued) | ||||||||||||
Health Care(continued) | ||||||||||||
Cigna Corp., | ||||||||||||
senior note, 3.75%, 7/15/23 | United States | $ | 36,552,000 | $ | 37,690,436 | |||||||
senior note, 4.125%, 11/15/25 | United States | 50,000,000 | 53,630,025 | |||||||||
CVS Health Corp., | ||||||||||||
senior bond, 4.30%, 3/25/28 | United States | 125,000,000 | 133,012,996 | |||||||||
senior bond, 5.05%, 3/25/48 | United States | 65,000,000 | 74,102,907 | |||||||||
senior note, 4.10%, 3/25/25 | United States | 50,000,000 | 52,712,813 | |||||||||
DaVita Inc., | ||||||||||||
senior bond, 5.125%, 7/15/24 | United States | 202,700,000 | 203,359,788 | |||||||||
senior bond, 5.00%, 5/01/25 | United States | 129,500,000 | 130,140,377 | |||||||||
eEndo DAC/Endo Finance LLC/Endo Finco Inc., | ||||||||||||
senior bond, 144A, 6.00%, 2/01/25 | United States | 74,900,000 | 51,563,407 | |||||||||
senior note, 144A, 6.00%, 7/15/23 | United States | 149,525,000 | 109,429,871 | |||||||||
HCA Inc., | ||||||||||||
senior bond, 5.875%, 5/01/23 | United States | 90,000,000 | 94,511,250 | |||||||||
senior bond, 5.625%, 9/01/28 | United States | 120,000,000 | 126,270,000 | |||||||||
senior secured note, first lien, 5.00%, 3/15/24 | United States | 124,800,000 | 129,442,564 | |||||||||
eMallinckrodt International Finance SA/Mallinckrodt CB LLC, | ||||||||||||
senior note, 144A, 4.875%, 4/15/20 | United States | 66,800,000 | 48,067,677 | |||||||||
senior note, 144A, 5.75%, 8/01/22 | United States | 190,110,000 | 96,480,825 | |||||||||
senior note, 144A, 5.625%, 10/15/23 | United States | 232,950,000 | 59,692,273 | |||||||||
senior note, 144A, 5.50%, 4/15/25 | United States | 106,400,000 | 23,142,000 | |||||||||
Mylan NV, senior note, 3.95%, 6/15/26 | United States | 150,000,000 | 150,135,913 | |||||||||
ePar Pharmaceutical Inc., senior secured note, 144A, 7.50%, 4/01/27 | United States | 85,000,000 | 85,218,875 | |||||||||
Tenet Healthcare Corp., | ||||||||||||
secured note, second lien, 5.125%, 5/01/25 | United States | 133,300,000 | 126,968,250 | |||||||||
senior note, 8.125%, 4/01/22 | United States | 910,000,000 | 864,809,400 | |||||||||
senior note, 6.75%, 6/15/23 | United States | 565,000,000 | 524,746,575 | |||||||||
senior note, 7.00%, 8/01/25 | United States | 155,000,000 | 135,044,525 | |||||||||
senior note, 6.875%, 11/15/31 | United States | 55,258,000 | 46,888,761 | |||||||||
esenior note, second lien, 144A, 6.25%, 2/01/27 | United States | 50,000,000 | 48,937,500 | |||||||||
senior secured note, first lien, 4.625%, 7/15/24 | United States | 95,200,000 | 91,154,000 | |||||||||
|
| |||||||||||
| 8,269,719,208 | ||||||||||||
|
| |||||||||||
Industrials 0.6% | ||||||||||||
eAmerican Airlines Group Inc., senior note, 144A, 5.00%, 6/01/22 | United States | 16,000,000 | 12,940,000 | |||||||||
eAshtead Capital Inc., | ||||||||||||
secured bond, second lien, 144A, 4.375%, 8/15/27 | United Kingdom | 34,500,000 | 31,998,750 | |||||||||
secured note, second lien, 144A, 4.00%, 5/01/28 | United Kingdom | 25,000,000 | 21,612,500 | |||||||||
Delta Air Lines Inc., senior note, 3.75%, 10/28/29 | United States | 10,000,000 | 8,105,341 | |||||||||
Hertz Corp., senior note, 6.25%, 10/15/22 | United States | 18,000,000 | 12,743,622 | |||||||||
United Airlines Holdings Inc., senior note, 4.25%, 10/01/22 | United States | 13,150,000 | 12,046,057 | |||||||||
United Rentals North America Inc., senior bond, 4.875%, 1/15/28 | United States | 106,000,000 | 103,408,300 | |||||||||
United Technologies Corp., | ||||||||||||
senior bond, 4.50%, 6/01/42 | United States | 15,000,000 | 17,495,879 | |||||||||
senior note, 3.95%, 8/16/25 | United States | 20,000,000 | 21,924,342 | |||||||||
senior note, 3.125%, 5/04/27 | United States | 40,000,000 | 40,937,007 | |||||||||
| franklintempleton.com | Semiannual Report | 69 | ||
FRANKLIN CUSTODIAN FUNDS
STATEMENT OF INVESTMENTS (UNAUDITED)
Franklin Income Fund(continued)
| Country | Principal Amount* | Value | ||||||||||
Corporate Bonds(continued) | ||||||||||||
Industrials(continued) | ||||||||||||
e XPO Logistics Inc., senior note, 144A, 6.50%, 6/15/22 | United States | $ | 50,000,000 | $ | 50,392,000 | |||||||
|
| |||||||||||
| 333,603,798 | ||||||||||||
|
| |||||||||||
Information Technology 0.5% | ||||||||||||
Broadcom Corp./Broadcom Cayman Finance Ltd., senior bond, 3.50%, 1/15/28 | United States | 40,000,000 | 37,154,050 | |||||||||
e CommScope Inc., senior bond, 144A, 5.50%, 6/15/24 | United States | 80,000,000 | 74,477,600 | |||||||||
e CommScope Technologies LLC, senior bond, 144A, 6.00%, 6/15/25 | United States | 21,398,000 | 19,743,935 | |||||||||
e Dell International LLC/EMC Corp., | ||||||||||||
senior secured note, first lien, 144A, 5.45%, 6/15/23 | United States | 25,000,000 | 25,686,144 | |||||||||
senior secured note, first lien, 144A, 4.90%, 10/01/26 | United States | 30,000,000 | 29,949,326 | |||||||||
Microchip Technology Inc., senior secured note, 4.333%, 6/01/23 | United States | 69,000,000 | 68,874,446 | |||||||||
NCR Corp., | ||||||||||||
senior note, 5.00%, 7/15/22 | United States | 35,000,000 | 33,031,250 | |||||||||
senior note, 6.375%, 12/15/23 | United States | 35,000,000 | 34,781,075 | |||||||||
|
| |||||||||||
| 323,697,826 | ||||||||||||
|
| |||||||||||
Materials 1.2% | ||||||||||||
e Cemex Finance LLC, senior secured note, first lien, 144A, 6.00%, 4/01/24 | Mexico | 57,800,000 | 50,287,734 | |||||||||
e Cemex SAB de CV, | ||||||||||||
senior secured bond, 144A, 7.75%, 4/16/26 | Mexico | 50,100,000 | 45,118,056 | |||||||||
senior secured bond, first lien, 144A, 5.70%, 1/11/25 | Mexico | 65,000,000 | 55,411,200 | |||||||||
e Cleveland-Cliffs Inc., senior secured note, 144A, 6.75%, 3/15/26 | United States | 40,000,000 | 35,575,000 | |||||||||
e FMG Resources (August 2006) Pty. Ltd., | ||||||||||||
senior note, 144A, 4.75%, 5/15/22 | Australia | 40,200,000 | 40,263,918 | |||||||||
senior note, 144A, 5.125%, 3/15/23 | Australia | 25,000,000 | 24,686,750 | |||||||||
senior note, 144A, 5.125%, 5/15/24 | Australia | 60,540,000 | 60,010,578 | |||||||||
Freeport-McMoRan Inc., | ||||||||||||
senior bond, 3.875%, 3/15/23 | United States | 62,636,000 | 60,052,578 | |||||||||
senior bond, 5.25%, 9/01/29 | United States | 40,000,000 | 37,914,000 | |||||||||
International Paper Co., senior bond, 3.00%, 2/15/27 | United States | 50,000,000 | 51,546,263 | |||||||||
LYB International Finance II BV, senior note, 3.50%, 3/02/27 | United States | 30,200,000 | 29,601,436 | |||||||||
e Mauser Packaging Solutions Holding Co., | ||||||||||||
secured note, 144A, 5.50%, 4/15/24 | United States | 80,000,000 | 74,197,600 | |||||||||
senior note, 144A, 7.25%, 4/15/25 | United States | 200,995,000 | 153,767,205 | |||||||||
e Syngenta Finance NV, | ||||||||||||
senior note, 144A, 4.441%, 4/24/23 | Switzerland | 25,000,000 | 23,578,895 | |||||||||
senior note, 144A, 5.182%, 4/24/28 | Switzerland | 20,000,000 | 17,117,420 | |||||||||
|
| |||||||||||
| 759,128,633 | ||||||||||||
|
| |||||||||||
RealEstate 0.6% | ||||||||||||
American Tower Corp., senior bond, 3.375%, 10/15/26 | United States | 50,000,000 | 50,125,052 | |||||||||
Equinix Inc., senior bond, 5.375%, 5/15/27 | United States | 75,000,000 | 75,249,750 | |||||||||
Iron Mountain Inc., | ||||||||||||
e senior note, 144A, 4.875%, 9/15/27 | United States | 125,610,000 | 122,716,888 | |||||||||
senior sub. bond, 5.75%, 8/15/24 | United States | 125,000,000 | 125,308,750 | |||||||||
|
| |||||||||||
| 373,400,440 | ||||||||||||
|
| |||||||||||
70 | Semiannual Report | franklintempleton.com | ||
FRANKLIN CUSTODIAN FUNDS
STATEMENT OF INVESTMENTS (UNAUDITED)
Franklin Income Fund(continued)
| Country | Principal Amount* | Value | ||||||||||
Corporate Bonds(continued) | ||||||||||||
Utilities 0.6% | ||||||||||||
Calpine Corp., | ||||||||||||
senior bond, 5.75%, 1/15/25 | United States | $ | 22,819,000 | $ | 21,278,717 | |||||||
senior note, 5.50%, 2/01/24 | United States | 186,500,000 | 178,568,155 | |||||||||
Sempra Energy, senior bond, 3.40%, 2/01/28 | United States | 30,000,000 | 30,158,212 | |||||||||
The Southern Co., junior sub. bond, 5.50% to 3/14/22, FRN thereafter, 3/15/57 | United States | 46,857,000 | 44,802,820 | |||||||||
Vistra Energy Corp., senior note, 5.875%, 6/01/23 | United States | 78,000,000 | 78,387,660 | |||||||||
|
| |||||||||||
| 353,195,564 | ||||||||||||
|
| |||||||||||
Total Corporate Bonds (Cost $25,198,093,095) | 20,455,916,417 | |||||||||||
|
| |||||||||||
k,lSenior Floating Rate Interests 0.6% | ||||||||||||
Communication Services 0.3% | ||||||||||||
Diamond Sports Group LLC, Term Loan, 4.18%,(1-month USD LIBOR + 3.25%), 8/24/26 | United States | 24,875,000 | 19,526,875 | |||||||||
Global Eagle Entertainment Inc., Initial Term Loans, 9.378%,(3-month USD LIBOR + 7.50%), 1/06/23 | United States | 35,185,333 | 23,046,393 | |||||||||
Sprint Communications Inc., 2018 Incremental Term Loans, 4.00%,(1-month USD LIBOR + 3.00%), 2/03/24 | United States | 98,750,000 | 97,968,196 | |||||||||
Univision Communications Inc., Term Loan, 3.75%,(1-month USD LIBOR + 2.75%), 3/15/24 | United States | 61,762,054 | 52,806,556 | |||||||||
|
| |||||||||||
| 193,348,020 | ||||||||||||
|
| |||||||||||
Consumer Discretionary 0.2% | ||||||||||||
24 Hour Fitness Worldwide Inc., Term Loan, 4.95%,(3-month USD LIBOR + 3.50%), 5/30/25 | United States | 96,190,533 | 24,047,633 | |||||||||
Belk Inc., Extended Term Loan B, 7.75%,(3-month USD LIBOR + 6.75%), 7/31/25 | United States | 135,813,908 | 64,511,607 | |||||||||
f,mGolden Nugget Inc., Term Loan B, TBD, 10/23/23 | United States | 26,135,238 | 20,429,053 | |||||||||
|
| |||||||||||
| 108,988,293 | ||||||||||||
|
| |||||||||||
Energy 0.1% | ||||||||||||
fChesapeake Energy Corp., Class A Loan, 9.00%,(1-month USD LIBOR + 8.00%), 6/23/24 | United States | 195,000,000 | 79,170,000 | |||||||||
|
| |||||||||||
Total Senior Floating Rate Interests (Cost $646,149,847) | 381,506,313 | |||||||||||
|
| |||||||||||
U.S. Government and Agency Securities 8.5% | ||||||||||||
U.S. Treasury Bond, | ||||||||||||
7.50%, 11/15/24 | United States | 350,000,000 | 464,201,171 | |||||||||
6.875%, 8/15/25 | United States | 400,000,000 | 536,437,500 | |||||||||
6.125%, 11/15/27 | United States | 300,000,000 | 425,074,218 | |||||||||
6.125%, 8/15/29 | United States | 100,000,000 | 149,707,031 | |||||||||
U.S. Treasury Note, | ||||||||||||
2.50%, 2/28/21 | United States | 500,000,000 | 510,869,140 | |||||||||
2.375%, 3/15/21 | United States | 750,000,000 | 766,186,522 | |||||||||
2.625%, 6/15/21 | United States | 500,000,000 | 515,136,720 | |||||||||
2.00%, 11/30/22 | United States | 450,000,000 | 470,636,721 | |||||||||
2.75%, 4/30/23 | United States | 500,000,000 | 537,890,625 | |||||||||
2.75%, 5/31/23 | United States | 500,000,000 | 538,789,060 | |||||||||
| franklintempleton.com | Semiannual Report | 71 | ||
FRANKLIN CUSTODIAN FUNDS
STATEMENT OF INVESTMENTS (UNAUDITED)
Franklin Income Fund(continued)
| Country | Principal Amount* | Value | ||||||||||
U.S. Government and Agency Securities(continued) | ||||||||||||
U.S. Treasury Note, (continued) | ||||||||||||
2.875%, 5/31/25 | United States | $ | 250,000,000 | $ | 281,416,015 | |||||||
|
| |||||||||||
Total U.S. Government and Agency Securities | 5,196,344,723 | |||||||||||
|
| |||||||||||
Mortgage-Backed Securities 3.0% | ||||||||||||
Federal Home Loan Mortgage Corp. (FHLMC) Fixed Rate 0.2% | ||||||||||||
FHLMC 30 Year, 4.00%, 5/01/49 - 10/01/49 | United States | 124,230,322 | 133,167,947 | |||||||||
|
| |||||||||||
Federal National Mortgage Association (FNMA) Fixed Rate 1.0% | ||||||||||||
FNMA 30 Year, 4.00%, 10/01/47 - 2/01/50 | United States | 562,819,757 | 603,494,481 | |||||||||
|
| |||||||||||
Government National Mortgage Association (GNMA) Fixed Rate 1.8% | ||||||||||||
GNMA II SF 30 Year, 3.50%, 12/20/49 - 1/20/50 | United States | 538,916,948 | 570,291,219 | |||||||||
GNMA II SF 30 Year, 4.00%, 9/20/49 - 1/20/50 | United States | 486,512,388 | 518,602,406 | |||||||||
|
| |||||||||||
| 1,088,893,625 | ||||||||||||
|
| |||||||||||
Total Mortgage-Backed Securities | 1,825,556,053 | |||||||||||
|
| |||||||||||
| Shares | ||||||||||||
Escrows and Litigation Trusts 0.0% | ||||||||||||
a,nMotors Liquidation Co., Escrow Account | United States | 400,000,000 | — | |||||||||
a,nMotors Liquidation Co., Escrow Account, cvt. pfd., C | United States | 11,000,000 | — | |||||||||
|
| |||||||||||
Total Escrows and Litigation Trusts | — | |||||||||||
|
| |||||||||||
| Number of Contracts | Notional Amount | |||||||||||
Options Purchased 1.9% | ||||||||||||
Puts - Exchange-Traded | ||||||||||||
S&P 500 Index, June Strike Price $2,400.00, Expires 6/19/20 | 10,000 | 1,000,000 | 136,460,000 | |||||||||
S&P 500 Index, June Strike Price $2,700.00, Expires 6/19/20 | 10,000 | 1,000,000 | 229,200,000 | |||||||||
S&P 500 Index, September Strike Price $3,350.00, Expires 9/18/20 | 10,000 | 1,000,000 | 791,750,000 | |||||||||
|
| |||||||||||
Total Options Purchased | 1,157,410,000 | |||||||||||
|
| |||||||||||
Total Investments before Short Term Investments | 59,691,711,334 | |||||||||||
|
| |||||||||||
72 | Semiannual Report | franklintempleton.com | ||
FRANKLIN CUSTODIAN FUNDS
STATEMENT OF INVESTMENTS (UNAUDITED)
Franklin Income Fund(continued)
| Country | Principal Amount* | Value | ||||||||||
Short Term Investments 2.4% | ||||||||||||
Corporate Bonds (Cost $6,505,204) 0.0%† | ||||||||||||
Martin Midstream Partners LP/Martin Midstream Finance Corp., senior note, 7.25%, 2/15/21 | United States | $ | 12,723,000 | $ | 6,934,671 | |||||||
|
| |||||||||||
Total Investments before Money Market Funds and Repurchase Agreement | 59,698,646,005 | |||||||||||
|
| |||||||||||
| Shares | ||||||||||||
Money Market Funds (Cost $1,446,874,834) 2.4% | ||||||||||||
o,pInstitutional Fiduciary Trust Money Market Portfolio, 0.32% | United States | 1,446,874,834 | 1,446,874,834 | |||||||||
|
| |||||||||||
qInvestments from Cash Collateral Received for Loaned Securities 0.0%† | ||||||||||||
Money Market Funds (Cost $3,832,000) 0.0%† | ||||||||||||
o,pInstitutional Fiduciary Trust Money Market Portfolio, 0.32% | United States | 3,832,000 | 3,832,000 | |||||||||
|
| |||||||||||
| Principal Amount* | ||||||||||||
Repurchase Agreements (Cost $958,031) 0.0%† | ||||||||||||
rJoint Repurchase Agreement, 0.01%, 4/01/20 (Maturity Value $958,031) | ||||||||||||
BofA Securities Inc. | ||||||||||||
Collateralized by U.S. Treasury Notes, 2.75%, 11/15/23 (valued at $977,195) | United States | $ | 958,031 | 958,031 | ||||||||
|
| |||||||||||
Total Investments from Cash Collateral Received for Loaned Securities (Cost $4,790,031) | 4,790,031 | |||||||||||
|
| |||||||||||
Total Investments (Cost $68,670,471,034) 100.2% | 61,150,310,870 | |||||||||||
Options Written (1.0)% | (606,021,000 | ) | ||||||||||
Other Assets, less Liabilities 0.8% | 484,595,795 | |||||||||||
|
| |||||||||||
Net Assets 100.0% | $ | 61,028,885,665 | ||||||||||
|
| |||||||||||
| Number of Contracts | Notional Amount | |||||||||||
sOptions Written (1.0)% | ||||||||||||
Calls - Exchange-Traded | ||||||||||||
Alphabet Inc., A, May Strike Price $1,300.00, Expires 5/15/20 | 2,500 | 250,000 | (4,500,000 | ) | ||||||||
Intel Corp., June Strike Price $60.00, Expires 6/19/20 | 15,000 | 1,500,000 | (3,780,000 | ) | ||||||||
Johnson & Johnson, May Strike Price $135.00, Expires 5/15/20 | 10,000 | 1,000,000 | (5,610,000 | ) | ||||||||
McDonald’s Corp., May Strike Price $180.00, Expires 5/15/20 | 6,000 | 600,000 | (3,006,000 | ) | ||||||||
PepsiCo Inc., May Strike Price $130.00, Expires 5/15/20 | 15,000 | 1,500,000 | (3,975,000 | ) | ||||||||
Philip Morris International Inc., May Strike Price $80.00, Expires 5/15/20 | 10,000 | 1,000,000 | (2,250,000 | ) | ||||||||
The Procter & Gamble Co., June Strike Price $125.00, Expires 6/19/20 | 10,000 | 1,000,000 | (2,620,000 | ) | ||||||||
|
| |||||||||||
| (25,741,000 | ) | |||||||||||
|
| |||||||||||
| franklintempleton.com | Semiannual Report | 73 | ||
FRANKLIN CUSTODIAN FUNDS
STATEMENT OF INVESTMENTS (UNAUDITED)
Franklin Income Fund(continued)
| Number of Contracts | Notional Amount | Value | ||||||||||
sOptions Written(continued) | ||||||||||||
Puts - Exchange-Traded | ||||||||||||
S&P 500 Index, June Strike Price $2,500.00, Expires 6/19/20 | 10,000 | $ | 1,000,000 | $ | (164,280,000 | ) | ||||||
S&P 500 Index, September Strike Price $2,900.00, Expires 9/18/20 | 10,000 | 1,000,000 | (416,000,000 | ) | ||||||||
|
| |||||||||||
| (580,280,000 | ) | |||||||||||
|
| |||||||||||
Total Options Written (Premiums received $157,397,330) | $ | (606,021,000 | ) | |||||||||
|
| |||||||||||
†Rounds to less than 0.1% of net assets.
*The principal amount is stated in U.S. dollars unless otherwise indicated.
aNon-income producing.
bA portion or all of the security is held in connection with written option contracts open at period end.
cSee Note 10 regarding holdings of 5% voting securities.
dSee Note 1(h) regarding equity-linked securities.
eSecurity was purchased pursuant to Rule 144A under the Securities Act of 1933 and may be sold in transactions exempt from registration only to qualified institutional buyers or in a public offering registered under the Securities Act of 1933. At March 31, 2020, the aggregate value of these securities was $19,632,240,283, representing 32.2% of net assets.
fA portion or all of the security purchased on a delayed delivery basis. See Note 1(d).
gA portion or all of the security is on loan at March 31, 2020. See Note 1(i).
hSee Note 1(g) regarding index-linked notes.
iSecurity pays variable interest based on the distributions of the strategy index and proceeds earned from related equity derivatives. The coupon rate shown represents the combined rate at period end. Cash payment at maturity or upon early redemption is based on the performance of the strategy index.
jPerpetual security with no stated maturity date.
kThe coupon rate shown represents the rate at period end.
lSee Note 1(k) regarding senior floating rate interests.
mA portion or all of the security represents an unsettled loan commitment. The coupon rate isto-be determined (TBD) at the time of settlement and will be based upon a reference index/floor plus a spread.
nFair valued using significant unobservable inputs. See Note 14 regarding fair value measurements.
oSee Note 3(f) regarding investments in affiliated management investment companies.
pThe rate shown is the annualizedseven-day effective yield at period end.
qSee Note 1(i) regarding securities on loan.
rSee Note 1(c) regarding joint repurchase agreement.
sSee Note 1(e) regarding written options.
74 | Semiannual Report | franklintempleton.com | ||
FRANKLIN CUSTODIAN FUNDS
STATEMENT OF INVESTMENTS (UNAUDITED)
Franklin Income Fund(continued)
At March 31, 2020, the Fund had the following credit default swap contracts outstanding. See Note 1(e).
Credit Default Swap Contracts
| Description | Periodic Payment Rate Received (Paid) | Payment Frequency | Counter- party | Maturity Date | Notional Amount | Value | Unamortized Upfront Payments (Receipts) | Unrealized Appreciation (Depreciation) | Rating | |||||||||||||||||||||||||||
OTC Swap Contracts | ||||||||||||||||||||||||||||||||||||
Contracts to Buy Protection | ||||||||||||||||||||||||||||||||||||
Single Name | ||||||||||||||||||||||||||||||||||||
Chesapeake Energy Corp. | (5.00 | )% | Quarterly | CITI | 9/20/20 | $ | 25,000,000 | $ | 15,461,271 | $ | 5,622,500 | $ | 9,838,771 | |||||||||||||||||||||||
|
| |||||||||||||||||||||||||||||||||||
See Note 9 regarding other derivative information.
See Abbreviations on page 127.
| franklintempleton.com | The accompanying notes are an integral part of these financial statements. | Semiannual Report | 75 | ||
FRANKLIN CUSTODIAN FUNDS
Financial Highlights
Franklin U.S. Government Securities Fund
| Six Months Ended March 31, 2020 | Year Ended September 30, | |||||||||||
| (unaudited) | 2019 | 2018a | ||||||||||
Class A | ||||||||||||
Per share operating performance (for a share outstanding throughout the period) | ||||||||||||
Net asset value, beginning of period | $ 6.07 | $ 5.86 | $ 5.89 | |||||||||
|
| |||||||||||
Income from investment operationsb: | ||||||||||||
Net investment incomec | 0.06 | 0.14 | 0.01 | |||||||||
Net realized and unrealized gains (losses) | 0.10 | 0.25 | (0.02) | |||||||||
|
| |||||||||||
Total from investment operations | 0.16 | 0.39 | (0.01) | |||||||||
|
| |||||||||||
Less distributions from: | ||||||||||||
Net investment income | (0.08 | ) | (0.18 | ) | (0.02) | |||||||
|
| |||||||||||
Net asset value, end of period | $ 6.15 | $ 6.07 | $ 5.86 | |||||||||
|
| |||||||||||
Total returnd | 2.71% | 6.70% | (0.23)% | |||||||||
Ratios to average net assetse | ||||||||||||
Expenses before waiver and payments by affiliates | 0.89% | 0.89% | 0.86% | |||||||||
Expenses net of waiver and payments by affiliatesf | 0.88% | 0.88% | 0.86%g | |||||||||
Net investment income | 1.99% | 2.36% | 2.40% | |||||||||
Supplemental data | ||||||||||||
Net assets, end of period (000’s) | $649,729 | $336,646 | $4,472 | |||||||||
Portfolio turnover rate | 25.67% | 41.34% | 44.67% | |||||||||
Portfolio turnover rate excluding mortgage dollar rollsh | 25.67% | 41.34% | 44.67% | |||||||||
aFor the period September 10, 2018 (effective date) to September 30, 2018.
bThe amount shown for a share outstanding throughout the period may not correlate with the Statement of Operations for the period due to the timing of sales and repurchases of the Fund’s shares in relation to income earned and/or fluctuating fair value of the investments of the Fund.
cBased on average daily shares outstanding.
dTotal return does not reflect sales commissions or contingent deferred sales charges, if applicable, and is not annualized for periods less than one year.
eRatios are annualized for periods less than one year.
fBenefit of expense reduction rounds to less than 0.01%.
gBenefit of waiver and payments by affiliates rounds to less than 0.01%.
hSee Note 1(j) regarding mortgage dollar rolls.
76 | Semiannual Report | The accompanying notes are an integral part of these financial statements. | franklintempleton.com | ||
FRANKLIN CUSTODIAN FUNDS
FINANCIAL HIGHLIGHTS
Franklin U.S. Government Securities Fund(continued)
| Six Months Ended | ||||||||||||||||||||||||
| March 31, 2020 | Year Ended September 30, | |||||||||||||||||||||||
| (unaudited) | 2019 | 2018 | 2017 | 2016 | 2015 | |||||||||||||||||||
Class A1 | ||||||||||||||||||||||||
Per share operating performance (for a share outstanding throughout the period) | ||||||||||||||||||||||||
Net asset value, beginning of period | $ 6.07 | $ 5.85 | $ 6.13 | $ 6.35 | $ 6.40 | $ 6.48 | ||||||||||||||||||
|
| |||||||||||||||||||||||
Income from investment operationsa: | ||||||||||||||||||||||||
Net investment incomeb | 0.06 | 0.15 | 0.15 | 0.13 | 0.14 | 0.15 | ||||||||||||||||||
Net realized and unrealized gains (losses) | 0.12 | 0.25 | (0.25 | ) | (0.16 | ) | 0.01 | (0.02) | ||||||||||||||||
|
| |||||||||||||||||||||||
Total from investment operations | 0.18 | 0.40 | (0.10 | ) | (0.03 | ) | 0.15 | 0.13 | ||||||||||||||||
|
| |||||||||||||||||||||||
Less distributions from: | ||||||||||||||||||||||||
Net investment income | (0.09 | ) | (0.18 | ) | (0.18 | ) | (0.19 | ) | (0.20) | (0.21) | ||||||||||||||
|
| |||||||||||||||||||||||
Net asset value, end of period | $ 6.16 | $ 6.07 | $ 5.85 | $ 6.13 | $ 6.35 | $ 6.40 | ||||||||||||||||||
|
| |||||||||||||||||||||||
Total returnc | 2.92% | 6.94% | (1.60)% | (0.45)% | 2.35% | 2.07% | ||||||||||||||||||
Ratios to average net assetsd | ||||||||||||||||||||||||
Expenses before waiver and payments by affiliates | 0.79% | 0.79% | 0.76% | 0.79% | 0.76% | 0.76% | ||||||||||||||||||
Expenses net of waiver and payments by affiliatese | 0.78% | 0.78% | 0.76% | f | 0.79% | f | 0.76%f | 0.76% | f | |||||||||||||||
Net investment income | 2.09% | 2.46% | 2.50% | 2.17% | 2.21% | 2.28% | ||||||||||||||||||
Supplemental data | ||||||||||||||||||||||||
Net assets, end of period (000’s) | $2,777,388 | $2,885,194 | $3,099,373 | $3,581,769 | $4,235,819 | $4,167,639 | ||||||||||||||||||
Portfolio turnover rate | 25.67% | 41.34% | 44.67% | 86.72% | 92.18% | 69.10% | ||||||||||||||||||
Portfolio turnover rate excluding mortgage dollar rollsg | 25.67% | 41.34% | 44.67% | 86.72% | 92.18% | 58.70% | ||||||||||||||||||
aThe amount shown for a share outstanding throughout the period may not correlate with the Statement of Operations for the period due to the timing of sales and repurchases of the Fund’s shares in relation to income earned and/or fluctuating fair value of the investments of the Fund.
bBased on average daily shares outstanding.
cTotal return does not reflect sales commissions or contingent deferred sales charges, if applicable, and is not annualized for periods less than one year.
dRatios are annualized for periods less than one year.
eBenefit of expense reduction rounds to less than 0.01%.
fBenefit of waiver and payments by affiliates rounds to less than 0.01%.
gSee Note 1(j) regarding mortgage dollar rolls.
| franklintempleton.com | The accompanying notes are an integral part of these financial statements. | Semiannual Report | 77 | ||
FRANKLIN CUSTODIAN FUNDS
FINANCIAL HIGHLIGHTS
Franklin U.S. Government Securities Fund(continued)
| Six Months Ended | ||||||||||||||||||||||||
| March 31, 2020 | Year Ended September 30, | |||||||||||||||||||||||
| (unaudited) | 2019 | 2018 | 2017 | 2016 | 2015 | |||||||||||||||||||
Class C | ||||||||||||||||||||||||
Per share operating performance (for a share outstanding throughout the period) | ||||||||||||||||||||||||
Net asset value, beginning of period | $ 6.03 | $ 5.81 | $ 6.08 | $ 6.30 | $ 6.36 | $ 6.44 | ||||||||||||||||||
|
| |||||||||||||||||||||||
Income from investment operationsa: | ||||||||||||||||||||||||
Net investment incomeb | 0.05 | 0.12 | 0.12 | 0.10 | 0.11 | 0.11 | ||||||||||||||||||
Net realized and unrealized gains (losses) | 0.10 | 0.25 | (0.24 | ) | (0.16 | ) | —c | (0.01) | ||||||||||||||||
|
| |||||||||||||||||||||||
Total from investment operations | 0.15 | 0.37 | (0.12 | ) | (0.06 | ) | 0.11 | 0.10 | ||||||||||||||||
|
| |||||||||||||||||||||||
Less distributions from: | ||||||||||||||||||||||||
Net investment income | (0.07 | ) | (0.15 | ) | (0.15 | ) | (0.16 | ) | (0.17) | (0.18) | ||||||||||||||
|
| |||||||||||||||||||||||
Net asset value, end of period | $ 6.11 | $ 6.03 | $ 5.81 | $ 6.08 | $ 6.30 | $ 6.36 | ||||||||||||||||||
|
| |||||||||||||||||||||||
Total returnd | 2.52% | 6.45% | (1.94)% | (0.96)% | 1.70% | 1.57% | ||||||||||||||||||
Ratios to average net assetse | ||||||||||||||||||||||||
Expenses before waiver and payments by affiliates | 1.29% | 1.29% | 1.26% | 1.29% | 1.26% | 1.26% | ||||||||||||||||||
Expenses net of waiver and payments by affiliatesf | 1.28% | 1.28% | 1.26% | g | 1.29% | g | 1.26%g | 1.26% | g | |||||||||||||||
Net investment income | 1.59% | 1.96% | 2.00% | 1.67% | 1.71% | 1.78% | ||||||||||||||||||
Supplemental data | ||||||||||||||||||||||||
Net assets, end of period (000’s) | $380,274 | $389,021 | $571,525 | $797,394 | $1,034,410 | $1,040,294 | ||||||||||||||||||
Portfolio turnover rate | 25.67% | 41.34% | 44.67% | 86.72% | 92.18% | 69.10% | ||||||||||||||||||
Portfolio turnover rate excluding mortgage dollar rollsh | 25.67% | 41.34% | 44.67% | 86.72% | 92.18% | 58.70% | ||||||||||||||||||
aThe amount shown for a share outstanding throughout the period may not correlate with the Statement of Operations for the period due to the timing of sales and repurchases of the Fund’s shares in relation to income earned and/or fluctuating fair value of the investments of the Fund.
bBased on average daily shares outstanding.
cAmount rounds to less than $0.01 per share.
dTotal return does not reflect sales commissions or contingent deferred sales charges, if applicable, and is not annualized for periods less than one year.
eRatios are annualized for periods less than one year.
fBenefit of expense reduction rounds to less than 0.01%.
gBenefit of waiver and payments by affiliates rounds to less than 0.01%.
hSee Note 1(j) regarding mortgage dollar rolls.
78 | Semiannual Report | The accompanying notes are an integral part of these financial statements. | franklintempleton.com | ||
FRANKLIN CUSTODIAN FUNDS
FINANCIAL HIGHLIGHTS
Franklin U.S. Government Securities Fund(continued)
| Six Months Ended | ||||||||||||||||||||||||
| March 31, 2020 | Year Ended September 30, | |||||||||||||||||||||||
| (unaudited) | 2019 | 2018 | 2017 | 2016 | 2015 | |||||||||||||||||||
Class R | ||||||||||||||||||||||||
Per share operating performance (for a share outstanding throughout the period) | ||||||||||||||||||||||||
Net asset value, beginning of period | $ 6.07 | $ 5.85 | $ 6.12 | $ 6.34 | $ 6.40 | $ 6.48 | ||||||||||||||||||
|
| |||||||||||||||||||||||
Income from investment operationsa: | ||||||||||||||||||||||||
Net investment incomeb | 0.05 | 0.13 | 0.13 | 0.11 | 0.12 | 0.13 | ||||||||||||||||||
Net realized and unrealized gains (losses) | 0.11 | 0.25 | (0.24 | ) | (0.16 | ) | —c | (0.02) | ||||||||||||||||
|
| |||||||||||||||||||||||
Total from investment operations | 0.16 | 0.38 | (0.11 | ) | (0.05 | ) | 0.12 | 0.11 | ||||||||||||||||
|
| |||||||||||||||||||||||
Less distributions from: | ||||||||||||||||||||||||
Net investment income | (0.08 | ) | (0.16 | ) | (0.16 | ) | (0.17 | ) | (0.18) | (0.19) | ||||||||||||||
|
| |||||||||||||||||||||||
Net asset value, end of period | $ 6.15 | $ 6.07 | $ 5.85 | $ 6.12 | $ 6.34 | $ 6.40 | ||||||||||||||||||
|
| |||||||||||||||||||||||
Total returnd | 2.58% | 6.58% | (1.78)% | (0.81)% | 1.84% | 1.71% | ||||||||||||||||||
Ratios to average net assetse | ||||||||||||||||||||||||
Expenses before waiver and payments by affiliates | 1.13% | 1.14% | 1.11% | 1.13% | 1.11% | 1.11% | ||||||||||||||||||
Expenses net of waiver and payments by affiliatesf | 1.12% | 1.13% | 1.11% | g | 1.13% | g | 1.11%g | 1.11% | g | |||||||||||||||
Net investment income | 1.75% | 2.11% | 2.15% | 1.83% | 1.86% | 1.93% | ||||||||||||||||||
Supplemental data | ||||||||||||||||||||||||
Net assets, end of period (000’s) | $35,356 | $32,906 | $31,144 | $38,363 | $59,785 | $64,689 | ||||||||||||||||||
Portfolio turnover rate | 25.67% | 41.34% | 44.67% | 86.72% | 92.18% | 69.10% | ||||||||||||||||||
Portfolio turnover rate excluding mortgage dollar rollsh | 25.67% | 41.34% | 44.67% | 86.72% | 92.18% | 58.70% | ||||||||||||||||||
aThe amount shown for a share outstanding throughout the period may not correlate with the Statement of Operations for the period due to the timing of sales and repurchases of the Fund’s shares in relation to income earned and/or fluctuating fair value of the investments of the Fund.
bBased on average daily shares outstanding.
cAmount rounds to less than $0.01 per share.
dTotal return is not annualized for periods less than one year.
eRatios are annualized for periods less than one year.
fBenefit of expense reduction rounds to less than 0.01%.
gBenefit of waiver and payments by affiliates rounds to less than 0.01%.
hSee Note 1(j) regarding mortgage dollar rolls.
| franklintempleton.com | The accompanying notes are an integral part of these financial statements. | Semiannual Report | 79 | ||
FRANKLIN CUSTODIAN FUNDS
FINANCIAL HIGHLIGHTS
Franklin U.S. Government Securities Fund(continued)
| Six Months Ended | ||||||||||||||||||||||||
| March 31, 2020 | Year Ended September 30, | |||||||||||||||||||||||
| (unaudited) | 2019 | 2018 | 2017 | 2016 | 2015 | |||||||||||||||||||
Class R6 | ||||||||||||||||||||||||
Per share operating performance (for a share outstanding throughout the period) | ||||||||||||||||||||||||
Net asset value, beginning of period | $ 6.10 | $ 5.87 | $ 6.15 | $ 6.37 | $ 6.42 | $ 6.50 | ||||||||||||||||||
|
| |||||||||||||||||||||||
Income from investment operationsa: | ||||||||||||||||||||||||
Net investment incomeb | 0.07 | 0.16 | 0.17 | 0.15 | 0.16 | 0.17 | ||||||||||||||||||
Net realized and unrealized gains (losses) | 0.10 | 0.27 | (0.25 | ) | (0.16 | ) | 0.01 | (0.02 | ) | |||||||||||||||
|
| |||||||||||||||||||||||
Total from investment operations | 0.17 | 0.43 | (0.08 | ) | (0.01 | ) | 0.17 | 0.15 | ||||||||||||||||
|
| |||||||||||||||||||||||
Less distributions from: | ||||||||||||||||||||||||
Net investment income | (0.09 | ) | (0.20 | ) | (0.20 | ) | (0.21 | ) | (0.22 | ) | (0.23 | ) | ||||||||||||
|
| |||||||||||||||||||||||
Net asset value, end of period | $ 6.18 | $ 6.10 | $ 5.87 | $ 6.15 | $ 6.37 | $ 6.42 | ||||||||||||||||||
|
| |||||||||||||||||||||||
Total returnc | 2.88% | 7.39% | (1.33)% | (0.16)% | 2.63% | 2.35% | ||||||||||||||||||
Ratios to average net assetsd | ||||||||||||||||||||||||
Expenses before waiver and payments by affiliates | 0.53% | 0.51% | 0.49% | 0.48% | 0.48% | 0.47% | ||||||||||||||||||
Expenses net of waiver and payments by affiliatese | 0.51% | 0.50% | 0.48% | 0.48% | f | 0.48% | f | 0.47% | f | |||||||||||||||
Net investment income | 2.36% | 2.74% | 2.78% | 2.48% | 2.49% | 2.57% | ||||||||||||||||||
Supplemental data | ||||||||||||||||||||||||
Net assets, end of period (000’s) | $333,402 | $573,957 | $694,813 | $446,174 | $624,619 | $375,644 | ||||||||||||||||||
Portfolio turnover rate | 25.67% | 41.34% | 44.67% | 86.72% | 92.18% | 69.10% | ||||||||||||||||||
Portfolio turnover rate excluding mortgage dollar rollsg | 25.67% | 41.34% | 44.67% | 86.72% | 92.18% | 58.70% | ||||||||||||||||||
aThe amount shown for a share outstanding throughout the period may not correlate with the Statement of Operations for the period due to the timing of sales and repurchases of the Fund’s shares in relation to income earned and/or fluctuating fair value of the investments of the Fund.
bBased on average daily shares outstanding.
cTotal return is not annualized for periods less than one year.
dRatios are annualized for periods less than one year.
eBenefit of expense reduction rounds to less than 0.01%.
fBenefit of waiver and payments by affiliates rounds to less than 0.01%.
gSee Note 1(j) regarding mortgage dollar rolls.
80 | Semiannual Report | The accompanying notes are an integral part of these financial statements. | franklintempleton.com | ||
FRANKLIN CUSTODIAN FUNDS
FINANCIAL HIGHLIGHTS
Franklin U.S. Government Securities Fund(continued)
| Six Months Ended | ||||||||||||||||||||||||
| March 31, 2020 | Year Ended September 30, | |||||||||||||||||||||||
| (unaudited) | 2019 | 2018 | 2017 | 2016 | 2015 | |||||||||||||||||||
Advisor Class | ||||||||||||||||||||||||
Per share operating performance (for a share outstanding throughout the period) | ||||||||||||||||||||||||
Net asset value, beginning of period | $ 6.10 | $ 5.87 | $ 6.15 | $ 6.37 | $ 6.42 | $ 6.50 | ||||||||||||||||||
|
| |||||||||||||||||||||||
Income from investment operationsa: | ||||||||||||||||||||||||
Net investment incomeb | 0.07 | 0.16 | 0.16 | 0.15 | 0.15 | 0.16 | ||||||||||||||||||
Net realized and unrealized gains (losses) | 0.10 | 0.26 | (0.25 | ) | (0.17 | ) | 0.01 | (0.02 | ) | |||||||||||||||
|
| |||||||||||||||||||||||
Total from investment operations | 0.17 | 0.42 | (0.09 | ) | (0.02 | ) | 0.16 | 0.14 | ||||||||||||||||
|
| |||||||||||||||||||||||
Less distributions from: | ||||||||||||||||||||||||
Net investment income | (0.09 | ) | (0.19 | ) | (0.19 | ) | (0.20 | ) | (0.21 | ) | (0.22 | ) | ||||||||||||
|
| |||||||||||||||||||||||
Net asset value, end of period | $ 6.18 | $ 6.10 | $ 5.87 | $ 6.15 | $ 6.37 | $ 6.42 | ||||||||||||||||||
|
| |||||||||||||||||||||||
Total returnc | 2.99% | 7.08% | (1.45)% | (0.30)% | 2.49% | 2.21% | ||||||||||||||||||
Ratios to average net assetsd | ||||||||||||||||||||||||
Expenses before waiver and payments by affiliates | 0.64% | 0.64% | 0.61% | 0.64% | 0.61% | 0.61% | ||||||||||||||||||
Expenses net of waiver and payments by affiliatese | 0.63% | 0.63% | 0.61% | f | 0.64% | f | 0.61% | f | 0.61% | f | ||||||||||||||
Net investment income | 2.24% | 2.61% | 2.65% | 2.32% | 2.36% | 2.43% | ||||||||||||||||||
Supplemental data | ||||||||||||||||||||||||
Net assets, end of period (000’s) | $988,271 | $946,318 | $720,281 | $854,640 | $718,975 | $622,339 | ||||||||||||||||||
Portfolio turnover rate | 25.67% | 41.34% | 44.67% | 86.72% | 92.18% | 69.10% | ||||||||||||||||||
Portfolio turnover rate excluding mortgage dollar rollsg | 25.67% | 41.34% | 44.67% | 86.72% | 92.18% | 58.70% | ||||||||||||||||||
aThe amount shown for a share outstanding throughout the period may not correlate with the Statement of Operations for the period due to the timing of
sales and repurchases of the Fund’s shares in relation to income earned and/or fluctuating fair value of the investments of the Fund.
bBased on average daily shares outstanding.
cTotal return is not annualized for periods less than one year.
dRatios are annualized for periods less than one year.
eBenefit of expense reduction rounds to less than 0.01%.
fBenefit of waiver and payments by affiliates rounds to less than 0.01%.
gSee Note 1(j) regarding mortgage dollar rolls.
| franklintempleton.com | The accompanying notes are an integral part of these financial statements. | Semiannual Report | 81 | ||
FRANKLIN CUSTODIAN FUNDS
Statement of Investments, March 31, 2020 (unaudited)
Franklin U.S. Government Securities Fund
Principal Amount | Value | |||||||
Mortgage-Backed Securities 96.5% | ||||||||
Government National Mortgage Association (GNMA) Fixed Rate 96.5% | ||||||||
GNMA I SF 30 Year, 3.50%, 4/15/43 - 5/15/43 | $ 22,003,848 | $ 23,977,196 | ||||||
GNMA I SF 30 Year, 4.00%, 10/15/40 - 1/15/45 | 46,114,170 | 50,323,931 | ||||||
GNMA I SF 30 Year, 4.00%, 1/15/45 - 8/15/46 | 38,219,772 | 41,703,890 | ||||||
GNMA I SF 30 Year, 4.50%, 2/15/39 - 11/15/39 | 43,603,183 | 48,792,740 | ||||||
GNMA I SF 30 Year, 4.50%, 12/15/39 - 6/15/40 | 44,398,170 | 49,579,152 | ||||||
GNMA I SF 30 Year, 4.50%, 6/15/40 - 7/15/40 | 37,093,513 | 41,251,857 | ||||||
GNMA I SF 30 Year, 4.50%, 7/15/40 - 6/15/41 | 40,054,373 | 44,689,470 | ||||||
GNMA I SF 30 Year, 5.00%, 2/15/33 - 3/15/34 | 45,401,502 | 50,375,050 | ||||||
GNMA I SF 30 Year, 5.00%, 3/15/34 - 8/15/39 | 36,934,080 | 41,112,605 | ||||||
GNMA I SF 30 Year, 5.00%, 8/15/39 - 10/15/39 | 38,836,758 | 43,317,283 | ||||||
GNMA I SF 30 Year, 5.00%, 10/15/39 - 1/15/40 | 44,790,783 | 49,972,366 | ||||||
GNMA I SF 30 Year, 5.00%, 11/15/39 | 17,631,530 | 19,688,216 | ||||||
GNMA I SF 30 Year, 5.00%, 1/15/40 - 5/15/40 | 45,464,636 | 50,695,517 | ||||||
GNMA I SF 30 Year, 5.00%, 5/15/40 - 9/15/40 | 45,927,016 | 51,225,021 | ||||||
GNMA I SF 30 Year, 5.50%, 5/15/28 - 7/15/33 | 46,084,705 | 51,577,928 | ||||||
GNMA I SF 30 Year, 5.50%, 7/15/33 - 12/15/38 | 45,047,551 | 50,919,862 | ||||||
GNMA I SF 30 Year, 5.50%, 12/15/38 - 2/15/40 | 24,118,849 | 27,334,445 | ||||||
GNMA I SF 30 Year, 6.00%, 10/15/23 - 1/15/36 | 45,769,803 | 51,449,928 | ||||||
GNMA I SF 30 Year, 6.00%, 1/15/36 - 11/15/38 | 44,241,192 | 50,268,705 | ||||||
GNMA I SF 30 Year, 6.00%, 11/15/38 - 12/15/39 | 12,326,791 | 13,991,279 | ||||||
GNMA I SF 30 Year, 6.50%, 5/15/23 - 8/15/37 | 30,667,146 | 34,647,194 | ||||||
GNMA I SF 30 Year, 7.00%, 4/15/22 - 9/15/32 | 20,489,118 | 23,119,166 | ||||||
GNMA I SF 30 Year, 7.25%, 12/15/25 - 1/15/26 | 63,877 | 65,314 | ||||||
GNMA I SF 30 Year, 7.50%, 1/15/22 - 8/15/33 | 5,083,680 | 5,585,556 | ||||||
GNMA I SF 30 Year, 7.70%, 1/15/21 - 10/15/21 | 7,268 | 7,293 | ||||||
GNMA I SF 30 Year, 8.00%, 4/15/21 - 9/15/30 | 1,608,484 | 1,654,805 | ||||||
GNMA I SF 30 Year, 8.50%, 4/15/21 - 5/15/25 | 209,167 | 213,273 | ||||||
GNMA I SF 30 Year, 9.00%, 6/15/20 - 7/15/23 | 102,569 | 103,917 | ||||||
GNMA I SF 30 Year, 9.50%, 5/15/20 - 8/15/22 | 62,884 | 63,214 | ||||||
GNMA I SF 30 Year, 10.00%, 6/15/20 - 3/15/25 | 24,909 | 25,016 | ||||||
GNMA I SF 30 Year, 10.50%, 8/15/20 - 1/15/21 | 791 | 793 | ||||||
GNMA II SF 30 Year, 3.00%, 10/20/44 | 42,998,116 | 46,331,675 | ||||||
GNMA II SF 30 Year, 3.00%, 12/20/44 | 31,486,003 | 33,870,779 | ||||||
GNMA II SF 30 Year, 3.00%, 2/20/45 - 6/20/47 | 34,889,340 | 37,464,398 | ||||||
GNMA II SF 30 Year, 3.00%, 5/20/45 | 46,699,600 | 50,243,558 | ||||||
GNMA II SF 30 Year, 3.00%, 6/20/45 | 18,537,122 | 19,943,072 | ||||||
GNMA II SF 30 Year, 3.00%, 4/20/46 | 62,232,954 | 66,676,923 | ||||||
GNMA II SF 30 Year, 3.00%, 7/20/47 | 195,340,997 | 209,169,424 | ||||||
GNMA II SF 30 Year, 3.00%, 9/20/47 | 54,675,550 | 58,032,116 | ||||||
GNMA II SF 30 Year, 3.00%, 10/20/47 | 94,629,049 | 100,438,385 | ||||||
GNMA II SF 30 Year, 3.00%, 11/20/47 - 1/20/50 | 29,997,465 | 32,006,387 | ||||||
GNMA II SF 30 Year, 3.00%, 1/20/48 | 28,958,921 | 30,933,294 | ||||||
GNMA II SF 30 Year, 3.00%, 2/20/48 | 48,451,888 | 51,732,695 | ||||||
GNMA II SF 30 Year, 3.00%, 4/20/48 | 17,019,199 | 18,064,019 | ||||||
GNMA II SF 30 Year, 3.00%, 8/20/49 | 42,669,936 | 45,289,470 | ||||||
GNMA II SF 30 Year, 3.00%, 11/20/49 | 25,684,156 | 27,260,922 | ||||||
82 | Semiannual Report | franklintempleton.com | ||
FRANKLIN CUSTODIAN FUNDS
STATEMENT OF INVESTMENTS (UNAUDITED)
Franklin U.S. Government Securities Fund(continued)
Principal Amount | Value | |||||||
Mortgage-Backed Securities(continued) | ||||||||
Government National Mortgage Association (GNMA) Fixed Rate(continued) | ||||||||
GNMA II SF 30 Year, 3.00%, 12/20/49 | $102,657,479 | $ 108,959,687 | ||||||
GNMA II SF 30 Year, 3.00%, 2/20/50 | 103,855,015 | 110,230,740 | ||||||
GNMA II SF 30 Year, 3.50%, 10/20/40 - 2/20/43 | 47,782,751 | 51,235,889 | ||||||
GNMA II SF 30 Year, 3.50%, 7/20/42 | 39,342,519 | 42,136,218 | ||||||
GNMA II SF 30 Year, 3.50%, 9/20/42 | 90,976,924 | 97,437,335 | ||||||
GNMA II SF 30 Year, 3.50%, 10/20/42 | 18,754,661 | 20,086,479 | ||||||
GNMA II SF 30 Year, 3.50%, 2/20/43 - 1/20/49 | 9,763,079 | 10,458,460 | ||||||
GNMA II SF 30 Year, 3.50%, 4/20/43 | 19,095,841 | 20,451,974 | ||||||
GNMA II SF 30 Year, 3.50%, 5/20/43 | 26,100,975 | 27,953,175 | ||||||
GNMA II SF 30 Year, 3.50%, 6/20/43 | 29,957,629 | 32,084,487 | ||||||
GNMA II SF 30 Year, 3.50%, 8/20/43 | 20,898,979 | 22,349,713 | ||||||
GNMA II SF 30 Year, 3.50%, 9/20/47 | 521,341,232 | 557,268,696 | ||||||
GNMA II SF 30 Year, 3.50%, 11/20/47 | 515,903,043 | 548,904,040 | ||||||
GNMA II SF 30 Year, 3.50%, 11/20/49 | 90,649,390 | 95,766,500 | ||||||
GNMA II SF 30 Year, 3.50%, 2/20/50 | 101,779,616 | 107,784,732 | ||||||
GNMA II SF 30 Year, 4.00%, 5/20/40 - 2/20/44 | 32,858,518 | 35,913,509 | ||||||
GNMA II SF 30 Year, 4.00%, 11/20/40. | 25,420,826 | 27,761,493 | ||||||
GNMA II SF 30 Year, 4.00%, 1/20/41 | 16,746,256 | 18,289,380 | ||||||
GNMA II SF 30 Year, 4.00%, 7/20/41 | 20,189,068 | 22,048,841 | ||||||
GNMA II SF 30 Year, 4.00%, 9/20/41 | 24,056,211 | 26,270,836 | ||||||
GNMA II SF 30 Year, 4.00%, 10/20/41 | 29,595,097 | 32,320,793 | ||||||
GNMA II SF 30 Year, 4.00%, 11/20/41 | 27,298,251 | 29,815,821 | ||||||
GNMA II SF 30 Year, 4.00%, 2/20/44 | 17,491,066 | 19,089,045 | ||||||
aGNMA II SF 30 Year, 4.00%, 5/20/47 | 132,493,164 | 142,242,840 | ||||||
GNMA II SF 30 Year, 4.00%, 7/20/49 | 84,040,715 | 89,337,112 | ||||||
GNMA II SF 30 Year, 4.00%, 11/20/49 | 54,493,605 | 59,188,278 | ||||||
GNMA II SF 30 Year, 4.00%, 11/20/49 | 149,514,554 | 159,244,314 | ||||||
GNMA II SF 30 Year, 4.00%, 12/20/49 | 20,342,964 | 22,095,660 | ||||||
GNMA II SF 30 Year, 4.00%, 12/20/49 | 21,718,658 | 23,589,866 | ||||||
GNMA II SF 30 Year, 4.00%, 12/20/49 | 185,766,809 | 199,203,540 | ||||||
GNMA II SF 30 Year, 4.50%, 5/20/33 - 8/20/42 | 42,771,039 | 47,118,024 | ||||||
GNMA II SF 30 Year, 4.50%, 12/20/39 | 16,965,366 | 18,726,076 | ||||||
GNMA II SF 30 Year, 4.50%, 5/20/41 | 22,158,965 | 24,457,654 | ||||||
GNMA II SF 30 Year, 4.50%, 6/20/41 | 26,623,669 | 29,382,729 | ||||||
GNMA II SF 30 Year, 4.50%, 7/20/41 | 29,397,385 | 32,447,740 | ||||||
GNMA II SF 30 Year, 4.50%, 9/20/41 | 39,726,634 | 43,843,217 | ||||||
GNMA II SF 30 Year, 4.50%, 10/20/41 | 29,334,317 | 32,375,343 | ||||||
GNMA II SF 30 Year, 4.50%, 2/20/44 | 15,661,466 | 17,162,239 | ||||||
GNMA II SF 30 Year, 5.00%, 7/20/33 - 5/20/40 | 44,456,047 | 49,331,556 | ||||||
GNMA II SF 30 Year, 5.00%, 9/20/33 | 16,705,916 | 18,565,741 | ||||||
GNMA II SF 30 Year, 5.00%, 6/20/40 - 9/20/41 | 12,752,588 | 14,136,736 | ||||||
GNMA II SF 30 Year, 5.50%, 6/20/34 - 6/20/35 | 44,367,721 | 50,064,704 | ||||||
GNMA II SF 30 Year, 5.50%, 7/20/35 - 4/20/40 | 19,781,714 | 22,221,815 | ||||||
GNMA II SF 30 Year, 6.00%, 10/20/23 - 8/20/38 | 44,071,671 | 50,429,435 | ||||||
GNMA II SF 30 Year, 6.00%, 9/20/38 - 7/20/39 | 4,550,615 | 5,198,003 | ||||||
GNMA II SF 30 Year, 6.50%, 6/20/24 - 1/20/39 | 16,344,007 | 19,390,577 | ||||||
| franklintempleton.com | Semiannual Report | 83 | ||
FRANKLIN CUSTODIAN FUNDS
STATEMENT OF INVESTMENTS (UNAUDITED)
Franklin U.S. Government Securities Fund(continued)
Principal Amount | Value | |||||||
Mortgage-Backed Securities(continued) | ||||||||
Government National Mortgage Association (GNMA) Fixed Rate(continued) | ||||||||
GNMA II SF 30 Year, 7.00%, 2/20/28 - 7/20/33 | $ 4,244,256 | $ 5,118,678 | ||||||
GNMA II SF 30 Year, 7.50%, 10/20/22 - 4/20/32 | 738,670 | 844,695 | ||||||
GNMA II SF 30 Year, 8.00%, 5/20/24 - 6/20/30 | 378,064 | 441,003 | ||||||
GNMA II SF 30 Year, 8.50%, 7/20/21 - 6/20/25 | 34,192 | 34,631 | ||||||
GNMA II SF 30 Year, 9.00%, 10/20/21 - 11/20/21 | 6,345 | 6,432 | ||||||
GNMA II SF 30 Year, 9.50%, 11/20/20 - 4/20/25 | 15,811 | 15,929 | ||||||
GNMA II SF 30 Year, 10.00%, 11/20/20 - 3/20/21 | 7,837 | 7,911 | ||||||
GNMA II SF 30 Year, 10.50%, 6/20/20 - 1/20/21 | 4,618 | 4,636 | ||||||
GNMA II SF 30 Year, 11.00%, 1/20/21 | 607 | 608 | ||||||
|
| |||||||
Total Mortgage-Backed Securities (Cost $4,795,611,805) | 4,986,034,664 | |||||||
|
| |||||||
U.S. Government and Agency Securities (Cost $19,117,277) 0.5% | ||||||||
U.S. Treasury Bond, 4.75%, 2/15/37 | 14,500,000 | 23,164,883 | ||||||
|
| |||||||
Total Investments before Short Term Investments | 5,009,199,547 | |||||||
| Shares | ||||||||
|
| |||||||
Short Term Investments (Cost $259,247,829) 5.0% | ||||||||
Money Market Funds 5.0% | ||||||||
b,cInstitutional Fiduciary Trust Money Market Portfolio, 0.32% | 259,247,829 | 259,247,829 | ||||||
|
| |||||||
Total Investments (Cost $5,073,976,911) 102.0% | 5,268,447,376 | |||||||
Other Assets, less Liabilities (2.0)% | (104,027,632 | ) | ||||||
|
| |||||||
Net Assets 100.0% | $5,164,419,744 | |||||||
|
| |||||||
See Abbreviations on page 127.
aA portion or all of the security purchased on a delayed delivery basis. See Note 1(d).
bSee Note 3(f) regarding investments in affiliated management investment companies.
cThe rate shown is the annualizedseven-day effective yield at period end.
84 | Semiannual Report | The accompanying notes are an integral part of these financial statements | franklintempleton.com | ||
FRANKLIN CUSTODIAN FUNDS
Financial Highlights
Franklin Utilities Fund
| Six Months Ended | ||||||||||||
| March 31, 2020 | Year Ended September 30, | |||||||||||
| (unaudited) | 2019 | 2018a | ||||||||||
Class A | ||||||||||||
Per share operating performance (for a share outstanding throughout the period) | ||||||||||||
Net asset value, beginning of period | $22.53 | $18.66 | $19.16 | |||||||||
|
| |||||||||||
Income from investment operationsb: | ||||||||||||
Net investment incomec | 0.26 | 0.53 | 0.02 | |||||||||
Net realized and unrealized gains (losses) | (3.48) | 4.41 | (0.52) | |||||||||
|
| |||||||||||
Total from investment operations | (3.22) | 4.94 | (0.50) | |||||||||
|
| |||||||||||
Less distributions from: | ||||||||||||
Net investment income | (0.27) | (0.49) | — | |||||||||
Net realized gains | (0.35) | (0.58) | — | |||||||||
|
| |||||||||||
Total distributions | (0.62) | (1.07) | — | |||||||||
|
| |||||||||||
Net asset value, end of period | $18.69 | $22.53 | $18.66 | |||||||||
|
| |||||||||||
Total returnd | (14.62)% | 27.43% | (2.61)% | |||||||||
Ratios to average net assetse | ||||||||||||
Expensesf | 0.81% | 0.83% | 0.84% | |||||||||
Net investment income | 2.35% | 2.51% | 2.62% | |||||||||
Supplemental data | ||||||||||||
Net assets, end of period (000’s) | $594,319 | $521,782 | $3,536 | |||||||||
Portfolio turnover rate | 8.23% | 7.90% | 4.58% | |||||||||
aFor the period September 10, 2018 (effective date) to September 30, 2018.
bThe amount shown for a share outstanding throughout the period may not correlate with the Statement of Operations for the period due to the timing of sales and repurchases of the Fund’s shares in relation to income earned and/or fluctuating fair value of the investments of the Fund.
cBased on average daily shares outstanding.
dTotal return does not reflect sales commissions or contingent deferred sales charges, if applicable, and is not annualized for periods less than one year.
eRatios are annualized for periods less than one year.
fBenefit of waiver and payments by affiliates and expense reduction rounds to less than 0.01%.
| franklintempleton.com | The accompanying notes are an integral part of these financial statements. | Semiannual Report | 85 | ||
FRANKLIN CUSTODIAN FUNDS
FINANCIAL HIGHLIGHTS
Franklin Utilities Fund(continued)
| Six Months Ended | ||||||||||||||||||||||||
| March 31, 2020 | Year Ended September 30, | |||||||||||||||||||||||
| (unaudited) | 2019 | 2018 | 2017 | 2016 | 2015 | |||||||||||||||||||
Class A1 | ||||||||||||||||||||||||
Per share operating performance (for a share outstanding throughout the period) | ||||||||||||||||||||||||
Net asset value, beginning of period | $22.54 | $18.66 | $19.18 | $17.85 | $16.08 | $16.58 | ||||||||||||||||||
Income from investment operationsa: | ||||||||||||||||||||||||
Net investment incomeb | 0.27 | 0.53 | 0.50 | 0.53 | 0.48 | 0.49 | ||||||||||||||||||
Net realized and unrealized gains (losses) | (3.47 | ) | 4.44 | (0.17 | ) | 1.30 | 2.31 | (0.09 | ) | |||||||||||||||
Total from investment operations | (3.20 | ) | 4.97 | 0.33 | 1.83 | 2.79 | 0.40 | |||||||||||||||||
Less distributions from: | ||||||||||||||||||||||||
Net investment income | (0.29 | ) | (0.51 | ) | (0.54 | ) | (0.49 | ) | (0.50 | ) | (0.48 | ) | ||||||||||||
Net realized gains | (0.35 | ) | (0.58 | ) | (0.31 | ) | (0.01 | ) | (0.52 | ) | (0.42 | ) | ||||||||||||
Total distributions | (0.64 | ) | (1.09 | ) | (0.85 | ) | (0.50 | ) | (1.02 | ) | (0.90 | ) | ||||||||||||
Net asset value, end of period | $18.70 | $22.54 | $18.66 | $19.18 | $17.85 | $16.08 | ||||||||||||||||||
Total returnc | (14.57)% | 27.61% | 1.68% | 10.38% | 18.23% | 2.19% | ||||||||||||||||||
Ratios to average net assetsd | ||||||||||||||||||||||||
Expensese | 0.71% | f | 0.73% | f | 0.74% | f | 0.75% | f | 0.73% | f | 0.73% | |||||||||||||
Net investment income | 2.45% | 2.61% | 2.72% | 2.86% | 2.81% | 2.88% | ||||||||||||||||||
Supplemental data | ||||||||||||||||||||||||
Net assets, end of period (000’s) | $3,328,806 | $4,176,487 | $3,654,795 | $4,182,780 | $4,180,124 | $3,524,835 | ||||||||||||||||||
Portfolio turnover rate | 8.23% | 7.90% | 4.58% | 0.89% | 7.17% | 9.55% | ||||||||||||||||||
aThe amount shown for a share outstanding throughout the period may not correlate with the Statement of Operations for the period due to the timing of sales and repurchases of the Fund’s shares in relation to income earned and/or fluctuating fair value of the investments of the Fund.
bBased on average daily shares outstanding.
cTotal return does not reflect sales commissions or contingent deferred sales charges, if applicable, and is not annualized for periods less than one year.
dRatios are annualized for periods less than one year.
eBenefit of waiver and payments by affiliates rounds to less than 0.01%.
fBenefit of expense reduction rounds to less than 0.01%.
86 | Semiannual Report | The accompanying notes are an integral part of these financial statements. | franklintempleton.com | ||
FRANKLIN CUSTODIAN FUNDS
FINANCIAL HIGHLIGHTS
Franklin Utilities Fund(continued)
| Six Months Ended | ||||||||||||||||||||||||
| March 31, 2020 | Year Ended September 30, | |||||||||||||||||||||||
| (unaudited) | 2019 | 2018 | 2017 | 2016 | 2015 | |||||||||||||||||||
Class C | ||||||||||||||||||||||||
Per share operating performance (for a share outstanding throughout the period) | ||||||||||||||||||||||||
Net asset value, beginning of period | $22.42 | $18.57 | $19.09 | $17.76 | $16.01 | $16.50 | ||||||||||||||||||
Income from investment operationsa: | ||||||||||||||||||||||||
Net investment incomeb | 0.21 | 0.42 | 0.41 | 0.43 | 0.39 | 0.40 | ||||||||||||||||||
Net realized and unrealized gains (losses) | (3.46 | ) | 4.43 | (0.18 | ) | 1.30 | 2.30 | (0.08 | ) | |||||||||||||||
Total from investment operations | (3.25 | ) | 4.85 | 0.23 | 1.73 | 2.69 | 0.32 | |||||||||||||||||
Less distributions from: | ||||||||||||||||||||||||
Net investment income | (0.23 | ) | (0.42 | ) | (0.44 | ) | (0.39 | ) | (0.42 | ) | (0.39 | ) | ||||||||||||
Net realized gains | (0.35 | ) | (0.58 | ) | (0.31 | ) | (0.01 | ) | (0.52 | ) | (0.42 | ) | ||||||||||||
Total distributions | (0.58 | ) | (1.00 | ) | (0.75 | ) | (0.40 | ) | (0.94 | ) | (0.81 | ) | ||||||||||||
Net asset value, end of period | $18.59 | $22.42 | $18.57 | $19.09 | $17.76 | $16.01 | ||||||||||||||||||
Total returnc | (14.82)% | 26.96% | 1.18% | 9.88% | 17.59% | 1.74% | ||||||||||||||||||
Ratios to average net assetsd | ||||||||||||||||||||||||
Expensese | 1.21% | f | 1.23% | f | 1.24% | f | 1.25% | f | 1.23% | f | 1.23% | |||||||||||||
Net investment income | 1.95% | 2.11% | 2.22% | 2.36% | 2.31% | 2.38% | ||||||||||||||||||
Supplemental data | ||||||||||||||||||||||||
Net assets, end of period (000’s) | $604,760 | $767,363 | $834,070 | $981,515 | $1,064,065 | $931,800 | ||||||||||||||||||
Portfolio turnover rate | 8.23% | 7.90% | 4.58% | 0.89% | 7.17% | 9.55% | ||||||||||||||||||
aThe amount shown for a share outstanding throughout the period may not correlate with the Statement of Operations for the period due to the timing of sales and repurchases of the Fund’s shares in relation to income earned and/or fluctuating fair value of the investments of the Fund.
bBased on average daily shares outstanding.
cTotal return does not reflect sales commissions or contingent deferred sales charges, if applicable, and is not annualized for periods less than one year.
dRatios are annualized for periods less than one year.
eBenefit of waiver and payments by affiliates rounds to less than 0.01%.
fBenefit of expense reduction rounds to less than 0.01%.
| franklintempleton.com | The accompanying notes are an integral part of these financial statements. | Semiannual Report | 87 | ||
FRANKLIN CUSTODIAN FUNDS
FINANCIAL HIGHLIGHTS
Franklin Utilities Fund(continued)
| Six Months Ended | ||||||||||||||||||||||||
| March 31, 2020 | Year Ended September 30, | |||||||||||||||||||||||
| (unaudited) | 2019 | 2018 | 2017 | 2016 | 2015 | |||||||||||||||||||
Class R | ||||||||||||||||||||||||
Per share operating performance (for a share outstanding throughout the period) | ||||||||||||||||||||||||
Net asset value, beginning of period | $22.45 | $18.59 | $19.11 | $17.78 | $16.02 | $16.52 | ||||||||||||||||||
Income from investment operationsa: | ||||||||||||||||||||||||
Net investment incomeb | 0.23 | 0.45 | 0.44 | 0.46 | 0.42 | 0.42 | ||||||||||||||||||
Net realized and unrealized gains (losses) | (3.46 | ) | 4.44 | (0.18 | ) | 1.30 | 2.30 | (0.09 | ) | |||||||||||||||
Total from investment operations | (3.23 | ) | 4.89 | 0.26 | 1.76 | 2.72 | 0.33 | |||||||||||||||||
Less distributions from: | ||||||||||||||||||||||||
Net investment income | (0.25 | ) | (0.45 | ) | (0.47 | ) | (0.42 | ) | (0.44 | ) | (0.41 | ) | ||||||||||||
Net realized gains | (0.35 | ) | (0.58 | ) | (0.31 | ) | (0.01 | ) | (0.52 | ) | (0.42 | ) | ||||||||||||
Total distributions | (0.60 | ) | (1.03 | ) | (0.78 | ) | (0.43 | ) | (0.96 | ) | (0.83 | ) | ||||||||||||
Net asset value, end of period | $18.62 | $22.45 | $18.59 | $19.11 | $17.78 | $16.02 | ||||||||||||||||||
Total returnc | (14.73)% | 27.17% | 1.33% | 10.04% | 17.81% | 1.83% | ||||||||||||||||||
Ratios to average net assetsd | ||||||||||||||||||||||||
Expensese | 1.06% | f | 1.08% | f | 1.09% | f | 1.10% | f | 1.08% | f | 1.08% | |||||||||||||
Net investment income | 2.10% | 2.26% | 2.37% | 2.51% | 2.46% | 2.53% | ||||||||||||||||||
Supplemental data | ||||||||||||||||||||||||
Net assets, end of period (000’s) | $84,724 | $103,376 | $72,927 | $94,465 | $103,247 | $83,271 | ||||||||||||||||||
Portfolio turnover rate | 8.23% | 7.90% | 4.58% | 0.89% | 7.17% | 9.55% | ||||||||||||||||||
aThe amount shown for a share outstanding throughout the period may not correlate with the Statement of Operations for the period due to the timing of sales and repurchases of the Fund’s shares in relation to income earned and/or fluctuating fair value of the investments of the Fund.
bBased on average daily shares outstanding.
cTotal return is not annualized for periods less than one year.
dRatios are annualized for periods less than one year.
eBenefit of waiver and payments by affiliates rounds to less than 0.01%.
fBenefit of expense reduction rounds to less than 0.01%.
88 | Semiannual Report | The accompanying notes are an integral part of these financial statements. | franklintempleton.com | ||
FRANKLIN CUSTODIAN FUNDS
FINANCIAL HIGHLIGHTS
Franklin Utilities Fund(continued)
| Six Months Ended | ||||||||||||||||||||||||
| March 31, 2020 | Year Ended September 30, | |||||||||||||||||||||||
| (unaudited) | 2019 | 2018 | 2017 | 2016 | 2015 | |||||||||||||||||||
Class R6 | ||||||||||||||||||||||||
Per share operating performance (for a share outstanding throughout the period) | ||||||||||||||||||||||||
Net asset value, beginning of period | $22.73 | $18.81 | $19.32 | $17.97 | $16.18 | $16.68 | ||||||||||||||||||
Income from investment operationsa: | ||||||||||||||||||||||||
Net investment incomeb | 0.30 | 0.56 | 0.55 | 0.58 | 0.53 | 0.53 | ||||||||||||||||||
Net realized and unrealized gains (losses) | (3.52 | ) | 4.50 | (0.17 | ) | 1.31 | 2.32 | (0.09 | ) | |||||||||||||||
Total from investment operations | (3.22 | ) | 5.06 | 0.38 | 1.89 | 2.85 | 0.44 | |||||||||||||||||
Less distributions from: | ||||||||||||||||||||||||
Net investment income | (0.31 | ) | (0.56 | ) | (0.58 | ) | (0.53 | ) | (0.54 | ) | (0.52 | ) | ||||||||||||
Net realized gains | (0.35 | ) | (0.58 | ) | (0.31 | ) | (0.01 | ) | (0.52 | ) | (0.42 | ) | ||||||||||||
Total distributions | (0.66 | ) | (1.14 | ) | (0.89 | ) | (0.54 | ) | (1.06 | ) | (0.94 | ) | ||||||||||||
Net asset value, end of period | $18.85 | $22.73 | $18.81 | $19.32 | $17.97 | $16.18 | ||||||||||||||||||
Total returnc | (14.52)% | 27.89% | 1.97% | 10.70% | 18.55% | 2.45% | ||||||||||||||||||
Ratios to average net assetsd | ||||||||||||||||||||||||
Expenses before waiver and payments by affiliates | 0.55% | 0.53% | 0.52% | 0.48% | 0.47% | 0.47% | ||||||||||||||||||
Expenses net of waiver and payments by affiliates | 0.49% | e | 0.50% | e | 0.48% | e | 0.48% | e,f | 0.47% | e,f | 0.47% | f | ||||||||||||
Net investment income | 2.67% | 2.84% | 2.98% | 3.13% | 3.07% | 3.14% | ||||||||||||||||||
Supplemental data | ||||||||||||||||||||||||
Net assets, end of period (000’s) | $145,286 | $150,244 | $230,393 | $241,455 | $219,587 | $201,225 | ||||||||||||||||||
Portfolio turnover rate | 8.23% | 7.90% | 4.58% | 0.89% | 7.17% | 9.55% | ||||||||||||||||||
aThe amount shown for a share outstanding throughout the period may not correlate with the Statement of Operations for the period due to the timing of sales and repurchases of the Fund’s shares in relation to income earned and/or fluctuating fair value of the investments of the Fund.
bBased on average daily shares outstanding.
cTotal return is not annualized for periods less than one year.
dRatios are annualized for periods less than one year.
eBenefit of expense reduction rounds to less than 0.01%.
fBenefit of waiver and payments by affiliates rounds to less than 0.01%.
| franklintempleton.com | The accompanying notes are an integral part of these financial statements. | Semiannual Report | 89 | ||
FRANKLIN CUSTODIAN FUNDS
FINANCIAL HIGHLIGHTS
Franklin Utilities Fund(continued)
| Six Months Ended | ||||||||||||||||||||||||
| March 31, 2020 | Year Ended September 30, | |||||||||||||||||||||||
| (unaudited) | 2019 | 2018 | 2017 | 2016 | 2015 | |||||||||||||||||||
| ||||||||||||||||||||||||
Advisor Class | ||||||||||||||||||||||||
Per share operating performance (for a share outstanding throughout the period) | ||||||||||||||||||||||||
Net asset value, beginning of period | $22.73 | $18.81 | $19.32 | $17.97 | $16.19 | $16.68 | ||||||||||||||||||
|
|
| ||||||||||||||||||||||
Income from investment operationsa: | ||||||||||||||||||||||||
Net investment incomeb | 0.29 | 0.56 | 0.54 | 0.57 | 0.51 | 0.52 | ||||||||||||||||||
Net realized and unrealized gains (losses) | (3.52 | ) | 4.48 | (0.18 | ) | 1.30 | 2.32 | (0.09 | ) | |||||||||||||||
|
|
| ||||||||||||||||||||||
Total from investment operations | (3.23 | ) | 5.04 | 0.36 | 1.87 | 2.83 | 0.43 | |||||||||||||||||
|
|
| ||||||||||||||||||||||
Less distributions from: | ||||||||||||||||||||||||
Net investment income | (0.30 | ) | (0.54 | ) | (0.56 | ) | (0.51 | ) | (0.53 | ) | (0.50 | ) | ||||||||||||
Net realized gains | (0.35 | ) | (0.58 | ) | (0.31 | ) | (0.01 | ) | (0.52 | ) | (0.42 | ) | ||||||||||||
|
|
| ||||||||||||||||||||||
Total distributions | (0.65 | ) | (1.12 | ) | (0.87 | ) | (0.52 | ) | (1.05 | ) | (0.92 | ) | ||||||||||||
|
|
| ||||||||||||||||||||||
Net asset value, end of period | $18.85 | $22.73 | $18.81 | $19.32 | $17.97 | $16.19 | ||||||||||||||||||
|
|
| ||||||||||||||||||||||
Total returnc | (14.55 | )% | 27.78% | 1.82% | 10.64% | 18.34% | 2.40% | |||||||||||||||||
Ratios to average net assetsd | ||||||||||||||||||||||||
Expensese | 0.56% | f | 0.58% | f | 0.59% | f | 0.60% | f | 0.58% | f | 0.58% | |||||||||||||
Net investment income | 2.60% | 2.76% | 2.87% | 3.01% | 2.96% | 3.03% | ||||||||||||||||||
Supplemental data | ||||||||||||||||||||||||
Net assets, end of period (000’s) | $1,106,029 | $1,262,883 | $927,845 | $963,228 | $755,484 | $549,371 | ||||||||||||||||||
Portfolio turnover rate | 8.23% | 7.90% | 4.58% | 0.89% | 7.17% | 9.55% | ||||||||||||||||||
aThe amount shown for a share outstanding throughout the period may not correlate with the Statement of Operations for the period due to the timing of sales and repurchases of the Fund’s shares in relation to income earned and/or fluctuating fair value of the investments of the Fund.
bBased on average daily shares outstanding.
cTotal return is not annualized for periods less than one year.
dRatios are annualized for periods less than one year.
eBenefit of waiver and payments by affiliates rounds to less than 0.01%.
fBenefit of expense reduction rounds to less than 0.01%.
90 | Semiannual Report | The accompanying notes are an integral part of these financial statements. | franklintempleton.com | ||
FRANKLIN CUSTODIAN FUNDS
Statement of Investments, March 31, 2020 (unaudited)
Franklin Utilities Fund
| Country | Shares | Value | ||||||||||
Common Stocks 99.3% | ||||||||||||
Diversified Telecommunication Services 0.5% | ||||||||||||
Telus Corp | Canada | 2,000,000 | $ | 31,616,341 | ||||||||
|
| |||||||||||
Electric Utilities 56.3% | ||||||||||||
Alliant Energy Corp. | United States | 3,856,870 | 186,248,254 | |||||||||
American Electric Power Co. Inc. | United States | 3,000,000 | 239,940,000 | |||||||||
Duke Energy Corp. | United States | 3,000,000 | 242,640,000 | |||||||||
Edison International | United States | 3,900,000 | 213,681,000 | |||||||||
Emera Inc. | Canada | 2,200,000 | 86,749,556 | |||||||||
Entergy Corp. | United States | 2,100,000 | 197,337,000 | |||||||||
Evergy Inc. | United States | 2,500,000 | 137,625,000 | |||||||||
Eversource Energy | United States | 2,550,000 | 199,435,500 | |||||||||
Exelon Corp. | United States | 6,800,000 | 250,308,000 | |||||||||
FirstEnergy Corp. | United States | 4,400,000 | 176,308,000 | |||||||||
Fortis Inc. | Canada | 500,000 | 19,278,863 | |||||||||
NextEra Energy Inc. | United States | 2,600,000 | 625,612,000 | |||||||||
OGE Energy Corp. | United States | 1,400,000 | 43,022,000 | |||||||||
Pinnacle West Capital Corp. | United States | 1,350,000 | 102,316,500 | |||||||||
PNM Resources Inc. | United States | 2,600,070 | 98,802,660 | |||||||||
PPL Corp. | United States | 2,200,000 | 54,296,000 | |||||||||
The Southern Co. | United States | 4,000,000 | 216,560,000 | |||||||||
Xcel Energy Inc. | United States | 3,474,300 | 209,500,290 | |||||||||
|
| |||||||||||
| 3,299,660,623 | ||||||||||||
|
| |||||||||||
Gas Utilities 3.2% | ||||||||||||
Atmos Energy Corp. | United States | 250,000 | 24,807,500 | |||||||||
New Jersey Resources Corp. | United States | 1,000,000 | 33,970,000 | |||||||||
Southwest Gas Holdings Inc. | United States | 1,000,000 | 69,560,000 | |||||||||
Spire Inc. | United States | 800,000 | 59,584,000 | |||||||||
|
| |||||||||||
| 187,921,500 | ||||||||||||
|
| |||||||||||
Independent Power & Renewable Electricity Producers 0.8% | ||||||||||||
Clearway Energy Inc., C | United States | 2,537,458 | 47,704,210 | |||||||||
|
| |||||||||||
Multi-Utilities 31.4% | ||||||||||||
Ameren Corp. | United States | 1,600,000 | 116,528,000 | |||||||||
Black Hills Corp. | United States | 784,393 | 50,224,684 | |||||||||
CenterPoint Energy Inc. | United States | 6,500,000 | 100,425,000 | |||||||||
CMS Energy Corp. | United States | 5,000,000 | 293,750,000 | |||||||||
Consolidated Edison Inc. | United States | 1,000,000 | 78,000,000 | |||||||||
Dominion Energy Inc. | United States | 4,250,000 | 306,807,500 | |||||||||
DTE Energy Co. | United States | 1,900,000 | 180,443,000 | |||||||||
E.ON SE | Germany | 5,000,000 | 51,274,433 | |||||||||
National Grid PLC | United Kingdom | 5,999,933 | 70,065,320 | |||||||||
NiSource Inc. | United States | 4,065,416 | 101,513,437 | |||||||||
NorthWestern Corp. | United States | 1,000,000 | 59,830,000 | |||||||||
Public Service Enterprise Group Inc. | United States | 2,100,000 | 94,311,000 | |||||||||
Sempra Energy | United States | 1,988,900 | 224,725,811 | |||||||||
WEC Energy Group Inc. | United States | 1,300,000 | 114,569,000 | |||||||||
|
| |||||||||||
| 1,842,467,185 | ||||||||||||
|
| |||||||||||
| franklintempleton.com | Semiannual Report | 91 | ||
FRANKLIN CUSTODIAN FUNDS
STATEMENT OF INVESTMENTS (UNAUDITED)
Franklin Utilities Fund(continued)
| Country | Shares | Value | ||||||||||
Common Stocks(continued) | ||||||||||||
Oil, Gas & Consumable Fuels 2.4% | ||||||||||||
aCheniere Energy Inc. | United States | 1,200,000 | $ | 40,200,000 | ||||||||
Kinder Morgan Inc. | United States | 1,000,000 | 13,920,000 | |||||||||
ONEOK Inc. | United States | 200,000 | 4,362,000 | |||||||||
Origin Energy Ltd. | Australia | 7,000,000 | 18,834,438 | |||||||||
The Williams Cos. Inc. | United States | 4,400,000 | 62,260,000 | |||||||||
|
| |||||||||||
| 139,576,438 | ||||||||||||
|
| |||||||||||
Water Utilities 4.7% | ||||||||||||
American Water Works Co. Inc. | United States | 1,400,000 | 167,384,000 | |||||||||
Essential Utilities Inc. | United States | 1,750,000 | 71,225,000 | |||||||||
United Utilities Group PLC | United Kingdom | 3,000,000 | 33,562,803 | |||||||||
|
| |||||||||||
| 272,171,803 | ||||||||||||
|
| |||||||||||
Total Common Stocks (Cost $3,344,738,346) | 5,821,118,100 | |||||||||||
|
| |||||||||||
| Principal Amount | ||||||||||||
Corporate Bonds (Cost $6,090,349) 0.1% | ||||||||||||
Multi-Utilities 0.1% | ||||||||||||
Aquila Inc., senior note, 8.27%, 11/15/21 | United States | $ | 6,100,000 | 6,562,644 | ||||||||
|
| |||||||||||
Total Investments before Short Term Investments | 5,827,680,744 | |||||||||||
|
| |||||||||||
| Shares | ||||||||||||
Short Term Investments (Cost $30,548,998) 0.5% | ||||||||||||
Money Market Funds 0.5% | ||||||||||||
b,cInstitutional Fiduciary Trust Money Market Portfolio, 0.32% | United States | 30,548,998 | 30,548,998 | |||||||||
|
| |||||||||||
Total Investments (Cost $3,381,377,693) 99.9% | 5,858,229,742 | |||||||||||
Other Assets, less Liabilities 0.1% | 5,693,870 | |||||||||||
|
| |||||||||||
Net Assets 100.0% | $ | 5,863,923,612 | ||||||||||
|
| |||||||||||
aNon-income producing.
bSee Note 3(f) regarding investments in affiliated management investment companies.
cThe rate shown is the annualizedseven-day effective yield at period end.
92 | Semiannual Report | The accompanying notes are an integral part of these financial statements. | franklintempleton.com | ||
FRANKLIN CUSTODIAN FUNDS
Statements of Assets and Liabilities
March 31, 2020 (unaudited)
| Franklin | Franklin | Franklin | ||||||||||
| DynaTech Fund | Growth Fund | Income Fund | ||||||||||
Assets: | ||||||||||||
Investments in securities: | ||||||||||||
Cost - Unaffiliated issuers | $5,929,936,448 | $ | 5,383,939,962 | $ | 66,888,806,165 | |||||||
Cost -Non-controlled affiliates (Note 3f and 10) | 312,581,737 | 382,766,516 | 1,780,706,838 | |||||||||
Cost - Unaffiliated repurchase agreements | 7,070,315 | 8,421,871 | 958,031 | |||||||||
|
| |||||||||||
Value - Unaffiliated issuers+ | $9,284,503,350 | $ | 13,793,083,363 | $ | 59,609,396,005 | |||||||
Value -Non-controlled affiliates (Note 3f and 10) | 312,581,737 | 382,766,516 | 1,539,956,834 | |||||||||
Value - Unaffiliated repurchase agreements | 7,070,315 | 8,421,871 | 958,031 | |||||||||
Cash | — | 1,139,037 | 10,211,517 | |||||||||
Restricted cash for OTC derivative contracts (Note 1f) | — | — | 13,970,000 | |||||||||
Receivables: | ||||||||||||
Investment securities sold** | 19,597,848 | — | 971,927,919 | |||||||||
Capital shares sold | 83,665,966 | 111,607,461 | 56,542,624 | |||||||||
Dividends and interest | 1,957,132 | 8,946,116 | 622,158,904 | |||||||||
OTC swap contracts (upfront payments $—, $— and $6,500,000, respectively) | — | — | 5,622,500 | |||||||||
Unrealized appreciation on OTC swap contracts | — | — | 9,838,771 | |||||||||
Other assets | 12,104 | 19,622 | 84,910 | |||||||||
|
| |||||||||||
Total assets | 9,709,388,452 | 14,305,983,986 | 62,840,668,015 | |||||||||
|
| |||||||||||
Liabilities: | ||||||||||||
Payables: | ||||||||||||
Investment securities purchased | 5,872,719 | 28,167,804 | 1,029,808,760 | |||||||||
Capital shares redeemed | 26,656,422 | 31,354,527 | 114,295,542 | |||||||||
Management fees | 3,527,316 | 5,121,574 | 18,693,544 | |||||||||
Distribution fees | 1,578,293 | 2,424,214 | 11,924,012 | |||||||||
Transfer agent fees | 949,470 | 2,762,992 | 9,269,407 | |||||||||
Trustees’ fees and expenses | — | 817 | 11,014 | |||||||||
Deposits from brokers for: | ||||||||||||
OTC derivative contracts | — | — | 13,970,000 | |||||||||
Options written, at value (premiums received $—, $— and $157,397,330, respectively) | — | — | 606,021,000 | |||||||||
Payable upon return of securities loaned | 46,551,315 | 19,805,871 | 4,790,031 | |||||||||
Accrued expenses and other liabilities | 342,836 | 749,262 | 2,999,040 | |||||||||
|
| |||||||||||
Total liabilities | 85,478,371 | 90,387,061 | 1,811,782,350 | |||||||||
|
| |||||||||||
Net assets, at value | $9,623,910,081 | $ | 14,215,596,925 | $ | 61,028,885,665 | |||||||
|
| |||||||||||
Net assets consist of: | ||||||||||||
Paid-in capital | $6,405,574,861 | $ | 5,356,221,165 | $ | 73,218,677,592 | |||||||
Total distributable earnings (losses) | 3,218,335,220 | 8,859,375,760 | (12,189,791,927 | ) | ||||||||
|
| |||||||||||
Net assets, at value | $9,623,910,081 | $ | 14,215,596,925 | $ | 61,028,885,665 | |||||||
|
| |||||||||||
+Includes securities loaned | $ 44,426,446 | $ | 17,636,940 | $ | 1,718,055 | |||||||
**Includes securities loaned | $ — | $ | — | $ | 3,040,916 | |||||||
| franklintempleton.com | The accompanying notes are an integral part of these financial statements. | Semiannual Report | 93 | ||
FRANKLIN CUSTODIAN FUNDS
FINANCIAL STATEMENTS
Statements of Assets and Liabilities(continued)
March 31, 2020 (unaudited)
| Franklin DynaTech Fund | Franklin Growth Fund | Franklin Income Fund | ||||||||||
Class A: | ||||||||||||
Net assets, at value | $ | 4,709,601,419 | $ | 8,149,797,826 | $ | 7,486,376,242 | ||||||
Shares outstanding | 58,973,290 | 86,603,709 | 3,869,711,841 | |||||||||
Net asset value per sharea | $79.86 | $94.10 | $1.93 | |||||||||
Maximum offering price per share (net asset value per share ÷ 94.50%, 94.50% and 96.25%, respectively) | $84.51 | $99.58 | $2.01 | |||||||||
Class A1: | ||||||||||||
Net assets, at value | $31,730,369,427 | |||||||||||
Shares outstanding | 16,360,305,562 | |||||||||||
Net asset value and maximum offering price per sharea | $1.94 | |||||||||||
Maximum offering price per share (net asset value per share ÷ 96.25%) | $2.02 | |||||||||||
Class C: | ||||||||||||
Net assets, at value | $ | 632,512,855 | $ | 601,887,006 | $10,488,848,560 | |||||||
Shares outstanding | 9,615,415 | 7,058,786 | 5,329,752,766 | |||||||||
Net asset value and maximum offering price per sharea | $65.78 | $85.27 | $1.97 | |||||||||
Class R: | ||||||||||||
Net assets, at value | $ | 129,637,806 | $ | 335,275,525 | $ 214,501,646 | |||||||
Shares outstanding | 1,678,147 | 3,575,666 | 112,831,709 | |||||||||
Net asset value and maximum offering price per share | $77.25 | $93.77 | $1.90 | |||||||||
Class R6: | ||||||||||||
Net assets, at value | $ | 2,833,759,455 | $ | 2,309,813,341 | $ 1,569,103,640 | |||||||
Shares outstanding | 33,929,096 | 24,510,959 | 815,171,893 | |||||||||
Net asset value and maximum offering price per share | $83.52 | $94.24 | $1.92 | |||||||||
Advisor Class: | ||||||||||||
Net assets, at value | $ | 1,318,398,546 | $ | 2,818,823,227 | $ 9,539,686,150 | |||||||
Shares outstanding | 15,957,058 | 29,882,053 | 4,960,799,136 | |||||||||
Net asset value and maximum offering price per share | $82.62 | $94.33 | $1.92 | |||||||||
aRedemption price is equal to net asset value less contingent deferred sales charges, if applicable.
94 | Semiannual Report | The accompanying notes are an integral part of these financial statements. | franklintempleton.com | ||
FRANKLIN CUSTODIAN FUNDS
FINANCIAL STATEMENTS
Statements of Assets and Liabilities(continued)
March 31, 2020 (unaudited)
Franklin U.S. Government | Franklin Utilities Fund | |||||||
Assets: | ||||||||
Investments in securities: | ||||||||
Cost - Unaffiliated issuers | $4,814,729,082 | $3,350,828,695 | ||||||
Cost -Non-controlled affiliates (Note 3f and 10) | 259,247,829 | 30,548,998 | ||||||
Value - Unaffiliated issuers | $5,009,199,547 | $5,827,680,744 | ||||||
Value -Non-controlled affiliates (Note 3f and 10) | 259,247,829 | 30,548,998 | ||||||
Cash | 40,076,808 | — | ||||||
Receivables: | ||||||||
Capital shares sold | 9,655,968 | 6,269,780 | ||||||
Dividends and interest | 15,360,623 | 10,424,972 | ||||||
Other assets | 5,582 | 8,446 | ||||||
Total assets | 5,333,546,357 | 5,874,932,940 | ||||||
Liabilities: | ||||||||
Payables: | ||||||||
Investment securities purchased | 141,018,329 | 6,353 | ||||||
Capital shares redeemed | 22,758,891 | 7,024,885 | ||||||
Management fees | 1,887,078 | 2,216,430 | ||||||
Distribution fees | 680,042 | 960,992 | ||||||
Transfer agent fees | 1,166,014 | 602,590 | ||||||
Trustees’ fees and expenses | 1,136 | — | ||||||
Distributions to shareholders | 1,365,366 | — | ||||||
Accrued expenses and other liabilities | 249,757 | 198,078 | ||||||
Total liabilities | 169,126,613 | 11,009,328 | ||||||
Net assets, at value | $5,164,419,744 | $5,863,923,612 | ||||||
Net assets consist of: | ||||||||
Paid-in capital | $5,548,815,711 | $3,165,888,865 | ||||||
Total distributable earnings (losses) | (384,395,967 | ) | 2,698,034,747 | |||||
Net assets, at value | $5,164,419,744 | $5,863,923,612 | ||||||
| franklintempleton.com | The accompanying notes are an integral part of these financial statements. | Semiannual Report | 95 | ||
FRANKLIN CUSTODIAN FUNDS
FINANCIAL STATEMENTS
Statements of Assets and Liabilities(continued)
March 31, 2020 (unaudited)
| Franklin U.S. Government Securities Fund | Franklin Utilities Fund | |||||||
Class A: | ||||||||
Net assets, at value | $ | 649,729,453 | $ | 594,318,545 | ||||
Shares outstanding | 105,587,918 | 31,801,179 | ||||||
Net asset value per sharea | $6.15 | $18.69 | ||||||
Maximum offering price per share (net asset value per share ÷ 96.25%) | $6.39 | $19.42 | ||||||
Class A1: | ||||||||
Net assets, at value | $ | 2,777,387,860 | $ | 3,328,805,927 | ||||
Shares outstanding | 451,171,635 | 178,053,822 | ||||||
Net asset value and maximum offering price per sharea | $6.16 | $18.70 | ||||||
Maximum offering price per share (net asset value per share ÷ 96.25%) | $6.40 | $19.43 | ||||||
Class C: | ||||||||
Net assets, at value | $ | 380,273,799 | $ | 604,760,368 | ||||
Shares outstanding | 62,251,301 | 32,528,985 | ||||||
Net asset value and maximum offering price per sharea | $6.11 | $18.59 | ||||||
Class R: | ||||||||
Net assets, at value | $ | 35,356,318 | $ | 84,724,065 | ||||
Shares outstanding | 5,746,951 | 4,550,724 | ||||||
Net asset value and maximum offering price per share | $6.15 | $18.62 | ||||||
Class R6: | ||||||||
Net assets, at value | $ | 333,401,507 | $ | 145,285,935 | ||||
Shares outstanding | 53,928,710 | 7,707,143 | ||||||
Net asset value and maximum offering price per share | $6.18 | $18.85 | ||||||
Advisor Class: | ||||||||
Net assets, at value | $ | 988,270,807 | $ | 1,106,028,772 | ||||
Shares outstanding | 159,978,787 | 58,669,286 | ||||||
Net asset value and maximum offering price per share | $6.18 | $18.85 | ||||||
aRedemption price is equal to net asset value less contingent deferred sales charges, if applicable.
96 | Semiannual Report | The accompanying notes are an integral part of these financial statements. | franklintempleton.com | ||
FRANKLIN CUSTODIAN FUNDS
FINANCIAL STATEMENTS
Statements of Operations
for the six months ended March 31, 2020 (unaudited)
| Franklin DynaTech Fund | Franklin Growth Fund | Franklin Income Fund | ||||||||||
Investment income: | ||||||||||||
Dividends: (net of foreign taxes)* | ||||||||||||
Unaffiliated issuers | $ | 24,610,132 | $ | 98,422,719 | $ | 504,191,836 | ||||||
Non-controlled affiliates (Note 3f and 10) | 1,866,127 | 1,265,726 | 21,730,817 | |||||||||
Interest: | ||||||||||||
Unaffiliated issuers | 46,015 | — | 1,073,382,187 | |||||||||
Non-controlled affiliates (Note 10) | — | — | 49,120,310 | |||||||||
Income from securities loaned: | ||||||||||||
Unaffiliated entities (net of fees and rebates) | 460,366 | — | 232,113 | |||||||||
Non-controlled affiliates (Note 3f) | 166,034 | 40,148 | 81,606 | |||||||||
|
| |||||||||||
Total investment income | 27,148,674 | 99,728,593 | 1,648,738,869 | |||||||||
|
| |||||||||||
Expenses: | ||||||||||||
Management fees (Note 3a) | 22,136,374 | 35,585,150 | 134,731,879 | |||||||||
Distribution fees: (Note 3c) | ||||||||||||
Class A | 6,172,635 | 11,811,765 | 10,091,003 | |||||||||
Class A1 | — | — | 28,735,545 | |||||||||
Class C | 3,288,020 | 3,556,874 | 41,869,431 | |||||||||
Class R | 338,517 | 1,047,533 | 640,490 | |||||||||
Transfer agent fees: (Note 3e) | ||||||||||||
Class A | 2,992,321 | 5,735,729 | 3,574,019 | |||||||||
Class A1 | — | — | 16,956,894 | |||||||||
Class C | 398,414 | 433,803 | 5,700,508 | |||||||||
Class R | 82,233 | 255,889 | 114,433 | |||||||||
Class R6 | 334,379 | 376,269 | 268,726 | |||||||||
Advisor Class | 802,594 | 1,985,258 | 5,151,572 | |||||||||
Custodian fees (Note 4) | 61,260 | 63,454 | 433,098 | |||||||||
Reports to shareholders | 474,442 | 499,233 | 1,855,517 | |||||||||
Registration and filing fees | 223,788 | 167,378 | 509,241 | |||||||||
Professional fees | 45,610 | 60,465 | (5,853,160 | )a | ||||||||
Trustees’ fees and expenses | 18,540 | 38,923 | 184,583 | |||||||||
Other | 61,397 | 159,505 | 400,671 | |||||||||
|
| |||||||||||
Total expenses | 37,430,524 | 61,777,228 | 245,364,450 | |||||||||
Expense reductions (Note 4) | — | (167 | ) | (429,269 | ) | |||||||
Expenses waived/paid by affiliates (Note 3f and 3g) | (561,147 | ) | (386,326 | ) | (5,197,901 | ) | ||||||
|
| |||||||||||
Net expenses | 36,869,377 | 61,390,735 | 239,737,280 | |||||||||
|
| |||||||||||
Net investment income (loss) | (9,720,703 | ) | 38,337,858 | 1,409,001,589 | ||||||||
|
| |||||||||||
Realized and unrealized gains (losses): | ||||||||||||
Net realized gain (loss) from: | ||||||||||||
Investments: | ||||||||||||
Unaffiliated issuers | (109,034,961 | ) | 620,636,138 | (308,894,089 | ) | |||||||
Non-controlled affiliates (Note 3f and 10) | — | — | (388,510,419 | ) | ||||||||
Written options | ��� | — | (101,328,838 | ) | ||||||||
Foreign currency transactions | (86,454 | ) | 6,049 | 2,501,144 | ||||||||
Futures contracts | — | — | (57,189,500 | ) | ||||||||
Swap contracts | — | — | (971,250 | ) | ||||||||
|
| |||||||||||
Net realized gain (loss) | (109,121,415 | ) | 620,642,187 | (854,392,952 | ) | |||||||
|
| |||||||||||
Net change in unrealized appreciation (depreciation) on: | ||||||||||||
Investments: | ||||||||||||
Unaffiliated issuers | (234,065,394 | ) | (2,129,034,985 | ) | (9,671,061,328 | ) | ||||||
Non-controlled affiliates (Note 3f and 10) | — | — | (231,471,451 | ) | ||||||||
Translation of other assets and liabilities denominated in foreign currencies | 15,440 | — | 230,533 | |||||||||
Written options | — | — | (485,681,641 | ) | ||||||||
Futures contracts | — | — | (15,254,808 | ) | ||||||||
| franklintempleton.com | The accompanying notes are an integral part of these financial statements. | Semiannual Report | 97 | ||
FRANKLIN CUSTODIAN FUNDS
FINANCIAL STATEMENTS
Statements of Operations (continued)
for the six months ended March 31, 2020 (unaudited)
| Franklin | Franklin | Franklin | ||||||||||
| DynaTech Fund | Growth Fund | Income Fund | ||||||||||
Swap contracts | $ — | $ — | $ 9,838,771 | |||||||||
|
| |||||||||||
Net change in unrealized appreciation (depreciation) | (234,049,954 | ) | (2,129,034,985 | ) | (10,393,399,924 | ) | ||||||
|
| |||||||||||
Net realized and unrealized gain (loss) | (343,171,369 | ) | (1,508,392,798 | ) | (11,247,792,876 | ) | ||||||
|
| |||||||||||
Net increase (decrease) in net assets resulting from operations | $(352,892,072 | ) | $(1,470,054,940 | ) | $ (9,838,791,287 | ) | ||||||
|
| |||||||||||
*Foreign taxes withheld on dividends | $ 133,849 | $ 425,011 | $ 8,433,000 | |||||||||
aIncludes unaffiliated reimbursement of legal fees incurred in connection with certain Fund holdings.
98 | Semiannual Report | The accompanying notes are an integral part of these financial statements. | franklintempleton.com | ||
FRANKLIN CUSTODIAN FUNDS
FINANCIAL STATEMENTS
Statements of Operations (continued)
for the six months ended March 31, 2020 (unaudited)
| Franklin U.S. Government Securities Fund | Franklin Utilities Fund | |||||||
Investment income: | ||||||||
Dividends: (net of foreign taxes)* | ||||||||
Unaffiliated issuers | $ — | $ 108,115,457 | ||||||
Non-controlled affiliates (Note 3f and 10) | 873,116 | 169,413 | ||||||
Interest: | ||||||||
Unaffiliated issuers: | ||||||||
Paydown gain (loss) | (18,341,771 | ) | — | |||||
Paid in cash | 88,176,728 | 253,119 | ||||||
|
| |||||||
Total investment income | 70,708,073 | 108,537,989 | ||||||
|
| |||||||
Expenses: | ||||||||
Management fees (Note 3a) | 11,233,155 | 15,403,299 | ||||||
Distribution fees: (Note 3c) | ||||||||
Class A | 557,899 | 764,129 | ||||||
Class A1 | 2,048,580 | 3,007,029 | ||||||
Class C | 1,198,463 | 2,387,228 | ||||||
Class R | 80,784 | 252,003 | ||||||
Transfer agent fees: (Note 3e) | ||||||||
Class A | 340,431 | 314,264 | ||||||
Class A1 | 2,143,021 | 2,060,901 | ||||||
Class C | 281,088 | 377,585 | ||||||
Class R | 24,980 | 51,951 | ||||||
Class R6 | 55,131 | 74,367 | ||||||
Advisor Class | 733,068 | 654,124 | ||||||
Custodian fees (Note 4) | 17,756 | 35,840 | ||||||
Reports to shareholders | 168,825 | 177,286 | ||||||
Registration and filing fees | 91,905 | 100,237 | ||||||
Professional fees | 55,583 | 36,952 | ||||||
Trustees’ fees and expenses | 13,234 | 15,369 | ||||||
Other | 475,936 | 54,072 | ||||||
|
| |||||||
Total expenses | 19,519,839 | 25,766,636 | ||||||
Expense reductions (Note 4) | (4,069 | ) | (157 | ) | ||||
Expenses waived/paid by affiliates (Note 3f and 3g) | (272,342 | ) | (93,486 | ) | ||||
|
| |||||||
Net expenses | 19,243,428 | 25,672,993 | ||||||
|
| |||||||
Net investment income | 51,464,645 | 82,864,996 | ||||||
|
| |||||||
Realized and unrealized gains (losses): | ||||||||
Net realized gain (loss) from: | ||||||||
Investments: | ||||||||
Unaffiliated issuers | 1,907,610 | 223,250,463 | ||||||
Foreign currency transactions | — | 234,661 | ||||||
|
| |||||||
Net realized gain (loss) | 1,907,610 | 223,485,124 | ||||||
|
| |||||||
Net change in unrealized appreciation (depreciation) on: | ||||||||
Investments: | ||||||||
Unaffiliated issuers | 85,043,495 | (1,337,355,362 | ) | |||||
Translation of other assets and liabilities denominated in foreign currencies | — | (10,474 | ) | |||||
|
| |||||||
Net change in unrealized appreciation (depreciation) | 85,043,495 | (1,337,365,836 | ) | |||||
|
| |||||||
Net realized and unrealized gain (loss) | 86,951,105 | (1,113,880,712 | ) | |||||
|
| |||||||
Net increase (decrease) in net assets resulting from operations | $138,415,750 | $(1,031,015,716 | ) | |||||
|
| |||||||
*Foreign taxes withheld on dividends | $ — | $ 383,625 | ||||||
| franklintempleton.com | The accompanying notes are an integral part of these financial statements. | Semiannual Report | 99 | ||
FRANKLIN CUSTODIAN FUNDS
FINANCIAL STATEMENTS
Statements of Changes in Net Assets
| Franklin DynaTech Fund | Franklin Growth Fund | |||||||||||||||
|
| |||||||||||||||
| Six Months Ended March 31, 2020 (unaudited) | Year Ended September 30, 2019 | Six Months Ended March 31, 2020 (unaudited) | Year Ended September 30, 2019 | |||||||||||||
| ||||||||||||||||
| Increase (decrease) in net assets: | ||||||||||||||||
Operations: | ||||||||||||||||
Net investment income (loss) | $ (9,720,703 | ) | $ (14,718,658 | ) | $ 38,337,858 | $ 79,438,413 | ||||||||||
Net realized gain (loss) | (109,121,415 | ) | 70,729,834 | 620,642,187 | 840,085,967 | |||||||||||
Net change in unrealized appreciation (depreciation) | (234,049,954 | ) | 345,441,488 | (2,129,034,985 | ) | (346,522,216 | ) | |||||||||
|
| |||||||||||||||
Net increase (decrease) in net assets resulting from operations | (352,892,072 | ) | 401,452,664 | (1,470,054,940 | ) | 573,002,164 | ||||||||||
|
| |||||||||||||||
Distributions to shareholders: | ||||||||||||||||
Class A | (36,593,322 | ) | (92,155,284 | ) | (533,974,949 | ) | (127,214,618 | ) | ||||||||
Class C | (5,870,103 | ) | (14,892,611 | ) | (41,241,265 | ) | (8,201,337 | ) | ||||||||
Class R | (1,018,472 | ) | (2,378,516 | ) | (23,492,085 | ) | (5,605,930 | ) | ||||||||
Class R6 | (18,942,623 | ) | (41,995,760 | ) | (159,258,602 | ) | (45,185,076 | ) | ||||||||
Advisor Class | (9,227,765 | ) | (16,868,687 | ) | (191,436,520 | ) | (50,860,743 | ) | ||||||||
|
| |||||||||||||||
Total distributions to shareholders | (71,652,285 | ) | (168,290,858 | ) | (949,403,421 | ) | (237,067,704 | ) | ||||||||
|
| |||||||||||||||
Capital share transactions: (Note 2) | ||||||||||||||||
Class A | 399,131,972 | 650,491,224 | 368,717,188 | (100,470,621 | ) | |||||||||||
Class C | 65,311,120 | (11,971,946 | ) | 5,837,290 | (348,123,281 | ) | ||||||||||
Class R | 11,833,402 | 24,484,953 | (43,379,103 | ) | (95,495,550 | ) | ||||||||||
Class R6 | 490,694,833 | 696,883,004 | 155,681,054 | (144,735,583 | ) | |||||||||||
Advisor Class | 226,855,528 | 444,209,154 | 151,354,883 | (53,980,770 | ) | |||||||||||
|
| |||||||||||||||
Total capital share transactions | 1,193,826,855 | 1,804,096,389 | 638,211,312 | (742,805,805 | ) | |||||||||||
|
| |||||||||||||||
Net increase (decrease) in net assets | 769,282,498 | 2,037,258,195 | (1,781,247,049 | ) | (406,871,345 | ) | ||||||||||
Net assets: | ||||||||||||||||
Beginning of period | 8,854,627,583 | 6,817,369,388 | 15,996,843,974 | 16,403,715,319 | ||||||||||||
|
| |||||||||||||||
End of period | $9,623,910,081 | $8,854,627,583 | $14,215,596,925 | $15,996,843,974 | ||||||||||||
|
| |||||||||||||||
100 | Semiannual Report | The accompanying notes are an integral part of these financial statements. | franklintempleton.com | ||
FRANKLIN CUSTODIAN FUNDS
FINANCIAL STATEMENTS
Statements of Changes in Net Assets(continued)
| Franklin Income Fund | Franklin U.S. Government Securities Fund | |||||||||||||||
|
| |||||||||||||||
| Six Months Ended March 31, 2020 (unaudited) | Year Ended September 30, 2019 | Six Months Ended March 31, 2020 (unaudited) | Year Ended September 30, 2019 | |||||||||||||
| ||||||||||||||||
| Increase (decrease) in net assets: | ||||||||||||||||
Operations: | ||||||||||||||||
Net investment income | $ 1,409,001,589 | $ 2,914,704,511 | $ 51,464,645 | $ 129,091,071 | ||||||||||||
Net realized gain (loss) | (854,392,952 | ) | 215,579,716 | 1,907,610 | 16,617,504 | |||||||||||
Net change in unrealized appreciation (depreciation) | (10,393,399,924 | ) | 52,766,661 | 85,043,495 | 206,765,016 | |||||||||||
|
| |||||||||||||||
Net increase (decrease) in net assets resulting from operations | (9,838,791,287 | ) | 3,183,050,888 | 138,415,750 | 352,473,591 | |||||||||||
|
| |||||||||||||||
Distributions to shareholders: | ||||||||||||||||
Class A | (207,371,957 | ) | (238,921,964 | ) | (6,488,730 | ) | (5,700,515 | ) | ||||||||
Class A1 | (1,017,232,970 | ) | (2,139,823,753 | ) | (39,367,731 | ) | (88,940,105 | ) | ||||||||
Class C | (304,094,918 | ) | (713,887,824 | ) | (4,297,379 | ) | (10,975,833 | ) | ||||||||
Class R | (6,492,403 | ) | (13,702,246 | ) | (408,326 | ) | (832,535 | ) | ||||||||
Class R6 | (52,298,951 | ) | (105,925,119 | ) | (4,724,722 | ) | (24,763,152 | ) | ||||||||
Advisor Class | (317,674,776 | ) | (609,231,978 | ) | (14,203,197 | ) | (26,064,423 | ) | ||||||||
|
| |||||||||||||||
Total distributions to shareholders | (1,905,165,975 | ) | (3,821,492,884 | ) | (69,490,085 | ) | (157,276,563 | ) | ||||||||
|
| |||||||||||||||
Capital share transactions: (Note 2) | ||||||||||||||||
Class A | 1,460,963,711 | 7,250,036,688 | 304,431,646 | 324,210,864 | ||||||||||||
Class A1 | (1,796,371,914 | ) | (2,920,848,622 | ) | (144,325,795 | ) | (323,855,335 | ) | ||||||||
Class C | (973,169,521 | ) | (6,197,626,508 | ) | (13,591,160 | ) | (197,618,270 | ) | ||||||||
Class R | (9,605,280 | ) | (27,415,311 | ) | 1,996,562 | 615,002 | ||||||||||
Class R6 | (28,196,938 | ) | (140,374,274 | ) | (245,596,017 | ) | (150,358,443 | ) | ||||||||
Advisor Class | (406,678,722 | ) | 581,307,127 | 28,536,288 | 194,243,684 | |||||||||||
|
| |||||||||||||||
Total capital share transactions | (1,753,058,664 | ) | (1,454,920,900 | ) | (68,548,476 | ) | (152,762,498 | ) | ||||||||
|
| |||||||||||||||
Net increase (decrease) in net assets | (13,497,015,926 | ) | (2,093,362,896 | ) | 377,189 | 42,434,530 | ||||||||||
Net assets: | ||||||||||||||||
Beginning of period | 74,525,901,591 | 76,619,264,487 | 5,164,042,555 | 5,121,608,025 | ||||||||||||
|
| |||||||||||||||
End of period | $ 61,028,885,665 | $ 74,525,901,591 | $5,164,419,744 | $5,164,042,555 | ||||||||||||
|
| |||||||||||||||
| franklintempleton.com | The accompanying notes are an integral part of these financial statements. | Semiannual Report | 101 | ||
FRANKLIN CUSTODIAN FUNDS
FINANCIAL STATEMENTS
Statements of Changes in Net Assets(continued)
| Franklin Utilities Fund | ||||||||
| Six Months Ended March 31, 2020 (unaudited) | Year Ended September 30, 2019 | |||||||
| ||||||||
Increase (decrease) in net assets: | ||||||||
Operations: | ||||||||
Net investment income | $ 82,864,996 | $ 160,830,310 | ||||||
Net realized gain (loss) | 223,485,124 | 124,025,551 | ||||||
Net change in unrealized appreciation (depreciation) | (1,337,365,836 | ) | 1,246,304,369 | |||||
|
| |||||||
Net increase (decrease) in net assets resulting from operations | (1,031,015,716 | ) | 1,531,160,230 | |||||
|
| |||||||
Distributions to shareholders: | ||||||||
Class A | (17,011,617 | ) | (12,003,162 | ) | ||||
Class A1 | (115,218,231 | ) | (210,886,943 | ) | ||||
Class C | (19,353,107 | ) | (36,435,738 | ) | ||||
Class R | (2,726,247 | ) | (4,121,777 | ) | ||||
Class R6 | (5,062,064 | ) | (12,677,551 | ) | ||||
Advisor Class | (36,674,724 | ) | (56,945,571 | ) | ||||
|
| |||||||
Total distributions to shareholders | (196,045,990 | ) | (333,070,742 | ) | ||||
|
| |||||||
Capital share transactions: (Note 2) | ||||||||
Class A | 191,363,468 | 460,752,617 | ||||||
Class A1 | (148,198,854 | ) | (216,801,580 | ) | ||||
Class C | (35,093,317 | ) | (211,431,033 | ) | ||||
Class R | (97,979 | ) | 13,908,640 | |||||
Class R6 | 25,639,587 | (118,348,388 | ) | |||||
Advisor Class | 75,238,296 | 132,397,828 | ||||||
|
| |||||||
Total capital share transactions | 108,851,201 | 60,478,084 | ||||||
|
| |||||||
Net increase (decrease) in net assets | (1,118,210,505 | ) | 1,258,567,572 | |||||
Net assets: | ||||||||
Beginning of period | 6,982,134,117 | 5,723,566,545 | ||||||
|
| |||||||
End of period | $ 5,863,923,612 | $6,982,134,117 | ||||||
|
| |||||||
102 | Semiannual Report | The accompanying notes are an integral part of these financial statements. | franklintempleton.com | ||
FRANKLIN CUSTODIAN FUNDS
Notes to Financial Statements (unaudited)
1. Organization and Significant Accounting Policies
Franklin Custodian Funds (Trust) is registered under the Investment Company Act of 1940 (1940 Act) as anopen-end management investment company, consisting of six separate funds, five of which are included in this report (Funds) and applies the specialized accounting and reporting guidance in U.S. Generally Accepted Accounting Principles (U.S. GAAP). The classes of shares offered within each of the Funds are indicated below. Class C shares automatically convert to Class A shares after they have been held for 10 years. Each class of shares may differ by its initial sales load, contingent deferred sales charges, voting rights on matters affecting a single class, its exchange privilege and fees due to differing arrangements for distribution and transfer agent fees.
Class A, Class C, Class R, Class R6 & Advisor Class
Franklin DynaTech Fund
Franklin Growth Fund
Class A, Class A1, Class C, Class R, Class R6 & Advisor Class
Franklin Income Fund
Franklin U.S. Government Securities Fund
Franklin Utilities Fund
The following summarizes the Funds’ significant accounting policies.
a. Financial Instrument Valuation
The Funds’ investments in financial instruments are carried at fair value daily. Fair value is the price that would be received to sell an asset or paid to transfer a liability in an orderly transaction between market participants on the measurement date. The Funds calculate the net asset value (NAV) per share each business day as of 4 p.m. Eastern time or the regularly scheduled close of the New York Stock Exchange (NYSE), whichever is earlier. Under compliance policies and procedures approved by the Trust’s Board of Trustees (the Board), the Funds’ administrator has responsibility for oversight of valuation, including leading the cross-functional Valuation Committee (VC). The Funds may utilize independent pricing services, quotations from securities and financial instrument dealers, and other market sources to determine fair value.
Equity securities and derivative financial instruments listed on an exchange or on the NASDAQ National Market System are valued at the last quoted sale price or the official closing price
of the day, respectively. Foreign equity securities are valued as of the close of trading on the foreign stock exchange on which the security is primarily traded, or as of 4 p.m. Eastern time. The value is then converted into its U.S. dollar equivalent at the foreign exchange rate in effect at 4 p.m. Eastern time on the day that the value of the security is determined.Over-the-counter (OTC) securities are valued within the range of the most recent quoted bid and ask prices. Securities that trade in multiple markets or on multiple exchanges are valued according to the broadest and most representative market. Certain equity securities are valued based upon fundamental characteristics or relationships to similar securities.
Debt securities generally trade in the OTC market rather than on a securities exchange. The Funds’ pricing services use multiple valuation techniques to determine fair value. In instances where sufficient market activity exists, the pricing services may utilize a market-based approach through which quotes from market makers are used to determine fair value. In instances where sufficient market activity may not exist or is limited, the pricing services also utilize proprietary valuation models which may consider market characteristics such as benchmark yield curves, credit spreads, estimated default rates, anticipated market interest rate volatility, coupon rates, anticipated timing of principal repayments, underlying collateral, and other unique security features in order to estimate the relevant cash flows, which are then discounted to calculate the fair value. Securities denominated in a foreign currency are converted into their U.S. dollar equivalent at the foreign exchange rate in effect at 4 p.m. Eastern time on the date that the values of the foreign debt securities are determined.
Investments inopen-end mutual funds are valued at the closing NAV. Investments in repurchase agreements are valued at cost, which approximates fair value.
The Funds have procedures to determine the fair value of financial instruments for which market prices are not reliable or readily available. Under these procedures, the Funds primarily employ a market-based approach which may use related or comparable assets or liabilities, recent transactions, market multiples, book values, and other relevant information for the investment to determine the fair value of the investment. An income-based valuation approach may also be used in which the anticipated future cash flows of the investment are discounted to calculate fair value. Discounts may also be applied due to the nature or duration of any
| franklintempleton.com | Semiannual Report | 103 | ||
FRANKLIN CUSTODIAN FUNDS
NOTES TO FINANCIAL STATEMENTS (UNAUDITED)
1. Organization and Significant Accounting Policies (continued)
a. Financial Instrument Valuation(continued)
restrictions on the disposition of the investments. Due to the inherent uncertainty of valuations of such investments, the fair values may differ significantly from the values that would have been used had an active market existed.
Trading in securities on foreign securities stock exchanges and OTC markets may be completed before 4 p.m. Eastern time. In addition, trading in certain foreign markets may not take place on every Funds’ business day. Occasionally, events occur between the time at which trading in a foreign security is completed and 4 p.m. Eastern time that might call into question the reliability of the value of a portfolio security held by the Fund. As a result, differences may arise between the value of the Funds’ portfolio securities as determined at the foreign market close and the latest indications of value at 4 p.m. Eastern time. In order to minimize the potential for these differences, the VC monitors price movements following the close of trading in foreign stock markets through a series of country specific market proxies (such as baskets of American Depositary Receipts, futures contracts and exchange traded funds). These price movements are measured against established trigger thresholds for each specific market proxy to assist in determining if an event has occurred that may call into question the reliability of the values of the foreign securities held by the Funds. If such an event occurs, the securities may be valued using fair value procedures, which may include the use of independent pricing services. At March 31, 2020, a market event occurred resulting in a portion of the securities held by certain or all Funds being valued using fair value procedures.
When the last day of the reporting period is anon-business day, certain foreign markets may be open on those days that the Funds’ NAV is not calculated, which could result in differences between the value of the Funds’ portfolio securities on the last business day and the last calendar day of the reporting period. Any significant security valuation changes due to an open foreign market are adjusted and reflected by the Funds for financial reporting purposes.
b. Foreign Currency Translation
Portfolio securities and other assets and liabilities denominated in foreign currencies are translated into U.S. dollars based on the exchange rate of such currencies
against U.S. dollars on the date of valuation. The Funds may enter into foreign currency exchange contracts to facilitate transactions denominated in a foreign currency. Purchases and sales of securities, income and expense items denominated in foreign currencies are translated into U.S. dollars at the exchange rate in effect on the transaction date. Portfolio securities and assets and liabilities denominated in foreign currencies contain risks that those currencies will decline in value relative to the U.S. dollar. Occasionally, events may impact the availability or reliability of foreign exchange rates used to convert the U.S. dollar equivalent value. If such an event occurs, the foreign exchange rate will be valued at fair value using procedures established and approved by the Board.
The Funds do not separately report the effect of changes in foreign exchange rates from changes in market prices on securities held. Such changes are included in net realized and unrealized gain or loss from investments in the Statements of Operations.
Realized foreign exchange gains or losses arise from sales of foreign currencies, currency gains or losses realized between the trade and settlement dates on securities transactions and the difference between the recorded amounts of dividends, interest, and foreign withholding taxes and the U.S. dollar equivalent of the amounts actually received or paid. Net unrealized foreign exchange gains and losses arise from changes in foreign exchange rates on foreign denominated assets and liabilities other than investments in securities held at the end of the reporting period.
c. Joint Repurchase Agreement
Certain or all Funds enter into a joint repurchase agreement whereby their uninvested cash balance is deposited into a joint cash account with other funds managed by the investment manager or an affiliate of the investment manager and is used to invest in one or more repurchase agreements. The value and face amount of the joint repurchase agreement are allocated to the funds based on theirpro-rata interest. A repurchase agreement is accounted for as a loan by the Fund to the seller, collateralized by securities which are delivered to the Funds’ custodian. The fair value, including accrued interest, of the initial collateralization is required to be at least 102% of the dollar amount invested by the funds, with the value of the underlying securities marked to market daily to maintain coverage of at least 100%. Repurchase agreements are subject to the terms of Master Repurchase
104 | Semiannual Report | franklintempleton.com | ||
FRANKLIN CUSTODIAN FUNDS
NOTES TO FINANCIAL STATEMENTS (UNAUDITED)
Agreements (MRAs) with approved counterparties (sellers). The MRAs contain various provisions, including but not limited to events of default and maintenance of collateral for repurchase agreements. In the event of default by either the seller or the Funds, certain MRAs may permit thenon-defaulting party to net andclose-out all transactions, if any, traded under such agreements. The Funds may sell securities it holds as collateral and apply the proceeds towards the repurchase price and any other amounts owed by the seller to the Funds in the event of default by the seller. This could involve costs or delays in addition to a loss on the securities if their value falls below the repurchase price owed by the seller. The joint repurchase agreement held by the Funds at period end, as indicated in the Statements of Investments, had been entered into on March 31, 2020.
d. Securities Purchased on a Delayed Delivery Basis
Certain or all Funds purchase securities on a delayed delivery basis, with payment and delivery scheduled for a future date. These transactions are subject to market fluctuations and are subject to the risk that the value at delivery may be more or less than the trade date purchase price. Although the Funds will generally purchase these securities with the intention of holding the securities, they may sell the securities before the settlement date. Sufficient assets have been segregated for these securities.
e. Derivative Financial Instruments
Certain or all Funds invested in derivative financial instruments in order to manage risk or gain exposure to various other investments or markets. Derivatives are financial contracts based on an underlying or notional amount, require no initial investment or an initial net investment that is smaller than would normally be required to have a similar response to changes in market factors, and require or permit net settlement. Derivatives contain various risks including the potential inability of the counterparty to fulfill their obligations under the terms of the contract, the potential for an illiquid secondary market, and/or the potential for market movements which expose the Fund to gains or losses in excess of the amounts shown in the Statements of Assets and Liabilities. Realized gain and loss and unrealized appreciation and depreciation on these contracts for the period are included in the Statements of Operations.
Derivative counterparty credit risk is managed through a formal evaluation of the creditworthiness of all potential counterparties. Certain or all Funds attempt to reduce their
exposure to counterparty credit risk on OTC derivatives, whenever possible, by entering into International Swaps and Derivatives Association (ISDA) master agreements with certain counterparties. These agreements contain various provisions, including but not limited to collateral requirements, events of default, or early termination. Termination events applicable to the counterparty include certain deteriorations in the credit quality of the counterparty. Termination events applicable to the Funds include failure of the Funds to maintain certain net asset levels and/or limit the decline in net assets over various periods of time. In the event of default or early termination, the ISDA master agreement gives thenon-defaulting party the right to net andclose-out all transactions traded, whether or not arising under the ISDA agreement, to one net amount payable by one counterparty to the other. However, absent an event of default or early termination, OTC derivative assets and liabilities are presented gross and not offset in the Statements of Assets and Liabilities. Early termination by the counterparty may result in an immediate payment by the Funds of any net liability owed to that counterparty under the ISDA agreement. At March 31, 2020, Franklin Income Fund had no OTC derivatives in a net liability position for such contracts.
Collateral requirements differ by type of derivative. Collateral terms are contract specific for OTC derivatives. For OTC derivatives traded under an ISDA master agreement, posting of collateral is required by either the Fund or the applicable counterparty if the total net exposure of all OTC derivatives with the applicable counterparty exceeds the minimum transfer amount, which typically ranges from $100,000 to $250,000, and can vary depending on the counterparty and the type of the agreement. Generally, collateral is determined at the close of Fund business each day and any additional collateral required due to changes in derivative values may be delivered by the Fund or the counterparty the next business day, or within a few business days. Collateral pledged and/or received by the Fund, if any, is held in segregated accounts with the Fund’s custodian/counterparty broker and can be in the form of cash and/or securities. Unrestricted cash may be invested according to the Funds’ investment objectives. To the extent that the amounts due to the Fund from its counterparties are not subject to collateralization or are not fully collateralized, the Fund bears the risk of loss from counterpartynon-performance.
Certain or all Funds entered into exchange traded futures contracts primarily to manage exposure to interest rate risk. A futures contract is an agreement between the Fund and a
| franklintempleton.com | Semiannual Report | 105 | ||
FRANKLIN CUSTODIAN FUNDS
NOTES TO FINANCIAL STATEMENTS (UNAUDITED)
1. Organization and Significant Accounting
Policies(continued)
e. Derivative Financial Instruments(continued)
counterparty to buy or sell an asset at a specified price on a future date. Required initial margins are pledged by the Fund, and the daily change in fair value is accounted for as a variation margin payable or receivable in the Statements of Assets and Liabilities.
Certain or all Funds entered into credit default swap contracts primarily to manage exposure to credit risk. A credit default swap is an agreement between the Fund and a counterparty whereby the buyer of the contract receives credit protection and the seller of the contract guarantees the credit worthiness of a referenced debt obligation. These agreements may be privately negotiated in theover-the-counter market (OTC credit default swaps) or may be executed in a multilateral trade facility platform, such as a registered exchange (centrally cleared credit default swaps). The underlying referenced debt obligation may be a single issuer of corporate or sovereign debt, a credit index, a basket of issuers or indices, or a tranche of a credit index or basket of issuers or indices. In the event of a default of the underlying referenced debt obligation, the buyer is entitled to receive the notional amount of the credit default swap contract from the seller in exchange for the referenced debt obligation, a net settlement amount equal to the notional amount of the credit default swap less the recovery value of the referenced debt obligation, or other agreed upon amount. For centrally cleared credit default swaps, required initial margins are pledged by the Fund, and the daily change in fair value is accounted for as a variation margin payable or receivable in the Statements of Assets and Liabilities. Over the term of the contract, the buyer pays the seller a periodic stream of payments, provided that no event of default has occurred. Such periodic payments are accrued daily as an unrealized appreciation or depreciation until the payments are made, at which time they are realized. Upfront payments and receipts are reflected in the Statements of Assets and Liabilities and represent compensating factors between stated terms of the credit default swap agreement and prevailing market conditions (credit spreads and other relevant factors). These upfront payments and receipts are amortized over the term of the contract as a realized gain or loss in the Statements of Operations.
Certain or all Funds purchased or wrote exchange traded option contracts primarily to manage exposure to equity price risk. An option is a contract entitling the holder to purchase or sell a specific amount of shares or units of an asset or notional amount of a swap (swaption), at a specified price. When an option is purchased or written, an amount equal to the premium paid or received is recorded as an asset or liability, respectively. Upon exercise of an option, the acquisition cost or sales proceeds of the underlying investment is adjusted by any premium received or paid. Upon expiration of an option, any premium received or paid is recorded as a realized gain or loss. Upon closing an option other than through expiration or exercise, the difference between the premium received or paid and the cost to close the position is recorded as a realized gain or loss.
See Note 9 regarding other derivative information.
f. Restricted Cash
At March 31, 2020, certain or all Funds held restricted cash in connection with investments in certain derivative securities. Restricted cash is held in a segregated account with the Fund’s custodian and is reflected in the Statements of Assets and Liabilities.
g. Index-Linked Notes
Certain or all Funds invest in index-linked notes. Index-linked notes are senior, unsecured, subordinated debt securities issued by a financial institution, and the value is based on the price movements of the underlying index. Index-linked notes are designed to provide investors access to the returns of various market benchmarks and intended to replicate the economic effects that would apply had the Fund directly purchased the underlying referenced asset or basket of assets. The risks of investing in index-linked notes include unfavorable price movements in the underlying index and the credit risk of the issuing financial institution. There may be no guarantee of a return of principal with index-linked notes and the appreciation potential may be limited. Index-linked notes may be more volatile and less liquid than other investments held by the Funds.
h. Equity-Linked Securities
Certain or all Funds invest in equity-linked securities. Equity-linked securities are hybrid financial instruments that generally combine both debt and equity characteristics into a single note form. Income received from equity-linked
106 | Semiannual Report | franklintempleton.com | ||
FRANKLIN CUSTODIAN FUNDS
NOTES TO FINANCIAL STATEMENTS (UNAUDITED)
securities is recorded as realized gains in the Statements of Operations and may be based on the performance of an underlying equity security, an equity index, or an option position. The risks of investing in equity-linked securities include unfavorable price movements in the underlying security and the credit risk of the issuing financial institution. There may be no guarantee of a return of principal with equity-linked securities and the appreciation potential may be limited. Equity-linked securities may be more volatile and less liquid than other investments held by the Funds.
i. Securities Lending
Certain or all Funds participate in an agency based securities lending program to earn additional income. The Fund receives cash collateral against the loaned securities in an amount equal to at least 102% of the fair value of the loaned securities. Collateral is maintained over the life of the loan in an amount not less than 100% of the fair value of loaned securities, as determined at the close of Fund business each day; any additional collateral required due to changes in security values is delivered to the Fund on the next business day. The collateral is deposited into a joint cash account with other funds and is used to invest in a money market fund managed by Franklin Advisers, Inc., an affiliate of the Funds, and/or a joint repurchase agreement. The Fund may receive income from the investment of cash collateral, in addition to lending fees and rebates paid by the borrower. Income from securities loaned, net of fees paid to the securities lending agent and/or third-party vendor, is reported separately in the Statements of Operations. The Fund bears the market risk with respect to the collateral investment, securities loaned, and the risk that the agent may default on its obligations to the Fund. If the borrower defaults on its obligation to return the securities loaned, the Fund has the right to repurchase the securities in the open market using the collateral received. The securities lending agent has agreed to indemnify the Fund in the event of default by a third party borrower.
j. Mortgage Dollar Rolls
Certain or all Funds enter into mortgage dollar rolls, typically on a TBA basis. Mortgage dollar rolls are agreements between the Fund and a financial institution where the Fund sells (or buys) mortgage-backed securities for delivery on a specified date and simultaneously contracts to repurchase (or sell) substantially similar (same type, coupon, and maturity) securities at a future date and at a predetermined price. Gains or losses are realized on the initial sale, and the
difference between the repurchase price and the sale price is recorded as an unrealized gain or loss to the Fund upon entering into the mortgage dollar roll. In addition, the Fund may invest the cash proceeds that are received from the initial sale. During the period between the sale and repurchase, the Fund is not entitled to principal and interest paid on the mortgage backed securities. Transactions in mortgage dollar rolls are accounted for as purchases and sales and may result in an increase to the Fund’s portfolio turnover rate. The risks of mortgage dollar roll transactions include the potential inability of the counterparty to fulfill its obligations.
k. Senior Floating Rate Interests
Certain or all Funds invest in senior secured corporate loans that pay interest at rates which are periodically reset by reference to a base lending rate plus a spread. These base lending rates are generally the prime rate offered by a designated U.S. bank or the London InterBank Offered Rate (LIBOR). Senior secured corporate loans often require prepayment of principal from excess cash flows or at the discretion of the borrower. As a result, actual maturity may be substantially less than the stated maturity. Senior secured corporate loans in which the Funds invest are generally readily marketable, but may be subject to certain restrictions on resale. On July 27, 2017, the United Kingdom’s Financial Conduct Authority announced its intention to cease sustaining LIBOR after 2021. There remains uncertainty regarding the future utilization of LIBOR and the nature of any replacement rate. As such, the potential effect of a transition away from LIBOR on the Fund or the Fund’s investments that use or may use a floating rate based on LIBOR cannot yet be determined.
l. Income and Deferred Taxes
It is each Fund’s policy to qualify as a regulated investment company under the Internal Revenue Code. Each Fund intends to distribute to shareholders substantially all of its taxable income and net realized gains to relieve it from federal income and excise taxes. As a result, no provision for U.S. federal income taxes is required.
The Funds may be subject to foreign taxation related to income received, capital gains on the sale of securities and certain foreign currency transactions in the foreign jurisdictions in which the Funds invest. Foreign taxes, if any, are recorded based on the tax regulations and rates that exist in the foreign markets in which the Funds invest. When a
| franklintempleton.com | Semiannual Report | 107 | ||
FRANKLIN CUSTODIAN FUNDS
NOTES TO FINANCIAL STATEMENTS (UNAUDITED)
1. Organization and Significant Accounting
Policies(continued)
l. Income and Deferred Taxes(continued)
capital gain tax is determined to apply, certain or all Funds record an estimated deferred tax liability in an amount that would be payable if the securities were disposed of on the valuation date.
As a result of several court cases, in certain countries across the European Union, certain or all Funds filed additional tax reclaims for previously withheld taxes on dividends earned in those countries (EU reclaims). These additional filings are subject to various administrative proceedings by the local jurisdictions’ tax authorities within the European Union, as well as a number of related judicial proceedings. Income recognized, if any, for EU reclaims is reflected as other income in the Statements of Operations and any related receivable, if any, is reflected as European Union tax reclaims in the Statements of Assets and Liabilities. When uncertainty exists as to the ultimate resolution of these proceedings, the likelihood of receipt of these EU reclaims, and the potential timing of payment, no amounts are reflected in the financial statements. For U.S. income tax purposes, EU reclaims received by the Funds, if any, reduce the amounts of foreign taxes Fund shareholders can use as tax credits in their individual income tax returns.
Each Fund may recognize an income tax liability related to its uncertain tax positions under U.S. GAAP when the uncertain tax position has a less than 50% probability that it will be sustained upon examination by the tax authorities based on its technical merits. As of March 31, 2020, each Fund has determined that no tax liability is required in its financial statements related to uncertain tax positions for any open tax years (or expected to be taken in future tax years). Open tax years are those that remain subject to examination and are based on the statute of limitations in each jurisdiction in which the Fund invests.
m. Security Transactions, Investment Income, Expenses and Distributions
Security transactions are accounted for on trade date. Realized gains and losses on security transactions are determined on a specific identification basis. Interest income and estimated expenses are accrued daily. Amortization of premium and accretion of discount on debt securities are included in interest income. Paydown gains and losses are
recorded separately on the Statements of Operations. Facility fees are recognized as income over the expected term of the loan. Dividend income is recorded on theex-dividend date except for certain dividends from securities where the dividend rate is not available. In such cases, the dividend is recorded as soon as the information is received by the Funds. Distributions to shareholders are recorded on theex-dividend date. Distributable earnings are determined according to income tax regulations (tax basis) and may differ from earnings recorded in accordance with U.S. GAAP. These differences may be permanent or temporary. Permanent differences are reclassified among capital accounts to reflect their tax character. These reclassifications have no impact on net assets or the results of operations. Temporary differences are not reclassified, as they may reverse in subsequent periods.
Common expenses incurred by the Trust are allocated among the Funds based on the ratio of net assets of each Fund to the combined net assets of the Trust or based on the ratio of number of shareholders of each Fund to the combined number of shareholders of the Trust. Fund specific expenses are charged directly to the Fund that incurred the expense.
Realized and unrealized gains and losses and net investment income, excluding class specific expenses, are allocated daily to each class of shares based upon the relative proportion of net assets of each class. Differences in per share distributions by class are generally due to differences in class specific expenses.
n. Accounting Estimates
The preparation of financial statements in accordance with U.S. GAAP requires management to make estimates and assumptions that affect the reported amounts of assets and liabilities at the date of the financial statements and the amounts of income and expenses during the reporting period. Actual results could differ from those estimates.
o. Guarantees and Indemnifications
Under the Trust’s organizational documents, its officers and trustees are indemnified by the Trust against certain liabilities arising out of the performance of their duties to the Trust. Additionally, in the normal course of business, the Trust, on behalf of the Funds, enters into contracts with service providers that contain general indemnification clauses. The Trust’s maximum exposure under these arrangements is
108 | Semiannual Report | franklintempleton.com | ||
FRANKLIN CUSTODIAN FUNDS
NOTES TO FINANCIAL STATEMENTS (UNAUDITED)
unknown as this would involve future claims that may be made against the Trust that have not yet occurred. Currently, the Trust expects the risk of loss to be remote.
2. Shares of Beneficial Interest
At March 31, 2020, there were an unlimited number of shares authorized (without par value). Transactions in the Funds’ shares were as follows:
| Franklin | Franklin | |||||||||||||||
| DynaTech Fund | Growth Fund | |||||||||||||||
| Shares | Amount | Shares | Amount | |||||||||||||
Class A Shares: | ||||||||||||||||
Six Months ended March 31, 2020 | ||||||||||||||||
Shares solda | 11,396,232 | $ | 980,814,504 | 7,657,367 | $ | 835,641,804 | ||||||||||
Shares issued in reinvestment of distributions | 402,760 | 34,512,504 | 4,607,922 | 498,807,538 | ||||||||||||
Shares issued on reorganization (Note 11) | — | — | 681,606 | 54,922,873 | ||||||||||||
Shares redeemed | (7,198,525 | ) | (616,195,036 | ) | (9,562,319 | ) | (1,020,655,027 | ) | ||||||||
Net increase (decrease) | 4,600,467 | $ | 399,131,972 | 3,384,576 | $ | 368,717,188 | ||||||||||
Year ended September 30, 2019 | ||||||||||||||||
Shares solda | 18,045,630 | $ | 1,406,354,947 | 12,734,660 | $ | 1,294,982,995 | ||||||||||
Shares issued in reinvestment of distributions | 1,181,936 | 85,513,056 | 1,182,058 | 118,489,471 | ||||||||||||
Shares redeemed | (10,956,984 | ) | (841,376,779 | ) | (14,767,957 | ) | (1,513,943,087 | ) | ||||||||
Net increase (decrease) | 8,270,582 | $ | 650,491,224 | (851,239 | ) | $ | (100,470,621 | ) | ||||||||
Class C Shares: | ||||||||||||||||
Six Months ended March 31, 2020 | ||||||||||||||||
Shares sold. | 2,080,106 | $ | 148,059,262 | 636,799 | $ | 67,139,693 | ||||||||||
Shares issued in reinvestment of distributions | 80,044 | 5,663,934 | 395,742 | 38,913,306 | ||||||||||||
Shares issued on reorganization (Note 11) | — | — | 131,927 | 9,642,973 | ||||||||||||
Shares redeemeda | (1,260,318 | ) | (88,412,076 | ) | (1,133,147 | ) | (109,858,682 | ) | ||||||||
Net increase (decrease) | 899,832 | $ | 65,311,120 | 31,321 | $ | 5,837,290 | ||||||||||
Year ended September 30, 2019 | ||||||||||||||||
Shares sold. | 3,070,856 | $ | 199,977,771 | 1,283,911 | $ | 119,568,065 | ||||||||||
Shares issued in reinvestment of distributions | 239,761 | 14,455,228 | 84,225 | 7,736,874 | ||||||||||||
Shares redeemeda | (3,574,686 | ) | (226,404,945 | ) | (5,118,036 | ) | (475,428,220 | ) | ||||||||
Net increase (decrease) | (264,069 | ) | $ | (11,971,946 | ) | (3,749,900 | ) | $ | (348,123,281 | ) | ||||||
| franklintempleton.com | Semiannual Report | 109 | ||
FRANKLIN CUSTODIAN FUNDS
NOTES TO FINANCIAL STATEMENTS (UNAUDITED)
2. Shares of Beneficial Interest(continued)
| Franklin | Franklin | |||||||||||||||
| DynaTech Fund | Growth Fund | |||||||||||||||
| Shares | Amount | Shares | Amount | |||||||||||||
Class R Shares: | ||||||||||||||||
Six Months ended March 31, 2020 | ||||||||||||||||
Shares sold. | 372,592 | $ | 31,417,953 | 218,527 | $ | 23,343,050 | ||||||||||
Shares issued in reinvestment of distributions | 12,156 | 1,008,426 | 215,326 | 23,244,460 | ||||||||||||
Shares issued on reorganization (Note 11) | — | — | 1,379 | 110,728 | ||||||||||||
Shares redeemed | (248,168 | ) | (20,592,977 | ) | (835,651 | ) | (90,077,341 | ) | ||||||||
Net increase (decrease) | 136,580 | $ | 11,833,402 | (400,419 | ) | $ | (43,379,103 | ) | ||||||||
Year ended September 30, 2019 | ||||||||||||||||
Shares sold. | 718,232 | $ | 54,816,432 | 386,516 | $ | 39,100,757 | ||||||||||
Shares issued in reinvestment of distributions | 33,480 | 2,351,628 | 54,920 | 5,489,301 | ||||||||||||
Shares redeemed | (426,266 | ) | (32,683,107 | ) | (1,371,370 | ) | (140,085,608 | ) | ||||||||
Net increase (decrease) | 325,446 | $ | 24,484,953 | (929,934 | ) | $ | (95,495,550 | ) | ||||||||
Class R6 Shares: | ||||||||||||||||
Six Months ended March 31, 2020 | ||||||||||||||||
Shares sold. | 10,494,645 | $ | 948,095,459 | 3,283,799 | $ | 355,216,648 | ||||||||||
Shares issued in reinvestment of distributions | 210,608 | 18,853,620 | 1,355,970 | 146,824,455 | ||||||||||||
Shares issued on reorganization (Note 11) | — | — | 8,606 | 694,117 | ||||||||||||
Shares redeemed | (5,389,758 | ) | (476,254,246 | ) | (3,204,339 | ) | (347,054,166 | ) | ||||||||
Net increase (decrease) | 5,315,495 | $ | 490,694,833 | 1,444,036 | $ | 155,681,054 | ||||||||||
Year ended September 30, 2019 | ||||||||||||||||
Shares sold. | 14,600,444 | $ | 1,197,778,037 | 5,242,855 | $ | 533,528,077 | ||||||||||
Shares issued in reinvestment of distributions | 557,220 | 41,953,067 | 416,642 | 41,768,390 | ||||||||||||
Shares redeemed | (6,571,287 | ) | (542,848,100 | ) | (7,008,411 | ) | (720,032,050 | ) | ||||||||
Net increase (decrease) | 8,586,377 | $ | 696,883,004 | (1,348,914 | ) | $ | (144,735,583 | ) | ||||||||
Advisor Class Shares: | ||||||||||||||||
Six Months ended March 31, 2020 | ||||||||||||||||
Shares sold. | 6,194,333 | $ | 554,167,456 | 3,438,021 | $ | 379,694,241 | ||||||||||
Shares issued in reinvestment of distributions | 95,164 | 8,429,620 | 1,537,666 | 166,713,686 | ||||||||||||
Shares issued on reorganization (Note 11) | — | — | 110,569 | 8,927,640 | ||||||||||||
Shares redeemed | (3,824,217 | ) | (335,741,548 | ) | (3,773,151 | ) | (403,980,684 | ) | ||||||||
Net increase (decrease) | 2,465,280 | $ | 226,855,528 | 1,313,105 | $ | 151,354,883 | ||||||||||
Year ended September 30, 2019 | ||||||||||||||||
Shares sold. | 8,540,729 | $ | 696,364,989 | 8,275,911 | $ | 843,459,997 | ||||||||||
Shares issued in reinvestment of distributions | 208,740 | 15,569,915 | 463,663 | 46,542,484 | ||||||||||||
Shares redeemedin-kind (Note 13) | — | — | (956,267 | ) | (87,335,163 | ) | ||||||||||
Shares redeemed | (3,396,410 | ) | (267,725,750 | ) | (8,294,264 | ) | (856,648,088 | ) | ||||||||
Net increase (decrease) | 5,353,059 | $ | 444,209,154 | (510,957 | ) | $ | (53,980,770 | ) | ||||||||
aMay include a portion of Class C shares that were automatically converted to Class A.
110 | Semiannual Report | franklintempleton.com | ||
FRANKLIN CUSTODIAN FUNDS
NOTES TO FINANCIAL STATEMENTS (UNAUDITED)
| Franklin | ||||||||||||||||
| Franklin | U.S. Government | |||||||||||||||
| Income Fund | Securities Fund | |||||||||||||||
| Shares | Amount | Shares | Amount | |||||||||||||
Class A Shares: | ||||||||||||||||
Six Months ended March 31, 2020 | ||||||||||||||||
Shares solda | 954,767,060 | $ | 2,142,931,859 | 62,831,196 | $ | 381,290,864 | ||||||||||
Shares issued in reinvestment of distributions | 86,317,041 | 197,281,254 | 1,039,061 | 6,313,185 | ||||||||||||
Shares redeemed | (403,313,278 | ) | (879,249,402 | ) | (13,716,122 | ) | (83,172,403 | ) | ||||||||
Net increase (decrease) | 637,770,823 | $ | 1,460,963,711 | 50,154,135 | $ | 304,431,646 | ||||||||||
Year ended September 30, 2019 | ||||||||||||||||
Shares solda | 3,539,972,556 | $ | 8,051,972,021 | 63,345,656 | $ | 375,877,932 | ||||||||||
Shares issued in reinvestment of distributions | 101,099,391 | 229,215,481 | 921,344 | 5,509,871 | ||||||||||||
Shares redeemed | (455,241,055 | ) | (1,031,150,814 | ) | (9,596,929 | ) | (57,176,939 | ) | ||||||||
Net increase (decrease) | 3,185,830,892 | $ | 7,250,036,688 | 54,670,071 | $ | 324,210,864 | ||||||||||
Class A1 Shares: | ||||||||||||||||
Six Months ended March 31, 2020 | ||||||||||||||||
Shares sold | 339,413,598 | $ | 761,495,380 | 29,805,271 | $ | 180,693,880 | ||||||||||
Shares issued in reinvestment of distributions | 405,935,717 | 930,099,841 | 5,322,771 | 32,324,222 | ||||||||||||
Shares redeemed | (1,584,226,364 | ) | (3,487,967,135 | ) | (58,949,287 | ) | (357,343,897 | ) | ||||||||
Net increase (decrease) | (838,877,049 | ) | $ | (1,796,371,914 | ) | (23,821,245 | ) | $ | (144,325,795 | ) | ||||||
Year ended September 30, 2019 | ||||||||||||||||
Shares sold | 734,292,978 | $ | 1,667,920,670 | 31,667,964 | $ | 188,180,745 | ||||||||||
Shares issued in reinvestment of distributions | 861,324,178 | 1,956,731,362 | 12,257,776 | 72,888,073 | ||||||||||||
Shares redeemed | (2,886,028,051 | ) | (6,545,500,654 | ) | (98,666,952 | ) | (584,924,153 | ) | ||||||||
Net increase (decrease) | (1,290,410,895 | ) | $ | (2,920,848,622 | ) | (54,741,212 | ) | $ | (323,855,335 | ) | ||||||
Class C Shares: | ||||||||||||||||
Six Months ended March 31, 2020 | ||||||||||||||||
Shares sold | 299,431,446 | $ | 686,310,875 | 12,878,656 | $ | 77,579,513 | ||||||||||
Shares issued in reinvestment of distributions | 118,425,116 | 275,486,700 | 642,788 | 3,875,196 | ||||||||||||
Shares redeemeda | (860,390,297 | ) | (1,934,967,096 | ) | (15,797,409 | ) | (95,045,869 | ) | ||||||||
Net increase (decrease) | (442,533,735 | ) | $ | (973,169,521 | ) | (2,275,965 | ) | $ | (13,591,160 | ) | ||||||
Year ended September 30, 2019 | ||||||||||||||||
Shares sold | 604,815,133 | $ | 1,395,555,258 | 9,900,368 | $ | 58,656,797 | ||||||||||
Shares issued in reinvestment of distributions | 282,624,044 | 650,966,785 | 1,677,007 | 9,894,309 | ||||||||||||
Shares redeemeda | (3,568,750,502 | ) | (8,244,148,551 | ) | (45,441,898 | ) | (266,169,376 | ) | ||||||||
Net increase (decrease) | (2,681,311,325 | ) | $ | (6,197,626,508 | ) | (33,864,523 | ) | $ | (197,618,270 | ) | ||||||
| franklintempleton.com | Semiannual Report | 111 | ||
FRANKLIN CUSTODIAN FUNDS
NOTES TO FINANCIAL STATEMENTS (UNAUDITED)
2. Shares of Beneficial Interest(continued)
| Franklin | ||||||||||||||||
| Franklin | U.S. Government | |||||||||||||||
| Income Fund | Securities Fund | |||||||||||||||
| Shares | Amount | Shares | Amount | |||||||||||||
Class R Shares: | ||||||||||||||||
Six Months ended March 31, 2020 | ||||||||||||||||
Shares sold | 14,707,091 | $ | 32,149,074 | 1,710,298 | $ | 10,386,213 | ||||||||||
Shares issued in reinvestment of distributions | 2,814,502 | 6,321,477 | 65,344 | 396,604 | ||||||||||||
Shares redeemed | (22,226,416 | ) | (48,075,831 | ) | (1,449,193 | ) | (8,786,255 | ) | ||||||||
Net increase (decrease) | (4,704,823 | ) | $ | (9,605,280 | ) | 326,449 | $ | 1,996,562 | ||||||||
Year ended September 30, 2019 | ||||||||||||||||
Shares sold | 22,136,825 | $ | 49,568,022 | 1,880,919 | $ | 11,250,749 | ||||||||||
Shares issued in reinvestment of distributions | 5,857,339 | 13,054,171 | 133,133 | 792,020 | ||||||||||||
Shares redeemed | (40,417,255 | ) | (90,037,504 | ) | (1,919,391 | ) | (11,427,767 | ) | ||||||||
Net increase (decrease) | (12,423,091 | ) | $ | (27,415,311 | ) | 94,661 | $ | 615,002 | ||||||||
Class R6 Shares: | ||||||||||||||||
Six Months ended March 31, 2020 | ||||||||||||||||
Shares sold | 63,138,967 | $ | 140,891,707 | 11,646,900 | $ | 71,021,649 | ||||||||||
Shares issued in reinvestment of distributions | 21,469,186 | 48,833,917 | 768,580 | 4,687,885 | ||||||||||||
Shares redeemed | (101,343,285 | ) | (217,922,562 | ) | (52,630,639 | ) | (321,305,551 | ) | ||||||||
Net increase (decrease) | (16,735,132 | ) | $ | (28,196,938 | ) | (40,215,159 | ) | $ | (245,596,017 | ) | ||||||
Year ended September 30, 2019 | ||||||||||||||||
Shares sold | 83,989,939 | $ | 189,707,762 | 59,439,310 | $ | 354,899,398 | ||||||||||
Shares issued in reinvestment of distributions | 44,158,383 | 99,481,277 | 4,115,777 | 24,590,060 | ||||||||||||
Shares redeemed | (191,415,233 | ) | (429,563,313 | ) | (87,769,171 | ) | (529,847,901 | ) | ||||||||
Net increase (decrease) | (63,266,911 | ) | $ | (140,374,274 | ) | (24,214,084 | ) | $ | (150,358,443 | ) | ||||||
Advisor Class Shares: | ||||||||||||||||
Six Months ended March 31, 2020 | ||||||||||||||||
Shares sold | 590,521,861 | $ | 1,313,219,485 | 32,888,646 | $ | 200,497,687 | ||||||||||
Shares issued in reinvestment of distributions | 125,683,653 | 285,462,541 | 2,240,995 | 13,655,486 | ||||||||||||
Shares redeemed | (928,220,496 | ) | (2,005,360,748 | ) | (30,411,914 | ) | (185,616,885 | ) | ||||||||
Net increase (decrease) | (212,014,982 | ) | $ | (406,678,722 | ) | 4,717,727 | $ | 28,536,288 | ||||||||
Year ended September 30, 2019 | ||||||||||||||||
Shares sold | 1,215,772,185 | $ | 2,742,135,489 | 86,539,808 | $ | 515,721,436 | ||||||||||
Shares issued in reinvestment of distributions | 241,618,818 | 544,234,079 | 4,124,300 | 24,667,003 | ||||||||||||
Shares redeemed | (1,205,298,748 | ) | (2,705,062,441 | ) | (58,081,812 | ) | (346,144,755 | ) | ||||||||
Net increase (decrease) | 252,092,255 | $ | 581,307,127 | 32,582,296 | $ | 194,243,684 | ||||||||||
aMay include a portion of Class C shares that were automatically converted to Class A.
112 | Semiannual Report | franklintempleton.com | ||
FRANKLIN CUSTODIAN FUNDS
NOTES TO FINANCIAL STATEMENTS (UNAUDITED)
| Franklin | ||||||||
| Utilities Fund | ||||||||
| Shares | Amount | |||||||
Class A Shares: | ||||||||
Six Months ended March 31, 2020 | ||||||||
Shares solda | 14,404,146 | $ | 314,583,509 | |||||
Shares issued in reinvestment of distributions | 685,432 | 14,595,315 | ||||||
Shares redeemed | (6,444,126 | ) | (137,815,356 | ) | ||||
Net increase (decrease) | 8,645,452 | $ | 191,363,468 | |||||
Year ended September 30, 2019 | ||||||||
Shares solda | 27,331,039 | $ | 549,681,782 | |||||
Shares issued in reinvestment of distributions | 567,087 | 11,254,351 | ||||||
Shares redeemed | (4,931,903 | ) | (100,183,516 | ) | ||||
Net increase (decrease) | 22,966,223 | $ | 460,752,617 | |||||
Class A1 Shares: | ||||||||
Six Months ended March 31, 2020 | ||||||||
Shares sold | 4,716,019 | $ | 102,233,546 | |||||
Shares issued in reinvestment of distributions | 4,932,427 | 104,982,347 | ||||||
Shares redeemed | (16,862,466 | ) | (355,414,747 | ) | ||||
Net increase (decrease) | (7,214,020 | ) | $ | (148,198,854 | ) | |||
Year ended September 30, 2019 | ||||||||
Shares sold | 12,428,032 | $ | 244,772,010 | |||||
Shares issued in reinvestment of distributions | 9,723,812 | 190,596,017 | ||||||
Shares redeemed | (32,697,882 | ) | (652,169,607 | ) | ||||
Net increase (decrease) | (10,546,038 | ) | $ | (216,801,580 | ) | |||
Class C Shares: | ||||||||
Six Months ended March 31, 2020 | ||||||||
Shares sold | 2,485,031 | $ | 53,749,827 | |||||
Shares issued in reinvestment of distributions | 851,843 | 18,010,569 | ||||||
Shares redeemeda | (5,038,188 | ) | (106,853,713 | ) | ||||
Net increase (decrease) | (1,701,314 | ) | $ | (35,093,317 | ) | |||
Year ended September 30, 2019 | ||||||||
Shares sold | 4,737,482 | $ | 94,764,608 | |||||
Shares issued in reinvestment of distributions | 1,745,793 | 33,948,245 | ||||||
Shares redeemeda | (17,173,602 | ) | (340,143,886 | ) | ||||
Net increase (decrease) | (10,690,327 | ) | $ | (211,431,033 | ) | |||
| franklintempleton.com | Semiannual Report | 113 | ||
FRANKLIN CUSTODIAN FUNDS
NOTES TO FINANCIAL STATEMENTS (UNAUDITED)
2. Shares of Beneficial Interest(continued)
| Franklin | ||||||||
| Utilities Fund | ||||||||
| Shares | Amount | |||||||
Class R Shares: | ||||||||
Six Months ended March 31, 2020 | ||||||||
Shares sold | 1,220,047 | $ | 26,681,320 | |||||
Shares issued in reinvestment of distributions | 127,096 | 2,691,958 | ||||||
Shares redeemed | (1,401,287 | ) | (29,471,257 | ) | ||||
Net increase (decrease) | (54,144 | ) | $ | (97,979 | ) | |||
Year ended September 30, 2019 | ||||||||
Shares sold | 2,089,705 | $ | 41,924,174 | |||||
Shares issued in reinvestment of distributions | 204,895 | 4,003,694 | ||||||
Shares redeemed | (1,612,008 | ) | (32,019,228 | ) | ||||
Net increase (decrease) | 682,592 | $ | 13,908,640 | |||||
Class R6 Shares: | ||||||||
Six Months ended March 31, 2020 | ||||||||
Shares sold | 2,996,667 | $ | 65,805,346 | |||||
Shares issued in reinvestment of distributions | 234,684 | 5,040,346 | ||||||
Shares redeemed | (2,135,269 | ) | (45,206,105 | ) | ||||
Net increase (decrease) | 1,096,082 | $ | 25,639,587 | |||||
Year ended September 30, 2019 | ||||||||
Shares sold | 3,594,861 | $ | 72,892,164 | |||||
Shares issued in reinvestment of distributions | 643,860 | 12,661,539 | ||||||
Shares redeemed | (9,878,250 | ) | (203,902,091 | ) | ||||
Net increase (decrease) | (5,639,529 | ) | $ | (118,348,388 | ) | |||
Advisor Class Shares: | ||||||||
Six Months ended March 31, 2020 | ||||||||
Shares sold | 12,038,178 | $ | 262,026,042 | |||||
Shares issued in reinvestment of distributions | 1,591,016 | 34,167,097 | ||||||
Shares redeemed | (10,528,096 | ) | (220,954,843 | ) | ||||
Net increase (decrease) | 3,101,098 | $ | 75,238,296 | |||||
Year ended September 30, 2019 | ||||||||
Shares sold | 21,320,610 | $ | 434,204,062 | |||||
Shares issued in reinvestment of distributions | 2,659,178 | 52,686,480 | ||||||
Shares redeemed | (17,744,082 | ) | (354,492,714 | ) | ||||
Net increase (decrease) | 6,235,706 | $ | 132,397,828 | |||||
aMay include a portion of Class C shares that were automatically converted to Class A.
114 | Semiannual Report | franklintempleton.com | ||
FRANKLIN CUSTODIAN FUNDS
NOTES TO FINANCIAL STATEMENTS (UNAUDITED)
3. Transactions with Affiliates
Franklin Resources, Inc. is the holding company for various subsidiaries that together are referred to as Franklin Templeton. Certain officers and trustees of the Trust are also officers and/or directors of the following subsidiaries:
| Subsidiary | Affiliation | |||
Franklin Advisers, Inc. (Advisers) | Investment manager | |||
Franklin Templeton Institutional, LLC (FT Institutional) | Investment manager | |||
Franklin Templeton Services, LLC (FT Services) | Administrative manager | |||
Franklin Templeton Distributors, Inc. (Distributors) | Principal underwriter | |||
Franklin Templeton Investor Services, LLC (Investor Services) | Transfer agent | |||
a. Management Fees
Franklin Income Fund and Franklin Utilities Fund pay an investment management fee to Advisers based on themonth-end net assets of each of the Funds as follows:
| Annualized Fee Rate | Net Assets | |
0.625% | Up to and including $100 million | |
0.500% | Over $100 million, up to and including $250 million | |
0.450% | Over $250 million, up to and including $7.5 billion | |
0.440% | Over $7.5 billion, up to and including $10 billion | |
0.430% | Over $10 billion, up to and including $12.5 billion | |
0.420% | Over $12.5 billion, up to and including $15 billion | |
0.400% | Over $15 billion, up to and including $17.5 billion | |
0.380% | Over $17.5 billion, up to and including $20 billion | |
0.360% | Over $20 billion, up to and including $35 billion | |
0.355% | Over $35 billion, up to and including $50 billion | |
0.350% | Over $50 billion, up to and including $65 billion | |
0.345% | Over $65 billion, up to and including $80 billion | |
0.340% | In excess of $80 billion |
| franklintempleton.com | Semiannual Report | 115 | ||
FRANKLIN CUSTODIAN FUNDS
NOTES TO FINANCIAL STATEMENTS (UNAUDITED)
3. Transactions with Affiliates(continued)
a. Management Fees(continued)
Franklin DynaTech Fund, Franklin Growth Fund and Franklin U.S. Government Securities Fund pay an investment management fee to Advisers based on themonth-end net assets of each of the Funds as follows:
| Annualized Fee Rate | Net Assets | |
0.625% | Up to and including $100 million | |
0.500% | Over $100 million, up to and including $250 million | |
0.450% | Over $250 million, up to and including $7.5 billion | |
0.440% | Over $7.5 billion, up to and including $10 billion | |
0.430% | Over $10 billion, up to and including $12.5 billion | |
0.420% | Over $12.5 billion, up to and including $15 billion | |
0.400% | Over $15 billion, up to and including $17.5 billion | |
0.380% | Over $17.5 billion, up to and including $20 billion | |
0.360% | Over $20 billion, up to and including $35 billion | |
0.355% | Over $35 billion, up to and including $50 billion | |
0.350% | In excess of $50 billion |
For the period ended March 31, 2020, each Fund’s annualized gross effective investment management fee rate based on average daily net assets was as follows:
| Franklin DynaTech Fund | Franklin Growth Fund | Franklin Income Fund | Franklin U.S. Government Securities Fund | Franklin Utilities Fund | ||||||||||||||
| 0.452% | 0.432% | 0.370% | 0.456% | 0.448% | ||||||||||||||
Effective October 24, 2019, under a subadvisory agreement, FT Institutional, an affiliate of Advisers, provides subadvisory services to Franklin U.S. Government Securities Fund. The subadvisory fee is paid by Advisers based on the Fund’s average daily net assets, and is not an additional expense of the Fund. Effective March 27, 2020, the subadvisory agreement was terminated for Franklin U.S. Government Securities Fund.
b. Administrative Fees
Under an agreement with Advisers, FT Services provides administrative services to the Funds. The fee is paid by Advisers based on each of the Funds’ average daily net assets, and is not an additional expense of the Funds.
c. Distribution Fees
The Board has adopted distribution plans for each share class, with the exception of Class R6 and Advisor Class shares, pursuant to Rule12b-1 under the 1940 Act. Under the Funds’ Class A and A1 reimbursement distribution plans, the Funds reimburse Distributors for costs incurred in connection with the servicing, sale and distribution of each Fund’s shares up to the maximum annual plan rate for each class. Under the Class A and A1 reimbursement distribution plans, costs exceeding the maximum for the current plan year cannot be reimbursed in subsequent periods. In addition, under the Funds’ Class C and R compensation distribution plans, the Funds pay Distributors for costs incurred in connection with the servicing, sale and distribution of each Fund’s shares up to the maximum annual plan rate for each class. The plan year, for purposes of monitoring compliance with the maximum annual plan rates, is February 1 through January 31 for each Fund.
116 | Semiannual Report | franklintempleton.com | ||
FRANKLIN CUSTODIAN FUNDS
NOTES TO FINANCIAL STATEMENTS (UNAUDITED)
The maximum annual plan rates, based on the average daily net assets, for each class, are as follows:
| Franklin DynaTech Fund | Franklin Growth Fund | Franklin Income Fund | Franklin U.S. Government Securities Fund | Franklin Utilities Fund | ||||||||||||||||
Reimbursement Plans: | ||||||||||||||||||||
Class A | 0.25% | 0.25% | 0.25% | 0.25% | 0.25% | |||||||||||||||
Class A1 | —% | —% | 0.15% | 0.15% | 0.15% | |||||||||||||||
Compensation Plans: | ||||||||||||||||||||
Class C | 1.00% | 1.00% | 0.65% | 0.65% | 0.65% | |||||||||||||||
Class R | 0.50% | 0.50% | 0.50% | 0.50% | 0.50% | |||||||||||||||
d. Sales Charges/Underwriting Agreements
Front-end sales charges and contingent deferred sales charges (CDSC) do not represent expenses of the Funds. These charges are deducted from the proceeds of sales of fund shares prior to investment or from redemption proceeds prior to remittance, as applicable. Distributors has advised the Funds of the following commission transactions related to the sales and redemptions of the Funds’ shares for the period:
Franklin DynaTech Fund | Franklin Growth Fund | Franklin Income Fund | Franklin U.S. Government Securities Fund | Franklin Utilities Fund | ||||||||||||||
Sales charges retained net of commissions paid to unaffiliated brokers/dealers | $1,355,278 | $774,459 | $1,599,320 | $53,688 | $147,072 | |||||||||||||
CDSC retained | $ 85,224 | $ 36,583 | $ 709,532 | $57,093 | $ 25,944 | |||||||||||||
e. Transfer Agent Fees
Each class of shares pays transfer agent fees to Investor Services for its performance of shareholder servicing obligations. The fees are based on an annualized asset based fee of 0.02% plus a transaction based fee. In addition, each class reimburses Investor Services for out of pocket expenses incurred and, except for Class R6, reimburses shareholder servicing fees paid to third parties. These fees are allocated daily based upon their relative proportion of such classes’ aggregate net assets. Class R6 pays Investor Services transfer agent fees specific to that class.
For the period ended March 31, 2020, the Funds paid transfer agent fees as noted in the Statements of Operations of which the following amounts were retained by Investor Services:
| Franklin DynaTech Fund | Franklin Growth Fund | Franklin Income Fund | Franklin U.S. Government | Franklin Utilities Fund | ||||||||||||||||
Transfer agent fees | $2,075,126 | $3,673,084 | $13,317,279 | $1,651,153 | $1,699,842 | |||||||||||||||
| franklintempleton.com | Semiannual Report | 117 | ||
FRANKLIN CUSTODIAN FUNDS
NOTES TO FINANCIAL STATEMENTS (UNAUDITED)
3. Transactions with Affiliates (continued)
f. Investments in Affiliated Management Investment Companies
Certain or all Funds invest in one or more affiliated management investment companies for purposes other than exercising a controlling influence over the management or policies. Management fees paid by the Funds are waived on assets invested in the affiliated management investment companies, as noted in the Statements of Operations, in an amount not to exceed the management and administrative fees paid directly or indirectly by each affiliate. During the period ended March 31, 2020, investments in affiliated management investment companies were as follows:
Value at of Period | Purchases | Sales | Realized Gain (Loss) | Net Change in Unrealized Appreciation (Depreciation) | Value at End of Period | Number of Held at End | Investment Income | |||||||||||||||||||||||||||||||||
Franklin DynaTech Fund |
| |||||||||||||||||||||||||||||||||||||||
Non-Controlled Affiliates |
| |||||||||||||||||||||||||||||||||||||||
| Dividends | ||||||||||||||||||||||||||||||||||||||||
|
| |||||||||||||||||||||||||||||||||||||||
Institutional Fiduciary Trust Money Market Portfolio, 0.32% | $ | 439,351,721 | $ | 1,052,301,314 | $ | (1,218,552,298 | ) | $ — | $ — | $ | 273,100,737 | 273,100,737 | $ | 1,866,127 | ||||||||||||||||||||||||||
| Income from securities loaned | ||||||||||||||||||||||||||||||||||||||||
|
| |||||||||||||||||||||||||||||||||||||||
Institutional Fiduciary Trust Money Market Portfolio, 0.32% | — | 110,765,000 | (71,284,000 | ) | — | — | 39,481,000 | 39,481,000 | 166,034 | |||||||||||||||||||||||||||||||
|
|
|
| |||||||||||||||||||||||||||||||||||||
Total Affiliated Securities | $ | 439,351,721 | $ | 1,163,066,314 | $ | (1,289,836,298 | ) | $ — | $ — | $ | 312,581,737 | $ | 2,032,161 | |||||||||||||||||||||||||||
|
|
|
| |||||||||||||||||||||||||||||||||||||
Franklin Growth Fund |
| |||||||||||||||||||||||||||||||||||||||
Non-Controlled Affiliates |
| |||||||||||||||||||||||||||||||||||||||
| Dividends | ||||||||||||||||||||||||||||||||||||||||
| �� |
|
| ||||||||||||||||||||||||||||||||||||||
Institutional Fiduciary Trust Money Market Portfolio, 0.32% | $ | 195,726,982 | $ | 915,827,619 | $ | (740,172,085 | ) | $ — | $ — | $ | 371,382,516 | 371,382,516 | $ | 1,265,726 | ||||||||||||||||||||||||||
| Income from securities loaned | ||||||||||||||||||||||||||||||||||||||||
|
| |||||||||||||||||||||||||||||||||||||||
Institutional Fiduciary Trust Money Market Portfolio, 0.32% | — | 89,087,000 | (77,703,000 | ) | — | — | 11,384,000 | 11,384,000 | 40,148 | |||||||||||||||||||||||||||||||
|
|
|
| |||||||||||||||||||||||||||||||||||||
Total Affiliated Securities | $ | 195,726,982 | $ | 1,004,914,619 | $ | (817,875,085 | ) | $ — | $ — | $ | 382,766,516 | $ | 1,305,874 | |||||||||||||||||||||||||||
|
|
|
| |||||||||||||||||||||||||||||||||||||
Franklin Income Fund |
| |||||||||||||||||||||||||||||||||||||||
Non-Controlled Affiliates |
| |||||||||||||||||||||||||||||||||||||||
| Dividends | ||||||||||||||||||||||||||||||||||||||||
|
| |||||||||||||||||||||||||||||||||||||||
Institutional Fiduciary Trust Money Market Portfolio, 0.32% | $ | 1,386,045,053 | $ | 18,077,984,634 | $ | (18,017,154,853 | ) | $ — | $ — | $ | 1,446,874,834 | 1,446,874,834 | $ | 18,482,642 | ||||||||||||||||||||||||||
118 | Semiannual Report | franklintempleton.com | ||
FRANKLIN CUSTODIAN FUNDS
NOTES TO FINANCIAL STATEMENTS (UNAUDITED)
Value at of Period | Purchases | Sales | Realized Gain (Loss) | Net Change in Unrealized Appreciation (Depreciation) | Value at End of Period | Number of Held at End | Investment Income | |||||||||||||||||||||||||||||
Franklin Income Fund(continued) |
| |||||||||||||||||||||||||||||||||||
Non-Controlled Affiliates(continued) |
| |||||||||||||||||||||||||||||||||||
| Income from securities loaned | ||||||||||||||||||||||||||||||||||||
|
| |||||||||||||||||||||||||||||||||||
Institutional Fiduciary Trust Money Market Portfolio, 0.32% | $ | 23,902,000 | $ | 18,746,000 | $ | (38,816,000 | ) | $ — | $ — | $ | 3,832,000 | 3,832,000 | $ | 81,606 | ||||||||||||||||||||||
|
|
|
| |||||||||||||||||||||||||||||||||
Total Affiliated Securities | $ | 1,409,947,053 | $ | 18,096,730,634 | $ | (18,055,970,853 | ) | $ — | $ — | $ | 1,450,706,834 | $ | 18,564,248 | |||||||||||||||||||||||
|
|
|
| |||||||||||||||||||||||||||||||||
Franklin U.S. Government Securities Fund |
| |||||||||||||||||||||||||||||||||||
Non-Controlled Affiliates |
| |||||||||||||||||||||||||||||||||||
| Dividends | ||||||||||||||||||||||||||||||||||||
|
| |||||||||||||||||||||||||||||||||||
Institutional Fiduciary Trust Money Market Portfolio, 0.32% | $ | 86,808,469 | $ | 470,185,932 | $ | (297,746,572 | ) | $ — | $ — | $ | 259,247,829 | 259,247,829 | $ | 873,116 | ||||||||||||||||||||||
|
|
|
| |||||||||||||||||||||||||||||||||
Franklin Utilities Fund |
| |||||||||||||||||||||||||||||||||||
Non-Controlled Affiliates |
| |||||||||||||||||||||||||||||||||||
| Dividends | ||||||||||||||||||||||||||||||||||||
|
| |||||||||||||||||||||||||||||||||||
Institutional Fiduciary Trust Money Market Portfolio, 0.32% | $ | 35,371,057 | $ | 440,695,084 | $ | (445,517,143 | ) | $ — | $ — | $ | 30,548,998 | 30,548,998 | $ | 169,413 | ||||||||||||||||||||||
|
|
|
| |||||||||||||||||||||||||||||||||
g. Waiver and Expense Reimbursements
For Franklin Income Fund, Investor Services has contractually agreed in advance to waive or limit its fees so that the Class R6 transfer agent fees do not exceed 0.02% based on the average net assets of the class until January 31, 2021. For Franklin DynaTech Fund, Franklin Growth Fund, Franklin U.S. Government Securities Fund and Franklin Utilities Fund, Investor Services has contractually agreed in advance to waive or limit its fees so that the Class R6 transfer agent fees do not exceed 0.03% based on the average net assets of the class until January 31, 2021.
h. Other Affiliated Transactions
At March 31, 2020, one or more of the funds in Franklin Fund Allocator Series owned a percentage of the following Funds’ outstanding shares:
| Franklin Growth Fund | Franklin Income Fund | Franklin U.S. Government Securities Fund | ||
5.2% | 1.6% | 0.2% |
| franklintempleton.com | Semiannual Report | 119 | ||
FRANKLIN CUSTODIAN FUNDS
NOTES TO FINANCIAL STATEMENTS (UNAUDITED)
3. Transactions with Affiliates(continued)
i. Interfund Transactions
Certain or all Funds engaged in purchases and sales of investments with funds or other accounts that have common investment managers (or affiliated investment managers), directors, trustees or officers. These purchases and sales for the period ended March 31, 2020, were as follows:
| Franklin Income Fund | Franklin U.S. Government Securities Fund | |||||||
Purchases | $13,406,250 | $ — | ||||||
Sales | $ — | $1,252,875 | ||||||
4. Expense Offset Arrangement
The Funds have entered into an arrangement with their custodian whereby credits realized as a result of uninvested cash balances are used to reduce a portion of the Funds’ custodian expenses. During the period ended March 31, 2020, the custodian fees were reduced as noted in the Statements of Operations.
5. Income Taxes
For tax purposes, capital losses may be carried over to offset future capital gains.
At September 30, 2019, the capital loss carryforwards were as follows:
| Franklin Income Fund | Franklin U.S. Government Securities Fund | |||||||
Capital loss carryforwards not subject to expiration: | ||||||||
Short term | $1,721,032,147 | $221,741,390 | ||||||
Long term | 737,972,108 | 341,766,354 | ||||||
|
| |||||||
Total capital loss carryforwards | $2,459,004,255 |
|
$563,507,744 |
| ||||
|
| |||||||
For tax purposes, the Funds may elect to defer any portion of a post-October capital loss or late-year ordinary loss to the first day of the following fiscal year. At September 30, 2019, Franklin DynaTech Fund deferred late-year ordinary losses of $14,242,754.
At March 31, 2020, the cost of investments and net unrealized appreciation (depreciation) for income tax purposes were as follows:
| Franklin | Franklin | Franklin | ||||||||||
| DynaTech Fund | Growth Fund | Income Fund | ||||||||||
| ||||||||||||
Cost of investments | $ | 6,252,694,957 | $ | 5,779,707,670 | $ | 68,956,027,063 | ||||||
Unrealized appreciation | $ | 3,522,065,879 | $ | 8,682,765,186 | $ | 4,143,263,686 | ||||||
Unrealized depreciation | (170,605,434 | ) | (278,201,106 | ) | (12,555,000,879 | ) | ||||||
Net unrealized appreciation (depreciation) | $ | 3,351,460,445 | $ | 8,404,564,080 | $ | (8,411,737,193 | ) | |||||
120 | Semiannual Report | franklintempleton.com | ||
FRANKLIN CUSTODIAN FUNDS
NOTES TO FINANCIAL STATEMENTS (UNAUDITED)
| Franklin U.S. Government Securities Fund | Franklin Utilities Fund | |||||||
Cost of investments | $5,073,985,133 | $ | 3,381,364,691 | |||||
Unrealized appreciation | $ 197,356,488 | $ | 2,627,095,473 | |||||
Unrealized depreciation | (2,894,245 | ) | (150,230,422 | ) | ||||
Net unrealized appreciation (depreciation) | $ 194,462,243 | $ | 2,476,865,051 | |||||
Differences between income and/or capital gains as determined on a book basis and a tax basis are primarily due to differing treatments of paydown losses, bond discounts and premiums, corporate actions, equity-linked securities, wash sales and gains realized onin-kind shareholder redemptions.
6. Investment Transactions
Purchases and sales of investments (excluding short term securities) for the period ended March 31, 2020, were as follows:
| Franklin DynaTech Fund | Franklin Growth Fund | Franklin Income Fund | Franklin U.S. Government Securities Fund | Franklin Utilities Fund | ||||||||||||||||
Purchases | $1,646,941,056 | $ 708,993,578 | $25,941,929,585 | $1,238,135,456 | $557,166,556 | |||||||||||||||
Sales | $ 344,646,493 | $1,345,613,350 | $29,020,030,913 | $1,366,560,179 | $561,885,645 | |||||||||||||||
At March 31, 2020, in connection with securities lending transactions, certain or all Funds loaned investments and received cash collateral as follows:
| Franklin DynaTech Fund | Franklin Growth Fund | Franklin Income Fund | ||||||||||
Securities lending transactionsa: | ||||||||||||
Equity Investmentsb | $46,551,315 | $19,805,871 | $4,790,031 | |||||||||
aThe agreements can be terminated at any time.
bThe gross amount of recognized liability for such transactions is included in payable upon return of securities loaned in the Statements of Assets and Liabilities.
7. Credit Risk
At March 31, 2020, Franklin Income Fund had 32.2% of its portfolio invested in high yield securities, senior secured floating rate loans, or other securities rated below investment grade and unrated securities, if any. These securities may be more sensitive to economic conditions causing greater price volatility and are potentially subject to a greater risk of loss due to default than higher rated securities.
8. Novel Coronavirus Pandemic
The global outbreak of the novel coronavirus disease, known asCOVID-19, has caused adverse effects on many companies, sectors, nations, regions and the markets in general, and may continue for an unpredictable duration. The effects of this pandemic may materially impact the value and performance of the Funds, their ability to buy and sell fund investments at appropriate valuations and their ability to achieve their investment objectives.
| franklintempleton.com | Semiannual Report | 121 | ||
FRANKLIN CUSTODIAN FUNDS
NOTES TO FINANCIAL STATEMENTS (UNAUDITED)
9. Other Derivative Information
At March 31, 2020, investments in derivative contracts are reflected in the Statements of Assets and Liabilities as follows:
Asset Derivatives | Liability Derivatives | |||||||||||||
Derivative Contracts Not Accounted for as Hedging Instruments | Statements of Assets and Liabilities | Fair Value | Statements of Assets and Liabilities | Fair Value | ||||||||||
| ||||||||||||||
Franklin Income Fund | ||||||||||||||
Credit contracts | OTC swap contracts (upfront payments) | $ | 5,622,500 | OTC swap contracts (upfront receipts) | $ | — | ||||||||
Unrealized appreciation on OTC swap contracts | 9,838,771 | Unrealized depreciation on OTC swap contracts | — | |||||||||||
Equity contracts | Investments in securities, at value | 1,157,410,000 | a | Options written, at value | 606,021,000 | |||||||||
|
|
|
| |||||||||||
Totals | $ | 1,172,871,271 | $ | 606,021,000 | ||||||||||
|
|
|
| |||||||||||
aPurchased option contracts are included in investments in securities, at value in the Statements of Assets and Liabilities.
For the period ended March 31, 2020, the effect of derivative contracts in the Statements of Operations was as follows:
Derivative Contracts Not Accounted for as Hedging Instruments | Statements of Operations Location | Net Realized Gain (Loss) for the Period | Statements of Operations Location | Net Change in Unrealized Appreciation (Depreciation) for the Period | ||||||
| Net realized gain (loss) from: | Net change in unrealized appreciation (depreciation) on: | |||||||||
Franklin Income Fund | ||||||||||
Interest rate contracts | Futures contracts | $ (57,189,500) | Futures contracts | $ (15,254,808) | ||||||
Credit contracts | Swap contracts | (971,250) | Swap contracts | 9,838,771 | ||||||
Equity contracts | Investments | (362,951,920) | a | Investments | 810,843,756a | |||||
| Written options | (101,328,838) | Written options | (485,681,641) | |||||||
|
|
| ||||||||
Totals | $ (522,441,508) | $319,746,078 | ||||||||
|
|
| ||||||||
aPurchased option contracts are included in net realized gain (loss) from investments and net change in unrealized appreciation (depreciation) on investments in the Statements of Operations.
For the period ended March 31, 2020, the average month end notional amount of futures contracts, swap contracts and options represented $1,289,309,152, $3,571,429 and 36,290,000 shares, repectively.
See Note 1(e) regarding derivative financial instruments.
122 | Semiannual Report | franklintempleton.com | ||
FRANKLIN CUSTODIAN FUNDS
NOTES TO FINANCIAL STATEMENTS (UNAUDITED)
10. Holdings of 5% Voting Securities of Portfolio Companies
The 1940 Act defines “affiliated companies” to include investments in portfolio companies in which a fund owns 5% or more of the outstanding voting securities. During the period ended March 31, 2020, investments in “affiliated companies” were as follows:
| Name of Issuer | Value at of Period | Purchases | Sales | Realized Gain (Loss) | Net Change in Unrealized Appreciation (Depreciation) | Value at End of Period | Number of at End of Period | Investment Income | ||||||||||||||||||||||||
Franklin Income Fund |
| |||||||||||||||||||||||||||||||
Non-Controlled Affiliates |
| |||||||||||||||||||||||||||||||
| Dividends | ||||||||||||||||||||||||||||||||
Chesapeake Energy Corp. | $ | 325,710,000 | $ | — | $ | (159,935,764 | ) | $ | (334,910,619 | ) | $ | 169,136,383 | $ | — | a | — | $ | — | ||||||||||||||
Chesapeake Energy Corp., cvt. pfd., 5.75% | 44,721,438 | — | (1,423,141 | ) | (21,796,084 | ) | — | b | — | b | — | b | 3,248,175 | |||||||||||||||||||
Weatherford International PLC | — | 331,232,648 | c | (1,652,292 | ) | 419,648 | (240,750,004 | ) | 89,250,000 | 15,000,000 | — | |||||||||||||||||||||
|
|
|
| |||||||||||||||||||||||||||||
| $ | 370,431,438 | $ | 331,232,648 | $ | (163,011,197 | ) | $ | (356,287,055 | ) | $ | (71,613,621 | ) | $ | 89,250,000 | $ | 3,248,175 | ||||||||||||||||
|
|
|
| |||||||||||||||||||||||||||||
| Interest | ||||||||||||||||||||||||||||||||
|
| |||||||||||||||||||||||||||||||
Chesapeake Energy Corp., cvt., senior note, 5.50%, 9/15/26 | 6,075,000 | 103,470,594 | c | (5,887,500 | ) | (10,437,322 | ) | — | b | — | b | — | b | 5,496,166 | ||||||||||||||||||
Chesapeake Energy Corp., senior bond, 8.00%, 6/15/27 | 135,500,000 | 14,777,377 | c | (139,196,735 | )c | — | (11,080,642 | ) | — | a | — | 4,468,444 | ||||||||||||||||||||
Chesapeake Energy Corp., senior note, 7.00%, 10/01/24 | 212,871,889 | 77,873,416 | c | (8,570,176 | ) | (21,786,042 | ) | — | b | — | b | — | b | 14,270,278 | ||||||||||||||||||
Chesapeake Energy Corp., senior note, 8.00%, 1/15/25 | 396,487,500 | 30,022,467 | c | (357,006,250 | )c | — | (69,503,717 | ) | — | a | — | 11,243,334 | ||||||||||||||||||||
Chesapeake Energy Corp., senior note, 7.50%, 10/01/26 | 88,502,000 | 114,424 | c | (66,260,220 | )c | — | (22,356,204 | ) | — | a | — | 2,099,500 | ||||||||||||||||||||
Chesapeake Energy Corp., senior note, 144A, 8.00%, 3/15/26 | 448,500,000 | 7,914,472 | c | (399,497,205 | )c | — | (56,917,267 | ) | — | a | — | 11,542,588 | ||||||||||||||||||||
|
|
|
| |||||||||||||||||||||||||||||
| $ | 1,287,936,389 | $ | 234,172,750 | $ | (976,418,086 | ) | $ | (32,223,364 | ) | $ | (159,857,830 | ) | $ | — | $ | 49,120,310 | ||||||||||||||||
|
|
|
| |||||||||||||||||||||||||||||
Total Affiliated Securities(Value is 0.1% of Net Assets) | $ | 1,658,367,827 | $ | 565,405,398 | $ | (1,139,429,283 | ) | $ | (388,510,419 | ) | $ | (231,471,451 | ) | $ | 89,250,000 | $ | 52,368,485 | |||||||||||||||
|
|
|
| |||||||||||||||||||||||||||||
aAs of March 31, 2020, no longer held by the fund.
bAs of March 31, 2020, no longer an affiliate.
cMay include accretion, amortization, partnership adjustments, and/or corporate actions.
11. Reorganization
On February 7, 2020, Franklin Growth Fund, pursuant to a plan of reorganization approved on July 17, 2019, by shareholders of Franklin Select U.S. Equity Fund (Acquired Fund), a series of Franklin Strategic Series, acquired 100% of the Acquired Fund’s net assets, primarily made up of investment securities, which included $34,292,301 of unrealized appreciation, through atax-free exchange of 934,087 shares of the Fund (valued at $108,590,632). Immediately after the completion of the reorganization, the combined net assets of the Fund were $17,919,822,034.
| franklintempleton.com | Semiannual Report | 123 | ||
FRANKLIN CUSTODIAN FUNDS
NOTES TO FINANCIAL STATEMENTS (UNAUDITED)
11. Reorganization(continued)
The primary purpose for the reorganization was to combine the Acquired Fund with a larger fund that had lower annual fund operating expense ratios, better overall historical performance, identical investment goals and similar principal investment strategies/risks. The estimated cost of the reorganization was $159,765 of which the Fund and the Acquired Fund each paid 25% and Advisers paid 50%. The allocated portion of the Fund’s reorganization expenses are included with other expenses in the Statement of Operations.
Assuming the reorganization had been completed on October 1, 2019, the Fund’s pro forma results of operations, would have been as follows:
| Period | Net Investment Income | Net Realized and Unrealized Gain (Loss) | Net Increase (Decrease) in Net Assets Resulting from Operations | |||||||||
For the period October 1, 2019 through March 31, 2020 | $38,118,570 | $(1,493,776,561) | $(1,455,657,991) | |||||||||
Subsequent to the reorganization, the Fund has been managed as a single entity. Accordingly, it is impracticable to identify the amounts of investment income and net investment income attributable to the Acquired Fund’s assets after the completion of the reorganization.
12. Credit Facility
The Funds, together with other U.S. registered and foreign investment funds (collectively, Borrowers), managed by Franklin Templeton, are borrowers in a joint syndicated senior unsecured credit facility totaling $2 billion (Global Credit Facility) which matures on February 5, 2021. This Global Credit Facility provides a source of funds to the Borrowers for temporary and emergency purposes, including the ability to meet future unanticipated or unusually large redemption requests.
Under the terms of the Global Credit Facility, the Funds shall, in addition to interest charged on any borrowings made by the Funds and other costs incurred by the Funds, pay their share of fees and expenses incurred in connection with the implementation and maintenance of the Global Credit Facility, based upon their relative share of the aggregate net assets of all of the Borrowers, including an annual commitment fee of 0.15% based upon the unused portion of the Global Credit Facility. These fees are reflected in other expenses in the Statements of Operations. During the period ended March 31, 2020, the Funds did not use the Global Credit Facility.
13. RedemptionsIn-Kind
During the year ended September 30, 2019, the Franklin Growth Fund realized $52,349,028 of net gains resulting from redemptionsin-kind in which a shareholder redeemed fund shares for cash and securities held by the Fund. Because such gains are not taxable to the Fund and are not distributed to remaining shareholders, they are reclassified from accumulated net realized gains topaid-in capital.
14. Fair Value Measurements
The Funds follow a fair value hierarchy that distinguishes between market data obtained from independent sources (observable inputs) and the Funds’ own market assumptions (unobservable inputs). These inputs are used in determining the value of the Funds’ financial instruments and are summarized in the following fair value hierarchy:
| • | Level 1 – quoted prices in active markets for identical financial instruments |
124 | Semiannual Report | franklintempleton.com | ||
FRANKLIN CUSTODIAN FUNDS
NOTES TO FINANCIAL STATEMENTS (UNAUDITED)
| • | Level 2 – other significant observable inputs (including quoted prices for similar financial instruments, interest rates, prepayment speed, credit risk, etc.) |
| • | Level 3 – significant unobservable inputs (including the Funds’ own assumptions in determining the fair value of financial instruments) |
The input levels are not necessarily an indication of the risk or liquidity associated with financial instruments at that level.
A summary of inputs used as of March 31, 2020, in valuing the Funds’ assets and liabilities carried at fair value, is as follows:
| Level 1 | Level 2 | Level 3 | Total | |||||||||||||
Franklin DynaTech Fund | ||||||||||||||||
Assets: | ||||||||||||||||
Investments in Securities:a | ||||||||||||||||
Equity Investments: | ||||||||||||||||
Biotechnology | $ 98,580,500 | $ | 13,159,596 | $ | — | $ | 111,740,096 | |||||||||
Health Care Equipment & Supplies | 866,119,100 | 21,255,315 | — | 887,374,415 | ||||||||||||
Interactive Media & Services | 653,512,266 | 9,979,305 | — | 663,491,571 | ||||||||||||
Internet & Direct Marketing Retail | 993,997,350 | 39,578,040 | — | 1,033,575,390 | ||||||||||||
IT Services | 1,013,635,085 | 107,350,611 | — | 1,120,985,696 | ||||||||||||
Life Sciences Tools & Services | 258,417,589 | 31,720,385 | — | 290,137,974 | ||||||||||||
Pharmaceuticals | 78,536,400 | 139,515,987 | — | 218,052,387 | ||||||||||||
All Other Equity Investments | 4,959,145,821 | — | — | 4,959,145,821 | ||||||||||||
Short Term Investments | 312,581,737 | 7,070,315 | — | 319,652,052 | ||||||||||||
|
| |||||||||||||||
Total Investments in Securities | $ 9,234,525,848 | $ | 369,629,554 | $ | — | $ | 9,604,155,402 | |||||||||
|
| |||||||||||||||
Franklin Growth Fund | ||||||||||||||||
Assets: | ||||||||||||||||
Investments in Securities:a | ||||||||||||||||
Equity Investments: | ||||||||||||||||
Software & Services | $ 2,356,532,626 | $ | 51,207,036 | $ | — | $ | 2,407,739,662 | |||||||||
All Other Equity Investments | 11,385,343,701 | — | — | 11,385,343,701 | ||||||||||||
Short Term Investments | 382,766,516 | 8,421,871 | — | 391,188,387 | ||||||||||||
|
| |||||||||||||||
Total Investments in Securities | $14,124,642,843 | $ | 59,628,907 | $ | — | $ | 14,184,271,750 | |||||||||
|
| |||||||||||||||
| franklintempleton.com | Semiannual Report | 125 | ||
FRANKLIN CUSTODIAN FUNDS
NOTES TO FINANCIAL STATEMENTS (UNAUDITED)
14. Fair Value Measurements(continued)
| Level 1 | Level 2 | Level 3 | Total | |||||||||||||
Franklin Income Fund | ||||||||||||||||
Assets: | ||||||||||||||||
Investments in Securities:a | ||||||||||||||||
Equity Investments:b | ||||||||||||||||
Communication Services | $ | 1,634,680,429 | $ | 133,692,821 | $ | — | $ | 1,768,373,250 | ||||||||
Consumer Staples | 1,582,040,000 | 151,205,290 | — | 1,733,245,290 | ||||||||||||
Energy | 2,300,215,095 | 2,518,542 | — | 2,302,733,637 | ||||||||||||
Financials | 2,975,071,379 | 304,720,834 | — | 3,279,792,213 | ||||||||||||
Health Care | 1,784,059,000 | 823,830,790 | — | 2,607,889,790 | ||||||||||||
Materials | 589,361,500 | 467,292,310 | — | 1,056,653,810 | ||||||||||||
All Other Equity Investments | 6,488,239,684 | — | — | 6,488,239,684 | ||||||||||||
Equity-Linked Securities | — | 11,284,414,399 | — | 11,284,414,399 | ||||||||||||
Index-Linked Notes | — | 142,451,010 | — | 142,451,010 | ||||||||||||
Convertible Bonds | — | 11,184,745 | — | 11,184,745 | ||||||||||||
Corporate Bonds | — | 20,455,916,417 | — | 20,455,916,417 | ||||||||||||
Senior Floating Rate Interests | — | 381,506,313 | — | 381,506,313 | ||||||||||||
U.S. Government and Agency Securities | — | 5,196,344,723 | — | 5,196,344,723 | ||||||||||||
Mortgage-Backed Securities | — | 1,825,556,053 | — | 1,825,556,053 | ||||||||||||
Escrows and Litigation Trusts | — | — | — | c | — | |||||||||||
Options Purchased | 1,157,410,000 | — | — | 1,157,410,000 | ||||||||||||
Short Term Investments | 1,450,706,834 | 7,892,702 | — | 1,458,599,536 | ||||||||||||
|
| |||||||||||||||
Total Investments in Securities | $ | 19,961,783,921 | $ | 41,188,526,949 | $ | — | $ | 61,150,310,870 | ||||||||
|
| |||||||||||||||
Other Financial Instruments: | ||||||||||||||||
Swap Contracts | $ | — | $ | 9,838,771 | $ | — | $ | 9,838,771 | ||||||||
|
| |||||||||||||||
Liabilities: | ||||||||||||||||
Other Financial Instruments: | ||||||||||||||||
Options Written | $ | 606,021,000 | $ | — | $ | — | $ | 606,021,000 | ||||||||
|
| |||||||||||||||
Franklin U.S. Government Securities Fund | ||||||||||||||||
Assets: | ||||||||||||||||
Investments in Securities:a | ||||||||||||||||
Mortgage-Backed Securities | $ | — | $ | 4,986,034,664 | $ | — | $ | 4,986,034,664 | ||||||||
U.S. Government and Agency Securities | — | 23,164,883 | — | 23,164,883 | ||||||||||||
Short Term Investments | 259,247,829 | — | — | 259,247,829 | ||||||||||||
|
| |||||||||||||||
Total Investments in Securities | $ | 259,247,829 | $ | 5,009,199,547 | $ | — | $ | 5,268,447,376 | ||||||||
|
| |||||||||||||||
126 | Semiannual Report | franklintempleton.com | ||
FRANKLIN CUSTODIAN FUNDS
NOTES TO FINANCIAL STATEMENTS (UNAUDITED)
| Level 1 | Level 2 | Level 3 | Total | |||||||||||||
Franklin Utilities Fund | ||||||||||||||||
Assets: | ||||||||||||||||
Investments in Securities:a | ||||||||||||||||
Equity Investments: | ||||||||||||||||
Telecommunication Services | $ | — | $ | 31,616,341 | $ | — | $ | 31,616,341 | ||||||||
Utilities | 5,495,022,765 | 154,902,556 | — | 5,649,925,321 | ||||||||||||
All Other Equity Investments | 139,576,438 | — | — | 139,576,438 | ||||||||||||
Corporate Bonds | — | 6,562,644 | — | 6,562,644 | ||||||||||||
Short Term Investments | 30,548,998 | — | — | 30,548,998 | ||||||||||||
Total Investments in Securities | $ | 5,665,148,201 | $ | 193,081,541 | $ | — | $ | 5,858,229,742 | ||||||||
aFor detailed categories, see the accompanying Statement of Investments.
bIncludes common, preferred and convertible preferred stocks.
cIncludes securities determined to have no value at March 31, 2020.
A reconciliation in which Level 3 inputs are used in determining fair value is presented when there are significant Level 3 assets and/or liabilities at the beginning and/or end of the period.
15. New Accounting Pronouncements
In March 2020, the Financial Accounting Standards Board (FASB) issued Accounting Standards Update (ASU)No. 2020-04, Reference Rate Reform (Topic 848) – Facilitation of the Effects of Reference Rate Reform on Financial Reporting. The amendments in the ASU provides optional temporary financial reporting relief from the effect of certain types of contract modifications due to the planned discontinuation of the London Interbank Offered Rate (LIBOR) and other interbank-offered based reference rates as of the end of 2021. The ASU is effective for certain reference rate-related contract modifications that occur during the period March 12, 2020 through December 31, 2022. Management is currently evaluating the impact, if any, of applying this ASU.
16. Subsequent Events
The Funds have evaluated subsequent events through the issuance of the financial statements and determined that no events have occurred that require disclosure other than those already disclosed in the financial statements.
Abbreviations
| Counterparty | Currency | Selected Portfolio | ||||||
| CITI Citigroup, Inc. | USD United States Dollar | ADR | American Depositary Receipt | |||||
| FHLMC | Federal Home Loan Mortgage Corp. | |||||||
| FNMA | Federal National Mortgage Association | |||||||
| FRN | Floating Rate Note | |||||||
| LIBOR | London InterBank Offered Rate | |||||||
| SF | Single Family | |||||||
| franklintempleton.com | Semiannual Report | 127 | ||
FRANKLIN CUSTODIAN FUNDS
Board Approval of Investment
Management Agreements
FRANKLIN CUSTODIAN FUNDS
Franklin DynaTech Fund
Franklin Growth Fund
Franklin Income Fund
Franklin U.S. Government Securities Fund
Franklin Utilities Fund
(each a Fund)
At anin-person meeting held on February 25, 2020 (Meeting), the Board of Trustees (Board) of Franklin Custodian Funds (Trust), including a majority of the trustees who are not “interested persons” as defined in the Investment Company Act of 1940 (Independent Trustees), reviewed and approved the continuance of the investment management agreement between Franklin Advisers, Inc. (Manager) and the Trust, on behalf of each Fund (each a Management Agreement) for an additionalone-year period. The Independent Trustees received advice from and met separately with Independent Trustee counsel in considering whether to approve the continuation of each Management Agreement. Although the Management Agreements for the Funds were considered at the same Board meeting, the Board considered the information provided to it about the Funds together and with respect to each Fund separately as the Board deemed appropriate.
In considering the continuation of each Management Agreement, the Board reviewed and considered information provided by the Manager at the Meeting and throughout the year at meetings of the Board and its committees. The Board also reviewed and considered information provided in response to a detailed set of requests for information submitted to the Manager by Independent Trustee counsel on behalf of the Independent Trustees in connection with the annual contract renewal process. In addition, prior to the Meeting, the Independent Trustees held a telephonic contract renewal meeting at which the Independent Trustees conferred amongst themselves and Independent Trustee counsel about contract renewal matters and, in some cases, requested additional information from the Manager relating to the contract. The Board reviewed and considered all of the factors it deemed relevant in approving the continuance of each Management Agreement, including, but not limited to: (i) the nature, extent and quality of the services provided by the Manager; (ii) the investment performance of each Fund; (iii) the costs of the services provided and profits realized by the Manager and its affiliates from the
relationship with each Fund; (iv) the extent to which economies of scale are realized as each Fund grows; and (v) whether fee levels reflect these economies of scale for the benefit of Fund investors.
In approving the continuance of each Management Agreement, the Board, including a majority of the Independent Trustees, determined that the terms of the Management Agreement are fair and reasonable and that the continuance of such Management Agreement is in the interests of the applicable Fund and its shareholders. While attention was given to all information furnished, the following discusses some primary factors relevant to the Board’s determination.
Nature, Extent and Quality of Services
The Board reviewed and considered information regarding the nature, extent and quality of investment management services provided by the Manager and its affiliates to the Funds and their shareholders. This information included, among other things, the qualifications, background and experience of the senior management and investment personnel of the Manager, as well as information on succession planning where appropriate; the structure of investment personnel compensation; oversight of third-party service providers; investment performance reports and related financial information for each Fund; reports on expenses and shareholder services; legal and compliance matters; risk controls; pricing and other services provided by the Manager and its affiliates; and management fees charged by the Manager and its affiliates to US funds and other accounts, including management’s explanation of differences among accounts where relevant. The Board also reviewed and considered an annual report on payments made by Franklin Templeton (FT) or the Funds to financial intermediaries, as well as a memorandum relating to third-party servicing arrangements, which included discussion of the changing distribution landscape for the Funds. The Board noted management’s continuing efforts and expenditures in establishing effective business continuity plans and developing strategies to address areas of heightened concern in the mutual fund industry, such as cybersecurity and liquidity risk management.
The Board also reviewed and considered the benefits provided to Fund shareholders of investing in a fund that is part of the FT family of funds. The Board noted the financial position of Franklin Resources, Inc. (FRI), the Manager’s parent, and its commitment to the mutual fund business as evidenced by its continued introduction of new funds,
128 | Semiannual Report | franklintempleton.com | ||
FRANKLIN CUSTODIAN FUNDS
SHAREHOLDER INFORMATION
reassessment of the fund offerings in response to the market environment and project initiatives and capital investments relating to the services provided to the Funds by the FT organization. The Board specifically noted FT’s commitment to enhancing services and controlling costs, as reflected in its plan to outsource certain administrative functions, and growth opportunities, as evidenced by its upcoming acquisition of the Legg Mason companies. The Board acknowledged the change in leadership at FRI and the opportunity to hear from Jennifer Johnson, President and Chief Executive Officer of FRI, about goals she has for the company that will benefit the Funds.
Following consideration of such information, the Board was satisfied with the nature, extent and quality of services provided by the Manager and its affiliates to the Funds and their shareholders.
Fund Performance
The Board reviewed and considered the performance results of each Fund over various time periods ended December 31, 2019. The Board considered the performance returns for each Fund in comparison to the performance returns of mutual funds deemed comparable to the Fund included in a universe (Performance Universe) selected by Broadridge Financial Solutions, Inc. (Broadridge), an independent provider of investment company data. The Board received a description of the methodology used by Broadridge to select the mutual funds included in a Performance Universe. The Board also considered the performance returns for the Franklin Income Fund in comparison to the performance returns of a customized peer group (Performance Customized Peer Group) selected by the Manager. The Board further reviewed and considered Fund performance reports provided and discussions that occurred with portfolio managers at Board meetings throughout the year. A summary of each Fund’s performance results is below.
Franklin DynaTech Fund – The Performance Universe for the Fund included the Fund and all retail and institutionalmulti-cap growth funds. The Board noted that the Fund’s annualized total return for theone-, three-, five- and10-year periods was above the median of its Performance Universe. The Board concluded that the Fund’s performance was satisfactory.
Franklin Growth Fund – The Performance Universe for the Fund included the Fund and all retail and institutionalmulti-cap growth funds. The Board noted that the Fund’s annualized total return for the three- and10-year periods was below the median of its Performance Universe, but for
theone- and five-year periods was above the median of its Performance Universe. The Board concluded that the Fund’s performance was satisfactory.
Franklin Income Fund – The Performance Universe for the Fund included the Fund and all retail and institutional mixed-asset target allocation moderate funds. The Performance Customized Peer Group for the Fund included funds sorted by trailing12-month yield and set to be top quartile (highest yield). The Board noted that the Fund’s annualized income returns for theone-, three-, five- and10-year periods were above the medians of its Performance Universe and Performance Customized Peer Group. The Board also noted that the Fund’s annualized total returns for theone-, three- and five-year periods were below the medians of its Performance Universe and Performance Customized Peer Group, but for the10-year periods were above the medians of its Performance Universe and Performance Customized Peer Group. Given the Fund’s income-oriented investment objective, the Board concluded that the Fund’s performance was satisfactory.
Franklin U.S. Government Securities Fund –The Performance Universe for the Fund included the Fund and all retail and institutional Government National Mortgage Association (Ginnie Mae) funds. The Board noted that the Fund’s annualized income return for theone-, three-,five-and10-year periods was above the median of its Performance Universe. The Board also noted that the Fund’s annualized total return for theone-, three-, five- and10-year periods was below the median of its Performance Universe. Given the Fund’s income-oriented investment objective and conservative policy of investing substantially all of its assets in Ginnie Mae obligations, the Board concluded that the Fund’s performance was satisfactory.
Franklin Utilities Fund – The Performance Universe for the Fund included the Fund and all retail and institutional utility funds. The Board noted that the Fund’s annualized income return for theone-, three-, five- and10-year periods was above the median of its Performance Universe. The Board also noted that the Fund’s annualized total return for the three-year period was below the median of its Performance Universe, but for theone-, five- and10-year periods was above the median of its Performance Universe. The Board concluded that the Fund’s performance was satisfactory.
Comparative Fees and Expenses
The Board reviewed and considered information regarding each Fund’s actual total expense ratio and its various components, including, as applicable, management fees;
| franklintempleton.com | Semiannual Report | 129 | ||
FRANKLIN CUSTODIAN FUNDS
SHAREHOLDER INFORMATION
transfer agent expenses; underlying fund expenses; Rule12b-1 andnon-Rule12b-1 service fees; and othernon-management fees. The Board also noted the quarterly and annual reports it receives on all marketing support payments made by FT to financial intermediaries. The Board considered the actual total expense ratio and, separately, the contractual management fee rate, without the effect of fee waivers, if any (Management Rate) of each Fund in comparison to the median expense ratio and median Management Rate, respectively, of other mutual funds deemed comparable to and with a similar expense structure to the Fund selected by Broadridge (Expense Group). Broadridge fee and expense data is based upon information taken from each fund’s most recent annual report, which reflects historical asset levels that may be quite different from those currently existing, particularly in a period of market volatility. While recognizing such inherent limitation and the fact that expense ratios and Management Rates generally increase as assets decline and decrease as assets grow, the Board believed the independent analysis conducted by Broadridge to be an appropriate measure of comparative fees and expenses. The Broadridge Management Rate includes administrative charges, and the actual total expense ratio, for comparative consistency, was shown for Class A1 shares for the Franklin Income Fund, Franklin U.S. Government Securities Fund and Franklin Utilities Fund and for Class A shares for each other Fund and for each other fund in the applicable Expense Group. The Board received a description of the methodology used by Broadridge to select the mutual funds included in an Expense Group.
Franklin DynaTech Fund, Franklin Growth Fund, Franklin Income Fund and Franklin Utilities Fund – The Expense Group for the Franklin DynaTech Fund included the Fund and 12 othermulti-cap growth funds. The Expense Group for the Franklin Growth Fund included the Fund and nine othermulti-cap growth funds. The Expense Group for the Franklin Income Fund included the Fund and eight other mixed-asset target allocation moderate funds. The Expense Group for the Franklin Utilities Fund included the Fund and seven other utility funds. The Board noted that the Management Rates and actual total expense ratios for the Funds were below the medians of their respective Expense Groups. The Board concluded that the Management Rates charged to the Funds are reasonable.
Franklin U.S. Government Securities Fund – The Expense Group for the Fund included the Fund, six other Ginnie Mae funds, and eight US mortgage funds. The Board noted that
the Management Rate for the Fund was equal to the median of its Expense Group. The Board also noted that the actual total expense ratio for the Fund was below the median of its Expense Group. The Board concluded that the Management Rate charged to the Fund is reasonable.
Profitability
The Board reviewed and considered information regarding the profits realized by the Manager and its affiliates in connection with the operation of each Fund. In this respect, the Board considered the Fund profitability analysis provided by the Manager that addresses the overall profitability of FT’s US fund business, as well as its profits in providing investment management and other services to each of the individual funds during the12-month period ended September 30, 2019, being the most recent fiscalyear-end for FRI. The Board noted that although management continually makes refinements to its methodologies used in calculating profitability in response to organizational and product-related changes, the overall methodology has remained consistent with that used in the Funds’ profitability report presentations from prior years. Additionally, PricewaterhouseCoopers LLP, auditor to FRI and certain FT funds, was engaged by the Manager to review and assess the allocation methodologies to be used solely by the Funds’ Board with respect to the profitability analysis.
The Board noted management’s belief that costs incurred in establishing the infrastructure necessary for the type of mutual fund operations conducted by the Manager and its affiliates may not be fully reflected in the expenses allocated to each Fund in determining its profitability, as well as the fact that the level of profits, to a certain extent, reflected operational cost savings and efficiencies initiated by management. As part of this evaluation, the Board considered the initiative currently underway to outsource certain operations, which effort would require considerable up front expenditures by the Manager but, over the long run is expected to result in greater efficiencies. The Board also noted management’s expenditures in improving shareholder services provided to the Funds, as well as the need to implement systems and meet additional regulatory and compliance requirements resulting from recent US Securities and Exchange Commission and other regulatory requirements, notably in the area of cybersecurity protections.
The Board also considered the extent to which the Manager and its affiliates might derive ancillary benefits from fund operations, including revenues generated from transfer agent
130 | Semiannual Report | franklintempleton.com | ||
FRANKLIN CUSTODIAN FUNDS
SHAREHOLDER INFORMATION
services, potential benefits resulting from personnel and systems enhancements necessitated by fund growth, as well as increased leverage with service providers and counterparties. Based upon its consideration of all these factors, the Board concluded that the level of profits realized by the Manager and its affiliates from providing services to each Fund was not excessive in view of the nature, extent and quality of services provided to each Fund.
Economies of Scale
The Board reviewed and considered the extent to which the Manager may realize economies of scale, if any, as each Fund grows larger and whether each Fund’s management fee structure reflects any economies of scale for the benefit of shareholders. With respect to possible economies of scale, the Board noted the existence of management fee breakpoints, which operate generally to share any economies of scale with a Fund’s shareholders by reducing the Fund’s effective management fees as the Fund grows in size. The Board considered the Manager’s view that any analyses of potential economies of scale in managing a particular fund are inherently limited in light of the joint and common costs and investments the Manager incurs across the FT family of funds as a whole. The Board concluded that to the extent economies of scale may be realized by the Manager and its affiliates, each Fund’s management fee structure provided a sharing of benefits with the Fund and its shareholders as the Fund grows.
Conclusion
Based on its review, consideration and evaluation of all factors it believed relevant, including the above-described factors and conclusions, the Board unanimously approved the continuation of each Management Agreement for an additionalone-year period.
Proxy Voting Policies and Procedures
The Trust’s investment manager has established Proxy Voting Policies and Procedures (Policies) that the Trust uses to determine how to vote proxies relating to portfolio securities. Shareholders may view the Trust’s complete Policies online at franklintempleton.com. Alternatively, shareholders may request copies of the Policies free of charge by calling the Proxy Group collect at (954)527-7678 or by sending a written request to: Franklin Templeton Companies, LLC, 300 S.E. 2nd Street, Fort Lauderdale, FL 33301, Attention: Proxy Group. Copies of the Trust’s proxy voting records are also made available online at franklintempleton.com and posted on the U.S. Securities and
Exchange Commission’s website at sec.gov and reflect the most recent12-month period ended June 30.
Quarterly Statement of Investments
The Trust files a complete statement of investments with the U.S. Securities and Exchange Commission for the first and third quarters for each fiscal year as an exhibit to its report on FormN-PORT. Shareholders may view the filed FormN-PORT by visiting the Commission’s website at sec.gov. The filed form may also be viewed and copied at the Commission’s Public Reference Room in Washington, DC. Information regarding the operations of the Public Reference Room may be obtained by calling(800) SEC-0330.
| franklintempleton.com | Semiannual Report | 131 | ||
This page intentionally left blank.
Authorized for distribution only when accompanied or preceded by a summary prospectus and/or prospectus. Investors should carefully consider a fund’s investment goals, risks, charges and expenses before investing. A prospectus contains this and other information; please read it carefully before investing.
To help ensure we provide you with quality service, all calls to and from our service areas are monitored and/or recorded.
 | Semiannual Report and Shareholder Letter | |||||||
| Franklin Custodian Funds | ||||||||
Investment Manager |
Distributor |
Shareholder Services | ||||||
| Franklin Advisers, Inc. | Franklin Templeton Distributors, Inc. | (800)632-2301 | ||||||
| (800) DIAL BEN®/342-5236 | ||||||||
| franklintempleton.com | ||||||||
| © 2020 Franklin Templeton Investments. All rights reserved. | FCF S 05/20 | |||||||
Sign up for electronic delivery at franklintempleton.com/edelivery
Internet Delivery of Fund Reports Unless You Request Paper Copies:Effective January 1, 2021, as permitted by the SEC, paper copies of the Fund’s shareholder reports will no longer be sent by mail, unless you specifically request them from the Fund or your financial intermediary. Instead, the reports will be made available on a website, and you will be notified by mail each time a report is posted and provided with a website link to access the report.
If you already elected to receive shareholder reports electronically, you will not be affected by this change and you need not take any action. If you have not signed up for electronic delivery, we would encourage you to join fellow shareholders who have. You may elect to receive shareholder reports and other communications electronically from the Fund by calling (800)632-2301 or by contacting your financial intermediary.
You may elect to continue to receive paper copies of all your future shareholder reports free of charge by contacting your financial intermediary or, if you invest directly with a Fund, calling (800)632-2301 to let the Fund know of your request. Your election to receive reports in paper will apply to all funds held in your account.
SHAREHOLDER LETTER
Dear Shareholder:
During 2019’s last quarter, the U.S. economy continued to grow moderately, mainly due to concerns about trade. To support the economy, the U.S. Federal Reserve (Fed) lowered the federal funds rate by 0.25% at its October 2019 meeting. However, amid larger economic risks posed by the novel coronavirus(COVID-19) outbreak towardperiod-end, the Fed lowered its key rate again by 0.50% on March 3 and further by 1.00% on March 15, decreasing the rate during the period from 2.00% to 0.25%. In its efforts to support U.S. economic activity, the Fed also announced a plan to purchase government, government-backed and corporate bonds, which would significantly expand its balance sheet.
The10-year U.S. Treasury yield was 1.68% on September 30, 2019, and decreased to 0.70% at the end of March 2020. In this environment, the prices of U.S. stocks, as measured by the Standard & Poor’s® 500 Index (S&P 500®), dropped 13.17%, (the index decreasing from 2,976.74 to 2,584.59).1,2
We are committed to our long-term perspective and disciplined investment approach as we conduct a rigorous, fundamental analysis of securities with a regular emphasis on investment risk management.
We believe active, professional investment management serves investors well. We also recognize the important role of financial advisors in today’s markets and encourage investors to continue to seek their advice. Amid changing markets and economic conditions, we are confident investors
with a well-diversified portfolio and a patient, long-term outlook should be well-positioned for the years ahead.
Franklin Focused Growth Fund’s semiannual report includes more detail about prevailing conditions and a discussion about investment decisions during the period. Please remember all securities markets fluctuate, as do mutual fund share prices.
We thank you for investing with Franklin, welcome your questions and comments, and look forward to serving your future investment needs.
Sincerely,

Rupert H. Johnson, Jr.
Chairman
Franklin Custodian Funds
This letter reflects our analysis and opinions as of March 31, 2020, unless otherwise indicated. The information is not a complete analysis of every aspect of any market, country, industry, security or fund. Statements of fact are from sources considered reliable.
1. Source: Copyright© 2020, S&P Dow Jones Indices LLC. All rights reserved.
2. Source: Morningstar. The changes in index prices shown for the S&P 500 do not include reinvestments of income and distributions, which are included in its total return, which was: S&P 500-12.31% (index total return resulting in a decrease from 6,008.59 to 5,269.20).
See www.franklintempletondatasources.com for additional data provider information.
Not FDIC Insured | May Lose Value | No Bank Guarantee
|
| franklintempleton.com | Not part of the semiannual report | 1 | ||
| 3 | ||||
| 6 | ||||
| 8 | ||||
| 9 | ||||
| 16 | ||||
| 20 | ||||
| 28 | ||||
| Visitfranklintempleton.comfor fund updates, to access your account, or to find helpful financial planning tools. |
2 | Semiannual Report | franklintempleton.com | ||
This semiannual report for Franklin Focused Growth Fund covers the period ended March 31, 2020. The Fund commenced operations on April 12, 2016, and initiated Advisor Class shares fornon-public use. The Fund began offering Class A, Class C, Class R and Class R6, as well as Advisor Class shares, to the public on February 14, 2020.
Your Fund’s Goal and Main Investments
The Fund seeks capital appreciation by investing in an equity securities portfolio of approximately 20–50 companies that we believe offers a compellingtrade-off between growth opportunity, business and financial risk and valuation.
Performance Overview
The Fund’s Class A shares posted a-0.15% cumulative total return for the six months under review.1 In comparison, the Russell 1000® Growth Index, which measures performance of those Russell 1000® Index companies with higherprice-to-book ratios and higher forecasted growth values, posted a-4.98% total return.2 You can find more of the Fund’s performance data in the Performance Summary beginning on page 6.
Performance data represent past performance, which does not guarantee future results. Investment return and principal value will fluctuate, and you may have a gain or loss when you sell your shares. Current performance may differ from figures shown.
Economic and Market Overview
U.S. equities, as measured by the Standard & Poor’s® 500 Index (S&P 500®), declined significantly during the six months under review. Equities posted strong gains throughout much of the reporting period, aided by relatively steady economic growth, easing trade tensions and the U.S. Federal Reserve’s (Fed’s) supportive monetary policy. However, a sharp selloff began in late February 2020 amid fears of a global economic slowdown due to the novel
Portfolio Composition
Based on Total Net Assets as of 3/31/20
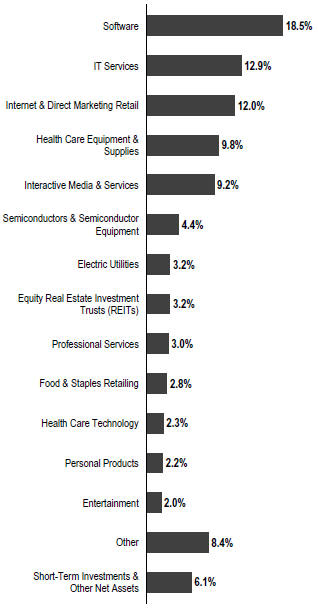
1. Effective 2/14/20, the Fund began offering Class A shares. Class A performance shown has been calculated as follows: (a) for periods prior to 2/14/20, a restated figure is used based on the Fund’s Advisor Class performance that includes any Rule12b-1 rate differential that exists between Class A and Advisor Class; and (b) for periods after 2/14/20, actual Class A performance is used, reflecting all charges and fees applicable to that class.
2. Source: Morningstar. Frank Russell Company is the source and owner of the trademarks, service marks and copyrights related to the Russell Indexes. Russell® is a trademark of Frank Russell Company.
The index is unmanaged and includes reinvestment of any income or distributions. It does not reflect any fees, expenses or sales charges. One cannot invest directly in an index, and an index is not representative of the Fund’s portfolio.
The dollar value, number of shares or principal amount, and names of all portfolio holdings are listed in the Fund’s Statement of Investments (SOI). The SOI begins on page 14.
| franklintempleton.com | Semiannual Report | 3 | ||
FRANKLIN FOCUSED GROWTH FUND
coronavirus(COVID-19) pandemic. Concerns about global supply chain disruptions, business and personal restrictions, and subdued consumer spending drove many investors to sell equity holdings in favor of perceived safe investments such as government bonds and cash.
The Fed lowered the federal funds target rate in October for the third time in 2019, to a range of 1.50%–1.75%. The labor market remained strong through February 2020 and supported consumer spending, though some parts of the economy struggled as annual industrial production contracted and capital spending declined.
However, economic activity weakened considerably as theCOVID-19 pandemic spread across the U.S. and many state and local governments issuedstay-at-home orders, which included business closures and restrictions. Weekly unemployment claims surged nearperiod-end, reflecting layoffs in many industries, particularly retail, restaurants and hospitality. As a result, the unemployment rate jumped from a50-year low of 3.5% in February 2020 to 4.4% atperiod-end, and the economy contracted in the first quarter, following an expansion that lasted more than a decade.3
Market volatility persisted at a heightened level throughout March 2020, as social distancing measures intended to mitigate the pandemic severely weakened the economy. In an effort to boost the U.S. economy and aid businesses and individuals directly impacted by the pandemic, the federal government passed an unprecedented $2 trillion stimulus package. Furthermore, the Fed cut the federal funds target rate to a range of 0.00%–0.25% and announced sweeping quantitative easing measures aimed at stimulating lending and credit availability. Many investors were encouraged by policymakers’ swift and decisive fiscal and stimulus measures. U.S. stocks, as measured by the S&P 500, bounced from multi-year lows, but still finished the reporting period with negative returns.
Investment Strategy
We are research-driven,bottom-up fundamental investors. Under normal market conditions, we invest predominantly in equity securities of companies that we believe offer compelling growth opportunities. The equity securities in which we invest are predominantly common stock. We may invest in companies of any size, including small and medium capitalization companies. In addition to our main
Top 10 Holdings
3/31/20
Company Sector/Industry | % of Total Net Assets | |||
Microsoft Corp. Software | 9.0 | % | ||
Amazon.com Inc. Internet & Direct Marketing Retail | 8.7 | % | ||
Alphabet Inc. Interactive Media & Services | 3.9 | % | ||
ServiceNow Inc. Software | 3.8 | % | ||
Mastercard Inc. IT Services | 3.7 | % | ||
Visa Inc. IT Services | 3.2 | % | ||
NextEra Energy Inc. Electric Utilities | 3.2 | % | ||
Crown Castle International Corp. Equity Real Estate Investment Trusts (REITs) | 3.2 | % | ||
Danaher Corp. Health Care Equipment & Supplies | 3.0 | % | ||
Facebook Inc. Interactive Media & Services | 3.0 | % | ||
investments, we may invest a portion (up to 25%) of net assets in foreign equity securities, including those located in emerging markets. Although we seek investments across a number of sectors, from time to time, based on economic conditions, we may have significant positions in particular sectors.
Manager’s Discussion
During the six months under review, the information technology (IT), consumer discretionary and communication services sectors contributed to the Fund’s performance.4 In IT, information software and services firm Microsoft, 3D graphics products designer NVIDIA and cloud solutions provider ServiceNow benefited results. Microsoft’s shares rose during the period based on strong earnings reports for 2019’s third and fourth quarters, with their Intelligent Cloud line of products performing particularly well. The company also benefited from news that the U.S. Department of Defense had awarded Microsoft a lucrative contract to provide cloud computing services. NVIDIA experienced
3. Source: Bureau of Labor Statistics.
4. The IT sector comprises IT services, semiconductors and semiconductor equipment and software in the SOI. The consumer discretionary sector comprises automobiles, internet and direct marketing retail; and textiles, apparel and luxury goods in the SOI. The communication services sector comprises entertainment, interactive media and services and media in the SOI.
4 | Semiannual Report | franklintempleton.com | ||
FRANKLIN FOCUSED GROWTH FUND
growing earnings driven by client adoption of its accelerated computing that produced record data center revenue. NVIDIA’s RTX ray tracing computer graphics used across gaming, virtual reality and design markets also helped results.
In consumer discretionary, online marketplace Amazon.com contributed to absolute results as shares of the company rose during theCOVID-19 outbreak in 2020’s first quarter. People increasingly turned to the online retailer for basic goods as they spent increasing amounts of time at home, boosting sales. The company also benefited from the increase in remote working, which has made more companies reliant on technology infrastructure provided by Amazon Web Services. In the communication services sector, internet subscription service company Netflix, China-based internet services company Tencent Holdings and telecommunications and media company Charter Communications also benefited performance.
In contrast, the industrials, health care and consumer staples sectors detracted from performance.5 In industrials, aerospace firm Boeing (not held atperiod-end) and data analytics provider Verisk Analytics hurt results. Boeing has been hard hit by both theCOVID-19 outbreak, which has drastically cut international travel, and continued safety concerns about Boeing’s flagship 737 MAX passenger airliner. Both factors have led to significant order cancellations for the 737 MAX.
In health care, veterinary diagnostics and information systems provider IDEXX Laboratories hindered returns, and in consumer staples, luxury cosmetics maker Estee Lauder also detracted from performance. Estee Lauder’s flagship brands and skin care products performed well during the period’s first half, but a second consecutive earnings outlook cut and reduced demand after theCOVID-19 outbreak pressured the company’s share price byperiod-end. Other detractors included financial technology company Mastercard, integrated circuits maker Analog Devices and derivatives exchange operator CME Group (not held atperiod-end). Shares of Mastercard slid after the company issued a warning that theCOVID-19 outbreak and the accompanying economic slowdown would likely hurt 2020 revenues.
Thank you for your participation in Franklin Focused Growth Fund. We look forward to serving your future investment needs.
 |
Matthew J. Moberg, CPA Portfolio Manager |

The foregoing information reflects our analysis, opinions and portfolio holdings as of March 31, 2020, the end of the reporting period. The way we implement our main investment strategies and the resulting portfolio holdings may change depending on factors such as market and economic conditions. These opinions may not be relied upon as investment advice or an offer for a particular security. The information is not a complete analysis of every aspect of any market, country, industry, security or the Fund. Statements of fact are from sources considered reliable, but the investment manager makes no representation or warranty as to their completeness or accuracy. Although historical performance is no guarantee of future results, these insights may help you understand our investment management philosophy.
5. The industrials sector comprises industrial conglomerates, machinery and professional services in the SOI. The health care sector comprises health care equipment and supplies, health care technology and life sciences tools and services in the SOI. The consumer staples sector comprises food and staples retailing and personal products in the SOI.
See www.franklintempletondatasources.com for additional data provider information.
| franklintempleton.com | Semiannual Report | 5 | ||
FRANKLIN FOCUSED GROWTH FUND
Performance Summary as of March 31, 2020
The performance table does not reflect any taxes that a shareholder would pay on Fund dividends, capital gain distributions, if any, or any realized gains on the sale of Fund shares. Total return reflects reinvestment of the Fund’s dividends and capital gain distributions, if any, and any unrealized gains or losses. Your dividend income will vary depending on dividends or interest paid by securities in the Fund’s portfolio, adjusted for operating expenses of each class. Capital gain distributions are net profits realized from the sale of portfolio securities.
Performance as of 3/31/201
Cumulative total return excludes sales charges. Average annual total return includes maximum sales charges. Sales charges will vary depending on the size of the investment and the class of share purchased. The maximum is 5.50% and the minimum is 0%.Class A:5.50% maximum initial sales charge;Advisor Class:no sales charges. For other share classes, visitfranklintempleton.com.
| Share Class | Cumulative Total Return2 | Average Annual Total Return3 | ||||
A4 | ||||||
6-Month | -0.15% | -5.64% | ||||
1-Year | +3.42% | -2.27% | ||||
3-Year | +51.09% | +12.61% | ||||
Since Inception (4/12/16) | +76.07% | +13.69% | ||||
Advisor | ||||||
6-Month | +0.05% | +0.05% | ||||
1-Year | +3.76% | +3.76% | ||||
3-Year | +52.34% | +15.06% | ||||
Since Inception (4/12/16) | +77.96% | +15.65% |
Performance data represent past performance, which does not guarantee future results. Investment return and principal value will fluctuate, and you may have a gain or loss when you sell your shares. Current performance may differ from figures shown. For most recentmonth-end performance, go tofranklintempleton.comor call(800)342-5236.
See page 7 for Performance Summary footnotes.
6 | Semiannual Report | franklintempleton.com | ||
FRANKLIN FOCUSED GROWTH FUND
PERFORMANCE SUMMARY
Distributions(10/1/19–3/31/20)
| Share Class | Short-Term Capital Gain | Long-Term Capital Gain | Total | |||||||||||||||||
A(2/14/20-3/31/20) | $ | — | $ | — | $ | — | ||||||||||||||
C (2/14/20–3/31/20) | $ | — | $ | — | $ | — | ||||||||||||||
R (2/14/20–3/31/20) | $ | — | $ | — | $ | — | ||||||||||||||
R6 (2/14/20–3/31/20) | $ | — | $ | — | $ | — | ||||||||||||||
Advisor | $ | 0.0218 | $ | 1.0640 | $ | 1.0858 | ||||||||||||||
Total Annual Operating Expenses5
| Share Class | With Fee Waiver | Without Fee Waiver | ||||||||||
A | 1.11% | 2.52% | ||||||||||
Advisor | 0.86% | 2.27% | ||||||||||
Each class of shares is available to certain eligible investors and has different annual fees and expenses, as described in the prospectus.
All investments involve risks, including possible loss of principal. To the extent the Fund focuses on particular countries, regions, industries, sectors or types of investment from time to time, it may be subject to greater risks of adverse developments in such areas of focus than a fund that invests in a wider variety of countries, regions, industries, sectors or investments. Growth stock prices reflect projections of future earnings or revenues, and can, therefore, fall dramatically if the company fails to meet those projections. The Fund may also invest in small- andmid-capitalization companies, which can be particularly sensitive to changing economic conditions, and their prospects for growth are less certain than those of larger, more established companies. Foreign investing carries additional risks such as currency and market volatility, and political or social instability; risks which are heightened in developing countries. Unexpected events and their aftermaths, such as the spread of deadly diseases; natural, environmental orman-made disasters; financial, political or social disruptions; terrorism and war; and other tragedies or catastrophes, can cause investor fear and panic, which can adversely affect the economies of many companies, sectors, nations, regions and the market in general, in ways that cannot necessarily be foreseen. The Fund’s prospectus also includes a description of the main investment risks.
1. The Fund has an expense reduction and a fee waiver associated with any investments it makes in a Franklin Templeton money fund and/or other Franklin Templeton fund, contractually guaranteed through 1/31/21. Fund investment results reflect the expense reduction and fee waiver; without these reductions, the results would have been lower.
2. Cumulative total return represents the change in value of an investment over the periods indicated.
3. Average annual total return represents the average annual change in value of an investment over the periods indicated. Return for less than one year, if any, has not been annualized.
4. Effective 2/14/20, the Fund began offering Class A shares. Class A performance shown has been calculated as follows: (a) for periods prior to 2/14/20, a restated figure is used based on the Fund’s Advisor Class performance that includes any Rule12b-1 rate differential that exists between Class A and Advisor Class; and (b) for periods after 2/14/20, actual Class A performance is used, reflecting all charges and fees applicable to that class.
5. Figures are as stated in the Fund’s current prospectus and may differ from the expense ratios disclosed in the Your Fund’s Expenses and Financial Highlights sections in this report. In periods of market volatility, assets may decline significantly, causing total annual Fund operating expenses to become higher than the figures shown.
| franklintempleton.com | Semiannual Report | 7 | ||
FRANKLIN FOCUSED GROWTH FUND
As a Fund shareholder, you can incur two types of costs: (1) transaction costs, including sales charges (loads) on Fund purchases and redemptions; and (2) ongoing Fund costs, including management fees, distribution and service(12b-1) fees, and other Fund expenses. All mutual funds have ongoing costs, sometimes referred to as operating expenses. The table below shows ongoing costs of investing in the Fund and can help you understand these costs and compare them with those of other mutual funds. The table assumes a $1,000 investment held for the six months indicated.
Actual Fund Expenses
The table below provides information about actual account values and actual expenses in the columns under the heading “Actual.” In these columns the Fund’s actual return, which includes the effect of Fund expenses, is used to calculate the “Ending Account Value.” You can estimate the expenses you paid during the period by following these steps (of course, your account value and expenses will differ from those in this illustration): Divide your account value by $1,000 (if your account had an $8,600 value, then $8,600÷ $1,000 = 8.6). Then multiply the result by the number in the row for your class of shares under the headings “Actual” and “Expenses Paid During Period” (if Actual Expenses Paid During Period were $7.50, then 8.6 x $7.50= $64.50). In this illustration, the actual expenses paid this period are $64.50.
Hypothetical Example for Comparison with Other Funds
Under the heading “Hypothetical” in the table, information is provided about hypothetical account values and hypothetical expenses based on the Fund’s actual expense ratio and an assumed rate of return of 5% per year before expenses, which is not the Fund’s actual return. This information may not be used to estimate the actual ending account balance or expenses you paid for the period, but it can help you compare ongoing costs of investing in the Fund with those of other funds. To do so, compare this 5% hypothetical example for the class of shares you hold with the 5% hypothetical examples that appear in the shareholder reports of other funds.
Please note that expenses shown in the table are meant to highlight ongoing costs and do not reflect any transactional costs. Therefore, information under the heading “Hypothetical” is useful in comparing ongoing costs only, and will not help you compare total costs of owning different funds. In addition, if transactional costs were included, your total costs would have been higher.
Actual (actual return after expenses) | Hypothetical (5% annual return before expenses) | |||||||||||||||||
|
| |||||||||||||||||
Share Class | Beginning Value 10/1/191 | Ending Account Value 3/31/20 | Expenses Paid During Period 10/1/19–3/31/202,3,4,5 | Ending Account | Expenses Paid During Period 10/1/19–3/31/202,3,4,5 | Net Annualized Expense Ratio4,5 | ||||||||||||
|
|
|
| |||||||||||||||
A | $1,000 | $ 822.90 | $1.26 | $1,019.50 | $5.55 | 1.10% | ||||||||||||
C | $1,000 | $ 822.90 | $2.12 | $1,015.75 | $9.32 | 1.85% | ||||||||||||
R | $1,000 | $ 822.90 | $1.55 | $1,018.25 | $6.81 | 1.35% | ||||||||||||
R6 | $1,000 | $ 823.40 | $0.97 | $1,020.75 | $4.29 | 0.85% | ||||||||||||
Advisor | $1,000 | $1,000.50 | $4.75 | $1,020.25 | $4.80 | 0.95% | ||||||||||||
1. For Class Advisor, 10/1/19 for Actual and Hypothetical. For Classes A, C, R and R6, 2/14/20 for Actual and 10/1/19 for Hypothetical.
2. For Class Advisor, 10/1/19–3/31/20. For Classes A, C, R and R6, 2/14/20–3/31/20.
3. Expenses are equal to the annualized expense ratio for thesix-month period as indicated above—in the far right column—multiplied by the simple average account value over the period indicated, and then multiplied by 183/366 to reflect theone-half year period. The multiplier is 46/366 for Actual expenses for Classes A, C, R and R6 to reflect the number of days since inception.
4. Reflects expenses after fee waivers and expense reimbursements. Does not include acquired fund fees and expenses.
5. Effective February 1, 2020, the expense waiver for Advisor Class changed and the new annualized net expense ratio is 0.85%. Had such expense waiver been in effect for the full period, the Actual expenses paid for Advisor class would have been $4.25 and the Hypothetical expenses paid would have been $4.29.
8 | Semiannual Report | franklintempleton.com | ||
FRANKLIN CUSTODIAN FUNDS
Franklin Focused Growth Fund
| Period Ended March 31, 2020 (unaudited)a | ||||
Class A | ||||
Per share operating performance (for a share outstanding throughout the period) | ||||
Net asset value, beginning of period | $20.16 | |||
|
| |||
Income from investment operationsb: | ||||
Net investment income (loss)c | (0.01) | |||
Net realized and unrealized gains (losses) | (3.56) | |||
|
| |||
Total from investment operations | (3.57) | |||
|
| |||
Net asset value, end of period | $16.59 | |||
|
| |||
Total returnd | (17.71)% | |||
Ratios to average net assetse | ||||
Expenses before waiver and payments by affiliates | 1.73% | |||
Expenses net of waiver and payments by affiliates | 1.10% | |||
Net investment income (loss) | (0.47)% | |||
Supplemental data | ||||
Net assets, end of period (000’s) | $1,179 | |||
Portfolio turnover rate | 16.57% | |||
aFor the period February 14, 2020 (commencement of operations) to March 31, 2020.
bThe amount shown for a share outstanding throughout the period may not correlate with the Statement of Operations for the period due to the timing of sales and repurchases of the Fund’s shares in relation to income earned and/or fluctuating fair value of the investments of the Fund.
cBased on average daily shares outstanding.
dTotal return does not reflect sales commissions or contingent deferred sales charges, if applicable, and is not annualized for periods less than one year.eRatios are annualized for periods less than one year, except fornon-recurring expenses, if any.
| franklintempleton.com | The accompanying notes are an integral part of these financial statements. | Semiannual Report | 9 | ||
FRANKLIN CUSTODIAN FUNDS
FINANCIAL HIGHLIGHTS
Franklin Focused Growth Fund(continued)
| Period Ended March 31, 2020 (unaudited)a | ||||
Class C | ||||
Per share operating performance (for a share outstanding throughout the period) | ||||
Net asset value, beginning of period | $20.16 | |||
|
| |||
Income from investment operationsb: | ||||
Net investment income (loss)c | (0.03) | |||
Net realized and unrealized gains (losses) | (3.54) | |||
|
| |||
Total from investment operations | (3.57) | |||
|
| |||
Net asset value, end of period | $16.59 | |||
|
| |||
Total returnd | (17.71)% | |||
Ratios to average net assetse | ||||
Expenses before waiver and payments by affiliates | 2.48% | |||
Expenses net of waiver and payments by affiliates | 1.85% | |||
Net investment income (loss) | (1.22)% | |||
Supplemental data | ||||
Net assets, end of period (000’s) | $114 | |||
Portfolio turnover rate | 16.57% | |||
aFor the period February 14, 2020 (commencement of operations) to March 31, 2020.
bThe amount shown for a share outstanding throughout the period may not correlate with the Statement of Operations for the period due to the timing of sales and repurchases of the Fund’s shares in relation to income earned and/or fluctuating fair value of the investments of the Fund.
cBased on average daily shares outstanding.
dTotal return does not reflect sales commissions or contingent deferred sales charges, if applicable, and is not annualized for periods less than one year.eRatios are annualized for periods less than one year, except fornon-recurring expenses, if any.
10 | Semiannual Report | The accompanying notes are an integral part of these financial statements. | franklintempleton.com | ||
FRANKLIN CUSTODIAN FUNDS
FINANCIAL HIGHLIGHTS
Franklin Focused Growth Fund(continued)
| Period Ended March 31, 2020 (unaudited)a | ||||
Class R | ||||
Per share operating performance (for a share outstanding throughout the period) | ||||
Net asset value, beginning of period | $20.16 | |||
|
| |||
Income from investment operationsb: | ||||
Net investment income (loss)c | (0.01) | |||
Net realized and unrealized gains (losses) | (3.56) | |||
|
| |||
Total from investment operations | (3.57) | |||
|
| |||
Net asset value, end of period | $16.59 | |||
|
| |||
Total returnd | (17.71)% | |||
Ratios to average net assetse | ||||
Expenses before waiver and payments by affiliates | 1.98% | |||
Expenses net of waiver and payments by affiliates | 1.35% | |||
Net investment income (loss) | (0.72)% | |||
Supplemental data | ||||
Net assets, end of period (000’s) | $4 | |||
Portfolio turnover rate | 16.57% | |||
aFor the period February 14, 2020 (commencement of operations) to March 31, 2020.
bThe amount shown for a share outstanding throughout the period may not correlate with the Statement of Operations for the period due to the timing of sales and repurchases of the Fund’s shares in relation to income earned and/or fluctuating fair value of the investments of the Fund.
cBased on average daily shares outstanding.
dTotal return is not annualized for periods less than one year.
eRatios are annualized for periods less than one year, except fornon-recurring expenses, if any.
| franklintempleton.com | The accompanying notes are an integral part of these financial statements. | Semiannual Report | 11 | ||
FRANKLIN CUSTODIAN FUNDS
FINANCIAL HIGHLIGHTS
Franklin Focused Growth Fund(continued)
| Period Ended March 31, 2020 (unaudited)a | ||||
Class R6 | ||||
Per share operating performance (for a share outstanding throughout the period) | ||||
Net asset value, beginning of period | $20.16 | |||
|
| |||
Income from investment operationsb: | ||||
Net investment income (loss)c | (—) | d | ||
Net realized and unrealized gains (losses) | (3.56) | |||
|
| |||
Total from investment operations | (3.56) | |||
|
| |||
Net asset value, end of period | $16.60 | |||
|
| |||
Total returne | (17.66)% | |||
Ratios to average net assetsf | ||||
Expenses before waiver and payments by affiliates | 1.48% | |||
Expenses net of waiver and payments by affiliates | 0.85% | |||
Net investment income (loss) | (0.22)% | |||
Supplemental data | ||||
Net assets, end of period (000’s) | $4 | |||
Portfolio turnover rate | 16.57% | |||
aFor the period February 14, 2020 (commencement of operations) to March 31, 2020.
bThe amount shown for a share outstanding throughout the period may not correlate with the Statement of Operations for the period due to the timing of sales and repurchases of the Fund’s shares in relation to income earned and/or fluctuating fair value of the investments of the Fund.
cBased on average daily shares outstanding.
dAmount rounds to less than $0.01 per share.
eTotal return is not annualized for periods less than one year.
fRatios are annualized for periods less than one year, except fornon-recurring expenses, if any.
12 | Semiannual Report | The accompanying notes are an integral part of these financial statements. | franklintempleton.com | ||
FRANKLIN CUSTODIAN FUNDS
FINANCIAL HIGHLIGHTS
Franklin Focused Growth Fund(continued)
Six Months Ended March 31, 2020 (unaudited) | Year Ended September 30, | |||||||||||||||||||
| 2019 | 2018 | 2017 | 2016a | |||||||||||||||||
Advisor Class | ||||||||||||||||||||
Per share operating performance (for a share outstanding throughout the period) | ||||||||||||||||||||
Net asset value, beginning of period | $17.62 | $17.24 | $13.36 | $10.93 | $10.00 | |||||||||||||||
Income from investment operationsb: | ||||||||||||||||||||
Net investment income (loss)c | (0.02 | ) | (0.06 | ) | (0.05 | ) | (0.02 | ) | (0.01 | ) | ||||||||||
Net realized and unrealized gains (losses) | 0.10 | 0.52 | 3.93 | 2.49 | 0.94 | |||||||||||||||
Total from investment operations | 0.08 | 0.46 | 3.88 | 2.47 | 0.93 | |||||||||||||||
Less distributions from: | ||||||||||||||||||||
Net investment income | — | (0.01 | ) | — | (0.01 | ) | — | |||||||||||||
Net realized gains | (1.09 | ) | (0.07 | ) | — | (0.03 | ) | — | ||||||||||||
Total distributions | (1.09 | ) | (0.08 | ) | — | (0.04 | )�� | — | ||||||||||||
Net asset value, end of period | $16.61 | $17.62 | $17.24 | $13.36 | $10.93 | |||||||||||||||
Total returnd | 0.05% | 2.80% | 29.04% | 22.78% | 9.30% | |||||||||||||||
Ratios to average net assetse | ||||||||||||||||||||
Expenses before waiver and payments by affiliates | 2.00% | 2.41% | 2.23% | 2.31% | 4.76% | |||||||||||||||
Expenses net of waiver and payments by affiliates | 0.95% | 1.00% | 1.00% | f | 1.00% | f | 1.00% | |||||||||||||
Net investment income (loss) | (0.32)% | (0.36)% | (0.34)% | (0.20)% | (0.18)% | |||||||||||||||
Supplemental data | ||||||||||||||||||||
Net assets, end of period (000’s) | $8,988 | $4,404 | $4,310 | $3,341 | $2,732 | |||||||||||||||
Portfolio turnover rate | 16.57% | 28.65% | 14.47% | 28.48% | 7.46% | |||||||||||||||
aFor the period April 12, 2016 (commencement of operations) to September 30, 2016.
bThe amount shown for a share outstanding throughout the period may not correlate with the Statement of Operations for the period due to the timing of sales and repurchases of the Fund’s shares in relation to income earned and/or fluctuating fair value of the investments of the Fund.
cBased on average daily shares outstanding.
dTotal return is not annualized for periods less than one year.
eRatios are annualized for periods less than one year, except fornon-recurring expenses, if any.
fBenefit of expense reduction rounds to less than 0.01%.
| franklintempleton.com | The accompanying notes are an integral part of these financial statements. | Semiannual Report | 13 | ||
FRANKLIN CUSTODIAN FUNDS
Statement of Investments, March 31, 2020 (unaudited)
Franklin Focused Growth Fund
| Country | Shares | Value | ||||||||||
Common Stocks 93.9% | ||||||||||||
Automobiles 0.5% | ||||||||||||
aTesla Inc. | United States | 88 | $ | 46,112 | ||||||||
|
| |||||||||||
Capital Markets 1.0% | ||||||||||||
MSCI Inc. | United States | 362 | 104,603 | |||||||||
|
| |||||||||||
Electric Utilities 3.2% | ||||||||||||
NextEra Energy Inc. | United States | 1,366 | 328,687 | |||||||||
|
| |||||||||||
Entertainment 2.0% | ||||||||||||
aNetflix Inc. | United States | 281 | 105,515 | |||||||||
aSea Ltd., ADR | Taiwan | 2,174 | 96,330 | |||||||||
|
| |||||||||||
| 201,845 | ||||||||||||
|
| |||||||||||
Equity Real Estate Investment Trusts (REITs) 3.2% | ||||||||||||
Crown Castle International Corp. | United States | 2,244 | 324,034 | |||||||||
|
| |||||||||||
Food & Staples Retailing 2.8% | ||||||||||||
Costco Wholesale Corp. | United States | 1,022 | 291,403 | |||||||||
|
| |||||||||||
Health Care Equipment & Supplies 9.8% | ||||||||||||
Abbott Laboratories | United States | 2,604 | 205,482 | |||||||||
Danaher Corp. | United States | 2,221 | 307,408 | |||||||||
aIDEXX Laboratories Inc. | United States | 1,117 | 270,582 | |||||||||
aIntuitive Surgical Inc. | United States | 458 | 226,806 | |||||||||
|
| |||||||||||
| 1,010,278 | ||||||||||||
|
| |||||||||||
Health Care Technology 2.3% | ||||||||||||
aVeeva Systems Inc. | United States | 1,483 | 231,897 | |||||||||
|
| |||||||||||
Industrial Conglomerates 0.9% | ||||||||||||
Roper Technologies Inc. | United States | 291 | 90,737 | |||||||||
|
| |||||||||||
Interactive Media & Services 9.2% | ||||||||||||
aAlphabet Inc., A | United States | 348 | 404,359 | |||||||||
aFacebook Inc., A | United States | 1,838 | 306,578 | |||||||||
Tencent Holdings Ltd. | China | 4,799 | 235,349 | |||||||||
|
| |||||||||||
| 946,286 | ||||||||||||
|
| |||||||||||
Internet & Direct Marketing Retail 12.0% | ||||||||||||
aAlibaba Group Holding Ltd., ADR | China | 1,015 | 197,397 | |||||||||
aAmazon.com Inc. | United States | 459 | 894,922 | |||||||||
aMercadoLibre Inc. | Argentina | 297 | 145,108 | |||||||||
|
| |||||||||||
| 1,237,427 | ||||||||||||
|
| |||||||||||
IT Services 12.9% | ||||||||||||
aAdyen NV | Netherlands | 237 | 202,420 | |||||||||
Mastercard Inc., A. | United States | 1,590 | 384,081 | |||||||||
aPayPal Holdings Inc. | United States | 1,500 | 143,610 | |||||||||
aShopify Inc., A | Canada | 640 | 268,104 | |||||||||
Visa Inc., A | United States | 2,070 | 333,518 | |||||||||
|
| |||||||||||
| 1,331,733 | ||||||||||||
|
| |||||||||||
14 | Semiannual Report | franklintempleton.com | ||
FRANKLIN CUSTODIAN FUNDS
STATEMENT OF INVESTMENTS (UNAUDITED)
Franklin Focused Growth Fund(continued)
| Country | Shares | Value | ||||||||||
Common Stocks(continued) | ||||||||||||
Life Sciences Tools & Services 1.7% | ||||||||||||
aIllumina Inc. | United States | 322 | $ | 87,945 | ||||||||
aWuXi Biologics (Cayman) Inc. | China | 6,897 | 89,408 | |||||||||
|
| |||||||||||
| 177,353 | ||||||||||||
|
| |||||||||||
Machinery 0.7% | ||||||||||||
Fortive Corp. | United States | 1,389 | 76,659 | |||||||||
|
| |||||||||||
Media 1.9% | ||||||||||||
aCharter Communications Inc., A | United States | 455 | 198,521 | |||||||||
|
| |||||||||||
Personal Products 2.2% | ||||||||||||
Estee Lauder Cos. Inc., A | United States | 1,426 | 227,219 | |||||||||
|
| |||||||||||
Professional Services 3.0% | ||||||||||||
aCoStar Group Inc. | United States | 294 | 172,640 | |||||||||
Verisk Analytics Inc. | United States | 943 | 131,435 | |||||||||
|
| |||||||||||
| 304,075 | ||||||||||||
|
| |||||||||||
Semiconductors & Semiconductor Equipment 4.4% | ||||||||||||
Analog Devices Inc. | United States | 1,717 | 153,929 | |||||||||
ASML Holding NV, N.Y. shs | Netherlands | 354 | 92,621 | |||||||||
NVIDIA Corp. | United States | 792 | 208,771 | |||||||||
|
| |||||||||||
| 455,321 | ||||||||||||
|
| |||||||||||
Software 18.5% | ||||||||||||
aAdobe Inc. | United States | 938 | 298,509 | |||||||||
Microsoft Corp. | United States | 5,865 | 924,969 | |||||||||
asalesforce.com Inc. | United States | 1,991 | 286,664 | |||||||||
aServiceNow Inc. | United States | 1,373 | 393,475 | |||||||||
|
| |||||||||||
| 1,903,617 | ||||||||||||
|
| |||||||||||
Textiles, Apparel & Luxury Goods 1.7% | ||||||||||||
NIKE Inc., B | United States | 2,076 | 171,768 | |||||||||
|
| |||||||||||
Total Common Stocks (Cost $9,104,018) | 9,659,575 | |||||||||||
|
| |||||||||||
Short Term Investments (Cost $457,661) 4.4% | ||||||||||||
Money Market Funds 4.4% | ||||||||||||
b,cInstitutional Fiduciary Trust Money Market Portfolio, 0.32% | United States | 457,661 | 457,661 | |||||||||
|
| |||||||||||
Total Investments (Cost $9,561,679) 98.3% | 10,117,236 | |||||||||||
Other Assets, less Liabilities 1.7% | 172,634 | |||||||||||
|
| |||||||||||
Net Assets 100.0% | $ | 10,289,870 | ||||||||||
|
| |||||||||||
See Abbreviations on page 27.
aNon-income producing.
bSee Note 3(f) regarding investments in affiliated management investment companies.
cThe rate shown is the annualizedseven-day effective yield at period end.
| franklintempleton.com | The accompanying notes are an integral part of these financial statements. | Semiannual Report | 15 | ||
FRANKLIN CUSTODIAN FUNDS
FINANCIAL STATEMENTS
Statement of Assets and Liabilities
March 31, 2020 (unaudited)
Franklin Focused Growth Fund
Assets: | ||||
Investments in securities: | ||||
Cost - Unaffiliated issuers | $ | 9,104,018 | ||
Cost -Non-controlled affiliates (Note 3f) | 457,661 | |||
|
| |||
Value - Unaffiliated issuers | $ | 9,659,575 | ||
Value -Non-controlled affiliates (Note 3f) | 457,661 | |||
Receivables: | ||||
Investment securities sold | 74,100 | |||
Dividends | 1,094 | |||
Affiliates | 18,456 | |||
Offering costs (Note 1e) | 103,327 | |||
Other assets | 5,182 | |||
|
| |||
Total assets | 10,319,395 | |||
|
| |||
Liabilities: | ||||
Payables: | ||||
Investment securities purchased | 218 | |||
Capital shares redeemed | 3,564 | |||
Distribution fees | 184 | |||
Transfer agent fees | 145 | |||
Reports to shareholders | 2,373 | |||
Professional fees | 20,917 | |||
Accrued expenses and other liabilities | 2,124 | |||
|
| |||
Total liabilities | 29,525 | |||
|
| |||
Net assets, at value | $ | 10,289,870 | ||
|
| |||
Net assets consist of: | ||||
Paid-in capital | $ | 9,681,452 | ||
Total distributable earnings (losses) | 608,418 | |||
|
| |||
Net assets, at value | $ | 10,289,870 | ||
|
| |||
16 | Semiannual Report | The accompanying notes are an integral part of these financial statements. | franklintempleton.com | ||
FRANKLIN CUSTODIAN FUNDS
FINANCIAL STATEMENTS
Statement of Assets and Liabilities(continued)
March 31, 2020 (unaudited)
Franklin Focused Growth Fund
Class A: | ||||
Net assets, at value | $1,179,383 | |||
|
| |||
Shares outstanding | 71,075 | |||
|
| |||
Net asset value per sharea | $16.59 | |||
|
| |||
Maximum offering price per share (net asset value per share ÷ 94.50%) | $17.56 | |||
|
| |||
Class C: | ||||
Net assets, at value | $ 114,187 | |||
|
| |||
Shares outstanding | 6,884 | |||
|
| |||
Net asset value and maximum offering price per sharea | $16.59 | |||
|
| |||
Class R: | ||||
Net assets, at value | $ 4,115 | |||
|
| |||
Shares outstanding | 248 | |||
|
| |||
Net asset value and maximum offering price per share | $16.59 | |||
|
| |||
Class R6: | ||||
Net assets, at value | $ 4,117 | |||
|
| |||
Shares outstanding | 248 | |||
|
| |||
Net asset value and maximum offering price per share | $16.60 | |||
|
| |||
Advisor Class: | ||||
Net assets, at value | $8,988,068 | |||
|
| |||
Shares outstanding | 541,204 | |||
|
| |||
Net asset value and maximum offering price per share | $16.61 | |||
|
|
aRedemption price is equal to net asset value less contingent deferred sales charges, if applicable.
| franklintempleton.com | The accompanying notes are an integral part of these financial statements. | Semiannual Report | 17 | ||
FRANKLIN CUSTODIAN FUNDS
FINANCIAL STATEMENTS
Statement of Operations
for the six months ended March 31, 2020 (unaudited)
Franklin Focused Growth Fund
Investment income: | ||||
Dividends: | ||||
Unaffiliated issuers | $ | 18,991 | ||
Non-controlled affiliates (Note 3f) | 821 | |||
Interest: | ||||
Unaffiliated issuers | 27 | |||
|
| |||
Total investment income | 19,839 | |||
|
| |||
Expenses: | ||||
Management fees (Note 3a) | 22,532 | |||
Distribution fees: (Note 3c) | ||||
Class A | 139 | |||
Class C | 60 | |||
Class R | 3 | |||
Transfer agent fees: (Note 3e) | ||||
Class A | 11 | |||
Class C | 1 | |||
Advisor Class. | 567 | |||
Custodian fees (Note 4) | 38 | |||
Reports to shareholders | 3,515 | |||
Registration and filing fees | 37 | |||
Professional fees | 23,009 | |||
Amortization of offering costs (Note 1e) | 15,224 | |||
Other | 3,503 | |||
|
| |||
Total expenses | 68,639 | |||
Expenses waived/paid by affiliates (Note 3g) | (40,989 | ) | ||
|
| |||
Net expenses. | 27,650 | |||
|
| |||
Net investment income (loss) | (7,811 | ) | ||
|
| |||
Realized and unrealized gains (losses): | ||||
Net realized gain (loss) from: | ||||
Investments: | ||||
Unaffiliated issuers | 117,099 | |||
Foreign currency transactions | 888 | |||
|
| |||
Net realized gain (loss) | 117,987 | |||
|
| |||
Net change in unrealized appreciation (depreciation) on: | ||||
Investments: | ||||
Unaffiliated issuers | (1,148,007 | ) | ||
|
| |||
Net realized and unrealized gain (loss) | (1,030,020 | ) | ||
|
| |||
Net increase (decrease) in net assets resulting from operations | $ | (1,037,831 | ) | |
|
| |||
18 | Semiannual Report | The accompanying notes are an integral part of these financial statements. | franklintempleton.com | ||
FRANKLIN CUSTODIAN FUNDS
FINANCIAL STATEMENTS
Statements of Changes in Net Assets
Franklin Focused Growth Fund
| Six Months Ended March 31, 2020 (unaudited) | Year Ended September 30, 2019 | |||||||
Increase (decrease) in net assets: | ||||||||
Operations: | ||||||||
Net investment income (loss) | $ (7,811 | ) | $ (15,013 | ) | ||||
Net realized gain (loss) | 117,987 | 242,621 | ||||||
Net change in unrealized appreciation (depreciation) | (1,148,007 | ) | (112,364 | ) | ||||
|
| |||||||
Net increase (decrease) in net assets resulting from operations | (1,037,831 | ) | 115,244 | |||||
|
| |||||||
Distributions to shareholders: | ||||||||
Advisor Class | (271,450 | ) | (21,000 | ) | ||||
|
| |||||||
Total distributions to shareholders | (271,450 | ) | (21,000 | ) | ||||
|
| |||||||
Capital share transactions: (Note 2) | ||||||||
Class A | 1,219,361 | — | ||||||
Class C | 119,523 | — | ||||||
Class R | 5,000 | — | ||||||
Class R6 | 5,000 | — | ||||||
Advisor Class | 5,846,091 | — | ||||||
|
| |||||||
Total capital share transactions | 7,194,975 | — | ||||||
|
| |||||||
Net increase (decrease) in net assets | 5,885,694 | 94,244 | ||||||
Net assets: | ||||||||
Beginning of period | 4,404,176 | 4,309,932 | ||||||
|
| |||||||
End of period | $10,289,870 | $4,404,176 | ||||||
|
| |||||||
| franklintempleton.com | The accompanying notes are an integral part of these financial statements. | Semiannual Report | 19 | ||
FRANKLIN CUSTODIAN FUNDS
Notes to Financial Statements (unaudited)
Franklin Focused Growth Fund
1. Organization and Significant Accounting Policies
Franklin Custodian Funds (Trust) is registered under the Investment Company Act of 1940 (1940 Act) as anopen-end management investment company, consisting of six separate funds and applies the specialized accounting and reporting guidance in U.S. Generally Accepted Accounting Principles (U.S. GAAP). Franklin Focused Growth Fund (Fund) is included in this report. The Fund offers five classes of shares: Class A, Class C, Class R, Class R6 and Advisor Class. Class C shares automatically convert to Class A shares after they have been held for 10 years. Each class of shares may differ by its initial sales load, contingent deferred sales charges, voting rights on matters affecting a single class, its exchange privilege and fees due to differing arrangements for distribution and transfer agent fees.
Effective February 14, 2020, the Fund commenced the public offering of all share classes. The Fund previously only operated with one class of shares, Advisor Class.
The following summarizes the Fund’s significant accounting policies.
a. Financial Instrument Valuation
The Fund’s investments in financial instruments are carried at fair value daily. Fair value is the price that would be received to sell an asset or paid to transfer a liability in an orderly transaction between market participants on the measurement date. The Fund calculates the net asset value (NAV) per share each business day as of 4 p.m. Eastern time or the regularly scheduled close of the New York Stock Exchange (NYSE), whichever is earlier. Under compliance policies and procedures approved by the Trust’s Board of Trustees(the Board), the Fund’s administrator has responsibility for oversight of valuation, including leading the cross-functional Valuation Committee (VC). The Fund may utilize independent pricing services, quotations from securities and financial instrument dealers, and other market sources to determine fair value.
Equity securities listed on an exchange or on the NASDAQ National Market System are valued at the last quoted sale price or the official closing price of the day, respectively. Foreign equity securities are valued as of the close of trading on the foreign stock exchange on which the security is primarily traded, or as of 4 p.m. Eastern time. The value is then converted into its U.S. dollar equivalent at the foreign exchange rate in effect at 4 p.m. Eastern time on the day that
the value of the security is determined.Over-the-counter (OTC) securities are valued within the range of the most recent quoted bid and ask prices. Securities that trade in multiple markets or on multiple exchanges are valued according to the broadest and most representative market. Certain equity securities are valued based upon fundamental characteristics or relationships to similar securities.
Investments inopen-end mutual funds are valued at the closing NAV. Investments in repurchase agreements are valued at cost, which approximates fair value.
The Fund has procedures to determine the fair value of financial instruments for which market prices are not reliable or readily available. Under these procedures, the Fund primarily employs a market-based approach which may use related or comparable assets or liabilities, recent transactions, market multiples, book values, and other relevant information for the investment to determine the fair value of the investment. An income-based valuation approach may also be used in which the anticipated future cash flows of the investment are discounted to calculate fair value. Discounts may also be applied due to the nature or duration of any restrictions on the disposition of the investments. Due to the inherent uncertainty of valuations of such investments, the fair values may differ significantly from the values that would have been used had an active market existed.
Trading in securities on foreign securities stock exchanges and OTC markets may be completed before 4 p.m. Eastern time. In addition, trading in certain foreign markets may not take place on every Fund’s business day. Occasionally, events occur between the time at which trading in a foreign security is completed and 4 p.m. Eastern time that might call into question the reliability of the value of a portfolio security held by the Fund. As a result, differences may arise between the value of the Fund’s portfolio securities as determined at the foreign market close and the latest indications of value at 4 p.m. Eastern time. In order to minimize the potential for these differences, the VC monitors price movements following the close of trading in foreign stock markets through a series of country specific market proxies (such as baskets of American Depositary Receipts, futures contracts and exchange traded funds). These price movements are measured against established trigger thresholds for each specific market proxy to assist in determining if an event has occurred that may call into question the reliability of the values of the foreign securities held by the Fund. If such an event occurs, the securities may be valued using fair value
20 | Semiannual Report | franklintempleton.com | ||
FRANKLIN CUSTODIAN FUNDS
NOTES TO FINANCIAL STATEMENTS (UNAUDITED)
Franklin Focused Growth Fund(continued)
procedures, which may include the use of independent pricing services. At March 31, 2020, a market event occurred resulting in a portion of the securities held by the Fund being valued using fair value procedures.
When the last day of the reporting period is anon-business day, certain foreign markets may be open on those days that the Fund’s NAV is not calculated, which could result in differences between the value of the Fund’s portfolio securities on the last business day and the last calendar day of the reporting period. Any significant security valuation changes due to an open foreign market are adjusted and reflected by the Fund for financial reporting purposes.
b. Foreign Currency Translation
Portfolio securities and other assets and liabilities denominated in foreign currencies are translated into U.S. dollars based on the exchange rate of such currencies against U.S. dollars on the date of valuation. The Fund may enter into foreign currency exchange contracts to facilitate transactions denominated in a foreign currency. Purchases and sales of securities, income and expense items denominated in foreign currencies are translated into U.S. dollars at the exchange rate in effect on the transaction date. Portfolio securities and assets and liabilities denominated in foreign currencies contain risks that those currencies will decline in value relative to the U.S. dollar. Occasionally, events may impact the availability or reliability of foreign exchange rates used to convert the U.S. dollar equivalent value. If such an event occurs, the foreign exchange rate will be valued at fair value using procedures established and approved by the Board.
The Fund does not separately report the effect of changes in foreign exchange rates from changes in market prices on securities held. Such changes are included in net realized and unrealized gain or loss from investments in the Statement of Operations.
Realized foreign exchange gains or losses arise from sales of foreign currencies, currency gains or losses realized between the trade and settlement dates on securities transactions and the difference between the recorded amounts of dividends, interest, and foreign withholding taxes and the U.S. dollar equivalent of the amounts actually received or paid. Net unrealized foreign exchange gains and losses arise from changes in foreign exchange rates on foreign denominated assets and liabilities other than investments in securities held at the end of the reporting period.
c. Income and Deferred Taxes
It is the Fund’s policy to qualify as a regulated investment company under the Internal Revenue Code. The Fund intends to distribute to shareholders substantially all of its taxable income and net realized gains to relieve it from federal income and excise taxes. As a result, no provision for U.S. federal income taxes is required.
The Fund may be subject to foreign taxation related to income received, capital gains on the sale of securities and certain foreign currency transactions in the foreign jurisdictions in which it invests. Foreign taxes, if any, are recorded based on the tax regulations and rates that exist in the foreign markets in which the Fund invests. When a capital gain tax is determined to apply, the Fund records an estimated deferred tax liability in an amount that would be payable if the securities were disposed of on the valuation date.
The Fund may recognize an income tax liability related to its uncertain tax positions under U.S. GAAP when the uncertain tax position has a less than 50% probability that it will be sustained upon examination by the tax authorities based on its technical merits. As of March 31, 2020, the Fund has determined that no tax liability is required in its financial statements related to uncertain tax positions for any open tax years (or expected to be taken in future tax years). Open tax years are those that remain subject to examination and are based on the statute of limitations in each jurisdiction in which the Fund invests.
d. Security Transactions, Investment Income, Expenses and Distributions
Security transactions are accounted for on trade date. Realized gains and losses on security transactions are determined on a specific identification basis. Interest income and estimated expenses are accrued daily. Dividend income is recorded on theex-dividend date except for certain dividends from securities where the dividend rate is not available. In such cases, the dividend is recorded as soon as the information is received by the Fund. Distributions to shareholders are recorded on theex-dividend date. Distributable earnings are determined according to income tax regulations (tax basis) and may differ from earnings recorded in accordance with U.S. GAAP. These differences may be permanent or temporary. Permanent differences are reclassified among capital accounts to reflect their tax
| franklintempleton.com | Semiannual Report | 21 | ||
FRANKLIN CUSTODIAN FUNDS
NOTES TO FINANCIAL STATEMENTS (UNAUDITED)
Franklin Focused Growth Fund(continued)
1. Organization and Significant Accounting
Policies(continued)
d. Security Transactions, Investment Income, Expenses and Distributions(continued)
character. These reclassifications have no impact on net assets or the results of operations. Temporary differences are not reclassified, as they may reverse in subsequent periods.
Common expenses incurred by the Trust are allocated among the Funds based on the ratio of net assets of each Fund to the combined net assets of the Trust or based on the ratio of number of shareholders of each Fund to the combined number of shareholders of the Trust. Fund specific expenses are charged directly to the Fund that incurred the expense.
Realized and unrealized gains and losses and net investment income, excluding class specific expenses, are allocated daily to each class of shares based upon the relative proportion of net assets of each class. Differences in per share distributions by class are generally due to differences in class specific expenses.
e. Offering Costs
Offering costs are amortized on a straight line basis over the first twelve months of operations.
f. Accounting Estimates
The preparation of financial statements in accordance with U.S. GAAP requires management to make estimates and assumptions that affect the reported amounts of assets and liabilities at the date of the financial statements and the amounts of income and expenses during the reporting period. Actual results could differ from those estimates.
g. Guarantees and Indemnifications
Under the Trust’s organizational documents, its officers and trustees are indemnified by the Trust against certain liabilities arising out of the performance of their duties to the Trust. Additionally, in the normal course of business, the Trust, on behalf of the Fund, enters into contracts with service providers that contain general indemnification clauses. The Trust’s maximum exposure under these arrangements is unknown as this would involve future claims that may be made against the Trust that have not yet occurred. Currently, the Trust expects the risk of loss to be remote.
2. Shares of Beneficial Interest
At March 31, 2020, there were an unlimited number of shares authorized (without par value). Transactions in the Fund’s shares were as follows:
| Six Months Ended March 31, 2020a | ||||||||
| Shares | Amount | |||||||
Class A Shares: | ||||||||
Shares soldb | 71,290 | $ | 1,222,925 | |||||
Shares redeemed | (215) | (3,564) | ||||||
|
| |||||||
Net increase (decrease) | 71,075 | $ | 1,219,361 | |||||
|
| |||||||
Class C Shares: | ||||||||
Shares sold | 7,004 | $ | 121,556 | |||||
Shares redeemedb | (120) | (2,033) | ||||||
|
| |||||||
Net increase (decrease) | 6,884 | $ | 119,523 | |||||
|
| |||||||
Class R Shares: | ||||||||
Shares sold | 248 | $ | 5,000 | |||||
|
| |||||||
Class R6 Shares: | ||||||||
Shares sold | 248 | $ | 5,000 | |||||
|
| |||||||
22 | Semiannual Report | franklintempleton.com | ||
FRANKLIN CUSTODIAN FUNDS
NOTES TO FINANCIAL STATEMENTS (UNAUDITED)
Franklin Focused Growth Fund(continued)
| Six Months Ended March 31, 2020a | ||||||||
| Shares | Amount | |||||||
Advisor Class Sharesc: | ||||||||
Shares sold | 291,582 | $ | 5,851,718 | |||||
Shares redeemed | (378) | (5,627) | ||||||
|
| |||||||
Net increase (decrease) | 291,204 | $ | 5,846,091 | |||||
|
| |||||||
aFor the period February 14, 2020 (commencement of operations) to March 31, 2020 for Classes A, C, R and R6.
bMay include a portion of Class C shares that were automatically converted to Class A.
cDuring the year ended September 30, 2019, Advisor Class did not report any share transactions.
3. Transactions with Affiliates
Franklin Resources, Inc. is the holding company for various subsidiaries that together are referred to as Franklin Templeton. Certain officers and trustees of the Trust are also officers and/or directors of the following subsidiaries:
| Subsidiary | Affiliation | |
Franklin Advisers, Inc. (Advisers) | Investment manager | |
Franklin Templeton Services, LLC (FT Services) | Administrative manager | |
Franklin Templeton Distributors, Inc. (Distributors) | Principal underwriter | |
Franklin Templeton Investor Services, LLC (Investor Services) | Transfer agent | |
a. Management Fees
Effective February 1, 2020, the Fund pays an investment management fee to Advisers based on the average daily net assets of the Fund as follows:
| Annualized Fee Rate | Net Assets | |
0.700% | Up to and including $500 million | |
0.600% | Over $500 million, up to and including $1 billion | |
0.550% | Over $1 billion, up to and including $3 billion | |
0.500% | Over $3 billion, up to and including $5 billion | |
0.450% | In excess of $5 billion |
Prior to February 1, 2020, the Fund paid fees to Advisers based on the average daily net assets of the Fund as follows:
| Annualized Fee Rate | Net Assets | |
0.850% | Up to and including $500 million | |
0.800% | Over $500 million, up to and including $1 billion | |
0.750% | Over $1 billion, up to and including $3 billion | |
0.730% | Over $3 billion, up to and including $5 billion | |
0.700% | In excess of $5 billion |
| franklintempleton.com | Semiannual Report | 23 | ||
FRANKLIN CUSTODIAN FUNDS
NOTES TO FINANCIAL STATEMENTS (UNAUDITED)
Franklin Focused Growth Fund(continued)
3. Transactions with Affiliates(continued)
b. Administrative Fees
Under an agreement with Advisers, FT Services provides administrative services to the Fund. The fee is paid by Advisers based on the Fund’s average daily net assets, and is not an additional expense of the Fund.
c. Distribution Fees
The Board has adopted distribution plans for each share class, with the exception of Class R6 and Advisor Class shares, pursuant to Rule12b-1 under the 1940 Act. Under the Fund’s Class A reimbursement distribution plan, the Fund reimburses Distributors for costs incurred in connection with the servicing, sale and distribution of the Fund’s shares up to the maximum annual plan rate. Under the Class A reimbursement distribution plan, costs exceeding the maximum for the current plan year cannot be reimbursed in subsequent periods. In addition, under the Fund’s Class C and R compensation distribution plans, the Fund pays Distributors for costs incurred in connection with the servicing, sale and distribution of the Fund’s shares up to the maximum annual plan rate for each class. The plan year, for purposes of monitoring compliance with the maximum annual plan rates, is February 1 through January 31.
The maximum annual plan rates, based on the average daily net assets, for each class, are as follows:
Class A | 0.25 | % | ||
Class C | 1.00 | % | ||
Class R | 0.50 | % | ||
d. Sales Charges/Underwriting Agreements
Front-end sales charges and contingent deferred sales charges (CDSC) do not represent expenses of the Fund. These charges are deducted from the proceeds of sales of Fund shares prior to investment or from redemption proceeds prior to remittance, as applicable. Distributors has advised the Fund of the following commission transactions related to the sales and redemptions of the Fund’s shares for the period:
Sales charges retained net of commissions paid to unaffiliated brokers/dealers | $ | 123 | ||
CDSC retained | $ | — |
e. Transfer Agent Fees
Each class of shares pays transfer agent fees to Investor Services for its performance of shareholder servicing obligations. The fees are based on an annualized asset based fee of 0.02% plus a transaction based fee. In addition, each class reimburses Investor Services for out of pocket expenses incurred and, except for Class R6, reimburses shareholder servicing fees paid to third parties. These fees are allocated daily based upon their relative proportion of such classes’ aggregate net assets. Class R6 pays Investor Services transfer agent fees specific to that class.
For the period ended March 31, 2020, the Fund paid transfer agent fees of $579, of which $531 was retained by Investor Services.
24 | Semiannual Report | franklintempleton.com | ||
FRANKLIN CUSTODIAN FUNDS
NOTES TO FINANCIAL STATEMENTS (UNAUDITED)
Franklin Focused Growth Fund(continued)
f. Investments in Affiliated Management Investment Companies
The Fund invests in one or more affiliated management investment companies for purposes other than exercising a controlling influence over the management or policies. Management fees paid by the Fund are waived on assets invested in the affiliated management investment companies, as noted in the Statement of Operations, in an amount not to exceed the management and administrative fees paid directly or indirectly by each affiliate. During the period ended March 31, 2020, the Fund held investments in affiliated management investment companies as follows:
| Value at Beginning of Period | Purchases | Sales | Realized Gain (Loss) | Net Change in Unrealized Appreciation (Depreciation) | Value at End of Period | Number of Shares Held at End of Period | Dividend Income | |||||||||||||||||||||||||
Non-Controlled Affiliates | ||||||||||||||||||||||||||||||||
Institutional Fiduciary Trust Money Market Portfolio, 0.32% | $116,522 | $6,177,424 | $(5,836,285) | $ — | $ — | $457,661 | 457,661 | $821 | ||||||||||||||||||||||||
|
|
|
| |||||||||||||||||||||||||||||
g. Waiver and Expense Reimbursements
Advisers has contractually agreed in advance to waive or limit its fees and to assume as its own expense certain expenses otherwise payable by the Fund so that the expenses (excluding distribution fees, acquired fund fees and expenses and certainnon-routine expenses or costs, including those relating to litigation, indemnification, reorganizations, and liquidations) for each class of the Fund do not exceed 0.85% based on the average net assets of each class until January 31, 2021. Total expenses waived or paid are not subject to recapture subsequent to the Fund’s fiscal year end.
Prior to February 1, 2020, expenses (excluding certain fees and expenses as previously disclosed) for the Fund were limited to 1.00% based on the average net assets of each class.
h. Other Affiliated Transactions
At March 31, 2020, Franklin Resources, Inc. owned 85.3% of the Fund’s outstanding shares. Investment activities of this shareholder could have a material impact on the Fund.
4. Expense Offset Arrangement
The Fund has entered into an arrangement with its custodian whereby credits realized as a result of uninvested cash balances are used to reduce a portion of the Fund’s custodian expenses. During the period ended March 31, 2020, there were no credits earned.
5. Income Taxes
At March 31, 2020, the cost of investments and net unrealized appreciation (depreciation) for income tax purposes were as follows:
Cost of investments | $ | 9,561,679 | ||
Unrealized appreciation | $ | 937,914 | ||
Unrealized depreciation | (382,357 | ) | ||
Net unrealized appreciation (depreciation) | $ | 555,557 | ||
| franklintempleton.com | Semiannual Report | 25 | ||
FRANKLIN CUSTODIAN FUNDS
NOTES TO FINANCIAL STATEMENTS (UNAUDITED)
Franklin Focused Growth Fund(continued)
6. Investment Transactions
Purchases and sales of investments (excluding short term securities) for the period ended March 31, 2020, aggregated $7,371,206 and $984,511, respectively.
7. Novel Coronavirus Pandemic
The global outbreak of the novel coronavirus disease, known asCOVID-19, has caused adverse effects on many companies, sectors, nations, regions and the markets in general, and may continue for an unpredictable duration. The effects of this pandemic may materially impact the value and performance of the Fund, its ability to buy and sell fund investments at appropriate valuations and its ability to achieve its investment objectives.
8. Credit Facility
The Fund, together with other U.S. registered and foreign investment funds (collectively, Borrowers), managed by Franklin Templeton, are borrowers in a joint syndicated senior unsecured credit facility totaling $2 billion (Global Credit Facility) which matures on February 5, 2021. This Global Credit Facility provides a source of funds to the Borrowers for temporary and emergency purposes, including the ability to meet future unanticipated or unusually large redemption requests.
Under the terms of the Global Credit Facility, the Fund shall, in addition to interest charged on any borrowings made by the Fund and other costs incurred by the Fund, pay its share of fees and expenses incurred in connection with the implementation and maintenance of the Global Credit Facility, based upon its relative share of the aggregate net assets of all of the Borrowers, including an annual commitment fee of 0.15% based upon the unused portion of the Global Credit Facility. These fees are reflected in other expenses in the Statement of Operations. During the period ended March 31, 2020, the Fund did not use the Global Credit Facility.
9. Fair Value Measurements
The Fund follows a fair value hierarchy that distinguishes between market data obtained from independent sources (observable inputs) and the Fund’s own market assumptions (unobservable inputs). These inputs are used in determining the value of the Fund’s financial instruments and are summarized in the following fair value hierarchy:
| • | Level 1 – quoted prices in active markets for identical financial instruments |
| • | Level 2 – other significant observable inputs (including quoted prices for similar financial instruments, interest rates, prepayment speed, credit risk, etc.) |
| • | Level 3 – significant unobservable inputs (including the Fund’s own assumptions in determining the fair value of financial instruments) |
The input levels are not necessarily an indication of the risk or liquidity associated with financial instruments at that level.
26 | Semiannual Report | franklintempleton.com | ||
FRANKLIN CUSTODIAN FUNDS
NOTES TO FINANCIAL STATEMENTS (UNAUDITED)
Franklin Focused Growth Fund(continued)
A summary of inputs used as of March 31, 2020, in valuing the Fund’s assets carried at fair value, is as follows:
| Level 1 | Level 2 | Level 3 | Total | |||||||||||||
| ||||||||||||||||
Assets: | ||||||||||||||||
Investments in Securities:a | ||||||||||||||||
Equity Investments: | ||||||||||||||||
IT Services | $ | 1,129,313 | $ | 202,420 | $ | — | $ | 1,331,733 | ||||||||
All Other Equity Investments | 8,327,842 | — | — | 8,327,842 | ||||||||||||
Short Term Investments | 457,661 | — | — | 457,661 | ||||||||||||
|
| |||||||||||||||
Total Investments in Securities | $ | 9,914,816 | $ | 202,420 | $ | — | $ | 10,117,236 | ||||||||
|
| |||||||||||||||
aFor detailed categories, see the accompanying Statement of Investments.
10. New Accounting Pronouncements
In March 2020, the Financial Accounting Standards Board issued Accounting Standards Update (ASU)No. 2020-04, Reference Rate Reform (Topic 848) – Facilitation of the Effects of Reference Rate Reform on Financial Reporting. The amendments in the ASU provides optional temporary financial reporting relief from the effect of certain types of contract modifications due to the planned discontinuation of the London Interbank Offered Rate (LIBOR) and other interbank-offered based reference rates as of the end of 2021. The ASU is effective for certain reference rate-related contract modifications that occur during the period March 12, 2020 through December 31, 2022. Management is currently evaluating the impact, if any, of applying this ASU.
11. Subsequent Events
The Fund has evaluated subsequent events through the issuance of the financial statements and determined that no events have occurred that require disclosure.
Abbreviations
Selected Portfolio
ADR American Depositary Receipt
| franklintempleton.com | Semiannual Report | 27 | ||
FRANKLIN CUSTODIAN FUNDS
FRANKLIN FOCUSED GROWTH FUND
Board Approval of Investment
Management Agreements
FRANKLIN CUSTODIAN FUNDS
Franklin Focused Growth Fund
(Fund)
At anin-person meeting held on February 25, 2020 (Meeting), the Board of Trustees (Board) of Franklin Custodian Funds (Trust), including a majority of the trustees who are not “interested persons” as defined in the Investment Company Act of 1940 (Independent Trustees), reviewed and approved the continuance of the investment management agreement between Franklin Advisers, Inc. (Manager) and the Trust, on behalf of the Fund (Management Agreement) for an additionalone-year period. The Independent Trustees received advice from and met separately with Independent Trustee counsel in considering whether to approve the continuation of the Management Agreement.
In considering the continuation of the Management Agreement, the Board reviewed and considered information provided by the Manager at the Meeting and throughout the year at meetings of the Board and its committees. The Board also reviewed and considered information provided in response to a detailed set of requests for information submitted to the Manager by Independent Trustee counsel on behalf of the Independent Trustees in connection with the annual contract renewal process. In addition, prior to the Meeting, the Independent Trustees held a telephonic contract renewal meeting at which the Independent Trustees conferred amongst themselves and Independent Trustee counsel about contract renewal matters and, in some cases, requested additional information from the Manager relating to the contract. The Board reviewed and considered all of the factors it deemed relevant in approving the continuance of the Management Agreement, including, but not limited to: (i) the nature, extent and quality of the services provided by the Manager; (ii) the investment performance of the Fund; (iii) the costs of the services provided and profits realized by the Manager and its affiliates from the relationship with the Fund; (iv) the extent to which economies of scale are realized as the Fund grows; and (v) whether fee levels reflect these economies of scale for the benefit of Fund investors.
In approving the continuance of the Management Agreement, the Board, including a majority of the Independent Trustees, determined that the terms of the Management Agreement are fair and reasonable and that
the continuance of such Management Agreement is in the interests of the Fund and its shareholder(s). While attention was given to all information furnished, the following discusses some primary factors relevant to the Board’s determination.
Nature, Extent and Quality of Services
The Board reviewed and considered information regarding the nature, extent and quality of investment management services provided by the Manager and its affiliates to the Fund and its shareholders. This information included, among other things, the qualifications, background and experience of the senior management and investment personnel of the Manager, as well as information on succession planning where appropriate; the structure of investment personnel compensation; oversight of third-party service providers; investment performance reports and related financial information for the Fund; reports on expenses and shareholder services; legal and compliance matters; risk controls; pricing and other services provided by the Manager and its affiliates; and management fees charged by the Manager and its affiliates to US funds and other accounts, including management’s explanation of differences among accounts where relevant. The Board also reviewed and considered an annual report on payments made by Franklin Templeton (FT) or the Fund to financial intermediaries, as well as a memorandum relating to third-party servicing arrangements, which included discussion of the changing distribution landscape for the Fund. The Board noted management’s continuing efforts and expenditures in establishing effective business continuity plans and developing strategies to address areas of heightened concern in the mutual fund industry, such as cybersecurity and liquidity risk management.
The Board also reviewed and considered the benefits provided to Fund shareholders of investing in a fund that is part of the FT family of funds. The Board noted the financial position of Franklin Resources, Inc. (FRI), the Manager’s parent, and its commitment to the mutual fund business as evidenced by its continued introduction of new funds, reassessment of the fund offerings in response to the market environment and project initiatives and capital investments relating to the services provided to the Fund by the FT organization. The Board specifically noted FT’s commitment to enhancing services and controlling costs, as reflected in its plan to outsource certain administrative functions, and growth opportunities, as evidenced by its upcoming acquisition of the Legg Mason companies. The Board acknowledged the change in leadership at FRI and
28 | Semiannual Report | franklintempleton.com | ||
FRANKLIN CUSTODIAN FUNDS
FRANKLIN FOCUSED GROWTH FUND
SHAREHOLDER INFORMATION
the opportunity to hear from Jennifer Johnson, President and Chief Executive Officer of FRI, about goals she has for the company that will benefit the Fund.
Following consideration of such information, the Board was satisfied with the nature, extent and quality of services provided by the Manager and its affiliates to the Fund and its shareholder(s).
Fund Performance
The Board reviewed and considered the performance results of the Fund over various time periods ended December 31, 2019. The Board considered the performance returns for the Fund in comparison to the performance returns of mutual funds deemed comparable to the Fund included in a universe (Performance Universe) selected by Broadridge Financial Solutions, Inc. (Broadridge), an independent provider of investment company data. The Board received a description of the methodology used by Broadridge to select the mutual funds included in a Performance Universe. The Board also reviewed and considered Fund performance reports provided and discussions that occurred with portfolio managers at Board meetings throughout the year. A summary of the Fund’s performance results is below.
The Performance Universe for the Fund included the Fund and all retail and institutionallarge-cap growth funds. The Board noted that the Fund’s annualized total return for theone-year period was slightly below the median of its Performance Universe, but for the three-year period was above the median and in the first quintile (best) of its Performance Universe. The Board concluded that the Fund’s performance was satisfactory.
Comparative Fees and Expenses
The Board reviewed and considered information regarding the Fund’s actual total expense ratio and its various components, including, as applicable, management fees; transfer agent expenses; underlying fund expenses; Rule12b-1 andnon-Rule12b-1 service fees; and othernon-management fees. The Board also noted the quarterly and annual reports it receives on all marketing support payments made by FT to financial intermediaries. The Board considered the actual total expense ratio and, separately, the contractual management fee rate, without the effect of fee waivers, if any (Management Rate) of the Fund in comparison to the median expense ratio and median Management Rate, respectively, of other mutual funds deemed comparable to and with a similar expense structure to the Fund selected by Broadridge (Expense Group). Broadridge fee and expense data is based upon information
taken from each fund’s most recent annual report, which reflects historical asset levels that may be quite different from those currently existing, particularly in a period of market volatility. While recognizing such inherent limitation and the fact that expense ratios and Management Rates generally increase as assets decline and decrease as assets grow, the Board believed the independent analysis conducted by Broadridge to be an appropriate measure of comparative fees and expenses. The Broadridge Management Rate includes administrative charges, and the actual total expense ratio, for comparative consistency, was shown for Advisor Class shares for the Fund and for the Institutional Class, Class I, Class N, Class P or Advisor Class shares for each other fund in the Expense Group. The Board received a description of the methodology used by Broadridge to select the mutual funds included in an Expense Group.
The Expense Group for the Fund included the Fund and ten otherlarge-cap growth funds. The Board noted that the Management Rate for the Fund was above the median of its Expense Group, and its actual total expense ratio was slightly above the median of its Expense Group. The Board concluded that the Management Rate charged to the Fund is reasonable. In doing so, the Board noted that, effective February 1, 2020, each level of the Fund’s tiered management fee schedule was reduced. The Board further noted the fee waiver from management on the Fund’s actual total expense ratio.
Profitability
The Board reviewed and considered information regarding the profits realized by the Manager and its affiliates in connection with the operation of the Fund. In this respect, the Board considered the Fund profitability analysis provided by the Manager that addresses the overall profitability of FT’s US fund business, as well as its profits in providing investment management and other services to each of the individual funds during the12-month period ended September 30, 2019, being the most recent fiscalyear-end for FRI. The Board noted that although management continually makes refinements to its methodologies used in calculating profitability in response to organizational and product-related changes, the overall methodology has remained consistent with that used in the Fund’s profitability report presentations from prior years. Additionally, PricewaterhouseCoopers LLP, auditor to FRI and certain FT funds, was engaged by the Manager to review and assess the allocation methodologies to be used solely by the Fund’s Board with respect to the profitability analysis.
| franklintempleton.com | Semiannual Report | 29 | ||
FRANKLIN CUSTODIAN FUNDS
FRANKLIN FOCUSED GROWTH FUND
SHAREHOLDER INFORMATION
The Board noted management’s belief that costs incurred in establishing the infrastructure necessary for the type of mutual fund operations conducted by the Manager and its affiliates may not be fully reflected in the expenses allocated to the Fund in determining its profitability, as well as the fact that the level of profits, to a certain extent, reflected operational cost savings and efficiencies initiated by management. As part of this evaluation, the Board considered the initiative currently underway to outsource certain operations, which effort would require considerable up front expenditures by the Manager but, over the long run is expected to result in greater efficiencies. The Board also noted management’s expenditures in improving shareholder services provided to the Fund, as well as the need to implement systems and meet additional regulatory and compliance requirements resulting from recent US Securities and Exchange Commission and other regulatory requirements, notably in the area of cybersecurity protections.
The Board also considered the extent to which the Manager and its affiliates might derive ancillary benefits from fund operations, including revenues generated from transfer agent services, potential benefits resulting from personnel and systems enhancements necessitated by fund growth, as well as increased leverage with service providers and counterparties. Based upon its consideration of all these factors, the Board concluded that the level of profits realized/expected to be realized by the Manager and its affiliates from providing services to the Fund was not excessive in view of the nature, extent and quality of services provided to the Fund.
Economies of Scale
The Board reviewed and considered the extent to which the Manager may realize economies of scale, if any, as the Fund grows larger and whether the Fund’s management fee structure reflects any economies of scale for the benefit of shareholder(s). With respect to possible economies of scale, the Board noted the existence of management fee breakpoints, which operate generally to share any economies of scale with the Fund’s shareholder(s) by reducing the Fund’s effective management fees as the Fund grows in size. The Board considered the Manager’s view that any analyses of potential economies of scale in managing a particular fund are inherently limited in light of the joint and common costs and investments the Manager incurs across the FT family of funds as a whole. The Board noted that the Fund does not have an asset size that would likely enable the Fund to achieve economies of scale, but concluded that
to the extent economies of scale may be realized by the Manager and its affiliates, the Fund’s management fee structure provided a sharing of benefits with the Fund and its shareholders as the Fund grows.
Conclusion
Based on its review, consideration and evaluation of all factors it believed relevant, including the above-described factors and conclusions, the Board unanimously approved the continuation of the Management Agreement for an additionalone-year period.
Proxy Voting Policies and Procedures
The Fund’s investment manager has established Proxy Voting Policies and Procedures (Policies) that the Fund uses to determine how to vote proxies relating to portfolio securities. Shareholders may view the Fund’s complete Policies online at franklintempleton.com. Alternatively, shareholders may request copies of the Policies free of charge by calling the Proxy Group collect at (954)527-7678 or by sending a written request to: Franklin Templeton Companies, LLC, 300 S.E. 2nd Street, Fort Lauderdale, FL 33301, Attention: Proxy Group. Copies of the Fund’s proxy voting records are also made available online at franklintempleton.com and posted on the U.S. Securities and Exchange Commission’s website at sec.gov and reflect the most recent12-month period ended June 30.
Quarterly Statement of Investments
The Trust, on behalf of the Fund, files a complete statement of investments with the U.S. Securities and Exchange Commission for the first and third quarters for each fiscal year as an exhibit to its report on FormN-PORT. Shareholders may view the filed FormN-PORT by visiting the Commission’s website at sec.gov. The filed form may also be viewed and copied at the Commission’s Public Reference Room in Washington, DC. Information regarding the operations of the Public Reference Room may be obtained by calling(800) SEC-0330.
30 | Semiannual Report | franklintempleton.com | ||
This page intentionally left blank.
This page intentionally left blank.
Authorized for distribution only when accompanied or preceded by a summary prospectus and/or prospectus. Investors should carefully consider a fund’s investment goals, risks, charges and expenses before investing. A prospectus contains this and other information; please read it carefully before investing.
To help ensure we provide you with quality service, all calls to and from our service areas are monitored and/or recorded.
 | Semiannual Report and Shareholder Letter | |||||
| Franklin Focused Growth Fund | ||||||
Investment Manager |
Distributor |
Shareholder Services | ||||
| Franklin Advisers, Inc. | Franklin Templeton Distributors, Inc. | (800)632-2301 | ||||
| (800) DIAL BEN®/342-5236 | ||||||
| franklintempleton.com | ||||||
| © 2020 Franklin Templeton Investments. All rights reserved. | 961 S 05/20 | |||||
Item 2. Code of Ethics.
(a) The Registrant has adopted a code of ethics that applies to its principal executive officers and principal financial and accounting officer.
(c) N/A
(d) N/A
(f) Pursuant to Item 13(a)(1), the Registrant is attaching as an exhibit a copy of its code of ethics that applies to its principal executive officers and principal financial and accounting officer.
Item 3. Audit Committee Financial Expert.
(a)(1) The Registrant has an audit committee financial expert serving on its audit committee.
(2) The audit committee financial expert is Mary C. Choksi and she is “independent” as defined under the relevant Securities and Exchange Commission Rules and Releases.
Item 4. Principal Accountant Fees and Services. N/A
Item 5. Audit Committee of Listed Registrants. N/A
Item 6. Schedule of Investments. N/A
Item 7. Disclosure of Proxy Voting Policies and Procedures forClosed-End Management Investment Companies. N/A
Item 8. Portfolio Managers ofClosed-End Management Investment Companies. N/A
Item 9. Purchases of Equity Securities byClosed-End Management Investment Company and Affiliated Purchasers. N/A
Item 10. Submission of Matters to a Vote of Security Holders.
There have been no changes to the procedures by which shareholders may recommend nominees to the Registrant’s Board of Trustees that would require disclosure herein.
Item 11. Controls and Procedures.
(a) Evaluation of Disclosure Controls and Procedures. The Registrant maintains disclosure controls and procedures that are designed to provide reasonable assurance that information required to be disclosed in the Registrant’s filings under the Securities Exchange Act of 1934, as amended, and the Investment Company Act of 1940 is recorded, processed, summarized and reported within the periods specified in the rules and forms of the Securities and Exchange Commission. Such information is accumulated and communicated to the Registrant’s management, including its principal executive officer and principal financial officer, as appropriate, to allow timely decisions regarding required disclosure. The Registrant’s management, including the principal executive officer and the principal financial officer, recognizes that any set of controls and procedures, no matter how well designed and operated, can provide only reasonable assurance of achieving the desired control objectives.
Within 90 days prior to the filing date of this Shareholder Report onForm N-CSR, the Registrant had carried out an evaluation, under the supervision and with the participation of the Registrant’s management, including the Registrant’s principal executive officer and the Registrant’s principal financial officer, of the effectiveness of the design and operation of the Registrant’s disclosure controls and procedures. Based on such evaluation, the Registrant’s principal executive officer and principal financial officer concluded that the Registrant’s disclosure controls and procedures are effective.
(b) Changes in Internal Controls. There have been no changes in the Registrant’s internal control over financial reporting that occurred during the period covered by this report that has materially affected, or is reasonably likely to materially affect the internal control over financial reporting.
Item 12. Disclosure of Securities Lending Activities forClosed-End Management Investment Company. N/A
Item 13. Exhibits.
SIGNATURES
Pursuant to the requirements of the Securities Exchange Act of 1934 and the Investment Company Act of 1940, the registrant has duly caused this report to be signed on its behalf by the undersigned, thereunto duly authorized.
| FRANKLIN CUSTODIAN FUNDS | ||
| By | S\MATTHEW T. HINKLE | |
| Matthew T. Hinkle | ||
| Chief Executive Officer –Finance and Administration | ||
Date May 29, 2020
Pursuant to the requirements of the Securities Exchange Act of 1934 and the Investment Company Act of 1940, this report has been signed below by the following persons on behalf of the registrant and in the capacities and on the dates indicated.
| By | S\MATTHEW T. HINKLE | |
| Matthew T. Hinkle | ||
| Chief Executive Officer –Finance and Administration |
Date May 29, 2020
| By | S\GASTON GARDEY | |
| Gaston Gardey | ||
| Chief Financial Officer and Chief Accounting Officer |
Date May 29, 2020