UNITED STATES
SECURITIES AND EXCHANGE COMMISSION
Washington, DC 20549
FORM N-CSRS
CERTIFIED SHAREHOLDER REPORT OF REGISTERED
MANAGEMENT INVESTMENT COMPANIES
Investment Company Act file number 811-00537
Franklin Custodian Funds
(Exact name of registrant as specified in charter)
One Franklin Parkway, San Mateo, CA 94403-1906
(Address of principal executive offices) (Zip code)
Craig S. Tyle, One Franklin Parkway, San Mateo, CA 94403-1906
(Name and address of agent for service)
Registrant’s telephone number, including area code: 650 312-2000
Date of fiscal year end: 9/30
Date of reporting period: 3/31/18
| Item 1. | Reports to Stockholders. |
| Semiannual Report and Shareholder Letter | |||
| March 31, 2018 |

Franklin Custodian Funds
|
|
Franklin DynaTech Fund
Franklin Growth Fund
Franklin Income Fund
Franklin U.S. Government Securities Fund
Franklin Utilities Fund

Sign up for electronic delivery at franklintempleton.com/edelivery
Franklin Templeton Investments
Why choose Franklin Templeton Investments?
Successful investing begins with ambition. And achievement only comes when you reach for it. That’s why we continually strive to deliver better outcomes for investors. No matter what your goals are, our deep, global investment expertise allows us to offer solutions that can help.
During our more than 70 years of experience, we’ve managed through all kinds of markets—up, down and those in between. We’re always preparing for what may come next. It’s because of this, combined with our strength as one of the world’s largest asset managers that we’ve earned the trust of millions of investors around the world.
Dear Fellow Shareholder:
During the six months ended March 31, 2018, upbeat economic data, generally supportive monetary policies and better corporate earnings combined with the passage of the US tax reform bill aided investor sentiment. However, some investors expressed concerns about President Trump’s protectionist trade policies, as well as trade tensions between the US and China.
The US Federal Reserve (Fed) began reducing its balance sheet in October 2017 and raised its target for the federal funds rate 0.25% from a range of 1.00% to 1.25% to a range of 1.25%–1.50% in December. After the Fed left its target unchanged at its January 2018 meeting, in March the Fed raised it 0.25% from a range of 1.25% to 1.50% to a range of 1.50%–1.75% and maintained its forecast of three rate increases in 2018, while upgrading its economic forecasts for 2018 and 2019. The 10-year US Treasury yield began the period at 2.33% and ended the period at 2.74%. Within this environment, US stocks, as measured by the Standard & Poor’s 500® Index, generated a +5.84% total return for the six-month period.1 Investment-grade bonds, as measured by the Bloomberg Barclays US Aggregate Bond Index, had a negative 1.08% total return.1
We are committed to our long-term perspective and disciplined investment approach as we conduct rigorous, fundamental analysis of securities with a regular emphasis on investment risk management.
We believe active, professional investment management serves investors well. We also recognize the important role of financial advisors in today’s markets and encourage investors
to continue to seek their advice. Amid changing markets and economic conditions, we are confident investors with a well-diversified portfolio and a patient, long-term outlook will be well positioned for the years ahead.
Franklin Custodian Funds’ semiannual report, covering Franklin DynaTech Fund, Franklin Growth Fund, Franklin Income Fund, Franklin U.S. Government Securities Fund and Franklin Utilities Fund, includes more detail about prevailing conditions and a discussion about investment decisions during the period. Please remember all securities markets fluctuate, as do mutual fund share prices.
We thank you for investing with Franklin Templeton, welcome your questions and comments, and look forward to serving your future investment needs.
Sincerely,

Rupert H. Johnson, Jr.
Chairman
Franklin Custodian Funds
This letter reflects our analysis and opinions as of March 31, 2018, unless otherwise indicated. The information is not a complete analysis of every aspect of any market, country, industry, security or fund. Statements of fact are from sources considered reliable.
1. Source: Morningstar.
See: www.franklintempletondatasources.com for additional data provider information.
| Not FDIC Insured | May Lose Value | No Bank Guarantee |
| franklintempleton.com | Not part of the semiannual report | 1 |
| Semiannual Report | ||||
| 3 | ||||
| 4 | ||||
| 10 | ||||
| 16 | ||||
| 24 | ||||
| 29 | ||||
| 34 | ||||
| 91 | ||||
| 100 | ||||
| 121 | ||||
| 125 | ||||
|
| |||
| Visit franklintempleton.com for fund updates, to access your account, or to find helpful financial planning tools. | ||||
| 2 | Semiannual Report | franklintempleton.com |
Semiannual Report
The US economy continued to grow during the six months under review. The economy expanded in 2017’s fourth quarter, though at a slower pace compared to the third quarter. Growth continued to moderate in 2018’s first quarter due to a slowdown in consumer spending, residential fixed investment, exports, and state and local government spending. The manufacturing and services sectors expanded during the period. The unemployment rate declined from 4.2% in September 2017 to 4.1% at period-end.1 Monthly retail sales grew early in the period but subsequently declined for three consecutive months, rebounding at period-end amid robust automobile sales. Annual inflation, as measured by the Consumer Price Index, increased from 2.2% in September 2017 to 2.4% at period-end.1
The US Federal Reserve (Fed) began reducing its balance sheet in October 2017 and raised its target range for the federal funds rate 0.25% to 1.25%–1.50% in December. In February 2018, Jerome Powell succeeded Janet Yellen as Fed Chair and spoke before Congress for the first time. He indicated that the Fed saw signs of a continued strong labor market and economic growth. He reiterated the Fed’s intention to gradually raise interest rates in an effort to keep the economy from overheating as inflation increases toward the Fed’s 2% target. However, he noted that there was no evidence of the economy overheating and that he had yet to see a clear upward move in wages. At its March meeting, the Fed raised its target range for the federal funds rate 0.25% to 1.50%–1.75% and maintained its forecast of three rate increases in 2018. Additionally, the Fed upgraded its economic forecasts for 2018 and 2019, and its rate projections indicated the number of rate hikes would increase in 2019 and 2020.
US equity markets rose during the review period, benefiting from mostly upbeat economic data, better US corporate earnings and improving global economic growth. Markets were also supported by the US Fed Chair’s comments indicating optimism about the US economy and the likelihood of gradual rate hikes, as well as the passage of the US tax reform bill in December. However, concerns about political uncertainties in the US, tensions between the US and North Korea, and the progress of the US tax reform bill curbed market sentiment at times. After reaching new all-time highs in January 2018, US stocks declined in February amid concerns that strong economic growth and rising inflation would lead the Fed to
increase its target rate faster than expected. In March, stocks were pressured further by a broad sell-off in information technology stocks due to a potential for tighter regulation in the sector arising from concerns about consumer data privacy. The Trump administration’s protectionist policy and escalating trade tensions between the US and China further dampened investor sentiment near period-end. In this environment, the broad US stock market, as measured by the Standard & Poor’s® 500 Index, generated a +5.84% total return for the period.2
The foregoing information reflects our analysis and opinions as of March 31, 2018. The information is not a complete analysis of every aspect of any market, country, industry, security or fund. Statements of fact are from sources considered reliable.
1. Source: Bureau of Labor Statistics.
2. Source: Morningstar.
See www.franklintempletondatasources.com for additional data provider information.
| franklintempleton.com | Semiannual Report | 3 |
We are pleased to bring you Franklin DynaTech Fund’s semiannual report for the period ended March 31, 2018.
Your Fund’s Goal and Main Investments
The Fund seeks capital appreciation by investing primarily in equity securities of companies that emphasize innovation and new technologies, have superior management and that benefit from new industry conditions in the dynamically changing global economy.
Performance Overview
The Fund’s Class A shares delivered a +12.73% cumulative total return for the six months under review. In comparison, the Russell 1000® Growth Index, which measures performance of the largest companies in the Russell 3000® Index with higher price-to-book ratios and higher forecasted growth values, generated a total return of +6.99%.1 Also for comparison, the broad US stock market as measured by the Standard & Poor’s 500 Index (S&P 500®), produced a +5.84% return.1 You can find the Fund’s long-term performance data in the Performance Summary beginning on page 7.
Performance data represent past performance, which does not guarantee future results. Investment return and principal value will fluctuate, and you may have a gain or loss when you sell your shares. Current performance may differ from figures shown. For most recent month-end performance, go to franklintempleton.com or call (800) 342-5236.
Investment Strategy
We use fundamental, bottom-up research to seek companies meeting our criteria of growth potential, quality and valuation. In seeking sustainable growth characteristics, we look for companies we believe can produce sustainable earnings and cash flow growth, evaluating the long-term market opportunity and competitive structure of an industry to target leaders and emerging leaders. We define quality companies as those with strong and improving competitive positions in attractive markets. We also believe important attributes of quality are
experienced and talented management teams as well as financial strength reflected in the capital structure, gross and operating margins, free cash flow generation and returns on capital employed. Our valuation analysis includes a range of potential outcomes based on an assessment of multiple scenarios. In assessing value, we consider whether security prices fully reflect the balance of the sustainable growth opportunities relative to business and financial risks.
We may invest in companies in any economic sector or of any market capitalization and may invest in companies both inside and outside of the US. Although we search for investments across a large number of sectors, we expect to have significant positions in particular sectors including, for example, technology and health care.
Manager’s Discussion
During the reporting period, most investment sectors contributed to absolute performance, notably consumer discretionary, information technology (IT) and industrials.2 In the consumer discretionary sector, online retail shopping services provider Amazon.com benefited results as it continued to experience revenue growth, driven by higher margin businesses such as fulfillment services, advertising revenue and subscriptions to its Prime service. We believe Prime subscribers could support retail growth, as the program appears to increase purchase frequency, loyalty and overall spending. Its Amazon Web Service, a leader in cloud computing, also drove profitability for the company. Netflix, an internet subscription service company, also boosted results.
In the IT sector, Mastercard, a technology company that provides payment services reported an increase in fourth-quarter 2017 revenue that was stronger than consensus. Management described its outlook for 2018 as slightly better than 2017. The company continued to benefit from the ongoing transition from cash toward card and electronic payments. The Fund’s position in digital marketing and media company Adobe Systems and China-based internet value-added services provider Tencent Holdings also benefited results.
1. Source: Morningstar.
The indexes are unmanaged and include reinvestment of any income or distributions. They do not reflect any fees, expenses or sales charges. One cannot invest directly in an index, and an index is not representative of the Fund’s portfolio.
Frank Russell Company is the source and owner of the trademarks, service marks and copyrights related to the Russell Indexes. Russell® is a trademark of Frank Russell Company.
2. The consumer discretionary sector comprises diversified consumer services; internet and direct marketing retail; media; and textiles, apparel and luxury goods in the SOI. The IT sector comprises communications equipment; electronic equipment, instruments and components; internet software and services; IT services; semiconductors and semiconductor equipment; software; and technology hardware, storage and peripherals in the SOI. The industrials sector comprises aerospace and defense, air freight and logistics, electrical equipment, industrial conglomerates, machinery and professional services in the SOI.
The dollar value, number of shares or principal amount, and names of all portfolio holdings are listed in the Fund’s Statement of Investments (SOI). The SOI begins on page 39.
| 4 | Semiannual Report | franklintempleton.com |
FRANKLIN DYNATECH FUND
In industrials, Boeing, which manufactures commercial jetliners and defense, space and security systems, reported strong fourth-quarter 2017 revenue and earnings results that exceeded market expectations, aided by solid operating performance. Additionally, the company provided higher-than-expected fiscal-year 2018 guidance as it started 2018 with diversified demand across all commercial aviation markets and solid growth in its global services segment.
In contrast, the energy sector detracted from the Fund’s absolute performance during the period.3 Schlumberger, a company that provides project management solutions to the international oil and gas exploration and production industries, detracted from performance.
Individual holdings that detracted from the Fund’s performance included Celgene,4 Regeneron Pharmaceuticals and Incyte.4 Biopharmaceutical company Celgene reported disappointing third-quarter 2017 results as revenues for its psoriasis medication Otezla came in significantly below expectations due to increased competition and discounting, although the drug rebounded during the period. Additionally, its cancer drug Revlimid faced patent litigation. Protein engineering biopharmaceutical company Regeneron, detracted from results. Its shares declined after it discontinued phase 3 trials for its combination eye disease therapy due to unfavorable results. Further pressuring sales were investor concerns about encouraging developmental data from two direct competitors to its primary product Eylea, an engineered protein used in treating retinal disorders. Shares of biopharmaceutical company Incyte declined after a rumored buyout did not materialize.
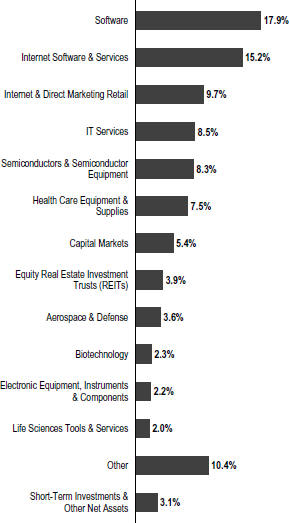
Portfolio Composition
Based on Total Net Assets as of 3/31/18
3. The energy sector comprises energy equipment and services in the SOI.
4. Not held at period-end.
See www.franklintempletondatasources.com for additional data provider information.
| franklintempleton.com | Semiannual Report | 5 |
FRANKLIN DYNATECH FUND
Top 10 Holdings
3/31/18
Company Sector/Industry | % of Total Net Assets | |
Amazon.com Inc. Internet & Direct Marketing Retail |
7.1% | |
Alphabet Inc. Internet Software & Services |
4.5% | |
Mastercard Inc. IT Services |
3.4% | |
Facebook Inc. Internet Software & Services |
3.1% | |
Tencent Holdings Ltd. Internet Software & Services |
2.6% | |
Visa Inc. IT Services |
2.3% | |
Salesforce.com Inc. Software |
2.3% | |
Adobe Systems Inc. Software |
2.1% | |
ServiceNow Inc. Software |
1.9% | |
Raytheon Co. Aerospace & Defense |
1.7% |
Thank you for your continued participation in Franklin DynaTech Fund. We look forward to serving your future investment needs.
|
Matthew J. Moberg, CPA |


|
Rupert H. Johnson, Jr. | |
Portfolio Management Team | ||


The foregoing information reflects our analysis, opinions and portfolio holdings as of March 31, 2018, the end of the reporting period. The way we implement our main investment strategies and the resulting portfolio holdings may change depending on factors such as market and economic conditions. These opinions may not be relied upon as investment advice or an offer for a particular security. The information is not a complete analysis of every aspect of any market, country, industry, security or the Fund. Statements of fact are from sources considered reliable, but the investment manager makes no representation or warranty as to their completeness or accuracy. Although historical performance is no guarantee of future results, these insights may help you understand our investment management philosophy.
| 6 | Semiannual Report | franklintempleton.com |
FRANKLIN DYNATECH FUND
Performance Summary as of March 31, 2018
The performance table does not reflect any taxes that a shareholder would pay on Fund dividends, capital gain distributions, if any, or any realized gains on the sale of Fund shares. Total return reflects reinvestment of the Fund’s dividends and capital gain distributions, if any, and any unrealized gains or losses. Your dividend income will vary depending on dividends or interest paid by securities in the Fund’s portfolio, adjusted for operating expenses of each class. Capital gain distributions are net profits realized from the sale of portfolio securities.
Performance as of 3/31/181
Cumulative total return excludes sales charges. Average annual total return includes maximum sales charges. Sales charges will vary depending on the size of the investment and the class of share purchased. The maximum is 5.75% and the minimum is 0%. Class A: 5.75% maximum initial sales charge; Advisor Class: no sales charges. For other share classes, visit franklintempleton.com.
| Share Class | Cumulative Total Return2 | Average Annual Total Return3 | ||
A | ||||
6-Month | +12.73% | +6.25% | ||
1-Year | +31.36% | +23.82% | ||
5-Year | +125.49% | +16.28% | ||
10-Year | +229.64% | +12.01% | ||
Advisor4 | ||||
6-Month | +12.89% | +12.89% | ||
1-Year | +31.69% | +31.69% | ||
5-Year | +128.34% | +17.96% | ||
10-Year | +237.85% | +12.95% | ||
Performance data represent past performance, which does not guarantee future results. Investment return and principal value will fluctuate, and you may have a gain or loss when you sell your shares. Current performance may differ from figures shown. For most recent month-end performance, go to franklintempleton.com or call (800) 342-5236.
See page 8 for Performance Summary footnotes.
| franklintempleton.com | Semiannual Report | 7 |
FRANKLIN DYNATECH FUND
PERFORMANCE SUMMARY
Distributions (10/1/17–3/31/18)
| Share Class | Long-Term Capital Gain | |||
A | $1.1554 | |||
C | $1.1554 | |||
R | $1.1554 | |||
R6 | $1.1554 | |||
Advisor | $1.1554 | |||
Total Annual Operating Expenses5
| Share Class | With Waiver | Without Waiver | ||||||
A | 0.89% | 0.90% | ||||||
Advisor | 0.64% | 0.65% | ||||||
Each class of shares is available to certain eligible investors and has different annual fees and expenses, as described in the prospectus.
All investments involve risks, including possible loss of principal. Stocks historically have outperformed other asset classes over the long term, but tend to fluctuate more dramatically over the short term. Investments in fast-growing industries, like the technology and health care sectors (which have historically been volatile) could result in increased price fluctuation, especially over the short term, due to the rapid pace of product change and development and changes in government regulation of companies emphasizing scientific or technological advancement or regulatory approval for new drugs and medical instruments. The Fund may also invest in small- and mid-capitalization companies, which can be particularly sensitive to changing economic conditions, and their prospects for growth are less certain than those of larger, more established companies. The Fund is actively managed but there is no guarantee that the manager’s investment decisions will produce the desired results. The Fund’s prospectus also includes a description of the main investment risks.
1. The Fund has a fee waiver associated with any investment it makes in a Franklin Templeton money fund and/or other Franklin Templeton fund, contractually guaranteed through 1/31/19. Fund investment results reflect the fee waiver; without this waiver, the results would have been lower.
2. Cumulative total return represents the change in value of an investment over the periods indicated.
3. Average annual total return represents the average annual change in value of an investment over the periods indicated. Return for less than one year, if any, has not been annualized.
4. Effective 5/15/08, the Fund began offering Advisor Class shares, which do not have sales charges or a Rule 12b-1 plan. Performance quotations for this class reflect the following methods of calculation: (a) For periods prior to 5/15/08, a restated figure is used based upon the Fund’s Class A performance, excluding the effect of Class A’s maximum initial sales charge, but reflecting the effect of the Class A Rule 12b-1 fees; and (b) for periods after 5/15/08, actual Advisor Class performance is used reflecting all charges and fees applicable to that class. Since 5/15/08 (commencement of sales), the cumulative and average annual total returns of Advisor Class shares were +198.90% and +11.72%.
5. Figures are as stated in the Fund’s current prospectus and may differ from the expense ratios disclosed in the Your Fund’s Expenses and Financial Highlights sections in this report. In periods of market volatility, assets may decline significantly, causing total annual Fund operating expenses to become higher than the figures shown.
| 8 | Semiannual Report | franklintempleton.com |
FRANKLIN DYNATECH FUND
Your Fund’s Expenses
As a Fund shareholder, you can incur two types of costs: (1) transaction costs, including sales charges (loads) on Fund purchases and redemptions; and (2) ongoing Fund costs, including management fees, distribution and service (12b-1) fees, and other Fund expenses. All mutual funds have ongoing costs, sometimes referred to as operating expenses. The table below shows ongoing costs of investing in the Fund and can help you understand these costs and compare them with those of other mutual funds. The table assumes a $1,000 investment held for the six months indicated.
Actual Fund Expenses
The table below provides information about actual account values and actual expenses in the columns under the heading “Actual.” In these columns the Fund’s actual return, which includes the effect of Fund expenses, is used to calculate the “Ending Account Value” for each class of shares. You can estimate the expenses you paid during the period by following these steps (of course, your account value and expenses will differ from those in this illustration): Divide your account value by $1,000 (if your account had an $8,600 value, then $8,600 ÷ $1,000 = 8.6). Then multiply the result by the number in the row for your class of shares under the headings “Actual” and “Expenses Paid During Period” (if Actual Expenses Paid During Period were $7.50, then 8.6 x $7.50 = $64.50). In this illustration, the actual expenses paid this period are $64.50.
Hypothetical Example for Comparison with Other Funds
Under the heading “Hypothetical” in the table, information is provided about hypothetical account values and hypothetical expenses based on the Fund’s actual expense ratio and an assumed rate of return of 5% per year before expenses, which is not the Fund’s actual return. This information may not be used to estimate the actual ending account balance or expenses you paid for the period, but it can help you compare ongoing costs of investing in the Fund with those of other funds. To do so, compare this 5% hypothetical example for the class of shares you hold with the 5% hypothetical examples that appear in the shareholder reports of other funds.
Please note that expenses shown in the table are meant to highlight ongoing costs and do not reflect any transactional costs. Therefore, information under the heading “Hypothetical” is useful in comparing ongoing costs only, and will not help you compare total costs of owning different funds. In addition, if transactional costs were included, your total costs would have been higher.
| Actual (actual return after expenses) | Hypothetical (5% annual return before expenses) | |||||||||||||||||||||||||||||||||||
| Share Class | Beginning Account Value 10/1/17 | Ending Account Value 3/31/18 | Expenses Paid During Period 10/1/17–3/31/181,2 | Ending Account Value 3/31/18 | Expenses Paid During Period 10/1/17–3/31/181,2 | Net Annualized Expense Ratio2 | ||||||||||||||||||||||||||||||
A | $ | 1,000 | $ | 1,127.30 | $ | 4.61 | $ | 1,020.59 | $ | 4.38 | 0.87% | |||||||||||||||||||||||||
C | $ | 1,000 | $ | 1,123.50 | $ | 8.58 | $ | 1,016.85 | $ | 8.15 | 1.62% | |||||||||||||||||||||||||
R | $ | 1,000 | $ | 1,126.10 | $ | 5.94 | $ | 1,019.35 | $ | 5.64 | 1.12% | |||||||||||||||||||||||||
R6 | $ | 1,000 | $ | 1,129.90 | $ | 2.60 | $ | 1,022.49 | $ | 2.47 | 0.49% | |||||||||||||||||||||||||
Advisor | $ | 1,000 | $ | 1,128.90 | $ | 3.29 | $ | 1,021.84 | $ | 3.13 | 0.62% | |||||||||||||||||||||||||
1. Expenses are equal to the annualized expense ratio for the six-month period as indicated above—in the far right column—multiplied by the simple average account value over the period indicated, and then multiplied by 182/365 to reflect the one-half year period.
2. Reflects expenses after fee waivers and expense reimbursements. Does not include acquired fund fees and expenses.
| franklintempleton.com | Semiannual Report | 9 |
We are pleased to bring you Franklin Growth Fund’s semiannual report for the period ended March 31, 2018.
Your Fund’s Goal and Main Investments
The Fund seeks capital appreciation by investing substantially in equity securities of companies that are leaders in their industries.
Performance Overview
The Fund’s Class A shares delivered a +8.04% cumulative total return for the six months under review. In comparison, the Standard & Poor’s 500 Index (S&P 500), which is a broad measure of U.S. stock performance, had a +5.84% total return.1 You can find the Fund’s long-term performance data in the Performance Summary beginning on page 13.
Performance data represent past performance, which does not guarantee future results. Investment return will fluctuate. Current performance may differ from figures shown. For most recent month-end performance, go to franklintempleton.com or call (800) 342-5236.
Investment Strategy
We use fundamental, bottom-up research to seek companies meeting our criteria of growth potential, quality and valuation. In seeking sustainable growth characteristics, we look for companies we believe can produce sustainable earnings and cash flow growth, evaluating the long-term market opportunity and competitive structure of an industry to target leaders and emerging leaders. We define quality companies as those with strong and improving competitive positions in attractive markets. We also believe important attributes of quality are experienced and talented management teams as well as financial strength reflected in the capital structure, gross and operating margins, free cash flow generation and returns on capital employed. Our valuation analysis includes a range of potential outcomes based on an assessment of multiple scenarios. In assessing value, we consider whether security prices fully reflect the balance of the sustainable growth opportunities relative to business and financial risks.
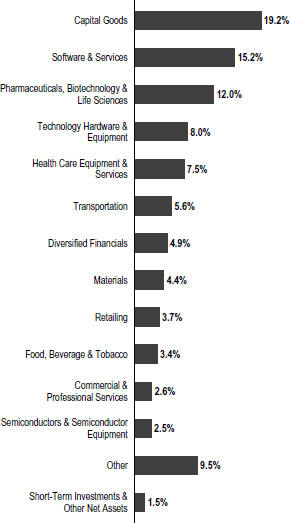
Portfolio Composition
Based on Total Net Assets as of 3/31/18
Manager’s Discussion
Franklin Growth Fund owned shares of 139 companies at period-end. We continue to invest in a broad array of companies of all sizes and in varied industries.
During the period under review, all sectors contributed to absolute performance, notably consumer discretionary,
1. Source: Morningstar.
The index is unmanaged and includes reinvestment of any income or distributions. It does not reflect any fees, expenses or sales charges. One cannot invest directly in an index, and an index is not representative of the Fund’s portfolio.
The dollar value, number of shares or principal amount, and names of all portfolio holdings are listed in the Fund’s Statement of Investments (SOI). The SOI begins on page 48.
| 10 | Semiannual Report | franklintempleton.com |
FRANKLIN GROWTH FUND
Top 10 Holdings
3/31/18
| Company Sector/Industry | % of Total Net Assets | |
Apple Inc. Technology Hardware & Equipment | 4.6% | |
Amazon.com Inc. Retailing | 3.4% | |
Northrop Grumman Corp. Capital Goods | 2.6% | |
The Boeing Co. Capital Goods | 2.4% | |
Alphabet Inc. Software & Services | 2.3% | |
Microsoft Corp. Software & Services | 2.1% | |
Union Pacific Corp. Transportation | 1.8% | |
Mastercard Inc. Software & Services | 1.7% | |
Mettler-Toledo International Inc. Pharmaceuticals, Biotechnology & Life Sciences | 1.7% | |
General Dynamics Corp. Capital Goods | 1.5% | |
industrials and information technology (IT).2 In the consumer discretionary sector, online retail shopping services provider Amazon.com contributed to the Fund’s performance as it continued to experience revenue growth, driven by higher margin businesses such as fulfillment services, advertising revenue and subscriptions to its Prime service. We believe Prime subscribers could support retail growth, as the program appears to increase purchase frequency, loyalty and overall spending. Its Amazon Web Service, a leader in cloud computing, also drove profitability for the company.
In industrials, Boeing, which manufactures commercial jetliners and defense, space and security systems, reported strong fourth-quarter 2017 revenue and earnings results that exceeded market expectations, aided by solid operating performance. Additionally, the company provided higher-than-expected fiscal-year 2018 guidance as it started 2018 with diversified demand across all commercial aviation markets and solid growth in its global services segment. Shares in global security company Northrop Grumman also benefited results.
In the IT sector, shares of software and equipment company Apple benefited from robust earnings, revenue and cash flow generation from a strong product cycle, with many customers pleased with the new iPhone’s features. The company’s high-margin services business also continued to grow, and we believe recent guidance to minimize its cash position could mean more cash for shareholders. In addition, shares of software and services company Microsoft contributed to performance.
Although the Fund had no sector detractors, some holdings detracted from absolute performance, including Celgene, General Electric (GE), Alaska Air Group, Albermarle3 and Mettler-Toledo International. Biopharmaceutical company Celgene reported disappointing third-quarter 2017 results as revenues for its psoriasis medication Otezla came in significantly below expectations due to increased competition and discounting, although the drug rebounded during the period. Additionally, its cancer drug Revlimid faced patent litigation.
Industrial conglomerate GE struggled with lower-than-expected cash flow, ultimately resulting in a reduction in its dividend distribution. Its oil segment and gas and power segment remain challenged, though we believe the company is taking steps to improve profitability, reduce costs, implement more accountability and sell non-core assets.
Air transportation services company Alaska Air Group, the holding company for Alaska Airlines and Horizon Air Industries, continued to face a difficult competitive environment. The company reported revenues in line with expectations but lower-than-expected earnings for 2017’s third-quarter. The company lowered its earnings guidance for 2018, noting increased costs resulting from the new pilot’s contract; the reduced flight schedule for Horizon Airlines due to a pilot shortage; and customer service issues arising from the integration with Virgin America, which have caused disruptions and elevated costs.
2. The consumer discretionary sector comprises automobiles and components, consumer durables and apparel, consumer services, media and retailing in the SOI. The industrials sector comprises capital goods, commercial and professional services and transportation in the SOI. The IT sector comprises semiconductors and semiconductor equipment, software and services and technology hardware equipment in the SOI.
3. Not held at period-end.
See www.franklintempletondatasources.com for additional data provider information.
| franklintempleton.com | Semiannual Report | 11 |
FRANKLIN GROWTH FUND
Thank you for your participation in Franklin Growth Fund. We look forward to serving your future investment needs.
 |
| |
| Serena Perin Vinton, CFA | ||
| John Anderson | ||
| Robert Rendler, CFA | ||
| Portfolio Management Team | ||

The foregoing information reflects our analysis, opinions and portfolio holdings as of March 31, 2018, the end of the reporting period. The way we implement our main investment strategies and the resulting portfolio holdings may change depending on factors such as market and economic conditions. These opinions may not be relied upon as investment advice or an offer for a particular security. The information is not a complete analysis of every aspect of any market, country, industry, security or the Fund. Statements of fact are from sources considered reliable, but the investment manager makes no representation or warranty as to their completeness or accuracy. Although historical performance is no guarantee of future results, these insights may help you understand our investment management philosophy.
CFA® is a trademark owned by CFA Institute.
| 12 | Semiannual Report | franklintempleton.com |
FRANKLIN GROWTH FUND
Performance Summary as of March 31, 2018
The performance table does not reflect any taxes that a shareholder would pay on Fund dividends, capital gain distributions, if any, or any realized gains on the sale of Fund shares. Total return reflects reinvestment of the Fund’s dividends and capital gain distributions, if any, and any unrealized gains or losses. Your dividend income will vary depending on dividends or interest paid by securities in the Fund’s portfolio, adjusted for operating expenses of each class. Capital gain distributions are net profits realized from the sale of portfolio securities.
Performance as of 3/31/181
Cumulative total return excludes sales charges. Average annual total return includes maximum sales charges. Sales charges will vary depending on the size of the investment and the class of share purchased. The maximum is 5.75% and the minimum is 0%. Class A: 5.75% maximum initial sales charge; Advisor Class: no sales charges. For other share classes, visit franklintempleton.com.
| Share Class | Cumulative Total Return2 | Average Annual Total Return3 | ||
A | ||||
6-Month | +8.04% | +1.83% | ||
1-Year | +19.39% | +12.52% | ||
5-Year | +96.59% | +13.13% | ||
10-Year | +174.57% | +9.98% | ||
Advisor | ||||
6-Month | +8.17% | +8.17% | ||
1-Year | +19.70% | +19.70% | ||
5-Year | +99.05% | +14.76% | ||
10-Year | +181.61% | +10.91% | ||
Performance data represent past performance, which does not guarantee future results. Investment return and principal value will fluctuate, and you may have a gain or loss when you sell your shares. Current performance may differ from figures shown. For most recent month-end performance, go to franklintempleton.com or call (800) 342-5236.
See page 14 for Performance Summary footnotes.
| franklintempleton.com | Semiannual Report | 13 |
FRANKLIN GROWTH FUND
PERFORMANCE SUMMARY
Distributions (10/1/17–3/31/18)
| Share Class | Net Investment Income | Long-Term Capital Gain | Total | |||||||||
A | $0.3618 | $2.2538 | $2.6156 | |||||||||
C | N/A | $2.2538 | $2.2538 | |||||||||
R | $0.1304 | $2.2538 | $2.3842 | |||||||||
R6 | $0.7359 | $2.2538 | $2.9897 | |||||||||
Advisor | $0.5853 | $2.2538 | $2.8391 | |||||||||
Total Annual Operating Expenses4
| Share Class | With Waiver | Without Waiver | ||||||
A | 0.87% | 0.88% | ||||||
Advisor | 0.62% | 0.63% | ||||||
Each class of shares is available to certain eligible investors and has different annual fees and expenses, as described in the prospectus.
All investments involve risks, including possible loss of principal. Historically, the Fund has focused on larger companies. The Fund may also invest in small, relatively new and/or unseasoned companies, which involves additional risks, as the price of these securities can be volatile, particularly over the short term. The Fund may focus on particular sectors of the market from time to time, which can carry greater risks of adverse developments in such sectors. In addition, the Fund may invest up to 40% of its net assets in stocks of foreign companies, which involve special risks, including currency fluctuations and economic as well as political uncertainty. The Fund is actively managed but there is no guarantee that the manager’s investment decisions will produce the desired results. The Fund’s prospectus also includes a description of the main investment risks.
1. The Fund has a fee waiver associated with any investment it makes in a Franklin Templeton money fund and/or other Franklin Templeton fund, contractually guaranteed through 1/31/19. Fund investment results reflect the fee waiver; without this waiver, the results would have been lower.
2. Cumulative total return represents the change in value of an investment over the periods indicated.
3. Average annual total return represents the average annual change in value of an investment over the periods indicated. Return for less than one year, if any, has not been annualized.
4. Figures are as stated in the Fund’s current prospectus and may differ from the expense ratios disclosed in the Your Fund’s Expenses and Financial Highlights sections in this report. In periods of market volatility, assets may decline significantly, causing total annual Fund operating expenses to become higher than the figures shown.
| 14 | Semiannual Report | franklintempleton.com |
FRANKLIN GROWTH FUND
Your Fund’s Expenses
As a Fund shareholder, you can incur two types of costs: (1) transaction costs, including sales charges (loads) on Fund purchases and redemptions; and (2) ongoing Fund costs, including management fees, distribution and service (12b-1) fees, and other Fund expenses. All mutual funds have ongoing costs, sometimes referred to as operating expenses. The table below shows ongoing costs of investing in the Fund and can help you understand these costs and compare them with those of other mutual funds. The table assumes a $1,000 investment held for the six months indicated.
Actual Fund Expenses
The table below provides information about actual account values and actual expenses in the columns under the heading “Actual.” In these columns the Fund’s actual return, which includes the effect of Fund expenses, is used to calculate the “Ending Account Value” for each class of shares. You can estimate the expenses you paid during the period by following these steps (of course, your account value and expenses will differ from those in this illustration): Divide your account value by $1,000 (if your account had an $8,600 value, then $8,600 ÷ $1,000 = 8.6). Then multiply the result by the number in the row for your class of shares under the headings “Actual” and “Expenses Paid During Period” (if Actual Expenses Paid During Period were $7.50, then 8.6 x $7.50 = $64.50). In this illustration, the actual expenses paid this period are $64.50.
Hypothetical Example for Comparison with Other Funds
Under the heading “Hypothetical” in the table, information is provided about hypothetical account values and hypothetical expenses based on the Fund’s actual expense ratio and an assumed rate of return of 5% per year before expenses, which is not the Fund’s actual return. This information may not be used to estimate the actual ending account balance or expenses you paid for the period, but it can help you compare ongoing costs of investing in the Fund with those of other funds. To do so, compare this 5% hypothetical example for the class of shares you hold with the 5% hypothetical examples that appear in the shareholder reports of other funds.
Please note that expenses shown in the table are meant to highlight ongoing costs and do not reflect any transactional costs. Therefore, information under the heading “Hypothetical” is useful in comparing ongoing costs only, and will not help you compare total costs of owning different funds. In addition, if transactional costs were included, your total costs would have been higher.
| Actual (actual return after expenses) | Hypothetical (5% annual return before expenses) | |||||||||||||||||
| Share Class | Beginning Account Value 10/1/17 | Ending Account Value 3/31/18 | Expenses Paid During Period 10/1/17–3/31/181,2 | Ending Account Value 3/31/18 | Expenses Paid During Period 10/1/17–3/31/181,2 | Net Annualized Expense Ratio2 | ||||||||||||
| A | $1,000 | $1,080.40 | $4.36 | $1,020.74 | $4.23 | 0.84% | ||||||||||||
| C | $1,000 | $1,076.40 | $8.23 | $1,017.00 | $8.00 | 1.59% | ||||||||||||
| R | $1,000 | $1,079.10 | $5.65 | $1,019.50 | $5.49 | 1.09% | ||||||||||||
| R6 | $1,000 | $1,082.60 | $2.44 | $1,022.59 | $2.37 | 0.47% | ||||||||||||
| Advisor | $1,000 | $1,081.70 | $3.06 | $1,021.99 | $2.97 | 0.59% | ||||||||||||
1. Expenses are equal to the annualized expense ratio for the six-month period as indicated above—in the far right column—multiplied by the simple average account value over the period indicated, and then multiplied by 182/365 to reflect the one-half year period.
2. Reflects expenses after fee waivers and expense reimbursements. Does not include acquired fund fees and expenses.
| franklintempleton.com | Semiannual Report | 15 |
This semiannual report for Franklin Income Fund covers the period ended March 31, 2018.
Your Fund’s Goal and Main Investments
The Fund seeks to maximize income, while maintaining prospects for capital appreciation by investing, under normal market conditions, in a diversified portfolio of debt and equity securities.
Performance Overview
The Fund’s Class A shares had a cumulative total return of -1.73% for the six months under review. In comparison, the Fund’s equity benchmark, the Standard & Poor’s 500 Index (S&P 500), which is a broad measure of US stock performance, returned +5.84%.1 The Fund’s fixed income benchmark, the Bloomberg Barclays US Aggregate Bond Index, which tracks the US investment-grade, taxable bond market, had a -1.08% total return.1 The Fund’s peers, as measured by the Lipper Mixed-Asset Target Allocation Moderate Funds Classification Average, which consists of funds chosen by Lipper that, by practice, maintain a mix of 40% to 60% equity securities, with the remainder in bonds and cash, had a -1.73% total return.2 You can find the Fund’s long-term performance data in the Performance Summary beginning on page 20.
Performance data represent past performance, which does not guarantee future results. Investment return will fluctuate. Current performance may differ from figures shown. For most recent month-end performance, go to franklintempleton.com or call (800) 342-5236.
Investment Strategy
By generally performing independent analysis of debt, convertible and equity securities, we search for undervalued or out-of-favor securities we believe offer opportunities for income today and significant growth tomorrow. We consider such factors as a company’s experience and managerial strength; its cash flow potential and profitability; its competitive positioning and advantages; its responsiveness to changes in interest rates and business conditions; debt maturity schedules and borrowing requirements; a company’s changing financial condition and market recognition of the change; and a
Dividend Distributions*
10/1/17–3/31/18
| Dividend per Share (cents) |
| ||||||||||||||||||||||
Month | | Class A | | | Class M** | | Class C | Class R | | Class R6 | | | Advisor Class | | ||||||||||
October | 1.00 | — | 0.90 | 0.93 | 1.04 | 1.03 | ||||||||||||||||||
November | 1.00 | — | 0.90 | 0.93 | 1.04 | 1.03 | ||||||||||||||||||
December | 1.00 | — | 0.89 | 0.93 | 1.04 | 1.03 | ||||||||||||||||||
January | 1.00 | — | 0.89 | 0.93 | 1.04 | 1.03 | ||||||||||||||||||
February | 1.00 | 1.03 | 0.89 | 0.93 | 1.04 | 1.03 | ||||||||||||||||||
March | 1.00 | 1.03 | 0.89 | 0.93 | 1.04 | 1.03 | ||||||||||||||||||
Total | 6.00 | 2.06 | 5.36 | 5.58 | 6.24 | 6.18 | ||||||||||||||||||
*The distribution amount is the sum of all estimated tax-basis net investment income distributions for the period shown. A portion or all of the distribution may be reclassified as return of capital or short-term or long-term capital gains once final tax designations are known. All Fund distributions will vary depending upon current market conditions, and past distributions are not indicative of future trends.
**Effective 1/25/18, the Fund began offering Class M shares. See the prospectus for details.
security’s relative value based on such factors as anticipated cash flow, interest or dividend coverage, asset coverage and earnings.
Manager’s Discussion
During the period under review, our equity weighting increased from 54.9% to 56.3%, and our fixed income weighting increased from 39.0% to 41.2%. The Fund’s cash position decreased from 6.1% to 2.5% of total net assets.
Although broad financial market volatility remained muted for the first three months of the period under review, particularly in the equity markets, 2018’s first quarter experienced a return of volatility, which has pressured prices across a range of asset classes. The return of volatility to the equity markets in 2018 has, in some cases, just returned many measures of market volatility back to longer term averages and we believe that these conditions are far more normal than the prior period of extraordinarily depressed volatility.
Our focus remains on trying to identify corporate fundamentals that will support our goal to generate attractive income and the potential for capital appreciation over time. Although the increase in volatility in the short term draws many investors’ attention, we believe the markets offer opportunity for those
1. Source: Morningstar.
2. Source: Lipper, a Thomson Reuters Company. For the six month period ended 3/31/18, this category consisted of 563 funds. Lipper calculations do not include sales charges or expense subsidization by a fund’s manager. The Fund’s performance relative to the average may have differed if these and other factors had been considered.
The indexes are unmanaged and include reinvestment of any income or distributions. They do not reflect any fees, expenses or sales charges. One cannot invest directly in an index, and an index is not representative of the Fund’s portfolio.
The dollar value, number of shares or principal amount, and names of all portfolio holdings are listed in the Fund’s Statement of Investments (SOI). The SOI begins on page 59.
| 16 | Semiannual Report | franklintempleton.com |
FRANKLIN INCOME FUND
approaching their investment objective with a longer term, three- to- five-year investment horizon.
In general, it is our view that while high yield bonds remain attractive for our income-oriented approach, greater selectivity in issuer exposure remains critical given the backdrop of continued increases in interest rates and the reality that we are likely in the latter stages of the current economic expansion.
Within equities, the Fund saw the largest gains in holdings in the information technology (IT), energy and real estate sectors. Shares of IT companies continued to perform well with strong corporate spending on technology, a shift to cloud-based computing as well as increasing demand for mobile phones. Software firm Microsoft has been a strong performer for several years as demand for its suite of office and cloud-based products had led to improving results. The company is a beneficiary of healthy levels of corporate IT spending. Shares of semiconductor manufacturer Intel have been strong with personal computer demand rising and the company seeing traction from new initiatives that will broaden its business. Consumer electronics company Apple reported robust earnings and cash flow generation from a strong product cycle, with many customers pleased with the new iPhone features. Also, the company’s high-margin services business continued to grow.
Shares of our two larger energy holdings, Royal Dutch Shell and BP, were notable Fund contributors. Both benefited from rising energy prices and a focus on reducing costs to drive cash flow higher. The combination of declining capital spending and the rising cash flow has alleviated concerns that dividend payments would need to be reduced. Importantly, large integrated oil companies appear to be focused on cash flow and greater capital discipline going forward.
In other sectors, Target’s shares performed well as in-store traffic and sales at the retailer improved through the year. Financial stocks, and large banks, in particular, have been helped by a growing economy, increasing returns of excess capital to shareholders, less regulation and rising interest rates, which have helped net interest margins. Shares of large bank JPMorgan increased as an improving economy, higher net interest margins, additional loan and capital markets activity and a focus on expense reductions has led to higher earnings, while strong performances during government-mandated tests have allowed for greater buybacks and dividends. Shares of Rio Tinto, a mining and mineral processing firm, increased as commodity prices rose with stronger demand from an improving global economy. Rio has also worked to be the low cost producer.
Portfolio Composition
3/31/18
| | % of Total Net Assets | | ||
Equity* | 56.3% | |||
Financials | 8.2% | |||
Health Care | 8.2% | |||
Energy | 7.3% | |||
Utilities | 6.8% | |||
Information Technology | 5.3% | |||
Consumer Discretionary | 5.3% | |||
Materials | 4.6% | |||
Industrials | 4.6% | |||
Consumer Staples | 3.9% | |||
Telecommunication Services | 1.3% | |||
Real Estate | 0.8% | |||
Fixed Income** | 41.2% | |||
Health Care | 11.4% | |||
Energy | 8.3% | |||
Consumer Discretionary | 6.7% | |||
Financials | 3.9% | |||
Utilities | 2.9% | |||
Telecommunication Services | 2.7% | |||
Materials | 1.6% | |||
Industrials | 1.2% | |||
Information Technology | 1.1% | |||
Consumer Staples | 0.8% | |||
Real Estate | 0.6% | |||
Short-Term Investments & Other Net Assets | 2.5% |
*Includes convertible bonds.
**Includes senior floating rate interests and index-linked notes.
In equities, detracting from performance were the industrial and utilities sectors as two specific holdings more than offset positive contributions from other sector holdings. In industrials, holdings of General Electric (GE) hampered Fund results as the company has struggled with lower cash flow generation than expected, ultimately resulting in a reduction in its dividend. Its oil and gas and power segments remain challenged though we believe the company is taking steps to improve profitability, reduce costs, implement more accountability and sell non-core assets. Utilities sector performance was weighed down by
| franklintempleton.com | Semiannual Report | 17 |
FRANKLIN INCOME FUND
shares of PG&E,3 which were heavily impacted by the devastating fires that occurred in Northern California last year, which could be a potential liability. Dominion Energy has been negatively impacted by tax reform, regulatory changes effecting its master limited partnership business and greater uncertainty following a recent acquisition.
Top Five Equity Holdings*
3/31/18
Company Sector/Industry | | % of Total Net Assets | | |
Wells Fargo & Co. Financials | 2.7% | |||
General Electric Co. Industrials | 1.9% | |||
Royal Dutch Shell PLC Energy | 1.8% | |||
Dominion Energy Inc. Utilities | 1.7% | |||
The Southern Co. Utilities | 1.7% |
*Includes convertible bonds.
Health care stocks also detracted from performance. Pharmaceutical giant Sanofi saw weaker stock performance as competing products received positive indications and their own results were weaker than expected. Generic drug maker Teva Pharmaceutical Industries3 has struggled with the loss of key patents, declining drug prices and a heavy debt burden as a result of buying Allergan’s3 generics segment. Allergan has similarly struggled with weaker volumes and prices than anticipated.
In other sectors, we believe Weatherford International, an oilfield services company, is in the process of turning its business around though it has struggled with less drilling activity, particularly off-shore, over the past year. New management has taken significant steps to improve profitability across its segments with new revenue opportunities and a sharp reduction in costs. Baker Hughes, also in oilfield services, similarly struggled with less off-shore and liquid natural gas production levels and earnings have been volatile and disappointing since combining with GE’s oil and gas assets.
In fixed income, we continue to be mindful of the impact of rising rates and look to focus on the shorter end of the curve, focusing on positions more sensitive to credit issues rather than interest rates. We have also taken larger positions in names in
Top Five Fixed Income Holdings*
3/31/18
Company Sector/Industry | | % of Total Net Assets | | |
CHS/Community Health Systems Inc. Health Care | 3.7% | |||
Chesapeake Energy Corp. Energy | 2.8% | |||
Tenet Healthcare Corp. Health Care | 2.7% | |||
JPMorgan Chase & Co. Financials | 1.5% | |||
Weatherford International Ltd. Energy | 1.5% |
*Includes senior floating rate interests and index-linked notes.
which we have conviction, especially self-help situations where we believe management has a sound plan. We continue to deploy the strategy of moving up the capital structure when possible as companies refinance their debt. Within fixed income, the Fund benefited most from holdings in the electric utility and technology industries and in the energy sector.4 In electric utility, Dynegy bonds have performed well following the announcement that Vistra will be acquiring the business and that leverage ratios are expected to decline substantially. Holdings of InterGen have performed well as leverage has declined significantly, the business continues to show stable results and indicated asset sales are likely to lower leverage levels further.
Energy holdings have been helped by improving supply/ demand dynamics, which have led to higher oil prices. Companies have worked to lower their breakeven costs and the higher oil prices are leading to improved cash flow results. Independent oil producer Bill Barrett has been helped by an equity raise and an acquisition that positions the company to benefit from rising production and higher oil prices. Chesapeake Energy has materially improved its financial condition through a combination of asset sales, increased balance sheet flexibility, production growth and cost reductions. With the improved positioning, the company has guided to a significant increase in cash flow this year.
In other sectors, positions in Tenet Healthcare have risen as the company has made progress in improving its core operations,
3. Not held at period-end.
4. Electric utility holdings are in utilities in the fixed income section of the SOI. Technology holdings are in consumer discretionary, information technology and real estate in the fixed income section of the SOI.
| 18 | Semiannual Report | franklintempleton.com |
FRANKLIN INCOME FUND
focusing on care quality and streamlining operations. As a result, key cash flow and same-hospital volume metrics have been better than expected. Fixed income holdings of banks, including the Fund’s position in JPMorgan, have been helped by the same factors mentioned above for financials stocks.
Fund performance was hindered by fixed income holdings in the consumer non-cyclical and communications industries.5 In consumer non-cyclical, operating results at CHS/Community Health Systems have been impacted by weaker volume trends as well as unfortunate hurricane activity in Texas and in Florida where they operate numerous facilities. Combined with some near-term bond maturities, bond prices have been pressured. We believe the company continues to be successful in selling non-core assets, while they work to enhance patient services and improving core operations and base-line profitability. Pharmaceutical company Mallinckrodt was another notable detractor in consumer non-cyclical, and communications sector detractors included DISH and Sprint.
Thank you for your continued participation in Franklin Income Fund. We look forward to serving your future investment needs.
 |
| |
| Edward Perks, CFA | ||
| Matthew Quinlan | ||
| Richard S. Hsu, CFA | ||
| Todd Brighton, CFA | ||
| Portfolio Management Team | ||

The foregoing information reflects our analysis, opinions and portfolio holdings as of March 31, 2018, the end of the reporting period. The way we implement our main investment strategies and the resulting portfolio holdings may change depending on factors such as market and economic conditions. These opinions may not be relied upon as investment advice or an offer for a particular security. The information is not a complete analysis of every aspect of any market, country, industry, security or the Fund. Statements of fact are from sources considered reliable, but the investment manager makes no representation or warranty as to their completeness or accuracy. Although historical performance is no guarantee of future results, these insights may help you understand our investment management philosophy.
5. Consumer non-cyclical holdings are in consumer discretionary, consumer staples and health care in the fixed income section of the SOI. Communications holdings are in consumer discretionary and telecommunication services in the fixed income section of the SOI.
See www.franklintempletondatasources.com for additional data provider information.
| franklintempleton.com | Semiannual Report | 19 |
FRANKLIN INCOME FUND
Performance Summary as of March 31, 2018
The performance tables do not reflect any taxes that a shareholder would pay on Fund dividends, capital gain distributions, if any, or any realized gains on the sale of Fund shares. Total return reflects reinvestment of the Fund’s dividends and capital gain distributions, if any, and any unrealized gains or losses. Your dividend income will vary depending on dividends or interest paid by securities in the Fund’s portfolio, adjusted for operating expenses of each class. Capital gain distributions are net profits realized from the sale of portfolio securities.
Performance as of 3/31/181
Cumulative total return excludes sales charges. Average annual total return includes maximum sales charges. Sales charges will vary depending on the size of the investment and the class of share purchased. The maximum is 4.25% and the minimum is 0%. Class A: 4.25% maximum initial sales charge; Advisor Class: no sales charges. For other share classes, visit franklintempleton.com.
| Share Class | Cumulative Total Return2 | Average Annual Total Return3 | ||||||
A | ||||||||
6-Month | -1.73% | -6.06% | ||||||
1-Year | +2.09% | -2.06% | ||||||
5-Year | +27.59% | +4.12% | ||||||
10-Year | +76.60% | +5.38% | ||||||
Advisor | ||||||||
6-Month | -1.67% | -1.67% | ||||||
1-Year | +2.24% | +2.24% | ||||||
5-Year | +28.75% | +5.18% | ||||||
10-Year | +79.86% | +6.05% | ||||||
| Distribution | 30-Day Standardized Yield5 | |||||||||||
| Share Class | Rate4 | (with waiver) | (without waiver) | |||||||||
A | 5.02% | 3.72% | 3.72% | |||||||||
Advisor | 5.44% | 4.04% | 4.04% | |||||||||
Performance data represent past performance, which does not guarantee future results. Investment return and principal value will fluctuate, and you may have a gain or loss when you sell your shares. Current performance may differ from figures shown. For most recent month-end performance, go to franklintempleton.com or call (800) 342-5236.
See page 22 for Performance Summary footnotes.
| 20 | Semiannual Report | franklintempleton.com |
FRANKLIN INCOME FUND
PERFORMANCE SUMMARY
Net Asset Value
| Share Class (Symbol) | 3/31/18 | 1/25/18 | 9/30/17 | Change | ||||
| A (FKINX) | $2.29 | N/A | $2.39 | -$0.10 | ||||
| M(FIFMX) | $2.29 | $2.43 | N/A | -$0.14 | ||||
| C (FCISX) | $2.32 | N/A | $2.42 | -$0.10 | ||||
| R (FISRX) | $2.24 | N/A | $2.35 | -$0.11 | ||||
| R6 (FNCFX) | $2.27 | N/A | $2.37 | -$0.10 | ||||
| Advisor (FRIAX) | $2.27 | N/A | $2.37 | -$0.10 | ||||
Distributions (10/1/17–3/31/18)
| Share Class | Net Investment Income | |||
| A | $0.0600 | |||
| M (1/25/18–3/31/18) | $0.0206 | |||
| C | $0.0536 | |||
| R | $0.0558 | |||
| R6 | $0.0624 | |||
| Advisor | $0.0618 | |||
Total Annual Operating Expenses6
| Share Class | With Waiver | Without Waiver | ||||||
| A | 0.62% | 0.63% | ||||||
| Advisor | 0.47% | 0.48% | ||||||
| franklintempleton.com | Semiannual Report | 21 |
FRANKLIN INCOME FUND
PERFORMANCE SUMMARY
Each class of shares is available to certain investors and has different annual fees and expenses, as described in the prospectus.
All investments involve risks, including possible loss of principal. The Fund’s share price and yield will be affected by interest rate movements. Bond prices generally move in the opposite direction of interest rates. Thus, as prices of bonds in the Fund adjust to a rise in interest rates, the Fund’s share price may decline. Changes in the financial strength of a bond issuer or in a bond’s credit rating may affect its value. The Fund’s portfolio includes a substantial portion of higher yielding, lower rated corporate bonds because of the relatively higher yields they offer. Floating-rate loans are lower rated, higher yielding instruments, which are subject to increased risk of default and can potentially result in loss of principal. These securities carry a greater degree of credit risk relative to investment-grade securities. Stock prices fluctuate, sometimes rapidly and dramatically, due to factors affecting individual companies, particular industries or sectors, or general market conditions. The Fund is actively managed but there is no guarantee that the manager’s investment decisions will produce the desired results. The Fund’s prospectus also includes a description of the main investment risks.
1. The Fund has a fee waiver associated with any investment it makes in a Franklin Templeton money fund and/or other Franklin Templeton fund, contractually guaranteed through 1/31/19. Fund investment results reflect the fee waiver; without this waiver, the results would have been lower.
2. Cumulative total return represents the change in value of an investment over the periods indicated.
3. Average annual total return represents the average annual change in value of an investment over the periods indicated. Return for less than one year, if any, has not been annualized.
4. Distribution rate is based on an annualization of the respective class’s March dividend and the maximum offering price (NAV for Advisor Class) per share on 3/31/18.
5. The Fund’s 30-day standardized yield is calculated over a trailing 30-day period using the yield to maturity on bonds and/or the dividends accrued on stocks. It may not equal the Fund’s actual income distribution rate, which reflects the Fund’s past dividends paid to shareholders.
6. Figures are as stated in the Fund’s current prospectus and may differ from the expense ratios disclosed in the Your Fund’s Expenses and Financial Highlights sections in this report. In periods of market volatility, assets may decline significantly, causing total annual Fund operating expenses to become higher than the figures shown.
| 22 | Semiannual Report | franklintempleton.com |
FRANKLIN INCOME FUND
Your Fund’s Expenses
As a Fund shareholder, you can incur two types of costs: (1) transaction costs, including sales charges (loads) on Fund purchases and redemptions; and (2) ongoing Fund costs, including management fees, distribution and service (12b-1) fees, and other Fund expenses. All mutual funds have ongoing costs, sometimes referred to as operating expenses. The table below shows ongoing costs of investing in the Fund and can help you understand these costs and compare them with those of other mutual funds. The table assumes a $1,000 investment held for the six months indicated.
Actual Fund Expenses
The table below provides information about actual account values and actual expenses in the columns under the heading “Actual.” In these columns the Fund’s actual return, which includes the effect of Fund expenses, is used to calculate the “Ending Account Value” for each class of shares. You can estimate the expenses you paid during the period by following these steps (of course, your account value and expenses will differ from those in this illustration): Divide your account value by $1,000 (if your account had an $8,600 value, then $8,600 ÷ $1,000 = 8.6). Then multiply the result by the number in the row for your class of shares under the headings “Actual” and “Expenses Paid During Period” (if Actual Expenses Paid During Period were $7.50, then 8.6 x $7.50 = $64.50). In this illustration, the actual expenses paid this period are $64.50.
Hypothetical Example for Comparison with Other Funds
Under the heading “Hypothetical” in the table, information is provided about hypothetical account values and hypothetical expenses based on the Fund’s actual expense ratio and an assumed rate of return of 5% per year before expenses, which is not the Fund’s actual return. This information may not be used to estimate the actual ending account balance or expenses you paid for the period, but it can help you compare ongoing costs of investing in the Fund with those of other funds. To do so, compare this 5% hypothetical example for the class of shares you hold with the 5% hypothetical examples that appear in the shareholder reports of other funds.
Please note that expenses shown in the table are meant to highlight ongoing costs and do not reflect any transactional costs. Therefore, information under the heading “Hypothetical” is useful in comparing ongoing costs only, and will not help you compare total costs of owning different funds. In addition, if transactional costs were included, your total costs would have been higher.
| Actual (actual return after expenses) | Hypothetical (5% annual return before expenses) | |||||||||||||||||
| Share Class | Beginning Account Value1 | Ending Account Value 3/31/18 | Expenses Paid During Period2,3,4 | Ending Account | Expenses Paid During Period3,4 | Net Annualized Expense Ratio4 | ||||||||||||
A | $1,000 | $982.70 | $2.97 | $1,021.94 | $3.02 | 0.60% | ||||||||||||
M | $1,000 | $946.50 | $0.78 | $1,022.69 | $2.27 | 0.45% | ||||||||||||
C | $1,000 | $976.10 | $5.42 | $1,019.45 | $5.54 | 1.10% | ||||||||||||
R | $1,000 | $976.30 | $4.68 | $1,020.19 | $4.78 | 0.95% | ||||||||||||
R6 | $1,000 | $983.50 | $1.98 | $1,022.94 | $2.02 | 0.40% | ||||||||||||
Advisor | $1,000 | $983.30 | $2.23 | $1,022.69 | $2.27 | 0.45% | ||||||||||||
1. For Classes A, C, R, R6 and Advisor, 10/1/17 for Actual and Hypothetical. For Class M, 1/25/18 for Actual and 10/1/17 for Hypothetical.
2. For Classes A, C, R, R6 and Advisor, 10/1/17–3/31/18. For Class M, 1/25/18–3/31/18.
3. Expenses are equal to the annualized expense ratio for the six-month period as indicated above—in the far right column—multiplied by the simple average account value over the period indicated, and then multiplied by 182/365 to reflect the one-half year period. The multiplier is 65/365 for Actual Class M expenses to reflect the number of days since inception.
4. Reflects expenses after fee waivers and expense reimbursements. Does not include acquired fund fees and expenses.
| franklintempleton.com | Semiannual Report | 23 |
Franklin U.S. Government Securities Fund
This semiannual report for Franklin U.S. Government Securities Fund covers the period ended March 31, 2018.
Your Fund’s Goal and Main Investments
The Fund seeks income by investing at least 80% of its net assets in US government securities. The Fund presently invests substantially all of its assets in Government National Mortgage Association obligations (Ginnie Maes).
Since 1983, the Fund has invested substantially in Ginnie Mae securities, which carry a guarantee backed by the full faith and credit of the US government as to the timely payment of interest and principal.1 Issued by the Government National Mortgage Association (GNMA), Ginnie Maes have been among the highest yielding US government obligations available.
Portfolio Composition
Based on Total Net Assets as of 3/31/18
| ||||
GNMA | 96.6% | |||
US Government and Agency Securities | 1.6% | |||
Short-Term Investments & Other Net Assets | 1.8% |
Performance Overview
The Fund’s Class A shares had a -1.48% cumulative total return for the six months under review. In comparison, the Bloomberg Barclays US Government Index: Intermediate Component, the intermediate component of the Bloomberg Barclays US Government Index, had -1.10% total return.2 The Fund’s peers, as measured by the Lipper GNMA Funds Classification Average, which consists of funds chosen by Lipper that invest primarily in GNMAs, had a -1.30% total return for the same period.3 You can find the Fund’s long-term performance data in the Performance Summary beginning on page 26.
Performance data represent past performance, which does not guarantee future results. Investment return and principal value will fluctuate, and you may have a gain or loss when you sell your shares. Current performance may differ from figures
shown. For most recent month-end performance, go to franklintempleton.com or call (800) 342-5236.
Investment Strategy
We currently invest the Fund’s assets substantially in GNMA obligations. We analyze securities using proprietary models to help us identify attractive investment opportunities.
Dividend Distributions*
10/1/17–3/31/18
| Dividend per Share (cents) | ||||||||||||||||||||||||
| Month | Class A | Class M** | Class C | Class R | Class R6 | Advisor Class | ||||||||||||||||||
October | 1.40 | — | 1.13 | 1.21 | 1.55 | 1.46 | ||||||||||||||||||
November | 1.52 | — | 1.27 | 1.34 | 1.66 | 1.60 | ||||||||||||||||||
December | 1.51 | — | 1.25 | 1.33 | 1.65 | 1.59 | ||||||||||||||||||
January | 1.52 | 1.66 | 1.26 | 1.34 | 1.66 | 1.60 | ||||||||||||||||||
February | 1.54 | 1.61 | 1.31 | 1.38 | 1.67 | 1.61 | ||||||||||||||||||
March | 1.51 | 1.59 | 1.25 | 1.34 | 1.65 | 1.58 | ||||||||||||||||||
Total | 9.00 | 4.86 | 7.47 | 7.94 | 9.84 | 9.44 | ||||||||||||||||||
*The distribution amount is the sum of all estimated tax-basis net investment income distributions for the period shown. A portion or all of the distribution may be reclassified as return of capital or short-term or long-term capital gains once final tax designations are known. All Fund distributions will vary depending upon current market conditions, and past distributions are not indicative of future trends.
**Effective 1/25/18, the Fund began offering Class M shares. See the prospectus for details.
Manager’s Discussion
US economic indicators were generally encouraging during the reporting period. Steady growth in the services sector created new jobs and boosted employment levels. Retail sales grew for most of the period. Low energy prices pulled inflation lower. In this environment, home sales which had slowed in the middle of the period due to low supply levels and rising prices, rose to their strongest pace in almost 11 years toward period-end. From a perspective of excess returns over Treasuries of similar duration, emerging markets bonds performed well. Other major fixed income sectors that delivered notable positive excess returns, as measured by Bloomberg Barclays indexes, included high yield and investment grade corporate credit and commercial mortgage-backed securities (CMBS). In contrast,
1. Securities owned by the Fund, but not shares of the Fund, are guaranteed by the US government, its agencies or instrumentalities as to timely payment of principal and interest. The Fund’s yield and share price are not guaranteed and will vary with market conditions.
2. Source: Morningstar.
3. Source: Lipper, a Thomson Reuters Company. For the six month period ended 3/31/18, there were 59 funds in this category. Lipper calculations do not include sales charges or expense subsidization by a fund’s manager. The Fund’s performance relative to the average may have differed if these or other factors had been considered.
The indexes are unmanaged and include reinvestment of any income or distributions. They do not reflect any fees, expenses or sales charges. One cannot invest directly in an index, and an index is not representative of the Fund’s portfolio.
See www.franklintempletondatasources.com for additional data provider information.
The dollar value, number of shares or principal amount, and names of all portfolio holdings are listed in the Fund’s Statement of Investments (SOI).
The SOI begins on page 80.
| 24 | Semiannual Report | franklintempleton.com |
FRANKLIN U.S. GOVERNMENT SECURITIES FUND
higher quality agency mortgage backed securities (MBS) underperformed Treasuries. Ginnie Mae MBS (GNMA) produced negative excess returns and underperformed Treasuries.
MBS conditions remain supportive and the prepayment outlook fairly benign. With this backdrop, despite tight overall valuations, we are constructive on MBS fundamentals. The continued wind down of the Federal Reserve’s System Open Market Account (SOMA) stands to be a key influence on the market as we move into the later part of the year. Despite relatively constant net supply, the Fed’s balance sheet runoff and an investor base that is mainly even-weight could pressure the sector.
Within the agency mortgage pass-through sector, GNMAs underperformed their Freddie Mac and Fannie Mae counterparts. On an excess return basis, GNMA II 5.0% and GNMA I and II 5.5% coupons were the best performers, while 3.5% coupons generally lagged.
The Fund maintains a conservative, disciplined investment strategy and invests primarily in GNMA mortgage pass-throughs, which remain the only MBS that are backed by the full faith and credit of the US government—the same guarantee applicable to US Treasuries.1 We believe our collateral-intensive research approach can allow us to uncover dislocations across the GNMA markets and associated misvaluation of prepayment risk. We continue to focus on specified pools where we believe our experience and continual investment in new technologies help us uncover these discrepancies.
During the period, we were more weighted toward GNMA IIs (pools of mortgages from multiple issuers) than GNMA Is (pools of mortgages from single issuers). Over the period, we added to GNMA II 3.0% and 4.0% coupons, while reducing exposure to 4.5% and 5.0% coupons. Our heaviest allocation was in 3.5%, 4.0% and 4.5% coupons at period-end. The Fund’s position in 3.0% and 4.0% coupon GNMA securities benefited performance, while our allocation to 5.0% coupon GNMAs detracted from performance.
Thank you for your continued participation in Franklin U.S. Government Securities Fund. We welcome your comments and questions and look forward to serving your investment needs in the years ahead.
|
| |
| Roger A. Bayston, CFA | ||
|
Paul Varunok | |
| Portfolio Management Team | ||


The foregoing information reflects our analysis, opinions and portfolio holdings as of March 31, 2018, the end of the reporting period. The way we implement our main investment strategies and the resulting portfolio holdings may change depending on factors such as market and economic conditions. These opinions may not be relied upon as investment advice or an offer for a particular security. The information is not a complete analysis of every aspect of any market, country, industry, security or the Fund. Statements of fact are from sources considered reliable, but the investment manager makes no representation or warranty as to their completeness or accuracy. Although historical performance is no guarantee of future results, these insights may help you understand our investment management philosophy.
| franklintempleton.com | Semiannual Report | 25 |
FRANKLIN U.S. GOVERNMENT SECURITIES FUND
Performance Summary as of March 31, 2018
The performance tables do not reflect any taxes that a shareholder would pay on Fund dividends, capital gain distributions, if any, or any realized gains on the sale of Fund shares. Total return reflects reinvestment of the Fund’s dividends and capital gain distributions, if any, and any unrealized gains or losses. Your dividend income will vary depending on dividends or interest paid by securities in the Fund’s portfolio, adjusted for operating expenses of each class. Capital gain distributions are net profits realized from the sale of portfolio securities.
Performance as of 3/31/181
Cumulative total return excludes sales charges. Average annual total return includes maximum sales charges. Sales charges will vary depending on the size of the investment and the class of share purchased. The maximum is 4.25% and the minimum is 0%. Class A: 4.25% maximum initial sales charge; Advisor Class: no sales charges. For other share classes, visit franklintempleton.com.
| Share Class | | Cumulative Total Return | 2 | | Average Annual Total Return3 | | ||
A | ||||||||
6-Month | -1.48% | -5.63% | ||||||
1-Year | -0.45% | -4.63% | ||||||
5-Year | +4.08% | -0.07% | ||||||
10-Year | +30.77% | +2.28% | ||||||
Advisor | ||||||||
6-Month | -1.40% | -1.40% | ||||||
1-Year | -0.46% | -0.46% | ||||||
5-Year | +4.84% | +0.95% | ||||||
10-Year | +32.60% | +2.86% | ||||||
| Distribution | 30-Day Standardized Yield5 | |||||||||||||
| Share Class | Rate4 | (with waiver) | (without waiver) | |||||||||||
A | 2.92% | 2.48% | 2.47% | |||||||||||
Advisor | 3.18% | 2.75% | 2.73% | |||||||||||
Performance data represent past performance, which does not guarantee future results. Investment return and principal value will fluctuate, and you may have a gain or loss when you sell your shares. Current performance may differ from figures shown. For most recent month-end performance, go to franklintempleton.com or call (800) 342-5236.
See page 27 for Performance Summary footnotes.
| 26 | Semiannual Report | franklintempleton.com |
FRANKLIN U.S. GOVERNMENT SECURITIES FUND
PERFORMANCE SUMMARY
Distributions (10/1/17–3/31/18)
| Share Class | Net Investment Income | |||
A | $0.0900 | |||
M (1/25/18–3/31/18) | $0.0486 | |||
C | $0.0747 | |||
R | $0.0794 | |||
R6 | $0.0984 | |||
Advisor | $0.0944 | |||
Total Annual Operating Expenses6
| Share Class | With Waiver | Without Waiver | ||||||
A | 0.77% | 0.77% | ||||||
Advisor | 0.62% | 0.62% | ||||||
Each class of shares is available to certain eligible investors and has different annual fees and expenses, as described in the prospectus.
All investments involve risks, including possible loss of principal. The Fund’s share price and yield will be affected by interest rate movements and mortgage prepayments. Bond prices generally move in the opposite direction of interest rates. Thus, as prices of bonds in the Fund adjust to a rise in interest rates, the Fund’s share price may decline. Changes in the financial strength of a bond issuer or in a bond’s credit rating may affect its value. The Fund is actively managed but there is no guarantee that the manager’s investment decisions will produce the desired results. The Fund’s prospectus also includes a description of the main investment risks.
1. The Fund has a fee waiver associated with any investment it makes in a Franklin Templeton money fund and/or other Franklin Templeton fund, contractually guaranteed through 1/31/19. Fund investment results reflect the fee waiver; without this waiver, the results would have been lower.
2. Cumulative total return represents the change in value of an investment over the periods indicated.
3. Average annual total return represents the average annual change in value of an investment over the periods indicated. Return for less than one year, if any, has not been annualized.
4. Distribution rate is based on an annualization of the respective class’s March dividend and the maximum offering price (NAV for Advisor Class) per share on 3/31/18.
5. The Fund’s 30-day standardized yield is calculated over a trailing 30-day period using the yield to maturity on bonds and/or the dividends accrued on stocks. It may not equal the Fund’s actual income distribution rate, which reflects the Fund’s past dividends paid to shareholders.
6. Figures are as stated in the Fund’s current prospectus and may differ from the expense ratios disclosed in the Your Fund’s Expenses and Financial Highlights sections in this report. In periods of market volatility, assets may decline significantly, causing total annual Fund operating expenses to become higher than the figures shown.
| franklintempleton.com | Semiannual Report | 27 |
FRANKLIN U.S. GOVERNMENT SECURITIES FUND
Your Fund’s Expenses
As a Fund shareholder, you can incur two types of costs: (1) transaction costs, including sales charges (loads) on Fund purchases and redemptions; and (2) ongoing Fund costs, including management fees, distribution and service (12b-1) fees, and other Fund expenses. All mutual funds have ongoing costs, sometimes referred to as operating expenses. The table below shows ongoing costs of investing in the Fund and can help you understand these costs and compare them with those of other mutual funds. The table assumes a $1,000 investment held for the six months indicated.
Actual Fund Expenses
The table below provides information about actual account values and actual expenses in the columns under the heading “Actual.” In these columns the Fund’s actual return, which includes the effect of Fund expenses, is used to calculate the “Ending Account Value” for each class of shares. You can estimate the expenses you paid during the period by following these steps (of course, your account value and expenses will differ from those in this illustration): Divide your account value by $1,000 (if your account had an $8,600 value, then $8,600 ÷ $1,000 = 8.6). Then multiply the result by the number in the row for your class of shares under the headings “Actual” and “Expenses Paid During Period” (if Actual Expenses Paid During Period were $7.50, then 8.6 x $7.50 = $64.50). In this illustration, the actual expenses paid this period are $64.50.
Hypothetical Example for Comparison with Other Funds
Under the heading “Hypothetical” in the table, information is provided about hypothetical account values and hypothetical expenses based on the Fund’s actual expense ratio and an assumed rate of return of 5% per year before expenses, which is not the Fund’s actual return. This information may not be used to estimate the actual ending account balance or expenses you paid for the period, but it can help you compare ongoing costs of investing in the Fund with those of other funds. To do so, compare this 5% hypothetical example for the class of shares you hold with the 5% hypothetical examples that appear in the shareholder reports of other funds.
Please note that expenses shown in the table are meant to highlight ongoing costs and do not reflect any transactional costs. Therefore, information under the heading “Hypothetical” is useful in comparing ongoing costs only, and will not help you compare total costs of owning different funds. In addition, if transactional costs were included, your total costs would have been higher.
| Actual (actual return after expenses) | Hypothetical (5% annual return before expenses) | |||||||||||||||||
| Share Class | Beginning Account Value1 | Ending Account Value 3/31/18 | Expenses Paid During Period2,3,4 | Ending Value 3/31/18 | Expenses Paid During Period3,4 | Net Annualized Expense Ratio4 | ||||||||||||
A | $1,000 | $985.20 | $3.86 | $1,021.04 | $3.93 | 0.78% | ||||||||||||
M | $1,000 | $994.80 | $1.12 | $1,021.79 | $3.18 | 0.63% | ||||||||||||
C | $1,000 | $984.30 | $6.33 | $1,018.55 | $6.44 | 1.28% | ||||||||||||
R | $1,000 | $985.10 | $5.54 | $1,019.35 | $5.64 | 1.12% | ||||||||||||
R6 | $1,000 | $986.70 | $2.48 | $1,022.44 | $2.52 | 0.50% | ||||||||||||
Advisor | $1,000 | $986.00 | $3.12 | $1,021.79 | $3.18 | 0.63% | ||||||||||||
1. For Classes A, C, R, R6 and Advisor, 10/1/17 for Actual and Hypothetical. For Class M, 1/25/18 for Actual and 10/1/17 for Hypothetical.
2. For Classes A, C, R, R6 and Advisor, 10/1/17–3/31/18. For Class M, 1/25/18–3/31/18.
3. Expenses are equal to the annualized expense ratio for the six-month period as indicated above—in the far right column—multiplied by the simple average account value over the period indicated, and then multiplied by 182/365 to reflect the one-half year period. The multiplier is 65/365 for Actual Class M expenses to reflect the number of days since inception.
4. Reflects expenses after fee waivers and expense reimbursements. Does not include acquired fund fees and expenses.
| 28 | Semiannual Report | franklintempleton.com |
This semiannual report for Franklin Utilities Fund covers the period ended March 31, 2018.
Your Fund’s Goal and Main Investments
The Fund seeks both capital appreciation and current income by investing at least 80% of its net assets in public utility company securities.
Performance Overview
The Fund’s Class A shares had a -3.99% cumulative total return for the six months under review. In comparison, the Standard & Poor’s 500 (S&P 500) Index, which is a broad measure of US stock performance, posted a +5.84% total return, and the S&P 500 Utilities Index, which measures the performance of all utilities stocks in the S&P 500 Index, had a -3.10% total return.1 You can find the Fund’s long-term performance data in the Performance Summary beginning on page 31.
Performance data represent past performance, which does not guarantee future results. Investment return will fluctuate. Current performance may differ from figures shown. For most recent month-end performance, go to franklintempleton.com or call (800) 342-5236.
Investment Strategy
We search for the best return opportunities available in the global utilities arena with a specific focus on the US electricity and gas sector. Generally, we look for companies producing a high percentage of earnings from their regulated operations.
Manager’s Discussion
During the six months under review, key individual contributors to the Fund’s absolute performance included our investments in NextEra Energy, FirstEnergy and Exelon. A holding company with interests in generating and distributing electricity, NextEra Energy’s fourth quarter earnings rose, driven by solid contribution from both Florida Power Light Company and NextEra Energy Resources segments. NextEra Energy raised its earnings guidance as a result of the tax reform. Diversified energy company FirstEnergy made progress in transitioning to a fully regulated utility during the
Portfolio Composition
Based on Total Net Assets as of 3/31/18
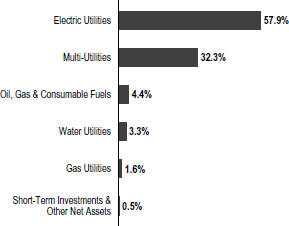
period and reaffirmed its earnings growth for the regulated business. It also provided an overall earnings growth guidance that was slightly better than consensus view. The company sold shares to raise capital, which it planned to use to reduce debt and supplement the pension fund. Shares of Exelon, a utility services holding company enjoyed substantial rallies that outpaced most of its industry peers. Exelon’s share price was also helped by strong cash flow support from merchant operations, higher-than-expected 2018 earnings guidance, healthy earnings growth and increased annual dividend growth.
In contrast, both sectors represented in the Fund’s portfolio, utilities and energy, detracted from the Fund’s absolute performance.2 In the utilities sector, PG&E and Edison International hampered Fund performance. Shares of PG&E were heavily impacted by the devastating fires that occurred in Northern California in 2017, which could be a potential liability for the company. Renewable energy company Edison International’s shares declined due to lawsuits arising out of the southern California wildfires and subsequent mudslides.
1. Source: Morningstar.
The indexes are unmanaged and include reinvested dividends. They do not reflect any fees, expenses or sales charges. One cannot invest directly in an index, and an index is not representative of the Fund’s portfolio.
2. The utilities sector comprises electric utilities, gas utilities, multi-utilities and water utilities in the SOI. The energy sector comprises oil, gas and consumable fuels in the SOI. See www.franklintempletondatasources.com for additional data provider information.
The dollar value, number of shares or principal amount, and names of all portfolio holdings are listed in the Fund’s Statement of Investments (SOI).
The SOI begins on page 89.
| franklintempleton.com | Semiannual Report | 29 |
FRANKLIN UTILITIES FUND
Within the energy sector, energy infrastructure company Kinder Morgan reported a significant non-cash charge due to the Tax Cuts and Jobs Act of 2017.
Top 10 Holdings
3/31/18
Company Sector/Industry | % of Total Net Assets | |||
NextEra Energy Inc. Electric Utilities | 8.2% | |||
Sempra Energy Multi-Utilities | 5.1% | |||
Dominion Energy Inc. Multi-Utilities | 4.9% | |||
American Electric Power Co. Inc. Electric Utilities | 4.6% | |||
Exelon Corp. Electric Utilities | 4.5% | |||
Duke Energy Corp. Electric Utilities | 4.4% | |||
CMS Energy Corp. Multi-Utilities | 4.0% | |||
Edison International Electric Utilities | 4.0% | |||
Xcel Energy Inc. Electric Utilities | 3.6% | |||
The Southern Co. Electric Utilities | 3.5% | |||
Thank you for your continued participation in Franklin Utilities Fund. We look forward to serving your future investment needs.
|
| |
| John C. Kohli, CFA | ||
|
| |
| J. Blair Schmicker, CFA | ||
| Portfolio Management Team | ||


The foregoing information reflects our analysis, opinions and portfolio holdings as of March 31, 2018, the end of the reporting period. The way we implement our main investment strategies and the resulting portfolio holdings may change depending on factors such as market and economic conditions. These opinions may not be relied upon as investment advice or an offer for a particular security. The information is not a complete analysis of every aspect of any market, country, industry, security or the Fund. Statements of fact are from sources considered reliable, but the investment manager makes no representation or warranty as to their completeness or accuracy. Although historical performance is no guarantee of future results, these insights may help you understand our investment management philosophy.
| 30 | Semiannual Report | franklintempleton.com |
FRANKLIN UTILITIES FUND
Performance Summary as of March 31, 2018
The performance tables do not reflect any taxes that a shareholder would pay on Fund dividends, capital gain distributions, if any, or any realized gains on the sale of Fund shares. Total return reflects reinvestment of the Fund’s dividends and capital gain distributions, if any, and any unrealized gains or losses. Your dividend income will vary depending on dividends or interest paid by securities in the Fund’s portfolio, adjusted for operating expenses of each class. Capital gain distributions are net profits realized from the sale of portfolio securities.
Performance as of 3/31/181
Cumulative total return excludes sales charges. Average annual total return includes maximum sales charges. Sales charges will vary depending on the size of the investment and the class of share purchased. The maximum is 4.25% and the minimum is 0%. Class A: 4.25% maximum initial sales charge; Advisor Class: no sales charges. For other share classes, visit franklintempleton.com.
| Share Class | Cumulative Total Return2 | Average Annual Total Return3 | ||||||
A | ||||||||
6-Month | -3.99% | -8.07% | ||||||
1-Year | +0.06% | -4.21% | ||||||
5-Year | +47.46% | +7.14% | ||||||
10-Year | +110.03% | +7.24% | ||||||
Advisor | ||||||||
6-Month | -4.00% | -4.00% | ||||||
1-Year | +0.15% | +0.15% | ||||||
5-Year | +48.63% | +8.25% | ||||||
10-Year | +113.20% | +7.86% | ||||||
| Distribution | 30-Day Standardized Yield5 | |||||||||||||||
| Share Class | Rate4 | (with waiver) | (without waiver) | |||||||||||||
A | 2.58% | 2.87% | 2.87% | |||||||||||||
Advisor | 2.82% | 3.16% | 3.15% | |||||||||||||
Performance data represent past performance, which does not guarantee future results. Investment return and principal value will fluctuate, and you may have a gain or loss when you sell your shares. Current performance may differ from figures shown. For most recent month-end performance, go to franklintempleton.com or call (800) 342-5236.
See page 32 for Performance Summary footnotes.
| franklintempleton.com | Semiannual Report | 31 |
FRANKLIN UTILITIES FUND
PERFORMANCE SUMMARY
Net Asset Value
| Share Class (Symbol) | 3/31/18 | 1/25/18 | 9/30/17 | Change | ||||
| A (FKUTX) | $17.85 | N/A | $19.18 | -$1.33 | ||||
| M (FUFMX) | $17.84 | $18.14 | N/A | -$0.30 | ||||
| C (FRUSX) | $17.75 | N/A | $19.09 | -$1.34 | ||||
| R (FRURX) | $17.78 | N/A | $19.11 | -$1.33 | ||||
| R6 (FUFRX) | $17.98 | N/A | $19.32 | -$1.34 | ||||
| Advisor (FRUAX) | $17.98 | N/A | $19.32 | -$1.34 | ||||
Distributions (10/1/17–3/31/18)
| Share Class | Net Investment Income | Long-Term Capital Gain | Total | |||||||||
| A | $0.2955 | $0.3087 | $0.6042 | |||||||||
| M (1/25/18 –3/31/18) | $0.1267 | N/A | $0.1267 | |||||||||
| C | $0.2483 | $0.3087 | $0.5570 | |||||||||
| R | $0.2624 | $0.3087 | $0.5711 | |||||||||
| R6 | $0.3189 | $0.3087 | $0.6276 | |||||||||
Advisor | $0.3096 | $0.3087 | $0.6183 | |||||||||
Total Annual Operating Expenses6
| Share Class | With Waiver | Without Waiver | ||||||
| A | 0.73% | 0.73% | ||||||
| Advisor | 0.58% | 0.58% |
Each class of shares is available to certain eligible investors and has different annual fees and expenses, as described in the prospectus.
All investments involve risks, including possible loss of principal. Investing in a fund concentrating in the utilities sector involves special risks, including increased susceptibility to adverse economic and regulatory developments affecting the sector. Stocks historically have outperformed other asset classes over the long term, but tend to fluctuate more dramatically over the short term. Securities issued by utility companies have been historically sensitive to interestrate changes. When interest rates fall, utility securities prices, and thus a utilities fund’s share price, tend to rise; when interest rates rise, their prices generally fall. The Fund is actively managed but there is no guarantee that the manager’s investment decisions will produce the desired results. The Fund’s prospectus also includes a description of the main investment risks.
1. The Fund has a fee waiver associated with any investment it makes in a Franklin Templeton money fund and/or other Franklin Templeton fund, contractually guaranteed through 1/31/19. Fund investment results reflect the fee waiver; without this waiver, the results would have been lower.
2. Cumulative total return represents the change in value of an investment over the periods indicated.
3. Average annual total return represents the average annual change in value of an investment over the periods indicated. Return for less than one year, if any, has not been annualized.
4. Distribution rate is based on an annualization of the respective class’s current quarterly dividend and the maximum offering price (NAV for Advisor Class) per share on 3/31/18.
5. The Fund’s 30-day standardized yield is calculated over a trailing 30-day period using the yield to maturity on bonds and/or the dividends accrued on stocks. It may not equal the Fund’s actual income distribution rate, which reflects the Fund’s past dividends paid to shareholders.
6. Figures are as stated in the Fund’s current prospectus and may differ from the expense ratios disclosed in the Your Fund’s Expenses and Financial Highlights sections in this report. In periods of market volatility, assets may decline significantly, causing total annual Fund operating expenses to become higher than the figures shown.
| 32 | Semiannual Report | franklintempleton.com |
FRANKLIN UTILITIES FUND
Your Fund’s Expenses
As a Fund shareholder, you can incur two types of costs: (1) transaction costs, including sales charges (loads) on Fund purchases and redemptions; and (2) ongoing Fund costs, including management fees, distribution and service (12b-1) fees, and other Fund expenses. All mutual funds have ongoing costs, sometimes referred to as operating expenses. The table below shows ongoing costs of investing in the Fund and can help you understand these costs and compare them with those of other mutual funds. The table assumes a $1,000 investment held for the six months indicated.
Actual Fund Expenses
The table below provides information about actual account values and actual expenses in the columns under the heading “Actual.” In these columns the Fund’s actual return, which includes the effect of Fund expenses, is used to calculate the “Ending Account Value” for each class of shares. You can estimate the expenses you paid during the period by following these steps (of course, your account value and expenses will differ from those in this illustration): Divide your account value by $1,000 (if your account had an $8,600 value, then $8,600 ÷ $1,000 = 8.6). Then multiply the result by the number in the row for your class of shares under the headings “Actual” and “Expenses Paid During Period” (if Actual Expenses Paid During Period were $7.50, then 8.6 x $7.50 = $64.50). In this illustration, the actual expenses paid this period are $64.50.
Hypothetical Example for Comparison with Other Funds
Under the heading “Hypothetical” in the table, information is provided about hypothetical account values and hypothetical expenses based on the Fund’s actual expense ratio and an assumed rate of return of 5% per year before expenses, which is not the Fund’s actual return. This information may not be used to estimate the actual ending account balance or expenses you paid for the period, but it can help you compare ongoing costs of investing in the Fund with those of other funds. To do so, compare this 5% hypothetical example for the class of shares you hold with the 5% hypothetical examples that appear in the shareholder reports of other funds.
Please note that expenses shown in the table are meant to highlight ongoing costs and do not reflect any transactional costs. Therefore, information under the heading “Hypothetical” is useful in comparing ongoing costs only, and will not help you compare total costs of owning different funds. In addition, if transactional costs were included, your total costs would have been higher.
Actual (actual return after expenses) | Hypothetical (5% annual return before expenses) | |||||||||||||||||
| Share Class | Beginning Account Value1 | Ending Account Value 3/31/18 | Expenses Paid During Period2,3,4 | Ending Account Value 3/31/18 | Expenses Paid During Period3,4 | Net Annualized Expense Ratio4 | ||||||||||||
A | $1,000 | $960.10 | $3.52 | $1,021.34 | $3.63 | 0.72% | ||||||||||||
M | $1,000 | $990.70 | $1.01 | $1,022.09 | $2.87 | 0.57% | ||||||||||||
C | $1,000 | $956.90 | $5.95 | $1,018.85 | $6.14 | 1.22% | ||||||||||||
R | $1,000 | $958.20 | $5.22 | $1,019.60 | $5.39 | 1.07% | ||||||||||||
R6 | $1,000 | $961.00 | $2.40 | $1,022.49 | $2.47 | 0.49% | ||||||||||||
Advisor | $1,000 | $960.00 | $2.79 | $1,022.09 | $2.87 | 0.57% | ||||||||||||
1. For Classes A, C, R, R6 and Advisor, 10/1/17 for Actual and Hypothetical. For Class M, 1/25/18 for Actual and 10/1/17 for Hypothetical.
2. For Classes A, C, R, R6 and Advisor, 10/1/17–3/31/18. For Class M, 1/25/18–3/31/18.
3. Expenses are equal to the annualized expense ratio for the six-month period as indicated above—in the far right column—multiplied by the simple average account value over the period indicated, and then multiplied by 182/365 to reflect the one-half year period. The multiplier is 65/365 for Actual Class M expenses to reflect the number of days since inception.
4. Reflects expenses after fee waivers and expense reimbursements. Does not include acquired fund fees and expenses.
| franklintempleton.com | Semiannual Report | 33 |
FRANKLIN CUSTODIAN FUNDS
Franklin DynaTech Fund
| Six Months Ended March 31, 2018 | Year Ended September 30, | |||||||||||||||||||||||
| (unaudited) | 2017 | 2016 | 2015 | 2014 | 2013 | |||||||||||||||||||
Class A | ||||||||||||||||||||||||
Per share operating performance | ||||||||||||||||||||||||
(for a share outstanding throughout the period) | ||||||||||||||||||||||||
Net asset value, beginning of period | $63.10 | $52.05 | $46.04 | $46.08 | $42.13 | $34.00 | ||||||||||||||||||
Income from investment operationsa: | ||||||||||||||||||||||||
Net investment income (loss)b | (0.12 | ) | (0.18 | ) | (0.14 | ) | (0.21 | ) | (0.18 | ) | (0.12 | ) | ||||||||||||
Net realized and unrealized gains (losses) | 8.09 | 12.92 | 7.35 | 1.78 | 5.94 | 8.25 | ||||||||||||||||||
Total from investment operations | 7.97 | 12.74 | 7.21 | 1.57 | 5.76 | 8.13 | ||||||||||||||||||
Less distributions from net realized gains | (1.16 | ) | (1.69 | ) | (1.20 | ) | (1.61 | ) | (1.81 | ) | — | |||||||||||||
Net asset value, end of period | $69.91 | $63.10 | $52.05 | $46.04 | $46.08 | $42.13 | ||||||||||||||||||
Total returnc | 12.73% | 25.67% | 15.73% | 3.40% | 13.98% | 23.91% | ||||||||||||||||||
Ratios to average net assetsd | ||||||||||||||||||||||||
Expenses before waiver and payments by affiliates | 0.88% | 0.92% | 0.91% | 0.89% | 0.89% | 0.94% | ||||||||||||||||||
Expenses net of waiver and payments by affiliates | 0.87%e | 0.91%e | 0.90% | 0.89%f | 0.89%e,f | 0.94% | ||||||||||||||||||
Net investment income (loss) | (0.34)% | (0.33)% | (0.30)% | (0.44)% | (0.41)% | (0.34)% | ||||||||||||||||||
Supplemental data | ||||||||||||||||||||||||
Net assets, end of period (000’s) | $2,915,885 | $2,498,393 | $2,123,082 | $1,857,570 | $1,504,338 | $1,072,814 | ||||||||||||||||||
Portfolio turnover rate | 9.07% | 19.85% | 22.42% | 31.02% | 26.43% | 35.40% | ||||||||||||||||||
aThe amount shown for a share outstanding throughout the period may not correlate with the Statement of Operations for the period due to the timing of sales and repurchases of the Fund’s shares in relation to income earned and/or fluctuating fair value of the investments of the Fund.
bBased on average daily shares outstanding.
cTotal return does not reflect sales commissions or contingent deferred sales charges, if applicable, and is not annualized for periods less than one year.
dRatios are annualized for periods less than one year.
eBenefit of expense reduction rounds to less than 0.01%.
fBenefit of waiver and payments by affiliates rounds to less than 0.01%.
| 34 | Semiannual Report | The accompanying notes are an integral part of these financial statements. | franklintempleton.com |
FRANKLIN CUSTODIAN FUNDS
FINANCIAL HIGHLIGHTS
Franklin DynaTech Fund (continued)
| Six Months Ended March 31, 2018 | Year Ended September 30, | |||||||||||||||||||||||
| (unaudited) | 2017 | 2016 | 2015 | 2014 | 2013 | |||||||||||||||||||
Class C | ||||||||||||||||||||||||
Per share operating performance | ||||||||||||||||||||||||
(for a share outstanding throughout the period) | ||||||||||||||||||||||||
Net asset value, beginning of period | $53.49 | $44.71 | $40.00 | $40.53 | $37.53 | $30.52 | ||||||||||||||||||
Income from investment operationsa: | ||||||||||||||||||||||||
Net investment income (loss)b | (0.31 | ) | (0.50 | ) | (0.43 | ) | (0.50 | ) | (0.46 | ) | (0.35 | ) | ||||||||||||
Net realized and unrealized gains (losses) | 6.83 | 10.97 | 6.34 | 1.58 | 5.27 | 7.36 | ||||||||||||||||||
Total from investment operations | 6.52 | 10.47 | 5.91 | 1.08 | 4.81 | 7.01 | ||||||||||||||||||
Less distributions from net realized gains | (1.16 | ) | (1.69 | ) | (1.20 | ) | (1.61 | ) | (1.81 | ) | — | |||||||||||||
Net asset value, end of period | $58.85 | $53.49 | $44.71 | $40.00 | $40.53 | $37.53 | ||||||||||||||||||
Total returnc | 12.35% | 24.72% | 14.86% | 2.63% | 13.13% | 22.97% | ||||||||||||||||||
Ratios to average net assetsd | ||||||||||||||||||||||||
Expenses before waiver and payments by affiliates | 1.63% | 1.67% | 1.66% | 1.64% | 1.64% | 1.69% | ||||||||||||||||||
Expenses net of waiver and payments by affiliates | 1.62%e | 1.66%e | 1.65% | 1.64%f | 1.64% | e,f | 1.69% | |||||||||||||||||
Net investment income (loss) | (1.09)% | (1.08)% | (1.05)% | (1.19)% | (1.16)% | (1.09)% | ||||||||||||||||||
Supplemental data | ||||||||||||||||||||||||
Net assets, end of period (000’s) | $468,828 | $374,502 | $318,896 | $270,961 | $212,961 | $176,556 | ||||||||||||||||||
Portfolio turnover rate | 9.07% | 19.85% | 22.42% | 31.02% | 26.43% | 35.40% | ||||||||||||||||||
aThe amount shown for a share outstanding throughout the period may not correlate with the Statement of Operations for the period due to the timing of sales and repurchases of the Fund’s shares in relation to income earned and/or fluctuating fair value of the investments of the Fund.
bBased on average daily shares outstanding.
cTotal return does not reflect sales commissions or contingent deferred sales charges, if applicable, and is not annualized for periods less than one year.
dRatios are annualized for periods less than one year.
eBenefit of expense reduction rounds to less than 0.01%.
fBenefit of waiver and payments by affiliates rounds to less than 0.01%.
| franklintempleton.com | The accompanying notes are an integral part of these financial statements. | Semiannual Report | 35 |
FRANKLIN CUSTODIAN FUNDS
FINANCIAL HIGHLIGHTS
Franklin DynaTech Fund (continued)
| Six Months Ended March 31, 2018 | Year Ended September 30, | |||||||||||||||||||||||
| (unaudited) | 2017 | 2016 | 2015 | 2014 | 2013 | |||||||||||||||||||
Class R | ||||||||||||||||||||||||
Per share operating performance | ||||||||||||||||||||||||
(for a share outstanding throughout the period) | ||||||||||||||||||||||||
Net asset value, beginning of period | $61.51 | $50.90 | $45.16 | $45.35 | $41.58 | $33.65 | ||||||||||||||||||
Income from investment operationsa: | ||||||||||||||||||||||||
Net investment income (loss)b | (0.19 | ) | (0.31 | ) | (0.26 | ) | (0.32 | ) | (0.29 | ) | (0.21 | ) | ||||||||||||
Net realized and unrealized gains (losses) | 7.87 | 12.61 | 7.20 | 1.74 | 5.87 | 8.14 | ||||||||||||||||||
Total from investment operations | 7.68 | 12.30 | 6.94 | 1.42 | 5.58 | 7.93 | ||||||||||||||||||
Less distributions from net realized gains | (1.16 | ) | (1.69 | ) | (1.20 | ) | (1.61 | ) | (1.81 | ) | — | |||||||||||||
Net asset value, end of period | $68.03 | $61.51 | $50.90 | $45.16 | $45.35 | $41.58 | ||||||||||||||||||
Total returnc | 12.61% | 25.36% | 15.43% | 3.11% | 13.72% | 23.57% | ||||||||||||||||||
Ratios to average net assetsd | ||||||||||||||||||||||||
Expenses before waiver and payments by affiliates | 1.13% | 1.17% | 1.16% | 1.14% | 1.14% | 1.19% | ||||||||||||||||||
Expenses net of waiver and payments by affiliates | 1.12%e | 1.16%e | 1.15% | 1.14%f | 1.14%e,f | 1.19% | ||||||||||||||||||
Net investment income (loss) | (0.59)% | (0.58)% | (0.55)% | (0.69)% | (0.66)% | (0.59)% | ||||||||||||||||||
Supplemental data | ||||||||||||||||||||||||
Net assets, end of period (000’s) | $64,439 | $47,860 | $38,862 | $43,001 | $45,230 | $41,825 | ||||||||||||||||||
Portfolio turnover rate | 9.07% | 19.85% | 22.42% | 31.02% | 26.43% | 35.40% | ||||||||||||||||||
aThe amount shown for a share outstanding throughout the period may not correlate with the Statement of Operations for the period due to the timing of sales and repurchases of the Fund’s shares in relation to income earned and/or fluctuating fair value of the investments of the Fund.
bBased on average daily shares outstanding.
cTotal return is not annualized for periods less than one year.
dRatios are annualized for periods less than one year.
eBenefit of expense reduction rounds to less than 0.01%.
fBenefit of waiver and payments by affiliates rounds to less than 0.01%.
| 36 | Semiannual Report | The accompanying notes are an integral part of these financial statements. | franklintempleton.com |
FRANKLIN CUSTODIAN FUNDS
FINANCIAL HIGHLIGHTS
Franklin DynaTech Fund (continued)
| Six Months Ended March 31, 2018 | Year Ended September 30, | |||||||||||||||||||||||
| (unaudited) | 2017 | 2016 | 2015 | 2014 | 2013a | |||||||||||||||||||
Class R6 | ||||||||||||||||||||||||
Per share operating performance | ||||||||||||||||||||||||
(for a share outstanding throughout the period) | ||||||||||||||||||||||||
Net asset value, beginning of period | $65.28 | $53.56 | $47.15 | $46.97 | $42.74 | $36.56 | ||||||||||||||||||
Income from investment operationsb: | ||||||||||||||||||||||||
Net investment income (loss)c | 0.02 | 0.06 | 0.06 | (0.01 | ) | (0.01 | ) | 0.01 | ||||||||||||||||
Net realized and unrealized gains (losses) | 8.36 | 13.35 | 7.55 | 1.80 | 6.05 | 6.17 | ||||||||||||||||||
Total from investment operations | 8.38 | 13.41 | 7.61 | 1.79 | 6.04 | 6.18 | ||||||||||||||||||
Less distributions from net realized gains | (1.16 | ) | (1.69 | ) | (1.20 | ) | (1.61 | ) | (1.81 | ) | — | |||||||||||||
Net asset value, end of period | $72.50 | $65.28 | $53.56 | $47.15 | $46.97 | $42.74 | ||||||||||||||||||
Total returnd | 12.99% | 26.17% | 16.21% | 3.81% | 14.45% | 16.90% | ||||||||||||||||||
Ratios to average net assetse | ||||||||||||||||||||||||
Expenses before waiver and payments by affiliates | 0.50% | 0.49% | 0.49% | 0.48% | 0.49% | 0.52% | ||||||||||||||||||
Expenses net of waiver and payments by affiliates | 0.49%f | 0.48%f | 0.48% | 0.48%g | 0.49% | f,g | 0.52% | |||||||||||||||||
Net investment income (loss) | 0.04% | 0.10% | 0.12% | (0.03)% | (0.01)% | 0.08% | ||||||||||||||||||
Supplemental data | ||||||||||||||||||||||||
Net assets, end of period (000’s) | $1,242,880 | $457,846 | $359,505 | $362,627 | $342,466 | $317,315 | ||||||||||||||||||
Portfolio turnover rate | 9.07% | 19.85% | 22.42% | 31.02% | 26.43% | 35.40% | ||||||||||||||||||
aFor the period May 1, 2013 (effective date) to September 30, 2013.
bThe amount shown for a share outstanding throughout the period may not correlate with the Statement of Operations for the period due to the timing of sales and repurchases of the Fund’s shares in relation to income earned and/or fluctuating fair value of the investments of the Fund.
cBased on average daily shares outstanding.
dTotal return is not annualized for periods less than one year.
eRatios are annualized for periods less than one year.
fBenefit of expense reduction rounds to less than 0.01%.
gBenefit of waiver and payments by affiliates rounds to less than 0.01%.
| franklintempleton.com | The accompanying notes are an integral part of these financial statements. | Semiannual Report | 37 |
FRANKLIN CUSTODIAN FUNDS
FINANCIAL HIGHLIGHTS
Franklin DynaTech Fund (continued)
| Six Months Ended March 31, 2018 | Year Ended September 30, | |||||||||||||||||||||||
| (unaudited) | 2017 | 2016 | 2015 | 2014 | 2013 | |||||||||||||||||||
Advisor Class | ||||||||||||||||||||||||
Per share operating performance | ||||||||||||||||||||||||
(for a share outstanding throughout the period) | ||||||||||||||||||||||||
Net asset value, beginning of period | $64.78 | $53.25 | $46.96 | $46.87 | $42.71 | $34.39 | ||||||||||||||||||
Income from investment operationsa: | ||||||||||||||||||||||||
Net investment income (loss)b | (0.04 | ) | (0.04 | ) | (0.03 | ) | (0.09 | ) | (0.07 | ) | (0.03 | ) | ||||||||||||
Net realized and unrealized gains (losses) | 8.31 | 13.26 | 7.52 | 1.79 | 6.04 | 8.35 | ||||||||||||||||||
Total from investment operations | 8.27 | 13.22 | 7.49 | 1.70 | 5.97 | 8.32 | ||||||||||||||||||
Less distributions from net realized gains | (1.16 | ) | (1.69 | ) | (1.20 | ) | (1.61 | ) | (1.81 | ) | — | |||||||||||||
Net asset value, end of period | $71.89 | $64.78 | $53.25 | $46.96 | $46.87 | $42.71 | ||||||||||||||||||
Total returnc | 12.89% | 25.98% | 16.02% | 3.62% | 14.29% | 24.19% | ||||||||||||||||||
Ratios to average net assetsd | ||||||||||||||||||||||||
Expenses before waiver and payments by affiliates | 0.63% | 0.67% | 0.66% | 0.64% | 0.64% | 0.69% | ||||||||||||||||||
Expenses net of waiver and payments by affiliates | 0.62%e | 0.66%e | 0.65% | 0.64%f | 0.64% | e,f | 0.69% | |||||||||||||||||
Net investment income (loss) | (0.09)% | (0.08)% | (0.05)% | (0.19)% | (0.16)% | (0.09)% | ||||||||||||||||||
Supplemental data | ||||||||||||||||||||||||
Net assets, end of period (000’s) | $425,166 | $712,762 | $203,443 | $176,090 | $159,180 | $122,287 | ||||||||||||||||||
Portfolio turnover rate | 9.07% | 19.85% | 22.42% | 31.02% | 26.43% | 35.40% | ||||||||||||||||||
aThe amount shown for a share outstanding throughout the period may not correlate with the Statement of Operations for the period due to the timing of sales and repurchases of the Fund’s shares in relation to income earned and/or fluctuating fair value of the investments of the Fund.
bBased on average daily shares outstanding.
cTotal return is not annualized for periods less than one year.
dRatios are annualized for periods less than one year.
eBenefit of expense reduction rounds to less than 0.01%.
fBenefit of waiver and payments by affiliates rounds to less than 0.01%.
| 38 | Semiannual Report | The accompanying notes are an integral part of these financial statements. | franklintempleton.com |
FRANKLIN CUSTODIAN FUNDS
Statement of Investments, March 31, 2018 (unaudited)
Franklin DynaTech Fund
| Country | Shares | Value | ||||||||||
Common Stocks 96.9% | ||||||||||||
Aerospace & Defense 3.6% | ||||||||||||
The Boeing Co. | United States | 200,000 | $ | 65,576,000 | ||||||||
Heico Corp. | United States | 350,000 | 30,383,500 | |||||||||
Raytheon Co. | United States | 400,000 | 86,328,000 | |||||||||
| 182,287,500 | ||||||||||||
Air Freight & Logistics 0.9% | ||||||||||||
FedEx Corp. | United States | 200,000 | 48,022,000 | |||||||||
Biotechnology 2.3% | ||||||||||||
a Alnylam Pharmaceuticals Inc. | United States | 40,000 | 4,764,000 | |||||||||
Amgen Inc. | United States | 80,000 | 13,638,400 | |||||||||
a AveXis Inc. | United States | 100,000 | 12,358,000 | |||||||||
a Bluebird Bio Inc. | United States | 100,000 | 17,075,000 | |||||||||
a Foundation Medicine Inc. | United States | 100,000 | 7,875,000 | |||||||||
a Neurocrine Biosciences Inc. | United States | 300,000 | 24,879,000 | |||||||||
a Regeneron Pharmaceuticals Inc. | United States | 100,000 | 34,436,000 | |||||||||
a Rhythm Pharmaceuticals Inc. | United States | 105,400 | 2,097,460 | |||||||||
| 117,122,860 | ||||||||||||
Capital Markets 5.4% | ||||||||||||
CBOE Global Markets Inc. | United States | 350,000 | 39,935,000 | |||||||||
The Charles Schwab Corp. | United States | 1,300,000 | 67,886,000 | |||||||||
Intercontinental Exchange Inc. | United States | 750,000 | 54,390,000 | |||||||||
MarketAxess Holdings Inc. | United States | 100,000 | 21,744,000 | |||||||||
Moody’s Corp. | United States | 300,000 | 48,390,000 | |||||||||
MSCI Inc. | United States | 300,000 | 44,841,000 | |||||||||
| 277,186,000 | ||||||||||||
Communications Equipment 0.4% | ||||||||||||
a Arista Networks Inc. | United States | 75,000 | 19,147,500 | |||||||||
Consumer Finance 0.0%† | ||||||||||||
a Lexinfintech Holdings Ltd., ADR | China | 190,500 | 2,766,060 | |||||||||
Diversified Consumer Services 0.1% | ||||||||||||
a Bright Horizons Family Solutions Inc. | United States | 80,000 | 7,977,600 | |||||||||
Electrical Equipment 0.5% | ||||||||||||
Nidec Corp. | Japan | 20,000 | 3,084,740 | |||||||||
Rockwell Automation Inc. | United States | 140,000 | 24,388,000 | |||||||||
| 27,472,740 | ||||||||||||
Electronic Equipment, Instruments & Components 2.2% | ||||||||||||
Amphenol Corp., A | United States | 500,000 | 43,065,000 | |||||||||
Cognex Corp. | United States | 500,000 | 25,995,000 | |||||||||
Keyence Corp. | Japan | 70,000 | 43,502,564 | |||||||||
| 112,562,564 | ||||||||||||
Energy Equipment & Services 0.6% | ||||||||||||
Schlumberger Ltd. | United States | 500,000 | 32,390,000 | |||||||||
Equity Real Estate Investment Trusts (REITs) 3.9% | ||||||||||||
American Tower Corp. | United States | 400,000 | 58,136,000 | |||||||||
Equinix Inc. | United States | 170,000 | 71,083,800 | |||||||||
a SBA Communications Corp., A. | United States | 400,000 | 68,368,000 | |||||||||
| 197,587,800 | ||||||||||||
| franklintempleton.com | Semiannual Report | 39 |
FRANKLIN CUSTODIAN FUNDS
STATEMENT OF INVESTMENTS (UNAUDITED)
Franklin DynaTech Fund (continued)
| Country | Shares | Value | ||||||||||
Common Stocks (continued) | ||||||||||||
Health Care Equipment & Supplies 7.5% | ||||||||||||
Abbott Laboratories | United States | 750,000 | $ | 44,940,000 | ||||||||
a ABIOMED Inc. | United States | 115,000 | 33,463,850 | |||||||||
a Align Technology Inc. | United States | 50,000 | 12,556,500 | |||||||||
Becton, Dickinson and Co. | United States | 210,000 | 45,507,000 | |||||||||
Danaher Corp. | United States | 200,000 | 19,582,000 | |||||||||
a Edwards Lifesciences Corp. | United States | 300,000 | 41,856,000 | |||||||||
a IDEXX Laboratories Inc. | United States | 400,000 | 76,556,000 | |||||||||
a Intuitive Surgical Inc. | United States | 125,000 | 51,603,750 | |||||||||
a iRhythm Technologies Inc. | United States | 115,000 | 7,239,250 | |||||||||
a Nevro Corp. | United States | 100,000 | 8,667,000 | |||||||||
Stryker Corp. | United States | 250,000 | 40,230,000 | |||||||||
| 382,201,350 | ||||||||||||
Health Care Providers & Services 1.5% | ||||||||||||
UnitedHealth Group Inc. | United States | 350,000 | 74,900,000 | |||||||||
Health Care Technology 0.9% | ||||||||||||
a Veeva Systems Inc. | United States | 600,000 | 43,812,000 | |||||||||
Industrial Conglomerates 0.1% | ||||||||||||
Roper Technologies Inc. | United States | 20,000 | 5,613,800 | |||||||||
Internet & Direct Marketing Retail 9.7% | ||||||||||||
a Amazon.com Inc. | United States | 250,000 | 361,835,000 | |||||||||
a Booking Holdings Inc. | United States | 20,000 | 41,607,800 | |||||||||
a Despegar.com Corp. | Argentina | 100,000 | 3,125,000 | |||||||||
a Netflix Inc. | United States | 250,000 | 73,837,500 | |||||||||
Start Today Co. Ltd. | Japan | 650,000 | 17,383,899 | |||||||||
| 497,789,199 | ||||||||||||
Internet Software & Services 15.2% | ||||||||||||
a 2U Inc. | United States | 400,000 | 33,612,000 | |||||||||
a Alibaba Group Holding Ltd., ADR | China | 400,000 | 73,416,000 | |||||||||
a Alphabet Inc., A | United States | 160,000 | 165,942,400 | |||||||||
a Alphabet Inc., C | United States | 62,170 | 64,146,384 | |||||||||
a Alteryx Inc. | United States | 20,000 | 682,800 | |||||||||
a Baidu Inc., ADR | China | 25,000 | 5,579,750 | |||||||||
a CarGurus Inc. | United States | 100,000 | 3,847,000 | |||||||||
a Delivery Hero AG | Germany | 200,000 | 9,683,913 | |||||||||
a Dropbox Inc., A | United States | 52,600 | 1,643,750 | |||||||||
a eBay Inc. | United States | 10,000 | 402,400 | |||||||||
a Etsy Inc. | United States | 100,000 | 2,806,000 | |||||||||
a Facebook Inc., A | United States | 1,000,000 | 159,790,000 | |||||||||
a GoDaddy Inc., A | United States | 40,000 | 2,456,800 | |||||||||
a GrubHub Inc. | United States | 160,000 | 16,235,200 | |||||||||
a Match Group Inc. | United States | 300,000 | 13,332,000 | |||||||||
MercadoLibre Inc. | Argentina | 100,000 | 35,639,000 | |||||||||
NetEase Inc., ADR | China | 50,000 | 14,019,500 | |||||||||
a Q2 Holdings Inc. | United States | 300,000 | 13,665,000 | |||||||||
a SendGrid Inc. | United States | 100,000 | 2,814,000 | |||||||||
a Shopify Inc., A | Canada | 100,000 | 12,430,316 | |||||||||
Tencent Holdings Ltd. | China | 2,500,000 | 130,465,804 | |||||||||
a Weibo Corp., ADR | China | 110,000 | 13,149,400 | |||||||||
| 775,759,417 | ||||||||||||
| 40 | Semiannual Report | franklintempleton.com |
FRANKLIN CUSTODIAN FUNDS
STATEMENT OF INVESTMENTS (UNAUDITED)
Franklin DynaTech Fund (continued)
| Country | Shares | Value | ||||||||||
Common Stocks (continued) | ||||||||||||
IT Services 8.5% | ||||||||||||
DXC Technology Co. | United States | 100,000 | $ | 10,053,000 | ||||||||
a Fiserv Inc. | United States | 500,000 | 35,655,000 | |||||||||
a InterXion Holding NV | Netherlands | 500,000 | 31,055,000 | |||||||||
Mastercard Inc., A | United States | 1,000,000 | 175,160,000 | |||||||||
a Pagseguro Digital Ltd. | Brazil | 350,000 | 13,412,000 | |||||||||
a PayPal Holdings Inc. | United States | 350,000 | 26,554,500 | |||||||||
a Square Inc., A | United States | 500,000 | 24,600,000 | |||||||||
Visa Inc., A | United States | 1,000,000 | 119,620,000 | |||||||||
| 436,109,500 | ||||||||||||
Life Sciences Tools & Services 2.0% | ||||||||||||
a Illumina Inc. | United States | 165,000 | 39,009,300 | |||||||||
Thermo Fisher Scientific Inc. | United States | 200,000 | 41,292,000 | |||||||||
a Waters Corp. | United States | 100,000 | 19,865,000 | |||||||||
| 100,166,300 | ||||||||||||
Machinery 1.0% | ||||||||||||
FANUC Corp. | Japan | 40,000 | 10,148,215 | |||||||||
Fortive Corp. | United States | 500,000 | 38,760,000 | |||||||||
KUKA AG | Germany | 38,218 | 4,336,665 | |||||||||
| 53,244,880 | ||||||||||||
Media 1.7% | ||||||||||||
a GCI Liberty Inc. | United States | 330,000 | 17,443,800 | |||||||||
a Liberty Broadband Corp., A | United States | 400,000 | 33,920,000 | |||||||||
a Liberty Broadband Corp., C | United States | 130,907 | 11,217,421 | |||||||||
Naspers Ltd., N | South Africa | 100,000 | 24,456,444 | |||||||||
| 87,037,665 | ||||||||||||
Pharmaceuticals 0.2% | ||||||||||||
Merck KGaA | Germany | 100,000 | 9,597,669 | |||||||||
a Nektar Therapeutics | United States | 30,000 | 3,187,800 | |||||||||
| 12,785,469 | ||||||||||||
Professional Services 0.9% | ||||||||||||
a CoStar Group Inc. | United States | 120,000 | 43,521,600 | |||||||||
en-japan Inc. | Japan | 25,000 | 1,451,560 | |||||||||
| 44,973,160 | ||||||||||||
Real Estate Management & Development 0.0%† | ||||||||||||
a Redfin Corp. | United States | 20,400 | 465,732 | |||||||||
Semiconductors & Semiconductor Equipment 8.3% | ||||||||||||
Analog Devices Inc. | United States | 450,000 | 41,008,500 | |||||||||
Applied Materials Inc. | United States | 320,000 | 17,795,200 | |||||||||
ASML Holding NV, N.Y. shs | Netherlands | 200,000 | 39,712,000 | |||||||||
Broadcom Ltd. | United States | 250,000 | 58,912,500 | |||||||||
Intel Corp. | United States | 1,000,000 | 52,080,000 | |||||||||
KLA-Tencor Corp. | United States | 150,000 | 16,351,500 | |||||||||
Lam Research Corp. | United States | 350,000 | 71,106,000 | |||||||||
Monolithic Power Systems | United States | 200,000 | 23,154,000 | |||||||||
NVIDIA Corp. | United States | 350,000 | 81,056,500 | |||||||||
Teradyne Inc. | United States | 20,000 | 914,200 | |||||||||
Xilinx Inc. | United States | 325,000 | 23,478,000 | |||||||||
| 425,568,400 | ||||||||||||
| franklintempleton.com | Semiannual Report | 41 |
FRANKLIN CUSTODIAN FUNDS
STATEMENT OF INVESTMENTS (UNAUDITED)
Franklin DynaTech Fund (continued)
| Country | Shares | Value | ||||||||||
Common Stocks (continued) | ||||||||||||
Software 17.9% | ||||||||||||
Activision Blizzard Inc. | United States | 550,000 | $ | 37,103,000 | ||||||||
a Adobe Systems Inc. | United States | 500,000 | 108,040,000 | |||||||||
a Altair Engineering Inc. | United States | 250,000 | 7,840,000 | |||||||||
a ANSYS Inc. | United States | 200,000 | 31,338,000 | |||||||||
a Aspen Technology Inc. | United States | 500,000 | 39,445,000 | |||||||||
a Atlassian Corp. PLC | Australia | 350,000 | 18,872,000 | |||||||||
a Autodesk Inc. | United States | 350,000 | 43,953,000 | |||||||||
a Blackline Inc. | United States | �� | 200,200 | 7,849,842 | ||||||||
a Cadence Design Systems Inc. | United States | 500,000 | 18,385,000 | |||||||||
a Electronic Arts Inc. | United States | 500,000 | 60,620,000 | |||||||||
a Guidewire Software Inc. | United States | 350,000 | 28,290,500 | |||||||||
a Hubspot Inc. | United States | 250,000 | 27,075,000 | |||||||||
Intuit Inc. | United States | 250,000 | 43,337,500 | |||||||||
Microsoft Corp.. | United States | 750,000 | 68,452,500 | |||||||||
NCsoft Corp. | South Korea | 5,000 | 1,978,416 | |||||||||
a Salesforce.com Inc. | United States | 1,000,000 | 116,300,000 | |||||||||
a Sea Ltd., ADR | Singapore | 100,000 | 1,127,000 | |||||||||
a ServiceNow Inc. | United States | 600,000 | 99,270,000 | |||||||||
a Splunk Inc. | United States | 400,000 | 39,356,000 | |||||||||
a Take-Two Interactive Software Inc. | United States | 10,000 | 977,800 | |||||||||
a Tyler Technologies Inc. | United States | 100,000 | 21,096,000 | |||||||||
a Ultimate Software Group Inc. | United States | 50,000 | 12,185,000 | |||||||||
a Workday Inc., A | United States | 500,000 | 63,555,000 | |||||||||
a Zendesk Inc. | United States | 300,000 | 14,361,000 | |||||||||
a Zscaler Inc. | United States | 200,000 | 5,614,000 | |||||||||
| 916,421,558 | ||||||||||||
Technology Hardware, Storage & Peripherals 1.3% | ||||||||||||
Apple Inc. | United States | 400,000 | 67,112,000 | |||||||||
Textiles, Apparel & Luxury Goods 0.3% | ||||||||||||
NIKE Inc., B | United States | 200,000 | 13,288,000 | |||||||||
Total Common Stocks (Cost $2,528,296,034) | 4,961,771,054 | |||||||||||
Short Term Investments (Cost $168,212,818) 3.3% | ||||||||||||
Money Market Funds 3.3% | ||||||||||||
b,c Institutional Fiduciary Trust Money Market Portfolio, 1.24% | United States | 168,212,818 | 168,212,818 | |||||||||
Total Investments (Cost $2,696,508,852) 100.2% | 5,129,983,872 | |||||||||||
Other Assets, less Liabilities (0.2)% | (12,785,711 | ) | ||||||||||
Net Assets 100.0% | $ | 5,117,198,161 | ||||||||||
See Abbreviations on page 120.
†Rounds to less than 0.1% of net assets.
aNon-income producing.
bSee Note 3(f) regarding investments in affiliated management investment companies.
cThe rate shown is the annualized seven-day effective yield at period end.
| 42 | Semiannual Report | The accompanying notes are an integral part of these financial statements. | franklintempleton.com |
FRANKLIN CUSTODIAN FUNDS
Financial Highlights
Franklin Growth Fund
| Six Months Ended March 31, 2018 | Year Ended September 30, | |||||||||||||||||||||||
| (unaudited | ) | 2017 | 2016 | 2015 | 2014 | 2013 | ||||||||||||||||||
Class A | ||||||||||||||||||||||||
Per share operating performance (for a share outstanding throughout the period) | ||||||||||||||||||||||||
Net asset value, beginning of period | $91.61 | $78.54 | $72.40 | $70.51 | $59.49 | $50.13 | ||||||||||||||||||
Income from investment operationsa: | ||||||||||||||||||||||||
Net investment incomeb | 0.19 | 0.40 | 0.47 | c | 0.29 | 0.26 | 0.26 | |||||||||||||||||
Net realized and unrealized gains (losses) | 7.10 | 15.56 | 8.51 | 1.79 | 11.06 | 9.24 | ||||||||||||||||||
Total from investment operations | 7.29 | 15.96 | 8.98 | 2.08 | 11.32 | 9.50 | ||||||||||||||||||
Less distributions from: | ||||||||||||||||||||||||
Net investment income | (0.36 | ) | (0.39 | ) | (0.47 | ) | (0.19 | ) | (0.30 | ) | (0.14 | ) | ||||||||||||
Net realized gains | (2.25 | ) | (2.50 | ) | (2.37 | ) | — | — | — | |||||||||||||||
Total distributions | (2.61 | ) | (2.89 | ) | (2.84 | ) | (0.19 | ) | (0.30 | ) | (0.14 | ) | ||||||||||||
Net asset value, end of period | $96.29 | $91.61 | $78.54 | $72.40 | $70.51 | $59.49 | ||||||||||||||||||
Total returnd | 8.04% | 21.12% | 12.57% | 2.94% | 19.08% | 19.01% | ||||||||||||||||||
Ratios to average net assetse | ||||||||||||||||||||||||
Expenses before waiver and payments by affiliates | 0.85% | 0.88% | 0.88% | 0.88% | 0.90% | 0.91% | ||||||||||||||||||
Expenses net of waiver and payments by affiliatesf | 0.84% | 0.87% | 0.86% | 0.88% | g | 0.90% | g | 0.91% | ||||||||||||||||
Net investment income | 0.40% | 0.47% | 0.63% | c | 0.38% | 0.40% | 0.49% | |||||||||||||||||
Supplemental data | ||||||||||||||||||||||||
Net assets, end of period (000’s) | $8,336,492 | $8,051,641 | $7,628,523 | $7,185,665 | $6,611,073 | $5,305,031 | ||||||||||||||||||
Portfolio turnover rate | 3.02% | 5.60% | 7.53% | 5.05% | 1.50% | 0.83% | ||||||||||||||||||
aThe amount shown for a share outstanding throughout the period may not correlate with the Statement of Operations for the period due to the timing of sales and repurchases of the Fund’s shares in relation to income earned and/or fluctuating fair value of the investments of the Fund.
bBased on average daily shares outstanding.
cNet investment income per share includes approximately $0.10 per share related to income received in the form of special dividends in connection with certain Fund holdings. Excluding this amount, the ratio of net investment income to average net assets would have been 0.50%.
dTotal return does not reflect sales commissions or contingent deferred sales charges, if applicable, and is not annualized for periods less than one year.
eRatios are annualized for periods less than one year.
fBenefit of expense reduction rounds to less than 0.01%.
gBenefit of waiver and payments by affiliates rounds to less than 0.01%.
| franklintempleton.com | The accompanying notes are an integral part of these financial statements. | Semiannual Report | 43 |
FRANKLIN CUSTODIAN FUNDS
FINANCIAL HIGHLIGHTS
Franklin Growth Fund (continued)
| Six Months Ended March 31, 2018 | Year Ended September 30, | |||||||||||||||||||||||
| (unaudited | ) | 2017 | 2016 | 2015 | 2014 | 2013 | ||||||||||||||||||
Class C | ||||||||||||||||||||||||
Per share operating performance (for a share outstanding throughout the period) | ||||||||||||||||||||||||
Net asset value, beginning of period | $84.25 | $72.60 | $67.17 | $65.75 | $55.64 | $47.10 | ||||||||||||||||||
Income from investment operationsa: | ||||||||||||||||||||||||
Net investment income (loss)b | (0.16 | ) | (0.21 | ) | (0.08 | )c | (0.26 | ) | (0.22 | ) | (0.13 | ) | ||||||||||||
Net realized and unrealized gains (losses) | 6.54 | 14.36 | 7.88 | 1.68 | 10.33 | 8.67 | ||||||||||||||||||
Total from investment operations | 6.38 | 14.15 | 7.80 | 1.42 | 10.11 | 8.54 | ||||||||||||||||||
Less distributions from net realized gains | (2.25 | ) | (2.50 | ) | (2.37 | ) | — | — | — | |||||||||||||||
Net asset value, end of period | $88.38 | $84.25 | $72.60 | $67.17 | $65.75 | $55.64 | ||||||||||||||||||
Total returnd | 7.64 | % | 20.21 | % | 11.74 | % | 2.16 | % | 18.17 | % | 18.13 | % | ||||||||||||
Ratios to average net assetse | ||||||||||||||||||||||||
Expenses before waiver and payments by affiliates | 1.60 | % | 1.63 | % | 1.63 | % | 1.63 | % | 1.65 | % | 1.66 | % | ||||||||||||
Expenses net of waiver and payments by affiliatesf | 1.59 | % | 1.62 | % | 1.61 | % | 1.63 | %g | 1.65 | %g | 1.66 | % | ||||||||||||
Net investment income (loss) | (0.35 | )% | (0.28 | )% | (0.12 | )%c | (0.37 | )% | (0.35 | )% | (0.26 | )% | ||||||||||||
Supplemental data | ||||||||||||||||||||||||
Net assets, end of period (000’s) | $994,443 | $930,751 | $846,965 | $777,570 | $662,548 | $546,505 | ||||||||||||||||||
Portfolio turnover rate | 3.02 | % | 5.60 | % | 7.53 | % | 5.05 | % | 1.50 | % | 0.83 | % | ||||||||||||
aThe amount shown for a share outstanding throughout the period may not correlate with the Statement of Operations for the period due to the timing of sales and repurchases of the Fund’s shares in relation to income earned and/or fluctuating fair value of the investments of the Fund.
bBased on average daily shares outstanding.
cNet investment income per share includes approximately $0.10 per share related to income received in the form of special dividends in connection with certain Fund holdings. Excluding this amount, the ratio of net investment income to average net assets would have been (0.25)%.
dTotal return does not reflect sales commissions or contingent deferred sales charges, if applicable, and is not annualized for periods less than one year.
eRatios are annualized for periods less than one year.
fBenefit of expense reduction rounds to less than 0.01%.
gBenefit of waiver and payments by affiliates rounds to less than 0.01%.
| 44 | Semiannual Report | The accompanying notes are an integral part of these financial statements. | franklintempleton.com |
FRANKLIN CUSTODIAN FUNDS
FINANCIAL HIGHLIGHTS
Franklin Growth Fund (continued)
| Six Months Ended March 31, 2018 | Year Ended September 30, | |||||||||||||||||||||||
| (unaudited | ) | 2017 | 2016 | 2015 | 2014 | 2013 | ||||||||||||||||||
Class R | ||||||||||||||||||||||||
Per share operating performance (for a share outstanding throughout the period) | ||||||||||||||||||||||||
Net asset value, beginning of period | $91.13 | $78.14 | $71.93 | $70.05 | $59.07 | $49.82 | ||||||||||||||||||
Income from investment operationsa: | ||||||||||||||||||||||||
Net investment incomeb | 0.07 | 0.19 | 0.29 | c | 0.10 | 0.10 | 0.13 | |||||||||||||||||
Net realized and unrealized gains (losses) | 7.06 | 15.51 | 8.45 | 1.78 | 10.98 | 9.18 | ||||||||||||||||||
Total from investment operations | 7.13 | 15.70 | 8.74 | 1.88 | 11.08 | 9.31 | ||||||||||||||||||
Less distributions from: | ||||||||||||||||||||||||
Net investment income | (0.13 | ) | (0.21 | ) | (0.16 | ) | — | (0.10 | ) | (0.06 | ) | |||||||||||||
Net realized gains | (2.25 | ) | (2.50 | ) | (2.37 | ) | — | — | — | |||||||||||||||
Total distributions | (2.38 | ) | (2.71 | ) | (2.53 | ) | — | (0.10 | ) | (0.06 | ) | |||||||||||||
Net asset value, end of period | $95.88 | $91.13 | $78.14 | $71.93 | $70.05 | $59.07 | ||||||||||||||||||
Total returnd | 7.91% | 20.81% | 12.29% | 2.68% | 18.77% | 18.71% | ||||||||||||||||||
Ratios to average net assetse | ||||||||||||||||||||||||
Expenses before waiver and payments by affiliates | 1.10% | 1.13% | 1.13% | 1.13% | 1.15% | 1.16% | ||||||||||||||||||
Expenses net of waiver and payments by affiliatesf | 1.09% | 1.12% | 1.11% | 1.13% | g | 1.15% | g | 1.16% | ||||||||||||||||
Net investment income | 0.15% | 0.22% | 0.38% | c | 0.13% | 0.15% | 0.24% | |||||||||||||||||
Supplemental data | ||||||||||||||||||||||||
Net assets, end of period (000’s) | $507,133 | $510,317 | $477,221 | $501,813 | $565,634 | $552,391 | ||||||||||||||||||
Portfolio turnover rate | 3.02% | 5.60% | 7.53% | 5.05% | 1.50% | 0.83% | ||||||||||||||||||
aThe amount shown for a share outstanding throughout the period may not correlate with the Statement of Operations for the period due to the timing of sales and repurchases of the Fund’s shares in relation to income earned and/or fluctuating fair value of the investments of the Fund.
bBased on average daily shares outstanding.
cNet investment income per share includes approximately $0.10 per share related to income received in the form of special dividends in connection with certain Fund holdings. Excluding this amount, the ratio of net investment income to average net assets would have been 0.25%.
dTotal return is not annualized for periods less than one year.
eRatios are annualized for periods less than one year.
fBenefit of expense reduction rounds to less than 0.01%.
gBenefit of waiver and payments by affiliates rounds to less than 0.01%.
| franklintempleton.com | The accompanying notes are an integral part of these financial statements. | Semiannual Report | 45 |
FRANKLIN CUSTODIAN FUNDS
FINANCIAL HIGHLIGHTS
Franklin Growth Fund (continued)
| Six Months Ended March 31, 2018 | Year Ended September 30, | |||||||||||||||||||||||
| (unaudited | ) | 2017 | 2016 | 2015 | 2014 | 2013 | a | |||||||||||||||||
Class R6 | ||||||||||||||||||||||||
Per share operating performance (for a share outstanding throughout the period) | ||||||||||||||||||||||||
Net asset value, beginning of period | $91.90 | $78.79 | $72.69 | $70.76 | $59.71 | $54.58 | ||||||||||||||||||
Income from investment operationsb: | ||||||||||||||||||||||||
Net investment incomec | 0.37 | 0.74 | 0.78 | d | 0.61 | 0.55 | 0.24 | |||||||||||||||||
Net realized and unrealized gains (losses) | 7.12 | 15.59 | 8.56 | 1.79 | 11.08 | 4.89 | ||||||||||||||||||
Total from investment operations | 7.49 | 16.33 | 9.34 | 2.40 | 11.63 | 5.13 | ||||||||||||||||||
Less distributions from: | ||||||||||||||||||||||||
Net investment income | (0.74 | ) | (0.72 | ) | (0.87 | ) | (0.47 | ) | (0.58 | ) | — | |||||||||||||
Net realized gains | (2.25 | ) | (2.50 | ) | (2.37 | ) | — | — | — | |||||||||||||||
Total distributions | (2.99 | ) | (3.22 | ) | (3.24 | ) | (0.47 | ) | (0.58 | ) | — | |||||||||||||
Net asset value, end of period | $96.40 | $91.90 | $78.79 | $72.69 | $70.76 | $59.71 | ||||||||||||||||||
Total returne | 8.26% | 21.61% | 13.05% | 3.37% | 19.59% | 9.40% | ||||||||||||||||||
Ratios to average net assetsf | ||||||||||||||||||||||||
Expenses before waiver and payments by affiliates | 0.48% | 0.46% | 0.46% | 0.46% | 0.47% | 0.48% | ||||||||||||||||||
Expenses net of waiver and payments by affiliatesg | 0.47% | 0.45% | 0.44% | 0.46% | h | 0.47% | h | 0.48% | ||||||||||||||||
Net investment income | 0.77% | 0.89% | 1.05% | d | 0.80% | 0.83% | 0.92% | |||||||||||||||||
Supplemental data | ||||||||||||||||||||||||
Net assets, end of period (000’s) | $2,264,312 | $1,700,993 | $1,247,825 | $1,163,362 | $1,107,887 | $871,260 | ||||||||||||||||||
Portfolio turnover rate | 3.02% | 5.60% | 7.53% | 5.05% | 1.50% | 0.83% | ||||||||||||||||||
aFor the period May 1, 2013 (effective date) to September 30, 2013.
bThe amount shown for a share outstanding throughout the period may not correlate with the Statement of Operations for the period due to the timing of sales and repurchases of the Fund’s shares in relation to income earned and/or fluctuating fair value of the investments of the Fund.
cBased on average daily shares outstanding.
dNet investment income per share includes approximately $0.10 per share related to income received in the form of special dividends in connection with certain Fund holdings. Excluding this amount, the ratio of net investment income to average net assets would have been 0.92%.
eTotal return is not annualized for periods less than one year.
fRatios are annualized for periods less than one year.
gBenefit of expense reduction rounds to less than 0.01%.
hBenefit of waiver and payments by affiliates rounds to less than 0.01%.
| 46 | Semiannual Report | The accompanying notes are an integral part of these financial statements. | franklintempleton.com |
FRANKLIN CUSTODIAN FUNDS
FINANCIAL HIGHLIGHTS
Franklin Growth Fund (continued)
| Six Months Ended March 31, 2018 | Year Ended September 30, | |||||||||||||||||||||||
| (unaudited | ) | 2017 | 2016 | 2015 | 2014 | 2013 | ||||||||||||||||||
Advisor Class | ||||||||||||||||||||||||
Per share operating performance (for a share outstanding throughout the period) | ||||||||||||||||||||||||
Net asset value, beginning of period | $91.90 | $78.80 | $72.67 | $70.75 | $59.66 | $50.24 | ||||||||||||||||||
Income from investment operationsa: | ||||||||||||||||||||||||
Net investment incomeb | 0.31 | 0.60 | 0.65 | c | 0.48 | 0.43 | 0.39 | |||||||||||||||||
Net realized and unrealized gains (losses) | 7.12 | 15.61 | 8.56 | 1.79 | 11.08 | 9.26 | ||||||||||||||||||
Total from investment operations | 7.43 | 16.21 | 9.21 | 2.27 | 11.51 | 9.65 | ||||||||||||||||||
Less distributions from: | ||||||||||||||||||||||||
Net investment income | (0.59 | ) | (0.61 | ) | (0.71 | ) | (0.35 | ) | (0.42 | ) | (0.23 | ) | ||||||||||||
Net realized gains | (2.25 | ) | (2.50 | ) | (2.37 | ) | — | — | — | |||||||||||||||
Total distributions | (2.84 | ) | (3.11 | ) | (3.08 | ) | (0.35 | ) | (0.42 | ) | (0.23 | ) | ||||||||||||
Net asset value, end of period | $96.49 | $91.90 | $78.80 | $72.67 | $70.75 | $59.66 | ||||||||||||||||||
Total returnd | 8.17% | 21.43% | 12.85% | 3.20% | 19.37% | 19.29% | ||||||||||||||||||
Ratios to average net assetse | ||||||||||||||||||||||||
Expenses before waiver and payments by affiliates | 0.60% | 0.63% | 0.63% | 0.63% | 0.65% | 0.66% | ||||||||||||||||||
Expenses net of waiver and payments by affiliatesf | 0.59% | 0.62% | 0.61% | 0.63% | g | 0.65% | g | 0.66% | ||||||||||||||||
Net investment income | 0.65% | 0.72% | 0.88% | c | 0.63% | 0.65% | 0.74% | |||||||||||||||||
Supplemental data | ||||||||||||||||||||||||
Net assets, end of period (000’s) | $2,697,170 | $2,801,153 | $1,998,483 | $1,514,492 | $1,414,980 | $1,080,811 | ||||||||||||||||||
Portfolio turnover rate | 3.02% | 5.60% | 7.53% | 5.05% | 1.50% | 0.83% | ||||||||||||||||||
aThe amount shown for a share outstanding throughout the period may not correlate with the Statement of Operations for the period due to the timing of sales and repurchases of the Fund’s shares in relation to income earned and/or fluctuating fair value of the investments of the Fund.
bBased on average daily shares outstanding.
cNet investment income per share includes approximately $0.10 per share related to income received in the form of special dividends in connection with certain Fund holdings. Excluding this amount, the ratio of net investment income to average net assets would have been 0.75%.
dTotal return is not annualized for periods less than one year.
eRatios are annualized for periods less than one year.
fBenefit of expense reduction rounds to less than 0.01%.
gBenefit of waiver and payments by affiliates rounds to less than 0.01%.
| franklintempleton.com | The accompanying notes are an integral part of these financial statements. | Semiannual Report | 47 |
FRANKLIN CUSTODIAN FUNDS
Statement of Investments, March 31, 2018 (unaudited)
Franklin Growth Fund
| Country | Shares | Value | ||||||||||||
| Common Stocks 97.6% | ||||||||||||||
| Automobiles & Components 0.6% | ||||||||||||||
| BorgWarner Inc. | United States | 1,650,000 | $ | 82,879,500 | ||||||||||
|
| |||||||||||||
| Banks 0.3% | ||||||||||||||
| Wells Fargo & Co. | United States | 750,000 | 39,307,500 | |||||||||||
|
| |||||||||||||
| Capital Goods 19.2% | ||||||||||||||
| 3M Co. | United States | 855,000 | 187,689,600 | |||||||||||
| Allegion PLC | United States | 700,000 | 59,703,000 | |||||||||||
| AMETEK Inc. | United States | 700,000 | 53,179,000 | |||||||||||
| The Boeing Co. | United States | 1,100,000 | 360,668,000 | |||||||||||
| BWX Technologies Inc. | United States | 1,200,000 | 76,236,000 | |||||||||||
| Caterpillar Inc. | United States | 550,000 | 81,059,000 | |||||||||||
| Deere & Co. | United States | 500,000 | 77,660,000 | |||||||||||
| Emerson Electric Co. | United States | 1,100,000 | 75,130,000 | |||||||||||
| Fortive Corp. | United States | 525,000 | 40,698,000 | |||||||||||
| General Dynamics Corp. | United States | 1,000,000 | 220,900,000 | |||||||||||
| General Electric Co. | United States | 5,000,000 | 67,400,000 | |||||||||||
| Huntington Ingalls Industries Inc. | United States | 300,000 | 77,328,000 | |||||||||||
| Illinois Tool Works Inc. | United States | 1,000,000 | 156,660,000 | |||||||||||
| Ingersoll-Rand PLC | United States | 1,100,000 | 94,061,000 | |||||||||||
| Lockheed Martin Corp. | United States | 500,000 | 168,965,000 | |||||||||||
| Northrop Grumman Corp. | United States | 1,100,000 | 384,032,000 | |||||||||||
| Raytheon Co. | United States | 600,000 | 129,492,000 | |||||||||||
| Rockwell Collins Inc. | United States | 350,000 | 47,197,500 | |||||||||||
a | Sensata Technologies Holding PLC | United States | 3,200,000 | 165,856,000 | ||||||||||
| Stanley Black & Decker Inc. | United States | 650,000 | 99,580,000 | |||||||||||
| Textron Inc. | United States | 1,600,000 | 94,352,000 | |||||||||||
| United Technologies Corp. | United States | 930,000 | 117,012,600 | |||||||||||
|
| |||||||||||||
| 2,834,858,700 | ||||||||||||||
|
| |||||||||||||
| Commercial & Professional Services 2.6% | ||||||||||||||
| Equifax Inc. | United States | 550,000 | 64,795,500 | |||||||||||
a | IHS Markit Ltd. | United States | 3,556,600 | 171,570,384 | ||||||||||
a | Verisk Analytics Inc. | United States | 1,500,000 | 156,000,000 | ||||||||||
|
| |||||||||||||
| 392,365,884 | ||||||||||||||
|
| |||||||||||||
| Consumer Durables & Apparel 0.8% | ||||||||||||||
| NIKE Inc., B | United States | 1,880,000 | 124,907,200 | |||||||||||
|
| |||||||||||||
| Consumer Services 1.4% | ||||||||||||||
| Carnival Corp. | United States | 1,200,000 | 78,696,000 | |||||||||||
| Graham Holdings Co., B | United States | 80,000 | 48,180,000 | |||||||||||
| Marriott International Inc., A | United States | 200,000 | 27,196,000 | |||||||||||
| Starbucks Corp. | United States | 900,000 | 52,101,000 | |||||||||||
|
| |||||||||||||
| 206,173,000 | ||||||||||||||
|
| |||||||||||||
| Diversified Financials 4.0% | ||||||||||||||
| American Express Co. | United States | 600,000 | 55,968,000 | |||||||||||
a | Berkshire Hathaway Inc., A | United States | 184 | 55,034,400 | ||||||||||
| BlackRock Inc. | United States | 225,000 | 121,887,000 | |||||||||||
| The Charles Schwab Corp. | United States | 3,000,000 | 156,660,000 | |||||||||||
| Intercontinental Exchange Inc. | United States | 1,400,000 | 101,528,000 | |||||||||||
| T. Rowe Price Group Inc. | United States | 900,000 | 97,173,000 | |||||||||||
|
| |||||||||||||
| 588,250,400 | ||||||||||||||
|
|
| 48 | Semiannual Report | franklintempleton.com |
FRANKLIN CUSTODIAN FUNDS
STATEMENT OF INVESTMENTS (UNAUDITED)
Franklin Growth Fund (continued)
| Country | Shares | Value | ||||||||||||
Common Stocks (continued) | ||||||||||||||
| Energy 1.5% | ||||||||||||||
| Anadarko Petroleum Corp. | United States | 1,250,000 | $ | 75,512,500 | ||||||||||
| Cabot Oil & Gas Corp., A | United States | 1,700,000 | 40,766,000 | |||||||||||
| Halliburton Co. | United States | 850,000 | 39,899,000 | |||||||||||
| Royal Dutch Shell PLC, A, ADR | United Kingdom | 345,000 | 22,014,450 | |||||||||||
| Schlumberger Ltd. | United States | 573,700 | 37,164,286 | |||||||||||
|
| |||||||||||||
| 215,356,236 | ||||||||||||||
|
| |||||||||||||
| Food & Staples Retailing 0.3% | ||||||||||||||
| CVS Health Corp. | United States | 656,000 | 40,809,760 | |||||||||||
|
| |||||||||||||
| Food, Beverage & Tobacco 3.4% | ||||||||||||||
| Anheuser-Busch InBev SA/NV, ADR | Belgium | 350,000 | 38,479,000 | |||||||||||
| Brown-Forman Corp., B | United States | 1,625,000 | 88,400,000 | |||||||||||
| Constellation Brands Inc., A | United States | 400,000 | 91,168,000 | |||||||||||
| Mondelez International Inc., A | United States | 1,500,000 | 62,595,000 | |||||||||||
a | Monster Beverage Corp. | United States | 2,700,000 | 154,467,000 | ||||||||||
| PepsiCo Inc. | United States | 650,000 | 70,947,500 | |||||||||||
|
| |||||||||||||
| 506,056,500 | ||||||||||||||
|
| |||||||||||||
| Health Care Equipment & Services 7.5% | ||||||||||||||
| Abbott Laboratories | United States | 1,350,000 | 80,892,000 | |||||||||||
a | ABIOMED Inc. | United States | 200,000 | 58,198,000 | ||||||||||
| Aetna Inc. | United States | 650,000 | 109,850,000 | |||||||||||
| Baxter International Inc. | United States | 400,000 | 26,016,000 | |||||||||||
| Becton, Dickinson and Co. | United States | 77,700 | 16,837,590 | |||||||||||
| Danaher Corp. | United States | 1,050,000 | 102,805,500 | |||||||||||
a | Edwards Lifesciences Corp. | United States | 400,000 | 55,808,000 | ||||||||||
a | Haemonetics Corp. | United States | 1,000,000 | 73,160,000 | ||||||||||
a | Intuitive Surgical Inc. | United States | 450,000 | 185,773,500 | ||||||||||
a | Laboratory Corp. of America Holdings | United States | 500,000 | 80,875,000 | ||||||||||
| Quest Diagnostics Inc. | United States | 900,000 | 90,270,000 | |||||||||||
| Stryker Corp. | United States | 400,000 | 64,368,000 | |||||||||||
| Teleflex Inc. | United States | 500,000 | 127,490,000 | |||||||||||
a | Varian Medical Systems Inc. | United States | 300,000 | 36,795,000 | ||||||||||
|
| |||||||||||||
| 1,109,138,590 | ||||||||||||||
|
| |||||||||||||
| Insurance 0.4% | ||||||||||||||
| Aflac Inc. | United States | 1,200,000 | 52,512,000 | |||||||||||
|
| |||||||||||||
| Materials 4.4% | ||||||||||||||
| Air Products and Chemicals Inc. | United States | 500,000 | 79,515,000 | |||||||||||
| Albemarle Corp. | United States | 550,000 | 51,007,000 | |||||||||||
a | Axalta Coating Systems Ltd. | United States | 3,400,000 | 102,646,000 | ||||||||||
| Celanese Corp., A | United States | 1,250,000 | 125,262,500 | |||||||||||
| Ecolab Inc. | United States | 920,000 | 126,104,400 | |||||||||||
| Martin Marietta Materials Inc. | United States | 400,000 | 82,920,000 | |||||||||||
| Praxair Inc. | United States | 575,000 | 82,972,500 | |||||||||||
|
| |||||||||||||
| 650,427,400 | ||||||||||||||
|
| |||||||||||||
| Media 1.6% | ||||||||||||||
| Cable One Inc. | United States | 80,000 | 54,968,800 | |||||||||||
| Comcast Corp., A | United States | 110,000 | 3,758,700 | |||||||||||
| The Walt Disney Co. | United States | 1,724,290 | 173,187,688 | |||||||||||
|
| |||||||||||||
| 231,915,188 | ||||||||||||||
|
|
| franklintempleton.com | Semiannual Report | 49 |
FRANKLIN CUSTODIAN FUNDS
STATEMENT OF INVESTMENTS (UNAUDITED)
Franklin Growth Fund (continued)
| Country | Shares | Value | ||||||||||||
Common Stocks (continued) | ||||||||||||||
| Pharmaceuticals, Biotechnology & Life Sciences 12.0% | ||||||||||||||
| AbbVie Inc. | United States | 460,000 | $ | 43,539,000 | ||||||||||
| Agilent Technologies Inc. | United States | 1,300,000 | 86,970,000 | |||||||||||
| Allergan PLC | United States | 200,000 | 33,658,000 | |||||||||||
| Amgen Inc. | United States | 1,000,000 | 170,480,000 | |||||||||||
a | Biogen Inc. | United States | 500,000 | 136,910,000 | ||||||||||
a | Catalent Inc. | United States | 3,400,000 | 139,604,000 | ||||||||||
a | Celgene Corp. | United States | 1,300,000 | 115,973,000 | ||||||||||
| Eli Lilly & Co. | United States | 1,450,000 | 112,186,500 | |||||||||||
| Gilead Sciences Inc. | United States | 650,000 | 49,003,500 | |||||||||||
a | Illumina Inc. | United States | 525,000 | 124,120,500 | ||||||||||
| Johnson & Johnson | United States | 1,200,100 | 153,792,815 | |||||||||||
| Merck & Co. Inc. | United States | 1,000,000 | 54,470,000 | |||||||||||
a | Mettler-Toledo International Inc. | United States | 425,000 | 244,387,750 | ||||||||||
a | Neurocrine Biosciences Inc. | United States | 500,000 | 41,465,000 | ||||||||||
| Pfizer Inc. | United States | 2,761,000 | 97,987,890 | |||||||||||
| Roche Holding AG, ADR | Switzerland | 1,700,000 | 48,662,500 | |||||||||||
a | Waters Corp. | United States | 625,000 | 124,156,250 | ||||||||||
|
| |||||||||||||
| 1,777,366,705 | ||||||||||||||
|
| |||||||||||||
| Real Estate 1.7% | ||||||||||||||
| American Tower Corp. | United States | 900,000 | 130,806,000 | |||||||||||
| Equinix Inc. | United States | 300,000 | 125,442,000 | |||||||||||
|
| |||||||||||||
| 256,248,000 | ||||||||||||||
|
| |||||||||||||
| Retailing 3.7% | ||||||||||||||
a | Amazon.com Inc. | United States | 350,000 | 506,569,000 | ||||||||||
| Expedia Group Inc. | United States | 350,000 | 38,643,500 | |||||||||||
| Lowe’s Cos. Inc. | United States | 60,000 | 5,265,000 | |||||||||||
|
| |||||||||||||
| 550,477,500 | ||||||||||||||
|
| |||||||||||||
| Semiconductors & Semiconductor Equipment 2.5% | ||||||||||||||
| ASML Holding NV, N.Y. shs | Netherlands | 650,000 | 129,064,000 | |||||||||||
| Intel Corp. | United States | 1,100,000 | 57,288,000 | |||||||||||
| Lam Research Corp. | United States | 30,000 | 6,094,800 | |||||||||||
| Monolithic Power Systems | United States | 200,000 | 23,154,000 | |||||||||||
| Texas Instruments Inc. | United States | 1,400,000 | 145,446,000 | |||||||||||
| Versum Materials Inc. | United States | 250,000 | 9,407,500 | |||||||||||
|
| |||||||||||||
| 370,454,300 | ||||||||||||||
|
| |||||||||||||
| Software & Services 15.2% | ||||||||||||||
a | Alibaba Group Holding Ltd., ADR | China | 480,400 | 88,172,616 | ||||||||||
a | Alphabet Inc., A | United States | 165,000 | 171,128,100 | ||||||||||
a | Alphabet Inc., C | United States | 158,432 | 163,468,553 | ||||||||||
a | Autodesk Inc. | United States | 800,000 | 100,464,000 | ||||||||||
| Automatic Data Processing Inc. | United States | 700,000 | 79,436,000 | |||||||||||
| CDK Global LLC | United States | 233,333 | 14,779,312 | |||||||||||
| CSRA Inc. | United States | 2,300,000 | 94,829,000 | |||||||||||
| DXC Technology Co. | United States | 1,400,000 | 140,742,000 | |||||||||||
a | Electronic Arts Inc. | United States | 300,000 | 36,372,000 | ||||||||||
a | Facebook Inc., A | United States | 750,000 | 119,842,500 | ||||||||||
a | IAC/InterActiveCorp. | United States | 300,000 | 46,914,000 | ||||||||||
| Intuit Inc. | United States | 1,000,000 | 173,350,000 | |||||||||||
| Mastercard Inc., A | United States | 1,400,000 | 245,224,000 | |||||||||||
| Microsoft Corp. | United States | 3,400,000 | 310,318,000 |
| 50 | Semiannual Report | franklintempleton.com |
FRANKLIN CUSTODIAN FUNDS
STATEMENT OF INVESTMENTS (UNAUDITED)
Franklin Growth Fund (continued)
| Country | Shares | Value | ||||||||||||
| Common Stocks (continued) | ||||||||||||||
| Software & Services (continued) | ||||||||||||||
| Oracle Corp. | United States | 1,400,000 | $ | 64,050,000 | ||||||||||
a | Salesforce.com Inc. | United States | 300,000 | 34,890,000 | ||||||||||
a | ServiceNow Inc. | United States | 1,000,000 | 165,450,000 | ||||||||||
a | Tyler Technologies Inc. | United States | 175,000 | 36,918,000 | ||||||||||
| Visa Inc., A | United States | 1,400,000 | 167,468,000 | |||||||||||
|
| |||||||||||||
| 2,253,816,081 | ||||||||||||||
|
| |||||||||||||
| Technology Hardware & Equipment 8.0% | ||||||||||||||
| Apple Inc. | United States | 4,086,000 | 685,549,080 | |||||||||||
| Cisco Systems Inc. | United States | 2,945,000 | 126,311,050 | |||||||||||
| Cognex Corp. | United States | 650,000 | 33,793,500 | |||||||||||
a | Keysight Technologies Inc. | United States | 650,000 | 34,053,500 | ||||||||||
| TE Connectivity Ltd. | United States | 1,650,000 | 164,835,000 | |||||||||||
a | Trimble Inc. | United States | 2,700,000 | 96,876,000 | ||||||||||
a | ViaSat Inc. | United States | 700,000 | 46,004,000 | ||||||||||
|
| |||||||||||||
| 1,187,422,130 | ||||||||||||||
|
| |||||||||||||
| Transportation 5.6% | ||||||||||||||
| Alaska Air Group Inc. | United States | 3,200,000 | 198,272,000 | |||||||||||
| Allegiant Travel Co. | United States | 200,000 | 34,510,000 | |||||||||||
| Canadian National Railway Co. | Canada | 1,000,000 | 73,130,000 | |||||||||||
| Canadian Pacific Railway Ltd. | Canada | 500,000 | 88,250,000 | |||||||||||
| J.B. Hunt Transport Services Inc. | United States | 500,000 | 58,575,000 | |||||||||||
| Kansas City Southern | United States | 750,000 | 82,387,500 | |||||||||||
a | Ryanair Holdings PLC, ADR | Ireland | 233,220 | 28,651,077 | ||||||||||
| Union Pacific Corp. | United States | 2,030,000 | 272,892,900 | |||||||||||
|
| |||||||||||||
| 836,668,477 | ||||||||||||||
|
| |||||||||||||
| Utilities 0.9% | ||||||||||||||
| American Water Works Co. Inc. | United States | 700,000 | 57,491,000 | |||||||||||
| NextEra Energy Inc. | United States | 500,000 | 81,665,000 | |||||||||||
|
| |||||||||||||
| 139,156,000 | ||||||||||||||
|
| |||||||||||||
| Total Common Stocks (Cost $5,327,057,694) | 14,446,567,051 | |||||||||||||
|
| |||||||||||||
| Management Investment Companies (Cost $10,148,164) 0.9% | ||||||||||||||
| Diversified Financials 0.9% | ||||||||||||||
a | Altaba Inc. | United States | 1,700,000 | 125,868,000 | ||||||||||
|
| |||||||||||||
| Total Investments before Short Term Investments (Cost $5,337,205,858) | 14,572,435,051 | |||||||||||||
|
|
| franklintempleton.com | Semiannual Report | 51 |
FRANKLIN CUSTODIAN FUNDS
STATEMENT OF INVESTMENTS (UNAUDITED)
Franklin Growth Fund (continued)
| Country | Shares | Value | ||||||||||||
| Short Term Investments (Cost $252,178,231) 1.7% | ||||||||||||||
| Money Market Funds 1.7% | ||||||||||||||
b,c | Institutional Fiduciary Trust Money Market Portfolio, 1.24% | United States | 252,178,231 | $ | 252,178,231 | |||||||||
|
| |||||||||||||
| Total Investments (Cost $5,589,384,089) 100.2% | 14,824,613,282 | |||||||||||||
| Other Assets, less Liabilities (0.2)% | (25,062,653 | ) | ||||||||||||
|
| |||||||||||||
| Net Assets 100.0% | $ | 14,799,550,629 | ||||||||||||
|
| |||||||||||||
See Abbreviations on page 120.
aNon-income producing.
bSee Note 3(f) regarding investments in affiliated management investment companies.
cThe rate shown is the annualized seven-day effective yield at period end.
| 52 | Semiannual Report | The accompanying notes are an integral part of these financial statements. | franklintempleton.com |
FRANKLIN CUSTODIAN FUNDS
Financial Highlights
Franklin Income Fund
| Six Months Ended | ||||||||||||||||||||||||
| March 31, 2018 | Year Ended September 30, | |||||||||||||||||||||||
| (unaudited) | 2017 | 2016 | 2015 | 2014 | 2013 | |||||||||||||||||||
Class A | ||||||||||||||||||||||||
Per share operating performance | ||||||||||||||||||||||||
(for a share outstanding throughout the period) | ||||||||||||||||||||||||
Net asset value, beginning of period | $ 2.39 | $ 2.25 | $ 2.10 | $ 2.48 | $ 2.33 | $ 2.23 | ||||||||||||||||||
Income from investment operationsa: | ||||||||||||||||||||||||
Net investment incomeb | 0.05 | 0.10 | 0.10 | 0.10 | 0.11 | 0.11 | ||||||||||||||||||
Net realized and unrealized gains (losses) | (0.09 | ) | 0.16 | 0.17 | (0.36 | ) | 0.16 | 0.12 | ||||||||||||||||
Total from investment operations | (0.04 | ) | 0.26 | 0.27 | (0.26 | ) | 0.27 | 0.23 | ||||||||||||||||
Less distributions from net investment income | (0.06 | ) | (0.12 | ) | (0.12 | ) | (0.12 | ) | (0.12 | ) | (0.13 | ) | ||||||||||||
Net asset value, end of period | $ 2.29 | $ 2.39 | $ 2.25 | $ 2.10 | $ 2.48 | $ 2.33 | ||||||||||||||||||
Total returnc | (1.73)% | 11.86% | 13.31% | (10.93)% | 11.86% | 10.72% | ||||||||||||||||||
Ratios to average net assetsd | ||||||||||||||||||||||||
Expenses before waiver and payments by affiliates | 0.60% | 0.62% | 0.61% | 0.61% | 0.61% | 0.62% | ||||||||||||||||||
Expenses net of waiver and payments by affiliatese | 0.60% | f | 0.61% | 0.61% | f | 0.61% | f | 0.61% | f | 0.62% | ||||||||||||||
Net investment income | 3.90% | 4.22% | 4.57% | 4.43% | 4.28% | 4.98% | ||||||||||||||||||
Supplemental data | ||||||||||||||||||||||||
Net assets, end of period (000’s) | $43,544,927 | $46,505,632 | $45,515,127 | $44,886,127 | $53,823,921 | $48,320,611 | ||||||||||||||||||
Portfolio turnover rate | 25.78% | 34.12% | 61.26% | 44.81% | 36.03% | 37.60% | ||||||||||||||||||
aThe amount shown for a share outstanding throughout the period may not correlate with the Statement of Operations for the period due to the timing of sales and repurchases of the Fund’s shares in relation to income earned and/or fluctuating fair value of the investments of the Fund.
bBased on average daily shares outstanding.
cTotal return does not reflect sales commissions or contingent deferred sales charges, if applicable, and is not annualized for periods less than one year. dRatios are annualized for periods less than one year.
eBenefit of expense reduction rounds to less than 0.01%.
fBenefit of waiver and payments by affiliates rounds to less than 0.01%.
| franklintempleton.com | The accompanying notes are an integral part of these financial statements. | Semiannual Report | 53 |
FRANKLIN CUSTODIAN FUNDS
FINANCIAL HIGHLIGHTS
Franklin Income Fund (continued)
| Period Ended March 31, 2018 (unaudited)a | ||||
Class M | ||||
Per share operating performance | ||||
(for a share outstanding throughout the period) | ||||
Net asset value, beginning of period | $2.43 | |||
Income from investment operationsb: | ||||
Net investment incomec | 0.01 | |||
Net realized and unrealized gains (losses) | (0.13) | |||
Total from investment operations | (0.12) | |||
Less distributions from net investment income | (0.02) | |||
Net asset value, end of period | $2.29 | |||
Total returnd | (5.35)% | |||
Ratios to average net assetse | ||||
Expensesf | 0.45% | |||
Net investment income | 4.05% | |||
Supplemental data | ||||
Net assets, end of period (000’s) | $5 | |||
Portfolio turnover rate | 25.78% | |||
aFor the period January 25, 2018 (effective date) to March 31, 2018.
bThe amount shown for a share outstanding throughout the period may not correlate with the Statement of Operations for the period due to the timing of sales and repurchases of the Fund’s shares in relation to income earned and/or fluctuating fair value of the investments of the Fund.
cBased on average daily shares outstanding.
dTotal return does not reflect sales commissions or contingent deferred sales charges, if applicable, and is not annualized for periods less than one year.
eRatios are annualized for periods less than one year.
fBenefit of waiver and payments by affiliates and expense reduction rounds to less than 0.01%.
| 54 | Semiannual Report | The accompanying notes are an integral part of these financial statements. | franklintempleton.com |
FRANKLIN CUSTODIAN FUNDS
FINANCIAL HIGHLIGHTS
Franklin Income Fund (continued)
| Six Months Ended | ||||||||||||||||||||||||
| March 31, 2018 | Year Ended September 30, | |||||||||||||||||||||||
| (unaudited) | 2017 | 2016 | 2015 | 2014 | 2013 | |||||||||||||||||||
Class C | ||||||||||||||||||||||||
Per share operating performance | ||||||||||||||||||||||||
(for a share outstanding throughout the period) | ||||||||||||||||||||||||
Net asset value, beginning of period | $2.42 | $2.27 | $2.13 | $2.50 | $2.35 | $2.25 | ||||||||||||||||||
Income from investment operationsa: | ||||||||||||||||||||||||
Net investment incomeb | 0.04 | 0.09 | 0.09 | 0.09 | 0.09 | 0.10 | ||||||||||||||||||
Net realized and unrealized gains (losses) | (0.09 | ) | 0.17 | 0.16 | (0.35 | ) | 0.17 | 0.12 | ||||||||||||||||
Total from investment operations | (0.05 | ) | 0.26 | 0.25 | (0.26 | ) | 0.26 | 0.22 | ||||||||||||||||
Less distributions from net investment income | (0.05 | ) | (0.11 | ) | (0.11 | ) | (0.11 | ) | (0.11 | ) | (0.12 | ) | ||||||||||||
Net asset value, end of period | $2.32 | $2.42 | $2.27 | $2.13 | $2.50 | $2.35 | ||||||||||||||||||
Total returnc | (2.39)% | 11.63% | 12.07% | (10.89)% | 11.19% | 10.07% | ||||||||||||||||||
Ratios to average net assetsd | ||||||||||||||||||||||||
Expenses before waiver and payments by affiliates | 1.10% | 1.12% | 1.11% | 1.11% | 1.11% | 1.12% | ||||||||||||||||||
Expenses net of waiver and payments by affiliatese | 1.10% | f | 1.11% | 1.11% | f | 1.11% | f | 1.11% | f | 1.12% | ||||||||||||||
Net investment income | 3.40% | 3.72% | 4.07% | 3.93% | 3.78% | 4.48% | ||||||||||||||||||
Supplemental data | ||||||||||||||||||||||||
Net assets, end of period (000’s) | $20,981,302 | $23,036,875 | $23,841,466 | $24,091,638 | $28,802,209 | $24,016,797 | ||||||||||||||||||
Portfolio turnover rate | 25.78% | 34.12% | 61.26% | 44.81% | 36.03% | 37.60% | ||||||||||||||||||
aThe amount shown for a share outstanding throughout the period may not correlate with the Statement of Operations for the period due to the timing of sales and repurchases of the Fund’s shares in relation to income earned and/or fluctuating fair value of the investments of the Fund.
bBased on average daily shares outstanding.
cTotal return does not reflect sales commissions or contingent deferred sales charges, if applicable, and is not annualized for periods less than one year.
dRatios are annualized for periods less than one year.
eBenefit of expense reduction rounds to less than 0.01%.
fBenefit of waiver and payments by affiliates rounds to less than 0.01%.
| franklintempleton.com | The accompanying notes are an integral part of these financial statements. | Semiannual Report | 55 |
FRANKLIN CUSTODIAN FUNDS
FINANCIAL HIGHLIGHTS
Franklin Income Fund (continued)
Six Months Ended March 31, 2018 | Year Ended September 30, | |||||||||||||||||||||||
| (unaudited) | 2017 | 2016 | 2015 | 2014 | 2013 | |||||||||||||||||||
Class R | ||||||||||||||||||||||||
Per share operating performance (for a share outstanding throughout the period) | ||||||||||||||||||||||||
Net asset value, beginning of period | $ 2.35 | $ 2.21 | $ 2.07 | $ 2.44 | $ 2.29 | $ 2.20 | ||||||||||||||||||
Income from investment operationsa: | ||||||||||||||||||||||||
Net investment incomeb | 0.04 | 0.09 | 0.09 | 0.10 | 0.10 | 0.11 | ||||||||||||||||||
Net realized and unrealized gains (losses) | (0.09 | ) | 0.16 | 0.16 | (0.36 | ) | 0.16 | 0.10 | ||||||||||||||||
Total from investment operations | (0.05 | ) | 0.25 | 0.25 | (0.26 | ) | 0.26 | 0.21 | ||||||||||||||||
Less distributions from net investment income | (0.06 | ) | (0.11 | ) | (0.11 | ) | (0.11 | ) | (0.11 | ) | (0.12 | ) | ||||||||||||
Net asset value, end of period | $ 2.24 | $ 2.35 | $ 2.21 | $ 2.07 | $ 2.44 | $ 2.29 | ||||||||||||||||||
Total returnc | (2.37)% | 11.67% | 12.62% | (10.99)% | 11.66% | 10.03% | ||||||||||||||||||
Ratios to average net assetsd | ||||||||||||||||||||||||
Expenses before waiver and payments by affiliates | 0.95% | 0.97% | 0.96% | 0.96% | 0.96% | 0.97% | ||||||||||||||||||
Expenses net of waiver and payments by affiliatese | 0.95% | f | 0.96% | 0.96% | f | 0.96% | f | 0.96% | f | 0.97% | ||||||||||||||
Net investment income | 3.55% | 3.87% | 4.22% | 4.08% | 3.93% | 4.63% | ||||||||||||||||||
Supplemental data | ||||||||||||||||||||||||
Net assets, end of period (000’s) | $308,864 | $361,603 | $396,107 | $416,653 | $514,892 | $446,463 | ||||||||||||||||||
Portfolio turnover rate | 25.78% | 34.12% | 61.26% | 44.81% | 36.03% | 37.60% | ||||||||||||||||||
aThe amount shown for a share outstanding throughout the period may not correlate with the Statement of Operations for the period due to the timing of sales and repurchases of the Fund’s shares in relation to income earned and/or fluctuating fair value of the investments of the Fund.
bBased on average daily shares outstanding.
cTotal return is not annualized for periods less than one year.
dRatios are annualized for periods less than one year.
eBenefit of expense reduction rounds to less than 0.01%.
fBenefit of waiver and payments by affiliates rounds to less than 0.01%.
| 56 | Semiannual Report | The accompanying notes are an integral part of these financial statements. | franklintempleton.com |
FRANKLIN CUSTODIAN FUNDS
FINANCIAL HIGHLIGHTS
Franklin Income Fund (continued)
Six Months Ended March 31, 2018 | Year Ended September 30, | |||||||||||||||||||||||
| (unaudited) | 2017 | 2016 | 2015 | 2014 | 2013a | |||||||||||||||||||
Class R6 | ||||||||||||||||||||||||
Per share operating performance (for a share outstanding throughout the period) | ||||||||||||||||||||||||
Net asset value, beginning of period | $ 2.37 | $ 2.23 | $ 2.09 | $ 2.46 | $ 2.31 | $ 2.33 | ||||||||||||||||||
Income from investment operationsb: | ||||||||||||||||||||||||
Net investment incomec | 0.05 | 0.11 | 0.10 | 0.11 | 0.11 | 0.04 | ||||||||||||||||||
Net realized and unrealized gains (losses) | (0.09 | ) | 0.15 | 0.16 | (0.35 | ) | 0.17 | (0.02 | ) | |||||||||||||||
Total from investment operations | (0.04 | ) | 0.26 | 0.26 | (0.24 | ) | 0.28 | 0.02 | ||||||||||||||||
Less distributions from net investment income | (0.06 | ) | (0.12 | ) | (0.12 | ) | (0.13 | ) | (0.13 | ) | (0.04 | ) | ||||||||||||
Net asset value, end of period | $ 2.27 | $ 2.37 | $ 2.23 | $ 2.09 | $ 2.46 | $ 2.31 | ||||||||||||||||||
Total returnd | (1.65)% | 12.15% | 13.15% | (10.39)% | 12.19% | 1.06% | ||||||||||||||||||
Ratios to average net assetse | ||||||||||||||||||||||||
Expenses before waiver and payments by affiliates | 0.40% | 0.39% | 0.38% | 0.38% | 0.38% | 0.39% | ||||||||||||||||||
Expenses net of waiver and payments by affiliatesf | 0.40% | g | 0.38% | 0.38% | g | 0.38% | g | 0.38% | g | 0.39% | ||||||||||||||
Net investment income | 4.10% | 4.45% | 4.80% | 4.66% | 4.50% | 5.21% | ||||||||||||||||||
Supplemental data | ||||||||||||||||||||||||
Net assets, end of period (000’s) | $2,099,137 | $1,815,977 | $1,737,577 | $1,744,718 | $2,108,076 | $1,921,084 | ||||||||||||||||||
Portfolio turnover rate | 25.78% | 34.12% | 61.26% | 44.81% | 36.03% | 37.60% | ||||||||||||||||||
aFor the period May 1, 2013 (effective date) to September 30, 2013.
bThe amount shown for a share outstanding throughout the period may not correlate with the Statement of Operations for the period due to the timing of sales and repurchases of the Fund’s shares in relation to income earned and/or fluctuating fair value of the investments of the Fund.
cBased on average daily shares outstanding.
dTotal return is not annualized for periods less than one year.
eRatios are annualized for periods less than one year.
fBenefit of expense reduction rounds to less than 0.01%.
gBenefit of waiver and payments by affiliates rounds to less than 0.01%.
| franklintempleton.com | The accompanying notes are an integral part of these financial statements. | Semiannual Report | 57 |
FRANKLIN CUSTODIAN FUNDS
FINANCIAL HIGHLIGHTS
Franklin Income Fund (continued)
Six Months Ended March 31, 2018 | Year Ended September 30, | |||||||||||||||||||||||
| (unaudited) | 2017 | 2016 | 2015 | 2014 | 2013 | |||||||||||||||||||
Advisor Class | ||||||||||||||||||||||||
Per share operating performance (for a share outstanding throughout the period) | ||||||||||||||||||||||||
Net asset value, beginning of period | $ 2.37 | $ 2.23 | $ 2.09 | $ 2.46 | $ 2.31 | $ 2.22 | ||||||||||||||||||
Income from investment operationsa: | ||||||||||||||||||||||||
Net investment incomeb | 0.05 | 0.10 | 0.10 | 0.11 | 0.11 | 0.12 | ||||||||||||||||||
Net realized and unrealized gains (losses) | (0.09 | ) | 0.16 | 0.16 | (0.36 | ) | 0.17 | 0.11 | ||||||||||||||||
Total from investment operations | (0.04 | ) | 0.26 | 0.26 | (0.25 | ) | 0.28 | 0.23 | ||||||||||||||||
Less distributions from net investment income | (0.06 | ) | (0.12 | ) | (0.12 | ) | (0.12 | ) | (0.13 | ) | (0.14 | ) | ||||||||||||
Net asset value, end of period | $ 2.27 | �� | $ 2.37 | $ 2.23 | $ 2.09 | $ 2.46 | $ 2.31 | |||||||||||||||||
Total returnc | (1.67)% | 12.09% | 13.06% | (10.46)% | 12.12% | 10.49% | ||||||||||||||||||
Ratios to average net assetsd | ||||||||||||||||||||||||
Expenses before waiver and payments by affiliates | 0.45% | 0.47% | 0.46% | 0.46% | 0.46% | 0.47% | ||||||||||||||||||
Expenses net of waiver and payments by affiliatese | 0.45% | f | 0.46% | 0.46% | f | 0.46% | f | 0.46% | f | 0.47% | ||||||||||||||
Net investment income | 4.05% | 4.37% | 4.72% | 4.58% | 4.43% | 5.13% | ||||||||||||||||||
Supplemental data | ||||||||||||||||||||||||
Net assets, end of period (000’s) | $10,984,006 | $11,671,173 | $8,143,479 | $7,754,475 | $9,096,269 | $5,903,701 | ||||||||||||||||||
Portfolio turnover rate | 25.78% | 34.12% | 61.26% | 44.81% | 36.03% | 37.60% | ||||||||||||||||||
aThe amount shown for a share outstanding throughout the period may not correlate with the Statement of Operations for the period due to the timing of sales and repurchases of the Fund’s shares in relation to income earned and/or fluctuating fair value of the investments of the Fund.
bBased on average daily shares outstanding.
cTotal return is not annualized for periods less than one year.
dRatios are annualized for periods less than one year.
eBenefit of expense reduction rounds to less than 0.01%.
fBenefit of waiver and payments by affiliates rounds to less than 0.01%.
| 58 | Semiannual Report | The accompanying notes are an integral part of these financial statements. | franklintempleton.com |
FRANKLIN CUSTODIAN FUNDS
Statement of Investments, March 31, 2018 (unaudited)
Franklin Income Fund
| Country | Shares | Value | ||||||||||||
| ||||||||||||||
| Common Stocks 39.5% | ||||||||||||||
| Consumer Discretionary 2.3% | ||||||||||||||
| Comcast Corp., A | United States | 1,000,000 | $ | 34,170,000 | ||||||||||
| Daimler AG | Germany | 8,000,000 | 679,795,884 | |||||||||||
a | Ford Motor Co. | United States | 39,738,498 | 440,302,558 | ||||||||||
| General Motors Co. | United States | 10,780,000 | 391,745,200 | |||||||||||
| Target Corp. | United States | 4,000,000 | 277,720,000 | |||||||||||
|
| |||||||||||||
| 1,823,733,642 | ||||||||||||||
|
| |||||||||||||
| Consumer Staples 3.6% | ||||||||||||||
| Anheuser-Busch InBev SA/NV, ADR | Belgium | 3,500,000 | 384,790,000 | |||||||||||
| The Coca-Cola Co. | United States | 12,000,000 | 521,160,000 | |||||||||||
| Nestle SA | Switzerland | 5,000,000 | 396,455,908 | |||||||||||
| PepsiCo Inc. | United States | 5,500,000 | 600,325,000 | |||||||||||
| Philip Morris International Inc. | United States | 5,500,000 | 546,700,000 | |||||||||||
| The Procter & Gamble Co. | United States | 4,000,000 | 317,120,000 | |||||||||||
|
| |||||||||||||
| 2,766,550,908 | ||||||||||||||
|
| |||||||||||||
| Energy 5.2% | ||||||||||||||
a | Anadarko Petroleum Corp. | United States | 3,000,000 | 181,230,000 | ||||||||||
| Baker Hughes a GE Co., A | United States | 9,500,000 | 263,815,000 | |||||||||||
a | BP PLC, ADR | United Kingdom | 9,000,000 | 364,860,000 | ||||||||||
a | Chevron Corp. | United States | 5,000,000 | 570,200,000 | ||||||||||
| Exxon Mobil Corp. | United States | 5,000,000 | 373,050,000 | |||||||||||
b | Halcon Resources Corp. | United States | 5,341,485 | 26,013,032 | ||||||||||
b | HighPoint Resources Corp. | United States | 6,540,000 | 33,223,200 | ||||||||||
| Occidental Petroleum Corp. | United States | 4,000,000 | 259,840,000 | |||||||||||
b | PetroQuest Energy Inc. | United States | 1,000,000 | 580,700 | ||||||||||
| Royal Dutch Shell PLC, A, ADR | United Kingdom | 22,189,194 | 1,415,892,469 | |||||||||||
b,c | Stone Energy Corp. | United States | 6,151,402 | 228,217,014 | ||||||||||
| TransCanada Corp. | Canada | 2,500,000 | 103,275,000 | |||||||||||
b | Weatherford International PLC | United States | 41,450,000 | 94,920,500 | ||||||||||
| The Williams Cos. Inc. | United States | 5,000,000 | 124,300,000 | |||||||||||
|
| |||||||||||||
| 4,039,416,915 | ||||||||||||||
|
| |||||||||||||
| Financials 6.2% | ||||||||||||||
| AXA SA | France | 22,000,000 | 585,470,139 | |||||||||||
| Bank of America Corp. | United States | 15,000,000 | 449,850,000 | |||||||||||
| HSBC Holdings PLC | United Kingdom | 45,000,000 | 420,130,219 | |||||||||||
| JPMorgan Chase & Co. | United States | 6,000,000 | 659,820,000 | |||||||||||
| MetLife Inc. | United States | 12,500,000 | 573,625,000 | |||||||||||
| U.S. Bancorp | United States | 8,200,000 | 414,100,000 | |||||||||||
a | Wells Fargo & Co. | United States | 33,520,000 | 1,756,783,200 | ||||||||||
|
| |||||||||||||
| 4,859,778,558 | ||||||||||||||
|
| |||||||||||||
| Health Care 6.3% | ||||||||||||||
| AstraZeneca PLC | United Kingdom | 12,000,000 | 824,265,098 | |||||||||||
| Eli Lilly & Co. | United States | 7,380,703 | 571,044,991 | |||||||||||
| Medtronic PLC | United States | 3,843,098 | 308,293,322 | |||||||||||
| Merck & Co. Inc. | United States | 20,000,000 | 1,089,400,000 | |||||||||||
| Pfizer Inc. | United States | 25,000,000 | 887,250,000 | |||||||||||
| Roche Holding AG | Switzerland | 2,297,022 | 527,710,517 | |||||||||||
| Sanofi, ADR | France | 18,000,000 | 721,440,000 | |||||||||||
|
| |||||||||||||
| 4,929,403,928 | ||||||||||||||
|
| |||||||||||||
| franklintempleton.com | Semiannual Report | 59 |
FRANKLIN CUSTODIAN FUNDS
STATEMENT OF INVESTMENTS (UNAUDITED)
Franklin Income Fund (continued)
| Country | Shares | Value | ||||||||||||
| ||||||||||||||
| Common Stocks (continued) | ||||||||||||||
| Industrials 2.5% | ||||||||||||||
b,c | CEVA Holdings LLC | United States | 81,371 | $ | 49,636,347 | |||||||||
| Cummins Inc. | United States | 1,760,706 | 285,392,835 | |||||||||||
| General Electric Co. | United States | 106,714,131 | 1,438,506,486 | |||||||||||
| Republic Services Inc. | United States | 2,000,000 | 132,460,000 | |||||||||||
|
| |||||||||||||
| 1,905,995,668 | ||||||||||||||
|
| |||||||||||||
| Information Technology 1.6% | ||||||||||||||
| Analog Devices Inc. | United States | 2,500,000 | 227,825,000 | |||||||||||
| Apple Inc. | United States | 808,000 | 135,566,240 | |||||||||||
a | Intel Corp. | United States | 1,000,000 | 52,080,000 | ||||||||||
a | Microsoft Corp. | United States | 6,142,000 | 560,580,340 | ||||||||||
| Texas Instruments Inc. | United States | 2,500,000 | 259,725,000 | |||||||||||
|
| |||||||||||||
| 1,235,776,580 | ||||||||||||||
|
| |||||||||||||
| Materials 3.2% | ||||||||||||||
| BASF SE | Germany | 12,000,000 | 1,219,285,919 | |||||||||||
| DowDuPont Inc. | United States | 12,500,000 | 796,375,000 | |||||||||||
| Rio Tinto PLC, ADR | United Kingdom | 8,910,000 | 459,132,300 | |||||||||||
|
| |||||||||||||
| 2,474,793,219 | ||||||||||||||
|
| |||||||||||||
| Real Estate 0.8% | ||||||||||||||
| Equity Residential | United States | 1,600,000 | 98,592,000 | |||||||||||
| Host Hotels & Resorts Inc. | United States | 30,000,000 | 559,200,000 | |||||||||||
|
| |||||||||||||
| 657,792,000 | ||||||||||||||
|
| |||||||||||||
| Telecommunication Services 1.3% | ||||||||||||||
| BCE Inc. | Canada | 6,000,000 | 257,910,448 | |||||||||||
| Verizon Communications Inc. | United States | 16,000,000 | 765,120,000 | |||||||||||
|
| |||||||||||||
| 1,023,030,448 | ||||||||||||||
|
| |||||||||||||
| Utilities 6.5% | ||||||||||||||
| Dominion Energy Inc. | United States | 20,000,000 | 1,348,600,000 | |||||||||||
| Duke Energy Corp. | United States | 9,000,000 | 697,230,000 | |||||||||||
| Great Plains Energy Inc. | United States | 4,000,000 | 127,160,000 | |||||||||||
| Sempra Energy | United States | 11,000,000 | 1,223,420,000 | |||||||||||
| The Southern Co. | United States | 30,000,000 | 1,339,800,000 | |||||||||||
| Xcel Energy Inc. | United States | 6,500,000 | 295,620,000 | |||||||||||
|
| |||||||||||||
| 5,031,830,000 | ||||||||||||||
|
| |||||||||||||
| Total Common Stocks (Cost $28,295,658,833) | 30,748,101,866 | |||||||||||||
|
| |||||||||||||
d | Equity-Linked Securities 13.8% | |||||||||||||
| Consumer Discretionary 3.0% | ||||||||||||||
e | Citigroup Global Markets Holdings Inc. into Ford Motor Co., 9.00%, 144A | United States | 17,100,000 | 195,428,325 | ||||||||||
e | Credit Suisse AG London into Comcast Corp., 7.00%, 144A | United States | 6,204,000 | 220,729,486 | ||||||||||
e | Credit Suisse AG London into General Motors Co., 8.00%, 144A | United States | 5,680,000 | 218,251,171 | ||||||||||
e | Credit Suisse AG London into Newell Brands Inc., 7.00%, 144A | United States | 3,940,000 | 106,666,840 | ||||||||||
e | Goldman Sachs International into Target Corp., 8.00%, 144A | United States | 4,650,000 | 282,807,215 | ||||||||||
e | JP Morgan Chase Financial Co. LLC into Ford Motor Co., 10.00%, 144A | United States | 28,170,000 | 313,350,094 | ||||||||||
e | Merrill Lynch International & Co. CV into Ford Motor Co., 9.00%, 144A | United States | 26,270,000 | 293,888,374 | ||||||||||
e | Morgan Stanley BV into Target Corp., 8.00%, 144A | United States | 3,379,000 | 238,948,617 | ||||||||||
e | UBS AG London into General Motors Co., 8.00%, 144A | United States | 6,793,000 | 248,611,240 | ||||||||||
e | Wells Fargo Bank National Assn. into Target Corp., 8.00%, 144A | United States | 2,536,000 | 182,777,694 | ||||||||||
|
| |||||||||||||
| 2,301,459,056 | ||||||||||||||
|
| |||||||||||||
| 60 | Semiannual Report | franklintempleton.com |
FRANKLIN CUSTODIAN FUNDS
STATEMENT OF INVESTMENTS (UNAUDITED)
Franklin Income Fund (continued)
| Country | Shares | Value | ||||||||||||
| ||||||||||||||
d | Equity-Linked Securities (continued) | |||||||||||||
| Consumer Staples 0.3% | ||||||||||||||
e | Royal Bank of Canada into Anheuser-Busch Cos. Inc., 6.50%, 144A | Belgium | 2,100,000 | $ | 233,502,196 | |||||||||
|
| |||||||||||||
| Energy 1.6% | ||||||||||||||
e | Barclays Bank PLC into Halliburton Co., 7.00%, 144A | United States | 5,680,000 | 260,771,362 | ||||||||||
e | BNP Paribas Arbitrage Issuance BV into Anadarko Petroleum Corp., 8.50%, 144A | United States | 4,464,000 | 239,499,814 | ||||||||||
e | Deutsche Bank AG/London into Schlumberger Ltd., 6.00%, 144A | United States | 3,032,000 | 197,142,402 | ||||||||||
e | Morgan Stanley into Halliburton Co., 6.50%, 144A | United States | 6,305,000 | 271,373,246 | ||||||||||
e | Royal Bank of Canada into Anadarko Petroleum Corp., 8.50%, 144A | United States | 4,450,000 | 242,595,524 | ||||||||||
e | UBS AG London into Halliburton Co., 7.00%, 144A | United States | 1,400,000 | 67,713,216 | ||||||||||
|
| |||||||||||||
| 1,279,095,564 | ||||||||||||||
|
| |||||||||||||
| Financials 0.5% | ||||||||||||||
e | Deutsche Bank AG/London into Wells Fargo & Co., 7.00%, 144A | United States | 3,785,000 | 209,598,599 | ||||||||||
e | Royal Bank of Canada into U.S. Bancorp, 6.00%, 144A | United States | 3,680,000 | 189,126,582 | ||||||||||
|
| |||||||||||||
| 398,725,181 | ||||||||||||||
|
| |||||||||||||
| Health Care 1.3% | ||||||||||||||
e | Deutsche Bank AG/London into Medtronic PLC, 6.00%, 144A | United States | 1,858,000 | 148,730,447 | ||||||||||
e | Goldman Sachs International into Mylan NV, 7.50%, 144A | United States | 5,400,000 | 215,477,966 | ||||||||||
e | Merrill Lynch International & Co. CV into Merck & Co. Inc., 6.50%, 144A | United States | 4,125,000 | 232,026,502 | ||||||||||
e | UBS AG London into Medtronic PLC, 6.00%, 144A | United States | 2,442,000 | 197,962,291 | ||||||||||
e | Wells Fargo Bank National Assn. into Bristol-Myers Squibb Co., 7.00%, 144A | United States | 3,200,000 | 202,040,291 | ||||||||||
|
| |||||||||||||
| 996,237,497 | ||||||||||||||
|
| |||||||||||||
| Industrials 2.0% | ||||||||||||||
e | Citigroup Global Markets Holdings Inc. into Union Pacific Corp., 6.50%, 144A | United States | 2,284,000 | 276,121,017 | ||||||||||
e | Goldman Sachs International into Union Pacific Corp., 6.00%, 144A | United States | 1,450,000 | 165,903,364 | ||||||||||
e | Merrill Lynch International & Co. CV into Deere & Co., 7.00%, 144A | United States | 1,848,000 | 260,084,929 | ||||||||||
e | Merrill Lynch International & Co. CV into General Electric Co., 6.00%, 144A | United States | 8,932,000 | 123,846,565 | ||||||||||
e | Morgan Stanley BV into Cummins Inc., 7.50%, 144A | United States | 1,265,000 �� | 202,524,929 | ||||||||||
e | UBS AG London into Union Pacific Corp., 7.50%, 144A | United States | 2,130,000 | 292,008,143 | ||||||||||
e | Wells Fargo Bank National Assn. into General Electric Co., 8.00%, 144A | United States | 17,300,000 | 238,565,564 | ||||||||||
|
| |||||||||||||
| 1,559,054,511 | ||||||||||||||
|
| |||||||||||||
| Information Technology 3.7% | ||||||||||||||
e | Barclays Bank PLC into Alphabet Inc., 7.00%, 144A | United States | 182,000 | 192,393,297 | ||||||||||
e | Deutsche Bank AG/London into Applied Materials Inc., 8.00%, 144A | United States | 3,252,000 | 182,457,040 | ||||||||||
e | Deutsche Bank AG/London into Intel Corp., 7.00%, 144A | United States | 10,750,000 | 515,933,533 | ||||||||||
e | Goldman Sachs International into Apple Inc., 6.50%, 144A | United States | 2,883,000 | 487,817,092 | ||||||||||
e | Goldman Sachs International into Mylan NV, 6.00%, 144A | United States | 2,530,000 | 101,775,932 | ||||||||||
e | Merrill Lynch International & Co. CV into Cisco Systems Inc., 6.50%, 144A | United States | 11,110,000 | 385,720,346 | ||||||||||
e | Societe Generale SA into Intel Corp., 8.00%, 144A | United States | 4,322,000 | 220,445,590 | ||||||||||
e | UBS AG London into Broadcom Ltd., 8.00%, 144A | United States | 757,000 | 182,198,701 | ||||||||||
e | UBS AG London into Oracle Corp., 5.50%, 144A | United States | 3,799,000 | 176,909,298 | ||||||||||
e | Wells Fargo Bank National Assn. into Microsoft Corp., 7.00%, 144A | United States | 3,118,000 | 287,465,410 | ||||||||||
e | Wells Fargo Bank National Assn. into Oracle Corp., 6.00%, 144A | United States | 3,925,000 | 181,632,676 | ||||||||||
|
| |||||||||||||
| 2,914,748,915 | ||||||||||||||
|
| |||||||||||||
| Materials 1.4% | ||||||||||||||
e | Barclays Bank PLC into Rio Tinto PLC, 10.00%, 144A | United Kingdom | 4,752,000 | 247,010,267 | ||||||||||
e | The Goldman Sachs Group Inc. into Rio Tinto PLC, 11.00%, 144A | United Kingdom | 4,900,000 | 241,440,758 | ||||||||||
e | Royal Bank of Canada into Barrick Gold Corp., 7.50%, 144A | Canada | 7,936,000 | 100,795,572 | ||||||||||
| franklintempleton.com | Semiannual Report | 61 |
FRANKLIN CUSTODIAN FUNDS
STATEMENT OF INVESTMENTS (UNAUDITED)
Franklin Income Fund (continued)
| Country | Shares | Value | ||||||||||||||||
| ||||||||||||||||||
d | Equity-Linked Securities (continued) | |||||||||||||||||
| Materials (continued) | ||||||||||||||||||
e | UBS AG London into DowDuPont Inc., 6.00%, 144A | United States | 4,360,000 | $ | 284,245,012 | |||||||||||||
e | Wells Fargo Bank National Assn. into Rio Tinto PLC, 9.00%, 144A | United Kingdom | 4,238,000 | 212,149,855 | ||||||||||||||
|
| |||||||||||||||||
| 1,085,641,464 | ||||||||||||||||||
|
| |||||||||||||||||
| Total Equity-Linked Securities (Cost $11,010,297,650) | 10,768,464,384 | |||||||||||||||||
|
| |||||||||||||||||
| Convertible Preferred Stocks 2.1% | ||||||||||||||||||
| Energy 0.1% | ||||||||||||||||||
| Chesapeake Energy Corp., 5.75%, cvt. pfd. | United States | 95,150 | 54,711,250 | |||||||||||||||
|
| |||||||||||||||||
| Financials 1.4% | ||||||||||||||||||
| Bank of America Corp., 7.25%, cvt. pfd., L | United States | 570,218 | 735,267,600 | |||||||||||||||
b | FNMA, 5.375%, cvt. pfd. | United States | 4,250 | 76,500,000 | ||||||||||||||
| Wells Fargo & Co., 7.50%, cvt. pfd., A | United States | 235,097 | 303,275,130 | |||||||||||||||
|
| |||||||||||||||||
| 1,115,042,730 | ||||||||||||||||||
|
| |||||||||||||||||
| Health Care 0.2% | ||||||||||||||||||
| Becton Dickinson and Co., 6.125%, cvt. pfd., A | United States | 3,000,000 | 175,290,000 | |||||||||||||||
|
| |||||||||||||||||
| Industrials 0.1% | ||||||||||||||||||
b,c | CEVA Holdings LLC, cvt. pfd., A-1 | United States | 2,897 | 2,607,525 | ||||||||||||||
b,c | CEVA Holdings LLC, cvt. pfd., A-2 | United States | 110,565 | 67,444,699 | ||||||||||||||
|
| |||||||||||||||||
| 70,052,224 | ||||||||||||||||||
|
| |||||||||||||||||
| Real Estate 0.0%† | ||||||||||||||||||
| RLJ Lodging Trust, 1.95%, cvt. pfd. | United States | 95,293 | 2,418,536 | |||||||||||||||
|
| |||||||||||||||||
| Utilities 0.3% | ||||||||||||||||||
| NextEra Energy Inc., 6.371%, cvt. pfd. | United States | 3,650,000 | 265,811,250 | |||||||||||||||
|
| |||||||||||||||||
| Total Convertible Preferred Stocks (Cost $1,544,200,270) | 1,683,325,990 | |||||||||||||||||
|
| |||||||||||||||||
| Preferred Stocks 0.1% | ||||||||||||||||||
| Financials 0.1% | ||||||||||||||||||
b | FHLMC, 8.375%, pfd., Z | United States | 8,132,009 | 46,759,052 | ||||||||||||||
b | FNMA, 8.25%, pfd., S | United States | 6,000,000 | 34,500,000 | ||||||||||||||
| Morgan Stanley, 6.375%, pfd., I | United States | 60,000 | 1,627,200 | |||||||||||||||
|
| |||||||||||||||||
| Total Preferred Stocks (Cost $342,567,732) | 82,886,252 | |||||||||||||||||
|
| |||||||||||||||||
| Units | ||||||||||||||||||
f | Index-Linked Notes (Cost $100,005,322) 0.1% | |||||||||||||||||
| Financials 0.1% | ||||||||||||||||||
e,g | Morgan Stanley Finance LLC, senior note, 144A, 2.00%, 10/03/19 | United States | 755,000 | 99,214,550 | ||||||||||||||
|
| |||||||||||||||||
| Principal Amount* | ||||||||||||||||||
| Convertible Bonds 0.8% | ||||||||||||||||||
| Energy 0.4% | ||||||||||||||||||
| Chesapeake Energy Corp., cvt., senior note, 5.50%, 9/15/26 | United States | 140,000,000 | 120,873,340 | |||||||||||||||
| Weatherford International Ltd., cvt., senior note, 5.875%, 7/01/21 | United States | 238,500,000 | 214,396,474 | |||||||||||||||
|
| |||||||||||||||||
| 335,269,814 | ||||||||||||||||||
|
| |||||||||||||||||
| 62 | Semiannual Report | franklintempleton.com |
FRANKLIN CUSTODIAN FUNDS
STATEMENT OF INVESTMENTS (UNAUDITED)
Franklin Income Fund (continued)
| Country | | Principal Amount | * | Value | ||||||||||||||
| ||||||||||||||||||
| Convertible Bonds (continued) | ||||||||||||||||||
| Health Care 0.4% | ||||||||||||||||||
e | Bayer Capital Corp BV, cvt., junior sub. note, 144A, 5.625%, 11/22/19 | Germany | 180,000,000 | EUR | $ | 227,051,530 | ||||||||||||
| Impax Laboratories Inc., cvt., senior note, 2.00%, 6/15/22 | United States | 60,000,000 | 59,719,980 | |||||||||||||||
|
| |||||||||||||||||
| 286,771,510 | ||||||||||||||||||
|
| |||||||||||||||||
| Total Convertible Bonds (Cost $624,206,200) | 622,041,324 | |||||||||||||||||
|
| |||||||||||||||||
| Corporate Bonds 37.1% | ||||||||||||||||||
| Consumer Discretionary 4.7% | ||||||||||||||||||
e | 24 Hour Holdings III LLC, senior note, 144A, 8.00%, 6/01/22 | United States | 110,000,000 | 110,539,000 | ||||||||||||||
e | Altice Financing SA, secured bond, 144A, 7.50%, 5/15/26 | Luxembourg | 50,000,000 | 49,125,000 | ||||||||||||||
e | Altice Luxembourg SA, senior secured note, 144A, 7.75%, 5/15/22 | Luxembourg | 50,000,000 | 46,562,500 | ||||||||||||||
| AMC Entertainment Holdings Inc., | ||||||||||||||||||
senior sub. bond, 5.75%, 6/15/25 | United States | 43,325,000 | 42,837,594 | |||||||||||||||
senior sub. note, 5.875%, 11/15/26 | United States | 64,900,000 | 63,926,500 | |||||||||||||||
| CCO Holdings LLC/CCO Holdings Capital Corp., | ||||||||||||||||||
senior bond, 5.125%, 2/15/23. | United States | 105,000,000 | 105,945,000 | |||||||||||||||
senior bond, 5.75%, 9/01/23 | United States | 67,000,000 | 68,172,500 | |||||||||||||||
senior bond, 5.75%, 1/15/24 | United States | 105,000,000 | 106,837,500 | |||||||||||||||
e senior bond, 144A, 5.50%, 5/01/26 | United States | 50,000,000 | 49,062,500 | |||||||||||||||
e senior bond, 144A, 5.125%, 5/01/27 | United States | 50,000,000 | 47,595,000 | |||||||||||||||
e senior bond, 144A, 5.00%, 2/01/28 | United States | 65,500,000 | 61,733,750 | |||||||||||||||
e,h | Cequel Communications Holdings I LLC/Cequel Capital Corp., senior note, 144A, 7.50%, 4/01/28 | United States | 50,000,000 | 51,375,000 | ||||||||||||||
| Cinemark USA Inc., senior note, 5.125%, 12/15/22 | United States | 50,000,000 | 51,125,000 | |||||||||||||||
e | CSC Holdings LLC, senior note, 144A, 10.125%, 1/15/23 | United States | 75,000,000 | 83,250,000 | ||||||||||||||
| DISH DBS Corp., | ||||||||||||||||||
senior bond, 5.00%, 3/15/23 | United States | 300,000,000 | 271,875,000 | |||||||||||||||
senior note, 6.75%, 6/01/21 | United States | 100,000,000 | 101,250,000 | |||||||||||||||
senior note, 5.875%, 7/15/22 | United States | 347,500,000 | 333,165,625 | |||||||||||||||
senior note, 5.875%, 11/15/24 | United States | 128,200,000 | 114,739,000 | |||||||||||||||
| Fiat Chrysler Automobiles NV, senior note, 5.25%, 4/15/23 | United Kingdom | 55,400,000 | 56,814,085 | |||||||||||||||
| Ford Motor Co., senior note, 4.346%, 12/08/26 | United States | 50,000,000 | 49,456,892 | |||||||||||||||
| Ford Motor Credit Co. LLC, senior note, 4.134%, 8/04/25 | United States | 19,000,000 | 18,700,741 | |||||||||||||||
| General Motors Co., senior bond, 5.15%, 4/01/38 | United States | 50,000,000 | 49,929,904 | |||||||||||||||
e | Golden Nugget Inc., senior note, 144A, 6.75%, 10/15/24 | United States | 50,000,000 | 50,500,000 | ||||||||||||||
i | iHeartCommunications Inc., senior secured note, first lien, 9.00%, 12/15/19 | United States | 284,000,000 | 226,845,000 | ||||||||||||||
| KB Home, | ||||||||||||||||||
senior bond, 7.50%, 9/15/22 | United States | 50,000,000 | 55,125,000 | |||||||||||||||
senior note, 7.00%, 12/15/21 | United States | 50,000,000 | 53,812,500 | |||||||||||||||
e | PetSmart Inc., | |||||||||||||||||
senior note, 144A, 7.125%, 3/15/23 | United States | 104,600,000 | 59,883,500 | |||||||||||||||
senior secured note, first lien, 144A, 5.875%, 6/01/25 | United States | 127,700,000 | 92,901,750 | |||||||||||||||
| Quebecor Media Inc., senior bond, 5.75%, 1/15/23 | Canada | 33,800,000 | 34,814,000 | |||||||||||||||
e | Shea Homes LP/Shea Homes Funding Corp., | |||||||||||||||||
senior bond, 144A, 6.125%, 4/01/25 | United States | 90,000,000 | 91,462,500 | |||||||||||||||
senior note, 144A, 5.875%, 4/01/23 | United States | 80,000,000 | 81,400,000 | |||||||||||||||
e | Sirius XM Radio Inc., | |||||||||||||||||
senior bond, 144A, 6.00%, 7/15/24 | United States | 50,000,000 | 51,625,000 | |||||||||||||||
senior note, 144A, 4.625%, 5/15/23 | United States | 88,400,000 | 87,211,020 | |||||||||||||||
e,j | Tesla Inc., senior note, 144A, 5.30%, 8/15/25 | United States | 220,000,000 | 192,775,000 | ||||||||||||||
e | Univision Communications Inc., | |||||||||||||||||
senior secured note, first lien, 144A, 5.125%, 5/15/23 | United States | 137,000,000 | 130,848,700 | |||||||||||||||
senior secured note, first lien, 144A, 5.125%, 2/15/25 | United States | 120,020,000 | 112,218,700 | |||||||||||||||
| franklintempleton.com | Semiannual Report | 63 |
FRANKLIN CUSTODIAN FUNDS
STATEMENT OF INVESTMENTS (UNAUDITED)
Franklin Income Fund (continued)
| Country | | Principal Amount* | | Value | ||||||||||
| ||||||||||||||
| Corporate Bonds (continued) | ||||||||||||||
| Consumer Discretionary (continued) | ||||||||||||||
e | Virgin Media Secured Finance PLC, senior secured bond, first lien, 144A, 5.50%, 1/15/25 | United Kingdom | 80,000,000 | $ | 79,300,000 | |||||||||
e | Wynn Las Vegas LLC/Wynn Las Vegas Capital Corp., | |||||||||||||
senior bond, 144A, 4.25%, 5/30/23 | United States | 84,000,000 | 82,635,000 | |||||||||||
senior bond, 144A, 5.50%, 3/01/25 | United States | 111,000,000 | 111,832,500 | |||||||||||
senior bond, 144A, 5.25%, 5/15/27 | United States | 84,577,000 | 83,096,902 | |||||||||||
e | Wynn Macau Ltd., senior bond, 144A, 5.50%, 10/01/27 | Macau | 47,200,000 | 46,374,000 | ||||||||||
e | Ziggo Secured Finance BV, secured bond, 144A, 5.50%, 1/15/27 | Netherlands | 35,000,000 | 32,943,750 | ||||||||||
|
| |||||||||||||
| 3,691,622,913 | ||||||||||||||
|
| |||||||||||||
| Consumer Staples 0.7% | ||||||||||||||
| CVS Health Corp., | ||||||||||||||
senior bond, 4.30%, 3/25/28 | United States | 115,000,000 | 115,938,630 | |||||||||||
senior bond, 5.05%, 3/25/48 | United States | 50,200,000 | 52,898,920 | |||||||||||
senior note, 4.10%, 3/25/25 | United States | 65,200,000 | 65,702,260 | |||||||||||
e | JBS USA LLC/Finance Inc., | |||||||||||||
senior bond, 144A, 5.875%, 7/15/24 | United States | 101,180,000 | 99,060,279 | |||||||||||
senior note, 144A, 7.25%, 6/01/21 | United States | 98,500,000 | 99,854,375 | |||||||||||
senior note, 144A, 5.75%, 6/15/25 | United States | 55,000,000 | 51,562,500 | |||||||||||
e | Post Holdings Inc., | |||||||||||||
senior bond, 144A, 5.00%, 8/15/26 | United States | 29,500,000 | 28,098,750 | |||||||||||
senior bond, 144A, 5.625%, 1/15/28 | United States | 65,000,000 | 62,318,750 | |||||||||||
|
| |||||||||||||
| 575,434,464 | ||||||||||||||
|
| |||||||||||||
| Energy 8.0% | ||||||||||||||
e | Ascent Resources Utica Holdings LLC/ARU Finance Corp., senior note, 144A, 10.00%, 4/01/22 | United States | 225,000,000 | 244,125,000 | ||||||||||
| Bill Barrett Corp., | ||||||||||||||
senior bond, 7.00%, 10/15/22 | United States | 200,890,000 | 202,898,900 | |||||||||||
senior note, 8.75%, 6/15/25 | United States | 142,000,000 | 154,070,000 | |||||||||||
| Calumet Specialty Products Partners LP/Calumet Finance Corp., | ||||||||||||||
senior note, 6.50%, 4/15/21 | United States | 309,348,000 | 301,614,300 | |||||||||||
senior note, 7.625%, 1/15/22 | United States | 90,552,000 | 90,099,240 | |||||||||||
senior note, 7.75%, 4/15/23 | United States | 62,000,000 | 61,535,000 | |||||||||||
e senior note, 144A, 11.50%, 1/15/21 | United States | 32,200,000 | 36,003,625 | |||||||||||
| Chesapeake Energy Corp., | ||||||||||||||
e secured note, second lien, 144A, 8.00%, 12/15/22 | United States | 506,386,000 | 536,136,177 | |||||||||||
senior bond, 6.875%, 11/15/20 | United States | 95,000,000 | 98,562,500 | |||||||||||
senior bond, 6.125%, 2/15/21 | United States | 226,000,000 | 228,260,000 | |||||||||||
e,j senior bond, 144A, 8.00%, 6/15/27 | United States | 306,000,000 | 293,760,000 | |||||||||||
senior note, 6.625%, 8/15/20 | United States | 192,500,000 | 199,237,500 | |||||||||||
senior note, 5.375%, 6/15/21 | United States | 97,000,000 | 94,817,500 | |||||||||||
senior note, 4.875%, 4/15/22 | United States | 107,710,000 | 100,170,300 | |||||||||||
senior note, 5.75%, 3/15/23 | United States | 96,700,000 | 87,634,375 | |||||||||||
e,j senior note, 144A, 8.00%, 1/15/25 | United States | 430,000,000 | 417,100,000 | |||||||||||
k senior note, FRN, 4.97%, (3-month USD LIBOR + 3.25%), 4/15/19 | United States | 148,000,000 | 147,630,000 | |||||||||||
| Energy Transfer Equity LP, senior secured bond, first lien, 5.50%, 6/01/27 | United States | 95,300,000 | 96,014,750 | |||||||||||
| Ensco PLC, | ||||||||||||||
senior bond, 5.75%, 10/01/44 | United States | 50,000,000 | 34,375,000 | |||||||||||
senior note, 7.75%, 2/01/26 | United States | 60,000,000 | 55,200,000 | |||||||||||
| 64 | Semiannual Report | franklintempleton.com |
FRANKLIN CUSTODIAN FUNDS
STATEMENT OF INVESTMENTS (UNAUDITED)
Franklin Income Fund (continued)
| Country | | Principal Amount* | | Value | ||||||||||
| ||||||||||||||
| Corporate Bonds (continued) | ||||||||||||||
| Energy (continued) | ||||||||||||||
| Ferrellgas LP/Ferrellgas Finance Corp., | ||||||||||||||
senior note, 6.50%, 5/01/21 | United States | 79,295,000 | $ | 76,321,438 | ||||||||||
senior note, 6.75%, 1/15/22 | United States | 107,500,000 | 102,393,750 | |||||||||||
senior note, 6.75%, 6/15/23 | United States | 80,900,000 | 74,023,500 | |||||||||||
| Gulfport Energy Corp., | ||||||||||||||
senior note, 6.375%, 5/15/25 | United States | 50,000,000 | 48,312,500 | |||||||||||
senior note, 6.375%, 1/15/26 | United States | 50,000,000 | 47,625,000 | |||||||||||
| Halcon Resources Corp., senior note, 6.75%, 2/15/25 | United States | 65,000,000 | 64,187,500 | |||||||||||
| Kinder Morgan Inc., | ||||||||||||||
senior bond, 7.75%, 1/15/32 | United States | 118,000,000 | 151,168,137 | |||||||||||
e senior secured bond, first lien, 144A, 5.625%, 11/15/23 | United States | 91,200,000 | 97,713,144 | |||||||||||
e | McDermott International Inc., secured note, second lien, 144A, 8.00%, 5/01/21 | United States | 145,270,000 | 149,083,338 | ||||||||||
| Petroquest Energy Inc., | ||||||||||||||
secured note, second lien, 10.00%, 2/15/21 | United States | 7,343,000 | 5,901,936 | |||||||||||
l secured note, second lien, PIK, 10.00%, 2/15/21 | United States | 56,811,246 | 45,733,053 | |||||||||||
| Rex Energy Corp., second lien, 8.00%, 10/01/20 | United States | 109,000,000 | 31,610,000 | |||||||||||
| Sanchez Energy Corp., senior note, 7.75%, 6/15/21 | United States | 199,790,000 | 184,805,750 | |||||||||||
e | Sesi LLC, senior note, 144A, 7.75%, 9/15/24 | United States | 50,000,000 | 51,875,000 | ||||||||||
c | Stone Energy Corp., senior note, 7.50%, 5/31/22 | United States | 72,845,556 | 74,484,581 | ||||||||||
e | Sunoco LP/Sunoco Finance Corp., senior note, 144A, 5.50%, 2/15/26 | United States | 50,000,000 | 48,375,000 | ||||||||||
|
| |||||||||||||
| W&T Offshore Inc., | ||||||||||||||
e,l secured note, second lien, 144A, PIK, 9.00%, 5/15/20 | United States | 79,711,396 | 76,722,219 | |||||||||||
senior note, 8.50%, 6/15/19 | United States | 96,921,000 | 93,044,160 | |||||||||||
e,l senior secured note, third lien, 144A, PIK, 10.00%, 6/15/21 | United States | 71,081,877 | 57,655,726 | |||||||||||
e | Weatherford International LLC, senior note, 144A, 9.875%, 3/01/25 | United States | 100,000,000 | 90,470,000 | ||||||||||
| Weatherford International Ltd., | ||||||||||||||
senior note, 5.125%, 9/15/20 | United States | 91,000,000 | 87,360,000 | |||||||||||
senior note, 7.75%, 6/15/21 | United States | 384,500,000 | 359,988,125 | |||||||||||
j senior note, 4.50%, 4/15/22 | United States | 317,600,000 | 265,196,000 | |||||||||||
senior note, 8.25%, 6/15/23 | United States | 293,100,000 | 255,729,750 | |||||||||||
senior note, 9.875%, 2/15/24 | United States | 230,000,000 | 211,025,000 | |||||||||||
| The Williams Cos. Inc., senior note, 4.55%, 6/24/24 | United States | 24,000,000 | 24,287,280 | |||||||||||
|
| |||||||||||||
| 6,254,336,054 | ||||||||||||||
|
| |||||||||||||
| Financials 3.7% | ||||||||||||||
m | Bank of America Corp., | |||||||||||||
junior sub. bond, AA, 6.10% to 3/17/25, FRN thereafter, Perpetual | United States | 80,000,000 | 84,300,000 | |||||||||||
junior sub. bond, U, 5.20% to 6/01/23, FRN thereafter, Perpetual | United States | 80,000,000 | 79,700,000 | |||||||||||
junior sub. bond, X, 6.25% to 9/05/24, FRN thereafter, Perpetual | United States | 85,000,000 | 90,214,750 | |||||||||||
| Capital One Financial Corp., senior sub. note, 4.20%, 10/29/25 | United States | 40,000,000 | 39,675,707 | |||||||||||
| Citigroup Inc., | ||||||||||||||
m junior sub. bond, 5.35% to 5/15/23, FRN thereafter, Perpetual | United States | 179,195,000 | 178,299,025 | |||||||||||
m junior sub. bond, 5.90% to 2/15/23, FRN thereafter, Perpetual | United States | 33,000,000 | 34,113,750 | |||||||||||
m junior sub. bond, 5.95% to 1/30/23, FRN thereafter, Perpetual | United States | 230,000,000 | 236,900,000 | |||||||||||
m junior sub. bond, M, 6.30% to 5/15/24, FRN thereafter, Perpetual | United States | 250,000,000 | 261,250,000 | |||||||||||
m junior sub. bond, O, 5.875% to 3/27/20, FRN thereafter, Perpetual | United States | 160,000,000 | 165,400,000 | |||||||||||
m junior sub. bond, Q, 5.95% to 8/15/20, FRN thereafter, Perpetual | United States | 120,000,000 | 124,576,200 | |||||||||||
sub. bond, 4.125%, 7/25/28 | United States | 50,000,000 | 49,437,263 | |||||||||||
| franklintempleton.com | Semiannual Report | 65 |
FRANKLIN CUSTODIAN FUNDS
STATEMENT OF INVESTMENTS (UNAUDITED)
Franklin Income Fund (continued)
| Country | | Principal Amount* | | Value | ||||||||||
| ||||||||||||||
| Corporate Bonds (continued) | ||||||||||||||
| Financials (continued) | ||||||||||||||
m | Fifth Third Bancorp, junior sub. bond, 5.10% to 6/30/23, FRN thereafter, Perpetual | United States | 54,000,000 | $ | 53,325,000 | |||||||||
| The Goldman Sachs Group Inc., | ||||||||||||||
m junior sub. note, 5.70% to 5/10/19, FRN thereafter, Perpetual | United States | 13,400,000 | 13,668,000 | |||||||||||
k senior note, FRN, 3.272%, (3-month USD LIBOR + 1.201%), 9/29/25 | United States | 50,000,000 | 48,149,164 | |||||||||||
m | JPMorgan Chase & Co., | |||||||||||||
junior sub. bond, 6.125% to 4/30/24, FRN thereafter, Perpetual | United States | 60,000,000 | 62,925,000 | |||||||||||
junior sub. bond, 6.75% to 2/01/24, FRN thereafter, Perpetual | United States | 100,000,000 | 109,225,000 | |||||||||||
junior sub. bond, I, 7.90% to 4/30/19, FRN thereafter, Perpetual | United States | 585,000,000 | 588,714,750 | |||||||||||
junior sub. bond, Q, 5.15% to 5/01/23, FRN thereafter, Perpetual | United States | 100,000,000 | 100,160,000 | |||||||||||
junior sub. bond, R, 6.00% to 8/01/23, FRN thereafter, Perpetual | United States | 105,000,000 | 108,543,750 | |||||||||||
junior sub. bond, V, 5.00% to 7/30/19, FRN thereafter, Perpetual | United States | 200,000,000 | 202,030,000 | |||||||||||
junior sub. bond, X, 6.10% to 10/01/24, FRN thereafter, Perpetual | United States | 80,000,000 | 84,100,000 | |||||||||||
m | Morgan Stanley, junior sub. bond, 5.55% to 7/15/20, FRN thereafter, Perpetual | United States | 58,000,000 | 59,871,660 | ||||||||||
m | Wells Fargo & Co., junior sub. bond, S, 5.90% to 6/15/24, FRN thereafter, Perpetual | United States | 98,700,000 | 101,794,245 | ||||||||||
|
| |||||||||||||
| 2,876,373,264 | ||||||||||||||
|
| |||||||||||||
| Health Care 11.0% | ||||||||||||||
e | AMAG Pharmaceuticals Inc., senior note, 144A, 7.875%, 9/01/23 | United States | 55,600,000 | 55,183,000 | ||||||||||
e | Avantor Inc., senior note, 144A, 9.00%, 10/01/25 | United States | 75,000,000 | 73,640,625 | ||||||||||
| CHS/Community Health Systems Inc., | ||||||||||||||
senior note, 8.00%, 11/15/19 | United States | 1,171,245,000 | 1,059,976,725 | |||||||||||
senior note, 7.125%, 7/15/20 | United States | 575,000,000 | 470,781,250 | |||||||||||
senior note, 6.875%, 2/01/22 | United States | 1,433,900,000 | 833,454,375 | |||||||||||
senior secured note, 5.125%, 8/01/21 | United States | 132,000,000 | 123,420,000 | |||||||||||
senior secured note, first lien, 6.25%, 3/31/23 | United States | 351,000,000 | 325,113,750 | |||||||||||
| DaVita Inc., | ||||||||||||||
senior bond, 5.125%, 7/15/24 | United States | 122,000,000 | 119,331,250 | |||||||||||
senior bond, 5.00%, 5/01/25 | United States | 110,000,000 | 106,595,500 | |||||||||||
e | Endo DAC/Endo Finance LLC/Endo Finco Inc., | |||||||||||||
senior bond, 144A, 6.00%, 2/01/25 | United States | 108,700,000 | 78,535,750 | |||||||||||
senior note, 144A, 6.00%, 7/15/23 | United States | 218,025,000 | 165,699,000 | |||||||||||
e | Endo Finance LLC, senior note, 144A, 5.75%, 1/15/22 | United States | 126,000,000 | 103,950,000 | ||||||||||
e | Endo Finance LLC/Endo Finco Inc., senior note, 144A, 5.375%, 1/15/23 | United States | 35,000,000 | 26,512,500 | ||||||||||
| HCA Inc., | ||||||||||||||
senior bond, 5.875%, 5/01/23 | United States | 120,000,000 | 124,500,000 | |||||||||||
senior note, 7.50%, 2/15/22 | United States | 100,000,000 | 110,125,000 | |||||||||||
senior secured note, first lien, 5.00%, 3/15/24 | United States | 134,800,000 | 136,485,000 | |||||||||||
| Horizon Pharma Inc., senior note, 6.625%, 5/01/23 | United States | 105,012,000 | 105,012,000 | |||||||||||
e | Horizon Pharma Inc./Horizon Pharma USA Inc., senior note, 144A, 8.75%, 11/01/24 | United States | 33,303,000 | 35,634,210 | ||||||||||
e | Jaguar Holding Co. II/Pharmaceutical Product Development LLC, senior note, 144A, 6.375%, 8/01/23 | United States | 54,265,000 | 55,011,144 | ||||||||||
| Kindred Healthcare Inc., senior note, 8.00%, 1/15/20 | United States | 28,845,000 | 30,683,869 | |||||||||||
j | Mallinckrodt International Finance SA, senior bond, 4.75%, 4/15/23 | United States | 66,000,000 | 50,820,000 | ||||||||||
e | Mallinckrodt International Finance SA/Mallinckrodt CB LLC, | |||||||||||||
j senior note, 144A, 4.875%, 4/15/20 | United States | 258,127,000 | 246,511,285 | |||||||||||
senior note, 144A, 5.75%, 8/01/22 | United States | 337,775,000 | 290,486,500 | |||||||||||
senior note, 144A, 5.625%, 10/15/23 | United States | 285,350,000 | 229,706,750 | |||||||||||
senior note, 144A, 5.50%, 4/15/25 | United States | 137,500,000 | 107,421,875 | |||||||||||
| 66 | Semiannual Report | franklintempleton.com |
FRANKLIN CUSTODIAN FUNDS
STATEMENT OF INVESTMENTS (UNAUDITED)
Franklin Income Fund (continued)
| Country | | Principal Amount* | | Value | ||||||||||
| ||||||||||||||
| Corporate Bonds (continued) | ||||||||||||||
| Health Care (continued) | ||||||||||||||
| Tenet Healthcare Corp., | ||||||||||||||
e secured note, second lien, 144A, 5.125%, 5/01/25 | United States | 128,300,000 | $ | 123,809,500 | ||||||||||
senior note, 5.50%, 3/01/19 | United States | 45,000,000 | 45,675,000 | |||||||||||
senior note, 8.125%, 4/01/22 | United States | 876,400,000 | 916,933,500 | |||||||||||
j senior note, 6.75%, 6/15/23 | United States | 570,000,000 | 560,025,000 | |||||||||||
senior note, 6.875%, 11/15/31 | United States | 24,400,000 | 22,326,000 | |||||||||||
e senior note, 144A, 7.00%, 8/01/25 | United States | 140,000,000 | 138,250,000 | |||||||||||
senior secured note, first lien, 4.375%, 10/01/21 | United States | 140,000,000 | 138,250,000 | |||||||||||
e senior secured note, first lien, 144A, 4.625%, 7/15/24 | United States | 25,200,000 | 24,318,000 | |||||||||||
e senior secured note, second lien, 144A, 7.50%, 1/01/22 | United States | 66,700,000 | 70,535,250 | |||||||||||
e | Valeant Pharmaceuticals International, | |||||||||||||
senior note, 144A, 6.375%, 10/15/20 | United States | 209,900,000 | 212,261,375 | |||||||||||
senior note, 144A, 9.25%, 4/01/26 | United States | 200,000,000 | 199,750,000 | |||||||||||
e | Valeant Pharmaceuticals International Inc., | |||||||||||||
senior bond, 144A, 6.125%, 4/15/25 | United States | 122,400,000 | 106,090,200 | |||||||||||
senior note, 144A, 5.375%, 3/15/20 | United States | 356,991,000 | 360,221,768 | |||||||||||
senior note, 144A, 7.50%, 7/15/21 | United States | 205,000,000 | 207,306,250 | |||||||||||
senior note, 144A, 5.875%, 5/15/23 | United States | 183,500,000 | 163,544,375 | |||||||||||
senior note, 144A, 9.00%, 12/15/25 | United States | 85,000,000 | 84,787,500 | |||||||||||
senior note, first lien, 144A, 7.00%, 3/15/24 | United States | 77,300,000 | 80,875,125 | |||||||||||
senior secured note, first lien, 144A, 6.50%, 3/15/22 | United States | 50,500,000 | 52,330,625 | |||||||||||
senior secured note, first lien, 144A, 5.50%, 11/01/25 | United States | 25,000,000 | 24,431,250 | |||||||||||
|
| |||||||||||||
| 8,596,312,076 | ||||||||||||||
|
| |||||||||||||
| Industrials 0.8% | ||||||||||||||
l,n | CEVA Group PLC, senior secured note, first lien, 144A, PIK, 9.00%, 9/01/20 | United Kingdom | 165,515,180 | 168,784,616 | ||||||||||
e | Cloud Crane LLC, secured note, second lien, 144A, 10.125%, 8/01/24 | United States | 29,500,000 | 32,745,000 | ||||||||||
| TransDigm Inc., senior sub. note, 6.00%, 7/15/22 | United States | 17,900,000 | 18,302,750 | |||||||||||
| United Rentals North America Inc., senior bond, 5.75%, 11/15/24 | United States | 70,400,000 | 73,553,920 | |||||||||||
e | West Corp., senior note, 144A, 8.50%, 10/15/25 | United States | 50,000,000 | 48,625,000 | ||||||||||
e | XPO Logistics Inc., senior note, 144A, 6.50%, 6/15/22 | United States | 240,000,000 | 248,400,000 | ||||||||||
|
| |||||||||||||
| 590,411,286 | ||||||||||||||
|
| |||||||||||||
| Information Technology 0.9% | ||||||||||||||
e | BMC Software Finance Inc., senior note, 144A, 8.125%, 7/15/21 | United States | 110,805,000 | 111,220,519 | ||||||||||
e | CommScope Inc., senior bond, 144A, 5.50%, 6/15/24 | United States | 100,000,000 | 102,500,000 | ||||||||||
e | CommScope Technologies LLC, senior bond, 144A, 6.00%, 6/15/25 | United States | 74,200,000 | 77,576,100 | ||||||||||
e | Dell International LLC/EMC Corp., senior secured note, first lien, 144A, 5.45%, 6/15/23 | United States | 69,750,000 | 73,993,057 | ||||||||||
e | First Data Corp., | |||||||||||||
secured note, second lien, 144A, 5.75%, 1/15/24 | United States | 35,000,000 | 35,350,000 | |||||||||||
senior note, 144A, 7.00%, 12/01/23 | United States | 175,000,000 | 184,406,250 | |||||||||||
| NCR Corp., | ||||||||||||||
senior note, 5.00%, 7/15/22 | United States | 40,000,000 | 40,200,000 | |||||||||||
senior note, 6.375%, 12/15/23 | United States | 35,000,000 | 36,400,000 | |||||||||||
|
| |||||||||||||
| 661,645,926 | ||||||||||||||
|
| |||||||||||||
| franklintempleton.com | Semiannual Report | 67 |
FRANKLIN CUSTODIAN FUNDS
STATEMENT OF INVESTMENTS (UNAUDITED)
Franklin Income Fund (continued)
| Country | | Principal Amount* | | Value | ||||||||||
| Corporate Bonds (continued) | ||||||||||||||
| Materials 1.6% | ||||||||||||||
e | Ardagh Packaging Finance PLC/Ardagh MP Holdings USA Inc., senior note, 144A, 7.25%, 5/15/24 | Luxembourg | 27,300,000 | $ | 29,176,875 | |||||||||
| Ball Corp., senior bond, 4.00%, 11/15/23 | United States | 100,000,000 | 97,875,000 | |||||||||||
e | BWAY Holding Co., | |||||||||||||
secured note, 144A, 5.50%, 4/15/24 | United States | 75,000,000 | 75,656,250 | |||||||||||
senior note, 144A, 7.25%, 4/15/25 | United States | 175,000,000 | 178,937,500 | |||||||||||
e | Cemex Finance LLC, senior secured note, first lien, 144A, 6.00%, 4/01/24 | Mexico | 88,400,000 | 91,716,326 | ||||||||||
e | Cemex SAB de CV, | |||||||||||||
senior secured bond, 144A, 7.75%, 4/16/26 | Mexico | 55,100,000 | 60,886,878 | |||||||||||
senior secured bond, first lien, 144A, 5.70%, 1/11/25 | Mexico | 70,000,000 | 71,990,450 | |||||||||||
| Crown Americas LLC/Crown Americas Capital Corp. IV, senior bond, 4.50%, 1/15/23 | United States | 105,000,000 | 104,475,000 | |||||||||||
e | FMG Resources (August 2006) Pty. Ltd., | |||||||||||||
senior note, 144A, 5.125%, 5/15/24 | Australia | 44,400,000 | 44,178,000 | |||||||||||
| senior secured note, 144A, 9.75%, 3/01/22 | Australia | 425,000,000 | 469,625,000 | |||||||||||
| 1,224,517,279 | ||||||||||||||
| Real Estate 0.6% | ||||||||||||||
| Equinix Inc., senior bond, 5.375%, 5/15/27 | United States | 140,000,000 | 142,450,000 | |||||||||||
| Iron Mountain Inc., | ||||||||||||||
e senior note, 144A, 4.875%, 9/15/27 | United States | 91,500,000 | 85,323,750 | |||||||||||
senior sub. bond, 5.75%, 8/15/24 | United States | 122,254,000 | 119,044,832 | |||||||||||
| iStar Inc., senior note, 5.00%, 7/01/19 | United States | 95,900,000 | 96,263,941 | |||||||||||
| 443,082,523 | ||||||||||||||
| Telecommunication Services 2.5% | ||||||||||||||
| AT&T Inc., senior bond, 4.125%, 2/17/26 | United States | 50,000,000 | 50,173,968 | |||||||||||
| Consolidated Communications Inc., senior note, 6.50%, 10/01/22 | United States | 64,200,000 | 57,670,860 | |||||||||||
e | Digicel Ltd., senior note, 144A, 6.75%, 3/01/23 | Bermuda | 68,300,000 | 61,875,702 | ||||||||||
e | SFR Group SA, | |||||||||||||
secured bond, 144A, 7.375%, 5/01/26 | France | 50,000,000 | 47,875,000 | |||||||||||
senior note, first lien, 144A, 6.00%, 5/15/22 | France | 60,000,000 | 58,725,000 | |||||||||||
| Sprint Capital Corp., senior note, 6.90%, 5/01/19 | United States | 200,000,000 | 206,500,000 | |||||||||||
| Sprint Communications Inc., | ||||||||||||||
senior bond, 11.50%, 11/15/21 | United States | 200,000,000 | 233,000,000 | |||||||||||
senior note, 7.00%, 8/15/20 | United States | 102,500,000 | 106,856,250 | |||||||||||
senior note, 6.00%, 11/15/22 | United States | 362,700,000 | 356,806,125 | |||||||||||
| Sprint Corp., | ||||||||||||||
senior bond, 7.875%, 9/15/23 | United States | 187,350,000 | 191,799,562 | |||||||||||
senior bond, 7.125%, 6/15/24 | United States | 190,650,000 | 186,360,375 | |||||||||||
senior note, 7.625%, 3/01/26 | United States | 100,000,000 | 97,875,000 | |||||||||||
e | Sprint Spectrum Co. LLC, first lien, senior secured note, 144A, 5.152%, 9/20/29 | United States | 220,000,000 | 221,375,000 | ||||||||||
| Zayo Group LLC/Zayo Capital Inc., senior note, 6.00%, 4/01/23 | United States | 77,000,000 | 79,502,500 | |||||||||||
| 1,956,395,342 | ||||||||||||||
| Utilities 2.6% | ||||||||||||||
| The AES Corp., senior bond, 4.875%, 5/15/23 | United States | 75,000,000 | 76,687,500 | |||||||||||
| Calpine Corp., | ||||||||||||||
senior bond, 5.75%, 1/15/25 | United States | 227,000,000 | 208,272,500 | |||||||||||
senior note, 5.375%, 1/15/23 | United States | 340,000,000 | 326,757,000 | |||||||||||
senior note, 5.50%, 2/01/24 | United States | 186,500,000 | 170,414,375 |
| 68 | Semiannual Report | franklintempleton.com |
FRANKLIN CUSTODIAN FUNDS
STATEMENT OF INVESTMENTS (UNAUDITED)
Franklin Income Fund (continued)
| Country | | Principal Amount* | | Value | ||||||||||||||
| Corporate Bonds (continued) | ||||||||||||||||||
| Utilities (continued) | ||||||||||||||||||
| Dynegy Inc., | ||||||||||||||||||
senior bond, 8.034%, 2/02/24 | United States | 81,983,928 | $ | 86,083,124 | ||||||||||||||
senior note, 6.75%, 11/01/19 | United States | 324,002,000 | 330,482,040 | |||||||||||||||
senior note, 7.375%, 11/01/22 | United States | 351,500,000 | 371,271,875 | |||||||||||||||
senior note, 5.875%, 6/01/23 | United States | 130,000,000 | 133,926,000 | |||||||||||||||
e senior note, 144A, 8.00%, 1/15/25 | United States | 58,300,000 | 63,692,750 | |||||||||||||||
| Ferrellgas Partners LP/Ferrellgas Partners Finance Corp., senior note, 8.625%, 6/15/20 | United States | 49,900,000 | 45,908,000 | |||||||||||||||
e | InterGen NV, | |||||||||||||||||
secured bond, 144A, 7.00%, 6/30/23 | Netherlands | 143,700,000 | 143,697,845 | |||||||||||||||
secured note, 144A, 7.50%, 6/30/21 | Netherlands | 35,800,000 | GBP | 50,419,344 | ||||||||||||||
e | Talen Energy Supply LLC, senior note, 144A, 10.50%, 1/15/26 | United States | 50,000,000 | 43,187,500 | ||||||||||||||
| 2,050,799,853 | ||||||||||||||||||
| Total Corporate Bonds (Cost $28,982,113,018) | 28,920,930,980 | |||||||||||||||||
k,o | Senior Floating Rate Interests 4.0% | |||||||||||||||||
| Consumer Discretionary 2.0% | ||||||||||||||||||
| 24 Hour Fitness Worldwide Inc., Term Loan, 6.052%, (LIBOR + 3.75%), 5/28/21 | United States | 54,529,366 | 54,836,093 | |||||||||||||||
| Academy Ltd., Initial Term Loan, 5.887% - 6.017%, (LIBOR + 4.00%), 7/02/22 | United States | 111,471,778 | 89,363,246 | |||||||||||||||
| Belk Inc., Closing Date Term Loan, 6.458%, (LIBOR + 4.75%), 12/12/22 | United States | 244,755,330 | 213,068,326 | |||||||||||||||
| BJ’s Wholesale Club Inc., | ||||||||||||||||||
Second Lien Initial Term Loans, 9.191%, (LIBOR + 7.50%), 3/24/25 | United States | 38,817,949 | 39,048,450 | |||||||||||||||
Tranche B Term Loans, 5.191%, (LIBOR + 3.50%), 3/27/24 | United States | 24,824,937 | 24,836,233 | |||||||||||||||
| Global Eagle Entertainment Inc., Initial Term Loans, 9.358%, (LIBOR + 7.50%), 1/06/23 | United States | 105,251,250 | 109,987,556 | |||||||||||||||
i | iHeartCommunications Inc., | |||||||||||||||||
Tranche D Term Loan, 8.443%, (LIBOR + 6.75%), 1/30/19 | United States | 908,185,547 | 720,150,270 | |||||||||||||||
Tranche E Term Loan, 9.193%, (LIBOR + 7.50%), 7/30/19 | United States | 241,744,256 | 191,170,149 | |||||||||||||||
| Neiman Marcus Group Ltd. Inc., Term Loan, 4.941%, (LIBOR + 3.25%), 10/25/20 | United States | 50,351,145 | 43,632,389 | |||||||||||||||
| PetSmart Inc., Tranche B-2 Loans, 4.89%, (LIBOR + 3.00%), 3/11/22 | United States | 29,923,077 | 24,088,077 | |||||||||||||||
p | Stars Group Holdings BV, Term B Loan, TBD, 3/29/25 | United States | 50,000,000 | 49,875,000 | ||||||||||||||
p,q | Univision Communications Inc., Term Loan, TBD, 3/15/24 | United States | 30,000,000 | 29,573,430 | ||||||||||||||
| 1,589,629,219 | ||||||||||||||||||
| Consumer Staples 0.1% | ||||||||||||||||||
| Almonde Inc., | ||||||||||||||||||
2nd Lien Dollar Term Loan, 9.234%, (LIBOR + 7.25%), 6/13/25 | United States | 15,000,000 | 14,898,435 | |||||||||||||||
Dollar Term Loan, 5.484%, (LIBOR + 3.50%), 6/13/24 | United States | 59,700,000 | 59,720,716 | |||||||||||||||
| 74,619,151 | ||||||||||||||||||
| Energy 0.3% | ||||||||||||||||||
r | PetroQuest Energy Inc., Multidraw Term Loan Facility, 10.00%, 10/17/20 | United States | 30,000,000 | 29,721,300 | ||||||||||||||
| W&T Offshore Inc., | ||||||||||||||||||
Second Lien Term Loan, 9.00%, 5/15/20 | United States | 161,850,000 | 156,362,314 | |||||||||||||||
Senior Secured 1.5 Lien Term Loan, 11.00%, 11/15/19 | United States | 75,000,000 | 77,250,000 | |||||||||||||||
| 263,333,614 | ||||||||||||||||||
| Financials 0.1% | ||||||||||||||||||
| Russell Investments U.S. Institutional Holdco Inc., Term Loan B, 4.943%, (LIBOR + 3.25%), 6/01/23 | United States | 64,099,246 | 64,566,850 | |||||||||||||||
| franklintempleton.com | Semiannual Report | 69 |
FRANKLIN CUSTODIAN FUNDS
STATEMENT OF INVESTMENTS (UNAUDITED)
Franklin Income Fund (continued)
| Country | | Principal Amount* | | Value | ||||||||||
k,o | Senior Floating Rate Interests (continued) | |||||||||||||
| Health Care 0.4% | ||||||||||||||
| Air Medical Group Holdings Inc., 2018 Term Loans, 4.936%, (LIBOR + 3.25%), 4/28/22 | United States | 14,673,613 | $ | 14,752,719 | ||||||||||
p,q | Amneal Holdings LLC, Term B Loan, TBD, 3/23/25 | United States | 60,000,000 | 60,112,500 | ||||||||||
| Community Health Systems Inc., 2021 Term H Loans, 4.984%, (LIBOR + 3.00%), 1/15/21 | United States | 38,797,057 | 37,371,808 | |||||||||||
| Endo Luxembourg Finance Co. I S.A.R.L. and Endo LLC, Initial Term Loans, 6.188%, (LIBOR + 4.25%), 4/29/24 | United States | 79,400,000 | 79,489,325 | |||||||||||
| Horizon Pharma Inc., Third Amendment Refinancing Term Loan, 5.125%, (LIBOR + 3.25%), 3/29/24 | United States | 32,642,777 | 32,880,807 | |||||||||||
| Lannett Co. Inc., Initial Tranche B Term Loans, 7.252%, (LIBOR + 5.375%), 11/25/22 | United States | 56,157,222 | 56,087,026 | |||||||||||
| Mallinckrodt International Finance SA, 2018 Incremental Term Loans, 4.82%, (LIBOR + 3.00%), 2/24/25 | Luxembourg | 50,000,000 | 50,140,600 | |||||||||||
| 330,834,785 | ||||||||||||||
| Industrials 0.4% | ||||||||||||||
| CEVA Group PLC, Pre-Funded L/C, 6.50%, (LIBOR + 5.50%), 3/19/21 | United Kingdom | 18,246,603 | 17,967,248 | |||||||||||
| CEVA Intercompany BV, Dutch BV Term Loan, 7.272%, (LIBOR + 5.50%), 3/19/21 | United Kingdom | 18,520,302 | 18,236,756 | |||||||||||
| CEVA Logistics Canada ULC, Canadian Term Loan, 7.272%, (LIBOR + 5.50%), 3/19/21 | Canada | 3,193,156 | 3,144,269 | |||||||||||
| CEVA Logistics U.S. Holdings Inc., U.S. Term Loan, 7.272%, (LIBOR + 5.50%), 3/19/21 | United Kingdom | 25,545,245 | 25,154,147 | |||||||||||
| Commercial Barge Line Co., Initial Term Loan, 10.627%, (LIBOR + 8.75%), 11/12/20 | United States | 126,000,000 | 75,521,250 | |||||||||||
| Vertiv Group Corp., Term B Loans, 5.887%, (LIBOR + 4.00%), 11/30/23 | United States | 104,327,586 | 105,172,640 | |||||||||||
| West Corp., Term B Loans, 5.877%, (LIBOR + 4.00%), 10/10/24 | United States | 61,577,512 | 62,129,123 | |||||||||||
| 307,325,433 | ||||||||||||||
| Information Technology 0.2% | ||||||||||||||
| Digicert Inc., | ||||||||||||||
First Lien Term Loan, 6.522%, (LIBOR + 4.75%), 10/31/24 | United States | 45,000,000 | 45,579,375 | |||||||||||
Second Lien Initial Loan, 9.772%, (LIBOR + 8.00%), 9/18/25 | United States | 10,000,000 | 10,100,000 | |||||||||||
| MH Sub I LLC and Micro Holding Corp., | ||||||||||||||
Amendment No. 2 Initial Term Loan, 5.527%, (LIBOR + 3.75%), 9/15/24 | United States | 39,800,000 | 39,858,028 | |||||||||||
Second Lien Initial Term Loan, 9.277%, (LIBOR + 7.50%), 9/15/25 | United States | 30,000,000 | 30,431,250 | |||||||||||
| 125,968,653 | ||||||||||||||
| Telecommunication Services 0.2% | ||||||||||||||
| Digicel International Finance Ltd., Initial Term B Loans, 5.02%, (LIBOR + 3.25%), 5/25/24 | United States | 69,516,548 | 69,299,308 | |||||||||||
| Securus Technologies Holdings Inc., | ||||||||||||||
Second Lien Initial Loan, 10.127%, (LIBOR + 8.25%), 11/01/25 | United States | 30,000,000 | 30,412,500 | |||||||||||
Term Loan B, 6.377%, (LIBOR + 4.50%), 11/01/24 | United States | 44,887,500 | 45,431,761 | |||||||||||
| 145,143,569 |
| 70 | Semiannual Report | franklintempleton.com |
FRANKLIN CUSTODIAN FUNDS
STATEMENT OF INVESTMENTS (UNAUDITED)
Franklin Income Fund (continued)
| Country | | Principal Amount* | | Value | ||||||||||
| ||||||||||||||
k,o | Senior Floating Rate Interests (continued) | |||||||||||||
| Utilities 0.3% | ||||||||||||||
| Intergen NV, Term Advance, 6.24%, (LIBOR + 4.50%), 6/13/20 | Netherlands | 66,549,146 | $ | 66,923,485 | ||||||||||
| Talen Energy Supply LLC, | ||||||||||||||
Term B-1 Loans, 5.877%, (LIBOR + 4.00%), 7/15/23 | United States | 64,213,875 | 63,411,202 | |||||||||||
Tranche B-2 Term Loan, 5.877%, (LIBOR + 4.00%), 4/13/24 | United States | 59,280,000 | 58,390,800 | |||||||||||
| 188,725,487 | ||||||||||||||
Total Senior Floating Rate Interests | 3,090,146,761 | |||||||||||||
| Shares | ||||||||||||||
| Escrows and Litigation Trusts 0.0% | ||||||||||||||
b,s | Impax Laboratories Inc., Escrow Account | United States | 60,000,000 | — | ||||||||||
b,s | Motors Liquidation Co., Escrow Account | United States | 400,000,000 | — | ||||||||||
b,s | Motors Liquidation Co., Escrow Account, cvt. pfd., C | United States | 11,000,000 | — | ||||||||||
Total Escrows and Litigation Trusts | — | |||||||||||||
Total Investments before Short Term Investments | 76,015,112,107 | |||||||||||||
| Short Term Investments 0.3% | ||||||||||||||
| Money Market Funds (Cost $108,191,396) 0.2% | ||||||||||||||
t,u | Institutional Fiduciary Trust Money Market Portfolio, 1.24% | United States | 108,191,396 | 108,191,396 | ||||||||||
v | Investments from Cash Collateral Received for Loaned Securities 0.1% | |||||||||||||
| Money Market Funds (Cost $84,739,000) 0.1% | ||||||||||||||
t,u | Institutional Fiduciary Trust Money Market Portfolio, 1.24% | United States | 84,739,000 | 84,739,000 | ||||||||||
| Principal Amount* | ||||||||||||||
| Repurchase Agreement (Cost $17,011,579) 0.0%† | ||||||||||||||
w | Joint Repurchase Agreement, 1.80%, 4/02/18 (Maturity Value $17,014,981) | |||||||||||||
BNP Paribas Securities Corp. | ||||||||||||||
Collateralized by xU.S. Treasury Bill, 6/14/18; U.S. Treasury Bond, 8.13% | United States | 17,011,579 | 17,011,579 | |||||||||||
Total Investments from Cash Collateral Received for Loaned Securities (Cost $101,750,579) | 101,750,579 | |||||||||||||
Total Investments (Cost $74,442,853,338) 97.8%. | 76,225,054,082 | |||||||||||||
Options Written (0.0)%† | (22,440,000 | ) | ||||||||||||
Other Assets, less Liabilities 2.2% | 1,715,627,717 | |||||||||||||
Net Assets 100.0% | $ | 77,918,241,799 | ||||||||||||
| franklintempleton.com | Semiannual Report | 71 |
FRANKLIN CUSTODIAN FUNDS
STATEMENT OF INVESTMENTS (UNAUDITED)
Franklin Income Fund (continued)
| | Number of Contracts | | | Notional Amount* �� | | Value | ||||||||
y | Options Written (0.0)%† | |||||||||||||
| Calls - Exchange-Traded | ||||||||||||||
| Anadarko Petroleum Corp., April Strike Price $62.50, Expires 4/20/18 | 10,000 | 1,000,000 | $ | (960,000 | ) | |||||||||
| Anadarko Petroleum Corp., April Strike Price $65, Expires 4/20/18 | 10,000 | 1,000,000 | (340,000 | ) | ||||||||||
| BP PLC, April Strike Price $41, Expires 4/20/18 | 40,000 | 4,000,000 | (2,440,000 | ) | ||||||||||
| Chevron Corp., April Strike Price $120, Expires 4/20/18 | 20,000 | 2,000,000 | (780,000 | ) | ||||||||||
| Ford Motor Co., April Strike Price $11.50, Expires 4/27/18 | 10,000 | 1,000,000 | (130,000 | ) | ||||||||||
| Ford Motor Co., June Strike Price $11.87, Expires 6/15/18 | 35,000 | 3,500,000 | (630,000 | ) | ||||||||||
| Intel Corp., April Strike Price $52.50, Expires 4/20/18 | 10,000 | 1,000,000 | (1,320,000 | ) | ||||||||||
| Microsoft Corp., April Strike Price $97.50, Expires 4/20/18 | 10,000 | 1,000,000 | (510,000 | ) | ||||||||||
| Wells Fargo & Co., April Strike Price $65, Expires 4/20/18 | 20,000 | 2,000,000 | (60,000 | ) | ||||||||||
| (7,170,000 | ) | |||||||||||||
| Puts - Exchange-Traded | ||||||||||||||
| Alphabet Inc., April Strike Price $1,000, Expires 4/20/18 | 1,000 | 100,000 | (1,500,000 | ) | ||||||||||
| Caterpillar Inc., April Strike Price $140, Expires 4/20/18 | 10,000 | 1,000,000 | (1,910,000 | ) | ||||||||||
| Comcast Corp., April Strike Price $35, Expires 4/20/18 | 20,000 | 2,000,000 | (2,900,000 | ) | ||||||||||
| Microsoft Corp., April Strike Price $85, Expires 4/20/18 | 10,000 | 1,000,000 | (610,000 | ) | ||||||||||
| Target Corp., April Strike Price $65, Expires 4/20/18 | 10,000 | 1,000,000 | (620,000 | ) | ||||||||||
| Texas Instruments Inc., April Strike Price $100, Expires 4/20/18 | 5,000 | 500,000 | (630,000 | ) | ||||||||||
| Texas Instruments Inc., April Strike Price $105, Expires 4/20/18 | 20,000 | 2,000,000 | (6,140,000 | ) | ||||||||||
| Walmart Inc., April Strike Price $85, Expires 4/20/18 | 20,000 | 2,000,000 | (960,000 | ) | ||||||||||
| (15,270,000 | ) | |||||||||||||
| Total Options Written (Premiums received $19,982,836) | $ | (22,440,000 | ) | |||||||||||
| 72 | Semiannual Report | franklintempleton.com |
FRANKLIN CUSTODIAN FUNDS
STATEMENT OF INVESTMENTS (UNAUDITED)
Franklin Income Fund (continued)
See Abbreviations on page 120.
†Rounds to less than 0.1% of net assets.
*The principal/notional amount is stated in U.S. dollars unless otherwise indicated.
aA portion or all of the security is held in connection with written option contracts open at period end.
bNon-income producing.
cSee Note 11 regarding holdings of 5% voting securities.
dSee Note 1(g) regarding equity-linked securities.
eSecurity was purchased pursuant to Rule 144A under the Securities Act of 1933 and may be sold in transactions exempt from registration only to qualified institutional buyers or in a public offering registered under the Securities Act of 1933. These securities have been deemed liquid under guidelines approved by the Trust’s Board of Trustees. At March 31, 2018, the aggregate value of these securities was $21,450,854,372, representing 27.5% of net assets.
fSee Note 1(f) regarding index-linked notes.
gSecurity pays a fixed 2.00% coupon rate and a variable coupon based on the distribution of the Morgan Stanley Custom Enhanced SPX B DT Index 20 Delta. The coupon rate shown represents the combined rate at period end. Cash payment at maturity or upon early redemption is based on the performance of the Morgan Stanley Custom Enhanced SPX B Index 20 Delta.
hSecurity purchased on a when-issued basis. See Note 1(d).
iSee Note 7 regarding defaulted securities.
jA portion or all of the security is on loan at March 31, 2018. See Note 1(h).
kThe coupon rate shown represents the rate at period end.
lIncome may be received in additional securities and/or cash.
mPerpetual security with no stated maturity date.
nSee Note 8 regarding restricted securities.
oSee Note 1(j) regarding senior floating rate interests.
pA portion or all of the security represents an unsettled loan commitment. The coupon rate is to-be determined (TBD) at the time of settlement and will be based upon a reference index/floor plus a spread.
qSecurity purchased on a delayed delivery basis. See Note 1(d).
rSee Note 9 regarding unfunded loan commitments.
sFair valued using significant unobservable inputs. See Note 13 regarding fair value measurements.
tSee Note 3(f) regarding investments in affiliated management investment companies.
uThe rate shown is the annualized seven-day effective yield at period end.
vSee Note 1(h) regarding securities on loan.
wSee Note 1(c) regarding joint repurchase agreement.
xThe security was issued on a discount basis with no stated coupon rate.
ySee Note 1(e) regarding written options.
| franklintempleton.com | The accompanying notes are an integral part of these financial statements. | Semiannual Report | 73 |
FRANKLIN CUSTODIAN FUNDS
Financial Highlights
Franklin U.S. Government Securities Fund
Six Months Ended March 31, 2018 | Year Ended September 30, | |||||||||||||||||||||||
| (unaudited) | 2017 | 2016 | 2015 | 2014 | 2013 | |||||||||||||||||||
Class A | ||||||||||||||||||||||||
Per share operating performance (for a share outstanding throughout the period) | ||||||||||||||||||||||||
Net asset value, beginning of period | $ 6.13 | $ 6.35 | $ 6.40 | $ 6.48 | $ 6.53 | $ 6.91 | ||||||||||||||||||
Income from investment operationsa: | ||||||||||||||||||||||||
Net investment incomeb | 0.07 | 0.13 | 0.14 | 0.15 | 0.17 | 0.15 | ||||||||||||||||||
Net realized and unrealized gains (losses) | (0.16 | ) | (0.16 | ) | 0.01 | (0.02 | ) | 0.01 | (0.29 | ) | ||||||||||||||
Total from investment operations | (0.09 | ) | (0.03 | ) | 0.15 | 0.13 | 0.18 | (0.14 | ) | |||||||||||||||
Less distributions from net investment income | (0.09 | ) | (0.19 | ) | (0.20 | ) | (0.21 | ) | (0.23 | ) | (0.24 | ) | ||||||||||||
Net asset value, end of period | $ 5.95 | $ 6.13 | $ 6.35 | $ 6.40 | $ 6.48 | $ 6.53 | ||||||||||||||||||
Total returnc | (1.48)% | (0.45)% | 2.35% | 2.07% | 2.80% | (2.03)% | ||||||||||||||||||
Ratios to average net assetsd | ||||||||||||||||||||||||
Expenses before waiver and payments by affiliates | 0.79% | 0.79% | 0.76% | 0.76% | 0.75% | 0.73% | ||||||||||||||||||
Expenses net of waiver and payments by affiliates | 0.78% | e | 0.79% | e,f | 0.76% | e,f | 0.76% | e,f | 0.75% | e,f | 0.73% | |||||||||||||
Net investment income | 2.44% | 2.17% | 2.21% | 2.28% | 2.62% | 2.17% | ||||||||||||||||||
Supplemental data | ||||||||||||||||||||||||
Net assets, end of period (000’s) | $3,416,942 | $3,581,769 | $4,235,819 | $4,167,639 | $4,323,990 | $5,138,613 | ||||||||||||||||||
Portfolio turnover rate | 32.61% | 86.72% | 92.18% | 69.10% | 69.73% | 46.16% | ||||||||||||||||||
Portfolio turnover rate excluding mortgage dollar rollsg | 32.61% | 86.72% | 92.18% | 58.70% | 38.79% | 40.83% | ||||||||||||||||||
aThe amount shown for a share outstanding throughout the period may not correlate with the Statement of Operations for the period due to the timing of sales and repurchases of the Fund’s shares in relation to income earned and/or fluctuating fair value of the investments of the Fund.
bBased on average daily shares outstanding.
cTotal return does not reflect sales commissions or contingent deferred sales charges, if applicable and is not annualized for periods less than one year.
dRatios are annualized for periods less than one year.
eBenefit of expense reduction rounds to less than 0.01%.
fBenefit of waiver and payments by affiliates rounds to less than 0.01%.
gSee Note 1(i) regarding mortgage dollar rolls.
| 74 | Semiannual Report | The accompanying notes are an integral part of these financial statements. | franklintempleton.com |
FRANKLIN CUSTODIAN FUNDS
FINANCIAL HIGHLIGHTS
Franklin U.S. Government Securities Fund (continued)
| Period Ended March 31, 2018 (unaudited)a | ||||
| ||||
Class M | ||||
Per share operating performance (for a share outstanding throughout the period) | ||||
Net asset value, beginning of period | $6.03 | |||
|
| |||
Income from investment operationsb: | ||||
Net investment incomec | 0.03 | |||
Net realized and unrealized gains (losses) | (0.06 | ) | ||
|
| |||
Total from investment operations | (0.03 | ) | ||
|
| |||
Less distributions from net investment income | (0.05 | ) | ||
|
| |||
Net asset value, end of period | $5.95 | |||
|
| |||
Total returnd | (0.52)% | |||
Ratios to average net assetse | ||||
Expenses before waiver and payments by affiliates | 0.64% | |||
Expenses net of waiver and payments by affiliatesf | 0.63% | |||
Net investment income | 2.59% | |||
Supplemental data | ||||
Net assets, end of period (000’s) | $5 | |||
Portfolio turnover rate | 32.61% | |||
Portfolio turnover rate excluding mortgage dollar rollsg | 32.61% | |||
aFor the period January 25, 2018 (effective date) to March 31, 2018.
bThe amount shown for a share outstanding throughout the period may not correlate with the Statement of Operations for the period due to the timing of sales and repurchases of the Fund’s shares in relation to income earned and/or fluctuating fair value of the investments of the Fund.
cBased on average daily shares outstanding.
dTotal return does not reflect sales commissions or contingent deferred sales charges, if applicable and is not annualized for periods less than one year.
eRatios are annualized for periods less than one year.
fBenefit of expense reduction rounds to less than 0.01%.
gSee Note 1(i) regarding mortgage dollar rolls.
| franklintempleton.com | The accompanying notes are an integral part of these financial statements. | Semiannual Report | 75 |
FRANKLIN CUSTODIAN FUNDS
FINANCIAL HIGHLIGHTS
Franklin U.S. Government Securities Fund (continued)
| Six Months Ended | ||||||||||||||||||||||||
| March 31, 2018 | Year Ended September 30, | |||||||||||||||||||||||
| (unaudited) | 2017 | 2016 | 2015 | 2014 | 2013 | |||||||||||||||||||
Class C | ||||||||||||||||||||||||
Per share operating performance (for a share outstanding throughout the period) | ||||||||||||||||||||||||
Net asset value, beginning of period | $ 6.08 | $ 6.30 | $ 6.36 | $ 6.44 | $ 6.49 | $ 6.86 | ||||||||||||||||||
Income from investment operationsa: | ||||||||||||||||||||||||
Net investment incomeb | 0.06 | 0.10 | 0.11 | 0.11 | 0.14 | 0.11 | ||||||||||||||||||
Net realized and unrealized gains (losses) | (0.16) | (0.16) | — | c | (0.01) | 0.01 | (0.28) | |||||||||||||||||
Total from investment operations | (0.10) | (0.06) | 0.11 | 0.10 | 0.15 | (0.17) | ||||||||||||||||||
Less distributions from net investment income | (0.07) | (0.16) | (0.17) | (0.18) | (0.20) | (0.20) | ||||||||||||||||||
Net asset value, end of period | $ 5.91 | $ 6.08 | $ 6.30 | $ 6.36 | $ 6.44 | $ 6.49 | ||||||||||||||||||
Total returnd | (1.57)% | (0.96)% | 1.70% | 1.57% | 2.30% | (2.45)% | ||||||||||||||||||
Ratios to average net assetse | ||||||||||||||||||||||||
Expenses before waiver and payments by affiliates | 1.29% | 1.29% | 1.26% | 1.26% | 1.25% | 1.23% | ||||||||||||||||||
Expenses net of waiver and payments by affiliates | 1.28%f | 1.29% | f,g | 1.26% | f,g | 1.26% | f,g | 1.25% | f,g | 1.23% | ||||||||||||||
Net investment income | 1.94% | 1.67% | 1.71% | 1.78% | 2.12% | 1.67% | ||||||||||||||||||
Supplemental data | ||||||||||||||||||||||||
Net assets, end of period (000’s) | $667,400 | $797,394 | $1,034,410 | $1,040,294 | $1,190,720 | $1,640,787 | ||||||||||||||||||
Portfolio turnover rate | 32.61% | 86.72% | 92.18% | 69.10% | 69.73% | 46.16% | ||||||||||||||||||
Portfolio turnover rate excluding mortgage dollar rollsh | 32.61% | 86.72% | 92.18% | 58.70% | 38.79% | 40.83% | ||||||||||||||||||
aThe amount shown for a share outstanding throughout the period may not correlate with the Statement of Operations for the period due to the timing of sales and repurchases of the Fund’s shares in relation to income earned and/or fluctuating fair value of the investments of the Fund.
bBased on average daily shares outstanding.
cAmount rounds to less than $0.01 per share.
dTotal return does not reflect sales commissions or contingent deferred sales charges, if applicable and is not annualized for periods less than one year. eRatios are annualized for periods less than one year.
fBenefit of expense reduction rounds to less than 0.01%.
gBenefit of waiver and payments by affiliates rounds to less than 0.01%.
hSee Note 1(i) regarding mortgage dollar rolls.
| 76 | Semiannual Report | The accompanying notes are an integral part of these financial statements. | franklintempleton.com |
FRANKLIN CUSTODIAN FUNDS
FINANCIAL HIGHLIGHTS
Franklin U.S. Government Securities Fund (continued)
| Six Months Ended | ||||||||||||||||||||||||
| March 31, 2018 | Year Ended September 30, | |||||||||||||||||||||||
| (unaudited) | 2017 | 2016 | 2015 | 2014 | 2013 | |||||||||||||||||||
Class R | ||||||||||||||||||||||||
Per share operating performance (for a share outstanding throughout the period) | ||||||||||||||||||||||||
Net asset value, beginning of period | $ 6.12 | $ 6.34 | $ 6.40 | $ 6.48 | $ 6.53 | $ 6.90 | ||||||||||||||||||
Income from investment operationsa: | ||||||||||||||||||||||||
Net investment incomeb | 0.06 | 0.11 | 0.12 | 0.13 | 0.15 | 0.12 | ||||||||||||||||||
Net realized and unrealized gains (losses) | (0.15) | (0.16) | —c | (0.02) | 0.01 | (0.27) | ||||||||||||||||||
Total from investment operations | (0.09) | (0.05) | 0.12 | 0.11 | 0.16 | (0.15) | ||||||||||||||||||
Less distributions from net investment income | (0.08) | (0.17) | (0.18) | (0.19) | (0.21) | (0.22) | ||||||||||||||||||
Net asset value, end of period | $ 5.95 | $ 6.12 | $ 6.34 | $ 6.40 | $ 6.48 | $ 6.53 | ||||||||||||||||||
Total returnd | (1.49)% | (0.81)% | 1.84% | 1.71% | 2.44% | (2.27)% | ||||||||||||||||||
Ratios to average net assetse | ||||||||||||||||||||||||
Expenses before waiver and payments by affiliates | 1.13% | 1.13% | 1.11% | 1.11% | 1.10% | 1.08% | ||||||||||||||||||
Expenses net of waiver and payments by affiliates | 1.12%f | 1.13%f,g | 1.11%f,g | 1.11%f,g | 1.10%f,g | 1.08% | ||||||||||||||||||
Net investment income | 2.10% | 1.83% | 1.86% | 1.93% | 2.27% | 1.82% | ||||||||||||||||||
Supplemental data | ||||||||||||||||||||||||
Net assets, end of period (000’s) | $33,832 | $38,363 | $59,785 | $64,689 | $74,442 | $94,110 | ||||||||||||||||||
Portfolio turnover rate | 32.61% | 86.72% | 92.18% | 69.10% | 69.73% | 46.16% | ||||||||||||||||||
Portfolio turnover rate excluding mortgage dollar rollsh | 32.61% | 86.72% | 92.18% | 58.70% | 38.79% | 40.83% | ||||||||||||||||||
aThe amount shown for a share outstanding throughout the period may not correlate with the Statement of Operations for the period due to the timing of sales and repurchases of the Fund’s shares in relation to income earned and/or fluctuating fair value of the investments of the Fund.
bBased on average daily shares outstanding.
cAmount rounds to less than $0.01 per share.
dTotal return is not annualized for periods less than one year.
eRatios are annualized for periods less than one year.
fBenefit of expense reduction rounds to less than 0.01%.
gBenefit of waiver and payments by affiliates rounds to less than 0.01%.
hSee Note 1(i) regarding mortgage dollar rolls.
| franklintempleton.com | The accompanying notes are an integral part of these financial statements. | Semiannual Report | 77 |
FRANKLIN CUSTODIAN FUNDS
FINANCIAL HIGHLIGHTS
Franklin U.S. Government Securities Fund (continued)
| Six Months Ended | ||||||||||||||||||||||||
| March 31, 2018 | Year Ended September 30, | |||||||||||||||||||||||
| (unaudited) | 2017 | 2016 | 2015 | 2014 | 2013a | |||||||||||||||||||
Class R6 | ||||||||||||||||||||||||
Per share operating performance (for a share outstanding throughout the period) | ||||||||||||||||||||||||
Net asset value, beginning of period | $6.15 | $6.37 | $6.42 | $6.50 | $6.55 | $6.76 | ||||||||||||||||||
Income from investment operationsb: | ||||||||||||||||||||||||
Net investment incomec | 0.08 | 0.15 | 0.16 | 0.17 | 0.19 | 0.07 | ||||||||||||||||||
Net realized and unrealized gains (losses) | (0.16) | (0.16) | 0.01 | (0.02) | 0.01 | (0.17) | ||||||||||||||||||
Total from investment operations | (0.08) | (0.01) | 0.17 | 0.15 | 0.20 | (0.10) | ||||||||||||||||||
Less distributions from net investment income | (0.10) | (0.21) | (0.22) | (0.23) | (0.25) | (0.11) | ||||||||||||||||||
Net asset value, end of period | $5.97 | $6.15 | $6.37 | $6.42 | $6.50 | $6.55 | ||||||||||||||||||
Total returnd | (1.33)% | (0.16)% | 2.63% | 2.35% | 3.08% | (1.53)% | ||||||||||||||||||
Ratios to average net assetse | ||||||||||||||||||||||||
Expenses before waiver and payments by affiliates | 0.51% | 0.48% | 0.48% | 0.47% | 0.47% | 0.46% | ||||||||||||||||||
Expenses net of waiver and payments by affiliates | 0.50%f | 0.48%f,g | 0.48%f,g | 0.47%f,g | 0.47%f,g | 0.46% | ||||||||||||||||||
Net investment income | 2.72% | 2.48% | 2.49% | 2.57% | 2.90% | 2.44% | ||||||||||||||||||
Supplemental data | ||||||||||||||||||||||||
Net assets, end of period (000’s) | $607,967 | $446,174 | $624,619 | $375,644 | $497,246 | $480,590 | ||||||||||||||||||
Portfolio turnover rate | 32.61% | 86.72% | 92.18% | 69.10% | 69.73% | 46.16% | ||||||||||||||||||
Portfolio turnover rate excluding mortgage dollar rollsh | 32.61% | 86.72% | 92.18% | 58.70% | 38.79% | 40.83% | ||||||||||||||||||
aFor the period May 1, 2013 (effective date) to September 30, 2013.
bThe amount shown for a share outstanding throughout the period may not correlate with the Statement of Operations for the period due to the timing of sales and repurchases of the Fund’s shares in relation to income earned and/or fluctuating fair value of the investments of the Fund.
cBased on average daily shares outstanding.
dTotal return is not annualized for periods less than one year.
eRatios are annualized for periods less than one year.
fBenefit of expense reduction rounds to less than 0.01%.
gBenefit of waiver and payments by affiliates rounds to less than 0.01%.
hSee Note 1(i) regarding mortgage dollar rolls.
| 78 | Semiannual Report | The accompanying notes are an integral part of these financial statements. | franklintempleton.com |
FRANKLIN CUSTODIAN FUNDS
FINANCIAL HIGHLIGHTS
Franklin U.S. Government Securities Fund (continued)
| Six Months Ended | ||||||||||||||||||||||||
| March 31, 2018 | Year Ended September 30, | |||||||||||||||||||||||
| (unaudited) | 2017 | 2016 | 2015 | 2014 | 2013 | |||||||||||||||||||
Advisor Class | ||||||||||||||||||||||||
Per share operating performance (for a share outstanding throughout the period) | ||||||||||||||||||||||||
Net asset value, beginning of period | $ 6.15 | $ 6.37 | $ 6.42 | $ 6.50 | $ 6.55 | $ 6.93 | ||||||||||||||||||
Income from investment operationsa: | ||||||||||||||||||||||||
Net investment incomeb | 0.08 | 0.15 | 0.15 | 0.16 | 0.18 | 0.16 | ||||||||||||||||||
Net realized and unrealized gains (losses) | (0.17) | (0.17) | 0.01 | (0.02) | 0.01 | (0.29) | ||||||||||||||||||
Total from investment operations | (0.09) | (0.02) | 0.16 | 0.14 | 0.19 | (0.13) | ||||||||||||||||||
Less distributions from net investment income | (0.09) | (0.20) | (0.21) | (0.22) | (0.24) | (0.25) | ||||||||||||||||||
Net asset value, end of period | $ 5.97 | $ 6.15 | $ 6.37 | $ 6.42 | $ 6.50 | $ 6.55 | ||||||||||||||||||
Total returnc | (1.40)% | (0.30)% | 2.49% | 2.21% | 2.94% | (1.86)% | ||||||||||||||||||
Ratios to average net assetsd | ||||||||||||||||||||||||
Expenses before waiver and payments by affiliates | 0.64% | 0.64% | 0.61% | 0.61% | 0.60% | 0.58% | ||||||||||||||||||
Expenses net of waiver and payments by affiliates | 0.63%e | 0.64%e,f | 0.61%e,f | 0.61%e,f | 0.60%e,f | 0.58% | ||||||||||||||||||
Net investment income | 2.59% | 2.32% | 2.36% | 2.43% | 2.77% | 2.32% | ||||||||||||||||||
Supplemental data | ||||||||||||||||||||||||
Net assets, end of period (000’s) | $716,203 | $854,640 | $718,975 | $622,339 | $652,737 | $949,085 | ||||||||||||||||||
Portfolio turnover rate | 32.61% | 86.72% | 92.18% | 69.10% | 69.73% | 46.16% | ||||||||||||||||||
Portfolio turnover rate excluding mortgage dollar rollsg | 32.61% | 86.72% | 92.18% | 58.70% | 38.79% | 40.83% | ||||||||||||||||||
aThe amount shown for a share outstanding throughout the period may not correlate with the Statement of Operations for the period due to the timing of sales and repurchases of the Fund’s shares in relation to income earned and/or fluctuating fair value of the investments of the Fund.
bBased on average daily shares outstanding.
cTotal return is not annualized for periods less than one year.
dRatios are annualized for periods less than one year.
eBenefit of expense reduction rounds to less than 0.01%.
fBenefit of waiver and payments by affiliates rounds to less than 0.01%.
gSee Note 1(i) regarding mortgage dollar rolls.
| franklintempleton.com | The accompanying notes are an integral part of these financial statements. | Semiannual Report | 79 |
FRANKLIN CUSTODIAN FUNDS
Statement of Investments, March 31, 2018 (unaudited)
Franklin U.S. Government Securities Fund
| | Principal Amount | | Value | |||||||
| Mortgage-Backed Securities 96.6% | ||||||||||
| Government National Mortgage Association (GNMA) Fixed Rate 96.6% | ||||||||||
| GNMA I SF 15 Year, 6.50%, 5/15/18 | $ 5 | $ 5 | ||||||||
| GNMA I SF 30 Year, 3.50%, 4/15/43 - 5/15/43 | 29,737,755 | 30,188,840 | ||||||||
| GNMA I SF 30 Year, 4.00%, 10/15/40 - 1/15/45 | 48,494,081 | 50,248,897 | ||||||||
| GNMA I SF 30 Year, 4.00%, 8/15/44 | 18,312,175 | 18,970,556 | ||||||||
| GNMA I SF 30 Year, 4.00%, 1/15/45 - 8/15/46 | 51,483,815 | 53,333,184 | ||||||||
| GNMA I SF 30 Year, 4.50%, 2/15/39 - 12/15/39 | 51,317,769 | 54,312,881 | ||||||||
| GNMA I SF 30 Year, 4.50%, 3/15/39 | 17,982,335 | 19,017,903 | ||||||||
| GNMA I SF 30 Year, 4.50%, 1/15/40 - 6/15/40 | 49,863,121 | 52,752,161 | ||||||||
| GNMA I SF 30 Year, 4.50%, 6/15/40 | 14,579,923 | 15,423,468 | ||||||||
| GNMA I SF 30 Year, 4.50%, 6/15/40 - 8/15/40 | 46,175,452 | 48,754,867 | ||||||||
| GNMA I SF 30 Year, 4.50%, 7/15/40 | 14,945,739 | 15,794,916 | ||||||||
| GNMA I SF 30 Year, 4.50%, 8/15/40 - 6/15/41 | 38,941,103 | 41,236,267 | ||||||||
| GNMA I SF 30 Year, 5.00%, 2/15/33 - 10/15/33 | 50,335,545 | 53,970,092 | ||||||||
| GNMA I SF 30 Year, 5.00%, 10/15/33 - 6/15/39 | 48,939,816 | 52,483,707 | ||||||||
| GNMA I SF 30 Year, 5.00%, 6/15/39 - 10/15/39 | 46,667,195 | 50,070,401 | ||||||||
| GNMA I SF 30 Year, 5.00%, 8/15/39 | 21,374,422 | 22,975,408 | ||||||||
| GNMA I SF 30 Year, 5.00%, 10/15/39 | 14,662,779 | 15,764,437 | ||||||||
| GNMA I SF 30 Year, 5.00%, 10/15/39 | 20,047,418 | 21,545,067 | ||||||||
| GNMA I SF 30 Year, 5.00%, 10/15/39 - 2/15/40 | 42,234,832 | 45,319,931 | ||||||||
| GNMA I SF 30 Year, 5.00%, 11/15/39 | 26,137,592 | 28,092,280 | ||||||||
| GNMA I SF 30 Year, 5.00%, 2/15/40 | 14,083,346 | 15,134,475 | ||||||||
| GNMA I SF 30 Year, 5.00%, 2/15/40 - 6/15/40 | 48,273,328 | 51,746,068 | ||||||||
| GNMA I SF 30 Year, 5.00%, 3/15/40 | 17,456,733 | 18,764,039 | ||||||||
| GNMA I SF 30 Year, 5.00%, 6/15/40 | 23,173,141 | 24,888,247 | ||||||||
| GNMA I SF 30 Year, 5.00%, 9/15/40 | 22,473,953 | 24,158,862 | ||||||||
| GNMA I SF 30 Year, 5.50%, 5/15/28 - 6/15/33 | 49,469,116 | 54,394,673 | ||||||||
| GNMA I SF 30 Year, 5.50%, 6/15/33 - 5/15/36 | 49,170,685 | 54,097,518 | ||||||||
| GNMA I SF 30 Year, 5.50%, 6/15/36 - 7/15/39 | 49,429,008 | 54,313,359 | ||||||||
| GNMA I SF 30 Year, 5.50%, 8/15/39 - 2/15/40 | 15,550,306 | 17,121,941 | ||||||||
| GNMA I SF 30 Year, 6.00%, 10/15/23 - 10/15/33 | 48,105,234 | 53,886,477 | ||||||||
| GNMA I SF 30 Year, 6.00%, 10/15/33 - 6/15/37 | 47,911,093 | 53,935,912 | ||||||||
| GNMA I SF 30 Year, 6.00%, 6/15/37 - 12/15/39 | 48,086,273 | 53,829,861 | ||||||||
| GNMA I SF 30 Year, 6.50%, 5/15/23 - 8/15/37 | 45,644,904 | 51,246,280 | ||||||||
| GNMA I SF 30 Year, 7.00%, 3/15/22 - 9/15/32 | 31,714,196 | 34,510,705 | ||||||||
| GNMA I SF 30 Year, 7.25%, 12/15/25 - 1/15/26 | 86,130 | 87,631 | ||||||||
| GNMA I SF 30 Year, 7.50%, 6/15/21 - 8/15/33 | 8,860,101 | 9,504,694 | ||||||||
| GNMA I SF 30 Year, 7.70%, 1/15/21 - 10/15/21 | 41,448 | 41,546 | ||||||||
| GNMA I SF 30 Year, 8.00%, 2/15/20 - 9/15/30 | 3,365,889 | 3,467,696 | ||||||||
| GNMA I SF 30 Year, 8.50%, 9/15/19 - 5/15/25 | 607,706 | 625,115 | ||||||||
| GNMA I SF 30 Year, 9.00%, 5/15/18 - 7/15/23 | 508,828 | 519,986 | ||||||||
| GNMA I SF 30 Year, 9.50%, 6/15/18 - 8/15/22 | 490,523 | 495,079 | ||||||||
| GNMA I SF 30 Year, 10.00%, 6/15/18 - 3/15/25 | 207,872 | 209,442 | ||||||||
| GNMA I SF 30 Year, 10.50%, 5/15/18 - 10/15/21 | 87,411 | 87,942 | ||||||||
| GNMA I SF 30 Year, 11.00%, 9/15/18 - 5/15/21 | 8,163 | 8,196 | ||||||||
| GNMA II SF 30 Year, 3.00%, 2/20/45 | 9,466,503 | 9,380,731 | ||||||||
| GNMA II SF 30 Year, 3.00%, 7/20/47 | 256,384,030 | 252,478,725 | ||||||||
| GNMA II SF 30 Year, 3.00%, 9/20/47 | 58,792,726 | 57,874,082 | ||||||||
| GNMA II SF 30 Year, 3.00%, 10/20/47 | 25,367,090 | 24,970,728 | ||||||||
| GNMA II SF 30 Year, 3.00%, 11/20/47 | 93,903,311 | 92,412,370 | ||||||||
| GNMA II SF 30 Year, 3.50%, 10/20/40 - 5/20/43 | 36,284,438 | 36,796,637 | ||||||||
| GNMA II SF 30 Year, 3.50%, 7/20/42 | 55,265,789 | 56,099,657 |
| 80 | Semiannual Report | franklintempleton.com |
FRANKLIN CUSTODIAN FUNDS
STATEMENT OF INVESTMENTS (UNAUDITED)
Franklin U.S. Government Securities Fund (continued)
| | Principal Amount | | Value | |||||||
| Mortgage-Backed Securities (continued) | ||||||||||
| Government National Mortgage Association (GNMA) Fixed Rate (continued) | ||||||||||
| GNMA II SF 30 Year, 3.50%, 8/20/42 | $ | 19,094,655 | $ | 19,382,764 | ||||||
| GNMA II SF 30 Year, 3.50%, 9/20/42 | 126,547,178 | 128,456,606 | ||||||||
| GNMA II SF 30 Year, 3.50%, 10/20/42 | 26,116,792 | 26,510,865 | ||||||||
| GNMA II SF 30 Year, 3.50%, 11/20/42 | 21,756,444 | 22,084,728 | ||||||||
| GNMA II SF 30 Year, 3.50%, 4/20/43 | 26,688,827 | 27,091,558 | ||||||||
| GNMA II SF 30 Year, 3.50%, 5/20/43 | 36,139,327 | 36,684,666 | ||||||||
| GNMA II SF 30 Year, 3.50%, 6/20/43 | 41,744,128 | 42,374,050 | ||||||||
| GNMA II SF 30 Year, 3.50%, 8/20/43 | 29,915,473 | 30,366,919 | ||||||||
| GNMA II SF 30 Year, 3.50%, 9/20/47 | 798,489,325 | 806,802,724 | ||||||||
| GNMA II SF 30 Year, 3.50%, 11/20/47 | 734,981,747 | 742,645,909 | ||||||||
| GNMA II SF 30 Year, 3.50%, 2/20/48 | 304,093,806 | 307,258,927 | ||||||||
| GNMA II SF 30 Year, 4.00%, 5/20/40 - 2/20/44 | 23,710,273 | 24,663,449 | ||||||||
| GNMA II SF 30 Year, 4.00%, 11/20/40 | 36,435,807 | 38,096,838 | ||||||||
| GNMA II SF 30 Year, 4.00%, 12/20/40 | 21,447,372 | 22,424,207 | ||||||||
| GNMA II SF 30 Year, 4.00%, 1/20/41 | 23,506,411 | 24,578,337 | ||||||||
| GNMA II SF 30 Year, 4.00%, 7/20/41 | 29,263,744 | 30,596,498 | ||||||||
| GNMA II SF 30 Year, 4.00%, 9/20/41 | 34,447,467 | 36,015,141 | ||||||||
| GNMA II SF 30 Year, 4.00%, 10/20/41 | 42,612,775 | 44,553,989 | ||||||||
| GNMA II SF 30 Year, 4.00%, 11/20/41 | 38,912,646 | 40,684,479 | ||||||||
| GNMA II SF 30 Year, 4.00%, 2/20/44 | 24,133,959 | 24,966,690 | ||||||||
| GNMA II SF 30 Year, 4.00%, 10/20/47 | 236,094,305 | 242,957,450 | ||||||||
| a GNMA II SF 30 Year, 4.00%, 4/01/48 | 75,000,000 | 77,070,759 | ||||||||
| GNMA II SF 30 Year, 4.50%, 5/20/33 - 7/20/40 | 45,062,880 | 47,381,792 | ||||||||
| GNMA II SF 30 Year, 4.50%, 12/20/39 | 24,532,881 | 25,795,593 | ||||||||
| GNMA II SF 30 Year, 4.50%, 5/20/41 | 32,057,855 | 33,714,584 | ||||||||
| GNMA II SF 30 Year, 4.50%, 6/20/41 - 8/20/42 | 16,872,784 | 17,752,097 | ||||||||
| GNMA II SF 30 Year, 4.50%, 6/20/41 | 38,871,666 | 40,896,321 | ||||||||
| GNMA II SF 30 Year, 4.50%, 7/20/41 | 42,209,630 | 44,419,375 | ||||||||
| GNMA II SF 30 Year, 4.50%, 9/20/41 | 56,480,872 | 59,446,196 | ||||||||
| GNMA II SF 30 Year, 4.50%, 10/20/41 | 42,105,835 | 44,316,000 | ||||||||
| GNMA II SF 30 Year, 4.50%, 2/20/44 | 22,917,003 | 24,153,161 | ||||||||
| GNMA II SF 30 Year, 5.00%, 7/20/33 - 4/20/40 | 43,420,015 | 46,777,222 | ||||||||
| GNMA II SF 30 Year, 5.00%, 9/20/33 | 23,598,815 | 25,644,312 | ||||||||
| GNMA II SF 30 Year, 5.00%, 7/20/39 | 13,901,889 | 14,978,976 | ||||||||
| GNMA II SF 30 Year, 5.00%, 5/20/40 - 9/20/41 | 9,614,841 | 10,334,056 | ||||||||
| GNMA II SF 30 Year, 5.00%, 6/20/40 | 16,640,265 | 18,086,140 | ||||||||
| GNMA II SF 30 Year, 5.50%, 6/20/34 - 6/20/35 | 47,075,734 | 51,879,890 | ||||||||
| GNMA II SF 30 Year, 5.50%, 12/20/34 | 15,352,558 | 16,920,180 | ||||||||
| GNMA II SF 30 Year, 5.50%, 7/20/35 - 4/20/40 | 28,176,902 | 30,701,595 | ||||||||
| GNMA II SF 30 Year, 6.00%, 10/20/23 - 5/20/37 | 47,304,943 | 53,421,668 | ||||||||
| GNMA II SF 30 Year, 6.00%, 8/20/37 - 7/20/39 | 20,131,129 | 22,651,577 | ||||||||
| GNMA II SF 30 Year, 6.50%, 6/20/24 - 1/20/39 | 22,895,028 | 25,861,870 | ||||||||
| GNMA II SF 30 Year, 7.00%, 2/20/28 - 7/20/33 | 5,609,603 | 6,481,013 | ||||||||
| GNMA II SF 30 Year, 7.50%, 10/20/22 - 4/20/32 | 1,174,463 | 1,308,921 | ||||||||
| GNMA II SF 30 Year, 8.00%, 5/20/24 - 6/20/30 | 567,152 | 648,107 | ||||||||
| GNMA II SF 30 Year, 8.50%, 5/20/19 - 6/20/25 | 118,321 | 123,308 | ||||||||
| GNMA II SF 30 Year, 9.00%, 6/20/18 - 11/20/21 | 27,958 | 29,446 | ||||||||
| GNMA II SF 30 Year, 9.50%, 8/20/18 - 4/20/25 | 47,346 | 48,203 | ||||||||
| GNMA II SF 30 Year, 10.00%, 4/20/19 - 3/20/21 | 40,562 | 42,237 | ||||||||
| GNMA II SF 30 Year, 10.50%, 8/20/18 - 1/20/21 | 33,656 | 33,821 |
| franklintempleton.com | Semiannual Report | 81 |
FRANKLIN CUSTODIAN FUNDS
STATEMENT OF INVESTMENTS (UNAUDITED)
Franklin U.S. Government Securities Fund (continued)
| | Principal Amount | | Value | |||||||||
| Mortgage-Backed Securities (continued) | ||||||||||||
| Government National Mortgage Association (GNMA) Fixed Rate (continued) | ||||||||||||
| GNMA II SF 30 Year, 11.00%, 1/20/19 - 1/20/21 | $ | 4,247 | $ | 4,262 | ||||||||
|
| |||||||||||
| Total Mortgage-Backed Securities (Cost $5,285,784,244) | 5,257,463,418 | |||||||||||
|
| |||||||||||
| U.S. Government and Agency Securities (Cost $90,459,572) 1.6% | ||||||||||||
| U.S. Treasury Bond, 4.75%, 2/15/37 | 67,500,000 | 86,299,658 | ||||||||||
|
| |||||||||||
Total Investments before Short Term Investments | 5,343,763,076 | |||||||||||
| Shares | ||||||||||||
| Short Term Investments (Cost $175,163,520) 3.2% | ||||||||||||
|
| |||||||||||
| Money Market Funds 3.2% | ||||||||||||
| b,c | Institutional Fiduciary Trust Money Market Portfolio, 1.24% | 175,163,520 | 175,163,520 | |||||||||
|
| |||||||||||
| Total Investments (Cost $5,551,407,336) 101.4% | 5,518,926,596 | |||||||||||
| Other Assets, less Liabilities (1.4)% | (76,577,343 | ) | ||||||||||
|
| |||||||||||
| Net Assets 100.0% | $ | 5,442,349,253 | ||||||||||
|
| |||||||||||
See Abbreviations on page 120.
aSecurity purchased on a to-be-announced (TBA) basis. See Note 1(d).
bSee Note 3(f) regarding investments in affiliated management investment companies.
cThe rate shown is the annualized seven-day effective yield at period end.
| 82 | Semiannual Report | The accompanying notes are an integral part of these financial statements. | franklintempleton.com |
FRANKLIN CUSTODIAN FUNDS
Financial Highlights
Franklin Utilities Fund
Six Months Ended (unaudited) | Year Ended September 30, | |||||||||||||||||||||||
| 2017 | 2016 | 2015 | 2014 | 2013 | ||||||||||||||||||||
Class A | ||||||||||||||||||||||||
| Per share operating performance (for a share outstanding throughout the period) | ||||||||||||||||||||||||
Net asset value, beginning of period | $19.18 | $17.85 | $16.08 | $16.58 | $14.62 | $14.04 | ||||||||||||||||||
Income from investment operationsa: | ||||||||||||||||||||||||
Net investment incomeb | 0.24 | 0.53 | 0.48 | 0.49 | 0.49 | 0.49 | ||||||||||||||||||
Net realized and unrealized gains (losses) | (0.96) | 1.30 | 2.31 | (0.09 | ) | 2.00 | 0.60 | |||||||||||||||||
Total from investment operations | (0.72) | 1.83 | 2.79 | 0.40 | 2.49 | 1.09 | ||||||||||||||||||
Less distributions from: | ||||||||||||||||||||||||
Net investment income. | (0.30) | (0.49 | ) | (0.50 | ) | (0.48 | ) | (0.49 | ) | (0.51 | ) | |||||||||||||
Net realized gains | (0.31) | (0.01 | ) | (0.52 | ) | (0.42 | ) | (0.04 | ) | — | ||||||||||||||
Total distributions | (0.61) | (0.50 | ) | (1.02 | ) | (0.90 | ) | (0.53 | ) | (0.51 | ) | |||||||||||||
Net asset value, end of period | $17.85 | $19.18 | $17.85 | $16.08 | $16.58 | $14.62 | ||||||||||||||||||
Total returnc | (3.99)% | 10.38% | 18.23% | 2.19% | 17.24% | 7.92% | ||||||||||||||||||
Ratios to average net assetsd | ||||||||||||||||||||||||
Expenses | 0.72%e,f | 0.75% | e,f | 0.73% | e,f | 0.73% | f | 0.75% | e,f | 0.75% | e | |||||||||||||
Net investment income | 2.63% | 2.86% | 2.81% | 2.88% | 3.05% | 3.34% | ||||||||||||||||||
Supplemental data | ||||||||||||||||||||||||
Net assets, end of period (000’s) | $3,729,894 | $4,182,780 | $4,180,124 | $3,524,835 | $3,717,397 | $3,275,129 | ||||||||||||||||||
Portfolio turnover rate | 2.60% | 0.89% | 7.17% | 9.55% | 8.10% | 4.57% | ||||||||||||||||||
aThe amount shown for a share outstanding throughout the period may not correlate with the Statement of Operations for the period due to the timing of sales and repurchases of the Fund’s shares in relation to income earned and/or fluctuating fair value of the investments of the Fund.
bBased on average daily shares outstanding.
cTotal return does not reflect sales commissions or contingent deferred sales charges, if applicable, and is not annualized for periods less than one year.
dRatios are annualized for periods less than one year.
eBenefit of expense reduction rounds to less than 0.01%.
fBenefit of waiver and payments by affiliates rounds to less than 0.01%.
| franklintempleton.com | The accompanying notes are an integral part of these financial statements. | Semiannual Report | 83 |
FRANKLIN CUSTODIAN FUNDS
FINANCIAL HIGHLIGHTS
Franklin Utilities Fund (continued)
| Period Ended March 31, 2018 (unaudited)a | ||||
Class M | ||||
| Per share operating performance (for a share outstanding throughout the period) | ||||
Net asset value, beginning of period | $18.14 | |||
|
| |||
Income from investment operationsb: | ||||
Net investment incomec | 0.13 | |||
|
| |||
Net realized and unrealized gains (losses) | (0.30 | ) | ||
|
| |||
Total from investment operations | (0.17 | ) | ||
|
| |||
Less distributions from net investment income | (0.13 | ) | ||
|
| |||
Net asset value, end of period | $17.84 | |||
|
| |||
Total returnd | (0.93)% | |||
Ratios to average net assetse | ||||
Expensesf | 0.57% | |||
Net investment income | 2.78% | |||
Supplemental data | ||||
Net assets, end of period (000’s) | $5 | |||
Portfolio turnover rate | 2.60% | |||
aFor the period January 25, 2018 (effective date) to March 31, 2018.
bThe amount shown for a share outstanding throughout the period may not correlate with the Statement of Operations for the period due to the timing of sales and repurchases of the Fund’s shares in relation to income earned and/or fluctuating fair value of the investments of the Fund.
cBased on average daily shares outstanding.
dTotal return does not reflect sales commissions or contingent deferred sales charges, if applicable, and is not annualized for periods less than one year.
eRatios are annualized for periods less than one year.
fBenefit of waiver and payments by affiliates and expense reduction rounds to less than 0.01%.
| 84 | Semiannual Report | The accompanying notes are an integral part of these financial statements. | franklintempleton.com |
FRANKLIN CUSTODIAN FUNDS
FINANCIAL HIGHLIGHTS
Franklin Utilities Fund (continued)
Six Months Ended (unaudited) | Year Ended September 30, | |||||||||||||||||||||||
| 2017 | 2016 | 2015 | 2014 | 2013 | ||||||||||||||||||||
Class C | ||||||||||||||||||||||||
| Per share operating performance (for a share outstanding throughout the period) | ||||||||||||||||||||||||
Net asset value, beginning of period | $19.09 | $17.76 | $16.01 | $16.50 | $14.56 | $13.98 | ||||||||||||||||||
Income from investment operationsa: | ||||||||||||||||||||||||
Net investment incomeb | 0.20 | 0.43 | 0.39 | 0.40 | 0.41 | 0.41 | ||||||||||||||||||
Net realized and unrealized gains (losses) | (0.98) | 1.30 | 2.30 | (0.08 | ) | 1.98 | 0.61 | |||||||||||||||||
Total from investment operations | (0.78) | 1.73 | 2.69 | 0.32 | 2.39 | 1.02 | ||||||||||||||||||
Less distributions from: | ||||||||||||||||||||||||
Net investment income. | (0.25) | (0.39 | ) | (0.42 | ) | (0.39 | ) | (0.41 | ) | (0.44 | ) | |||||||||||||
Net realized gains | (0.31) | (0.01 | ) | (0.52 | ) | (0.42 | ) | (0.04 | ) | — | ||||||||||||||
Total distributions | (0.56) | (0.40 | ) | (0.94 | ) | (0.81 | ) | (0.45 | ) | (0.44 | ) | |||||||||||||
Net asset value, end of period | $17.75 | $19.09 | $17.76 | $16.01 | $16.50 | $14.56 | ||||||||||||||||||
Total returnc | (4.31)% | 9.88% | 17.59% | 1.74% | 16.61% | 7.40% | ||||||||||||||||||
Ratios to average net assetsd | ||||||||||||||||||||||||
Expenses. | 1.22%e,f | 1.25% | e,f | 1.23% | e,f | 1.23% | f | 1.25% | e,f | 1.25% | e | |||||||||||||
Net investment income | 2.13% | 2.36% | 2.31% | 2.38% | 2.55% | 2.84% | ||||||||||||||||||
Supplemental data | ||||||||||||||||||||||||
Net assets, end of period (000’s) | $867,860 | $ | 981,515 | $ | 1,064,065 | $ | 931,800 | $ | 986,318 | $ | 845,173 | |||||||||||||
Portfolio turnover rate | 2.60% | 0.89% | 7.17% | 9.55% | 8.10% | 4.57% | ||||||||||||||||||
aThe amount shown for a share outstanding throughout the period may not correlate with the Statement of Operations for the period due to the timing of sales and repurchases of the Fund’s shares in relation to income earned and/or fluctuating fair value of the investments of the Fund.
bBased on average daily shares outstanding.
cTotal return does not reflect sales commissions or contingent deferred sales charges, if applicable, and is not annualized for periods less than one year.
dRatios are annualized for periods less than one year.
eBenefit of expense reduction rounds to less than 0.01%.
fBenefit of waiver and payments by affiliates rounds to less than 0.01%.
| franklintempleton.com | The accompanying notes are an integral part of these financial statements. | Semiannual Report | 85 |
FRANKLIN CUSTODIAN FUNDS
FINANCIAL HIGHLIGHTS
Franklin Utilities Fund (continued)
Six Months Ended (unaudited) | Year Ended September 30, | |||||||||||||||||||||||
| 2017 | 2016 | 2015 | 2014 | 2013 | ||||||||||||||||||||
Class R | ||||||||||||||||||||||||
| Per share operating performance (for a share outstanding throughout the period) | ||||||||||||||||||||||||
Net asset value, beginning of period | $19.11 | $17.78 | $16.02 | $16.52 | $14.58 | $14.00 | ||||||||||||||||||
|
| |||||||||||||||||||||||
Income from investment operationsa: | ||||||||||||||||||||||||
Net investment incomeb | 0.21 | 0.46 | 0.42 | 0.42 | 0.43 | 0.44 | ||||||||||||||||||
Net realized and unrealized gains (losses) | (0.97) | 1.30 | 2.30 | (0.09 | ) | 1.99 | 0.60 | |||||||||||||||||
|
| |||||||||||||||||||||||
Total from investment operations | (0.76) | 1.76 | 2.72 | 0.33 | 2.42 | 1.04 | ||||||||||||||||||
|
| |||||||||||||||||||||||
Less distributions from: | ||||||||||||||||||||||||
Net investment income. | (0.26) | (0.42 | ) | (0.44 | ) | (0.41 | ) | (0.44 | ) | (0.46 | ) | |||||||||||||
Net realized gains | (0.31) | (0.01 | ) | (0.52 | ) | (0.42 | ) | (0.04 | ) | — | ||||||||||||||
|
| |||||||||||||||||||||||
Total distributions | (0.57) | (0.43 | ) | (0.96 | ) | (0.83 | ) | (0.48 | ) | (0.46 | ) | |||||||||||||
|
| |||||||||||||||||||||||
Net asset value, end of period | $17.78 | $19.11 | $17.78 | $16.02 | $16.52 | $14.58 | ||||||||||||||||||
|
| |||||||||||||||||||||||
Total returnc | (4.18)% | 10.04% | 17.81% | 1.83% | 16.75% | 7.56% | ||||||||||||||||||
Ratios to average net assetsd | ||||||||||||||||||||||||
Expenses. | 1.07%e,f | 1.10% | e,f | 1.08% | e,f | 1.08% | f | 1.10% | e,f | 1.10% | e | |||||||||||||
Net investment income | 2.28% | 2.51% | 2.46% | 2.53% | 2.70% | 2.99% | ||||||||||||||||||
Supplemental data | ||||||||||||||||||||||||
Net assets, end of period (000’s) | $76,897 | $ | 94,465 | $ | 103,247 | $ | 83,271 | $95,498 | $ | 86,216 | ||||||||||||||
Portfolio turnover rate | 2.60% | 0.89% | 7.17% | 9.55% | 8.10% | 4.57% | ||||||||||||||||||
aThe amount shown for a share outstanding throughout the period may not correlate with the Statement of Operations for the period due to the timing of sales and repurchases of the Fund’s shares in relation to income earned and/or fluctuating fair value of the investments of the Fund.
bBased on average daily shares outstanding.
cTotal return is not annualized for periods less than one year.
dRatios are annualized for periods less than one year.
eBenefit of expense reduction rounds to less than 0.01%.
fBenefit of waiver and payments by affiliates rounds to less than 0.01%.
| 86 | Semiannual Report | The accompanying notes are an integral part of these financial statements. | franklintempleton.com |
FRANKLIN CUSTODIAN FUNDS
FINANCIAL HIGHLIGHTS
Franklin Utilities Fund (continued)
| Six Months Ended March 31, 2018 | Year Ended September 30, | |||||||||||||||||||||||
| (unaudited) | 2017 | 2016 | 2015 | 2014 | 2013a | |||||||||||||||||||
Class R6 | ||||||||||||||||||||||||
| Per share operating performance (for a share outstanding throughout the period) | ||||||||||||||||||||||||
Net asset value, beginning of period | $19.32 | $17.97 | $16.18 | $16.68 | $14.71 | $15.88 | ||||||||||||||||||
| Income from investment operationsb: | ||||||||||||||||||||||||
Net investment incomec | 0.27 | 0.58 | 0.53 | 0.53 | 0.53 | 0.25 | ||||||||||||||||||
Net realized and unrealized gains (losses) | (0.98 | ) | 1.31 | 2.32 | (0.09 | ) | 2.01 | (1.17 | ) | |||||||||||||||
Total from investment operations | (0.71 | ) | 1.89 | 2.85 | 0.44 | 2.54 | (0.92 | ) | ||||||||||||||||
| Less distributions from: | ||||||||||||||||||||||||
Net investment income | (0.32 | ) | (0.53 | ) | (0.54 | ) | (0.52 | ) | (0.53 | ) | (0.25 | ) | ||||||||||||
Net realized gains | (0.31 | ) | (0.01 | ) | (0.52 | ) | (0.42 | ) | (0.04 | ) | — | |||||||||||||
Total distributions | (0.63 | ) | (0.54 | ) | (1.06 | ) | (0.94 | ) | (0.57 | ) | (0.25 | ) | ||||||||||||
Net asset value, end of period | $17.98 | $19.32 | $17.97 | $16.18 | $16.68 | $14.71 | ||||||||||||||||||
Total returnd | (3.90)% | 10.70% | 18.55% | 2.45% | 17.51% | (5.79)% | ||||||||||||||||||
Ratios to average net assetse | ||||||||||||||||||||||||
Expenses before waiver and payments by affiliates | 0.52% | 0.48% | 0.47% | 0.47% | 0.48% | 0.48% | ||||||||||||||||||
Expenses net of waiver and payments by affiliates | 0.49%f | 0.48% | f,g | 0.47% | f,g | 0.47% | g | 0.48% | f,g | 0.48%f | ||||||||||||||
Net investment income | 2.86% | 3.13% | 3.07% | 3.14% | 3.32% | 3.61% | ||||||||||||||||||
Supplemental data | ||||||||||||||||||||||||
Net assets, end of period (000’s) | $221,503 | $ | 241,455 | $ | 219,587 | $ | 201,225 | $ | 236,437 | $ | 218,746 | |||||||||||||
Portfolio turnover rate | 2.60% | 0.89% | 7.17% | 9.55% | 8.10% | 4.57% | ||||||||||||||||||
aFor the period May 1, 2013 (effective date) to September 30, 2013.
bThe amount shown for a share outstanding throughout the period may not correlate with the Statement of Operations for the period due to the timing of sales and repurchases of the Fund’s shares in relation to income earned and/or fluctuating fair value of the investments of the Fund.
cBased on average daily shares outstanding.
dTotal return is not annualized for periods less than one year.
eRatios are annualized for periods less than one year.
fBenefit of expense reduction rounds to less than 0.01%.
gBenefit of waiver and payments by affiliates rounds to less than 0.01%.
| franklintempleton.com | The accompanying notes are an integral part of these financial statements. | Semiannual Report | 87 |
FRANKLIN CUSTODIAN FUNDS
FINANCIAL HIGHLIGHTS
Franklin Utilities Fund (continued)
| Six Months Ended March 31, 2018 | Year Ended September 30, | |||||||||||||||||||||||
| (unaudited) | 2017 | 2016 | 2015 | 2014 | 2013 | |||||||||||||||||||
Advisor Class | ||||||||||||||||||||||||
| Per share operating performance (for a share outstanding throughout the period) | ||||||||||||||||||||||||
Net asset value, beginning of period | $19.32 | $17.97 | $16.19 | $16.68 | $14.71 | $14.12 | ||||||||||||||||||
| Income from investment operationsa: | ||||||||||||||||||||||||
Net investment incomeb | 0.26 | 0.57 | 0.51 | 0.52 | 0.52 | 0.50 | ||||||||||||||||||
Net realized and unrealized gains (losses) | (0.98 | ) | 1.30 | 2.32 | (0.09 | ) | 2.00 | 0.62 | ||||||||||||||||
Total from investment operations | (0.72 | ) | 1.87 | 2.83 | 0.43 | 2.52 | 1.12 | |||||||||||||||||
| Less distributions from: | ||||||||||||||||||||||||
Net investment income | (0.31 | ) | (0.51 | ) | (0.53 | ) | (0.50 | ) | (0.51 | ) | (0.53 | ) | ||||||||||||
Net realized gains | (0.31 | ) | (0.01 | ) | (0.52 | ) | (0.42 | ) | (0.04 | ) | — | |||||||||||||
Total distributions | (0.62 | ) | (0.52 | ) | (1.05 | ) | (0.92 | ) | (0.55 | ) | (0.53 | ) | ||||||||||||
Net asset value, end of period | $17.98 | $19.32 | $17.97 | $16.19 | $16.68 | $14.71 | ||||||||||||||||||
Total returnc | (4.00)% | 10.64% | 18.34% | 2.40% | 17.37% | 8.11% | ||||||||||||||||||
Ratios to average net assetsd | ||||||||||||||||||||||||
Expenses. | 0.57% | e,f | 0.60% | e,f | 0.58% | e,f | 0.58% | f | 0.60% | e,f | 0.60% | e | ||||||||||||
Net investment income | 2.78% | 3.01% | 2.96% | 3.03% | 3.20% | 3.49% | ||||||||||||||||||
Supplemental data | ||||||||||||||||||||||||
Net assets, end of period (000’s) | $884,092 | $ | 963,228 | $ | 755,484 | $ | 549,371 | $ | 562,202 | $ | 343,082 | |||||||||||||
Portfolio turnover rate | 2.60% | 0.89% | 7.17% | 9.55% | 8.10% | 4.57% | ||||||||||||||||||
aThe amount shown for a share outstanding throughout the period may not correlate with the Statement of Operations for the period due to the timing of sales and repurchases of the Fund’s shares in relation to income earned and/or fluctuating fair value of the investments of the Fund.
bBased on average daily shares outstanding.
cTotal return is not annualized for periods less than one year.
dRatios are annualized for periods less than one year.
eBenefit of expense reduction rounds to less than 0.01%.
fBenefit of waiver and payments by affiliates rounds to less than 0.01%.
| 88 | Semiannual Report | The accompanying notes are an integral part of these financial statements. | franklintempleton.com |
FRANKLIN CUSTODIAN FUNDS
Statement of Investments, March 31, 2018 (unaudited)
Franklin Utilities Fund
| Country | Shares | Value | |||||||||||
Common Stocks 99.3% | ||||||||||||||
Electric Utilities 57.8% | ||||||||||||||
ALLETE Inc. | United States | 397,290 | $ | 28,704,202 | ||||||||||
Alliant Energy Corp. | United States | 3,800,000 | 155,268,000 | |||||||||||
American Electric Power Co. Inc. | United States | 3,900,000 | 267,501,000 | |||||||||||
Duke Energy Corp. | United States | 3,250,000 | 251,777,500 | |||||||||||
Edison International | United States | 3,600,000 | 229,176,000 | |||||||||||
Emera Inc. | Canada | 2,000,000 | 63,206,048 | |||||||||||
Entergy Corp. | United States | 1,500,000 | 118,170,000 | |||||||||||
Eversource Energy | United States | 2,300,000 | 135,516,000 | |||||||||||
Exelon Corp. | United States | 6,700,000 | 261,367,000 | |||||||||||
FirstEnergy Corp. | United States | 4,800,000 | 163,248,000 | |||||||||||
Great Plains Energy Inc. | United States | 5,100,000 | 162,129,000 | |||||||||||
a | Hydro One Ltd., 144A | Canada | 1,000,000 | 16,220,198 | ||||||||||
NextEra Energy Inc. | United States | 2,900,000 | 473,657,000 | |||||||||||
OGE Energy Corp. | United States | 1,800,000 | 58,986,000 | |||||||||||
PG&E Corp. | United States | 2,800,000 | 123,004,000 | |||||||||||
Pinnacle West Capital Corp. | United States | 1,500,000 | 119,700,000 | |||||||||||
PNM Resources Inc. | United States | 2,500,000 | 95,625,000 | |||||||||||
Portland General Electric Co. | United States | 570,928 | 23,128,293 | |||||||||||
PPL Corp. | United States | 2,750,000 | 77,797,500 | |||||||||||
The Southern Co. | United States | 4,500,000 | 200,970,000 | |||||||||||
Westar Energy Inc. | United States | 2,000,000 | 105,180,000 | |||||||||||
| Xcel Energy Inc. | United States | 4,600,000 | 209,208,000 | |||||||||||
| 3,339,538,741 | ||||||||||||||
Gas Utilities 1.6% | ||||||||||||||
Atmos Energy Corp. | United States | 200,000 | 16,848,000 | |||||||||||
ONE Gas Inc. | United States | 38,181 | 2,520,710 | |||||||||||
| Spire Inc. | United States | 1,000,000 | 72,300,000 | |||||||||||
| 91,668,710 | ||||||||||||||
Multi-Utilities 32.2% | ||||||||||||||
Ameren Corp. | United States | 900,000 | 50,967,000 | |||||||||||
Black Hills Corp. | United States | 800,000 | 43,440,000 | |||||||||||
CenterPoint Energy Inc. | United States | 5,000,000 | 137,000,000 | |||||||||||
CMS Energy Corp. | United States | 5,100,000 | 230,979,000 | |||||||||||
Consolidated Edison Inc. | United States | 1,250,000 | 97,425,000 | |||||||||||
Dominion Energy Inc. | United States | 4,200,000 | 283,206,000 | |||||||||||
DTE Energy Co. | United States | 1,683,000 | 175,705,200 | |||||||||||
National Grid PLC | United Kingdom | 10,083,333 | 113,494,647 | |||||||||||
NiSource Inc. | United States | 2,500,000 | 59,775,000 | |||||||||||
NorthWestern Corp. | United States | 596,800 | 32,107,840 | |||||||||||
Public Service Enterprise Group Inc. | United States | 2,900,000 | 145,696,000 | |||||||||||
Sempra Energy | United States | 2,650,000 | 294,733,000 | |||||||||||
Vectren Corp. | United States | 1,000,000 | 63,920,000 | |||||||||||
| WEC Energy Group Inc. | United States | 2,150,792 | 134,854,658 | |||||||||||
| 1,863,303,345 | ||||||||||||||
Oil, Gas & Consumable Fuels 4.4% | ||||||||||||||
Enbridge Inc. (CAD Traded) | Canada | 847,200 | 26,616,433 | |||||||||||
Enbridge Inc. (USD Traded) | Canada | 984,000 | 30,966,480 | |||||||||||
Kinder Morgan Inc. | United States | 5,000,000 | 75,300,000 | |||||||||||
ONEOK Inc. | United States | 568,200 | 32,341,944 | |||||||||||
TransCanada Corp. | Canada | 1,000,000 | 41,310,331 | |||||||||||
| franklintempleton.com | Semiannual Report | 89 |
FRANKLIN CUSTODIAN FUNDS
STATEMENT OF INVESTMENTS (UNAUDITED)
Franklin Utilities Fund (continued)
| Country | Shares | Value | ||||||||||||
Common Stocks (continued) | ||||||||||||||
| Oil, Gas & Consumable Fuels (continued) | ||||||||||||||
| The Williams Cos. Inc. | United States | 1,800,000 | $ | 44,748,000 | ||||||||||
| 251,283,188 | ||||||||||||||
Water Utilities 3.3% | ||||||||||||||
American Water Works Co. Inc. | United States | 1,500,000 | 123,195,000 | |||||||||||
United Utilities Group PLC | United Kingdom | 6,700,000 | 67,253,107 | |||||||||||
| 190,448,107 | ||||||||||||||
Total Common Stocks (Cost $3,332,316,762) | 5,736,242,091 | |||||||||||||
| Principal Amount | ||||||||||||||
Corporate Bonds 0.2% | ||||||||||||||
Electric Utilities 0.1% | ||||||||||||||
Northeast Generation Co., senior secured note, B-1, 8.812%, 10/15/26 | United States | $ | 5,613,281 | 6,234,430 | ||||||||||
Multi-Utilities 0.1% | ||||||||||||||
Aquila Inc., senior note, 8.27%, 11/15/21 | United States | 6,100,000 | 7,001,436 | |||||||||||
Total Corporate Bonds (Cost $11,799,234) | 13,235,866 | |||||||||||||
Total Investments before Short Term Investments | 5,749,477,957 | |||||||||||||
| Shares | ||||||||||||||
Short Term Investments (Cost $8,879,870) 0.1% | ||||||||||||||
Money Market Funds 0.1% | ||||||||||||||
b,c | Institutional Fiduciary Trust Money Market Portfolio, 1.24% | United States | 8,879,870 | 8,879,870 | ||||||||||
Total Investments (Cost $3,352,995,866) 99.6% | 5,758,357,827 | |||||||||||||
Other Assets, less Liabilities 0.4% | 21,893,662 | |||||||||||||
Net Assets 100.0% | $ | 5,780,251,489 | ||||||||||||
See Abbreviations on page 120.
aSecurity was purchased pursuant to Rule 144A under the Securities Act of 1933 and may be sold in transactions exempt from registration only to qualified institutional buyers or in a public offering registered under the Securities Act of 1933. This security has been deemed liquid under guidelines approved by the Trust’s Board of Trustees. At March 31, 2018, the value of this security was $16,220,198, representing 0.3% of net assets.
bSee Note 3(f) regarding investments in affiliated management investment companies.
cThe rate shown is the annualized seven-day effective yield at period end.
| 90 | Semiannual Report | The accompanying notes are an integral part of these financial statements. | franklintempleton.com |
FRANKLIN CUSTODIAN FUNDS
Statements of Assets and Liabilities
March 31, 2018 (unaudited)
| Franklin DynaTech Fund | Franklin Growth Fund | Franklin Income Fund | ||||||||||
Assets: | ||||||||||||
+Investments in securities: | ||||||||||||
Cost - Unaffiliated issuers | $2,528,296,034 | $ | 5,337,205,858 | $ | 73,617,605,594 | |||||||
Cost - Controlled affiliates (Note 3f and 11) | — | — | 299,161,226 | |||||||||
Cost - Non-controlled affiliates (Note 3f and 11) | 168,212,818 | 252,178,231 | 509,074,939 | |||||||||
Cost - Unaffiliated repurchase agreements | — | — | 17,011,579 | |||||||||
Value - Unaffiliated issuers | $4,961,771,054 | $ | 14,572,435,051 | $ | 75,592,721,941 | |||||||
Value - Controlled affiliates (Note 3f and 11) | — | — | 302,701,595 | |||||||||
Value - Non-controlled affiliates (Note 3f and 11) | 168,212,818 | 252,178,231 | 312,618,967 | |||||||||
Value - Unaffiliated repurchase agreements | — | — | 17,011,579 | |||||||||
Cash | 151,200 | 3,285,730 | 25,233,853 | |||||||||
Receivables: | ||||||||||||
Investment securities sold | 27,434,624 | — | 462,502,299 | |||||||||
Capital shares sold | 40,697,663 | 11,590,221 | 61,719,078 | |||||||||
Dividends and interest | 1,165,636 | 10,672,410 | 743,697,397 | |||||||||
Deposits with brokers for: | ||||||||||||
Exchange traded options written | — | — | 890,000,000 | |||||||||
Other assets | 4,614 | 14,127 | 76,063 | |||||||||
Total assets | 5,199,437,609 | 14,850,175,770 | 78,408,282,772 | |||||||||
Liabilities: | ||||||||||||
Payables: | ||||||||||||
Investment securities purchased | 60,271,323 | — | 189,087,500 | |||||||||
Capital shares redeemed | 16,656,380 | 34,591,326 | 103,846,539 | |||||||||
Management fees | 1,903,262 | 5,395,306 | 23,895,317 | |||||||||
Distribution fees | 1,986,531 | 5,502,249 | 33,641,335 | |||||||||
Transfer agent fees | 1,272,650 | 4,428,244 | 10,758,150 | |||||||||
Options written, at value (premiums received $—, $— and $19,982,836, respectively) | — | — | 22,440,000 | |||||||||
Payable upon return of securities loaned | — | — | 101,750,579 | |||||||||
Unrealized depreciation on unfunded loan commitments (Note 9) | — | — | 185,800 | |||||||||
Accrued expenses and other liabilities | 149,302 | 708,016 | 4,435,753 | |||||||||
Total liabilities | 82,239,448 | 50,625,141 | 490,040,973 | |||||||||
Net assets, at value | $5,117,198,161 | $ | 14,799,550,629 | $ | 77,918,241,799 | |||||||
Net assets consist of: | ||||||||||||
Paid-in capital | $2,611,147,992 | $ | 5,429,732,859 | $ | 81,285,315,302 | |||||||
Accumulated net investment loss | (15,595,995) | — | — | |||||||||
Undistributed net investment income | — | 4,983,177 | — | |||||||||
Distributions in excess of net investment income | — | — | (557,606,440 | ) | ||||||||
Net unrealized appreciation (depreciation) | 2,433,438,884 | 9,235,229,164 | 1,780,591,730 | |||||||||
Accumulated net realized gain (loss) | 88,207,280 | 129,605,429 | (4,590,058,793 | ) | ||||||||
Net assets, at value | $5,117,198,161 | $ | 14,799,550,629 | $ | 77,918,241,799 | |||||||
+Includes securities loaned | $ — | $ | — | $ | 97,991,090 | |||||||
| franklintempleton.com | The accompanying notes are an integral part of these financial statements. | Semiannual Report | 91 |
FRANKLIN CUSTODIAN FUNDS
FINANCIAL STATEMENTS
Statements of Assets and Liabilities (continued)
March 31, 2018 (unaudited)
| Franklin DynaTech Fund | Franklin Growth Fund | Franklin Income Fund | ||||||||||
| Class A: | ||||||||||||
Net assets, at value | $2,915,885,158 | $8,336,492,282 | $43,544,926,764 | |||||||||
Shares outstanding. | 41,711,070 | 86,579,296 | 19,055,990,161 | |||||||||
Net asset value per sharea | $69.91 | $96.29 | $2.29 | |||||||||
Maximum offering price per share (net asset value per share ÷ 94.25%, 94.25% and 95.75%, respectively) | $74.18 | $102.16 | $2.39 | |||||||||
| Class M: | ||||||||||||
Net assets, at value | $ 4,702 | |||||||||||
Shares outstanding. | 2,058 | |||||||||||
Net asset value per sharea,b | $2.29 | |||||||||||
Maximum offering price per share (net asset value per share ÷ 95.75%) | $2.39 | |||||||||||
| Class C: | ||||||||||||
Net assets, at value | $ 468,828,325 | $ 994,442,847 | $20,981,302,105 | |||||||||
Shares outstanding. | 7,966,368 | 11,252,188 | 9,062,261,038 | |||||||||
Net asset value and maximum offering price per sharea | $58.85 | $88.38 | $2.32 | |||||||||
| Class R: | ||||||||||||
Net assets, at value | $64,438,760 | $ 507,133,236 | $ 308,864,427 | |||||||||
Shares outstanding. | 947,228 | 5,288,974 | 137,676,454 | |||||||||
Net asset value and maximum offering price per share | $68.03 | $95.88 | $2.24 | |||||||||
| Class R6: | ||||||||||||
Net assets, at value | $1,242,879,666 | $2,264,311,803 | $ 2,099,137,411 | |||||||||
Shares outstanding. | 17,143,019 | 23,488,134 | 925,884,777 | |||||||||
Net asset value and maximum offering price per share | $72.50 | $96.40 | $2.27 | |||||||||
| Advisor Class: | ||||||||||||
Net assets, at value | $ 425,166,252 | $2,697,170,461 | $10,984,006,390 | |||||||||
Shares outstanding. | 5,914,499 | 27,951,918 | 4,846,825,889 | |||||||||
Net asset value and maximum offering price per share | $71.89 | $96.49 | $2.27 | |||||||||
aRedemption price is equal to net asset value less contingent deferred sales charges, if applicable.
bNet asset value and maximum offering price may not recalculate due to rounding of net assets and/or shares outstanding.
| 92 | Semiannual Report | The accompanying notes are an integral part of these financial statements. | franklintempleton.com |
FRANKLIN CUSTODIAN FUNDS
FINANCIAL STATEMENTS
Statements of Assets and Liabilities (continued)
March 31, 2018 (unaudited)
Franklin U.S. Government | Franklin Utilities Fund | |||||||
Assets: | ||||||||
Investments in securities: | ||||||||
Cost - Unaffiliated issuers | $5,376,243,816 | $3,344,115,996 | ||||||
Cost - Non-controlled affiliates (Note 3f and 11) | 175,163,520 | 8,879,870 | ||||||
Value - Unaffiliated issuers | $5,343,763,076 | $5,749,477,957 | ||||||
Value - Non-controlled affiliates (Note 3f and 11) | 175,163,520 | 8,879,870 | ||||||
Cash | — | 2,466,500 | ||||||
Receivables: | ||||||||
Investment securities sold | — | 16,244,543 | ||||||
Capital shares sold | 2,711,239 | 7,237,785 | ||||||
Dividends and interest | 16,946,615 | 11,407,836 | ||||||
Other assets | 4,978 | 5,644 | ||||||
Total assets. | 5,538,589,428 | 5,795,720,135 | ||||||
Liabilities: | ||||||||
Payables: | ||||||||
Investment securities purchased | 77,048,437 | — | ||||||
Capital shares redeemed | 11,060,211 | 9,965,954 | ||||||
Management fees | 2,019,776 | 2,188,324 | ||||||
Distribution fees. | 1,554,901 | 1,862,435 | ||||||
Transfer agent fees | 1,992,111 | 1,103,730 | ||||||
Distributions to shareholders | 1,754,907 | — | ||||||
Accrued expenses and other liabilities | 809,832 | 348,203 | ||||||
Total liabilities | 96,240,175 | 15,468,646 | ||||||
Net assets, at value | $5,442,349,253 | $5,780,251,489 | ||||||
Net assets consist of: | ||||||||
Paid-in capital | $6,024,919,036 | $3,283,063,304 | ||||||
Undistributed net investment income | — | 3,574,625 | ||||||
Distributions in excess of net investment income | (16,209,048 | ) | — | |||||
Net unrealized appreciation (depreciation) | (32,480,740 | ) | 2,405,374,786 | |||||
Accumulated net realized gain (loss) | (533,879,995 | ) | 88,238,774 | |||||
Net assets, at value | $5,442,349,253 | $5,780,251,489 | ||||||
| franklintempleton.com | The accompanying notes are an integral part of these financial statements. | Semiannual Report | 93 |
FRANKLIN CUSTODIAN FUNDS
FINANCIAL STATEMENTS
Statements of Assets and Liabilities (continued)
March 31, 2018 (unaudited)
Franklin U.S. Government | Franklin Utilities Fund | |||||||
Class A: | ||||||||
Net assets, at value | $3,416,941,883 | $3,729,893,930 | ||||||
Shares outstanding | 574,367,234 | 209,013,105 | ||||||
Net asset value per sharea | $5.95 | $17.85 | ||||||
Maximum offering price per share (net asset value per share ÷ 95.75%) | $6.21 | $18.64 | ||||||
Class M: | ||||||||
Net assets, at value | $4,931 | $4,918 | ||||||
Shares outstanding | 829 | 276 | ||||||
Net asset value per sharea | $5.95 | $17.84b | ||||||
Maximum offering price per share (net asset value per share ÷ 95.75%) | $6.21 | $18.63 | ||||||
Class C: | ||||||||
Net assets, at value | $667,399,837 | $867,860,093 | ||||||
Shares outstanding | 112,986,967 | 48,882,950 | ||||||
Net asset value and maximum offering price per sharea | $5.91 | $17.75 | ||||||
Class R: | ||||||||
Net assets, at value | $33,832,267 | $76,897,321 | ||||||
Shares outstanding | 5,690,329 | 4,325,455 | ||||||
Net asset value and maximum offering price per share | $5.95 | $17.78 | ||||||
Class R6: | ||||||||
Net assets, at value | $607,967,316 | $221,503,265 | ||||||
Shares outstanding | 101,860,668 | 12,321,043 | ||||||
Net asset value and maximum offering price per share | $5.97 | $17.98 | ||||||
Advisor Class: | ||||||||
Net assets, at value | $716,203,019 | $884,091,962 | ||||||
Shares outstanding | 119,976,177 | 49,170,103 | ||||||
Net asset value and maximum offering price per share | $5.97 | $17.98 | ||||||
aRedemption price is equal to net asset value less contingent deferred sales charges, if applicable.
bNet asset value and maximum offering price may not recalculate due to rounding of net assets and/or shares outstanding.
| 94 | Semiannual Report | The accompanying notes are an integral part of these financial statements. | franklintempleton.com |
FRANKLIN CUSTODIAN FUNDS
FINANCIAL STATEMENTS
Statements of Operations
for the six months ended March 31, 2018 (unaudited)
| Franklin DynaTech Fund | Franklin Growth Fund | Franklin Income Fund | ||||||||||
Investment income: | ||||||||||||
Dividends: (net of foreign taxes)* | ||||||||||||
Unaffiliated issuers. | $ 11,781,844 | $90,274,304 | $570,103,269 | |||||||||
Non-controlled affiliates (Note 3f and 11) | 573,368 | 1,092,627 | 6,942,930 | |||||||||
Interest: | ||||||||||||
Unaffiliated issuers. | — | — | 1,219,066,961 | |||||||||
Controlled affiliates (Note 11) | — | — | 2,746,885 | |||||||||
Non-controlled affiliates (Note 11) | — | — | 30,864,897 | |||||||||
Income from securities loaned (net of fees and rebates) | — | — | 886,608 | |||||||||
Total investment income | 12,355,212 | 91,366,931 | 1,830,611,550 | |||||||||
Expenses: | ||||||||||||
Management fees (Note 3a) | 10,791,606 | 32,842,942 | 151,030,270 | |||||||||
Distribution fees: (Note 3c) | ||||||||||||
Class A | 3,437,272 | 10,495,467 | 34,129,922 | |||||||||
Class C | 2,127,044 | 4,916,993 | 72,109,149 | |||||||||
Class R | 136,529 | 1,305,745 | 842,224 | |||||||||
Transfer agent fees: (Note 3e) | ||||||||||||
Class A | 2,020,528 | 6,003,055 | 17,051,463 | |||||||||
Class M | — | — | 1 | |||||||||
Class C | 312,575 | 703,075 | 8,313,542 | |||||||||
Class R | 40,286 | 375,148 | 127,381 | |||||||||
Class R6 | 119,096 | 244,240 | 217,901 | |||||||||
Advisor Class | 315,825 | 1,923,149 | 4,250,306 | |||||||||
Custodian fees (Note 4) | 36,856 | 61,908 | 544,240 | |||||||||
Reports to shareholders | 170,136 | 481,253 | 2,224,712 | |||||||||
Registration and filing fees | 139,068 | 176,313 | 548,864 | |||||||||
Professional fees | 34,863 | 78,952 | 1,266,353 | |||||||||
Trustees’ fees and expenses | 6,140 | 24,529 | 161,538 | |||||||||
Other | 33,321 | 114,762 | 957,696 | |||||||||
Total expenses | 19,721,145 | 59,747,531 | 293,775,562 | |||||||||
Expense reductions (Note 4) | (25 | ) | (235 | ) | (104,142 | ) | ||||||
Expenses waived/paid by affiliates (Note 3f and 3g) | (247,006 | ) | (478,233 | ) | (3,121,642 | ) | ||||||
Net expenses | 19,474,114 | 59,269,063 | 290,549,778 | |||||||||
Net investment income (loss) | (7,118,902 | ) | 32,097,868 | 1,540,061,772 | ||||||||
Realized and unrealized gains (losses): | ||||||||||||
Net realized gain (loss) from: | ||||||||||||
Investments: | ||||||||||||
Unaffiliated issuers | 95,334,341 | 220,978,669 | 1,387,929,211 | |||||||||
Non-controlled affiliates (Note 3f and 11) | — | — | (367,030,218 | ) | ||||||||
Written options | — | — | 51,908,601 | |||||||||
Foreign currency transactions | (94,948 | ) | 13,138 | (158,972 | ) | |||||||
Net realized gain (loss) | 95,239,393 | 220,991,807 | 1,072,648,622 | |||||||||
Net change in unrealized appreciation (depreciation) on: | ||||||||||||
Investments: | ||||||||||||
Unaffiliated issuers | 443,304,096 | 872,974,910 | (4,552,134,319 | ) | ||||||||
Controlled affiliates (Note 3f and 11) | — | — | 53,570,976 | |||||||||
Non-controlled affiliates (Note 3f and 11) | — | — | 252,746,144 | |||||||||
Translation of other assets and liabilities denominated in foreign currencies | (39,350 | ) | — | (17,074 | ) | |||||||
Written options | — | — | 662,521 | |||||||||
Net change in unrealized appreciation (depreciation) | 443,264,746 | 872,974,910 | (4,245,171,752 | ) | ||||||||
Net realized and unrealized gain (loss) | 538,504,139 | 1,093,966,717 | (3,172,523,130 | ) | ||||||||
Net increase (decrease) in net assets resulting from operations | $531,385,237 | $1,126,064,585 | $(1,632,461,358 | ) | ||||||||
*Foreign taxes withheld on dividends | $24,765 | $ 572,839 | $ 13,610,200 | |||||||||
| franklintempleton.com | The accompanying notes are an integral part of these financial statements. | Semiannual Report | 95 |
FRANKLIN CUSTODIAN FUNDS
FINANCIAL STATEMENTS
Statements of Operations (continued)
for the six months ended March 31, 2018 (unaudited)
Franklin U.S. Government | Franklin Utilities Fund | |||||||
Investment income: | ||||||||
Dividends: (net of foreign taxes)* | ||||||||
Unaffiliated issuers | $ — | $102,721,294 | ||||||
Non-controlled affiliates (Note 3f and 11) | 566,442 | 159,746 | ||||||
Interest: | ||||||||
Unaffiliated issuers: | ||||||||
Paydown gain (loss) | (15,826,313 | ) | — | |||||
Paid in cash | 104,970,037 | 1,015,251 | ||||||
Income from securities loaned (net of fees and rebates) | — | 11 | ||||||
Total investment income | 89,710,166 | 103,896,302 | ||||||
Expenses: | ||||||||
Management fees (Note 3a) | 12,660,117 | 14,087,787 | ||||||
Distribution fees: (Note 3c) | ||||||||
Class A | 2,571,084 | 2,994,117 | ||||||
Class C | 2,359,268 | 3,050,947 | ||||||
Class R | 88,273 | 217,030 | ||||||
Transfer agent fees: (Note 3e) | ||||||||
Class A | 2,572,433 | 2,095,406 | ||||||
Class M | 1 | 1 | ||||||
Class C | 534,190 | 492,704 | ||||||
Class R | 26,334 | 45,821 | ||||||
Class R6 | 65,448 | 56,844 | ||||||
Advisor Class | 552,332 | 496,301 | ||||||
Custodian fees (Note 4) | 23,891 | 42,451 | ||||||
Reports to shareholders | 225,692 | 233,186 | ||||||
Registration and filing fees | 94,333 | 90,915 | ||||||
Professional fees | 48,911 | 48,336 | ||||||
Trustees’ fees and expenses | 11,879 | 12,321 | ||||||
Other | 514,339 | 55,561 | ||||||
Total expenses | 22,348,525 | 24,019,728 | ||||||
Expense reductions (Note 4) | (39 | ) | (958 | ) | ||||
Expenses waived/paid by affiliates (Note 3f and 3g) | (226,865 | ) | (106,191 | ) | ||||
Net expenses | 22,121,621 | 23,912,579 | ||||||
Net investment income | 67,588,545 | 79,983,723 | ||||||
Realized and unrealized gains (losses): | ||||||||
Net realized gain (loss) from: | ||||||||
Investments: | ||||||||
Unaffiliated issuers | (9,044,695 | ) | 114,622,749 | |||||
Foreign currency transactions. | — | 83,970 | ||||||
Net realized gain (loss) | (9,044,695 | ) | 114,706,719 | |||||
Net change in unrealized appreciation (depreciation) on: | ||||||||
Investments: | ||||||||
Unaffiliated issuers | (139,665,584 | ) | (452,919,658 | ) | ||||
Translation of other assets and liabilities denominated in foreign currencies | — | 13,012 | ||||||
Net change in unrealized appreciation (depreciation) | (139,665,584 | ) | (452,906,646 | ) | ||||
Net realized and unrealized gain (loss) | (148,710,279 | ) | (338,199,927 | ) | ||||
Net increase (decrease) in net assets resulting from operations | $ (81,121,734 | ) | $(258,216,204 | ) | ||||
*Foreign taxes withheld on dividends | $ — | $787,004 | ||||||
| 96 | Semiannual Report | The accompanying notes are an integral part of these financial statements. | franklintempleton.com |
FRANKLIN CUSTODIAN FUNDS
FINANCIAL STATEMENTS
Statements of Changes in Net Assets
| Franklin DynaTech Fund | Franklin Growth Fund | |||||||||||||||
| Six Months Ended | Six Months Ended | |||||||||||||||
| March 31, 2018 (unaudited) | Year Ended September 30, 2017 | March 31, 2018 (unaudited) | Year Ended September 30, 2017 | |||||||||||||
Increase (decrease) in net assets: | ||||||||||||||||
Operations: | ||||||||||||||||
Net investment income (loss) | $ (7,118,902 | ) | $ (10,773,451 | ) | $ 32,097,868 | $ 65,365,826 | ||||||||||
Net realized gain (loss) | 95,239,393 | 110,351,134 | 220,991,807 | 281,282,680 | ||||||||||||
Net change in unrealized appreciation (depreciation) | 443,264,746 | 687,873,992 | 872,974,910 | 2,130,737,126 | ||||||||||||
Net increase (decrease) in net assets resulting from operations | 531,385,237 | 787,451,675 | 1,126,064,585 | 2,477,385,632 | ||||||||||||
Distributions to shareholders from: | ||||||||||||||||
Net investment income: | ||||||||||||||||
Class A | — | — | (31,386,194 | ) | (36,895,906 | ) | ||||||||||
Class R | — | — | (717,885 | ) | (1,230,882 | ) | ||||||||||
Class R6 | — | — | (16,406,737 | ) | (11,177,576 | ) | ||||||||||
Advisor Class | — | — | (15,847,658 | ) | (15,699,120 | ) | ||||||||||
Net realized gains: | ||||||||||||||||
Class A | (46,020,811 | ) | (67,256,053 | ) | (195,463,740 | ) | (234,479,371 | ) | ||||||||
Class C | �� | (8,263,869 | ) | (11,758,906 | ) | (24,691,047 | ) | (28,670,653 | ) | |||||||
Class R | (916,851 | ) | (1,284,067 | ) | (12,407,706 | ) | (14,987,347 | ) | ||||||||
Class R6 | (16,654,639 | ) | (11,046,724 | ) | (50,248,000 | ) | (38,880,082 | ) | ||||||||
Advisor Class | (5,793,931 | ) | (7,824,210 | ) | (61,022,144 | ) | (64,547,148 | ) | ||||||||
Total distributions to shareholders | (77,650,101 | ) | (99,169,960 | ) | (408,191,111 | ) | (446,568,085 | ) | ||||||||
Capital share transactions: (Note 2) | ||||||||||||||||
Class A | 145,712,737 | (58,619,051 | ) | (131,157,188 | ) | (775,062,897 | ) | |||||||||
Class C | 56,075,988 | (5,464,905 | ) | 17,878,065 | (50,580,939 | ) | ||||||||||
Class R | 11,887,480 | 1,319,443 | (30,195,848 | ) | (43,562,140 | ) | ||||||||||
Class R6 | 690,870,713 | 11,234,886 | 469,075,500 | 215,211,021 | ||||||||||||
Advisor Class | (332,447,190 | ) | 410,822,596 | (238,778,470 | ) | 419,014,663 | ||||||||||
Total capital share transactions | 572,099,728 | 359,292,969 | 86,822,059 | (234,980,292 | ) | |||||||||||
Net increase (decrease) in net assets | 1,025,834,864 | 1,047,574,684 | 804,695,533 | 1,795,837,255 | ||||||||||||
Net assets: | ||||||||||||||||
Beginning of period | 4,091,363,297 | 3,043,788,613 | 13,994,855,096 | 12,199,017,841 | ||||||||||||
End of period | $5,117,198,161 | $4,091,363,297 | $14,799,550,629 | $13,994,855,096 | ||||||||||||
Undistributed net investment income included in net assets: | ||||||||||||||||
End of period | $ — | $ — | $ 4,983,177 | $ 37,243,783 | ||||||||||||
Accumulated net investment loss included in net assets: | ||||||||||||||||
End of period | $ (15,595,995 | ) | $ (8,477,093 | ) | $ — | $ — | ||||||||||
| franklintempleton.com | The accompanying notes are an integral part of these financial statements. | Semiannual Report | 97 |
FRANKLIN CUSTODIAN FUNDS
FINANCIAL STATEMENTS
Statements of Changes in Net Assets (continued)
| Franklin Income Fund | Franklin U.S. Government Securities Fund | |||||||||||||||
| Six Months Ended | Six Months Ended | |||||||||||||||
| March 31, 2018 (unaudited) | Year Ended September 30, 2017 | March 31, 2018 (unaudited) | Year Ended September 30, 2017 | |||||||||||||
Increase (decrease) in net assets: | ||||||||||||||||
Operations: | ||||||||||||||||
Net investment income | $ | 1,540,061,772 | $ | 3,350,660,766 | $ 67,588,545 | $ 130,407,046 | ||||||||||
Net realized gain (loss) | 1,072,648,622 | 1,860,395,900 | (9,044,695 | ) | (63,379,288 | ) | ||||||||||
Net change in unrealized appreciation (depreciation) | (4,245,171,752 | ) | 3,978,607,766 | (139,665,584 | ) | (107,534,558 | ) | |||||||||
Net increase (decrease) in net assets resulting from operations | (1,632,461,358 | ) | 9,189,664,432 | (81,121,734 | ) | (40,506,800 | ) | |||||||||
Distributions to shareholders from: | ||||||||||||||||
Net investment income: | ||||||||||||||||
Class A | (1,159,404,745 | ) | (2,378,392,172 | ) | (52,191,790 | ) | (117,543,709 | ) | ||||||||
Class M | (43 | ) | — | (40 | ) | — | ||||||||||
Class C | (499,574,183 | ) | (1,087,030,360 | ) | (8,937,772 | ) | (23,194,188 | ) | ||||||||
Class R | (8,214,731 | ) | (18,864,554 | ) | (469,071 | ) | (1,294,613 | ) | ||||||||
Class R6 | (56,154,357 | ) | (95,303,179 | ) | (9,662,040 | ) | (16,694,015 | ) | ||||||||
Advisor Class | (299,448,723 | ) | (524,726,253 | ) | (11,450,389 | ) | (25,402,172 | ) | ||||||||
Total distributions to shareholders | (2,022,796,782 | ) | (4,104,316,518 | ) | (82,711,102 | ) | (184,128,697 | ) | ||||||||
Capital share transactions: (Note 2) | ||||||||||||||||
Class A | (914,067,921 | ) | (1,869,610,539 | ) | (62,259,646 | ) | (511,968,136 | ) | ||||||||
Class M | 5,000 | — | 5,000 | — | ||||||||||||
Class C | (1,073,804,823 | ) | (2,293,654,717 | ) | (108,723,438 | ) | (202,855,335 | ) | ||||||||
Class R | (37,926,923 | ) | (58,209,535 | ) | (3,481,480 | ) | (19,433,072 | ) | ||||||||
Class R6 | 380,242,631 | (32,346,017 | ) | 178,797,605 | (159,062,673 | ) | ||||||||||
Advisor Class | (172,208,492 | ) | 2,925,976,903 | (116,495,126 | ) | 162,685,038 | ||||||||||
Total capital share transactions | (1,817,760,528 | ) | (1,327,843,905 | ) | (112,157,085 | ) | (730,634,178 | ) | ||||||||
Net increase (decrease) in net assets | (5,473,018,668 | ) | 3,757,504,009 | (275,989,921 | ) | (955,269,675 | ) | |||||||||
Net assets: | ||||||||||||||||
Beginning of period | 83,391,260,467 | 79,633,756,458 | 5,718,339,174 | 6,673,608,849 | ||||||||||||
End of period | $ | 77,918,241,799 | $ | 83,391,260,467 | $5,442,349,253 | $5,718,339,174 | ||||||||||
Distributions in excess of net investment income included in net assets: | ||||||||||||||||
End of period | $ | (557,606,440 | ) | $ | (74,871,430 | ) | $ (16,209,048 | ) | $ (1,086,491 | ) | ||||||
| 98 | Semiannual Report | The accompanying notes are an integral part of these financial statements. | franklintempleton.com |
FRANKLIN CUSTODIAN FUNDS
FINANCIAL STATEMENTS
Statements of Changes in Net Assets (continued)
| Franklin Utilities Fund | ||||||||
| Six Months Ended | ||||||||
| March 31, 2018 (unaudited) | Year Ended September 30, 2017 | |||||||
Increase (decrease) in net assets: | ||||||||
Operations: | ||||||||
Net investment income | $ | 79,983,723 | $ | 177,423,281 | ||||
Net realized gain (loss) | 114,706,719 | 88,486,105 | ||||||
Net change in unrealized appreciation (depreciation) | (452,906,646 | ) | 349,739,100 | |||||
Net increase (decrease) in net assets resulting from operations | (258,216,204 | ) | 615,648,486 | |||||
Distributions to shareholders from: | ||||||||
Net investment income: | ||||||||
Class A | (62,985,661 | ) | (108,430,003 | ) | ||||
Class M | (35 | ) | — | |||||
Class C | (12,510,837 | ) | (21,699,670 | ) | ||||
Class R | (1,223,463 | ) | (2,242,163 | ) | ||||
Class R6 | (3,938,812 | ) | (6,694,467 | ) | ||||
Advisor Class | (15,586,734 | ) | (23,372,926 | ) | ||||
Net realized gains: | ||||||||
Class A | (66,128,695 | ) | (2,346,125 | ) | ||||
Class C | (15,697,484 | ) | (595,960 | ) | ||||
Class R | (1,496,735 | ) | (58,199 | ) | ||||
Class R6 | (3,834,374 | ) | (124,605 | ) | ||||
Advisor Class | (15,623,915 | ) | (418,502 | ) | ||||
Total distributions to shareholders | (199,026,745 | ) | (165,982,620 | ) | ||||
Capital share transactions: (Note 2) | ||||||||
Class A | (160,019,833 | ) | (289,671,581 | ) | ||||
Class M | 5,000 | — | ||||||
Class C | (44,039,208 | ) | (156,252,743 | ) | ||||
Class R | (11,156,134 | ) | (15,638,722 | ) | ||||
Class R6 | (2,810,947 | ) | 4,295,848 | |||||
Advisor Class | (7,926,561 | ) | 148,535,428 | |||||
Total capital share transactions | (225,947,683 | ) | (308,731,770 | ) | ||||
Net increase (decrease) in net assets | (683,190,632 | ) | 140,934,096 | |||||
Net assets: | ||||||||
Beginning of period | 6,463,442,121 | 6,322,508,025 | ||||||
End of period | $ | 5,780,251,489 | $ | 6,463,442,121 | ||||
Undistributed net investment income included in net assets: | ||||||||
End of period | $ | 3,574,625 | $ | 19,836,444 | ||||
| franklintempleton.com | The accompanying notes are an integral part of these financial statements. | Semiannual Report | 99 |
FRANKLIN CUSTODIAN FUNDS
Notes to Financial Statements (unaudited)
1. Organization and Significant Accounting Policies
Franklin Custodian Funds (Trust) is registered under the Investment Company Act of 1940 (1940 Act) as an open-end management investment company, consisting of six separate funds, five of which are included in this report (Funds) and applies the specialized accounting and reporting guidance in U.S. Generally Accepted Accounting Principles (U.S. GAAP). The classes of shares offered within each of the Funds are indicated below. Each class of shares may differ by its initial sales load, contingent deferred sales charges, voting rights on matters affecting a single class, its exchange privilege and fees due to differing arrangements for distribution and transfer agent fees. Effective January 25, 2018, Franklin Income Fund, Franklin U.S. Government Securities Fund and Franklin Utilities Fund began offering a new class of shares, Class M.
| Class A, Class C, Class R, Class R6 & Advisor Class | ||
Franklin DynaTech Fund
Franklin Growth Fund
| Class A, Class M, Class C, Class R, Class R6 & Advisor Class |
Franklin Income Fund
Franklin U.S. Government Securities Fund
Franklin Utilities Fund
The following summarizes the Funds’ significant accounting policies.
a. Financial Instrument Valuation
The Funds’ investments in financial instruments are carried at fair value daily. Fair value is the price that would be received to sell an asset or paid to transfer a liability in an orderly transaction between market participants on the measurement date. The Funds calculate the net asset value (NAV) per share as of 4 p.m. Eastern time each day the New York Stock Exchange (NYSE) is open for trading. Under compliance policies and procedures approved by the Trust’s Board of Trustees (the Board), the Funds’ administrator has responsibility for oversight of valuation, including leading the cross-functional Valuation Committee (VC). The VC provides administration and oversight of the Funds’ valuation policies and procedures, which are approved annually by the Board. Among other things, these procedures allow the Funds to utilize independent pricing services, quotations from securities and financial instrument dealers, and other market sources to determine fair value.
Equity securities and derivative financial instruments listed on an exchange or on the NASDAQ National Market System are valued at the last quoted sale price or the official closing price of the day, respectively. Foreign equity securities are valued as of the close of trading on the foreign stock exchange on which the security is primarily traded, or as of 4 p.m. Eastern time. The value is then converted into its U.S. dollar equivalent at the foreign exchange rate in effect at 4 p.m. Eastern time on the day that the value of the security is determined. Over-the-counter (OTC) securities are valued within the range of the most recent quoted bid and ask prices. Securities that trade in multiple markets or on multiple exchanges are valued according to the broadest and most representative market. Certain equity securities are valued based upon fundamental characteristics or relationships to similar securities.
Debt securities generally trade in the OTC market rather than on a securities exchange. The Funds’ pricing services use multiple valuation techniques to determine fair value. In instances where sufficient market activity exists, the pricing services may utilize a market-based approach through which quotes from market makers are used to determine fair value. In instances where sufficient market activity may not exist or is limited, the pricing services also utilize proprietary valuation models which may consider market characteristics such as benchmark yield curves, credit spreads, estimated default rates, anticipated market interest rate volatility, coupon rates, anticipated timing of principal repayments, underlying collateral, and other unique security features in order to estimate the relevant cash flows, which are then discounted to calculate the fair value. Securities denominated in a foreign currency are converted into their U.S. dollar equivalent at the foreign exchange rate in effect at 4 p.m. Eastern time on the date that the values of the foreign debt securities are determined.
Investments in open-end mutual funds are valued at the closing NAV. Investments in repurchase agreements are valued at cost, which approximates fair value.
The Funds have procedures to determine the fair value of financial instruments for which market prices are not reliable or readily available. Under these procedures, the VC convenes on a regular basis to review such financial instruments and considers a number of factors, including significant unobservable valuation inputs, when arriving at fair value. The VC primarily employs a market-based approach which may use related or comparable assets or liabilities, recent transactions, market multiples, book values, and other relevant information
| 100 | Semiannual Report | franklintempleton.com |
FRANKLIN CUSTODIAN FUNDS
NOTES TO FINANCIAL STATEMENTS (UNAUDITED)
for the investment to determine the fair value of the investment. An income-based valuation approach may also be used in which the anticipated future cash flows of the investment are discounted to calculate fair value. Discounts may also be applied due to the nature or duration of any restrictions on the disposition of the investments. Due to the inherent uncertainty of valuations of such investments, the fair values may differ significantly from the values that would have been used had an active market existed. The VC employs various methods for calibrating these valuation approaches including a regular review of key inputs and assumptions, transactional back-testing or disposition analysis, and reviews of any related market activity.
Trading in securities on foreign securities stock exchanges and OTC markets may be completed before 4 p.m. Eastern time. In addition, trading in certain foreign markets may not take place on every Funds’ business day. Occasionally, events occur between the time at which trading in a foreign security is completed and 4 p.m. Eastern time that might call into question the reliability of the value of a portfolio security held by the Fund. As a result, differences may arise between the value of the Funds’ portfolio securities as determined at the foreign market close and the latest indications of value at 4 p.m. Eastern time. In order to minimize the potential for these differences, the VC monitors price movements following the close of trading in foreign stock markets through a series of country specific market proxies (such as baskets of American Depositary Receipts, futures contracts and exchange traded funds). These price movements are measured against established trigger thresholds for each specific market proxy to assist in determining if an event has occurred that may call into question the reliability of the values of the foreign securities held by the Funds. If such an event occurs, the securities may be valued using fair value procedures, which may include the use of independent pricing services.
When the last day of the reporting period is a non-business day, certain foreign markets may be open on those days that the Funds’ NAV is not calculated, which could result in differences between the value of the Funds’ portfolio securities on the last business day and the last calendar day of the reporting period. Any significant security valuation changes due to an open foreign market are adjusted and reflected by the Funds for financial reporting purposes.
b. Foreign Currency Translation
Portfolio securities and other assets and liabilities denominated in foreign currencies are translated into U.S. dollars based on the exchange rate of such currencies against U.S. dollars on the date of valuation. The Funds may enter into foreign currency exchange contracts to facilitate transactions denominated in a foreign currency. Purchases and sales of securities, income and expense items denominated in foreign currencies are translated into U.S. dollars at the exchange rate in effect on the transaction date. Portfolio securities and assets and liabilities denominated in foreign currencies contain risks that those currencies will decline in value relative to the U.S. dollar. Occasionally, events may impact the availability or reliability of foreign exchange rates used to convert the U.S. dollar equivalent value. If such an event occurs, the foreign exchange rate will be valued at fair value using procedures established and approved by the Board.
The Funds do not separately report the effect of changes in foreign exchange rates from changes in market prices on securities held. Such changes are included in net realized and unrealized gain or loss from investments in the Statements of Operations.
Realized foreign exchange gains or losses arise from sales of foreign currencies, currency gains or losses realized between the trade and settlement dates on securities transactions and the difference between the recorded amounts of dividends, interest, and foreign withholding taxes and the U.S. dollar equivalent of the amounts actually received or paid. Net unrealized foreign exchange gains and losses arise from changes in foreign exchange rates on foreign denominated assets and liabilities other than investments in securities held at the end of the reporting period.
c. Joint Repurchase Agreement
Certain or all Funds enter into a joint repurchase agreement whereby their uninvested cash balance is deposited into a joint cash account with other funds managed by the investment manager or an affiliate of the investment manager and is used to invest in one or more repurchase agreements. The value and face amount of the joint repurchase agreement are allocated to the funds based on their pro-rata interest. A repurchase agreement is accounted for as a loan by the Fund to the seller, collateralized by securities which are delivered to the Funds’ custodian. The fair value, including accrued interest, of the initial collateralization is required to be at least 102% of the dollar amount invested by the funds, with the value of the
| franklintempleton.com | Semiannual Report | 101 |
FRANKLIN CUSTODIAN FUNDS
NOTES TO FINANCIAL STATEMENTS (UNAUDITED)
1. Organization and Significant Accounting
Policies (continued)
c. Joint Repurchase Agreement (continued)
underlying securities marked to market daily to maintain coverage of at least 100%. Repurchase agreements are subject to the terms of Master Repurchase Agreements (MRAs) with approved counterparties (sellers). The MRAs contain various provisions, including but not limited to events of default and maintenance of collateral for repurchase agreements. In the event of default by either the seller or the Funds, certain MRAs may permit the non-defaulting party to net and close-out all transactions, if any, traded under such agreements. The Funds may sell securities it holds as collateral and apply the proceeds towards the repurchase price and any other amounts owed by the seller to the Funds in the event of default by the seller. This could involve costs or delays in addition to a loss on the securities if their value falls below the repurchase price owed by the seller. The joint repurchase agreement held by the Funds at period end, as indicated in the Statements of Investments, had been entered into on March 29, 2018.
d. Securities Purchased on a When-Issued or Delayed Delivery and TBA Basis
Certain or all Funds purchase securities on a when-issued or delayed delivery and to-be-announced (TBA) basis, with payment and delivery scheduled for a future date. These transactions are subject to market fluctuations and are subject to the risk that the value at delivery may be more or less than the trade date purchase price. Although the Funds will generally purchase these securities with the intention of holding the securities, they may sell the securities before the settlement date. Sufficient assets have been segregated for these securities.
e. Derivative Financial Instruments
Certain or all Funds invested in derivative financial instruments in order to manage risk or gain exposure to various other investments or markets. Derivatives are financial contracts based on an underlying or notional amount, require no initial investment or an initial net investment that is smaller than would normally be required to have a similar response to changes in market factors, and require or permit net settlement. Derivatives contain various risks including the potential inability of the counterparty to fulfill their obligations under the terms of the contract, the potential for an illiquid secondary market, and/or the potential for market movements which expose the Fund to gains or losses in excess of the amounts
shown in the Statements of Assets and Liabilities. Realized gain and loss and unrealized appreciation and depreciation on these contracts for the period are included in the Statements of Operations.
Collateral requirements differ by type of derivative. Collateral or initial margin requirements are set by the broker or exchange clearing house for exchange traded and centrally cleared derivatives. Initial margin deposited is held at the exchange and can be in the form of cash and/or securities.
Certain or all Funds purchased or wrote exchange traded option contracts primarily to manage exposure to equity price risk. An option is a contract entitling the holder to purchase or sell a specific amount of shares or units of an asset or notional amount of a swap (swaption), at a specified price. When an option is purchased or written, an amount equal to the premium paid or received is recorded as an asset or liability, respectively. Upon exercise of an option, the acquisition cost or sales proceeds of the underlying investment is adjusted by any premium received or paid. Upon expiration of an option, any premium received or paid is recorded as a realized gain or loss. Upon closing an option other than through expiration or exercise, the difference between the premium received or paid and the cost to close the position is recorded as a realized gain or loss.
See Note 10 regarding other derivative information.
f. Index-Linked Notes
Certain or all Funds invest in index-linked notes. Index-linked notes are senior, unsecured, subordinated debt securities issued by a financial institution, and the value is based on the price movements of the underlying index. Index-linked notes are designed to provide investors access to the returns of various market benchmarks and intended to replicate the economic effects that would apply had the Fund directly purchased the underlying referenced asset or basket of assets. The risks of investing in index-linked notes include unfavorable price movements in the underlying index and the credit risk of the issuing financial institution. There may be no guarantee of a return of principal with index-linked notes and the appreciation potential may be limited. Index-linked notes may be more volatile and less liquid than other investments held by the Funds.
| 102 | Semiannual Report | franklintempleton.com |
FRANKLIN CUSTODIAN FUNDS
NOTES TO FINANCIAL STATEMENTS (UNAUDITED)
g. Equity-Linked Securities
Certain or all Funds invest in equity-linked securities. Equity-linked securities are hybrid financial instruments that generally combine both debt and equity characteristics into a single note form. Income received from equity-linked securities is recorded as realized gains in the Statements of Operations and may be based on the performance of an underlying equity security, an equity index, or an option position. The risks of investing in equity-linked securities include unfavorable price movements in the underlying security and the credit risk of the issuing financial institution. There may be no guarantee of a return of principal with equity-linked securities and the appreciation potential may be limited. Equity-linked securities may be more volatile and less liquid than other investments held by the Funds.
h. Securities Lending
Certain or all Funds participate in an agency based securities lending program to earn additional income. The Fund receives cash collateral against the loaned securities in an amount equal to at least 102% of the fair value of the loaned securities. Collateral is maintained over the life of the loan in an amount not less than 100% of the fair value of loaned securities, as determined at the close of Fund business each day; any additional collateral required due to changes in security values is delivered to the Fund on the next business day. The collateral is deposited into a joint cash account with other funds and is used to invest in a money market fund managed by Franklin Advisers, Inc., an affiliate of the Funds, and/or a joint repurchase agreement. The Fund may receive income from the investment of cash collateral, in addition to lending fees and rebates paid by the borrower. Income from securities loaned, net of fees paid to the securities lending agent and/or third-party vendor, is reported separately in the Statements of Operations. The Fund bears the market risk with respect to the collateral investment, securities loaned, and the risk that the agent may default on its obligations to the Fund. If the borrower defaults on its obligation to return the securities loaned, the Fund has the right to repurchase the securities in the open market using the collateral received. The securities lending agent has agreed to indemnify the Fund in the event of default by a third party borrower. At March 31, 2018, the Franklin Utilities Fund had no securities on loan.
i. Mortgage Dollar Rolls
Certain or all Funds enter into mortgage dollar rolls, typically on a TBA basis. Mortgage dollar rolls are agreements between the Fund and a financial institution where the Fund sells (or buys) mortgage-backed securities for delivery on a specified date and simultaneously contracts to repurchase (or sell) substantially similar (same type, coupon, and maturity) securities at a future date and at a predetermined price. Gains or losses are realized on the initial sale, and the difference between the repurchase price and the sale price is recorded as an unrealized gain or loss to the Fund upon entering into the mortgage dollar roll. In addition, the Fund may invest the cash proceeds that are received from the initial sale. During the period between the sale and repurchase, the Fund is not entitled to principal and interest paid on the mortgage backed securities. Transactions in mortgage dollar rolls are accounted for as purchases and sales and may result in an increase to the Fund’s portfolio turnover rate. The risks of mortgage dollar roll transactions include the potential inability of the counterparty to fulfill its obligations.
j. Senior Floating Rate Interests
Certain or all Funds invest in senior secured corporate loans that pay interest at rates which are periodically reset by reference to a base lending rate plus a spread. These base lending rates are generally the prime rate offered by a designated U.S. bank or the London InterBank Offered Rate (LIBOR). Senior secured corporate loans often require prepayment of principal from excess cash flows or at the discretion of the borrower. As a result, actual maturity may be substantially less than the stated maturity. Senior secured corporate loans in which the Funds invest are generally readily marketable, but may be subject to certain restrictions on resale.
k. Income and Deferred Taxes
It is each Fund’s policy to qualify as a regulated investment company under the Internal Revenue Code. Each Fund intends to distribute to shareholders substantially all of its taxable income and net realized gains to relieve it from federal income and excise taxes. As a result, no provision for U.S. federal income taxes is required.
The Funds may be subject to foreign taxation related to income received, capital gains on the sale of securities and certain foreign currency transactions in the foreign jurisdictions in which the Funds invest. Foreign taxes, if any, are recorded
| franklintempleton.com | Semiannual Report | 103 |
FRANKLIN CUSTODIAN FUNDS
NOTES TO FINANCIAL STATEMENTS (UNAUDITED)
1. Organization and Significant Accounting
Policies (continued)
k. Income and Deferred Taxes (continued)
based on the tax regulations and rates that exist in the foreign markets in which the Funds invest. When a capital gain tax is determined to apply, certain or all Funds record an estimated deferred tax liability in an amount that would be payable if the securities were disposed of on the valuation date.
As a result of several court cases, in certain countries across the European Union, certain or all Funds filed additional tax reclaims for previously withheld taxes on dividends earned in those countries (EU reclaims). These additional filings are subject to various administrative proceedings by the local jurisdictions’ tax authorities within the European Union, as well as a number of related judicial proceedings. Income recognized, if any, for EU reclaims is reflected as other income in the Statements of Operations and any related receivable, if any, is reflected as European Union tax reclaims in the Statements of Assets and Liabilities. When uncertainty exists as to the ultimate resolution of these proceedings, the likelihood of receipt of these EU reclaims, and the potential timing of payment, no amounts are reflected in the financial statements. For U.S. income tax purposes, EU reclaims received by the Funds, if any, reduce the amounts of foreign taxes Fund shareholders can use as tax credits in their individual income tax returns.
Each Fund may recognize an income tax liability related to its uncertain tax positions under U.S. GAAP when the uncertain tax position has a less than 50% probability that it will be sustained upon examination by the tax authorities based on its technical merits. As of March 31, 2018, each Fund has determined that no tax liability is required in its financial statements related to uncertain tax positions for any open tax years (or expected to be taken in future tax years). Open tax years are those that remain subject to examination and are based on the statute of limitations in each jurisdiction in which the Fund invests.
l. Security Transactions, Investment Income, Expenses and Distributions
Security transactions are accounted for on trade date. Realized gains and losses on security transactions are determined on a specific identification basis. Interest income and estimated expenses are accrued daily. Amortization of premium and
accretion of discount on debt securities are included in interest income. Paydown gains and losses are recorded separately on the Statements of Operations. Facility fees are recognized as income over the expected term of the loan. Dividend income is recorded on the ex-dividend date except for certain dividends from securities where the dividend rate is not available. In such cases, the dividend is recorded as soon as the information is received by the Funds. Distributions to shareholders are recorded on the ex-dividend date. Distributable earnings are determined according to income tax regulations (tax basis) and may differ from earnings recorded in accordance with U.S. GAAP. These differences may be permanent or temporary. Permanent differences are reclassified among capital accounts to reflect their tax character. These reclassifications have no impact on net assets or the results of operations. Temporary differences are not reclassified, as they may reverse in subsequent periods.
Common expenses incurred by the Trust are allocated among the Funds based on the ratio of net assets of each Fund to the combined net assets of the Trust. Fund specific expenses are charged directly to the Fund that incurred the expense.
Realized and unrealized gains and losses and net investment income, excluding class specific expenses, are allocated daily to each class of shares based upon the relative proportion of net assets of each class. Differences in per share distributions by class are generally due to differences in class specific expenses.
m. Accounting Estimates
The preparation of financial statements in accordance with U.S. GAAP requires management to make estimates and assumptions that affect the reported amounts of assets and liabilities at the date of the financial statements and the amounts of income and expenses during the reporting period. Actual results could differ from those estimates.
n. Guarantees and Indemnifications
Under the Trust’s organizational documents, its officers and trustees are indemnified by the Trust against certain liabilities arising out of the performance of their duties to the Trust. Additionally, in the normal course of business, the Trust, on behalf of the Funds, enters into contracts with service providers that contain general indemnification clauses. The Trust’s maximum exposure under these arrangements is unknown as
| 104 | Semiannual Report | franklintempleton.com |
FRANKLIN CUSTODIAN FUNDS
NOTES TO FINANCIAL STATEMENTS (UNAUDITED)
this would involve future claims that may be made against the Trust that have not yet occurred. Currently, the Trust expects the risk of loss to be remote.
2. Shares of Beneficial Interest
At March 31, 2018, there were an unlimited number of shares authorized (without par value). Transactions in the Funds’ shares were as follows:
| Franklin | Franklin | |||||||||||||||
| DynaTech Fund | Growth Fund | |||||||||||||||
| Shares | Amount | Shares | Amount | |||||||||||||
Class A Shares: | ||||||||||||||||
Six Months ended March 31, 2018 | ||||||||||||||||
Shares sold | 6,367,837 | $ | 435,926,940 | 6,250,804 | $ | 599,985,557 | ||||||||||
Shares issued in reinvestment of distributions | 649,395 | 42,411,985 | 2,241,541 | 209,291,769 | ||||||||||||
Shares redeemed | (4,900,449 | ) | (332,626,188 | ) | (9,802,762 | ) | (940,434,514 | ) | ||||||||
Net increase (decrease) | 2,116,783 | $ | 145,712,737 | (1,310,417 | ) | $ | (131,157,188 | ) | ||||||||
Year ended September 30, 2017 | ||||||||||||||||
Shares sold | 9,362,267 | $ | 523,007,968 | 14,162,348 | $ | 1,174,286,495 | ||||||||||
Shares issued in reinvestment of distributions. | 1,325,934 | 62,305,651 | 3,311,489 | 249,918,049 | ||||||||||||
Shares redeemed | (11,882,951 | ) | (643,932,670 | ) | (26,713,031 | ) | (2,199,267,441 | ) | ||||||||
Net increase (decrease) | (1,194,750 | ) | $ | (58,619,051 | ) | (9,239,194 | ) | $ | (775,062,897 | ) | ||||||
Class C Shares: | ||||||||||||||||
Six Months ended March 31, 2018 | ||||||||||||||||
Shares sold | 1,670,401 | $ | 96,756,708 | 1,081,685 | $ | 95,826,220 | ||||||||||
Shares issued in reinvestment of distributions. | 145,521 | 8,019,677 | 273,481 | 23,494,774 | ||||||||||||
Shares redeemed | (850,950 | ) | (48,700,397 | ) | (1,149,972 | ) | (101,442,929 | ) | ||||||||
Net increase (decrease) | 964,972 | $ | 56,075,988 | 205,194 | $ | 17,878,065 | ||||||||||
Year ended September 30, 2017 | ||||||||||||||||
Shares sold | 1,608,949 | $ | 76,923,384 | 2,061,309 | $ | 157,211,473 | ||||||||||
Shares issued in reinvestment of distributions. | 278,097 | 11,146,149 | 378,292 | 26,423,730 | ||||||||||||
Shares redeemed | (2,017,425 | ) | (93,534,438 | ) | (3,058,986 | ) | (234,216,142 | ) | ||||||||
Net increase (decrease) | (130,379 | ) | $ | (5,464,905 | ) | (619,385 | ) | $ | (50,580,939 | ) | ||||||
Class R Shares: | ||||||||||||||||
Six Months ended March 31, 2018 | ||||||||||||||||
Shares sold | 320,570 | $ | 21,830,372 | 396,478 | $ | 37,940,573 | ||||||||||
Shares issued in reinvestment of distributions. | 14,081 | 895,541 | 137,301 | 12,777,240 | ||||||||||||
Shares redeemed | (165,519 | ) | (10,838,433 | ) | (844,755 | ) | (80,913,661 | ) | ||||||||
Net increase (decrease) | 169,132 | $ | 11,887,480 | (310,976 | ) | $ | (30,195,848 | ) | ||||||||
Year ended September 30, 2017 | ||||||||||||||||
Shares sold | 267,584 | $ | 14,852,690 | 912,197 | $ | 76,231,533 | ||||||||||
Shares issued in reinvestment of distributions. | 27,272 | 1,251,781 | 210,204 | 15,813,630 | ||||||||||||
Shares redeemed | (280,176 | ) | (14,785,028 | ) | (1,629,437 | ) | (135,607,303 | ) | ||||||||
Net increase (decrease) | 14,680 | $ | 1,319,443 | (507,036 | ) | $ | (43,562,140 | ) | ||||||||
| franklintempleton.com | Semiannual Report | 105 |
FRANKLIN CUSTODIAN FUNDS
NOTES TO FINANCIAL STATEMENTS (UNAUDITED)
2. Shares of Beneficial Interest (continued)
| Franklin | Franklin | |||||||||||||||
| DynaTech Fund | Growth Fund | |||||||||||||||
| Shares | Amount | Shares | Amount | |||||||||||||
Class R6 Shares: | ||||||||||||||||
Six Months ended March 31, 2018 | ||||||||||||||||
Shares sold | 11,454,430 | $ 786,224,285 | 7,319,293 | $ | 697,242,997 | |||||||||||
Shares issued in reinvestment of distributions. | 246,188 | 16,654,639 | 664,502 | 62,044,590 | ||||||||||||
Shares redeemed | (1,571,471 | ) | (112,008,211 | ) | (3,004,157 | ) | (290,212,087 | ) | ||||||||
Net increase (decrease) | 10,129,147 | $690,870,713 | 4,979,638 | $ | 469,075,500 | |||||||||||
Year ended September 30, 2017 | ||||||||||||||||
Shares sold | 1,671,232 | $ 92,675,376 | 6,556,890 | $ | 547,502,376 | |||||||||||
Shares issued in reinvestment of distributions. | 228,050 | 11,046,724 | 613,371 | 46,278,808 | ||||||||||||
Shares redeemed | (1,597,410 | ) | (92,487,214 | ) | (4,499,648 | ) | (378,570,163 | ) | ||||||||
Net increase (decrease) | 301,872 | $ 11,234,886 | 2,670,613 | $ | 215,211,021 | |||||||||||
Advisor Class Shares: | ||||||||||||||||
Six Months ended March 31, 2018 | ||||||||||||||||
Shares sold | 2,283,325 | $ 159,045,222 | 3,434,597 | $ | 331,619,297 | |||||||||||
Shares issued in reinvestment of distributions. | 79,332 | 5,323,142 | 772,474 | 72,226,322 | ||||||||||||
Shares redeemed | (7,451,449 | ) | (496,815,554 | ) | (6,735,376 | ) | (642,624,089 | ) | ||||||||
Net increase (decrease) | (5,088,792 | ) | $(332,447,190 | ) | (2,528,305 | ) | $ | (238,778,470 | ) | |||||||
Year ended September 30, 2017 | ||||||||||||||||
Shares sold | 9,006,379 | $ 514,535,401 | 11,853,956 | $ | 980,377,887 | |||||||||||
Shares issued in reinvestment of distributions. | 155,933 | 7,506,593 | 998,990 | 75,473,718 | ||||||||||||
Shares redeemed | (1,979,331 | ) | (111,219,398 | ) | (7,733,627 | ) | (636,836,942 | ) | ||||||||
Net increase (decrease) | 7,182,981 | $ 410,822,596 | 5,119,319 | $ | 419,014,663 | |||||||||||
| Franklin | ||||||||||||||||
| Franklin | U.S. Government | |||||||||||||||
| Income Fund | Securities Fund | |||||||||||||||
| Shares | Amount | Shares | Amount | |||||||||||||
Class A Shares: | ||||||||||||||||
Six Months ended March 31, 2018 | ||||||||||||||||
Shares sold | 926,579,698 | $ | 2,191,310,521 | 67,521,749 | $ | 409,200,577 | ||||||||||
Shares issued in reinvestment of distributions | 447,378,662 | 1,060,113,076 | 7,198,044 | 43,312,583 | ||||||||||||
Shares redeemed | (1,763,973,175 | ) | (4,165,491,518 | ) | (85,037,731 | ) | (514,772,806 | ) | ||||||||
Net increase (decrease) | (390,014,815 | ) | $ | (914,067,921 | ) | (10,317,938 | ) | $ | (62,259,646 | ) | ||||||
Year ended September 30, 2017 | ||||||||||||||||
Shares sold | 2,326,579,530 | $ | 5,409,263,110 | 88,315,020 | $ | 547,846,708 | ||||||||||
Shares issued in reinvestment of distributions | 942,817,065 | 2,180,859,371 | 16,155,083 | 99,906,202 | ||||||||||||
Shares redeemed | (4,077,035,296 | ) | (9,459,733,020 | ) | (187,133,417 | ) | (1,159,721,046 | ) | ||||||||
Net increase (decrease) | (807,638,701 | ) | $ | (1,869,610,539 | ) | (82,663,314 | ) | $ | (511,968,136 | ) | ||||||
Class M Shares: | ||||||||||||||||
Six Months ended March 31, 2018a | ||||||||||||||||
Shares sold | 2,058 | $ | 5,000 | 829 | $ | 5,000 | ||||||||||
| 106 | Semiannual Report | franklintempleton.com |
FRANKLIN CUSTODIAN FUNDS
NOTES TO FINANCIAL STATEMENTS (UNAUDITED)
| Franklin | ||||||||||||||||
| Franklin | U.S. Government | |||||||||||||||
| Income Fund | Securities Fund | |||||||||||||||
| Shares | Amount | Shares | Amount | |||||||||||||
Class C Shares: | ||||||||||||||||
Six Months ended March 31, 2018 | ||||||||||||||||
Shares sold | 334,478,242 | $ | 801,284,726 | 4,935,332 | $ | 29,614,557 | ||||||||||
Shares issued in reinvestment of distributions | 190,839,487 | 458,277,686 | 1,362,701 | 8,144,318 | ||||||||||||
Shares redeemed | (975,038,808 | ) | (2,333,367,235 | ) | (24,396,769 | ) | (146,482,313 | ) | ||||||||
Net increase (decrease) | (449,721,079 | ) | $ | (1,073,804,823 | ) | (18,098,736 | ) | $ | (108,723,438 | ) | ||||||
Year ended September 30, 2017 | ||||||||||||||||
Shares sold | 911,767,616 | $ | 2,142,426,105 | 14,550,091 | $ | 89,797,342 | ||||||||||
Shares issued in reinvestment of distributions | 413,154,940 | 967,759,461 | 3,401,372 | 20,890,746 | ||||||||||||
Shares redeemed | (2,297,260,192 | ) | (5,403,840,283 | ) | (50,952,421 | ) | (313,543,423 | ) | ||||||||
Net increase (decrease) | (972,337,636 | ) | $ | (2,293,654,717 | ) | (33,000,958 | ) | $ | (202,855,335 | ) | ||||||
Class R Shares: | ||||||||||||||||
Six Months ended March 31, 2018 | ||||||||||||||||
Shares sold | 12,851,921 | $ | 29,831,404 | 757,077 | $ | 4,565,740 | ||||||||||
Shares issued in reinvestment of distributions | 3,320,608 | 7,725,627 | 73,484 | 441,918 | ||||||||||||
Shares redeemed | (32,444,558 | ) | (75,483,954 | ) | (1,406,528 | ) | (8,489,138 | ) | ||||||||
Net increase (decrease) | (16,272,029 | ) | $ | (37,926,923 | ) | (575,967 | ) | $ | (3,481,480 | ) | ||||||
Year ended September 30, 2017 | ||||||||||||||||
Shares sold | 29,390,834 | $ | 67,078,836 | 2,216,203 | $ | 13,791,777 | ||||||||||
Shares issued in reinvestment of distributions | 7,822,410 | 17,773,811 | 199,172 | 1,231,596 | ||||||||||||
Shares redeemed | (62,623,063 | ) | (143,062,182 | ) | (5,574,593 | ) | (34,456,445 | ) | ||||||||
Net increase (decrease) | (25,409,819 | ) | $ | (58,209,535 | ) | (3,159,218 | ) | $ | (19,433,072 | ) | ||||||
Class R6 Shares: | ||||||||||||||||
Six Months ended March 31, 2018 | ||||||||||||||||
Shares sold | 204,936,724 | $ | 482,815,039 | 36,428,526 | $ | 222,031,620 | ||||||||||
Shares issued in reinvestment of distributions | 22,742,764 | 53,419,508 | 1,600,842 | 9,660,713 | ||||||||||||
Shares redeemed | (66,880,921 | ) | (155,991,916 | ) | (8,766,105 | ) | (52,894,728 | ) | ||||||||
Net increase (decrease) | 160,798,567 | $ | 380,242,631 | 29,263,263 | $ | 178,797,605 | ||||||||||
Year ended September 30, 2017 | ||||||||||||||||
Shares sold | 45,238,070 | $ | 104,748,463 | 7,989,421 | $ | 49,592,166 | ||||||||||
Shares issued in reinvestment of distributions | 39,448,905 | 90,547,964 | 2,685,559 | 16,667,699 | ||||||||||||
Shares redeemed | (98,936,238 | ) | (227,642,444 | ) | (36,176,783 | ) | (225,322,538 | ) | ||||||||
Net increase (decrease) | (14,249,263 | ) | $ | (32,346,017 | ) | (25,501,803 | ) | $ | (159,062,673 | ) | ||||||
| franklintempleton.com | Semiannual Report | 107 |
FRANKLIN CUSTODIAN FUNDS
NOTES TO FINANCIAL STATEMENTS (UNAUDITED)
2. Shares of Beneficial Interest (continued)
| Franklin | ||||||||||||||||
| Franklin | U.S. Government | |||||||||||||||
| Income Fund | Securities Fund | |||||||||||||||
| Shares | Amount | Shares | Amount | |||||||||||||
Advisor Class Shares: | ||||||||||||||||
Six Months ended March 31, 2018 | ||||||||||||||||
Shares sold | 589,149,896 | $ | 1,380,111,790 | 22,114,042 | $ | 134,147,350 | ||||||||||
Shares issued in reinvestment of distributions | 111,821,111 | 262,732,211 | 1,714,653 | 10,349,609 | ||||||||||||
Shares redeemed | (773,915,021 | ) | (1,815,052,493 | ) | (42,890,333 | ) | (260,992,085 | ) | ||||||||
Net increase (decrease) | (72,944,014 | ) | $ | (172,208,492 | ) | (19,061,638 | ) | $ | (116,495,126 | ) | ||||||
Year ended September 30, 2017 | ||||||||||||||||
Shares sold | 2,163,722,071 | $ | 4,992,265,330 | 63,438,736 | $ | 394,713,677 | ||||||||||
Shares issued in reinvestment of distributions | 201,275,423 | 462,952,027 | 3,720,638 | 23,067,829 | ||||||||||||
Shares redeemed | (1,099,054,643 | ) | (2,529,240,454 | ) | (41,027,662 | ) | (255,096,468 | ) | ||||||||
Net increase (decrease) | 1,265,942,851 | $ | 2,925,976,903 | 26,131,712 | $ | 162,685,038 | ||||||||||
aFor the period January 25, 2018 (effective date) to March 31, 2018.
| Franklin | ||||||||
| Utilities Fund | ||||||||
| Shares | Amount | |||||||
Class A Shares: | ||||||||
Six Months ended March 31, 2018 | ||||||||
Shares sold | 15,388,836 | $ | 285,230,695 | |||||
Shares issued in reinvestment of distributions | 6,152,157 | 118,374,673 | ||||||
Shares redeemed | (30,561,917 | ) | (563,625,201 | ) | ||||
Net increase (decrease) | (9,020,924 | ) | $ | (160,019,833 | ) | |||
Year ended September 30, 2017 | ||||||||
Shares sold | 33,746,244 | $ | 620,365,753 | |||||
Shares issued in reinvestment of distributions | 5,477,068 | 100,790,068 | ||||||
Shares redeemed | (55,404,028 | ) | (1,010,827,402 | ) | ||||
Net increase (decrease) | (16,180,716 | ) | $ | (289,671,581 | ) | |||
Class M Shares: | ||||||||
Six Months ended March 31, 2018a | ||||||||
Shares sold | 276 | $ | 5,000 | |||||
Class C Shares: | ||||||||
Six Months ended March 31, 2018 | ||||||||
Shares sold | 2,278,088 | $ | 42,669,956 | |||||
Shares issued in reinvestment of distributions | 1,371,834 | 26,359,077 | ||||||
Shares redeemed | (6,187,912 | ) | (113,068,241 | ) | ||||
Net increase (decrease) | (2,537,990 | ) | $ | (44,039,208 | ) | |||
Year ended September 30, 2017 | ||||||||
Shares sold | 5,503,753 | $ | 100,721,777 | |||||
Shares issued in reinvestment of distributions | 1,083,738 | 19,834,562 | ||||||
Shares redeemed | (15,075,669 | ) | (276,809,082 | ) | ||||
Net increase (decrease) | (8,488,178 | ) | $ | (156,252,743 | ) | |||
108 | Semiannual Report | franklintempleton.com |
FRANKLIN CUSTODIAN FUNDS
NOTES TO FINANCIAL STATEMENTS (UNAUDITED)
| Franklin | ||||||||
| Utilities Fund | ||||||||
| Shares | Amount | |||||||
Class R Shares: | ||||||||
Six Months ended March 31, 2018 | ||||||||
Shares sold | 547,137 | $ | 10,063,175 | |||||
Shares issued in reinvestment of distributions | 136,901 | 2,634,569 | ||||||
Shares redeemed | (1,301,035 | ) | (23,853,878 | ) | ||||
Net increase (decrease) | (616,997 | ) | $ | (11,156,134 | ) | |||
Year ended September 30, 2017 | ||||||||
Shares sold | 1,609,833 | $ | 29,215,041 | |||||
Shares issued in reinvestment of distributions | 121,708 | 2,225,505 | ||||||
Shares redeemed | (2,594,910 | ) | (47,079,268 | ) | ||||
Net increase (decrease) | (863,369 | ) | $ | (15,638,722 | ) | |||
Class R6 Shares: | ||||||||
Six Months ended March 31, 2018 | ||||||||
Shares sold | 1,352,066 | $ | 25,257,656 | |||||
Shares issued in reinvestment of distributions | 401,753 | 7,773,186 | ||||||
Shares redeemed | (1,928,417 | ) | (35,841,789 | ) | ||||
Net increase (decrease) | (174,598 | ) | $ | (2,810,947 | ) | |||
Year ended September 30, 2017 | ||||||||
Shares sold | 3,378,291 | $ | 61,987,731 | |||||
Shares issued in reinvestment of distributions | 367,045 | 6,819,073 | ||||||
Shares redeemed | (3,469,190 | ) | (64,510,956 | ) | ||||
Net increase (decrease) | 276,146 | $ | 4,295,848 | |||||
Advisor Class Shares: | ||||||||
Six Months ended March 31, 2018 | ||||||||
Shares sold | 7,949,121 | $ | 149,301,424 | |||||
Shares issued in reinvestment of distributions | 1,484,912 | 28,746,338 | ||||||
Shares redeemed | (10,108,294 | ) | (185,974,323 | ) | ||||
Net increase (decrease) | (674,261 | ) | $ | (7,926,561 | ) | |||
Year ended September 30, 2017 | ||||||||
Shares sold | 21,268,414 | $ | 394,510,240 | |||||
Shares issued in reinvestment of distributions | 1,182,297 | 22,042,770 | ||||||
Shares redeemed | (14,639,265 | ) | (268,017,582 | ) | ||||
Net increase (decrease) | 7,811,446 | $ | 148,535,428 | |||||
aFor the period January 25, 2018 (effective date) to March 31, 2018.
| franklintempleton.com | Semiannual Report | 109 |
FRANKLIN CUSTODIAN FUNDS
NOTES TO FINANCIAL STATEMENTS (UNAUDITED)
3. Transactions with Affiliates
Franklin Resources, Inc. is the holding company for various subsidiaries that together are referred to as Franklin Templeton Investments. Certain officers and trustees of the Trust are also officers and/or directors of the following subsidiaries:
| Subsidiary | Affiliation | |
| Franklin Advisers, Inc. (Advisers) | Investment manager | |
| Franklin Templeton Services, LLC (FT Services) | Administrative manager | |
| Franklin Templeton Distributors, Inc. (Distributors) | Principal underwriter | |
| Franklin Templeton Investor Services, LLC (Investor Services) | Transfer agent |
a. Management Fees
Franklin Income Fund and Franklin Utilities Fund pay an investment management fee to Advisers based on the month-end net assets of each of the Funds as follows:
| Annualized Fee Rate | Net Assets | |
0.625% | Up to and including $100 million | |
0.500% | Over $100 million, up to and including $250 million | |
0.450% | Over $250 million, up to and including $7.5 billion | |
0.440% | Over $7.5 billion, up to and including $10 billion | |
0.430% | Over $10 billion, up to and including $12.5 billion | |
0.420% | Over $12.5 billion, up to and including $15 billion | |
0.400% | Over $15 billion, up to and including $17.5 billion | |
0.380% | Over $17.5 billion, up to and including $20 billion | |
0.360% | Over $20 billion, up to and including $35 billion | |
0.355% | Over $35 billion, up to and including $50 billion | |
0.350% | Over $50 billion, up to and including $65 billion | |
0.345% | Over $65 billion, up to and including $80 billion | |
0.340% | In excess of $80 billion |
Franklin DynaTech Fund, Franklin Growth Fund and Franklin U.S. Government Securities Fund pay an investment management fee to Advisers based on the month-end net assets of each of the Funds as follows:
| Annualized Fee Rate | Net Assets | |
0.625% | Up to and including $100 million | |
0.500% | Over $100 million, up to and including $250 million | |
0.450% | Over $250 million, up to and including $7.5 billion | |
0.440% | Over $7.5 billion, up to and including $10 billion | |
0.430% | Over $10 billion, up to and including $12.5 billion | |
0.420% | Over $12.5 billion, up to and including $15 billion | |
0.400% | Over $15 billion, up to and including $17.5 billion | |
0.380% | Over $17.5 billion, up to and including $20 billion | |
0.360% | Over $20 billion, up to and including $35 billion | |
0.355% | Over $35 billion, up to and including $50 billion | |
0.350% | In excess of $50 billion |
| 110 | Semiannual Report | franklintempleton.com |
FRANKLIN CUSTODIAN FUNDS
NOTES TO FINANCIAL STATEMENTS (UNAUDITED)
For the period ended March 31, 2018, each Fund’s annualized gross effective investment management fee rate based on average daily net assets was as follows:
Franklin DynaTech Fund
| Franklin Growth Fund
| Franklin Income Fund
| Franklin U.S. Government Securities Fund
| Franklin Utilities Fund
| ||||
| 0.463% | 0.445% | 0.371% | 0.454% | 0.455% |
b. Administrative Fees
Under an agreement with Advisers, FT Services provides administrative services to the Funds. The fee is paid by Advisers based on each of the Funds’ average daily net assets, and is not an additional expense of the Funds.
c. Distribution Fees
The Board has adopted distribution plans for each share class, with the exception of Class R6 and Advisor Class shares, pursuant to Rule 12b-1 under the 1940 Act. Under the Funds’ Class A and M reimbursement distribution plans, the Funds reimburse Distributors for costs incurred in connection with the servicing, sale and distribution of each Fund’s shares up to the maximum annual plan rate for each class. Under the Class A and M reimbursement distribution plans, costs exceeding the maximum for the current plan year cannot be reimbursed in subsequent periods. In addition, under the Funds’ Class C and R compensation distribution plans, the Funds pay Distributors for costs incurred in connection with the servicing, sale and distribution of each Fund’s shares up to the maximum annual plan rate for each class. The plan year, for purposes of monitoring compliance with the maximum annual plan rates, is February 1 through January 31 for each Fund.
The maximum annual plan rates, based on the average daily net assets, for each class, are as follows:
Franklin
| Franklin
| Franklin
| Franklin U.S. Government
| Franklin Utilities Fund
| ||||||
Reimbursement Plans: | ||||||||||
Class A | 0.25% | 0.25% | 0.15% | 0.15% | 0.15% | |||||
Class M | — | — | 0.25% | 0.25% | 0.25% | |||||
Compensation Plans: | ||||||||||
Class C | 1.00% | 1.00% | 0.65% | 0.65% | 0.65% | |||||
Class R | 0.50% | 0.50% | 0.50% | 0.50% | 0.50% |
d. Sales Charges/Underwriting Agreements
Front-end sales charges and contingent deferred sales charges (CDSC) do not represent expenses of the Funds. These charges are deducted from the proceeds of sales of fund shares prior to investment or from redemption proceeds prior to remittance, as applicable. Distributors has advised the Funds of the following commission transactions related to the sales and redemptions of the Funds’ shares for the period:
Franklin
| Franklin Growth Fund
| Franklin Income Fund
| Franklin U.S. Government
| Franklin Utilities Fund
| ||||||
Sales charges retained net of commissions paid to unaffiliated brokers/dealers | $803,178 | $1,017,788 | $5,600,292 | $206,865 | $267,408 | |||||
CDSC retained | $ 35,698 | $ 36,102 | $ 520,977 | $ 26,216 | $ 43,227 |
| franklintempleton.com | Semiannual Report | 111 |
FRANKLIN CUSTODIAN FUNDS
NOTES TO FINANCIAL STATEMENTS (UNAUDITED)
3. Transactions with Affiliates (continued)
e. Transfer Agent Fees
Each class of shares pays transfer agent fees to Investor Services for its performance of shareholder servicing obligations. Effective November 1, 2017, the fees are based on an annualized asset based fee of 0.02% plus a transaction based fee. Prior to November 1, 2017, the fees were account based fees that varied based on fund or account type. In addition, each class reimburses Investor Services for out of pocket expenses incurred and, except for Class R6, reimburses shareholder servicing fees paid to third parties. These fees are allocated daily based upon their relative proportion of such classes’ aggregate net assets. Class R6 pays Investor Services transfer agent fees specific to that class.
For the period ended March 31, 2018, the Funds paid transfer agent fees as noted in the Statements of Operations of which the following amounts were retained by Investor Services:
| Franklin DynaTech Fund | Franklin Growth Fund | Franklin Income Fund | Franklin U.S. Government Securities Fund | Franklin Utilities Fund | ||||||||||||||||
Transfer agent fees | $573,609 | $1,814,197 | $8,280,379 | $763,543 | $724,611 | |||||||||||||||
f. Investments in Affiliated Management Investment Companies
Certain or all Funds invest in one or more affiliated management investment companies for purposes other than exercising a controlling influence over the management or policies. Management fees paid by the Funds are waived on assets invested in the affiliated management investment companies, as noted in the Statements of Operations, in an amount not to exceed the management and administrative fees paid directly or indirectly by each affiliate. Prior to October 1, 2013, the waiver was accounted for as a reduction to management fees. During the period ended March 31, 2018, investments in affiliated management investment companies were as follows:
Number of at Beginning | Gross Additions | Gross Reductions | Number of Held at End | Value at End of Period | Dividend Income | Realized Gain (Loss) | Net Change in Unrealized Appreciation (Depreciation) | |||||||||||||||||||||||||
Franklin DynaTech Fund | ||||||||||||||||||||||||||||||||
Non-Controlled Affiliates | ||||||||||||||||||||||||||||||||
Institutional Fiduciary Trust Money Market Portfolio, 1.24% | 90,584,258 | 555,149,373 | (477,520,813 | ) | 168,212,818 | $168,212,818 | $ 573,368 | $ — | $ — | |||||||||||||||||||||||
Franklin Growth Fund | ||||||||||||||||||||||||||||||||
Non-Controlled Affiliates | ||||||||||||||||||||||||||||||||
Institutional Fiduciary Trust Money Market Portfolio, 1.24% | 331,780,723 | 482,526,928 | (562,129,420 | ) | 252,178,231 | $252,178,231 | $1,092,627 | $ — | $ — | |||||||||||||||||||||||
Franklin Income Fund | ||||||||||||||||||||||||||||||||
Non-Controlled Affiliates | ||||||||||||||||||||||||||||||||
Institutional Fiduciary Trust Money Market Portfolio, 1.24% | 4,208,455,331 | 9,946,152,061 | (13,961,676,996 | ) | 192,930,396 | $192,930,396 | $6,942,930 | $ — | $ — | |||||||||||||||||||||||
Franklin U.S. Government Securities Fund | ||||||||||||||||||||||||||||||||
Non-Controlled Affiliates | ||||||||||||||||||||||||||||||||
Institutional Fiduciary Trust Money Market Portfolio, 1.24% | 90,681,295 | 585,575,893 | (501,093,668 | ) | 175,163,520 | $175,163,520 | $ 566,442 | $ — | $ — | |||||||||||||||||||||||
Franklin Utilities Fund | ||||||||||||||||||||||||||||||||
Non-Controlled Affiliates | ||||||||||||||||||||||||||||||||
Institutional Fiduciary Trust Money Market Portfolio, 1.24% | 21,127,106 | 368,150,323 | (380,397,559 | ) | 8,879,870 | $ 8,879,870 | $ 159,746 | $ — | $ — | |||||||||||||||||||||||
| 112 | Semiannual Report | franklintempleton.com |
FRANKLIN CUSTODIAN FUNDS
NOTES TO FINANCIAL STATEMENTS (UNAUDITED)
g. Waiver and Expense Reimbursements
For Franklin Income Fund, Investor Services has contractually agreed in advance to waive or limit its fees so that the Class R6 transfer agent fees do not exceed 0.01% until January 31, 2019. For Franklin DynaTech Fund, Franklin Growth Fund, Franklin U.S. Government Securities Fund and Franklin Utilities Fund, Investor Services has voluntarily agreed in advance to waive or limit its fees so that the Class R6 transfer agent fees do not exceed 0.02%. Investor Services may discontinue this waiver in the future.
h. Other Affiliated Transactions
At March 31, 2018, one or more of the funds in Franklin Fund Allocator Series owned a percentage of the following Funds’ outstanding shares:
Franklin DynaTech Fund | Franklin Growth Fund | Franklin Income Fund | Franklin U.S. Government | Franklin Utilities Fund | ||||
7.9% | 6.0% | 2.0% | 6.5% | 2.3% |
i. Interfund Transactions
Franklin Income Fund engaged in purchases and sales of investments with funds or other accounts that have common investment managers (or affiliated investment managers), directors, trustees or officers. During the period ended March 31, 2018, these purchase and sale transactions aggregated $11,130,000 and $0, respectively.
4. Expense Offset Arrangement
The Funds have entered into an arrangement with their custodian whereby credits realized as a result of uninvested cash balances are used to reduce a portion of the Funds’ custodian expenses. During the period ended March 31, 2018, the custodian fees were reduced as noted in the Statements of Operations.
5. Income Taxes
For tax purposes, capital losses may be carried over to offset future capital gains. Capital loss carryforwards with no expiration, if any, must be fully utilized before those losses with expiration dates.
At September 30, 2017, the capital loss carryforwards were as follows:
| | Franklin Income Fund | | | Franklin U.S. Government | | |||
Capital loss carryforwards subject to expiration: | ||||||||
2018 | $ | 2,298,838,256 | $ 16,923,310 | |||||
2019 | — | 4,445,156 | ||||||
Capital loss carryforwards not subject to expiration: | ||||||||
Short term | 1,089,373,631 | 204,034,009 | ||||||
Long term | 2,047,701,218 | 299,432,828 | ||||||
|
| |||||||
Total capital loss carryforwards | $ | 5,435,913,105 | $524,835,303 | |||||
|
| |||||||
For tax purposes, the Funds may elect to defer any portion of a late-year ordinary loss to the first day of the following fiscal year. At September 30, 2017, Franklin DynaTech Fund deferred late-year ordinary losses of $8,477,090.
| franklintempleton.com | Semiannual Report | 113 |
FRANKLIN CUSTODIAN FUNDS
NOTES TO FINANCIAL STATEMENTS (UNAUDITED)
5. Income Taxes (continued)
At March 31, 2018, the cost of investments and net unrealized appreciation (depreciation) for income tax purposes were as follows:
| Franklin DynaTech Fund | Franklin Growth Fund | Franklin Income Fund | ||||||||||
Cost of investments | $2,697,378,323 | $ | 5,600,984,688 | $ | 74,724,917,945 | |||||||
Unrealized appreciation | $2,440,943,446 | $ | 9,351,653,075 | $ | 6,272,662,132 | |||||||
Unrealized depreciation | (8,337,897 | ) | (128,024,481 | ) | (4,794,965,995 | ) | ||||||
Net unrealized appreciation (depreciation) | $2,432,605,549 | $ | 9,223,628,594 | $ | 1,477,696,137 | |||||||
Franklin U.S. Government | Franklin Utilities Fund | |||||||||||
Cost of investments | $5,551,665,733 | $ | 3,351,963,961 | |||||||||
Unrealized appreciation | $ 82,192,719 | $ | 2,480,689,095 | |||||||||
Unrealized depreciation | (114,931,856 | ) | (74,295,229 | ) | ||||||||
Net unrealized appreciation (depreciation) | $ (32,739,137 | ) | $ | 2,406,393,866 | ||||||||
Differences between income and/or capital gains as determined on a book basis and a tax basis are primarily due to differing treatments of paydown losses, bond discounts and premiums, corporate actions, equity-linked securities and wash sales.
6. Investment Transactions
Purchases and sales of investments (excluding short term securities) for the period ended March 31, 2018, were as follows:
| Franklin DynaTech Fund | Franklin Growth Fund | Franklin Income Fund | Franklin U.S. Government Securities Fund | Franklin Utilities Fund | ||||||||||||||||
Purchases | $837,496,609 | $437,636,754 | $21,089,284,044 | $1,781,846,189 | $160,912,802 | |||||||||||||||
Sales | $409,838,338 | $626,960,176 | $20,089,254,881 | $1,919,082,603 | $509,042,511 | |||||||||||||||
At March 31, 2018, in connection with securities lending transactions, Franklin Income Fund loaned corporate bonds and notes and received $101,750,579 of cash collateral. The gross amount of recognized liability for such transactions is included in payable upon return of securities loaned in the Statement of Assets and Liabilities. The agreements can be terminated at any time.
7. Credit Risk and Defaulted Securities
At March 31, 2018, Franklin Income Fund had 38.3% of its portfolio invested in high yield securities, senior secured floating rate notes, or other securities rated below investment grade and unrated securities, if any. These securities may be more sensitive to economic conditions causing greater price volatility and are potentially subject to a greater risk of loss due to default than higher rated securities.
Franklin Income Fund held defaulted securities and/or other securities for which the income has been deemed uncollectible. At March 31, 2018, the aggregate value of these securities was $1,138,165,419, representing 1.5% of the Fund’s net assets. The Fund discontinues accruing income on securities for which income has been deemed uncollectible and provides an estimate for losses on interest receivable. The securities have been identified in the accompanying Statement of Investments.
| 114 | Semiannual Report | franklintempleton.com |
FRANKLIN CUSTODIAN FUNDS
NOTES TO FINANCIAL STATEMENTS (UNAUDITED)
8. Restricted Securities
Certain or all Funds invest in securities that are restricted under the Securities Act of 1933 (1933 Act). Restricted securities are often purchased in private placement transactions, and cannot be sold without prior registration unless the sale is pursuant to an exemption under the 1933 Act. Disposal of these securities may require greater effort and expense, and prompt sale at an acceptable price may be difficult. The Funds may have registration rights for restricted securities. The issuer generally incurs all registration costs.
At March 31, 2018, investments in restricted securities, excluding securities exempt from registration under the 1933 Act deemed to be liquid, were as follows:
| Principal Amount | Issuer | Acquisition Date | Cost | Value | ||||||||||
Franklin Income Fund | ||||||||||||||
| 165,515,180 | a CEVA Group PLC, senior secured note, first lien, 144A, PIK, 9.00%, 9/01/20 (Value is 0.2% of Net Assets) | 4/07/17 - 11/01/17 | $ | 152,236,933 | $ | 168,784,616 | ||||||||
aThe Fund also invests in unrestricted securities of the issuer, valued at $17,967,248 as of March 31, 2018.
9. Unfunded Loan Commitments
Certain or all Funds enter into certain credit agreements, all or a portion of which may be unfunded. The Funds are obligated to fund these loan commitments at the borrowers’ discretion. Unfunded loan commitments and funded portions of credit agreements are marked to market daily and any unrealized appreciation or depreciation is included in the Statements of Assets and Liabilities and the Statements of Operations. Funded portions of credit agreements are presented in the Statements of Investments.
At March 31, 2018, unfunded commitments were as follows:
| Borrower | Unfunded Commitment | |||
Franklin Income Fund | ||||
PetroQuest Energy Inc., Mutlidraw Term Loan Facility | $20,000,000 | |||
10. Other Derivative Information
At March 31, 2018, Franklin Income Fund’s investments in derivative contracts are reflected in the Statements of Assets and Liabilities as follows:
| Asset Derivatives | Liability Derivatives | |||||||||||
Derivative Contracts Not Accounted for as Hedging Instruments | Statement of Assets and Liabilities Location | Fair Value | Statement of Assets and Liabilities | Fair Value | ||||||||
Equity contracts | Investments in securities, at value | $— | Options written, at value | $22,440,000 | ||||||||
| franklintempleton.com | Semiannual Report | 115 |
FRANKLIN CUSTODIAN FUNDS
NOTES TO FINANCIAL STATEMENTS (UNAUDITED)
10. Other Derivative Information (continued)
For the period ended March 31, 2018, the effect of derivative contracts in the Franklin Income Fund’s Statements of Operations was as follows:
Derivative Contracts Not Accounted for as Hedging Instruments | Statement of Operations Location | Net Realized Gain (Loss) for the Period | Statement of Operations Location | Net Change in Unrealized Appreciation (Depreciation) for the Period | ||||||||
| Net realized gain (loss) from: | Net change in unrealized appreciation (depreciation) on: | |||||||||||
Equity contracts | Investments | $ 4,614,303 | a | Investments | $6,245,230 | a | ||||||
Written options | 51,908,601 | Written options | 662,521 | |||||||||
Totals | $56,522,904 | $6,907,751 | ||||||||||
aPurchased option contracts are included in net realized gain (loss) from investments and net change in unrealized appreciation (depreciation) on investments in the Statements of Operations.
For the period ended March 31, 2018, the average month end notional amount of options represented $48,146,286.
See Note 1(e) regarding derivative financial instruments.
11. Holdings of 5% Voting Securities of Portfolio Companies
The 1940 Act defines “affiliated companies” to include investments in portfolio companies in which a fund owns 5% or more of the outstanding voting securities. During the period ended March 31, 2018, investments in “affiliated companies” were as follows:
| Name of Issuer | Number of Shares/ Principal Amount Held at Beginning of Period | Gross Additions | Gross Reductions | Number of at End of Period | Value at End of Period | Investment Income | Realized Gain (Loss) | Net Change in Unrealized Appreciation (Depreciation) | ||||||||||||||||||||||||
Franklin Income Fund |
| |||||||||||||||||||||||||||||||
Controlled Affiliatesa |
| |||||||||||||||||||||||||||||||
| Dividends | ||||||||||||||||||||||||||||||||
Stone Energy Corp. | 6,151,402 | — | — | 6,151,402 | $ | 228,217,014 | $ | — | $ — | $49,457,272 | ||||||||||||||||||||||
| Interest | ||||||||||||||||||||||||||||||||
Stone Energy Corp., senior note, 7.50%, 5/31/22 | 72,845,556 | — | — | 72,845,556 | 74,484,581 | 2,746,885 | — | 4,113,704 | ||||||||||||||||||||||||
Total Controlled Affiliates |
| $ | 302,701,595 | $ | 2,746,885 | $ — | $53,570,976 | |||||||||||||||||||||||||
| 116 | Semiannual Report | franklintempleton.com |
FRANKLIN CUSTODIAN FUNDS
NOTES TO FINANCIAL STATEMENTS (UNAUDITED)
| Name of Issuer | Number of Shares/ Principal Amount Held at Beginning of Period | Gross Additions | Gross Reductions | Number of of Period | Value at End of Period | Investment Income | Realized Gain (Loss) | Net Change in Unrealized Appreciation (Depreciation) | ||||||||||||||||||||||||
Franklin Income Fund (continued) |
| |||||||||||||||||||||||||||||||
Non-Controlled Affiliates |
| |||||||||||||||||||||||||||||||
| Dividends | ||||||||||||||||||||||||||||||||
CEVA Holdings LLC. | 81,371 | — | — | 81,371 | $ | 49,636,347 | $ | — | $ | — | $ | 13,019,370 | ||||||||||||||||||||
CEVA Holdings LLC, cvt | ||||||||||||||||||||||||||||||||
pfd., A-1, 2/20/49 | 2,897 | — | — | 2,897 | 2,607,525 | — | — | 811,230 | ||||||||||||||||||||||||
CEVA Holdings LLC, cvt | ||||||||||||||||||||||||||||||||
pfd., A-2, 2/20/49 | 110,565 | — | — | 110,565 | 67,444,699 | — | — | 17,690,413 | ||||||||||||||||||||||||
Energy XXI Gulf Coast Inc. | 7,000,000 | — | (7,000,000 | ) | — | — | — | (276,683,474 | ) | 244,184,332 | ||||||||||||||||||||||
Goodrich Petroleum Corp. | 2,260,859 | — | (2,260,859 | ) | — | — | — | 4,645,755 | (1,960,199 | ) | ||||||||||||||||||||||
Halcon Resources Corp. | 22,500,000 | — | (17,158,515 | ) | 5,341,485 | — | b | — | (112,264,327 | ) | — | b | ||||||||||||||||||||
W&T Offshore Inc. | 10,000,000 | — | (10,000,000 | ) | — | — | — | 15,002,537 | (14,382,287 | ) | ||||||||||||||||||||||
| $ | 119,688,571 | $ | — | $ | (369,299,509 | ) | $ | 259,362,859 | ||||||||||||||||||||||||
| Interest | ||||||||||||||||||||||||||||||||
Halcon Resources Corp., senior note, 144A, 6.75%, 2/15/25 | 108,000,000 | — | (108,000,000 | )c | — | — | 90,147 | 2,269,291 | (6,616,715 | ) | ||||||||||||||||||||||
W&T Offshore Inc., Second Lien Term Loan, 9.00%, 5/15/20 | 161,850,000 | — | — | 161,850,000 | — | b | 7,263,296 | — | — | b | ||||||||||||||||||||||
W&T Offshore Inc., secured note, second lien, 144A, PIK, 9.00%, 5/15/20 | 75,645,453 | 4,065,943 | c | — | 79,711,396 | — | b | 6,375,224 | d | — | — | b | ||||||||||||||||||||
W&T Offshore Inc., senior note, 8.50%, 6/15/19 | 15,568,000 | 81,353,000 | — | 96,921,000 | — | b | 8,786,252 | — | — | b | ||||||||||||||||||||||
W&T Offshore Inc., Senior Secured 1.5 Lien Term Loan, 11.00%, 11/15/19 | 75,000,000 | — | — | 75,000,000 | — | b | 4,113,699 | — | — | b | ||||||||||||||||||||||
W&T Offshore Inc., senior secured note, third lien, 144A, PIK, 10.00%, 6/15/21 | 67,697,026 | 3,384,851 | c | — | 71,081,877 | — | b | 4,236,279 | d | — | — | b | ||||||||||||||||||||
| $ | — | $ | 30,864,897 | $ | 2,269,291 | $ | (6,616,715 | ) | ||||||||||||||||||||||||
Total Non-Controlled Affiliates |
| $ | 119,688,571 | $ | 30,864,897 | $ | (367,030,218 | ) | $ | 252,746,144 | ||||||||||||||||||||||
Total Affiliated Securities (Value is 0.5% of Net Assets) |
| $ | 422,390,166 | $ | 33,611,782 | $ | (367,030,218 | ) | $ | 306,317,120 | ||||||||||||||||||||||
aIssuer in which the Fund owns 25% or more of the outstanding voting securities.
bAs of March 31, 2018, no longer an affiliate.
cGross addition/reduction was the result of various corporate actions.
dIncludes non-cash dividend/interest received.
12. Credit Facility
The Funds, together with other U.S. registered and foreign investment funds (collectively, Borrowers), managed by Franklin Templeton Investments, are borrowers in a joint syndicated senior unsecured credit facility totaling $2 billion (Global Credit Facility) which matures on February 8, 2019. This Global Credit Facility provides a source of funds to the Borrowers for temporary and emergency purposes, including the ability to meet future unanticipated or unusually large redemption requests.
| franklintempleton.com | Semiannual Report | 117 |
FRANKLIN CUSTODIAN FUNDS
NOTES TO FINANCIAL STATEMENTS (UNAUDITED)
12. Credit Facility (continued)
Under the terms of the Global Credit Facility, the Funds shall, in addition to interest charged on any borrowings made by the Funds and other costs incurred by the Funds, pay their share of fees and expenses incurred in connection with the implementation and maintenance of the Global Credit Facility, based upon their relative share of the aggregate net assets of all of the Borrowers, including an annual commitment fee of 0.15% based upon the unused portion of the Global Credit Facility. These fees are reflected in other expenses in the Statements of Operations. During the period ended March 31, 2018, the Funds did not use the Global Credit Facility.
13. Fair Value Measurements
The Funds follow a fair value hierarchy that distinguishes between market data obtained from independent sources (observable inputs) and the Funds’ own market assumptions (unobservable inputs). These inputs are used in determining the value of the Funds’ financial instruments and are summarized in the following fair value hierarchy:
| • | Level 1 – quoted prices in active markets for identical financial instruments |
| • | Level 2 – other significant observable inputs (including quoted prices for similar financial instruments, interest rates, prepayment speed, credit risk, etc.) |
| • | Level 3 – significant unobservable inputs (including the Funds’ own assumptions in determining the fair value of financial instruments) |
The input levels are not necessarily an indication of the risk or liquidity associated with financial instruments at that level.
For movements between the levels within the fair value hierarchy, the Funds have adopted a policy of recognizing the transfers as of the date of the underlying event which caused the movement.
A summary of inputs used as of March 31, 2018, in valuing the Funds’ assets and liabilities carried at fair value, is as follows:
| Level 1 | Level 2 | Level 3 | Total | |||||||||||||
Franklin DynaTech Fund | ||||||||||||||||
Assets: | ||||||||||||||||
Investments in Securities:a | ||||||||||||||||
Equity Investments | $ | 4,961,771,054 | $ | — | $ | — | $ | 4,961,771,054 | ||||||||
Short Term Investments | 168,212,818 | — | — | 168,212,818 | ||||||||||||
Total Investments in Securities | $ | 5,129,983,872 | $ | — | $ | — | $ | 5,129,983,872 | ||||||||
Franklin Growth Fund | ||||||||||||||||
Assets: | ||||||||||||||||
Investments in Securities:a | ||||||||||||||||
Equity Investmentsb | $ | 14,572,435,051 | $ | — | $ | — | $ | 14,572,435,051 | ||||||||
Short Term Investments | 252,178,231 | — | — | 252,178,231 | ||||||||||||
Total Investments in Securities | $ | 14,824,613,282 | $ | — | $ | — | $ | 14,824,613,282 | ||||||||
| 118 | Semiannual Report | franklintempleton.com |
FRANKLIN CUSTODIAN FUNDS
NOTES TO FINANCIAL STATEMENTS (UNAUDITED)
| Level 1 | Level 2 | Level 3 | Total | |||||||||||||
Franklin Income Fund | ||||||||||||||||
Assets: | ||||||||||||||||
Investments in Securities:a | ||||||||||||||||
Equity Investments:b | ||||||||||||||||
Financials | $ | 5,981,207,540 | $ | 76,500,000 | $ | — | $ | 6,057,707,540 | ||||||||
Industrials | 1,856,359,321 | 119,688,571 | — | 1,976,047,892 | ||||||||||||
All Other Equity Investments. | 24,480,558,676 | — | — | 24,480,558,676 | ||||||||||||
Equity-Linked Securities | — | 10,768,464,384 | — | 10,768,464,384 | ||||||||||||
Index-Linked Notes | — | 99,214,550 | — | 99,214,550 | ||||||||||||
Convertible Bonds | — | 622,041,324 | — | 622,041,324 | ||||||||||||
Corporate Bonds | — | 28,920,930,980 | — | 28,920,930,980 | ||||||||||||
Senior Floating Rate Interests | — | 3,090,146,761 | — | 3,090,146,761 | ||||||||||||
Escrows and Litigation Trusts | — | — | — | c | — | |||||||||||
Short Term Investments | 192,930,396 | 17,011,579 | — | 209,941,975 | ||||||||||||
Total Investments in Securities | $ | 32,511,055,933 | $ | 43,713,998,149 | $ | — | $ | 76,225,054,082 | ||||||||
Liabilities: | ||||||||||||||||
Other Financial Instruments: | ||||||||||||||||
Options Written | $ | 22,440,000 | $ | — | $ | — | $ | 22,440,000 | ||||||||
Unfunded Loan Commitments. | — | 185,800 | — | 185,800 | ||||||||||||
Total Other Financial Instruments | $ | 22,440,000 | $ | 185,800 | $ | — | $ | 22,625,800 | ||||||||
Franklin U.S. Government Securities Fund | ||||||||||||||||
Assets: | ||||||||||||||||
Investments in Securities:a | ||||||||||||||||
Mortgage-Backed Securities | $ | — | $ | 5,257,463,418 | $ | — | $ | 5,257,463,418 | ||||||||
U.S. Government and Agency Securities | — | 86,299,658 | — | 86,299,658 | ||||||||||||
Short Term Investments | 175,163,520 | — | — | 175,163,520 | ||||||||||||
Total Investments in Securities | $ | 175,163,520 | $ | 5,343,763,076 | $ | — | $ | 5,518,926,596 | ||||||||
Franklin Utilities Fund | ||||||||||||||||
Assets: | ||||||||||||||||
Investments in Securities:a | ||||||||||||||||
Equity Investments | $ | 5,736,242,091 | $ | — | $ | — | $ | 5,736,242,091 | ||||||||
Corporate Bonds | — | 13,235,866 | — | 13,235,866 | ||||||||||||
Short Term Investments | 8,879,870 | — | — | 8,879,870 | ||||||||||||
Total Investments in Securities | $ | 5,745,121,961 | $ | 13,235,866 | $ | — | $ | 5,758,357,827 | ||||||||
aFor detailed categories, see the accompanying Statement of Investments.
bIncludes common, preferred and convertible preferred stocks and management investment companies.
cIncludes securities determined to have no value at March 31, 2018.
A reconciliation of assets in which Level 3 inputs are used in determining fair value is presented when there are significant Level 3 financial instruments at the beginning and/or end of the period.
14. New Accounting Pronouncements
In March 2017, the Financial Accounting Standards Board issued Accounting Standards Update (ASU) No. 2017-08, Receivables—Nonrefundable Fees and Other Costs (Subtopic 310-20): Premium Amortization on Purchased Callable Debt Securities. The amendments in the ASU shorten the amortization period for certain callable debt securities acquired at a premium, to be amortized to the earliest call date. The ASU does not require an accounting change for securities acquired at a discount, which continues to be amortized to maturity. The ASU is effective for fiscal years and interim periods within those fiscal years beginning after December 15, 2018. Management has reviewed the requirements and believes the adoption of this ASU will not have a material impact on the financial statements.
| franklintempleton.com | Semiannual Report | 119 |
FRANKLIN CUSTODIAN FUNDS
NOTES TO FINANCIAL STATEMENTS (UNAUDITED)
15. Subsequent Events
The Funds have evaluated subsequent events through the issuance of the financial statements and determined that no events have occurred that require disclosure.
Abbreviations
| Currency | Selected Portfolio | |||||||
| CAD | Canadian Dollar | ADR | American Depositary Receipt | |||||
| EUR | Euro | FHLMC | Federal Home Loan Mortgage Corp. | |||||
| GBP | British Pound | FNMA | Federal National Mortgage Association | |||||
| USD | United States Dollar | FRN | Floating Rate Note | |||||
| L/C | Letter of Credit | |||||||
| LIBOR | London InterBank Offered Rate | |||||||
| PIK | Payment-In-Kind | |||||||
| SF | Single Family | |||||||
| SPX B | S&P 500 Index Buy-Write | |||||||
| SPX B DT | S&P 500 Index Buy-Write Distribution | |||||||
| 120 | Semiannual Report | franklintempleton.com |
FRANKLIN CUSTODIAN FUNDS
Special Meeting of Shareholders
MEETING OF SHAREHOLDERS: OCTOBER 30, 2017 AND RECONVENED ON DECEMBER 15, 2017 AND DECEMBER 29, 2017
(UNAUDITED)
A Special Meeting of Shareholders of Franklin Custodian Funds was held at the offices of Franklin Templeton Investments, One Franklin Parkway, San Mateo, California on October 30, 2017 and reconvened on December 15, 2017 and December 29, 2017. The purpose of the meeting was to elect Trustees of Franklin Custodian Funds and to vote on the following proposals: for each Fund to approve the use of a “manager of managers” structure whereby the Fund’s investment manager would be able to hire and replace subadvisers without shareholder approval; for each Fund, to approve an amended fundamental investment restriction regarding investments in commodities; and for Franklin Income Fund, to consider a shareholder proposal. At the meeting, (i) the following persons were elected by the shareholders to serve as Trustees of Franklin Custodian Funds: Harris J. Ashton, Terrence J. Checki, Mary C. Choksi, Edith E. Holiday, Gregory E. Johnson, Rupert H. Johnson, Jr., J. Michael Luttig, Larry D. Thompson, and John B. Wilson; (ii) the proposals to use a “manager of managers” structure to approve the amended fundamental investment restriction regarding investments in commodities were approved by shareholders of each Fund; and (iii) sufficient votes were not received to pass the shareholder proposal for Franklin Income Fund. No other business was transacted at the meeting.
In connection with the meeting, management is aware that some shareholders received from the proxy solicitor numerous calls and mailings that may have been distracting. Management is taking steps to ensure that, in the future, for any new shareholder meeting solicitations that occur, such activity is not repeated. Management apologizes for any inconvenience that may have been caused as a result of such calls and mailings.
The results of the voting at the meeting are as follows:
Proposal 1. To elect a Board of Trustees:
| Name | For | Withheld | ||
| Harris J. Ashton | 20,620,255,266 | 682,475,910 | ||
| Terrence J. Checki | 20,622,617,162 | 680,114,004 | ||
| Mary C. Choksi | 20,641,972,272 | 660,758,903 | ||
| Edith E. Holiday | 20,643,191,970 | 659,539,208 | ||
| Gregory E. Johnson | 20,640,028,777 | 662,702,399 | ||
| Rupert H. Johnson, Jr. | 20,623,629,983 | 679,101,196 | ||
| J. Michael Luttig | 20,638,743,410 | 663,987,768 | ||
| Larry D. Thompson | 20,634,644,439 | 668,086,738 | ||
| John B. Wilson | 20,638,176,920 | 661,053,794 | ||
Total Trust Shares Outstanding*: 36,447,693,102
| * | As of the record date. |
| franklintempleton.com | Semiannual Report | 121 |
FRANKLIN CUSTODIAN FUNDS
SPECIAL MEETING OF SHAREHOLDERS
| Proposal 2. | To approve the use of a “manager of managers” structure whereby the Fund’s investment manager would be able to hire and replace subadvisers without shareholder approval: |
Franklin DynaTech Fund
| Shares | ||||
| ||||
For | 26,120,033 | |||
Against | 1,611,032 | |||
Abstain | 1,036,224 | |||
Broker Non-Votes | 7,606,644 | |||
Total Fund Shares Voted | 36,373,925 | |||
Total Fund Shares Outstanding* | 64,259,298 | |||
| Franklin Growth Fund | ||||
| Shares | ||||
| ||||
For | 62,525,115 | |||
Against | 3,841,242 | |||
Abstain | 2,289,625 | |||
Broker Non-Votes | 17,966,153 | |||
Total Fund Shares Voted | 86,622,134 | |||
Total Fund Shares Outstanding* | 153,895,391 | |||
| Franklin Income Fund | ||||
| Shares | ||||
| ||||
For | 13,745,941,125 | |||
Against | 1,083,743,995 | |||
Abstain | 700,822,344 | |||
Broker Non-Votes | 4,857,894,126 | |||
Total Fund Shares Voted | 20,388,081,146 | |||
Total Fund Shares Outstanding* | 34,952,846,556 | |||
| Franklin U.S. Government Securities Fund | ||||
| Shares | ||||
| ||||
For | 428,222,393 | |||
Against | 29,263,682 | |||
Abstain | 20,078,313 | |||
Broker Non-Votes | 103,560,080 | |||
Total Fund Shares Voted | 581,124,647 | |||
Total Fund Shares Outstanding* | 940,312,857 | |||
| Franklin Utilities Fund | ||||
| Shares | ||||
| ||||
For | 143,130,068 | |||
Against | 10,836,309 | |||
Abstain | 7,518,358 | |||
Broker Non-Votes | 48,794,594 | |||
Total Fund Shares Voted | 210,279,325 | |||
Total Fund Shares Outstanding* | 336,129,000 | |||
122 | Semiannual Report | franklintempleton.com |
FRANKLIN CUSTODIAN FUNDS
SPECIAL MEETING OF SHAREHOLDERS
| Proposal 3. | To approve an amended fundamental investment restriction regarding investments in commodities: |
Franklin DynaTech Fund
| Shares | ||||
| ||||
For | 26,263,004 | |||
Against | 1,160,563 | |||
Abstain | 1,343,715 | |||
Broker Non-Votes | 7,606,644 | |||
Total Fund Shares Voted | 36,373,925 | |||
Total Fund Shares Outstanding* | 64,259,298 | |||
| Franklin Growth Fund | ||||
| Shares | ||||
| ||||
For | 62,908,596 | |||
Against | 2,906,472 | |||
Abstain | 2,840,914 | |||
Broker Non-Votes | 17,966,153 | |||
Total Fund Shares Voted | 86,622,134 | |||
Total Fund Shares Outstanding* | 153,895,391 | |||
| Franklin Income Fund | ||||
| Shares | ||||
| ||||
For | 13,861,058,200 | |||
Against | 776,938,721 | |||
Abstain | 892,190,099 | |||
Broker Non-Votes | 4,857,894,126 | |||
Total Fund Shares Voted | 20,388,081,146 | |||
Total Fund Shares Outstanding* | 34,952,846,556 | |||
| Franklin U.S. Government Securities Fund | ||||
| Shares | ||||
| ||||
For | 428,632,998 | |||
Against | 23,699,554 | |||
Abstain | 25,232,014 | |||
Broker Non-Votes | 103,560,080 | |||
Total Fund Shares Voted | 581,124,647 | |||
Total Fund Shares Outstanding* | 940,312,857 | |||
| Franklin Utilities Fund | ||||
| Shares | ||||
| ||||
For | 143,792,779 | |||
Against | 8,193,703 | |||
Abstain | 9,498,250 | |||
Broker Non-Votes | 48,794,594 | |||
Total Fund Shares Voted | 210,279,325 | |||
Total Fund Shares Outstanding* | 336,129,000 | |||
| franklintempleton.com | Semiannual Report | 123 |
FRANKLIN CUSTODIAN FUNDS
SPECIAL MEETING OF SHAREHOLDERS
| Proposal 4. | Shareholder proposal requesting that Franklin Income Fund’s Board institute procedures to prevent holding investments in companies that, in the judgment of the Board, substantially contribute to genocide or crimes against humanity: |
| Shares | ||||
| ||||
For | 3,258,164,390 | |||
Against | 11,233,489,698 | |||
Abstain | 1,038,532,927 | |||
Broker Non-Votes | 4,857,894,126 | |||
Total Fund Shares Voted | 20,388,081,146 | |||
Total Fund Shares Outstanding* | 34,952,846,556 | |||
124 | Semiannual Report | franklintempleton.com |
FRANKLIN CUSTODIAN FUNDS
Board Approval of Investment Management Agreements
FRANKLIN CUSTODIAN FUNDS
Franklin Dynatech Fund
Franklin Growth Fund
Franklin Income Fund
Franklin U.S. Government Securities
Fund Franklin Utilities Fund
(each a Fund)
At an in-person meeting held on February 27, 2018 (Meeting), the Board of Trustees (Board) of Franklin Custodian Funds (Trust), including a majority of the trustees who are not “interested persons” as defined in the Investment Company Act of 1940 (Independent Trustees), reviewed and approved the continuance of the investment management agreement between Franklin Advisers, Inc. (Manager) and the Trust, on behalf of each Fund (each a Management Agreement) for an additional one-year period. The Independent Trustees received advice from and met separately with Independent Trustee counsel in considering whether to approve the continuation of each Management Agreement. Although the Management Agreements for the Funds were considered at the same Board meeting, the Board considered the information provided to it about the Funds together and with respect to each Fund separately as the Board deemed appropriate.
In considering the continuation of each Management Agreement, the Board reviewed and considered information provided by the Manager at the Meeting and throughout the year at meetings of the Board and its committees. The Board also reviewed and considered information provided in response to a detailed set of requests for information submitted to the Manager by Independent Trustee counsel on behalf of the Independent Trustees in connection with the annual contract renewal process. In addition, prior to the Meeting, the Independent Trustees held a telephonic contract renewal meeting at which the Independent Trustees conferred amongst themselves and Independent Trustee counsel about contract renewal matters. The Board reviewed and considered all of the factors it deemed relevant in approving the continuance of each Management Agreement, including, but not limited to: (i) the nature, extent and quality of the services provided by the Manager; (ii) the investment performance of each Fund; (iii) the costs of the services provided and profits realized by the Manager and its affiliates from the relationship with each Fund; (iv) the extent to which economies of scale are realized as each
Fund grows; and (v) whether fee levels reflect these economies of scale for the benefit of Fund investors.
In approving the continuance of each Management Agreement, the Board, including a majority of the Independent Trustees, determined that the terms of the Management Agreement are fair and reasonable and that the continuance of such Management Agreement is in the interests of the applicable Fund and its shareholders. While attention was given to all information furnished, the following discusses some primary factors relevant to the Board’s determination.
Nature, Extent and Quality of Services
The Board reviewed and considered information regarding the nature, extent and quality of investment management services provided by the Manager and its affiliates to the Funds and their shareholders. This information included, among other things, the qualifications, background and experience of the senior management and investment personnel of the Manager; the structure of investment personnel compensation; oversight of third-party service providers; investment performance reports and related financial information for each Fund; reports on expenses, shareholder services, marketing support payments made to financial intermediaries and third party servicing arrangements; legal and compliance matters; risk controls; pricing and other services provided by the Manager and its affiliates; and management fees charged by the Manager and its affiliates to U.S. funds and other accounts, including management’s explanation of differences among accounts where relevant. The Board also reviewed and considered an annual report on payments made by Franklin Templeton Investments (FTI) or the Funds to financial intermediaries, as well as a memorandum relating to third-party servicing arrangements in response to a guidance update in 2016 from the U.S. Securities and Exchange Commission (SEC) relating to mutual fund distribution and sub-accounting fees. The Board noted management’s continuing efforts and expenditures in establishing effective business continuity plans and developing strategies to address areas of heightened concern in the mutual fund industry, such as cybersecurity and liquidity risk management. The Board also recognized management’s commitment to facilitating Board oversight of particular areas, including derivatives and payments to intermediaries, by enhanced reporting.
The Board also reviewed and considered the benefits provided to Fund shareholders of investing in a fund that is part of the Franklin Templeton family of funds. The Board noted the financial position of Franklin Resources, Inc. (FRI), the
| franklintempleton.com | Semiannual Report | 125 |
FRANKLIN CUSTODIAN FUNDS
SHAREHOLDER INFORMATION
Manager’s parent, and its commitment to the mutual fund business as evidenced by its continued introduction of new funds, reassessment of the fund offerings in response to the market environment and project initiatives and capital investments relating to the services provided to the Funds by the FTI organization.
Following consideration of such information, the Board was satisfied with the nature, extent and quality of services provided by the Manager and its affiliates to the Funds and their shareholders.
Fund Performance
The Board reviewed and considered the performance results of each Fund over various time periods ended December 31, 2017. The Board considered the performance returns for each Fund in comparison to the performance returns of mutual funds deemed comparable to the Fund included in a universe (Performance Universe) selected by Broadridge Financial Solutions, Inc. (Broadridge), an independent provider of investment company data. The Board received a description of the methodology used by Broadridge to select the mutual funds included in a Performance Universe. The Board also reviewed and considered Fund performance reports provided and discussions that occurred with portfolio managers at Board meetings throughout the year. A summary of each Fund’s performance results is below.
Franklin DynaTech Fund - The Performance Universe for this Fund included the Fund and all retail and institutional multi-cap growth funds. The Board noted that the Fund’s annualized total return for the one-, three-, five- and 10-year periods was above the median of its Performance Universe. The Board concluded that the Fund’s performance was satisfactory.
Franklin Growth Fund - The Performance Universe for this Fund included the Fund and all retail and institutional multi-cap growth funds. The Board noted that the Fund’s annualized total return for the one-year period was below the median of its Performance Universe, but for the three-, five- and 10-year periods was above the median of its Performance Universe. The Board concluded that the Fund’s performance was satisfactory. In doing so, the Board noted that the Fund’s annualized total return for the one-year period exceeded 26%.
Franklin Income Fund - The Performance Universe for this Fund included the Fund and all retail and institutional mixed-asset target allocation moderate funds. The Board noted that the Fund’s annualized income return for the one-, three-, five- and 10-year periods was above the median of its
Performance Universe. The Board also noted that the Fund’s annualized total return for the one-, three- and five-year periods was below the median of its Performance Universe, but for the 10-year period was above the median of its Performance Universe. Given the Fund’s income-oriented investment objective, the Board concluded that the Fund’s performance was satisfactory.
Franklin U.S. Government Securities Fund - The Performance Universe for this Fund included the Fund and all retail and institutional Government National Mortgage Association (Ginnie Mae) funds. The Board noted that the Fund’s annualized income return for the one-, three-, five- and 10-year periods was above the median of its Performance Universe. The Board also noted that the Fund’s annualized total return for the one-, three-, five- and 10-year periods was below the median of its Performance Universe. Given the Fund’s income-oriented investment objective and conservative policy of investing substantially all of its assets in Ginnie Mae obligations, the Board concluded that the Fund’s performance was satisfactory.
Franklin Utilities Fund - The Performance Universe for this Fund included the Fund and all retail and institutional utility funds. The Board noted that the Fund’s annualized income return for the one-, three-, five- and 10-year periods was above the median of its Performance Universe. The Board also noted that the Fund’s annualized total return for the one-year period was below the median of its Performance Universe, but for the three-, five- and 10-year periods was above the median of its Performance Universe. The Board concluded that the Fund’s performance was satisfactory.
Comparative Fees and Expenses
The Board reviewed and considered information regarding each Fund’s actual total expense ratio and its various components, including, as applicable, management fees; transfer agent expenses; underlying fund expenses; Rule 12b-1 and non-Rule 12b-1 service fees; and other non-management fees. The Board also noted the quarterly and annual reports it receives on all marketing support payments made by FTI to financial intermediaries. The Board considered the actual total expense ratio and, separately, the contractual management fee rate, without the effect of fee waivers (Management Rate), if any, of each Fund in comparison to the median expense ratio and median Management Rate, respectively, of other mutual funds deemed comparable to and with a similar expense structure as the Fund selected by Broadridge (Expense Group). Broadridge fee and expense data is based upon information taken from each fund’s most recent annual report, which
| 126 | Semiannual Report | franklintempleton.com |
FRANKLIN CUSTODIAN FUNDS
SHAREHOLDER INFORMATION
reflects historical asset levels that may be quite different from those currently existing, particularly in a period of market volatility. While recognizing such inherent limitation and the fact that expense ratios and Management Rates generally increase as assets decline and decrease as assets grow, the Board believed the independent analysis conducted by Broadridge to be an appropriate measure of comparative fees and expenses. The Broadridge Management Rate includes administrative charges, and the actual total expense ratio, for comparative consistency, was shown for Class A shares for funds with multiple classes of shares. The Board received a description of the methodology used by Broadridge to select the mutual funds included in an Expense Group.
Franklin DynaTech Fund, Franklin Growth Fund, Franklin Income Fund and Franklin Utilities Fund - The Expense Group for the Franklin DynaTech Fund included the Fund and 11 other multi-cap growth funds. The Expense Group for the Franklin Growth Fund included the Fund and eight other multi-cap growth funds. The Expense Group for the Franklin Income Fund included the Fund and seven other mixed-asset target allocation moderate funds. The Expense Group for the Franklin Utilities Fund included the Fund and six other utility funds. The Board noted that the Management Rates and actual total expense ratios for these Funds were below the medians of their respective Expense Groups. The Board concluded that the Management Rates charged to these Funds are reasonable.
Franklin U.S. Government Securities Fund - The Expense Group for the Fund included the Fund, six other GNMA funds and six U.S. mortgage funds. The Board noted that the Management Rate for the Fund was equal to the median of its Expense Group, but its actual total expense ratio was below the median of its Expense Group. The Board concluded that the Management Rate charged to the Fund is reasonable.
Profitability
The Board reviewed and considered information regarding the profits realized by the Manager and its affiliates in connection with the operation of each Fund. In this respect, the Board considered the Fund profitability analysis provided by the Manager that addresses the overall profitability of FTI’s U.S. fund business, as well as its profits in providing investment management and other services to each of the individual funds during the 12-month period ended September 30, 2017, being the most recent fiscal year-end for FRI. The Board noted that although management continually makes refinements to its methodologies used in calculating profitability in response to organizational and product-related changes, the overall
methodology has remained consistent with that used in the Funds’ profitability report presentations from prior years. Additionally, PricewaterhouseCoopers LLP, auditor to Franklin Resources, Inc. and certain Franklin Templeton funds, has been engaged by the Manager to periodically review and assess the allocation methodologies to be used solely by the Funds’ Board with respect to the profitability analysis.
The Board noted management’s belief that costs incurred in establishing the infrastructure necessary for the type of mutual fund operations conducted by the Manager and its affiliates may not be fully reflected in the expenses allocated to each Fund in determining its profitability, as well as the fact that the level of profits, to a certain extent, reflected operational cost savings and efficiencies initiated by management. The Board also noted management’s expenditures in improving shareholder services provided to the Funds, as well as the need to implement systems and meet additional regulatory and compliance requirements resulting from recent SEC and other regulatory requirements.
The Board also considered the extent to which the Manager and its affiliates might derive ancillary benefits from fund operations, including revenues generated from transfer agent services, potential benefits resulting from personnel and systems enhancements necessitated by fund growth, as well as increased leverage with service providers and counterparties. Based upon its consideration of all these factors, the Board concluded that the level of profits realized by the Manager and its affiliates from providing services to each Fund was not excessive in view of the nature, extent and quality of services provided to each Fund.
Economies of Scale
The Board reviewed and considered the extent to which the Manager may realize economies of scale, if any, as each Fund grows larger and whether the Fund’s management fee structure reflects any economies of scale for the benefit of shareholders. With respect to possible economies of scale, the Board noted the existence of management fee breakpoints, which operate generally to share any economies of scale with a Fund’s shareholders by reducing the Fund’s effective management fees as the Fund grows in size. The Board considered the Manager’s view that any analyses of potential economies of scale in managing a particular fund are inherently limited in light of the joint and common costs and investments the Manager incurs across the Franklin Templeton family of funds as a whole. The Board noted that the Franklin Income Fund had experienced a decrease in assets over the past three years and would not be
| franklintempleton.com | Semiannual Report | 127 |
FRANKLIN CUSTODIAN FUNDS
SHAREHOLDER INFORMATION
expected to demonstrate additional economies of scale in the near term, but concluded that to the extent economies of scale may be realized by the Manager and its affiliates, each Fund’s management fee structure provided a sharing of benefits with the Fund and its shareholders as the Fund grows.
Conclusion
Based on its review, consideration and evaluation of all factors it believed relevant, including the above-described factors and conclusions, the Board unanimously approved the continuation of each Management Agreement for an additional one-year period.
Proxy Voting Policies and Procedures
The Trust’s investment manager has established Proxy Voting Policies and Procedures (Policies) that the Trust uses to determine how to vote proxies relating to portfolio securities. Shareholders may view the Trust’s complete Policies online at franklintempleton.com. Alternatively, shareholders may request copies of the Policies free of charge by calling the Proxy Group collect at (954) 527-7678 or by sending a written request to: Franklin Templeton Companies, LLC, 300 S.E. 2nd Street, Fort Lauderdale, FL 33301, Attention: Proxy Group. Copies of the Trust’s proxy voting records are also made available online at franklintempleton.com and posted on the US Securities and Exchange Commission’s website at sec.gov and reflect the most recent 12-month period ended June 30.
Quarterly Statement of Investments
The Trust files a complete statement of investments with the US Securities and Exchange Commission for the first and third quarters for each fiscal year on Form N-Q. Shareholders may view the filed Form N-Q by visiting the Commission’s website at sec.gov. The filed form may also be viewed and copied at the Commission’s Public Reference Room in Washington, DC. Information regarding the operations of the Public Reference Room may be obtained by calling (800) SEC-0330.
| 128 | Semiannual Report | franklintempleton.com |
|
Semiannual Report and Shareholder Letter Franklin Custodian Funds
Investment Manager Franklin Advisers, Inc.
Distributor Franklin Templeton Distributors, Inc. (800) DIAL BEN® / 342-5236 franklintempleton.com
Shareholder Services (800) 632-2301
| |||
Authorized for distribution only when accompanied or preceded by a summary prospectus and/or prospectus. Investors should carefully consider a fund’s investment goals, risks, charges and expenses before investing. A prospectus contains this and other information; please read it carefully before investing.
To help ensure we provide you with quality service, all calls to and from our service areas are monitored and/or recorded.
| © 2018 Franklin Templeton Investments. All rights reserved. | FCF S 05/18 |
| Semiannual Report | ||||
| 2 | ||||
| 5 | ||||
| 7 | ||||
| 8 | ||||
| 11 | ||||
| 14 | ||||
| 20 | ||||
| 22 | ||||
|
| |||
| 1 | Semiannual Report | |||
We are pleased to bring you Franklin Focused Growth Fund’s semiannual report for the period ended March 31, 2018.
Your Fund’s Goal and Main Investments
The Fund seeks capital appreciation by investing in a focused portfolio of approximately 20–50 stocks that the investment manager believes have favorable growth, quality and valuation characteristics.
Performance Overview
For the period under review, the Fund’s Advisor Class shares delivered a +11.68% cumulative total return. In comparison, the Russell 1000® Growth Index, which measures performance of those Russell 1000® Index companies with higher price-to-book ratios and higher forecasted growth values, generated a +9.39% total return.1 You can find more of the Fund’s performance data in the Performance Summary beginning on page 5.
Performance data represent past performance, which does not guarantee future results. Investment return and principal value will fluctuate, and you may have a gain or loss when you sell your shares. Current performance may differ from figures shown.
Economic and Market Overview
The US economy continued to grow during the six months under review. The economy expanded in 2017’s fourth quarter, though at a slower pace compared to the third quarter. Growth continued to moderate in 2018’s first quarter due to a slowdown in consumer spending, residential fixed investment, exports, and state and local government spending. The manufacturing and services sectors expanded during the period. The unemployment rate declined from 4.2% in September 2017 to 4.1% at period-end.2 Monthly retail sales grew early in the period but subsequently declined for three consecutive months, rebounding at period-end amid robust automobile sales. Annual
Portfolio Composition
Based on Total Net Assets as of 3/31/18
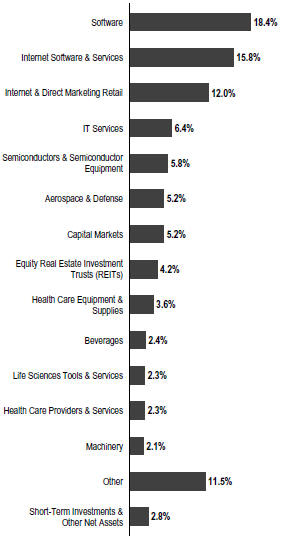
inflation, as measured by the Consumer Price Index, increased from 2.2% in September 2017 to 2.4% at period-end.2
1. Source: Morningstar. Frank Russell Company is the source and owner of the trademarks, service marks and copyrights related to the Russell Indexes. Russell® is a trademark of Frank Russell Company.
The index is unmanaged and includes reinvestment of any income or distributions. It does not reflect any fees, expenses or sales charges. One cannot invest directly in an index, and an index is not representative of the Fund’s portfolio.
2. Source: Bureau of Labor Statistics.
The dollar value, number of shares or principal amount, and names of all portfolio holdings are listed in the Fund’s Statement of Investments (SOI). The SOI begins on page 9.
Semiannual Report | 2 | |||
FRANKLIN FOCUSED GROWTH FUND
The US Federal Reserve (Fed) began reducing its balance sheet in October 2017 and raised its target range for the federal funds rate 0.25% to 1.25%–1.50% in December. In February 2018, Jerome Powell succeeded Janet Yellen as Fed Chair and spoke before Congress for the first time. He indicated that the Fed saw signs of a continued strong labor market and economic growth. He reiterated the Fed’s intention to gradually raise interest rates in an effort to keep the economy from overheating as inflation increases toward the Fed’s 2% target. However, he noted that there was no evidence of the economy overheating and that he had yet to see a clear upward move in wages. At its March meeting, the Fed raised its target range for the federal funds rate 0.25% to 1.50%–1.75% and maintained its forecast of three rate increases in 2018. Additionally, the Fed upgraded its economic forecasts for 2018 and 2019, and its rate projections indicated the number of rate hikes would increase in 2019 and 2020.
US equity markets rose during the review period, benefiting from mostly upbeat economic data, better US corporate earnings and improving global economic growth. Markets were also supported by the US Fed Chair’s comments indicating optimism about the US economy and the likelihood of gradual rate hikes, as well as the passage of the US tax reform bill in December. However, concerns about political uncertainties in the US, tensions between the US and North Korea, and the progress of the US tax reform bill curbed market sentiment at times. After reaching new all-time highs in January 2018, US stocks declined in February amid concerns that strong economic growth and rising inflation would lead the Fed to increase its target rate faster than expected. In March, stocks were pressured further by a broad sell-off in information technology stocks due to a potential for tighter regulation in the sector arising from concerns about consumer data privacy. The Trump administration’s protectionist policy and escalating trade tensions between the US and China further dampened investor sentiment near period-end. In this environment, the broad US stock market, as measured by the Standard & Poor’s® 500 Index, generated a +5.84% total return for the period.3
Investment Strategy
We are research-driven, bottom-up, fundamental investors. Under normal market conditions, we will invest predominantly in equity securities of companies that we believe offer compelling growth opportunities. The equity securities in
Top 10 Holdings
3/31/18
Company Sector/Industry | % of Total Net Assets | |||
| ||||
Amazon.com Inc. | 8.5% | |||
Internet & Direct Marketing Retail
| ||||
| ||||
Visa Inc. | 6.4% | |||
IT Services
| ||||
| ||||
Alphabet Inc. | 5.6% | |||
Internet Software & Services
| ||||
| ||||
Facebook Inc. | 5.1% | |||
Internet Software & Services
| ||||
| ||||
Microsoft Corp. | 4.9% | |||
Software
| ||||
| ||||
Adobe Systems Inc. | 4.6% | |||
Software | ||||
| ||||
Salesforce.com Inc. | 3.7% | |||
Software
| ||||
| ||||
Tencent Holdings Ltd. | 3.5% | |||
Internet Software & Services
| ||||
| ||||
Raytheon Co. | 3.5% | |||
Aerospace & Defense
| ||||
| ||||
ServiceNow Inc. | 2.9% | |||
Software
| ||||
| ||||
which we will invest are predominantly common stock. We may invest in companies of any size, including small and medium capitalization companies. In addition to our main investments, we may invest a portion (up to 25%) of net assets in foreign securities. We will generally seek to maintain a portfolio consisting of securities of approximately 20–50 companies. Although we seek investments across a number of sectors, from time to time, based on economic conditions, we may have significant positions in particular sectors.
Manager’s Discussion
During the period under review, most sectors contributed to the Fund’s absolute performance, including information technology (IT), consumer discretionary and industrials.4 In IT, the Fund’s position in digital marketing and media solutions provider Adobe Systems helped results. The company delivered solid fourth-quarter 2017 corporate results, driven by better-than-expected revenue and earnings. Operating margins exceeded market expectations, and Adobe left the 2018 outlook it provided in October 2017 largely unchanged. Robust growth from its high margin creative cloud business continued to offset
3. Source: Morningstar.
4. The IT sector comprises internet software and services, IT services, semiconductors and semiconductor equipment, and software in the SOI. The consumer discretionary sector comprises hotels, restaurants and leisure; internet and direct marketing retail; media; multiline retail; and textiles, apparel and luxury goods in the SOI. The industrials sector comprises aerospace and defense, electrical equipment, industrial conglomerates, machinery and professional services in the SOI.
| 3 | Semiannual Report | |||
FRANKLIN FOCUSED GROWTH FUND
the more muted growth in its experience cloud business. Software and IT services company Microsoft benefited performance due to demand for its suite of office and cloud-based products. The company is a beneficiary of healthy levels of corporate spending for the IT industry. Payments technology company Visa also contributed to the Fund’s returns.
In consumer discretionary, online retail shopping services provider Amazon.com contributed to the Fund’s performance as it continued to experience revenue growth, driven by higher margin businesses such as fulfillment services, advertising revenue and subscriptions to its Prime service. We believe Prime subscribers could support retail growth, as the program appears to increase purchase frequency, loyalty and overall spending. Its Amazon Web Service, a leader in cloud computing, also drove profitability for the company. Netflix, an internet subscription service company, also boosted results.
In industrials, defense and security solutions company Raytheon benefited the Fund’s performance.
In contrast, the health care and materials sectors detracted from the Fund’s absolute performance during the reporting period.5 In health care, biopharmaceutical company Celgene detracted from results.6 The company reported disappointing third quarter results as revenues for its psoriasis medication Otezla came in significantly below expectations due to increased competition and discounting, although the drug rebounded during the period. Additionally, its cancer drug Revlimid faced patent litigation. Alexion Pharmaceuticals, a biopharmaceutical company that develops and commercializes therapeutic products, also hindered the Fund’s performance.6
In materials, Albemarle hindered the Fund’s results.6 The company engages in developing, manufacturing and marketing chemicals for various products and services.
Elsewhere, broadband communications services provider Charter Communications detracted from results as upfront costs for launching its wireless service have hindered its earnings growth. Social media company Facebook also hampered the Fund’s performances following criticism around potential abuse of the platform and the spread of fake news. The company also faced general concerns about the user
experience. Nevertheless, Facebook experienced fourth quarter revenue growth.
 |
Matthew J. Moberg, CPA Portfolio Manager |

The foregoing information reflects our analysis, opinions and portfolio holdings as of March 31, 2018, the end of the reporting period. The way we implement our main investment strategies and the resulting portfolio holdings may change depending on factors such as market and economic conditions. These opinions may not be relied upon as investment advice or an offer for a particular security. The information is not a complete analysis of every aspect of any market, country, industry, security or the Fund. Statements of fact are from sources considered reliable, but the investment manager makes no representation or warranty as to their completeness or accuracy. Although historical performance is no guarantee of future results, these insights may help you understand our investment management philosophy.
5. The health care sector comprises health care equipment and supplies, health care providers and services, and life sciences tools and services in the SOI.
6. No longer held at period-end.
See www.franklintempletondatasources.com for additional data provider information.
Semiannual Report | 4 | |||
FRANKLIN FOCUSED GROWTH FUND
Performance Summary as of March 31, 2018
The performance table does not reflect any taxes that a shareholder would pay on Fund dividends, capital gain distributions, if any, or any realized gains on the sale of Fund shares. Total return reflects reinvestment of the Fund’s dividends and capital gain distributions, if any, and any unrealized gains or losses. Your dividend income will vary depending on dividends or interest paid by securities in the Fund’s portfolio, adjusted for operating expenses. Capital gain distributions are net profits realized from the sale of portfolio securities.
Performance as of 3/31/181
Cumulative total return excludes sales charges. Average annual total return includes maximum sales charges. Sales charges will vary depending on the size of the investment and the class of share purchased. Advisor Class shares are offered without sales charges.
| Share Class | Cumulative Total Return2 | Average Annual Total Return3 | ||||||
Advisor | ||||||||
6-Month
|
| +11.68%
|
|
| +11.68%
|
| ||
1-Year
|
| +28.18%
|
|
| +28.18%
|
| ||
Since Inception (4/12/16)
|
| +49.73%
|
|
| +22.78%
|
| ||
Performance data represent past performance, which does not guarantee future results. Investment return and principal value will fluctuate, and you may have a gain or loss when you sell your shares. Current performance may differ from figures shown.
See page 6 for Performance Summary footnotes.
| 5 | Semiannual Report | |||
FRANKLIN FOCUSED GROWTH FUND
PERFORMANCE SUMMARY
Total Annual Operating Expenses4
| Share Class | With Waiver | Without Waiver | ||||||
Advisor
|
| 1.00%
|
|
| 2.56%
|
| ||
All investments involve risks, including possible loss of principal. The market values of securities or other investments owned by the Fund will go up or down, sometimes rapidly or unpredictably. Growth stock prices reflect projections of future earnings or revenues, and can, therefore, fall dramatically if the company fails to meet those projections. To the extent the Fund focuses on particular countries, regions, industries, sectors or types of investment from time to time, it may be subject to greater risks of adverse developments in such areas of focus than a fund that invests in a wider variety of countries, regions, industries, sectors or investments. Investments in fast-growing industries such as the information technology and health care sectors (which have historically been volatile) could result in increased price fluctuation, especially over the short term, due to the rapid pace of product change and development and changes in government regulation of companies emphasizing scientific or technological advancement or regulatory approval for new drugs and medical instruments. The Fund may also invest in small- and mid-capitalization companies, which can be particularly sensitive to changing economic conditions, and their prospects for growth are less certain than those of larger, more established companies. Foreign securities involve special risks, including currency fluctuations and economic and political uncertainties. The Fund is actively managed but there is no guarantee that the manager’s investment decisions will produce the desired results. The Fund’s prospectus also includes a description of the main investment risks.
1. The Fund has an expense reduction contractually guaranteed through 1/31/19. Fund investment results reflect the expense reduction; without this reduction the results would have been lower.
2. Cumulative total return represents the change in value of an investment over the periods indicated.
3. Average annual total return represents the average annual change in value of an investment over the periods indicated. Return for less than one year, if any, has not been annualized.
4. Figures are as stated in the Fund’s current prospectus and may differ from the expense ratios disclosed in the Your Fund’s Expenses and Financial Highlights sections in this report. In periods of market volatility, assets may decline significantly, causing total annual Fund operating expenses to become higher than the figures shown.
Semiannual Report | 6 | |||
FRANKLIN FOCUSED GROWTH FUND
As a Fund shareholder, you can incur two types of costs: (1) transaction costs, including sales charges (loads) on Fund purchases and redemptions; and (2) ongoing Fund costs, including management fees, distribution and service (12b-1) fees, and other Fund expenses. All mutual funds have ongoing costs, sometimes referred to as operating expenses. The table below shows ongoing costs of investing in the Fund and can help you understand these costs and compare them with those of other mutual funds. The table assumes a $1,000 investment held for the six months indicated.
Actual Fund Expenses
The table below provides information about actual account values and actual expenses in the columns under the heading “Actual.” In these columns the Fund’s actual return, which includes the effect of Fund expenses, is used to calculate the “Ending Account Value.” You can estimate the expenses you paid during the period by following these steps (of course, your account value and expenses will differ from those in this illustration): Divide your account value by $1,000 (if your account had an $8,600 value, then $8,600 ÷ $1,000 = 8.6). Then multiply the result by the number in the row for your class of shares under the headings “Actual” and “Expenses Paid During Period” (if Actual Expenses Paid During Period were $7.50, then 8.6 x $7.50 = $64.50). In this illustration, the actual expenses paid this period are $64.50.
Hypothetical Example for Comparison with Other Funds
Under the heading “Hypothetical” in the table, information is provided about hypothetical account values and hypothetical expenses based on the Fund’s actual expense ratio and an assumed rate of return of 5% per year before expenses, which is not the Fund’s actual return. This information may not be used to estimate the actual ending account balance or expenses you paid for the period, but it can help you compare ongoing costs of investing in the Fund with those of other funds. To do so, compare this 5% hypothetical example for the class of shares you hold with the 5% hypothetical examples that appear in the shareholder reports of other funds.
Please note that expenses shown in the table are meant to highlight ongoing costs and do not reflect any transactional costs. Therefore, information under the heading “Hypothetical” is useful in comparing ongoing costs only, and will not help you compare total costs of owning different funds. In addition, if transactional costs were included, your total costs would have been higher.
Actual (actual return after expenses) | Hypothetical (5% annual return before expenses) | |||||||||||||||||
| Share Class | Beginning Account Value | Ending Account Value 3/31/18 | Expenses Paid During Period | Ending Account Value 3/31/18 | Expenses Paid During Period 10/1/17–3/31/181,2 | Net Annualized Expense Ratio2 | ||||||||||||
Advisor | $1,000 | $1,116.80 | $5.28 | $1,019.95 | $5.04 | 1.00% | ||||||||||||
1. Expenses are equal to the annualized expense ratio for the six-month period as indicated above—in the far right column—multiplied by the simple average account value over the period indicated, and then multiplied by 182/365 to reflect the one-half year period.
2. Reflects expenses after fee waivers and expense reimbursements. Does not include acquired fund fees and expenses.
| 7 | Semiannual Report | |||
FRANKLIN CUSTODIAN FUNDS
Franklin Focused Growth Fund
| Six Months Ended March 31, 2018 | Year Ended September 30, | |||||||||||
| (unaudited) | 2017 | 2016a | ||||||||||
Advisor Class | ||||||||||||
Per share operating performance | ||||||||||||
(for a share outstanding throughout the period) | ||||||||||||
Net asset value, beginning of period | $13.36 | $10.93 | $10.00 | |||||||||
Income from investment operationsb: | ||||||||||||
Net investment income (loss)c | (0.03 | ) | (0.02 | ) | (0.01 | ) | ||||||
Net realized and unrealized gains (losses) | 1.59 | 2.49 | 0.94 | |||||||||
Total from investment operations | 1.56 | 2.47 | 0.93 | |||||||||
Less distributions from: | ||||||||||||
Net investment income | — | (0.01 | ) | — | ||||||||
Net realized gains | — | (0.03 | ) | — | ||||||||
Total distributions | — | (0.04 | ) | — | ||||||||
Net asset value, end of period | $14.92 | $13.36 | $10.93 | |||||||||
Total returnd | 11.68 | % | 22.78 | % | 9.30 | % | ||||||
Ratios to average net assetse | ||||||||||||
Expenses before waiver and payments by affiliates | 2.25% | 2.31% | 4.76% | |||||||||
Expenses net of waiver and payments by affiliates | 1.00%f | 1.00%f | 1.00% | |||||||||
Net investment income (loss) | (0.36)% | (0.20)% | (0.18)% | |||||||||
Supplemental data | ||||||||||||
Net assets, end of period (000’s) | $3,730 | $3,341 | $2,732 | |||||||||
Portfolio turnover rate | 7.44% | 28.48% | 7.46% | |||||||||
aFor the period April 12, 2016 (commencement of operations) to September 30, 2016.
bThe amount shown for a share outstanding throughout the period may not correlate with the Statement of Operations for the period due to the timing of sales and repurchases of the Fund’s shares in relation to income earned and/or fluctuating fair value of the investments of the Fund.
cBased on average daily shares outstanding.
dTotal return is not annualized for periods less than one year.
eRatios are annualized for periods less than one year, except for non-recurring expenses, if any.
fBenefit of expense reduction rounds to less than 0.01%.
The accompanying notes are an integral part of these financial statements. | Semiannual Report | 8 |
FRANKLIN CUSTODIAN FUNDS
Statement of Investments, March 31, 2018 (unaudited)
Franklin Focused Growth Fund
| Country | Shares | Value | ||||||||||
Common Stocks 97.2% | ||||||||||||
Aerospace & Defense 5.2% | ||||||||||||
The Boeing Co. | United States | 200 | $ | 65,576 | ||||||||
Raytheon Co. | United States | 600 | 129,492 | |||||||||
| 195,068 | ||||||||||||
Beverages 2.4% | ||||||||||||
Constellation Brands Inc., A | United States | 400 | 91,168 | |||||||||
Capital Markets 5.2% | ||||||||||||
BlackRock Inc. | United States | 100 | 54,172 | |||||||||
CBOE Global Markets Inc. | United States | 300 | 34,230 | |||||||||
The Charles Schwab Corp. | United States | 2,000 | 104,440 | |||||||||
| 192,842 | ||||||||||||
Electrical Equipment 0.9% | ||||||||||||
Rockwell Automation Inc. | United States | 200 | 34,840 | |||||||||
Equity Real Estate Investment Trusts (REITs) 4.2% | ||||||||||||
American Tower Corp. | United States | 500 | 72,670 | |||||||||
Equinix Inc. | United States | 200 | 83,628 | |||||||||
| 156,298 | ||||||||||||
Food & Staples Retailing 1.8% | ||||||||||||
Costco Wholesale Corp. | United States | 350 | 65,951 | |||||||||
Health Care Equipment & Supplies 3.6% | ||||||||||||
Danaher Corp. | United States | 700 | 68,537 | |||||||||
a IDEXX Laboratories Inc. | United States | 350 | 66,986 | |||||||||
| 135,523 | ||||||||||||
Health Care Providers & Services 2.3% | ||||||||||||
UnitedHealth Group Inc. | United States | 400 | 85,600 | |||||||||
Hotels, Restaurants & Leisure 0.9% | ||||||||||||
Vail Resorts Inc. | United States | 150 | 33,255 | |||||||||
Industrial Conglomerates 1.8% | ||||||||||||
3M Co. | United States | 300 | 65,856 | |||||||||
Internet & Direct Marketing Retail 12.0% | ||||||||||||
a Amazon.com Inc. | United States | 220 | 318,415 | |||||||||
a Booking Holdings Inc. | United States | 20 | 41,608 | |||||||||
a Netflix Inc. | United States | 300 | 88,605 | |||||||||
| 448,628 | ||||||||||||
Internet Software & Services 15.8% | ||||||||||||
a Alibaba Group Holding Ltd., ADR | China | 300 | 55,062 | |||||||||
a Alphabet Inc., A | United States | 200 | 207,428 | |||||||||
a Dropbox Inc., A | United States | 100 | 3,125 | |||||||||
a Facebook Inc., A | United States | 1,200 | 191,748 | |||||||||
Tencent Holdings Ltd. | China | 2,500 | 130,466 | |||||||||
| 587,829 | ||||||||||||
IT Services 6.4% | ||||||||||||
Visa Inc., A | United States | 2,000 | 239,240 | |||||||||
Life Sciences Tools & Services 2.3% | ||||||||||||
a Mettler-Toledo International Inc. | United States | 150 | 86,254 | |||||||||
Machinery 2.1% | ||||||||||||
Fortive Corp. | United States | 1,000 | 77,520 |
| 9 |
Semiannual Report |
FRANKLIN CUSTODIAN FUNDS
STATEMENT OF INVESTMENTS (UNAUDITED)
Franklin Focused Growth Fund (continued)
| Country | Shares | Value | ||||||||||
Common Stocks (continued) | ||||||||||||
Media 1.7% | ||||||||||||
a Charter Communications Inc., A | United States | 200 | $ | 62,244 | ||||||||
Oil, Gas & Consumable Fuels 1.2% | ||||||||||||
a Concho Resources Inc. | United States | 300 | 45,099 | |||||||||
Personal Products 1.3% | ||||||||||||
Estee Lauder Cos. Inc., A | United States | 330 | 49,408 | |||||||||
Professional Services 1.0% | ||||||||||||
a Verisk Analytics Inc. | United States | 350 | 36,400 | |||||||||
Semiconductors & Semiconductor Equipment 5.8% | ||||||||||||
Analog Devices Inc. | United States | 800 | 72,904 | |||||||||
NVIDIA Corp. | United States | 300 | 69,477 | |||||||||
Xilinx Inc. | United States | 1,000 | 72,240 | |||||||||
| 214,621 | ||||||||||||
Software 18.4% | ||||||||||||
Activision Blizzard Inc. | United States | 1,200 | 80,952 | |||||||||
a Adobe Systems Inc. | United States | 800 | 172,864 | |||||||||
Microsoft Corp. | United States | 2,000 | 182,540 | |||||||||
a Salesforce.com Inc. | United States | 1,200 | 139,560 | |||||||||
a ServiceNow Inc. | United States | 650 | 107,542 | |||||||||
a Zscaler Inc. | United States | 100 | 2,807 | |||||||||
| 686,265 | ||||||||||||
Textiles, Apparel & Luxury Goods 0.9% | ||||||||||||
NIKE Inc., B | United States | 500 | 33,220 | |||||||||
Total Common Stocks (Cost $2,340,487) | 3,623,129 | |||||||||||
Short Term Investments (Cost $119,997) 3.2% | ||||||||||||
Money Market Funds 3.2% | ||||||||||||
b,c Institutional Fiduciary Trust Money Market Portfolio, 1.24% | United States | 119,997 | 119,997 | |||||||||
Total Investments (Cost $2,460,484) 100.4% | 3,743,126 | |||||||||||
Other Assets, less Liabilities (0.4)% | (13,271 | ) | ||||||||||
Net Assets 100.0% | $ | 3,729,855 | ||||||||||
See Abbreviations on page 19.
aNon-income producing.
bSee Note 3(e) regarding investments in affiliated management investment companies.
cThe rate shown is the annualized seven-day effective yield at period end.
| The accompanying notes are an integral part of these financial statements. | Semiannual Report | 10 | |||||
FRANKLIN CUSTODIAN FUNDS
Statement of Assets and Liabilities
March 31, 2018 (unaudited)
Franklin Focused Growth Fund
Assets: | ||||
Investments in securities: | ||||
Cost - Unaffiliated issuers | $2,340,487 | |||
Cost - Non-controlled affiliates (Note 3e) | 119,997 | |||
Value - Unaffiliated issuers | $3,623,129 | |||
Value - Non-controlled affiliates (Note 3e) | 119,997 | |||
Receivables: | ||||
Investment securities sold | 4,789 | |||
Dividends | 840 | |||
Affiliates | 7,138 | |||
Other assets | 3 | |||
Total assets | 3,755,896 | |||
Liabilities: | ||||
Payables: | ||||
Investment securities purchased | 5,400 | |||
Reports to shareholders. | 2,229 | |||
Professional fees | 16,439 | |||
Accrued expenses and other liabilities | 1,973 | |||
Total liabilities | 26,041 | |||
Net assets, at value | $3,729,855 | |||
Net assets consist of: | ||||
Paid-in capital | $2,495,234 | |||
Distributions in excess of net investment income | (12,534 | ) | ||
Net unrealized appreciation (depreciation) | 1,282,642 | |||
Accumulated net realized gain (loss) | (35,487 | ) | ||
Net assets, at value | $3,729,855 | |||
Shares outstanding | 250,000 | |||
Net asset value and maximum offering price per share | $14.92 | |||
| 11 | Semiannual Report | | The accompanying notes are an integral part of these financial statements. | ||
FRANKLIN CUSTODIAN FUNDS
FINANCIAL STATEMENTS
Statement of Operations
for the six months ended March 31, 2018 (unaudited)
Franklin Focused Growth Fund
Investment income: | ||||
Dividends: | ||||
Unaffiliated issuers | $ | 11,174 | ||
Non-controlled affiliates (Note 3e) | 384 | |||
|
| |||
Total investment income | 11,558 | |||
|
| |||
Expenses: | ||||
Management fees (Note 3a) | 15,367 | |||
Transfer agent fees (Note 3d) | 304 | |||
Custodian fees (Note 4) | 28 | |||
Reports to shareholders | 3,842 | |||
Professional fees | 18,822 | |||
Other | 2,316 | |||
Total expenses | 40,679 | |||
|
| |||
Expense reductions (Note 4) | (8 | ) | ||
Expenses waived/paid by affiliates (Note 3f) | (22,587 | ) | ||
|
| |||
Net expenses | 18,084 | |||
|
| |||
Net investment income (loss) | (6,526 | ) | ||
|
| |||
Realized and unrealized gains (losses): | ||||
Net realized gain (loss) from: | ||||
Investments: | ||||
Unaffiliated issuers | (19,971 | ) | ||
|
| |||
Net change in unrealized appreciation (depreciation) on: | ||||
Investments: | ||||
Unaffiliated issuers | 415,827 | |||
|
| |||
Net realized and unrealized gain (loss) | 395,856 | |||
|
| |||
Net increase (decrease) in net assets resulting from operations | $ | 389,330 | ||
|
| |||
The accompanying notes are an integral part of these financial statements. | Semiannual Report | 12 |
FRANKLIN CUSTODIAN FUNDS
FINANCIAL STATEMENTS
Statements of Changes in Net Assets
Franklin Focused Growth Fund
| Six Months Ended March 31, 2018 (unaudited) | Year Ended September 30, 2017 | |||||||||||||||||||
Increase (decrease) in net assets: | ||||||||||||||||||||
Operations: | ||||||||||||||||||||
Net investment income (loss) | $ | (6,526 | ) | $ | (6,004 | ) | ||||||||||||||
Net realized gain (loss) | (19,971 | ) | (15,522 | ) | ||||||||||||||||
Net change in unrealized appreciation (depreciation) | 415,827 | 639,454 | ||||||||||||||||||
Net increase (decrease) in net assets resulting from operations | 389,330 | 617,928 | ||||||||||||||||||
Distributions to shareholders from: | ||||||||||||||||||||
Net investment income | — | (2,575 | ) | |||||||||||||||||
Net realized gains | — | (6,900 | ) | |||||||||||||||||
Total distributions to shareholders | — | (9,475 | ) | |||||||||||||||||
Net increase (decrease) in net assets | 389,330 | 608,453 | ||||||||||||||||||
Net assets: | ||||||||||||||||||||
Beginning of period | 3,340,525 | 2,732,072 | ||||||||||||||||||
End of period | $ | 3,729,855 | $ | 3,340,525 | ||||||||||||||||
Distributions in excess of net investment income included in net assets: | ||||||||||||||||||||
End of period | $ | (12,534 | ) | $ | (6,008 | ) | ||||||||||||||
| 13 | Semiannual Report | The accompanying notes are an integral part of these financial statements. |
FRANKLIN CUSTODIAN FUNDS
Notes to Financial Statements (unaudited)
Franklin Focused Growth Fund
1. Organization and Significant Accounting Policies
Franklin Custodian Funds (Trust) is registered under the Investment Company Act of 1940 (1940 Act) as an open-end management investment company, consisting of six separate funds and applies the specialized accounting and reporting guidance in U.S. Generally Accepted Accounting Principles (U.S. GAAP). Franklin Focused Growth Fund (Fund) is included in this report. The Fund has five classes of shares: Class A, Class C, Class R, Class R6 and Advisor Class. Each class of shares may differ by its initial sales load, contingent deferred sales charges, voting rights on matters affecting a single class, its exchange privilege and fees due to differing arrangements for distribution and transfer agent fees.
The Fund currently operates with one class of shares, Advisor Class.
The following summarizes the Fund’s significant accounting policies.
a. Financial Instrument Valuation
The Fund’s investments in financial instruments are carried at fair value daily. Fair value is the price that would be received to sell an asset or paid to transfer a liability in an orderly transaction between market participants on the measurement date. The Fund calculates the net asset value (NAV) per share as of 4 p.m. Eastern time each day the New York Stock Exchange (NYSE) is open for trading. Under compliance policies and procedures approved by the Trust’s Board of Trustees (the Board), the Fund’s administrator has responsibility for oversight of valuation, including leading the cross-functional Valuation Committee (VC). The VC provides administration and oversight of the Fund’s valuation policies and procedures, which are approved annually by the Board. Among other things, these procedures allow the Fund to utilize independent pricing services, quotations from securities and financial instrument dealers, and other market sources to determine fair value.
Equity securities listed on an exchange or on the NASDAQ National Market System are valued at the last quoted sale price or the official closing price of the day, respectively. Foreign equity securities are valued as of the close of trading on the foreign stock exchange on which the security is primarily traded, or as of 4 p.m. Eastern time. The value is then converted into its U.S. dollar equivalent at the foreign exchange rate in
effect at 4 p.m. Eastern time on the day that the value of the security is determined. Over-the-counter (OTC) securities are valued within the range of the most recent quoted bid and ask prices. Securities that trade in multiple markets or on multiple exchanges are valued according to the broadest and most representative market. Certain equity securities are valued based upon fundamental characteristics or relationships to similar securities.
Investments in open-end mutual funds are valued at the closing NAV.
The Fund has procedures to determine the fair value of financial instruments for which market prices are not reliable or readily available. Under these procedures, the VC convenes on a regular basis to review such financial instruments and considers a number of factors, including significant unobservable valuation inputs, when arriving at fair value. The VC primarily employs a market-based approach which may use related or comparable assets or liabilities, recent transactions, market multiples, book values, and other relevant information for the investment to determine the fair value of the investment. An income-based valuation approach may also be used in which the anticipated future cash flows of the investment are discounted to calculate fair value. Discounts may also be applied due to the nature or duration of any restrictions on the disposition of the investments. Due to the inherent uncertainty of valuations of such investments, the fair values may differ significantly from the values that would have been used had an active market existed. The VC employs various methods for calibrating these valuation approaches including a regular review of key inputs and assumptions, transactional back-testing or disposition analysis, and reviews of any related market activity.
Trading in securities on foreign securities stock exchanges and OTC markets may be completed before 4 p.m. Eastern time. In addition, trading in certain foreign markets may not take place on every Fund’s business day. Occasionally, events occur between the time at which trading in a foreign security is completed and 4 p.m. Eastern time that might call into question the reliability of the value of a portfolio security held by the Fund. As a result, differences may arise between the value of the Fund’s portfolio securities as determined at the foreign market close and the latest indications of value at 4 p.m. Eastern time. In order to minimize the potential for these differences, the VC monitors price movements following the close of trading in foreign stock markets through a series of country specific market proxies (such as baskets of American
Semiannual Report | 14 |
FRANKLIN CUSTODIAN FUNDS
NOTES TO FINANCIAL STATEMENTS (UNAUDITED)
Franklin Focused Growth Fund (continued)
1. Organization and Significant Accounting
Policies (continued)
a. Financial Instrument Valuation (continued)
Depositary Receipts, futures contracts and exchange traded funds). These price movements are measured against established trigger thresholds for each specific market proxy to assist in determining if an event has occurred that may call into question the reliability of the values of the foreign securities held by the Fund. If such an event occurs, the securities may be valued using fair value procedures, which may include the use of independent pricing services.
When the last day of the reporting period is a non-business day, certain foreign markets may be open on those days that the Fund’s NAV is not calculated, which could result in differences between the value of the Fund’s portfolio securities on the last business day and the last calendar day of the reporting period. Any significant security valuation changes due to an open foreign market are adjusted and reflected by the Fund for financial reporting purposes.
b. Foreign Currency Translation
Portfolio securities and other assets and liabilities denominated in foreign currencies are translated into U.S. dollars based on the exchange rate of such currencies against U.S. dollars on the date of valuation. The Fund may enter into foreign currency exchange contracts to facilitate transactions denominated in a foreign currency. Purchases and sales of securities, income and expense items denominated in foreign currencies are translated into U.S. dollars at the exchange rate in effect on the transaction date. Portfolio securities and assets and liabilities denominated in foreign currencies contain risks that those currencies will decline in value relative to the U.S. dollar. Occasionally, events may impact the availability or reliability of foreign exchange rates used to convert the U.S. dollar equivalent value. If such an event occurs, the foreign exchange rate will be valued at fair value using procedures established and approved by the Board.
The Fund does not separately report the effect of changes in foreign exchange rates from changes in market prices on securities held. Such changes are included in net realized and unrealized gain or loss from investments in the Statement of Operations.
Realized foreign exchange gains or losses arise from sales of foreign currencies, currency gains or losses realized between the trade and settlement dates on securities transactions and the
difference between the recorded amounts of dividends, interest, and foreign withholding taxes and the U.S. dollar equivalent of the amounts actually received or paid. Net unrealized foreign exchange gains and losses arise from changes in foreign exchange rates on foreign denominated assets and liabilities other than investments in securities held at the end of the reporting period.
c. Income and Deferred Taxes
It is the Fund’s policy to qualify as a regulated investment company under the Internal Revenue Code. The Fund intends to distribute to shareholders substantially all of its taxable income and net realized gains to relieve it from federal income and excise taxes. As a result, no provision for U.S. federal income taxes is required.
The Fund may be subject to foreign taxation related to income received, capital gains on the sale of securities and certain foreign currency transactions in the foreign jurisdictions in which it invests. Foreign taxes, if any, are recorded based on the tax regulations and rates that exist in the foreign markets in which the Fund invests. When a capital gain tax is determined to apply, the Fund records an estimated deferred tax liability in an amount that would be payable if the securities were disposed of on the valuation date.
The Fund may recognize an income tax liability related to its uncertain tax positions under U.S. GAAP when the uncertain tax position has a less than 50% probability that it will be sustained upon examination by the tax authorities based on its technical merits. As of March 31, 2018, the Fund has determined that no tax liability is required in its financial statements related to uncertain tax positions for any open tax years (or expected to be taken in future tax years). Open tax years are those that remain subject to examination and are based on the statute of limitations in each jurisdiction in which the Fund invests.
d. Security Transactions, Investment Income, Expenses and Distributions
Security transactions are accounted for on trade date. Realized gains and losses on security transactions are determined on a specific identification basis. Estimated expenses are accrued daily. Dividend income is recorded on the ex-dividend date except for certain dividends from securities where the dividend rate is not available. In such cases, the dividend is recorded as soon as the information is received by the Fund. Distributions to
| 15 |
Semiannual Report |
FRANKLIN CUSTODIAN FUNDS
NOTES TO FINANCIAL STATEMENTS (UNAUDITED)
Franklin Focused Growth Fund (continued)
shareholders are recorded on the ex-dividend date. Distributable earnings are determined according to income tax regulations (tax basis) and may differ from earnings recorded in accordance with U.S. GAAP. These differences may be permanent or temporary. Permanent differences are reclassified among capital accounts to reflect their tax character. These reclassifications have no impact on net assets or the results of operations. Temporary differences are not reclassified, as they may reverse in subsequent periods.
Common expenses incurred by the Trust are allocated among the Funds based on the ratio of net assets of each Fund to the combined net assets of the Trust. Fund specific expenses are charged directly to the Fund that incurred the expense.
Realized and unrealized gains and losses and net investment income, excluding class specific expenses, are allocated daily to each class of shares based upon the relative proportion of net assets of each class. Differences in per share distributions by class are generally due to differences in class specific expenses.
e. Accounting Estimates
The preparation of financial statements in accordance with U.S. GAAP requires management to make estimates and assumptions that affect the reported amounts of assets and
liabilities at the date of the financial statements and the amounts of income and expenses during the reporting period. Actual results could differ from those estimates.
f. Guarantees and Indemnifications
Under the Trust’s organizational documents, its officers and trustees are indemnified by the Trust against certain liabilities arising out of the performance of their duties to the Trust. Additionally, in the normal course of business, the Trust, on behalf of the Fund, enters into contracts with service providers that contain general indemnification clauses. The Trust’s maximum exposure under these arrangements is unknown as this would involve future claims that may be made against the Trust that have not yet occurred. Currently, the Trust expects the risk of loss to be remote.
2. Shares of Beneficial Interest
At March 31, 2018, there were an unlimited number of shares authorized (without par value). During the period ended March 31, 2018 and year ended September 30, 2017, there were no transactions of the Fund’s shares.
3. Transactions with Affiliates
Franklin Resources, Inc. is the holding company for various subsidiaries that together are referred to as Franklin Templeton Investments. Certain officers and trustees of the Trust are also officers and/or directors of the following subsidiaries:
| Subsidiary | Affiliation | |
| Franklin Advisers, Inc. (Advisers) | Investment manager | |
| Franklin Templeton Services, LLC (FT Services) | Administrative manager | |
| Franklin Templeton Distributors, Inc. (Distributors) | Principal underwriter | |
| Franklin Templeton Investor Services, LLC (Investor Services) | Transfer agent |
Semiannual Report | 16 |
FRANKLIN CUSTODIAN FUNDS
NOTES TO FINANCIAL STATEMENTS (UNAUDITED)
Franklin Focused Growth Fund (continued)
3. Transactions with Affiliates (continued)
a. Management Fees
The Fund pays an investment management fee to Advisers based on the average daily net assets of the Fund as follows:
| Annualized Fee Rate | Net Assets | |
0.850% | Up to and including $500 million | |
0.800% | Over $500 million, up to and including $1 billion | |
0.750% | Over $1 billion, up to and including $3 billion | |
0.730% | Over $3 billion, up to and including $5 billion | |
0.700% | In excess of $5 billion |
For the period ended March 31, 2018, the annualized gross effective investment management fee rate was 0.850% of the Fund’s average daily net assets.
b. Administrative Fees
Under an agreement with Advisers, FT Services provides administrative services to the Fund. The fee is paid by Advisers based on the Fund’s average daily net assets, and is not an additional expense of the Fund.
c. Distribution Fees
The Board has adopted distribution plans for each share class, with the exception of Class R6 and Advisor Class shares, pursuant to Rule 12b-1 under the 1940 Act. Under the Fund’s Class A reimbursement distribution plan, the Fund reimburses Distributors for costs incurred in connection with the servicing, sale and distribution of the Fund’s shares up to the maximum annual plan rate. Under the Class A reimbursement distribution plan, costs exceeding the maximum for the current plan year cannot be reimbursed in subsequent periods. In addition, under the Fund’s Class C and R compensation distribution plans, the Fund pays Distributors for costs incurred in connection with the servicing, sale and distribution of the Fund’s shares up to the maximum annual plan rate for each class. The plan year, for purposes of monitoring compliance with the maximum annual plan rates, is February 1 through January 31.
The maximum annual plan rates, based on the average daily net assets, for each class, are as follows:
Class A | 0.25% | |
Class C | 1.00% | |
Class R | 0.50% |
d. Transfer Agent Fees
Each class of shares pays transfer agent fees to Investor Services for its performance of shareholder servicing obligations. Effective November 1, 2017, the fees are based on an annualized asset based fee of 0.02% plus a transaction based fee. Prior to November 1, 2017, the fees were account based fees that varied based on fund or account type. In addition, each class reimburses Investor Services for out of pocket expenses incurred and, except for Class R6, reimburses shareholder servicing fees paid to third parties. These fees are allocated daily based upon their relative proportion of such classes’ aggregate net assets. Class R6 pays Investor Services transfer agent fees specific to that class.
For the period ended March 31, 2018, the Fund paid transfer agent fees of $304, which were retained by Investor Services.
| 17 | Semiannual Report | |||
FRANKLIN CUSTODIAN FUNDS
NOTES TO FINANCIAL STATEMENTS (UNAUDITED)
Franklin Focused Growth Fund (continued)
e. Investments in Affiliated Management Investment Companies
The Fund invests in one or more affiliated management investment companies for purposes other than exercising a controlling influence over the management or policies. Management fees paid by the Fund are waived on assets invested in the affiliated management investment companies, as noted in the Statement of Operations, in an amount not to exceed the management and administrative fees paid directly or indirectly by each affiliate. During the period ended March 31, 2018, the Fund held investments in affiliated management investment companies as follows:
| Number of Shares Held at Beginning of Period | Gross Additions | Gross Reductions | Number of Shares Held at End of Period | Value at End of | Dividend Income | Realized Gain (Loss) | Net Change in Unrealized Appreciation (Depreciation) | |||||||||||||||||||
Non-Controlled Affiliates | ||||||||||||||||||||||||||
Institutional Fiduciary Trust Money Market Portfolio, 1.24% | 25,993 | 258,053 | (164,049 | ) | 119,997 | $ | 119,997 | $384 | $ — | $ — | ||||||||||||||||
f. Waiver and Expense Reimbursements
Advisers has contractually agreed in advance to waive or limit its fees and to assume as its own expense certain expenses otherwise payable by the Fund so that the expenses (excluding distribution fees, and acquired fund fees and expenses) for each class of the Fund do not exceed 1.00% based on the average net assets of each class (other than certain non-routine expenses or costs, including those relating to litigation, indemnification, reorganizations, and liquidations) until January 31, 2019. Total expenses waived or paid are not subject to recapture subsequent to the Fund’s fiscal year end.
g. Other Affiliated Transactions
At March 31, 2018, Franklin Resources Inc. owned 100% of the Fund’s outstanding shares. Investment activities of this shareholder could have a material impact on the Fund.
4. Expense Offset Arrangement
The Fund has entered into an arrangement with its custodian whereby credits realized as a result of uninvested cash balances are used to reduce a portion of the Fund’s custodian expenses. During the period ended March 31, 2018, the custodian fees were reduced as noted in the Statement of Operations.
5. Income Taxes
For tax purposes, capital losses may be carried over to offset future capital gains, if any. At September 30, 2017, the Fund had short-term capital loss carryforwards of $15,516.
For tax purposes, the Fund may elect to defer any portion of a late-year ordinary loss to the first day of the following fiscal year. At September 30, 2017, the Fund deferred late-year ordinary losses of $6,009.
At March 31, 2018, the cost of investments and net unrealized appreciation (depreciation) for income tax purposes were as follows:
Cost of investments | $ | 2,460,484 | ||
Unrealized appreciation | $ | 1,287,929 | ||
Unrealized depreciation | (5,287 | ) | ||
Net unrealized appreciation (depreciation) | $ | 1,282,642 | ||
Differences between income and/or capital gains as determined on a book basis and a tax basis are primarily due to differing treatment of foreign currency transactions.
Semiannual Report | 18 | |||
FRANKLIN CUSTODIAN FUNDS
NOTES TO FINANCIAL STATEMENTS (UNAUDITED)
Franklin Focused Growth Fund (continued)
6. Investment Transactions
Purchases and sales of investments (excluding short term securities) for the period ended March 31, 2018, aggregated $261,785 and $369,037, respectively.
7. Credit Facility
The Fund, together with other U.S. registered and foreign investment funds (collectively, Borrowers), managed by Franklin Templeton Investments, are borrowers in a joint syndicated senior unsecured credit facility totaling $2 billion (Global Credit Facility) which matures on February 8, 2019. This Global Credit Facility provides a source of funds to the Borrowers for temporary and emergency purposes, including the ability to meet future unanticipated or unusually large redemption requests.
Under the terms of the Global Credit Facility, the Fund shall, in addition to interest charged on any borrowings made by the Fund and other costs incurred by the Fund, pay its share of fees and expenses incurred in connection with the implementation and maintenance of the Global Credit Facility, based upon its relative share of the aggregate net assets of all of the Borrowers, including an annual commitment fee of 0.15% based upon the unused portion of the Global Credit Facility. These fees are reflected in other expenses in the Statement of Operations. During the period ended March 31, 2018, the Fund did not use the Global Credit Facility.
8. Fair Value Measurements
The Fund follows a fair value hierarchy that distinguishes between market data obtained from independent sources (observable inputs) and the Fund’s own market assumptions (unobservable inputs). These inputs are used in determining the value of the Fund’s financial instruments and are summarized in the following fair value hierarchy:
| • | Level 1 – quoted prices in active markets for identical financial instruments |
| • | Level 2 – other significant observable inputs (including quoted prices for similar financial instruments, interest rates, prepayment speed, credit risk, etc.) |
| • | Level 3 – significant unobservable inputs (including the Fund’s own assumptions in determining the fair value of financial instruments) |
The input levels are not necessarily an indication of the risk or liquidity associated with financial instruments at that level.
For movements between the levels within the fair value hierarchy, the Fund has adopted a policy of recognizing the transfers as of the date of the underlying event which caused the movement.
At March 31, 2018, all of the Fund’s investments in financial instruments carried at fair value were valued using Level 1 inputs. For detailed categories, see the accompanying Statement of Investments.
9. Subsequent Events
The Fund has evaluated subsequent events through the issuance of the financial statements and determined that no events have occurred that require disclosure.
Abbreviations
| Selected Portfolio | ||||||||
| ADR | American Depository Receipt | |||||||
19 |
Semiannual Report |
FRANKLIN FOCUSED GROWTH FUND
Special Meeting of Shareholders
MEETING OF SHAREHOLDERS: OCTOBER 30, 2017 AND RECONVENED ON DECEMBER 15, 2017 AND DECEMBER 29, 2017
(UNAUDITED)
A Special Meeting of Shareholders of Franklin Custodian Funds was held at the offices of Franklin Templeton Investments, One Franklin Parkway, San Mateo, California on October 30, 2017 and reconvened on December 15, 2017 and December 29, 2017. The purpose of the meeting was to elect Trustees of Franklin Custodian Funds and to vote to approve an amended fundamental investment restriction regarding investments in commodities for the Fund. At the meeting, (i) the following persons were elected by the shareholders to serve as Trustees of Franklin Custodian Funds: Harris J. Ashton, Terrence J. Checki, Mary C. Choksi, Edith E. Holiday, Gregory E. Johnson, Rupert H. Johnson, Jr., J. Michael Luttig, Larry D. Thompson, and John B. Wilson; and (ii) the proposal to approve the amended fundamental investment restriction regarding investments in commodities was approved by shareholders of the Fund. No other business was transacted at the meeting.
In connection with the meeting, management is aware that some shareholders received from the proxy solicitor numerous calls and mailings that may have been distracting. Management is taking steps to ensure that, in the future, for any new shareholder meeting solicitations that occur, such activity is not repeated. Management apologizes for any inconvenience that may have been caused as a result of such calls and mailings.
The results of the voting at the meeting are as follows:
Proposal 1. To elect a Board of Trustees:
| Name | For | Withheld | ||
| Harris J. Ashton | 20,620,255,266.00 | 682,475,910.00 | ||
| Terrence J. Checki | 20,622,617,162.00 | 680,114,004.00 | ||
| Mary C. Choksi | 20,641,972,272.00 | 660,758,903.00 | ||
| Edith E. Holiday | 20,643,191,970.00 | 659,539,208.00 | ||
| Gregory E. Johnson | 20,640,028,777.00 | 662,702,399.00 | ||
| Rupert H. Johnson, Jr. | 20,623,629,983.00 | 679,101,196.00 | ||
| J. Michael Luttig | 20,638,743,410.00 | 663,987,768.00 | ||
| Larry D. Thompson | 20,634,644,439.00 | 668,086,738.00 | ||
| John B. Wilson | 20,638,176,920.00 | 661,053,794.00 | ||
Total Trust Shares Outstanding*: 36,447,693,102
* As of the record date.
Semiannual Report | 20 |
FRANKLIN FOCUSED GROWTH FUND
SPECIAL MEETING OF SHAREHOLDERS
| Proposal 2. | To approve an amended fundamental investment restriction regarding investments in commodities: |
| Shares | ||||
| ||||
For | 250,000 | |||
Against | 0 | |||
Abstain | 0 | |||
Broker Non-Votes | 0 | |||
Total Fund Shares Voted | 250,000 | |||
Total Fund Shares Outstanding* | 250,000 | |||
| 21 | Semiannual Report |
FRANKLIN CUSTODIAN FUNDS
FRANKLIN FOCUSED GROWTH FUND
Board Approval of Investment Management Agreements
FRANKLIN CUSTODIAN FUNDS
Franklin Focused Growth Fund
(Fund)
At an in-person meeting held on February 27, 2018 (Meeting), the Board of Trustees (Board) of Franklin Custodian Funds (Trust), including a majority of the trustees who are not “interested persons” as defined in the Investment Company Act of 1940 (Independent Trustees), reviewed and approved the continuance of the investment management agreement between Franklin Advisers, Inc. (Manager) and the Trust, on behalf of the Fund (Management Agreement) for an additional one-year period. The Independent Trustees received advice from and met separately with Independent Trustee counsel in considering whether to approve the continuation of the Management Agreement.
In considering the continuation of the Management Agreement, the Board reviewed and considered information provided by the Manager at the Meeting and throughout the year at meetings of the Board and its committees. The Board also reviewed and considered information provided in response to a detailed set of requests for information submitted to the Manager by Independent Trustee counsel on behalf of the Independent Trustees in connection with the annual contract renewal process. In addition, prior to the Meeting, the Independent Trustees held a telephonic contract renewal meeting at which the Independent Trustees conferred amongst themselves and Independent Trustee counsel about contract renewal matters. The Board reviewed and considered all of the factors it deemed relevant in approving the continuance of the Management Agreement, including, but not limited to: (i) the nature, extent and quality of the services provided by the Manager; (ii) the investment performance of the Fund; (iii) the costs of the services provided and profits realized by the Manager and its affiliates from the relationship with the Fund; and (iv) the extent to which economies of scale may be realized as the Fund grows. The Board noted that the Fund commenced operations on April 12, 2016, but is not currently available for public sale. The Board also noted that Franklin Resources, Inc. (FRI) owns 100% of the Fund’s outstanding shares.
In approving the continuance of the Management Agreement, the Board, including a majority of the Independent Trustees, determined that the terms of the Management Agreement are fair and reasonable and that the continuance of such Management Agreement is in the interests of the Fund and its
shareholder(s). While attention was given to all information furnished, the following discusses some primary factors relevant to the Board’s determination.
Nature, Extent and Quality of Services
The Board reviewed and considered information regarding the nature, extent and quality of investment management services provided by the Manager and its affiliates to the Fund and its shareholder(s). This information included, among other things, the qualifications, background and experience of the senior management and investment personnel of the Manager; the structure of investment personnel compensation; oversight of third-party service providers; investment performance reports and related financial information for the Fund; reports on expenses, shareholder services, and third party servicing arrangements; legal and compliance matters; risk controls; pricing and other services provided by the Manager and its affiliates; and management fees charged by the Manager and its affiliates to U.S. funds and other accounts, including management’s explanation of differences among accounts where relevant. The Board noted management’s continuing efforts and expenditures in establishing effective business continuity plans and developing strategies to address areas of heightened concern in the mutual fund industry, such as cybersecurity and liquidity risk management. The Board also recognized management’s commitment to facilitating Board oversight of particular areas, including derivatives and payments to intermediaries, by enhanced reporting.
The Board also reviewed and considered the benefits provided to Fund shareholder(s) of investing in a fund that is part of the Franklin Templeton family of funds. The Board noted the financial position of FRI, the Manager’s parent, and its commitment to the mutual fund business as evidenced by its continued introduction of new funds, reassessment of the fund offerings in response to the market environment and project initiatives and capital investments relating to the services provided to the Fund by the FTI organization.
Following consideration of such information, the Board was satisfied with the nature, extent and quality of services provided by the Manager and its affiliates to the Fund and its shareholder(s).
Fund Performance
The Board reviewed and considered the performance results of the Fund over various time periods ended December 31, 2017. The Board considered the performance returns for the Fund in comparison to the performance returns of mutual funds deemed comparable to the Fund included in a universe (Performance
Semiannual Report | 22 |
FRANKLIN CUSTODIAN FUNDS
FRANKLIN FOCUSED GROWTH FUND
SHAREHOLDER INFORMATION
Universe) selected by Broadridge Financial Solutions, Inc. (Broadridge), an independent provider of investment company data. The Board received a description of the methodology used by Broadridge to select the mutual funds included in a Performance Universe. The Board also reviewed and considered Fund performance reports provided and discussions that occurred with portfolio managers at Board meetings throughout the year. A summary of the Fund’s performance results is below.
The Performance Universe for the Fund included the Fund and all retail and institutional multi-cap growth funds. The Board noted that the Fund’s annualized total return for the one-year period was above the median of its Performance Universe. The Board concluded that the Fund’s performance was satisfactory.
Comparative Fees and Expenses
The Board reviewed and considered information regarding the Fund’s actual total expense ratio and its various components, including, as applicable, management fees; transfer agent expenses; underlying fund expenses; Rule 12b-1 and non-Rule 12b-1 service fees; and other non-management fees. The Board also noted the quarterly and annual reports it receives on all marketing support payments made by FTI to financial intermediaries. The Board considered the actual total expense ratio and, separately, the contractual management fee rate, without the effect of fee waivers (Management Rate), if any, of the Fund in comparison to the median expense ratio and median Management Rate, respectively, of other mutual funds deemed comparable to and with a similar expense structure as the Fund selected by Broadridge (Expense Group). Broadridge fee and expense data is based upon information taken from each fund’s most recent annual report, which reflects historical asset levels that may be quite different from those currently existing, particularly in a period of market volatility. While recognizing such inherent limitation and the fact that expense ratios and Management Rates generally increase as assets decline and decrease as assets grow, the Board believed the independent analysis conducted by Broadridge to be an appropriate measure of comparative fees and expenses. The Broadridge Management Rate includes administrative charges, and the actual total expense ratio, for comparative consistency, was shown for Advisor Class shares for the Fund and for Institutional Class, Class I and Class S shares for the other funds in the Expense Group. The Board received a description of the methodology used by Broadridge to select the mutual funds included in an Expense Group.
The Expense Group for the Fund included the Fund and ten other multi-cap growth funds. The Board noted that the Management Rate for the Fund was above the median of its Expense Group, but its actual total expense ratio was below the median of its Expense Group. The Board concluded that the Management Rate charged to the Fund is reasonable. In doing so, the Board noted that the Fund has a cap on operating expenses.
Profitability
The Board reviewed and considered information regarding the profits realized by the Manager and its affiliates in connection with the operation of the Fund, noting that the Fund incepted on April 12, 2016, but is not currently available for public sale. In this respect, the Board considered the Fund profitability analysis provided by the Manager that addresses the overall profitability of FTI’s U.S. fund business, as well as its profits in providing investment management and other services to each of the individual funds during the 12-month period ended September 30, 2017, being the most recent fiscal year-end for FRI. The Board noted that although management continually makes refinements to its methodologies used in calculating profitability in response to organizational and product related changes, the overall methodology has remained consistent with that used in the Fund’s profitability report presentations from prior years. Additionally, PricewaterhouseCoopers LLP, auditor to Franklin Resources, Inc. and certain Franklin Templeton funds, has been engaged by the Manager to periodically review and assess the allocation methodologies to be used solely by the Fund’s Board with respect to the profitability analysis.
The Board noted management’s belief that costs incurred in establishing the infrastructure necessary for the type of mutual fund operations conducted by the Manager and its affiliates may not be fully reflected in the expenses allocated to the Fund in determining its profitability, as well as the fact that the level of profits, to a certain extent, reflected operational cost savings and efficiencies initiated by management. The Board also noted management’s need to implement systems and meet additional regulatory and compliance requirements resulting from recent SEC and other regulatory requirements.
The Board also considered the extent to which the Manager and its affiliates might derive ancillary benefits from fund operations, including revenues generated from transfer agent services, potential benefits resulting from personnel and systems enhancements necessitated by fund growth, as well as increased leverage with service providers and counterparties.
| 23 | Semiannual Report |
FRANKLIN CUSTODIAN FUNDS
FRANKLIN FOCUSED GROWTH FUND
SHAREHOLDER INFORMATION
Based upon its consideration of all these factors, the Board concluded that the level of profits realized/expected to be realized by the Manager and its affiliates from providing services to the Fund was not excessive in view of the nature, extent and quality of services provided to the Fund.
Economies of Scale
The Board reviewed and considered the extent to which the Manager may realize economies of scale, if any, as the Fund grows larger and whether the Fund’s management fee structure reflects any economies of scale for the benefit of shareholder(s). With respect to possible economies of scale, the Board noted the existence of management fee breakpoints, which operate generally to share any economies of scale with a Fund’s shareholder(s) by reducing the Fund’s effective management fees as the Fund grows in size. The Board considered the Manager’s view that any analyses of potential economies of scale in managing a particular fund are inherently limited in light of the joint and common costs and investments the Manager incurs across the Franklin Templeton family of funds as a whole. The Board concluded that, to the extent economies of scale may be realized by the Manager and its affiliates, the Fund’s management fee structure provided a sharing of benefits with the Fund and its shareholder(s) as the Fund grows.
Conclusion
Based on its review, consideration and evaluation of all factors it believed relevant, including the above-described factors and conclusions, the Board unanimously approved the continuation of the Management Agreement for an additional one-year period.
Proxy Voting Policies and Procedures
The Fund’s investment manager has established Proxy Voting Policies and Procedures (Policies) that the Fund uses to determine how to vote proxies relating to portfolio securities. Shareholders may view the Fund’s complete Policies online at franklintempleton.com. Alternatively, shareholders may request copies of the Policies free of charge by calling the Proxy Group collect at (954) 527-7678 or by sending a written request to: Franklin Templeton Companies, LLC, 300 S.E. 2nd Street, Fort Lauderdale, FL 33301, Attention: Proxy Group. Copies of the Fund’s proxy voting records are also made available online at franklintempleton.com and posted on the US Securities and Exchange Commission’s website at sec.gov and reflect the most recent 12-month period ended June 30.
Quarterly Statement of Investments
The Trust, on behalf of the Fund, files a complete statement of investments with the US Securities and Exchange Commission for the first and third quarters for each fiscal year on Form N-Q. Shareholders may view the filed Form N-Q by visiting the Commission’s website at sec.gov. The filed form may also be viewed and copied at the Commission’s Public Reference Room in Washington, DC. Information regarding the operations of the Public Reference Room may be obtained by calling (800) SEC-0330.
Semiannual Report | 24 |
| Item 2. | Code of Ethics. |
(a) The Registrant has adopted a code of ethics that applies to its principal executive officers and principal financial and accounting officer.
(c) N/A
(d) N/A
(f) Pursuant to Item 12(a)(1), the Registrant is attaching as an exhibit a copy of its code of ethics that applies to its principal executive officers and principal financial and accounting officer.
| Item 3. | Audit Committee Financial Expert. |
(a)(1) The Registrant has an audit committee financial expert serving on its audit committee.
(2) The audit committee financial expert is John B. Wilson and he is “independent” as defined under the relevant Securities and Exchange Commission Rules and Releases.
| Item 4. | Principal Accountant Fees and Services. N/A |
| Item 5. | Audit Committee of Listed Registrants. N/A |
| Item 6. | Schedule of Investments. N/A |
| Item 7. | Disclosure of Proxy Voting Policies and Procedures for Closed-End Management Investment Companies. N/A |
| Item 8. | Portfolio Managers of Closed-End Management Investment Companies. N/A |
| Item 9. | Purchases of Equity Securities by Closed-End Management Investment Company and Affiliated Purchasers. N/A |
| Item 10. | Submission of Matters to a Vote of Security Holders. |
There have been no changes to the procedures by which shareholders may recommend nominees to the Registrant’s Board of Trustees that would require disclosure herein.
| Item 11. | Controls and Procedures. |
(a) Evaluation of Disclosure Controls and Procedures. The Registrant maintains disclosure controls and procedures that are designed to ensure that information required to be disclosed in the Registrant’s filings under the Securities Exchange Act of 1934 and the Investment
Company Act of 1940 is recorded, processed, summarized and reported within the periods specified in the rules and forms of the Securities and Exchange Commission. Such information is accumulated and communicated to the Registrant’s management, including its principal executive officer and principal financial officer, as appropriate, to allow timely decisions regarding required disclosure. The Registrant’s management, including the principal executive officer and the principal financial officer, recognizes that any set of controls and procedures, no matter how well designed and operated, can provide only reasonable assurance of achieving the desired control objectives.
Within 90 days prior to the filing date of this Shareholder Report on Form N-CSR, the Registrant had carried out an evaluation, under the supervision and with the participation of the Registrant’s management, including the Registrant’s principal executive officer and the Registrant’s principal financial officer, of the effectiveness of the design and operation of the Registrant’s disclosure controls and procedures. Based on such evaluation, the Registrant’s principal executive officer and principal financial officer concluded that the Registrant’s disclosure controls and procedures are effective.
(b) Changes in Internal Controls. There have been no significant changes in the Registrant’s internal controls or in other factors that could significantly affect the internal controls subsequent to the date of their evaluation in connection with the preparation of this Shareholder Report on Form N-CSR.
| Item 12. | Exhibits. |
(a)(1) Code of Ethics
(a)(2) Certifications pursuant to Section 302 of the Sarbanes-Oxley Act of 2002 of Matthew T. Hinkle, Chief Executive Officer – Finance and Administration, and Gaston Gardey, Chief Financial Officer and Chief Accounting Officer
(b) Certifications pursuant to Section 906 of the Sarbanes-Oxley Act of 2002 of Matthew T. Hinkle, Chief Executive Officer – Finance and Administration, and Gaston Gardey, Chief Financial Officer and Chief Accounting Officer
SIGNATURES
Pursuant to the requirements of the Securities Exchange Act of 1934 and the Investment Company Act of 1940, the registrant has duly caused this report to be signed on its behalf by the undersigned, thereunto duly authorized.
FRANKLIN CUSTODIAN FUNDS
| By | /s/ MATTHEW T. HINKLE | |
| Matthew T. Hinkle | ||
| Chief Executive Officer – Finance and Administration | ||
| Date | May 24, 2018 | |
Pursuant to the requirements of the Securities Exchange Act of 1934 and the Investment Company Act of 1940, this report has been signed below by the following persons on behalf of the registrant and in the capacities and on the dates indicated.
| By | /s/ MATTHEW T. HINKLE | |
| Matthew T. Hinkle | ||
| Chief Executive Officer – Finance and Administration | ||
| Date | May 24, 2018 | |
| By | /s/ GASTON GARDEY | |
| Gaston Gardey | ||
| Chief Financial Officer and Chief Accounting Officer | ||
| Date | May 24, 2018 | |