UNITED STATES
SECURITIES AND EXCHANGE COMMISSION
Washington, DC 20549
FORM N-CSRS
CERTIFIED SHAREHOLDER REPORT OF REGISTERED MANAGEMENT INVESTMENT COMPANIES
Investment Company Act file number 811-00537
Franklin Custodian Funds
(Exact name of registrant as specified in charter)
One Franklin Parkway, San Mateo, CA 94403-1906
(Address of principal executive offices) (Zip code)
Craig S. Tyle, One Franklin Parkway, San Mateo, CA 94403-1906
(Name and address of agent for service)
Registrant's telephone number, including area code: 650 312-2000
Date of fiscal year end: 9/30
Date of reporting period: 3/31/16
Item 1. Reports to Stockholders.
| Contents | |
| Semiannual Report | |
| Economic and Market Overview | 3 |
| Franklin DynaTech Fund | 4 |
| Franklin Growth Fund | 13 |
| Franklin Income Fund | 21 |
| Franklin U.S. Government Securities Fund | 29 |
| Franklin Utilities Fund | 36 |
| Financial Highlights and Statements of Investments | 43 |
| FinancialStatements | 99 |
| Notes to Financial Statements | 108 |
| Shareholder Information | 129 |
Visit franklintempleton.com for fund updates, to access your account, or to find helpful financial planning tools.
2 Semiannual Report
franklintempleton.com
Semiannual Report
Economic and Market Overview
The U.S. economy grew modestly during the period under review amid solid consumer spending. In the third and fourth quarters of 2015, exports slowed and state and local governments reduced their spending. Manufacturing activities mostly contracted, except for an expansion toward period-end, while the services sector expanded throughout the period. Growth in services contributed to new jobs and helped the unemployment rate to be largely stable at 5.0% through the review period.1 Retail sales remained mixed as they grew early in the review period due to modest automobile and auto component sales, but contracted toward period-end amid falling gasoline prices and auto sales. Inflation, as measured by the Consumer Price Index, remained subdued and contracted sharply toward period-end led by lower energy prices.
In December 2015, the U.S. Federal Reserve (Fed) raised its target range for the federal funds rate to 0.25%–0.50% and maintained this rate through period-end. At the time of the increase, policymakers cited the labor market’s considerable improvement and were reasonably confident that inflation would move back to the Fed’s 2% medium-term objective. The Fed kept interest rates unchanged at its March meeting and indicated that it would monitor global economic and financial developments and their implications on the labor market and track their actual and expected progression toward its employment and inflation goals.
U.S. stock markets experienced sell-offs during the period under review, resulting from investor concerns about the timing of the Fed’s interest rate increases, slower global economic growth, weakness in China’s economy and a plunge in crude oil prices. However, investors generally remained confident as the Fed maintained an accommodative monetary policy stance despite the rate increase, the European Central Bank expanded its monetary policy measures, the People’s Bank of China adopted further easing measures and the Bank of Japan adopted negative interest rates. The broad U.S. stock market, as measured by the Standard & Poor’s® 500 Index, generated a positive total return for the six months under review.
The foregoing information reflects our analysis and opinions as of March 31, 2016. The information is not a complete analysis of every aspect of any market, country, industry, security or fund. Statements of fact are from sources considered reliable.
1. Source: Bureau of Labor Statistics.
franklintempleton.com
Semiannual Report 3
Franklin DynaTech Fund
This semiannual report for Franklin DynaTech Fund covers the period ended March 31, 2016.
Your Fund’s Goal and Main Investments
The Fund seeks capital appreciation by investing primarily in equity securities of companies that emphasize innovation and new technologies, have superior management and that benefit from new industry conditions in the dynamically changing global economy.
Performance Overview
The Fund’s Class A shares delivered a +2.16% cumulative total return for the six months under review. In comparison, the Russell 1000® Growth Index, which measures performance of the largest companies in the Russell 3000® Index with higher price-to-book ratios and higher forecasted growth values, generated a total return of +8.11%.1 Also for comparison, the broad U.S. stock market as measured by the Standard & Poor’s 500 Index (S&P 500®), produced a +8.49% return, and domestic and international-based stocks as measured by the NASDAQ Composite Index® had a -1.45% total return.1 You can find the Fund’s long-term performance data in the Performance Summary beginning on page 8.
Performance data represent past performance, which does not guarantee future results. Investment return and principal value will fluctuate, and you may have a gain or loss when you sell your shares. Current performance may differ from figures shown. For most recent month-end performance, go to franklintempleton.com or call (800) 342-5236.
Investment Strategy
We use fundamental, bottom-up research to seek companies meeting our criteria of growth potential, quality and valuation. In seeking sustainable growth characteristics, we look for companies we believe can produce sustainable earnings and cash flow growth, evaluating the long-term market opportunity and competitive structure of an industry to target leaders and emerging leaders. We define quality companies as those with strong and improving competitive positions in attractive markets. We also believe important attributes of quality are experienced and talented management teams as well as financial strength reflected in the capital structure, gross and operating margins, free cash flow generation and returns on capital employed. Our valuation analysis includes a range of potential outcomes based on an assessment of multiple scenarios. In assessing value, we consider whether security prices fully reflect the balance of the sustainable growth opportunities relative to business and financial risks.
Manager’s Discussion
The Fund’s information technology (IT) holdings contributed notably to absolute performance during the reporting period.2 Facebook delivered strong results in the fourth quarter of its fiscal year that exceeded analysts’ expectations. The social media network’s advertising revenue accelerated based on its successful strategy for capitalizing on the consumer shift from personal computers to mobile devices. Facebook generated a substantial portion of its revenue from mobile advertising. The company benefited from a highly engaged user base with strong data, targeting and measurement capabilities. These features prompted advertisers to continue to shift more of their budgets toward Facebook advertising. The Fund’s position in Alphabet, the parent company of Internet-related services and products provider Google, also performed well. This positive performance was based on acceleration in the core Google advertising business, better cost controls, and new policies that made the company friendlier toward its shareholders. Chinese Internet portal Tencent Holdings delivered solid results that exceeded expectations despite concerns about the Chinese economy. Results were driven by strong performance from the company’s social networks and growing ecosystem, as well as its online advertising and mobile gaming efforts.
The Fund’s financials sector positions also substantially supported results.3 Data center provider Equinix benefited from the rising adoption of cloud computing technology. Equinix also acquired data center and colocation center company Telecity, which we believed could provide Equinix with a dominant position in the European market. Wireless communications tower operator American Tower produced
1. Source: Morningstar.
The indexes are unmanaged and include reinvestment of any income or distributions. They do not reflect any fees, expenses or sales charges. One cannot invest directly in an
index, and an index is not representative of the Fund’s portfolio.
Russell Investment Group is the source and owner of the trademarks, service marks and copyrights related to the Russell Indexes. Russell® is a trademark of Russell
Investment Group.
2. The IT sector comprises communications equipment; electronic equipment, instruments and components; Internet software and services; IT services; semiconductors and
semiconductor equipment; software; and technology hardware, storage and peripherals in the SOI.
3. The financials sector comprises diversified financial services and real estate investment trusts in the SOI.
The dollar value, number of shares or principal amount, and names of all portfolio holdings are listed in the Fund’s Statement of Investments (SOI).
The SOI begins on page 48.
4 Semiannual Report
franklintempleton.com
FRANKLIN DYNATECH FUND
results that outperformed analysts’ expectations after a period of underperformance caused by concerns about the company’s exposure to a falling Brazil currency. The company also made a large investment in Viom, an Indian tower company. The acquisition further diversifies American Tower’s portfolio of international holdings and could extend their capacity for growth. Shares of independent credit rating agency Moody’s experienced volatility in January and February 2016 based on a weak outlook for corporate high yield debt issuance. However, near period-end, the company’s management team announced an optimistic debt issuance outlook. At period-end, spreads narrowed and issuance volumes improved, which we believed could provide Moody’s with a manageable operating environment.
The Fund’s consumer discretionary sector holdings also aided performance.4 Electronic commerce company Amazon.com experienced a substantial increase in its operating income during the period. This growth was driven by the company’s retail and cloud computing businesses. Travel booking website The Priceline Group experienced volatility during the period. The company was hurt by headwinds caused by strong foreign currency rates and terrorist attacks in Paris and Brussels that made investors question consumer appetite for European travel. However, in February, the company reported that bookings had reaccelerated based on low oil prices and consequently cheaper air tickets. Shares of Liberty Broadband performed well in anticipation of the announced approval of the Charter/Time Warner Cable merger. Liberty Broadband invested in both companies.
In other sectors, Edwards Lifesciences’ stock rose due to greater-than-expected sales and profits during its September and December quarters, increased expectations for sales and profits earnings in 2016, and the release of favorable mortality and stroke risk data in studies of its trans-catheter heart valves. Shares of LED lighting manufacturer Acuity Brands performed well because of continued strength in the non-residential construction market supported growth. UnitedHealth, a diversified health care company, reported strong performance from three of its lines of business: Medicare Advantage, Optum and its Catamaran acquisition. Medical devices developer Stryker’s stock appreciated due to stronger-than-expected profits reported for its September 2015 and December 2015 quarters. Edwards Lifesciences, a producer of artificial heart valves and hemodynamic monitoring, was another contributor during the period.
4. The consumer discretionary sector comprises Internet and catalog retail; media; and textiles, apparel and luxury goods in the SOI.
franklintempleton.com
Semiannual Report 5
| FRANKLIN DYNATECH FUND | ||
| Top 10 Holdings | ||
| 3/31/16 | ||
| Company | % of Total | |
| Sector/Industry | Net Assets | |
| Alphabet Inc. | 5.6 | % |
| Internet Software & Services | ||
| Amazon.com Inc. | 4.7 | % |
| Internet & Catalog Retail | ||
| Facebook Inc. | 4.3 | % |
| Internet Software & Services | ||
| MasterCard Inc. | 3.3 | % |
| IT Services | ||
| Visa Inc. | 2.6 | % |
| IT Services | ||
| Equinix Inc. | 2.3 | % |
| Real Estate Investment Trusts (REITs) | ||
| Celgene Corp. | 2.2 | % |
| Biotechnology | ||
| Gilead Sciences Inc. | 2.1 | % |
| Biotechnology | ||
| Salesforce.com Inc. | 2.0 | % |
| Software | ||
| Palo Alto Networks Inc. | 2.0 | % |
| Communications Equipment | ||
In contrast, the Fund’s health care holdings weighed on absolute performance.5 Incyte, like many other smaller mid-cap biotech companies, performed poorly during the period. The company’s performance can be attributed to disappointing data about the efficacy of several therapies in development, as well as dissipating speculation about mergers and acquisition activity. The Fund’s position in Regeneron Pharmaceuticals also detracted from Fund performance. The biopharmaceutical company was hurt by higher-than-expected expense guidance and a biotechnology selloff in January. Regeneron also suffered after it lost an important patent decision about its high cholesterol medication Praluent.
The telecommunication services sector also detracted from Fund results.6 Wireless infrastructure operator SBA Communications was pressured during the period by a variety of factors. The company suffered from poor guidance driven by operating headwinds that we feel could abate with time. SBA was also hurt by a false rumor that alleged its client Sprint would attempt to cut costs by moving from high-cost leased tower space to less expensive locations. SBA’s performance was also affected by a risk-off environment at the beginning of 2016 that led to underperformance of highly leveraged companies.
The Fund’s exposure to the energy sector was detrimental to performance.7 The share price of Anadarko Petroleum dropped after it was revealed the company made an unsolicited preliminary offer to buy fellow petroleum and natural gas producer Apache. The news sparked a sell-off as investors previously saw Anadarko as a potential seller to larger oil companies. We sold our position in Anadarko by period-end.
Although the IT sector as a whole performed well during the period, a number of individual companies hampered Fund results. Business-oriented social networking service LinkedIn suffered from a preliminary outlook for 2016 that was disappointing and signaled a more rapid deceleration in growth and lower profitability than expected. NetSuite, a business software developer, underperformed because of poor execution in its attempt to attract larger accounts. The company also suffered from relatively low profitability as investors rotated into more mature and highly profitable enterprise software products. Tyler Technologies, which creates software for the public sector, experienced a drop in share price as the broader market sold off and other high profile technology companies reported weak quarterly results.
As managers of Franklin DynaTech Fund, at period-end we remained encouraged by the relative abundance of companies that we believe have strong long-term growth prospects trading at what we perceive to be attractive valuations. We believe it is these innovative, thought-leading companies that may promote economic advancement over the longer term.
5. The health care sector comprises biotechnology, health care equipment and supplies, health care providers and services, health care technology, life sciences tools and
services, and pharmaceuticals in the SOI.
6. The telecommunication services sector comprises diversified telecommunication services and wireless telecommunication services in the SOI.
7. The energy sector comprises energy equipment and services in the SOI.
See www.franklintempletondatasources.com for additional data provider information.
6 Semiannual Report
franklintempleton.com
FRANKLIN DYNATECH FUND
Thank you for your continued participation in Franklin DynaTech Fund. We look forward to serving your future investment needs.

The foregoing information reflects our analysis, opinions and portfolio holdings as of March 31, 2016, the end of the reporting period. The way we implement our main investment strategies and the resulting portfolio holdings may change depending on factors such as market and economic conditions. These opinions may not be relied upon as investment advice or an offer for a particular security. The information is not a complete analysis of every aspect of any market, country, industry, security or the Fund. Statements of fact are from sources considered reliable, but the investment manager makes no representation or warranty as to their completeness or accuracy. Although historical performance is no guarantee of future results, these insights may help you understand our investment management philosophy.
franklintempleton.com
Semiannual Report 7
FRANKLIN DYNATECH FUND
Performance Summary as of March 31, 2016
Your dividend income will vary depending on dividends or interest paid by securities in the Fund’s portfolio, adjusted for operating expenses of each class. Capital gain distributions are net profits realized from the sale of portfolio securities. The performance table does not reflect any taxes that a shareholder would pay on Fund dividends, capital gain distributions, if any, or any realized gains on the sale of Fund shares. Total return reflects reinvestment of the Fund’s dividends and capital gain distributions, if any, and any unrealized gains or losses.
| Net Asset Value | ||||||
| Share Class (Symbol) | 3/31/16 | 9/30/15 | Change | |||
| A (FKDNX) | $ | 45.93 | $ | 46.04 | -$ | 0.11 |
| C (FDYNX) | $ | 39.60 | $ | 40.00 | -$ | 0.40 |
| R (FDNRX) | $ | 44.97 | $ | 45.16 | -$ | 0.19 |
| R6 (FDTRX) | $ | 47.16 | $ | 47.15 | +$ | 0.01 |
| Advisor (FDYZX) | $ | 46.93 | $ | 46.96 | -$ | 0.03 |
| Distributions1 (10/1/15–3/31/16) | ||||||
| Long-Term | ||||||
| Share Class | Capital Gain | |||||
| A | $ | 1.2027 | ||||
| C | $ | 1.2027 | ||||
| R | $ | 1.2027 | ||||
| R6 | $ | 1.2027 | ||||
| Advisor | $ | 1.2027 | ||||
See page 10 for Performance Summary footnotes.
8 Semiannual Report
franklintempleton.com
FRANKLIN DYNATECH FUND
PERFORMANCE SUMMARY
Performance as of 3/31/162
Cumulative total return excludes sales charges. Average annual total return and value of $10,000 investment include maximum sales charges. Class A: 5.75% maximum initial sales charge; Class C: 1% contingent deferred sales charge in first year only;
Class R/R6/Advisor Class: no sales charges.
| Cumulative | Average Annual | Value of | Total Annual | |||||
| Share Class | Total Return3 | Total Return4 | $ | 10,000 Investment5 | Operating Expenses6 | |||
| A | 0.89 | % | ||||||
| 6-Month | +2.16 | % | -3.72 | % | $ | 9,628 | ||
| 1-Year | -3.30 | % | -8.87 | % | $ | 9,113 | ||
| 5-Year | +61.90 | % | +8.82 | % | $ | 15,260 | ||
| 10-Year | +117.49 | % | +7.44 | % | $ | 20,495 | ||
| C | 1.64 | % | ||||||
| 6-Month | +1.75 | % | +0.76 | % | $ | 10,076 | ||
| 1-Year | -4.05 | % | -4.99 | % | $ | 9,501 | ||
| 5-Year | +55.92 | % | +9.29 | % | $ | 15,592 | ||
| 10-Year | +101.68 | % | +7.27 | % | $ | 20,168 | ||
| R | 1.14 | % | ||||||
| 6-Month | +2.04 | % | +2.04 | % | $ | 10,204 | ||
| 1-Year | -3.53 | % | -3.53 | % | $ | 9,647 | ||
| 5-Year | +59.89 | % | +9.84 | % | $ | 15,989 | ||
| Since Inception (12/1/08) | +224.67 | % | +17.43 | % | $ | 32,467 | ||
| R6 | 0.48 | % | ||||||
| 6-Month | +2.37 | % | +2.37 | % | $ | 10,237 | ||
| 1-Year | -2.91 | % | -2.91 | % | $ | 9,709 | ||
| Since Inception (5/1/13) | +42.18 | % | +12.83 | % | $ | 14,218 | ||
| Advisor7 | 0.64 | % | ||||||
| 6-Month | +2.29 | % | +2.29 | % | $ | 10,229 | ||
| 1-Year | -3.08 | % | -3.08 | % | $ | 9,692 | ||
| 5-Year | +63.94 | % | +10.39 | % | $ | 16,394 | ||
| 10-Year | +121.77 | % | +8.29 | % | $ | 22,177 |
Performance data represent past performance, which does not guarantee future results. Investment return and principal value will fluctuate, and you may have a gain or loss when you sell your shares. Current performance may differ from figures shown. For most recent month-end performance, go to franklintempleton.com or call (800) 342-5236.
See page 10 for Performance Summary footnotes.
franklintempleton.com
Semiannual Report 9
| FRANKLIN DYNATECH FUND |
| PERFORMANCE SUMMARY |
All investments involve risks, including possible loss of principal. The Fund’s investments in fast-growing industries, including the technology and health care sectors (which have historically been volatile) could result in increased price fluctuation, especially over the short term, due to the rapid pace of product change and development and changes in government regulation of companies emphasizing scientific or technological advancement or regulatory approval for new drugs and medical instruments. The Fund may also invest in small capitalization companies, which can be particularly sensitive to changing economic conditions, and their prospects for growth are less certain than those of larger, more established companies. The Fund is actively managed but there is no guarantee that the manager’s investment decisions will produce the desired results. The Fund’s prospectus also includes a description of the main investment risks.
| Class C: | These shares have higher annual fees and expenses than Class A shares. |
| Class R: | Shares are available to certain eligible investors as described in the prospectus. These shares have higher annual fees and expenses than Class A shares. |
| Class R6: | Shares are available to certain eligible investors as described in the prospectus. |
| Advisor Class: | Shares are available to certain eligible investors as described in the prospectus. |
1. The distribution amount is the sum of the dividend payments to shareholders for the period shown and includes only estimated tax-basis capital gain.
2. The Fund has a fee waiver associated with any investment in a Franklin Templeton money fund, contractually guaranteed through at least its current fiscal year-end. Fund
investment results reflect the fee waiver, to the extent applicable; without this reduction, the results would have been lower.
3. Cumulative total return represents the change in value of an investment over the periods indicated.
4. Average annual total return represents the average annual change in value of an investment over the periods indicated. Return for less than one year, ifany,hasnotbeen
annualized.
5. These figures represent the value of a hypothetical $10,000 investment in the Fund over the periods indicated.
6. Figures are as stated in the Fund’s current prospectus. In periods of market volatility, assets may decline significantly, causing total annual Fund operating expenses to
become higher than the figures shown.
7. Effective 5/15/08, the Fund began offering Advisor Class shares, which do not have sales charges or a Rule 12b-1 plan. Performance quotations for this class reflect the
following methods of calculation: (a) For periods prior to 5/15/08, a restated figure is used based upon the Fund’s Class A performance, excluding the effect of Class A’s
maximum initial sales charge, but reflecting the effect of the Class A Rule 12b-1 fees; and (b) for periods after 5/15/08, actual Advisor Class performance is used reflecting all
charges and fees applicable to that class. Since 5/15/08 (commencement of sales), the cumulative and average annual total returns of Advisor Class shares were +85.30% and
+8.15%.
10 Semiannual Report
franklintempleton.com
FRANKLIN DYNATECH FUND
Your Fund’s Expenses
As a Fund shareholder, you can incur two types of costs:
- Transaction costs, including sales charges (loads) on Fund purchases; and
- Ongoing Fund costs, including management fees, distribution and service (12b-1) fees, and other Fund expenses. All mutual funds have ongoing costs, sometimes referred to as operating expenses.
The following table shows ongoing costs of investing in the Fund and can help you understand these costs and compare them with those of other mutual funds. The table assumes a $1,000 investment held for the six months indicated.
Actual Fund Expenses
The first line (Actual) for each share class listed in the table provides actual account values and expenses. The “Ending Account Value” is derived from the Fund’s actual return, which includes the effect of Fund expenses.
You can estimate the expenses you paid during the period by following these steps. Of course, your account value and expenses will differ from those in this illustration:
| 1. | Divide your account value by $1,000. |
| If an account had an $8,600 value, then $8,600 ÷ $1,000 = 8.6. | |
| 2. | Multiply the result by the number under the heading “Expenses Paid During Period.” |
| If Expenses Paid During Period were $7.50, then 8.6 x $7.50 = $64.50. |
In this illustration, the estimated expenses paid this period are $64.50.
Hypothetical Example for Comparison with Other Funds
Information in the second line (Hypothetical) for each class in the table can help you compare ongoing costs of investing in the Fund with those of other mutual funds. This information may not be used to estimate the actual ending account balance or expenses you paid during the period. The hypothetical “Ending Account Value” is based on the actual expense ratio for each class and an assumed 5% annual rate of return before expenses, which does not represent the Fund’s actual return. The figure under the heading “Expenses Paid During Period” shows the hypothetical expenses your account would have incurred under this scenario. You can compare this figure with the 5% hypothetical examples that appear in shareholder reports of other funds.
Please note that expenses shown in the table are meant to highlight ongoing costs and do not reflect any transaction costs, such as sales charges. Therefore, the second line for each class is useful in comparing ongoing costs only, and will not help you compare total costs of owning different funds. In addition, if transaction costs were included, your total costs would have been higher. Please refer to the Fund prospectus for additional information on operating expenses.
franklintempleton.com
Semiannual Report 11
| FRANKLIN DYNATECH FUND | ||||||
| YOUR FUND’S EXPENSES | ||||||
| Beginning Account | Ending Account | Expenses Paid During | ||||
| Share Class | Value 10/1/15 | Value 3/31/16 | Period* 10/1/15–3/31/16 | |||
| A | ||||||
| Actual | $ | 1,000 | $ | 1,021.60 | $ | 4.45 |
| Hypothetical (5% return before expenses) | $ | 1,000 | $ | 1,020.60 | $ | 4.45 |
| C | ||||||
| Actual | $ | 1,000 | $ | 1,017.50 | $ | 8.22 |
| Hypothetical (5% return before expenses) | $ | 1,000 | $ | 1,016.85 | $ | 8.22 |
| R | ||||||
| Actual | $ | 1,000 | $ | 1,020.40 | $ | 5.71 |
| Hypothetical (5% return before expenses) | $ | 1,000 | $ | 1,019.35 | $ | 5.70 |
| R6 | ||||||
| Actual | $ | 1,000 | $ | 1,023.70 | $ | 2.38 |
| Hypothetical (5% return before expenses) | $ | 1,000 | $ | 1,022.65 | $ | 2.38 |
| Advisor | ||||||
| Actual | $ | 1,000 | $ | 1,022.90 | $ | 3.19 |
| Hypothetical (5% return before expenses) | $ | 1,000 | $ | 1,021.85 | $ | 3.18 |
*Expenses are calculated using the most recent six-month expense ratio, net of expense waivers, annualized for each class (A: 0.88%;
C: 1.63%; R: 1.13%; R6: 0.47%; and Advisor: 0.63%), multiplied by the average account value over the period, multiplied by 183/366 to reflect
the one-half year period.
12 Semiannual Report
franklintempleton.com
Franklin Growth Fund
This semiannual report for Franklin Growth Fund covers the period ended March 31, 2016.
As previously communicated, shareholders approved the reorganization of Franklin Large Cap Equity Fund into Franklin Growth Fund. The transactions were completed on March 11, 2016, and shares of Franklin Large Cap Equity Fund share classes A, C, R and Advisor were exchanged for shares in Franklin Growth Fund share classes A, C, R, and Advisor, respectively.
Your Fund’s Goal and Main Investments
The Fund seeks capital appreciation by investing substantially in equity securities of companies that are leaders in their industries.
Performance Overview
The Fund’s Class A shares delivered a +5.38% cumulative total return for the six months under review. In comparison, the Standard & Poor’s 500 Index (S&P 500), which is a broad measure of U.S. stock performance, had a +8.49% total return.1 You can find the Fund’s long-term performance data in the Performance Summary beginning on page 16.
Performance data represent past performance, which does not guarantee future results. Investment return will fluctuate. Current performance may differ from figures shown. Please visit franklintempleton.com or call (800) 342-5236 for most recent month-end performance.
Investment Strategy
We use fundamental, bottom-up research to seek companies meeting our criteria of growth potential, quality and valuation. In seeking sustainable growth characteristics, we look for companies we believe can produce sustainable earnings and cash flow growth, evaluating the long-term market opportunity and competitive structure of an industry to target leaders and emerging leaders. We define quality companies as those with strong and improving competitive positions in attractive markets. We also believe important attributes of quality are experienced and talented management teams as well as financial strength reflected in the capital structure, gross and operating margins, free cash flow generation and returns on capital employed. Our valuation analysis includes a range of potential outcomes based on an assessment of multiple scenarios. In assessing value, we consider whether security prices fully reflect the balance of the sustainable growth opportunities relative to business and financial risks.
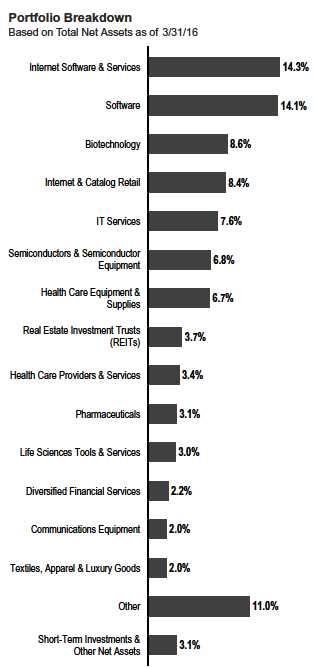
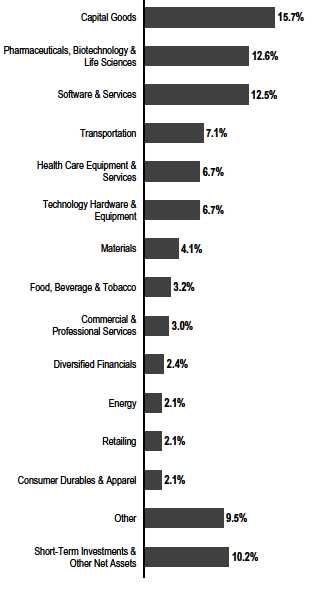
Portfolio Breakdown
Based on Total Net Assets as of 3/31/16
1. Source: Morningstar.
The index is unmanaged and includes reinvestment of any income or distributions. It does not reflect any fees, expenses or sales charges. One cannot invest directly in an
index, and an index is not representative of the Fund’s portfolio.
The dollar value, number of shares or principal amount, and names of all portfolio holdings are listed in the Fund’s Statement of Investments (SOI).
The SOI begins on page 57.
franklintempleton.com
Semiannual Report 13
FRANKLIN GROWTH FUND
Manager’s Discussion
Franklin Growth Fund owned shares of 178 companies at period-end. We continue to invest in a broad array of companies of all sizes and in varied industries.
Top 10 Holdings
3/31/16
| Company | % of Total | |
| Sector/Industry | Net Assets | |
| Apple Inc. | 3.8 | % |
| Technology Hardware & Equipment | ||
| Alaska Air Group Inc. | 2.2 | % |
| Transportation | ||
| Alphabet Inc. | 2.1 | % |
| Software & Services | ||
| Northrop Grumman Corp. | 1.8 | % |
| Capital Goods | ||
| Amazon.com Inc. | 1.8 | % |
| Retailing | ||
| Microsoft Corp. | 1.5 | % |
| Software & Services | ||
| The Walt Disney Co. | 1.4 | % |
| Media | ||
| Union Pacific Corp. | 1.4 | % |
| Transportation | ||
| Amgen Inc. | 1.3 | % |
| Pharmaceuticals, Biotechnology & Life Sciences | ||
| Mettler-Toledo International Inc. | 1.2 | % |
| Pharmaceuticals, Biotechnology & Life Sciences |
During the period under review, most investment sectors contributed to absolute performance including information technology (IT), industrials and health care.2 In IT, Microsoft, a software and IT services company, benefited from strong execution on Office 365 and cloud conversions, constrained operating expenses and continued dividend growth. Shares of positioning, wireless and software technology provider Trimble Navigation increased during the period partially due to positive public reception of the company’s new chief financial officer (CFO) and a recovery in cyclical industrials. Alphabet, the parent company of Internet-related services and products provider Google, also performed well. This positive performance was based on acceleration in the core Google advertising business, better cost controls, and new policies that made the company friendlier towards its shareholders.
In industrials, Northrop Grumman, a security products and solutions provider, benefited from the recent declining geopolitical backdrop. We believed the company is well positioned to produce unmanned aerial vehicles and military aircraft, and the U.S. will potentially increase overall weapon spending in the near term. Shares of 3M, an innovative products and services provider, improved during the second half of the period as declining U.S. manufacturing activity began to recover. Industrial products and equipment manufacturer Illinois Tool Works posted strong earnings results for the fourth quarter of 2015, which was partially driven by excellent cost control and strength in their consumer-facing businesses. The company also completed a mediumsized acquisition within their automotive original equipment manufacturer division.
In health care, precision instrument manufacturer Mettler-Toledo International reported positive results for the fourth quarter of 2015 despite market-related challenges in China and Brazil. Shares of Intuitive Surgical, a systems and instruments manufacturer for minimally invasive surgery, Telefex, a medical technology products provider, improved due to stronger-than-expected profits reported for each company’s September 2015 and December 2015 quarters.
Energy companies, including many with what we considered solid fundamentals, were generally hurt by declining energy prices and geopolitical unrest. However, the Fund was only slightly exposed to energy sector holdings, and consequently, headwinds facing the energy sector minimally detracted from the Fund’s absolute performance.
In other sectors, some individual detractors included EnVision Healthcare Holdings and Fortinet. EnVision, a health care-related services provider, experienced a share decline due to lower-than-expected revenues, which impacted investor confidence in the company. Shares of Fortinet, a network security solutions provider, fell as investor concerns weighed
2. The IT sector comprises technology and hardware equipment, software and services and semiconductors and semiconductor equipment in the SOI. The industrials sector
comprises capital goods, commercial and professional services and transportation in the SOI. The health care sector comprises health care equipment and services and
pharmaceuticals, biotechnology and life sciences in the SOI.
See www.franklintempletondatasources.com for additional data provider information.
14 Semiannual Report
franklintempleton.com
FRANKLIN GROWTH FUND
on the company’s recent poor execution to acquire larger enterprise accounts.
Thank you for your continued participation in Franklin Growth Fund. We look forward to serving your future investment needs.

The foregoing information reflects our analysis, opinions and portfolio holdings as of March 31, 2016, the end of the reporting period. The way we implement our main investment strategies and the resulting portfolio holdings may change depending on factors such as market and economic conditions. These opinions may not be relied upon as investment advice or an offer for a particular security. The information is not a complete analysis of every aspect of any market, country, industry, security or the Fund. Statements of fact are from sources considered reliable, but the investment manager makes no representation or warranty as to their completeness or accuracy. Although historical performance is no guarantee of future results, these insights may help you understand our investment management philosophy.
John Anderson is a research analyst and portfolio manager with the Franklin Equity Group, focusing on equity research and analysis of companies in the food, beverage, and tobacco industries. Prior to joining Franklin Templeton Investments in 2014, Mr. Anderson was a research analyst at Lakeview Investment Group, a value-focused hedge fund and an associate at ThinkEquity Partners, a full-service investment bank. Mr. Anderson holds a BA in Economic and Mathematics from The University of St. Andrews and an M.B.A. in Accounting, Finance and Economics from the University of Chicago Booth School of Business.
Robert Rendler is a research analayst and portfolio manager with the Franklin Equity Group, specializing in equity research within the industrial and natural resources sectors. His primary research coverage includes the chemical and steel industries. His previous research coverage also included utilities. He is a member of the management team for the Franklin Growth Fund. Mr. Rendler began his career with Franklin in 2005 as a futures associate and worked as a quantitative research analyst until 2010. Mr. Rendler earned a B.S. in business from Cal Poly. He is a Chartered Financial Analayst (CFA) charterholder and a member of the Securities Analysts of San Francisco (SASF).
CFA® is a trademark owned by CFA Institute.
franklintempleton.com
Semiannual Report 15
FRANKLIN GROWTH FUND
Performance Summary as of March 31, 2016
Your dividend income will vary depending on dividends or interest paid by securities in the Fund’s portfolio, adjusted for operating expenses of each class. Capital gain distributions are net profits realized from the sale of portfolio securities. The performance table does not reflect any taxes that a shareholder would pay on Fund dividends, capital gain distributions, if any, or any realized gains on the sale of Fund shares. Total return reflects reinvestment of the Fund’s dividends and capital gain distributions, if any, and any unrealized gains or losses.
| Net Asset Value | ||||||
| Share Class (Symbol) | 3/31/16 | 9/30/15 | Change | |||
| A (FKGRX) | $ | 73.52 | $ | 72.40 | +$ | 1.12 |
| C (FRGSX) | $ | 68.22 | $ | 67.17 | +$ | 1.05 |
| R (FGSRX) | $ | 73.24 | $ | 71.93 | +$ | 1.31 |
| R6 (FIFRX) | $ | 73.60 | $ | 72.69 | +$ | 0.91 |
| Advisor (FCGAX) | $ | 73.68 | $ | 72.67 | +$ | 1.01 |
| Distributions1 (10/1/15–3/31/16) | ||||||
| Dividend | Long-Term | |||||
| Share Class | Income | Capital Gain | Total | |||
| A | $ | 0.4747 | $ | 2.3723 | $ | 2.8470 |
| C | $ | 0.0000 | $ | 2.3723 | $ | 2.3723 |
| R | $ | 0.1596 | $ | 2.3723 | $ | 2.5319 |
| R6 | $ | 0.8681 | $ | 2.3723 | $ | 3.2404 |
| Advisor | $ | 0.7056 | $ | 2.3723 | $ | 3.0779 |
See page 18 for Performance Summary footnotes.
16 Semiannual Report
franklintempleton.com
FRANKLIN GROWTH FUND
PERFORMANCE SUMMARY
Performance as of 3/31/162
Cumulative total return excludes sales charges. Average annual total return and value of $10,000 investment include maximum sales charges. Class A: 5.75% maximum initial sales charge; Class C: 1% contingent deferred sales charge in first year only;
Class R/R6/Advisor Class: no sales charges.
| Cumulative | Average Annual | Value of | Total Annual | |||||
| Share Class | Total Return | Total Return | $10,000 Investment | Operating Expenses | ||||
| A | 0.88 | % | ||||||
| 6-Month | +5.38 | % | -0.69 | % | $ | 9,931 | ||
| 1-Year | -1.12 | % | -6.81 | % | $ | 9,319 | ||
| 5-Year | +65.93 | % | +9.36 | % | $ | 15,640 | ||
| 10-Year | +108.26 | % | +6.98 | % | $ | 19,627 | ||
| C | 1.63 | % | ||||||
| 6-Month | +5.00 | % | +4.00 | % | $ | 10,400 | ||
| 1-Year | -1.86 | % | -2.81 | % | $ | 9,719 | ||
| 5-Year | +59.81 | % | +9.83 | % | $ | 15,981 | ||
| 10-Year | +93.21 | % | +6.81 | % | $ | 19,321 | ||
| R | 1.13 | % | ||||||
| 6-Month | +5.25 | % | +5.25 | % | $ | 10,525 | ||
| 1-Year | -1.38 | % | -1.38 | % | $ | 9,862 | ||
| 5-Year | +63.87 | % | +10.38 | % | $ | 16,387 | ||
| 10-Year | +103.07 | % | +7.34 | % | $ | 20,307 | ||
| R6 | 0.46 | % | ||||||
| 6-Month | +5.60 | % | +5.60 | % | $ | 10,560 | ||
| 1-Year | -0.71 | % | -0.71 | % | $ | 9,929 | ||
| Since Inception (5/1/13) | +42.81 | % | +13.00 | % | $ | 14,281 | ||
| Advisor | 0.63 | % | ||||||
| 6-Month | +5.52 | % | +5.52 | % | $ | 10,552 | ||
| 1-Year | -0.87 | % | -0.87 | % | $ | 9,913 | ||
| 5-Year | +68.03 | % | +10.94 | % | $ | 16,803 | ||
| 10-Year | +113.50 | % | +7.88 | % | $ | 21,350 |
Performance data represent past performance, which does not guarantee future results. Investment return and principal value will fluctuate, and you may have a gain or loss when you sell your shares. Current performance may differ from figures shown. For most recent month-end performance, go to franklintempleton.com or call (800) 342-5236.
See page 18 for Performance Summary footnotes.
franklintempleton.com
Semiannual Report 17
| FRANKLIN GROWTH FUND |
| PERFORMANCE SUMMARY |
All investments involve risks, including possible loss of principal. Historically, the Fund has focused on larger companies. The Fund may also invest in small, relatively new and/or unseasoned companies, which involves additional risks, as the price of these securities can be volatile, particularly over the short term. The Fund may focus on particular sectors of the market from time to time, which can carry greater risks of adverse developments in such sectors. In addition, the Fund may invest up to 40% of its net assets in stocks of foreign companies, which involve special risks, including currency fluctuations and economic as well as political uncertainty. The Fund is actively managed but there is no guarantee that the manager’s investment decisions will produce the desired results. The Fund’s prospectus also includes a description of the main investment risks.
| Class C: | These shares have higher annual fees and expenses than Class A shares. |
| Class R: | Shares are available to certain eligible investors as described in the prospectus. These shares have higher annual fees and expenses than Class A shares. |
| Class R6: | Shares are available to certain eligible investors as described in the prospectus. |
| Advisor Class: | Shares are available to certain eligible investors as described in the prospectus. |
1. The distribution amount is the sum of the dividend payments to shareholders for the period shown and includes only estimated tax-basis net investment income and capital
gain.
2. The Fund has a fee waiver associated with any investment in a Franklin Templeton money fund, contractually guaranteed through at least its current fiscal year-end. Fund
investment results reflect the fee waiver, to the extent applicable; without this reduction, the results would have been lower.
3. Cumulative total return represents the change in value of an investment over the periods indicated.
4. Average annual total return represents the average annual change in value of an investment over the periods indicated. Return for less than one year, ifany,hasnotbeen
annualized.
5. These figures represent the value of a hypothetical $10,000 investment in the Fund over the periods indicated.
6. Figures are as stated in the Fund’s current prospectus. In periods of market volatility, assets may decline significantly, causing total annual Fund operating expenses to
become higher than the figures shown.
18 Semiannual Report
franklintempleton.com
FRANKLIN GROWTH FUND
Your Fund’s Expenses
As a Fund shareholder, you can incur two types of costs:
- Transaction costs, including sales charges (loads) on Fund purchases; and
- Ongoing Fund costs, including management fees, distribution and service (12b-1) fees, and other Fund expenses. All mutual funds have ongoing costs, sometimes referred to as operating expenses.
The following table shows ongoing costs of investing in the Fund and can help you understand these costs and compare them with those of other mutual funds. The table assumes a $1,000 investment held for the six months indicated.
Actual Fund Expenses
The first line (Actual) for each share class listed in the table provides actual account values and expenses. The “Ending Account Value” is derived from the Fund’s actual return, which includes the effect of Fund expenses.
You can estimate the expenses you paid during the period by following these steps. Of course, your account value and expenses will differ from those in this illustration:
| 1. | Divide your account value by $1,000. |
| If an account had an $8,600 value, then $8,600 ÷ $1,000 = 8.6. | |
| 2. | Multiply the result by the number under the heading “Expenses Paid During Period.” |
| If Expenses Paid During Period were $7.50, then 8.6 x $7.50 = $64.50. |
In this illustration, the estimated expenses paid this period are $64.50.
Hypothetical Example for Comparison with Other Funds
Information in the second line (Hypothetical) for each class in the table can help you compare ongoing costs of investing in the Fund with those of other mutual funds. This information may not be used to estimate the actual ending account balance or expenses you paid during the period. The hypothetical “Ending Account Value” is based on the actual expense ratio for each class and an assumed 5% annual rate of return before expenses, which does not represent the Fund’s actual return. The figure under the heading “Expenses Paid During Period” shows the hypothetical expenses your account would have incurred under this scenario. You can compare this figure with the 5% hypothetical examples that appear in shareholder reports of other funds.
Please note that expenses shown in the table are meant to highlight ongoing costs and do not reflect any transaction costs, such as sales charges. Therefore, the second line for each class is useful in comparing ongoing costs only, and will not help you compare total costs of owning different funds. In addition, if transaction costs were included, your total costs would have been higher. Please refer to the Fund prospectus for additional information on operating expenses.
franklintempleton.com
Semiannual Report 19
| FRANKLIN GROWTH FUND | ||||||
| YOUR FUND’S EXPENSES | ||||||
| Beginning Account | Ending Account | Expenses Paid During | ||||
| Share Class | Value 10/1/15 | Value 3/31/16 | Period* 10/1/15–3/31/16 | |||
| A | ||||||
| Actual | $ | 1,000 | $ | 1,053.80 | $ | 4.42 |
| Hypothetical (5% return before expenses) | $ | 1,000 | $ | 1,020.70 | $ | 4.34 |
| C | ||||||
| Actual | $ | 1,000 | $ | 1,050.00 | $ | 8.25 |
| Hypothetical (5% return before expenses) | $ | 1,000 | $ | 1,016.95 | $ | 8.12 |
| R | ||||||
| Actual | $ | 1,000 | $ | 1,052.50 | $ | 5.70 |
| Hypothetical (5% return before expenses) | $ | 1,000 | $ | 1,019.45 | $ | 5.60 |
| R6 | ||||||
| Actual | $ | 1,000 | $ | 1,056.00 | $ | 2.26 |
| Hypothetical (5% return before expenses) | $ | 1,000 | $ | 1,022.80 | $ | 2.23 |
| Advisor | ||||||
| Actual | $ | 1,000 | $ | 1,055.20 | $ | 3.13 |
| Hypothetical (5% return before expenses) | $ | 1,000 | $ | 1,021.95 | $ | 3.08 |
*Expenses are calculated using the most recent six-month expense ratio, net of expense waivers, annualized for each class (A: 0.86%;
C: 1.61%; R: 1.11%; R6: 0.44%; and Advisor: 0.61%), multiplied by the average account value over the period, multiplied by 183/366 to reflect
the one-half year period.
20 Semiannual Report
franklintempleton.com
Franklin Income Fund
This semiannual report for Franklin Income Fund covers the period ended March 31, 2016.
Your Fund’s Goal and Main Investments
The Fund seeks to maximize income while maintaining prospects for capital appreciation by investing, under normal market conditions, in a diversified portfolio of debt and equity securities.
Performance Overview
The Fund’s Class A shares delivered a cumulative total return of +3.38% for the six months under review. In comparison, the Fund’s equity benchmark, the Standard & Poor’s 500 Index (S&P 500), which is a broad measure of U.S. stock performance, returned +8.49%.1 The Fund’s fixed income benchmark, the Barclays U.S. Aggregate Bond Index, which tracks the U.S. investment-grade, taxable bond market, posted a +2.44% total return.1 The Fund’s peers, as measured by the Lipper Mixed-Asset Target Allocation Moderate Funds Classification Average, which consists of funds chosen by Lipper that, by practice, maintain a mix of 40% to 60% equity securities, with the remainder in bonds and cash, returned +3.47%.2 You can find the Fund’s long-term performance data in the Performance Summary beginning on page 24.
Performance data represent past performance, which does not guarantee future results. Investment return will fluctuate. Current performance may differ from figures shown. Please visit franklintempleton.com or call (800) 342-5236 for most recent month-end performance.
Investment Strategy
By generally performing independent analysis of debt, convertible and equity securities, we search for undervalued or out-of-favor securities we believe offer opportunities for income today and significant growth tomorrow. We consider such factors as a company’s experience and managerial strength; its cash flow potential and profitability; its competitive positioning and advantages; its responsiveness to changes in interest rates and business conditions; debt maturity schedules and borrowing requirements; a company’s changing financial condition and market recognition of the change; and a security’s relative value based on such factors as anticipated
| Dividend Distributions* | |||||
| 10/1/15–3/31/16 | |||||
| Dividend per Share (cents) | |||||
| Advisor | |||||
| Month | Class A | Class C | Class R | Class R6 | Class |
| October | 1.00 | 0.90 | 0.93 | 1.04 | 1.02 |
| November | 1.00 | 0.90 | 0.93 | 1.04 | 1.02 |
| December | 1.00 | 0.91 | 0.93 | 1.05 | 1.03 |
| January | 1.00 | 0.91 | 0.93 | 1.05 | 1.03 |
| February | 1.00 | 0.91 | 0.93 | 1.05 | 1.03 |
| March | 1.00 | 0.92 | 0.95 | 1.04 | 1.03 |
| Total | 6.00 | 5.45 | 5.60 | 6.27 | 6.16 |
*The distribution amount is the sum of the dividend payments to shareholders for
the period shown and includes only estimated tax-basis net investment income. All
Fund distributions will vary depending upon current market conditions, and past
distributions are not indicative of future trends.
cash flow, interest or dividend coverage, asset coverage and earnings.
Manager’s Discussion
During the six months under review, we continued to strategically shift the Fund’s asset mix in seeking to manage risks. Thus, our equity holdings declined, while our fixed income holdings increased. The Fund’s equity weighting fell from 65.5% to 60.7% of total net assets. Our fixed income weighting rose from 32.5% to 36.7%, as we took advantage of strength across all sectors with the exception of energy. The Fund’s cash position rose from 2.0% to 2.6% of total net assets.
The equity health care sector was a significant detractor from Fund performance during the period. Major health care detractors included pharmaceutical giants Sanofi, Eli Lily & Co. and Pfizer.
Although the materials sector produced overall positive results during the period, two metals and mining companies, BHP Billiton and Rio Tinto, were significant detractors. Both companies, however, were among the lowest cost producers and continued to further reduce costs that we believed improved the overall quality of their assets. They also maintained strong balance sheets that, in our opinion, enabled them to survive the commodities downturn and make acquisitions as opportunities presented themselves.
1. Source: Morningstar.
2. Source: Lipper, a Thomson Reuters Company. For the six-month period ended 3/31/16, this category consisted of 577 funds. Lipper calculations do not include sales charges
or expense subsidization by a fund’s manager. The Fund’s performance relative to the average may have differed if these and other factors had been considered.
The indexes are unmanaged and include reinvestment of any income or distributions. They do not reflect any fees, expenses or sales charges. One cannot invest directly in an
index, and an index is not representative of the Fund’s portfolio.
The dollar value, number of shares or principal amount, and names of all portfolio holdings are listed in the Fund’s Statement of Investments (SOI).
The SOI begins on page 67.
franklintempleton.com
Semiannual Report 21
FRANKLIN INCOME FUND
| Portfolio Breakdown | ||
| 3/31/16 | ||
| % of Total | ||
| Net Assets | ||
| Equity* | 60.7 | % |
| Energy | 9.3 | % |
| Industrials | 8.7 | % |
| Health Care | 8.5 | % |
| Information Technology | 7.4 | % |
| Financials | 6.6 | % |
| Consumer Discretionary | 6.1 | % |
| Utilities | 5.6 | % |
| Materials | 5.2 | % |
| Other | 3.3 | % |
| Fixed Income** | 36.7 | % |
| Consumer Discretionary | 6.7 | % |
| Financials | 5.0 | % |
| Health Care | 4.8 | % |
| Energy | 3.9 | % |
| Telecommunication Services | 3.6 | % |
| Information Technology | 3.4 | % |
| Industrials | 3.1 | % |
| Materials | 3.1 | % |
| Utilities | 2.2 | % |
| Consumer Staples | 0.9 | % |
| Short-Term Investments & Other Net Assets | 2.6 | % |
*Includes convertible bonds.
**Includes senior floating rate interests.
| Top Five Equity Holdings | ||
| 3/31/16 | ||
| Company | % of Total | |
| Sector/Industry | Net Assets | |
| Royal Dutch Shell PLC | 2.6 | % |
| Energy | ||
| Roche Holding AG | 1.6 | % |
| Health Care | ||
| Pfizer Inc. | 1.6 | % |
| Health Care | ||
| General Electric Co. | 1.4 | % |
| Industrials | ||
| Chevron Corp. | 1.4 | % |
| Energy |
Market volatility during the period provided what we considered favorable conditions for stock selection. In this environment, we found opportunities to buy stocks in diversified sectors including industrials and information technology that we believe could generate yields.
The equity industrials and utilities sectors were significant contributors to Fund performance. Key industrials contributors included multinational conglomerate General Electric and aerospace and building industries products manufacturer United Technologies. We took advantage of a decline in General Electric’s stock price in January of 2016, and increased our position. We made the acquisitions based on what we believed to be the high quality of the company’s industrial assets and the management team’s ongoing efforts to divest assets and pursue a more focused vision.
The utilities sector experienced large declines during the period. Our positions in PG&E and Duke Energy, however, were notable contributors. The market generally viewed utilities less favorably earlier in the year as the prospect for interest rate increases appeared high, but utility stocks rebounded somewhat as the Federal Reserve elected not to raise rates until December. Although the potential for future rate hikes may likely continue to dampen investor sentiment toward utility sector stocks, we feel our focus on individual utility companies with meaningful earnings per share growth potential somewhat mitigated this interest rate sensitivity.
Individual equity positions that significantly contributed to Fund performance included multinational corporation Chevron and chemical producers Dow Chemical and E. I. Du Pont de Nemours.
Our fixed income energy holdings had the greatest negative impact on returns. Energy XXI Gulf Coast, Linn Energy and Halcon Resources were hurt by falling oil prices. These companies, like many other exploration and production companies, were hampered by falling oil prices and were forced to restructure their capital structures to lower their costs. We greatly reduced our exposure to distressed exploration and production companies during the period, and focused on the ones that we believe can prosper in a lower oil price environment.
Individual fixed income positions that significantly detracted from Fund performance included mass media company iHeartCommunications, satellite services provider Instelsat Jackson Holdings and specialty drugs company Valeant Pharmaceuticals International.
22 Semiannual Report
franklintempleton.com
FRANKLIN INCOME FUND
| Top Five Fixed Income Holdings | ||
| and Senior Floating Rate Interests* | ||
| 3/31/16 | ||
| Company | % of Total | |
| Sector/Industry | Net Assets | |
| JPMorgan Chase & Co. | 1.8 | % |
| Financials | ||
| iHeartCommunications Inc. | 1.5 | % |
| Consumer Discretionary | ||
| CHS/Community Health Systems Inc. | 1.4 | % |
| Health Care | ||
| Citigroup Inc. | 1.2 | % |
| Financials | ||
| Tenet Healthcare Corp. | 1.2 | % |
| Health Care | ||
| *Does not include convertible bonds. |
In contrast, the fixed income consumer cyclical, technology and capital goods sectors were significant contributors to Fund performance.3 Major consumer cyclical contributors included hotel and casino operator Wynn Resorts and gaming and lottery systems company International Game Technology. In technology, our position in payment technology solutions developer First Data boosted results. In capital goods, food packaging producer Reynolds Group, equipment rental company United Rentals North America and building materials manufacturer Cemex also contributed to Fund performance.
Individual fixed income positions that significantly contributed to Fund performance included iron ore producer Fortescue Metals Group and supply chain services provider XPO Logistics.
Thank you for your continued participation in Franklin Income Fund. We look forward to serving your future investment needs.

The foregoing information reflects our analysis, opinions and portfolio holdings as of March 31, 2016, the end of the reporting period. The way we implement our main investment strategies and the resulting portfolio holdings may change depending on factors such as market and economic conditions. These opinions may not be relied upon as investment advice or an offer for a particular security. The information is not a complete analysis of every aspect of any market, country, industry, security or the Fund. Statements of fact are from sources considered reliable, but the investment manager makes no representation or warranty as to their completeness or accuracy. Although historical performance is no guarantee of future results, these insights may help you understand our investment management philosophy.
3. Consumer cyclical holdings are in consumer discretionary and industrials in the fixed income section of the SOI. Technology holdings are in financials, industrials information
technology and materials in the fixed income section of the SOI. Capital goods holdings are in consumer discretionary and industrials materials in the fixed income section of
the SOI.
See www.franklintempletondatasources.com for additional data provider information.
franklintempleton.com
Semiannual Report 23
FRANKLIN INCOME FUND
Performance Summary as of March 31, 2016
Your dividend income will vary depending on dividends or interest paid by securities in the Fund’s portfolio, adjusted for operating expenses of each class. Capital gain distributions are net profits realized from the sale of portfolio securities. The performance table does not reflect any taxes that a shareholder would pay on Fund dividends, capital gain distributions, if any, or any realized gains on the sale of Fund shares. Total return reflects reinvestment of the Fund’s dividends and capital gain distributions, if any, and any unrealized gains or losses.
| Net Asset Value | |||||
| Share Class (Symbol) | 3/31/16 | 9/30/15 | Change | ||
| A (FKINX) | $ | 2.11 | $ | 2.10 | +$0.01 |
| C (FCISX) | $ | 2.14 | $ | 2.13 | +$0.01 |
| R (FISRX) | $ | 2.08 | $ | 2.07 | +$0.01 |
| R6 (FNCFX) | $ | 2.10 | $ | 2.09 | +$0.01 |
| Advisor (FRIAX) | $ | 2.10 | $ | 2.09 | +$0.01 |
| Distributions1 (10/1/15–3/31/16) | |||||
| Dividend | |||||
| Share Class | Income | ||||
| A | $ | 0.0600 | |||
| C | $ | 0.0545 | |||
| R | $ | 0.0560 | |||
| R6 | $ | 0.0627 | |||
| Advisor | $ | 0.0616 | |||
See page 26 for Performance Summary footnotes.
24 Semiannual Report
franklintempleton.com
FRANKLIN INCOME FUND
PERFORMANCE SUMMARY
Performance as of 3/31/162
Cumulative total return excludes sales charges. Average annual total return and value of $10,000 investment include maximum sales charges. Class A: 4.25% maximum initial sales charge; Class C: 1% contingent deferred sales charge in first year only;
Class R/R6/Advisor Class: no sales charges.
| Cumulative | Average Annual | Value of | Total Annual | ||||||
| Share Class | Total Return3 | Total Return4 | $ | 10,000 Investment5 | Operating Expenses6 | ||||
| A | 0.61 | % | |||||||
| 6-Month | +3.38 | % | -0.87 | % | $ | 9,913 | |||
| 1-Year | -6.79 | % | -10.89 | % | $ | 8,911 | |||
| 5-Year | +24.08 | % | +3.51 | % | $ | 11,882 | |||
| 10-Year | +66.22 | % | +4.76 | % | $ | 15,913 | |||
| C | 1.11 | % | |||||||
| 6-Month | +3.08 | % | +2.08 | % | $ | 10,208 | |||
| 1-Year | -6.79 | % | -7.67 | % | $ | 9,233 | |||
| 5-Year | +21.82 | % | +4.03 | % | $ | 12,182 | |||
| 10-Year | +58.80 | % | +4.73 | % | $ | 15,880 | |||
| R | 0.96 | % | |||||||
| 6-Month | +3.24 | % | +3.24 | % | $ | 10,324 | |||
| 1-Year | -6.81 | % | -6.81 | % | $ | 9,319 | |||
| 5-Year | +22.30 | % | +4.11 | % | $ | 12,230 | |||
| 10-Year | +60.82 | % | +4.87 | % | $ | 16,082 | |||
| R6 | 0.38 | % | |||||||
| 6-Month | +3.54 | % | +3.54 | % | $ | 10,354 | |||
| 1-Year | -6.18 | % | -6.18 | % | $ | 9,382 | |||
| Since Inception (5/1/13) | +5.19 | % | +1.75 | % | $ | 10,519 | |||
| Advisor | 0.46 | % | |||||||
| 6-Month | +3.49 | % | +3.49 | % | $ | 10,349 | |||
| 1-Year | -6.26 | % | -6.26 | % | $ | 9,374 | |||
| 5-Year | +25.80 | % | +4.70 | % | $ | 12,580 | |||
| 10-Year | +69.27 | % | +5.40 | % | $ | 16,927 | |||
| Distribution | 30-Day Standardized Yield8 | ||||||||
| Share Class | Rate7 | (with waiver) (without waiver) | |||||||
| A | 5.45 | % | 4.70 | % | 4.68 | % | |||
| C | 5.16 | % | 4.39 | % | 4.38 | % | |||
| R | 5.48 | % | 4.53 | % | 4.51 | % | |||
| R6 | 5.94 | % | 5.14 | % | 5.14 | % | |||
| Advisor | 5.89 | % | 5.04 | % | 5.03 | % | |||
Performance data represent past performance, which does not guarantee future results. Investment return and principal value will fluctuate, and you may have a gain or loss when you sell your shares. Current performance may differ from figures shown. For most recent month-end performance, go to franklintempleton.com or call (800) 342-5236.
See page 26 for Performance Summary footnotes.
franklintempleton.com
Semiannual Report 25
| FRANKLIN INCOME FUND |
| PERFORMANCE SUMMARY |
All investments involve risks, including possible loss of principal. The Fund’s share price and yield will be affected by interest rate movements. Bond prices generally move in the opposite direction of interest rates. Thus, as prices of bonds in the Fund adjust to a rise in interest rates, the Fund’s share price may decline. Changes in the financial strength of a bond issuer or in a bond’s credit rating may affect its value. The Fund’s portfolio includes a substantial portion of higher yielding, lower rated corporate bonds because of the relatively higher yields they offer. Floating-rate loans are lower rated, higher yielding instruments, which are subject to increased risk of default and can potentially result in loss of principal. These securities carry a greater degree of credit risk relative to investment-grade securities. Stock prices fluctuate, sometimes rapidly and dramatically, due to factors affecting individual companies, particular industries or sectors, or general market conditions. The Fund is actively managed but there is no guarantee that the manager’s investment decisions will produce the desired results. The Fund’s prospectus also includes a description of the main investment risks.
| Class C: | These shares have higher annual fees and expenses than Class A shares. |
| Class R: | Shares are available to certain eligible investors as described in the prospectus. These shares have higher annual fees and expenses than Class A shares. |
| Class R6: | Shares are available to certain eligible investors as described in the prospectus. |
| Advisor Class: | Shares are available to certain eligible investors as described in the prospectus. |
1. The distribution amount is the sum of the dividend payments to shareholders for the period shown and includes only estimated tax-basis net investment income.
2. The Fund has a fee waiver associated with any investment in a Franklin Templeton money fund, contractually guaranteed through at least its current fiscal year-end. Fund
investment results reflect the fee waiver, to the extent applicable; without this reduction, the results would have been lower.
3. Cumulative total return represents the change in value of an investment over the periods indicated.
4. Average annual total return represents the average annual change in value of an investment over the periods indicated. Return for less than one year, ifany,hasnotbeen
annualized.
5. These figures represent the value of a hypothetical $10,000 investment in the Fund over the periods indicated.
6. Figures are as stated in the Fund’s current prospectus. In periods of market volatility, assets may decline significantly, causing total annual Fund operating expenses to
become higher than the figures shown.
7. Distribution rate is based on an annualization of the respective class’s March dividend and the maximum offering price (NAV for Classes C, R, R6 and Advisor) per share on
3/31/16.
8. The 30-day standardized yield for the 30 days ended 3/31/16 reflects an estimated yield to maturity (assuming all portfolio securities are held to maturity). It should be
regarded as an estimate of the Fund’s rate of investment income, and it may not equal the Fund’s actual income distribution rate (which reflects the Fund’s past dividends paid
to shareholders) or the income reported in the Fund’s financial statements.
26 Semiannual Report
franklintempleton.com
FRANKLIN INCOME FUND
Your Fund’s Expenses
As a Fund shareholder, you can incur two types of costs:
- Transaction costs, including sales charges (loads) on Fund purchases; and
- Ongoing Fund costs, including management fees, distribution and service (12b-1) fees, and other Fund expenses. All mutual funds have ongoing costs, sometimes referred to as operating expenses.
The following table shows ongoing costs of investing in the Fund and can help you understand these costs and compare them with those of other mutual funds. The table assumes a $1,000 investment held for the six months indicated.
Actual Fund Expenses
The first line (Actual) for each share class listed in the table provides actual account values and expenses. The “Ending Account Value” is derived from the Fund’s actual return, which includes the effect of Fund expenses.
You can estimate the expenses you paid during the period by following these steps. Of course, your account value and expenses will differ from those in this illustration:
| 1. | Divide your account value by $1,000. |
| If an account had an $8,600 value, then $8,600 ÷ $1,000 = 8.6. | |
| 2. | Multiply the result by the number under the heading “Expenses Paid During Period.” |
| If Expenses Paid During Period were $7.50, then 8.6 x $7.50 = $64.50. |
In this illustration, the estimated expenses paid this period are $64.50.
Hypothetical Example for Comparison with Other Funds
Information in the second line (Hypothetical) for each class in the table can help you compare ongoing costs of investing in the Fund with those of other mutual funds. This information may not be used to estimate the actual ending account balance or expenses you paid during the period. The hypothetical “Ending Account Value” is based on the actual expense ratio for each class and an assumed 5% annual rate of return before expenses, which does not represent the Fund’s actual return. The figure under the heading “Expenses Paid During Period” shows the hypothetical expenses your account would have incurred under this scenario. You can compare this figure with the 5% hypothetical examples that appear in shareholder reports of other funds.
Please note that expenses shown in the table are meant to highlight ongoing costs and do not reflect any transaction costs, such as sales charges. Therefore, the second line for each class is useful in comparing ongoing costs only, and will not help you compare total costs of owning different funds. In addition, if transaction costs were included, your total costs would have been higher. Please refer to the Fund prospectus for additional information on operating expenses.
franklintempleton.com
Semiannual Report 27
| FRANKLIN INCOME FUND | ||||||
| YOUR FUND’S EXPENSES | ||||||
| Beginning Account | Ending Account | Expenses Paid During | ||||
| Share Class | Value 10/1/15 | Value 3/31/16 | Period* 10/1/15–3/31/16 | |||
| A | ||||||
| Actual | $ | 1,000 | $ | 1,033.80 | $ | 3.15 |
| Hypothetical (5% return before expenses) | $ | 1,000 | $ | 1,021.90 | $ | 3.13 |
| C | ||||||
| Actual | $ | 1,000 | $ | 1,030.80 | $ | 5.69 |
| Hypothetical (5% return before expenses) | $ | 1,000 | $ | 1,019.40 | $ | 5.65 |
| R | ||||||
| Actual | $ | 1,000 | $ | 1,032.40 | $ | 4.93 |
| Hypothetical (5% return before expenses) | $ | 1,000 | $ | 1,020.15 | $ | 4.90 |
| R6 | ||||||
| Actual | $ | 1,000 | $ | 1,035.40 | $ | 1.98 |
| Hypothetical (5% return before expenses) | $ | 1,000 | $ | 1,023.05 | $ | 1.97 |
| Advisor | ||||||
| Actual | $ | 1,000 | $ | 1,034.90 | $ | 2.39 |
| Hypothetical (5% return before expenses) | $ | 1,000 | $ | 1,022.65 | $ | 2.38 |
*Expenses are calculated using the most recent six-month expense ratio, net of expense waivers, annualized for each class (A: 0.62%;
C: 1.12%; R: 0.97%; R6: 0.39%; and Advisor: 0.47%), multiplied by the average account value over the period, multiplied by 183/366 to reflect
the one-half year period.
28 Semiannual Report
franklintempleton.com
Franklin U.S. Government Securities Fund
This semiannual report for Franklin U.S. Government Securities Fund covers the period ended March 31, 2016.
Your Fund’s Goal and Main Investments
The Fund seeks income by investing at least 80% of its net assets in U.S. government securities. The Fund presently invests substantially all of its assets in Government National Mortgage Association obligations (Ginnie Maes).
Since 1983, the Fund has invested substantially in Ginnie Mae securities, which carry a guarantee backed by the full faith and credit of the U.S. government as to the timely payment of interest and principal.1 Issued by the Government National Mortgage Association (GNMA), Ginnie Maes have been among the highest yielding U.S. government obligations available.
| Portfolio Breakdown | ||
| Based on Total Net Assets as of 3/31/16 | ||
| GNMA | 97.1 | % |
| Short-Term Investments & Other Net Assets | 2.9 | % |
Performance Overview
The Fund’s Class A shares generated a +1.13% cumulative total return for the six months under review. In comparison, the Fund’s peers, as measured by the Lipper GNMA Funds Classification Average, which consists of funds chosen by Lipper that invest primarily in GNMAs, posted a +1.15% total return.2 The Barclays U.S. Government Index: Intermediate Component, the intermediate component of the Barclays U.S. Government Index, returned +1.43% for the same period.3 You can find the Fund’s long-term performance data in the Performance Summary beginning on page 31.
Performance data represent past performance, which does not guarantee future results. Investment return and principal value will fluctuate, and you may have a gain or loss when you sell your shares. Current performance may differ from figures shown. For most recent month-end performance, go to franklintempleton.com or call (800) 342-5236.
Investment Strategy
We currently invest the Fund’s assets predominantly in GNMA obligations. We analyze securities using proprietary models to help us identify attractive investment opportunities. The Fund’s short-term investments may include short-term government securities and cash or cash equivalents.
| Dividend Distributions* | |||||
| 10/1/15–3/31/16 | |||||
| Dividend per Share (cents) | |||||
| Advisor | |||||
| Month | Class A | Class C | Class R | Class R6 | Class |
| October | 1.75 | 1.48 | 1.56 | 1.90 | 1.83 |
| November | 1.70 | 1.44 | 1.52 | 1.85 | 1.78 |
| December | 1.74 | 1.47 | 1.55 | 1.89 | 1.82 |
| January | 1.67 | 1.40 | 1.49 | 1.82 | 1.75 |
| February | 1.64 | 1.39 | 1.46 | 1.78 | 1.71 |
| March | 1.67 | 1.40 | 1.47 | 1.82 | 1.75 |
| Total | 10.17 | 8.58 | 9.05 | 11.06 | 10.64 |
*The distribution amount is the sum of the dividend payments to shareholders for
the period shown and includes only estimated tax-basis net investment income. All
Fund distributions will vary depending upon current market conditions, and past
distributions are not indicative of future trends.
Manager’s Discussion
U.S. economic indicators were generally encouraging during the reporting period. Steady growth in the services sector created new jobs and boosted employment levels. Retail sales grew for most of the period. Low energy prices pulled inflation lower. In this environment, home sales grew for most of the period, but slowed in February because of low supply levels and rising prices.
Ginnie Mae (GNMA) mortgage-backed securities (MBS) performed well during the period and produced positive total and excess returns but were outpaced by strong performance from Treasuries.
In our view, agency MBS remained fully valued. The Fed’s participation in agency MBS has, in our view, kept mortgage
1. Securities owned by the Fund, but not shares of the Fund, are guaranteed by the U.S. government, its agencies or instrumentalities as to timely payment of principal and
interest. The Fund’s yield and share price are not guaranteed and will vary with market conditions.
2. Source: Lipper, a Thomson Reuters Company. For the six-month period ended 3/31/16, there were 61 funds in this category. Lipper calculations do not include sales charges
or expense subsidization by a fund’s manager. The Fund’s performance relative to the average may have differed if these or other factors had been considered.
3. Source: Morningstar.
The indexes are unmanaged and include reinvestment of any income or distributions. They do not reflect any fees, expenses or sales charges. One cannot invest directly in an
index, and an index is not representative of the Fund’s portfolio.
See www.franklintempletondatasources.com for additional data provider information.
The dollar value, number of shares or principal amount, and names of all portfolio holdings are listed in the Fund’s Statement of Investments (SOI).
The SOI begins on page 88.
franklintempleton.com
Semiannual Report 29
FRANKLIN U.S. GOVERNMENT SECURITIES FUND
valuations high. Questions persist about the demand source for agency MBS once the Fed moves closer to ceasing reinvestment in MBS. We felt demand from banks, mortgage real estate investment trusts, overseas investors and domestic money managers would need to rise to compensate for the Fed’s reduced presence in the MBS sector. We believed prepayment levels could moderate with mortgage rates staying in the same range and underwriting standards remaining tight.
Within the agency mortgage pass-through sector, GNMA MBS outpaced their Freddie Mac MBS and Fannie Mae MBS counterparts. On a total return basis, GNMA 3.0% coupons were the best performers, while 5.0% coupons generally lagged.
The Fund maintains a conservative, disciplined investment strategy and invests entirely in GNMA mortgage pass-throughs, which remain the only MBS that are backed by the full faith and credit of the U.S. government—the same guarantee applicable to U.S. Treasuries.1 Our collateral-intensive research approach can allow us to uncover dislocations across the GNMA markets and associated misvaluation of prepayment risk. We continue to focus on specified pools where we believe our experience and continual investment in new technologies help us uncover these discrepancies.
During the period, we were more weighted toward GNMA IIs (pools of mortgages from multiple issuers) than GNMA Is (pools of mortgages from single issuers). Over the period, we added to GNMA II 3.0%, 3.5% and 4.0% coupons while reducing exposure to 4.5%, 5.0% and 5.5% coupons. Our heaviest allocation was in 3.5% and 4.0% coupons at period-end. The Fund’s positions in higher coupon—4.0% through 6.0%—GNMA securities generally benefited performance, while our allocation to 3.0% and 3.5% coupon GNMAs detracted from performance.
Thank you for your continued participation in Franklin U.S. Government Securities Fund. We welcome your comments and questions and look forward to serving your investment needs in the years ahead.
The foregoing information reflects our analysis, opinions and portfolio holdings as of March 31, 2016, the end of the reporting period. The way we implement our main investment strategies and the resulting portfolio holdings may change depending on factors such as market and economic conditions. These opinions may not be relied upon as investment advice or an offer for a particular security. The information is not a complete analysis of every aspect of any market, country, industry, security or the Fund. Statements of fact are from sources considered reliable, but the investment manager makes no representation or warranty as to their completeness or accuracy. Although historical performance is no guarantee of future results, these insights may help you understand our investment management philosophy.
30 Semiannual Report
franklintempleton.com
FRANKLIN U.S. GOVERNMENT SECURITIES FUND
Performance Summary as of March 31, 2016
Your dividend income will vary depending on dividends or interest paid by securities in the Fund’s portfolio, adjusted for operating expenses of each class. Capital gain distributions are net profits realized from the sale of portfolio securities. The performance tables do not reflect any taxes that a shareholder would pay on Fund dividends, capital gain distributions, if any, or any realized gains on the sale of Fund shares. Total return reflects reinvestment of the Fund’s dividends and capital gain distributions, if any, and any unrealized gains or losses.
| Net Asset Value | ||||||
| Share Class (Symbol) | 3/31/16 | 9/30/15 | Change | |||
| A (FKUSX) | $ | 6.37 | $ | 6.40 | -$ | 0.03 |
| C (FRUGX) | $ | 6.33 | $ | 6.36 | -$ | 0.03 |
| R (FUSRX) | $ | 6.37 | $ | 6.40 | -$ | 0.03 |
| R6 (FGORX) | $ | 6.39 | $ | 6.42 | -$ | 0.03 |
| Advisor (FUSAX) | $ | 6.39 | $ | 6.42 | -$ | 0.03 |
| Distributions1 (10/1/15–3/31/16) | ||||||
| Dividend | ||||||
| Share Class | Income | |||||
| A | $ | 0.1017 | ||||
| C | $ | 0.0858 | ||||
| R | $ | 0.0905 | ||||
| R6 | $ | 0.1106 | ||||
| Advisor | $ | 0.1064 | ||||
See page 33 for Performance Summary footnotes.
franklintempleton.com
Semiannual Report 31
FRANKLIN U.S. GOVERNMENT SECURITIES FUND
PERFORMANCE SUMMARY
Performance as of 3/31/162
Cumulative total return excludes sales charges. Average annual total returns include maximum sales charges. Class A: 4.25% maximum initial sales charge; Class C: 1% contingent deferred sales charge in first year only; Class R/R6/Advisor Class: no sales charges.
| Cumulative | Average Annual | Total Annual | ||||
| Share Class | Total Return3 | Total Return4 | Operating Expenses5 | |||
| A | 0.76 | % | ||||
| 6-Month | +1.13 | % | -3.11 | % | ||
| 1-Year | +1.05 | % | -3.26 | % | ||
| 5-Year | +13.05 | % | +1.59 | % | ||
| 10-Year | +49.18 | % | +3.64 | % | ||
| C | 1.26 | % | ||||
| 6-Month | +0.88 | % | -0.11 | % | ||
| 1-Year | +0.70 | % | -0.28 | % | ||
| 5-Year | +10.27 | % | +1.97 | % | ||
| 10-Year | +41.85 | % | +3.56 | % | ||
| R | 1.11 | % | ||||
| 6-Month | +0.95 | % | +0.95 | % | ||
| 1-Year | +0.85 | % | +0.85 | % | ||
| 5-Year | +11.05 | % | +2.12 | % | ||
| 10-Year | +43.91 | % | +3.71 | % | ||
| R6 | 0.47 | % | ||||
| 6-Month | +1.27 | % | +1.27 | % | ||
| 1-Year | +1.49 | % | +1.49 | % | ||
| Since Inception (5/1/13) | +5.21 | % | +1.76 | % | ||
| Advisor | 0.61 | % | ||||
| 6-Month | +1.20 | % | +1.20 | % | ||
| 1-Year | +1.20 | % | +1.20 | % | ||
| 5-Year | +13.86 | % | +2.63 | % | ||
| 10-Year | +51.38 | % | +4.23 | % | ||
| Distribution | 30-Day Standardized Yield7 | |||||
| Share Class | Rate6 | (with waiver) (without waiver) | ||||
| A | 3.01 | % | 2.25 | % | 2.25 | % |
| C | 2.65 | % | 1.83 | % | 1.83 | % |
| R | 2.77 | % | 1.98 | % | 1.98 | % |
| R6 | 3.42 | % | 2.64 | % | 2.64 | % |
| Advisor | 3.29 | % | 2.50 | % | 2.50 | % |
Performance data represent past performance, which does not guarantee future results. Investment return and principal value will fluctuate, and you may have a gain or loss when you sell your shares. Current performance may differ from figures shown. For most recent month-end performance, go to franklintempleton.com or call (800) 342-5236.
See page 33 for Performance Summary footnotes.
32 Semiannual Report
franklintempleton.com
FRANKLIN U.S. GOVERNMENT SECURITIES FUND
PERFORMANCE SUMMARY
All investments involve risks, including possible loss of principal. The Fund’s share price and yield will be affected by interest rate movements and mortgage prepayments. Bond prices generally move in the opposite direction of interest rates. Thus, as prices of bonds in the Fund adjust to a rise in interest rates, the Fund’s share price may decline. Changes in the financial strength of a bond issuer or in a bond’s credit rating may affect its value. The Fund is actively managed but there is no guarantee that the manager’s investment decisions will produce the desired results. The Fund’s prospectus also includes a description of the main investment risks.
| Class C: | These shares have higher annual fees and expenses than Class A shares. |
| Class R: | Shares are available to certain eligible investors as described in the prospectus. These shares have higher annual fees and expenses than Class A shares. |
| Class R6: | Shares are available to certain eligible investors as described in the prospectus. |
| Advisor Class: | Shares are available to certain eligible investors as described in the prospectus. |
1. The distribution amount is the sum of the dividend payments to shareholders for the period shown and includes only estimated tax-basis net investment income.
2. The Fund has a fee waiver associated with any investment in a Franklin Templeton money fund, contractually guaranteed through at least its current fiscal year-end. Fund
investment results reflect the fee waiver, to the extent applicable; without this reduction, the results would have been lower.
3. Cumulative total return represents the change in value of an investment over the periods indicated.
4. Average annual total return represents the average annual change in value of an investment over the periods indicated. Return for less than one year, ifany,hasnotbeen
annualized.
5. Figures are as stated in the Fund’s current prospectus. In periods of market volatility, assets may decline significantly, causing total annual Fund operating expenses to
become higher than the figures shown.
6. Distribution rate is based on an annualization of the respective class’s March dividend and the maximum offering price (NAV for Classes C, R, R6 and Advisor) per share on
3/31/16.
7. The 30-day standardized yield for the 30 days ended 3/31/16 reflects an estimated yield to maturity (assuming all portfolio securities are held to maturity). It should be
regarded as an estimate of the Fund’s rate of investment income, and it may not equal the Fund’s actual income distribution rate (which reflects the Fund’s past dividends paid
to shareholders) or the income reported in the Fund’s financial statements.
franklintempleton.com
Semiannual Report 33
FRANKLIN U.S. GOVERNMENT SECURITIES FUND
Your Fund’s Expenses
As a Fund shareholder, you can incur two types of costs:
- Transaction costs, including sales charges (loads) on Fund purchases; and
- Ongoing Fund costs, including management fees, distribution and service (12b-1) fees, and other Fund expenses. All mutual funds have ongoing costs, sometimes referred to as operating expenses.
The following table shows ongoing costs of investing in the Fund and can help you understand these costs and compare them with those of other mutual funds. The table assumes a $1,000 investment held for the six months indicated.
Actual Fund Expenses
The first line (Actual) for each share class listed in the table provides actual account values and expenses. The “Ending Account Value” is derived from the Fund’s actual return, which includes the effect of Fund expenses.
You can estimate the expenses you paid during the period by following these steps. Of course, your account value and expenses will differ from those in this illustration:
| 1. | Divide your account value by $1,000. |
| If an account had an $8,600 value, then $8,600 ÷ $1,000 = 8.6. | |
| 2. | Multiply the result by the number under the heading “Expenses Paid During Period.” |
| If Expenses Paid During Period were $7.50, then 8.6 x $7.50 = $64.50. |
In this illustration, the estimated expenses paid this period are $64.50.
Hypothetical Example for Comparison with Other Funds
Information in the second line (Hypothetical) for each class in the table can help you compare ongoing costs of investing in the Fund with those of other mutual funds. This information may not be used to estimate the actual ending account balance or expenses you paid during the period. The hypothetical “Ending Account Value” is based on the actual expense ratio for each class and an assumed 5% annual rate of return before expenses, which does not represent the Fund’s actual return. The figure under the heading “Expenses Paid During Period” shows the hypothetical expenses your account would have incurred under this scenario. You can compare this figure with the 5% hypothetical examples that appear in shareholder reports of other funds.
Please note that expenses shown in the table are meant to highlight ongoing costs and do not reflect any transaction costs, such as sales charges. Therefore, the second line for each class is useful in comparing ongoing costs only, and will not help you compare total costs of owning different funds. In addition, if transaction costs were included, your total costs would have been higher. Please refer to the Fund prospectus for additional information on operating expenses.
34 Semiannual Report
franklintempleton.com
| FRANKLIN U.S. GOVERNMENT SECURITIES FUND | ||||||
| YOUR FUND’S EXPENSES | ||||||
| Beginning Account | Ending Account | Expenses Paid During | ||||
| Share Class | Value 10/1/15 | Value 3/31/16 | Period* 10/1/15–3/31/16 | |||
| A | ||||||
| Actual | $ | 1,000 | $ | 1,011.30 | $ | 3.82 |
| Hypothetical (5% return before expenses) | $ | 1,000 | $ | 1,021.20 | $ | 3.84 |
| C | ||||||
| Actual | $ | 1,000 | $ | 1,008.80 | $ | 6.33 |
| Hypothetical (5% return before expenses) | $ | 1,000 | $ | 1,018.70 | $ | 6.36 |
| R | ||||||
| Actual | $ | 1,000 | $ | 1,009.50 | $ | 5.58 |
| Hypothetical (5% return before expenses) | $ | 1,000 | $ | 1,019.45 | $ | 5.60 |
| R6 | ||||||
| Actual | $ | 1,000 | $ | 1,012.70 | $ | 2.42 |
| Hypothetical (5% return before expenses) | $ | 1,000 | $ | 1,022.60 | $ | 2.43 |
| Advisor | ||||||
| Actual | $ | 1,000 | $ | 1,012.00 | $ | 3.07 |
| Hypothetical (5% return before expenses) | $ | 1,000 | $ | 1,021.95 | $ | 3.08 |
*Expenses are calculated using the most recent six-month expense ratio, net of expense waivers, annualized for each class (A: 0.76%;
C: 1.26%; R: 1.11%; R6: 0.48%; and Advisor: 0.61%), multiplied by the average account value over the period, multiplied by 183/366 to reflect
the one-half year period.
franklintempleton.com
Semiannual Report 35
Franklin Utilities Fund
This semiannual report for Franklin Utilities Fund covers the period ended March 31, 2016.
Your Fund’s Goal and Main Investments
The Fund seeks both capital appreciation and current income by investing at least 80% of its net assets in public utility company securities.
Performance Overview
The Fund’s Class A shares delivered a +14.87% cumulative total return for the six months under review. In comparison, the Standard & Poor’s 500 (S&P 500) Index, which is a broad measure of U.S. stock performance, generated a +8.49% total return, and the S&P 500 Utilities Index, which measures the performance of all utilities stocks in the S&P 500 Index, produced a +16.80% total return.1 You can find the Fund’s long-term performance data in the Performance Summary beginning on page 38.
Performance data represent past performance, which does not guarantee future results. Investment return will fluctuate. Current performance may differ from figures shown. Please visit franklintempleton.com or call (800) 342-5236 for most recent month-end performance.
Investment Strategy
We search for the best return opportunities available in the global utilities arena with a specific focus on the U.S. electricity and gas sector. Generally, we look for companies producing a high percentage of earnings from regulated utility franchise operations.
Manager’s Discussion
The Fund’s energy sector holdings weighed on absolute performance.2 Significant detractors during the period included natural gas, petroleum and electricity power producer The Williams Companies, natural gas and refined petroleum products producer Kinder Morgan and pipeline holding company Plains GP Holdings. The companies had limited direct exposure to risky financial instruments that bet on commodity prices, but they suffered from indirect exposure through their production volumes, counterparty risk and growth
potential. The resulting decline in earnings potential combined with widening risk premiums for energy companies further damaged the companies’ access to capital, widened credit spreads and lowered market value. The Williams Companies was also hurt by the deteriorating financial condition of its key gathering and processing customer, Chesapeake Energy. Kinder was pressured by its management team’s decision to reduce its dividend in an attempt to maintain an investment-grade credit rating amid the decline in oil prices.
Portfolio Breakdown
Based on Total Net Assets as of 3/31/16
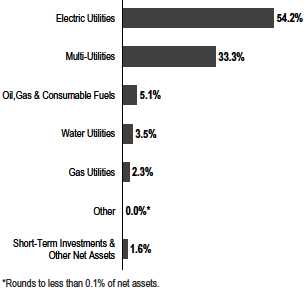
In contrast, the Fund’s utilities holdings contributed notably to absolute performance during the reporting period.3 Our position in clean energy company NextEra Energy benefited from the passage of a congressional spending bill that included
1. Source: Morningstar.
The indexes are unmanaged and include reinvested dividends. They do not reflect any fees, expenses or sales charges. One cannot invest directly in an index, and an index is
not representative of the Fund’s portfolio.
2. The energy sector comprises oil, gas and consumable fuels in the SOI.
3. The utilities sector comprises electric utilities, gas utilities, multi-utilities and water utilities in the SOI.
See www.franklintempletondatasources.com for additional data provider information.
The dollar value, number of shares or principal amount, and names of all portfolio holdings are listed in the Fund’s Statement of Investments (SOI).
The SOI begins on page 96.
36 Semiannual Report
franklintempleton.com
FRANKLIN UTILITIES FUND
multi-year extensions of solar and wind tax credits. The passage of this legislation was a surprise and a positive event for renewables developers, of which NextEra is among the leading players in the U.S. The legislation also helps provide greater clarity into the company’s earnings growth trajectory. Electric and gas utility provider Exelon’s decision to increase its dividend and explain its long-term growth metrics was viewed positively by investors. Contracting credit spreads following the bottoming of oil prices in early February also increased the value of comparable merchant generation assets. American Electric Power Company benefited from a legislative effort in Ohio to sign power purchasing agreements that covered several of the company’s unregulated power-generation assets.
| Top 10 Holdings | ||
| 3/31/16 | ||
| Company | % of Total | |
| Sector/Industry | Net Assets | |
| NextEra Energy Inc. | 5.7 | % |
| Electric Utilities | ||
| Edison International | 5.2 | % |
| Electric Utilities | ||
| Dominion Resources Inc. | 5.2 | % |
| Multi-Utilities | ||
| Duke Energy Corp. | 4.7 | % |
| Electric Utilities | ||
| Sempra Energy | 4.4 | % |
| Multi-Utilities | ||
| American Electric Power Co. Inc. | 4.4 | % |
| Electric Utilities | ||
| PG&E Corp. | 4.3 | % |
| Electric Utilities | ||
| Exelon Corp. | 3.9 | % |
| Electric Utilities | ||
| CMS Energy Corp. | 3.4 | % |
| Multi-Utilities | ||
| Xcel Energy Inc. | 3.2 | % |
| Electric Utilities |
Thank you for your continued participation in Franklin Utilities Fund. We look forward to serving your future investment needs.

The foregoing information reflects our analysis, opinions and portfolio holdings as of March 31, 2016, the end of the reporting period. The way we implement our main investment strategies and the resulting portfolio holdings may change depending on factors such as market and economic conditions. These opinions may not be relied upon as investment advice or an offer for a particular security. The information is not a complete analysis of every aspect of any market, country, industry, security or the Fund. Statements of fact are from sources considered reliable, but the investment manager makes no representation or warranty as to their completeness or accuracy. Although historical performance is no guarantee of future results, these insights may help you understand our investment management philosophy.
franklintempleton.com
Semiannual Report 37
FRANKLIN UTILITIES FUND
Performance Summary as of March 31, 2016
Your dividend income will vary depending on dividends or interest paid by securities in the Fund’s portfolio, adjusted for operating expenses of each class. Capital gain distributions are net profits realized from the sale of portfolio securities. The performance tables do not reflect any taxes that a shareholder would pay on Fund dividends, capital gain distributions, if any, or any realized gains on the sale of Fund shares. Total return reflects reinvestment of the Fund’s dividends and capital gain distributions, if any, and any unrealized gains or losses.
| Net Asset Value | ||||||||
| Share Class (Symbol) | 3/31/16 | 9/30/15 | Change | |||||
| A (FKUTX) | $ | 17.57 | $ | 16.08 | +$ | 1.49 | ||
| C (FRUSX) | $ | 17.48 | $ | 16.01 | +$ | 1.47 | ||
| R (FRURX) | $ | 17.50 | $ | 16.02 | +$ | 1.48 | ||
| R6 (FUFRX) | $ | 17.69 | $ | 16.18 | +$ | 1.51 | ||
| Advisor (FRUAX) | $ | 17.69 | $ | 16.19 | +$ | 1.50 | ||
| Distributions1 (10/1/15–3/31/16) | ||||||||
| Dividend | Short-Term | Long-Term | ||||||
| Share Class | Income | Capital Gain | Capital Gain | Total | ||||
| A | $ | 0.2700 | $ | 0.0339 | $ | 0.4872 | $ | 0.7911 |
| C | $ | 0.2296 | $ | 0.0339 | $ | 0.4872 | $ | 0.7507 |
| R | $ | 0.2412 | $ | 0.0339 | $ | 0.4872 | $ | 0.7623 |
| R6 | $ | 0.2923 | $ | 0.0339 | $ | 0.4872 | $ | 0.8134 |
| Advisor | $ | 0.2822 | $ | 0.0339 | $ | 0.4872 | $ | 0.8033 |
See page 40 for Performance Summary footnotes.
38 Semiannual Report
franklintempleton.com
FRANKLIN UTILITIES FUND
PERFORMANCE SUMMARY
Performance as of 3/31/162
Cumulative total return excludes sales charges. Average annual total return and value of $10,000 investment include maximum sales charges. Class A: 4.25% maximum initial sales charge; Class C: 1% contingent deferred sales charge in first year only;
Class R/R6/Advisor Class: no sales charges.
| Cumulative | Average Annual | Value of | Total Annual | |||||
| Share Class | Total Return3 | Total Return4 | $ | 10,000 Investment5 | Operating Expenses6 | |||
| A | 0.73 | % | ||||||
| 6-Month | +14.87 | % | +10.01 | % | $ | 11,001 | ||
| 1-Year | +10.54 | % | +5.85 | % | $ | 10,585 | ||
| 5-Year | +83.97 | % | +11.99 | % | $ | 17,614 | ||
| 10-Year | +146.66 | % | +8.98 | % | $ | 23,624 | ||
| C | 1.23 | % | ||||||
| 6-Month | +14.51 | % | +13.51 | % | $ | 11,351 | ||
| 1-Year | +9.95 | % | +8.95 | % | $ | 10,895 | ||
| 5-Year | +79.30 | % | +12.39 | % | $ | 17,930 | ||
| 10-Year | +134.44 | % | +8.89 | % | $ | 23,444 | ||
| R | 1.08 | % | ||||||
| 6-Month | +14.65 | % | +14.65 | % | $ | 11,465 | ||
| 1-Year | +10.08 | % | +10.08 | % | $ | 11,008 | ||
| 5-Year | +80.64 | % | +12.55 | % | $ | 18,064 | ||
| 10-Year | +138.01 | % | +9.06 | % | $ | 23,801 | ||
| R6 | 0.47 | % | ||||||
| 6-Month | +15.06 | % | +15.06 | % | $ | 11,506 | ||
| 1-Year | +10.80 | % | +10.80 | % | $ | 11,080 | ||
| Since Inception (5/1/13) | +30.49 | % | +9.56 | % | $ | 13,049 | ||
| Advisor | 0.58 | % | ||||||
| 6-Month | +14.91 | % | +14.91 | % | $ | 11,491 | ||
| 1-Year | +10.68 | % | +10.68 | % | $ | 11,068 | ||
| 5-Year | +85.26 | % | +13.12 | % | $ | 18,526 | ||
| 10-Year | +150.31 | % | +9.61 | % | $ | 25,031 |
| Distribution | 30-Day Standardized Yield8 | |||||
| Share Class | Rate7 | (with waiver) | (without waiver) | |||
| A | 2.51 | % | 2.53 | % | 2.53 | % |
| C | 2.18 | % | 2.14 | % | 2.14 | % |
| R | 2.31 | % | 2.30 | % | 2.29 | % |
| R6 | 2.86 | % | 2.90 | % | 2.90 | % |
| Advisor | 2.74 | % | 2.80 | % | 2.80 | % |
Performance data represent past performance, which does not guarantee future results. Investment return and principal value will fluctuate, and you may have a gain or loss when you sell your shares. Current performance may differ from figures shown. For most recent month-end performance, go to franklintempleton.com or call (800) 342-5236.
See page 40 for Performance Summary footnotes.
franklintempleton.com
Semiannual Report 39
| FRANKLIN UTILITIES FUND |
| PERFORMANCE SUMMARY |
All investments involve risks, including possible loss of principal. In addition to other factors, securities issued by utility companies have been historically sensitive to interest rate changes. When interest rates fall, utility securities prices, and thus a utilities fund’s share price, tend to rise; when interest rates rise, their prices generally fall. The Fund is actively managed but there is no guarantee that the manager’s investment decisions will produce the desired results. The Fund’s prospectus also includes a description of the main investment risks.
| Class C: | These shares have higher annual fees and expenses than Class A shares. |
| Class R: | Shares are available to certain eligible investors as described in the prospectus. These shares have higher annual fees and expenses than Class A shares. |
| Class R6: | Shares are available to certain eligible investors as described in the prospectus. |
| Advisor Class: | Shares are available to certain eligible investors as described in the prospectus. |
1. The distribution amount is the sum of the dividend payments to shareholders for the period shown and includes only estimated tax-basis net investment income and capital
gain.
2. The Fund has a fee waiver associated with any investment in a Franklin Templeton money fund, contractually guaranteed through at least its current fiscal year-end. Fund
investment results reflect the fee waiver, to the extent applicable; without this reduction, the results would have been lower.
3. Cumulative total return represents the change in value of an investment over the periods indicated.
4. Average annual total return represents the average annual change in value of an investment over the periods indicated. Return for less than one year, ifany,hasnotbeen
annualized.
5. These figures represent the value of a hypothetical $10,000 investment in the Fund over the periods indicated.
6. Figures are as stated in the Fund’s current prospectus. In periods of market volatility, assets may decline significantly, causing total annual Fund operating expenses to
become higher than the figures shown.
7. Distribution rate is based on an annualization of the respective class’s current quarterly dividend and the maximum offering price (NAV for Classes C, R, R6 and Advisor) per
share on 3/31/16.
8. The 30-day standardized yield for the 30 days ended 3/31/16 reflects an estimated yield to maturity (assuming all portfolio securities are held to maturity). It should be
regarded as an estimate of the Fund’s rate of investment income, and it may not equal the Fund’s actual income distribution rate (which reflects the Fund’s past dividends paid
to shareholders) or the income reported in the Fund’s financial statements.
40 Semiannual Report
franklintempleton.com
FRANKLIN UTILITIES FUND
Your Fund’s Expenses
As a Fund shareholder, you can incur two types of costs:
- Transaction costs, including sales charges (loads) on Fund purchases; and
- Ongoing Fund costs, including management fees, distribution and service (12b-1) fees, and other Fund expenses. All mutual funds have ongoing costs, sometimes referred to as operating expenses.
The following table shows ongoing costs of investing in the Fund and can help you understand these costs and compare them with those of other mutual funds. The table assumes a $1,000 investment held for the six months indicated.
Actual Fund Expenses
The first line (Actual) for each share class listed in the table provides actual account values and expenses. The “Ending Account Value” is derived from the Fund’s actual return, which includes the effect of Fund expenses.
You can estimate the expenses you paid during the period by following these steps. Of course, your account value and expenses will differ from those in this illustration:
| 1. | Divide your account value by $1,000. |
| If an account had an $8,600 value, then $8,600 ÷ $1,000 = 8.6. | |
| 2. | Multiply the result by the number under the heading “Expenses Paid During Period.” |
| If Expenses Paid During Period were $7.50, then 8.6 x $7.50 = $64.50. |
In this illustration, the estimated expenses paid this period are $64.50.
Hypothetical Example for Comparison with Other Funds
Information in the second line (Hypothetical) for each class in the table can help you compare ongoing costs of investing in the Fund with those of other mutual funds. This information may not be used to estimate the actual ending account balance or expenses you paid during the period. The hypothetical “Ending Account Value” is based on the actual expense ratio for each class and an assumed 5% annual rate of return before expenses, which does not represent the Fund’s actual return. The figure under the heading “Expenses Paid During Period” shows the hypothetical expenses your account would have incurred under this scenario. You can compare this figure with the 5% hypothetical examples that appear in shareholder reports of other funds.
Please note that expenses shown in the table are meant to highlight ongoing costs and do not reflect any transaction costs, such as sales charges. Therefore, the second line for each class is useful in comparing ongoing costs only, and will not help you compare total costs of owning different funds. In addition, if transaction costs were included, your total costs would have been higher. Please refer to the Fund prospectus for additional information on operating expenses.
franklintempleton.com
Semiannual Report 41
| FRANKLIN UTILITIES FUND | ||||||
| YOUR FUND’S EXPENSES | ||||||
| Beginning Account | Ending Account | Expenses Paid During | ||||
| Share Class | Value 10/1/15 | Value 3/31/16 | Period* 10/1/15–3/31/16 | |||
| A | ||||||
| Actual | $ | 1,000 | $ | 1,148.70 | $ | 4.03 |
| Hypothetical (5% return before expenses) | $ | 1,000 | $ | 1,021.25 | $ | 3.79 |
| C | ||||||
| Actual | $ | 1,000 | $ | 1,145.10 | $ | 6.70 |
| Hypothetical (5% return before expenses) | $ | 1,000 | $ | 1,018.75 | $ | 6.31 |
| R | ||||||
| Actual | $ | 1,000 | $ | 1,146.50 | $ | 5.90 |
| Hypothetical (5% return before expenses) | $ | 1,000 | $ | 1,019.50 | $ | 5.55 |
| R6 | ||||||
| Actual | $ | 1,000 | $ | 1,150.60 | $ | 2.58 |
| Hypothetical (5% return before expenses) | $ | 1,000 | $ | 1,022.60 | $ | 2.43 |
| Advisor | ||||||
| Actual | $ | 1,000 | $ | 1,149.10 | $ | 3.22 |
| Hypothetical (5% return before expenses) | $ | 1,000 | $ | 1,022.00 | $ | 3.03 |
*Expenses are calculated using the most recent six-month expense ratio, net of expense waivers, annualized for each class (A: 0.75%;
C: 1.25%; R: 1.10%; R6: 0.48%; and Advisor: 0.60%), multiplied by the average account value over the period, multiplied by 183/366 to reflect
the one-half year period.
42 Semiannual Report
franklintempleton.com
FRANKLIN CUSTODIAN FUNDS
| Financial Highlights | ||||||||||||||||||
| Franklin DynaTech Fund | ||||||||||||||||||
| Six Months Ended | ||||||||||||||||||
| March 31, 2016 | Year Ended September 30, | |||||||||||||||||
| (unaudited) | 2015 | 2014 | 2013 | 2012 | 2011 | |||||||||||||
| Class A | ||||||||||||||||||
| Per share operating performance | ||||||||||||||||||
| (for a share outstanding throughout the period) | ||||||||||||||||||
| Net asset value, beginning of period | $ | 46.04 | $ | 46.08 | $ | 42.13 | $ | 34.00 | $ | 27.66 | $ | 27.16 | ||||||
| Income from investment operationsa: | ||||||||||||||||||
| Net investment income (loss)b | (0.07 | ) | (0.21 | ) | (0.18 | ) | (0.12 | ) | (0.11 | ) | (0.14 | ) | ||||||
| Net realized and unrealized gains (losses) | 1.16 | 1.78 | 5.94 | 8.25 | 7.10 | 0.64 | ||||||||||||
| Total from investment operations | 1.09 | 1.57 | 5.76 | 8.13 | 6.99 | 0.50 | ||||||||||||
| Less distributions from net realized gains. | (1.20 | ) | (1.61 | ) | (1.81 | ) | — | (0.65 | ) | — | ||||||||
| Net asset value, end of period | $ | 45.93 | $ | 46.04 | $ | 46.08 | $ | 42.13 | $ | 34.00 | $ | 27.66 | ||||||
| Total returnc | 2.16 | % | 3.40 | % | 13.98 | % | 23.91 | % | 25.59 | % | 1.84 | % | ||||||
| Ratios to average net assetsd | ||||||||||||||||||
| Expenses before waiver and payments by | ||||||||||||||||||
| affiliates | 0.89 | % | 0.89 | % | 0.89 | % | 0.94 | % | 0.96 | % | 0.97 | % | ||||||
| Expenses net of waiver and payments by | ||||||||||||||||||
| affiliates | 0.88 | % | 0.89 | %e | 0.89 | %e,f | 0.94 | % | 0.96 | % | 0.97 | % | ||||||
| Net investment income (loss) | (0.31 | )% | (0.44 | )% | (0.41 | )% | (0.34 | )% | (0.35 | )% | (0.46 | )% | ||||||
| Supplemental data | ||||||||||||||||||
| Net assets, end of period (000’s) | $ | 2,026,775 | $ | 1,857,570 | $ | 1,504,338 | $ | 1,072,814 | $ | 898,665 | $ | 642,552 | ||||||
| Portfolio turnover rate | 7.92 | % | 31.02 | % | 26.43 | % | 35.40 | % | 16.65 | % | 30.11 | % | ||||||
aThe amount shown for a share outstanding throughout the period may not correlate with the Statement of Operations for the period due to the timing of sales and
repurchases of the Fund’s shares in relation to income earned and/or fluctuating fair value of the investments of the Fund.
bBased on average daily shares outstanding.
cTotal return does not reflect sales commissions or contingent deferred sales charges, if applicable, and is not annualized for periods less than one year.
dRatios are annualized for periods less than one year.
eBenefit of waiver and payments by affiliates rounds to less than 0.01%.
fBenefit of expense reduction rounds to less than 0.01%.
franklintempleton.com The accompanying notes are an integral part of these financial statements. | Semiannual Report 43
| FRANKLIN CUSTODIAN FUNDS | ||||||||||||||||||
| FINANCIAL HIGHLIGHTS | ||||||||||||||||||
| Franklin DynaTech Fund (continued) | ||||||||||||||||||
| Six Months Ended | ||||||||||||||||||
| March 31, 2016 | Year Ended September 30, | |||||||||||||||||
| (unaudited) | 2015 | 2014 | 2013 | 2012 | 2011 | |||||||||||||
| Class C | ||||||||||||||||||
| Per share operating performance | ||||||||||||||||||
| (for a share outstanding throughout the period) | ||||||||||||||||||
| Net asset value, beginning of period | $ | 40.00 | $ | 40.53 | $ | 37.53 | $ | 30.52 | $ | 25.07 | $ | 24.81 | ||||||
| Income from investment operationsa: | ||||||||||||||||||
| Net investment income (loss)b | (0.21 | ) | (0.50 | ) | (0.46 | ) | (0.35 | ) | (0.32 | ) | (0.34 | ) | ||||||
| Net realized and unrealized gains (losses) | 1.01 | 1.58 | 5.27 | 7.36 | 6.42 | 0.60 | ||||||||||||
| Total from investment operations | 0.80 | 1.08 | 4.81 | 7.01 | 6.10 | 0.26 | ||||||||||||
| Less distributions from net realized gains. | (1.20 | ) | (1.61 | ) | (1.81 | ) | — | (0.65 | ) | — | ||||||||
| Net asset value, end of period | $ | 39.60 | $ | 40.00 | $ | 40.53 | $ | 37.53 | $ | 30.52 | $ | 25.07 | ||||||
| Total returnc | 1.75 | % | 2.63 | % | 13.13 | % | 22.97 | % | 24.67 | % | 1.05 | % | ||||||
| Ratios to average net assetsd | ||||||||||||||||||
| Expenses before waiver and payments by | ||||||||||||||||||
| affiliates | 1.64 | % | 1.64 | % | 1.64 | % | 1.69 | % | 1.71 | % | 1.72 | % | ||||||
| Expenses net of waiver and payments by | ||||||||||||||||||
| affiliates | 1.63 | % | 1.64 | %e | 1.64 | %e,f | 1.69 | % | 1.71 | % | 1.72 | % | ||||||
| Net investment income (loss) | (1.06 | )% | (1.19 | )% | (1.16 | )% | (1.09 | )% | (1.10 | )% | (1.21 | )% | ||||||
| Supplemental data | ||||||||||||||||||
| Net assets, end of period (000’s) | $ | 307,615 | $ | 270,961 | $ | 212,961 | $ | 176,556 | $ | 142,903 | $ | 105,707 | ||||||
| Portfolio turnover rate | 7.92 | % | 31.02 | % | 26.43 | % | 35.40 | % | 16.65 | % | 30.11 | % | ||||||
aThe amount shown for a share outstanding throughout the period may not correlate with the Statement of Operations for the period due to the timing of sales and
repurchases of the Fund’s shares in relation to income earned and/or fluctuating fair value of the investments of the Fund.
bBased on average daily shares outstanding.
cTotal return does not reflect sales commissions or contingent deferred sales charges, if applicable, and is not annualized for periods less than one year.
dRatios are annualized for periods less than one year.
eBenefit of waiver and payments by affiliates rounds to less than 0.01%.
fBenefit of expense reduction rounds to less than 0.01%.
44 Semiannual Report | The accompanying notes are an integral part of these financial statements. franklintempleton.com
| FRANKLIN CUSTODIAN FUNDS | ||||||||||||||||||
| FINANCIAL HIGHLIGHTS | ||||||||||||||||||
| Franklin DynaTech Fund (continued) | ||||||||||||||||||
| Six Months Ended | ||||||||||||||||||
| March 31, 2016 | Year Ended September 30, | |||||||||||||||||
| (unaudited) | 2015 | 2014 | 2013 | 2012 | 2011 | |||||||||||||
| Class R | ||||||||||||||||||
| Per share operating performance | ||||||||||||||||||
| (for a share outstanding throughout the period) | ||||||||||||||||||
| Net asset value, beginning of period | $ | 45.16 | $ | 45.35 | $ | 41.58 | $ | 33.65 | $ | 27.44 | $ | 27.02 | ||||||
| Income from investment operationsa: | ||||||||||||||||||
| Net investment income (loss)b | (0.13 | ) | (0.32 | ) | (0.29 | ) | (0.21 | ) | (0.19 | ) | (0.22 | ) | ||||||
| Net realized and unrealized gains (losses) | 1.14 | 1.74 | 5.87 | 8.14 | 7.05 | 0.64 | ||||||||||||
| Total from investment operations | 1.01 | 1.42 | 5.58 | 7.93 | 6.86 | 0.42 | ||||||||||||
| Less distributions from net realized gains. | (1.20 | ) | (1.61 | ) | (1.81 | ) | — | (0.65 | ) | — | ||||||||
| Net asset value, end of period | $ | 44.97 | $ | 45.16 | $ | 45.35 | $ | 41.58 | $ | 33.65 | $ | 27.44 | ||||||
| Total returnc | 2.04 | % | 3.11 | % | 13.72 | % | 23.57 | % | 25.32 | % | 1.55 | % | ||||||
| Ratios to average net assetsd | ||||||||||||||||||
| Expenses before waiver and payments by | ||||||||||||||||||
| affiliates | 1.14 | % | 1.14 | % | 1.14 | % | 1.19 | % | 1.21 | % | 1.22 | % | ||||||
| Expenses net of waiver and payments by | ||||||||||||||||||
| affiliates | 1.13 | % | 1.14 | %e | 1.14 | %e,f | 1.19 | % | 1.21 | % | 1.22 | % | ||||||
| Net investment income (loss) | (0.56 | )% | (0.69 | )% | (0.66 | )% | (0.59 | )% | (0.60 | )% | (0.71 | )% | ||||||
| Supplemental data | ||||||||||||||||||
| Net assets, end of period (000’s) | $ | 39,975 | $ | 43,001 | $ | 45,230 | $ | 41,825 | $ | 33,338 | $ | 11,100 | ||||||
| Portfolio turnover rate | 7.92 | % | 31.02 | % | 26.43 | % | 35.40 | % | 16.65 | % | 30.11 | % | ||||||
aThe amount shown for a share outstanding throughout the period may not correlate with the Statement of Operations for the period due to the timing of sales and
repurchases of the Fund’s shares in relation to income earned and/or fluctuating fair value of the investments of the Fund.
bBased on average daily shares outstanding.
cTotal return is not annualized for periods less than one year.
dRatios are annualized for periods less than one year.
eBenefit of waiver and payments by affiliates rounds to less than 0.01%.
fBenefit of expense reduction rounds to less than 0.01%.
franklintempleton.com The accompanying notes are an integral part of these financial statements. | Semiannual Report 45
| FRANKLIN CUSTODIAN FUNDS | ||||||||||||
| FINANCIAL HIGHLIGHTS | ||||||||||||
| Franklin DynaTech Fund (continued) | ||||||||||||
| Six Months Ended | ||||||||||||
| March 31, 2016 | Year Ended September 30, | |||||||||||
| (unaudited) | 2015 | 2014 | 2013 | a | ||||||||
| Class R6 | ||||||||||||
| Per share operating performance | ||||||||||||
| (for a share outstanding throughout the period) | ||||||||||||
| Net asset value, beginning of period | $ | 47.15 | $ | 46.97 | $ | 42.74 | $ | 36.56 | ||||
| Income from investment operationsb: | ||||||||||||
| Net investment income (loss)c | 0.02 | (0.01 | ) | (0.01 | ) | 0.01 | ||||||
| Net realized and unrealized gains (losses) | 1.19 | 1.80 | 6.05 | 6.17 | ||||||||
| Total from investment operations | 1.21 | 1.79 | 6.04 | 6.18 | ||||||||
| Less distributions from net realized gains | (1.20 | ) | (1.61 | ) | (1.81 | ) | — | |||||
| Net asset value, end of period | $ | 47.16 | $ | 47.15 | $ | 46.97 | $ | 42.74 | ||||
| Total returnd | 2.37 | % | 3.81 | % | 14.45 | % | 16.90 | % | ||||
| Ratios to average net assetse | ||||||||||||
| Expenses before waiver and payments by affiliates | 0.48 | % | 0.48 | % | 0.49 | % | 0.52 | % | ||||
| Expenses net of waiver and payments by affiliates. | 0.47 | % | 0.48 | %f | 0.49 | %f,g | 0.52 | % | ||||
| Net investment income (loss) | 0.10 | % | (0.03 | )% | (0.01 | )% | 0.08 | % | ||||
| Supplemental data | ||||||||||||
| Net assets, end of period (000’s) | $ | 367,021 | $ | 362,627 | $ | 342,466 | $ | 317,315 | ||||
| Portfolio turnover rate. | 7.92 | % | 31.02 | % | 26.43 | % | 35.40 | % | ||||
aFor the period May 1, 2013 (effective date) to September 30, 2013.
bThe amount shown for a share outstanding throughout the period may not correlate with the Statement of Operations for the period due to the timing of sales and
repurchases of the Fund’s shares in relation to income earned and/or fluctuating fair value of the investments of the Fund.
cBased on average daily shares outstanding.
dTotal return is not annualized for periods less than one year.
eRatios are annualized for periods less than one year.
fBenefit of waiver and payments by affiliates rounds to less than 0.01%.
gBenefit of expense reduction rounds to less than 0.01%.
46 Semiannual Report | The accompanying notes are an integral part of these financial statements. franklintempleton.com
| FRANKLIN CUSTODIAN FUNDS | ||||||||||||||||||
| FINANCIAL HIGHLIGHTS | ||||||||||||||||||
| Franklin DynaTech Fund (continued) | ||||||||||||||||||
| Six Months Ended | ||||||||||||||||||
| March 31, 2016 | Year Ended September 30, | |||||||||||||||||
| (unaudited) | 2015 | 2014 | 2013 | 2012 | 2011 | |||||||||||||
| Advisor Class | ||||||||||||||||||
| Per share operating performance | ||||||||||||||||||
| (for a share outstanding throughout the period) | ||||||||||||||||||
| Net asset value, beginning of period | $ | 46.96 | $ | 46.87 | $ | 42.71 | $ | 34.39 | $ | 27.89 | $ | 27.33 | ||||||
| Income from investment operationsa: | ||||||||||||||||||
| Net investment income (loss)b | (0.02 | ) | (0.09 | ) | (0.07 | ) | (0.03 | ) | (0.03 | ) | (0.06 | ) | ||||||
| Net realized and unrealized gains (losses) | 1.19 | 1.79 | 6.04 | 8.35 | 7.18 | 0.62 | ||||||||||||
| Total from investment operations | 1.17 | 1.70 | 5.97 | 8.32 | 7.15 | 0.56 | ||||||||||||
| Less distributions from net realized gains. | (1.20 | ) | (1.61 | ) | (1.81 | ) | — | (0.65 | ) | — | ||||||||
| Net asset value, end of period | $ | 46.93 | $ | 46.96 | $ | 46.87 | $ | 42.71 | $ | 34.39 | $ | 27.89 | ||||||
| Total returnc | 2.29 | % | 3.62 | % | 14.29 | % | 24.19 | % | 25.96 | % | 2.05 | % | ||||||
| Ratios to average net assetsd | ||||||||||||||||||
| Expenses before waiver and payments by | ||||||||||||||||||
| affiliates | 0.64 | % | 0.64 | % | 0.64 | % | 0.69 | % | 0.71 | % | 0.72 | % | ||||||
| Expenses net of waiver and payments by | ||||||||||||||||||
| affiliates | 0.63 | % | 0.64 | %e | 0.64 | %e,f | 0.69 | % | 0.71 | % | 0.72 | % | ||||||
| Net investment income (loss) | (0.06 | )% | (0.19 | )% | (0.16 | )% | (0.09 | )% | (0.10 | )% | (0.21 | )% | ||||||
| Supplemental data | ||||||||||||||||||
| Net assets, end of period (000’s) | $ | 151,996 | $ | 176,090 | $ | 159,180 | $ | 122,287 | $ | 260,012 | $ | 102,221 | ||||||
| Portfolio turnover rate | 7.92 | % | 31.02 | % | 26.43 | % | 35.40 | % | 16.65 | % | 30.11 | % | ||||||
aThe amount shown for a share outstanding throughout the period may not correlate with the Statement of Operations for the period due to the timing of sales and
repurchases of the Fund’s shares in relation to income earned and/or fluctuating fair value of the investments of the Fund.
bBased on average daily shares outstanding.
cTotal return is not annualized for periods less than one year.
dRatios are annualized for periods less than one year.
eBenefit of waiver and payments by affiliates rounds to less than 0.01%.
fBenefit of expense reduction rounds to less than 0.01%.
franklintempleton.com The accompanying notes are an integral part of these financial statements. | Semiannual Report 47
| FRANKLIN CUSTODIAN FUNDS | ||||
| Statement of Investments, March 31, 2016 (unaudited) | ||||
| Franklin DynaTech Fund | ||||
| Country | Shares | Value | ||
| Common Stocks 96.9% | ||||
| Aerospace & Defense 0.9% | ||||
| The Boeing Co | United States | 100,000 | $ | 12,694,000 |
| Raytheon Co | United States | 100,000 | 12,263,000 | |
| 24,957,000 | ||||
| Air Freight & Logistics 0.7% | ||||
| FedEx Corp | United States | 120,000 | 19,526,400 | |
| Biotechnology 8.6% | ||||
| a Alnylam Pharmaceuticals Inc | United States | 120,000 | 7,532,400 | |
| Amgen Inc | United States | 150,000 | 22,489,500 | |
| a Biogen Inc | United States | 150,000 | 39,048,000 | |
| a Celgene Corp | United States | 650,000 | 65,058,500 | |
| Gilead Sciences Inc | United States | 650,000 | 59,709,000 | |
| a Heron Therapeutics Inc | United States | 200,000 | 3,798,000 | |
| a Incyte Corp | United States | 300,000 | 21,741,000 | |
| a Kite Pharma Inc | United States | 100,000 | 4,591,000 | |
| a Regeneron Pharmaceuticals Inc | United States | 70,000 | 25,230,800 | |
| 249,198,200 | ||||
| Communications Equipment 2.0% | ||||
| a Palo Alto Networks Inc | United States | 350,000 | 57,099,000 | |
| Diversified Financial Services 2.2% | ||||
| Intercontinental Exchange Inc | United States | 150,000 | 35,271,000 | |
| Moody’s Corp | United States | 300,000 | 28,968,000 | |
| 64,239,000 | ||||
| Diversified Telecommunication Services 1.1% | ||||
| a SBA Communications Corp | United States | 325,000 | 32,555,250 | |
| Electrical Equipment 0.9% | ||||
| Acuity Brands Inc | United States | 125,000 | 27,267,500 | |
| Electronic Equipment, Instruments & Components 0.8% | ||||
| Amphenol Corp., A | United States | 400,000 | 23,128,000 | |
| Energy Equipment & Services 1.7% | ||||
| Core Laboratories NV | United States | 100,000 | 11,241,000 | |
| Schlumberger Ltd | United States | 500,000 | 36,875,000 | |
| 48,116,000 | ||||
| Health Care Equipment & Supplies 6.7% | ||||
| Abbott Laboratories | United States | 550,000 | 23,006,500 | |
| C. R. Bard Inc | United States | 130,000 | 26,347,100 | |
| a DexCom Inc | United States | 400,000 | 27,164,000 | |
| a Edwards Lifesciences Corp | United States | 600,000 | 52,926,000 | |
| a IDEXX Laboratories Inc | United States | 400,000 | 31,328,000 | |
| a Nevro Corp | United States | 100,000 | 5,626,000 | |
| Stryker Corp | United States | 250,000 | 26,822,500 | |
| 193,220,100 | ||||
| Health Care Providers & Services 3.4% | ||||
| a Henry Schein Inc | United States | 120,000 | 20,715,600 | |
| McKesson Corp | United States | 200,000 | 31,450,000 | |
| UnitedHealth Group Inc | United States | 350,000 | 45,115,000 | |
| 97,280,600 | ||||
48 Semiannual Report
franklintempleton.com
FRANKLIN CUSTODIAN FUNDS
STATEMENT OF INVESTMENTS (UNAUDITED)
| Franklin DynaTech Fund (continued) | ||||
| Country | Shares | Value | ||
| Common Stocks (continued) | ||||
| Health Care Technology 1.5% | ||||
| a athenahealth Inc | United States | 125,000 | $ | 17,347,500 |
| a Cerner Corp | United States | 250,000 | 13,240,000 | |
| a Veeva Systems Inc | United States | 500,000 | 12,520,000 | |
| 43,107,500 | ||||
| Industrial Conglomerates 0.3% | ||||
| Roper Technologies Inc | United States | 40,000 | 7,310,800 | |
| Internet & Catalog Retail 8.4% | ||||
| a Amazon.com Inc | United States | 230,000 | 136,537,200 | |
| a Ctrip.com International Ltd., ADR | China | 200,000 | 8,852,000 | |
| a Liberty Ventures, A | United States | 550,000 | 21,516,000 | |
| a Netflix Inc | United States | 300,000 | 30,669,000 | |
| a The Priceline Group Inc | United States | 35,000 | 45,113,600 | |
| 242,687,800 | ||||
| Internet Software & Services 14.3% | ||||
| a Alphabet Inc., A | United States | 150,000 | 114,435,000 | |
| a Alphabet Inc., C | United States | 62,170 | 46,313,542 | |
| a Baidu Inc., ADR | China | 140,000 | 26,723,200 | |
| a Demandware Inc | United States | 175,000 | 6,842,500 | |
| a Facebook Inc., A. | United States | 1,100,000 | 125,510,000 | |
| a LinkedIn Corp., A | United States | 100,000 | 11,435,000 | |
| MercadoLibre Inc | Argentina | 100,000 | 11,785,000 | |
| NetEase Inc., ADR | China | 130,000 | 18,665,400 | |
| Tencent Holdings Ltd | China | 2,500,000 | 51,080,588 | |
| 412,790,230 | ||||
| IT Services 7.6% | ||||
| CSRA Inc | United States | 75,000 | 2,017,500 | |
| a EPAM Systems Inc | United States | 100,000 | 7,467,000 | |
| a Fiserv Inc | United States | 300,000 | 30,774,000 | |
| MasterCard Inc., A | United States | 1,000,000 | 94,500,000 | |
| a PayPal Holdings Inc | United States | 235,000 | 9,071,000 | |
| Visa Inc., A | United States | 1,000,000 | 76,480,000 | |
| 220,309,500 | ||||
| Life Sciences Tools & Services 3.0% | ||||
| a Illumina Inc | United States | 200,000 | 32,422,000 | |
| Thermo Fisher Scientific Inc | United States | 200,000 | 28,318,000 | |
| a VWR Corp | United States | 500,000 | 13,530,000 | |
| a Waters Corp | United States | 100,000 | 13,192,000 | |
| 87,462,000 | ||||
| Media 1.4% | ||||
| a Liberty Broadband Corp., A | United States | 300,000 | 17,448,000 | |
| a Liberty Broadband Corp., C | United States | 130,907 | 7,586,061 | |
| a Liberty Media Corp., A. | United States | 225,000 | 8,691,750 | |
| Naspers Ltd., N | South Africa | 55,000 | 7,678,161 | |
| 41,403,972 | ||||
| Pharmaceuticals 3.1% | ||||
| a Allergan PLC | United States | 200,000 | 53,606,000 | |
| Bristol-Myers Squibb Co | United States | 250,000 | 15,970,000 | |
| Merck KGaA | Germany | 250,000 | 20,861,277 | |
franklintempleton.com
Semiannual Report 49
FRANKLIN CUSTODIAN FUNDS
STATEMENT OF INVESTMENTS (UNAUDITED)
| Franklin DynaTech Fund (continued) | ||||
| Country | Shares | Value | ||
| Common Stocks (continued) | ||||
| Pharmaceuticals (continued) | ||||
| Novo Nordisk AS, ADR | Denmark | 10,000 | $ | 541,900 |
| 90,979,177 | ||||
| Real Estate Investment Trusts (REITs) 3.7% | ||||
| American Tower Corp | United States | 400,000 | 40,948,000 | |
| Equinix Inc | United States | 200,000 | 66,142,000 | |
| 107,090,000 | ||||
| Semiconductors & Semiconductor Equipment 6.8% | ||||
| ARM Holdings PLC, ADR. | United Kingdom | 750,000 | 32,767,500 | |
| ASML Holding NV, N.Y. shs | Netherlands | 200,000 | 20,078,000 | |
| Broadcom Ltd | Singapore | 270,000 | 41,715,000 | |
| a Cavium Inc | United States | 300,000 | 18,348,000 | |
| Intel Corp | United States | 800,000 | 25,880,000 | |
| Lam Research Corp | United States | 300,000 | 24,780,000 | |
| a M/A-COM Technology Solutions Holdings Inc | United States | 40,000 | 1,751,600 | |
| a NXP Semiconductors NV. | Netherlands | 400,000 | 32,428,000 | |
| 197,748,100 | ||||
| Software 14.1% | ||||
| a Adobe Systems Inc | United States | 500,000 | 46,900,000 | |
| a ANSYS Inc | United States | 250,000 | 22,365,000 | |
| a Aspen Technology Inc | United States | 400,000 | 14,452,000 | |
| a Atlassian Corp. PLC | United Kingdom | 100,000 | 2,515,000 | |
| a Electronic Arts Inc | United States | 450,000 | 29,749,500 | |
| a Ellie Mae Inc | United States | 250,000 | 22,660,000 | |
| a Hubspot Inc | United States | 25,000 | 1,090,500 | |
| Intuit Inc | United States | 300,000 | 31,203,000 | |
| Microsoft Corp | United States | 600,000 | 33,138,000 | |
| a Mobileye NV | United States | 50,000 | 1,864,500 | |
| a NetSuite Inc | United States | 400,000 | 27,396,000 | |
| a Red Hat Inc | United States | 10,000 | 745,100 | |
| a Salesforce.com Inc | United States | 800,000 | 59,064,000 | |
| a ServiceNow Inc | United States | 650,000 | 39,767,000 | |
| a Tyler Technologies Inc | United States | 150,000 | 19,291,500 | |
| a Ultimate Software Group Inc | United States | 200,000 | 38,700,000 | |
| a Workday Inc | United States | 225,000 | 17,289,000 | |
| a Zendesk Inc | United States | 50,000 | 1,046,500 | |
| 409,236,600 | ||||
| Technology Hardware, Storage & Peripherals 1.5% | ||||
| Apple Inc | United States | 400,000 | 43,596,000 | |
| Textiles, Apparel & Luxury Goods 2.0% | ||||
| NIKE Inc., B | United States | 600,000 | 36,882,000 | |
| a Under Armour Inc., A | United States | 250,000 | 21,207,500 | |
| 58,089,500 | ||||
| Wireless Telecommunication Services 0.2% | ||||
| a T-Mobile U.S. Inc | United States | 125,000 | 4,787,500 | |
| Total Common Stocks (Cost $1,766,579,427) | 2,803,185,729 | |||
50 Semiannual Report
franklintempleton.com
FRANKLIN CUSTODIAN FUNDS
STATEMENT OF INVESTMENTS (UNAUDITED)
| Franklin DynaTech Fund (continued) | |||||
| Country | Shares | Value | |||
| Short Term Investments (Cost $99,738,661) 3.4% | |||||
| Money Market Funds 3.4% | |||||
| a,b Institutional Fiduciary Trust Money Market Portfolio. | United States | 99,738,661 | $ | 99,738,661 | |
| Total Investments (Cost $1,866,318,088) 100.3% | 2,902,924,390 | ||||
| Other Assets, less Liabilities (0.3)% | (9,543,066 | ) | |||
| Net Assets 100.0% | $ | 2,893,381,324 |
See Abbreviations on page 128.
aNon-income producing.
bSee Note 3(f) regarding investments in affiliated management investment companies.
franklintempleton.com The accompanying notes are an integral part of these financial statements. | Semiannual Report 51
FRANKLIN CUSTODIAN FUNDS
| Financial Highlights | ||||||||||||||||||
| Franklin Growth Fund | ||||||||||||||||||
| Six Months Ended | ||||||||||||||||||
| March 31, 2016 | Year Ended September 30, | |||||||||||||||||
| (unaudited) | 2015 | 2014 | 2013 | 2012 | 2011 | |||||||||||||
| Class A | ||||||||||||||||||
| Per share operating performance | ||||||||||||||||||
| (for a share outstanding throughout the period) | ||||||||||||||||||
| Net asset value, beginning of period | $ | 72.40 | $ | 70.51 | $ | 59.49 | $ | 50.13 | $ | 40.45 | $ | 41.11 | ||||||
| Income from investment operationsa: | ||||||||||||||||||
| Net investment incomeb | 0.27 | c | 0.29 | 0.26 | 0.26 | 0.20 | 0.19 | |||||||||||
| Net realized and unrealized gains (losses) | 3.69 | 1.79 | 11.06 | 9.24 | 9.76 | (0.67 | ) | |||||||||||
| Total from investment operations | 3.96 | 2.08 | 11.32 | 9.50 | 9.96 | (0.48 | ) | |||||||||||
| Less distributions from: | ||||||||||||||||||
| Net investment income. | (0.47 | ) | (0.19 | ) | (0.30 | ) | (0.14 | ) | (0.16 | ) | (0.18 | ) | ||||||
| Net realized gains | (2.37 | ) | — | — | — | (0.12 | ) | — | ||||||||||
| Total distributions | (2.84 | ) | (0.19 | ) | (0.30 | ) | (0.14 | ) | (0.28 | ) | (0.18 | ) | ||||||
| Net asset value, end of period | $ | 73.52 | $ | 72.40 | $ | 70.51 | $ | 59.49 | $ | 50.13 | $ | 40.45 | ||||||
| Total returnd | 5.38 | % | 2.94 | % | 19.08 | % | 19.01 | % | 24.74 | % | (1.23 | )% | ||||||
| Ratios to average net assetse | ||||||||||||||||||
| Expenses before waiver and payments by | ||||||||||||||||||
| affiliates | 0.88 | % | 0.88 | % | 0.90 | % | 0.91 | % | 0.94 | % | 0.92 | % | ||||||
| Expenses net of waiver and payments by | ||||||||||||||||||
| affiliates | 0.86 | %f | 0.88 | %f,g | 0.90 | %f,g | 0.91 | %f | 0.94 | % | 0.92 | % | ||||||
| Net investment income | 0.75 | %c | 0.38 | % | 0.40 | % | 0.49 | % | 0.43 | % | 0.42 | % | ||||||
| Supplemental data | ||||||||||||||||||
| Net assets, end of period (000’s) | $ | 7,551,007 | $ | 7,185,665 | $ | 6,611,073 | $ | 5,305,031 | $ | 4,135,962 | $ | 3,046,277 | ||||||
| Portfolio turnover rate | 4.43 | % | 5.05 | % | 1.50 | % | 0.83 | % | 3.50 | % | 2.72 | % | ||||||
aThe amount shown for a share outstanding throughout the period may not correlate with the Statement of Operations for the period due to the timing of sales and
repurchases of the Fund’s shares in relation to income earned and/or fluctuating fair value of the investments of the Fund.
bBased on average daily shares outstanding.
cNet investment income per shares includes approximately $0.10 per share related to income received in the form of special dividends in connection with certain Fund
holdings. Excluding this amount, the ratio of net investment income to average net assets would have been 0.48%.
dTotal return does not reflect sales commissions or contingent deferred sales charges, if applicable, and is not annualized for periods less than one year.
eRatios are annualized for periods less than one year.
fBenefit of expense reduction rounds to less than 0.01%.
gBenefit of waiver and payments by affiliates rounds to less than 0.01%.
52 Semiannual Report | The accompanying notes are an integral part of these financial statements. franklintempleton.com
| FRANKLIN CUSTODIAN FUNDS | ||||||||||||||||||
| FINANCIAL HIGHLIGHTS | ||||||||||||||||||
| Franklin Growth Fund (continued) | ||||||||||||||||||
| Six Months Ended | ||||||||||||||||||
| March 31, 2016 | Year Ended September 30, | |||||||||||||||||
| (unaudited) | 2015 | 2014 | 2013 | 2012 | 2011 | |||||||||||||
| Class C | ||||||||||||||||||
| Per share operating performance | ||||||||||||||||||
| (for a share outstanding throughout the period) | ||||||||||||||||||
| Net asset value, beginning of period | $ | 67.17 | $ | 65.75 | $ | 55.64 | $ | 47.10 | $ | 38.16 | $ | 38.92 | ||||||
| Income from investment operationsa: | ||||||||||||||||||
| Net investment income (loss)b | —c,d | (0.26 | ) | (0.22 | ) | (0.13 | ) | (0.14 | ) | (0.14 | ) | |||||||
| Net realized and unrealized gains (losses) | 3.42 | 1.68 | 10.33 | 8.67 | 9.20 | (0.62 | ) | |||||||||||
| Total from investment operations | 3.42 | 1.42 | 10.11 | 8.54 | 9.06 | (0.76 | ) | |||||||||||
| Less distributions from net realized gains. | (2.37 | ) | — | — | — | (0.12 | ) | — | ||||||||||
| Net asset value, end of period | $ | 68.22 | $ | 67.17 | $ | 65.75 | $ | 55.64 | $ | 47.10 | $ | 38.16 | ||||||
| Total returne | 5.00 | % | 2.16 | % | 18.17 | % | 18.13 | % | 23.79 | % | (1.95 | )% | ||||||
| Ratios to average net assetsf | ||||||||||||||||||
| Expenses before waiver and payments by | ||||||||||||||||||
| affiliates | 1.63 | % | 1.63 | % | 1.65 | % | 1.66 | % | 1.69 | % | 1.67 | % | ||||||
| Expenses net of waiver and payments by | ||||||||||||||||||
| affiliates | 1.61 | %g | 1.63 | %g,h | 1.65 | %g,h | 1.66 | %g | 1.69 | % | 1.67 | % | ||||||
| Net investment income (loss) | —%c,i | (0.37 | )% | (0.35 | )% | (0.26 | )% | (0.32 | )% | (0.33 | )% | |||||||
| Supplemental data | ||||||||||||||||||
| Net assets, end of period (000’s) | $ | 835,215 | $ | 777,570 | $ | 662,548 | $ | 546,505 | $ | 466,205 | $ | 390,171 | ||||||
| Portfolio turnover rate | 4.43 | % | 5.05 | % | 1.50 | % | 0.83 | % | 3.50 | % | 2.72 | % | ||||||
aThe amount shown for a share outstanding throughout the period may not correlate with the Statement of Operations for the period due to the timing of sales and
repurchases of the Fund’s shares in relation to income earned and/or fluctuating fair value of the investments of the Fund.
bBased on average daily shares outstanding.
cNet investment income per shares includes approximately $0.10 per share related to income received in the form of special dividends in connection with certain Fund
holdings. Excluding this amount, the ratio of net investment income to average net assets would have been (0.27)%.
dAmount rounds to less than $0.01 per share.
eTotal return does not reflect sales commissions or contingent deferred sales charges, if applicable, and is not annualized for periods less than one year.
fRatios are annualized for periods less than one year.
gBenefit of expense reduction rounds to less than 0.01%.
hBenefit of waiver and payments by affiliates rounds to less than 0.01%.
iRounds to less than 0.01%.
franklintempleton.com The accompanying notes are an integral part of these financial statements. | Semiannual Report 53
| FRANKLIN CUSTODIAN FUNDS | ||||||||||||||||||
| FINANCIAL HIGHLIGHTS | ||||||||||||||||||
| Franklin Growth Fund (continued) | ||||||||||||||||||
| Six Months Ended | ||||||||||||||||||
| March 31, 2016 | Year Ended September 30, | |||||||||||||||||
| (unaudited) | 2015 | 2014 | 2013 | 2012 | 2011 | |||||||||||||
| Class R | ||||||||||||||||||
| Per share operating performance | ||||||||||||||||||
| (for a share outstanding throughout the period) | ||||||||||||||||||
| Net asset value, beginning of period | $ | 71.93 | $ | 70.05 | $ | 59.07 | $ | 49.82 | $ | 40.23 | $ | 40.94 | ||||||
| Income from investment operationsa: | ||||||||||||||||||
| Net investment incomeb | 0.19 | c | 0.10 | 0.10 | 0.13 | 0.08 | 0.06 | |||||||||||
| Net realized and unrealized gains (losses) | 3.65 | 1.78 | 10.98 | 9.18 | 9.71 | (0.65 | ) | |||||||||||
| Total from investment operations | 3.84 | 1.88 | 11.08 | 9.31 | 9.79 | (0.59 | ) | |||||||||||
| Less distributions from: | ||||||||||||||||||
| Net investment income. | (0.16 | ) | — | (0.10 | ) | (0.06 | ) | (0.08 | ) | (0.12 | ) | |||||||
| Net realized gains | (2.37 | ) | — | — | — | (0.12 | ) | — | ||||||||||
| Total distributions | (2.53 | ) | — | (0.10 | ) | (0.06 | ) | (0.20 | ) | (0.12 | ) | |||||||
| Net asset value, end of period | $ | 73.24 | $ | 71.93 | $ | 70.05 | $ | 59.07 | $ | 49.82 | $ | 40.23 | ||||||
| Total returnd | 5.25 | % | 2.68 | % | 18.77 | % | 18.71 | % | 24.42 | % | (1.47 | )% | ||||||
| Ratios to average net assetse | ||||||||||||||||||
| Expenses before waiver and payments by | ||||||||||||||||||
| affiliates | 1.13 | % | 1.13 | % | 1.15 | % | 1.16 | % | 1.19 | % | 1.17 | % | ||||||
| Expenses net of waiver and payments by | ||||||||||||||||||
| affiliates | 1.11 | %f | 1.13 | %f,g | 1.15 | %f,g | 1.16 | %f | 1.19 | % | 1.17 | % | ||||||
| Net investment income | 0.50 | %c | 0.13 | % | 0.15 | % | 0.24 | % | 0.18 | % | 0.17 | % | ||||||
| Supplemental data | ||||||||||||||||||
| Net assets, end of period (000’s) | $ | 474,822 | $ | 501,813 | $ | 565,634 | $ | 552,391 | $ | 466,954 | $ | 283,464 | ||||||
| Portfolio turnover rate | 4.43 | % | 5.05 | % | 1.50 | % | 0.83 | % | 3.50 | % | 2.72 | % | ||||||
aThe amount shown for a share outstanding throughout the period may not correlate with the Statement of Operations for the period due to the timing of sales and
repurchases of the Fund’s shares in relation to income earned and/or fluctuating fair value of the investments of the Fund.
bBased on average daily shares outstanding.
cNet investment income per shares includes approximately $0.10 per share related to income received in the form of special dividends in connection with certain Fund
holdings. Excluding this amount, the ratio of net investment income to average net assets would have been 0.23%.
dTotal return is not annualized for periods less than one year.
eRatios are annualized for periods less than one year.
fBenefit of expense reduction rounds to less than 0.01%.
gBenefit of waiver and payments by affiliates rounds to less than 0.01%.
54 Semiannual Report | The accompanying notes are an integral part of these financial statements. franklintempleton.com
| FRANKLIN CUSTODIAN FUNDS | ||||||||||||
| FINANCIAL HIGHLIGHTS | ||||||||||||
| Franklin Growth Fund (continued) | ||||||||||||
| Six Months Ended | ||||||||||||
| March 31, 2016 | Year Ended September 30, | |||||||||||
| (unaudited) | 2015 | 2014 | 2013 | a | ||||||||
| Class R6 | ||||||||||||
| Per share operating performance | ||||||||||||
| (for a share outstanding throughout the period) | ||||||||||||
| Net asset value, beginning of period | $ | 72.69 | $ | 70.76 | $ | 59.71 | $ | 54.58 | ||||
| Income from investment operationsb: | ||||||||||||
| Net investment incomec | 0.43 | d | 0.61 | 0.55 | 0.24 | |||||||
| Net realized and unrealized gains (losses) | 3.72 | 1.79 | 11.08 | 4.89 | ||||||||
| Total from investment operations | 4.15 | 2.40 | 11.63 | 5.13 | ||||||||
| Less distributions from: | ||||||||||||
| Net investment income | (0.87 | ) | (0.47 | ) | (0.58 | ) | — | |||||
| Net realized gains | (2.37 | ) | — | — | — | |||||||
| Total distributions | (3.24 | ) | (0.47 | ) | (0.58 | ) | — | |||||
| Net asset value, end of period | $ | 73.60 | $ | 72.69 | $ | 70.76 | $ | 59.71 | ||||
| Total returne | 5.60 | % | 3.37 | % | 19.59 | % | 9.40 | % | ||||
| Ratios to average net assetsf | ||||||||||||
| Expenses before waiver and payments by affiliates | 0.46 | % | 0.46 | % | 0.47 | % | 0.48 | % | ||||
| Expenses net of waiver and payments by affiliatesg | 0.44 | % | 0.46 | %h | 0.47 | %h | 0.48 | % | ||||
| Net investment income | 1.17 | %d | 0.80 | % | 0.83 | % | 0.92 | % | ||||
| Supplemental data | ||||||||||||
| Net assets, end of period (000’s) | $ | 1,240,937 | $ | 1,163,362 | $ | 1,107,887 | $ | 871,260 | ||||
| Portfolio turnover rate. | 4.43 | % | 5.05 | % | 1.50 | % | 0.83 | % | ||||
aFor the period May 1, 2013 (effective date) to September 30, 2013.
bThe amount shown for a share outstanding throughout the period may not correlate with the Statement of Operations for the period due to the timing of sales and
repurchases of the Fund’s shares in relation to income earned and/or fluctuating fair value of the investments of the Fund.
cBased on average daily shares outstanding.
dNet investment income per shares includes approximately $0.10 per share related to income received in the form of special dividends in connection with certain Fund
holdings. Excluding this amount, the ratio of net investment income to average net assets would have been 0.90%.
eTotal return is not annualized for periods less than one year.
fRatios are annualized for periods less than one year.
gBenefit of expense reduction rounds to less than 0.01%.
hBenefit of waiver and payments by affiliates rounds to less than 0.01%.
franklintempleton.com The accompanying notes are an integral part of these financial statements. | Semiannual Report 55
| FRANKLIN CUSTODIAN FUNDS | ||||||||||||||||||
| FINANCIAL HIGHLIGHTS | ||||||||||||||||||
| Franklin Growth Fund (continued) | ||||||||||||||||||
| Six Months Ended | ||||||||||||||||||
| March 31, 2016 | Year Ended September 30, | |||||||||||||||||
| (unaudited) | 2015 | 2014 | 2013 | 2012 | 2011 | |||||||||||||
| Advisor Class | ||||||||||||||||||
| Per share operating performance | ||||||||||||||||||
| (for a share outstanding throughout the period) | ||||||||||||||||||
| Net asset value, beginning of period | $ | 72.67 | $ | 70.75 | $ | 59.66 | $ | 50.24 | $ | 40.53 | $ | 41.18 | ||||||
| Income from investment operationsa: | ||||||||||||||||||
| Net investment incomeb | 0.36 | c | 0.48 | 0.43 | 0.39 | 0.32 | 0.30 | |||||||||||
| Net realized and unrealized gains (losses) | 3.73 | 1.79 | 11.08 | 9.26 | 9.78 | (0.68 | ) | |||||||||||
| Total from investment operations | 4.09 | 2.27 | 11.51 | 9.65 | 10.10 | (0.38 | ) | |||||||||||
| Less distributions from: | ||||||||||||||||||
| Net investment income. | (0.71 | ) | (0.35 | ) | (0.42 | ) | (0.23 | ) | (0.27 | ) | (0.27 | ) | ||||||
| Net realized gains | (2.37 | ) | — | — | — | (0.12 | ) | — | ||||||||||
| Total distributions | (3.08 | ) | (0.35 | ) | (0.42 | ) | (0.23 | ) | (0.39 | ) | (0.27 | ) | ||||||
| Net asset value, end of period | $ | 73.68 | $ | 72.67 | $ | 70.75 | $ | 59.66 | $ | 50.24 | $ | 40.53 | ||||||
| Total returnd | 5.52 | % | 3.20 | % | 19.37 | % | 19.29 | % | 25.04 | % | (0.96 | )% | ||||||
| Ratios to average net assetse | ||||||||||||||||||
| Expenses before waiver and payments by | ||||||||||||||||||
| affiliates | 0.63 | % | 0.63 | % | 0.65 | % | 0.66 | % | 0.69 | % | 0.67 | % | ||||||
| Expenses net of waiver and payments by | ||||||||||||||||||
| affiliates | 0.61 | %f | 0.63 | %f,g | 0.65 | %f,g | 0.66 | %f | 0.69 | % | 0.67 | % | ||||||
| Net investment income | 1.00 | %c | 0.63 | % | 0.65 | % | 0.74 | % | 0.68 | % | 0.67 | % | ||||||
| Supplemental data | ||||||||||||||||||
| Net assets, end of period (000’s) | $ | 1,748,350 | $ | 1,514,492 | $ | 1,414,980 | $ | 1,080,811 | $ | 1,399,191 | $ | 917,394 | ||||||
| Portfolio turnover rate | 4.43 | % | 5.05 | % | 1.50 | % | 0.83 | % | 3.50 | % | 2.72 | % | ||||||
aThe amount shown for a share outstanding throughout the period may not correlate with the Statement of Operations for the period due to the timing of sales and
repurchases of the Fund’s shares in relation to income earned and/or fluctuating fair value of the investments of the Fund.
bBased on average daily shares outstanding.
cNet investment income per shares includes approximately $0.10 per share related to income received in the form of special dividends in connection with certain Fund
holdings. Excluding this amount, the ratio of net investment income to average net assets would have been 0.73%.
dTotal return is not annualized for periods less than one year.
eRatios are annualized for periods less than one year.
fBenefit of expense reduction rounds to less than 0.01%.
gBenefit of waiver and payments by affiliates rounds to less than 0.01%.
56 Semiannual Report | The accompanying notes are an integral part of these financial statements. franklintempleton.com
FRANKLIN CUSTODIAN FUNDS
| Statement of Investments, March 31, 2016 (unaudited) | ||||
| Franklin Growth Fund | ||||
| Country | Shares | Value | ||
| Common Stocks 89.8% | ||||
| Automobiles & Components 1.8% | ||||
| BorgWarner Inc | United States | 1,650,000 | $ | 63,360,000 |
| Ford Motor Co | United States | 1,200,000 | 16,200,000 | |
| General Motors Co | United States | 800,000 | 25,144,000 | |
| Harley-Davidson Inc | United States | 913,096 | 46,869,218 | |
| Johnson Controls Inc | United States | 1,600,000 | 62,352,000 | |
| 213,925,218 | ||||
| Banks 0.4% | ||||
| a Signature Bank | United States | 23,000 | 3,130,760 | |
| U.S. Bancorp | United States | 100,000 | 4,059,000 | |
| Wells Fargo & Co | United States | 750,000 | 36,270,000 | |
| 43,459,760 | ||||
| Capital Goods 15.7% | ||||
| 3M Co | United States | 855,000 | 142,468,650 | |
| Allegion PLC | United States | 700,000 | 44,597,000 | |
| AMETEK Inc | United States | 60,000 | 2,998,800 | |
| The Boeing Co | United States | 1,100,000 | 139,634,000 | |
| Caterpillar Inc | United States | 550,000 | 42,097,000 | |
| Danaher Corp | United States | 1,050,000 | 99,603,000 | |
| Deere & Co | United States | 500,000 | 38,495,000 | |
| Emerson Electric Co | United States | 1,100,000 | 59,818,000 | |
| General Dynamics Corp | United States | 1,000,000 | 131,370,000 | |
| General Electric Co | United States | 1,800,000 | 57,222,000 | |
| Huntington Ingalls Industries Inc | United States | 166,666 | 22,823,242 | |
| Illinois Tool Works Inc | United States | 1,000,000 | 102,440,000 | |
| Ingersoll-Rand PLC | United States | 1,100,000 | 68,211,000 | |
| Lockheed Martin Corp | United States | 500,000 | 110,750,000 | |
| Northrop Grumman Corp | United States | 1,100,000 | 217,690,000 | |
| Raytheon Co | United States | 600,000 | 73,578,000 | |
| Rockwell Collins Inc | United States | 350,000 | 32,273,500 | |
| a Sensata Technologies Holding NV | United States | 3,200,000 | 124,288,000 | |
| Stanley Black & Decker Inc | United States | 650,000 | 68,386,500 | |
| Textron Inc | United States | 1,600,000 | 58,336,000 | |
| United Technologies Corp | United States | 930,000 | 93,093,000 | |
| W.W. Grainger Inc | United States | 550,000 | 128,386,500 | |
| 1,858,559,192 | ||||
| Commercial & Professional Services 3.0% | ||||
| Dun & Bradstreet Corp | United States | 675,000 | 69,579,000 | |
| Equifax Inc | United States | 550,000 | 62,859,500 | |
| a IHS Inc., A | United States | 1,000,000 | 124,160,000 | |
| Robert Half International Inc | United States | 150,000 | 6,987,000 | |
| a Stericycle Inc | United States | 200,000 | 25,238,000 | |
| a Verisk Analytics Inc | United States | 850,000 | 67,932,000 | |
| 356,755,500 | ||||
| Consumer Durables & Apparel 2.1% | ||||
| NIKE Inc., B | United States | 1,880,000 | 115,563,600 | |
| VF Corp | United States | 2,048,000 | 132,628,480 | |
| 248,192,080 | ||||
franklintempleton.com
Semiannual Report 57
FRANKLIN CUSTODIAN FUNDS
STATEMENT OF INVESTMENTS (UNAUDITED)
| Franklin Growth Fund (continued) | ||||
| Country | Shares | Value | ||
| Common Stocks (continued) | ||||
| Consumer Services 1.1% | ||||
| Carnival Corp | United States | 1,200,000 | $ | 63,324,000 |
| a Chipotle Mexican Grill Inc | United States | 4,000 | 1,883,880 | |
| Graham Holdings Co., B | United States | 80,000 | 38,400,000 | |
| Starbucks Corp | United States | 78,000 | 4,656,600 | |
| Starwood Hotels & Resorts Worldwide Inc | United States | 250,000 | 20,857,500 | |
| 129,121,980 | ||||
| Diversified Financials 2.4% | ||||
| American Express Co | United States | 600,000 | 36,840,000 | |
| a Berkshire Hathaway Inc., A | United States | 184 | 39,274,800 | |
| BlackRock Inc | United States | 225,000 | 76,628,250 | |
| The Charles Schwab Corp | United States | 2,200,000 | 61,644,000 | |
| T. Rowe Price Group Inc | United States | 900,000 | 66,114,000 | |
| 280,501,050 | ||||
| Energy 2.1% | ||||
| Anadarko Petroleum Corp | United States | 1,250,000 | 58,212,500 | |
| Cabot Oil & Gas Corp., A. | United States | 1,700,000 | 38,607,000 | |
| Chevron Corp | United States | 10,000 | 954,000 | |
| EOG Resources Inc | United States | 45,000 | 3,266,100 | |
| a FMC Technologies Inc | United States | 1,500,000 | 41,040,000 | |
| Halliburton Co | United States | 850,000 | 30,362,000 | |
| Occidental Petroleum Corp | United States | 300,000 | 20,529,000 | |
| Royal Dutch Shell PLC, A, ADR | United Kingdom | 345,000 | 16,715,250 | |
| Schlumberger Ltd | United States | 573,700 | 42,310,375 | |
| 251,996,225 | ||||
| Food & Staples Retailing 0.6% | ||||
| Costco Wholesale Corp | United States | 28,000 | 4,412,240 | |
| CVS Health Corp | United States | 656,000 | 68,046,880 | |
| 72,459,120 | ||||
| Food, Beverage & Tobacco 3.2% | ||||
| Brown-Forman Corp., B. | United States | 650,000 | 64,005,500 | |
| Bunge Ltd | United States | 250,000 | 14,167,500 | |
| Mead Johnson Nutrition Co., A | United States | 1,225,000 | 104,088,250 | |
| Mondelez International Inc., A | United States | 600,000 | 24,072,000 | |
| a Monster Beverage Corp | United States | 900,000 | 120,042,000 | |
| PepsiCo Inc | United States | 497,000 | 50,932,560 | |
| 377,307,810 | ||||
| Health Care Equipment & Services 6.7% | ||||
| Abbott Laboratories | United States | 1,099,000 | 45,971,170 | |
| Aetna Inc | United States | 600,000 | 67,410,000 | |
| Baxter International Inc | United States | 400,000 | 16,432,000 | |
| Becton, Dickinson and Co | United States | 77,700 | 11,796,414 | |
| Cardinal Health Inc | United States | 300,000 | 24,585,000 | |
| a Cerner Corp | United States | 68,000 | 3,601,280 | |
| a Edwards Lifesciences Corp | United States | 400,000 | 35,284,000 | |
| a Envision Healthcare Holdings Inc | United States | 2,300,000 | 46,920,000 | |
| a Express Scripts Holding Co | United States | 361,648 | 24,841,601 | |
| a Haemonetics Corp | United States | 1,000,000 | 34,980,000 | |
| a Henry Schein Inc | United States | 350,000 | 60,420,500 | |
| Hill-Rom Holdings Inc | United States | 300,000 | 15,090,000 | |
| a Intuitive Surgical Inc | United States | 150,000 | 90,157,500 | |
58 Semiannual Report
franklintempleton.com
FRANKLIN CUSTODIAN FUNDS
STATEMENT OF INVESTMENTS (UNAUDITED)
| Franklin Growth Fund (continued) | ||||
| Country | Shares | Value | ||
| Common Stocks (continued) | ||||
| Health Care Equipment & Services (continued) | ||||
| a Laboratory Corp. of America Holdings | United States | 500,000 | $ | 58,565,000 |
| McKesson Corp | United States | 31,000 | 4,874,750 | |
| Medtronic PLC | United States | 406,300 | 30,472,500 | |
| Quest Diagnostics Inc | United States | 900,000 | 64,305,000 | |
| Stryker Corp | United States | 400,000 | 42,916,000 | |
| Teleflex Inc | United States | 500,000 | 78,505,000 | |
| a Varian Medical Systems Inc | United States | 300,000 | 24,006,000 | |
| Zimmer Biomet Holdings Inc | United States | 100,000 | 10,663,000 | |
| 791,796,715 | ||||
| Household & Personal Products 0.2% | ||||
| The Procter & Gamble Co | United States | 335,000 | 27,573,850 | |
| Insurance 0.4% | ||||
| Aflac Inc | United States | 600,000 | 37,884,000 | |
| Chubb Ltd | United States | 35,000 | 4,170,250 | |
| MetLife Inc | United States | 105,000 | 4,613,700 | |
| 46,667,950 | ||||
| Materials 4.1% | ||||
| Air Products and Chemicals Inc | United States | 500,000 | 72,025,000 | |
| a Axalta Coating Systems Ltd | United States | 3,400,000 | 99,280,000 | |
| Celanese Corp., A | United States | 1,250,000 | 81,875,000 | |
| The Dow Chemical Co | United States | 90,000 | 4,577,400 | |
| Ecolab Inc | United States | 920,000 | 102,598,400 | |
| Martin Marietta Materials Inc | United States | 400,000 | 63,804,000 | |
| Praxair Inc | United States | 575,000 | 65,808,750 | |
| 489,968,550 | ||||
| Media 1.8% | ||||
| Cable One Inc | United States | 80,000 | 34,970,400 | |
| Comcast Corp., A | United States | 55,000 | 3,359,400 | |
| The Walt Disney Co | United States | 1,724,290 | 171,239,240 | |
| 209,569,040 | ||||
| Pharmaceuticals, Biotechnology & Life Sciences 12.6% | ||||
| AbbVie Inc | United States | 460,000 | 26,275,200 | |
| Agilent Technologies Inc | United States | 1,300,000 | 51,805,000 | |
| a Allergan PLC | United States | 400,000 | 107,212,000 | |
| Amgen Inc | United States | 1,000,000 | 149,930,000 | |
| Baxalta Inc | United States | 400,000 | 16,160,000 | |
| a Biogen Inc | United States | 500,000 | 130,160,000 | |
| a Bluebird Bio Inc | United States | 400,000 | 17,000,000 | |
| a Catalent Inc | United States | 3,400,000 | 90,678,000 | |
| a Celgene Corp | United States | 1,242,000 | 124,311,780 | |
| Eli Lilly & Co | United States | 1,350,000 | 97,213,500 | |
| Gilead Sciences Inc | United States | 650,000 | 59,709,000 | |
| a Illumina Inc | United States | 400,000 | 64,844,000 | |
| Johnson & Johnson | United States | 1,200,100 | 129,850,820 | |
| Merck & Co. Inc | United States | 1,000,000 | 52,910,000 | |
| a Mettler-Toledo International Inc | United States | 425,000 | 146,523,000 | |
| a NantKwest Inc | United States | 575,000 | 4,726,500 | |
| Perrigo Co. PLC | United States | 20,000 | 2,558,600 | |
| Pfizer Inc | United States | 2,761,000 | 81,836,040 | |
| a Quintiles Transnational Holdings Inc | United States | 40,000 | 2,604,000 | |
franklintempleton.com
Semiannual Report 59
FRANKLIN CUSTODIAN FUNDS
STATEMENT OF INVESTMENTS (UNAUDITED)
| Franklin Growth Fund (continued) | ||||
| Country | Shares | Value | ||
| Common Stocks (continued) | ||||
| Pharmaceuticals, Biotechnology & Life Sciences (continued) | ||||
| a Regeneron Pharmaceuticals Inc | United States | 5,000 | $ | 1,802,200 |
| Roche Holding AG, ADR | Switzerland | 1,700,000 | 52,062,500 | |
| a Waters Corp | United States | 625,000 | 82,450,000 | |
| 1,492,622,140 | ||||
| Real Estate 0.7% | ||||
| American Tower Corp | United States | 875,000 | 89,573,750 | |
| Retailing 2.1% | ||||
| a Amazon.com Inc | United States | 350,000 | 207,774,000 | |
| Expedia Inc | United States | 200,000 | 21,564,000 | |
| Lowe’s Cos. Inc | United States | 60,000 | 4,545,000 | |
| The TJX Cos. Inc | United States | 40,000 | 3,134,000 | |
| a TripAdvisor Inc | United States | 200,000 | 13,300,000 | |
| 250,317,000 | ||||
| Semiconductors & Semiconductor Equipment 1.9% | ||||
| ASML Holding NV, N.Y. shs | Netherlands | 650,000 | 65,253,500 | |
| Broadcom Ltd | Singapore | 20,000 | 3,090,000 | |
| Intel Corp | United States | 1,100,000 | 35,585,000 | |
| Lam Research Corp | United States | 30,000 | 2,478,000 | |
| Microchip Technology Inc | United States | 45,000 | 2,169,000 | |
| QUALCOMM Inc | United States | 660,000 | 33,752,400 | |
| Texas Instruments Inc | United States | 1,400,000 | 80,388,000 | |
| 222,715,900 | ||||
| Software & Services 12.5% | ||||
| a Alibaba Group Holding Ltd., ADR | China | 480,400 | 37,966,012 | |
| a Alphabet Inc., A | United States | 165,000 | 125,878,500 | |
| a Alphabet Inc., C | United States | 158,432 | 118,023,919 | |
| a Autodesk Inc | United States | 800,000 | 46,648,000 | |
| Automatic Data Processing Inc | United States | 700,000 | 62,797,000 | |
| CDK Global LLC. | United States | 233,333 | 10,861,651 | |
| a Check Point Software Technologies Ltd | Israel | 525,000 | 45,921,750 | |
| Computer Sciences Corp | United States | 1,400,000 | 48,146,000 | |
| CSRA Inc | United States | 1,400,000 | 37,660,000 | |
| a Facebook Inc., A | United States | 425,000 | 48,492,500 | |
| a Fortinet Inc | United States | 1,500,000 | 45,945,000 | |
| IAC/InterActiveCorp | United States | 300,000 | 14,124,000 | |
| International Business Machines Corp | United States | 600,000 | 90,870,000 | |
| Intuit Inc | United States | 1,000,000 | 104,010,000 | |
| MasterCard Inc., A | United States | 1,347,000 | 127,291,500 | |
| Microsoft Corp | United States | 3,215,000 | 177,564,450 | |
| Oracle Corp | United States | 2,670,000 | 109,229,700 | |
| a Red Hat Inc | United States | 33,000 | 2,458,830 | |
| a Salesforce.com Inc | United States | 61,000 | 4,503,630 | |
| a ServiceNow Inc | United States | 1,000,000 | 61,180,000 | |
| Visa Inc., A | United States | 1,300,000 | 99,424,000 | |
| a Yahoo! Inc | United States | 1,700,000 | 62,577,000 | |
| 1,481,573,442 | ||||
| Technology Hardware & Equipment 6.7% | ||||
| Apple Inc | United States | 4,086,000 | 445,333,140 | |
| Cisco Systems Inc | United States | 2,945,000 | 83,844,150 | |
| EMC Corp | United States | 2,700,000 | 71,955,000 | |
60 Semiannual Report
franklintempleton.com
FRANKLIN CUSTODIAN FUNDS
STATEMENT OF INVESTMENTS (UNAUDITED)
| Franklin Growth Fund (continued) | ||||
| Country | Shares | Value | ||
| Common Stocks (continued) | ||||
| Technology Hardware & Equipment (continued) | ||||
| a Keysight Technologies Inc | United States | 650,000 | $ | 18,031,000 |
| a Palo Alto Networks Inc | United States | 13,000 | 2,120,820 | |
| TE Connectivity Ltd | United States | 1,650,000 | 102,168,000 | |
| a Trimble Navigation Ltd | United States | 2,700,000 | 66,960,000 | |
| 790,412,110 | ||||
| Transportation 7.1% | ||||
| Alaska Air Group Inc | United States | 3,200,000 | 262,464,000 | |
| Allegiant Travel Co | United States | 200,000 | 35,612,000 | |
| C.H. Robinson Worldwide Inc | United States | 267,300 | 19,841,679 | |
| Canadian National Railway Co | Canada | 1,000,000 | 62,460,000 | |
| Canadian Pacific Railway Ltd | Canada | 500,000 | 66,345,000 | |
| Expeditors International of Washington Inc | United States | 600,000 | 29,286,000 | |
| Forward Air Corp | United States | 500,000 | 22,660,000 | |
| International Consolidated Airlines Group SA, ADR | United Kingdom | 1,400,000 | 55,916,000 | |
| Kansas City Southern | United States | 450,000 | 38,452,500 | |
| Ryanair Holdings PLC, ADR. | Ireland | 233,220 | 20,014,940 | |
| Union Pacific Corp | United States | 2,030,000 | 161,486,500 | |
| a United Continental Holdings Inc | United States | 1,050,000 | 62,853,000 | |
| 837,391,619 | ||||
| Utilities 0.6% | ||||
| American Water Works Co. Inc | United States | 700,000 | 48,251,000 | |
| NextEra Energy Inc | United States | 250,000 | 29,585,000 | |
| 77,836,000 | ||||
| Total Common Stocks (Cost $4,994,804,460) | 10,640,296,001 | |||
| Short Term Investments (Cost $1,183,949,659) 10.0% | ||||
| Money Market Funds 10.0% | ||||
| a,b Institutional Fiduciary Trust Money Market Portfolio | United States | 1,183,949,659 | 1,183,949,659 | |
| Total Investments (Cost $6,178,754,119) 99.8% | 11,824,245,660 | |||
| Other Assets, less Liabilities 0.2% | 26,085,514 | |||
| Net Assets 100.0% | $ | 11,850,331,174 | ||
See Abbreviations on page 128.
aNon-income producing.
bSee Note 3(f) regarding investments in affiliated management investment companies.
franklintempleton.com The accompanying notes are an integral part of these financial statements. | Semiannual Report 61
FRANKLIN CUSTODIAN FUNDS
| Financial Highlights | ||||||||||||||||||
| Franklin Income Fund | ||||||||||||||||||
| Six Months Ended | ||||||||||||||||||
| March 31, 2016 | Year Ended September 30, | |||||||||||||||||
| (unaudited) | 2015 | 2014 | 2013 | 2012 | 2011 | |||||||||||||
| Class A | ||||||||||||||||||
| Per share operating performance | ||||||||||||||||||
| (for a share outstanding throughout the period) | ||||||||||||||||||
| Net asset value, beginning of period | $ | 2.10 | $ | 2.48 | $ | 2.33 | $ | 2.23 | $ | 1.98 | $ | 2.11 | ||||||
| Income from investment operationsa: | ||||||||||||||||||
| Net investment incomeb | 0.05 | 0.10 | 0.11 | 0.11 | 0.13 | 0.13 | ||||||||||||
| Net realized and unrealized gains (losses) | 0.02 | (0.36 | ) | 0.16 | 0.12 | 0.26 | (0.12 | ) | ||||||||||
| Total from investment operations | 0.07 | (0.26 | ) | 0.27 | 0.23 | 0.39 | 0.01 | |||||||||||
| Less distributions from net investment income . | (0.06 | ) | (0.12 | ) | (0.12 | ) | (0.13 | ) | (0.14 | ) | (0.14 | ) | ||||||
| Net asset value, end of period | $ | 2.11 | $ | 2.10 | $ | 2.48 | $ | 2.33 | $ | 2.23 | $ | 1.98 | ||||||
| Total returnc | 3.38 | % | (10.93 | )% | 11.86 | % | 10.72 | % | 20.38 | % | 0.01 | % | ||||||
| Ratios to average net assetsd | �� | |||||||||||||||||
| Expensese | 0.62 | %f | 0.61 | %f | 0.61 | %f | 0.62 | % | 0.64 | % | 0.63 | % | ||||||
| Net investment income | 4.67 | % | 4.43 | % | 4.28 | % | 4.98 | % | 5.90 | % | 6.03 | % | ||||||
| Supplemental data | ||||||||||||||||||
| Net assets, end of period (000’s) | $ | 43,475,161 | $ | 44,886,127 | $ | 53,823,921 | $ | 48,320,611 | $ | 41,280,437 | $ | 32,847,934 | ||||||
| Portfolio turnover rate | 30.46 | % | 44.81 | % | 36.03 | % | 37.60 | % | 33.44 | % | 35.83 | % | ||||||
aThe amount shown for a share outstanding throughout the period may not correlate with the Statement of Operations for the period due to the timing of sales and
repurchases of the Fund’s shares in relation to income earned and/or fluctuating fair value of the investments of the Fund.
bBased on average daily shares outstanding.
cTotal return does not reflect sales commissions or contingent deferred sales charges, if applicable, and is not annualized for periods less than one year.
dRatios are annualized for periods less than one year.
eBenefit of expense reduction rounds to less than 0.01%.
fBenefit of waiver and payments by affiliates rounds to less than 0.01%.
62 Semiannual Report | The accompanying notes are an integral part of these financial statements. franklintempleton.com
| FRANKLIN CUSTODIAN FUNDS | ||||||||||||||||||
| FINANCIAL HIGHLIGHTS | ||||||||||||||||||
| Franklin Income Fund (continued) | ||||||||||||||||||
| Six Months Ended | ||||||||||||||||||
| March 31, 2016 | Year Ended September 30, | |||||||||||||||||
| (unaudited) | 2015 | 2014 | 2013 | 2012 | 2011 | |||||||||||||
| Class C | ||||||||||||||||||
| Per share operating performance | ||||||||||||||||||
| (for a share outstanding throughout the period) | ||||||||||||||||||
| Net asset value, beginning of period | $ | 2.13 | $ | 2.50 | $ | 2.35 | $ | 2.25 | $ | 2.00 | $ | 2.13 | ||||||
| Income from investment operationsa: | ||||||||||||||||||
| Net investment incomeb | 0.04 | 0.09 | 0.09 | 0.10 | 0.12 | 0.12 | ||||||||||||
| Net realized and unrealized gains (losses) | 0.02 | (0.35 | ) | 0.17 | 0.12 | 0.26 | (0.12 | ) | ||||||||||
| Total from investment operations | 0.06 | (0.26 | ) | 0.26 | 0.22 | 0.38 | — | |||||||||||
| Less distributions from net investment income . | (0.05 | ) | (0.11 | ) | (0.11 | ) | (0.12 | ) | (0.13 | ) | (0.13 | ) | ||||||
| Net asset value, end of period | $ | 2.14 | $ | 2.13 | $ | 2.50 | $ | 2.35 | $ | 2.25 | $ | 2.00 | ||||||
| Total returnc | 3.08 | % | (10.89 | )% | 11.19 | % | 10.07 | % | 19.58 | % | (0.48 | )% | ||||||
| Ratios to average net assetsd | ||||||||||||||||||
| Expensese | 1.12 | %f | 1.11 | %f | 1.11 | %f | 1.12 | % | 1.14 | % | 1.13 | % | ||||||
| Net investment income | 4.17 | % | 3.93 | % | 3.78 | % | 4.48 | % | 5.40 | % | 5.53 | % | ||||||
| Supplemental data | ||||||||||||||||||
| Net assets, end of period (000’s) | $ | 22,973,340 | $ | 24,091,638 | $ | 28,802,209 | $ | 24,016,797 | $ | 20,220,114 | $ | 16,217,805 | ||||||
| Portfolio turnover rate | 30.46 | % | 44.81 | % | 36.03 | % | 37.60 | % | 33.44 | % | 35.83 | % | ||||||
aThe amount shown for a share outstanding throughout the period may not correlate with the Statement of Operations for the period due to the timing of sales and
repurchases of the Fund’s shares in relation to income earned, and/or fluctuating fair value of the investments of the Fund.
bBased on average daily shares outstanding.
cTotal return does not reflect sales commissions or contingent deferred sales charges, if applicable, and is not annualized for periods less than one year.
dRatios are annualized for periods less than one year.
eBenefit of expense reduction rounds to less than 0.01%.
fBenefit of waiver and payments by affiliates rounds to less than 0.01%.
franklintempleton.com The accompanying notes are an integral part of these financial statements. | Semiannual Report 63
| FRANKLIN CUSTODIAN FUNDS | ||||||||||||||||||
| FINANCIAL HIGHLIGHTS | ||||||||||||||||||
| Franklin Income Fund (continued) | ||||||||||||||||||
| Six Months Ended | ||||||||||||||||||
| March 31, 2016 | Year Ended September 30, | |||||||||||||||||
| (unaudited) | 2015 | 2014 | 2013 | 2012 | 2011 | |||||||||||||
| Class R | ||||||||||||||||||
| Per share operating performance | ||||||||||||||||||
| (for a share outstanding throughout the period) | ||||||||||||||||||
| Net asset value, beginning of period | $ | 2.07 | $ | 2.44 | $ | 2.29 | $ | 2.20 | $ | 1.96 | $ | 2.09 | ||||||
| Income from investment operationsa: | ||||||||||||||||||
| Net investment incomeb | 0.05 | 0.10 | 0.10 | 0.11 | 0.12 | 0.12 | ||||||||||||
| Net realized and unrealized gains (losses) | 0.02 | (0.36 | ) | 0.16 | 0.10 | 0.25 | (0.12 | ) | ||||||||||
| Total from investment operations | 0.07 | (0.26 | ) | 0.26 | 0.21 | 0.37 | — | |||||||||||
| Less distributions from net investment income . | (0.06 | ) | (0.11 | ) | (0.11 | ) | (0.12 | ) | (0.13 | ) | (0.13 | ) | ||||||
| Net asset value, end of period | $ | 2.08 | $ | 2.07 | $ | 2.44 | $ | 2.29 | $ | 2.20 | $ | 1.96 | ||||||
| Total returnc | 3.24 | % | (10.99 | )% | 11.66 | % | 10.03 | % | 19.66 | % | (0.32 | )% | ||||||
| Ratios to average net assetsd | ||||||||||||||||||
| Expensese | 0.97 | %f | 0.96 | %f | 0.96 | %f | 0.97 | % | 0.99 | % | 0.98 | % | ||||||
| Net investment income | 4.32 | % | 4.08 | % | 3.93 | % | 4.63 | % | 5.55 | % | 5.68 | % | ||||||
| Supplemental data | ||||||||||||||||||
| Net assets, end of period (000’s) | $ | 388,344 | $ | 416,653 | $ | 514,892 | $ | 446,463 | $ | 426,525 | $ | 360,907 | ||||||
| Portfolio turnover rate | 30.46 | % | 44.81 | % | 36.03 | % | 37.60 | % | 33.44 | % | 35.83 | % | ||||||
aThe amount shown for a share outstanding throughout the period may not correlate with the Statement of Operations for the period due to the timing of sales and
repurchases of the Fund’s shares in relation to income earned and/or fluctuating fair value of the investments of the Fund.
bBased on average daily shares outstanding.
cTotal return is not annualized for periods less than one year.
dRatios are annualized for periods less than one year.
eBenefit of expense reduction rounds to less than 0.01%.
fBenefit of waiver and payments by affiliates rounds to less than 0.01%.
64 Semiannual Report | The accompanying notes are an integral part of these financial statements. franklintempleton.com
| FRANKLIN CUSTODIAN FUNDS | ||||||||||||
| FINANCIAL HIGHLIGHTS | ||||||||||||
| Franklin Income Fund (continued) | ||||||||||||
| Six Months Ended | ||||||||||||
| March 31, 2016 | Year Ended September 30, | |||||||||||
| (unaudited) | 2015 | 2014 | 2013 | a | ||||||||
| Class R6 | ||||||||||||
| Per share operating performance | ||||||||||||
| (for a share outstanding throughout the period) | ||||||||||||
| Net asset value, beginning of period | $ | 2.09 | $ | 2.46 | $ | 2.31 | $ | 2.33 | ||||
| Income from investment operationsb: | ||||||||||||
| Net investment incomec | 0.05 | 0.11 | 0.11 | 0.04 | ||||||||
| Net realized and unrealized gains (losses) | 0.02 | (0.35 | ) | 0.17 | (0.02 | ) | ||||||
| Total from investment operations | 0.07 | (0.24 | ) | 0.28 | 0.02 | |||||||
| Less distributions from net investment income. | (0.06 | ) | (0.13 | ) | (0.13 | ) | (0.04 | ) | ||||
| Net asset value, end of period | $ | 2.10 | $ | 2.09 | $ | 2.46 | $ | 2.31 | ||||
| Total returnd | 3.54 | % | (10.39 | )% | 12.19 | % | 1.06 | % | ||||
| Ratios to average net assetse | ||||||||||||
| Expensesf | 0.39 | %g | 0.38 | %g | 0.38 | %g | 0.39 | % | ||||
| Net investment income | 4.90 | % | 4.66 | % | 4.50 | % | 5.21 | % | ||||
| Supplemental data | ||||||||||||
| Net assets, end of period (000’s) | $ | 1,701,496 | $ | 1,744,718 | $ | 2,108,076 | $ | 1,921,084 | ||||
| Portfolio turnover rate. | 30.46 | % | 44.81 | % | 36.03 | % | 37.60 | % | ||||
aFor the period May 1, 2013 (effective date) to September 30, 2013.
bThe amount shown for a share outstanding throughout the period may not correlate with the Statement of Operations for the period due to the timing of sales and
repurchases of the Fund’s shares in relation to income earned and/or fluctuating fair value of the investments of the Fund.
cBased on average daily shares outstanding.
dTotal return is not annualized for periods less than one year.
eRatios are annualized for periods less than one year.
fBenefit of expense reduction rounds to less than 0.01%.
gBenefit of waiver and payments by affiliates rounds to less than 0.01%.
franklintempleton.com The accompanying notes are an integral part of these financial statements. | Semiannual Report 65
| FRANKLIN CUSTODIAN FUNDS | ||||||||||||||||||
| FINANCIAL HIGHLIGHTS | ||||||||||||||||||
| Franklin Income Fund (continued) | ||||||||||||||||||
| Six Months Ended | ||||||||||||||||||
| March 31, 2016 | Year Ended September 30, | |||||||||||||||||
| (unaudited) | 2015 | 2014 | 2013 | 2012 | 2011 | |||||||||||||
| Advisor Class | ||||||||||||||||||
| Per share operating performance | ||||||||||||||||||
| (for a share outstanding throughout the period) | ||||||||||||||||||
| Net asset value, beginning of period | $ | 2.09 | $ | 2.46 | $ | 2.31 | $ | 2.22 | $ | 1.97 | $ | 2.10 | ||||||
| Income from investment operationsa: | ||||||||||||||||||
| Net investment incomeb | 0.05 | 0.11 | 0.11 | 0.12 | 0.13 | 0.13 | ||||||||||||
| Net realized and unrealized gains (losses) | 0.02 | (0.36 | ) | 0.17 | 0.11 | 0.26 | (0.12 | ) | ||||||||||
| Total from investment operations | 0.07 | (0.25 | ) | 0.28 | 0.23 | 0.39 | 0.01 | |||||||||||
| Less distributions from net investment income . | (0.06 | ) | (0.12 | ) | (0.13 | ) | (0.14 | ) | (0.14 | ) | (0.14 | ) | ||||||
| Net asset value, end of period | $ | 2.10 | $ | 2.09 | $ | 2.46 | $ | 2.31 | $ | 2.22 | $ | 1.97 | ||||||
| Total returnc | 3.49 | % | (10.46 | )% | 12.12 | % | 10.49 | % | 20.69 | % | 0.16 | % | ||||||
| Ratios to average net assetsd | ||||||||||||||||||
| Expensese | 0.47 | %f | 0.46 | %f | 0.46 | %f | 0.47 | % | 0.49 | % | 0.48 | % | ||||||
| Net investment income | 4.82 | % | 4.58 | % | 4.43 | % | 5.13 | % | 6.05 | % | 6.18 | % | ||||||
| Supplemental data | ||||||||||||||||||
| Net assets, end of period (000’s) | $ | 7,231,711 | $ | 7,754,475 | $ | 9,096,269 | $ | 5,903,701 | $ | 6,444,763 | $ | 5,032,128 | ||||||
| Portfolio turnover rate | 30.46 | % | 44.81 | % | 36.03 | % | 37.60 | % | 33.44 | % | 35.83 | % | ||||||
aThe amount shown for a share outstanding throughout the period may not correlate with the Statement of Operations for the period due to the timing of sales and
repurchases of the Fund’s shares in relation to income earned and/or fluctuating fair value of the investments of the Fund.
bBased on average daily shares outstanding.
cTotal return is not annualized for periods less than one year.
dRatios are annualized for periods less than one year.
eBenefit of expense reduction rounds to less than 0.01%.
fBenefit of waiver and payments by affiliates rounds to less than 0.01%.
66 Semiannual Report | The accompanying notes are an integral part of these financial statements. franklintempleton.com
| FRANKLIN CUSTODIAN FUNDS | ||||
| Statement of Investments, March 31, 2016 (unaudited) | ||||
| Franklin Income Fund | ||||
| Country | Shares | Value | ||
| Common Stocks 43.5% | ||||
| Consumer Discretionary 3.5% | ||||
| Daimler AG | Germany | 8,422,057 | $ | 645,836,213 |
| Ford Motor Co | United States | 62,841,459 | 848,359,696 | |
| General Motors Co | United States | 10,621,840 | 333,844,431 | |
| Nordstrom Inc | United States | 2,000,000 | 114,420,000 | |
| Target Corp | United States | 8,684,784 | 714,584,028 | |
| 2,657,044,368 | ||||
| Consumer Staples 1.7% | ||||
| Anheuser-Busch InBev NV, ADR | Belgium | 1,675,900 | 208,917,694 | |
| Nestle SA | Switzerland | 5,000,000 | 373,771,003 | |
| PepsiCo Inc | United States | 7,000,000 | 717,360,000 | |
| 1,300,048,697 | ||||
| Energy 6.9% | ||||
| Anadarko Petroleum Corp | United States | 5,850,000 | 272,434,500 | |
| BP PLC, ADR | United Kingdom | 25,000,000 | 754,500,000 | |
| Cabot Oil & Gas Corp., A | United States | 3,552,535 | 80,678,070 | |
| Chevron Corp | United States | 11,000,000 | 1,049,400,000 | |
| Occidental Petroleum Corp | United States | 5,000,000 | 342,150,000 | |
| a PetroQuest Energy Inc | United States | 1,740,000 | 1,054,266 | |
| a,b Rex Energy Corp | United States | 2,520,000 | 1,325,465 | |
| Royal Dutch Shell PLC, A, ADR | United Kingdom | 40,000,000 | 1,938,000,000 | |
| Total SA, B, ADR | France | 17,500,000 | 794,850,000 | |
| 5,234,392,301 | ||||
| Financials 3.6% | ||||
| CBL & Associates Properties Inc | United States | 5,000,000 | 59,500,000 | |
| Commonwealth Bank of Australia | Australia | 1,786,957 | 102,651,581 | |
| HCP Inc | United States | 2,000,000 | 65,160,000 | |
| JPMorgan Chase & Co | United States | 10,000,000 | 592,200,000 | |
| MetLife Inc | United States | 9,831,207 | 431,983,236 | |
| Morgan Stanley | United States | 5,000,000 | 125,050,000 | |
| Outfront Media Inc | United States | 5,608,191 | 118,332,830 | |
| Royal Bank of Canada | Canada | 4,000,000 | 230,592,042 | |
| The Toronto-Dominion Bank | Canada | 3,000,000 | 129,563,576 | |
| U.S. Bancorp. | United States | 12,500,000 | 507,375,000 | |
| Wells Fargo & Co | United States | 8,000,000 | 386,880,000 | |
| 2,749,288,265 | ||||
| Health Care 7.3% | ||||
| AstraZeneca PLC | United Kingdom | 15,000,000 | 841,183,904 | |
| Bristol-Myers Squibb Co | United States | 5,000,000 | 319,400,000 | |
| Eli Lilly & Co | United States | 7,500,000 | 540,075,000 | |
| Merck & Co. Inc | United States | 12,500,000 | 661,375,000 | |
| Pfizer Inc | United States | 40,000,000 | 1,185,600,000 | |
| Roche Holding AG | Switzerland | 5,000,000 | 1,231,337,460 | |
| Sanofi, ADR | France | 18,000,000 | 722,880,000 | |
| 5,501,851,364 | ||||
| Industrials 7.3% | ||||
| The Boeing Co | United States | 2,870,868 | 364,427,984 | |
| a,c,d CEVA Holdings LLC | United Kingdom | 91,371 | 36,548,424 | |
| Deere & Co | United States | 4,500,000 | 346,455,000 | |
| General Electric Co | United States | 35,000,000 | 1,093,263,597 | |
| Illinois Tool Works Inc | United States | 1,000,000 | 102,440,000 | |
franklintempleton.com
Semiannual Report 67
FRANKLIN CUSTODIAN FUNDS
STATEMENT OF INVESTMENTS (UNAUDITED)
| Franklin Income Fund (continued) | ||||
| Country | Shares | Value | ||
| Common Stocks (continued) | ||||
| Industrials (continued) | ||||
| Lockheed Martin Corp | United States | 2,000,000 | $ | 443,000,000 |
| Raytheon Co | United States | 6,000,000 | 735,780,000 | |
| Republic Services Inc | United States | 8,500,000 | 405,025,000 | |
| Siemens AG | Germany | 4,000,000 | 424,111,960 | |
| Union Pacific Corp | United States | 6,000,000 | 477,300,000 | |
| United Technologies Corp | United States | 9,000,000 | 900,900,000 | |
| Waste Management Inc | United States | 4,032,512 | 237,918,208 | |
| 5,567,170,173 | ||||
| Information Technology 3.2% | ||||
| Analog Devices Inc | United States | 6,500,000 | 384,735,000 | |
| Apple Inc | United States | 802,613 | 87,476,791 | |
| Cisco Systems Inc | United States | 14,500,000 | 412,815,000 | |
| a,b First Data Holdings Inc., B | United States | 6,854,565 | 79,828,264 | |
| Intel Corp | United States | 13,500,000 | 436,725,000 | |
| Microsoft Corp | United States | 7,500,000 | 414,225,000 | |
| QUALCOMM Inc | United States | 1,221,001 | 62,441,991 | |
| Texas Instruments Inc | United States | 9,000,000 | 516,780,000 | |
| 2,395,027,046 | ||||
| Materials 4.0% | ||||
| Agrium Inc | Canada | 3,000,000 | 264,870,000 | |
| BASF SE | Germany | 12,000,000 | 905,591,722 | |
| BHP Billiton PLC | Australia | 16,300,000 | 183,356,033 | |
| The Dow Chemical Co | United States | 10,685,000 | 543,439,100 | |
| E. I. du Pont de Nemours and Co | United States | 196,139 | 12,419,521 | |
| LyondellBasell Industries NV, A | United States | 2,311,124 | 197,785,992 | |
| The Mosaic Co | United States | 12,000,000 | 324,000,000 | |
| Rio Tinto PLC, ADR | United Kingdom | 20,000,000 | 565,400,000 | |
| 2,996,862,368 | ||||
| Telecommunication Services 1.4% | ||||
| BCE Inc | Canada | 5,500,000 | 250,795,424 | |
| Telstra Corp. Ltd | Australia | 27,000,000 | 110,342,990 | |
| TELUS Corp | Canada | 2,500,000 | 81,429,837 | |
| Verizon Communications Inc | United States | 12,000,000 | 648,960,000 | |
| 1,091,528,251 | ||||
| Utilities 4.6% | ||||
| Dominion Resources Inc | United States | 7,500,000 | 563,400,000 | |
| Duke Energy Corp | United States | 8,000,000 | 645,440,000 | |
| Exelon Corp | United States | 2,788,700 | 100,002,782 | |
| PG&E Corp | United States | 10,000,000 | 597,200,000 | |
| PPL Corp | United States | 2,500,000 | 95,175,000 | |
| Public Service Enterprise Group Inc | United States | 5,000,000 | 235,700,000 | |
| Sempra Energy | United States | 4,500,000 | 468,225,000 | |
| The Southern Co | United States | 7,500,000 | 387,975,000 | |
| SSE PLC | United Kingdom | 4,000,000 | 85,760,163 | |
| Xcel Energy Inc | United States | 7,500,000 | 313,650,000 | |
| 3,492,527,945 | ||||
| Total Common Stocks (Cost $31,068,320,241) | 32,985,740,778 | |||
68 Semiannual Report
franklintempleton.com
FRANKLIN CUSTODIAN FUNDS
STATEMENT OF INVESTMENTS (UNAUDITED)
| Franklin Income Fund (continued) | ||||
| Country | Shares | Value | ||
| e Equity-Linked Securities 13.2% | ||||
| Consumer Discretionary 2.5% | ||||
| f Credit Suisse New York into Target Corp., 6.00%, 144A | United States | 1,870,000 | $ | 153,175,253 |
| f The Goldman Sachs Group Inc. into Ford Motor Co., 9.00%, 144A | United States | 17,915,000 | 247,262,830 | |
| f The Goldman Sachs Group Inc. into General Motors Co., 6.50%, 144A | United States | 6,000,000 | 188,951,400 | |
| f JPMorgan Chase & Co. into Target Corp., 6.50%, 144A | United States | 1,892,000 | 154,131,402 | |
| f JPMorgan Chase & Co. into Target Corp., 6.50%, 144A | United States | 2,014,000 | 161,434,788 | |
| f Merrill Lynch International & Co. CV into Ford Motors, 8.50%, 144A | United States | 18,740,000 | 254,980,188 | |
| f Merrill Lynch International & Co. CV into General Motors Co., 8.00%, | ||||
| 144A | United States | 6,590,000 | 206,015,921 | |
| f Merrill Lynch International & Co. CV into Target Corp., 6.00%, 144A | United States | 2,455,000 | 202,507,303 | |
| f UBS AG into General Motors Co., 8.00%, 144A. | United States | 5,706,000 | 183,078,722 | |
| f UBS AG into Las Vegas Sands Corp., 9.00%, 144A | United States | 2,494,000 | 130,499,548 | |
| 1,882,037,355 | ||||
| Consumer Staples 0.1% | ||||
| f Barclays Bank PLC into Whole Foods Market Inc., 7.00%, 144A | United States | 3,645,000 | 116,330,175 | |
| Energy 2.0% | ||||
| f Citigroup Inc. into Anadarko Petroleum Corp., 6.50%, 144A | United States | 2,130,000 | 100,276,140 | |
| f Credit Suisse New York into Chevron Corp., 7.00%, 144A | United States | 2,065,000 | 195,767,369 | |
| f Credit Suisse New York into Schlumberger Ltd., 6.00%, 144A. | United States | 1,970,000 | 145,719,127 | |
| f JPMorgan Chase & Co. into Anadarko Petroleum Corp., 8.50%, 144A | United States | 2,584,000 | 123,171,786 | |
| f JPMorgan Chase & Co. into Devon Energy Corp., 7.50%, 144A | United States | 2,516,000 | 69,277,305 | |
| f JPMorgan Chase & Co. into Halliburton Co., 8.50%, 144A | United States | 3,054,000 | 111,940,400 | |
| f Morgan Stanley into Anadarko Petroleum Corp., 9.50%, 144A. | United States | 4,275,000 | 195,387,165 | |
| f Royal Bank of Canada into Halliburton Co., 6.00%, 144A | United States | 3,125,000 | 113,219,375 | |
| f UBS AG into Exxon Mobil Corp., 6.50%, 144A | United States | 3,058,000 | 255,618,832 | |
| f UBS AG into Halliburton Co., 7.00%, 144A | United States | 4,750,000 | 173,768,775 | |
| 1,484,146,274 | ||||
| Financials 1.1% | ||||
| f Barclays Bank PLC into Bank of America Corp., 6.00%, 144A. | United States | 10,700,000 | 148,020,590 | |
| f Deutsche Bank AG/London into Bank of America Corp., 7.00%, 144A | United States | 6,370,000 | 87,389,393 | |
| f Deutsche Bank AG/London into MetLife Inc., 6.50%, 144A | United States | 3,000,000 | 132,780,000 | |
| f JPMorgan Chase & Co. into The Charles Schwab Corp., 9.50%, 144A. | United States | 2,164,000 | 59,695,888 | |
| f Royal Bank of Canada into Metlife Inc., 6.00%, 144A | United States | 2,950,000 | 130,108,865 | |
| f UBS AG into Bank of America Corp., 6.50%, 144A | United States | 9,586,000 | 134,488,704 | |
| f Wells Fargo Bank NA into The Charles Schwab Corp., 7.50%, 144A | United States | 5,773,000 | 157,940,620 | |
| 850,424,060 | ||||
| Health Care 0.8% | ||||
| f Barclays Bank PLC into Medtronic PLC, 6.00%, 144A | United States | 1,310,000 | 99,112,766 | |
| f JPMorgan Chase & Co. into Medtronic PLC, 6.00%, 144A | United States | 1,308,000 | 99,303,229 | |
| f Royal Bank of Canada into Eli Lilly & Co., 6.50%, 144A | United States | 1,197,000 | 87,819,581 | |
| f Royal Bank of Canada into Medtronic PLC, 6.50%, 144A | United States | 2,064,000 | 156,509,611 | |
| f UBS AG into Eli Lilly & Co., 7.50%, 144A | United States | 2,400,000 | 178,898,160 | |
| 621,643,347 | ||||
| Industrials 1.3% | ||||
| f Bank of America Merrill Lynch into Illinois Tool Works Inc., 6.00%, 144A | United States | 1,057,000 | 106,037,183 | |
| f Barclays Bank PLC into The Boeing Co., 7.50%, 144A | United States | 1,180,000 | 148,180,860 | |
| f The Goldman Sachs Group Inc. into General Electric Co., 5.50%, 144A | United States | 14,423,000 | 428,879,443 | |
| f The Goldman Sachs International into Deere & Co., 9.50%, 144A | United States | 2,020,000 | 155,332,748 | |
| f Merrill Lynch International & Co. CV into Deere & Co., 7.00%, 144A | United States | 1,890,000 | 146,100,213 | |
| 984,530,447 | ||||
franklintempleton.com
Semiannual Report 69
FRANKLIN CUSTODIAN FUNDS
STATEMENT OF INVESTMENTS (UNAUDITED)
| Franklin Income Fund (continued) | ||||
| Country | Shares | Value | ||
| e Equity-Linked Securities (continued) | ||||
| Information Technology 4.2% | ||||
| f Barclays Bank PLC into Seagate Technology PLC, 12.50%, 144A | United States | 1,380,000 | $ | 48,098,382 |
| f Citigroup Inc. into Apple Inc., 7.50%, 144A | United States | 2,395,400 | 259,666,151 | |
| f Citigroup Inc. into Intel Corp., 7.50%, 144A | United States | 6,864,000 | 217,468,680 | |
| f Citigroup Inc. into Microsoft Corp., 6.00%, 144A | United States | 4,254,000 | 224,161,552 | |
| f Credit Suisse New York into Cisco Systems Inc., 7.50%, 144A | United States | 7,580,000 | 211,607,828 | |
| f Credit Suisse New York into QUALCOMM Inc., 6.00%, 144A | United States | 2,910,000 | 149,469,240 | |
| f Credit Suisse New York into Texas Instruments Inc., 7.00%, 144A | United States | 2,575,000 | 148,663,505 | |
| f The Goldman Sachs Group Inc., 6.00%, into Oracle Corp., 144A | United States | 6,946,000 | 271,087,794 | |
| f The Goldman Sachs Group Inc. into Apple Inc., 7.50%, 144A | United States | 1,561,000 | 173,673,738 | |
| f JPMorgan Chase & Co. into Google Inc., 4.50%, C, 144A. | United States | 524,000 | 308,527,270 | |
| f Merrill Lynch International & Co. CV into Oracle Corp., 6.00%, 144A | United States | 4,950,000 | 202,477,275 | |
| f Morgan Stanley into QUALCOMM Inc., 8.00%, 144A | United States | 3,949,000 | 200,174,810 | |
| f Royal Bank of Canada into Cisco Systems Inc., 7.50%, 144A | United States | 9,356,000 | 260,692,777 | |
| f Royal Bank of Canada into Xilinx Inc., 8.50%, 144A. | United States | 3,176,000 | 150,222,894 | |
| f UBS AG into Intel Corp., 7.00%, 144A | United States | 5,750,000 | 190,073,725 | |
| f UBS AG into Intel Corp., 7.50%, 144A | United States | 5,100,000 | 162,461,520 | |
| 3,178,527,141 | ||||
| Materials 1.1% | ||||
| f Barclays Bank PLC into Alcoa Inc., 8.50%, 144A | United States | 8,495,000 | 82,104,175 | |
| f Citigroup Inc. into The Dow Chemical Co., 8.00%, 144A. | United States | 4,283,000 | 217,236,758 | |
| f Credit Suisse New York into The Dow Chemical Co., 8.00%, 144A | United States | 3,790,000 | 194,221,203 | |
| f Deutsche Bank AG/London into Agrium Inc., 8.00%, 144A | Canada | 1,050,000 | 94,569,090 | |
| f Merrill Lynch International & Co. CV into The Dow Chemical Co., 7.50%, | ||||
| 144A | United States | 4,826,000 | 248,119,621 | |
| 836,250,847 | ||||
| Utilities 0.1% | ||||
| f The Goldman Sachs Group Inc. into Calpine Corp., 6.00%, 144A | United States | 4,895,000 | 75,333,561 | |
| Total Equity-Linked Securities (Cost $10,458,051,206) | 10,029,223,207 | |||
| Convertible Preferred Stocks 3.6% | ||||
| Consumer Discretionary 0.1% | ||||
| Fiat Chrysler Automobiles NV, 7.875%, cvt. pfd | United Kingdom | 1,100,000 | 80,608,000 | |
| Energy 0.2% | ||||
| g Halcon Resources Corp., 5.75%, cvt. pfd., A | United States | 37,000 | 1,165,500 | |
| Hess Corp., 8.00%, cvt. pfd | United States | 2,000,000 | 134,840,000 | |
| Rex Energy Corp., 6.00%, cvt. pfd., A | United States | 350,000 | 1,750,000 | |
| Sanchez Energy Corp., 6.50%, cvt. pfd., B | United States | 1,200,000 | 15,936,000 | |
| 153,691,500 | ||||
| Financials 1.7% | ||||
| Bank of America Corp., 7.25%, cvt. pfd., L | United States | 670,218 | 762,708,084 | |
| FelCor Lodging Trust Inc., 7.80%, cvt. pfd., A | United States | 2,700,000 | 68,067,000 | |
| a FNMA, 5.375%, cvt. pfd | United States | 4,250 | 35,062,500 | |
| Wells Fargo & Co., 7.50%, cvt. pfd., A | United States | 360,097 | 433,920,486 | |
| 1,299,758,070 | ||||
| Health Care 0.4% | ||||
| Allergan PLC, 5.50%, cvt. pfd | United States | 80,000 | 73,531,200 | |
| Teva Pharmaceutical Industries Ltd., 7.00%, cvt. pfd | Israel | 250,000 | 220,985,000 | |
| 294,516,200 | ||||
70 Semiannual Report
franklintempleton.com
FRANKLIN CUSTODIAN FUNDS
STATEMENT OF INVESTMENTS (UNAUDITED)
| Franklin Income Fund (continued) | ||||
| Country | Shares | Value | ||
| Convertible Preferred Stocks (continued) | ||||
| Industrials 0.1% | ||||
| a,c,d CEVA Holdings LLC, cvt. pfd., A-1 | United Kingdom | 2,897 | $ | 1,521,056 |
| a,c,d CEVA Holdings LLC, cvt. pfd., A-2 | United Kingdom | 110,565 | 44,226,032 | |
| 45,747,088 | ||||
| Materials 0.1% | ||||
| Alcoa Inc., 5.375%, cvt. pfd | United States | 3,056,375 | 100,829,812 | |
| Telecommunication Services 0.1% | ||||
| T-Mobile US Inc., 5.50%, cvt. pfd | United States | 777,800 | 51,490,360 | |
| Utilities 0.9% | ||||
| Dominion Resources Inc., 6.125%, cvt. pfd., A | United States | 1,490,000 | 87,388,500 | |
| Dominion Resources Inc., 6.375%, cvt. pfd., A | United States | 2,500,000 | 125,750,000 | |
| Dominion Resources Inc., 6.00%, cvt. pfd., B | United States | 1,490,000 | 86,762,700 | |
| Exelon Corp., 6.50%, cvt. pfd | United States | 2,250,000 | 110,767,500 | |
| NextEra Energy Inc., 5.799%, cvt. pfd | United States | 1,000,000 | 60,900,000 | |
| NextEra Energy Inc., 6.371%, cvt. pfd | United States | 3,650,000 | 222,832,500 | |
| 694,401,200 | ||||
| Total Convertible Preferred Stocks | ||||
| (Cost $2,840,404,795) | 2,721,042,230 | |||
| Preferred Stocks 0.2% | ||||
| Financials 0.2% | ||||
| a FHLMC, 8.375%, pfd., Z | United States | 9,500,000 | 29,450,000 | |
| a FNMA, 8.25%, pfd.,S | United States | 7,000,000 | 21,280,000 | |
| Morgan Stanley, 6.375%, pfd., I | United States | 3,500,000 | 91,245,000 | |
| Total Preferred Stocks (Cost $488,900,000) | 141,975,000 | |||
| Principal | ||||
| Amount* | ||||
| Convertible Bonds 0.2% | ||||
| Energy 0.2% | ||||
| Cobalt International Energy Inc., | ||||
| cvt., senior bond, 3.125%, 5/15/24 | United States | 84,289,000 | 34,347,768 | |
| cvt., senior note, 2.625%, 12/01/19 | United States | 70,000,000 | 34,830,250 | |
| Stone Energy Corp., cvt., senior note, 1.75%, 3/01/17 | United States | 149,507,000 | 58,774,939 | |
| 127,952,957 | ||||
| Health Care 0.0%† | ||||
| f Impax Laboratories Inc., cvt., senior note, 144A, 2.00%, 6/15/22 | United States | 55,000,000 | 49,328,125 | |
| Total Convertible Bonds (Cost $323,088,243) | 177,281,082 | |||
| Corporate Bonds 32.7% | ||||
| Consumer Discretionary 5.2% | ||||
| f,h 24 Hour Holdings III LLC, senior note, 144A, 8.00%, 6/01/22. | United States | 103,000,000 | 84,202,500 | |
| f Altice Financing SA, secured note, 144A, 6.625%, 2/15/23 | Luxembourg | 40,000,000 | 40,300,000 | |
| f Altice Luxembourg SA, | ||||
| senior bond, 144A, 7.625%, 2/15/25 | Luxembourg | 20,000,000 | 19,200,000 | |
| senior secured note, 144A, 7.75%, 5/15/22 | Luxembourg | 25,000,000 | 24,716,250 | |
| AMC Networks Inc., 4.75%, 12/15/22 | United States | 26,500,000 | 26,698,750 | |
| f Argos Merger Sub Inc., senior note, 144A, 7.125%, 3/15/23 | United States | 49,600,000 | 52,700,000 | |
franklintempleton.com
Semiannual Report 71
FRANKLIN CUSTODIAN FUNDS
STATEMENT OF INVESTMENTS (UNAUDITED)
| Franklin Income Fund (continued) | ||||
| Principal | ||||
| Country | Amount* | Value | ||
| Corporate Bonds (continued) | ||||
| Consumer Discretionary (continued) | ||||
| CCO Holdings LLC/CCO Holdings Capital Corp., | ||||
| senior bond, 5.125%, 2/15/23 | United States | 170,000,000 | $ | 173,825,000 |
| senior bond, 5.75%, 9/01/23 | United States | 67,000,000 | 69,680,000 | |
| senior bond, 5.75%, 1/15/24 | United States | 168,000,000 | 175,350,000 | |
| f senior note, 144A, 5.125%, 5/01/23 | United States | 50,000,000 | 51,000,000 | |
| f senior note, 144A, 5.875%, 4/01/24 | United States | 40,000,000 | 42,000,000 | |
| f CCO Safari II LLC, senior secured note, 144A, 4.908%, 7/23/25 | United States | 90,000,000 | 95,107,680 | |
| f CCOH Safari LLC, senior bond, 144A, 5.75%, 2/15/26 | United States | 50,000,000 | 51,875,000 | |
| Cinemark USA Inc., | ||||
| senior bond, 4.875%, 6/01/23 | United States | 23,000,000 | 23,309,350 | |
| senior note, 5.125%, 12/15/22 | United States | 50,000,000 | 51,437,500 | |
| DISH DBS Corp., | ||||
| senior bond, 5.00%, 3/15/23 | United States | 250,000,000 | 223,125,000 | |
| senior note, 5.125%, 5/01/20 | United States | 45,000,000 | 44,775,000 | |
| senior note, 6.75%, 6/01/21 | United States | 95,000,000 | 98,325,000 | |
| senior note, 5.875%, 7/15/22 | United States | 232,000,000 | 220,400,000 | |
| senior note, 5.875%, 11/15/24 | United States | 153,200,000 | 140,944,000 | |
| Dollar General Corp., senior bond, 3.25%, 4/15/23 | United States | 170,000,000 | 171,893,630 | |
| Fiat Chrysler Automobiles NV, senior note, 5.25%, 4/15/23 | United Kingdom | 67,600,000 | 67,230,228 | |
| g iHeartCommunications Inc., | ||||
| senior secured bond, first lien, 9.00%, 3/01/21 | United States | 319,775,000 | 223,842,500 | |
| senior secured note, first lien, 9.00%, 12/15/19 | United States | 265,800,000 | 197,688,750 | |
| senior secured note, first lien, 11.25%, 3/01/21 | United States | 50,000,000 | 35,187,500 | |
| senior secured note, first lien, 9.00%, 9/15/22 | United States | 109,400,000 | 75,896,250 | |
| f International Game Technology PLC, | ||||
| senior note, 144A, 5.625%, 2/15/20 | United States | 42,500,000 | 44,306,250 | |
| senior secured bond, 144A, 6.50%, 2/15/25 | United States | 84,000,000 | 83,685,000 | |
| senior secured note, 144A, 6.25%, 2/15/22 | United States | 46,600,000 | 47,648,500 | |
| KB Home, | ||||
| senior bond, 7.50%, 9/15/22 | United States | 50,000,000 | 50,500,000 | |
| senior note, 7.00%, 12/15/21 | United States | 70,000,000 | 70,350,000 | |
| MGM Resorts International, | ||||
| senior note, 6.75%, 10/01/20 | United States | 27,450,000 | 29,838,150 | |
| senior note, 7.75%, 3/15/22 | United States | 80,000,000 | 89,800,000 | |
| Outfront Media Capital LLC/Corp., senior bond, 5.875%, 3/15/25. | United States | 30,000,000 | 31,387,500 | |
| Quebecor Media Inc., senior bond, 5.75%, 1/15/23 | Canada | 70,300,000 | 72,760,500 | |
| Regal Entertainment Group, senior note, 5.75%, 3/15/22 | United States | 50,000,000 | 52,000,000 | |
| f Shea Homes LP/Shea Homes Funding Corp., | ||||
| senior bond, 144A, 6.125%, 4/01/25 | United States | 90,000,000 | 88,650,000 | |
| senior note, 144A, 5.875%, 4/01/23 | United States | 80,000,000 | 79,300,000 | |
| f Sirius XM Radio Inc., | ||||
| senior bond, 144A, 6.00%, 7/15/24 | United States | 120,000,000 | 126,262,560 | |
| senior note, 144A, 4.625%, 5/15/23 | United States | 88,400,000 | 87,737,000 | |
| f Univision Communications Inc., | ||||
| senior secured note, first lien, 144A, 5.125%, 5/15/23 | United States | 135,500,000 | 135,500,000 | |
| senior secured note, first lien, 144A, 5.125%, 2/15/25 | United States | 74,020,000 | 73,279,800 | |
| f Virgin Media Secured Finance PLC, senior secured bond, first lien, 144A, | ||||
| 5.50%, 1/15/25 | United Kingdom | 80,000,000 | 81,914,000 | |
| f Wynn Las Vegas LLC/Wynn Las Vegas Capital Corp., | ||||
| senior bond, 144A, 4.25%, 5/30/23 | United States | 74,000,000 | 68,357,500 | |
| senior bond, 144A, 5.50%, 3/01/25 | United States | 100,000,000 | 94,625,000 | |
72 Semiannual Report
franklintempleton.com
FRANKLIN CUSTODIAN FUNDS
STATEMENT OF INVESTMENTS (UNAUDITED)
| Franklin Income Fund (continued) | |||||
| Principal | |||||
| Country | Amount* | Value | |||
| Corporate Bonds (continued) | |||||
| Consumer Discretionary (continued) | |||||
| f Wynn Macau Ltd., senior note, 144A, 5.25%, 10/15/21. | Macau | 47,000,000 | $ | 44,767,500 | |
| 3,933,379,148 | |||||
| Consumer Staples 0.8% | |||||
| Cott Beverages Inc., | |||||
| senior note, 6.75%, 1/01/20 | United States | 40,100,000 | 42,205,250 | ||
| senior note, 5.375%, 7/01/22 | United States | 49,377,000 | 50,364,540 | ||
| f ESAL GmbH, senior note, 144A, 6.25%, 2/05/23 | Brazil | 50,000,000 | 43,950,500 | ||
| f JBS USA LLC/Finance Inc., | |||||
| senior bond, 144A, 5.875%, 7/15/24 | United States | 80,000,000 | 72,600,000 | ||
| senior note, 144A, 7.25%, 6/01/21. | United States | 108,500,000 | 108,608,500 | ||
| senior note, 144A, 5.75%, 6/15/25. | United States | 55,000,000 | 48,400,000 | ||
| f Post Holdings Inc., | |||||
| senior note, 144A, 6.75%, 12/01/21 | United States | 48,000,000 | 50,700,000 | ||
| senior note, 144A, 7.75%, 3/15/24. | United States | 50,000,000 | 55,125,000 | ||
| U.S. Foods Inc., 8.50%, 6/30/19. | United States | 104,900,000 | 108,178,125 | ||
| 580,131,915 | |||||
| Energy 3.6% | |||||
| Anadarko Petroleum Corp., | |||||
| senior note, 6.375%, 9/15/17 | United States | 115,650,000 | 121,152,743 | ||
| senior note, 8.70%, 3/15/19 | United States | 69,533,000 | 77,757,155 | ||
| Antero Resources Corp., senior note, 5.375%, 11/01/21 | United States | 70,000,000 | 64,575,000 | ||
| Bill Barrett Corp., | |||||
| senior note, 7.625%, 10/01/19 | United States | 240,000,000 | 162,600,000 | ||
| senior note, 7.00%, 10/15/22 | United States | 147,351,000 | 88,410,600 | ||
| Calumet Specialty Products Partners LP/Calumet Finance Corp., senior | |||||
| note, 6.50%, 4/15/21 | United States | 33,100,000 | 23,666,500 | ||
| CGG SA, senior note, 6.875%, 1/15/22 | France | 22,200,000 | 9,102,000 | ||
| Chesapeake Energy Corp., | |||||
| f secured note, second lien, 144A, 8.00%, 12/15/22 | United States | 237,212,000 | 116,233,880 | ||
| senior note, 7.25%, 12/15/18 | United States | 119,000,000 | 65,450,000 | ||
| i senior note, FRN, 3.872%, 4/15/19 | United States | 50,000,000 | 19,625,000 | ||
| Denbury Resources Inc., | |||||
| senior bond, 6.375%, 8/15/21 | United States | 64,112,000 | 30,453,200 | ||
| senior note, 5.50%, 5/01/22 | United States | 151,000,000 | 67,950,000 | ||
| Energy Transfer Equity LP, | |||||
| senior secured bond, first lien, 5.875%, 1/15/24 | United States | 36,500,000 | 31,390,000 | ||
| senior secured bond, first lien, 5.50%, 6/01/27 | United States | 150,000,000 | 120,375,000 | ||
| f Energy XXI Gulf Coast Inc., senior secured note, second lien, 144A, | |||||
| 11.00%, 3/15/20 | United States | 400,000,000 | 58,000,000 | ||
| f EnQuest PLC, senior note, 144A, 7.00%, 4/15/22 | United Kingdom | 60,000,000 | 27,000,000 | ||
| Ferrellgas LP/Ferrellgas Finance Corp., | |||||
| senior note, 6.50%, 5/01/21 | United States | 48,000,000 | 42,840,000 | ||
| senior note, 6.75%, 1/15/22 | United States | 25,000,000 | 22,312,500 | ||
| f senior note, 144A, 6.75%, 6/15/23. | United States | 52,900,000 | 46,684,250 | ||
| f,g Goodrich Petroleum Corp., second lien, 144A, 8.00%, 3/15/18 | United States | 70,000 | j | 11,200,000 | |
| f,g Halcon Resources Corp., | |||||
| secured note, second lien, 144A, 8.625%, 2/01/20 | United States | 200,000,000 | 142,750,000 | ||
| senior secured note, third lien, 144A, 13.00%, 2/15/22 | United States | 460,000,000 | 139,150,000 | ||
| Kinder Morgan Inc., | |||||
| senior note, MTN, 7.75%, 1/15/32 | United States | 118,000,000 | 122,890,038 | ||
| f senior secured bond, first lien, 144A, 5.625%, 11/15/23 | United States | 120,000,000 | 121,971,240 | ||
franklintempleton.com
Semiannual Report 73
FRANKLIN CUSTODIAN FUNDS
STATEMENT OF INVESTMENTS (UNAUDITED)
| Franklin Income Fund (continued) | ||||
| Principal | ||||
| Country | Amount* | Value | ||
| Corporate Bonds (continued) | ||||
| Energy (continued) | ||||
| f,g,k Linn Energy LLC/Finance Corp., senior secured note, second lien, 144A, | ||||
| 12.00%, 12/15/20. | United States | 300,000,000 | $ | 42,750,000 |
| f McDermott International Inc., second lien, 144A, 8.00%, 5/01/21 | United States | 55,000,000 | 43,312,500 | |
| f NGPL PipeCo LLC, secured note, 144A, 7.119%, 12/15/17 | United States | 63,000,000 | 61,188,750 | |
| f PetroQuest Energy Inc., second lien, 144A, 10.00%, 2/15/21 | United States | 58,725,000 | 37,877,625 | |
| f Rex Energy Corp., second lien, 144A, 1.00% to 10/01/17, 8.00% | ||||
| thereafter, 10/01/20 | United States | 168,000,000 | 23,520,000 | |
| f Rockies Express Pipeline LLC, | ||||
| senior bond, 144A, 6.85%, 7/15/18 | United States | 35,207,000 | 35,295,017 | |
| senior bond, 144A, 5.625%, 4/15/20 | United States | 49,302,000 | 46,836,900 | |
| senior note, 144A, 6.00%, 1/15/19. | United States | 42,400,000 | 41,552,000 | |
| Sabine Pass Liquefaction LLC, | ||||
| first lien, 5.625%, 2/01/21 | United States | 10,000,000 | 9,662,500 | |
| first lien, 6.25%, 3/15/22. | United States | 75,000,000 | 73,875,000 | |
| first lien, 5.625%, 4/15/23 | United States | 149,450,000 | 143,098,375 | |
| senior secured note, first lien, 5.75%, 5/15/24 | United States | 75,000,000 | 72,000,000 | |
| Sanchez Energy Corp., | ||||
| senior note, 7.75%, 6/15/21 | United States | 155,000,000 | 89,900,000 | |
| senior note, 6.125%, 1/15/23 | United States | 118,000,000 | 64,310,000 | |
| Stone Energy Corp., senior bond, 7.50%, 11/15/22 | United States | 247,000,000 | 67,925,000 | |
| W&T Offshore Inc., senior note, 8.50%, 6/15/19 | United States | 329,515,000 | 39,541,800 | |
| Weatherford International Ltd., | ||||
| senior note, 9.625%, 3/01/19 | United States | 5,000,000 | 5,012,500 | |
| senior note, 5.125%, 9/15/20 | United States | 60,000,000 | 51,600,000 | |
| senior note, 4.50%, 4/15/22 | United States | 15,000,000 | 12,075,000 | |
| The Williams Cos. Inc., senior bond, 3.70%, 1/15/23 | United States | 60,700,000 | 45,676,750 | |
| 2,740,548,823 | ||||
| Financials 4.8% | ||||
| l Bank of America Corp., | ||||
| junior sub. bond, AA, 6.10% to 3/17/25, FRN thereafter, Perpetual. | United States | 80,000,000 | 78,900,000 | |
| junior sub. bond, M, 8.125% to 5/15/18, FRN thereafter, Perpetual | United States | 100,000,000 | 98,625,000 | |
| junior sub. bond, U, 5.20% to 6/01/23, FRN thereafter, Perpetual. | United States | 80,000,000 | 73,700,000 | |
| junior sub. bond, X, 6.25% to 9/05/24, FRN thereafter, Perpetual. | United States | 85,000,000 | 83,406,250 | |
| l Barclays PLC, sub. bond, 8.25% to 12/15/18, FRN thereafter, Perpetual | United Kingdom | 75,000,000 | 75,120,375 | |
| CIT Group Inc., senior bond, 5.00%, 8/01/23. | United States | 60,000,000 | 60,450,000 | |
| l Citigroup Inc., | ||||
| junior sub. bond, 5.35% to 5/15/23, FRN thereafter, Perpetual. | United States | 179,195,000 | 165,531,381 | |
| junior sub. bond, 5.90% to 2/15/23, FRN thereafter, Perpetual. | United States | 33,000,000 | 32,505,000 | |
| junior sub. bond, 5.95% to 1/30/23, FRN thereafter, Perpetual. | United States | 230,000,000 | 221,878,010 | |
| junior sub. bond, M, 6.30% to 5/15/24, FRN thereafter, Perpetual | United States | 250,000,000 | 240,433,250 | |
| junior sub. bond, O, 5.875% to 3/27/20, FRN thereafter, Perpetual | United States | 160,000,000 | 154,800,000 | |
| junior sub. bond, P, 5.95% to 5/15/25, FRN thereafter, Perpetual | United States | 25,000,000 | 24,093,750 | |
| junior sub. bond, Q, 5.95% to 8/15/20, FRN thereafter, Perpetual | United States | 120,000,000 | 115,065,000 | |
| Equinix Inc., senior bond, 5.875%, 1/15/26 | United States | 26,500,000 | 27,970,750 | |
| l Fifth Third Bancorp, junior sub. bond, 5.10% to 6/30/23, FRN thereafter, | ||||
| Perpetual | United States | 54,000,000 | 49,140,000 | |
| l The Goldman Sachs Group Inc., junior sub. note, 5.70% to 5/10/19, FRN | ||||
| thereafter, Perpetual | United States | 30,000,000 | 29,362,500 | |
| l HSBC Holdings PLC, junior sub. bond, 6.375% to 9/17/24, FRN thereafter, | ||||
| Perpetual | United Kingdom | 40,000,000 | 37,302,400 | |
| International Lease Finance Corp., senior note, 8.75%, 3/15/17 | United States | 45,000,000 | 47,515,500 | |
74 Semiannual Report
franklintempleton.com
FRANKLIN CUSTODIAN FUNDS
STATEMENT OF INVESTMENTS (UNAUDITED)
| Franklin Income Fund (continued) | ||||
| Principal | ||||
| Country | Amount* | Value | ||
| Corporate Bonds (continued) | ||||
| Financials (continued) | ||||
| Iron Mountain Inc., senior sub. bond, 5.75%, 8/15/24 | United States | 100,000,000 | $ | 103,000,000 |
| iStar Inc., senior note, 5.00%, 7/01/19 | United States | 115,000,000 | 110,975,000 | |
| l JPMorgan Chase & Co., | ||||
| junior sub. bond, 6.125% to 4/30/24, FRN thereafter, Perpetual | United States | 60,000,000 | 61,500,000 | |
| junior sub. bond, 6.75% to 2/01/24, FRN thereafter, Perpetual. | United States | 100,000,000 | 109,925,000 | |
| junior sub. bond, I, 7.90% to 4/30/19, FRN thereafter, Perpetual | United States | 750,000,000 | 750,937,500 | |
| junior sub. bond, Q, 5.15% to 5/01/23, FRN thereafter, Perpetual | United States | 100,000,000 | 96,270,000 | |
| junior sub. bond, R, 6.00% to 8/01/23, FRN thereafter, Perpetual | United States | 105,000,000 | 105,945,000 | |
| junior sub. bond, V, 5.00% to 7/30/19, FRN thereafter, Perpetual | United States | 200,000,000 | 191,250,000 | |
| junior sub. bond, X, 6.10% to 10/01/24, FRN thereafter, Perpetual | United States | 80,000,000 | 81,620,800 | |
| l MetLife Inc., junior sub. note, 5.25% to 6/15/20, FRN thereafter, Perpetual . | United States | 14,000,000 | 13,413,750 | |
| l Morgan Stanley, junior sub. bond, 5.55% to 7/15/20, FRN thereafter, | ||||
| Perpetual | United States | 58,000,000 | 57,246,000 | |
| Navient Corp., senior note, 6.125%, 3/25/24 | United States | 50,000,000 | 43,250,000 | |
| f OneMain Financial Holdings Inc., | ||||
| senior note, 144A, 6.75%, 12/15/19 | United States | 75,000,000 | 75,356,250 | |
| senior note, 144A, 7.25%, 12/15/21 | United States | 55,700,000 | 55,700,000 | |
| l PNC Financial Services Group Inc., junior sub. note, 4.85% to 6/01/23, | ||||
| FRN thereafter, Perpetual | United States | 54,000,000 | 51,097,500 | |
| l Wells Fargo & Co., junior sub. bond, S, 5.90% to 6/15/24, FRN thereafter, | ||||
| Perpetual | United States | 129,500,000 | 131,402,096 | |
| 3,654,688,062 | ||||
| Health Care 4.5% | ||||
| f AMAG Pharmaceuticals Inc., senior note, 144A, 7.875%, 9/01/23 | United States | 29,100,000 | 25,826,250 | |
| CHS/Community Health Systems Inc., | ||||
| senior note, 8.00%, 11/15/19 | United States | 525,000,000 | 513,843,750 | |
| senior note, 7.125%, 7/15/20 | United States | 235,000,000 | 223,250,000 | |
| senior note, 6.875%, 2/01/22 | United States | 310,000,000 | 281,325,000 | |
| f Concordia Healthcare Corp., senior note, 144A, 9.50%, 10/21/22 | Canada | 60,000,000 | 58,200,000 | |
| DaVita HealthCare Partners Inc., senior bond, 5.125%, 7/15/24 | United States | 81,000,000 | 81,961,875 | |
| f Endo Finance LLC, senior note, 144A, 5.75%, 1/15/22 | United States | 18,000,000 | 17,100,000 | |
| f Endo Finance LLC/Endo Ltd./Endo Finco Inc., | ||||
| senior bond, 144A, 6.00%, 2/01/25 | United States | 35,200,000 | 33,176,000 | |
| senior note, 144A, 6.00%, 7/15/23. | United States | 45,425,000 | 42,983,406 | |
| HCA Inc., | ||||
| senior bond, 5.875%, 5/01/23 | United States | 120,000,000 | 126,600,000 | |
| senior note, 7.50%, 2/15/22 | United States | 150,000,000 | 170,485,200 | |
| senior secured bond, first lien, 5.25%, 4/15/25 | United States | 20,000,000 | 20,650,000 | |
| senior secured note, first lien, 5.00%, 3/15/24 | United States | 134,800,000 | 138,254,250 | |
| f Jaguar Holding Co. II/Pharmaceutical Product Development LLC, senior | ||||
| note, 144A, 6.375%, 8/01/23 | United States | 81,765,000 | 84,160,714 | |
| Kindred Healthcare Inc., | ||||
| senior note, 8.00%, 1/15/20 | United States | 23,845,000 | 23,785,388 | |
| senior note, 8.75%, 1/15/23 | United States | 50,000,000 | 47,937,500 | |
| f Mallinckrodt International Finance SA/Mallinckrodt CB LLC, | ||||
| senior note, 144A, 4.875%, 4/15/20 | United States | 71,600,000 | 67,447,200 | |
| senior note, 144A, 5.75%, 8/01/22. | United States | 135,000,000 | 125,043,750 | |
| senior note, 144A, 5.625%, 10/15/23 | United States | 80,000,000 | 73,000,000 | |
| senior note, 144A, 5.50%, 4/15/25. | United States | 90,000,000 | 79,875,000 | |
franklintempleton.com
Semiannual Report 75
FRANKLIN CUSTODIAN FUNDS
STATEMENT OF INVESTMENTS (UNAUDITED)
| Franklin Income Fund (continued) | ||||
| Principal | ||||
| Country | Amount* | Value | ||
| Corporate Bonds (continued) | ||||
| Health Care (continued) | ||||
| Tenet Healthcare Corp., | ||||
| 4.375%, 10/01/21 | United States | 140,000,000 | $ | 141,050,000 |
| senior note, 5.00%, 3/01/19 | United States | 15,000,000 | 14,906,250 | |
| senior note, 8.00%, 8/01/20 | United States | 83,703,000 | 86,527,976 | |
| senior note, 8.125%, 4/01/22 | United States | 345,000,000 | 355,663,950 | |
| senior note, 6.75%, 6/15/23 | United States | 274,700,000 | 264,398,750 | |
| f Valeant Pharmaceuticals International, senior note, 144A, 6.375%, | ||||
| 10/15/20 | United States | 100,000,000 | 83,500,000 | |
| f Valeant Pharmaceuticals International Inc., | ||||
| senior bond, 144A, 6.125%, 4/15/25 | United States | 72,400,000 | 55,929,000 | |
| senior note, 144A, 5.375%, 3/15/20 | United States | 125,000,000 | 102,500,000 | |
| senior note, 144A, 5.875%, 5/15/23 | United States | 83,500,000 | 65,860,625 | |
| 3,405,241,834 | ||||
| Industrials 2.6% | ||||
| The ADT Corp., | ||||
| hsenior bond, 4.125%, 6/15/23 | United States | 24,700,000 | 21,612,500 | |
| senior note, 3.50%, 7/15/22 | United States | 68,000,000 | 59,160,000 | |
| f Ahern Rentals Inc., secured note, second lien, 144A, 7.375%, 5/15/23. | United States | 50,000,000 | 34,750,000 | |
| f Algeco Scotsman Global Finance PLC, senior secured note, first lien, | ||||
| 144A, 8.50%, 10/15/18 | United Kingdom | 68,900,000 | 52,418,087 | |
| f Bombardier Inc., | ||||
| 144A, 5.50%, 9/15/18 | Canada | 27,000,000 | 24,975,000 | |
| senior bond, 144A, 6.125%, 1/15/23 | Canada | 81,300,000 | 61,991,250 | |
| senior bond, 144A, 7.50%, 3/15/25 | Canada | 50,100,000 | 38,326,500 | |
| senior note, 144A, 6.00%, 10/15/22 | Canada | 35,000,000 | 26,281,500 | |
| c,f CEVA Group PLC, senior note, first lien, 144A, 4.00%, 5/01/18 | United Kingdom | 164,778,982 | 142,533,819 | |
| l General Electric Co., junior sub. bond, 5.00% to 1/21/21, FRN thereafter, | ||||
| Perpetual | United States | 90,153,000 | 92,970,281 | |
| Hertz Corp., | ||||
| senior bond, 7.375%, 1/15/21 | United States | 24,000,000 | 24,600,000 | |
| senior note, 7.50%, 10/15/18 | United States | 40,000,000 | 40,740,000 | |
| senior note, 6.75%, 4/15/19 | United States | 190,000,000 | 193,228,100 | |
| Navistar International Corp., senior bond, 8.25%, 11/01/21 | United States | 90,000,000 | 67,050,000 | |
| f Stena International SA, secured bond, 144A, 5.75%, 3/01/24 | Sweden | 60,650,000 | 50,036,250 | |
| TransDigm Inc., | ||||
| senior sub. bond, 6.50%, 7/15/24 | United States | 100,000,000 | 99,720,000 | |
| senior sub. note, 5.50%, 10/15/20 | United States | 44,500,000 | 44,856,000 | |
| senior sub. note, 6.00%, 7/15/22 | United States | 94,800,000 | 94,918,500 | |
| United Rentals North America Inc., | ||||
| senior bond, 6.125%, 6/15/23 | United States | 120,000,000 | 124,500,000 | |
| senior bond, 5.75%, 11/15/24 | United States | 121,700,000 | 122,308,500 | |
| senior note, 7.625%, 4/15/22 | United States | 17,000,000 | 18,190,000 | |
| f XPO Logistics Inc., | ||||
| senior note, 144A, 7.875%, 9/01/19 | United States | 200,000,000 | 208,000,000 | |
| senior note, 144A, 6.50%, 6/15/22. | United States | 335,000,000 | 327,043,750 | |
| 1,970,210,037 | ||||
| Information Technology 2.6% | ||||
| f Belden Inc., senior sub. note, 144A, 5.50%, 9/01/22. | United States | 40,000,000 | 40,400,000 | |
| f BMC Software Finance Inc., senior note, 144A, 8.125%, 7/15/21. | United States | 130,805,000 | 94,833,625 | |
| f,m Boxer Parent Co. Inc., senior note, 144A, PIK, 9.00%, 10/15/19 | United States | 55,000,000 | 38,225,000 | |
76 Semiannual Report
franklintempleton.com
FRANKLIN CUSTODIAN FUNDS
STATEMENT OF INVESTMENTS (UNAUDITED)
| Franklin Income Fund (continued) | ||||
| Principal | ||||
| Country | Amount* | Value | ||
| Corporate Bonds (continued) | ||||
| Information Technology (continued) | ||||
| f CommScope Inc., | ||||
| senior bond, 144A, 5.50%, 6/15/24 | United States | 100,000,000 | $ | 101,375,000 |
| senior note, 144A, 5.00%, 6/15/21. | United States | 75,000,000 | 75,843,750 | |
| f CommScope Technologies Finance LLC, senior bond, 144A, 6.00%, | ||||
| 6/15/25 | United States | 84,200,000 | 85,884,000 | |
| f First Data Corp., | ||||
| second lien, 144A, 5.75%, 1/15/24 | United States | 70,000,000 | 70,255,500 | |
| secured note, first lien, 144A, 5.00%, 1/15/24 | United States | 50,000,000 | 50,250,000 | |
| senior note, 144A, 7.00%, 12/01/23 | United States | 315,000,000 | 319,331,250 | |
| senior secured note, first lien, 144A, 5.375%, 8/15/23 | United States | 75,000,000 | 77,156,250 | |
| f Freescale Semiconductor Inc., | ||||
| secured note, 144A, 5.00%, 5/15/21 | United States | 59,450,000 | 61,828,000 | |
| senior secured note, 144A, 6.00%, 1/15/22 | United States | 118,850,000 | 126,278,125 | |
| Infor (U.S.) Inc., senior note, 6.50%, 5/15/22 | United States | 52,500,000 | 48,037,500 | |
| f,m Infor Software Parent LLC/Inc., senior note, 144A, PIK, 7.125%, 5/01/21 | United States | 24,650,000 | 18,549,125 | |
| f Inmarsat Finance PLC, senior note, 144A, 4.875%, 5/15/22 | United Kingdom | 27,000,000 | 25,599,240 | |
| f Match Group Inc., senior note, 144A, 6.75%, 12/15/22 | United States | 45,000,000 | 45,843,750 | |
| f Microsemi Corp., senior note, 144A, 9.125%, 4/15/23 | United States | 65,600,000 | 72,324,000 | |
| NCR Corp., | ||||
| senior note, 4.625%, 2/15/21 | United States | 33,858,000 | 33,815,678 | |
| senior note, 5.00%, 7/15/22 | United States | 60,000,000 | 59,700,000 | |
| senior note, 6.375%, 12/15/23 | United States | 45,000,000 | 46,575,000 | |
| f Qorvo Inc., senior note, 144A, 6.75%, 12/01/23 | United States | 50,000,000 | 51,750,000 | |
| f Vizient Inc., senior note, 144A, 10.375%, 3/01/24 | United States | 45,000,000 | 48,262,500 | |
| f,n Western Digital Corp., | ||||
| senior note, 144A, 10.50%, 4/01/24 | United States | 250,000,000 | 250,781,250 | |
| senior secured note, 144A, 7.375%, 4/01/23. | United States | 100,000,000 | 102,250,000 | |
| 1,945,148,543 | ||||
| Materials 2.9% | ||||
| f Ardagh Packaging Finance PLC, senior note, 144A, 9.125%, 10/15/20 | Luxembourg | 75,000,000 | 77,625,000 | |
| f Ardagh Packaging Finance PLC/Ardagh MP Holdings USA Inc., | ||||
| senior note, 144A, 6.25%, 1/31/19. | Luxembourg | 37,300,000 | 37,090,188 | |
| senior note, 144A, 6.00%, 6/30/21. | Luxembourg | 45,000,000 | 42,975,000 | |
| Ball Corp., senior bond, 4.00%, 11/15/23 | United States | 100,000,000 | 98,875,000 | |
| f BWAY Holding Co., senior note, 144A, 9.125%, 8/15/21 | United States | 55,000,000 | 49,362,500 | |
| f Cemex Finance LLC, senior secured note, first lien, 144A, 6.00%, 4/01/24 . | Mexico | 88,400,000 | 83,646,290 | |
| f Cemex SAB de CV, | ||||
| first lien, 144A, 5.70%, 1/11/25 | Mexico | 80,000,000 | 73,840,800 | |
| secured note, 144A, 7.25%, 1/15/21 | Mexico | 111,000,000 | 115,363,965 | |
| senior secured bond, 144A, 7.75%, 4/16/26 | Mexico | 75,100,000 | 77,055,979 | |
| f The Chemours Co., senior note, 144A, 6.625%, 5/15/23. | United States | 99,900,000 | 81,918,000 | |
| f Consolidated Minerals Ltd., senior secured note, 144A, 8.00%, 5/15/20 | Jersey Islands | 17,700,000 | 6,106,500 | |
| Crown Americas LLC/Crown Americas Capital Corp. IV, senior bond, | ||||
| 4.50%, 1/15/23 | United States | 115,000,000 | 117,875,000 | |
| f First Quantum Minerals Ltd., | ||||
| senior note, 144A, 6.75%, 2/15/20. | Canada | 50,000,000 | 34,500,000 | |
| senior note, 144A, 7.00%, 2/15/21. | Canada | 10,000,000 | 6,750,000 | |
| f FMG Resources (August 2006) Pty. Ltd., | ||||
| senior note, 144A, 8.25%, 11/01/19 | Australia | 82,000,000 | 78,720,000 | |
| senior secured note, 144A, 9.75%, 3/01/22 | Australia | 500,000,000 | 497,000,000 | |
| HudBay Minerals Inc., senior note, 9.50%, 10/01/20 | Canada | 24,100,000 | 17,231,500 | |
franklintempleton.com
Semiannual Report 77
FRANKLIN CUSTODIAN FUNDS
STATEMENT OF INVESTMENTS (UNAUDITED)
| Franklin Income Fund (continued) | |||||
| Principal | |||||
| Country | Amount* | Value | |||
| Corporate Bonds (continued) | |||||
| Materials (continued) | |||||
| f Kerling PLC, senior secured note, 144A, 10.625%, 2/01/17. | United Kingdom | 53,700,000 | EUR | $ | 61,515,526 |
| f Owens-Brockway Glass Container Inc., senior note, 144A, 5.875%, | |||||
| 8/15/23 | United States | 47,500,000 | 49,578,125 | ||
| f Platform Specialty Products Corp., senior note, 144A, 6.50%, 2/01/22 | United States | 45,000,000 | 38,193,750 | ||
| Reynolds Group Issuer Inc./LLC/SA, | |||||
| first lien, 5.75%, 10/15/20 | United States | 61,800,000 | 63,576,750 | ||
| senior note, 8.50%, 5/15/18 | United States | 127,900,000 | 128,059,875 | ||
| senior note, 9.00%, 4/15/19 | United States | 105,100,000 | 106,676,500 | ||
| senior note, 9.875%, 8/15/19 | United States | 132,000,000 | 136,702,500 | ||
| senior secured note, 7.875%, 8/15/19 | United States | 30,000,000 | 31,087,500 | ||
| senior secured note, first lien, 6.875%, 2/15/21 | United States | 25,600,000 | 26,512,000 | ||
| f Sealed Air Corp., senior bond, 144A, 5.25%, 4/01/23 | United States | 48,000,000 | 51,000,000 | ||
| 2,188,838,248 | |||||
| Telecommunication Services 3.6% | |||||
| CenturyLink Inc., | |||||
| senior note, 5.80%, 3/15/22 | United States | 68,000,000 | 65,677,800 | ||
| senior note, 7.50%, 4/01/24 | United States | 36,600,000 | 36,737,250 | ||
| Consolidated Communications Inc., senior note, 6.50%, 10/01/22 | United States | 100,000,000 | 87,750,000 | ||
| f Digicel Ltd., senior note, 144A, 6.75%, 3/01/23 | Bermuda | 73,300,000 | 65,405,223 | ||
| Frontier Communications Corp., | |||||
| senior bond, 8.75%, 4/15/22 | United States | 43,900,000 | 42,912,250 | ||
| senior bond, 7.625%, 4/15/24 | United States | 24,900,000 | 22,223,250 | ||
| senior note, 9.25%, 7/01/21 | United States | 63,600,000 | 65,110,500 | ||
| senior note, 7.125%, 1/15/23 | United States | 115,850,000 | 103,106,500 | ||
| f senior note, 144A, 10.50%, 9/15/22 | United States | 20,000,000 | 20,575,000 | ||
| f senior note, 144A, 11.00%, 9/15/25 | United States | 50,000,000 | 50,437,500 | ||
| Intelsat Jackson Holdings SA, senior bond, 5.50%, 8/01/23 | Luxembourg | 165,000,000 | 99,961,125 | ||
| f Neptune Finco Corp., | |||||
| senior bond, 144A, 10.875%, 10/15/25 | United States | 26,000,000 | 28,405,000 | ||
| senior note, 144A, 10.125%, 1/15/23 | United States | 75,000,000 | 80,343,750 | ||
| Sprint Capital Corp., | |||||
| senior bond, 6.875%, 11/15/28 | United States | 126,000,000 | 92,610,000 | ||
| senior note, 6.90%, 5/01/19 | United States | 100,000,000 | 87,000,000 | ||
| Sprint Communications Inc., | |||||
| 11.50%, 11/15/21 | United States | 200,000,000 | 179,000,000 | ||
| senior note, 8.375%, 8/15/17 | United States | 135,000,000 | 133,818,750 | ||
| senior note, 7.00%, 8/15/20 | United States | 72,500,000 | 58,000,000 | ||
| senior note, 6.00%, 11/15/22 | United States | 185,000,000 | 136,206,250 | ||
| f senior note, 144A, 9.00%, 11/15/18 | United States | 70,000,000 | 73,675,000 | ||
| Sprint Corp., | |||||
| senior bond, 7.875%, 9/15/23 | United States | 187,350,000 | 143,791,125 | ||
| senior bond, 7.125%, 6/15/24 | United States | 240,650,000 | 179,885,875 | ||
| senior note, 7.625%, 2/15/25 | United States | 100,000,000 | 74,750,000 | ||
| f Telecom Italia SpA, senior note, 144A, 5.303%, 5/30/24 | Italy | 55,000,000 | 56,775,125 | ||
| T-Mobile USA Inc., | |||||
| senior bond, 6.625%, 4/01/23 | United States | 50,000,000 | 52,875,000 | ||
| senior note, 6.25%, 4/01/21 | United States | 100,000,000 | 105,480,000 | ||
| senior note, 6.633%, 4/28/21 | United States | 100,000,000 | 105,000,000 | ||
| senior note, 6.731%, 4/28/22 | United States | 50,000,000 | 52,490,000 | ||
| senior note, 6.00%, 3/01/23 | United States | 30,000,000 | 30,900,000 | ||
| senior note, 6.836%, 4/28/23 | United States | 17,000,000 | 17,850,000 | ||
78 Semiannual Report
franklintempleton.com
FRANKLIN CUSTODIAN FUNDS
STATEMENT OF INVESTMENTS (UNAUDITED)
| Franklin Income Fund (continued) | |||||
| Principal | |||||
| Country | Amount* | Value | |||
| Corporate Bonds (continued) | |||||
| Telecommunication Services (continued) | |||||
| T-Mobile USA Inc., (continued) | |||||
| senior note, 6.00%, 4/15/24 | United States | 42,250,000 | $ | 42,883,750 | |
| f Wind Acquisition Finance SA, senior note, 144A, 7.375%, 4/23/21 | Italy | 270,000,000 | 247,725,000 | ||
| Zayo Group LLC/Zayo Capital Inc., senior note, 6.00%, 4/01/23 | United States | 80,000,000 | 80,249,600 | ||
| 2,719,610,623 | |||||
| Utilities 2.1% | |||||
| The AES Corp., | |||||
| senior bond, 4.875%, 5/15/23 | United States | 110,000,000 | 106,425,000 | ||
| senior bond, 5.50%, 3/15/24 | United States | 50,000,000 | 49,125,000 | ||
| Calpine Corp., | |||||
| senior bond, 5.75%, 1/15/25 | United States | 285,000,000 | 274,668,750 | ||
| senior note, 5.375%, 1/15/23 | United States | 260,000,000 | 253,338,800 | ||
| Dynegy Inc., | |||||
| senior note, 6.75%, 11/01/19 | United States | 440,000,000 | 440,000,000 | ||
| senior note, 7.375%, 11/01/22 | United States | 260,000,000 | 241,800,000 | ||
| senior note, 5.875%, 6/01/23 | United States | 115,000,000 | 96,600,000 | ||
| f InterGen NV, | |||||
| secured bond, 144A, 7.00%, 6/30/23 | Netherlands | 143,700,000 | 98,793,750 | ||
| secured note, 144A, 7.50%, 6/30/21 | Netherlands | 35,800,000 | GBP | 42,981,965 | |
| NGL Energy Partners LP/NGL Energy Finance Corp., senior note, | |||||
| 6.875%, 10/15/21. | United States | 30,000,000 | 17,850,000 | ||
| 1,621,583,265 | |||||
| Total Corporate Bonds (Cost $27,100,407,158) | 24,759,380,498 | ||||
| o Senior Floating Rate Interests 4.0% | |||||
| Consumer Discretionary 1.5% | |||||
| 24 Hour Fitness Worldwide Inc., Term Loan, 4.75%, 5/28/21 | United States | 29,475,000 | 28,664,437 | ||
| Academy Ltd., Initial Term Loan, 5.00%, 7/02/22 | United States | 93,770,548 | 89,584,349 | ||
| Altice Financing SA, Loans, 5.50%, 7/02/19 | Luxembourg | 48,875,000 | 49,064,391 | ||
| Belk Inc., Closing Date Term Loan, 5.75%, 12/12/22 | United States | 250,000,000 | 221,458,250 | ||
| g iHeartCommunications Inc., | |||||
| Tranche D Term Loan, 7.183%, 1/30/19 | United States | 687,373,595 | 472,426,373 | ||
| Tranche E Term Loan, 7.933%, 7/30/19 | United States | 200,744,256 | 138,362,979 | ||
| Neiman Marcus Group Ltd. Inc., Term Loan, 4.25%, 10/25/20 | United States | 71,816,794 | 65,971,697 | ||
| Petco Animal Supplies Inc., Tranche B-1 Term Loans, 5.75%, 1/26/23 | United States | 75,000,000 | 74,929,725 | ||
| TOMS Shoes LLC, Term Loan B, 6.50%, 10/30/20 | United States | 24,750,000 | 15,963,750 | ||
| 1,156,425,951 | |||||
| Consumer Staples 0.1% | |||||
| U.S. Foods Inc., Term Loan, 4.50%, 3/31/19 | United States | 97,250,000 | 96,928,686 | ||
| Energy 0.3% | |||||
| Callon Petroleum Co., Second Lien Term Loan, 8.50%, 10/08/21. | United States | 54,500,000 | 53,410,000 | ||
| McDermott Finance LLC, Term Loan, 5.25%, 4/16/19. | United States | 12,716,740 | 11,953,736 | ||
| NGPL PipeCo LLC, Term Loan, 6.75%, 9/15/17 | United States | 116,594,486 | 112,805,165 | ||
| W&T Offshore Inc., Second Lien Term Loan, 9.00%, 5/15/20 | United States | 151,850,000 | 80,346,872 | ||
| 258,515,773 | |||||
| Financials 0.2% | |||||
| First Eagle Investment Management, Initial Term Loans, 4.75%, 12/01/22 . | United States | 149,625,000 | 147,754,687 | ||
franklintempleton.com
Semiannual Report 79
FRANKLIN CUSTODIAN FUNDS
STATEMENT OF INVESTMENTS (UNAUDITED)
| Franklin Income Fund (continued) | ||||
| Principal | ||||
| Country | Amount* | Value | ||
| o Senior Floating Rate Interests (continued) | ||||
| Health Care 0.3% | ||||
| Concordia Healthcare Corp., Initial Dollar Term Loan, 5.25%, 10/21/21 | United States | 44,887,500 | $ | 43,877,531 |
| Lannett Co. Inc., Initial Tranche B Term Loans, 6.375%, 11/25/22 | United States | 64,187,500 | 60,175,781 | |
| Pharmaceutical Product Development LLC/Jaguar, Initial Term Loan, | ||||
| 4.25%, 8/18/22 | United States | 29,775,000 | 29,551,688 | |
| US Renal Care Inc., Initial Term Loan, 5.25%, 12/31/22 | United States | 59,850,000 | 59,775,187 | |
| 193,380,187 | ||||
| Industrials 0.5% | ||||
| c CEVA Group PLC, Pre-Funded L/C, 6.50%, 3/19/21 | United States | 20,320,197 | 16,950,438 | |
| CEVA Intercompany BV, Dutch BV Term Loan, 6.50%, 3/19/21 | Netherlands | 21,000,000 | 17,517,507 | |
| g CEVA Logistics Canada ULC, Canadian Term Loan, 6.50%, 3/19/21 | Canada | 3,620,690 | 3,020,260 | |
| g CEVA Logistics U.S. Holdings Inc., U.S. Term Loan, 6.50%, 3/19/21. | United States | 28,965,517 | 24,162,079 | |
| Commercial Barge Line Co., Initial Term Loan, 9.75%, 11/12/20 | United States | 140,000,000 | 126,350,000 | |
| Navistar Inc., Tranche B Term Loans, 6.50%, 8/07/20. | United States | 36,499,300 | 33,427,263 | |
| XPO Logistics Inc., First Lien Term Loan, 5.50%, 10/29/21 | United States | 190,000,000 | 191,068,750 | |
| 412,496,297 | ||||
| Information Technology 0.8% | ||||
| Avago Technologies Cayman Finance Ltd., Term B-1 Dollar Loans, 4.25%, | ||||
| 2/01/23 | United States | 85,000,000 | 84,687,115 | |
| BMC Software Finance Inc., Initial U.S. Term Loans, 5.00%, 9/10/20 | United States | 59,370,263 | 49,722,595 | |
| Microsemi Corp., Term B Loan, 5.25%, 1/15/23 | United States | 60,220,588 | 60,574,384 | |
| n ON Semiconductor Corp., Term Loan, 7.00%, 3/31/23 | United States | 75,000,000 | 75,262,500 | |
| Vizient Inc., Initial Term Loan, 6.25%, 2/10/23 | United States | 200,000,000 | 201,583,400 | |
| Western Digital Corp., Term Loan B, 8.00%, 3/16/23 | United States | 100,000,000 | 98,937,500 | |
| 570,767,494 | ||||
| Materials 0.2% | ||||
| n FMG America Finance Inc. (Fortescue Metals Group), Loans, 4.25%, | ||||
| 6/30/19 | Australia | 143,567,890 | 121,673,786 | |
| Utilities 0.1% | ||||
| Intergen NV, Term Advance, 5.50%, 6/13/20 | Netherlands | 43,750,313 | 39,047,155 | |
| Total Senior Floating Rate Interests | ||||
| (Cost $3,297,816,030) | 2,996,990,016 | |||
| Shares | ||||
| Escrows and Litigation Trusts 0.0% | ||||
| a,d Motors Liquidation Co., Escrow Account. | United States | 400,000,000 | — | |
| a,d Motors Liquidation Co., Escrow Account, cvt. pfd., C | United States | 11,000,000 | — | |
| Total Escrows and Litigation Trusts | ||||
| (Cost $2,416,248) | — | |||
| Total Investments before Short Term Investments | ||||
| (Cost $75,579,403,921) | 73,811,632,811 | |||
| Principal | ||||
| Amount* | ||||
| Short Term Investments 2.7% | ||||
| Corporate Bonds (Cost $88,922,542) 0.1% | ||||
| Sabine Pass LNG LP, senior secured note, first lien, 7.50%, 11/30/16 | United States | 90,000,000 | 92,666,250 | |
80 Semiannual Report
franklintempleton.com
FRANKLIN CUSTODIAN FUNDS
STATEMENT OF INVESTMENTS (UNAUDITED)
| Franklin Income Fund (continued) | ||||||
| Principal | ||||||
| Country | Amount* | Value | ||||
| U.S. Government and Agency Securities | ||||||
| (Cost $347,672,350) 0.5% | ||||||
| p FHLB, 4/13/16 | United States | 347,700,000 | $ | 347,676,704 | ||
| Total Investments before Money Market Funds and | ||||||
| Repurchase Agreement | ||||||
| (Cost $76,015,998,813) | 74,251,975,765 | |||||
| Shares | ||||||
| Money Market Funds (Cost $1,558,487,674) 2.1% | ||||||
| a,q Institutional Fiduciary Trust Money Market Portfolio | United States | 1,558,487,674 | 1,558,487,674 | |||
| r Investments from Cash Collateral Received for Loaned | ||||||
| Securities 0.0%† | ||||||
| Money Market Funds 0.0%† | ||||||
| a,q Institutional Fiduciary Trust Money Market Portfolio | United States | 18,447,000 | 18,447,000 | |||
| Principal | ||||||
| Amount* | ||||||
| Repurchase Agreement 0.0%† | ||||||
| s Joint Repurchase Agreement, 0.30%, 4/01/16 (Maturity Value $4,951,411) | ||||||
| BNP Paribas Securities Corp. | ||||||
| Collateralized by pU.S. Treasury Bill, 2/02/17; U.S. Treasury Bonds, | ||||||
| 7.25% - 8.75%, 5/15/16 - 5/15/17; U.S. Treasury Notes, 0.50% - | ||||||
| 4.75%, 9/30/16 - 12/31/20; U.S. Treasury Notes, Index Linked, | ||||||
| 0.125% - 2.625%, 7/15/16 - 7/15/17; U.S. Treasury Strips, 8/15/16 - | ||||||
| 11/15/20 (valued at $5,050,398) | United States | 4,951,370 | 4,951,370 | |||
| Total Investments from Cash Collateral Received for | ||||||
| Loaned Securities (Cost $23,398,370) | 23,398,370 | |||||
| Total Investments (Cost $77,597,884,857) 100.1% | 75,833,861,809 | |||||
| Other Assets, less Liabilities (0.1)% | (63,809,634 | ) | ||||
| Net Assets 100.0% | $ | 75,770,052,175 | ||||
franklintempleton.com
Semiannual Report 81
FRANKLIN CUSTODIAN FUNDS
STATEMENT OF INVESTMENTS (UNAUDITED)
Franklin Income Fund (continued)
See Abbreviations on page 128.
†Rounds to less than 0.1% of net assets.
*The principal amount is stated in U.S. dollars unless otherwise indicated.
aNon-income producing.
bSee Note 8 regarding restricted securities.
cSee Note 11 regarding holdings of 5% voting securities.
dSecurity has been deemed illiquid because it may not be able to be sold within seven days. At March 31, 2016, the aggregate value of these securities was $82,295,512.
eSee Note 1(f) regarding equity-linked securities.
fSecurity was purchased pursuant to Rule 144A under the Securities Act of 1933 and may be sold in transactions exempt from registration only to qualified institutional buyers
or in a public offering registered under the Securities Act of 1933. These securities have been deemed liquid under guidelines approved by the Trust’s Board of Trustees. At
March 31, 2016, the aggregate value of these securities was $18,966,785,687, representing 25.03% of net assets.
gAt March 31, 2016, pursuant to the Fund’s policies and the requirements of applicable securities law, the Fund is restricted from trading these securities at period end.
hA portion or all of the security is on loan at March 31, 2016. See Note 1(g).
iThe coupon rate shown represents the rate at period end.
jPrincipal amount is stated in 1,000 Units.
kSee Note 7 regarding defaulted securities.
lPerpetual security with no stated maturity date.
mIncome may be received in additional securities and/or cash.
nA portion or all of the security purchased on a when-issued or delayed delivery basis. See Note 1(d).
oSee Note 1(i) regarding senior floating rate interests.
pThe security is traded on a discount basis with no stated coupon rate.
qSee Note 3(f) regarding investments in affiliated management investment companies.
rSee Note 1(g) regarding securities on loan.
sSee Note 1(c) regarding joint repurchase agreement.
82 Semiannual Report | The accompanying notes are an integral part of these financial statements. franklintempleton.com
FRANKLIN CUSTODIAN FUNDS
| Financial Highlights | ||||||||||||||||||
| Franklin U.S. Government Securities Fund | ||||||||||||||||||
| Six Months Ended | ||||||||||||||||||
| March 31, 2016 | Year Ended September 30, | |||||||||||||||||
| (unaudited) | 2015 | 2014 | 2013 | 2012 | 2011 | |||||||||||||
| Class A | ||||||||||||||||||
| Per share operating performance | ||||||||||||||||||
| (for a share outstanding throughout the period) | ||||||||||||||||||
| Net asset value, beginning of period | $ | 6.40 | $ | 6.48 | $ | 6.53 | $ | 6.91 | $ | 6.92 | $ | 6.81 | ||||||
| Income from investment operationsa: | ||||||||||||||||||
| Net investment incomeb | 0.08 | 0.15 | 0.17 | 0.15 | 0.20 | 0.24 | ||||||||||||
| Net realized and unrealized gains (losses) | (0.01 | ) | (0.02 | ) | 0.01 | (0.29 | ) | 0.04 | 0.15 | |||||||||
| Total from investment operations | 0.07 | 0.13 | 0.18 | (0.14 | ) | 0.24 | 0.39 | |||||||||||
| Less distributions from net investment income . | (0.10 | ) | (0.21 | ) | (0.23 | ) | (0.24 | ) | (0.25 | ) | (0.28 | ) | ||||||
| Net asset value, end of period | $ | 6.37 | $ | 6.40 | $ | 6.48 | $ | 6.53 | $ | 6.91 | $ | 6.92 | ||||||
| Total returnc | 1.13 | % | 2.07 | % | 2.80 | % | (2.03 | )% | 3.49 | % | 5.93 | % | ||||||
| Ratios to average net assetsd | ||||||||||||||||||
| Expenses. | 0.76 | %e | 0.76 | %e | 0.75 | %e | 0.73 | % | 0.73 | % | 0.72 | % | ||||||
| Net investment income | 2.35 | % | 2.28 | % | 2.62 | % | 2.17 | % | 2.86 | % | 3.55 | % | ||||||
| Supplemental data | ||||||||||||||||||
| Net assets, end of period (000’s) | $ | 4,276,379 | $ | 4,167,639 | $ | 4,323,990 | $ | 5,138,613 | $ | 6,861,193 | $ | 6,423,821 | ||||||
| Portfolio turnover rate | 38.00 | % | 69.10 | % | 69.73 | % | 46.16 | % | 40.15 | % | 20.23 | % | ||||||
| Portfolio turnover rate excluding mortgage | ||||||||||||||||||
| dollar rollsf | 38.00 | % | 58.70 | % | 38.79 | % | 40.83 | % | 40.15 | % | 20.23 | % | ||||||
aThe amount shown for a share outstanding throughout the period may not correlate with the Statement of Operations for the period due to the timing of sales and
repurchases of the Fund’s shares in relation to income earned and/or fluctuating fair value of the investments of the Fund.
bBased on average daily shares outstanding.
cTotal return does not reflect sales commissions or contingent deferred sales charges, if applicable, and is not annualized for periods less than one year.
dRatios are annualized for periods less than one year.
eBenefit of waiver and payments by affiliates and expense reduction rounds to less than 0.01%.
fSee Note 1(h) regarding mortgage dollar rolls.
franklintempleton.com The accompanying notes are an integral part of these financial statements. | Semiannual Report 83
| FRANKLIN CUSTODIAN FUNDS | ||||||||||||||||||
| FINANCIAL HIGHLIGHTS | ||||||||||||||||||
| Franklin U.S. Government Securities Fund (continued) | ||||||||||||||||||
| Six Months Ended | ||||||||||||||||||
| March 31, 2016 | Year Ended September 30, | |||||||||||||||||
| (unaudited) | 2015 | 2014 | 2013 | 2012 | 2011 | |||||||||||||
| Class C | ||||||||||||||||||
| Per share operating performance | ||||||||||||||||||
| (for a share outstanding throughout the period) | ||||||||||||||||||
| Net asset value, beginning of period | $ | 6.36 | $ | 6.44 | $ | 6.49 | $ | 6.86 | $ | 6.88 | $ | 6.77 | ||||||
| Income from investment operationsa: | ||||||||||||||||||
| Net investment incomeb | 0.06 | 0.11 | 0.14 | 0.11 | 0.16 | 0.21 | ||||||||||||
| Net realized and unrealized gains (losses) | (—)c | (0.01 | ) | 0.01 | (0.28 | ) | 0.03 | 0.15 | ||||||||||
| Total from investment operations | 0.06 | 0.10 | 0.15 | (0.17 | ) | 0.19 | 0.36 | |||||||||||
| Less distributions from net investment income . | (0.09 | ) | (0.18 | ) | (0.20 | ) | (0.20 | ) | (0.21 | ) | (0.25 | ) | ||||||
| Net asset value, end of period | $ | 6.33 | $ | 6.36 | $ | 6.44 | $ | 6.49 | $ | 6.86 | $ | 6.88 | ||||||
| Total returnd | 0.88 | % | 1.57 | % | 2.30 | % | (2.45 | )% | 2.85 | % | 5.44 | % | ||||||
| Ratios to average net assetse | ||||||||||||||||||
| Expenses. | 1.26 | %f | 1.26 | %f | 1.25 | %f | 1.23 | % | 1.23 | % | 1.23 | % | ||||||
| Net investment income | 1.85 | % | 1.78 | % | 2.12 | % | 1.67 | % | 2.36 | % | 3.04 | % | ||||||
| Supplemental data | ||||||||||||||||||
| Net assets, end of period (000’s) | $ | 1,052,120 | $ | 1,040,294 | $ | 1,190,720 | $ | 1,640,787 | $ | 2,981,724 | $ | 2,294,707 | ||||||
| Portfolio turnover rate | 38.00 | % | 69.10 | % | 69.73 | % | 46.16 | % | 40.15 | % | 20.23 | % | ||||||
| Portfolio turnover rate excluding mortgage | ||||||||||||||||||
| dollar rollsg | 38.00 | % | 58.70 | % | 38.79 | % | 40.83 | % | 40.15 | % | 20.23 | % | ||||||
aThe amount shown for a share outstanding throughout the period may not correlate with the Statement of Operations for the period due to the timing of sales and
repurchases of the Fund’s shares in relation to income earned and/or fluctuating fair value of the investments of the Fund.
bBased on average daily shares outstanding.
cAmount rounds to less than $0.01 per share.
dTotal return does not reflect sales commissions or contingent deferred sales charges, if applicable, and is not annualized for periods less than one year.
eRatios are annualized for periods less than one year.
fBenefit of waiver and payments by affiliates and expense reduction rounds to less than 0.01%.
gSee Note 1(h) regarding mortgage dollar rolls.
84 Semiannual Report | The accompanying notes are an integral part of these financial statements. franklintempleton.com
| FRANKLIN CUSTODIAN FUNDS | ||||||||||||||||||
| FINANCIAL HIGHLIGHTS | ||||||||||||||||||
| Franklin U.S. Government Securities Fund (continued) | ||||||||||||||||||
| Six Months Ended | ||||||||||||||||||
| March 31, 2016 | Year Ended September 30, | |||||||||||||||||
| (unaudited) | 2015 | 2014 | 2013 | 2012 | 2011 | |||||||||||||
| Class R | ||||||||||||||||||
| Per share operating performance | ||||||||||||||||||
| (for a share outstanding throughout the period) | ||||||||||||||||||
| Net asset value, beginning of period | $ | 6.40 | $ | 6.48 | $ | 6.53 | $ | 6.90 | $ | 6.91 | $ | 6.81 | ||||||
| Income from investment operationsa: | ||||||||||||||||||
| Net investment incomeb | 0.06 | 0.13 | 0.15 | 0.12 | 0.17 | 0.22 | ||||||||||||
| Net realized and unrealized gains (losses) | (—)c | (0.02 | ) | 0.01 | (0.27 | ) | 0.04 | 0.14 | ||||||||||
| Total from investment operations | 0.06 | 0.11 | 0.16 | (0.15 | ) | 0.21 | 0.36 | |||||||||||
| Less distributions from net investment income . | (0.09 | ) | (0.19 | ) | (0.21 | ) | (0.22 | ) | (0.22 | ) | (0.26 | ) | ||||||
| Net asset value, end of period | $ | 6.37 | $ | 6.40 | $ | 6.48 | $ | 6.53 | $ | 6.90 | $ | 6.91 | ||||||
| Total returnd | 0.95 | % | 1.71 | % | 2.44 | % | (2.27 | )% | 3.13 | % | 5.41 | % | ||||||
| Ratios to average net assetse | ||||||||||||||||||
| Expenses. | 1.11 | %f | 1.11 | %f | 1.10 | %f | 1.08 | % | 1.08 | % | 1.08 | % | ||||||
| Net investment income | 2.00 | % | 1.93 | % | 2.27 | % | 1.82 | % | 2.51 | % | 3.19 | % | ||||||
| Supplemental data | ||||||||||||||||||
| Net assets, end of period (000’s) | $ | 61,862 | $ | 64,689 | $ | 74,442 | $ | 94,110 | $ | 141,140 | $ | 131,692 | ||||||
| Portfolio turnover rate | 38.00 | % | 69.10 | % | 69.73 | % | 46.16 | % | 40.15 | % | 20.23 | % | ||||||
| Portfolio turnover rate excluding mortgage | ||||||||||||||||||
| dollar rollsg | 38.00 | % | 58.70 | % | 38.79 | % | 40.83 | % | 40.15 | % | 20.23 | % | ||||||
aThe amount shown for a share outstanding throughout the period may not correlate with the Statement of Operations for the period due to the timing of sales and
repurchases of the Fund’s shares in relation to income earned and/or fluctuating fair value of the investments of the Fund.
bBased on average daily shares outstanding.
cAmount rounds to less than $0.01 per share.
dTotal return is not annualized for periods less than one year.
eRatios are annualized for periods less than one year.
fBenefit of waiver and payments by affiliates and expense reduction rounds to less than 0.01%.
gSee Note 1(h) regarding mortgage dollar rolls.
franklintempleton.com The accompanying notes are an integral part of these financial statements. | Semiannual Report 85
| FRANKLIN CUSTODIAN FUNDS | ||||||||||||
| FINANCIAL HIGHLIGHTS | ||||||||||||
| Franklin U.S. Government Securities Fund (continued) | ||||||||||||
| Six Months Ended | ||||||||||||
| March 31, 2016 | Year Ended September 30, | |||||||||||
| (unaudited) | 2015 | 2014 | 2013 | a | ||||||||
| Class R6 | ||||||||||||
| Per share operating performance | ||||||||||||
| (for a share outstanding throughout the period) | ||||||||||||
| Net asset value, beginning of period | $ | 6.42 | $ | 6.50 | $ | 6.55 | $ | 6.76 | ||||
| Income from investment operationsb: | ||||||||||||
| Net investment incomec | 0.09 | 0.17 | 0.19 | 0.07 | ||||||||
| Net realized and unrealized gains (losses) | (0.01 | ) | (0.02 | ) | 0.01 | (0.17 | ) | |||||
| Total from investment operations | 0.08 | 0.15 | 0.20 | (0.10 | ) | |||||||
| Less distributions from net investment income. | (0.11 | ) | (0.23 | ) | (0.25 | ) | (0.11 | ) | ||||
| Net asset value, end of period | $ | 6.39 | $ | 6.42 | $ | 6.50 | $ | 6.55 | ||||
| Total returnd | 1.27 | % | 2.35 | % | 3.08 | % | (1.53 | )% | ||||
| Ratios to average net assetse | ||||||||||||
| Expenses | 0.48 | %f | 0.47 | %f | 0.47 | %f | 0.46 | % | ||||
| Net investment income | 2.63 | % | 2.57 | % | 2.90 | % | 2.44 | % | ||||
| Supplemental data | ||||||||||||
| Net assets, end of period (000’s) | $ | 467,687 | $ | 375,644 | $ | 497,246 | $ | 480,590 | ||||
| Portfolio turnover rate. | 38.00 | % | 69.10 | % | 69.73 | % | 46.16 | % | ||||
| Portfolio turnover rate excluding mortgage dollar rollsg | 38.00 | % | 58.70 | % | 38.79 | % | 40.83 | % | ||||
aFor the period May 1, 2013 (effective date) to September 30, 2013.
bThe amount shown for a share outstanding throughout the period may not correlate with the Statement of Operations for the period due to the timing of sales and
repurchases of the Fund’s shares in relation to income earned and/or fluctuating fair value of the investments of the Fund.
cBased on average daily shares outstanding.
dTotal return is not annualized for periods less than one year.
eRatios are annualized for periods less than one year.
fBenefit of waiver and payments by affiliates and expense reduction rounds to less than 0.01%.
gSee Note 1(h) regarding mortgage dollar rolls.
86 Semiannual Report | The accompanying notes are an integral part of these financial statements. franklintempleton.com
| FRANKLIN CUSTODIAN FUNDS | ||||||||||||||||||
| FINANCIAL HIGHLIGHTS | ||||||||||||||||||
| Franklin U.S. Government Securities Fund (continued) | ||||||||||||||||||
| Six Months Ended | ||||||||||||||||||
| March 31, 2016 | Year Ended September 30, | |||||||||||||||||
| (unaudited) | 2015 | 2014 | 2013 | 2012 | 2011 | |||||||||||||
| Advisor Class | ||||||||||||||||||
| Per share operating performance | ||||||||||||||||||
| (for a share outstanding throughout the period) | ||||||||||||||||||
| Net asset value, beginning of period | $ | 6.42 | $ | 6.50 | $ | 6.55 | $ | 6.93 | $ | 6.94 | $ | 6.83 | ||||||
| Income from investment operationsa: | ||||||||||||||||||
| Net investment incomeb | 0.08 | 0.16 | 0.18 | 0.16 | 0.21 | 0.25 | ||||||||||||
| Net realized and unrealized gains (losses) | (—)c | (0.02 | ) | 0.01 | (0.29 | ) | 0.04 | 0.15 | ||||||||||
| Total from investment operations | 0.08 | 0.14 | 0.19 | (0.13 | ) | 0.25 | 0.40 | |||||||||||
| Less distributions from net investment income . | (0.11 | ) | (0.22 | ) | (0.24 | ) | (0.25 | ) | (0.26 | ) | (0.29 | ) | ||||||
| Net asset value, end of period | $ | 6.39 | $ | 6.42 | $ | 6.50 | $ | 6.55 | $ | 6.93 | $ | 6.94 | ||||||
| Total returnd | 1.20 | % | 2.21 | % | 2.94 | % | (1.86 | )% | 3.63 | % | 6.08 | % | ||||||
| Ratios to average net assetse | ||||||||||||||||||
| Expenses. | 0.61 | %f | 0.61 | %f | 0.60 | %f | 0.58 | % | 0.58 | % | 0.58 | % | ||||||
| Net investment income | 2.50 | % | 2.43 | % | 2.77 | % | 2.32 | % | 3.01 | % | 3.69 | % | ||||||
| Supplemental data | ||||||||||||||||||
| Net assets, end of period (000’s) | $ | 640,581 | $ | 622,339 | $ | 652,737 | $ | 949,085 | $ | 1,586,928 | $ | 1,478,504 | ||||||
| Portfolio turnover rate | 38.00 | % | 69.10 | % | 69.73 | % | 46.16 | % | 40.15 | % | 20.23 | % | ||||||
| Portfolio turnover rate excluding mortgage | ||||||||||||||||||
| dollar rollsg | 38.00 | % | 58.70 | % | 38.79 | % | 40.83 | % | 40.15 | % | 20.23 | % | ||||||
aThe amount shown for a share outstanding throughout the period may not correlate with the Statement of Operations for the period due to the timing of sales and
repurchases of the Fund’s shares in relation to income earned and/or fluctuating fair value of the investments of the Fund.
bBased on average daily shares outstanding.
cAmount rounds to less than $0.01 per share.
dTotal return is not annualized for periods less than one year.
eRatios are annualized for periods less than one year.
fBenefit of waiver and payments by affiliates and expense reduction rounds to less than 0.01%.
gSee Note 1(h) regarding mortgage dollar rolls.
franklintempleton.com The accompanying notes are an integral part of these financial statements. | Semiannual Report 87
| FRANKLIN CUSTODIAN FUNDS | ||||
| Statement of Investments, March 31, 2016 (unaudited) | ||||
| Franklin U.S. Government Securities Fund | ||||
| Principal | ||||
| Amount | Value | |||
| Mortgage-Backed Securities 97.1% | ||||
| Government National Mortgage Association (GNMA) Fixed Rate 97.1% | ||||
| GNMA GP 30 Year, 8.25%, 3/15/17 - 5/15/17 | $ | 5,954 | $ | 5,975 |
| GNMA GP 30 Year, 9.25%, 9/15/16 - 12/15/16 | 11,807 | 11,909 | ||
| GNMA I SF 15 Year, 6.50%, 5/15/18 | 20,971 | 21,233 | ||
| GNMA I SF 30 Year, 3.50%, 4/15/43 - 5/15/43 | 40,210,499 | 42,670,635 | ||
| GNMA I SF 30 Year, 4.00%, 12/15/40 - 9/15/41 | 14,506,481 | 15,688,900 | ||
| GNMA I SF 30 Year, 4.50%, 2/15/39 - 7/15/39 | 58,972,681 | 64,872,811 | ||
| GNMA I SF 30 Year, 4.50%, 8/15/39 - 1/15/40 | 57,483,924 | 63,025,640 | ||
| GNMA I SF 30 Year, 4.50%, 1/15/40 - 4/15/40 | 48,293,767 | 52,827,876 | ||
| GNMA I SF 30 Year, 4.50%, 4/15/40 - 6/15/40 | 55,142,685 | 60,257,794 | ||
| GNMA I SF 30 Year, 4.50%, 6/15/40 - 7/15/40 | 54,245,633 | 59,476,322 | ||
| GNMA I SF 30 Year, 4.50%, 7/15/40 - 8/15/40 | 55,849,949 | 61,076,813 | ||
| GNMA I SF 30 Year, 4.50%, 8/15/40 - 4/15/41 | 49,708,287 | 54,547,786 | ||
| GNMA I SF 30 Year, 4.50%, 4/15/41 - 6/15/41 | 12,869,203 | 14,261,840 | ||
| GNMA I SF 30 Year, 5.00%, 2/15/33 - 9/15/33 | 55,775,463 | 62,464,271 | ||
| GNMA I SF 30 Year, 5.00%, 9/15/33 - 5/15/34 | 57,652,470 | 64,472,685 | ||
| GNMA I SF 30 Year, 5.00%, 5/15/34 - 7/15/39 | 57,194,125 | 63,810,078 | ||
| GNMA I SF 30 Year, 5.00%, 7/15/39 - 9/15/39 | 57,223,589 | 63,666,704 | ||
| GNMA I SF 30 Year, 5.00%, 9/15/39 - 10/15/39 | 44,429,323 | 49,668,766 | ||
| GNMA I SF 30 Year, 5.00%, 10/15/39 - 11/15/39. | 57,565,773 | 64,631,032 | ||
| GNMA I SF 30 Year, 5.00%, 11/15/39 | 23,958,142 | 26,896,928 | ||
| GNMA I SF 30 Year, 5.00%, 11/15/39 - 1/15/40 | 55,769,591 | 62,425,045 | ||
| GNMA I SF 30 Year, 5.00%, 1/15/40 - 3/15/40 | 55,937,026 | 62,684,790 | ||
| GNMA I SF 30 Year, 5.00%, 3/15/40 - 5/15/40 | 55,539,809 | 62,273,709 | ||
| GNMA I SF 30 Year, 5.00%, 5/15/40 - 6/15/40 | 52,606,600 | 59,031,529 | ||
| GNMA I SF 30 Year, 5.00%, 6/15/40 - 9/15/40 | 50,865,072 | 56,800,674 | ||
| GNMA I SF 30 Year, 5.50%, 5/15/28 - 4/15/33 | 56,688,503 | 64,682,394 | ||
| GNMA I SF 30 Year, 5.50%, 4/15/33 - 11/15/33 | 56,921,204 | 64,771,608 | ||
| GNMA I SF 30 Year, 5.50%, 11/15/33 - 8/15/37 | 56,296,514 | 63,950,204 | ||
| GNMA I SF 30 Year, 5.50%, 2/15/38 - 7/15/39 | 56,052,454 | 63,220,618 | ||
| GNMA I SF 30 Year, 5.50%, 8/15/39 - 2/15/40 | 23,824,766 | 27,000,401 | ||
| GNMA I SF 30 Year, 6.00%, 10/15/23 - 12/15/32. | 56,986,454 | 64,985,075 | ||
| GNMA I SF 30 Year, 6.00%, 12/15/32 - 6/15/36 | 56,211,931 | 64,840,418 | ||
| GNMA I SF 30 Year, 6.00%, 6/15/36 - 1/15/38 | 56,549,762 | 64,584,046 | ||
| GNMA I SF 30 Year, 6.00%, 1/15/38 - 12/15/39 | 54,069,697 | 61,143,681 | ||
| GNMA I SF 30 Year, 6.50%, 5/15/23 - 1/15/33 | 56,424,484 | 64,943,028 | ||
| GNMA I SF 30 Year, 6.50%, 1/15/33 - 8/15/37 | 12,345,825 | 14,535,779 | ||
| GNMA I SF 30 Year, 6.75%, 3/15/26 | 5,456 | 6,251 | ||
| GNMA I SF 30 Year, 7.00%, 7/15/16 - 9/15/32 | 46,979,658 | 53,073,238 | ||
| GNMA I SF 30 Year, 7.25%, 12/15/25 - 1/15/26 | 170,597 | 183,188 | ||
| GNMA I SF 30 Year, 7.50%, 8/15/16 - 8/15/33 | 14,482,799 | 16,104,841 | ||
| GNMA I SF 30 Year, 7.70%, 1/15/21 - 1/15/22 | 86,005 | 86,315 | ||
| GNMA I SF 30 Year, 8.00%, 6/15/16 - 9/15/30 | 6,474,250 | 6,831,043 | ||
| GNMA I SF 30 Year, 8.50%, 8/15/16 - 5/15/25 | 1,345,793 | 1,428,843 | ||
| GNMA I SF 30 Year, 9.00%, 5/15/16 - 7/15/23 | 1,295,058 | 1,352,983 | ||
| GNMA I SF 30 Year, 9.50%, 5/15/16 - 8/15/22 | 1,219,014 | 1,244,258 | ||
| GNMA I SF 30 Year, 10.00%, 7/15/16 - 3/15/25 | 987,029 | 1,008,695 | ||
| GNMA I SF 30 Year, 10.50%, 10/15/16 - 10/15/21 | 523,985 | 533,687 | ||
| GNMA I SF 30 Year, 11.00%, 11/15/17 - 5/15/21. | 73,183 | 74,091 | ||
| GNMA II GP 30 Year, 8.75%, 3/20/17 - 7/20/17. | 4,121 | 4,147 | ||
| GNMA II SF 30 Year, 3.00%, 2/20/45 - 1/20/46 | 39,457,133 | 40,959,690 | ||
| GNMA II SF 30 Year, 3.50%, 10/20/40 - 6/20/42 | 20,907,573 | 22,170,002 | ||
88 Semiannual Report
franklintempleton.com
FRANKLIN CUSTODIAN FUNDS
STATEMENT OF INVESTMENTS (UNAUDITED)
| Franklin U.S. Government Securities Fund (continued) | ||||
| Principal | ||||
| Amount | Value | |||
| Mortgage-Backed Securities (continued) | ||||
| Government National Mortgage Association (GNMA) Fixed Rate (continued) | ||||
| GNMA II SF 30 Year, 3.50%, 7/20/42 | $ | 87,305,938 | $ | 92,577,095 |
| GNMA II SF 30 Year, 3.50%, 8/20/42 | 33,196,362 | 35,211,837 | ||
| GNMA II SF 30 Year, 3.50%, 9/20/42 | 193,742,387 | 205,439,806 | ||
| GNMA II SF 30 Year, 3.50%, 10/20/42 - 11/20/42 | 51,706,015 | 54,835,650 | ||
| GNMA II SF 30 Year, 3.50%, 11/20/42 - 3/20/43 | 49,523,209 | 52,527,848 | ||
| GNMA II SF 30 Year, 3.50%, 4/20/43 - 5/20/43 | 43,223,072 | 45,828,783 | ||
| GNMA II SF 30 Year, 3.50%, 5/20/43 | 55,453,469 | 58,783,826 | ||
| GNMA II SF 30 Year, 3.50%, 6/20/43 | 63,881,462 | 67,717,195 | ||
| GNMA II SF 30 Year, 3.50%, 8/20/43 | 46,845,381 | 49,642,273 | ||
| GNMA II SF 30 Year, 3.50%, 9/20/45 | 163,692,388 | 173,320,392 | ||
| GNMA II SF 30 Year, 3.50%, 10/20/45 - 11/20/45 | 48,920,916 | 51,798,331 | ||
| GNMA II SF 30 Year, 3.50%, 1/20/46 | 49,725,619 | 52,650,365 | ||
| GNMA II SF 30 Year, 3.50%, 2/20/46 | 142,107,007 | 150,465,410 | ||
| GNMA II SF 30 Year, 3.50%, 3/20/46 | 649,302,096 | 687,492,532 | ||
| GNMA II SF 30 Year, 4.00%, 5/20/40 - 10/20/40 | 19,635,177 | 21,175,955 | ||
| GNMA II SF 30 Year, 4.00%, 11/20/40 | 59,879,642 | 64,578,221 | ||
| GNMA II SF 30 Year, 4.00%, 12/20/40 | 34,918,480 | 37,660,414 | ||
| GNMA II SF 30 Year, 4.00%, 1/20/41 - 6/20/41 | 38,338,425 | 41,349,735 | ||
| GNMA II SF 30 Year, 4.00%, 7/20/41 | 49,882,357 | 53,754,157 | ||
| GNMA II SF 30 Year, 4.00%, 9/20/41 | 58,300,464 | 62,807,592 | ||
| GNMA II SF 30 Year, 4.00%, 10/20/41 | 69,909,479 | 75,318,082 | ||
| GNMA II SF 30 Year, 4.00%, 11/20/41 | 63,243,606 | 68,126,832 | ||
| GNMA II SF 30 Year, 4.00%, 2/20/44 | 49,861,617 | 53,763,930 | ||
| GNMA II SF 30 Year, 4.00%, 7/20/45 | 25,029,911 | 26,796,725 | ||
| GNMA II SF 30 Year, 4.00%, 9/20/45 | 63,974,956 | 68,509,700 | ||
| GNMA II SF 30 Year, 4.00%, 10/20/45 | 121,654,306 | 130,318,964 | ||
| GNMA II SF 30 Year, 4.00%, 11/20/45 | 150,548,099 | 161,288,768 | ||
| GNMA II SF 30 Year, 4.00%, 12/20/45 | 24,556,278 | 26,319,142 | ||
| GNMA II SF 30 Year, 4.00%, 1/20/46 | 335,511,955 | 359,593,268 | ||
| GNMA II SF 30 Year, 4.00%, 2/20/46 | 110,387,890 | 118,310,989 | ||
| GNMA II SF 30 Year, 4.00%, 3/20/46 | 95,490,000 | 102,470,974 | ||
| GNMA II SF 30 Year, 4.50%, 5/20/33 - 11/20/39 | 29,823,921 | 32,401,905 | ||
| GNMA II SF 30 Year, 4.50%, 12/20/39 - 1/20/40 | 50,512,626 | 54,996,511 | ||
| GNMA II SF 30 Year, 4.50%, 2/20/40 - 7/20/40 | 37,574,113 | 40,909,387 | ||
| GNMA II SF 30 Year, 4.50%, 5/20/41 | 54,488,837 | 59,326,116 | ||
| GNMA II SF 30 Year, 4.50%, 6/20/41 | 16,259,200 | 17,702,649 | ||
| GNMA II SF 30 Year, 4.50%, 6/20/41 | 66,568,011 | 72,477,743 | ||
| GNMA II SF 30 Year, 4.50%, 7/20/41 | 70,959,597 | 77,259,243 | ||
| GNMA II SF 30 Year, 4.50%, 8/20/41 | 8,918,999 | 9,711,021 | ||
| GNMA II SF 30 Year, 4.50%, 9/20/41 | 93,573,915 | 101,881,585 | ||
| GNMA II SF 30 Year, 4.50%, 10/20/41 | 70,560,620 | 76,830,082 | ||
| GNMA II SF 30 Year, 4.50%, 8/20/42 - 2/20/44 | 43,276,126 | 46,556,531 | ||
| GNMA II SF 30 Year, 5.00%, 7/20/33 - 10/20/33 | 49,744,808 | 55,127,865 | ||
| GNMA II SF 30 Year, 5.00%, 11/20/33 - 3/20/36 | 35,458,203 | 39,283,759 | ||
| GNMA II SF 30 Year, 5.00%, 7/20/39 - 5/20/40 | 58,263,217 | 64,569,460 | ||
| GNMA II SF 30 Year, 5.00%, 6/20/40 - 9/20/41 | 31,348,196 | 34,779,407 | ||
| GNMA II SF 30 Year, 5.50%, 6/20/34 - 11/20/34 | 35,963,985 | 40,656,069 | ||
| GNMA II SF 30 Year, 5.50%, 12/20/34 - 5/20/35 | 50,286,063 | 56,819,292 | ||
| GNMA II SF 30 Year, 5.50%, 6/20/35 - 4/20/40 | 53,253,542 | 59,549,048 | ||
| GNMA II SF 30 Year, 6.00%, 10/20/23 - 9/20/35 | 50,116,703 | 58,046,853 | ||
| GNMA II SF 30 Year, 6.00%, 11/20/35 - 7/20/39 | 51,530,551 | 58,897,646 | ||
franklintempleton.com
Semiannual Report 89
FRANKLIN CUSTODIAN FUNDS
STATEMENT OF INVESTMENTS (UNAUDITED)
| Franklin U.S. Government Securities Fund (continued) | ||||
| Principal | ||||
| Amount | Value | |||
| Mortgage-Backed Securities (continued) | ||||
| Government National Mortgage Association (GNMA) Fixed Rate (continued) | ||||
| GNMA II SF 30 Year, 6.50%, 6/20/24 - 1/20/39 | $ | 34,984,324 | $ | 40,870,756 |
| GNMA II SF 30 Year, 7.00%, 2/20/28 - 7/20/33 | 7,629,126 | 9,387,223 | ||
| GNMA II SF 30 Year, 7.50%, 10/20/22 - 4/20/32 | 1,718,041 | 2,001,436 | ||
| GNMA II SF 30 Year, 8.00%, 8/20/16 - 6/20/30 | 810,307 | 974,125 | ||
| GNMA II SF 30 Year, 8.50%, 6/20/16 - 6/20/25 | 286,092 | 304,873 | ||
| GNMA II SF 30 Year, 9.00%, 11/20/17 - 11/20/21 | 49,230 | 53,921 | ||
| GNMA II SF 30 Year, 9.50%, 3/20/18 - 4/20/25 | 78,044 | 82,530 | ||
| GNMA II SF 30 Year, 10.00%, 10/20/17 - 3/20/21 | 102,134 | 110,418 | ||
| GNMA II SF 30 Year, 10.50%, 8/20/16 - 1/20/21 | 140,047 | 144,091 | ||
| GNMA II SF 30 Year, 11.00%, 7/20/18 - 1/20/21 | 28,089 | 28,332 | ||
| GNMA II SF 30 Year, 11.50%, 1/20/18 | 1,020 | 1,034 | ||
| Total Mortgage-Backed Securities (Cost $6,098,648,459) | 6,313,465,971 | |||
| Shares | ||||
| Short Term Investments (Cost $172,684,420) 2.7% | ||||
| Money Market Funds 2.7% | ||||
| a,b Institutional Fiduciary Trust Money Market Portfolio | 172,684,420 | 172,684,420 | ||
| Total Investments (Cost $6,271,332,879) 99.8%. | 6,486,150,391 | |||
| Other Assets, less Liabilities 0.2% | 12,478,717 | |||
| Net Assets 100.0% | $ | 6,498,629,108 | ||
See Abbreviations on page 128.
aNon-income producing.
bSee Note 3(f) regarding investments in affiliated management investment companies.
90 Semiannual Report | The accompanying notes are an integral part of these financial statements. franklintempleton.com
FRANKLIN CUSTODIAN FUNDS
| Financial Highlights | ||||||||||||||||||
| Franklin Utilities Fund | ||||||||||||||||||
| Six Months Ended | ||||||||||||||||||
| March 31, 2016 | Year Ended September 30, | |||||||||||||||||
| (unaudited) | 2015 | 2014 | 2013 | 2012 | 2011 | |||||||||||||
| Class A | ||||||||||||||||||
| Per share operating performance | ||||||||||||||||||
| (for a share outstanding throughout the period) | ||||||||||||||||||
| Net asset value, beginning of period | $ | 16.08 | $ | 16.58 | $ | 14.62 | $ | 14.04 | $ | 12.42 | $ | 11.44 | ||||||
| Income from investment operationsa: | ||||||||||||||||||
| Net investment incomeb | 0.24 | 0.49 | 0.49 | 0.49 | 0.48 | 0.44 | ||||||||||||
| Net realized and unrealized gains (losses) | 2.04 | (0.09 | ) | 2.00 | 0.60 | 1.60 | 0.97 | |||||||||||
| Total from investment operations | 2.28 | 0.40 | 2.49 | 1.09 | 2.08 | 1.41 | ||||||||||||
| Less distributions from: | ||||||||||||||||||
| Net investment income. | (0.27 | ) | (0.48 | ) | (0.49 | ) | (0.51 | ) | (0.46 | ) | (0.43 | ) | ||||||
| Net realized gains | (0.52 | ) | (0.42 | ) | (0.04 | ) | — | — | — | |||||||||
| Total distributions | (0.79 | ) | (0.90 | ) | (0.53 | ) | (0.51 | ) | (0.46 | ) | (0.43 | ) | ||||||
| Net asset value, end of period | $ | 17.57 | $ | 16.08 | $ | 16.58 | $ | 14.62 | $ | 14.04 | $ | 12.42 | ||||||
| Total returnc | 14.87 | % | 2.19 | % | 17.24 | % | 7.92 | % | 16.99 | % | 12.50 | % | ||||||
| Ratios to average net assetsd | ||||||||||||||||||
| Expenses. | 0.75 | %e | 0.73 | %e | 0.75 | %e,f | 0.75 | %f | 0.76 | % | 0.76 | % | ||||||
| Net investment income | 2.93 | % | 2.88 | % | 3.05 | % | 3.34 | % | 3.61 | % | 3.67 | % | ||||||
| Supplemental data | ||||||||||||||||||
| Net assets, end of period (000’s) | $ | 4,006,679 | $ | 3,524,835 | $ | 3,717,397 | $ | 3,275,129 | $ | 3,076,131 | $ | 2,220,083 | ||||||
| Portfolio turnover rate | 4.14 | % | 9.55 | % | 8.10 | % | 4.57 | % | 1.27 | % | 5.21 | % | ||||||
aThe amount shown for a share outstanding throughout the period may not correlate with the Statement of Operations for the period due to the timing of sales and
repurchases of the Fund’s shares in relation to income earned and/or fluctuating fair value of the investments of the Fund.
bBased on average daily shares outstanding.
cTotal return does not reflect sales commissions or contingent deferred sales charges, if applicable, and is not annualized for periods less than one year.
dRatios are annualized for periods less than one year.
eBenefit of waiver and payments by affiliates rounds to less than 0.01%.
fBenefit of expense reduction rounds to less than 0.01%.
franklintempleton.com The accompanying notes are an integral part of these financial statements. | Semiannual Report 91
| FRANKLIN CUSTODIAN FUNDS | ||||||||||||||||||
| FINANCIAL HIGHLIGHTS | ||||||||||||||||||
| Franklin Utilities Fund (continued) | ||||||||||||||||||
| Six Months Ended | ||||||||||||||||||
| March 31, 2016 | Year Ended September 30, | |||||||||||||||||
| (unaudited) | 2015 | 2014 | 2013 | 2012 | 2011 | |||||||||||||
| Class C | ||||||||||||||||||
| Per share operating performance | ||||||||||||||||||
| (for a share outstanding throughout the period) | ||||||||||||||||||
| Net asset value, beginning of period | $ | 16.01 | $ | 16.50 | $ | 14.56 | $ | 13.98 | $ | 12.37 | $ | 11.40 | ||||||
| Income from investment operationsa: | ||||||||||||||||||
| Net investment incomeb | 0.19 | 0.40 | 0.41 | 0.41 | 0.42 | 0.38 | ||||||||||||
| Net realized and unrealized gains (losses) | 2.03 | (0.08 | ) | 1.98 | 0.61 | 1.58 | 0.96 | |||||||||||
| Total from investment operations | 2.22 | 0.32 | 2.39 | 1.02 | 2.00 | 1.34 | ||||||||||||
| Less distributions from: | ||||||||||||||||||
| Net investment income. | (0.23 | ) | (0.39 | ) | (0.41 | ) | (0.44 | ) | (0.39 | ) | (0.37 | ) | ||||||
| Net realized gains | (0.52 | ) | (0.42 | ) | (0.04 | ) | — | — | — | |||||||||
| Total distributions | (0.75 | ) | (0.81 | ) | (0.45 | ) | (0.44 | ) | (0.39 | ) | (0.37 | ) | ||||||
| Net asset value, end of period | $ | 17.48 | $ | 16.01 | $ | 16.50 | $ | 14.56 | $ | 13.98 | $ | 12.37 | ||||||
| Total returnc | 14.51 | % | 1.74 | % | 16.61 | % | 7.40 | % | 16.32 | % | 12.00 | % | ||||||
| Ratios to average net assetsd | ||||||||||||||||||
| Expenses. | 1.25 | %e | 1.23 | %e | 1.25 | %e,f | 1.25 | %f | 1.26 | % | 1.26 | % | ||||||
| Net investment income | 2.43 | % | 2.38 | % | 2.55 | % | 2.84 | % | 3.11 | % | 3.17 | % | ||||||
| Supplemental data | ||||||||||||||||||
| Net assets, end of period (000’s) | $ | 1,042,610 | $ | 931,800 | $ | 986,318 | $ | 845,173 | $ | 774,711 | $ | 528,391 | ||||||
| Portfolio turnover rate | 4.14 | % | 9.55 | % | 8.10 | % | 4.57 | % | 1.27 | % | 5.21 | % | ||||||
aThe amount shown for a share outstanding throughout the period may not correlate with the Statement of Operations for the period due to the timing of sales and
repurchases of the Fund’s shares in relation to income earned and/or fluctuating fair value of the investments of the Fund.
bBased on average daily shares outstanding.
cTotal return does not reflect sales commissions or contingent deferred sales charges, if applicable, and is not annualized for periods less than one year.
dRatios are annualized for periods less than one year.
eBenefit of waiver and payments by affiliates rounds to less than 0.01%.
fBenefit of expense reduction rounds to less than 0.01%.
92 Semiannual Report | The accompanying notes are an integral part of these financial statements. franklintempleton.com
| FRANKLIN CUSTODIAN FUNDS | ||||||||||||||||||
| FINANCIAL HIGHLIGHTS | ||||||||||||||||||
| Franklin Utilities Fund (continued) | ||||||||||||||||||
| Six Months Ended | ||||||||||||||||||
| March 31, 2016 | Year Ended September 30, | |||||||||||||||||
| (unaudited) | 2015 | 2014 | 2013 | 2012 | 2011 | |||||||||||||
| Class R | ||||||||||||||||||
| Per share operating performance | ||||||||||||||||||
| (for a share outstanding throughout the period) | ||||||||||||||||||
| Net asset value, beginning of period | $ | 16.02 | $ | 16.52 | $ | 14.58 | $ | 14.00 | $ | 12.39 | $ | 11.41 | ||||||
| Income from investment operationsa: | ||||||||||||||||||
| Net investment incomeb | 0.21 | 0.42 | 0.43 | 0.44 | 0.44 | 0.40 | ||||||||||||
| Net realized and unrealized gains (losses) | 2.03 | (0.09 | ) | 1.99 | 0.60 | 1.58 | 0.97 | |||||||||||
| Total from investment operations | 2.24 | 0.33 | 2.42 | 1.04 | 2.02 | 1.37 | ||||||||||||
| Less distributions from: | ||||||||||||||||||
| Net investment income. | (0.24 | ) | (0.41 | ) | (0.44 | ) | (0.46 | ) | (0.41 | ) | (0.39 | ) | ||||||
| Net realized gains | (0.52 | ) | (0.42 | ) | (0.04 | ) | — | — | — | |||||||||
| Total distributions | (0.76 | ) | (0.83 | ) | (0.48 | ) | (0.46 | ) | (0.41 | ) | (0.39 | ) | ||||||
| Net asset value, end of period | $ | 17.50 | $ | 16.02 | $ | 16.52 | $ | 14.58 | $ | 14.00 | $ | 12.39 | ||||||
| Total returnc | 14.65 | % | 1.83 | % | 16.75 | % | 7.56 | % | 16.55 | % | 12.14 | % | ||||||
| Ratios to average net assetsd | ||||||||||||||||||
| Expenses. | 1.10 | %e | 1.08 | %e | 1.10 | %e,f | 1.10 | %f | 1.11 | % | 1.11 | % | ||||||
| Net investment income | 2.58 | % | 2.53 | % | 2.70 | % | 2.99 | % | 3.26 | % | 3.32 | % | ||||||
| Supplemental data | ||||||||||||||||||
| Net assets, end of period (000’s) | $ | 93,365 | $ | 83,271 | $ | 95,498 | $ | 86,216 | $ | 80,478 | $ | 51,732 | ||||||
| Portfolio turnover rate | 4.14 | % | 9.55 | % | 8.10 | % | 4.57 | % | 1.27 | % | 5.21 | % | ||||||
aThe amount shown for a share outstanding throughout the period may not correlate with the Statement of Operations for the period due to the timing of sales and
repurchases of the Fund’s shares in relation to income earned and/or fluctuating fair value of the investments of the Fund.
bBased on average daily shares outstanding.
cTotal return is not annualized for periods less than one year.
dRatios are annualized for periods less than one year.
eBenefit of waiver and payments by affiliates rounds to less than 0.01%.
fBenefit of expense reduction rounds to less than 0.01%.
franklintempleton.com The accompanying notes are an integral part of these financial statements. | Semiannual Report 93
| FRANKLIN CUSTODIAN FUNDS | ||||||||||||
| FINANCIAL HIGHLIGHTS | ||||||||||||
| Franklin Utilities Fund (continued) | ||||||||||||
| Six Months Ended | ||||||||||||
| March 31, 2016 | Year Ended September 30, | |||||||||||
| (unaudited) | 2015 | 2014 | 2013 | a | ||||||||
| Class R6 | ||||||||||||
| Per share operating performance | ||||||||||||
| (for a share outstanding throughout the period) | ||||||||||||
| Net asset value, beginning of period | $ | 16.18 | $ | 16.68 | $ | 14.71 | $ | 15.88 | ||||
| Income from investment operationsb: | ||||||||||||
| Net investment incomec | 0.26 | 0.53 | 0.53 | 0.25 | ||||||||
| Net realized and unrealized gains (losses) | 2.06 | (0.09 | ) | 2.01 | (1.17 | ) | ||||||
| Total from investment operations | 2.32 | 0.44 | 2.54 | (0.92 | ) | |||||||
| Less distributions from: | ||||||||||||
| Net investment income | (0.29 | ) | (0.52 | ) | (0.53 | ) | (0.25 | ) | ||||
| Net realized gains | (0.52 | ) | (0.42 | ) | (0.04 | ) | — | |||||
| Total distributions | (0.81 | ) | (0.94 | ) | (0.57 | ) | (0.25 | ) | ||||
| Net asset value, end of period | $ | 17.69 | $ | 16.18 | $ | 16.68 | $ | 14.71 | ||||
| Total returnd | 15.06 | % | 2.45 | % | 17.51 | % | (5.79 | )% | ||||
| Ratios to average net assetse | ||||||||||||
| Expenses | 0.48 | %f | 0.47 | %f | 0.48 | %f,g | 0.48 | %g | ||||
| Net investment income | 3.20 | % | 3.14 | % | 3.32 | % | 3.61 | % | ||||
| Supplemental data | ||||||||||||
| Net assets, end of period (000’s) | $ | 249,903 | $ | 201,225 | $ | 236,437 | $ | 218,746 | ||||
| Portfolio turnover rate. | 4.14 | % | 9.55 | % | 8.10 | % | 4.57 | % | ||||
aFor the period May 1, 2013 (effective date) to September 30, 2013.
bThe amount shown for a share outstanding throughout the period may not correlate with the Statement of Operations for the period due to the timing of sales and
repurchases of the Fund’s shares in relation to income earned and/or fluctuating fair value of the investments of the Fund.
cBased on average daily shares outstanding.
dTotal return is not annualized for periods less than one year.
eRatios are annualized for periods less than one year.
fBenefit of waiver and payments by affiliates rounds to less than 0.01%.
gBenefit of expense reduction rounds to less than 0.01%.
94 Semiannual Report | The accompanying notes are an integral part of these financial statements. franklintempleton.com
| FRANKLIN CUSTODIAN FUNDS | ||||||||||||||||||
| FINANCIAL HIGHLIGHTS | ||||||||||||||||||
| Franklin Utilities Fund (continued) | ||||||||||||||||||
| Six Months Ended | ||||||||||||||||||
| March 31, 2016 | Year Ended September 30, | |||||||||||||||||
| (unaudited) | 2015 | 2014 | 2013 | 2012 | 2011 | |||||||||||||
| Advisor Class | ||||||||||||||||||
| Per share operating performance | ||||||||||||||||||
| (for a share outstanding throughout the period) | ||||||||||||||||||
| Net asset value, beginning of period | $ | 16.19 | $ | 16.68 | $ | 14.71 | $ | 14.12 | $ | 12.49 | $ | 11.50 | ||||||
| Income from investment operationsa: | ||||||||||||||||||
| Net investment incomeb | 0.25 | 0.52 | 0.52 | 0.50 | 0.51 | 0.46 | ||||||||||||
| Net realized and unrealized gains (losses) | 2.05 | (0.09 | ) | 2.00 | 0.62 | 1.60 | 0.97 | |||||||||||
| Total from investment operations | 2.30 | 0.43 | 2.52 | 1.12 | 2.11 | 1.43 | ||||||||||||
| Less distributions from: | ||||||||||||||||||
| Net investment income. | (0.28 | ) | (0.50 | ) | (0.51 | ) | (0.53 | ) | (0.48 | ) | (0.44 | ) | ||||||
| Net realized gains | (0.52 | ) | (0.42 | ) | (0.04 | ) | — | — | — | |||||||||
| Total distributions | (0.80 | ) | (0.92 | ) | (0.55 | ) | (0.53 | ) | (0.48 | ) | (0.44 | ) | ||||||
| Net asset value, end of period | $ | 17.69 | $ | 16.19 | $ | 16.68 | $ | 14.71 | $ | 14.12 | $ | 12.49 | ||||||
| Total returnc | 14.91 | % | 2.40 | % | 17.37 | % | 8.11 | % | 17.15 | % | 12.68 | % | ||||||
| Ratios to average net assetsd | ||||||||||||||||||
| Expenses. | 0.60 | %e | 0.58 | %e | 0.60 | %e,f | 0.60 | %f | 0.61 | % | 0.61 | % | ||||||
| Net investment income | 3.08 | % | 3.03 | % | 3.20 | % | 3.49 | % | 3.76 | % | 3.82 | % | ||||||
| Supplemental data | ||||||||||||||||||
| Net assets, end of period (000’s) | $ | 666,996 | $ | 549,371 | $ | 562,202 | $ | 343,082 | $ | 574,803 | $ | 347,983 | ||||||
| Portfolio turnover rate | 4.14 | % | 9.55 | % | 8.10 | % | 4.57 | % | 1.27 | % | 5.21 | % | ||||||
aThe amount shown for a share outstanding throughout the period may not correlate with the Statement of Operations for the period due to the timing of sales and
repurchases of the Fund’s shares in relation to income earned and/or fluctuating fair value of the investments of the Fund.
bBased on average daily shares outstanding.
cTotal return is not annualized for periods less than one year.
dRatios are annualized for periods less than one year.
eBenefit of waiver and payments by affiliates rounds to less than 0.01%.
fBenefit of expense reduction rounds to less than 0.01%.
franklintempleton.com The accompanying notes are an integral part of these financial statements. | Semiannual Report 95
| FRANKLIN CUSTODIAN FUNDS | ||||
| Statement of Investments, March 31, 2016 (unaudited) | ||||
| Franklin Utilities Fund | ||||
| Country | Shares | Value | ||
| Common Stocks 97.5% | ||||
| Electric Utilities 54.1% | ||||
| ALLETE Inc | United States | 1,000,000 | $ | 56,070,000 |
| American Electric Power Co. Inc | United States | 4,000,000 | 265,600,000 | |
| Cleco Corp | United States | 700,000 | 38,647,000 | |
| Duke Energy Corp | United States | 3,500,000 | 282,380,000 | |
| Edison International | United States | 4,400,000 | 316,316,000 | |
| Entergy Corp | United States | 1,000,000 | 79,280,000 | |
| Eversource Energy | United States | 1,700,000 | 99,178,000 | |
| Exelon Corp | United States | 6,600,000 | 236,676,000 | |
| FirstEnergy Corp | United States | 2,200,000 | 79,134,000 | |
| Great Plains Energy Inc | United States | 4,300,000 | 138,675,000 | |
| IDACORP Inc | United States | 400,000 | 29,836,000 | |
| ITC Holdings Corp | United States | 300,000 | 13,071,000 | |
| NextEra Energy Inc | United States | 2,900,000 | 343,186,000 | |
| OGE Energy Corp | United States | 2,000,000 | 57,260,000 | |
| PG&E Corp | United States | 4,400,000 | 262,768,000 | |
| Pinnacle West Capital Corp | United States | 1,900,000 | 142,633,000 | |
| PNM Resources Inc | United States | 3,000,000 | 101,160,000 | |
| Portland General Electric Co | United States | 1,800,000 | 71,082,000 | |
| PPL Corp | United States | 4,000,000 | 152,280,000 | |
| The Southern Co | United States | 3,600,000 | 186,228,000 | |
| Westar Energy Inc | United States | 2,700,000 | 133,947,000 | |
| Xcel Energy Inc | United States | 4,600,000 | 192,372,000 | |
| 3,277,779,000 | ||||
| Gas Utilities 2.3% | ||||
| The Laclede Group Inc | United States | 1,000,000 | 67,750,000 | |
| ONE Gas Inc | United States | 438,181 | 26,772,859 | |
| Questar Corp | United States | 1,700,000 | 42,160,000 | |
| 136,682,859 | ||||
| Independent Power & Renewable Electricity Producers 0.0%† | ||||
| a Drax Group PLC | United Kingdom | 800,000 | 3,128,062 | |
| Multi-Utilities 32.5% | ||||
| Alliant Energy Corp | United States | 1,900,000 | 141,132,000 | |
| Ameren Corp | United States | 600,000 | 30,060,000 | |
| a Black Hills Corp | United States | 500,000 | 30,065,000 | |
| CenterPoint Energy Inc | United States | 6,200,000 | 129,704,000 | |
| CMS Energy Corp | United States | 4,865,000 | 206,470,600 | |
| Consolidated Edison Inc | United States | 800,000 | 61,296,000 | |
| Dominion Resources Inc | United States | 4,200,000 | 315,504,000 | |
| DTE Energy Co | United States | 1,800,000 | 163,188,000 | |
| MDU Resources Group Inc | United States | 3,600,000 | 70,056,000 | |
| National Grid PLC | United Kingdom | 11,000,000 | 156,046,709 | |
| NiSource Inc | United States | 2,000,000 | 47,120,000 | |
| NorthWestern Corp | United States | 596,800 | 36,852,400 | |
| Public Service Enterprise Group Inc | United States | 3,000,000 | 141,420,000 | |
| Sempra Energy | United States | 2,566,600 | 267,054,730 | |
| Vectren Corp | United States | 925,100 | 46,773,056 | |
| WEC Energy Group Inc | United States | 2,100,000 | 126,147,000 | |
| 1,968,889,495 | ||||
96 Semiannual Report
franklintempleton.com
FRANKLIN CUSTODIAN FUNDS
STATEMENT OF INVESTMENTS (UNAUDITED)
| Franklin Utilities Fund (continued) | |||||
| Country | Shares | Value | |||
| Common Stocks (continued) | |||||
| Oil, Gas & Consumable Fuels 5.1% | |||||
| Columbia Pipeline Group Inc | United States | 2,500,000 | $ | 62,750,000 | |
| Enbridge Inc. | Canada | 847,200 | 32,999,062 | ||
| Kinder Morgan Inc | United States | 3,200,000 | 57,152,000 | ||
| b Plains GP Holdings LP, A | United States | 2,600,000 | 22,594,000 | ||
| Spectra Energy Corp | United States | 1,800,000 | 55,080,000 | ||
| TransCanada Corp | Canada | 1,200,000 | 47,203,112 | ||
| The Williams Cos. Inc | United States | 2,000,000 | 32,140,000 | ||
| 309,918,174 | |||||
| Water Utilities 3.5% | |||||
| American Water Works Co. Inc | United States | 1,800,000 | 124,074,000 | ||
| United Utilities Group PLC | United Kingdom | 6,700,000 | 88,865,520 | ||
| 212,939,520 | |||||
| Total Common Stocks (Cost $3,441,905,320) | 5,909,337,110 | ||||
| Principal | |||||
| Amount | |||||
| Corporate Bonds 0.9% | |||||
| Electric Utilities 0.1% | |||||
| Northeast Generation Co., senior secured note, B-1, 8.812%, 10/15/26 | United States | $ | 6,105,469 | 6,522,668 | |
| Multi-Utilities 0.8% | |||||
| Aquila Inc., senior note, 8.27%, 11/15/21 | United States | 6,100,000 | 7,494,832 | ||
| MidAmerican Energy Holdings Co., senior note, 8.48%, 9/15/28 | United States | 25,000,000 | 37,257,700 | ||
| 44,752,532 | |||||
| Total Corporate Bonds (Cost $37,330,108) | 51,275,200 | ||||
| Total Investments before Short Term Investments | |||||
| (Cost $3,479,235,428) | 5,960,612,310 | ||||
| Shares | |||||
| Short Term Investments 1.4% | |||||
| Money Market Funds (Cost $81,946,900) 1.3% | |||||
| b,c Institutional Fiduciary Trust Money Market Portfolio. | United States | 81,946,900 | 81,946,900 | ||
| d Investments from Cash Collateral Received for Loaned | |||||
| Securities (Cost $3,775,601) 0.1% | |||||
| Money Market Funds 0.1% | |||||
| b,c Institutional Fiduciary Trust Money Market Portfolio. | United States | 3,775,601 | 3,775,601 | ||
| Total Investments (Cost $3,564,957,929) 99.8% | 6,046,334,811 | ||||
| Other Assets, less Liabilities 0.2% | 13,216,926 | ||||
| Net Assets 100.0% | $ | 6,059,551,737 | |||
franklintempleton.com
Semiannual Report 97
FRANKLIN CUSTODIAN FUNDS
STATEMENT OF INVESTMENTS (UNAUDITED)
Franklin Utilities Fund (continued)
†Rounds to less than 0.1% of net assets.
aA portion or all of the security is on loan at March 31, 2016. See Note 1(g).
bNon-income producing.
cSee Note 3(f) regarding investments in affiliated management investment companies.
dSee Note 1(g) regarding securities on loan.
98 Semiannual Report | The accompanying notes are an integral part of these financial statements. franklintempleton.com
| FRANKLIN CUSTODIAN FUNDS | ||||||||
| Financial Statements | ||||||||
| Statements of Assets and Liabilities | ||||||||
| March 31, 2016 (unaudited) | ||||||||
| Franklin | Franklin | Franklin | ||||||
| DynaTech Fund | Growth Fund | Income Fund | ||||||
| Assets: | ||||||||
| Investments in securities: | ||||||||
| Cost - Unaffiliated issuers | $ | 1,766,579,427 | $ | 4,994,804,460 | $ | 75,487,174,115 | ||
| Cost - Non-controlled affiliates (Note 3f and 11) | 99,738,661 | 1,183,949,659 | 2,105,759,372 | |||||
| Cost - Repurchase agreements | — | — | 4,951,370 | |||||
| Total cost of investments | $ | 1,866,318,088 | $ | 6,178,754,119 | $ | 77,597,884,857 | ||
| Value - Unaffiliated issuers | $ | 2,803,185,729 | $ | 10,640,296,001 | $ | 74,010,195,996 | ||
| Value - Non-controlled affiliates (Note 3f and 11) | 99,738,661 | 1,183,949,659 | 1,818,714,443 | |||||
| Value - Repurchase agreements. | — | — | 4,951,370 | |||||
| Total value of investmentsa | 2,902,924,390 | 11,824,245,660 | 75,833,861,809 | |||||
| Cash. | — | 681,079 | 25,619,618 | |||||
| Receivables: | ||||||||
| Investment securities sold | — | 46,430,924 | 691,629,205 | |||||
| Capital shares sold | 3,663,187 | 12,435,044 | 102,800,033 | |||||
| Dividends and interest | 840,052 | 8,366,329 | 705,865,348 | |||||
| Other assets | 2,240 | 7,362 | 47,950 | |||||
| Total assets | 2,907,429,869 | 11,892,166,398 | 77,359,823,963 | |||||
| Liabilities: | ||||||||
| Payables: | ||||||||
| Investment securities purchased | — | 11,691,162 | 1,362,105,173 | |||||
| Capital shares redeemed | 11,072,058 | 17,548,503 | 130,494,794 | |||||
| Management fees | 1,081,094 | 4,106,238 | 23,293,044 | |||||
| Distribution fees | 1,304,841 | 4,657,736 | 34,511,000 | |||||
| Transfer agent fees | 459,711 | 3,327,075 | 11,540,188 | |||||
| Trustees’ fees and expenses | 575 | 842 | 24,774 | |||||
| Payable upon return of securities loaned | — | — | 23,398,370 | |||||
| Unrealized depreciation on unfunded loan commitments (Note 9) | — | — | 2,990 | |||||
| Accrued expenses and other liabilities. | 130,266 | 503,668 | 4,401,455 | |||||
| Total liabilities | 14,048,545 | 41,835,224 | 1,589,771,788 | |||||
| Net assets, at value | $ | 2,893,381,324 | $ | 11,850,331,174 | $ | 75,770,052,175 | ||
| Net assets consist of: | ||||||||
| Paid-in capital | $ | 1,919,032,305 | $ | 6,001,870,061 | $ | 85,346,884,686 | ||
| Undistributed net investment income (loss) | (13,222,990 | ) | 5,166,366 | — | ||||
| Distributions in excess of net investment income | — | — | (401,446,618 | ) | ||||
| Net unrealized appreciation (depreciation) | 1,036,607,601 | 5,615,271,064 | (1,763,972,542 | ) | ||||
| Accumulated net realized gain (loss) | (49,035,592 | ) | 228,023,683 | (7,411,413,351 | ) | |||
| Net assets, at value | $ | 2,893,381,324 | $ | 11,850,331,174 | $ | 75,770,052,175 | ||
| aIncludes securities loaned | $ | — | $ | — | $ | 22,428,668 | ||
franklintempleton.com The accompanying notes are an integral part of these financial statements. | Semiannual Report 99
| FRANKLIN CUSTODIAN FUNDS | |||||||
| FINANCIAL STATEMENTS | |||||||
| Statements of Assets and Liabilities (continued) | |||||||
| March 31, 2016 (unaudited) | |||||||
| Franklin | Franklin | Franklin | |||||
| DynaTech Fund | Growth Fund | Income Fund | |||||
| Class A: | |||||||
| Net assets, at value | $ | 2,026,775,016 | $ | 7,551,007,048 | $ | 43,475,160,860 | |
| Shares outstanding. | 44,129,069 | 102,701,434 | 20,567,690,294 | ||||
| Net asset value per sharea | $ | 45.93 | $ | 73.52 | $ | 2.11 | |
| Maximum offering price per share (net asset value per share ÷ 94.25%, | |||||||
| 94.25% and 95.75%, respectively) | $ | 48.73 | $ | 78.01 | $ | 2.20 | |
| Class C: | |||||||
| Net assets, at value | $ | 307,614,910 | $ | 835,214,900 | $ | 22,973,340,106 | |
| Shares outstanding. | 7,767,192 | 12,243,406 | 10,744,518,363 | ||||
| Net asset value and maximum offering price per sharea | $ | 39.60 | $ | 68.22 | $ | 2.14 | |
| Class R: | |||||||
| Net assets, at value | $ | 39,974,947 | $ | 474,821,888 | $ | 388,343,946 | |
| Shares outstanding. | 888,834 | 6,482,747 | 186,838,207 | ||||
| Net asset value and maximum offering price per share | $ | 44.97 | $ | 73.24 | $ | 2.08 | |
| Class R6: | |||||||
| Net assets, at value | $ | 367,020,919 | $ | 1,240,937,269 | $ | 1,701,496,337 | |
| Shares outstanding. | 7,782,602 | 16,860,068 | 811,369,628 | ||||
| Net asset value and maximum offering price per share | $ | 47.16 | $ | 73.60 | $ | 2.10 | |
| Advisor Class: | |||||||
| Net assets, at value | $ | 151,995,532 | $ | 1,748,350,069 | $ | 7,231,710,926 | |
| Shares outstanding. | 3,238,653 | 23,730,057 | 3,449,147,087 | ||||
| Net asset value and maximum offering price per share | $ | 46.93 | $ | 73.68 | $ | 2.10 | |
aRedemption price is equal to net asset value less contingent deferred sales charges, if applicable.
100 Semiannual Report | The accompanying notes are an integral part of these financial statements. franklintempleton.com
| FRANKLIN CUSTODIAN FUNDS | ||||||
| FINANCIAL STATEMENTS | ||||||
| Statements of Assets and Liabilities (continued) | ||||||
| March 31, 2016 (unaudited) | ||||||
| Franklin | ||||||
| U.S. Government | Franklin | |||||
| Securities Fund | Utilities Fund | |||||
| Assets: | ||||||
| Investments in securities: | ||||||
| Cost - Unaffiliated issuers | $ | 6,098,648,459 | $ | 3,479,235,428 | ||
| Cost - Non-controlled affiliates (Note 3f and 11) | 172,684,420 | 85,722,501 | ||||
| Total cost of investments | $ | 6,271,332,879 | $ | 3,564,957,929 | ||
| Value - Unaffiliated issuers | $ | 6,313,465,971 | $ | 5,960,612,310 | ||
| Value - Non-controlled affiliates (Note 3f and 11) | 172,684,420 | 85,722,501 | ||||
| Total value of investmentsa | 6,486,150,391 | 6,046,334,811 | ||||
| Receivables: | ||||||
| Capital shares sold | 11,425,434 | 17,699,899 | ||||
| Dividends and interest | 20,417,776 | 14,033,025 | ||||
| Other assets | 4,183 | 3,534 | ||||
| Total assets. | 6,517,997,784 | 6,078,071,269 | ||||
| Liabilities: | ||||||
| Payables: | ||||||
| Capital shares redeemed | 10,877,685 | 8,931,897 | ||||
| Management fees | 2,405,321 | 2,263,990 | ||||
| Distribution fees. | 2,206,072 | 2,052,329 | ||||
| Transfer agent fees | 1,331,920 | 1,185,418 | ||||
| Trustees’ fees and expenses | 1,236 | 1,940 | ||||
| Distributions to shareholders | 2,241,869 | — | ||||
| Payable upon return of securities loaned | — | 3,775,601 | ||||
| Accrued expenses and other liabilities | 304,573 | 308,357 | ||||
| Total liabilities | 19,368,676 | 18,519,532 | ||||
| Net assets, at value | $ | 6,498,629,108 | $ | 6,059,551,737 | ||
| Net assets consist of: | ||||||
| Paid-in capital | $ | 6,705,097,731 | $ | 3,639,538,429 | ||
| Undistributed net investment income | — | 1,529,601 | ||||
| Distributions in excess of net investment income | (26,491,723 | ) | — | |||
| Net unrealized appreciation (depreciation) | 214,817,512 | 2,481,383,537 | ||||
| Accumulated net realized gain (loss) | (394,794,412 | ) | (62,899,830 | ) | ||
| Net assets, at value | $ | 6,498,629,108 | $ | 6,059,551,737 | ||
| aIncludes securities loaned. | $ | — | $ | 3,547,713 | ||
franklintempleton.com The accompanying notes are an integral part of these financial statements. | Semiannual Report 101
| FRANKLIN CUSTODIAN FUNDS | |||||
| FINANCIAL STATEMENTS | |||||
| Statements of Assets and Liabilities (continued) | |||||
| March 31, 2016 (unaudited) | |||||
| Franklin | |||||
| U.S. Government | Franklin | ||||
| Securities Fund | Utilities Fund | ||||
| Class A: | |||||
| Net assets, at value | $ | 4,276,379,242 | $ | 4,006,678,561 | |
| Shares outstanding | 671,043,343 | 228,083,082 | |||
| Net asset value per sharea | $ | 6.37 | $ | 17.57 | |
| Maximum offering price per share (net asset value per share ÷ 95.75%) | $ | 6.65 | $ | 18.35 | |
| Class C: | |||||
| Net assets, at value | $ | 1,052,119,900 | $ | 1,042,609,942 | |
| Shares outstanding | 166,205,037 | 59,634,912 | |||
| Net asset value and maximum offering price per sharea | $ | 6.33 | $ | 17.48 | |
| Class R: | |||||
| Net assets, at value | $ | 61,862,402 | $ | 93,364,688 | |
| Shares outstanding | 9,713,714 | 5,333,742 | |||
| Net asset value and maximum offering price per share. | $ | 6.37 | $ | 17.50 | |
| Class R6: | |||||
| Net assets, at value | $ | 467,686,837 | $ | 249,902,754 | |
| Shares outstanding | 73,160,173 | 14,129,392 | |||
| Net asset value and maximum offering price per share. | $ | 6.39 | $ | 17.69 | |
| Advisor Class: | |||||
| Net assets, at value | $ | 640,580,727 | $ | 666,995,792 | |
| Shares outstanding | 100,201,006 | 37,706,225 | |||
| Net asset value and maximum offering price per share. | $ | 6.39 | $ | 17.69 | |
aRedemption price is equal to net asset value less contingent deferred sales charges, if applicable.
102 Semiannual Report | The accompanying notes are an integral part of these financial statements. franklintempleton.com
| FRANKLIN CUSTODIAN FUNDS | |||||||||
| FINANCIAL STATEMENTS | |||||||||
| Statements of Operations | |||||||||
| for the six months ended March 31, 2016 (unaudited) | |||||||||
| Franklin | Franklin | Franklin | |||||||
| DynaTech Fund | Growth Fund | Income Fund | |||||||
| Investment income: | |||||||||
| Dividends | $ | 8,322,469 | $ | 92,616,645 | $ | 852,261,511 | |||
| Interest: | |||||||||
| Unaffiliated issuers | 4,069 | — | 1,169,150,027 | ||||||
| Non-controlled affiliates (Note 11) | — | — | 5,527,815 | ||||||
| Income from securities loaned (net of fees and rebates) | — | — | 591,187 | ||||||
| Total investment income | 8,326,538 | 92,616,645 | 2,027,530,540 | ||||||
| Expenses: | |||||||||
| Management fees (Note 3a) | 6,753,864 | 25,862,638 | 143,067,225 | ||||||
| Distribution fees: (Note 3c) | |||||||||
| Class A | 2,509,866 | 9,245,313 | 32,954,957 | ||||||
| Class C | 1,496,528 | 4,077,776 | 76,111,137 | ||||||
| Class R | 106,900 | 1,218,206 | 1,010,048 | ||||||
| Transfer agent fees: (Note 3e) | |||||||||
| Class A | 1,568,438 | 6,170,722 | 18,401,994 | ||||||
| Class C | 233,701 | 680,326 | 9,808,252 | ||||||
| Class R | 33,472 | 406,783 | 169,209 | ||||||
| Class R6 | 640 | 1,967 | 3,419 | ||||||
| Advisor Class. | 139,578 | 1,309,015 | 3,101,536 | ||||||
| Custodian fees (Note 4) | 21,032 | 50,653 | 512,481 | ||||||
| Reports to shareholders | 125,977 | 458,375 | 2,783,902 | ||||||
| Registration and filing fees | 110,714 | 188,960 | 1,084,180 | ||||||
| Professional fees | 25,931 | 60,026 | 264,265 | ||||||
| Trustees’ fees and expenses | 5,411 | 24,133 | 194,075 | ||||||
| Other | 16,285 | 76,351 | 565,237 | ||||||
| Total expenses | 13,148,337 | 49,831,244 | 290,031,917 | ||||||
| Expense reductions (Note 4) | — | (1,031 | ) | (3,418 | ) | ||||
| Expenses waived/paid by affiliates (Note 3f and 3g) | (120,085 | ) | (1,268,316 | ) | (956,890 | ) | |||
| Net expenses. | 13,028,252 | 48,561,897 | 289,071,609 | ||||||
| Net investment income (loss) | (4,701,714 | ) | 44,054,748 | 1,738,458,931 | |||||
| Realized and unrealized gains (losses): | |||||||||
| Net realized gain (loss) from: | |||||||||
| Investments: | |||||||||
| Unaffiliated issuers | (47,568,142 | ) | 227,141,195 | (2,649,544,192 | ) | ||||
| Non-controlled affiliates (Note 11) | — | — | 15,875,621 | ||||||
| Written options | — | — | 1,728,167 | ||||||
| Foreign currency transactions | 88,166 | (29,957 | ) | (408,137 | ) | ||||
| Net realized gain (loss) | (47,479,976 | ) | 227,111,238 | (2,632,348,541 | ) | ||||
| Net change in unrealized appreciation (depreciation) on: | |||||||||
| Investments | 100,052,662 | 329,121,959 | 3,414,116,334 | ||||||
| Translation of other assets and liabilities | |||||||||
| denominated in foreign currencies | 468 | 806 | 463,170 | ||||||
| Net change in unrealized appreciation (depreciation) | 100,053,130 | 329,122,765 | 3,414,579,504 | ||||||
| Net realized and unrealized gain (loss) | 52,573,154 | 556,234,003 | 782,230,963 | ||||||
| Net increase (decrease) in net assets resulting from operations | $ | 47,871,440 | $ | 600,288,751 | $ | 2,520,689,894 | |||
franklintempleton.com The accompanying notes are an integral part of these financial statements. | Semiannual Report 103
| FRANKLIN CUSTODIAN FUNDS | ||||||
| FINANCIAL STATEMENTS | ||||||
| Statements of Operations (continued) | ||||||
| for the six months ended March 31, 2016 (unaudited) | ||||||
| Franklin | ||||||
| U.S. Government | Franklin | |||||
| Securities Fund | Utilities Fund | |||||
| Investment income: | ||||||
| Dividends. | $ | — | $ | 97,045,412 | ||
| Interest | 123,832,824 | 1,571,228 | ||||
| Paydown gain (loss) | (25,704,819 | ) | — | |||
| Income from securities loaned (net of fees and rebates) | — | 27,183 | ||||
| Total investment income. | 98,128,005 | 98,643,823 | ||||
| Expenses: | ||||||
| Management fees (Note 3a) | 14,377,760 | 12,382,876 | ||||
| Distribution fees: (Note 3c) | ||||||
| Class A | 3,073,924 | 2,681,734 | ||||
| Class C | 3,372,874 | 3,053,475 | ||||
| Class R | 157,911 | 207,501 | ||||
| Transfer agent fees: (Note 3e) | ||||||
| Class A | 2,811,953 | 2,131,229 | ||||
| Class C | 695,608 | 560,032 | ||||
| Class R | 42,337 | 49,470 | ||||
| Class R6 | 882 | 1,660 | ||||
| Advisor Class | 426,978 | 338,740 | ||||
| Custodian fees (Note 4) | 27,187 | 36,733 | ||||
| Reports to shareholders | 243,377 | 233,717 | ||||
| Registration and filing fees | 89,790 | 114,928 | ||||
| Professional fees | 38,669 | 38,664 | ||||
| Trustees’ fees and expenses | 13,615 | 12,384 | ||||
| Other. | 304,224 | 40,840 | ||||
| Total expenses | 25,677,089 | 21,883,983 | ||||
| Expense reductions (Note 4) | (151 | ) | — | |||
| Expenses waived/paid by affiliates (Note 3f and 3g) | (167,897 | ) | (61,280 | ) | ||
| Net expenses | 25,509,041 | 21,822,703 | ||||
| Net investment income | 72,618,964 | 76,821,120 | ||||
| Realized and unrealized gains (losses): | ||||||
| Net realized gain (loss) from: | ||||||
| Investments: | ||||||
| Unaffiliated issuers | 5,457,673 | (45,655,125 | ) | |||
| Non-controlled affiliates (Note 11) | — | (9,237,297 | ) | |||
| Foreign currency transactions | — | (195,795 | ) | |||
| Net realized gain (loss) | 5,457,673 | (55,088,217 | ) | |||
| Net change in unrealized appreciation (depreciation) on: | ||||||
| Investments | (6,515,005 | ) | 748,461,103 | |||
| Translation of other assets and liabilities | ||||||
| denominated in foreign currencies | — | 55,151 | ||||
| Net change in unrealized appreciation (depreciation) | (6,515,005 | ) | 748,516,254 | |||
| Net realized and unrealized gain (loss) | (1,057,332 | ) | 693,428,037 | |||
| Net increase (decrease) in net assets resulting from operations | $ | 71,561,632 | $ | 770,249,157 | ||
104 Semiannual Report | The accompanying notes are an integral part of these financial statements. franklintempleton.com
| FRANKLIN CUSTODIAN FUNDS | ||||||||||||
| FINANCIAL STATEMENTS | ||||||||||||
| Statements of Changes in Net Assets | ||||||||||||
| Franklin DynaTech Fund | Franklin Growth Fund | |||||||||||
| Six Months Ended | Six Months Ended | |||||||||||
| March 31, 2016 | Year Ended | March 31, 2016 | Year Ended | |||||||||
| (unaudited) | September 30, 2015 | (unaudited) | September 30, 2015 | |||||||||
| Increase (decrease) in net assets: | ||||||||||||
| Operations: | ||||||||||||
| Net investment income (loss) | $ | (4,701,714 | ) | $ | (11,245,962 | ) | $ | 44,054,748 | $ | 45,073,798 | ||
| Net realized gain (loss) | (47,479,976 | ) | 76,713,788 | 227,111,238 | 443,524,958 | |||||||
| Net change in unrealized | ||||||||||||
| appreciation (depreciation) | 100,053,130 | (8,212,061 | ) | 329,122,765 | (201,921,374 | ) | ||||||
| Net increase (decrease) in net | ||||||||||||
| assets resulting from | ||||||||||||
| operations | 47,871,440 | 57,255,765 | 600,288,751 | 286,677,382 | ||||||||
| Distributions to shareholders from: | ||||||||||||
| Net investment income: | ||||||||||||
| Class A | — | — | (47,314,836 | ) | (17,701,413 | ) | ||||||
| Class R | — | — | (1,070,343 | ) | — | |||||||
| Class R6 | — | — | (13,934,301 | ) | (7,173,435 | ) | ||||||
| Advisor Class | — | — | (14,692,727 | ) | (7,135,723 | ) | ||||||
| Net realized gains: | ||||||||||||
| Class A | (50,280,147 | ) | (52,815,773 | ) | (236,450,622 | ) | — | |||||
| Class C | (8,550,949 | ) | (8,572,795 | ) | (27,988,492 | ) | — | |||||
| Class R | (1,147,436 | ) | (1,588,330 | ) | (15,909,617 | ) | — | |||||
| Class R6 | (9,395,944 | ) | (11,564,117 | ) | (38,078,959 | ) | — | |||||
| Advisor Class | (4,536,946 | ) | (5,461,764 | ) | (49,398,589 | ) | — | |||||
| Total distributions to shareholders | (73,911,422 | ) | (80,002,779 | ) | (444,838,486 | ) | (32,010,571 | ) | ||||
| Capital share transactions: (Note 2) | ||||||||||||
| Class A | 186,188,810 | 370,383,990 | 264,582,374 | 411,335,990 | ||||||||
| Class C | 41,948,661 | 64,529,697 | 47,154,779 | 105,104,211 | ||||||||
| Class R | (2,927,137 | ) | (2,196,266 | ) | (35,463,323 | ) | (82,225,233 | ) | ||||
| Class R6 | 5,432,951 | 18,888,470 | 64,538,731 | 26,817,282 | ||||||||
| Advisor Class | (21,470,131 | ) | 17,214,652 | 211,166,429 | 65,080,465 | |||||||
| Total capital share transactions | 209,173,154 | 468,820,543 | 551,978,990 | 526,112,715 | ||||||||
| Net increase (decrease) in net | ||||||||||||
| assets | 183,133,172 | 446,073,529 | 707,429,255 | 780,779,526 | ||||||||
| Net assets: | ||||||||||||
| Beginning of period | 2,710,248,152 | 2,264,174,623 | 11,142,901,919 | 10,362,122,393 | ||||||||
| End of period. | $ | 2,893,381,324 | $ | 2,710,248,152 | $ | 11,850,331,174 | $ | 11,142,901,919 | ||||
| Undistributed net investment income | ||||||||||||
| (loss) included in net assets: | ||||||||||||
| End of period. | $ | (13,222,990 | ) | $ | (8,521,276 | ) | $ | 5,166,366 | $ | 38,123,825 | ||
franklintempleton.com The accompanying notes are an integral part of these financial statements. | Semiannual Report 105
| FRANKLIN CUSTODIAN FUNDS | |||||||||||||||
| FINANCIAL STATEMENTS | |||||||||||||||
| Statements of Changes in Net Assets (continued) | |||||||||||||||
| Franklin U.S. Government | |||||||||||||||
| Franklin Income Fund | Securities Fund | ||||||||||||||
| Six Months Ended | Six Months Ended | ||||||||||||||
| March 31, 2016 | Year Ended | March 31, 2016 | Year Ended | ||||||||||||
| (unaudited) | September 30, 2015 | (unaudited) | September 30, 2015 | ||||||||||||
| Increase (decrease) in net assets: | |||||||||||||||
| Operations: | |||||||||||||||
| Net investment income. | $ | 1,738,458,931 | $ | 3,915,982,068 | $ | 72,618,964 | $ | 143,482,204 | |||||||
| Net realized gain (loss) | (2,632,348,541 | ) | (1,368,512,341 | ) | 5,457,673 | 6,672,945 | |||||||||
| Net change in unrealized | |||||||||||||||
| appreciation (depreciation) | 3,414,579,504 | (12,457,228,091 | ) | (6,515,005 | ) | (22,546,828 | ) | ||||||||
| Net increase (decrease) in net | |||||||||||||||
| assets resulting from | |||||||||||||||
| operations | 2,520,689,894 | (9,909,758,364 | ) | 71,561,632 | 127,608,321 | ||||||||||
| Distributions to shareholders from: | |||||||||||||||
| Net investment income: | |||||||||||||||
| Class A | (1,257,017,142 | ) | (2,619,399,527 | ) | (66,843,596 | ) | (139,163,796 | ) | |||||||
| Class C | (602,247,316 | ) | (1,251,131,091 | ) | (14,028,657 | ) | (31,007,890 | ) | |||||||
| Class R | (10,967,480 | ) | (23,492,505 | ) | (895,952 | ) | (2,057,369 | ) | |||||||
| Class R6 | (52,122,731 | ) | (106,712,525 | ) | (7,089,677 | ) | (13,473,393 | ) | |||||||
| Advisor Class | (219,619,712 | ) | (475,823,657 | ) | (10,546,896 | ) | (21,952,307 | ) | |||||||
| Total distributions to shareholders | (2,141,974,381 | ) | (4,476,559,305 | ) | (99,404,778 | ) | (207,654,755 | ) | |||||||
| Capital share transactions: (Note 2) | |||||||||||||||
| Class A | (1,631,135,778 | ) | (765,848,401 | ) | 127,151,449 | (102,856,884 | ) | ||||||||
| Class C | (1,238,670,464 | ) | (331,371,839 | ) | 16,511,028 | (136,825,329 | ) | ||||||||
| Class R | (29,919,210 | ) | (21,217,142 | ) | (2,536,460 | ) | (8,900,898 | ) | |||||||
| Class R6 | (47,508,890 | ) | (43,676,141 | ) | 93,731,010 | (117,420,534 | ) | ||||||||
| Advisor Class | (555,039,695 | ) | 96,674,297 | 21,010,159 | (22,480,703 | ) | |||||||||
| Total capital share transactions | (3,502,274,037 | ) | (1,065,439,226 | ) | 255,867,186 | (388,484,348 | ) | ||||||||
| Net increase (decrease) in net | |||||||||||||||
| assets | (3,123,558,524 | ) | (15,451,756,895 | ) | 228,024,040 | (468,530,782 | ) | ||||||||
| Net assets: | |||||||||||||||
| Beginning of period | 78,893,610,699 | 94,345,367,594 | 6,270,605,068 | 6,739,135,850 | |||||||||||
| End of period. | $ | 75,770,052,175 | $ | 78,893,610,699 | $ | 6,498,629,108 | $ | 6,270,605,068 | |||||||
| Undistributed net investment income | |||||||||||||||
| included in net assets: | |||||||||||||||
| End of period. | $ | — | $ | 2,068,832 | $ | — | $ | 294,091 | |||||||
| Distributions in excess of net investment | |||||||||||||||
| income included in net assets: | |||||||||||||||
| End of period. | $ | (401,446,618 | ) | $ | — | $ | (26,491,723 | ) | $ | — | |||||
106 Semiannual Report | The accompanying notes are an integral part of these financial statements. franklintempleton.com
| FRANKLIN CUSTODIAN FUNDS | ||||||
| FINANCIAL STATEMENTS | ||||||
| Statements of Changes in Net Assets (continued) | ||||||
| Franklin Utilities Fund | ||||||
| Six Months Ended | ||||||
| March 31, 2016 | Year Ended | |||||
| (unaudited) | September 30, 2015 | |||||
| Increase (decrease) in net assets: | ||||||
| Operations: | ||||||
| Net investment income | $ | 76,821,120 | $ | 164,273,927 | ||
| Net realized gain (loss) | (55,088,217 | ) | 167,117,130 | |||
| Net change in unrealized appreciation (depreciation) | 748,516,254 | (215,469,865 | ) | |||
| Net increase (decrease) in net assets resulting from operations | 770,249,157 | 115,921,192 | ||||
| Distributions to shareholders from: | ||||||
| Net investment income: | ||||||
| Class A | (59,464,618 | ) | (108,522,416 | ) | ||
| Class C | (13,340,482 | ) | (23,635,072 | ) | ||
| Class R | (1,237,512 | ) | (2,354,864 | ) | ||
| Class R6 | (3,786,340 | ) | (7,004,985 | ) | ||
| Advisor Class | (9,816,096 | ) | (17,855,048 | ) | ||
| Net realized gains: | ||||||
| Class A | (112,737,319 | ) | (94,563,421 | ) | ||
| Class C | (29,873,670 | ) | (25,193,710 | ) | ||
| Class R | (2,659,792 | ) | (2,392,646 | ) | ||
| Class R6 | (6,346,334 | ) | (5,738,511 | ) | ||
| Advisor Class | (17,570,610 | ) | (14,963,811 | ) | ||
| Total distributions to shareholders | (256,832,773 | ) | (302,224,484 | ) | ||
| Capital share transactions: (Note 2) | ||||||
| Class A | 141,231,096 | (68,305,043 | ) | |||
| Class C | 22,259,935 | (22,237,201 | ) | |||
| Class R | 2,480,132 | (9,199,737 | ) | |||
| Class R6 | 27,624,899 | (29,285,137 | ) | |||
| Advisor Class | 62,038,375 | 7,979,532 | ||||
| Total capital share transactions | 255,634,437 | (121,047,586 | ) | |||
| Net increase (decrease) in net assets | 769,050,821 | (307,350,878 | ) | |||
| Net assets: | ||||||
| Beginning of period | 5,290,500,916 | 5,597,851,794 | ||||
| End of period. | $ | 6,059,551,737 | $ | 5,290,500,916 | ||
| Undistributed net investment income included in net assets: | ||||||
| End of period. | $ | 1,529,601 | $ | 12,353,529 | ||
franklintempleton.com The accompanying notes are an integral part of these financial statements. | Semiannual Report 107
FRANKLIN CUSTODIAN FUNDS
Notes to Financial Statements (unaudited)
1. Organization and Significant Accounting Policies
Franklin Custodian Funds (Trust) is registered under the Investment Company Act of 1940 (1940 Act) as an open-end management investment company, consisting of five separate funds (Funds) and applies the specialized accounting and reporting guidance in U.S. Generally Accepted Accounting Principles (U.S. GAAP). The Funds offer five classes of shares: Class A, Class C, Class R, Class R6, and Advisor Class. Each class of shares differs by its initial sales load, contingent deferred sales charges, voting rights on matters affecting a single class, its exchange privilege and fees primarily due to differing arrangements for distribution and transfer agent fees.
The following summarizes the Funds’ significant accounting policies.
a. Financial Instrument Valuation
The Funds’ investments in financial instruments are carried at fair value daily. Fair value is the price that would be received to sell an asset or paid to transfer a liability in an orderly transaction between market participants on the measurement date. The Funds calculate the net asset value (NAV) per share as of 4 p.m. Eastern time each day the New York Stock Exchange (NYSE) is open for trading. Under compliance policies and procedures approved by the Trust’s Board of Trustees (the Board), the Funds’ administrator has responsibility for oversight of valuation, including leading the cross-functional Valuation and Liquidity Oversight Committee (VLOC). The VLOC provides administration and oversight of the Funds’ valuation policies and procedures, which are approved annually by the Board. Among other things, these procedures allow the Funds to utilize independent pricing services, quotations from securities and financial instrument dealers, and other market sources to determine fair value.
Equity securities and derivative financial instruments (derivatives) listed on an exchange or on the NASDAQ National Market System are valued at the last quoted sale price or the official closing price of the day, respectively. Foreign equity securities are valued as of the close of trading on the foreign stock exchange on which the security is primarily traded or as 4 p.m. Eastern time, whichever is earlier. The value is then converted into its U.S. dollar equivalent at the foreign exchange rate in effect at 4 p.m. Eastern time on the day that the value of the security is determined. Over-the-counter (OTC) securities are valued within the range of the most recent quoted bid and ask prices. Securities that trade in multiple markets or on multiple exchanges are valued according to the broadest and most representative market. Certain equity securities are valued based upon fundamental characteristics or relationships to similar securities.
Debt securities generally trade in the OTC market rather than on a securities exchange. The Funds’ pricing services use multiple valuation techniques to determine fair value. In instances where sufficient market activity exists, the pricing services may utilize a market-based approach through which quotes from market makers are used to determine fair value. In instances where sufficient market activity may not exist or is limited, the pricing services also utilize proprietary valuation models which may consider market characteristics such as benchmark yield curves, credit spreads, estimated default rates, anticipated market interest rate volatility, coupon rates, anticipated timing of principal repayments, underlying collateral, and other unique security features in order to estimate the relevant cash flows, which are then discounted to calculate the fair value. Securities denominated in a foreign currency are converted into their U.S. dollar equivalent at the foreign exchange rate in effect at 4 p.m. Eastern time on the date that the values of the foreign debt securities are determined.
Investments in open-end mutual funds are valued at the closing NAV. Repurchase agreements are valued at cost, which approximates fair value.
The Funds have procedures to determine the fair value of financial instruments for which market prices are not reliable or readily available. Under these procedures, the VLOC convenes on a regular basis to review such financial instruments and considers a number of factors, including significant unobservable valuation inputs, when arriving at fair value. The VLOC primarily employs a market-based approach which may use related or comparable assets or liabilities, recent transactions, market multiples, book values, and other relevant information for the investment to determine the fair value of the investment. An income-based valuation approach may also be used in which the anticipated future cash flows of the investment are discounted to calculate fair value. Discounts may also be applied due to the nature or duration of any restrictions on the disposition of the investments. Due to the inherent uncertainty of valuations of such investments, the fair values may differ significantly from the values that would have been used had an active market existed. The VLOC employs various methods for calibrating these valuation approaches including a
108 Semiannual Report
franklintempleton.com
FRANKLIN CUSTODIAN FUNDS
NOTES TO FINANCIAL STATEMENTS (UNAUDITED)
regular review of key inputs and assumptions, transactional back-testing or disposition analysis, and reviews of any related market activity.
Trading in securities on foreign securities stock exchanges and OTC markets may be completed before 4 p.m. Eastern time. In addition, trading in certain foreign markets may not take place on every NYSE business day. Occasionally, events occur between the time at which trading in a foreign security is completed and the close of the NYSE that might call into question the reliability of the value of a portfolio security held by the Fund. As a result, differences may arise between the value of the Funds’ portfolio securities as determined at the foreign market close and the latest indications of value at the close of the NYSE. In order to minimize the potential for these differences, the VLOC monitors price movements following the close of trading in foreign stock markets through a series of country specific market proxies (such as baskets of American Depositary Receipts, futures contracts and exchange traded funds). These price movements are measured against established trigger thresholds for each specific market proxy to assist in determining if an event has occurred that may call into question the reliability of the values of the foreign securities held by the Funds. If such an event occurs, the securities may be valued using fair value procedures, which may include the use of independent pricing services.
When the last day of the reporting period is a non-business day, certain foreign markets may be open on those days that the NYSE is closed, which could result in differences between the value of the Funds’ portfolio securities on the last business day and the last calendar day of the reporting period. Any significant security valuation changes due to an open foreign market are adjusted and reflected by the Funds for financial reporting purposes.
b. Foreign Currency Translation
Portfolio securities and other assets and liabilities denominated in foreign currencies are translated into U.S. dollars based on the exchange rate of such currencies against U.S. dollars on the date of valuation. The Funds may enter into foreign currency exchange contracts to facilitate transactions denominated in a foreign currency. Purchases and sales of securities, income and expense items denominated in foreign currencies are translated into U.S. dollars at the exchange rate in effect on the transaction date. Portfolio securities and assets and liabilities denominated in foreign currencies contain risks that those currencies will decline in value relative to the U.S. dollar. Occasionally, events may impact the availability or reliability of foreign exchange rates used to convert the U.S. dollar equivalent value. If such an event occurs, the foreign exchange rate will be valued at fair value using procedures established and approved by the Board.
The Funds do not separately report the effect of changes in foreign exchange rates from changes in market prices on securities held. Such changes are included in net realized and unrealized gain or loss from investments in the Statements of Operations.
Realized foreign exchange gains or losses arise from sales of foreign currencies, currency gains or losses realized between the trade and settlement dates on securities transactions and the difference between the recorded amounts of dividends, interest, and foreign withholding taxes and the U.S. dollar equivalent of the amounts actually received or paid. Net unrealized foreign exchange gains and losses arise from changes in foreign exchange rates on foreign denominated assets and liabilities other than investments in securities held at the end of the reporting period.
c. Joint Repurchase Agreement
Certain or all Funds enter into a joint repurchase agreement whereby their uninvested cash balance is deposited into a joint cash account with other funds managed by the investment manager or an affiliate of the investment manager and is used to invest in one or more repurchase agreements. The value and face amount of the joint repurchase agreement are allocated to the funds based on their pro-rata interest. A repurchase agreement is accounted for as a loan by the Fund to the seller, collateralized by securities which are delivered to the Funds’ custodian. The fair value, including accrued interest, of the initial collateralization is required to be at least 102% of the dollar amount invested by the funds, with the value of the underlying securities marked to market daily to maintain coverage of at least 100%. Repurchase agreements are subject to the terms of Master Repurchase Agreements (MRAs) with approved counterparties (sellers). The MRAs contain various provisions, including but not limited to events of default and maintenance of collateral for repurchase agreements. In the event of default by either the seller or the Funds, certain MRAs may permit the non-defaulting party to net and close-out all transactions, if any, traded under such agreements. The Funds may sell securities it holds as collateral and apply the proceeds towards the repurchase price and any other amounts owed by
franklintempleton.com
Semiannual Report 109
FRANKLIN CUSTODIAN FUNDS
NOTES TO FINANCIAL STATEMENTS (UNAUDITED)
1. Organization and Significant Accounting
Policies (continued)
c. Joint Repurchase Agreement (continued)
the seller to the Funds in the event of default by the seller. This could involve costs or delays in addition to a loss on the securities if their value falls below the repurchase price owed by the seller. The joint repurchase agreement held by the Funds at period end, as indicated in the Statements of Investments, had been entered into on March 31, 2016.
d. Securities Purchased on a When-Issued or Delayed Delivery Basis
Certain or all Funds purchase securities on a when-issued or delayed delivery basis, with payment and delivery scheduled for a future date. These transactions are subject to market fluctuations and are subject to the risk that the value at delivery may be more or less than the trade date purchase price. Although the Funds will generally purchase these securities with the intention of holding the securities, they may sell the securities before the settlement date. Sufficient assets have been segregated for these securities.
e. Derivative Financial Instruments
Certain or all Funds invested in derivatives in order to manage risk or gain exposure to various other investments or markets. Derivatives are financial contracts based on an underlying or notional amount, require no initial investment or an initial net investment that is smaller than would normally be required to have a similar response to changes in market factors, and require or permit net settlement. Derivatives contain various risks including the potential inability of the counterparty to fulfill their obligations under the terms of the contract, the potential for an illiquid secondary market, and/or the potential for market movements which expose the Fund to gains or losses in excess of the amounts shown in the Statements of Assets and Liabilities. Realized gain and loss and unrealized appreciation and depreciation on these contracts for the period are included in the Statements of Operations.
Collateral requirements differ by type of derivative. Collateral or initial margin requirements are set by the broker or exchange clearing house for exchange traded and centrally cleared derivatives. Initial margin deposited is held at the exchange and can be in the form of cash and/or securities.
Certain or all Funds purchased or wrote exchange traded option contracts primarily to manage exposure to equity price risk. An option is a contract entitling the holder to purchase or sell a specific amount of shares or units of an asset or notional amount of a swap (swaption), at a specified price. When an option is purchased or written, an amount equal to the premium paid or received is recorded as an asset or liability, respectively. Upon exercise of an option, the acquisition cost or sales proceeds of the underlying investment is adjusted by any premium received or paid. Upon expiration of an option, any premium received or paid is recorded as a realized gain or loss. Upon closing an option other than through expiration or exercise, the difference between the premium received or paid and the cost to close the position is recorded as a realized gain or loss.
See Notes 6 and 10 regarding investment transactions and other derivative information, respectively.
f. Equity-Linked Securities
Certain or all Funds invest in equity-linked securities. Equity-linked securities are hybrid financial instruments that generally combine both debt and equity characteristics into a single note form. Income received from equity-linked securities is recorded as realized gains in the Statements of Operations and may be based on the performance of an underlying equity security, an equity index, or an option position. The risks of investing in equity-linked securities include unfavorable price movements in the underlying security and the credit risk of the issuing financial institution. There may be no guarantee of a return of principal with equity-linked securities and the appreciation potential may be limited. Equity-linked securities may be more volatile and less liquid than other investments held by the Funds.
g. Securities Lending
Certain or all Funds participate in an agency based securities lending program to earn additional income. The Fund receives cash collateral against the loaned securities in an amount equal to at least 102% of the fair value of the loaned securities. Collateral is maintained over the life of the loan in an amount not less than 100% of the fair value of loaned securities, as determined at the close of Fund business each day; any additional collateral required due to changes in security values is delivered to the Fund on the next business day. The collateral is deposited into a joint cash account with other funds and is used to invest in a money market fund managed by Franklin Advisers, Inc., an affiliate of the Funds, and/or a joint
110 Semiannual Report
franklintempleton.com
FRANKLIN CUSTODIAN FUNDS
NOTES TO FINANCIAL STATEMENTS (UNAUDITED)
repurchase agreement. The Fund may receive income from the investment of cash collateral, in addition to lending fees and rebates paid by the borrower. Income from securities loaned, net of fees paid to the securities lending agent and/or third-party vendor, is reported separately in the Statements of Operations. The Fund bears the market risk with respect to the collateral investment, securities loaned, and the risk that the agent may default on its obligations to the Fund. If the borrower defaults on its obligation to return the securities loaned, the Fund has the right to repurchase the securities in the open market using the collateral received. The securities lending agent has agreed to indemnify the Fund in the event of default by a third party borrower.
Securities lending transactions are accounted for as secured borrowing transactions. The securities out on loan represent the collateral pledged by the Fund, and the cash collateral received for the loaned securities represents the amount borrowed by the Fund. At March 31, 2016, the Funds’ secured borrowing transactions were as follows:
| Franklin | Franklin | |||
| Income | Utilities | |||
| Fund | Fund | |||
| Securities lending transactionsa,b: | ||||
| Equity investments | $ | — | $ | 3,775,601 |
| Corporate bonds and notes | 23,398,370 | — |
aThe agreements open at period end can be terminated at any time.
bGross amount of recognized liabilities for securities lending transactions is included
in payable upon return of securities loaned in the Statements of Assets and
Liabilities.
h. Mortgage Dollar Rolls
Certain or all Funds enter into mortgage dollar rolls, typically on a to-be-announced basis. Mortgage dollar rolls are agreements between the Fund and a financial institution to simultaneously sell and repurchase mortgage-backed securities at a future date. Gains or losses are realized on the initial sale, and the difference between the repurchase price and the sale price is recorded as an unrealized gain or loss to the Fund upon entering into the mortgage dollar roll. In addition, the Fund may invest the cash proceeds that are received from the initial sale. During the period between the sale and repurchase, the Fund is not entitled to principal and interest paid on the mortgage backed securities. The risks of mortgage dollar roll transactions include the potential inability of the counterparty to fulfill its obligations.
i. Senior Floating Rate Interests
Certain or all Funds invest in senior secured corporate loans that pay interest at rates which are periodically reset by reference to a base lending rate plus a spread. These base lending rates are generally the prime rate offered by a designated U.S. bank or the London InterBank Offered Rate (LIBOR). Senior secured corporate loans often require prepayment of principal from excess cash flows or at the discretion of the borrower. As a result, actual maturity may be substantially less than the stated maturity. Senior secured corporate loans in which the Funds invest are generally readily marketable, but may be subject to certain restrictions on resale.
j. Income and Deferred Taxes
It is each Fund’s policy to qualify as a regulated investment company under the Internal Revenue Code. Each Fund intends to distribute to shareholders substantially all of its taxable income and net realized gains to relieve it from federal income and excise taxes. As a result, no provision for U.S. federal income taxes is required.
The Funds may be subject to foreign taxation related to income received, capital gains on the sale of securities and certain foreign currency transactions in the foreign jurisdictions in which the Funds invest. Foreign taxes, if any, are recorded based on the tax regulations and rates that exist in the foreign markets in which the Funds invest. When a capital gain tax is determined to apply, certain or all Funds record an estimated deferred tax liability in an amount that would be payable if the securities were disposed of on the valuation date. As a result of several court cases, in certain countries across the European Union, the Funds have filed additional tax reclaims for previously withheld taxes on dividends earned in those countries. These additional filings are subject to various administrative proceedings by the local jurisdictions’ tax authorities within the European Union, as well as a number of related judicial proceedings. At this time, uncertainty exists as to the ultimate resolution of these proceedings, the likelihood of receipt of these reclaims, and the potential timing of payment, and accordingly, no amounts are reflected in the financial statements.
Each Fund may recognize an income tax liability related to its uncertain tax positions under U.S. GAAP when the uncertain tax position has a less than 50% probability that it will be sustained upon examination by the tax authorities based on its technical merits. As of March 31, 2016, each Fund has
franklintempleton.com
Semiannual Report 111
FRANKLIN CUSTODIAN FUNDS
NOTES TO FINANCIAL STATEMENTS (UNAUDITED)
1. Organization and Significant Accounting
Policies (continued)
j. Income and Deferred Taxes (continued)
determined that no tax liability is required in its financial statements related to uncertain tax positions for any open tax years (or expected to be taken on future tax returns). Open tax years are those that remain subject to examination and are based on each tax jurisdiction’s statute of limitation.
k. Security Transactions, Investment Income, Expenses and Distributions
Security transactions are accounted for on trade date. Realized gains and losses on security transactions are determined on a specific identification basis. Interest income and estimated expenses are accrued daily. Amortization of premium and accretion of discount on debt securities are included in interest income. Paydown gains and losses are recorded separately in the Statements of Operations. Facility fees are recognized as income over the expected term of the loan. Dividend income is recorded on the ex-dividend date except for certain dividends from foreign securities where the dividend rate is not available. In such cases, the dividend is recorded as soon as the information is received by the Funds. Distributions to shareholders are recorded on the ex-dividend date and are determined according to income tax regulations (tax basis). Distributable earnings determined on a tax basis may differ from earnings recorded in accordance with U.S. GAAP. These differences may be permanent or temporary. Permanent differences are reclassified among capital accounts to reflect their tax character. These reclassifications have no impact on net assets or the results of operations. Temporary differences are not reclassified, as they may reverse in subsequent periods.
Common expenses incurred by the Trust are allocated among the Funds based on the ratio of net assets of each Fund to the combined net assets of the Trust. Fund specific expenses are charged directly to the Fund that incurred the expense.
Realized and unrealized gains and losses and net investment income, not including class specific expenses, are allocated daily to each class of shares based upon the relative proportion of net assets of each class. Differences in per share distributions, by class, are generally due to differences in class specific expenses.
l. Accounting Estimates
The preparation of financial statements in accordance with U.S. GAAP requires management to make estimates and assumptions that affect the reported amounts of assets and liabilities at the date of the financial statements and the amounts of income and expenses during the reporting period. Actual results could differ from those estimates.
m. Guarantees and Indemnifications
Under the Trust’s organizational documents, its officers and trustees are indemnified by the Trust against certain liabilities arising out of the performance of their duties to the Trust. Additionally, in the normal course of business, the Trust, on behalf of the Funds, enters into contracts with service providers that contain general indemnification clauses. The Trust’s maximum exposure under these arrangements is unknown as this would involve future claims that may be made against the Trust that have not yet occurred. Currently, the Trust expect the risk of loss to be remote.
112 Semiannual Report
franklintempleton.com
FRANKLIN CUSTODIAN FUNDS
NOTES TO FINANCIAL STATEMENTS (UNAUDITED)
2. Shares of Beneficial Interest
At March 31, 2016, there were an unlimited number of shares authorized (without par value). Transactions in the Funds’ shares were as follows:
| Franklin DynaTech Fund | Franklin Growth Fund | |||||||||
| Shares | Amount | Shares | Amount | |||||||
| Class A Shares: | ||||||||||
| Six Months ended March 31, 2016 | ||||||||||
| Shares sold. | 8,190,167 | $ | 386,690,692 | 8,813,575 | $ | 644,252,929 | ||||
| Shares issued in reinvestment of distributions | 934,041 | 46,730,097 | 3,458,557 | 261,017,261 | ||||||
| Shares issued on reorganization (Note 12) | — | — | 314,663 | 18,982,031 | ||||||
| Shares redeemed | (5,345,500 | ) | (247,231,979 | ) | (9,139,588 | ) | (659,669,847 | ) | ||
| Net increase (decrease) | 3,778,708 | $ | 186,188,810 | 3,447,207 | $ | 264,582,374 | ||||
| Year ended September 30, 2015 | ||||||||||
| Shares sold. | 18,501,749 | $ | 892,063,000 | 21,692,171 | $ | 1,636,207,846 | ||||
| Shares issued in reinvestment of distributions | 1,036,739 | 48,011,508 | 215,218 | 16,016,600 | ||||||
| Shares redeemed | (11,831,219 | ) | (569,690,518 | ) | (16,414,655 | ) | (1,240,888,456 | ) | ||
| Net increase (decrease) | 7,707,269 | $ | 370,383,990 | 5,492,734 | $ | 411,335,990 | ||||
| Class C Shares: | ||||||||||
| Six Months ended March 31, 2016 | ||||||||||
| Shares sold. | 1,544,031 | $ | 63,078,493 | 1,548,777 | $ | 105,270,049 | ||||
| Shares issued in reinvestment of distributions | 187,219 | 8,097,222 | 364,919 | 25,617,345 | ||||||
| Shares issued on reorganization (Note 12) | — | — | 57,203 | 3,204,287 | ||||||
| Shares redeemed | (738,255 | ) | (29,227,054 | ) | (1,303,995 | ) | (86,936,902 | ) | ||
| Net increase (decrease) | 992,995 | $ | 41,948,661 | 666,904 | $ | 47,154,779 | ||||
| Year ended September 30, 2015 | ||||||||||
| Shares sold. | 2,327,658 | $ | 98,622,323 | 3,260,956 | $ | 229,365,295 | ||||
| Shares issued in reinvestment of distributions | 197,997 | 8,016,890 | — | — | ||||||
| Shares redeemed | (1,005,267 | ) | (42,109,516 | ) | (1,761,541 | ) | (124,261,084 | ) | ||
| Net increase (decrease) | 1,520,388 | $ | 64,529,697 | 1,499,415 | $ | 105,104,211 | ||||
| Class R Shares: | ||||||||||
| Six Months ended March 31, 2016 | ||||||||||
| Shares sold. | 108,247 | $ | 4,980,546 | 530,867 | $ | 38,528,581 | ||||
| Shares issued in reinvestment of distributions | 23,085 | 1,131,862 | 220,024 | 16,556,807 | ||||||
| Shares issued on reorganization (Note 12) | — | — | 137 | 7,135 | ||||||
| Shares redeemed | (194,708 | ) | (9,039,545 | ) | (1,245,116 | ) | (90,555,846 | ) | ||
| Net increase (decrease) | (63,376 | ) | $ | (2,927,137 | ) | (494,088 | ) | $ | (35,463,323 | ) |
| Year ended September 30, 2015 | ||||||||||
| Shares sold. | 176,420 | $ | 8,339,480 | 1,222,443 | $ | 91,843,479 | ||||
| Shares issued in reinvestment of distributions | 34,518 | 1,571,239 | — | — | ||||||
| Shares redeemed | (256,145 | ) | (12,106,985 | ) | (2,319,903 | ) | (174,068,712 | ) | ||
| Net increase (decrease) | (45,207 | ) | $ | (2,196,266 | ) | (1,097,460 | ) | $ | (82,225,233 | ) |
franklintempleton.com
Semiannual Report 113
| FRANKLIN CUSTODIAN FUNDS | ||||||||||||
| NOTES TO FINANCIAL STATEMENTS (UNAUDITED) | ||||||||||||
| 2. Shares of Beneficial Interest (continued) | ||||||||||||
| Franklin DynaTech Fund | Franklin Growth Fund | |||||||||||
| Shares | Amount | Shares | Amount | |||||||||
| Class R6 Shares: | ||||||||||||
| Six Months ended March 31, 2016 | ||||||||||||
| Shares sold. | 891,635 | $ | 42,540,579 | 1,042,583 | $ | 77,309,402 | ||||||
| Shares issued in reinvestment of distributions | 183,157 | 9,395,944 | 637,359 | 48,088,702 | ||||||||
| Shares redeemed | (983,643 | ) | (46,503,572 | ) | (824,386 | ) | (60,859,373 | ) | ||||
| Net increase (decrease) | 91,149 | $ | 5,432,951 | 855,556 | $ | 64,538,731 | ||||||
| Year ended September 30, 2015 | ||||||||||||
| Shares sold. | 498,228 | $ | 24,243,849 | 1,852,609 | $ | 140,977,540 | ||||||
| Shares issued in reinvestment of distributions | 244,640 | 11,564,117 | 88,714 | 6,605,680 | ||||||||
| Shares redeemed | (341,976 | ) | (16,919,496 | ) | (1,593,869 | ) | (120,765,938 | ) | ||||
| Net increase (decrease) | 400,892 | $ | 18,888,470 | 347,454 | $ | 26,817,282 | ||||||
| Advisor Class Shares: | ||||||||||||
| Six Months ended March 31, 2016 | ||||||||||||
| Shares sold. | 749,831 | $ | 35,580,462 | 2,052,811 | $ | 174,375,550 | ||||||
| Shares issued in reinvestment of distributions | 84,067 | 4,294,126 | 801,297 | 60,554,033 | ||||||||
| Shares issued on reorganization (Note 12) | — | — | 2,254,565 | 136,327,485 | ||||||||
| Shares redeemed | (1,344,942 | ) | (61,344,719 | ) | (2,219,908 | ) | (160,090,639 | ) | ||||
| Net increase (decrease) | (511,044 | ) | $ | (21,470,131 | ) | 2,888,765 | $ | 211,166,429 | ||||
| Year ended September 30, 2015 | ||||||||||||
| Shares sold. | 1,507,866 | $ | 73,683,045 | 5,277,691 | $ | 400,540,494 | ||||||
| Shares issued in reinvestment of distributions | 109,767 | 5,174,431 | 89,253 | 6,652,935 | ||||||||
| Shares redeemed | (1,264,457 | ) | (61,642,824 | ) | (4,525,051 | ) | (342,112,964 | ) | ||||
| Net increase (decrease) | 353,176 | $ | 17,214,652 | 842,163 | $ | 65,080,465 | ||||||
| Franklin U.S. Government | ||||||||||||
| Franklin Income Fund | Securities Fund | |||||||||||
| Shares | Amount | Shares | Amount | |||||||||
| Class A Shares: | ||||||||||||
| Six Months ended March 31, 2016 | ||||||||||||
| Shares sold | 1,230,259,788 | $ | 2,566,719,361 | 74,075,268 | $ | 472,685,102 | ||||||
| Shares issued in reinvestment of distributions | 547,497,210 | 1,150,539,554 | 8,879,915 | 56,579,249 | ||||||||
| Shares redeemed | (2,554,946,242 | ) | (5,348,394,693 | ) | (63,015,679 | ) | (402,112,902 | ) | ||||
| Net increase (decrease) | (777,189,244 | ) | $ | (1,631,135,778 | ) | 19,939,504 | $ | 127,151,449 | ||||
| Year ended September 30, 2015 | ||||||||||||
| Shares sold | 2,723,862,225 | $ | 6,464,708,282 | 99,038,940 | $ | 641,302,319 | ||||||
| Shares issued in reinvestment of distributions | 990,884,317 | 2,344,531,358 | 17,899,302 | 115,836,536 | ||||||||
| Shares redeemed | (4,082,116,553 | ) | (9,575,088,041 | ) | (132,675,658 | ) | (859,995,739 | ) | ||||
| Net increase (decrease) | (367,370,011 | ) | $ | (765,848,401 | ) | (15,737,416 | ) | $ | (102,856,884 | ) | ||
114 Semiannual Report
franklintempleton.com
| FRANKLIN CUSTODIAN FUNDS | |||||||||||
| NOTES TO FINANCIAL STATEMENTS (UNAUDITED) | |||||||||||
| Franklin U.S. Government | |||||||||||
| Franklin Income Fund | Securities Fund | ||||||||||
| Shares | Amount | Shares | Amount | ||||||||
| Class C Shares: | |||||||||||
| Six Months ended March 31, 2016 | |||||||||||
| Shares sold | 565,993,217 | $ | 1,196,721,031 | 19,855,669 | $ | 125,832,935 | |||||
| Shares issued in reinvestment of distributions | 245,425,095 | 521,367,847 | 1,966,508 | 12,451,211 | |||||||
| Shares redeemed | (1,396,762,119 | ) | (2,956,759,342 | ) | (19,211,535 | ) | (121,773,118 | ) | |||
| Net increase (decrease) | (585,343,807 | ) | $ | (1,238,670,464 | ) | 2,610,642 | $ | 16,511,028 | |||
| Year ended September 30, 2015 | |||||||||||
| Shares sold | 1,515,518,749 | $ | 3,644,318,312 | 21,009,366 | $ | 135,074,176 | |||||
| Shares issued in reinvestment of distributions | 444,186,624 | 1,062,744,412 | 4,258,005 | 27,388,271 | |||||||
| Shares redeemed | (2,129,021,084 | ) | (5,038,434,563 | ) | (46,483,636 | ) | (299,287,776 | ) | |||
| Net increase (decrease) | (169,315,711 | ) | $ | (331,371,839 | ) | (21,216,265 | ) | $ | (136,825,329 | ) | |
| Class R Shares: | |||||||||||
| Six Months ended March 31, 2016 | |||||||||||
| Shares sold | 16,761,942 | $ | 34,506,605 | 2,676,313 | $ | 17,065,060 | |||||
| Shares issued in reinvestment of distributions | 5,050,576 | 10,437,649 | 134,065 | 853,758 | |||||||
| Shares redeemed | (36,414,988 | ) | (74,863,464 | ) | (3,209,524 | ) | (20,455,278 | ) | |||
| Net increase (decrease) | (14,602,470 | ) | $ | (29,919,210 | ) | (399,146 | ) | $ | (2,536,460 | ) | |
| Year ended September 30, 2015 | |||||||||||
| Shares sold | 45,090,049 | $ | 105,356,612 | 2,921,544 | $ | 18,930,156 | |||||
| Shares issued in reinvestment of distributions | 9,620,381 | 22,391,889 | 304,019 | 1,967,188 | |||||||
| Shares redeemed | (64,261,612 | ) | (148,965,643 | ) | (4,600,896 | ) | (29,798,242 | ) | |||
| Net increase (decrease) | (9,551,182 | ) | $ | (21,217,142 | ) | (1,375,333 | ) | $ | (8,900,898 | ) | |
| Class R6 Shares: | |||||||||||
| Six Months ended March 31, 2016 | |||||||||||
| Shares sold | 13,246,225 | $ | 27,507,115 | 16,920,343 | $ | 108,276,284 | |||||
| Shares issued in reinvestment of distributions | 24,025,979 | 50,036,997 | 1,055,934 | 6,749,149 | |||||||
| Shares redeemed | (61,850,368 | ) | (125,053,002 | ) | (3,325,972 | ) | (21,294,423 | ) | |||
| Net increase (decrease) | (24,578,164 | ) | $ | (47,508,890 | ) | 14,650,305 | $ | 93,731,010 | |||
| Year ended September 30, 2015 | |||||||||||
| Shares sold | 17,167,618 | $ | 40,192,542 | 14,239,234 | $ | 92,767,162 | |||||
| Shares issued in reinvestment of distributions | 43,733,583 | 102,667,315 | 1,973,225 | 12,808,747 | |||||||
| Shares redeemed | (81,471,526 | ) | (186,535,998 | ) | (34,161,637 | ) | (222,996,443 | ) | |||
| Net increase (decrease) | (20,570,325 | ) | $ | (43,676,141 | ) | (17,949,178 | ) | $ | (117,420,534 | ) | |
| Advisor Class Shares: | |||||||||||
| Six Months ended March 31, 2016 | |||||||||||
| Shares sold | 459,228,224 | $ | 950,355,761 | 15,735,736 | $ | 100,771,913 | |||||
| Shares issued in reinvestment of distributions | 91,120,847 | 189,882,708 | 1,438,057 | 9,191,381 | |||||||
| Shares redeemed | (817,788,102 | ) | (1,695,278,164 | ) | (13,898,159 | ) | (88,953,135 | ) | |||
| Net increase (decrease) | (267,439,031 | ) | $ | (555,039,695 | ) | 3,275,634 | $ | 21,010,159 | |||
| Year ended September 30, 2015 | |||||||||||
| Shares sold | 1,046,052,890 | $ | 2,467,625,168 | 27,570,106 | $ | 179,399,346 | |||||
| Shares issued in reinvestment of distributions | 173,756,747 | 407,768,104 | 2,960,236 | 19,220,147 | |||||||
| Shares redeemed | (1,200,237,331 | ) | (2,778,718,975 | ) | (33,965,158 | ) | (221,100,196 | ) | |||
| Net increase (decrease) | 19,572,306 | $ | 96,674,297 | (3,434,816 | ) | $ | (22,480,703 | ) | |||
franklintempleton.com
Semiannual Report 115
FRANKLIN CUSTODIAN FUNDS
NOTES TO FINANCIAL STATEMENTS (UNAUDITED)
| 2. Shares of Beneficial Interest (continued) | ||||||
| Franklin Utilities Fund | ||||||
| Shares | Amount | |||||
| Class A Shares: | ||||||
| Six Months ended March 31, 2016 | ||||||
| Shares sold | 21,371,267 | $ | 346,384,248 | |||
| Shares issued in reinvestment of distributions. | 10,282,898 | 159,735,261 | ||||
| Shares redeemed | (22,787,300 | ) | (364,888,413 | ) | ||
| Net increase (decrease) | 8,866,865 | $ | 141,231,096 | |||
| Year ended September 30, 2015 | ||||||
| Shares sold | 42,258,371 | $ | 726,023,381 | |||
| Shares issued in reinvestment of distributions. | 10,958,781 | 185,109,264 | ||||
| Shares redeemed | (58,276,559 | ) | (979,437,688 | ) | ||
| Net increase (decrease) | (5,059,407 | ) | $ | (68,305,043 | ) | |
| Class C Shares: | ||||||
| Six Months ended March 31, 2016 | ||||||
| Shares sold | 5,022,591 | $ | 80,483,456 | |||
| Shares issued in reinvestment of distributions. | 2,366,273 | 36,579,557 | ||||
| Shares redeemed | (5,970,650 | ) | (94,803,078 | ) | ||
| Net increase (decrease) | 1,418,214 | $ | 22,259,935 | |||
| Year ended September 30, 2015 | ||||||
| Shares sold | 9,428,768 | $ | 161,040,132 | |||
| Shares issued in reinvestment of distributions. | 2,420,296 | 40,798,650 | ||||
| Shares redeemed | (13,401,139 | ) | (224,075,983 | ) | ||
| Net increase (decrease) | (1,552,075 | ) | $ | (22,237,201 | ) | |
| Class R Shares: | ||||||
| Six Months ended March 31, 2016 | ||||||
| Shares sold | 985,574 | $ | 16,083,448 | |||
| Shares issued in reinvestment of distributions. | 244,400 | 3,781,507 | ||||
| Shares redeemed | (1,092,718 | ) | (17,384,823 | ) | ||
| Net increase (decrease) | 137,256 | $ | 2,480,132 | |||
| Year ended September 30, 2015 | ||||||
| Shares sold | 2,047,309 | $ | 34,931,594 | |||
| Shares issued in reinvestment of distributions. | 272,659 | 4,601,120 | ||||
| Shares redeemed | (2,904,134 | ) | (48,732,451 | ) | ||
| Net increase (decrease) | (584,166 | ) | $ | (9,199,737 | ) | |
| Class R6 Shares: | ||||||
| Six Months ended March 31, 2016 | ||||||
| Shares sold | 1,697,999 | $ | 28,250,832 | |||
| Shares issued in reinvestment of distributions. | 647,234 | 10,132,674 | ||||
| Shares redeemed | (648,987 | ) | (10,758,607 | ) | ||
| Net increase (decrease) | 1,696,246 | $ | 27,624,899 | |||
| Year ended September 30, 2015 | ||||||
| Shares sold | 1,511,769 | $ | 26,223,112 | |||
| Shares issued in reinvestment of distributions. | 749,780 | 12,743,496 | ||||
| Shares redeemed | (4,004,853 | ) | (68,251,745 | ) | ||
| Net increase (decrease) | (1,743,304 | ) | $ | (29,285,137 | ) | |
116 Semiannual Report
franklintempleton.com
FRANKLIN CUSTODIAN FUNDS
NOTES TO FINANCIAL STATEMENTS (UNAUDITED)
| Franklin Utilities Fund | |||||
| Shares | Amount | ||||
| Advisor Class Shares: | |||||
| Six Months ended March 31, 2016 | |||||
| Shares sold | 6,986,194 | $ | 114,262,284 | ||
| Shares issued in reinvestment of distributions. | 1,635,379 | 25,600,262 | |||
| Shares redeemed | (4,856,932 | ) | (77,824,171 | ) | |
| Net increase (decrease) | 3,764,641 | $ | 62,038,375 | ||
| Year ended September 30, 2015 | |||||
| Shares sold | 11,264,405 | $ | 194,715,849 | ||
| Shares issued in reinvestment of distributions. | 1,799,910 | 30,585,241 | |||
| Shares redeemed | (12,829,193 | ) | (217,321,558 | ) | |
| Net increase (decrease) | 235,122 | $ | 7,979,532 | ||
3. Transactions with Affiliates
Franklin Resources, Inc. is the holding company for various subsidiaries that together are referred to as Franklin Templeton Investments. Certain officers and trustees of the Trust are also officers and/or directors of the following subsidiaries:
| Subsidiary | Affiliation |
| Franklin Advisers, Inc. (Advisers) | Investment manager |
| Franklin Templeton Services, LLC (FT Services) | Administrative manager |
| Franklin Templeton Distributors, Inc. (Distributors) | Principal underwriter |
| Franklin Templeton Investor Services, LLC (Investor Services) | Transfer agent |
a. Management Fees
Franklin Income Fund and Franklin Utilities Fund pay an investment management fee to Advisers based on the month-end net assets of each of the Funds as follows:
| Annualized Fee Rate | Net Assets | |
| 0.625 | % | Up to and including $100 million |
| 0.500 | % | Over $100 million, up to and including $250 million |
| 0.450 | % | Over $250 million, up to and including $7.5 billion |
| 0.440 | % | Over $7.5 billion, up to and including $10 billion |
| 0.430 | % | Over $10 billion, up to and including $12.5 billion |
| 0.420 | % | Over $12.5 billion, up to and including $15 billion |
| 0.400 | % | Over $15 billion, up to and including $17.5 billion |
| 0.380 | % | Over $17.5 billion, up to and including $20 billion |
| 0.360 | % | Over $20 billion, up to and including $35 billion |
| 0.355 | % | Over $35 billion, up to and including $50 billion |
| 0.350 | % | Over $50 billion, up to and including $65 billion |
| 0.345 | % | Over $65 billion, up to and including $80 billion |
| 0.340 | % | In excess of $80 billion |
franklintempleton.com
Semiannual Report 117
FRANKLIN CUSTODIAN FUNDS
NOTES TO FINANCIAL STATEMENTS (UNAUDITED)
| 3. | Transactions with Affiliates (continued) |
| a. | Management Fees (continued) |
Franklin DynaTech Fund, Franklin Growth Fund and Franklin U.S. Government Securities Fund pay an investment management fee to Advisers based on the month-end net assets of each of the Funds as follows:
| Annualized Fee Rate | Net Assets | |
| 0.625 | % | Up to and including $100 million |
| 0.500 | % | Over $100 million, up to and including $250 million |
| 0.450 | % | Over $250 million, up to and including $7.5 billion |
| 0.440 | % | Over $7.5 billion, up to and including $10 billion |
| 0.430 | % | Over $10 billion, up to and including $12.5 billion |
| 0.420 | % | Over $12.5 billion, up to and including $15 billion |
| 0.400 | % | Over $15 billion, up to and including $17.5 billion |
| 0.380 | % | Over $17.5 billion, up to and including $20 billion |
| 0.360 | % | Over $20 billion, up to and including $35 billion |
| 0.355 | % | Over $35 billion, up to and including $50 billion |
| 0.350 | % | In excess of $50 billion |
For the period ended March 31, 2016, each Fund’s annualized effective investment management fee rate based on average daily net assets was as follows:
| Franklin | ||||||||||
| Franklin | Franklin | Franklin | U.S. Government | Franklin | ||||||
| DynaTech Fund | Growth Fund | Income Fund | Securities Fund | Utilities Fund | ||||||
| 0.465 | % | 0.451 | % | 0.373 | % | 0.455 | % | 0.461 | % | |
| b. | Administrative Fees | |||||||||
Under an agreement with Advisers, FT Services provides administrative services to the Funds. The fee is paid by Advisers based on each of the Funds’ average daily net assets, and is not an additional expense of the Funds.
c. Distribution Fees
The Board has adopted distribution plans for each share class, with the exception of Class R6 and Advisor Class shares, pursuant to Rule 12b-1 under the 1940 Act. Under the Funds’ Class A reimbursement distribution plans, the Funds reimburse Distributors for costs incurred in connection with the servicing, sale and distribution of each Fund’s shares up to the maximum annual plan rate for each class. Under the Class A reimbursement distribution plans, costs exceeding the maximum for the current plan year cannot be reimbursed in subsequent periods. In addition, under the Funds’ Class C and R compensation distribution plans, the Funds pay Distributors for costs incurred in connection with the servicing, sale and distribution of each Fund’s shares up to the maximum annual plan rate for each class. The plan year, for purposes of monitoring compliance with the maximum annual plan rates, is February 1 through January 31 for each Fund.
118 Semiannual Report
franklintempleton.com
FRANKLIN CUSTODIAN FUNDS
NOTES TO FINANCIAL STATEMENTS (UNAUDITED)
The maximum annual plan rates, based on the average daily net assets, for each class, are as follows:
| Franklin | ||||||||||
| Franklin | Franklin | Franklin | U.S. Government | Franklin | ||||||
| DynaTech Fund | Growth Fund | Income Fund | Securities Fund | Utilities Fund | ||||||
| Reimbursement Plans: | ||||||||||
| Class A | 0.25 | % | 0.25 | % | 0.15 | % | 0.15 | % | 0.15 | % |
| Compensation Plans: | ||||||||||
| Class C | 1.00 | % | 1.00 | % | 0.65 | % | 0.65 | % | 0.65 | % |
| Class R | 0.50 | % | 0.50 | % | 0.50 | % | 0.50 | % | 0.50 | % |
d. Sales Charges/Underwriting Agreements
Front-end sales charges and contingent deferred sales charges (CDSC) do not represent expenses of the Funds. These charges are deducted from the proceeds of sales of fund shares prior to investment or from redemption proceeds prior to remittance, as applicable. Distributors has advised the Funds of the following commission transactions related to the sales and redemptions of the Funds’ shares for the period:
| Franklin | ||||||||||
| Franklin | Franklin | Franklin | U.S. Government | Franklin | ||||||
| DynaTech Fund | Growth Fund | Income Fund | Securities Fund | Utilities Fund | ||||||
| Sales charges retained net of | ||||||||||
| commissions paid to | ||||||||||
| unaffiliated brokers/dealers . | $ | 774,054 | $ | 1,453,178 | $ | 6,173,188 | $ | 495,631 | $ | 334,436 |
| CDSC retained. | $ | 29,178 | $ | 58,155 | $ | 1,209,267 | $ | 40,840 | $ | 37,854 |
e. Transfer Agent Fees
Each class of shares, except for Class R6, pays transfer agent fees to Investor Services for its performance of shareholder servicing obligations and reimburses Investor Services for out of pocket expenses incurred, including shareholder servicing fees paid to third parties. These fees are allocated daily based upon their relative proportion of such classes’ aggregate net assets. Class R6 pays Investor Services transfer agent fees specific to that class.
For the period ended March 31, 2016, the Funds paid transfer agent fees as noted in the Statements of Operations of which the following amounts were retained by Investor Services:
| Franklin | ||||||||||
| Franklin | Franklin | Franklin | U.S. Government | Franklin | ||||||
| DynaTech Fund | Growth Fund | Income Fund | Securities Fund | Utilities Fund | ||||||
| Transfer agent fees. | $ | 951,938 | $ | 3,643,939 | $ | 11,425,689 | $ | 1,992,654 | $ | 1,320,437 |
franklintempleton.com
Semiannual Report 119
FRANKLIN CUSTODIAN FUNDS
NOTES TO FINANCIAL STATEMENTS (UNAUDITED)
| 3. | Transactions with Affiliates (continued) |
| f. | Investments in Affiliated Management Investment Companies |
Certain or all Funds invest in an affiliated management investment company for purposes other than exercising a controlling influence over the management or policies. Management fees paid by the Funds are waived on assets invested in the affiliated management investment company, as noted in the Statements of Operations, in an amount not to exceed the management and administrative fees paid directly or indirectly by each affiliate. Prior to October 1, 2013, the waiver was accounted for as a reduction to management fees.
| % of | |||||||||||
| Affiliated | |||||||||||
| Number of | Number of | Fund Shares | |||||||||
| Shares Held | Shares | Outstanding | |||||||||
| at Beginning | Gross | Gross | Held at End | Value at End | Investment | Realized | Held at End | ||||
| of Period | Additions | Reductions | of Period | of Period | Income | Gain (Loss) | of Period | ||||
| Non-Controlled Affiliates | |||||||||||
| Franklin DynaTech Fund | |||||||||||
| Institutional | |||||||||||
| Fiduciary Trust | |||||||||||
| Money Market | |||||||||||
| Portfolio | 132,223,790 | 219,567,558 | (252,052,687 | ) | 99,738,661 | $ | 99,738,661 | $ — | $ — | 0.46 | % |
| Franklin Growth Fund | |||||||||||
| Institutional | |||||||||||
| Fiduciary Trust | |||||||||||
| Money Market | |||||||||||
| Portfolio | 1,399,136,183 | 471,603,084 | (686,789,608 | ) | 1,183,949,659 | $ | 1,183,949,659 | $ — | $ — | 5.50 | % |
| Franklin Income Fund | |||||||||||
| Institutional | |||||||||||
| Fiduciary Trust | |||||||||||
| Money Market | |||||||||||
| Portfolio | 143,022,415 | 12,580,968,290 | (11,147,056,031 | ) | 1,576,934,674 | $ | 1,576,934,674 | $ — | $ — | 7.33 | % |
| Franklin U.S. Government | |||||||||||
| Securities Fund | |||||||||||
| Institutional | |||||||||||
| Fiduciary Trust | |||||||||||
| Money Market | |||||||||||
| Portfolio | 106,304,328 | 780,984,737 | (714,604,645 | ) | 172,684,420 | $ | 172,684,420 | $ — | $ — | 0.80 | % |
| Franklin Utilities Fund | |||||||||||
| Institutional | |||||||||||
| Fiduciary Trust | |||||||||||
| Money Market | |||||||||||
| Portfolio | 2,850,614 | 371,536,964 | (288,665,077 | ) | 85,722,501 | $ | 85,722,501 | $ — | $ — | 0.40 | % |
| g. Waiver and Expense Reimbursements | |||||||||||
Investor Services has contractually agreed in advance to waive or limit its fees so that the Class R6 transfer agent fees do not exceed 0.01% until January 31, 2017. There were no Class R6 transfer agent fees waived during the period ended March 31, 2016.
120 Semiannual Report
franklintempleton.com
FRANKLIN CUSTODIAN FUNDS
NOTES TO FINANCIAL STATEMENTS (UNAUDITED)
h. Other Affiliated Transactions
At March 31, 2016, one or more funds in Franklin Fund Allocator Series owned a percentage of the Funds’ outstanding shares as follows:
| Franklin | |||||||||
| Franklin | Franklin | Franklin | U.S. Government | Franklin | |||||
| DynaTech Fund | Growth Fund | Income Fund | Securities Fund | Utilities Fund | |||||
| 11.43 | % | 8.46 | % | 2.11 | % | 5.14 | % | 3.66 | % |
i. Interfund Transactions
Franklin Income Fund engaged in purchases and sales of investments with funds or other accounts that have a common investment manager (or affiliated investment managers), directors, trustees, or officers. During the period ended March 31, 2016, the purchase and sale transactions aggregated $61,824 and $0, respectively.
4. Expense Offset Arrangement
The Funds have entered into an arrangement with their custodian whereby credits realized as a result of uninvested cash balances are used to reduce a portion of the Funds’ custodian expenses. During the period ended March 31, 2016, the custodian fees were reduced as noted in the Statements of Operations.
5. Income Taxes
For tax purposes, capital losses may be carried over to offset future capital gains. Capital loss carryforwards with no expiration, if any, must be fully utilized before those losses with expiration dates.
| At September 30, 2015, the capital loss carryforwards were as follows: | |||||
| Franklin U.S. | |||||
| Franklin | Government | ||||
| Income Fund | Securities Fund | ||||
| Capital loss carryforwards subject to expiration: | |||||
| 2016 | $ | — | $ | 20,514,778 | |
| 2017 | — | 18,668,917 | |||
| 2018 | 2,298,838,256 | 16,923,310 | |||
| 2019 | — | 4,445,156 | |||
| Capital loss carryforwards not subject to expiration: | |||||
| Short term | — | 118,712,269 | |||
| Long term | — | 220,987,655 | |||
| Total capital loss carryforwards. | $ | 2,298,838,256 | $ | 400,252,085 | |
For tax purposes, the Funds may elect to defer any portion of a post-October capital loss or late-year ordinary loss to the first day of the following fiscal year. At September 30, 2015, Franklin Income Fund deferred post-October capital losses of $2,299,027,295, and Franklin DynaTech Fund and Franklin Income Fund deferred late-year ordinary losses of $8,521,276 and $27,510,168, respectively.
franklintempleton.com
Semiannual Report 121
FRANKLIN CUSTODIAN FUNDS
NOTES TO FINANCIAL STATEMENTS (UNAUDITED)
5. Income Taxes (continued)
At March 31, 2016, the cost of investments and net unrealized appreciation (depreciation) for income tax purposes were as follows:
| Franklin | Franklin | Franklin | |||||||
| DynaTech Fund | Growth Fund | Income Fund | |||||||
| Cost of investments | $ | 1,867,954,552 | $ | 6,183,784,076 | $ | 77,895,395,412 | |||
| Unrealized appreciation | $ | 1,055,136,684 | $ | 5,812,761,432 | $ | 6,281,808,300 | |||
| Unrealized depreciation | (20,166,846 | ) | (172,299,848 | ) | (8,343,341,903 | ) | |||
| Net unrealized appreciation (depreciation) | $ | 1,034,969,838 | $ | 5,640,461,584 | $ | (2,061,533,603 | ) | ||
| Franklin | |||||||||
| U.S. Government | Franklin | ||||||||
| Securities Fund | Utilities Fund | ||||||||
| Cost of investments | $ | 6,271,350,577 | $ | 3,564,678,721 | |||||
| Unrealized appreciation | $ | 228,428,683 | $ | 2,582,597,655 | |||||
| Unrealized depreciation | (13,628,869 | ) | (100,941,565 | ) | |||||
| Net unrealized appreciation (depreciation) | $ | 214,799,814 | $ | 2,481,656,090 | |||||
Differences between income and/or capital gains as determined on a book basis and a tax basis are primarily due to differing treatments of paydown losses, bond discounts and premiums, corporate actions, equity-linked securities and wash sales.
6. Investment Transactions
Purchases and sales of investments (excluding short term securities) for the period ended March 31, 2016, were as follows:
| Franklin | ||||||||||||
| Franklin | Franklin | Franklin | U.S. Government | Franklin | ||||||||
| DynaTech Fund | Growth Fund | Income Fund | Securities Fund | Utilities Fund | ||||||||
| Purchases | $ | 436,999,973 | $ | 566,746,808 | $ | 22,556,518,986 | $ | 2,529,016,948 | $ | 222,319,270 | ||
| Sales | $ | 219,379,518 | $ | 450,680,947 | $ | 26,438,876,831 | $ | 2,343,331,232 | $ | 233,129,502 | ||
| Transactions in options written during the period ended March 31, 2016, were as follows: | ||||||||||||
| Number of | Premiums | |||||||||||
| Contracts | Received | |||||||||||
| Franklin Income Fund | ||||||||||||
| Options outstanding at September 30, 2015. | — | $ | — | |||||||||
| Options written | 79,000 | 11,529,185 | ||||||||||
| Options expired | (35,000 | ) | (1,728,167 | ) | ||||||||
| Options exercised | (44,000 | ) | (9,801,018 | ) | ||||||||
| Options closed | — | — | ||||||||||
| Options outstanding at March 31, 2016 | — | $ | — | |||||||||
See Notes 1(e) and 10 regarding derivative financial instruments and other derivative information, respectively.
122 Semiannual Report
franklintempleton.com
FRANKLIN CUSTODIAN FUNDS
NOTES TO FINANCIAL STATEMENTS (UNAUDITED)
7. Credit Risk and Defaulted Securities
At March 31, 2016, Franklin Income Fund had 15.67% of its portfolio invested in high yield, senior secured floating rate notes, or other securities rated below investment grade. These securities may be more sensitive to economic conditions causing greater price volatility and are potentially subject to a greater risk of loss due to default than higher rated securities.
Certain or all Funds held defaulted securities and/or other securities for which the income has been deemed uncollectible. At March 31, 2016, the value of this security for Franklin Income Fund was $42,750,000, representing 0.06% of the Fund’s net assets. The Fund discontinues accruing income on securities for which income has been deemed uncollectible and provides an estimate for losses on interest receivable. The securities have been identified in the accompanying Statement of Investments.
8. Restricted Securities
Certain or all Funds invest in securities that are restricted under the Securities Act of 1933 (1933 Act) or which are subject to legal, contractual, or other agreed upon restrictions on resale. Restricted securities are often purchased in private placement transactions, and cannot be sold without prior registration unless the sale is pursuant to an exemption under the 1933 Act. Disposal of these securities may require greater effort and expense, and prompt sale at an acceptable price may be difficult. The Funds may have registration rights for restricted securities. The issuer generally incurs all registration costs.
At March 31, 2016, the Franklin Income Fund held investments in restricted securities, excluding certain securities exempt from registration under the 1933 Act deemed to be liquid, as follows:
| Acquisition | ||||||
| Shares | Issuer | Dates | Cost | Value | ||
| 6,854,565 | First Data Holdings Inc., B | 6/26/14 | $ | 86,666,664 | $ | 79,828,264 |
| 2,520,000 | a Rex Energy Corp | 7/14/14 | 138,796,627 | 1,325,465 | ||
| Total Restricted Securities (Value is 0.11% of Net Assets) | $ | 225,463,291 | $ | 81,153,729 |
aThe Fund also invests in unrestricted securities or other investments in the issuer, valued at $23,520,000 as of March 31, 2016.
9. Unfunded Loan Commitments
Certain or all Funds enter into certain credit agreements, all or a portion of which may be unfunded. The Funds are obligated to fund these loan commitments at the borrowers’ discretion. Unfunded loan commitments and funded portions of credit agreements are marked to market daily and any unrealized appreciation or depreciation is included in the Statements of Assets and Liabilities and the Statements of Operations. Funded portions of credit agreements are presented in the Statements of Investments.
| At March 31, 2016, unfunded commitments were as follows: | ||
| Unfunded | ||
| Borrower | Commitment | |
| Franklin Income Fund | ||
| Frontier Communications Corp., Senior Unsecured Bridge Loan | $ | 125,000,000 |
| Western Digital Corp., Unsecured Bridge Loan | 200,980,392 | |
| Western Digital Corp., Senior Secured Bridge Loan | 49,019,608 | |
| $ | 375,000,000 | |
franklintempleton.com
Semiannual Report 123
FRANKLIN CUSTODIAN FUNDS
NOTES TO FINANCIAL STATEMENTS (UNAUDITED)
10. Other Derivative Information
For the period ended March 31, 2016, the effect of derivative contracts in Franklin Income Fund’s Statement of Operations was as follows:
| Net Change in | |||||
| Unrealized | |||||
| Derivative Contracts | Net Realized | Appreciation | |||
| Not Accounted for as | Statement of | Gain (Loss) for | Statement of | (Depreciation) | |
| Hedging Instruments | Operations Locations | the Period | Operations Locations | for the Period | |
| Net realized gain (loss) from: | Net change in unrealized | ||||
| appreciation (depreciation) on: | |||||
| Equity contracts | Written options | $ | 1,728,167 | Written options | $ — |
For the period ended March 31, 2016, the average month end fair value of derivatives represented less than 0.01% of average month end net assets. The average month end number of open derivative contracts for the year was 1.
See Notes 1(e) and 6 regarding derivative financial instruments and investment transactions, respectively.
11. Holdings of 5% Voting Securities of Portfolio Companies
The 1940 Act defines "affiliated companies" to include investments in portfolio companies in which a fund owns 5% or more of the outstanding voting securities. Investments in "affiliated companies" for certain or all Funds for the period ended March 31, 2016, were as shown below.
| Number of | Number of | |||||||||||
| Shares/ | Shares/ | |||||||||||
| Principal | Principal | |||||||||||
| Amount* | Amount* | |||||||||||
| Held at | Held at | Value at | ||||||||||
| Beginning | Gross | Gross | End | End of | Investment | Realized | ||||||
| Name of Issuer | of Period | Additions | Reductions | of Period | Period | Income | Gain (Loss) | |||||
| Franklin Income Fund | ||||||||||||
| Non-Controlled Affiliates | ||||||||||||
| Agrium Inc | 7,500,000 | — | (4,500,000 | ) | 3,000,000 | $ | —a | $ | — | $ | (39,463,484 | ) |
| CEVA Group PLC, Pre-Funded | ||||||||||||
| L/C, 6.50%, 3/19/21 | 20,320,197 | — | — | 20,320,197 | 16,950,438 | 645,731 | — | |||||
| CEVA Group PLC, senior note, | ||||||||||||
| first lien, 144A, 4.00%, | ||||||||||||
| 5/01/18 | 174,778,982 | — | (10,000,000 | ) | 164,778,982 | 142,533,819 | 3,371,382 | (1,237,500 | ) | |||
| CEVA Holdings LLC | 91,371 | — | — | 91,371 | 36,548,424 | — | — | |||||
| CEVA Holdings LLC, cvt. pfd., | ||||||||||||
| A-1 | 2,897 | — | — | 2,897 | 1,521,056 | — | — | |||||
| CEVA Holdings LLC, cvt. pfd., | ||||||||||||
| A-2 | 110,565 | — | — | 110,565 | 44,226,032 | — | — | |||||
| Halcon Resources Corp | 47,500,000 | — | (47,500,000 | )b | — | — | — | (71,022,137 | ) | |||
| Halcon Resources Corp.,senior | ||||||||||||
| secured note, third lien, 144A, | ||||||||||||
| 13.00%, 2/15/22 | 341,510,000 | 118,490,000 | — | 460,000,000 | —a | — | — | |||||
| Halcon Resources Corp., | ||||||||||||
| 5.75%, cvt. pfd., A. | 37,000 | — | — | 37,000 | —a | — | — | |||||
| Halcon Resources Corp., | ||||||||||||
| secured note, second lien, | ||||||||||||
| 144A, 8.625%, 2/01/20 | 130,000,000 | 70,000,000 | — | 200,000,000 | —a | — | — | |||||
| Halcon Resources Corp., | ||||||||||||
| senior note, 8.875%, 5/15/21 . | 13,375,000 | 15,300,000 | (28,675,000 | ) | — | — | 1,297,692 | (5,654,907 | ) | |||
124 Semiannual Report
franklintempleton.com
FRANKLIN CUSTODIAN FUNDS
NOTES TO FINANCIAL STATEMENTS (UNAUDITED)
| Number of | Number of | |||||||||||
| Shares/ | Shares/ | |||||||||||
| Principal | Principal | |||||||||||
| Amount* | Amount* | |||||||||||
| Held at | Held at | Value at | ||||||||||
| Beginning | Gross | Gross | End | End of | Investment | Realized | ||||||
| Name of Issuer | of Period | Additions | Reductions | of Period | Period | Income | Gain (Loss) | |||||
| Franklin Income Fund (continued) | ||||||||||||
| Non-Controlled Affiliates (continued) | ||||||||||||
| Halcon Resources Corp., | ||||||||||||
| senior note, 9.75%, 7/15/20 | 6,500,000 | 10,000,000 | (16,500,000 | ) | — | $ | — | $ | 213,010 | $ | (3,657,675 | ) |
| PG&E Corp | 24,910,000 | — | (14,910,000 | ) | 10,000,000 | —a | — | 136,911,324 | ||||
| Total Affiliated Securities (Value is 0.32% of Net Assets) | $ | 241,779,769 | $ | 5,527,815 | $ | 15,875,621 | ||||||
| Franklin Utilities Fund | ||||||||||||
| Non-Controlled Affiliates | ||||||||||||
| 8point3 Energy Partners LP | 1,298,500 | — | (1,298,500 | ) | — | $ | — | $ | — | $ | (9,237,297 | ) |
*In U.S. dollars unless otherwise indicated.
aAs of March 31, 2016, no longer an affiliate.
bGross addition/reduction was the result of various corporate actions.
12. Reorganization
On March 11, 2016, Franklin Growth Fund (Surviving Fund), pursuant to a plan of reorganization approved on March 9, 2016 by shareholders of Franklin Large Cap Equity Fund (Acquired Fund), a series of Franklin Global Trust, acquired 100% of the Acquired Fund’s net assets, primarily made up of investment securities, which included $30,220,448 of unrealized appreciation (depreciation), through a tax-free exchange of 2,626,568 shares of the Surviving Fund (valued at $158,520,938). Immediately after the completion of the reorganization, the combined net assets of the Surviving Fund were $11,613,893,884.
The primary purpose for the reorganization was to combine the Acquired Fund with a larger fund that had a significant overlap of portfolio holdings, generally similar investment goals, principal investment strategies and principal investment risks. The estimated cost of the reorganization was $110,000 of which the Surviving Fund, the Acquired Fund, Advisers, and Fiduciary International, Inc., the investment manager of the Acquired Fund, each paid 25%. The allocated portion of the Surviving Fund’s reorganization expenses are included with professional fees and reports to shareholders expenses in the Statements of Operations.
Assuming the reorganization had been completed on October 1, 2015, the Surviving Fund’s pro forma results of operations would have been as follows:
| Net Increase | ||||||
| Net | Net Realized | (Decrease) in | ||||
| Investment | and Unrealized | Net Assets from | ||||
| Period | Income | Gain (Loss) | Operations | |||
| For the period October 1, 2015 through March 31, 2016 | $ | 44,534,703 | $ | 555,979,986 | $ | 600,514,689 |
Subsequent to the reorganization, the Surviving Fund has been managed as a single entity. Accordingly, it is impracticable to identify the amounts of investment income and net investment income attributable to the Acquired Fund’s assets after the completion of the reorganization.
franklintempleton.com
Semiannual Report 125
FRANKLIN CUSTODIAN FUNDS
NOTES TO FINANCIAL STATEMENTS (UNAUDITED)
13. Credit Facility
Certain or all Funds, together with other U.S. registered and foreign investment funds (collectively, Borrowers), managed by Franklin Templeton Investments, are borrowers in a joint syndicated senior unsecured credit facility totaling $2 billion (Global Credit Facility) which matures on February 10, 2017. This Global Credit Facility provides a source of funds to the Borrowers for temporary and emergency purposes, including the ability to meet future unanticipated or unusually large redemption requests.
Under the terms of the Global Credit Facility, the Funds shall, in addition to interest charged on any borrowings made by the Funds and other costs incurred by the Funds, pay their share of fees and expenses incurred in connection with the implementation and maintenance of the Global Credit Facility, based upon their relative share of the aggregate net assets of all of the Borrowers, including an annual commitment fee of 0.07% based upon the unused portion of the Global Credit Facility. Effective February 12, 2016, the annual commitment fee is 0.15%. These fees are reflected in other expenses in the Statements of Operations. During the period ended March 31, 2016, the Funds did not use the Global Credit Facility.
14. Fair Value Measurements
The Funds follow a fair value hierarchy that distinguishes between market data obtained from independent sources (observable inputs) and the Funds’ own market assumptions (unobservable inputs). These inputs are used in determining the value of the Funds’ financial instruments and are summarized in the following fair value hierarchy:
- Level 1 – quoted prices in active markets for identical financial instruments
- Level 2 – other significant observable inputs (including quoted prices for similar financial instruments, interest rates, prepayment speed, credit risk, etc.)
- Level 3 – significant unobservable inputs (including the Funds’ own assumptions in determining the fair value of financial instruments)
The input levels are not necessarily an indication of the risk or liquidity associated with financial instruments at that level.
For movements between the levels within the fair value hierarchy, the Funds have adopted a policy of recognizing the transfers as of the date of the underlying event which caused the movement.
A summary of inputs used as of March 31, 2016, in valuing the Funds’ assets and liabilities carried at fair value, is as follows:
| Level 1 | Level 2 | Level 3 | Total | |||||
| Franklin DynaTech Fund | ||||||||
| Assets: | ||||||||
| Investments in Securities: | ||||||||
| Equity Investmentsa | $ | 2,803,185,729 | $ | — | $ | — | $ | 2,803,185,729 |
| Short Term Investments | 99,738,661 | — | — | 99,738,661 | ||||
| Total Investments in Securities | $ | 2,902,924,390 | $ | — | $ | — | $ | 2,902,924,390 |
| Franklin Growth Fund | ||||||||
| Assets: | ||||||||
| Investments in Securities: | ||||||||
| Equity Investmentsa | $ | 10,640,296,001 | $ | — | $ | — | $ | 10,640,296,001 |
| Short Term Investments | 1,183,949,659 | — | — | 1,183,949,659 | ||||
| Total Investments in Securities | $ | 11,824,245,660 | $ | — | $ | — | $ | 11,824,245,660 |
126 Semiannual Report
franklintempleton.com
FRANKLIN CUSTODIAN FUNDS
NOTES TO FINANCIAL STATEMENTS (UNAUDITED)
| Level 1 | Level 2 | Level 3 | Total | |||||||
| Franklin Income Fund | ||||||||||
| Assets: | ||||||||||
| Investments in Securities: | ||||||||||
| Equity Investments:b | ||||||||||
| Energy. | $ | 5,367,906,836 | $ | 18,851,500 | $ | 1,325,465 | $ | 5,388,083,801 | ||
| Financials | 4,155,958,835 | 35,062,500 | — | 4,191,021,335 | ||||||
| Industrials | 5,530,621,749 | 36,548,424 | 45,747,088 | 5,612,917,261 | ||||||
| Information Technology | 2,315,198,782 | — | 79,828,264 | 2,395,027,046 | ||||||
| All Other Equity Investmentsa | 18,261,708,565 | — | — | 18,261,708,565 | ||||||
| Equity-Linked Securities | — | 10,029,223,207 | — | 10,029,223,207 | ||||||
| Convertible Bonds | — | 177,281,082 | — | 177,281,082 | ||||||
| Corporate Bonds | — | 24,748,180,498 | 11,200,000 | 24,759,380,498 | ||||||
| Senior Floating Rate Interests | — | 2,996,990,016 | — | 2,996,990,016 | ||||||
| Escrows and Litigation Trusts | — | — | —c | — | ||||||
| Short Term Investments | 1,576,934,674 | 445,294,324 | — | 2,022,228,998 | ||||||
| Total Investments in Securities | $ | 37,208,329,441 | $ | 38,487,431,551 | $ | 138,100,817 | $ | 75,833,861,809 | ||
| Liabilities: | ||||||||||
| Other Financial Instruments: | ||||||||||
| Unfunded Loan Commitments. | $ | — | $ | (2,990 | ) | $ | — | $ | (2,990 | ) |
| Franklin U.S. Government Securities Fund | ||||||||||
| Assets: | ||||||||||
| Investments in Securities: | ||||||||||
| Mortgage-Backed Securities | $ | — | $ | 6,313,465,971 | $ | — | $ | 6,313,465,971 | ||
| Short Term Investments | 172,684,420 | — | — | 172,684,420 | ||||||
| Total Investments in Securities | $ | 172,684,420 | $ | 6,313,465,971 | $ | — | $ | 6,486,150,391 | ||
| Franklin Utilities Fund | ||||||||||
| Assets: | ||||||||||
| Investments in Securities: | ||||||||||
| Equity Investmentsa | $ | 5,909,337,110 | $ | — | $ | — | $ | 5,909,337,110 | ||
| Corporate Bonds | — | 51,275,200 | — | 51,275,200 | ||||||
| Short Term Investments | 85,722,501 | — | — | 85,722,501 | ||||||
| Total Investments in Securities | $ | 5,995,059,611 | $ | 51,275,200 | $ | — | $ | 6,046,334,811 | ||
aFor detailed categories, see the accompanying Statement of Investments.
bIncludes common, preferred and convertible preferred stocks as well as other equity investments.
cIncludes securities determined to have no value at March 31, 2016.
A reconciliation of assets in which Level 3 inputs are used in determining fair value is presented when there are significant Level 3 financial instruments at the end of the period.
15. Subsequent Events
The Funds have evaluated subsequent events through the issuance of the financial statements and determined that no events have occurred that require disclosure.
franklintempleton.com
Semiannual Report 127
FRANKLIN CUSTODIAN FUNDS
NOTES TO FINANCIAL STATEMENTS (UNAUDITED)
| Abbreviations | |||
| Currency | Selected Portfolio | ||
| EUR | Euro | ADR | American Depositary Receipt |
| GBP | British Pound Sterling | ARM | Adjustable Rate Mortgage |
| FHLB | Federal Home Loan Bank | ||
| FHLMC | Federal Home Loan Mortgage Corp. | ||
| FRN | Floating Rate Note | ||
| GP | Graduated Payment | ||
| L/C | Letter of Credit | ||
| MTN | Medium Term Note | ||
| PIK | Payment-In-Kind | ||
| SBA | Small Business Administration | ||
128 Semiannual Report
franklintempleton.com
FRANKLIN CUSTODIAN FUNDS
Shareholder Information
Board Review of Investment Management Agreement
At a meeting held February 23, 2016, the Board of Trustees (Board), including a majority of trustees that are not “interested persons” as such term is defined in section 2(a)(19) of the Investment Company Act of 1940 (hereinafter referred to as “non-interested Trustees” or “independent Trustees”), approved renewal of the investment management agreement for each of the five separate funds in Franklin Custodian Funds (Fund(s)). In reaching this decision, the Board took into account information furnished throughout the year at regular Board meetings, as well as information prepared specifically in connection with the annual renewal review process. Information furnished and discussed throughout the year included investment performance reports and related financial information for each Fund, along with periodic reports on expenses, shareholder services, legal and compliance matters, risk control, pricing, brokerage commissions and execution, and other services provided by the Investment Manager (Manager) and its affiliates, as well as marketing support payments made to financial intermediaries. Information furnished specifically in connection with the renewal process included a report for each Fund prepared by Broadridge Financial Solutions, Inc. (Broadridge), an independent organization, as well as additional material, including a Fund profitability analysis prepared by management. The Broadridge reports, which utilize data from Lipper, Inc. (Lipper), compared each Fund’s investment performance and expenses with those of other mutual funds deemed comparable to the Fund as selected by Lipper. The Fund profitability analysis discussed the profitability to Franklin Templeton Investments (FTI) from its overall U.S. fund operations, as well as on an individual fund-by-fund basis. Additional material accompanying such profitability analysis included information on a fund-by-fund basis listing portfolio managers and other accounts they manage, as well as information on management fees charged by the Manager and its affiliates to U.S. mutual funds and other accounts, including management’s explanation of differences where relevant. Such material also included a memorandum prepared by management describing project initiatives and capital investments relating to the services provided to the Funds by the FTI organization, as well as a memorandum relating to economies of scale and an analysis concerning transfer agent fees charged by an affiliate of the Manager. The Board also received a report on all marketing support payments made by FTI to financial intermediaries during the past year, as well as a memorandum relating to third-party servicing arrangements in response to a Guidance Update from the U.S. Securities and Exchange Commission (SEC) relating to mutual fund distribution and sub-accounting fees.
In considering such materials, the independent Trustees received assistance and advice from and met separately with independent counsel. While the investment management agreements for all Funds were considered at the same Board meeting, the Board dealt with each Fund separately. In approving continuance of the investment management agreement for each Fund, the Board, including a majority of independent Trustees, determined that the existing management fee structure was fair and reasonable and that continuance of the investment management agreement was in the best interests of such Fund and its shareholders. While attention was given to all information furnished, the following discusses some primary factors relevant to the Board’s decision.
NATURE, EXTENT AND QUALITY OF SERVICES. The Board was satisfied with the nature and quality of the overall services provided by the Manager and its affiliates to the Funds and their shareholders. In addition to investment performance and expenses discussed later, the Board’s opinion was based, in part, upon periodic reports furnished it showing that the investment policies and restrictions for each Fund were consistently complied with as well as other reports periodically furnished the Board covering matters such as the compliance of portfolio managers and other management personnel with the code of ethics adopted throughout the Franklin Templeton fund complex, the adherence to fair value pricing procedures established by the Board, and the accuracy of net asset value calculations. The Board also noted the extent of benefits provided Fund shareholders from being part of the Franklin Templeton family of funds, including the right to exchange investments between the same class of shares of different funds without a sales charge, the ability to reinvest Fund dividends into other funds and the right to combine holdings in other funds to obtain a reduced sales charge. Favorable consideration was given to management’s continual efforts and expenditures in establishing effective business continuity plans and developing strategies to address cybersecurity threats. Additionally, the Board noted the Manager’s continued attention to pricing and valuation issues, particularly with respect to complex securities. Among other factors
franklintempleton.com
Semiannual Report 129
FRANKLIN CUSTODIAN FUNDS
SHAREHOLDER INFORMATION
Board Review of Investment Management Agreement (continued)
taken into account by the Board were the Manager’s best execution trading policies, including a favorable report by an independent portfolio trading analytical firm that also covered FOREX transactions. Consideration was also given to the experience of each Fund’s portfolio management team, the number of accounts managed and general method of compensation. In this latter respect, the Board noted that a primary factor in management’s determination of a portfolio manager’s bonus compensation was the relative investment performance of the funds he or she managed and that a portion of such bonus was required to be invested in a pre-designated list of funds within such person’s fund management area so as to be aligned with the interests of shareholders. The Board also took into account the quality of transfer agent and shareholder services provided Fund shareholders by an affiliate of the Manager and steps taken by FTI to enhance analytical support to the investment management groups and provide additional oversight of liquidity risk and complex securities. The Board also took into account, among other things, management’s efforts in establishing a global credit facility for the benefit of the Funds and other accounts managed by FTI to provide a source of cash for temporary and emergency purposes or to meet unusual redemption requests as well as the strong financial position of the Manager’s parent company and its commitment to the mutual fund business as evidenced by its continued introduction of new funds and reassessment of fund offerings in response to the market environment.
INVESTMENT PERFORMANCE. The Board placed significant emphasis on the investment performance of each Fund in view of its importance to shareholders. While consideration was given to performance reports and discussions with portfolio managers at Board meetings during the year, particular attention in assessing performance was given to the Broadridge reports furnished for the agreement renewals. The Broadridge reports prepared for each individual Fund showed the investment performance of its Class A shares during 2015 and during the previous 10-year period ended December 31, 2015, in comparison with a performance universe selected by Lipper. Investment performance was shown on a total return basis for all Funds with income return being shown as well for those Funds having income as an investment objective element. The following summarizes the performance results for each Fund.
Franklin DynaTech Fund - This Fund’s investment performance was shown in comparison to a performance universe consisting of the Fund and all retail and institutional multi-cap growth funds as classified by Lipper. The Broadridge report showed the Fund’s total return for 2015 to be in the highest performing quintile of its performance universe and on an annualized basis to be in either the highest or second-highest performing quintile of such universe for each of the previous three-, five- and 10-year periods. The Board found the Fund’s performance as shown in the Broadridge report to be satisfactory.
Franklin Growth Fund - The Fund’s investment performance was shown in comparison to a performance universe consisting of all retail and institutional multi-cap core funds as classified by Lipper. The Broadridge report showed the Fund’s total return during 2015 to be in the highest performing quintile of such performance universe and on an annualized basis to be in the second-highest performing quintile for the previous three-and five-year periods, and in the highest performing quintile of such universe for the previous 10-year period. The Board was satisfied with the Fund’s overall performance as shown in the Broadridge report.
Franklin Income Fund - The Fund’s investment performance was shown in comparison to a performance universe consisting of the Fund and all other retail and institutional mixed-asset target allocation moderate funds as classified by Lipper. The Broadridge report showed the Fund’s income return during 2015 to be in the highest quintile of its performance universe and its income return on an annualized basis during each of the previous three-, five- and 10-year periods to also be in the highest quintile of such performance universe. The Broadridge report showed the Fund’s total return during 2015 to be in the lowest performing quintile of its Lipper performance universe, and on an annualized basis to be in the lowest performing quintile of such universe for the previous three-year period, the second-lowest performing quintile for the previous five-year period, and the second-highest performing quintile for the previous 10-year period. The Board found the Fund’s performance as shown in the Broadridge report to be acceptable and noted that its income return for 2015 was 5.36%.
130 Semiannual Report
franklintempleton.com
FRANKLIN CUSTODIAN FUNDS
SHAREHOLDER INFORMATION
Franklin U.S. Government Securities Fund - This Fund’s investment performance was shown in comparison to a performance universe consisting of all retail and institutional Ginnie Mae funds as classified by Lipper. The Fund’s Broadridge report showed its income return during 2015 to be in the second highest quintile of its Lipper performance universe and its income return on an annualized basis to be in the second-highest quintile of such universe during each of the previous three-, five- and 10-year periods. The Fund’s Broadridge report showed its total return to be in the middle performing quintile of its performance universe during 2015, and its total return on an annualized basis to be in the middle performing quintile of such universe for the previous three- and five- year periods, and in the second lowest performing quintile for the previous 10-year period. The Board found such comparative performance to be acceptable in view of the Fund’s income oriented investment objective and conservative policy of investing only in plain vanilla Ginnie Mae pass-through securities. The Board also noted that the Fund’s total return for the annualized one- and three-year periods was 10 basis points above the performance universe median for such periods.
Franklin Utilities Fund - This Fund’s investment performance was shown in comparison to a performance universe consisting of all retail and institutional utility funds as classified by Lipper. The Fund’s Broadridge report showed its income return during 2015 to be in the second-highest quintile of such universe, and its income return on an annualized basis to be in the highest or second-highest quintile of such performance universe during each of the previous three-, five- and 10-year periods. The Fund’s total return during 2015 was in the second-highest performing quintile of its performance universe, and on an annualized basis was in the highest or second-highest performing quintile of such universe during each of the previous three-, five- and 10-year periods. The Board was satisfied with the Fund’s performance as shown in the Broadridge report.
COMPARATIVE EXPENSES. Consideration was given to a comparative analysis of the management fees and total expense ratio of each Fund compared with those of a group of other funds selected by Lipper as constituting its appropriate Lipper expense group. Lipper expense data is based upon information taken from each fund’s most recent annual report, which reflects historical asset levels that may be quite different from those currently existing, particularly in a period of market volatility. While recognizing such inherent limitation and the fact that expense ratios generally increase as assets decline and decrease as assets grow, the Board believed the independent analysis conducted by Lipper to be an appropriate measure of comparative expenses. In reviewing comparative costs, Lipper provides information on each Fund’s contractual investment management fee in comparison with the contractual investment management fee that would have been charged by other funds within its Lipper expense group assuming they were similar in size to the Fund, as well as the actual total expenses of the Fund in comparison with those of its Lipper expense group. The Lipper contractual investment management fee analysis considers administrative charges as being part of contractual investment management fees, and total expenses, for comparative consistency, are shown by Lipper for Fund Class A shares for funds having multiple share classes. The results of such expense comparisons showed for each Fund that its contractual investment management fee rate was below the median of its Lipper expense group, with the exception of Franklin U.S. Government Securities Fund, which was only 1.1 basis points above the median of its Lipper expense group. The results of such expense comparison also showed for each Fund that its actual total expense ratio was in the least expensive quintile of its Lipper expense group. Based upon the above, the Board was satisfied with the management fee and actual total expense ratio of each Fund in comparison to its respective Lipper expense group as shown in the Broadridge reports.
MANAGEMENT PROFITABILITY. The Board also considered the level of profits realized by the Manager and its affiliates in connection with the operation of each Fund. In this respect, the Board reviewed the Fund profitability analysis that addresses the overall profitability of Franklin Templeton’s U.S. fund business, as well as its profits in providing management and other services to each of the individual funds during the 12-month period ended September 30, 2015, being the most recent fiscal year-end for Franklin Resources, Inc., the Manager’s parent. In reviewing the analysis, the Board recognized that allocation methodologies are inherently subjective and various allocation methodologies may be reasonable while producing different results. In this respect, the Board noted that while management continually makes refinements to its methodologies in response to organizational and product related changes, the overall approach as defined by the primary drivers and activity measurements has remained consistent with that used in the Funds’ profitability report presentations from prior years. Additionally, the Funds’ independent registered public accounting firm had been engaged by the Manager to periodically review the reasonableness of the allocation methodologies to be
franklintempleton.com
Semiannual Report 131
FRANKLIN CUSTODIAN FUNDS
SHAREHOLDER INFORMATION
Board Review of Investment Management Agreement (continued)
used solely by the Funds’ Board in reference to the profitability analysis. In reviewing and discussing such analysis, management discussed with the Board its belief that costs incurred in establishing the infrastructure necessary for the type of mutual fund operations conducted by the Manager and its affiliates may not be fully reflected in the expenses allocated to each Fund in determining its profitability, as well as the fact that the level of profits, to a certain extent, reflected operational cost savings and efficiencies initiated by management. The Board also took into account management’s expenditures in improving shareholder services provided the Funds, as well as the need to implement systems and meet additional regulatory and compliance requirements resulting from statutes such as the Sarbanes-Oxley and Dodd-Frank Acts and recent SEC and other regulatory requirements. In addition, the Board considered a third-party study comparing the profitability of the Manager’s parent on an overall basis to other publicly held managers broken down to show profitability from management operations exclusive of distribution expenses, as well as profitability including distribution expenses. The Board also considered the extent to which the Manager and its affiliates might derive ancillary benefits from fund operations, including revenues generated from transfer agent services and potential benefits resulting from personnel and systems enhancements necessitated by fund growth, as well as increased leverage with service providers and counterparties, allocation of fund brokerage and the use of commission dollars to pay for research. Based upon its consideration of all these factors, the Board determined that the level of profits realized by the Manager and its affiliates from providing services to each Fund was not excessive in view of the nature, quality and extent of services provided.
ECONOMIES OF SCALE. The Board also considered whether economies of scale are realized by the Manager as the Funds grow larger and the extent to which this is reflected in the level of management fees charged. While recognizing that any precise determination is inherently subjective, the Board noted that based upon the Fund profitability analysis, it appears that as some funds get larger, at some point economies of scale do result in the Manager realizing a larger profit margin on management services provided such a fund. The Board also noted that economies of scale are shared with each Fund and its shareholders through management fee breakpoints so that as a Fund grows in size, its effective management fee rate declines. The fee structure under the investment management agreement with each Fund provides an initial fee of 0.625% on the first $100 million of assets; 0.50% on the next $150 million of assets; 0.45% on the next $7.25 billion of assets; and declining thereafter until reaching a breakpoint of 0.35% for assets in excess of $50 billion, with such breakpoints continuing in the case of Franklin Income Fund and Franklin Utilities Fund to 0.345% on assets in excess of $65 billion and 0.34% on assets in excess of $80 billion. Existing breakpoints continue beyond the year-end asset size of each Fund. The Board believed that to the extent economies of scale may be realized by the Manager and its affiliates, the schedule of fees under the investment management agreements for these Funds provides a sharing of benefits with the Funds and their shareholders.
Proxy Voting Policies and Procedures
The Trust’s investment manager has established Proxy Voting Policies and Procedures (Policies) that the Trust uses to determine how to vote proxies relating to portfolio securities. Shareholders may view the Trust’s complete Policies online at franklintempleton.com. Alternatively, shareholders may request copies of the Policies free of charge by calling the Proxy Group collect at (954) 527-7678 or by sending a written request to: Franklin Templeton Companies, LLC, 300 S.E. 2nd Street, Fort Lauderdale, FL 33301, Attention: Proxy Group. Copies of the Trust’s proxy voting records are also made available online at franklintempleton.com and posted on the U.S. Securities and Exchange Commission’s website at sec.gov and reflect the most recent 12-month period ended June 30.
Quarterly Statement of Investments
The Trust files a complete statement of investments with the U.S. Securities and Exchange Commission for the first and third quarters for each fiscal year on Form N-Q. Shareholders may view the filed Form N-Q by visiting the Commission’s website at sec.gov. The filed form may also be viewed and copied at the Commission’s Public Reference Room in Washington, DC. Information regarding the operations of the Public Reference Room may be obtained by calling (800) SEC-0330.
132 Semiannual Report
franklintempleton.com

Item 2. Code of Ethics.
(a) The Registrant has adopted a code of ethics that applies to its principal executive officers and principal financial and accounting officer.
(c) N/A
(d) N/A
(f) Pursuant to Item 12(a)(1), the Registrant is attaching as an exhibit a copy of its code of ethics that applies to its principal executive officers and principal financial and accounting officer.
Item 3. Audit Committee Financial Expert.
(a)(1) The Registrant has an audit committee financial expert serving on its audit committee.
(2) The audit committee financial expert is John B. Wilson and he is "independent" as defined under the relevant Securities and Exchange Commission Rules and Releases.
Item 4. Principal Accountant Fees and Services. N/A
Item 5. Audit Committee of Listed Registrants. N/A
Item 6. Schedule of Investments. N/A
Item 7. Disclosure of Proxy Voting Policies and Procedures for Closed-End Management Investment Companies. N/A
Item 8. Portfolio Managers of Closed-End Management Investment Companies. N/A
Item 9. Purchases of Equity Securities by Closed-End Management Investment Company and Affiliated Purchasers. N/A
Item 10. Submission of Matters to a Vote of Security Holders.
There have been no changes to the procedures by which shareholders may recommend nominees to the Registrant's Board of Trustees that would require disclosure herein.
Item 11. Controls and Procedures.
(a) Evaluation of Disclosure Controls and Procedures. The Registrant maintains disclosure controls and procedures that are designed to ensure that information required to be disclosed in the Registrant’s filings under the Securities Exchange Act of 1934 and the Investment Company Act of 1940 is recorded, processed, summarized and reported within the periods specified in the rules and forms of the Securities and Exchange Commission. Such information is accumulated and communicated to the Registrant’s management, including its principal executive officer and principal financial officer, as appropriate, to allow timely decisions regarding required disclosure. The Registrant’s management, including the principal executive officer and the principal financial officer, recognizes that any set of controls and procedures, no matter how well designed and operated, can provide only reasonable assurance of achieving the desired control objectives.
Within 90 days prior to the filing date of this Shareholder Report on Form N-CSR, the Registrant had carried out an evaluation, under the supervision and with the participation of the Registrant’s management, including the Registrant’s principal executive officer and the Registrant’s principal financial officer, of the effectiveness of the design and operation of the Registrant’s disclosure controls and procedures. Based on such evaluation, the Registrant’s principal executive officer and principal financial officer concluded that the Registrant’s disclosure controls and procedures are effective.
(b) Changes in Internal Controls. There have been no significant changes in the Registrant’s internal controls or in other factors that could significantly affect the internal controls subsequent to the date of their evaluation in connection with the preparation of this Shareholder Report on Form N-CSR.
Item 12. Exhibits.
(a)(1) Code of Ethics
(a)(2) Certifications pursuant to Section 302 of the Sarbanes-Oxley Act of 2002 of Laura F. Fergerson, Chief Executive Officer - Finance and Administration, and Gaston Gardey, Chief Financial Officer and Chief Accounting Officer
(b) Certifications pursuant to Section 906 of the Sarbanes-Oxley Act of 2002 of Laura F. Fergerson, Chief Executive Officer - Finance and Administration, and Gaston Gardey, Chief Financial Officer and Chief Accounting Officer
SIGNATURES
Pursuant to the requirements of the Securities Exchange Act of 1934 and the Investment Company Act of 1940, the registrant has duly caused this report to be signed on its behalf by the undersigned, thereunto duly authorized.
FRANKLIN CUSTODIAN FUNDS
By /s/Laura F. Fergerson
Laura F. Fergerson
Chief Executive Officer - Finance and Administration
Date May 26, 2016
Pursuant to the requirements of the Securities Exchange Act of 1934 and the Investment Company Act of 1940, this report has been signed below by the following persons on behalf of the registrant and in the capacities and on the dates indicated.
By /s/Laura F. Fergerson
Laura F. Fergerson
Chief Executive Officer - Finance and Administration
Date May 26, 2016
By /s/Gaston Gardey
Gaston Gardey
Chief Financial Officer and Chief Accounting Officer
Date May 26, 2016