| Performance Graph | 10 |
| Selected Consolidated Financial Data | 11 |
| Management’s Discussion and Analysis of Financial Condition and Results of Operations | 12 |
Management’s Annual Report on Internal Control Over Financial Reporting (PCAOB ID 173)
| 36 |
| Report of Independent Registered Public Accounting Firm | 37 |
| Consolidated Financial Statements | 39
|
| Notes to Consolidated Financial Statements | 44 |
| Quarterly Data | 110 |
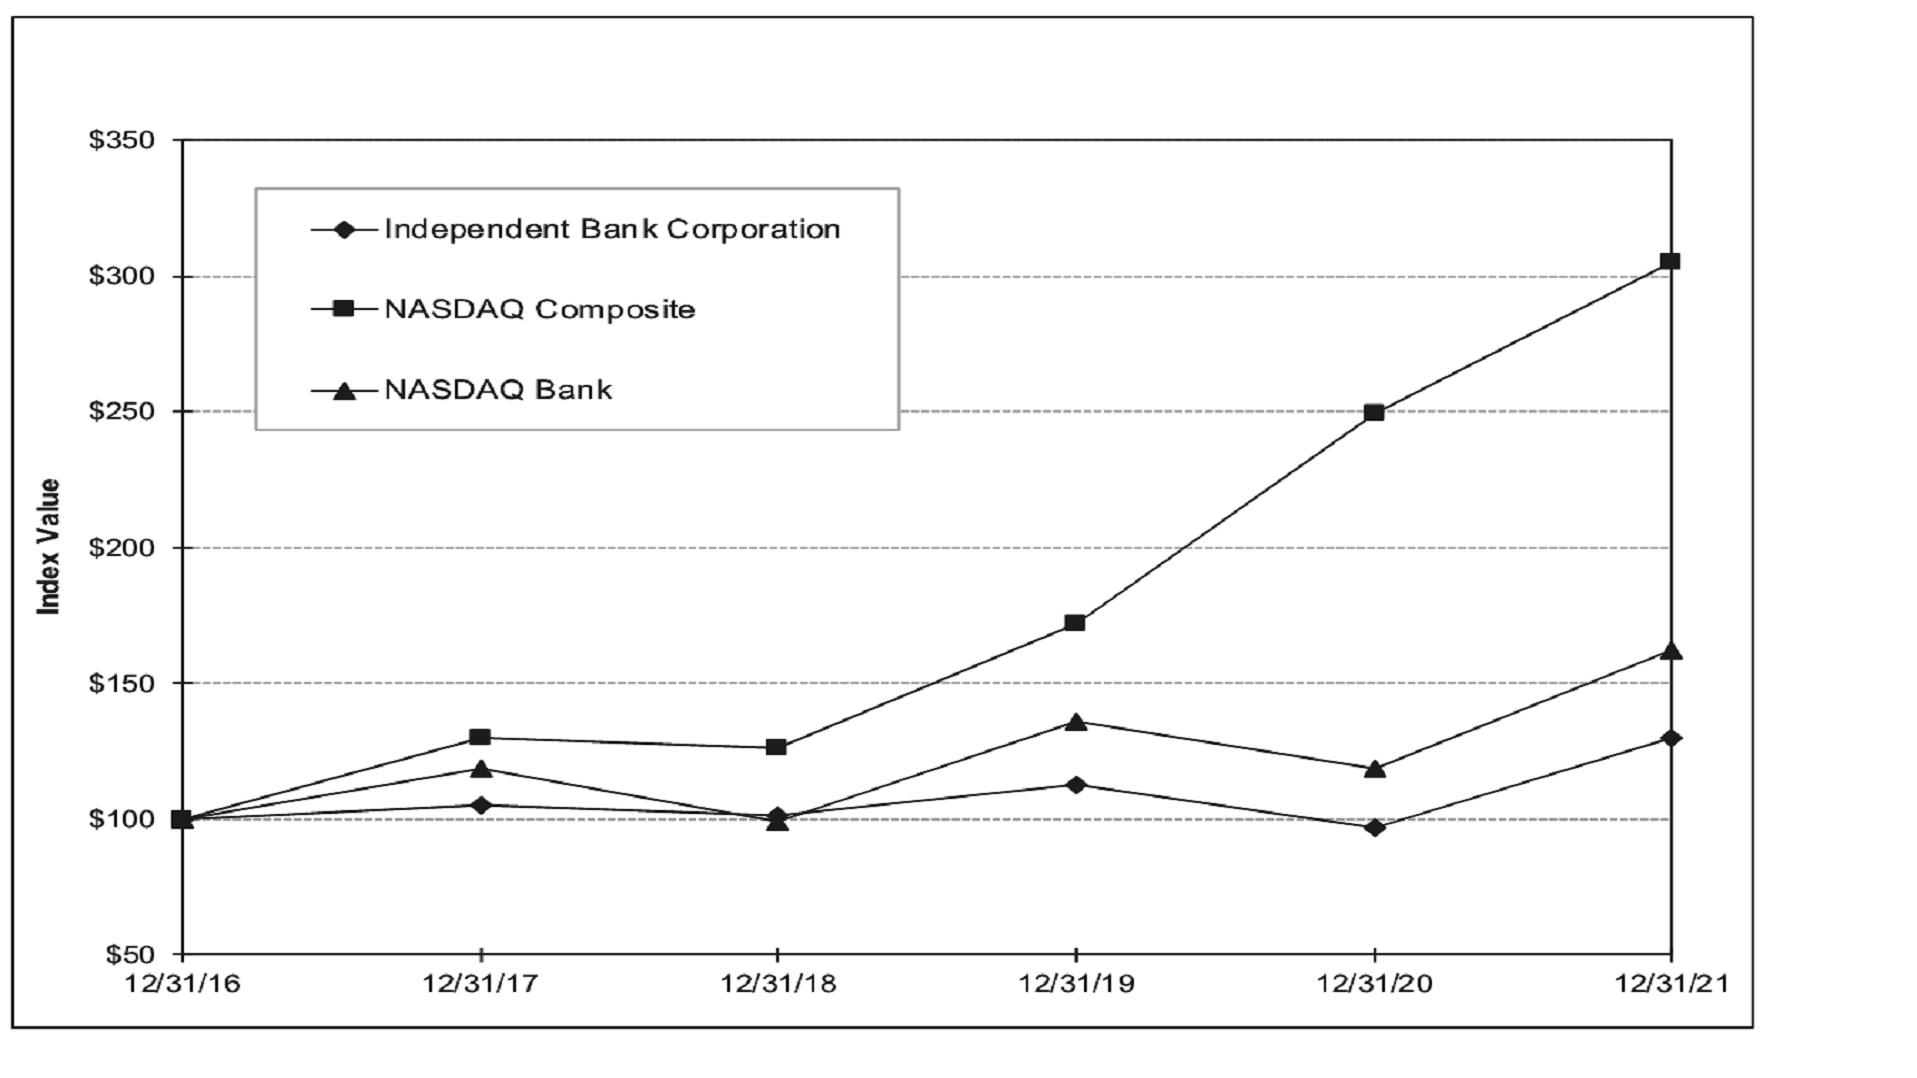
The graph below compares the total returns (assuming reinvestment of dividends) of Independent Bank Corporation common stock, the NASDAQ Composite Index and the NASDAQ Bank Stock Index. The graph assumes $100 invested in Independent Bank Corporation common stock (returns based on stock prices per the NASDAQ) and each of the indices on December 31, 2016, and the reinvestment of all dividends during the periods presented. The performance shown on the graph is not necessarily indicative of future performance.
| Independent Bank Corporation |
| | Period Ending | |
| Index | | 12/31/16 | | | 12/31/17 | | | 12/31/18 | | | 12/31/19 | | | 12/31/20 | | | 12/31/21 | |
| Independent Bank Corporation | | $ | 100.00 | | | $ | 105.03 | | | $ | 101.29 | | | $ | 112.84 | | | $ | 96.72 | | | $ | 129.79 | |
| NASDAQ Composite | | | 100.00 | | | | 129.64 | | | | 125.96 | | | | 172.17 | | | | 249.51 | | | | 304.85 | |
| NASDAQ Bank | | | 100.00 | | | | 118.39 | | | | 98.98 | | | | 135.78 | | | | 118.40 | | | | 162.58 | |
SELECTED CONSOLIDATED FINANCIAL DATA
| | | Year Ended December 31, | |
| | | 2021 | | | 2020 | | | 2019 | | | 2018 | | | 2017 | |
| | | (Dollars in thousands, except per share amounts) | |
| SUMMARY OF OPERATIONS | | | | | | | | | | | | | | | |
| Interest income | | $ | 138,080 | | | $ | 139,829 | | | $ | 148,928 | | | $ | 130,773 | | | $ | 98,309 | |
| Interest expense | | | 8,315 | | | | 16,217 | | | | 26,347 | | | | 17,491 | | | | 9,123 | |
| Net interest income | | | 129,765 | | | | 123,612 | | | | 122,581 | | | | 113,282 | | | | 89,186 | |
Provision for credit losses(1) | | | (1,928 | ) | | | 12,463 | | | | 824 | | | | 1,503 | | | | 1,199 | |
| Net gains on securities available for sale | | | 1,411 | | | | 267 | | | | 307 | | | | 138 | | | | 260 | |
| Other non-interest income | | | 75,232 | | | | 80,478 | | | | 47,429 | | | | 44,677 | | | | 42,273 | |
| Non-interest expense | | | 131,023 | | | | 122,413 | | | | 111,733 | | | | 107,461 | | | | 92,082 | |
| Income before income tax | | | 77,313 | | | | 69,481 | | | | 57,760 | | | | 49,133 | | | | 38,438 | |
| Income tax expense | | | 14,418 | | | | 13,329 | | | | 11,325 | | | | 9,294 | | | | 17,963 | |
| Net income | | $ | 62,895 | | | $ | 56,152 | | | $ | 46,435 | | | $ | 39,839 | | | $ | 20,475 | |
| | | | | | | | | | | | | | | | | | | | | |
| PER COMMON SHARE DATA | | | | | | | | | | | | | | | | | | | | |
| Net income per common share | | | | | | | | | | | | | | | | | | | | |
| Basic | | $ | 2.91 | | | $ | 2.56 | | | $ | 2.03 | | | $ | 1.70 | | | $ | 0.96 | |
| Diluted | | | 2.88 | | | | 2.53 | | | | 2.00 | | | | 1.68 | | | | 0.95 | |
| Cash dividends declared and paid | | | 0.84 | | | | 0.80 | | | | 0.72 | | | | 0.60 | | | | 0.42 | |
| Book value | | | 18.82 | | | | 17.82 | | | | 15.58 | | | | 14.38 | | | | 12.42 | |
| | | | | | | | | | | | | | | | | | | | | |
| SELECTED BALANCES | | | | | | | | | | | | | | | | | | | | |
| Assets | | $ | 4,704,740 | | | $ | 4,204,013 | | | $ | 3,564,694 | | | $ | 3,353,281 | | | $ | 2,789,355 | |
| Loans | | | 2,905,045 | | | | 2,733,678 | | | | 2,725,023 | | | | 2,582,520 | | | | 2,018,817 | |
Allowance for credit losses(1) | | | 47,252 | | | | 35,429 | | | | 26,148 | | | | 24,888 | | | | 22,587 | |
| Deposits | | | 4,117,090 | | | | 3,637,355 | | | | 3,036,727 | | | | 2,913,428 | | | | 2,400,534 | |
| Shareholders’ equity | | | 398,484 | | | | 389,522 | | | | 350,169 | | | | 338,994 | | | | 264,933 | |
| Other borrowings | | | 30,009 | | | | 30,012 | | | | 88,646 | | | | 25,700 | | | | 54,600 | |
| Subordinated debt | | | 39,357 | | | | 39,281 | | | | — | | | | — | | | | — | |
| Subordinated debentures | | | 39,592 | | | | 39,524 | | | | 39,456 | | | | 39,388 | | | | 35,569 | |
| | | | | | | | | | | | | | | | | | | | | |
| SELECTED RATIOS | | | | | | | | | | | | | | | | | | | | |
Net interest income to average interest earning assets | | | 3.10 | % | | | 3.34 | % | | | 3.80 | % | | | 3.88 | % | | | 3.65 | % |
| Net income to | | | | | | | | | | | | | | | | | | | | |
| Average shareholders' equity | | | 16.13 | | | | 15.68 | | | | 13.63 | | | | 12.38 | | | | 7.82 | |
| Average assets | | | 1.41 | | | | 1.43 | | | | 1.35 | | | | 1.27 | | | | 0.77 | |
| Average shareholders’ equity to average assets | | | 8.73 | | | | 9.10 | | | | 9.90 | | | | 10.27 | | | | 9.88 | |
| Tier 1 capital to average assets | | | 8.79 | | | | 9.15 | | | | 10.11 | | | | 10.47 | | | | 10.57 | |
| Non-performing loans to Portfolio Loans | | | 0.18 | | | | 0.29 | | | | 0.35 | | | | 0.33 | | | | 0.39 | |
| (1) | Beginning January 1, 2021, calculation is based on CECL methodology. Prior to January 1, 2021, calculation was based on the probable incurred loss methodology. |
MANAGEMENT’S DISCUSSION AND ANALYSIS OF
FINANCIAL CONDITION AND RESULTS OF OPERATIONS
Disclaimer Regarding Forward-Looking Statements. Statements in this report that are not statements of historical fact, including statements that include terms such as “will,” “may,” “should,” “believe,” “expect,” “forecast,” “anticipate,” “estimate,” “project,” “intend,” “likely,” “optimistic” and “plan” and statements about future or projected financial and operating results, plans, projections, objectives, expectations, and intentions, are forward-looking statements. Forward-looking statements include, but are not limited to, descriptions of plans and objectives for future operations, products or services; projections of our future revenue, earnings or other measures of economic performance; forecasts of credit losses and other asset quality trends; statements about our business and growth strategies; and expectations about economic and market conditions and trends. These forward-looking statements express our current expectations, forecasts of future events, or long-term goals. They are based on assumptions, estimates, and forecasts that, although believed to be reasonable, may turn out to be incorrect. Actual results could differ materially from those discussed in the forward-looking statements for a variety of reasons, including:
| • | economic, market, operational, liquidity, credit, and interest rate risks associated with our business including the impact of the ongoing COVID-19 pandemic on each of these items; |
| • | economic conditions generally and in the financial services industry, particularly economic conditions within Michigan and the regional and local real estate markets in which our bank operates including the economic impact of the ongoing COVID-19 pandemic in each of these areas; |
| • | the failure of assumptions underlying the establishment of, and provisions made to, our allowance for credit losses; |
| • | increased competition in the financial services industry, either nationally or regionally; |
| • | our ability to achieve loan and deposit growth; |
| • | volatility and direction of market interest rates; |
| • | the continued services of our management team; and |
| • | implementation of new legislation, which may have significant effects on us and the financial services industry. |
This list provides examples of factors that could affect the results described by forward-looking statements contained in this report, but the list is not intended to be all-inclusive. The risk factors disclosed in Part I – Item 1A of our Annual Report on Form 10-K for the year ended December 31, 2021, as updated by any new or modified risk factors disclosed in Part II – Item 1A of any subsequently filed Quarterly Report on Form 10-Q, include the primary risks our management believes could materially affect the results described by forward-looking statements in this report. However, those risks are not the only risks we face. Our results of operations, cash flows, financial position, and prospects could also be materially and adversely affected by additional factors that are not presently known to us, that we currently consider to be immaterial, or that develop after the date of this report. We cannot assure you that our future results will meet expectations. While we believe the forward-looking statements in this report are reasonable, you should not place undue reliance on any forward-looking statement. In addition, these statements speak only as of the date made. We do not undertake, and expressly disclaim, any obligation to update or alter any statements, whether as a result of new information, future events, or otherwise, except as required by applicable law.
Introduction. The following section presents additional information to assess the financial condition and results of operations of Independent Bank Corporation (“IBCP”), its wholly-owned bank, Independent Bank (the “Bank”), and their subsidiaries. This section should be read in conjunction with the consolidated financial statements and the supplemental financial data contained elsewhere in this annual report. We also encourage you to read our Annual Report on Form 10-K filed with the U.S. Securities and Exchange Commission (“SEC”). That report includes a list of risk factors that you should consider in connection with any decision to buy or sell our securities.
Overview. We provide banking services to customers located primarily in Michigan’s Lower Peninsula and also have two loan production offices in Ohio (Columbus and Fairlawn). As a result, our success depends to a great extent upon the economic conditions in Michigan’s Lower Peninsula.
Significant Developments. The COVID-19 pandemic and the related government mandates, restrictions, and guidance have created and may continue to create and contribute to significant economic uncertainty and market disruptions. Throughout 2020 and 2021, the volatility created by the pandemic and responses to the pandemic impacted our performance, customers, and the markets we serve.
Federal and state government responses have also created uncertainty. On November 4, 2021, the U.S. Department of Labor implemented an emergency temporary standard (ETS) mandating that all employers with 100 workers or more must require their employees to be fully vaccinated or submit to weekly testing. The ETS has been met with many subsequent legal challenges. On January 13, 2022, the U.S. Supreme Court stayed the ETS, sending the case back to the U.S. Court of Appeals for the Sixth Circuit for a decision on the merits. The timeline for such a decision is undetermined, and the outcomes remain unpredictable. In Michigan, the Department of Health and Human Services announced its intent to update quarantine and isolation periods to align with the Centers for Disease Control and Prevention’s newly shortened guidelines. These impending mandates and guidelines may have significant effects on the U.S. and Michigan economies, the banking sector generally, and our business specifically, the scope of which cannot be foreseen.
Based on this uncertainty, it is difficult to predict the extent to which the pandemic will continue to adversely impact our business, results of operations, financial condition, and customers. The potential impacts may include, but are not limited to:
| • | difficulties encountered by our business customers in addressing the effects of the pandemic may cause increases in loan delinquencies, foreclosures and defaults; |
| • | increases in our allowance for credit losses may be necessary; |
| • | declines in collateral values may occur; |
| • | third party disruptions may occur, including outages at network providers, on-line banking vendors and other suppliers; |
| • | there is increased cyber and payment fraud risk, as cybercriminals attempt to profit from the disruption, given increased online and remote activity; |
| • | we may experience operational failures due to changes in our normal business practices necessitated by the pandemic and related governmental actions; and/or |
| • | our production and efficiency may suffer due to employee illnesses and/or employees having to work remotely. |
Given the ongoing uncertainty with respect to the pandemic and potential government responses, these risk factors may continue to some degree for a significant period of time.
The extent to which the COVID-19 pandemic may impact our business, results of operations, asset valuations, financial condition, and customers will depend on future developments, which continue to be highly uncertain and difficult to predict. Those developments and factors are expected to include the evolution of the virus and new and emerging virus variants, vaccination rates and subsequent vaccine-“boosters,” actions taken by governmental authorities to address the foregoing, and the enforcement thereof, and how quickly and to what extent normal economic and operating conditions stabilize. Potential developments also include market factors such as interest rates, supply chain disruptions, inflation, consumer-welfare, and employment rates. We do not know the full extent of the potential impact. Material adverse impacts may include all or a combination of valuation impairments on our intangible assets, securities available for sale, loans, capitalized mortgage loan servicing rights or deferred tax assets.
It is against this backdrop that we discuss our results of operations and financial condition in 2021 as compared to earlier periods.
RESULTS OF OPERATIONS
Summary. We recorded net income of $62.9 million, or $2.88 per diluted share, in 2021, net income of $56.2 million, or $2.53 per diluted share, in 2020, and net income of $46.4 million, or $2.00 per diluted share, in 2019.
KEY PERFORMANCE RATIOS
| | Year Ended December 31, | |
| | 2021 | | | 2020 | | | 2019 | |
| Net income to | | | | | | | | | |
| Average shareholders' equity | | | 16.13 | % | | | 15.68 | % | | | 13.63 | % |
| Average assets | | | 1.41 | | | | 1.43 | | | | 1.35 | |
| Net income per common share | | | | | | | | | | | | |
| Basic | | $ | 2.91 | | | $ | 2.56 | | | $ | 2.03 | |
| Diluted | | | 2.88 | | | | 2.53 | | | | 2.00 | |
Net interest income. Net interest income is the most important source of our earnings and thus is critical in evaluating our results of operations. Changes in our net interest income are primarily influenced by our level of interest-earning assets and the income or yield that we earn on those assets and the manner and cost of funding our interest-earning assets. Certain macro-economic factors can also influence our net interest income such as the level and direction of interest rates, the difference between short-term and long-term interest rates (the steepness of the yield curve) and the general strength of the economies in which we are doing business. Finally, risk management plays an important role in our level of net interest income. The ineffective management of credit risk and interest-rate risk in particular can adversely impact our net interest income.
Net interest income totaled $129.8 million during 2021, compared to $123.6 million and $122.6 million during 2020 and 2019, respectively. The increase in net interest income in 2021 compared to 2020 primarily reflects a $529.9 million increase in average interest-earning assets that was partially offset by a 24 basis point decrease in our tax equivalent net interest income as a percent of average interest-earning assets (the “net interest margin”).
The increase in net interest income in 2020 compared to 2019 primarily reflects a $483.8 million increase in average interest-earning assets that was partially offset by a 46 basis point decrease in our net interest margin.
The increase in average interest-earning assets during 2021 primarily reflects an increase in securities available for sale and interest bearing cash deposits. The significant increases in these balances is primarily due to the deployment of funds from a substantial increase in deposits.
The decrease in the net interest margin during 2021 as compared to 2020 primarily reflects a change in the mix of earning assets as well as the origination of new loans and the purchase of securities available for sale at lower rates than those same instruments that have matured or paid off. These decreases were partially offset by the impact of Payroll Protection Program (“PPP”) loans and accelerated amortization of certain deferred losses on derivative financial instruments that were de-designated.
Due to the economic impact of COVID-19, the Federal Reserve Bank has taken a variety of actions to stimulate the economy, including lowering short-term interest rates. These actions, along with lower long-term interest rates, have placed pressure on our net interest margin.
Interest and fees on loans in 2021 include $8.9 million of accretion of net loan fees on PPP loans compared to $5.6 million in 2020. No such accretion is included in 2019.
Interest expense in 2020 included $1.6 million of accelerated amortization of deferred loss on certain derivative financial instruments that were de-designated. No such amortization is included in 2021 or 2019. See note #16 to the Consolidated Financial Statements for discussion regarding these derivative financial instruments.
The increase in average interest-earning assets during 2020 primarily reflects an increase in securities available for sale and interest bearing cash deposits. The significant increases in these balances is primarily due to the deployment of funds from a substantial increase in deposits. The decrease in the net interest margin during 2020 as compared to 2019 primarily reflects reductions in short-term interest rates during that year as well as a flattening of the yield curve.
2021, 2020 and 2019 interest income on loans includes $0.8 million, $1.1 million and $1.5 million, respectively, of accretion of the discount recorded on loans acquired in connection with our acquisition of Traverse City State Bank (“TCSB”) in 2018.
Our net interest income is also impacted by our level of non-accrual loans. Average non-accrual loans totaled $6.2 million, $11.2 million and $8.1 million in 2021, 2020 and 2019, respectively.
AVERAGE BALANCES AND RATES
| | | 2021 | | | 2020 | | | 2019 | |
| | | Average Balance | | | Interest | | | Rate | | | Average Balance | | | Interest | | | Rate | | | Average Balance | | | Interest | | | Rate | |
| | | (Dollars in thousands) | |
| ASSETS | | | | | | | | | | | | | | | | | | | | | | | | | | | |
| Taxable loans | | $ | 2,881,950 | | | $ | 116,358 | | | | 4.04 | % | | $ | 2,863,846 | | | $ | 122,875 | | | | 4.29 | % | | $ | 2,713,690 | | | $ | 133,574 | | | | 4.92 | % |
Tax-exempt loans(1) | | | 7,240 | | | | 362 | | | | 5.00 | | | | 7,145 | | | | 360 | | | | 5.04 | | | | 7,937 | | | | 391 | | | | 4.93 | |
| Taxable securities | | | 915,701 | | | | 14,488 | | | | 1.58 | | | | 635,914 | | | | 12,655 | | | | 1.99 | | | | 397,598 | | | | 11,842 | | | | 2.98 | |
Tax-exempt securities(1) | | | 348,346 | | | | 7,892 | | | | 2.27 | | | | 137,330 | | | | 3,673 | | | | 2.67 | | | | 52,324 | | | | 1,683 | | | | 3.22 | |
| Interest bearing cash | | | 79,915 | | | | 112 | | | | 0.14 | | | | 59,056 | | | | 184 | | | | 0.31 | | | | 48,023 | | | | 818 | | | | 1.70 | |
| Other investments | | | 18,427 | | | | 734 | | | | 3.98 | | | | 18,410 | | | | 905 | | | | 4.92 | | | | 18,359 | | | | 1,043 | | | | 5.68 | |
| Interest earning assets | | | 4,251,579 | | | | 139,946 | | | | 3.30 | | | | 3,721,701 | | | | 140,652 | | | | 3.78 | | | | 3,237,931 | | | | 149,351 | | | | 4.61 | |
| Cash and due from banks | | | 56,474 | | | | | | | | | | | | 49,886 | | | | | | | | | | | | 37,575 | | | | | | | | | |
| Other assets, net | | | 157,524 | | | | | | | | | | | | 162,068 | | | | | | | | | | | | 164,726 | | | | | | | | | |
| Total assets | | $ | 4,465,577 | | | | | | | | | | | $ | 3,933,655 | | | | | | | | | | | $ | 3,440,232 | | | | | | | | | |
| LIABILITIES | | | | | | | | | | | | | | | | | | | | | | | | | | | | | | | | | | | | |
Savings and interest-bearing checking | | $ | 2,282,607 | | | | 2,693 | | | | 0.12 | | | $ | 1,821,115 | | | | 3,882 | | | | 0.21 | | | $ | 1,453,061 | | | | 10,228 | | | | 0.70 | |
| Time deposits | | | 326,081 | | | | 1,772 | | | | 0.54 | | | | 516,306 | | | | 8,784 | | | | 1.70 | | | | 655,718 | | | | 13,197 | | | | 2.01 | |
| Other borrowings | | | 108,884 | | | | 3,850 | | | | 3.54 | | | | 117,904 | | | | 3,551 | | | | 3.01 | | | | 77,254 | | | | 2,922 | | | | 3.78 | |
| Interest bearing liabilities | | | 2,717,572 | | | | 8,315 | | | | 0.31 | | | | 2,455,325 | | | | 16,217 | | | | 0.66 | | | | 2,186,033 | | | | 26,347 | | | | 1.21 | |
| Non-interest bearing deposits | | | 1,288,276 | | | | | | | | | | | | 1,054,230 | | | | | | | | | | | | 867,314 | | | | | | | | | |
| Other liabilities | | | 69,694 | | | | | | | | | | | | 65,943 | | | | | | | | | | | | 46,153 | | | | | | | | | |
| Shareholders’ equity | | | 390,035 | | | | | | | | | | | | 358,157 | | | | | | | | | | | | 340,732 | | | | | | | | | |
| Total liabilities and shareholders’ equity | | $ | 4,465,577 | | | | | | | | | | | $ | 3,933,655 | | | | | | | | | | | $ | 3,440,232 | | | | | | | | | |
| Net interest income | | | | | | $ | 131,631 | | | | | | | | | | | $ | 124,435 | | | | | | | | | | | $ | 123,004 | | | | | |
| Net interest income as a percent of average interest earning assets | | | | | | | | | | | 3.10 | % | | | | | | | | | | | 3.34 | % | | | | | | | | | | | 3.80 | % |
| (1) | Interest on tax-exempt loans and securities is presented on a fully tax equivalent basis assuming a marginal tax rate of 21%. |
RECONCILIATION OF NET INTEREST MARGIN, FULLY TAXABLE EQUIVALENT ("FTE")
| | Year Ended December 31, | |
| | 2021 | | | 2020 | | | 2019 | |
| | (Dollars in thousands) | |
| Net interest income | | $ | 129,765 | | | $ | 123,612 | | | $ | 122,581 | |
| Add: taxable equivalent adjustment | | | 1,866 | | | | 823 | | | | 423 | |
| Net interest income - taxable equivalent | | $ | 131,631 | | | $ | 124,435 | | | $ | 123,004 | |
| Net interest margin (GAAP) | | | 3.05 | % | | | 3.32 | % | | | 3.79 | % |
| Net interest margin (FTE) | | | 3.10 | % | | | 3.34 | % | | | 3.80 | % |
CHANGE IN NET INTEREST INCOME
| | 2021 compared to 2020 | | | 2020 compared to 2019 | |
| | Volume | | | Rate | | | Net | | | Volume | | | Rate | | | Net | |
| | (In thousands) | |
Increase (decrease) in interest income(1) | | | | | | | | | | | | | | | | | | |
| Taxable loans | | $ | 772 | | | $ | (7,289 | ) | | $ | (6,517 | ) | | $ | 7,105 | | | $ | (17,804 | ) | | $ | (10,699 | ) |
Tax-exempt loans(2) | | | 5 | | | | (3 | ) | | | 2 | | | | (40 | ) | | | 9 | | | | (31 | ) |
| Taxable securities | | | 4,789 | | | | (2,956 | ) | | | 1,833 | | | | 5,582 | | | | (4,769 | ) | | | 813 | |
Tax-exempt securities(2) | | | 4,859 | | | | (640 | ) | | | 4,219 | | | | 2,318 | | | | (328 | ) | | | 1,990 | |
| Interest bearing cash | | | 51 | | | | (123 | ) | | | (72 | ) | | | 154 | | | | (788 | ) | | | (634 | ) |
| Other investments | | | 1 | | | | (172 | ) | | | (171 | ) | | | 3 | | | | (141 | ) | | | (138 | ) |
| Total interest income | | | 10,477 | | | | (11,183 | ) | | | (706 | ) | | | 15,122 | | | | (23,821 | ) | | | (8,699 | ) |
Increase (decrease) in interest expense(1) | | | | | | | | | | | | | | | | | | | | | | | | |
| Savings and interest bearing checking | | | 825 | | | | (2,014 | ) | | | (1,189 | ) | | | 2,109 | | | | (8,455 | ) | | | (6,346 | ) |
| Time deposits | | | (2,463 | ) | | | (4,549 | ) | | | (7,012 | ) | | | (2,555 | ) | | | (1,858 | ) | | | (4,413 | ) |
| Other borrowings | | | (286 | ) | | | 585 | | | | 299 | | | | 1,311 | | | | (682 | ) | | | 629 | |
| Total interest expense | | | (1,924 | ) | | | (5,978 | ) | | | (7,902 | ) | | | 865 | | | | (10,995 | ) | | | (10,130 | ) |
| Net interest income | | $ | 12,401 | | | $ | (5,205 | ) | | $ | 7,196 | | | $ | 14,257 | | | $ | (12,826 | ) | | $ | 1,431 | |
| (1) | The change in interest due to changes in both balance and rate has been allocated to change due to balance and change due to rate in proportion to the relationship of the absolute dollar amounts of change in each. |
| (2) | Interest on tax-exempt loans and securities is presented on a fully tax equivalent basis assuming a marginal tax rate of 21%. |
COMPOSITION OF AVERAGE INTEREST EARNING ASSETS AND INTEREST BEARING LIABILITIES
| | | Year Ended December 31, | |
| | | 2021 | | | 2020 | | | 2019 | |
| As a percent of average interest earning assets | | | | | | | | | |
| Loans | | | 68.0 | % | | | 77.1 | % | | | 84.1 | % |
| Other interest earning assets | | | 32.0 | | | | 22.9 | | | | 15.9 | |
| Average interest earning assets | | | 100.0 | % | | | 100.0 | % | | | 100.0 | % |
| Savings and interest-bearing checking | | | 53.7 | % | | | 48.9 | % | | | 44.9 | % |
| Time deposits | | | 7.7 | | | | 13.9 | | | | 20.3 | |
| Other borrowings | | | 2.6 | | | | 3.2 | | | | 2.3 | |
| Average interest bearing liabilities | | | 64.0 | % | | | 66.0 | % | | | 67.5 | % |
| Earning asset ratio | | | 95.2 | % | | | 94.6 | % | | | 94.1 | % |
Free-funds ratio(1) | | | 36.1 | | | | 34.0 | | | | 32.5 | |
| (1) | Average interest earning assets less average interest bearing liabilities. |
Provision for credit losses. We adopted Financial Accounting Standards Board Accounting Standards Update 2016-13, Financial Instruments — Credit Losses (Topic 326), Measurement of Credit Losses on Financial Instruments (“CECL”) on January 1, 2021. See note #1 to the Consolidated Financial Statements included within this report for our discussion on CECL implementation.
The provision for credit losses was a credit of $1.9 million in 2021 and an expense of $12.5 million and $0.8 million in 2020 and 2019, respectively. The provision reflects our assessment of the allowance for credit losses (the “ACL”) taking into consideration factors such as loan growth, loan mix, levels of non-performing and classified loans, economic conditions and loan net charge-offs. While we use relevant information to recognize losses on loans, additional provisions for related losses may be necessary based on changes in economic conditions, customer circumstances and other credit risk factors. The decrease in the provision for credit losses in 2021 compared to 2020 was primarily the result of a decline in the adjustment to allocations based on subjective factors and specific allocations as well as an increase in recoveries of loans previously charged off. In particular, the higher provision for credit losses in 2020 relative to 2021 and 2019 included an $11.2 million (or 128.2%) increase in the qualitative/subjective portion of the allowance for credit losses. That increase principally reflected the unique challenges and economic uncertainty resulting from the COVID-19 pandemic during the first half of 2020 and the potential impact on the loan portfolio. See “Portfolio Loans and asset quality” for a discussion of the various components of the ACL and their impact on the provision for credit losses in 2021 and note #19 to the Consolidated Financial Statements included within this report for a discussion on industry concentrations.
Non-interest income. Non-interest income is a significant element in assessing our results of operations. Non-interest income totaled $76.6 million during 2021 compared to $80.7 million and $47.7 million during 2020 and 2019, respectively.
NON-INTEREST INCOME
| | Year Ended December 31, | |
| | 2021 | | | 2020 | | | 2019 | |
| | (In thousands) | |
| Interchange income | | $ | 14,045 | | | $ | 11,230 | | | $ | 10,297 | |
| Service charges on deposit accounts | | | 10,170 | | | | 8,517 | | | | 11,208 | |
| Net gains on assets | | | | | | | | | | | | |
| Mortgage loans | | | 35,880 | | | | 62,560 | | | | 19,978 | |
| Securities available for sale | | | 1,411 | | | | 267 | | | | 307 | |
| Mortgage loan servicing, net | | | 5,745 | | | | (9,350 | ) | | | (3,336 | ) |
| Investment and insurance commissions | | | 2,603 | | | | 1,971 | | | | 1,658 | |
| Bank owned life insurance | | | 567 | | | | 910 | | | | 1,111 | |
| Other | | | 6,222 | | | | 4,640 | | | | 6,513 | |
| Total non-interest income | | $ | 76,643 | | | $ | 80,745 | | | $ | 47,736 | |
Interchange income totaled $14.0 million in 2021 compared to $11.2 million in 2020 and $10.3 million in 2019. The increase in interchange income in 2021 compared to 2020 is primarily due to growth in debit card transaction volume (2020 was adversely impacted by COVID-19 pandemic related shut-downs of businesses and stay at home mandates), a new switch contract that was initially effective in the fourth quarter of 2020 that increased revenues, and our joining a surcharge free ATM network in April 2020 that increased both interchange income and interchange expense. The increase in interchange income in 2020 compared to 2019 is primarily due to an increase in transaction volume.
Service charges on deposit accounts totaled $10.2 million in 2021, as compared to $8.5 million in 2020 and $11.2 million during 2019. The increase in 2021 compared to 2020 was primarily due to an increase in non-sufficient funds occurrences (and related fees). The decrease in 2020 compared to 2019 primarily reflect declines in non-sufficient funds fees. During 2020, non-sufficient funds fees were impacted by contracted consumer spending and government stimulus payments related to COVID-19.
We realized net gains of $35.9 million on mortgage loans during 2021, compared to $62.6 million and $20.0 million during 2020 and 2019 respectively. Mortgage loan activity is summarized as follows:
MORTGAGE LOAN ACTIVITY
| | Year Ended December 31, | |
| | 2021 | | | 2020 | | | 2019 | |
| | | (Dollars in thousands) | |
| Mortgage loans originated | | $ | 1,861,060 | | | $ | 1,820,697 | | | $ | 1,011,141 | |
Mortgage loans sold(1) | | | 1,254,638 | | | | 1,447,031 | | | | 738,910 | |
| Net gains on mortgage loans | | | 35,880 | | | | 62,560 | | | | 19,978 | |
| Net gains as a percent of mortgage loans sold (“Loan Sales Margin”) | | | 2.86 | % | | | 4.32 | % | | | 2.70 | % |
| Fair value adjustments included in the Loan Sales Margin | | | (0.52 | ) | | | 0.47 | | | | 0.22 | |
| (1) | 2021 includes the sale of $9.6 million of portfolio residential fixed rate mortgage loans. 2020 includes the securitization of $26.3 million of portfolio residential fixed rate loans and the sale of $2.4 million of portfolio residential fixed rate mortgage loans. 2019 includes the sale of $50.5 million of portfolio residential fixed and adjustable rate mortgage loans to other institutions and securitization of $65.1 million of portfolio residential fixed rate loans. |
The increase in mortgage loan originations in 2021 as compared to 2020 is due primarily to an increase in purchase money mortgages reflecting strong home sales in many of our markets. Mortgage loans sold decreased in 2021 compared to 2020 due to a lower mix of salable loans in our origination volumes. Net gains on mortgage loans decreased in 2021 as compared to 2020 due to the decline in loan sale volume, a decrease in the Loan Sales Margin and fair value adjustments as discussed below.
The increase in mortgage loan originations, sales and net gains in 2020 as compared to 2019 is due primarily to lower interest rates in 2020 that spurred a significant increase in refinance volumes. Mortgage loans sold also increased in 2020 compared to 2019 due to a higher mix of salable loans in our origination volumes. Net gains on mortgage loans also increased in 2020 as compared to 2019 due to fair value adjustments as discussed below.
The volume of loans sold is dependent upon our ability to originate mortgage loans as well as the demand for fixed-rate obligations and other loans that we choose to not put into portfolio because of our established interest-rate risk parameters. (See “Portfolio Loans and asset quality.”) Net gains on mortgage loans are also dependent upon economic and competitive factors as well as our ability to effectively manage exposure to changes in interest rates and thus can often be a volatile part of our overall revenues.
Our Loan Sales Margin is impacted by several factors including competition and the manner in which the loan is sold. Net gains on mortgage loans are also impacted by recording fair value accounting adjustments. Excluding these fair value accounting adjustments, the Loan Sales Margin would have been 3.38% in 2021, 3.85% in 2020 and 2.48% in 2019. The decrease in the Loan Sales Margin (excluding fair value adjustments) in 2021 was generally due to a tightening of primary-to-secondary market pricing spreads as market interest rates increased during 2021. The changes in the fair value accounting adjustments are primarily due to changes in the amount of commitments to originate mortgage loans for sale during each year as well as a lower Loan Sales Margin in 2021.
We generated net gains on securities of $1.41 million, $0.27 million and $0.31 million in 2021, 2020 and 2019, respectively. These net gains were due to the sales of securities and changes in the fair value of equity/trading securities as outlined in the table below. We recorded no credit related charges in 2021, 2020 or 2019 for securities available for sale.
GAINS AND LOSSES ON SECURITIES
| | Year Ended December 31, | |
| | Proceeds | | | Gains(1) | | | Losses | | | Net | |
| | (In thousands) | |
| 2021 | | $ | 85,371 | | | $ | 1,475 | | | $ | 64 | | | $ | 1,411 | |
| 2020 | | | 38,095 | | | | 271 | | | | 4 | | | | 267 | |
| 2019 | | | 68,716 | | | | 415 | | | | 108 | | | | 307 | |
| (1) | Gains in 2019 include $0.166 million related to equity securities at fair value. |
Mortgage loan servicing, net, generated a gain of $5.7 million in 2021 compared to losses of $9.4 million and $3.3 million in 2020 and 2019 respectively. The significant variances in mortgage loan servicing, net are primarily due to changes in the fair value of capitalized mortgage loan servicing rights associated with changes in mortgage loan interest rates and expected future prepayment levels. Mortgage loan servicing, net activity is summarized in the following table:
MORTGAGE LOAN SERVICING ACTIVITY
| | 2021 | | | 2020 | | | 2019 | |
| | (In thousands) | |
| Mortgage loan servicing: | | | | | | | | | |
| Revenue, net | | $ | 7,853 | | | $ | 6,874 | | | $ | 6,196 | |
| Fair value change due to price | | | 3,380 | | | | (10,833 | ) | | | (6,408 | ) |
| Fair value change due to pay-downs | | | (5,488 | ) | | | (5,391 | ) | | | (3,124 | ) |
| Total | | $ | 5,745 | | | $ | (9,350 | ) | | $ | (3,336 | ) |
Activity related to capitalized mortgage loan servicing rights is as follows:
CAPITALIZED MORTGAGE LOAN SERVICING RIGHTS
| | 2021 | | | 2020 | | | 2019 | |
| | (In thousands) | |
| Balance at January 1, | | $ | 16,904 | | | $ | 19,171 | | | $ | 21,400 | |
| Originated servicing rights capitalized | | | 11,436 | | | | 13,957 | | | | 7,303 | |
| Change in fair value | | | (2,108 | ) | | | (16,224 | ) | | | (9,532 | ) |
| Balance at December 31, | | $ | 26,232 | | | $ | 16,904 | | | $ | 19,171 | |
At December 31, 2021, we were servicing approximately $3.3 billion in mortgage loans for others on which servicing rights have been capitalized. This servicing portfolio had a weighted average coupon rate of 3.46% and a weighted average service fee of approximately 25.6 basis points. Remaining capitalized mortgage loan servicing rights at December 31, 2021 totaled $26.2 million, representing approximately 78.9 basis points on the related amount of mortgage loans serviced for others.
Investment and insurance commissions totaled $2.6 million in 2021 as compared to $2.0 million and $1.7 million in 2020 and 2019. The increase in revenue in 2021 as compared to 2020 and 2019 was primarily due to higher sales volume and an increase in fee based revenue.
We earned $0.6 million, $0.9 million and $1.1 million in 2021, 2020 and 2019, respectively, on our separate account bank owned life insurance principally as a result of increases in the cash surrender value. Our separate account is primarily invested in agency mortgage-backed securities and managed by a fixed income investment manager. The crediting rate (on which the earnings are based) reflects the performance of the separate account. The total cash surrender value of our bank owned life insurance was $55.3 million and $55.2 million at December 31, 2021 and 2020, respectively. The decrease in earnings in each year is due to a decrease in the crediting rate.
Other non-interest income totaled $6.2 million, $4.6 million and $6.5 million in 2021, 2020 and 2019, respectively. Other non-interest income increased in 2021 as compared to 2020 due primarily to increases in credit card and merchant processing revenue, higher commercial loan swap fee income and a one-time fee reimbursement from our core data processing vendor for conversion related loss of revenues. The decrease in 2020 as compared to 2019 is due to the impact of the COVID-19 pandemic on transaction volumes, including ATM fees. In addition, we elected to suspend certain electronic banking fees because of the COVID-19 pandemic and the increased need for our customers to access these channels. Fees related to interest rate swaps for commercial loan customers were also lower in 2020 as customers did not feel the need to execute such transactions given the low interest rate environment.
Non-interest expense. Non-interest expense is an important component of our results of operations. We strive to efficiently manage our cost structure.
Non-interest expense totaled $131.0 million in 2021, $122.4 million in 2020, and $111.7 million in 2019. Increases in compensation and employee benefits, data processing, interchange expense, costs related to unfunded lending commitments and other expenses are primarily responsible for the increase in 2021 compared to 2020. Performance based compensation and expense related to the core data processing conversion are primarily responsible for the increase in 2020 compared to 2019. The components of non-interest expense are as follows:
NON-INTEREST EXPENSE
| | Year ended December 31, | |
| | 2021 | | | 2020 | | | 2019 | |
| | | (In thousands) | |
| Compensation | | $ | 44,226 | | | $ | 41,517 | | | $ | 41,719 | |
| Performance-based compensation | | | 19,800 | | | | 19,725 | | | | 12,066 | |
| Payroll taxes and employee benefits | | | 15,943 | | | | 13,539 | | | | 13,716 | |
| Compensation and employee benefits | | | 79,969 | | | | 74,781 | | | | 67,501 | |
| Data processing | | | 10,823 | | | | 8,534 | | | | 8,905 | |
| Occupancy, net | | | 8,794 | | | | 8,938 | | | | 9,013 | |
| Interchange expense | | | 4,434 | | | | 3,342 | | | | 3,215 | |
| Furniture, fixtures and equipment | | | 4,172 | | | | 4,089 | | | | 4,113 | |
| Loan and collection | | | 3,172 | | | | 3,037 | | | | 2,685 | |
| Communications | | | 3,080 | | | | 3,194 | | | | 2,947 | |
| Legal and professional | | | 2,068 | | | | 2,027 | | | | 1,814 | |
| Advertising | | | 1,918 | | | | 2,230 | | | | 2,450 | |
| Conversion related expenses | | | 1,827 | | | | 2,586 | | | | — | |
| FDIC deposit insurance | | | 1,396 | | | | 1,596 | | | | 685 | |
| Costs related to unfunded lending commitments | | | 1,207 | | | | 263 | | | | 246 | |
| Amortization of intangible assets | | | 970 | | | | 1,020 | | | | 1,089 | |
| Supplies | | | 611 | | | | 680 | | | | 638 | |
| Correspondent bank service fees | | | 382 | | | | 395 | | | | 411 | |
| Provision for loss reimbursement on sold loans | | | 133 | | | | 200 | | | | 229 | |
| Branch closure costs | | | — | | | | 417 | | | | — | |
| Net (gains) losses on other real estate and repossessed assets | | | (230 | ) | | | 64 | | | | (90 | ) |
| Other | | | 6,297 | | | | 5,020 | | | | 5,882 | |
| Total non-interest expense | | $ | 131,023 | | | $ | 122,413 | | | $ | 111,733 | |
Compensation expense, which is primarily salaries, totaled $44.2 million, $41.5 million and $41.7 million in 2021, 2020 and 2019, respectively. The comparative increase in 2021 to 2020 is primarily due to an increase in lending personnel, higher overtime levels and salary increases that were predominantly effective on January 1, 2021. The comparative decrease in 2020 to 2019 is primarily due to an increased level of compensation that was deferred as direct loan origination costs (due to higher loan origination volumes) that was partially offset by salary increases that were predominantly effective on January 1, 2020.
Performance-based compensation expense totaled $19.8 million, $19.7 million and $12.1 million in 2021, 2020 and 2019, respectively. The increase in 2020 as compared to 2019 was due to actual performance relative to the established incentive plan targets as well as $0.4 million in bonuses paid during the second quarter of 2020 to front-line personnel due to their extraordinary efforts during the COVID-19 pandemic.
We maintain performance-based compensation plans. In addition to commissions and cash incentive awards, such plans include an ESOP and a long-term equity based incentive plan. The amount of expense recognized in 2021, 2020 and 2019 for share-based awards under our long-term equity based incentive plan was $1.6 million in each respective year. In each of those three years, we granted both restricted stock and performance share awards under the plan.
Payroll taxes and employee benefits expense totaled $15.9 million, $13.5 million and $13.7 million in 2021, 2020 and 2019, respectively. The increase in 2021 compared to 2020 is primarily due to increases in payroll taxes (reflecting higher compensation costs), our 401(k) plan match and health care costs (due to increased claims in 2021).
The decrease in 2020 compared to 2019 is due primarily to a decline in health care costs (due to decreased claims in 2020) as well as a $0.3 million prescription drug rebate received and recorded in the second quarter of 2020 that related to our 2019 plan year. The decrease in 2020 health care claims is due in part to the COVID-19 pandemic that resulted in the closing of many medical and dental facilities except for emergency care during Michigan’s “stay home, stay safe” period.
Data processing expenses totaled $10.8 million, $8.5 million, and $8.9 million in 2021, 2020 and 2019, respectively. The increase in 2021 compared to 2020 is primarily due to the 2020 cost savings agreement discussed below that expired during the first quarter of 2021. The remainder of the increased costs in 2021 principally relate to new software and technology product and service additions. The decrease in 2020 compared to 2019 is primarily due to a cost savings agreement related to core data processing services that was executed in the second quarter of 2020. This expense reduction was partially offset by new software product additions and increased mobile banking costs.
Interchange expense, which totaled $4.4 million, $3.3 million, and $3.2 million in 2021, 2020 and 2019, respectively, primarily represents fees paid to our core information systems processor and debit card licensor related to debit card and ATM transactions. The increase in 2021 compared to 2020 was primarily due to increased debit card transaction volume and transaction channel mix. Increased debit card transaction volumes in 2020 compared to 2019 contributed to the rise in this expense from 2019 to 2020.
Loan and collection expenses reflect costs related to new lending activity as well as the management and collection of non-performing loans and other problem credits. These expenses totaled $3.2 million, $3.0 million and $2.7 million in 2021, 2020 and 2019, respectively. These costs increased in 2021 and 2020 due primarily to higher loan origination activity.
Communications expense totaled $3.1 million, $3.2 million and $2.9 million in 2021, 2020 and 2019, respectively. These costs were relatively unchanged in 2021 while the increase in 2020 relative to 2019 was primarily due to mailing costs related to the issuance of new contactless debit cards.
Legal and professional fees totaled $2.1 million, $2.0 million, and $1.8 million in 2021, 2020 and 2019, respectively. These costs were relatively unchanged in 2021 while the increase in 2020 was due primarily to an increase in title search fees and bank examination fees (due to an increase in our asset size).
Advertising expense totaled $1.9 million, $2.2 million, and $2.5 million in 2021, 2020 and 2019, respectively. The decrease in 2021 compared to 2020 is due primarily due to the receipt of a $0.3 million reimbursement from our debit card provider for certain eligible marketing costs that we incurred as well as reduced levels of advertising in certain channels. The decrease in 2020 compared to 2019 was due primarily to the receipt of a $0.2 million reimbursement from our debit card provider for certain eligible marketing costs that we incurred.
Conversion related expenses totaled $1.8 million and $2.6 million in 2021 and 2020, respectively. We began a process to convert our core data processing system to a new system hosted by a different vendor in early 2020 and completed this conversion in May 2021. These expenses represent costs incurred for assistance from our existing vendor and fees from consultants who assisted us in this conversion.
FDIC deposit insurance expense totaled $1.4 million, $1.6 million, and $0.7 million in 2021, 2020 and 2019, respectively. FDIC deposit insurance expense decreased in 2021 compared to 2020 due primarily to a lower assessment rate. FDIC deposit insurance expense increased in 2020 compared to 2019 due primarily to the use of our FDIC Small Bank Assessment Credit in 2019 as well as an increase in our assessment rate and growth in our total assets.
The changes in costs related to unfunded lending commitments are primarily impacted by changes in the amounts of such commitments to originate Portfolio Loans as well as (for commercial loan commitments) the grade (pursuant to our loan rating system) of such commitments. Costs related to unfunded lending commitments totaled $1.2 million, $0.3 million, and $0.2 million in 2021, 2020 and 2019, respectively. The increase in 2021 compared to 2020 and 2019 is due primarily to an increase in the amount of unfunded lending commitments.
The amortization of intangible assets primarily relates to our acquisition of TSCB and certain branch acquisitions and the related amortization of the deposit customer relationship value, including core deposit value,
which was acquired in connection with those transactions. We had remaining unamortized intangible assets of $3.3 million and $4.3 million at December 31, 2021 and 2020 respectively. See note #7 to the Consolidated Financial Statements for a schedule of future amortization of intangible assets.
Branch closure costs totaled $0.4 million for 2020. We closed eight Bank branches in 2020 (two on June 26, 2020 and six on July 31, 2020). These costs primarily represent write-downs of fixed assets (buildings, furniture and equipment) and lease assets.
Net (gains) losses on other real estate and repossessed assets represent the gain or loss on the sale or additional write downs on these assets subsequent to the transfer of the asset from our loan portfolio. This transfer occurs at the time we acquire the collateral that secured the loan. At the time of acquisition, the other real estate or repossessed asset is valued at fair value, less estimated costs to sell, which becomes the new basis for the asset. Any write-downs at the time of acquisition are charged to the allowance for credit losses. Net gain was $0.2 million in 2021 compared to net loss of $0.1 million and a net gain of $0.1 million in 2020 and 2019 respectively.
Other non-interest expenses totaled $6.3 million, $5.0 million, and $5.9 million in 2021, 2020 and 2019, respectively. The increase in other expense in 2021 compared to 2020 primarily represents increases in travel and entertainment related expenses due to the lifting of COVID-19 travel restrictions, an increase in deposit customer account fraud related costs, an increase in Michigan Corporate Income Tax expense as the result of a change in how the tax base is calculated, a branch write-down and certain one-time contract termination costs. The decrease in 2020 was primarily due to a decline in travel and entertainment costs due to COVID-19 pandemic related travel restrictions as well as a reduction in deposit customer account and customer debit card related fraud costs.
Income tax expense. We recorded an income tax expense of $14.4 million, $13.3 million and $11.3 million in 2021, 2020 and 2019, respectively. The 2021 increase in tax expense compared to 2020 and 2019 is due to higher taxable income.
Our actual federal income tax expense is different than the amount computed by applying our statutory federal income tax rate to our pre-tax income primarily due to tax-exempt interest income, share based compensation and tax-exempt income from the increase in the cash surrender value on life insurance.
We assess whether a valuation allowance should be established against our deferred tax asset, net (“DTA”) based on the consideration of all available evidence using a “more likely than not” standard. The ultimate realization of this asset is primarily based on generating future income. We concluded at December 31, 2021 and 2020 that the realization of substantially all of our DTA continues to be more likely than not. See note #13 to the Consolidated Financial Statements included within this report for more information.
FINANCIAL CONDITION
Summary. Our total assets increased to $4.70 billion at December 31, 2021, compared to $4.20 billion at December 31, 2020, primarily due to growth in securities available for sale as well as mortgage and installment loans. Loans, excluding loans held for sale (“Portfolio Loans”), totaled $2.91 billion and $2.73 billion at December 31, 2021 and December 31, 2020. Growth in mortgage loans of $123.7 million and installment loans of $86.5 million were partially offset by a decline in commercial loans of $38.8 million.
Deposits totaled $4.12 billion at December 31, 2021, compared to $3.64 billion at December 31, 2020. The $479.7 million increase in deposits is primarily due to growth in non-interest bearing deposits, savings and interest bearing checking deposits, reciprocal deposits and time deposits that were partially offset by a decline in brokered time deposits.
The decrease in commercial loans in 2021 is due primarily to forgiveness of loans extended under the PPP administered by the U.S. Small Business Administration (“SBA”). The increase in deposits is due in part to the significant liquidity that has been injected into the economy through government programs, such as the PPP, as well as by monetary actions by the Federal Reserve Bank, all in response to the COVID-19 pandemic.
It is unclear how the termination of these various government stimulus programs will impact the levels of portfolio loans and deposits. However, our liquidity and funding contingency plans take into account the possibility of significant reductions in commercial loans and deposits during 2022.
Securities. We maintain diversified securities portfolios, which include obligations of U.S. government- sponsored agencies, securities issued by states and political subdivisions, residential and commercial mortgage- backed securities, asset-backed securities, corporate securities, trust preferred securities and foreign government securities (that are denominated in U.S. dollars). We regularly evaluate asset/liability management needs and attempt to maintain a portfolio structure that provides sufficient liquidity and cash flow. Except as discussed below, we believe that the unrealized losses on securities available for sale are temporary in nature and are expected to be recovered within a reasonable time period. We believe that we have the ability to hold securities with unrealized losses to maturity or until such time as the unrealized losses reverse. (See “Asset/liability management.”) Securities available for sale increased by $340.7 million during 2021, reflecting the deployment of a portion of the funds generated from the growth in deposits.
Securities available for sale in unrealized loss positions are evaluated quarterly for impairment related to credit losses. For securities available for sale in an unrealized loss position, we first assess whether we intend to sell, or it is more likely than not that we will be required to sell, the security before recovery of its amortized cost basis. If either of the criteria regarding intent or requirement to sell is met, the security’s amortized cost basis is written down to fair value through income. For securities available for sale that do not meet this criteria, we evaluate whether the decline in fair value has resulted from credit losses or other factors. In making this assessment, we consider the extent to which fair value is less than amortized cost, adverse conditions specifically related to the security and the issuer and the impact of changes in market interest rates on the market value of the security, among other factors. If this assessment indicates that a credit loss exists, we compare the present value of cash flows expected to be collected from the security with the amortized cost basis of the security. If the present value of cash flows expected to be collected is less than the amortized cost basis for the security, a credit loss exists and an ACL is recorded, limited to the amount that the fair value of the security is less than its amortized cost basis. Any impairment that has not been recorded through an ACL is recognized in other comprehensive income (loss), net of applicable taxes. No ACL for securities available for sale was needed at December 31, 2021.
SECURITIES
| | Amortized | | | Unrealized | | | Fair | |
| | Cost | | | Gains | | | Losses | | | Value | |
| | (In thousands) | |
| Securities available for sale | | | | | | | | | | | | |
| December 31, 2021 | | $ | 1,404,858 | | | $ | 16,594 | | | $ | 8,622 | | | $ | 1,412,830 | |
| December 31, 2020 | | | 1,052,147 | | | | 21,416 | | | | 1,404 | | | | 1,072,159 | |
Portfolio Loans and asset quality. In addition to the communities served by our Bank branch and loan production office network, our principal lending markets also include nearby communities and metropolitan areas.
Subject to established underwriting criteria, we also may participate in commercial lending transactions with certain non-affiliated banks and make whole loan purchases from other financial institutions.
The senior management and board of directors of our Bank retain authority and responsibility for credit decisions and we have adopted uniform underwriting standards. Our loan committee structure and the loan review process attempt to provide requisite controls and promote compliance with such established underwriting standards. However, there can be no assurance that our lending procedures and the use of uniform underwriting standards will prevent us from incurring significant credit losses in our lending activities.
We generally retain loans that may be profitably funded within established risk parameters. (See “Asset/liability management.”) As a result, we may hold adjustable-rate conventional and fixed rate jumbo mortgage loans as Portfolio Loans, while 15- and 30-year fixed-rate non-jumbo mortgage loans are generally sold to mitigate exposure to changes in interest rates. (See “Non-interest income.”) Due primarily to the expansion of our mortgage-banking activities and a change in mix in our mortgage loan originations, we are now originating and putting into Portfolio Loans more fixed rate mortgage loans compared to past periods. These fixed rate mortgage loans generally have terms from 15 to 30 years, do not have prepayment penalties and expose us to more interest rate risk. (See “Asset/liability management”).
LOAN PORTFOLIO SEGMENTS
The following table summarizes each loan portfolio segment by (1) scheduled repayments and (2) predetermined (fixed) interest rate and/or adjustable (variable) interest rate at December 31, 2021:
| | Commercial | | | Mortgage | | | Installment | | | Total | |
| | | (In thousands) | |
| Due in one year or less | | $ | 117,497 | | | $ | 840 | | | $ | 2,033 | | | $ | 120,370 | |
Due after one but within five years
| | | 293,483 | | | | 2,610 | | | | 49,500 | | | | 345,593 | |
Due after five but within 15 years
| | | 774,772 | | | | 114,703 | | | | 454,134 | | | | 1,343,609 | |
| Due after 15 years | | | 17,829 | | | | 1,021,506 | | | | 56,138 | | | | 1,095,473 | |
| | | $ | 1,203,581 | | | $ | 1,139,659 | | | $ | 561,805 | | | $ | 2,905,045 | |
| | | | | | | | | | | | | | | | | |
| Fixed rate | | $ | 626,148 | | | $ | 736,515 | | | $ | 558,069 | | | $ | 1,920,732 | |
| Variable rate | | | 577,433 | | | | 403,144 | | | | 3,736 | | | | 984,313 | |
| | | $ | 1,203,581 | | | $ | 1,139,659 | | | $ | 561,805 | | | $ | 2,905,045 | |
In the fourth quarter of 2021 we reclassified $34.8 million (fair value of $34.8 million) of portfolio mortgage loans to held for sale. These loans were sold to other financial institutions on a servicing retained basis during the first quarter of 2022. In 2020 we sold or securitized $28.7 million of fixed and adjustable rate portfolio mortgage loans. In 2019, we sold or securitized $75.0 million of fixed and adjustable rate portfolio mortgage loans. All of these loan sales/securitizations were non-recourse (other than standard representations and warranties) and were executed primarily for asset/liability management purposes.
The PPP is a short-term, forgivable loan program primarily intended to help businesses impacted by COVID-19 to continue paying their employees. A short summary of the PPP is as follows:
| • | Terms of two years (five years for loans originated after June 5, 2020) with payments automatically deferred to the date the SBA remits the borrower’s loan forgiveness amount to the lender (or, if the borrower does not apply for loan forgiveness, 10 months after the end of the borrower’s loan forgiveness covered period); |
| • | One percent interest rate; |
| • | No collateral or personal guarantees required; |
| • | No fees paid by the borrower, rather lenders are paid a fee through the SBA according to a set schedule based on loan size; |
| • | Loans are forgivable if at least 60% of the loan proceeds are used for payroll with the remainder being used for rent, mortgage interest and/or utilities; and |
| • | Streamlined forgiveness application process for PPP loans of $50,000 or less. |
PAYCHECK PROTECTION PROGRAM
A summary of our participation in the PPP follows:
| | December 31, | |
| | 2021 | | | 2020 | |
| | Amount (#) | | | Amount ($) | | | Amount (#) | | | Amount ($) | |
| | (Dollars in thousands) | |
| Closed and outstanding - Round 1 loans | | | 6 | | | $ | 197 | | | | 1,483 | | | $ | 169,782 | |
| Closed and outstanding - Round 2 loans | | | 180 | | | | 26,167 | | | | — | | | | — | |
| Total closed and outstanding | | | 186 | | | $ | 26,364 | | | | 1,483 | | | $ | 169,782 | |
| Unaccreted net fees remaining at period end | | | | | | $ | 806 | | | | | | | $ | 3,216 | |
Congress and the major bank regulatory agencies encouraged banks to work with their borrowers to provide short-term loan payment relief during the COVID-19 national emergency. On March 22, 2020, an interagency statement was released by the Board of Governors of the Federal Reserve System, the Federal Deposit Insurance Corporation, the Office of the Comptroller of the Currency, the Consumer Financial Protection Bureau, the Conference of State Bank Supervisors, and the National Credit Union Administration that contained guidance regarding loan modifications made in response to the pandemic. In general, in order for a loan modification made in response to the pandemic to avoid being classified as a troubled debt restructuring (“TDR”):
| • | The modified loan must be current when the modification is made; |
| • | The modification must be short term in nature (up to six months); and |
| • | Modifications may include payment deferrals, fee waivers, extensions of repayment terms or other delays in payment that are insignificant. |
In addition, Section 4013 of the federal CARES Act provides temporary relief from the accounting and reporting requirements for TDRs regarding certain loan modifications for our customers. Section 4013 specified that COVID-19 related modifications on loans that were current as of December 31, 2019 are not TDRs. The provisions of Section 4013 were extended to the earlier of 60 days after the termination of the national emergency that was previously declared on March 13, 2020 or January 1, 2022 by the Economic Aid to Hard-Hit Small Businesses, Nonprofits, and Venues Act which was signed into law on December 27, 2020.
In response to our customers’ needs during this time of economic uncertainty, we have initiated forbearance programs for our retail (mortgage and installment loans) and our commercial customers. We also have similar programs for mortgage loans that we service for others. Commercial loan accommodations have typically been a three month interest-only period while retail loan (mortgage and installment) forbearances have primarily been payment suspensions for three months. To date, there have not been a significant number of requests for additional modifications. See note #4 to the Consolidated Financial Statements included within this report.
COMMERCIAL AND RETAIL LOAN COVID-19 ACCOMMODATIONS
A summary of accommodations as of December 31, 2021 follows:
| | Covid-19 Accommodations | | | Total | | | % of Total | |
| Loan Category | | Amount (#) | | | Amount ($) | | | Loans | | | Loans | |
| | (Dollars in thousands) | |
| Commercial | | | — | | | $ | — | | | $ | 1,203,581 | | | | 0.0 | % |
| Mortgage | | | 22 | | | | 2,278 | | | | 1,139,659 | | | | 0.2 | % |
| Installment | | | 1 | | | | 55 | | | | 561,805 | | | | 0.0 | % |
| Total | | | 23 | | | $ | 2,333 | | | $ | 2,905,045 | | | | 0.1 | % |
Mortgage loans serviced for others(1) | | | 46 | | | $ | 5,163 | | | $ | 3,323,521 | | | | 0.2 | % |
| (1) | We have delegated authority from all investors to grant these deferrals on their behalf. |
Certain industries (such as hotels and restaurants) have been more adversely impacted by the COVID-19 pandemic and related periodic shut downs of our economy. We believe that the following concentrations within our commercial loan portfolio represent greater potential risk in the current economic environment. The balances below are as of December 31, 2021.
COMMERCIAL LOAN SEGMENT
| | Amount | | | % of Total Loans | |
| | (Dollars in millions) | |
| Commercial and industrial: | | | | | | |
| Retail | | $ | 70 | | | | 2.4 | % |
| Food service | | | 49 | | | | 1.7 | |
| Hotel | | | 40 | | | | 1.4 | |
| | | | 159 | | | | 5.5 | |
| Commercial real estate: | | | | | | | | |
| Retail | | | 109 | | | | 3.8 | |
| Office | | | 72 | | | | 2.5 | |
| Multifamily | | | 55 | | | | 1.9 | |
| | | | 236 | | | | 8.1 | |
| Total | | $ | 395 | | | | 13.6 | % |
We are closely monitoring these industry concentrations and at present do not foresee any significant losses relative to this portion of our loan portfolio given the current economic conditions in Michigan and the fact that businesses have reopened. However, a high degree of uncertainty still exists with respect to the impact of the COVID-19 pandemic and the related economic disruptions on the future performance of our loan portfolio, including these concentrations.
LOAN PORTFOLIO COMPOSITION
| | December 31, | |
| | 2021 | | | 2020 | |
| | (In thousands) | |
Real estate(1) | | | | | | |
| Residential first mortgages | | $ | 870,169 | | | $ | 792,762 | |
| Residential home equity and other junior mortgages | | | 128,801 | | | | 138,128 | |
| Construction and land development | | | 278,992 | | | | 232,693 | |
Other(2) | | | 726,224 | | | | 669,150 | |
| Consumer | | | 339,785 | | | | 468,090 | |
| Commercial | | | 555,696 | | | | 429,011 | |
| Agricultural | | | 5,378 | | | | 3,844 | |
| Total loans | | $ | 2,905,045 | | | $ | 2,733,678 | |
| (1) | Includes both residential and non-residential commercial loans secured by real estate. |
| (2) | Includes loans secured by multi-family residential and non-farm, non-residential property. |
NON-PERFORMING ASSETS(1)
| | December 31, | |
| | 2021 | | | 2020 | | | 2019 | |
| | (Dollars in thousands) | |
| Non-accrual loans | | $ | 5,545 | | | $ | 8,312 | | | $ | 10,178 | |
| Loans 90 days or more past due and still accruing interest | | | — | | | | — | | | | — | |
| Sub total | | | 5,545 | | | | 8,312 | | | | 10,178 | |
| Less: Government guaranteed loans | | | 435 | | | | 439 | | | | 646 | |
| Total non-performing loans | | | 5,110 | | | | 7,873 | | | | 9,532 | |
| Other real estate and repossessed assets | | | 245 | | | | 766 | | | | 1,865 | |
| Total non-performing assets | | $ | 5,355 | | | $ | 8,639 | | | $ | 11,397 | |
| | | | | | | | | | | | | |
| As a percent of Portfolio Loans | | | | | | | | | | | | |
| Non-accrual loans | | | 0.19 | % | | | 0.30 | % | | | 0.37 | % |
| Non-performing loans | | | 0.18 | | | | 0.29 | | | | 0.35 | |
ACL(2) | | | 1.63 | | | | 1.30 | | | | 0.96 | |
| Non-performing assets to total assets | | | 0.11 | | | | 0.21 | | | | 0.32 | |
ACL as a percent of non-accrual loans(2) | | | 852.16 | | | | 426.24 | | | | 256.91 | |
ACL as a percent of non-performing loans(2) | | | 924.70 | | | | 450.01 | | | | 274.32 | |
| (1) | Excludes loans classified as “troubled debt restructured” that are performing. |
| (2) | Beginning January 1, 2021, calculation is based on CECL methodology. Prior to January 1, 2021, calculation was based on the probable incurred loss methodology. |
TROUBLED DEBT RESTRUCTURINGS
| | December 31, 2021 | |
| | Commercial | | | Retail(1) | | | Total | |
| | (In thousands) | |
| Performing TDRs | | $ | 4,481 | | | $ | 31,589 | | | $ | 36,070 | |
Non-performing TDRs(2) | | | — | | | | 1,016 | (3) | | | 1,016 | |
| Total | | $ | 4,481 | | | $ | 32,605 | | | $ | 37,086 | |
| | | | |
| | December 31, 2020 | |
| | | Commercial | | | Retail(1) | | | Total | |
| | | (In thousands) | |
| Performing TDRs | | $ | 7,956 | | | $ | 36,385 | | | $ | 44,341 | |
Non-performing TDRs(2) | | | 1,148 | | | | 1,584 | (3) | | | 2,732 | |
| Total | | $ | 9,104 | | | $ | 37,969 | | | $ | 47,073 | |
| (1) | Retail loans include mortgage and installment loan portfolio segments. |
| (2) | Included in non-performing loans table above. |
| (3) | Also includes loans on non-accrual at the time of modification until six payments are received on a timely basis. |
Non-performing loans totaled $5.1 million, $7.9 million and $9.5 million at December 31, 2021, 2020 and 2019, respectively. The decrease in 2021 compared to 2020 was primarily due to a $1.4 million decrease in the residential mortgage loan portfolio segment and a $1.4 million decrease in the commercial loan segment which were primarily attributed to loan payoffs and pay downs. Our collection and resolution efforts have generally resulted in a stable trend in non-performing loans. The decrease in non-performing loans in 2020 as compared to 2019 was primarily due to a $1.5 million decrease in the residential mortgage loan portfolio segment.
Non-performing loans exclude performing loans that are classified as troubled debt restructurings (“TDRs”). Performing TDRs totaled $36.1 million, or 1.2% of total Portfolio Loans, and $44.3 million, or 1.6% of total Portfolio
Loans, at December 31, 2021 and 2020, respectively. The decrease in the amount of performing TDRs during 2021 reflects declines in both commercial and mortgage loan TDRs due primarily to payoffs and paydowns.
Other real estate (“ORE”) and repossessed assets totaled $0.2 million at December 31, 2021, compared to $0.8 million at December 31, 2020. The decrease in ORE during 2021 reflects the sale of retail properties.
The ACL as a percent of non-accrual and non-performing loans increased during 2021 due primarily to an increase in the ACL resulting from the adoption of CECL on January 1, 2021 while the increase in 2020 was due primarily to an increase in the balance of the subjective factor component of our ACL (see further discussion below).
We will place a loan that is 90 days or more past due on non-accrual, unless we believe the loan is both well secured and in the process of collection. Accordingly, we have determined that the collection of the accrued and unpaid interest on any loans that are 90 days or more past due and still accruing interest is probable.
ALLOCATION OF THE ALLOWANCE FOR CREDIT LOSSES(1)
| | December 31, 2021 | | | January 1, 2021 | |
| | (In thousands) | |
| Specific allocations | | $ | 1,130 | | | $ | 2,452 | |
| Pooled analysis allocations | | | 33,359 | | | | 30,796 | |
| Additional allocations based on subjective factors | | | 12,763 | | | | 13,889 | |
| Total | | $ | 47,252 | | | $ | 47,137 | |
| (1) | January 1, 2021 includes impact of the adoption of CECL. |
Beginning January 1, 2021, we calculated the ACL using the current expected credit losses methodology. As of January 1, 2021, we increased the ACL for loans by $11.7 million and increased the ACL for unfunded loan commitments by $1.5 million.
Some loans will not be repaid in full. Therefore, an ACL is maintained at a level which represents our best estimate of expected credit losses. Our ACL is comprised of three principal elements: (i) specific analysis of individual loans identified during the review of the loan portfolio, (ii) pooled analysis of loans with similar risk characteristics based on historical experience, adjusted for current conditions, reasonable and supportable forecasts, and expected prepayments, and (iii) additional allowances based on subjective factors, including local and general economic business factors and trends, portfolio concentrations and changes in the size and/or the general terms of the loan portfolios. See notes #1 and #4 to the Consolidated Financial Statements included within this report for further discussion on the ACL.
While we use relevant information to recognize losses on loans, additional provisions for related losses may be necessary based on changes in economic conditions, customer circumstances and other credit risk factors.
The ACL increased $0.1 million to $47.3 million at December 31, 2021 from $47.1 million at January 1, 2021 (CECL adoption date) and was equal to 1.63% of total Portfolio Loans at December 31, 2021.
Two of the three components of the ACL outlined above decreased since our CECL adoption date. The ACL related to specific loans decreased $1.3 million due primarily to a $6.7 million decrease in the amount of such loans. The ACL related to subjective factors decreased $1.1 million due primarily to slightly lower reserve allocations reflecting an improvement in economic forecasts (particularly for lower unemployment levels) that was partially offset by loan growth in 2021. The ACL related to pooled analysis of loans increased $2.6 million due primarily loan growth in 2021.
During 2020 the ACL related to specific loans decreased $0.6 million as compared to 2019 due primarily to a $5.3 million decline in the amount such loans. The ACL related to other adversely rated commercial loans (used prior to the adoption of CECL) decreased $0.8 million in 2020 as compared to 2019, primarily due to a decrease in the balance of such loans included in this component to $37.6 million from $54.4 million at December 31, 2019. The ACL related to historical losses (used prior to the adoption of CECL) decreased $0.6 million in 2020 as compared to 2019 primarily due to a decrease in the balance of such loans included in this component. The ACL related to subjective factors increased $11.2 million in 2020 as compared to 2019. The significant increase in the ACL related to subjective factors is due principally to the economic shock of COVID-19 and various executive orders suspending
or restricting certain businesses and operations, the significant increase in unemployment claims, especially in the State of Michigan, and elevated requests for payment relief from our borrowers.
ALLOWANCE FOR CREDIT LOSSES ON LOANS AND UNFUNDED COMMITMENTS
| | 2021 | | | 2020 | | | 2019 | |
| | ACL | | | Unfunded Commitments | | | ACL | | | Unfunded Commitments | | | ACL | | | Unfunded Commitments | |
| | (In thousands) | |
| Balance at beginning of year | | $ | 35,429 | | | $ | 1,805 | | | $ | 26,148 | | | $ | 1,542 | | | $ | 24,888 | | | $ | 1,296 | |
| Additions (deductions) | | | | | | | | | | | | | | | | | | | | | | | | |
| Impact of adoption of CECL | | | 11,574 | | | | 1,469 | | | | — | | | | — | | | | — | | | | — | |
Provision for credit losses(1) | | | (1,928 | ) | | | — | | | | 12,463 | | | | — | | | | 824 | | | | — | |
| Initial allowance on loans purchased with credit deterioration | | | 134 | | | | | | | | | | | | | | | | | | | | | |
| Recoveries credited to the ACL | | | 4,477 | | | | — | | | | 3,069 | | | | — | | | | 3,961 | | | | — | |
| Loans charged against the ACL | | | (2,434 | ) | | | — | | | | (6,251 | ) | | | — | �� | | | (3,525 | ) | | | — | |
| Additions included in non-interest expense | | | — | | | | 1,207 | | | | — | | | | 263 | | | | — | | | | 246 | |
| Balance at end of year | | $ | 47,252 | | | $ | 4,481 | | | $ | 35,429 | | | $ | 1,805 | | | $ | 26,148 | | | $ | 1,542 | |
| (1) | Beginning January 1, 2021, calculation is based on CECL methodology. Prior to January 1, 2021, calculation was based on the probable incurred loss methodology. |
RATIO OF NET CHARGE-OFFS TO AVERAGE LOANS OUTSTANDING
| | Commercial | | | Mortgage | | | Installment | | | Total | |
| | | (Dollars in thousands) | |
| 2021 | | | | | | | | | | | | |
| Loans charged against (recoveries credited to) the ACL | | $ | (2,607 | ) | | $ | (471 | ) | | $ | 1,035 | | | $ | (2,043 | ) |
| Average Portfolio Loans | | | 1,241,961 | | | | 1,056,245 | | | | 521,089 | | | | 2,819,295 | |
| Net loans charged off against (credited to) the ACL to average Portfolio Loans | | | (0.21 | )% | | | (0.04 | )% | | | 0.20 | % | | | (0.07 | )% |
| | | | | | | | | | | | | | | | | |
| 2020 | | | | | | | | | | | | | | | | |
| Loans charged against (recoveries credited to) the ACL | | $ | 2,272 | | | $ | 303 | | | $ | 607 | | | $ | 3,182 | |
| Average Portfolio Loans | | | 1,294,217 | | | | 1,020,507 | | | | 472,210 | | | | 2,786,934 | |
| Net loans charged off against (credited to) the ACL to average Portfolio Loans | | | 0.18 | % | | | 0.03 | % | | | 0.13 | % | | | 0.11 | % |
| | | | | | | | | | | | | | | | | |
| 2019 | | | | | | | | | | | | | | | | |
| Loans charged against (recoveries credited to) the ACL | | $ | (1,483 | ) | | $ | 288 | | | $ | 759 | | | $ | (436 | ) |
| Average Portfolio Loans | | | 1,167,518 | | | | 1,060,643 | | | | 426,730 | | | | 2,654,891 | |
| Net loans charged off against (credited to) the ACL to average Portfolio Loans | | | (0.13 | )% | | | 0.03 | % | | | 0.18 | % | | | (0.02 | )% |
In 2021, we recorded loan net recoveries of $2.0 million compared to loan net charge offs of $3.2 million in 2020 and loan net recoveries of $0.4 million in 2019. The net recoveries in 2021 primarily reflect reduced levels of non-performing loans, improvement in collateral liquidation values and ongoing collection efforts on previously charged-off loans. The increase in net charge-offs in 2020 was attributed to a $4.0 million charge down of one specific commercial loan relationship whose balance was zero at December 31, 2020. The net recoveries in 2019 primarily reflect reduced levels of non-performing loans, improvement in collateral liquidation values and ongoing collection efforts on previously charged-off loans.
Deposits and borrowings. Historically, the loyalty of our customer base has allowed us to price deposits competitively, contributing to a net interest margin that compares favorably to our peers. However, we still face a
significant amount of competition for deposits within many of the markets served by our branch network, which limits our ability to materially increase deposits without adversely impacting the weighted-average cost of core deposits.
To attract new core deposits, we have implemented various account acquisition strategies as well as branch staff sales training. Account acquisition initiatives have historically generated increases in customer relationships. Over the past several years, we have also expanded our treasury management products and services for commercial businesses and municipalities or other governmental units and have also increased our sales calling efforts in order to attract additional deposit relationships from these sectors. We view long-term core deposit growth as an important objective. Core deposits generally provide a more stable and lower cost source of funds than alternative sources such as short-term borrowings. (See “Liquidity and capital resources.”)
Deposits totaled $4.12 billion and $3.64 billion at December 31, 2021 and 2020, respectively. The $479.7 million increase in deposits during 2021 is due to growth in non-interest bearing deposits, savings and interest bearing checking deposits, time deposits and reciprocal deposits. Reciprocal deposits totaled $586.6 million and $556.2 million at December 31, 2021 and 2020, respectively. These deposits represent demand, money market and time deposits from our customers that have been placed through the IntraFi Network (formerly Promontory Interfinancial Network’s Insured Cash Sweep® service and Certificate of Deposit Account Registry Service®). This service allows our customers to access multi-million dollar FDIC deposit insurance on deposit balances greater than the standard FDIC insurance maximum. The increase in reciprocal deposits is due in part to sales efforts of our treasury management team.
We cannot be sure that we will be able to maintain our current level of core deposits. In particular, those deposits that are uninsured may be susceptible to outflow. At December 31, 2021, we had an estimated $1.03 billion of uninsured deposits. A reduction in core deposits would likely increase our need to rely on wholesale funding sources.
We have also implemented strategies that incorporate using federal funds purchased, other borrowings and Brokered CDs to fund a portion of our interest-earning assets. The use of such alternate sources of funds supplements our core deposits and is also a part of our asset/liability management efforts. Other borrowings, comprised primarily of federal funds purchased and advances from the Federal Home Loan Bank (the “FHLB”), totaled $30.0 million at December 31, 2021 and 2020.
As described above, we utilize wholesale funding, including federal funds purchased, FHLB borrowings and Brokered CDs to augment our core deposits and fund a portion of our assets. At December 31, 2021, our use of such wholesale funding sources (including reciprocal deposits) amounted to approximately $619.6 million, or 14.9% of total funding (deposits and total borrowings, excluding subordinated debt and debentures). Because wholesale funding sources are affected by general market conditions, the availability of such funding may be dependent on the confidence these sources have in our financial condition and operations. The continued availability to us of these funding sources is not certain, and Brokered CDs may be difficult for us to retain or replace at attractive rates as they mature. Our liquidity may be constrained if we are unable to renew our wholesale funding sources or if adequate financing is not available in the future at acceptable rates of interest or at all. Our financial performance could also be affected if we are unable to maintain our access to funding sources or if we are required to rely more heavily on more expensive funding sources. In such case, our net interest income and results of operations could be adversely affected.
We have historically employed derivative financial instruments to manage our exposure to changes in interest rates. During 2021, 2020 and 2019, we entered into $79.0 million, $16.7 million and $74.5 million (original aggregate notional amounts), respectively, of interest rate swaps with commercial loan customers, which were offset with interest rate swaps that the Bank entered into with a broker-dealer. We recorded $0.81 million, $0.26 million and $0.94 million of fee income related to these transactions during 2021, 2020 and 2019, respectively. In 2021 we entered into $106.9 million (notional amount) of pay fixed interest rate swaps to hedge the fair value of municipal bond securities. In 2020 we entered into $42.0 million (notional amount) of pay fixed interest rate swaps to hedge the fair value of municipal bond securities. In 2019 we entered into a $7.1 million (notional amount) pay fixed interest rate swap to hedge the fair value of a fixed rate commercial loan.
Liquidity and capital resources. Liquidity risk is the risk of being unable to timely meet obligations as they come due at a reasonable funding cost or without incurring unacceptable losses. Our liquidity management involves the measurement and monitoring of a variety of sources and uses of funds. Our Consolidated Statements of Cash Flows categorize these sources and uses into operating, investing and financing activities. We primarily focus our liquidity
management on maintaining adequate levels of liquid assets (primarily funds on deposit with the FRB and certain securities available for sale) as well as developing access to a variety of borrowing sources to supplement our deposit gathering activities and provide funds for purchasing securities available for sale or originating Portfolio Loans as well as to be able to respond to unforeseen liquidity needs.
Our primary sources of funds include our deposit base, secured advances from the FHLB, federal funds purchased borrowing facilities with other commercial banks, and access to the capital markets (for Brokered CDs).
TIME DEPOSITS(1)
The following table summarizes time deposits in amounts less than $250,000 and in amounts of $250,000 or more, by time remaining until maturity at December 31, 2021:
| | Less than $250,000 | | | Greater than $250,000 | | | Total | |
| | | (In thousands) | |
| Three months or less | | $ | 74,671 | | | $ | 18,870 | | | $ | 93,541 | |
| Over three through six months | | | 53,328 | | | | 13,582 | | | | 66,910 | |
| Over six months through one year | | | 57,565 | | | | 51,051 | | | | 108,616 | |
| Over one year | | | 57,155 | | | | 9,570 | | | | 66,725 | |
| Total | | $ | 242,719 | | | $ | 93,073 | | | $ | 335,792 | |
| (1) | Includes time deposits, brokered time deposits and reciprocal time deposits |
At December 31, 2021, we had $269.1 million of time deposits (see note #8 to the Consolidated Financial Statements) that mature in the next 12 months. Historically, a majority of these maturing time deposits are renewed by our customers. Additionally, $3.81 billion of our deposits at December 31, 2021, were in account types from which the customer could withdraw the funds on demand. Changes in the balances of deposits that can be withdrawn upon demand are usually predictable and the total balances of these accounts have generally grown or have been stable over time as a result of our marketing and promotional activities. However, there can be no assurance that historical patterns of renewing time deposits or overall growth or stability in deposits will continue in the future.
We have developed contingency funding plans that stress test our liquidity needs that may arise from certain events such as an adverse change in our financial metrics (for example, credit quality or regulatory capital ratios). Our liquidity management also includes periodic monitoring that measures quick assets (defined generally as highly liquid or short-term assets) to total assets, short-term liability dependence and basic surplus (defined as quick assets less volatile liabilities to total assets). Policy limits have been established for our various liquidity measurements and are monitored on a quarterly basis. In addition, we also prepare cash flow forecasts that include a variety of different scenarios.
We believe that we currently have adequate liquidity at our Bank because of our cash and cash equivalents, our portfolio of securities available for sale, our access to secured advances from the FHLB, and our ability to issue Brokered CDs.
We also believe that the available cash on hand at the parent company (including time deposits) of approximately $46.1 million as of December 31, 2021, provides sufficient liquidity resources at the parent company to meet operating expenses, to make interest payments on our subordinated debt and debentures and to pay a cash dividend on our common stock for the foreseeable future.
In the normal course of business we enter into certain contractual obligations. Such obligations include requirements to make future payments on debt and lease arrangements, contractual commitments for capital expenditures, and service contracts.
Effective management of capital resources is critical to our mission to create value for our shareholders. In addition to common stock, our capital structure also currently includes subordinated debt and cumulative trust preferred securities.
CAPITALIZATION
| | December 31, | |
| | 2021 | | | 2020 | |
| | | (In thousands) | |
| Subordinated debt | | $ | 39,357 | | | $ | 39,281 | |
| Subordinated debentures | | | 39,592 | | | | 39,524 | |
| Amount not qualifying as regulatory capital | | | (581 | ) | | | (505 | ) |
| Amount qualifying as regulatory capital | | | 78,368 | | | | 78,300 | |
| Shareholders’ equity | | | | | | | | |
| Common stock | | | 323,401 | | | | 339,353 | |
| Retained earnings | | | 74,582 | | | | 40,145 | |
| Accumulated other comprehensive income | | | 501 | | | | 10,024 | |
| Total shareholders’ equity | | | 398,484 | | | | 389,522 | |
| Total capitalization | | $ | 476,852 | | | $ | 467,822 | |
In May 2020, we issued $40.0 million of fixed to floating subordinated notes with a ten year maturity and a five year call option. The initial coupon rate is 5.95% fixed for five years and then floats at the Secured Overnight Financing Rate (“SOFR”) plus 5.825%. These notes are presented in the Consolidated Statement of Financial Condition under the caption “Subordinated debt” and the December 31, 2021 and 2020 balances of $39.4 million and $39.3 million, respectively, is net of remaining unamortized deferred issuance costs that are being amortized through the maturity date into interest expense on other borrowings and subordinated debt and debentures in our Consolidated Statement of Operations.
We currently have four special purpose entities with $39.5 million of outstanding cumulative trust preferred securities. These special purpose entities issued common securities and provided cash to our parent company that in turn issued subordinated debentures to these special purpose entities equal to the trust preferred securities and common securities. The subordinated debentures represent the sole asset of the special purpose entities. The common securities and subordinated debentures are included in our Consolidated Statements of Financial Condition.
The FRB has issued rules regarding trust preferred securities as a component of the Tier 1 capital of bank holding companies. The aggregate amount of trust preferred securities (and certain other capital elements) is limited to 25% of Tier 1 capital elements, net of goodwill (net of any associated deferred tax liability). The amount of trust preferred securities and certain other elements in excess of the limit can be included in Tier 2 capital, subject to restrictions. Although the Dodd-Frank Act further limited Tier 1 treatment for trust preferred securities, those new limits did not apply to our outstanding trust preferred securities. Further, the capital rules allow for the treatment of our trust preferred securities as qualifying regulatory capital.
Common shareholders’ equity increased to $398.5 million at December 31, 2021 from $389.5 million at December 31, 2020, due primarily to our net income which was partially offset by the change in our accumulated other comprehensive income , share repurchases and dividends that we paid. Our tangible common equity (“TCE”) totaled $366.8 million and $356.9 million, respectively, at those same dates. Our ratio of TCE to tangible assets was 7.85% and 8.56% at December 31, 2021 and 2020, respectively. TCE and the ratio of TCE to tangible assets are non-GAAP measures. TCE represents total common equity less intangible assets.
In December 2021, our Board of Directors authorized the 2022 share repurchase plan. Under the terms of the 2022 share repurchase plan, we are authorized to buy back up to 1,100,000 shares, or approximately 5%, of our outstanding common stock. This repurchase plan commenced on January 1, 2022, and is expected to last through December 31, 2022.
In December 2020, our Board of Directors authorized the 2021 share repurchase plan. Under the original terms of the share repurchase plan, we were authorized to buy back 1,100,000 shares, or approximately 5% of our outstanding common stock. The share repurchase plan expired on December 31, 2021. We repurchased 814,910 shares during 2021 at an average cost of $21.19 per share.
In December 2019, our Board of Directors authorized a 2020 share repurchase plan. Under the terms of the 2020 share repurchase plan, we were authorized to buy back 1,120,000 shares, or approximately 5%, of our outstanding
common stock. During the first three months of 2020, we repurchased 678,929 shares at a weighted average purchase price of $20.30 per share. Due primarily to the economic uncertainty brought on by the COVID-19 pandemic, we suspended share repurchase activity on March 16, 2020. However, primarily as a result our strong financial performance and improved economic conditions, we reactivated the share repurchase plan in the fourth quarter of 2020 and acquired 30,027 shares at a weighted average price of $14.90. We repurchased a total of 708,956 shares at a weighted average price of $20.07 in 2020.
We currently pay a quarterly cash dividend on our common stock. The annual total dividends paid were $0.84, $0.80 and $0.72 per share for 2021, 2020 and 2019, respectively. We currently favor a dividend payout ratio between 30% and 50% of net income.
As of December 31, 2021 and 2020, our Bank (and holding company) continued to meet the requirements to be considered “well-capitalized” under federal regulatory standards (also see note #20 to the Consolidated Financial Statements).
Asset/liability management. Interest-rate risk is created by differences in the cash flow characteristics of our assets and liabilities. Options embedded in certain financial instruments, including caps on adjustable-rate loans as well as borrowers’ rights to prepay fixed-rate loans, also create interest-rate risk.
Our asset/liability management efforts identify and evaluate opportunities to structure our statement of financial condition in a manner that is consistent with our mission to maintain profitable financial leverage within established risk parameters. We evaluate various opportunities and alternate asset/liability management strategies carefully and consider the likely impact on our risk profile as well as the anticipated contribution to earnings. The marginal cost of funds is a principal consideration in the implementation of our asset/liability management strategies, but such evaluations further consider interest-rate and liquidity risk as well as other pertinent factors. We have established parameters for interest-rate risk. We regularly monitor our interest-rate risk and report at least quarterly to our board of directors.
We employ simulation analyses to monitor our interest-rate risk profile and evaluate potential changes in our net interest income and market value of portfolio equity that result from changes in interest rates. The purpose of these simulations is to identify sources of interest-rate risk inherent in our Consolidated Statements of Financial Condition. The simulations do not anticipate any actions that we might initiate in response to changes in interest rates and, accordingly, the simulations do not provide a reliable forecast of anticipated results. The simulations are predicated on immediate, permanent and parallel shifts in interest rates and generally assume that current loan and deposit pricing relationships remain constant. The simulations further incorporate assumptions relating to changes in customer behavior, including changes in prepayment rates on certain assets and liabilities. During 2021, our interest rate risk profile as measured by our short term earnings simulation has not changed significantly while our longer term interest rate risk measure based on changes in economic value now indicates modest exposure to rising rates. The shift is primarily due to an increase in asset duration. The increase in asset duration is attributed to growth and mix changes in the investment portfolio and portfolio mortgage loans. However, we are carefully monitoring this change in the composition of our earning assets and the impact of potential future changes in interest rates on our changes in market value of portfolio equity and changes in net interest income. As a result, we may add some longer-term borrowings, may utilize derivatives (interest rate swaps and interest rate caps) to manage interest rate risk and may continue to sell some fixed rate jumbo and other portfolio mortgage loans in the future.
CHANGES IN MARKET VALUE OF PORTFOLIO EQUITY AND NET INTEREST INCOME
| Change in Interest Rates | | Market Value of Portfolio Equity(1) | | | Percent Change | | | Net Interest Income(2) | | | Percent Change | |
| | (Dollars in thousands) | |
| December 31, 2021 | | | | | | | | | | | | |
| 200 basis point rise | | $ | 514,200 | | | | (5.86 | )% | | $ | 137,800 | | | | 3.30 | % |
| 100 basis point rise | | | 550,900 | | | | 0.86 | | | | 136,800 | | | | 2.55 | |
| Base-rate scenario | | | 546,200 | | | | — | | | | 133,400 | | | | — | |
| 100 basis point decline | | | 473,000 | | | | (13.40 | ) | | | 126,700 | | | | (5.02 | ) |
| Change in Interest Rates | | Market Value of Portfolio Equity(1) | | | Percent Change | | | Net Interest Income(2) | | | Percent Change | |
| | (Dollars in thousands) | |
| December 31, 2020 | | | | | | | | | | | | |
| 200 basis point rise | | $ | 494,600 | | | | 15.02 | % | | $ | 125,200 | | | | 4.16 | % |
| 100 basis point rise | | | 483,200 | | | | 12.37 | | | | 123,700 | | | | 2.91 | |
| Base-rate scenario | | | 430,000 | | | | — | | | | 120,200 | | | | — | |
| 100 basis point decline | | | 395,500 | | | | (8.02 | ) | | | 114,900 | | | | (4.41 | ) |
| (1) | Simulation analyses calculate the change in the net present value of our assets and liabilities, including debt and related financial derivative instruments, under parallel shifts in interest rates by discounting the estimated future cash flows using a market-based discount rate. Cash flow estimates incorporate anticipated changes in prepayment speeds and other embedded options. |
| (2) | Simulation analyses calculate the change in net interest income under immediate parallel shifts in interest rates over the next twelve months, based upon a static Consolidated Statement of Financial Condition, which includes debt and related financial derivative instruments, and do not consider loan fees. |
Accounting Standards Update. See note #1 to the Consolidated Financial Statements included elsewhere in this report for details on recently issued accounting pronouncements and their impact on our consolidated financial statements.
FAIR VALUATION OF FINANCIAL INSTRUMENTS
Financial Accounting Standards Board (“FASB”) Accounting Standards Codification (“ASC”) topic 820 - “Fair Value Measurements and Disclosures” (“FASB ASC topic 820”) defines fair value as the exchange price that would be received for an asset or paid to transfer a liability (an exit price) in the principal or most advantageous market for the asset or liability in an orderly transaction between market participants on the measurement date.
We utilize fair value measurements to record fair value adjustments to certain financial instruments and to determine fair value disclosures. FASB ASC topic 820 differentiates between those assets and liabilities required to be carried at fair value at every reporting period (“recurring”) and those assets and liabilities that are only required to be adjusted to fair value under certain circumstances (“nonrecurring”). Securities available for sale, loans held for sale, derivatives and capitalized mortgage loan servicing rights are financial instruments recorded at fair value on a recurring basis. Additionally, from time to time, we may be required to record at fair value other financial assets on a nonrecurring basis, such as loans held for investment and certain other assets. These nonrecurring fair value adjustments typically involve application of lower of cost or fair value accounting or write-downs of individual assets. See note #21 to the Consolidated Financial Statements for a complete discussion on our use of fair valuation of financial instruments and the related measurement techniques.
LITIGATION MATTERS
We are involved in various litigation matters in the ordinary course of business. At the present time, we do not believe any of these matters will have a significant impact on our consolidated financial position or results of operations. The aggregate amount we have accrued for losses we consider probable as a result of these litigation matters is immaterial. However, because of the inherent uncertainty of outcomes from any litigation matter, we believe it is reasonably possible we may incur losses in addition to the amounts we have accrued. At this time, we estimate the maximum amount of additional losses that are reasonably possible is insignificant. However, because of a number of factors, including the fact that certain of these litigation matters are still in their early stages, this maximum amount may change in the future.
The litigation matters described in the preceding paragraph primarily include claims that have been brought against us for damages, but do not include litigation matters where we seek to collect amounts owed to us by third parties (such as litigation initiated to collect delinquent loans). These excluded, collection-related matters may involve claims or counterclaims by the opposing party or parties, however we have excluded such matters from the disclosure contained in the preceding paragraph in all cases where we believe the possibility of us paying damages to any opposing party is remote.
CRITICAL ACCOUNTING POLICIES
Our accounting and reporting policies are in accordance with accounting principles generally accepted in the United States of America and conform to general practices within the banking industry. Accounting and reporting policies for the ACL and capitalized mortgage loan servicing rights are deemed critical since they involve the use of estimates and require significant management judgments. Application of assumptions different than those that we have used could result in material changes in our financial position or results of operations.
Our methodology for determining the ACL and related provision for credit losses is described above in “Portfolio Loans and asset quality.” In particular, this area of accounting requires a significant amount of judgment because a multitude of factors can influence the ultimate collection of a loan or other type of credit. It is extremely difficult to precisely measure the amount of expected credit losses in our loan portfolio. We use a rigorous process to attempt to accurately quantify the necessary ACL and related provision for credit losses, but there can be no assurance that our modeling process will successfully identify all of the expected credit losses in our loan portfolio. As a result, we could record future provisions for credit losses that may be significantly different than the levels that we recorded in prior periods. We adopted CECL on January 1, 2021 which changed the way we calculate our ACL. See also notes #1 and #4 to the Consolidated Financial Statements included within this report for further discussion on CECL.
At December 31, 2021 and 2020, we had approximately $26.2 million and $16.9 million, respectively, of mortgage loan servicing rights capitalized on our Consolidated Statements of Financial Condition. There are several critical assumptions involved in establishing the value of this asset including estimated future prepayment speeds on the underlying mortgage loans, the interest rate used to discount the net cash flows from the mortgage loan servicing, the estimated amount of ancillary income that will be received in the future (such as late fees) and the estimated cost to service the mortgage loans. We believe the assumptions that we utilize in our valuation are reasonable based upon accepted industry practices for valuing mortgage loan servicing rights and represent neither the most conservative or aggressive assumptions.