UNITED STATES
SECURITIES AND EXCHANGE COMMISSION
Washington, D.C. 20549
FORM N-CSR
Certified Shareholder Report of
Registered Management Investment Companies
Investment Company Act File Number: 811-00032
American Funds Fundamental Investors
(Exact Name of Registrant as Specified in Charter)
One Market, Steuart Tower
Suite 2000
San Francisco, California 94105
(Address of Principal Executive Offices)
Registrant's telephone number, including area code: (415) 421-9360
Date of fiscal year end: December 31
Date of reporting period: June 30, 2014
Patrick F. Quan
American Funds Fundamental Investors
One Market, Steuart Tower
Suite 2000
San Francisco, California 94105
(Name and Address of Agent for Service)
Copies to:
Mark D. Perlow
K&L Gates LLP
Four Embarcadero Center, Suite 1200
San Francisco, California 94111
(Counsel for the Registrant)
ITEM 1 – Reports to Stockholders

 | Fundamental Investors® Semi-annual report
for the six months ended
June 30, 2014 |
Fundamental Investors seeks long-term growth of capital and income.
This fund is one of more than 40 offered by one of the nation’s largest mutual fund families, American Funds, from Capital Group. For more than 80 years, Capital has invested with a long-term focus based on thorough research and attention to risk.
Fund results shown in this report, unless otherwise indicated, are for Class A shares at net asset value. If a sales charge (maximum 5.75%) had been deducted, the results would have been lower. Results are for past periods and are not predictive of results for future periods. Current and future results may be lower or higher than those shown. Share prices and returns will vary, so investors may lose money. Investing for short periods makes losses more likely. Investments are not FDIC-insured, nor are they deposits of or guaranteed by a bank or any other entity, so they may lose value. For current information and month-end results, visit americanfunds.com.
Here are the average annual total returns on a $1,000 investment with all distributions reinvested for periods ended June 30, 2014:
| Class A shares | | 1 year | | 5 years | | 10 years |
| | | | | | | |
| Reflecting 5.75% maximum sales charge | | 16.01% | | 15.88% | | 8.71% |
For other share class results, visit americanfunds.com and americanfundsretirement.com.
The total annual fund operating expense ratio was 0.63% for Class A shares as of the prospectus dated March 1, 2014.
Investment results assume all distributions are reinvested and reflect applicable fees and expenses. When applicable, investment results reflect fee waivers, without which results would have been lower. Visit americanfunds.com for more information.
Investing outside the United States may be subject to risks, such as currency fluctuations, periods of illiquidity and price volatility. These risks may be heightened in connection with investments in developing countries. Refer to the fund prospectus and the Risk Factors section of this report for more information on these and other risks associated with investing in the fund.

Fellow investors:
For the six months ended June 30, 2014, Fundamental Investors gained 5.34%. This return includes capital gains and quarterly dividends totaling 76.5 cents a share paid during the period.
The fund’s results trailed those of its primary benchmark, the unmanaged Standard & Poor’s 500 Composite Index, which rose 7.12%. Fundamental Investors also lagged its growth-and-income fund peers, as measured by the Lipper Growth and Income Funds Index, which advanced 5.96%.
Although the fund trailed both benchmarks in the short term, its record relative to theirs is strong over longer time frames. As shown in the table below, the fund’s results have surpassed those of its Lipper peers for all but the six-month period. It has also meaningfully outpaced the S&P 500 for the 10-year and lifetime periods — important considerations for those with long-term investing goals.
Results at a glance
For periods ended June 30, 2014, with all distributions reinvested
| | | Cumulative total returns | | Average annual total returns |
| | | | | | | | | | | Lifetime |
| | | 6 months | | 1 year | | 5 years | | 10 years | | (since 8/1/78) |
| Fundamental Investors (Class A shares) | | | 5.34 | % | | | 23.09 | % | | | 17.26 | % | | | 9.36 | % | | | 12.69 | % |
| Standard & Poor’s 500 Composite Index* | | | 7.12 | | | | 24.58 | | | | 18.82 | | | | 7.78 | | | | 11.77 | |
| Lipper Growth and Income Funds Index | | | 5.96 | | | | 20.78 | | | | 16.35 | | | | 6.95 | | | | 10.91 | |
| MSCI World Index* | | | 6.18 | | | | 24.05 | | | | 14.99 | | | | 7.25 | | | | 9.90 | |
* The market indexes are unmanaged and, therefore, have no expenses. Investors cannot invest directly in an index.
Steady as she goes
On the heels of 2013’s strong stock market returns, the gains experienced during the beginning of 2014 were modest, as investors worried about a potential pullback in economic activity in the U.S., China and Japan. Uncertainty over the pace of the Federal Reserve’s shift in monetary policy also weighed on markets. The outlook improved in the second quarter as the U.S. economy showed signs of rebounding from a harsh winter. In the end, each of the 10 sectors that make up the index finished in the black for the period, with most accruing solid gains.
Fundamental Investors can invest up to 35% of its assets in companies based outside the U.S. That number stood at approximately 15% at June 30, as fund managers have continued to find more attractive opportunities among American firms. That said, as a group, non-U.S. holdings fared well as slow but steady growth returned to Europe — home to the majority of our overseas holdings —where strong corporate profits and increased mergers and acquisitions activity also buoyed markets.
A mix of returns at the top
Returns among the fund’s 10 largest holdings varied: Five of them sharply outpaced the broader market, two rose modestly and three finished in negative territory.
Microsoft, the fund’s largest holding, climbed 11.41% on an uptick in its enterprise business, optimism around the new management team’s ability to reverse money-losing strategies and the advantage it appears to have over its technology peers in moving many of its offerings to the cloud.
Also supporting results among the top 10 were Union Pacific (18.75%), Apple (15.93%), Wells Fargo (15.77%) and Merck (15.58%). Google (4.23%)* and Comcast (3.30%) notched single-digit gains.
After making strong contributions to the fund during recent periods, Amazon (–18.56%) lost ground over the six months. Part of its price decline stemmed from the fact that many investors turned away from stocks with high price-to-earnings multiples. But beyond the broader trend, investors showed concerns over the company’s low profit margins, slowing retail growth and escalating competition in the IT infrastructure service market — an increasingly important part of its business.
| * | The fund holds two classes of Google shares — Class A shares, which were held for the full period, and Class C shares, which the company began issuing in early April 2014. The return shown is for Class A shares. |
| Fundamental Investors’ 10 largest holdings | (as of June 30, 2014) |
| Company | | Percent of net assets |
| Microsoft | | | 3.27 | % |
| Amazon | | | 3.13 | |
| Comcast | | | 2.67 | |
| Google | | | 2.32 | |
| Boeing | | | 2.02 | |
| Apple | | | 2.02 | |
| Philip Morris International | | | 1.89 | |
| Union Pacific | | | 1.87 | |
| Merck | | | 1.82 | |
| Wells Fargo | | | 1.82 | |
Other top 10 holdings posting negative returns included Boeing (–6.78%) and Philip Morris International (–3.24%), both of which have been positive contributors to fund results in recent years.
Two important sectors
Although no energy company is among the fund’s 20 largest holdings, as of June 30 these investments composed about 10% of the portfolio. Together this broad mix of companies was among the biggest positive contributors to returns during the six months, as oil prices rose on concerns over geopolitical instability in oil- and gas-producing regions such as the Middle East and Ukraine. These headlines were the short-term story; looking beyond them reveals an industry experiencing generally favorable conditions. Though oil prices have risen, they remain within a range that is high enough to encourage exploration and production while also allowing for healthy profit, but not so high as to destroy consumer demand. In addition, many companies have shown a newfound commitment to exercising greater discretion in terms of the projects and initiatives on which they’re willing to spend their cash. Suncor Energy (21.63%), Baker Hughes (34.73%) and Royal Dutch Shell (15.84%) were among the strongest supporters.
The fund’s biotech and pharmaceuticals holdings also fared well during the period. The sector offers a mix of investment opportunities that align well with the fund’s primary objectives. For example, a number of our biotechnology investments are in firms in the early stages of growth. We believe they offer considerable opportunity
for capital appreciation and, potentially, dividends down the road. On the other hand, a number of the larger, more established pharmaceutical companies in which we have stakes feature very attractive current yields, as well as fairly robust drug pipelines that we believe could drive future sales and push stock prices higher. Among biotech firms, Vertex (27.43%) and Gilead (10.33%) were additive; in addition to previously mentioned Merck, pharmaceutical companies AstraZeneca (25.50%) and Johnson & Johnson (14.23%) rose, although Bristol-Myers Squibb (–8.73%) and Pfizer (–3.10%) struggled.
Mindful of our mandate
Despite recent stock market gains, we continue to find investment opportunities across a range of sectors. As we analyze them, we remain mindful of, and committed to, the objectives that we have pursued throughout Fundamental Investors’ lifetime: long-term growth of capital and income. Our commitment to the latter goal was further demonstrated in the half-cent per share quarterly dividend increase that took effect in June. Although it may seem small, it amounts to an additional $25 million in dividend payouts over the coming 12 months and demonstrates our commitment to providing tangible return for investors.
As always, we thank you for your commitment to the fund.
Sincerely,
 |  |
James F. Rothenberg Vice Chairman | Dina N. Perry
President |
August 13, 2014
For current information about the fund, visit americanfunds.com.
The fund’s 30-day yield for Class A shares as of July 31, 2014, calculated in accordance with the U.S. Securities and Exchange Commission (SEC) formula, was 1.23%. The fund’s 12-month distribution rate for Class A shares as of that date was 1.16%. Both reflect the 5.75% maximum sales charge. The SEC yield reflects the rate at which the fund is earning income on its current portfolio of securities while the distribution rate reflects the fund’s past dividends paid to shareholders. Accordingly, the fund’s SEC yield and distribution rate may differ.
| Summary investment portfolio June 30, 2014 | unaudited |
| Industry sector diversification | Percent of net assets |
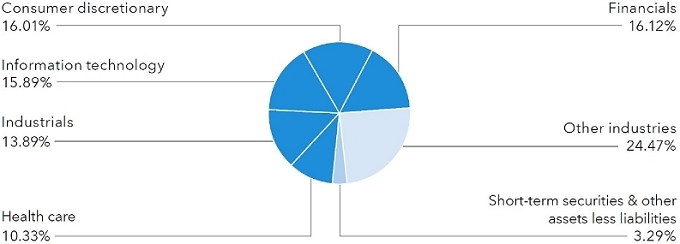
| Country diversification | | Percent of
net assets |
| United States | | | 83.4 | % |
| Euro zone* | | | 4.4 | |
| United Kingdom | | | 3.1 | |
| Canada | | | 2.9 | |
| Japan | | | 1.0 | |
| Other countries | | | 1.9 | |
| Short-term securities & other assets less liabilities | | | 3.3 | |
| * | Countries using the euro as a common currency; those represented in the fund’s portfolio are France, Germany, Ireland, the Netherlands and Spain. |
| Common stocks 96.71% | | Shares | | | Value
(000) | | | Percent of
net assets | |
| Financials 16.12% | | | | | | | | | |
| Wells Fargo & Co. | | | 24,415,916 | | | $ | 1,283,301 | | | | 1.82 | % |
| American Express Co. | | | 9,770,000 | | | | 926,880 | | | | 1.31 | |
| Capital One Financial Corp. | | | 10,162,000 | | | | 839,381 | | | | 1.19 | |
| JPMorgan Chase & Co. | | | 14,180,000 | | | | 817,052 | | | | 1.16 | |
| Berkshire Hathaway Inc., Class A1 | | | 3,330 | | | | 632,369 | | | | .89 | |
| CME Group Inc., Class A | | | 8,007,600 | | | | 568,139 | | | | .80 | |
| ACE Ltd. | | | 4,700,000 | | | | 487,390 | | | | .69 | |
| Weyerhaeuser Co.1 | | | 14,000,107 | | | | 463,263 | | | | .66 | |
| Legal & General Group PLC | | | 119,784,921 | | | | 462,070 | | | | .65 | |
| Other securities | | | | | | | 4,915,366 | | | | 6.95 | |
| | | | | | | | 11,395,211 | | | | 16.12 | |
| | | | | | | | | | | | | |
| Consumer discretionary 16.01% | | | | | | | | | | | | |
| Amazon.com, Inc.1 | | | 6,807,800 | | | | 2,211,037 | | | | 3.13 | |
| Comcast Corp., Class A | | | 35,135,000 | | | | 1,886,047 | | | | 2.67 | |
| Home Depot, Inc. | | | 15,560,000 | | | | 1,259,738 | | | | 1.78 | |
| Walt Disney Co. | | | 10,140,000 | | | | 869,404 | | | | 1.23 | |
| Time Warner Inc. | | | 12,007,293 | | | | 843,512 | | | | 1.19 | |
| Twenty-First Century Fox, Inc., Class A | | | 22,000,000 | | | | 773,300 | | | | 1.09 | |
| Other securities | | | | | | | 3,473,580 | | | | 4.92 | |
| | | | | | | | 11,316,618 | | | | 16.01 | |
| | | | | | | | | | | | | |
| Information technology 15.89% | | | | | | | | | | | | |
| Microsoft Corp. | | | 55,390,000 | | | | 2,309,763 | | | | 3.27 | |
| Google Inc., Class A1 | | | 1,462,800 | | | | 855,255 | | | | | |
| Google Inc., Class C1 | | | 1,362,800 | | | | 783,992 | | | | 2.32 | |
| Apple Inc. | | | 15,330,000 | | | | 1,424,617 | | | | 2.02 | |
| Avago Technologies Ltd. | | | 10,126,993 | | | | 729,852 | | | | 1.03 | |
| Cisco Systems, Inc. | | | 27,230,000 | | | | 676,665 | | | | .96 | |
| ASML Holding NV | | | 4,555,030 | | | | 424,192 | | | | .93 | |
| ASML Holding NV (New York registered) | | | 2,481,000 | | | | 231,403 | | | | | |
| Texas Instruments Inc. | | | 12,280,300 | | | | 586,876 | | | | .83 | |
| Other securities | | | | | | | 3,203,951 | | | | 4.53 | |
| | | | | | | | 11,226,566 | | | | 15.89 | |
| | | | | | | | | | | | | |
| Industrials 13.89% | | | | | | | | | | | | |
| Boeing Co. | | | 11,225,000 | | | | 1,428,157 | | | | 2.02 | |
| Union Pacific Corp. | | | 13,230,000 | | | | 1,319,692 | | | | 1.87 | |
| General Electric Co. | | | 35,050,000 | | | | 921,114 | | | | 1.30 | |
| Caterpillar Inc. | | | 7,025,000 | | | | 763,407 | | | | 1.08 | |
| Airbus Group NV | | | 8,490,000 | | | | 568,945 | | | | .81 | |
| Parker-Hannifin Corp. | | | 4,350,000 | | | | 546,925 | | | | .77 | |
| Lockheed Martin Corp. | | | 3,113,200 | | | | 500,385 | | | | .71 | |
| Rockwell Automation | | | 3,500,000 | | | | 438,060 | | | | .62 | |
| Other securities | | | | | | | 3,326,705 | | | | 4.71 | |
| | | | | | | | 9,813,390 | | | | 13.89 | |
| | | Shares | | | Value
(000) | | | Percent of
net assets | |
| Health care 10.33% | | | | | | | | | |
| Merck & Co., Inc. | | | 22,285,000 | | | $ | 1,289,187 | | | | 1.82 | % |
| Gilead Sciences, Inc.1 | | | 9,643,790 | | | | 799,567 | | | | 1.13 | |
| Vertex Pharmaceuticals Inc.1 | | | 6,215,000 | | | | 588,436 | | | | .83 | |
| Express Scripts Holding Co.1 | | | 8,380,000 | | | | 580,985 | | | | .82 | |
| Bristol-Myers Squibb Co. | | | 10,100,000 | | | | 489,951 | | | | .70 | |
| Other securities | | | | | | | 3,549,802 | | | | 5.03 | |
| | | | | | | | 7,297,928 | | | | 10.33 | |
| | | | | | | | | | | | | |
| Energy 10.16% | | | | | | | | | | | | |
| ConocoPhillips | | | 8,279,100 | | | | 709,767 | | | | 1.00 | |
| Suncor Energy Inc. | | | 15,592,932 | | | | 664,897 | | | | .94 | |
| Enbridge Inc. | | | 11,385,767 | | | | 540,238 | | | | .76 | |
| Noble Energy, Inc. | | | 5,634,400 | | | | 436,441 | | | | .62 | |
| Other securities | | | | | | | 4,832,749 | | | | 6.84 | |
| | | | | | | | 7,184,092 | | | | 10.16 | |
| | | | | | | | | | | | | |
| Consumer staples 5.82% | | | | | | | | | | | | |
| Philip Morris International Inc. | | | 15,820,000 | | | | 1,333,784 | | | | 1.89 | |
| Procter & Gamble Co. | | | 8,160,000 | | | | 641,294 | | | | .91 | |
| PepsiCo, Inc. | | | 5,000,000 | | | | 446,700 | | | | .63 | |
| Other securities | | | | | | | 1,691,263 | | | | 2.39 | |
| | | | | | | | 4,113,041 | | | | 5.82 | |
| | | | | | | | | | | | | |
| Materials 4.32% | | | | | | | | | | | | |
| Potash Corp. of Saskatchewan Inc. | | | 16,688,300 | | | | 633,488 | | | | .90 | |
| LyondellBasell Industries NV, Class A | | | 5,270,000 | | | | 514,615 | | | | .73 | |
| FMC Corp. | | | 6,408,000 | | | | 456,185 | | | | .64 | |
| Other securities | | | | | | | 1,450,825 | | | | 2.05 | |
| | | | | | | | 3,055,113 | | | | 4.32 | |
| | | | | | | | | | | | | |
| Telecommunication services 1.58% | | | | | | | | | | | | |
| Verizon Communications Inc. | | | 9,921,369 | | | | 485,452 | | | | .69 | |
| Other securities | | | | | | | 631,386 | | | | .89 | |
| | | | | | | | 1,116,838 | | | | 1.58 | |
| | | | | | | | | | | | | |
| Utilities 0.52% | | | | | | | | | | | | |
| Other securities | | | | | | | 365,918 | | | | .52 | |
| | | | | | | | | | | | | |
| Miscellaneous 2.07% | | | | | | | | | | | | |
| Other common stocks in initial period of acquisition | | | | | | | 1,459,481 | | | | 2.07 | |
| | | | | | | | | | | | | |
| Total common stocks (cost: $44,289,165,000) | | | | | | | 68,344,196 | | | | 96.71 | |
| Short-term securities 3.43% | | Principal amount
(000) | | | Value
(000) | | | Percent of
net assets | |
| Federal Home Loan Bank 0.04%–0.10% due 7/2/2014–9/3/2014 | | $ | 748,950 | | | $ | 748,928 | | | | 1.06 | % |
| Freddie Mac 0.06%–0.17% due 7/7/2014–6/11/2015 | | | 549,300 | | | | 549,065 | | | | .78 | |
| Coca-Cola Co. 0.11%–0.17% due 7/10/2014–12/1/20142 | | | 156,300 | | | | 156,259 | | | | .22 | |
| General Electric Capital Corp. 0.13%–0.16% due 8/5/2014–8/29/2014 | | | 100,000 | | | | 99,990 | | | | .18 | |
| General Electric Co. 0.06% due 7/1/2014 | | | 29,700 | | | | 29,700 | | | | | |
| Chariot Funding, LLC 0.26% due 1/26/20152 | | | 25,000 | | | | 24,969 | | | | .04 | |
| Microsoft Corp. 0.09% due 8/27/20142 | | | 9,900 | | | | 9,899 | | | | .01 | |
| Other securities | | | | | | | 806,289 | | | | 1.14 | |
| | | | | | | | | | | | | |
| Total short-term securities (cost: $2,424,964,000) | | | | | | | 2,425,099 | | | | 3.43 | |
| | | | | | | | | | | | | |
| Total investment securities (cost: $46,714,129,000) | | | | | | | 70,769,295 | | | | 100.14 | |
| Other assets less liabilities | | | | | | | (100,979 | ) | | | (.14 | ) |
| | | | | | | | | | | | | |
| Net assets | | | | | | $ | 70,668,316 | | | | 100.00 | % |
This summary investment portfolio is designed to streamline the report and help investors better focus on the fund’s principal holdings. See the inside back cover for details on how to obtain a complete schedule of portfolio holdings.
As permitted by U.S. Securities and Exchange Commission regulations, “Miscellaneous” securities include holdings in their first year of acquisition that have not previously been publicly disclosed.
“Other securities” includes all issues that are not disclosed separately in the summary investment portfolio.
Investments in affiliates
A company is an affiliate of the fund under the Investment Company Act of 1940 if the fund’s holdings in that company represent 5% or more of the outstanding voting shares. The value of the fund’s affiliated-company holdings is included in “Other securities” under the respective industry sectors in the summary investment portfolio. Further details on these holdings and related transactions during the six months ended June 30, 2014, appear below.
| | | Beginning
shares | | | Additions | | | Reductions | | | Ending
shares | | | Dividend
income
(000) | | | Value of
affiliates at
6/30/2014
(000) | |
| CNO Financial Group, Inc. | | | 11,900,000 | | | | — | | | | — | | | | 11,900,000 | | | $ | 1,428 | | | $ | 211,820 | |
| Grafton Group PLC, units | | | 15,037,000 | | | | — | | | | — | | | | 15,037,000 | | | | 1,374 | | | | 149,259 | |
| | | | | | | | | | | | | | | | | | | $ | 2,802 | | | $ | 361,079 | |
The following footnotes apply to either the individual securities noted or one or more of the securities aggregated and listed as a single line item.
| 1 | Security did not produce income during the last 12 months. |
| 2 | Acquired in a transaction exempt from registration under section 4(2) of the Securities Act of 1933. May be resold in the U.S. in transactions exempt from registration, normally to qualified institutional buyers. The total value of all such securities, including those in “Other securities,” was $766,067,000, which represented 1.08% of the net assets of the fund. |
See Notes to Financial Statements
Financial statements
| Statement of assets and liabilities | unaudited |
| at June 30, 2014 | (dollars in thousands) |
| Assets: | | | | | | | | |
| Investment securities, at value: | | | | | | | | |
| Unaffiliated issuers (cost: $46,472,041) | | $ | 70,408,216 | | | | | |
| Affiliated issuers (cost: $242,088) | | | 361,079 | | | $ | 70,769,295 | |
| Cash | | | | | | | 36,636 | |
| Receivables for: | | | | | | | | |
| Sales of investments | | | 3,821 | | | | | |
| Sales of fund’s shares | | | 63,660 | | | | | |
| Dividends and interest | | | 93,577 | | | | 161,058 | |
| | | | | | | | 70,966,989 | |
| | | | | | | | | |
| Liabilities: | | | | | | | | |
| Payables for: | | | | | | | | |
| Purchases of investments | | | 147,041 | | | | | |
| Repurchases of fund’s shares | | | 108,467 | | | | | |
| Investment advisory services | | | 14,249 | | | | | |
| Services provided by related parties | | | 24,030 | | | | | |
| Trustees’ deferred compensation | | | 4,321 | | | | | |
| Other | | | 565 | | | | 298,673 | |
| Net assets at June 30, 2014 | | | | | | $ | 70,668,316 | |
| | | | | | | | | |
| Net assets consist of: | | | | | | | | |
| Capital paid in on shares of beneficial interest | | | | | | $ | 43,062,509 | |
| Undistributed net investment income | | | | | | | 620,683 | |
| Undistributed net realized gain | | | | | | | 2,929,647 | |
| Net unrealized appreciation | | | | | | | 24,055,477 | |
| Net assets at June 30, 2014 | | | | | | $ | 70,668,316 | |
(dollars and shares in thousands, except per-share amounts)
Shares of beneficial interest issued and outstanding (no stated par value) —
unlimited shares authorized (1,310,632 total shares outstanding)
| | | | | | Shares | | | Net asset value | |
| | | Net assets | | | outstanding | | | per share | |
| Class A | | $ | 43,390,268 | | | | 804,384 | | | $ | 53.94 | |
| Class B | | | 399,077 | | | | 7,414 | | | | 53.83 | |
| Class C | | | 2,423,473 | | | | 45,108 | | | | 53.73 | |
| Class F-1 | | | 5,328,914 | | | | 98,837 | | | | 53.92 | |
| Class F-2 | | | 3,015,264 | | | | 55,909 | | | | 53.93 | |
| Class 529-A | | | 1,691,911 | | | | 31,398 | | | | 53.89 | |
| Class 529-B | | | 35,392 | | | | 656 | | | | 53.92 | |
| Class 529-C | | | 437,286 | | | | 8,122 | | | | 53.84 | |
| Class 529-E | | | 71,107 | | | | 1,321 | | | | 53.85 | |
| Class 529-F-1 | | | 73,303 | | | | 1,361 | | | | 53.86 | |
| Class R-1 | | | 172,323 | | | | 3,208 | | | | 53.72 | |
| Class R-2 | | | 795,246 | | | | 14,805 | | | | 53.71 | |
| Class R-3 | | | 2,735,089 | | | | 50,811 | | | | 53.83 | |
| Class R-4 | | | 2,838,719 | | | | 52,717 | | | | 53.85 | |
| Class R-5 | | | 1,933,849 | | | | 35,835 | | | | 53.97 | |
| Class R-6 | | | 5,327,095 | | | | 98,746 | | | | 53.95 | |
See Notes to Financial Statements
| Statement of operations | unaudited |
| for the six months ended June 30, 2014 | (dollars in thousands) |
| Investment income: | | | | | | | | |
| Income: | | | | | | | | |
| Dividends (net of non-U.S. taxes of $13,353; also includes $2,802 from affiliates) | | $ | 1,022,006 | | | | | |
| Interest | | | 1,517 | | | $ | 1,023,523 | |
| | | | | | | | | |
| Fees and expenses*: | | | | | | | | |
| Investment advisory services | | | 83,072 | | | | | |
| Distribution services | | | 87,079 | | | | | |
| Transfer agent services | | | 35,224 | | | | | |
| Administrative services | | | 8,425 | | | | | |
| Reports to shareholders | | | 1,473 | | | | | |
| Registration statement and prospectus | | | 622 | | | | | |
| Trustees’ compensation | | | 421 | | | | | |
| Auditing and legal | | | 32 | | | | | |
| Custodian | | | 466 | | | | | |
| Other | | | 1,190 | | | | 218,004 | |
| Net investment income | | | | | | | 805,519 | |
| �� | | | | | | | | |
| Net realized gain and unrealized depreciation on investments and currency: | | | | | | | | |
| Net realized gain (loss) on: | | | | | | | | |
| Investments | | | 2,922,405 | | | | | |
| Currency transactions | | | (869 | ) | | | 2,921,536 | |
| Net unrealized depreciation on: | | | | | | | | |
| Investments | | | (141,581 | ) | | | | |
| Currency translations | | | (793 | ) | | | (142,374 | ) |
| Net realized gain and unrealized depreciation on investments and currency | | | | | | | 2,779,162 | |
| | | | | | | | | |
| Net increase in net assets resulting from operations | | | | | | $ | 3,584,681 | |
* Additional information related to class-specific fees and expenses is included in the Notes to Financial Statements.
See Notes to Financial Statements
| Statements of changes in net assets | |
| | (dollars in thousands) |
| | |
| | | Six months ended
June 30,
2014* | | | Year ended
December 31,
2013 | |
| | | | | | | |
| Operations: | | | | | | | | |
| Net investment income | | $ | 805,519 | | | $ | 782,656 | |
| Net realized gain on investments and currency transactions | | | 2,921,536 | | | | 3,712,613 | |
Net unrealized (depreciation) appreciation on investments
and currency translations | | | (142,374 | ) | | | 11,837,702 | |
| Net increase in net assets resulting from operations | | | 3,584,681 | | | | 16,332,971 | |
| | | | | | | | | |
| Dividends and distributions paid to shareholders: | | | | | | | | |
| Dividends from net investment income | | | (334,894 | ) | | | (807,959 | ) |
| Distributions from net realized gain on investments | | | (651,025 | ) | | | (1,168,741 | ) |
| Total dividends and distributions paid to shareholders | | | (985,919 | ) | | | (1,976,700 | ) |
| | | | | | | | | |
| Net capital share transactions | | | 392,542 | | | | 1,312,946 | |
| | | | | | | | | |
| Total increase in net assets | | | 2,991,304 | | | | 15,669,217 | |
| | | | | | | | | |
| Net assets: | | | | | | | | |
| Beginning of period | | | 67,677,012 | | | | 52,007,795 | |
| End of period (including undistributed net investment income: $620,683 and $150,058, respectively) | | $ | 70,668,316 | | | $ | 67,677,012 | |
* Unaudited.
See Notes to Financial Statements
| Notes to financial statements | unaudited |
1. Organization
American Funds Fundamental Investors (the “trust”) is registered under the Investment Company Act of 1940 as an open-end, diversified management investment company and has initially issued one series of shares, Fundamental Investors (the “fund”). The fund seeks long-term growth of capital and income.
The fund has 16 share classes consisting of five retail share classes (Classes A, B and C, as well as two F share classes, F-1 and F-2), five 529 college savings plan share classes (Classes 529-A, 529-B, 529-C, 529-E and 529-F-1) and six retirement plan share classes (Classes R-1, R-2, R-3, R-4, R-5 and R-6). The 529 college savings plan share classes can be used to save for college education. The retirement plan share classes are generally offered only through eligible employer-sponsored retirement plans. The fund’s share classes are described further in the following table:
| Share class | | Initial sales charge | | Contingent deferred sales
charge upon redemption | | Conversion feature |
| Classes A and 529-A | | Up to 5.75% | | None (except 1% for certain redemptions within one year of purchase without an initial sales charge) | | None |
| Classes B and 529-B* | | None | | Declines from 5% to 0% for redemptions within six years of purchase | | Classes B and 529-B convert to Classes A and 529-A, respectively, after eight years |
| Class C | | None | | 1% for redemptions within one year of purchase | | Class C converts to Class F-1 after 10 years |
| Class 529-C | | None | | 1% for redemptions within one year of purchase | | None |
| Class 529-E | | None | | None | | None |
| Classes F-1, F-2 and 529-F-1 | | None | | None | | None |
| Classes R-1, R-2, R-3, R-4, R-5 and R-6 | | None | | None | | None |
| | |
| * Class B and 529-B shares of the fund are not available for purchase. |
Holders of all share classes have equal pro rata rights to assets, dividends and liquidation proceeds. Each share class has identical voting rights, except for the exclusive right to vote on matters affecting only its class. Share classes have different fees and expenses (“class-specific fees and expenses”), primarily due to different arrangements for distribution, administrative and shareholder services. Differences in class-specific fees and expenses will result in differences in net investment income and, therefore, the payment of different per-share dividends by each share class.
2. Significant accounting policies
The fund is an investment company that applies the accounting and reporting guidance issued in Topic 946 by the U.S. Financial Accounting Standards Board. The fund’s financial statements have been prepared to comply with U.S. generally accepted accounting principles (“U.S. GAAP”). These principles require the fund’s investment adviser to make estimates and assumptions that affect reported amounts and disclosures. Actual results could differ from those estimates. The fund follows the significant accounting policies described in this section, as well as the valuation policies described in the next section on valuation.
Security transactions and related investment income — Security transactions are recorded by the fund as of the date the trades are executed with brokers. Realized gains and losses from security transactions are determined based on the specific identified cost of the securities. In the event a security is purchased with a delayed payment date, the fund will segregate liquid assets sufficient to meet its payment obligations. Dividend income is recognized on the ex-dividend date and interest income is recognized on an accrual basis. Market discounts, premiums and original issue discounts on fixed-income securities are amortized daily over the expected life of the security.
Class allocations — Income, fees and expenses (other than class-specific fees and expenses) and realized and unrealized gains and losses are allocated daily among the various share classes based on their relative net assets. Class-specific fees and expenses, such as distribution, administrative and shareholder services, are charged directly to the respective share class.
Dividends and distributions to shareholders — Dividends and distributions to shareholders are recorded on the ex-dividend date.
Currency translation — Assets and liabilities, including investment securities, denominated in currencies other than U.S. dollars are translated into U.S. dollars at the exchange rates supplied by one or more pricing vendors on the valuation date. Purchases and sales of investment securities and income and expenses are translated into U.S. dollars at the exchange rates on the dates of such transactions. The effects of changes in exchange rates on investment securities are included with the net realized gain or loss and net unrealized appreciation or depreciation on investments in the fund’s statement of operations. The realized gain or loss and unrealized appreciation or depreciation resulting from all other transactions denominated in currencies other than U.S. dollars are disclosed separately.
3. Valuation
Capital Research and Management Company (“CRMC”), the fund’s investment adviser, values the fund’s investments at fair value as defined by U.S. GAAP. The net asset value of each share class of the fund is generally determined as of approximately 4:00 p.m. New York time each day the New York Stock Exchange is open.
Methods and inputs — The fund’s investment adviser uses the following methods and inputs to establish the fair value of the fund’s assets and liabilities. Use of particular methods and inputs may vary over time based on availability and relevance as market and economic conditions evolve.
Equity securities are generally valued at the official closing price of, or the last reported sale price on, the exchange or market on which such securities are traded, as of the close of business on the day the securities are being valued or, lacking any sales, at the last available bid price. Prices for each security are taken from the principal exchange or market on which the security trades.
Fixed-income securities, including short-term securities, are generally valued at prices obtained from one or more pricing vendors. Vendors value such securities based on one or more of the inputs described in the following table. The table provides examples of inputs that are commonly relevant for valuing particular classes of fixed-income securities in which the fund is authorized to invest. However, these classifications are not exclusive, and any of the inputs may be used to value any other class of fixed-income security.
| Fixed-income class | Examples of standard inputs |
| All | Benchmark yields, transactions, bids, offers, quotations from dealers and trading systems, new issues, spreads and other relationships observed in the markets among comparable securities; and proprietary pricing models such as yield measures calculated using factors such as cash flows, financial or collateral performance and other reference data (collectively referred to as “standard inputs”) |
Corporate bonds & notes;
convertible securities | Standard inputs and underlying equity of the issuer |
| Bonds & notes of governments & government agencies | Standard inputs and interest rate volatilities |
| Mortgage-backed; asset-backed obligations | Standard inputs and cash flows, prepayment information, default rates, delinquency and loss assumptions, collateral characteristics, credit enhancements and specific deal information |
When the fund’s investment adviser deems it appropriate to do so (such as when vendor prices are unavailable or not deemed to be representative), fixed-income securities will be valued in good faith at the mean quoted bid and ask prices that are reasonably and timely available (or bid prices, if ask prices are not available) or at prices for securities of comparable maturity, quality and type.
Securities with both fixed-income and equity characteristics, or equity securities traded principally among fixed-income dealers, are generally valued in the manner described for either equity or fixed-income securities, depending on which method is deemed most appropriate by the fund’s investment adviser.
Securities and other assets for which representative market quotations are not readily available or are considered unreliable by the fund’s investment adviser are fair valued as determined in good faith under fair valuation guidelines adopted by authority of the fund’s board of trustees as further described. The investment adviser follows fair valuation guidelines, consistent with U.S. Securities and Exchange Commission rules and guidance, to consider relevant principles and factors when making fair value determinations. The investment adviser considers relevant indications of value that are reasonably and timely available to it in determining the fair value to be assigned to a particular security, such as the type and cost of the security; contractual or legal restrictions on resale of the security; relevant financial or business developments of the issuer; actively traded similar or related securities; conversion or exchange rights on the security; related corporate actions; significant events occurring after the close of trading in the security; and changes in overall market conditions. In addition, the closing prices of equity securities that trade in markets outside U.S. time zones may be adjusted to reflect significant events that occur after the close of local trading but before the net asset value of each share class of the fund is determined. Fair valuations and valuations of investments that are not actively trading involve judgment and may differ materially from valuations that would have been used had greater market activity occurred.
Processes and structure — The fund’s board of trustees has delegated authority to the fund’s investment adviser to make fair value determinations, subject to board oversight. The investment adviser has established a Joint Fair Valuation Committee (the “Fair Valuation Committee”) to administer, implement and oversee the fair valuation process, and to make fair value decisions. The Fair Valuation Committee regularly reviews its own fair value decisions, as well as decisions made under its standing instructions to the investment adviser’s valuation teams. The Fair Valuation Committee reviews changes in fair value measurements from period to period and may, as deemed appropriate, update the fair valuation guidelines to better reflect the results of back testing and address new or evolving issues. The Fair Valuation
Committee reports any changes to the fair valuation guidelines to the board of trustees with supplemental information to support the changes. The fund’s board and audit committee also regularly review reports that describe fair value determinations and methods.
The fund’s investment adviser has also established a Fixed-Income Pricing Review Group to administer and oversee the fixed-income valuation process, including the use of fixed-income pricing vendors. This group regularly reviews pricing vendor information and market data. Pricing decisions, processes and controls over security valuation are also subject to additional internal reviews, including an annual control self-evaluation program facilitated by the investment adviser’s compliance group.
Classifications — The fund’s investment adviser classifies the fund’s assets and liabilities into three levels based on the inputs used to value the assets or liabilities. Level 1 values are based on quoted prices in active markets for identical securities. Level 2 values are based on significant observable market inputs, such as quoted prices for similar securities and quoted prices in inactive markets. Certain securities trading outside the U.S. may transfer between Level 1 and Level 2 due to valuation adjustments resulting from significant market movements following the close of local trading. Level 3 values are based on significant unobservable inputs that reflect the investment adviser’s determination of assumptions that market participants might reasonably use in valuing the securities. The valuation levels are not necessarily an indication of the risk or liquidity associated with the underlying investment. For example, U.S. government securities are reflected as Level 2 because the inputs used to determine fair value may not always be quoted prices in an active market. The following table presents the fund’s valuation levels as of June 30, 2014 (dollars in thousands):
| | | Investment securities | |
| | | Level 1 | | | Level 2 | | | Level 3 | | | Total | |
| Assets: | | | | | | | | | | | | | | | | |
| Common stocks: | | | | | | | | | | | | | | | | |
| Financials | | $ | 11,395,211 | | | $ | — | | | $ | — | | | $ | 11,395,211 | |
| Consumer discretionary | | | 11,316,618 | | | | — | | | | — | | | | 11,316,618 | |
| Information technology | | | 11,226,566 | | | | — | | | | — | | | | 11,226,566 | |
| Industrials | | | 9,813,390 | | | | — | | | | — | | | | 9,813,390 | |
| Health care | | | 7,297,928 | | | | — | | | | — | | | | 7,297,928 | |
| Energy | | | 7,184,092 | | | | — | | | | — | | | | 7,184,092 | |
| Consumer staples | | | 4,113,041 | | | | — | | | | — | | | | 4,113,041 | |
| Materials | | | 3,055,113 | | | | — | | | | — | | | | 3,055,113 | |
| Telecommunication services | | | 1,116,838 | | | | — | | | | — | | | | 1,116,838 | |
| Utilities | | | 365,918 | | | | — | | | | — | | | | 365,918 | |
| Miscellaneous | | | 1,459,481 | | | | — | | | | — | | | | 1,459,481 | |
| Short-term securities | | | — | | | | 2,425,099 | | | | — | | | | 2,425,099 | |
| Total | | $ | 68,344,196 | | | $ | 2,425,099 | | | $ | — | | | $ | 70,769,295 | |
4. Risk factors
Investing in the fund may involve certain risks including, but not limited to, those described below.
Market conditions — The prices of, and the income generated by, the common stocks and other securities held by the fund may decline in response to certain events taking place around the world, including those directly involving the issuers of securities held by the fund; conditions affecting the general economy; overall market changes; local, regional or global political, social or economic instability; governmental or governmental agency responses to economic conditions; and currency, interest rate and commodity price fluctuations.
Investing in growth-oriented stocks — Growth-oriented common stocks and other equity-type securities (such as preferred stocks, convertible preferred stocks and convertible bonds) may involve larger price swings and greater potential for loss than other types of investments.
Investing in income-oriented stocks — Income provided by the fund may be reduced by changes in the dividend policies of, and the capital resources available for dividend payments at, the companies in which the fund invests.
Investing outside the U.S. — Securities of issuers domiciled outside the U.S., or with significant operations outside the U.S., may lose value because of adverse political, social, economic or market developments in the countries or regions in which the issuers operate. These securities may also lose value due to changes in foreign currency exchange rates against the U.S. dollar and/or currencies of other countries. Securities markets in certain countries may be more volatile and/or less liquid than those in the U.S. Investments outside the U.S. may also be subject to different accounting practices and different regulatory, legal and reporting standards, and may be more difficult to value, than those in the U.S. In addition, the value of investments outside the U.S. may be reduced by foreign taxes, including foreign withholding taxes on interest and dividends. Further, there may be increased risks of delayed settlement of securities purchased or sold by the fund. The risks of investing outside the U.S. may be heightened in connection with investments in emerging markets.
Management — The investment adviser to the fund actively manages the fund’s investments. Consequently, the fund is subject to the risk that the methods and analyses employed by the investment adviser in this process may not produce the desired results. This could cause the fund to lose value or its investment results to lag relevant benchmarks or other funds with similar objectives.
5. Taxation and distributions
Federal income taxation — The fund complies with the requirements under Subchapter M of the Internal Revenue Code applicable to mutual funds and intends to distribute substantially all of its net taxable income and net capital gains each year. The fund is not subject to income taxes to the extent such distributions are made. Therefore, no federal income tax provision is required.
As of and during the period ended June 30, 2014, the fund did not have a liability for any unrecognized tax benefits. The fund recognizes interest and penalties, if any, related to unrecognized tax benefits as income tax expense in the statement of operations. During the period, the fund did not incur any interest or penalties.
The fund is not subject to examination by U.S. federal tax authorities for tax years before 2010, by state tax authorities for tax years before 2009 and by tax authorities outside the U.S. for tax years before 2007.
Non-U.S. taxation — Dividend income is recorded net of non-U.S. taxes paid. Gains realized by the fund on the sale of securities in certain countries are subject to non-U.S. taxes. The fund records a liability based on unrealized gains to provide for potential non-U.S. taxes payable upon the sale of these securities.
Distributions — Distributions paid to shareholders are based on net investment income and net realized gains determined on a tax basis, which may differ from net investment income and net realized gains for financial reporting purposes. These differences are due primarily to different treatment for items such as currency gains and losses; short-term capital gains and losses; capital losses related to sales of certain securities within 30 days of purchase; and deferred expenses. The fiscal year in which amounts are distributed may differ from the year in which the net investment income and net realized gains are recorded by the fund for financial reporting purposes.
The components of distributable earnings on a tax basis are reported as of the fund’s most recent year-end. As of December 31, 2013, the fund had tax basis undistributed ordinary income of $184,333,000 and undistributed long-term capital gains of $635,539,000.
As of June 30, 2014, the tax basis unrealized appreciation (depreciation) and cost of investment securities were as follows (dollars in thousands):
| Gross unrealized appreciation on investment securities | | $ | 24,382,830 | |
| Gross unrealized depreciation on investment securities | | | (333,029 | ) |
| Net unrealized appreciation on investment securities | | | 24,049,801 | |
| Cost of investment securities | | | 46,719,494 | |
The tax character of distributions paid to shareholders was as follows (dollars in thousands):
| | | Six months ended June 30, 2014 | | | Year ended December 31, 2013 | |
| Share class | | Ordinary
income | | | Long-term
capital
gains | | | Total
distributions
paid | | | Ordinary
income | | | Long-term
capital
gains | | | Total
distributions
paid | |
| Class A | | $ | 212,962 | | | $ | 401,058 | | | $ | 614,020 | | | $ | 513,793 | | | $ | 720,627 | | | $ | 1,234,420 | |
| Class B | | | 453 | | | | 4,128 | | | | 4,581 | | | | 2,649 | | | | 8,096 | | | | 10,745 | |
| Class C | | | 2,623 | | | | 22,565 | | | | 25,188 | | | | 12,323 | | | | 40,660 | | | | 52,983 | |
| Class F-1 | | | 25,276 | | | | 51,046 | | | | 76,322 | | | | 63,656 | | | | 91,663 | | | | 155,319 | |
| Class F-2 | | | 16,843 | | | | 24,809 | | | | 41,652 | | | | 31,514 | | | | 42,802 | | | | 74,316 | |
| Class 529-A | | | 7,508 | | | | 15,432 | | | | 22,940 | | | | 18,052 | | | | 27,333 | | | | 45,385 | |
| Class 529-B | | | 16 | | | | 356 | | | | 372 | | | | 178 | | | | 703 | | | | 881 | |
| Class 529-C | | | 318 | | | | 4,028 | | | | 4,346 | | | | 1,902 | | | | 7,181 | | | | 9,083 | |
| Class 529-E | | | 234 | | | | 647 | | | | 881 | | | | 623 | | | | 1,153 | | | | 1,776 | |
| Class 529-F-1 | | | 395 | | | | 651 | | | | 1,046 | | | | 877 | | | | 1,146 | | | | 2,023 | |
| Class R-1 | | | 197 | | | | 1,634 | | | | 1,831 | | | | 939 | | | | 2,988 | | | | 3,927 | |
| Class R-2 | | | 975 | | | | 7,428 | | | | 8,403 | | | | 4,611 | | | | 13,460 | | | | 18,071 | |
| Class R-3 | | | 9,014 | | | | 26,063 | | | | 35,077 | | | | 27,448 | | | | 48,796 | | | | 76,244 | |
| Class R-4 | | | 13,596 | | | | 27,241 | | | | 40,837 | | | | 35,636 | | | | 50,408 | | | | 86,044 | |
| Class R-5 | | | 12,260 | | | | 19,133 | | | | 31,393 | | | | 28,959 | | | | 34,053 | | | | 63,012 | |
| Class R-6 | | | 32,224 | | | | 44,806 | | | | 77,030 | | | | 64,799 | | | | 77,672 | | | | 142,471 | |
| Total | | $ | 334,894 | | | $ | 651,025 | | | $ | 985,919 | | | $ | 807,959 | | | $ | 1,168,741 | | | $ | 1,976,700 | |
6. Fees and transactions with related parties
CRMC, the fund’s investment adviser, is the parent company of American Funds Distributors,® Inc. (“AFD”), the principal underwriter of the fund’s shares, and American Funds Service Company® (“AFS”), the fund’s transfer agent. CRMC, AFD and AFS are considered related parties to the fund.
Investment advisory services — The fund has an investment advisory and service agreement with CRMC that provides for monthly fees accrued daily. These fees are based on a series of decreasing annual rates beginning with 0.390% on the first $1 billion of daily net assets and decreasing to 0.232% on such assets in excess of $55 billion. For the six months ended June 30, 2014, the investment advisory services fee was $83,072,000, which was equivalent to an annualized rate of 0.247% of average daily net assets.
Class-specific fees and expenses — Expenses that are specific to individual share classes are accrued directly to the respective share class. The principal class-specific fees and expenses are further described below:
Distribution services — The fund has plans of distribution for all share classes, except Class F-2, R-5 and R-6 shares. Under the plans, the board of trustees approves certain categories of expenses that are used to finance activities primarily intended to sell fund shares and service existing accounts. The plans provide for payments, based on an annualized percentage of average daily net assets, ranging from 0.25% to 1.00% as noted in this section. In some cases, the board of trustees has limited the amounts that may be paid to less than the maximum allowed by the plans. All share classes with a plan may use up to 0.25% of average daily net assets to pay service fees, or to compensate AFD for paying service fees, to firms that have entered into agreements with AFD to provide certain shareholder services. The remaining amounts available to be paid under each plan are paid to dealers to compensate them for their sales activities.
For Class A and 529-A shares, distribution-related expenses include the reimbursement of dealer and wholesaler commissions paid by AFD for certain shares sold without a sales charge. These share classes reimburse AFD for amounts billed within the prior 15 months but only to the extent that the overall annual expense limit of 0.25% is not exceeded. As of June 30, 2014, there were no unreimbursed expenses subject to reimbursement for Class A or 529-A shares.
| Share class | | Currently approved limits | | Plan limits |
| Class A | | | 0.25 | % | | | 0.25 | % |
| Class 529-A | | | 0.25 | | | | 0.50 | |
| Classes B and 529-B | | | 1.00 | | | | 1.00 | |
| Classes C, 529-C and R-1 | | | 1.00 | | | | 1.00 | |
| Class R-2 | | | 0.75 | | | | 1.00 | |
| Classes 529-E and R-3 | | | 0.50 | | | | 0.75 | |
| Classes F-1, 529-F-1 and R-4 | | | 0.25 | | | | 0.50 | |
Transfer agent services — The fund has a shareholder services agreement with AFS under which the fund compensates AFS for providing transfer agent services to each of the fund’s share classes. These services include recordkeeping, shareholder communications and transaction processing. In addition, the fund reimburses AFS for amounts paid to third parties for performing transfer agent services on behalf of fund shareholders.
Administrative services — The fund has an administrative services agreement with CRMC under which the fund compensates CRMC for providing administrative services to Class A, C, F, 529 and R shares. These services include, but are not limited to, coordinating, monitoring, assisting and overseeing third parties that provide services to fund shareholders. Under the agreement, Class A shares pay an annual fee of 0.01% and Class C, F, 529 and R shares pay an annual fee of 0.05% of their respective average daily net assets.
529 plan services — Each 529 share class is subject to service fees to compensate the Commonwealth of Virginia for the maintenance of the 529 college savings plan. During the period January 1, 2014, to March 31, 2014, the quarterly fee was based on a series of decreasing annual rates beginning with 0.10% on the first $30 billion of the net assets invested in Class 529 shares of the American Funds and decreasing to 0.06% on such assets between $120 billion and $150 billion. Effective April 1, 2014, the quarterly fee was amended to provide for reduced annual rates of 0.07%, 0.06% and 0.05% over $30 billion, $50 billion and $70 billion, respectively, of the net assets invested in Class 529 shares of the American Funds. The fee for any given calendar quarter is accrued and calculated on the basis of the average net assets of Class 529 shares of the American Funds for the last month of the prior calendar quarter. The fee is included in other expenses in the fund’s statement of operations. The Commonwealth of Virginia is not considered a related party to the fund.
For the six months ended June 30, 2014, class-specific expenses under the agreements were as follows (dollars in thousands):
| | Share class | | Distribution
services | | | Transfer agent
services | | | Administrative
services | | | 529 plan
services |
| | Class A | | | $48,886 | | | | $23,242 | | | | $2,071 | | | Not applicable |
| | Class B | | | 2,097 | | | | 251 | | | | Not applicable | | | Not applicable |
| | Class C | | | 11,587 | | | | 1,310 | | | | 580 | | | Not applicable |
| | Class F-1 | | | 6,523 | | | | 2,749 | | | | 1,310 | | | Not applicable |
| | Class F-2 | | | Not applicable | | | | 1,279 | | | | 652 | | | Not applicable |
| | Class 529-A | | | 1,731 | | | | 718 | | | | 399 | | | $741 |
| | Class 529-B | | | 182 | | | | 19 | | | | 9 | | | 17 |
| | Class 529-C | | | 2,067 | | | | 200 | | | | 104 | | | 193 |
| | Class 529-E | | | 167 | | | | 17 | | | | 17 | | | 31 |
| | Class 529-F-1 | | | — | | | | 30 | | | | 17 | | | 31 |
| | Class R-1 | | | 836 | | | | 91 | | | | 42 | | | Not applicable |
| | Class R-2 | | | 2,849 | | | | 1,284 | | | | 191 | | | Not applicable |
| | Class R-3 | | | 6,670 | | | | 2,088 | | | | 668 | | | Not applicable |
| | Class R-4 | | | 3,484 | | | | 1,449 | | | | 698 | | | Not applicable |
| | Class R-5 | | | Not applicable | | | | 487 | | | | 481 | | | Not applicable |
| | Class R-6 | | | Not applicable | | | | 10 | | | | 1,186 | | | Not applicable |
| | Total class-specific expenses | | | $87,079 | | | | $35,224 | | | | $8,425 | | | $1,013 |
Trustees’ deferred compensation — Trustees who are unaffiliated with CRMC may elect to defer the cash payment of part or all of their compensation. These deferred amounts, which remain as liabilities of the fund, are treated as if invested in shares of the fund or other American Funds. These amounts represent general, unsecured liabilities of the fund and vary according to the total returns of the selected funds. Trustees’ compensation of $421,000 in the fund’s statement of operations includes $181,000 in current fees (either paid in cash or deferred) and a net increase of $240,000 in the value of the deferred amounts.
Affiliated officers and trustees — Officers and certain trustees of the fund are or may be considered to be affiliated with CRMC, AFD and AFS. No affiliated officers or trustees received any compensation directly from the fund.
7. Capital share transactions
Capital share transactions in the fund were as follows (dollars and shares in thousands):
| | | Sales* | | | Reinvestments
of dividends
and distributions | | | Repurchases* | | | Net (decrease)
increase | |
| Share class | | Amount | | | Shares | | | Amount | | | Shares | | | Amount | | | Shares | | | Amount | | | Shares | |
| | | | | | | | | | | | | | | | | | | | | | | | | |
| Six months ended June 30, 2014 | | | | | | | | | | | | | | | | | | |
| | | | | | | | | | | | | | | | | | | | | | | | | | | | | | | | | |
| Class A | | $ | 1,764,902 | | | | 34,173 | | | $ | 602,665 | | | | 11,735 | | | $ | (2,391,074 | ) | | | (46,157 | ) | | $ | (23,507 | ) | | | (249 | ) |
| Class B | | | 3,112 | | | | 60 | | | | 4,549 | | | | 89 | | | | (90,458 | ) | | | (1,751 | ) | | | (82,797 | ) | | | (1,602 | ) |
| Class C | | | 167,451 | | | | 3,260 | | | | 24,813 | | | | 487 | | | | (210,288 | ) | | | (4,081 | ) | | | (18,024 | ) | | | (334 | ) |
| Class F-1 | | | 455,570 | | | | 8,835 | | | | 75,830 | | | | 1,478 | | | | (709,179 | ) | | | (13,620 | ) | | | (177,779 | ) | | | (3,307 | ) |
| Class F-2 | | | 629,020 | | | | 12,071 | | | | 39,330 | | | | 765 | | | | (246,230 | ) | | | (4,755 | ) | | | 422,120 | | | | 8,081 | |
| Class 529-A | | | 90,557 | | | | 1,754 | | | | 22,938 | | | | 448 | | | | (73,891 | ) | | | (1,427 | ) | | | 39,604 | | | | 775 | |
| Class 529-B | | | 501 | | | | 10 | | | | 372 | | | | 7 | | | | (7,396 | ) | | | (143 | ) | | | (6,523 | ) | | | (126 | ) |
| Class 529-C | | | 26,274 | | | | 509 | | | | 4,346 | | | | 85 | | | | (25,630 | ) | | | (495 | ) | | | 4,990 | | | | 99 | |
| Class 529-E | | | 3,755 | | | | 73 | | | | 881 | | | | 17 | | | | (3,171 | ) | | | (61 | ) | | | 1,465 | | | | 29 | |
| Class 529-F-1 | | | 6,574 | | | | 127 | | | | 1,045 | | | | 21 | | | | (4,295 | ) | | | (84 | ) | | | 3,324 | | | | 64 | |
| Class R-1 | | | 12,923 | | | | 251 | | | | 1,829 | | | | 36 | | | | (20,039 | ) | | | (387 | ) | | | (5,287 | ) | | | (100 | ) |
| Class R-2 | | | 78,249 | | | | 1,522 | | | | 8,399 | | | | 165 | | | | (97,121 | ) | | | (1,887 | ) | | | (10,473 | ) | | | (200 | ) |
| Class R-3 | | | 229,806 | | | | 4,464 | | | | 35,062 | | | | 686 | | | | (424,572 | ) | | | (8,224 | ) | | | (159,704 | ) | | | (3,074 | ) |
| Class R-4 | | | 271,938 | | | | 5,262 | | | | 40,833 | | | | 797 | | | | (419,759 | ) | | | (8,108 | ) | | | (106,988 | ) | | | (2,049 | ) |
| Class R-5 | | | 241,720 | | | | 4,676 | | | | 31,353 | | | | 610 | | | | (374,644 | ) | | | (7,232 | ) | | | (101,571 | ) | | | (1,946 | ) |
| Class R-6 | | | 764,405 | | | | 14,758 | | | | 77,029 | | | | 1,497 | | | | (227,742 | ) | | | (4,394 | ) | | | 613,692 | | | | 11,861 | |
| Total net increase (decrease) | | $ | 4,746,757 | | | | 91,805 | | | $ | 971,274 | | | | 18,923 | | | $ | (5,325,489 | ) | | | (102,806 | ) | | $ | 392,542 | | | | 7,922 | |
| | | | | | | | | | | | | | | | | | | | | | | | | | | | | | | | | |
| Year ended December 31, 2013 | | | | | | | | | | | | | | | | | |
| | | | | | | | | | | | | | | | | | | | | | | | | | | | | | | | | |
| Class A | | $ | 3,448,489 | | | | 74,176 | | | $ | 1,210,350 | | | | 24,454 | | | $ | (4,317,349 | ) | | | (92,697 | ) | | $ | 341,490 | | | | 5,933 | |
| Class B | | | 11,393 | | | | 245 | | | | 10,666 | | | | 213 | | | | (132,485 | ) | | | (2,869 | ) | | | (110,426 | ) | | | (2,411 | ) |
| Class C | | | 313,424 | | | | 6,762 | | | | 52,176 | | | | 1,042 | | | | (368,787 | ) | | | (7,951 | ) | | | (3,187 | ) | | | (147 | ) |
| Class F-1 | | | 924,486 | | | | 19,827 | | | | 154,281 | | | | 3,119 | | | | (1,468,666 | ) | | | (31,298 | ) | | | (389,899 | ) | | | (8,352 | ) |
| Class F-2 | | | 839,064 | | | | 17,327 | | | | 69,565 | | | | 1,404 | | | | (382,030 | ) | | | (8,207 | ) | | | 526,599 | | | | 10,524 | |
| Class 529-A | | | 177,318 | | | | 3,813 | | | | 45,378 | | | | 916 | | | | (146,630 | ) | | | (3,152 | ) | | | 76,066 | | | | 1,577 | |
| Class 529-B | | | 1,100 | | | | 24 | | | | 880 | | | | 17 | | | | (12,335 | ) | | | (267 | ) | | | (10,355 | ) | | | (226 | ) |
| Class 529-C | | | 48,976 | | | | 1,051 | | | | 9,079 | | | | 181 | | | | (47,863 | ) | | | (1,030 | ) | | | 10,192 | | | | 202 | |
| Class 529-E | | | 8,384 | | | | 179 | | | | 1,776 | | | | 35 | | | | (7,139 | ) | | | (152 | ) | | | 3,021 | | | | 62 | |
| Class 529-F-1 | | | 13,441 | | | | 286 | | | | 2,019 | | | | 41 | | | | (10,249 | ) | | | (217 | ) | | | 5,211 | | | | 110 | |
| Class R-1 | | | 28,443 | | | | 616 | | | | 3,921 | | | | 78 | | | | (44,951 | ) | | | (978 | ) | | | (12,587 | ) | | | (284 | ) |
| Class R-2 | | | 161,540 | | | | 3,505 | | | | 18,065 | | | | 362 | | | | (201,324 | ) | | | (4,358 | ) | | | (21,719 | ) | | | (491 | ) |
| Class R-3 | | | 522,597 | | | | 11,370 | | | | 76,219 | | | | 1,537 | | | | (801,668 | ) | | | (17,177 | ) | | | (202,852 | ) | | | (4,270 | ) |
| Class R-4 | | | 499,256 | | | | 10,776 | | | | 86,040 | | | | 1,742 | | | | (768,659 | ) | | | (16,467 | ) | | | (183,363 | ) | | | (3,949 | ) |
| Class R-5 | | | 367,587 | | | | 7,932 | | | | 62,957 | | | | 1,277 | | | | (399,954 | ) | | | (8,586 | ) | | | 30,590 | | | | 623 | |
| Class R-6 | | | 1,559,432 | | | | 34,497 | | | | 142,471 | | | | 2,886 | | | | (447,738 | ) | | | (9,581 | ) | | | 1,254,165 | | | | 27,802 | |
| Total net increase (decrease) | | $ | 8,924,930 | | | | 192,386 | | | $ | 1,945,843 | | | | 39,304 | | | $ | (9,557,827 | ) | | | (204,987 | ) | | $ | 1,312,946 | | | | 26,703 | |
* Includes exchanges between share classes of the fund.
8. Investment transactions
The fund made purchases and sales of investment securities, excluding short-term securities and U.S. government obligations, if any, of $11,072,921,000 and $10,841,389,000, respectively, during the six months ended June 30, 2014.
Financial highlights
| | | | | | | | Income (loss) from investment operations1 | |
| | | | | Net asset
value,
beginning
of period | | | Net
investment
income2,3 | | | Net gains (losses)
on securities
(both realized
and unrealized) | | | Total from
investment
operations | |
| Class A: | | Six months ended 6/30/20145,6 | | $ | 51.97 | | | $ | .62 | | | $ | 2.12 | | | $ | 2.74 | |
| | | Year ended 12/31/2013 | | | 40.78 | | | | .63 | | | | 12.13 | | | | 12.76 | |
| | | Year ended 12/31/2012 | | | 35.39 | | | | .64 | | | | 5.40 | | | | 6.04 | |
| | | Year ended 12/31/2011 | | | 36.70 | | | | .60 | | | | (1.29 | ) | | | (.69 | ) |
| | | Year ended 12/31/2010 | | | 32.73 | | | | .59 | | | | 3.95 | | | | 4.54 | |
| | | Year ended 12/31/2009 | | | 24.98 | | | | .44 | | | | 7.79 | | | | 8.23 | |
| Class B: | | Six months ended 6/30/20145,6 | | | 51.86 | | | | .44 | | | | 2.09 | | | | 2.53 | |
| | | Year ended 12/31/2013 | | | 40.68 | | | | .27 | | | | 12.11 | | | | 12.38 | |
| | | Year ended 12/31/2012 | | | 35.30 | | | | .34 | | | | 5.39 | | | | 5.73 | |
| | | Year ended 12/31/2011 | | | 36.60 | | | | .31 | | | | (1.28 | ) | | | (.97 | ) |
| | | Year ended 12/31/2010 | | | 32.64 | | | | .33 | | | | 3.94 | | | | 4.27 | |
| | | Year ended 12/31/2009 | | | 24.92 | | | | .23 | | | | 7.76 | | | | 7.99 | |
| Class C: | | Six months ended 6/30/20145,6 | | | 51.77 | | | | .42 | | | | 2.10 | | | | 2.52 | |
| | | Year ended 12/31/2013 | | | 40.63 | | | | .25 | | | | 12.09 | | | | 12.34 | |
| | | Year ended 12/31/2012 | | | 35.26 | | | | .33 | | | | 5.38 | | | | 5.71 | |
| | | Year ended 12/31/2011 | | | 36.56 | | | | .30 | | | | (1.28 | ) | | | (.98 | ) |
| | | Year ended 12/31/2010 | | | 32.61 | | | | .32 | | | | 3.94 | | | | 4.26 | |
| | | Year ended 12/31/2009 | | | 24.90 | | | | .22 | | | | 7.75 | | | | 7.97 | |
| Class F-1: | | Six months ended 6/30/20145,6 | | | 51.95 | | | | .61 | | | | 2.11 | | | | 2.72 | |
| | | Year ended 12/31/2013 | | | 40.76 | | | | .59 | | | | 12.14 | | | | 12.73 | |
| | | Year ended 12/31/2012 | | | 35.37 | | | | .64 | | | | 5.39 | | | | 6.03 | |
| | | Year ended 12/31/2011 | | | 36.68 | | | | .59 | | | | (1.29 | ) | | | (.70 | ) |
| | | Year ended 12/31/2010 | | | 32.72 | | | | .59 | | | | 3.93 | | | | 4.52 | |
| | | Year ended 12/31/2009 | | | 24.97 | | | | .45 | | | | 7.79 | | | | 8.24 | |
| Class F-2: | | Six months ended 6/30/20145,6 | | | 51.96 | | | | .67 | | | | 2.12 | | | | 2.79 | |
| | | Year ended 12/31/2013 | | | 40.77 | | | | .74 | | | | 12.13 | | | | 12.87 | |
| | | Year ended 12/31/2012 | | | 35.39 | | | | .76 | | | | 5.37 | | | | 6.13 | |
| | | Year ended 12/31/2011 | | | 36.70 | | | | .68 | | | | (1.29 | ) | | | (.61 | ) |
| | | Year ended 12/31/2010 | | | 32.73 | | | | .67 | | | | 3.95 | | | | 4.62 | |
| | | Year ended 12/31/2009 | | | 24.98 | | | | .49 | | | | 7.81 | | | | 8.30 | |
| Dividends and distributions | | | | | | | | | | | | | |
Dividends
(from net
investment | | | Distributions
(from capital | | | Total
dividends
and | | | Net asset
value, end | | | Total | | | Net assets,
end of period | | | Ratio of
expenses
to average | | | Ratio of
net income
to average | |
| income) | | | gains) | | | distributions | | | of period | | | return4 | | | (in millions) | | | net assets | | | net assets2,3 | |
| $ | (.27 | ) | | $ | (.50 | ) | | $ | (.77 | ) | | $ | 53.94 | | | | 5.34 | % | | $ | 43,390 | | | | .61 | %7 | | | 2.43 | %7 |
| | (.65 | ) | | | (.92 | ) | | | (1.57 | ) | | | 51.97 | | | | 31.49 | | | | 41,820 | | | | .63 | | | | 1.35 | |
| | (.65 | ) | | | — | | | | (.65 | ) | | | 40.78 | | | | 17.14 | | | | 32,568 | | | | .65 | | | | 1.66 | |
| | (.62 | ) | | | — | | | | (.62 | ) | | | 35.39 | | | | (1.89 | ) | | | 30,176 | | | | .63 | | | | 1.62 | |
| | (.57 | ) | | | — | | | | (.57 | ) | | | 36.70 | | | | 14.05 | | | | 33,089 | | | | .64 | | | | 1.78 | |
| | (.48 | ) | | | — | | | | (.48 | ) | | | 32.73 | | | | 33.36 | | | | 30,954 | | | | .69 | | | | 1.60 | |
| | (.06 | ) | | | (.50 | ) | | | (.56 | ) | | | 53.83 | | | | 4.94 | | | | 399 | | | | 1.37 | 7 | | | 1.70 | 7 |
| | (.28 | ) | | | (.92 | ) | | | (1.20 | ) | | | 51.86 | | | | 30.53 | | | | 468 | | | | 1.39 | | | | .59 | |
| | (.35 | ) | | | — | | | | (.35 | ) | | | 40.68 | | | | 16.25 | | | | 465 | | | | 1.41 | | | | .89 | |
| | (.33 | ) | | | — | | | | (.33 | ) | | | 35.30 | | | | (2.64 | ) | | | 545 | | | | 1.40 | | | | .85 | |
| | (.31 | ) | | | — | | | | (.31 | ) | | | 36.60 | | | | 13.18 | | | | 746 | | | | 1.41 | | | | 1.01 | |
| | (.27 | ) | | | — | | | | (.27 | ) | | | 32.64 | | | | 32.30 | | | | 897 | | | | 1.46 | | | | .85 | |
| | (.06 | ) | | | (.50 | ) | | | (.56 | ) | | | 53.73 | | | | 4.92 | | | | 2,424 | | | | 1.42 | 7 | | | 1.63 | 7 |
| | (.28 | ) | | | (.92 | ) | | | (1.20 | ) | | | 51.77 | | | | 30.44 | | | | 2,352 | | | | 1.43 | | | | .54 | |
| | (.34 | ) | | | — | | | | (.34 | ) | | | 40.63 | | | | 16.21 | | | | 1,852 | | | | 1.45 | | | | .86 | |
| | (.32 | ) | | | — | | | | (.32 | ) | | | 35.26 | | | | (2.67 | ) | | | 1,804 | | | | 1.44 | | | | .82 | |
| | (.31 | ) | | | — | | | | (.31 | ) | | | 36.56 | | | | 13.13 | | | | 2,081 | | | | 1.44 | | | | .98 | |
| | (.26 | ) | | | — | | | | (.26 | ) | | | 32.61 | | | | 32.26 | | | | 1,925 | | | | 1.48 | | | | .81 | |
| | (.25 | ) | | | (.50 | ) | | | (.75 | ) | | | 53.92 | | | | 5.31 | | | | 5,329 | | | | .66 | 7 | | | 2.39 | 7 |
| | (.62 | ) | | | (.92 | ) | | | (1.54 | ) | | | 51.95 | | | | 31.42 | | | | 5,306 | | | | .70 | | | | 1.27 | |
| | (.64 | ) | | | — | | | | (.64 | ) | | | 40.76 | | | | 17.12 | | | | 4,503 | | | | .66 | | | | 1.65 | |
| | (.61 | ) | | | — | | | | (.61 | ) | | | 35.37 | | | | (1.92 | ) | | | 4,285 | | | | .67 | | | | 1.60 | |
| | (.56 | ) | | | — | | | | (.56 | ) | | | 36.68 | | | | 14.01 | | | | 4,330 | | | | .66 | | | | 1.77 | |
| | (.49 | ) | | | — | | | | (.49 | ) | | | 32.72 | | | | 33.40 | | | | 3,868 | | | | .67 | | | | 1.61 | |
| | (.32 | ) | | | (.50 | ) | | | (.82 | ) | | | 53.93 | | | | 5.45 | | | | 3,015 | | | | .40 | 7 | | | 2.62 | 7 |
| | (.76 | ) | | | (.92 | ) | | | (1.68 | ) | | | 51.96 | | | | 31.80 | | | | 2,485 | | | | .41 | | | | 1.58 | |
| | (.75 | ) | | | — | | | | (.75 | ) | | | 40.77 | | | | 17.39 | | | | 1,521 | | | | .41 | | | | 1.96 | |
| | (.70 | ) | | | — | | | | (.70 | ) | | | 35.39 | | | | (1.67 | ) | | | 915 | | | | .42 | | | | 1.85 | |
| | (.65 | ) | | | — | | | | (.65 | ) | | | 36.70 | | | | 14.32 | | | | 888 | | | | .40 | | | | 2.03 | |
| | (.55 | ) | | | — | | | | (.55 | ) | | | 32.73 | | | | 33.72 | | | | 641 | | | | .43 | | | | 1.69 | |
See page 32 for footnotes.
Financial highlights (continued)
| | | | | | | | Income (loss) from investment operations1 | |
| | | | | Net asset
value,
beginning
of period | | | Net
investment
income2,3 | | | Net gains (losses)
on securities
(both realized
and unrealized) | | | Total from
investment
operations | |
| Class 529-A: | | Six months ended 6/30/20145,6 | | $ | 51.92 | | | $ | .60 | | | $ | 2.11 | | | $ | 2.71 | |
| | | Year ended 12/31/2013 | | | 40.74 | | | | .59 | | | | 12.12 | | | | 12.71 | |
| | | Year ended 12/31/2012 | | | 35.36 | | | | .61 | | | | 5.39 | | | | 6.00 | |
| | | Year ended 12/31/2011 | | | 36.67 | | | | .57 | | | | (1.29 | ) | | | (.72 | ) |
| | | Year ended 12/31/2010 | | | 32.71 | | | | .58 | | | | 3.93 | | | | 4.51 | |
| | | Year ended 12/31/2009 | | | 24.97 | | | | .43 | | | | 7.78 | | | | 8.21 | |
| Class 529-B: | | Six months ended 6/30/20145,6 | | | 51.95 | | | | .40 | | | | 2.09 | | | | 2.49 | |
| | | Year ended 12/31/2013 | | | 40.75 | | | | .21 | | | | 12.13 | | | | 12.34 | |
| | | Year ended 12/31/2012 | | | 35.36 | | | | .29 | | | | 5.39 | | | | 5.68 | |
| | | Year ended 12/31/2011 | | | 36.66 | | | | .27 | | | | (1.28 | ) | | | (1.01 | ) |
| | | Year ended 12/31/2010 | | | 32.69 | | | | .30 | | | | 3.95 | | | | 4.25 | |
| | | Year ended 12/31/2009 | | | 24.96 | | | | .20 | | | | 7.77 | | | | 7.97 | |
| Class 529-C: | | Six months ended 6/30/20145,6 | | | 51.88 | | | | .40 | | | | 2.10 | | | | 2.50 | |
| | | Year ended 12/31/2013 | | | 40.71 | | | | .22 | | | | 12.11 | | | | 12.33 | |
| | | Year ended 12/31/2012 | | | 35.34 | | | | .30 | | | | 5.38 | | | | 5.68 | |
| | | Year ended 12/31/2011 | | | 36.64 | | | | .28 | | | | (1.28 | ) | | | (1.00 | ) |
| | | Year ended 12/31/2010 | | | 32.69 | | | | .31 | | | | 3.93 | | | | 4.24 | |
| | | Year ended 12/31/2009 | | | 24.95 | | | | .20 | | | | 7.78 | | | | 7.98 | |
| Class 529-E: | | Six months ended 6/30/20145,6 | | | 51.89 | | | | .54 | | | | 2.10 | | | | 2.64 | |
| | | Year ended 12/31/2013 | | | 40.71 | | | | .47 | | | | 12.13 | | | | 12.60 | |
| | | Year ended 12/31/2012 | | | 35.34 | | | | .52 | | | | 5.37 | | | | 5.89 | |
| | | Year ended 12/31/2011 | | | 36.65 | | | | .47 | | | | (1.29 | ) | | | (.82 | ) |
| | | Year ended 12/31/2010 | | | 32.69 | | | | .48 | | | | 3.94 | | | | 4.42 | |
| | | Year ended 12/31/2009 | | | 24.95 | | | | .34 | | | | 7.78 | | | | 8.12 | |
| Class 529-F-1: | | Six months ended 6/30/20145,6 | | | 51.89 | | | | .65 | | | | 2.12 | | | | 2.77 | |
| | | Year ended 12/31/2013 | | | 40.71 | | | | .69 | | | | 12.12 | | | | 12.81 | |
| | | Year ended 12/31/2012 | | | 35.33 | | | | .69 | | | | 5.39 | | | | 6.08 | |
| | | Year ended 12/31/2011 | | | 36.65 | | | | .65 | | | | (1.30 | ) | | | (.65 | ) |
| | | Year ended 12/31/2010 | | | 32.69 | | | | .65 | | | | 3.93 | | | | 4.58 | |
| | | Year ended 12/31/2009 | | | 24.95 | | | | .48 | | | | 7.78 | | | | 8.26 | |
| Dividends and distributions | | | | | | | | | | | | | |
Dividends
(from net
investment | | | Distributions
(from capital | | | Total
dividends
and | | | Net asset
value, end | | | Total | | | Net assets,
end of period | | | Ratio of
expenses
to average | | | Ratio of
net income
to average | |
| income) | | | gains) | | | distributions | | | of period | | | return4 | | | (in millions) | | | net assets | | | net assets2,3 | |
| $ | (.24 | ) | | $ | (.50 | ) | | $ | (.74 | ) | | $ | 53.89 | | | | 5.30 | % | | $ | 1,692 | | | | .71 | %7 | | | 2.33 | %7 |
| | (.61 | ) | | | (.92 | ) | | | (1.53 | ) | | | 51.92 | | | | 31.39 | | | | 1,590 | | | | .72 | | | | 1.26 | |
| | (.62 | ) | | | — | | | | (.62 | ) | | | 40.74 | | | | 17.03 | | | | 1,183 | | | | .73 | | | | 1.59 | |
| | (.59 | ) | | | — | | | | (.59 | ) | | | 35.36 | | | | (1.97 | ) | | | 977 | | | | .71 | | | | 1.55 | |
| | (.55 | ) | | | — | | | | (.55 | ) | | | 36.67 | | | | 13.98 | | | | 916 | | | | .69 | | | | 1.74 | |
| | (.47 | ) | | | — | | | | (.47 | ) | | | 32.71 | | | | 33.30 | | | | 723 | | | | .73 | | | | 1.55 | |
| | (.02 | ) | | | (.50 | ) | | | (.52 | ) | | | 53.92 | | | | 4.86 | | | | 36 | | | | 1.50 | 7 | | | 1.57 | 7 |
| | (.22 | ) | | | (.92 | ) | | | (1.14 | ) | | | 51.95 | | | | 30.36 | | | | 41 | | | | 1.52 | | | | .46 | |
| | (.29 | ) | | | — | | | | (.29 | ) | | | 40.75 | | | | 16.09 | | | | 41 | | | | 1.54 | | | | .76 | |
| | (.29 | ) | | | — | | | | (.29 | ) | | | 35.36 | | | | (2.74 | ) | | | 48 | | | | 1.51 | | | | .74 | |
| | (.28 | ) | | | — | | | | (.28 | ) | | | 36.66 | | | | 13.09 | | | | 63 | | | | 1.50 | | | | .92 | |
| | (.24 | ) | | | — | | | | (.24 | ) | | | 32.69 | | | | 32.16 | | | | 71 | | | | 1.55 | | | | .74 | |
| | (.04 | ) | | | (.50 | ) | | | (.54 | ) | | | 53.84 | | | | 4.87 | | | | 437 | | | | 1.49 | 7 | | | 1.55 | 7 |
| | (.24 | ) | | | (.92 | ) | | | (1.16 | ) | | | 51.88 | | | | 30.37 | | | | 416 | | | | 1.51 | | | | .47 | |
| | (.31 | ) | | | — | | | | (.31 | ) | | | 40.71 | | | | 16.09 | | | | 319 | | | | 1.53 | | | | .79 | |
| | (.30 | ) | | | — | | | | (.30 | ) | | | 35.34 | | | | (2.72 | ) | | | 273 | | | | 1.51 | | | | .76 | |
| | (.29 | ) | | | — | | | | (.29 | ) | | | 36.64 | | | | 13.05 | | | | 265 | | | | 1.49 | | | | .94 | |
| | (.24 | ) | | | — | | | | (.24 | ) | | | 32.69 | | | | 32.22 | | | | 215 | | | | 1.55 | | | | .74 | |
| | (.18 | ) | | | (.50 | ) | | | (.68 | ) | | | 53.85 | | | | 5.16 | | | | 71 | | | | .95 | 7 | | | 2.09 | 7 |
| | (.50 | ) | | | (.92 | ) | | | (1.42 | ) | | | 51.89 | | | | 31.10 | | | | 67 | | | | .96 | | | | 1.02 | |
| | (.52 | ) | | | — | | | | (.52 | ) | | | 40.71 | | | | 16.73 | | | | 50 | | | | .98 | | | | 1.34 | |
| | (.49 | ) | | | — | | | | (.49 | ) | | | 35.34 | | | | (2.23 | ) | | | 42 | | | | .98 | | | | 1.29 | |
| | (.46 | ) | �� | | — | | | | (.46 | ) | | | 36.65 | | | | 13.66 | | | | 41 | | | | .98 | | | | 1.45 | |
| | (.38 | ) | | | — | | | | (.38 | ) | | | 32.69 | | | | 32.89 | | | | 32 | | | | 1.04 | | | | 1.24 | |
| | (.30 | ) | | | (.50 | ) | | | (.80 | ) | | | 53.86 | | | | 5.41 | | | | 73 | | | | .49 | 7 | | | 2.55 | 7 |
| | (.71 | ) | | | (.92 | ) | | | (1.63 | ) | | | 51.89 | | | | 31.70 | | | | 67 | | | | .51 | | | | 1.47 | |
| | (.70 | ) | | | — | | | | (.70 | ) | | | 40.71 | | | | 17.25 | | | | 48 | | | | .52 | | | | 1.79 | |
| | (.67 | ) | | | — | | | | (.67 | ) | | | 35.33 | | | | (1.75 | ) | | | 40 | | | | .50 | | | | 1.77 | |
| | (.62 | ) | | | — | | | | (.62 | ) | | | 36.65 | | | | 14.22 | | | | 37 | | | | .48 | | | | 1.95 | |
| | (.52 | ) | | | — | | | | (.52 | ) | | | 32.69 | | | | 33.56 | | | | 27 | | | | .54 | | | | 1.74 | |
See page 32 for footnotes.
Financial highlights (continued)
| | | | | | | | Income (loss) from investment operations1 | |
| | | | | Net asset
value,
beginning
of period | | | Net
investment
income2,3 | | | Net gains (losses)
on securities
(both realized
and unrealized) | | | Total from
investment
operations | |
| Class R-1: | | Six months ended 6/30/20145,6 | | $ | 51.77 | | | $ | .42 | | | $ | 2.09 | | | $ | 2.51 | |
| | | Year ended 12/31/2013 | | | 40.62 | | | | .26 | | | | 12.09 | | | | 12.35 | |
| | | Year ended 12/31/2012 | | | 35.26 | | | | .34 | | | | 5.37 | | | | 5.71 | |
| | | Year ended 12/31/2011 | | | 36.56 | | | | .31 | | | | (1.28 | ) | | | (.97 | ) |
| | | Year ended 12/31/2010 | | | 32.62 | | | | .33 | | | | 3.93 | | | | 4.26 | |
| | | Year ended 12/31/2009 | | | 24.90 | | | | .22 | | | | 7.76 | | | | 7.98 | |
| Class R-2: | | Six months ended 6/30/20145,6 | | | 51.76 | | | | .42 | | | | 2.10 | | | | 2.52 | |
| | | Year ended 12/31/2013 | | | 40.62 | | | | .29 | | | | 12.08 | | | | 12.37 | |
| | | Year ended 12/31/2012 | | | 35.26 | | | | .35 | | | | 5.37 | | | | 5.72 | |
| | | Year ended 12/31/2011 | | | 36.56 | | | | .31 | | | | (1.28 | ) | | | (.97 | ) |
| | | Year ended 12/31/2010 | | | 32.61 | | | | .33 | | | | 3.93 | | | | 4.26 | |
| | | Year ended 12/31/2009 | | | 24.89 | | | | .21 | | | | 7.76 | | | | 7.97 | |
| Class R-3: | | Six months ended 6/30/20145,6 | | | 51.87 | | | | .53 | | | | 2.10 | | | | 2.63 | |
| | | Year ended 12/31/2013 | | | 40.70 | | | | .48 | | | | 12.11 | | | | 12.59 | |
| | | Year ended 12/31/2012 | | | 35.32 | | | | .52 | | | | 5.39 | | | | 5.91 | |
| | | Year ended 12/31/2011 | | | 36.63 | | | | .48 | | | | (1.29 | ) | | | (.81 | ) |
| | | Year ended 12/31/2010 | | | 32.67 | | | | .49 | | | | 3.94 | | | | 4.43 | |
| | | Year ended 12/31/2009 | | | 24.94 | | | | .36 | | | | 7.77 | | | | 8.13 | |
| Class R-4: | | Six months ended 6/30/20145,6 | | | 51.88 | | | | .61 | | | | 2.11 | | | | 2.72 | |
| | | Year ended 12/31/2013 | | | 40.71 | | | | .61 | | | | 12.12 | | | | 12.73 | |
| | | Year ended 12/31/2012 | | | 35.33 | | | | .64 | | | | 5.39 | | | | 6.03 | |
| | | Year ended 12/31/2011 | | | 36.64 | | | | .59 | | | | (1.30 | ) | | | (.71 | ) |
| | | Year ended 12/31/2010 | | | 32.68 | | | | .59 | | | | 3.93 | | | | 4.52 | |
| | | Year ended 12/31/2009 | | | 24.95 | | | | .44 | | | | 7.77 | | | | 8.21 | |
| Class R-5: | | Six months ended 6/30/20145,6 | | | 51.99 | | | | .70 | | | | 2.11 | | | | 2.81 | |
| | | Year ended 12/31/2013 | | | 40.79 | | | | .76 | | | | 12.14 | | | | 12.90 | |
| | | Year ended 12/31/2012 | | | 35.40 | | | | .75 | | | | 5.40 | | | | 6.15 | |
| | | Year ended 12/31/2011 | | | 36.71 | | | | .70 | | | | (1.30 | ) | | | (.60 | ) |
| | | Year ended 12/31/2010 | | | 32.74 | | | | .69 | | | | 3.94 | | | | 4.63 | |
| | | Year ended 12/31/2009 | | | 24.99 | | | | .52 | | | | 7.79 | | | | 8.31 | |
| Class R-6: | | Six months ended 6/30/20145,6 | | | 51.98 | | | | .70 | | | | 2.11 | | | | 2.81 | |
| | | Year ended 12/31/2013 | | | 40.78 | | | | .79 | | | | 12.13 | | | | 12.92 | |
| | | Year ended 12/31/2012 | | | 35.39 | | | | .79 | | | | 5.38 | | | | 6.17 | |
| | | Year ended 12/31/2011 | | | 36.70 | | | | .72 | | | | (1.30 | ) | | | (.58 | ) |
| | | Year ended 12/31/2010 | | | 32.74 | | | | .71 | | | | 3.93 | | | | 4.64 | |
| | | Period from 5/1/2009 to 12/31/20095,8 | | | 25.63 | | | | .37 | | | | 7.17 | | | | 7.54 | |
| Dividends and distributions | | | | | | | | | | | | | |
Dividends
(from net
investment | | | Distributions
(from capital | | | Total
dividends
and | | | Net asset
value, end | | | Total | | | Net assets,
end of period | | | Ratio of
expenses
to average | | | Ratio of
net income
to average | |
| income) | | | gains) | | | distributions | | | of period | | | return4 | | | (in millions) | | | net assets | | | net assets2,3 | |
| $ | (.06 | ) | | $ | (.50 | ) | | $ | (.56 | ) | | $ | 53.72 | | | | 4.91 | % | | $ | 172 | | | | 1.41 | %7 | | | 1.63 | %7 |
| | (.28 | ) | | | (.92 | ) | | | (1.20 | ) | | | 51.77 | | | | 30.50 | | | | 171 | | | | 1.41 | | | | .57 | |
| | (.35 | ) | | | — | | | | (.35 | ) | | | 40.62 | | | | 16.22 | | | | 146 | | | | 1.42 | | | | .88 | |
| | (.33 | ) | | | — | | | | (.33 | ) | | | 35.26 | | | | (2.65 | ) | | | 142 | | | | 1.43 | | | | .84 | |
| | (.32 | ) | | | — | | | | (.32 | ) | | | 36.56 | | | | 13.13 | | | | 138 | | | | 1.43 | | | | 1.01 | |
| | (.26 | ) | | | — | | | | (.26 | ) | | | 32.62 | | | | 32.30 | | | | 98 | | | | 1.47 | | | | .80 | |
| | (.07 | ) | | | (.50 | ) | | | (.57 | ) | | | 53.71 | | | | 4.92 | | | | 795 | | | | 1.39 | 7 | | | 1.65 | 7 |
| | (.31 | ) | | | (.92 | ) | | | (1.23 | ) | | | 51.76 | | | | 30.55 | | | | 777 | | | | 1.36 | | | | .62 | |
| | (.36 | ) | | | — | | | | (.36 | ) | | | 40.62 | | | | 16.24 | | | | 630 | | | | 1.40 | | | | .91 | |
| | (.33 | ) | | | — | | | | (.33 | ) | | | 35.26 | | | | (2.64 | ) | | | 589 | | | | 1.41 | | | | .85 | |
| | (.31 | ) | | | — | | | | (.31 | ) | | | 36.56 | | | | 13.15 | | | | 631 | | | | 1.42 | | | | 1.00 | |
| | (.25 | ) | | | — | | | | (.25 | ) | | | 32.61 | | | | 32.22 | | | | 550 | | | | 1.52 | | | | .77 | |
| | (.17 | ) | | | (.50 | ) | | | (.67 | ) | | | 53.83 | | | | 5.15 | | | | 2,735 | | | | .96 | 7 | | | 2.09 | 7 |
| | (.50 | ) | | | (.92 | ) | | | (1.42 | ) | | | 51.87 | | | | 31.09 | | | | 2,795 | | | | .96 | | | | 1.02 | |
| | (.53 | ) | | | — | | | | (.53 | ) | | | 40.70 | | | | 16.78 | | | | 2,367 | | | | .96 | | | | 1.35 | |
| | (.50 | ) | | | — | | | | (.50 | ) | | | 35.32 | | | | (2.22 | ) | | | 2,146 | | | | .96 | | | | 1.30 | |
| | (.47 | ) | | | — | | | | (.47 | ) | | | 36.63 | | | | 13.69 | | | | 2,177 | | | | .96 | | | | 1.47 | |
| | (.40 | ) | | | — | | | | (.40 | ) | | | 32.67 | | | | 32.93 | | | | 1,707 | | | | .99 | | | | 1.29 | |
| | (.25 | ) | | | (.50 | ) | | | (.75 | ) | | | 53.85 | | | | 5.32 | | | | 2,839 | | | | .66 | 7 | | | 2.39 | 7 |
| | (.64 | ) | | | (.92 | ) | | | (1.56 | ) | | | 51.88 | | | | 31.47 | | | | 2,842 | | | | .66 | | | | 1.32 | |
| | (.65 | ) | | | — | | | | (.65 | ) | | | 40.71 | | | | 17.13 | | | | 2,390 | | | | .66 | | | | 1.65 | |
| | (.60 | ) | | | — | | | | (.60 | ) | | | 35.33 | | | | (1.92 | ) | | | 2,123 | | | | .66 | | | | 1.60 | |
| | (.56 | ) | | | — | | | | (.56 | ) | | | 36.64 | | | | 14.02 | | | | 2,050 | | | | .66 | | | | 1.77 | |
| | (.48 | ) | | | — | | | | (.48 | ) | | | 32.68 | | | | 33.31 | | | | 1,545 | | | | .69 | | | | 1.58 | |
| | (.33 | ) | | | (.50 | ) | | | (.83 | ) | | | 53.97 | | | | 5.49 | | | | 1,934 | | | | .36 | 7 | | | 2.71 | 7 |
| | (.78 | ) | | | (.92 | ) | | | (1.70 | ) | | | 51.99 | | | | 31.87 | | | | 1,964 | | | | .36 | | | | 1.62 | |
| | (.76 | ) | | | — | | | | (.76 | ) | | | 40.79 | | | | 17.47 | | | | 1,516 | | | | .36 | | | | 1.95 | |
| | (.71 | ) | | | — | | | | (.71 | ) | | | 35.40 | | | | (1.62 | ) | | | 1,394 | | | | .36 | | | | 1.89 | |
| | (.66 | ) | | | — | | | | (.66 | ) | | | 36.71 | | | | 14.37 | | | | 1,419 | | | | .36 | | | | 2.06 | |
| | (.56 | ) | | | — | | | | (.56 | ) | | | 32.74 | | | | 33.75 | | | | 1,269 | | | | .39 | | | | 1.92 | |
| | (.34 | ) | | | (.50 | ) | | | (.84 | ) | | | 53.95 | | | | 5.50 | | | | 5,327 | | | | .31 | 7 | | | 2.72 | 7 |
| | (.80 | ) | | | (.92 | ) | | | (1.72 | ) | | | 51.98 | | | | 31.95 | | | | 4,516 | | | | .31 | | | | 1.68 | |
| | (.78 | ) | | | — | | | | (.78 | ) | | | 40.78 | | | | 17.53 | | | | 2,409 | | | | .31 | | | | 2.03 | |
| | (.73 | ) | | | — | | | | (.73 | ) | | | 35.39 | | | | (1.57 | ) | | | 1,421 | | | | .31 | | | | 1.97 | |
| | (.68 | ) | | | — | | | | (.68 | ) | | | 36.70 | | | | 14.39 | | | | 950 | | | | .32 | | | | 2.13 | |
| | (.43 | ) | | | — | | | | (.43 | ) | | | 32.74 | | | | 29.60 | | | | 596 | | | | .35 | 7 | | | 1.87 | 7 |
See page 32 for footnotes.
Financial highlights (continued)
| | | Six months | | | | | | | | | | | | | | | |
| | | ended | | | | | | | | | | | | | | | |
| | | June 30, | | Year ended December 31 |
| | | 20145,6 | | 2013 | | 2012 | | 2011 | | 2010 | | 2009 |
| Portfolio turnover rate for all share classes | | | 17 | % | | | 34 | % | | | 28 | % | | | 28 | % | | | 32 | % | | | 30 | % |
| 1 | Based on average shares outstanding. |
| 2 | For the year ended December 31, 2010, this column reflects the impact of a corporate action event that resulted in a one-time increase to net investment income. If the corporate action event had not occurred, the Class A net investment income per share and ratio of net income to average net assets would have been lower by $.07 and .21 percentage points, respectively. The impact to the other share classes would have been similar. |
| 3 | For the six months ended June 30, 2014, this column reflects the impact of a corporate action event that resulted in a one-time increase to net investment income. If the corporate action event had not occurred, the Class A net investment income per share and ratio of net income to average net assets would have been lower by $.27 and .52 percentage points, respectively. The impact to the other share classes would have been similar. |
| 4 | Total returns exclude any applicable sales charges, including contingent deferred sales charges. |
| 5 | Based on operations for the period shown and, accordingly, is not representative of a full year. |
| 6 | Unaudited. |
| 7 | Annualized. |
| 8 | Class R-6 shares were offered beginning May 1, 2009. |
See Notes to Financial Statements
As a fund shareholder, you incur two types of costs: (1) transaction costs, such as initial sales charges on purchase payments and contingent deferred sales charges on redemptions (loads), and (2) ongoing costs, including management fees, distribution and service (12b-1) fees, and other expenses. This example is intended to help you understand your ongoing costs (in dollars) of investing in the fund so you can compare these costs with the ongoing costs of investing in other mutual funds. The example is based on an investment of $1,000 invested at the beginning of the period and held for the entire six-month period (January 1, 2014, through June 30, 2014).
Actual expenses:
The first line of each share class in the table on the following page provides information about actual account values and actual expenses. You may use the information in this line, together with the amount you invested, to estimate the expenses that you paid over the period. Simply divide your account value by $1,000 (for example, an $8,600 account value divided by $1,000 = 8.6), then multiply the result by the number in the first line under the heading entitled “Expenses paid during period” to estimate the expenses you paid on your account during this period.
Hypothetical example for comparison purposes:
The second line of each share class in the table on the following page provides information about hypothetical account values and hypothetical expenses based on the actual expense ratio for the share class and an assumed rate of return of 5.00% per year before expenses, which is not the actual return of the share class. The hypothetical account values and expenses may not be used to estimate the actual ending account balance or expenses you paid for the period. You may use this information to compare the ongoing costs of investing in the fund and other funds. To do so, compare this 5.00% hypothetical example with the 5.00% hypothetical examples that appear in the shareholder reports of the other funds.
Notes:
Retirement plan participants may be subject to certain fees charged by the plan sponsor, and Class F-1, F-2 and 529-F-1 shareholders may be subject to fees charged by financial intermediaries, typically ranging from 0.75% to 1.50% of assets annually depending on services offered. You can estimate the impact of these fees by adding the amount of the fees to the total estimated expenses you paid on your account during the period as calculated above. In addition, your ending account value would be lower by the amount of these fees.
Note that the expenses shown in the table on the following page are meant to highlight your ongoing costs only and do not reflect any transactional costs, such as sales charges (loads). Therefore, the second line of each share class in the table is useful in comparing ongoing costs only and will not help you determine the relative total costs of owning different funds. In addition, if these transactional costs were included, your costs would have been higher.
| | | Beginning
account value
1/1/2014 | | | Ending
account value
6/30/2014 | | | Expenses
paid during
period* | | | Annualized
expense
ratio | |
| Class A — actual return | | $ | 1,000.00 | | | $ | 1,053.39 | | | $ | 3.11 | | | | .61 | % |
| Class A — assumed 5% return | | | 1,000.00 | | | | 1,021.77 | | | | 3.06 | | | | .61 | |
| Class B — actual return | | | 1,000.00 | | | | 1,049.42 | | | | 6.96 | | | | 1.37 | |
| Class B — assumed 5% return | | | 1,000.00 | | | | 1,018.00 | | | | 6.85 | | | | 1.37 | |
| Class C — actual return | | | 1,000.00 | | | | 1,049.24 | | | | 7.22 | | | | 1.42 | |
| Class C — assumed 5% return | | | 1,000.00 | | | | 1,017.75 | | | | 7.10 | | | | 1.42 | |
| Class F-1 — actual return | | | 1,000.00 | | | | 1,053.11 | | | | 3.36 | | | | .66 | |
| Class F-1 — assumed 5% return | | | 1,000.00 | | | | 1,021.52 | | | | 3.31 | | | | .66 | |
| Class F-2 — actual return | | | 1,000.00 | | | | 1,054.55 | | | | 2.04 | | | | .40 | |
| Class F-2 — assumed 5% return | | | 1,000.00 | | | | 1,022.81 | | | | 2.01 | | | | .40 | |
| Class 529-A — actual return | | | 1,000.00 | | | | 1,052.96 | | | | 3.61 | | | | .71 | |
| Class 529-A — assumed 5% return | | | 1,000.00 | | | | 1,021.27 | | | | 3.56 | | | | .71 | |
| Class 529-B — actual return | | | 1,000.00 | | | | 1,048.58 | | | | 7.62 | | | | 1.50 | |
| Class 529-B — assumed 5% return | | | 1,000.00 | | | | 1,017.36 | | | | 7.50 | | | | 1.50 | |
| Class 529-C — actual return | | | 1,000.00 | | | | 1,048.70 | | | | 7.57 | | | | 1.49 | |
| Class 529-C — assumed 5% return | | | 1,000.00 | | | | 1,017.41 | | | | 7.45 | | | | 1.49 | |
| Class 529-E — actual return | | | 1,000.00 | | | | 1,051.58 | | | | 4.83 | | | | .95 | |
| Class 529-E — assumed 5% return | | | 1,000.00 | | | | 1,020.08 | | | | 4.76 | | | | .95 | |
| Class 529-F-1 — actual return | | | 1,000.00 | | | | 1,054.15 | | | | 2.50 | | | | .49 | |
| Class 529-F-1 — assumed 5% return | | | 1,000.00 | | | | 1,022.36 | | | | 2.46 | | | | .49 | |
| Class R-1 — actual return | | | 1,000.00 | | | | 1,049.10 | | | | 7.16 | | | | 1.41 | |
| Class R-1 — assumed 5% return | | | 1,000.00 | | | | 1,017.80 | | | | 7.05 | | | | 1.41 | |
| Class R-2 — actual return | | | 1,000.00 | | | | 1,049.17 | | | | 7.06 | | | | 1.39 | |
| Class R-2 — assumed 5% return | | | 1,000.00 | | | | 1,017.90 | | | | 6.95 | | | | 1.39 | |
| Class R-3 — actual return | | | 1,000.00 | | | | 1,051.52 | | | | 4.88 | | | | .96 | |
| Class R-3 — assumed 5% return | | | 1,000.00 | | | | 1,020.03 | | | | 4.81 | | | | .96 | |
| Class R-4 — actual return | | | 1,000.00 | | | | 1,053.20 | | | | 3.36 | | | | .66 | |
| Class R-4 — assumed 5% return | | | 1,000.00 | | | | 1,021.52 | | | | 3.31 | | | | .66 | |
| Class R-5 — actual return | | | 1,000.00 | | | | 1,054.90 | | | | 1.83 | | | | .36 | |
| Class R-5 — assumed 5% return | | | 1,000.00 | | | | 1,023.01 | | | | 1.81 | | | | .36 | |
| Class R-6 — actual return | | | 1,000.00 | | | | 1,054.99 | | | | 1.58 | | | | .31 | |
| Class R-6 — assumed 5% return | | | 1,000.00 | | | | 1,023.26 | | | | 1.56 | | | | .31 | |
| * | The “expenses paid during period” are equal to the “annualized expense ratio,” multiplied by the average account value over the period, multiplied by the number of days in the period, and divided by 365 (to reflect the one-half year period). |
This page was intentionally left blank.
Office of the fund
One Market
Steuart Tower, Suite 2000
San Francisco, CA 94105-1409
Investment adviser
Capital Research and Management Company
333 South Hope Street
Los Angeles, CA 90071-1406
6455 Irvine Center Drive
Irvine, CA 92618-4518
Transfer agent for shareholder accounts
American Funds Service Company
(Write to the address near you.)
P.O. Box 6007
Indianapolis, IN 46206-6007
P.O. Box 2280
Norfolk, VA 23501-2280
Custodian of assets
State Street Bank and Trust Company
One Lincoln Street
Boston, MA 02111
Counsel
K&L Gates LLP
Four Embarcadero Center, Suite 1200
San Francisco, CA 94111-5994
Independent registered public accounting firm
Deloitte & Touche LLP
695 Town Center Drive
Suite 1200
Costa Mesa, CA 92626-7188
Principal underwriter
American Funds Distributors, Inc.
333 South Hope Street
Los Angeles, CA 90071-1406
Investors should carefully consider investment objectives, risks, charges and expenses. This and other important information is contained in the fund prospectus and summary prospectus, which can be obtained from your financial professional and should be read carefully before investing. You may also call American Funds Service Company (AFS) at (800) 421-4225 or visit the American Funds website at americanfunds.com.
“American Funds Proxy Voting Procedures and Principles” — which describes how we vote proxies relating to portfolio securities — is available on the American Funds website or upon request by calling AFS. The fund files its proxy voting record with the U.S. Securities and Exchange Commission (SEC) for the 12 months ended June 30 by August 31. The proxy voting record is available free of charge on the SEC website at sec.gov and on the American Funds website.
A complete June 30, 2014, portfolio of Fundamental Investors’ investments is available free of charge by calling AFS or visiting the SEC website (where it is part of Form N-CSR).
Fundamental Investors files a complete list of its portfolio holdings with the SEC for the first and third quarters of each fiscal year on Form N-Q. This filing is available free of charge on the SEC website. You may also review or, for a fee, copy this filing at the SEC’s Public Reference Room in Washington, D.C. Additional information regarding the operation of the Public Reference Room may be obtained by calling the SEC’s Office of Investor Education and Advocacy at (800) SEC-0330. Additionally, the list of portfolio holdings is available by calling AFS.
This report is for the information of shareholders of Fundamental Investors, but it also may be used as sales literature when preceded or accompanied by the current prospectus or summary prospectus, which gives details about charges, expenses, investment objectives and operating policies of the fund. If used as sales material after September 30, 2014, this report must be accompanied by an American Funds statistical update for the most recently completed calendar quarter.
The American Funds Advantage
Since 1931, American Funds, part of Capital Group, has helped investors pursue long-term investment success. Our consistent approach — in combination with The Capital SystemSM — has resulted in a superior long-term track record.
| | Aligned with investor success |
| | We base our decisions on a long-term perspective, which we believe aligns our goals with the interests of our clients. Our portfolio managers average 26 years of investment experience, including 21 years at our company, reflecting a career commitment to our long-term approach.1 |
| | |
| | The Capital SystemSM |
| | Our investment process, The Capital System, combines individual accountability with teamwork. Each fund is divided into portions that are managed independently by investment professionals with diverse backgrounds, ages and investment approaches. An extensive global research effort is the backbone of our system. |
| | |
| | Superior long-term track record |
| | Our equity funds have beaten their Lipper peer indexes in 90% of 10-year periods and 96% of 20-year periods. Our fixed-income funds have beaten their Lipper indexes in 56% of 10-year periods and 57% of 20-year periods.2 Our fund management fees have been among the lowest in the industry.3 |
| | 1 | Portfolio manager experience as of December 31, 2013. |
| | 2 | Based on Class A share results for rolling periods through December 31, 2013. Periods covered are the shorter of the fund’s lifetime or since the comparable Lipper index inception date (except SMALLCAP World Fund, for which the Lipper average was used). |
| | 3 | Based on management fees for the 20-year period ended December 31, 2013, versus comparable Lipper categories, excluding funds of funds. |
 | Printed on paper containing 10% post-consumer waste Printed with inks containing soy and/or vegetable oil |
| Lit No. MFGESRX-010-0814P Litho in USA KBDA/ALD/8083-S42819 |
ITEM 2 – Code of Ethics
Not applicable for filing of semi-annual reports to shareholders.
ITEM 3 – Audit Committee Financial Expert
Not applicable for filing of semi-annual reports to shareholders.
ITEM 4 – Principal Accountant Fees and Services
Not applicable for filing of semi-annual reports to shareholders.
ITEM 5 – Audit Committee of Listed Registrants
Not applicable to this Registrant, insofar as the Registrant is not a listed issuer as defined in Rule 10A-3 under the Securities Exchange Act of 1934.
ITEM 6 – Schedule of Investments
 | American Funds Fundamental Investors Investment Portfolio June 30, 2014 |
unaudited
| Common stocks 96.71% | | |
| | | Value |
| Financials 16.12% | Shares | (000) |
| | | |
| Wells Fargo & Co. | 24,415,916 | $ 1,283,301 |
| American Express Co. | 9,770,000 | 926,880 |
| Capital One Financial Corp. | 10,162,000 | 839,381 |
| JPMorgan Chase & Co. | 14,180,000 | 817,052 |
| Berkshire Hathaway Inc., Class A1 | 3,330 | 632,369 |
| CME Group Inc., Class A | 8,007,600 | 568,139 |
| ACE Ltd. | 4,700,000 | 487,390 |
| Weyerhaeuser Co.1 | 14,000,107 | 463,263 |
| Legal & General Group PLC | 119,784,921 | 462,070 |
| American International Group, Inc. | 7,641,700 | 417,084 |
| Goldman Sachs Group, Inc. | 2,438,200 | 408,252 |
| Moody's Corp. | 4,420,000 | 387,457 |
| SunTrust Banks, Inc. | 9,603,987 | 384,736 |
| Citigroup Inc. | 8,000,000 | 376,800 |
| McGraw Hill Financial, Inc. | 4,405,000 | 365,747 |
| Deutsche Bank AG | 9,655,944 | 339,736 |
| Equity Residential | 4,926,804 | 310,389 |
| Aon PLC, Class A | 2,860,000 | 257,657 |
| BlackRock, Inc. | 730,000 | 233,308 |
| CNO Financial Group, Inc.2 | 11,900,000 | 211,820 |
| KeyCorp | 14,060,000 | 201,480 |
| XL Group PLC | 6,000,000 | 196,380 |
| American Tower Corp. | 2,000,000 | 179,960 |
| Svenska Handelsbanken AB, Class A | 2,790,000 | 136,586 |
| Charles Schwab Corp. | 5,000,000 | 134,650 |
| Leucadia National Corp. | 4,589,846 | 120,346 |
| Digital Realty Trust, Inc. | 1,665,000 | 97,103 |
| Crown Castle International Corp. | 1,251,522 | 92,938 |
| Sumitomo Mitsui Financial Group, Inc. | 600,000 | 25,136 |
| AXA SA | 1,000,000 | 23,901 |
| Industrial and Commercial Bank of China Ltd., Class H | 21,986,000 | 13,900 |
| | | 11,395,211 |
| | | |
| Consumer discretionary 16.01% | | |
| | | |
| Amazon.com, Inc.1 | 6,807,800 | 2,211,037 |
| Comcast Corp., Class A | 35,135,000 | 1,886,047 |
| Home Depot, Inc. | 15,560,000 | 1,259,738 |
| Walt Disney Co. | 10,140,000 | 869,404 |
| Time Warner Inc. | 12,007,293 | 843,512 |
| Twenty-First Century Fox, Inc., Class A | 22,000,000 | 773,300 |
| Expedia, Inc. | 4,891,000 | 385,215 |
| Marriott International, Inc., Class A | 4,693,545 | 300,856 |
| Carnival Corp., units | 7,920,000 | 298,188 |
| Macy's, Inc. | 5,000,000 | 290,100 |
| NIKE, Inc., Class B | 3,400,000 | 263,670 |
| Common stocks | | |
| | | Value |
| Consumer discretionary (continued) | Shares | (000) |
| | | |
| CBS Corp., Class B | 4,125,000 | $ 256,328 |
| Johnson Controls, Inc. | 4,600,000 | 229,678 |
| Viacom Inc., Class B | 2,580,000 | 223,763 |
| Altice SA1 | 3,005,000 | 209,358 |
| Naspers Ltd., Class N | 1,700,000 | 200,132 |
| Lowe's Companies, Inc. | 3,430,000 | 164,606 |
| Liberty Global PLC, Class C1 | 2,353,511 | 99,577 |
| Liberty Global PLC, Class A1 | 863,679 | 38,192 |
| Ralph Lauren Corp., Class A | 846,700 | 136,056 |
| VF Corp. | 1,400,000 | 88,200 |
| Starbucks Corp. | 965,000 | 74,672 |
| Toyota Motor Corp. | 930,000 | 55,852 |
| Las Vegas Sands Corp. | 426,141 | 32,481 |
| D.R. Horton, Inc. | 1,300,000 | 31,954 |
| Lennar Corp., Class A | 740,000 | 31,065 |
| Toll Brothers, Inc.1 | 640,000 | 23,616 |
| Industria de Diseño Textil, SA | 140,000 | 21,547 |
| Time Inc.1 | 762,750 | 18,474 |
| | | 11,316,618 |
| | | |
| Information technology 15.89% | | |
| | | |
| Microsoft Corp. | 55,390,000 | 2,309,763 |
| Google Inc., Class A1 | 1,462,800 | 855,255 |
| Google Inc., Class C1 | 1,362,800 | 783,992 |
| Apple Inc. | 15,330,000 | 1,424,617 |
| Avago Technologies Ltd. | 10,126,993 | 729,852 |
| Cisco Systems, Inc. | 27,230,000 | 676,665 |
| ASML Holding NV | 4,555,030 | 424,192 |
| ASML Holding NV (New York registered) | 2,481,000 | 231,403 |
| Texas Instruments Inc. | 12,280,300 | 586,876 |
| Intel Corp. | 12,000,000 | 370,800 |
| Analog Devices, Inc. | 6,799,000 | 367,622 |
| Amphenol Corp., Class A | 3,650,000 | 351,641 |
| salesforce.com, inc.1 | 4,430,000 | 257,294 |
| Intuit Inc. | 2,962,382 | 238,561 |
| Taiwan Semiconductor Manufacturing Co. Ltd. | 47,435,000 | 200,969 |
| Taiwan Semiconductor Manufacturing Co. Ltd. (ADR) | 1,200,000 | 25,668 |
| Baidu, Inc., Class A (ADR)1 | 985,000 | 184,008 |
| MasterCard Inc., Class A | 2,500,000 | 183,675 |
| LinkedIn Corp., Class A1 | 1,020,000 | 174,899 |
| Maxim Integrated Products, Inc. | 5,000,000 | 169,050 |
| Visa Inc., Class A | 750,000 | 158,032 |
| Murata Manufacturing Co., Ltd. | 1,455,000 | 136,172 |
| TE Connectivity Ltd. | 1,955,000 | 120,897 |
| ASM Pacific Technology Ltd. | 10,397,300 | 113,627 |
| Rackspace Hosting, Inc.1 | 3,172,700 | 106,793 |
| Concur Technologies, Inc.1 | 474,000 | 44,243 |
| | | 11,226,566 |
| | | |
| Industrials 13.89% | | |
| | | |
| Boeing Co. | 11,225,000 | 1,428,157 |
| Union Pacific Corp. | 13,230,000 | 1,319,692 |
| General Electric Co. | 35,050,000 | 921,114 |
| Common stocks | | |
| | | Value |
| Industrials (continued) | Shares | (000) |
| | | |
| Caterpillar Inc. | 7,025,000 | $ 763,407 |
| Airbus Group NV | 8,490,000 | 568,945 |
| Parker-Hannifin Corp. | 4,350,000 | 546,925 |
| Lockheed Martin Corp. | 3,113,200 | 500,385 |
| Rockwell Automation | 3,500,000 | 438,060 |
| Deere & Co. | 3,800,000 | 344,090 |
| Masco Corp. | 12,350,000 | 274,170 |
| Schneider Electric SE | 2,807,000 | 264,249 |
| Siemens AG | 2,000,000 | 264,138 |
| Iron Mountain Inc. | 6,319,011 | 224,009 |
| Honeywell International Inc. | 2,400,000 | 223,080 |
| Cummins Inc. | 1,410,000 | 217,549 |
| TransDigm Group Inc. | 1,260,000 | 210,748 |
| United Technologies Corp. | 1,725,000 | 199,151 |
| MTU Aero Engines AG | 1,835,346 | 168,858 |
| Fastenal Co. | 3,100,000 | 153,419 |
| Waste Management, Inc. | 3,400,000 | 152,082 |
| Grafton Group PLC, units2 | 15,037,000 | 149,259 |
| United Continental Holdings, Inc.1 | 3,600,000 | 147,852 |
| Meggitt PLC | 14,055,334 | 121,715 |
| Ryanair Holdings PLC (ADR)1 | 1,850,000 | 103,230 |
| Northrop Grumman Corp. | 740,000 | 88,526 |
| Adecco SA | 250,000 | 20,580 |
| | | 9,813,390 |
| | | |
| Health care 10.33% | | |
| | | |
| Merck & Co., Inc. | 22,285,000 | 1,289,187 |
| Gilead Sciences, Inc.1 | 9,643,790 | 799,567 |
| Vertex Pharmaceuticals Inc.1 | 6,215,000 | 588,436 |
| Express Scripts Holding Co.1 | 8,380,000 | 580,985 |
| Bristol-Myers Squibb Co. | 10,100,000 | 489,951 |
| AbbVie Inc. | 7,415,000 | 418,503 |
| Johnson & Johnson | 4,000,000 | 418,480 |
| Pfizer Inc. | 12,975,000 | 385,098 |
| Roche Holding AG | 1,234,000 | 368,057 |
| Edwards Lifesciences Corp.1 | 3,300,000 | 283,272 |
| Baxter International Inc. | 3,751,755 | 271,252 |
| Hologic, Inc.1 | 10,005,000 | 253,627 |
| Boston Scientific Corp.1 | 18,331,300 | 234,091 |
| Regeneron Pharmaceuticals, Inc.1 | 760,000 | 214,677 |
| Thermo Fisher Scientific Inc. | 1,400,000 | 165,200 |
| UnitedHealth Group Inc. | 1,852,000 | 151,401 |
| AstraZeneca PLC | 1,887,100 | 140,180 |
| Intuitive Surgical, Inc.1 | 243,000 | 100,067 |
| PerkinElmer, Inc. | 2,035,000 | 95,320 |
| Humana Inc. | 396,000 | 50,577 |
| | | 7,297,928 |
| | | |
| Energy 10.16% | | |
| | | |
| ConocoPhillips | 8,279,100 | 709,767 |
| Suncor Energy Inc. | 15,592,932 | 664,897 |
| Enbridge Inc. | 11,385,767 | 540,238 |
| Noble Energy, Inc. | 5,634,400 | 436,441 |
| Common stocks | | |
| | | Value |
| Energy (continued) | Shares | (000) |
| | | |
| Occidental Petroleum Corp. | 4,000,000 | $ 410,520 |
| Royal Dutch Shell PLC, Class B (ADR) | 4,663,834 | 405,800 |
| FMC Technologies, Inc.1 | 6,600,000 | 403,062 |
| Chevron Corp. | 3,016,137 | 393,757 |
| Baker Hughes Inc. | 5,000,000 | 372,250 |
| Concho Resources Inc.1 | 2,420,000 | 349,690 |
| Southwestern Energy Co.1 | 7,000,000 | 318,430 |
| Chesapeake Energy Corp. | 9,870,000 | 306,760 |
| Denbury Resources Inc. | 15,725,000 | 290,283 |
| Schlumberger Ltd. | 2,100,000 | 247,695 |
| EOG Resources, Inc. | 2,000,000 | 233,720 |
| Oceaneering International, Inc. | 2,449,764 | 191,400 |
| Peyto Exploration & Development Corp. | 3,977,500 | 150,258 |
| Kinder Morgan, Inc. | 3,990,000 | 144,678 |
| Murphy Oil Corp. | 2,140,000 | 142,267 |
| Phillips 66 | 1,670,000 | 134,318 |
| Pioneer Natural Resources Co. | 500,000 | 114,905 |
| Oil States International, Inc.1 | 1,467,000 | 94,020 |
| CONSOL Energy Inc. | 1,600,000 | 73,712 |
| Spectra Energy Corp | 1,300,000 | 55,224 |
| | | 7,184,092 |
| | | |
| Consumer staples 5.82% | | |
| | | |
| Philip Morris International Inc. | 15,820,000 | 1,333,784 |
| Procter & Gamble Co. | 8,160,000 | 641,294 |
| PepsiCo, Inc. | 5,000,000 | 446,700 |
| British American Tobacco PLC | 5,345,000 | 318,148 |
| Campbell Soup Co. | 6,000,000 | 274,860 |
| Wal-Mart Stores, Inc. | 2,850,000 | 213,950 |
| Herbalife Ltd. | 3,062,000 | 197,621 |
| Japan Tobacco Inc. | 4,705,000 | 171,517 |
| Costco Wholesale Corp. | 1,460,000 | 168,134 |
| Pernod Ricard SA | 1,150,000 | 138,101 |
| Altria Group, Inc. | 2,595,000 | 108,834 |
| Kimberly-Clark Corp. | 900,000 | 100,098 |
| | | 4,113,041 |
| | | |
| Materials 4.32% | | |
| | | |
| Potash Corp. of Saskatchewan Inc. | 16,688,300 | 633,488 |
| LyondellBasell Industries NV, Class A | 5,270,000 | 514,615 |
| FMC Corp. | 6,408,000 | 456,185 |
| E.I. du Pont de Nemours and Co. | 6,000,000 | 392,640 |
| Mosaic Co. | 5,500,000 | 271,975 |
| Monsanto Co. | 1,500,000 | 187,110 |
| Praxair, Inc. | 1,300,000 | 172,692 |
| MeadWestvaco Corp. | 3,660,000 | 161,992 |
| Rio Tinto PLC | 2,000,000 | 106,398 |
| Dow Chemical Co. | 1,858,318 | 95,629 |
| HudBay Minerals Inc. | 6,744,900 | 62,389 |
| | | 3,055,113 |
| | | |
| Telecommunication services 1.58% | | |
| | | |
| Verizon Communications Inc. | 9,921,369 | 485,452 |
| SoftBank Corp. | 4,195,000 | 312,353 |
| Common stocks | | |
| | | Value |
| Telecommunication services (continued) | Shares | (000) |
| | | |
| Deutsche Telekom AG | 12,800,000 | $ 224,346 |
| Orange | 6,000,000 | 94,687 |
| | | 1,116,838 |
| | | |
| Utilities 0.52% | | |
| | | |
| National Grid PLC | 11,065,000 | 159,068 |
| PG&E Corp. | 2,500,000 | 120,050 |
| FirstEnergy Corp. | 2,500,000 | 86,800 |
| | | 365,918 |
| Miscellaneous 2.07% | | |
| | | |
| Other common stocks in initial period of acquisition | | 1,459,481 |
| Total common stocks (cost: $44,289,165,000) | | 68,344,196 |
| | Principal amount | |
| Short-term securities 3.43% | (000) | |
| | | |
| Federal Home Loan Bank 0.04%–0.10% due 7/2/2014–9/3/2014 | $748,950 | 748,928 |
| Freddie Mac 0.06%–0.17% due 7/7/2014–6/11/2015 | 549,300 | 549,065 |
| Coca-Cola Co. 0.11%–0.17% due 7/10/2014–12/1/20143 | 156,300 | 156,259 |
| Fannie Mae 0.055%–0.14% due 9/8/2014–11/4/2014 | 141,800 | 141,788 |
| General Electric Capital Corp. 0.13%–0.16% due 8/5/2014–8/29/2014 | 100,000 | 99,990 |
| General Electric Co. 0.06% due 7/1/2014 | 29,700 | 29,700 |
| Emerson Electric Co. 0.09%–0.11% due 7/3/2014–7/23/20143 | 125,000 | 124,997 |
| Private Export Funding Corp. 0.12%–0.26% due 7/22/2014–1/22/20153 | 101,500 | 101,446 |
| Wal-Mart Stores, Inc. 0.09%–0.10% due 7/28/20143 | 84,200 | 84,197 |
| Federal Farm Credit Banks 0.11%–0.15% due 8/25/2014–3/30/2015 | 74,600 | 74,561 |
| Abbott Laboratories 0.09%–0.10% due 7/28/2014–9/3/20143 | 62,200 | 62,194 |
| Procter & Gamble Co. 0.09% due 8/12/20143 | 58,300 | 58,296 |
| United Parcel Service Inc. 0.13% due 1/2/20153 | 54,300 | 54,254 |
| Chevron Corp. 0.07% due 7/10/20143 | 35,600 | 35,599 |
| John Deere Bank SA 0.09% due 7/17/20143 | 19,760 | 19,759 |
| John Deere Financial Ltd. 0.09% due 7/16/20143 | 14,600 | 14,599 |
| Chariot Funding, LLC 0.26% due 1/26/20153 | 25,000 | 24,969 |
| Honeywell International Inc. 0.12% due 7/23/20143 | 19,600 | 19,599 |
| National Rural Utilities Cooperative Finance Corp. 0.09% due 7/7/2014 | 15,000 | 15,000 |
| Microsoft Corp. 0.09% due 8/27/20143 | 9,900 | 9,899 |
| Total short-term securities (cost: $2,424,964,000) | | 2,425,099 |
| Total investment securities (cost: $46,714,129,000) | | 70,769,295 |
| Other assets less liabilities | | (100,979) |
| Net assets | | $70,668,316 |
As permitted by U.S. Securities and Exchange Commission regulations, “Miscellaneous” securities include holdings in their first year of acquisition that have not previously been publicly disclosed.
1Security did not produce income during the last 12 months.
2Represents an affiliated company as defined under the Investment Company Act of 1940.
3Acquired in a transaction exempt from registration under section 4(2) of the Securities Act of 1933. May be resold in the U.S. in transactions exempt from registration, normally to qualified institutional buyers. The total value of all such securities was $766,067,000, which represented 1.08% of the net assets
of the fund.
Key to abbreviation
ADR = American Depositary Receipts
Investments are not FDIC-insured, nor are they deposits of or guaranteed by a bank or any other entity, so they may lose value.
Investors should carefully consider investment objectives, risks, charges and expenses. This and other important information is contained in the fund prospectus and summary prospectus, which can be obtained from your financial professional and should be read carefully before investing. You may also call American Funds Service Company (AFS) at (800) 421-4225 or visit the American Funds website at americanfunds.com.
MFGEFPX-010-0814O-S42154
ITEM 7 – Disclosure of Proxy Voting Policies and Procedures for Closed-End Management Investment Companies
Not applicable to this Registrant, insofar as the Registrant is not a closed-end management investment company.
ITEM 8 – Portfolio Managers of Closed-End Management Investment Companies
Not applicable to this Registrant, insofar as the Registrant is not a closed-end management investment company.
ITEM 9 – Purchases of Equity Securities by Closed-End Management Investment Company and Affiliated Purchasers
Not applicable to this Registrant, insofar as the Registrant is not a closed-end management investment company.
ITEM 10 – Submission of Matters to a Vote of Security Holders
There have been no material changes to the procedures by which shareholders may recommend nominees to the Registrant’s board of trustees since the Registrant last submitted a proxy statement to its shareholders. The procedures are as follows. The Registrant has a nominating and governance committee comprised solely of persons who are not considered ‘‘interested persons’’ of the Registrant within the meaning of the Investment Company Act of 1940, as amended. The committee periodically reviews such issues as the board’s composition, responsibilities, committees, compensation and other relevant issues, and recommends any appropriate changes to the full board of trustees. While the committee normally is able to identify from its own resources an ample number of qualified candidates, it will consider shareholder suggestions of persons to be considered as nominees to fill future vacancies on the board. Such suggestions must be sent in writing to the nominating and governance committee of the Registrant, c/o the Registrant’s Secretary, and must be accompanied by complete biographical and occupational data on the prospective nominee, along with a written consent of the prospective nominee for consideration of his or her name by the nominating and governance committee.
ITEM 11 – Controls and Procedures
| (a) | The Registrant’s Principal Executive Officer and Principal Financial Officer have concluded, based on their evaluation of the Registrant’s disclosure controls and procedures (as such term is defined in Rule 30a-3 under the Investment Company Act of 1940), that such controls and procedures are adequate and reasonably designed to achieve the purposes described in paragraph (c) of such rule. |
| | |
| (b) | There were no changes in the Registrant’s internal controls over financial reporting (as defined in Rule 30a-3(d) under the Investment Company Act of 1940) that occurred during the Registrant’s second fiscal quarter of the period covered by this report that has materially affected, or is reasonably likely to materially affect, the Registrant’s internal control over financial reporting. |
ITEM 12 – Exhibits
| (a)(1) | Not applicable for filing of semi-annual reports to shareholders. |
| | |
| (a)(2) | The certifications required by Rule 30a-2 of the Investment Company Act of 1940 and Sections 302 and 906 of the Sarbanes-Oxley Act of 2002 are attached as exhibits hereto. |
SIGNATURES
Pursuant to the requirements of the Securities Exchange Act of 1934 and the Investment Company Act of 1940, the Registrant has duly caused this report to be signed on its behalf by the undersigned, thereunto duly authorized.
| | AMERICAN FUNDS FUNDAMENTAL INVESTORS |
| | |
| | By /s/ Paul F. Roye |
| | Paul F. Roye, Executive Vice President and Principal Executive Officer |
| | |
| | Date: August 29, 2014 |
Pursuant to the requirements of the Securities Exchange Act of 1934 and the Investment Company Act of 1940, this report has been signed below by the following persons on behalf of the Registrant and in the capacities and on the dates indicated.
| By /s/ Paul F. Roye |
Paul F. Roye, Executive Vice President and Principal Executive Officer |
| |
| Date: August 29, 2014 |
| By /s/ Jeffrey P. Regal |
Jeffrey P. Regal, Treasurer and Principal Financial Officer |
| |
| Date: August 29, 2014 |