UNITED STATES
SECURITIES AND EXCHANGE COMMISSION
Washington, D.C. 20549
FORM N-CSR
Certified Shareholder Report of
Registered Management Investment Companies
Investment Company Act File Number: 811-00032
American Funds Fundamental Investors
(Exact Name of Registrant as Specified in Charter)
6455 Irvine Center Drive
Irvine, California 92618
(Address of Principal Executive Offices)
Registrant's telephone number, including area code: (213) 486-9200
Date of fiscal year end: December 31
Date of reporting period: June 30, 2016
Michael W. Stockton
American Funds Fundamental Investors
333 South Hope Street
Los Angeles, California 90071
(Name and Address of Agent for Service)
ITEM 1 – Reports to Stockholders

 | Fundamental Investors® Semi-annual report
for the six months ended
June 30, 2016 |
Fundamental Investors seeks long-term growth of capital and income.
This fund is one of more than 40 offered by one of the nation’s largest mutual fund families, American Funds, from Capital Group. For 85 years, Capital has invested with a long-term focus based on thorough research and attention to risk.
Fund results shown in this report, unless otherwise indicated, are for Class A shares at net asset value. If a sales charge (maximum 5.75%) had been deducted, the results would have been lower. Results are for past periods and are not predictive of results for future periods. Current and future results may be lower or higher than those shown. Share prices and returns will vary, so investors may lose money. Investing for short periods makes losses more likely. Investments are not FDIC-insured, nor are they deposits of or guaranteed by a bank or any other entity, so they may lose value. For current information and month-end results, visit americanfunds.com.
Here are the average annual total returns on a $1,000 investment with all distributions reinvested for periods ended June 30, 2016:
| Class A shares | | 1 year | | 5 years | | 10 years |
| | | | | | | |
| Reflecting 5.75% maximum sales charge | | –1.64% | | 9.45% | | 6.64% |
For other share class results, visit americanfunds.com and americanfundsretirement.com.
The total annual fund operating expense ratio was 0.60% for Class A shares as of the prospectus dated March 1, 2016.
Investment results assume all distributions are reinvested and reflect applicable fees and expenses. When applicable, investment results reflect fee waivers, without which results would have been lower. Visit americanfunds.com for more information.
The fund’s 30-day yield for Class A shares as of July 31, 2016, calculated in accordance with the U.S. Securities and Exchange Commission (SEC) formula, was 1.40%. The fund’s 12-month distribution rate for Class A shares as of that date was 1.30%. Both reflect the 5.75% maximum sales charge. The SEC yield reflects the rate at which the fund is earning income on its current portfolio of securities while the distribution rate reflects the fund’s past dividends paid to shareholders. Accordingly, the fund’s SEC yield and distribution rate may differ.
Investing outside the United States may be subject to risks, such as currency fluctuations, periods of illiquidity and price volatility. These risks may be heightened in connection with investments in developing countries. Refer to the fund prospectus and the Risk Factors section of this report for more information on these and other risks associated with investing in the fund.

Fellow investors:
For the six months ended June 30, 2016, Fundamental Investors gained 3.91%. This return includes the reinvestment of capital gain distributions and quarterly dividends totaling 71.0 cents a share paid during the period.
The fund’s results were slightly ahead of its primary benchmark, the unmanaged Standard & Poor’s 500 Composite Index, a market capitalization-weighted index based on the results of 500 widely held common stocks, which rose 3.84% for the six months. Fundamental Investors’ return was greater than that of its growth-and-income peers, which were up 3.01% as measured by the Lipper Growth and Income Funds Index.
Results at a glance
For periods ended June 30, 2016, with all distributions reinvested
| | | Cumulative total returns | | Average annual total returns |
| | | 6 months | | 1 year | | 5 years | | 10 years | | Lifetime
(since 8/1/78)1 |
| | | | | | | | | | | | | | | | |
| Fundamental Investors (Class A shares) | | | 3.91 | % | | | 4.35 | % | | | 10.76 | % | | | 7.28 | % | | | 12.29 | % |
| Standard & Poor’s 500 Composite Index2 | | | 3.84 | | | | 3.99 | | | | 12.10 | | | | 7.42 | | | | 11.45 | |
| Lipper Growth and Income Funds Index3 | | | 3.01 | | | | –0.56 | | | | 8.52 | | | | 5.39 | | | | 10.42 | |
| MSCI World Index2,4 | | | 0.66 | | | | –2.78 | | | | 6.63 | | | | 4.43 | | | | 9.31 | |
| | |
| 1 | Date Capital Research and Management Company began managing the fund. |
| 2 | The market indexes are unmanaged and, therefore, have no expenses. Investors cannot invest directly in an index. |
| 3 | Lipper indexes track the largest mutual funds (no more than 30), represented by one share class per fund, in the corresponding Lipper category. |
| 4 | Results reflect dividends net of withholding taxes. |
The fund’s results have bested those of its Lipper peers in multiple periods since its inception. In addition, Fundamental Investors has outpaced the S&P 500 over its lifetime. Although the annual advantages might seem small, when compounded over longer time frames, they have translated into significant added wealth for long-term investors.
Moderate U.S. gains against a volatile backdrop
U.S. stocks rose during the period despite market volatility. Concerns over tepid growth and falling oil prices sent markets lower in January. The S&P 500 fell more than 10% into a correction by early February, but stocks then began to recover on reassuring domestic economic data heading into March.
The steady improvement in housing and more stable oil prices counterbalanced concerns over sluggish global growth and sharp decreases in commodity prices earlier in the year. In June, the Federal Reserve elected to keep interest rates unchanged, continuing its cautious monetary policy and easing anxieties about the domestic interest rate environment.
Non-U.S. assets outpace international market weakness
Fundamental Investors is able to invest up to 35% of its assets in companies based outside of the U.S. As of June 30, 2016, these holdings remained near the lowest levels in a decade at 10% of assets, although we continue to pay close attention to well-valued companies domiciled abroad. During the period, Europe and Japan continued to struggle with deflationary pressures and weak economic activity. However, the fund’s non-U.S. holdings outpaced international market weakness with returns in line with the fund’s results.
European stocks declined after British voters approved a ballot measure to leave the European Union, raising questions about EU stability and the potential for an economic downturn. Equity markets fell sharply following the June 23 referendum, and the pound sterling plunged to levels not seen since the 1980s. However, markets staged a strong bounce-back rally in the final few days of the quarter, erasing some of the global declines in stock prices.
Japan was among the worst-returning developed equity markets, declining 5.58% during the period. The Bank of Japan’s mid-June decision to keep its monetary stimulus plan steady caused a steep selloff in Japanese stocks and pushed the yen to its highest point against the dollar in almost two years.
| Fundamental Investors’ 10 largest holdings | | (as of June 30, 2016) |
| | | |
| Company | | Percent of net assets |
| Amazon | | | 4.18 | % |
| Microsoft | | | 3.85 | |
| Philip Morris International | | | 3.41 | |
| Broadcom | | | 2.70 | |
| Home Depot | | | 2.39 | |
| Comcast | | | 2.35 | |
| General Electric | | | 1.75 | |
| Boeing | | | 1.65 | |
| JPMorgan Chase | | | 1.56 | |
| Taiwan Semiconductor Manufacturing | | | 1.50 | |
Commodity crosscurrents
Adding to the volatile market backdrop were swings in commodity prices. After declining 29.67% to $26.05 per barrel by early February, U.S. crude oil prices staged a turnaround, gaining 85.80% to end the six-month period 30.67% higher at $48.40 a barrel.
Copper also rebounded significantly, rising on signs of stabilization in the economic outlook for China and other emerging markets. Resource-dependent markets broadly gained as commodity prices recovered from sharp declines.
Companies over themes
We continue to note that the fund’s portfolio is carefully constructed based on the value and merits of individual companies rather than around an overarching macroeconomic theme or investment thesis.
This company-by-company approach can be seen in the fund’s 10 largest holdings, which span a wide range of industries. Returns from three of these companies contributed to the fund outpacing both its benchmark and peers, including Philip Morris International (+15.71%), Comcast (+15.52%) and Amazon (+5.88%).
Energy stocks buoy results; health care drags
The positive returns of energy stocks and the declines in shares in the health care sector represent a reversal in the sectors’ results compared with the six-month period a year earlier, when health care led and energy lagged.
Following a precipitous drop that began in mid-2014, oil prices have risen recently, supporting gains in the energy sector. Royal Dutch Shell (+21.28%), Chevron (+16.53%) and Schlumberger (+13.38%) were all key contributors. We took advantage of the weakness in stocks to buy solid companies at attractive prices and add to our exposure to the sector while commodities were under pressure.
Health care companies weighed on the fund’s results. Regeneron Pharmaceuticals (–35.67%), Vertex Pharmaceuticals (–31.64%) and Express Scripts (–13.28%) were among the biggest detractors as drug pricing came under increased scrutiny.
A consistent approach with a long-term focus
The fund’s results reflect the fact that at the individual holding level, the path to solid long-term results seldom moves steadily upward. A superior track record tends to be built using an investment approach that centers on the merits of the underlying company rather than near-term moves in its stock price, short-term company operating results, instances of market turmoil or market-moving world events.
Looking ahead, the U.S. economy remains one of the bright spots in the world despite volatile equity markets and potential headwinds overseas. In addition, the results of the recent U.K. referendum make it unlikely that the European Central Bank or the Bank of England will raise interest rates any time soon, which should be supportive going forward.
With our emphasis on companies, we continue to uncover opportunities in the U.S. and abroad for shareholders with the patience to remain invested during challenging environments.
We thank you for your continued commitment to Fundamental Investors.
Sincerely,
 |  |
Dina N. Perry
Vice Chairman | Brady L. Enright
President |
August 12, 2016
For current information about the fund, visit americanfunds.com.
| Summary investment portfolio June 30, 2016 | unaudited |
| | |
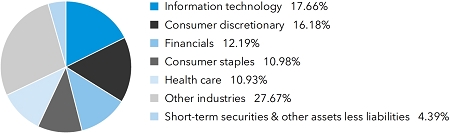
| Industry sector diversification | Percent of net assets |
| Country diversification by domicile | | Percent of
net assets | |
| United States | | | 85.71 | % |
| United Kingdom | | | 2.75 | |
| Euro zone* | | | 2.17 | |
| Canada | | | 1.64 | |
| Taiwan | | | 1.50 | |
| Switzerland | | | 0.61 | |
| Japan | | | 0.60 | |
| China | | | 0.41 | |
| Sweden | | | 0.18 | |
| Other countries | | | 0.04 | |
| Short-term securities & other assets less liabilities | | | 4.39 | |
| | |
| * | Countries using the euro as a common currency; those represented in the fund’s portfolio are France, Germany, Ireland and the Netherlands. |
| | |
| Common stocks 95.61% | | Shares | | | Value
(000) | |
| Information technology 17.66% | | | | | | | | |
| Microsoft Corp. | | | 56,741,000 | | | $ | 2,903,437 | |
| Broadcom Ltd. | | | 13,107,132 | | | | 2,036,848 | |
| Taiwan Semiconductor Manufacturing Co., Ltd.1 | | | 190,310,000 | | | | 962,315 | |
| Taiwan Semiconductor Manufacturing Co., Ltd. (ADR) | | | 6,438,430 | | | | 168,880 | |
| Texas Instruments Inc. | | | 17,150,300 | | | | 1,074,466 | |
| Intel Corp. | | | 26,657,073 | | | | 874,352 | |
| Alphabet Inc., Class C2 | | | 754,317 | | | | 522,063 | |
| Alphabet Inc., Class A2 | | | 442,800 | | | | 311,523 | |
| ASML Holding NV1 | | | 5,230,030 | | | | 518,417 | |
| ASML Holding NV (New York registered) | | | 3,141,000 | | | | 311,618 | |
| Apple Inc. | | | 6,505,000 | | | | 621,878 | |
| Visa Inc., Class A | | | 7,750,000 | | | | 574,818 | |
| Intuit Inc. | | | 4,180,000 | | | | 466,530 | |
| Other securities | | | | | | | 1,961,474 | |
| | | | | | | | 13,308,619 | |
| Common stocks (continued) | | Shares | | | Value
(000) | |
| Consumer discretionary 16.18% | | | | | | | | |
| Amazon.com, Inc.2 | | | 4,404,800 | | | $ | 3,152,163 | |
| Home Depot, Inc. | | | 14,110,000 | | | | 1,801,706 | |
| Comcast Corp., Class A | | | 27,211,000 | | | | 1,773,885 | |
| McDonald’s Corp. | | | 6,340,000 | | | | 762,956 | |
| Time Warner Inc. | | | 6,600,000 | | | | 485,364 | |
| Other securities | | | | | | | 4,213,803 | |
| | | | | | | | 12,189,877 | |
| | | | | | | | | |
| Financials 12.19% | | | | | | | | |
| JPMorgan Chase & Co. | | | 18,891,400 | | | | 1,173,912 | |
| Berkshire Hathaway Inc., Class A2 | | | 4,625 | | | | 1,003,509 | |
| Wells Fargo & Co. | | | 17,435,000 | | | | 825,199 | |
| CME Group Inc., Class A | | | 6,371,437 | | | | 620,578 | |
| SunTrust Banks, Inc. | | | 14,564,097 | | | | 598,293 | |
| Capital One Financial Corp. | | | 9,212,000 | | | | 585,054 | |
| Chubb Ltd. | | | 4,350,000 | | | | 568,588 | |
| BlackRock, Inc. | | | 1,363,100 | | | | 466,903 | |
| Other securities | | | | | | | 3,342,325 | |
| | | | | | | | 9,184,361 | |
| | | | | | | | | |
| Consumer staples 10.98% | | | | | | | | |
| Philip Morris International Inc. | | | 25,295,000 | | | | 2,573,007 | |
| Coca-Cola Co. | | | 20,285,000 | | | | 919,519 | |
| Procter & Gamble Co. | | | 10,275,000 | | | | 869,984 | |
| Kroger Co. | | | 18,879,000 | | | | 694,559 | |
| Reynolds American Inc. | | | 12,816,340 | | | | 691,185 | |
| Walgreens Boots Alliance, Inc. | | | 5,856,000 | | | | 487,629 | |
| Other securities | | | | | | | 2,032,943 | |
| | | | | | | | 8,268,826 | |
| | | | | | | | | |
| Health care 10.93% | | | | | | | | |
| Medtronic PLC | | | 12,705,000 | | | | 1,102,413 | |
| Merck & Co., Inc. | | | 17,710,000 | | | | 1,020,273 | |
| UnitedHealth Group Inc. | | | 5,501,500 | | | | 776,812 | |
| Boston Scientific Corp.2 | | | 31,600,000 | | | | 738,492 | |
| Express Scripts Holding Co.2 | | | 7,856,333 | | | | 595,510 | |
| Bristol-Myers Squibb Co. | | | 7,698,300 | | | | 566,210 | |
| Aetna Inc. | | | 4,242,000 | | | | 518,075 | |
| Vertex Pharmaceuticals Inc.2 | | | 5,925,000 | | | | 509,668 | |
| Gilead Sciences, Inc. | | | 5,698,790 | | | | 475,393 | |
| Other securities | | | | | | | 1,929,846 | |
| | | | | | | | 8,232,692 | |
| | | | | | | | | |
| Industrials 10.18% | | | | | | | | |
| General Electric Co. | | | 41,830,000 | | | | 1,316,808 | |
| Boeing Co. | | | 9,595,000 | | | | 1,246,103 | |
| Lockheed Martin Corp. | | | 3,283,200 | | | | 814,792 | |
| Parker-Hannifin Corp. | | | 4,550,000 | | | | 491,628 | |
| Union Pacific Corp. | | | 5,575,000 | | | | 486,419 | |
| Other securities | | | | | | | 3,315,042 | |
| | | | | | | | 7,670,792 | |
| | | Shares | | | Value
(000) | |
| Energy 9.01% | | | | | | | | |
| Schlumberger Ltd. | | | 14,028,400 | | | $ | 1,109,366 | |
| ConocoPhillips | | | 16,710,000 | | | | 728,556 | |
| Chevron Corp. | | | 5,726,137 | | | | 600,271 | |
| Enbridge Inc. (CAD denominated) | | | 11,984,914 | | | | 507,709 | |
| Other securities | | | | | | | 3,845,692 | |
| | | | | | | | 6,791,594 | |
| | | | | | | | | |
| Materials 3.17% | | | | | | | | |
| E.I. du Pont de Nemours and Co. | | | 17,046,125 | | | | 1,104,589 | |
| Praxair, Inc. | | | 7,155,000 | | | | 804,150 | |
| Other securities | | | | | | | 479,314 | |
| | | | | | | | 2,388,053 | |
| | | | | | | | | |
| Other 1.04% | | | | | | | | |
| Other securities | | | | | | | 786,714 | |
| | | | | | | | | |
| Miscellaneous 4.27% | | | | | | | | |
| Other common stocks in initial period of acquisition | | | | | | | 3,218,559 | |
| | | | | | | | | |
| Total common stocks (cost: $49,328,163,000) | | | | | | | 72,040,087 | |
| | | | | | | | | |
| Short-term securities 4.37% | | Principal amount
(000) | | | | | |
| Alphabet Inc. 0.41% due 8/11/20163 | | $ | 50,000 | | | | 49,977 | |
| Apple Inc. 0.40%–0.51% due 7/1/2016–9/12/20163 | | | 226,700 | | | | 226,643 | |
| Coca-Cola Co. 0.50% due 7/12/20163 | | | 70,000 | | | | 69,992 | |
| Federal Home Loan Bank 0.26%–0.59% due 7/5/2016–2/16/2017 | | | 1,502,270 | | | | 1,501,574 | |
| Intel Corp. 0.41% due 8/30/2016 | | | 13,200 | | | | 13,190 | |
| Jupiter Securitization Co., LLC 1.00% due 10/18/20163 | | | 25,500 | | | | 25,444 | |
| Microsoft Corp. 0.45%–0.47% due 8/3/2016–10/5/20163 | | | 110,700 | | | | 110,602 | |
| Wells Fargo Bank, N.A. 0.81% due 8/16/2016 | | | 30,500 | | | | 30,508 | |
| Other securities | | | | | | | 1,266,410 | |
| | | | | | | | | |
| Total short-term securities (cost: $3,293,924,000) | | | | | | | 3,294,340 | |
| Total investment securities 99.98% (cost: $52,622,087,000) | | | | | | | 75,334,427 | |
| Other assets less liabilities 0.02% | | | | | | | 18,493 | |
| | | | | | | | | |
| Net assets 100.00% | | | | | | $ | 75,352,920 | |
This summary investment portfolio is designed to streamline the report and help investors better focus on the fund’s principal holdings. See the inside back cover for details on how to obtain a complete schedule of portfolio holdings.
As permitted by U.S. Securities and Exchange Commission regulations, “Miscellaneous” securities include holdings in their first year of acquisition that have not previously been publicly disclosed.
“Other securities” includes all issues that are not disclosed separately in the summary investment portfolio.
Investments in affiliates
A company is an affiliate of the fund under the Investment Company Act of 1940 if the fund’s holdings in that company represent 5% or more of the outstanding voting shares. The value of the fund’s holdings in affiliated companies is included in “Other securities” under the respective industry sectors in the summary investment portfolio. Further details on these holdings and related transactions during the six months ended June 30, 2016, appear below.
| | | | | | | | | | | | | | | | | | Value of | |
| | | | | | | | | | | | | | | Dividend | | | affiliates at | |
| | | Beginning | | | | | | | | | Ending | | | income | | | 6/30/2016 | |
| | | shares | | | Additions | | | Reductions | | | shares | | | (000) | | | (000) | |
| Peyto Exploration & Development Corp. | | | 10,332,287 | | | | — | | | | — | | | | 10,332,287 | | | $ | 5,146 | | | $ | 277,351 | |
| CNO Financial Group, Inc. | | | 11,900,000 | | | | — | | | | — | | | | 11,900,000 | | | | 1,785 | | | | 207,774 | |
| Grafton Group PLC, units1 | | | 15,037,000 | | | | — | | | | — | | | | 15,037,000 | | | | 1,716 | | | | 99,650 | |
| FMC Corp.4 | | | 6,758,000 | | | | — | | | | 1,345,928 | | | | 5,412,072 | | | | 2,012 | | | | — | |
| | | | | | | | | | | | | | | | | | | $ | 10,659 | | | $ | 584,775 | |
The following footnotes apply to either the individual securities noted or one or more of the securities aggregated and listed as a single line item.
| 1 | Valued under fair value procedures adopted by authority of the board of trustees. The total value of all such securities, including those in “Miscellaneous” and “Other securities,” was $4,627,304,000, which represented 6.14% of the net assets of the fund. This entire amount relates to certain securities trading outside the U.S. whose values were adjusted as a result of significant market movements following the close of local trading. |
| 2 | Security did not produce income during the last 12 months. |
| 3 | Acquired in a transaction exempt from registration under Section 4(2) of the Securities Act of 1933. May be resold in the U.S. in transactions exempt from registration, normally to qualified institutional buyers. The total value of all such securities, including those in “Other securities,” was $1,082,171,000, which represented 1.44% of the net assets of the fund. |
| 4 | Unaffiliated issuer at 6/30/2016. |
Key to abbreviations
ADR = American Depositary Receipts
CAD = Canadian dollars
See Notes to Financial Statements
Financial statements
| Statement of assets and liabilities | unaudited |
| at June 30, 2016 | (dollars in thousands) |
| | |
| Assets: | | | | | | | | |
| Investment securities, at value: | | | | | | | | |
| Unaffiliated issuers (cost: $52,092,142) | | $ | 74,749,652 | | | | | |
| Affiliated issuers (cost: $529,945) | | | 584,775 | | | $ | 75,334,427 | |
| Cash | | | | | | | 2,024 | |
| Cash denominated in currencies other than U.S. dollars (cost: $1,951) | | | | | | | 1,940 | |
| Receivables for: | | | | | | | | |
| Sales of investments | | | 110,452 | | | | | |
| Sales of fund’s shares | | | 91,458 | | | | | |
| Dividends and interest | | | 143,710 | | | | | |
| Other | | | 87 | | | | 345,707 | |
| | | | | | | | 75,684,098 | |
| Liabilities: | | | | | | | | |
| Payables for: | | | | | | | | |
| Purchases of investments | | | 197,433 | | | | | |
| Repurchases of fund’s shares | | | 90,087 | | | | | |
| Investment advisory services | | | 15,081 | | | | | |
| Services provided by related parties | | | 15,359 | | | | | |
| Trustees’ deferred compensation | | | 3,967 | | | | | |
| Other | | | 9,251 | | | | 331,178 | |
| Net assets at June 30, 2016 | | | | | | $ | 75,352,920 | |
| |
| Net assets consist of: | | | | | | | | |
| Capital paid in on shares of beneficial interest | | | | | | $ | 50,835,939 | |
| Undistributed net investment income | | | | | | | 373,907 | |
| Undistributed net realized gain | | | | | | | 1,430,658 | |
| Net unrealized appreciation | | | | | | | 22,712,416 | |
| Net assets at June 30, 2016 | | | | | | $ | 75,352,920 | |
See Notes to Financial Statements
(dollars and shares in thousands, except per-share amounts)
Shares of beneficial interest issued and outstanding (no stated par value) —
unlimited shares authorized (1,450,524 total shares outstanding)
| | | Net assets | | | Shares
outstanding | | | Net asset value
per share | |
| Class A | | $ | 45,851,376 | | | | 882,283 | | | $ | 51.97 | |
| Class B | | | 109,601 | | | | 2,111 | | | | 51.93 | |
| Class C | | | 2,414,385 | | | | 46,677 | | | | 51.73 | |
| Class F-1 | | | 2,621,848 | | | | 50,474 | | | | 51.94 | |
| Class F-2 | | | 6,998,305 | | | | 134,700 | | | | 51.95 | |
| Class 529-A | | | 1,870,226 | | | | 36,031 | | | | 51.91 | |
| Class 529-B | | | 10,293 | | | | 198 | | | | 52.05 | |
| Class 529-C | | | 463,469 | | | | 8,939 | | | | 51.85 | |
| Class 529-E | | | 75,746 | | | | 1,461 | | | | 51.86 | |
| Class 529-F-1 | | | 85,291 | | | | 1,644 | | | | 51.87 | |
| Class R-1 | | | 147,053 | | | | 2,843 | | | | 51.73 | |
| Class R-2 | | | 737,485 | | | | 14,260 | | | | 51.72 | |
| Class R-2E | | | 10,199 | | | | 197 | | | | 51.80 | |
| Class R-3 | | | 2,173,513 | | | | 41,917 | | | | 51.85 | |
| Class R-4 | | | 2,247,031 | | | | 43,319 | | | | 51.87 | |
| Class R-5E | | | 10 | | | | — | * | | | 51.94 | |
| Class R-5 | | | 1,715,325 | | | | 32,987 | | | | 52.00 | |
| Class R-6 | | | 7,821,764 | | | | 150,483 | | | | 51.98 | |
*Amount less than one thousand.
See Notes to Financial Statements
| Statement of operations | unaudited |
| for the six months ended June 30, 2016 | (dollars in thousands) |
| | |
| Investment income: | | | | | | | | |
| Income: | | | | | | | | |
| Dividends (net of non-U.S. taxes of $19,560;also includes $10,659 from affiliates) | | $ | 825,404 | | | | | |
| Interest | | | 6,846 | | | $ | 832,250 | |
| |
| Fees and expenses*: | | | | | | | | |
| Investment advisory services | | | 87,955 | | | | | |
| Distribution services | | | 83,392 | | | | | |
| Transfer agent services | | | 36,097 | | | | | |
| Administrative services | | | 9,103 | | | | | |
| Reports to shareholders | | | 1,813 | | | | | |
| Registration statement and prospectus | | | 1,539 | | | | | |
| Trustees’ compensation | | | 302 | | | | | |
| Auditing and legal | | | 63 | | | | | |
| Custodian | | | 591 | | | | | |
| Other | | | 1,176 | | | | 222,031 | |
| Net investment income | | | | | | | 610,219 | |
| |
| Net realized gain and unrealized appreciation: | | | | | | | | |
| Net realized gain (loss) on: | | | | | | | | |
| Investments (includes $10,591 net loss from affiliates) | | | 1,415,168 | | | | | |
| Currency transactions | | | (3,881 | ) | | | 1,411,287 | |
| Net unrealized appreciation on: | | | | | | | | |
| Investments | | | 820,726 | | | | | |
| Currency translations | | | 398 | | | | 821,124 | |
| Net realized gain and unrealized appreciation | | | | | | | 2,232,411 | |
| Net increase in net assets resulting from operations | | | | | | $ | 2,842,630 | |
*Additional information related to class-specific fees and expenses is included in the Notes to Financial Statements.
See Notes to Financial Statements
Statements of changes in net assets
(dollars in thousands)
| | | Six months ended
June 30, 2016* | | | Year ended
December 31, 2015 | |
| Operations: | | | | | | | | |
| Net investment income | | $ | 610,219 | | | $ | 1,053,717 | |
| Net realized gain | | | 1,411,287 | | | | 3,176,138 | |
| Net unrealized appreciation (depreciation) | | | 821,124 | | | | (1,817,473 | ) |
| Net increase in net assets resulting from operations | | | 2,842,630 | | | | 2,412,382 | |
| |
| Dividends and distributions paid to shareholders: | | | | | | | | |
| Dividends from net investment income | | | (428,114 | ) | | | (1,043,315 | ) |
| Distributions from net realized gain on investments | | | (589,412 | ) | | | (3,203,313 | ) |
| Total dividends and distributions paid to shareholders | | | (1,017,526 | ) | | | (4,246,628 | ) |
| |
| Net capital share transactions | | | 763,442 | | | | 2,915,001 | |
| |
| Total increase in net assets | | | 2,588,546 | | | | 1,080,755 | |
| |
| Net assets: | | | | | | | | |
| Beginning of period | | | 72,764,374 | | | | 71,683,619 | |
| End of period (including undistributed net investment income: $373,907 and $191,802, respectively) | | $ | 75,352,920 | | | $ | 72,764,374 | |
*Unaudited.
See Notes to Financial Statements
| Notes to financial statements | unaudited |
1. Organization
American Funds Fundamental Investors (the “trust”) is registered under the Investment Company Act of 1940 as an open-end, diversified management investment company and has initially issued one series of shares, Fundamental Investors (the “fund”). The fund seeks long-term growth of capital and income.
The fund has 18 share classes consisting of five retail share classes (Classes A, B and C, as well as two F share classes, F-1 and F-2), five 529 college savings plan share classes (Classes 529-A, 529-B, 529-C, 529-E and 529-F-1) and eight retirement plan share classes (Classes R-1, R-2, R-2E, R-3, R-4, R-5E, R-5 and R-6). The 529 college savings plan share classes can be used to save for college education. The retirement plan share classes are generally offered only through eligible employer-sponsored retirement plans. The fund’s share classes are described further in the following table:
| Share class | | Initial sales charge | | Contingent deferred sales
charge upon redemption | | Conversion feature | |
| Classes A and 529-A | | Up to 5.75% | | None (except 1% for certain redemptions within one year of purchase without an initial sales charge) | | None | |
| Classes B and 529-B* | | None | | Declines from 5% to 0% for redemptions within six years of purchase | | Classes B and 529-B convert to Classes A and 529-A, respectively, after eight years | |
| Class C | | None | | 1% for redemptions within one year of purchase | | Class C converts to Class F-1 after 10 years | |
| Class 529-C | | None | | 1% for redemptions within one year of purchase | | None | |
| Class 529-E | | None | | None | | None | |
| Classes F-1, F-2 and 529-F-1 | | None | | None | | None | |
| Classes R-1, R-2, R-2E, R-3, R-4, R-5E, R-5 and R-6 | | None | | None | | None | |
*Class B and 529-B shares of the fund are not available for purchase.
Holders of all share classes have equal pro rata rights to the assets, dividends and liquidation proceeds of the fund. Each share class has identical voting rights, except for the exclusive right to vote on matters affecting only its class. Share classes have different fees and expenses (“class-specific fees and expenses”), primarily due to different arrangements for distribution, transfer agent and administrative services. Differences in class-specific fees and expenses will result in differences in net investment income and, therefore, the payment of different per-share dividends by each share class.
2. Significant accounting policies
The fund is an investment company that applies the accounting and reporting guidance issued in Topic 946 by the U.S. Financial Accounting Standards Board. The fund’s financial statements have been prepared to comply with U.S. generally accepted accounting principles (“U.S. GAAP”). These principles require the fund’s investment adviser to make estimates and assumptions that affect reported amounts and disclosures. Actual results could differ from those estimates. Subsequent events, if any, have been evaluated through the date of issuance in the preparation of the financial statements. The fund follows the significant accounting policies described in this section, as well as the valuation policies described in the next section on valuation.
Security transactions and related investment income — Security transactions are recorded by the fund as of the date the trades are executed with brokers. Realized gains and losses from security transactions are determined based on the specific identified cost of the securities. In the event a security is purchased with a delayed payment date, the fund will segregate liquid assets sufficient to meet its payment obligations. Dividend income is recognized on the ex-dividend date and interest income is recognized on an accrual basis. Market discounts, premiums and original issue discounts on fixed-income securities are amortized daily over the expected life of the security.
Class allocations — Income, fees and expenses (other than class-specific fees and expenses) and realized and unrealized gains and losses are allocated daily among the various share classes based on their relative net assets. Class-specific fees and expenses, such as distribution, transfer agent and administrative services, are charged directly to the respective share class.
Dividends and distributions to shareholders — Dividends and distributions to shareholders are recorded on the ex-dividend date.
Currency translation — Assets and liabilities, including investment securities, denominated in currencies other than U.S. dollars are translated into U.S. dollars at the exchange rates supplied by one or more pricing vendors on the valuation date. Purchases and sales of investment securities and income and expenses are translated into U.S. dollars at the exchange rates on the dates of such transactions. The effects of changes in exchange rates on investment securities are included with the net realized gain or loss and net unrealized appreciation or depreciation on investments in the fund’s statement of operations. The realized gain or loss and unrealized appreciation or depreciation resulting from all other transactions denominated in currencies other than U.S. dollars are disclosed separately.
3. Valuation
Capital Research and Management Company (“CRMC”), the fund’s investment adviser, values the fund’s investments at fair value as defined by U.S. GAAP. The net asset value of each share class of the fund is generally determined as of approximately 4:00 p.m. New York time each day the New York Stock Exchange is open.
Methods and inputs — The fund’s investment adviser uses the following methods and inputs to establish the fair value of the fund’s assets and liabilities. Use of particular methods and inputs may vary over time based on availability and relevance as market and economic conditions evolve.
Equity securities are generally valued at the official closing price of, or the last reported sale price on, the exchange or market on which such securities are traded, as of the close of business on the day the securities are being valued or, lacking any sales, at the last available bid price. Prices for each security are taken from the principal exchange or market on which the security trades.
Fixed-income securities, including short-term securities, are generally valued at prices obtained from one or more pricing vendors. Vendors value such securities based on one or more of the inputs described in the following table. The table provides examples of inputs that are commonly relevant for valuing particular classes of fixed-income securities in which the fund is authorized to invest. However, these classifications are not exclusive, and any of the inputs may be used to value any other class of fixed-income security.
| Fixed-income class | Examples of standard inputs |
| All | Benchmark yields, transactions, bids, offers, quotations from dealers and trading systems, new issues, spreads and other relationships observed in the markets among comparable securities; and proprietary pricing models such as yield measures calculated using factors such as cash flows, financial or collateral performance and other reference data (collectively referred to as “standard inputs”) |
| Corporate bonds & notes; convertible securities | Standard inputs and underlying equity of the issuer |
| Bonds & notes of governments & government agencies | Standard inputs and interest rate volatilities |
| Mortgage-backed; asset-backed obligations | Standard inputs and cash flows, prepayment information, default rates, delinquency and loss assumptions, collateral characteristics, credit enhancements and specific deal information |
When the fund’s investment adviser deems it appropriate to do so (such as when vendor prices are unavailable or deemed to be not representative), fixed-income securities will be valued in good faith at the mean quoted bid and ask prices that are reasonably and timely available (or bid prices, if ask prices are not available) or at prices for securities of comparable maturity, quality and type.
Securities with both fixed-income and equity characteristics, or equity securities traded principally among fixed-income dealers, are generally valued in the manner described above for either equity or fixed-income securities, depending on which method is deemed most appropriate by the fund’s investment adviser.
Securities and other assets for which representative market quotations are not readily available or are considered unreliable by the fund’s investment adviser are fair valued as determined in good faith under fair valuation guidelines adopted by authority of the fund’s board of trustees as further described. The investment adviser follows fair valuation guidelines, consistent with U.S. Securities and Exchange Commission rules and guidance, to consider relevant principles and factors when making fair value determinations. The investment adviser considers relevant indications of value that are reasonably and timely available to it in determining the fair value to be assigned to a particular security, such as the type and cost of the security; contractual or legal restrictions on resale of the security; relevant financial or business developments of the issuer; actively traded similar or related securities; conversion or exchange rights on the security; related corporate actions; significant events occurring after the close of trading in the security; and changes in overall market conditions. In addition, the closing prices of equity securities that trade in markets outside U.S. time zones may be adjusted to reflect significant events that occur after the close of local trading but before the net asset value of each share class of the fund is determined. Fair valuations and valuations of investments that are not actively trading involve judgment and may differ materially from valuations that would have been used had greater market activity occurred.
Processes and structure — The fund’s board of trustees has delegated authority to the fund’s investment adviser to make fair value determinations, subject to board oversight. The investment adviser has established a Joint Fair Valuation Committee (the “Fair Valuation Committee”) to administer, implement and oversee the fair valuation process, and to make fair value decisions. The Fair Valuation Committee regularly reviews its own fair value decisions, as well as decisions made under its standing instructions to the investment adviser’s valuation teams. The Fair Valuation Committee reviews changes in fair value measurements from period to period and may, as deemed appropriate, update the fair valuation guidelines to better reflect the results of back testing and address new or evolving issues. The Fair Valuation Committee reports any changes to the fair valuation guidelines to the board of trustees with supplemental information to support the changes. The fund’s board and audit committee also regularly review reports that describe fair value determinations and methods.
The fund’s investment adviser has also established a Fixed-Income Pricing Review Group to administer and oversee the fixed-income valuation process, including the use of fixed-income pricing vendors. This group regularly reviews pricing vendor information and market data. Pricing decisions, processes and controls over security valuation are also subject to additional internal reviews, including an annual control self-evaluation program facilitated by the investment adviser’s compliance group.
Classifications — The fund’s investment adviser classifies the fund’s assets and liabilities into three levels based on the inputs used to value the assets or liabilities. Level 1 values are based on quoted prices in active markets for identical securities. Level 2 values are based on significant observable market inputs, such as quoted prices for similar securities and quoted prices in inactive markets. Certain securities trading outside the U.S. may transfer between Level 1 and Level 2 due to valuation adjustments resulting from significant market movements following the close of local trading. Level 3 values are based on significant unobservable inputs that reflect the investment adviser’s determination of assumptions that market participants might reasonably use in valuing the securities. The valuation levels are not necessarily an indication of the risk or liquidity associated with the underlying investment. For example, U.S. government securities are reflected as Level 2 because the inputs used to determine fair value may not always be quoted prices in an active market. The following table presents the fund’s valuation levels as of June 30, 2016 (dollars in thousands):
| | | Investment securities | |
| | | Level 1 | | | Level 2* | | | Level 3 | | | Total | |
| Assets: | | | | | | | | | | | | | | | | |
| Common stocks: | | | | | | | | | | | | | | | | |
| Information technology | | $ | 11,674,203 | | | $ | 1,634,416 | | | $ | — | | | $ | 13,308,619 | |
| Consumer discretionary | | | 12,189,877 | | | | — | | | | — | | | | 12,189,877 | |
| Financials | | | 8,672,317 | | | | 512,044 | | | | — | | | | 9,184,361 | |
| Consumer staples | | | 7,688,716 | | | | 580,110 | | | | — | | | | 8,268,826 | |
| Health care | | | 7,951,350 | | | | 281,342 | | | | — | | | | 8,232,692 | |
| Industrials | | | 7,345,954 | | | | 324,838 | | | | — | | | | 7,670,792 | |
| Energy | | | 6,184,702 | | | | 606,892 | | | | — | | | | 6,791,594 | |
| Materials | | | 2,388,053 | | | | — | | | | — | | | | 2,388,053 | |
| Other | | | 575,124 | | | | 211,590 | | | | — | | | | 786,714 | |
| Miscellaneous | | | 2,742,487 | | | | 476,072 | | | | — | | | | 3,218,559 | |
| Short-term securities | | | — | | | | 3,294,340 | | | | — | | | | 3,294,340 | |
| Total | | $ | 67,412,783 | | | $ | 7,921,644 | | | $ | — | | | $ | 75,334,427 | |
| * | Securities with a value of $4,627,304,000, which represented 6.14% of the net assets of the fund, were classified as Level 2 due to significant market movements following the close of local trading. |
4. Risk factors
Investing in the fund may involve certain risks including, but not limited to, those described below.
Market conditions — The prices of, and the income generated by, the common stocks and other securities held by the fund may decline — sometimes rapidly or unpredictably — due to various factors, including events or conditions affecting the general economy or particular industries; overall market changes; local, regional or global political, social or economic instability; governmental or governmental agency responses to economic conditions; and currency exchange rate, interest rate and commodity price fluctuations.
Issuer risks — The prices of, and the income generated by, securities held by the fund may decline in response to various factors directly related to the issuers of such securities, including reduced demand for an issuer’s goods or services, poor management performance and strategic initiatives such as mergers, acquisitions or dispositions and the market response to any such initiatives.
Investing in growth-oriented stocks — Growth-oriented common stocks and other equity-type securities (such as preferred stocks, convertible preferred stocks and convertible bonds) may involve larger price swings and greater potential for loss than other types of investments.
Investing in income-oriented stocks — Income provided by the fund may be reduced by changes in the dividend policies of, and the capital resources available for dividend payments at, the companies in which the fund invests.
Investing outside the U.S. — Securities of issuers domiciled outside the U.S., or with significant operations or revenues outside the U.S., may lose value because of adverse political, social, economic or market developments (including social instability, regional conflicts, terrorism and war) in the countries or regions in which the issuers operate or generate revenue. These securities may also lose value due to changes in foreign currency exchange rates against the U.S. dollar and/or currencies of other countries. Issuers of these securities may be more susceptible to actions of foreign governments, such as the imposition of price controls or punitive taxes, that could adversely impact revenues. Securities markets in certain countries may be more volatile and/or less liquid than those in the U.S. Investments outside the U.S. may also be subject to different accounting practices and different regulatory, legal and reporting standards and practices, and may be more difficult to value, than those in the U.S. In addition, the value of investments outside the U.S. may be reduced by foreign taxes, including foreign withholding taxes on interest and dividends. Further, there may be increased risks of delayed settlement of securities purchased or sold by the fund. The risks of investing outside the U.S. may be heightened in connection with investments in emerging markets.
Management — The investment adviser to the fund actively manages the fund’s investments. Consequently, the fund is subject to the risk that the methods and analyses employed by the investment adviser in this process may not produce the desired results. This could cause the fund to lose value or its investment results to lag relevant benchmarks or other funds with similar objectives.
5. Taxation and distributions
Federal income taxation — The fund complies with the requirements under Subchapter M of the Internal Revenue Code applicable to mutual funds and intends to distribute substantially all of its net taxable income and net capital gains each year. The fund is not subject to income taxes to the extent such distributions are made. Therefore, no federal income tax provision is required.
As of and during the period ended June 30, 2016, the fund did not have a liability for any unrecognized tax benefits. The fund recognizes interest and penalties, if any, related to unrecognized tax benefits as income tax expense in the statement of operations. During the period, the fund did not incur any interest or penalties.
The fund is not subject to examination by U.S. federal tax authorities for tax years before 2012, and by state tax authorities and tax authorities outside the U.S. for tax years before 2011.
Non-U.S. taxation — Dividend and interest income are recorded net of non-U.S. taxes paid. The fund may file withholding tax reclaims in certain jurisdictions to recover a portion of amounts previously withheld. As a result of rulings from European courts, the fund filed for additional reclaims related to prior years. These reclaims are recorded when the amount is known and there are no significant uncertainties on collectability. Gains realized by the fund on the sale of securities in certain countries are subject to non-U.S. taxes. The fund records a liability based on unrealized gains to provide for potential non-U.S. taxes payable upon the sale of these securities.
Distributions — Distributions paid to shareholders are based on net investment income and net realized gains determined on a tax basis, which may differ from net investment income and net realized gains for financial reporting purposes. These differences are due primarily to different treatment for items such as currency gains and losses; short-term capital gains and losses; and capital losses related to sales of certain securities within 30 days of purchase. The fiscal year in which amounts are distributed may differ from the year in which the net investment income and net realized gains are recorded by the fund for financial reporting purposes.
The components of distributable earnings on a tax basis are reported as of the fund’s most recent year-end. As of December 31, 2015, the components of distributable earnings on a tax basis were as follows (dollars in thousands):
| Undistributed ordinary income | | $ | 215,856 | |
| Undistributed long-term capital gains | | | 588,153 | |
As of June 30, 2016, the tax basis unrealized appreciation (depreciation) and cost of investment securities were as follows (dollars in thousands):
| Gross unrealized appreciation on investment securities | | $ | 23,686,481 | |
| Gross unrealized depreciation on investment securities | | | (989,126 | ) |
| Net unrealized appreciation on investment securities | | | 22,697,355 | |
| Cost of investment securities | | | 52,637,072 | |
The tax character of distributions paid to shareholders was as follows (dollars in thousands):
| | | Six months ended June 30, 2016 | | | Year ended December 31, 2015 |
| | | | | | | | | Total | | | | | | | | | Total | |
| | | | | | | | | dividends and | | | | | | | | | dividends and | |
| | | Ordinary | | | Long-term | | | distributions | | | Ordinary | | | Long-term | | | distributions | |
| Share class | | income | | | capital gains | | | paid | | | income | | | capital gains | | | paid | |
| Class A | | $ | 262,980 | | | $ | 358,629 | | | $ | 621,609 | | | $ | 648,551 | | | $ | 1,960,261 | | | $ | 2,608,812 | |
| Class B | | | 181 | | | | 859 | | | | 1,040 | | | | 1,371 | | | | 9,638 | | | | 11,009 | |
| Class C | | | 4,615 | | | | 18,994 | | | | 23,609 | | | | 16,060 | | | | 107,683 | | | | 123,743 | |
| Class F-1 | | | 20,280 | | | | 20,635 | | | | 40,915 | | | | 66,483 | | | | 211,242 | | | | 277,725 | |
| Class F-2 | | | 39,088 | | | | 54,823 | | | | 93,911 | | | | 70,402 | | | | 189,640 | | | | 260,042 | |
| Class 529-A | | | 9,850 | | | | 14,629 | | | | 24,479 | | | | 24,279 | | | | 78,648 | | | | 102,927 | |
| Class 529-B | | | 9 | | | | 81 | | | | 90 | | | | 89 | | | | 839 | | | | 928 | |
| Class 529-C | | | 742 | | | | 3,642 | | | | 4,384 | | | | 2,633 | | | | 19,903 | | | | 22,536 | |
| Class 529-E | | | 316 | | | | 594 | | | | 910 | | | | 818 | | | | 3,204 | | | | 4,022 | |
| Class 529-F-1 | | | 538 | | | | 671 | | | | 1,209 | | | | 1,260 | | | | 3,529 | | | | 4,789 | |
| Class R-1 | | | 295 | | | | 1,173 | | | | 1,468 | | | | 1,017 | | | | 6,895 | | | | 7,912 | |
| Class R-2 | | | 1,541 | | | | 5,818 | | | | 7,359 | | | | 5,296 | | | | 33,102 | | | | 38,398 | |
| Class R-2E | | | 36 | | | | 79 | | | | 115 | | | | 6 | | | | 31 | | | | 37 | |
| Class R-3 | | | 9,064 | | | | 17,222 | | | | 26,286 | | | | 26,052 | | | | 103,305 | | | | 129,357 | |
| Class R-4 | | | 12,637 | | | | 17,704 | | | | 30,341 | | | | 34,218 | | | | 105,231 | | | | 139,449 | |
| Class R-5E* | | | — | † | | | — | † | | | — | † | | | — | † | | | — | † | | | — | † |
| Class R-5 | | | 13,786 | | | | 15,536 | | | | 29,322 | | | | 33,213 | | | | 85,152 | | | | 118,365 | |
| Class R-6 | | | 52,156 | | | | 58,323 | | | | 110,479 | | | | 111,567 | | | | 285,010 | | | | 396,577 | |
| Total | | $ | 428,114 | | | $ | 589,412 | | | $ | 1,017,526 | | | $ | 1,043,315 | | | $ | 3,203,313 | | | $ | 4,246,628 | |
| * | Class R-5E shares were offered beginning November 20, 2015. |
| † | Amount less than one thousand. |
6. Fees and transactions with related parties
CRMC, the fund’s investment adviser, is the parent company of American Funds Distributors,® Inc. (“AFD”), the principal underwriter of the fund’s shares, and American Funds Service Company® (“AFS”), the fund’s transfer agent. CRMC, AFD and AFS are considered related parties to the fund.
Investment advisory services — The fund has an investment advisory and service agreement with CRMC that provides for monthly fees accrued daily. These fees are based on a series of decreasing annual rates beginning with 0.390% on the first $1 billion of daily net assets and decreasing to 0.230% on such assets in excess of $71 billion. For the six months ended June 30, 2016, the investment advisory services fee was $87,955,000, which was equivalent to an annualized rate of 0.246% of average daily net assets.
Class-specific fees and expenses — Expenses that are specific to individual share classes are accrued directly to the respective share class. The principal class-specific fees and expenses are further described below:
Distribution services — The fund has plans of distribution for all share classes, except Class F-2, R-5E, R-5 and R-6 shares. Under the plans, the board of trustees approves certain categories of expenses that are used to finance activities primarily intended to sell fund shares and service existing accounts. The plans provide for payments, based on an annualized percentage of average daily net assets, ranging from 0.25% to 1.00% as noted in this section. In some cases, the board of trustees has limited the amounts that may be paid to less than the maximum allowed by the plans. All share classes with a plan may use up to 0.25% of average daily net assets to pay service fees, or to compensate AFD for paying service fees, to firms that have entered into agreements with AFD to provide certain shareholder services. The remaining amounts available to be paid under each plan are paid to dealers to compensate them for their sales activities.
For Class A and 529-A shares, distribution-related expenses include the reimbursement of dealer and wholesaler commissions paid by AFD for certain shares sold without a sales charge. These share classes reimburse AFD for amounts billed within the prior 15 months but only to the extent that the overall annual expense limit of 0.25% is not exceeded. As of June 30, 2016, there were no unreimbursed expenses subject to reimbursement for Class A or 529-A shares.
| Share class | | Currently approved limits | | Plan limits |
| Class A | | | 0.25 | % | | | 0.25 | % |
| Class 529-A | | | 0.25 | | | | 0.50 | |
| Classes B and 529-B | | | 1.00 | | | | 1.00 | |
| Classes C, 529-C and R-1 | | | 1.00 | | | | 1.00 | |
| Class R-2 | | | 0.75 | | | | 1.00 | |
| Class R-2E | | | 0.60 | | | | 0.85 | |
| Classes 529-E and R-3 | | | 0.50 | | | | 0.75 | |
| Classes F-1, 529-F-1 and R-4 | | | 0.25 | | | | 0.50 | |
Transfer agent services — The fund has a shareholder services agreement with AFS under which the fund compensates AFS for providing transfer agent services to each of the fund’s share classes. These services include recordkeeping, shareholder communications and transaction processing. In addition, the fund reimburses AFS for amounts paid to third parties for performing transfer agent services on behalf of fund shareholders.
Administrative services — The fund has an administrative services agreement with CRMC under which the fund compensates CRMC for providing administrative services to Class A, C, F, 529 and R shares. These services include, but are not limited to, coordinating, monitoring, assisting and overseeing third parties that provide
services to fund shareholders. Under the agreement, Class A shares pay an annual fee of 0.01% and Class C, F, 529 and R shares pay an annual fee of 0.05% of their respective average daily net assets.
529 plan services — Each 529 share class is subject to service fees to compensate the Virginia College Savings Plan (“Virginia529”) for its oversight and administration of the 529 college savings plan. The quarterly fee is based on a series of decreasing annual rates beginning with 0.10% on the first $30 billion of the net assets invested in Class 529 shares of the American Funds and decreasing to 0.05% on such assets in excess of $70 billion. Effective July 1, 2016, the quarterly fee will be amended to annual rates of 0.10% on the first $20 billion of the net assets invested in the Class 529 shares of the American Funds, 0.05% on net assets between $20 billion and $100 billion, and 0.03% on net assets over $100 billion. The fee for any given calendar quarter is accrued and calculated on the basis of the average net assets of Class 529 shares of the American Funds for the last month of the prior calendar quarter. The fee is included in other expenses in the fund’s statement of operations. Virginia529 is not considered a related party to the fund.
For the six months ended June 30, 2016, class-specific expenses under the agreements were as follows (dollars in thousands):
| | | Distribution | | Transfer agent | | Administrative | | 529 plan |
| Share class | | services | | services | | services | | services |
| Class A | | $50,832 | | $24,427 | | $2,182 | | Not applicable |
| Class B | | 709 | | 91 | | Not applicable | | Not applicable |
| Class C | | 11,677 | | 1,313 | | 585 | | Not applicable |
| Class F-1 | | 4,364 | | 2,318 | | 879 | | Not applicable |
| Class F-2 | | Not applicable | | 2,752 | | 1,389 | | Not applicable |
| Class 529-A | | 1,947 | | 814 | | 442 | | $783 |
| Class 529-B | | 62 | | 8 | | 3 | | 5 |
| Class 529-C | | 2,186 | | 217 | | 111 | | 195 |
| Class 529-E | | 179 | | 17 | | 18 | | 32 |
| Class 529-F-1 | | — | | 37 | | 20 | | 36 |
| Class R-1 | | 721 | | 65 | | 36 | | Not applicable |
| Class R-2 | | 2,641 | | 1,145 | | 177 | | Not applicable |
| Class R-2E | | 24 | | 7 | | 2 | | Not applicable |
| Class R-3 | | 5,311 | | 1,513 | | 533 | | Not applicable |
| Class R-4 | | 2,739 | | 978 | | 548 | | Not applicable |
| Class R-5E | | Not applicable | | — | * | — | * | Not applicable |
| Class R-5 | | Not applicable | | 383 | | 469 | | Not applicable |
| Class R-6 | | Not applicable | | 12 | | 1,709 | | Not applicable |
| Total class-specific expenses | | $83,392 | | $36,097 | | $9,103 | | $1,051 |
*Amount less than one thousand.
Trustees’ deferred compensation — Trustees who are unaffiliated with CRMC may elect to defer the cash payment of part or all of their compensation. These deferred amounts, which remain as liabilities of the fund, are treated as if invested in shares of the fund or other American Funds. These amounts represent general, unsecured liabilities of the fund and vary according to the total returns of the selected funds. Trustees’ compensation of $302,000 in the fund’s statement of operations reflects $222,000 in current fees (either paid in cash or deferred) and a net increase of $80,000 in the value of the deferred amounts.
Affiliated officers and trustees — Officers and certain trustees of the fund are or may be considered to be affiliated with CRMC, AFD and AFS. No affiliated officers or trustees received any compensation directly from the fund.
Security transactions with related funds — The fund may purchase from, or sell securities to, other CRMC-managed funds (or funds managed by certain affiliates of CRMC) under procedures adopted by the fund’s board of trustees. The funds involved in such transactions are considered related by virtue of having a common investment adviser (or affiliated investment advisers), common trustees and/or common officers. When such transactions occur, each transaction is executed at the current market price of the security and no brokerage commissions or fees are paid in accordance with Rule 17a-7 of the 1940 Act.
7. Capital share transactions
Capital share transactions in the fund were as follows (dollars and shares in thousands):
| | | Sales1 | | | Reinvestments of
dividends and
distributions | | | Repurchases1 | | | Net increase
(decrease) | |
| Share class | | Amount | | | Shares | | | Amount | | | Shares | | | Amount | | | Shares | | | Amount | | | Shares | |
| | | | | | | | | | | | | | | | | | | | | | | | | | | | | | | | | |
| Six months ended June 30, 2016 | | | | | | | | | | |
| | | | | | | | | | | | | | | | | | | | | | | | | | | | | | | | | |
| Class A | | $ | 1,936,966 | | | | 38,973 | | | $ | 609,764 | | | | 11,946 | | | $ | (2,397,437 | ) | | | (47,979 | ) | | $ | 149,293 | | | | 2,940 | |
| Class B | | | 843 | | | | 17 | | | | 1,036 | | | | 21 | | | | (83,687 | ) | | | (1,688 | ) | | | (81,808 | ) | | | (1,650 | ) |
| Class C | | | 176,443 | | | | 3,569 | | | | 23,334 | | | | 458 | | | | (276,368 | ) | | | (5,575 | ) | | | (76,591 | ) | | | (1,548 | ) |
| Class F-1 | | | 323,370 | | | | 6,547 | | | | 40,441 | | | | 795 | | | | (2,600,530 | ) | | | (51,924 | ) | | | (2,236,719 | ) | | | (44,582 | ) |
| Class F-2 | | | 3,021,743 | | | | 60,200 | | | | 90,928 | | | | 1,780 | | | | (694,652 | ) | | | (13,849 | ) | | | 2,418,019 | | | | 48,131 | |
| Class 529-A | | | 92,453 | | | | 1,863 | | | | 24,476 | | | | 480 | | | | (87,659 | ) | | | (1,758 | ) | | | 29,270 | | | | 585 | |
| Class 529-B | | | 103 | | | | 2 | | | | 90 | | | | 2 | | | | (6,588 | ) | | | (133 | ) | | | (6,395 | ) | | | (129 | ) |
| Class 529-C | | | 24,915 | | | | 502 | | | | 4,383 | | | | 86 | | | | (28,432 | ) | | | (570 | ) | | | 866 | | | | 18 | |
| Class 529-E | | | 3,825 | | | | 77 | | | | 910 | | | | 18 | | | | (3,565 | ) | | | (71 | ) | | | 1,170 | | | | 24 | |
| Class 529-F-1 | | | 7,503 | | | | 150 | | | | 1,209 | | | | 24 | | | | (8,155 | ) | | | (165 | ) | | | 557 | | | | 9 | |
| Class R-1 | | | 9,846 | | | | 200 | | | | 1,465 | | | | 29 | | | | (19,228 | ) | | | (386 | ) | | | (7,917 | ) | | | (157 | ) |
| Class R-2 | | | 83,917 | | | | 1,702 | | | | 7,354 | | | | 144 | | | | (105,588 | ) | | | (2,134 | ) | | | (14,317 | ) | | | (288 | ) |
| Class R-2E | | | 8,680 | | | | 182 | | | | 115 | | | | 2 | | | | (404 | ) | | | (8 | ) | | | 8,391 | | | | 176 | |
| Class R-3 | | | 197,118 | | | | 3,978 | | | | 26,253 | | | | 515 | | | | (338,222 | ) | | | (6,790 | ) | | | (114,851 | ) | | | (2,297 | ) |
| Class R-4 | | | 206,677 | | | | 4,159 | | | | 30,318 | | | | 595 | | | | (333,774 | ) | | | (6,661 | ) | | | (96,779 | ) | | | (1,907 | ) |
| Class R-5E | | | — | | | | — | | | | — | | | | — | | | | — | | | | — | | | | — | | | | — | |
| Class R-5 | | | 193,773 | | | | 3,894 | | | | 29,308 | | | | 574 | | | | (462,288 | ) | | | (9,207 | ) | | | (239,207 | ) | | | (4,739 | ) |
| Class R-6 | | | 1,158,309 | | | | 23,157 | | | | 110,476 | | | | 2,165 | | | | (238,325 | ) | | | (4,755 | ) | | | 1,030,460 | | | | 20,567 | |
| Total net increase (decrease) | | $ | 7,446,484 | | | | 149,172 | | | $ | 1,001,860 | | | | 19,634 | | | $ | (7,684,902 | ) | | | (153,653 | ) | | $ | 763,442 | | | | 15,153 | |
| | | | | | | | | | | | | | | | | | | | | | | | | | | | | | | | | |
| | | | | | Reinvestments of | | | | | | | |
| | | | | | dividends and | | | | | | Net increase | |
| | | Sales1 | | | distributions | | | Repurchases1 | | | (decrease) | |
| Share class | | Amount | | | Shares | | | Amount | | | Shares | | | | Amount | | | Shares | | | Amount | | | Shares | |
| | | | | | | | | | | | | | | | | | | | | | | | | | | | | | | | | |
| Year ended December 31, 2015 | | | | | | | | | | | | | | |
| | | | | | | | | | | | | | | | | | | | | | | | | | | | | | | | | |
| Class A | | $ | 3,775,879 | | | | 72,112 | | | $ | 2,560,866 | | | | 50,144 | | | $ | (4,548,531 | ) | | | (86,784 | ) | | $ | 1,788,214 | | | | 35,472 | |
| Class B | | | 3,274 | | | | 62 | | | | 10,952 | | | | 215 | | | | (153,198 | ) | | | (2,919 | ) | | | (138,972 | ) | | | (2,642 | ) |
| Class C | | | 351,791 | | | | 6,746 | | | | 122,242 | | | | 2,408 | | | | (418,811 | ) | | | (8,026 | ) | | | 55,222 | | | | 1,128 | |
| Class F-1 | | | 795,630 | | | | 15,159 | | | | 275,791 | | | | 5,404 | | | | (899,255 | ) | | | (17,150 | ) | | | 172,166 | | | | 3,413 | |
| Class F-2 | | | 1,154,329 | | | | 22,042 | | | | 248,911 | | | | 4,876 | | | | (819,817 | ) | | | (15,681 | ) | | | 583,423 | | | | 11,237 | |
| Class 529-A | | | 186,084 | | | | 3,554 | | | | 102,916 | | | | 2,018 | | | | (189,844 | ) | | | (3,623 | ) | | | 99,156 | | | | 1,949 | |
| Class 529-B | | | 446 | | | | 9 | | | | 927 | | | | 18 | | | | (13,717 | ) | | | (261 | ) | | | (12,344 | ) | | | (234 | ) |
| Class 529-C | | | 52,773 | | | | 1,009 | | | | 22,526 | | | | 443 | | | | (57,658 | ) | | | (1,102 | ) | | | 17,641 | | | | 350 | |
| Class 529-E | | | 7,474 | | | | 143 | | | | 4,020 | | | | 79 | | | | (9,211 | ) | | | (176 | ) | | | 2,283 | | | | 46 | |
| Class 529-F-1 | | | 19,418 | | | | 372 | | | | 4,789 | | | | 94 | | | | (15,585 | ) | | | (298 | ) | | | 8,622 | | | | 168 | |
| Class R-1 | | | 24,667 | | | | 474 | | | | 7,900 | | | | 156 | | | | (44,679 | ) | | | (857 | ) | | | (12,112 | ) | | | (227 | ) |
| Class R-2 | | | 158,238 | | | | 3,036 | | | | 38,372 | | | | 756 | | | | (233,513 | ) | | | (4,478 | ) | | | (36,903 | ) | | | (686 | ) |
| Class R-2E | | | 1,070 | | | | 20 | | | | 36 | | | | 1 | | | | (1 | ) | | | — | 2 | | | 1,105 | | | | 21 | |
| Class R-3 | | | 402,063 | | | | 7,693 | | | | 129,235 | | | | 2,536 | | | | (865,867 | ) | | | (16,596 | ) | | | (334,569 | ) | | | (6,367 | ) |
| Class R-4 | | | 438,112 | | | | 8,366 | | | | 139,394 | | | | 2,733 | | | | (883,641 | ) | | | (16,882 | ) | | | (306,135 | ) | | | (5,783 | ) |
| Class R-5E3 | | | 10 | | | | — | 2 | | | — | | | | — | | | | — | | | | — | | | | 10 | | | | — | 2 |
| Class R-5 | | | 343,202 | | | | 6,544 | | | | 118,303 | | | | 2,314 | | | | (479,390 | ) | | | (9,136 | ) | | | (17,885 | ) | | | (278 | ) |
| Class R-6 | | | 1,536,959 | | | | 29,450 | | | | 395,776 | | | | 7,751 | | | | (886,656 | ) | | | (17,020 | ) | | | 1,046,079 | | | | 20,181 | |
| Total net increase (decrease) | | $ | 9,251,419 | | | | 176,791 | | | $ | 4,182,956 | | | | 81,946 | | | $ | (10,519,374 | ) | | | (200,989 | ) | | $ | 2,915,001 | | | | 57,748 | |
| | |
| 1 | Includes exchanges between share classes of the fund. |
| 2 | Amount less than one thousand. |
| 3 | Class R-5E shares were offered beginning November 20, 2015. |
8. Investment transactions
The fund made purchases and sales of investment securities, excluding short-term securities and U.S. government obligations, if any, of $7,774,672,000 and $7,984,334,000, respectively, during the six months ended June 30, 2016.
Financial highlights
| | | | | | Income (loss) from investment operations1 | |
| | | Net asset value, beginning
of period | | | Net investment income2 | | | Net gains (losses) on securities (both realized and unrealized) | | | Total from investment operations | |
| Class A: | | | | | | | | | | | | | | | | |
| Six months ended 6/30/20164,5 | | $ | 50.71 | | | $ | .43 | | | $ | 1.54 | | | $ | 1.97 | |
| Year ended 12/31/2015 | | | 52.06 | | | | .77 | | | | .97 | | | | 1.74 | |
| Year ended 12/31/2014 | | | 51.97 | | | | .98 | | | | 3.63 | | | | 4.61 | |
| Year ended 12/31/2013 | | | 40.78 | | | | .63 | | | | 12.13 | | | | 12.76 | |
| Year ended 12/31/2012 | | | 35.39 | | | | .64 | | | | 5.40 | | | | 6.04 | |
| Year ended 12/31/2011 | | | 36.70 | | | | .60 | | | | (1.29 | ) | | | (.69 | ) |
| Class B: | | | | | | | | | | | | | | | | |
| Six months ended 6/30/20164,5 | | | 50.64 | | | | .22 | | | | 1.55 | | | | 1.77 | |
| Year ended 12/31/2015 | | | 51.95 | | | | .37 | | | | .97 | | | | 1.34 | |
| Year ended 12/31/2014 | | | 51.86 | | | | .61 | | | | 3.57 | | | | 4.18 | |
| Year ended 12/31/2013 | | | 40.68 | | | | .27 | | | | 12.11 | | | | 12.38 | |
| Year ended 12/31/2012 | | | 35.30 | | | | .34 | | | | 5.39 | | | | 5.73 | |
| Year ended 12/31/2011 | | | 36.60 | | | | .31 | | | | (1.28 | ) | | | (.97 | ) |
| Class C: | | | | | | | | | | | | | | | | |
| Six months ended 6/30/20164,5 | | | 50.48 | | | | .22 | | | | 1.54 | | | | 1.76 | |
| Year ended 12/31/2015 | | | 51.83 | | | | .35 | | | | .97 | | | | 1.32 | |
| Year ended 12/31/2014 | | | 51.77 | | | | .55 | | | | 3.60 | | | | 4.15 | |
| Year ended 12/31/2013 | | | 40.63 | | | | .25 | | | | 12.09 | | | | 12.34 | |
| Year ended 12/31/2012 | | | 35.26 | | | | .33 | | | | 5.38 | | | | 5.71 | |
| Year ended 12/31/2011 | | | 36.56 | | | | .30 | | | | (1.28 | ) | | | (.98 | ) |
| Class F-1: | | | | | | | | | | | | | | | | |
| Six months ended 6/30/20164,5 | | | 50.69 | | | | .40 | | | | 1.54 | | | | 1.94 | |
| Year ended 12/31/2015 | | | 52.03 | | | | .74 | | | | .97 | | | | 1.71 | |
| Year ended 12/31/2014 | | | 51.95 | | | | .96 | | | | 3.60 | | | | 4.56 | |
| Year ended 12/31/2013 | | | 40.76 | | | | .59 | | | | 12.14 | | | | 12.73 | |
| Year ended 12/31/2012 | | | 35.37 | | | | .64 | | | | 5.39 | | | | 6.03 | |
| Year ended 12/31/2011 | | | 36.68 | | | | .59 | | | | (1.29 | ) | | | (.70 | ) |
| Class F-2: | | | | | | | | | | | | | | | | |
| Six months ended 6/30/20164,5 | | | 50.70 | | | | .48 | | | | 1.53 | | | | 2.01 | |
| Year ended 12/31/2015 | | | 52.04 | | | | .88 | | | | .97 | | | | 1.85 | |
| Year ended 12/31/2014 | | | 51.96 | | | | 1.06 | | | | 3.66 | | | | 4.72 | |
| Year ended 12/31/2013 | | | 40.77 | | | | .74 | | | | 12.13 | | | | 12.87 | |
| Year ended 12/31/2012 | | | 35.39 | | | | .76 | | | | 5.37 | | | | 6.13 | |
| Year ended 12/31/2011 | | | 36.70 | | | | .68 | | | | (1.29 | ) | | | (.61 | ) |
| Class 529-A: | | | | | | | | | | | | | | | | |
| Six months ended 6/30/20164,5 | | | 50.65 | | | | .40 | | | | 1.55 | | | | 1.95 | |
| Year ended 12/31/2015 | | | 52.00 | | | | .72 | | | | .97 | | | | 1.69 | |
| Year ended 12/31/2014 | | | 51.92 | | | | .93 | | | | 3.62 | | | | 4.55 | |
| Year ended 12/31/2013 | | | 40.74 | | | | .59 | | | | 12.12 | | | | 12.71 | |
| Year ended 12/31/2012 | | | 35.36 | | | | .61 | | | | 5.39 | | | | 6.00 | |
| Year ended 12/31/2011 | | | 36.67 | | | | .57 | | | | (1.29 | ) | | | (.72 | ) |
| Dividends and distributions | | | | | | | | | | | | | | | | |
| Dividends | | | | | | Total | | | | | | | | | | | | Ratio of | | | Ratio of net | |
| (from net | | | Distributions | | | dividends | | | Net asset | | | | | | Net assets, | | | expenses | | | income | |
| investment | | | (from capital | | | and | | | value, end | | | Total | | | end of period | | | to average | | | to average | |
| income) | | | gains) | | | distributions | | | of period | | | return3 | | | (in millions) | | | net assets | | | net assets2 | |
| | | | | | | | | | | | | | | | | | | | | | | | | | | | | | | |
| $ | (.30 | ) | | $ | (.41 | ) | | $ | (.71 | ) | | $ | 51.97 | | | | 3.91 | %6 | | $ | 45,851 | | | | .61 | %7 | | | 1.71 | %7 |
| | (.77 | ) | | | (2.32 | ) | | | (3.09 | ) | | | 50.71 | | | | 3.38 | | | | 44,596 | | | | .60 | | | | 1.47 | |
| | (.96 | ) | | | (3.56 | ) | | | (4.52 | ) | | | 52.06 | | | | 8.96 | | | | 43,929 | | | | .61 | | | | 1.85 | |
| | (.65 | ) | | | (.92 | ) | | | (1.57 | ) | | | 51.97 | | | | 31.49 | | | | 41,820 | | | | .63 | | | | 1.35 | |
| | (.65 | ) | | | — | | | | (.65 | ) | | | 40.78 | | | | 17.14 | | | | 32,568 | | | | .65 | | | | 1.66 | |
| | (.62 | ) | | | — | | | | (.62 | ) | | | 35.39 | | | | (1.89 | ) | | | 30,176 | | | | .63 | | | | 1.62 | |
| | | | | | | | | | | | | | | | | | | | | | | | | | | | | | | |
| | (.07 | ) | | | (.41 | ) | | | (.48 | ) | | | 51.93 | | | | 3.51 | 6 | | | 110 | | | | 1.38 | 7 | | | .88 | 7 |
| | (.33 | ) | | | (2.32 | ) | | | (2.65 | ) | | | 50.64 | | | | 2.61 | | | | 190 | | | | 1.36 | | | | .70 | |
| | (.53 | ) | | | (3.56 | ) | | | (4.09 | ) | | | 51.95 | | | | 8.13 | | | | 333 | | | | 1.37 | | | | 1.16 | |
| | (.28 | ) | | | (.92 | ) | | | (1.20 | ) | | | 51.86 | | | | 30.53 | | | | 468 | | | | 1.39 | | | | .59 | |
| | (.35 | ) | | | — | | | | (.35 | ) | | | 40.68 | | | | 16.25 | | | | 465 | | | | 1.41 | | | | .89 | |
| | (.33 | ) | | | — | | | | (.33 | ) | | | 35.30 | | | | (2.64 | ) | | | 545 | | | | 1.40 | | | | .85 | |
| | | | | | | | | | | | | | | | | | | | | | | | | | | | | | | |
| | (.10 | ) | | | (.41 | ) | | | (.51 | ) | | | 51.73 | | | | 3.50 | 6 | | | 2,414 | | | | 1.42 | 7 | | | .91 | 7 |
| | (.35 | ) | | | (2.32 | ) | | | (2.67 | ) | | | 50.48 | | | | 2.56 | | | | 2,435 | | | | 1.40 | | | | .67 | |
| | (.53 | ) | | | (3.56 | ) | | | (4.09 | ) | | | 51.83 | | | | 8.08 | | | | 2,441 | | | | 1.41 | | | | 1.05 | |
| | (.28 | ) | | | (.92 | ) | | | (1.20 | ) | | | 51.77 | | | | 30.44 | | | | 2,352 | | | | 1.43 | | | | .54 | |
| | (.34 | ) | | | — | | | | (.34 | ) | | | 40.63 | | | | 16.21 | | | | 1,852 | | | | 1.45 | | | | .86 | |
| | (.32 | ) | | | — | | | | (.32 | ) | | | 35.26 | | | | (2.67 | ) | | | 1,804 | | | | 1.44 | | | | .82 | |
| | | | | | | | | | | | | | | | | | | | | | | | | | | | | | | |
| | (.28 | ) | | | (.41 | ) | | | (.69 | ) | | | 51.94 | | | | 3.86 | 6 | | | 2,622 | | | | .69 | 7 | | | 1.63 | 7 |
| | (.73 | ) | | | (2.32 | ) | | | (3.05 | ) | | | 50.69 | | | | 3.33 | | | | 4,819 | | | | .67 | | | | 1.40 | |
| | (.92 | ) | | | (3.56 | ) | | | (4.48 | ) | | | 52.03 | | | | 8.87 | | | | 4,769 | | | | .66 | | | | 1.81 | |
| | (.62 | ) | | | (.92 | ) | | | (1.54 | ) | | | 51.95 | | | | 31.42 | | | | 5,306 | | | | .70 | | | | 1.27 | |
| | (.64 | ) | | | — | | | | (.64 | ) | | | 40.76 | | | | 17.12 | | | | 4,503 | | | | .66 | | | | 1.65 | |
| | (.61 | ) | | | — | | | | (.61 | ) | | | 35.37 | | | | (1.92 | ) | | | 4,285 | | | | .67 | | | | 1.60 | |
| | | | | | | | | | | | | | | | | | | | | | | | | | | | | | | |
| | (.35 | ) | | | (.41 | ) | | | (.76 | ) | | | 51.95 | | | | 4.00 | 6 | | | 6,998 | | | | .41 | 7 | | | 1.93 | 7 |
| | (.87 | ) | | | (2.32 | ) | | | (3.19 | ) | | | 50.70 | | | | 3.61 | | | | 4,389 | | | | .41 | | | | 1.67 | |
| | (1.08 | ) | | | (3.56 | ) | | | (4.64 | ) | | | 52.04 | | | | 9.17 | | | | 3,921 | | | | .40 | | | | 1.99 | |
| | (.76 | ) | | | (.92 | ) | | | (1.68 | ) | | | 51.96 | | | | 31.80 | | | | 2,485 | | | | .41 | | | | 1.58 | |
| | (.75 | ) | | | — | | | | (.75 | ) | | | 40.77 | | | | 17.39 | | | | 1,521 | | | | .41 | | | | 1.96 | |
| | (.70 | ) | | | — | | | | (.70 | ) | | | 35.39 | | | | (1.67 | ) | | | 915 | | | | .42 | | | | 1.85 | |
| | | | | | | | | | | | | | | | | | | | | | | | | | | | | | | |
| | (.28 | ) | | | (.41 | ) | | | (.69 | ) | | | 51.91 | | | | 3.86 | 6 | | | 1,870 | | | | .71 | 7 | | | 1.62 | 7 |
| | (.72 | ) | | | (2.32 | ) | | | (3.04 | ) | | | 50.65 | | | | 3.28 | | | | 1,795 | | | | .70 | | | | 1.37 | |
| | (.91 | ) | | | (3.56 | ) | | | (4.47 | ) | | | 52.00 | | | | 8.85 | | | | 1,742 | | | | .70 | | | | 1.75 | |
| | (.61 | ) | | | (.92 | ) | | | (1.53 | ) | | | 51.92 | | | | 31.39 | | | | 1,590 | | | | .72 | | | | 1.26 | |
| | (.62 | ) | | | — | | | | (.62 | ) | | | 40.74 | | | | 17.03 | | | | 1,183 | | | | .73 | | | | 1.59 | |
| | (.59 | ) | | | — | | | | (.59 | ) | | | 35.36 | | | | (1.97 | ) | | | 977 | | | | .71 | | | | 1.55 | |
See page 32 for footnotes.
Financial highlights (continued)
| | | | | | Income (loss) from investment operations1 | |
| | | Net asset | | | | | | Net gains (losses) | | | | |
| | | value, | | | Net | | | on securities (both | | | Total from | |
| | | beginning | | | investment | | | realized and | | | investment | |
| | | of period | | | income2 | | | unrealized) | | | operations | |
| Class 529-B: | | | | | | | | | | | | | | | | |
| Six months ended 6/30/20164,5 | | $ | 50.76 | | | $ | .19 | | | $ | 1.55 | | | $ | 1.74 | |
| Year ended 12/31/2015 | | | 52.05 | | | | .30 | | | | .98 | | | | 1.28 | |
| Year ended 12/31/2014 | | | 51.95 | | | | .54 | | | | 3.58 | | | | 4.12 | |
| Year ended 12/31/2013 | | | 40.75 | | | | .21 | | | | 12.13 | | | | 12.34 | |
| Year ended 12/31/2012 | | | 35.36 | | | | .29 | | | | 5.39 | | | | 5.68 | |
| Year ended 12/31/2011 | | | 36.66 | | | | .27 | | | | (1.28 | ) | | | (1.01 | ) |
|
| Class 529-C: | | | | | | | | | | | | | | | | |
| Six months ended 6/30/20164,5 | | | 50.60 | | | | .21 | | | | 1.53 | | | | 1.74 | |
| Year ended 12/31/2015 | | | 51.95 | | | | .31 | | | | .97 | | | | 1.28 | |
| Year ended 12/31/2014 | | | 51.88 | | | | .51 | | | | 3.62 | | | | 4.13 | |
| Year ended 12/31/2013 | | | 40.71 | | | | .22 | | | | 12.11 | | | | 12.33 | |
| Year ended 12/31/2012 | | | 35.34 | | | | .30 | | | | 5.38 | | | | 5.68 | |
| Year ended 12/31/2011 | | | 36.64 | | | | .28 | | | | (1.28 | ) | | | (1.00 | ) |
|
| Class 529-E: | | | | | | | | | | | | | | | | |
| Six months ended 6/30/20164,5 | | | 50.61 | | | | .34 | | | | 1.54 | | | | 1.88 | |
| Year ended 12/31/2015 | | | 51.96 | | | | .59 | | | | .97 | | | | 1.56 | |
| Year ended 12/31/2014 | | | 51.89 | | | | .80 | | | | 3.61 | | | | 4.41 | |
| Year ended 12/31/2013 | | | 40.71 | | | | .47 | | | | 12.13 | | | | 12.60 | |
| Year ended 12/31/2012 | | | 35.34 | | | | .52 | | | | 5.37 | | | | 5.89 | |
| Year ended 12/31/2011 | | | 36.65 | | | | .47 | | | | (1.29 | ) | | | (.82 | ) |
|
| Class 529-F-1: | | | | | | | | | | | | | | | | |
| Six months ended 6/30/20164,5 | | | 50.62 | | | | .46 | | | | 1.53 | | | | 1.99 | |
| Year ended 12/31/2015 | | | 51.97 | | | | .83 | | | | .97 | | | | 1.80 | |
| Year ended 12/31/2014 | | | 51.89 | | | | 1.04 | | | | 3.63 | | | | 4.67 | |
| Year ended 12/31/2013 | | | 40.71 | | | | .69 | | | | 12.12 | | | | 12.81 | |
| Year ended 12/31/2012 | | | 35.33 | | | | .69 | | | | 5.39 | | | | 6.08 | |
| Year ended 12/31/2011 | | | 36.65 | | | | .65 | | | | (1.30 | ) | | | (.65 | ) |
|
| Class R-1: | | | | | | | | | | | | | | | | |
| Six months ended 6/30/20164,5 | | | 50.49 | | | | .23 | | | | 1.52 | | | | 1.75 | |
| Year ended 12/31/2015 | | | 51.83 | | | | .35 | | | | .97 | | | | 1.32 | |
| Year ended 12/31/2014 | | | 51.77 | | | | .56 | | | | 3.60 | | | | 4.16 | |
| Year ended 12/31/2013 | | | 40.62 | | | | .26 | | | | 12.09 | | | | 12.35 | |
| Year ended 12/31/2012 | | | 35.26 | | | | .34 | | | | 5.37 | | | | 5.71 | |
| Year ended 12/31/2011 | | | 36.56 | | | | .31 | | | | (1.28 | ) | | | (.97 | ) |
|
| Class R-2: | | | | | | | | | | | | | | | | |
| Six months ended 6/30/20164,5 | | | 50.47 | | | | .23 | | | | 1.54 | | | | 1.77 | |
| Year ended 12/31/2015 | | | 51.82 | | | | .37 | | | | .97 | | | | 1.34 | |
| Year ended 12/31/2014 | | | 51.76 | | | | .57 | | | | 3.60 | | | | 4.17 | |
| Year ended 12/31/2013 | | | 40.62 | | | | .29 | | | | 12.08 | | | | 12.37 | |
| Year ended 12/31/2012 | | | 35.26 | | | | .35 | | | | 5.37 | | | | 5.72 | |
| Year ended 12/31/2011 | | | 36.56 | | | | .31 | | | | (1.28 | ) | | | (.97 | ) |
| Dividends and distributions | | | | | | | | | | | | | | | | |
| Dividends | | | | | | Total | | | | | | | | | | | | Ratio of | | | Ratio of net | |
| (from net | | | Distributions | | | dividends | | | Net asset | | | | | | Net assets, | | | expenses | | | income | |
| investment | | | (from capital | | | and | | | value, end | | | Total | | | end of period | | | to average | | | to average | |
| income) | | | gains) | | | distributions | | | of period | | | return3 | | | (in millions) | | | net assets | | | net assets2 | |
| | | | | | | | | | | | | | | | | | | | | | | |
| $ | (.04 | ) | | $ | (.41 | ) | | $ | (.45 | ) | | $ | 52.05 | | | | 3.44 | %6 | | $ | 10 | | | | 1.50 | %7 | | | .77 | %7 |
| | (.25 | ) | | | (2.32 | ) | | | (2.57 | ) | | | 50.76 | | | | 2.49 | | | | 17 | | | | 1.49 | | | | .57 | |
| | (.46 | ) | | | (3.56 | ) | | | (4.02 | ) | | | 52.05 | | | | 7.97 | | | | 29 | | | | 1.49 | | | | 1.02 | |
| | (.22 | ) | | | (.92 | ) | | | (1.14 | ) | | | 51.95 | | | | 30.36 | | | | 41 | | | | 1.52 | | | | .46 | |
| | (.29 | ) | | | — | | | | (.29 | ) | | | 40.75 | | | | 16.09 | | | | 41 | | | | 1.54 | | | | .76 | |
| | (.29 | ) | | | — | | | | (.29 | ) | | | 35.36 | | | | (2.74 | ) | | | 48 | | | | 1.51 | | | | .74 | |
| |
| | (.08 | ) | | | (.41 | ) | | | (.49 | ) | | | 51.85 | | | | 3.46 | 6 | | | 464 | | | | 1.48 | 7 | | | .84 | 7 |
| | (.31 | ) | | | (2.32 | ) | | | (2.63 | ) | | | 50.60 | | | | 2.48 | | | | 451 | | | | 1.48 | | | | .59 | |
| | (.50 | ) | | | (3.56 | ) | | | (4.06 | ) | | | 51.95 | | | | 7.99 | | | | 445 | | | | 1.49 | | | | .97 | |
| | (.24 | ) | | | (.92 | ) | | | (1.16 | ) | | | 51.88 | | | | 30.37 | | | | 416 | | | | 1.51 | | | | .47 | |
| | (.31 | ) | | | — | | | | (.31 | ) | | | 40.71 | | | | 16.09 | | | | 319 | | | | 1.53 | | | | .79 | |
| | (.30 | ) | | | — | | | | (.30 | ) | | | 35.34 | | | | (2.72 | ) | | | 273 | | | | 1.51 | | | | .76 | |
| |
| | (.22 | ) | | | (.41 | ) | | | (.63 | ) | | | 51.86 | | | | 3.74 | 6 | | | 76 | | | | .94 | 7 | | | 1.39 | 7 |
| | (.59 | ) | | | (2.32 | ) | | | (2.91 | ) | | | 50.61 | | | | 3.04 | | | | 73 | | | | .94 | | | | 1.13 | |
| | (.78 | ) | | | (3.56 | ) | | | (4.34 | ) | | | 51.96 | | | | 8.58 | | | | 72 | | | | .94 | | | | 1.51 | |
| | (.50 | ) | | | (.92 | ) | | | (1.42 | ) | | | 51.89 | | | | 31.10 | | | | 67 | | | | .96 | | | | 1.02 | |
| | (.52 | ) | | | — | | | | (.52 | ) | | | 40.71 | | | | 16.73 | | | | 50 | | | | .98 | | | | 1.34 | |
| | (.49 | ) | | | — | | | | (.49 | ) | | | 35.34 | | | | (2.23 | ) | | | 42 | | | | .98 | | | | 1.29 | |
| |
| | (.33 | ) | | | (.41 | ) | | | (.74 | ) | | | 51.87 | | | | 3.97 | 6 | | | 85 | | | | .49 | 7 | | | 1.84 | 7 |
| | (.83 | ) | | | (2.32 | ) | | | (3.15 | ) | | | 50.62 | | | | 3.51 | | | | 83 | | | | .48 | | | | 1.59 | |
| | (1.03 | ) | | | (3.56 | ) | | | (4.59 | ) | | | 51.97 | | | | 9.10 | | | | 76 | | | | .48 | | | | 1.96 | |
| | (.71 | ) | | | (.92 | ) | | | (1.63 | ) | | | 51.89 | | | | 31.70 | | | | 67 | | | | .51 | | | | 1.47 | |
| | (.70 | ) | | | — | | | | (.70 | ) | | | 40.71 | | | | 17.25 | | | | 48 | | | | .52 | | | | 1.79 | |
| | (.67 | ) | | | — | | | | (.67 | ) | | | 35.33 | | | | (1.75 | ) | | | 40 | | | | .50 | | | | 1.77 | |
| |
| | (.10 | ) | | | (.41 | ) | | | (.51 | ) | | | 51.73 | | | | 3.51 | 6 | | | 147 | | | | 1.40 | 7 | | | .93 | 7 |
| | (.34 | ) | | | (2.32 | ) | | | (2.66 | ) | | | 50.49 | | | | 2.55 | | | | 151 | | | | 1.40 | | | | .66 | |
| | (.54 | ) | | | (3.56 | ) | | | (4.10 | ) | | | 51.83 | | | | 8.08 | | | | 167 | | | | 1.41 | | | | 1.06 | |
| | (.28 | ) | | | (.92 | ) | | | (1.20 | ) | | | 51.77 | | | | 30.50 | | | | 171 | | | | 1.41 | | | | .57 | |
| | (.35 | ) | | | — | | | | (.35 | ) | | | 40.62 | | | | 16.22 | | | | 146 | | | | 1.42 | | | | .88 | |
| | (.33 | ) | | | — | | | | (.33 | ) | | | 35.26 | | | | (2.65 | ) | | | 142 | | | | 1.43 | | | | .84 | |
| |
| | (.11 | ) | | | (.41 | ) | | | (.52 | ) | | | 51.72 | | | | 3.52 | 6 | | | 738 | | | | 1.38 | 7 | | | .95 | 7 |
| | (.37 | ) | | | (2.32 | ) | | | (2.69 | ) | | | 50.47 | | | | 2.61 | | | | 734 | | | | 1.35 | | | | .72 | |
| | (.55 | ) | | | (3.56 | ) | | | (4.11 | ) | | | 51.82 | | | | 8.11 | | | | 790 | | | | 1.38 | | | | 1.08 | |
| | (.31 | ) | | | (.92 | ) | | | (1.23 | ) | | | 51.76 | | | | 30.55 | | | | 777 | | | | 1.36 | | | | .62 | |
| | (.36 | ) | | | — | | | | (.36 | ) | | | 40.62 | | | | 16.24 | | | | 630 | | | | 1.40 | | | | .91 | |
| | (.33 | ) | | | — | | | | (.33 | ) | | | 35.26 | | | | (2.64 | ) | | | 589 | | | | 1.41 | | | | .85 | |
See page 32 for footnotes.
Financial highlights (continued)
| | | | | | Income (loss) from investment operations1 | |
| | | Net asset | | | | | | Net gains (losses) | | | | |
| | | value, | | | Net | | | on securities (both | | | Total from | |
| | | beginning | | | investment | | | realized and | | | investment | |
| | | of period | | | income2 | | | unrealized) | | | operations | |
| Class R-2E: | | | | | | | | | | | | | | | | |
| Six months ended 6/30/20164,5 | | $ | 50.56 | | | $ | .33 | | | $ | 1.53 | | | $ | 1.86 | |
| Year ended 12/31/2015 | | | 52.03 | | | | .69 | | | | .90 | | | | 1.59 | |
| Period from 8/29/2014 to 12/31/20145,8 | | | 55.04 | | | | .27 | | | | .52 | | | | .79 | |
|
| Class R-3: | | | | | | | | | | | | | | | | |
| Six months ended 6/30/20164,5 | | | 50.60 | | | | .34 | | | | 1.53 | | | | 1.87 | |
| Year ended 12/31/2015 | | | 51.94 | | | | .59 | | | | .97 | | | | 1.56 | |
| Year ended 12/31/2014 | | �� | 51.87 | | | | .80 | | | | 3.60 | | | | 4.40 | |
| Year ended 12/31/2013 | | | 40.70 | | | | .48 | | | | 12.11 | | | | 12.59 | |
| Year ended 12/31/2012 | | | 35.32 | | | | .52 | | | | 5.39 | | | | 5.91 | |
| Year ended 12/31/2011 | | | 36.63 | | | | .48 | | | | (1.29 | ) | | | (.81 | ) |
|
| Class R-4: | | | | | | | | | | | | | | | | |
| Six months ended 6/30/20164,5 | | | 50.62 | | | | .42 | | | | 1.53 | | | | 1.95 | |
| Year ended 12/31/2015 | | | 51.96 | | | | .75 | | | | .97 | | | | 1.72 | |
| Year ended 12/31/2014 | | | 51.88 | | | | .96 | | | | 3.61 | | | | 4.57 | |
| Year ended 12/31/2013 | | | 40.71 | | | | .61 | | | | 12.12 | | | | 12.73 | |
| Year ended 12/31/2012 | | | 35.33 | | | | .64 | | | | 5.39 | | | | 6.03 | |
| Year ended 12/31/2011 | | | 36.64 | | | | .59 | | | | (1.30 | ) | | | (.71 | ) |
|
| Class R-5E: | | | | | | | | | | | | | | | | |
| Six months ended 6/30/20164,5 | | | 50.69 | | | | .44 | | | | 1.54 | | | | 1.98 | |
| Period from 11/20/2015 to 12/31/20155,11 | | | 53.80 | | | | .11 | | | | (1.16 | ) | | | (1.05 | ) |
|
| Class R-5: | | | | | | | | | | | | | | | | |
| Six months ended 6/30/20164,5 | | | 50.74 | | | | .49 | | | | 1.54 | | | | 2.03 | |
| Year ended 12/31/2015 | | | 52.08 | | | | .90 | | | | .98 | | | | 1.88 | |
| Year ended 12/31/2014 | | | 51.99 | | | | 1.13 | | | | 3.62 | | | | 4.75 | |
| Year ended 12/31/2013 | | | 40.79 | | | | .76 | | | | 12.14 | | | | 12.90 | |
| Year ended 12/31/2012 | | | 35.40 | | | | .75 | | | | 5.40 | | | | 6.15 | |
| Year ended 12/31/2011 | | | 36.71 | | | | .70 | | | | (1.30 | ) | | | (.60 | ) |
|
| Class R-6: | | | | | | | | | | | | | | | | |
| Six months ended 6/30/20164,5 | | | 50.72 | | | | .50 | | | | 1.55 | | | | 2.05 | |
| Year ended 12/31/2015 | | | 52.06 | | | | .93 | | | | .97 | | | | 1.90 | |
| Year ended 12/31/2014 | | | 51.98 | | | | 1.12 | | | | 3.64 | | | | 4.76 | |
| Year ended 12/31/2013 | | | 40.78 | | | | .79 | | | | 12.13 | | | | 12.92 | |
| Year ended 12/31/2012 | | | 35.39 | | | | .79 | | | | 5.38 | | | | 6.17 | |
| Year ended 12/31/2011 | | | 36.70 | | | | .72 | | | | (1.30 | ) | | | (.58 | ) |
| | | Six months ended | | | | | | |
| | | June 30, | | Year ended December 31 |
| | | 20164,5,6 | | 2015 | | 2014 | | 2013 | | 2012 | | 2011 |
| Portfolio turnover rate for all share classes | | 11% | | 27% | | 29% | | 34% | | 28% | | 28% |
See Notes to Financial Statements
| Dividends and distributions | | | | | | | | | | | | | | | | |
| Dividends | | | | | | Total | | | | | | | | | | | | Ratio of | | | Ratio of net | |
| (from net | | | Distributions | | | dividends | | | Net asset | | | | | | Net assets, | | | expenses | | | income | |
| investment | | | (from capital | | | and | | | value, end | | | Total | | | end of period | | | to average | | | to average | |
| income) | | | gains) | | | distributions | | | of period | | | return3 | | | (in millions) | | | net assets | | | net assets2 | |
| | |
| $ | (.21 | ) | | $ | (.41 | ) | | $ | (.62 | ) | | $ | 51.80 | | | | 3.69 | %6 | | $ | 10 | | | | 1.08 | %7 | | | 1.37 | %7 |
| | (.74 | ) | | | (2.32 | ) | | | (3.06 | ) | | | 50.56 | | | | 3.09 | | | | 1 | | | | 1.13 | | | | 1.37 | |
| | (.74 | ) | | | (3.06 | ) | | | (3.80 | ) | | | 52.03 | | | | 1.40 | 6,9 | | | — | 10 | | | .17 | 6,9 | | | .50 | 6,9 |
| |
| | (.21 | ) | | | (.41 | ) | | | (.62 | ) | | | 51.85 | | | | 3.73 | 6 | | | 2,174 | | | | .95 | 7 | | | 1.37 | 7 |
| | (.58 | ) | | | (2.32 | ) | | | (2.90 | ) | | | 50.60 | | | | 3.03 | | | | 2,237 | | | | .95 | | | | 1.12 | |
| | (.77 | ) | | | (3.56 | ) | | | (4.33 | ) | | | 51.94 | | | | 8.56 | | | | 2,627 | | | | .96 | | | | 1.51 | |
| | (.50 | ) | | | (.92 | ) | | | (1.42 | ) | | | 51.87 | | | | 31.09 | | | | 2,795 | | | | .96 | | | | 1.02 | |
| | (.53 | ) | | | — | | | | (.53 | ) | | | 40.70 | | | | 16.78 | | | | 2,367 | | | | .96 | | | | 1.35 | |
| | (.50 | ) | | | — | | | | (.50 | ) | | | 35.32 | | | | (2.22 | ) | | | 2,146 | | | | .96 | | | | 1.30 | |
| |
| | (.29 | ) | | | (.41 | ) | | | (.70 | ) | | | 51.87 | | | | 3.88 | 6 | | | 2,247 | | | | .65 | 7 | | | 1.68 | 7 |
| | (.74 | ) | | | (2.32 | ) | | | (3.06 | ) | | | 50.62 | | | | 3.36 | | | | 2,289 | | | | .65 | | | | 1.42 | |
| | (.93 | ) | | | (3.56 | ) | | | (4.49 | ) | | | 51.96 | | | | 8.90 | | | | 2,651 | | | | .66 | | | | 1.82 | |
| | (.64 | ) | | | (.92 | ) | | | (1.56 | ) | | | 51.88 | | | | 31.47 | | | | 2,842 | | | | .66 | | | | 1.32 | |
| | (.65 | ) | | | — | | | | (.65 | ) | | | 40.71 | | | | 17.13 | | | | 2,390 | | | | .66 | | | | 1.65 | |
| | (.60 | ) | | | — | | | | (.60 | ) | | | 35.33 | | | | (1.92 | ) | | | 2,123 | | | | .66 | | | | 1.60 | |
| |
| | (.32 | ) | | | (.41 | ) | | | (.73 | ) | | | 51.94 | | | | 3.94 | 6 | | | — | 10 | | | .53 | 7 | | | 1.79 | 7 |
| | (.35 | ) | | | (1.71 | ) | | | (2.06 | ) | | | 50.69 | | | | (1.95 | )6 | | | — | 10 | | | .05 | 6 | | | .21 | 6 |
| |
| | (.36 | ) | | | (.41 | ) | | | (.77 | ) | | | 52.00 | | | | 4.04 | 6 | | | 1,715 | | | | .35 | 7 | | | 1.97 | 7 |
| | (.90 | ) | | | (2.32 | ) | | | (3.22 | ) | | | 50.74 | | | | 3.66 | | | | 1,914 | | | | .35 | | | | 1.72 | |
| | (1.10 | ) | | | (3.56 | ) | | | (4.66 | ) | | | 52.08 | | | | 9.23 | | | | 1,979 | | | | .35 | | | | 2.12 | |
| | (.78 | ) | | | (.92 | ) | | | (1.70 | ) | | | 51.99 | | | | 31.87 | | | | 1,964 | | | | .36 | | | | 1.62 | |
| | (.76 | ) | | | — | | | | (.76 | ) | | | 40.79 | | | | 17.47 | | | | 1,516 | | | | .36 | | | | 1.95 | |
| | (.71 | ) | | | — | | | | (.71 | ) | | | 35.40 | | | | (1.62 | ) | | | 1,394 | | | | .36 | | | | 1.89 | |
| |
| | (.38 | ) | | | (.41 | ) | | | (.79 | ) | | | 51.98 | | | | 4.06 | 6 | | | 7,822 | | | | .31 | 7 | | | 2.03 | 7 |
| | (.92 | ) | | | (2.32 | ) | | | (3.24 | ) | | | 50.72 | | | | 3.71 | | | | 6,590 | | | | .31 | | | | 1.77 | |
| | (1.12 | ) | | | (3.56 | ) | | | (4.68 | ) | | | 52.06 | | | | 9.27 | | | | 5,713 | | | | .31 | | | | 2.12 | |
| | (.80 | ) | | | (.92 | ) | | | (1.72 | ) | | | 51.98 | | | | 31.95 | | | | 4,516 | | | | .31 | | | | 1.68 | |
| | (.78 | ) | | | — | | | | (.78 | ) | | | 40.78 | | | | 17.53 | | | | 2,409 | | | | .31 | | | | 2.03 | |
| | (.73 | ) | | | — | | | | (.73 | ) | | | 35.39 | | | | (1.57 | ) | | | 1,421 | | | | .31 | | | | 1.97 | |
See page 32 for footnotes.
Financial highlights (continued)
| 1 | Based on average shares outstanding. |
| 2 | For the year ended December 31, 2014, this column reflects the impact of a corporate action event that resulted in a one-time increase to net investment income. If the corporate action event had not occurred, the Class A net investment income per share and ratio of net income to average net assets would have been lower by $.27 and .51 percentage points, respectively. The impact to the other share classes would have been similar. |
| 3 | Total returns exclude any applicable sales charges, including contingent deferred sales charges. |
| 4 | Unaudited. |
| 5 | Based on operations for the period shown and, accordingly, is not representative of a full year. |
| 6 | Not annualized. |
| 7 | Annualized. |
| 8 | Class R-2E shares were offered beginning August 29, 2014. |
| 9 | All or a significant portion of assets in this class consisted of seed capital invested by CRMC and/or its affiliates. Certain fees (including, where applicable, fees for distribution services) are not charged or accrued on these seed capital assets. If such fees were paid by the fund on seed capital assets, fund expenses would have been higher and net income and total return would have been lower. |
| 10 | Amount less than $1 million. |
| 11 | Class R-5E shares were offered beginning November 20, 2015. |
As a fund shareholder, you incur two types of costs: (1) transaction costs, such as initial sales charges on purchase payments and contingent deferred sales charges on redemptions (loads), and (2) ongoing costs, including management fees, distribution and service (12b-1) fees, and other expenses. This example is intended to help you understand your ongoing costs (in dollars) of investing in the fund so you can compare these costs with the ongoing costs of investing in other mutual funds. The example is based on an investment of $1,000 invested at the beginning of the period and held for the entire six-month period (January 1, 2016, through June 30, 2016).
Actual expenses:
The first line of each share class in the table on the following page provides information about actual account values and actual expenses. You may use the information in this line, together with the amount you invested, to estimate the expenses that you paid over the period. Simply divide your account value by $1,000 (for example, an $8,600 account value divided by $1,000 = 8.6), then multiply the result by the number in the first line under the heading entitled “Expenses paid during period” to estimate the expenses you paid on your account during this period.
Hypothetical example for comparison purposes:
The second line of each share class in the table on the following page provides information about hypothetical account values and hypothetical expenses based on the actual expense ratio for the share class and an assumed rate of return of 5.00% per year before expenses, which is not the actual return of the share class. The hypothetical account values and expenses may not be used to estimate the actual ending account balance or expenses you paid for the period. You may use this information to compare the ongoing costs of investing in the fund and other funds. To do so, compare this 5.00% hypothetical example with the 5.00% hypothetical examples that appear in the shareholder reports of the other funds.
Notes:
Retirement plan participants may be subject to certain fees charged by the plan sponsor, and Class F-1, F-2 and 529-F-1 shareholders may be subject to fees charged by financial intermediaries, typically ranging from 0.75% to 1.50% of assets annually depending on services offered. You can estimate the impact of these fees by adding the amount of the fees to the total estimated expenses you paid on your account during the period as calculated above. In addition, your ending account value would be lower by the amount of these fees.
Note that the expenses shown in the table on the following page are meant to highlight your ongoing costs only and do not reflect any transactional costs, such as sales charges (loads). Therefore, the second line of each share class in the table is useful in comparing ongoing costs only and will not help you determine the relative total costs of owning different funds. In addition, if these transactional costs were included, your costs would have been higher.
| | | Beginning | | | Ending | | | | | | | |
| | | account value | | | account value | | | Expenses paid | | | Annualized | |
| | | 1/1/2016 | | | 6/30/2016 | | | during period* | | | expense ratio | |
| Class A - actual return | | $ | 1,000.00 | | | $ | 1,039.14 | | | $ | 3.09 | | | | .61 | % |
| Class A - assumed 5% return | | | 1,000.00 | | | | 1,021.83 | | | | 3.07 | | | | .61 | |
| Class B - actual return | | | 1,000.00 | | | | 1,035.07 | | | | 6.98 | | | | 1.38 | |
| Class B - assumed 5% return | | | 1,000.00 | | | | 1,018.00 | | | | 6.92 | | | | 1.38 | |
| Class C - actual return | | | 1,000.00 | | | | 1,035.01 | | | | 7.18 | | | | 1.42 | |
| Class C - assumed 5% return | | | 1,000.00 | | | | 1,017.80 | | | | 7.12 | | | | 1.42 | |
| Class F-1 - actual return | | | 1,000.00 | | | | 1,038.59 | | | | 3.50 | | | | .69 | |
| Class F-1 - assumed 5% return | | | 1,000.00 | | | | 1,021.43 | | | | 3.47 | | | | .69 | |
| Class F-2 - actual return | | | 1,000.00 | | | | 1,040.04 | | | | 2.08 | | | | .41 | |
| Class F-2 - assumed 5% return | | | 1,000.00 | | | | 1,022.82 | | | | 2.06 | | | | .41 | |
| Class 529-A - actual return | | | 1,000.00 | | | | 1,038.62 | | | | 3.60 | | | | .71 | |
| Class 529-A - assumed 5% return | | | 1,000.00 | | | | 1,021.33 | | | | 3.57 | | | | .71 | |
| Class 529-B - actual return | | | 1,000.00 | | | | 1,034.39 | | | | 7.59 | | | | 1.50 | |
| Class 529-B - assumed 5% return | | | 1,000.00 | | | | 1,017.40 | | | | 7.52 | | | | 1.50 | |
| Class 529-C - actual return | | | 1,000.00 | | | | 1,034.61 | | | | 7.49 | | | | 1.48 | |
| Class 529-C - assumed 5% return | | | 1,000.00 | | | | 1,017.50 | | | | 7.42 | | | | 1.48 | |
| Class 529-E - actual return | | | 1,000.00 | | | | 1,037.36 | | | | 4.76 | | | | .94 | |
| Class 529-E - assumed 5% return | | | 1,000.00 | | | | 1,020.19 | | | | 4.72 | | | | .94 | |
| Class 529-F-1 - actual return | | | 1,000.00 | | | | 1,039.68 | | | | 2.48 | | | | .49 | |
| Class 529-F-1 - assumed 5% return | | | 1,000.00 | | | | 1,022.43 | | | | 2.46 | | | | .49 | |
| Class R-1 - actual return | | | 1,000.00 | | | | 1,035.07 | | | | 7.08 | | | | 1.40 | |
| Class R-1 - assumed 5% return | | | 1,000.00 | | | | 1,017.90 | | | | 7.02 | | | | 1.40 | |
| Class R-2 - actual return | | | 1,000.00 | | | | 1,035.18 | | | | 6.98 | | | | 1.38 | |
| Class R-2 - assumed 5% return | | | 1,000.00 | | | | 1,018.00 | | | | 6.92 | | | | 1.38 | |
| Class R-2E - actual return | | | 1,000.00 | | | | 1,036.93 | | | | 5.47 | | | | 1.08 | |
| Class R-2E - assumed 5% return | | | 1,000.00 | | | | 1,019.49 | | | | 5.42 | | | | 1.08 | |
| Class R-3 - actual return | | | 1,000.00 | | | | 1,037.31 | | | | 4.81 | | | | .95 | |
| Class R-3 - assumed 5% return | | | 1,000.00 | | | | 1,020.14 | | | | 4.77 | | | | .95 | |
| Class R-4 - actual return | | | 1,000.00 | | | | 1,038.80 | | | | 3.29 | | | | .65 | |
| Class R-4 - assumed 5% return | | | 1,000.00 | | | | 1,021.63 | | | | 3.27 | | | | .65 | |
| Class R-5E - actual return | | | 1,000.00 | | | | 1,039.37 | | | | 2.69 | | | | .53 | |
| Class R-5E - assumed 5% return | | | 1,000.00 | | | | 1,022.23 | | | | 2.66 | | | | .53 | |
| Class R-5 - actual return | | | 1,000.00 | | | | 1,040.42 | | | | 1.78 | | | | .35 | |
| Class R-5 - assumed 5% return | | | 1,000.00 | | | | 1,023.12 | | | | 1.76 | | | | .35 | |
| Class R-6 - actual return | | | 1,000.00 | | | | 1,040.64 | | | | 1.57 | | | | .31 | |
| Class R-6 - assumed 5% return | | | 1,000.00 | | | | 1,023.32 | | | | 1.56 | | | | .31 | |
| * | The “expenses paid during period” are equal to the “annualized expense ratio,” multiplied by the average account value over the period, multiplied by the number of days in the period, and divided by 366 (to reflect the one-half year period). |
This page was intentionally left blank.
Office of the fund
6455 Irvine Center Drive
Irvine, CA 92618-4518
Investment adviser
Capital Research and Management Company
333 South Hope Street
Los Angeles, CA 90071-1406
6455 Irvine Center Drive
Irvine, CA 92618-4518
Transfer agent for shareholder accounts
American Funds Service Company
(Write to the address near you.)
P.O. Box 6007
Indianapolis, IN 46206-6007
P.O. Box 2280
Norfolk, VA 23501-2280
Custodian of assets
State Street Bank and Trust Company
One Lincoln Street
Boston, MA 02111
Counsel
Dechert LLP
One Bush Street, Suite 1600
San Francisco, CA 94104-4446
Independent registered public accounting firm
Deloitte & Touche LLP
695 Town Center Drive
Suite 1200
Costa Mesa, CA 92626-7188
Principal underwriter
American Funds Distributors, Inc.
333 South Hope Street
Los Angeles, CA 90071-1406
Investors should carefully consider investment objectives, risks, charges and expenses. This and other important information is contained in the fund prospectus and summary prospectus, which can be obtained from your financial professional and should be read carefully before investing. You may also call American Funds Service Company (AFS) at (800) 421-4225 or visit the American Funds website at americanfunds.com.
“American Funds Proxy Voting Procedures and Principles” — which describes how we vote proxies relating to portfolio securities — is available on the American Funds website or upon request by calling AFS. The fund files its proxy voting record with the U.S. Securities and Exchange Commission (SEC) for the 12 months ended June 30 by August 31. The proxy voting record is available free of charge on the SEC website at sec.gov and on the American Funds website.
A complete June 30, 2016, portfolio of Fundamental Investors’ investments is available free of charge by calling AFS or visiting the SEC website (where it is part of Form N-CSR).
Fundamental Investors files a complete list of its portfolio holdings with the SEC for the first and third quarters of each fiscal year on Form N-Q. This filing is available free of charge on the SEC website. You may also review or, for a fee, copy this filing at the SEC’s Public Reference Room in Washington, D.C. Additional information regarding the operation of the Public Reference Room may be obtained by calling the SEC’s Office of Investor Education and Advocacy at (800) SEC-0330. Additionally, the list of portfolio holdings is available by calling AFS.
This report is for the information of shareholders of Fundamental Investors, but it also may be used as sales literature when preceded or accompanied by the current prospectus or summary prospectus, which gives details about charges, expenses, investment objectives and operating policies of the fund. If used as sales material after September 30, 2016, this report must be accompanied by an American Funds statistical update for the most recently completed calendar quarter.
The American Funds AdvantageSM
Since 1931, American Funds, part of Capital Group, has helped investors pursue long-term investment success. Our consistent approach — in combination with The Capital SystemSM — has resulted in a superior long-term track record.
| | Aligned with investor success |
| | We base our decisions on a long-term perspective, which we believe aligns our goals with the interests of our clients. Our portfolio managers average 27 years of investment experience, including 22 years at our company, reflecting a career commitment to our long-term approach.1 |
| | |
| | The Capital SystemSM |
| | The Capital System combines individual accountability with teamwork. Funds using The Capital System are divided into portions that are managed independently by investment professionals with diverse backgrounds, ages and investment approaches. An extensive global research effort is the backbone of our system. |
| | |
| | Superior long-term track record |
| | Our equity funds have beaten their Lipper peer indexes in 91% of 10-year periods and 95% of 20-year periods. Our fixed income funds have beaten their Lipper indexes in 58% of 10-year periods and 58% of 20-year periods.2 Our fund management fees have been among the lowest in the industry.3 |
| | 1 | Portfolio manager experience as of December 31, 2015. |
| | 2 | Based on Class A share results for rolling periods through December 31, 2015. Periods covered are the shorter of the fund’s lifetime or since the comparable Lipper index inception date (except Capital Income Builder and SMALLCAP World Fund, for which the Lipper average was used). |
| | 3 | On average, our management fees were in the lowest quintile 68% of the time, based on the 20-year period ended December 31, 2015, versus comparable Lipper categories, excluding funds of funds. |

ITEM 2 – Code of Ethics
Not applicable for filing of semi-annual reports to shareholders.
ITEM 3 – Audit Committee Financial Expert
Not applicable for filing of semi-annual reports to shareholders.
ITEM 4 – Principal Accountant Fees and Services
Not applicable for filing of semi-annual reports to shareholders.
ITEM 5 – Audit Committee of Listed Registrants
Not applicable to this Registrant, insofar as the Registrant is not a listed issuer as defined in Rule 10A-3 under the Securities Exchange Act of 1934.
ITEM 6 – Schedule of Investments
Fundamental Investors®
Investment portfolio
June 30, 2016
Common stocks 95.61%
Information technology 17.66% | Shares | Value
(000) |
| Microsoft Corp. | 56,741,000 | $2,903,437 |
| Broadcom Ltd. | 13,107,132 | 2,036,848 |
| Taiwan Semiconductor Manufacturing Co., Ltd.1 | 190,310,000 | 962,315 |
| Taiwan Semiconductor Manufacturing Co., Ltd. (ADR) | 6,438,430 | 168,880 |
| Texas Instruments Inc. | 17,150,300 | 1,074,466 |
| Intel Corp. | 26,657,073 | 874,352 |
| Alphabet Inc., Class C2 | 754,317 | 522,063 |
| Alphabet Inc., Class A2 | 442,800 | 311,523 |
| ASML Holding NV1 | 5,230,030 | 518,417 |
| ASML Holding NV (New York registered) | 3,141,000 | 311,618 |
| Apple Inc. | 6,505,000 | 621,878 |
| Visa Inc., Class A | 7,750,000 | 574,818 |
| Intuit Inc. | 4,180,000 | 466,530 |
| Amphenol Corp., Class A | 6,750,000 | 386,978 |
| International Business Machines Corp. | 2,100,000 | 318,738 |
| Baidu, Inc., Class A (ADR)2 | 1,890,000 | 312,134 |
| Analog Devices, Inc. | 4,999,000 | 283,143 |
| MasterCard Inc., Class A | 2,500,000 | 220,150 |
| Murata Manufacturing Co., Ltd.1 | 1,370,000 | 153,684 |
| TE Connectivity Ltd. | 2,300,000 | 131,353 |
| Facebook, Inc., Class A2 | 830,000 | 94,852 |
| KLA-Tencor Corp. | 825,140 | 60,442 |
| | | 13,308,619 |
| Consumer discretionary 16.18% | | |
| Amazon.com, Inc.2 | 4,404,800 | 3,152,163 |
| Home Depot, Inc. | 14,110,000 | 1,801,706 |
| Comcast Corp., Class A | 27,211,000 | 1,773,885 |
| McDonald’s Corp. | 6,340,000 | 762,956 |
| Time Warner Inc. | 6,600,000 | 485,364 |
| Twenty-First Century Fox, Inc., Class A | 17,125,000 | 463,231 |
| Walt Disney Co. | 4,640,000 | 453,885 |
| Expedia, Inc. | 3,887,000 | 413,188 |
| Las Vegas Sands Corp. | 8,600,000 | 374,014 |
| Newell Rubbermaid Inc. | 6,335,000 | 307,691 |
| Target Corp. | 4,400,000 | 307,208 |
| Priceline Group Inc.2 | 244,284 | 304,966 |
| CBS Corp., Class B | 4,480,000 | 243,891 |
| Johnson Controls, Inc. | 5,400,000 | 239,004 |
| Liberty Global PLC, Class C2 | 4,389,811 | 125,768 |
| Liberty Global PLC, Class A2 | 3,863,679 | 112,279 |
| Starbucks Corp. | 4,000,000 | 228,480 |
| Viacom Inc., Class B | 5,500,000 | 228,085 |
| Macy’s, Inc. | 5,200,000 | 174,772 |
| Charter Communications, Inc., Class A2 | 757,719 | 173,245 |
| NIKE, Inc., Class B | 719,800 | 39,733 |
| Liberty Global PLC LiLAC, Class C2 | 293,644 | 9,541 |
Fundamental Investors — Page 1 of 5
Common stocks
Consumer discretionary (continued) | Shares | Value
(000) |
| Liberty Global PLC LiLAC, Class A2 | 107,760 | $3,476 |
| Ralph Lauren Corp., Class A | 126,600 | 11,346 |
| | | 12,189,877 |
| Financials 12.19% | | |
| JPMorgan Chase & Co. | 18,891,400 | 1,173,912 |
| Berkshire Hathaway Inc., Class A2 | 4,625 | 1,003,509 |
| Wells Fargo & Co. | 17,435,000 | 825,199 |
| CME Group Inc., Class A | 6,371,437 | 620,578 |
| SunTrust Banks, Inc. | 14,564,097 | 598,293 |
| Capital One Financial Corp. | 9,212,000 | 585,054 |
| Chubb Ltd. | 4,350,000 | 568,588 |
| BlackRock, Inc. | 1,363,100 | 466,903 |
| Goldman Sachs Group, Inc. | 3,097,000 | 460,152 |
| Citigroup Inc. | 10,700,000 | 453,573 |
| Crown Castle International Corp. | 3,557,039 | 360,790 |
| Discover Financial Services | 5,730,000 | 307,071 |
| Legal & General Group PLC1 | 109,784,921 | 284,558 |
| Weyerhaeuser Co.2 | 9,000,107 | 267,933 |
| American International Group, Inc. | 4,666,700 | 246,822 |
| American Tower Corp. | 2,000,000 | 227,220 |
| CNO Financial Group, Inc.3 | 11,900,000 | 207,774 |
| Equinix, Inc. | 385,174 | 149,344 |
| Svenska Handelsbanken AB, Class A1 | 11,460,000 | 138,624 |
| PNC Financial Services Group, Inc. | 1,350,000 | 109,877 |
| Aegon NV1 | 22,277,585 | 88,862 |
| HDFC Bank Ltd. (ADR) | 414,250 | 27,485 |
| Arch Capital Group Ltd.2 | 170,000 | 12,240 |
| | | 9,184,361 |
| Consumer staples 10.98% | | |
| Philip Morris International Inc. | 25,295,000 | 2,573,007 |
| Coca-Cola Co. | 20,285,000 | 919,519 |
| Procter & Gamble Co. | 10,275,000 | 869,984 |
| Kroger Co. | 18,879,000 | 694,559 |
| Reynolds American Inc. | 12,816,340 | 691,185 |
| Walgreens Boots Alliance, Inc. | 5,856,000 | 487,629 |
| Kraft Heinz Co. | 4,900,000 | 433,552 |
| Altria Group, Inc. | 5,750,000 | 396,520 |
| British American Tobacco PLC1 | 5,905,000 | 384,241 |
| Campbell Soup Co. | 4,000,000 | 266,120 |
| Diageo PLC1 | 7,000,000 | 195,869 |
| Costco Wholesale Corp. | 1,035,000 | 162,536 |
| CVS Health Corp. | 1,225,931 | 117,371 |
| Coca-Cola Enterprises, Inc. | 2,150,000 | 76,734 |
| | | 8,268,826 |
| Health care 10.93% | | |
| Medtronic PLC | 12,705,000 | 1,102,413 |
| Merck & Co., Inc. | 17,710,000 | 1,020,273 |
| UnitedHealth Group Inc. | 5,501,500 | 776,812 |
| Boston Scientific Corp.2 | 31,600,000 | 738,492 |
| Express Scripts Holding Co.2 | 7,856,333 | 595,510 |
| Bristol-Myers Squibb Co. | 7,698,300 | 566,210 |
| Aetna Inc. | 4,242,000 | 518,075 |
Fundamental Investors — Page 2 of 5
Common stocks
Health care (continued) | Shares | Value
(000) |
| Vertex Pharmaceuticals Inc.2 | 5,925,000 | $509,668 |
| Gilead Sciences, Inc. | 5,698,790 | 475,393 |
| Thermo Fisher Scientific Inc. | 3,100,000 | 458,056 |
| Regeneron Pharmaceuticals, Inc.2 | 1,043,500 | 364,422 |
| Novartis AG1 | 3,420,000 | 281,342 |
| Johnson & Johnson | 2,100,000 | 254,730 |
| Humana Inc. | 1,190,000 | 214,057 |
| Pfizer Inc. | 4,793,000 | 168,762 |
| Hologic, Inc.2 | 3,565,000 | 123,349 |
| Abbott Laboratories | 1,656,771 | 65,128 |
| | | 8,232,692 |
| Industrials 10.18% | | |
| General Electric Co. | 41,830,000 | 1,316,808 |
| Boeing Co. | 9,595,000 | 1,246,103 |
| Lockheed Martin Corp. | 3,283,200 | 814,792 |
| Parker-Hannifin Corp. | 4,550,000 | 491,628 |
| Union Pacific Corp. | 5,575,000 | 486,419 |
| Rockwell Automation | 3,500,000 | 401,870 |
| Northrop Grumman Corp. | 1,640,000 | 364,539 |
| TransDigm Group Inc.2 | 1,352,000 | 356,509 |
| Caterpillar Inc. | 4,275,000 | 324,088 |
| Honeywell International Inc. | 2,400,000 | 279,168 |
| Deere & Co. | 3,000,000 | 243,120 |
| Republic Services, Inc. | 3,500,000 | 179,585 |
| Norfolk Southern Corp. | 1,934,600 | 164,692 |
| Ingersoll-Rand PLC | 2,500,000 | 159,200 |
| KAR Auction Services, Inc. | 3,500,000 | 146,090 |
| Ryanair Holdings PLC (ADR) | 1,803,750 | 125,433 |
| Cummins Inc. | 1,010,000 | 113,564 |
| MTU Aero Engines AG1 | 1,120,089 | 104,783 |
| Grafton Group PLC, units1,3 | 15,037,000 | 99,650 |
| Waste Management, Inc. | 1,400,000 | 92,778 |
| Meggitt PLC1 | 11,759,014 | 63,788 |
| Airbus Group SE, non-registered shares1 | 975,000 | 56,617 |
| Masco Corp. | 1,278,878 | 39,568 |
| | | 7,670,792 |
| Energy 9.01% | | |
| Schlumberger Ltd. | 14,028,400 | 1,109,366 |
| ConocoPhillips | 16,710,000 | 728,556 |
| Royal Dutch Shell PLC, Class B (ADR) | 6,620,734 | 370,761 |
| Royal Dutch Shell PLC, Class B1 | 10,233,720 | 281,420 |
| Royal Dutch Shell PLC, Class A (ADR) | 91,111 | 5,031 |
| Royal Dutch Shell PLC, Class A (GBP denominated)1 | 57,986 | 1,583 |
| Chevron Corp. | 5,726,137 | 600,271 |
| Enbridge Inc. (CAD denominated) | 11,984,914 | 507,709 |
| EOG Resources, Inc. | 4,395,000 | 366,631 |
| Suncor Energy Inc. | 12,598,934 | 349,507 |
| Suncor Energy Inc. | 397,100 | 11,016 |
| Concho Resources Inc.2 | 2,970,200 | 354,256 |
| Helmerich & Payne, Inc. | 4,400,000 | 295,372 |
| Peyto Exploration & Development Corp.3 | 10,332,287 | 277,351 |
| BP PLC1 | 46,528,700 | 271,697 |
| Baker Hughes Inc. | 4,500,000 | 203,085 |
Fundamental Investors — Page 3 of 5
Common stocks
Energy (continued) | Shares | Value
(000) |
| Murphy Oil Corp. | 6,281,900 | $199,450 |
| Cimarex Energy Co. | 1,565,000 | 186,736 |
| Noble Energy, Inc. | 4,746,400 | 170,253 |
| TOTAL SA (ADR) | 2,016,287 | 96,983 |
| TOTAL SA1 | 1,082,331 | 52,192 |
| Phillips 66 | 1,709,488 | 135,631 |
| Southwestern Energy Co.2 | 8,000,000 | 100,640 |
| Halliburton Co. | 1,995,000 | 90,353 |
| CONSOL Energy Inc. | 1,600,000 | 25,744 |
| | | 6,791,594 |
| Materials 3.17% | | |
| E.I. du Pont de Nemours and Co. | 17,046,125 | 1,104,589 |
| Praxair, Inc. | 7,155,000 | 804,150 |
| FMC Corp. | 5,412,072 | 250,633 |
| LyondellBasell Industries NV | 2,640,000 | 196,469 |
| HudBay Minerals Inc. | 6,744,900 | 32,212 |
| | | 2,388,053 |
| Telecommunication services 0.83% | | |
| Verizon Communications Inc. | 4,652,004 | 259,768 |
| SoftBank Group Corp.1 | 3,740,000 | 211,590 |
| AT&T Inc. | 3,600,000 | 155,556 |
| | | 626,914 |
| Utilities 0.21% | | |
| PG&E Corp. | 2,500,000 | 159,800 |
| Miscellaneous 4.27% | | |
| Other common stocks in initial period of acquisition | | 3,218,559 |
| Total common stocks (cost: $49,328,163,000) | | 72,040,087 |
| Short-term securities 4.37% | Principal amount
(000) | |
| Alphabet Inc. 0.41% due 8/11/20164 | $50,000 | 49,977 |
| Apple Inc. 0.40%–0.51% due 7/1/2016–9/12/20164 | 226,700 | 226,643 |
| CAFCO, LLC 0.57%–0.60% due 8/12/2016–9/15/20164 | 150,000 | 149,882 |
| Caterpillar Financial Services Corp. 0.48% due 8/4/2016 | 19,700 | 19,691 |
| Chevron Corp. 0.42%–0.53% due 7/12/2016–7/14/20164 | 50,000 | 49,994 |
| Citibank, N.A. 0.78% due 11/15/2016 | 75,000 | 75,013 |
| Coca-Cola Co. 0.50% due 7/12/20164 | 70,000 | 69,992 |
| Fannie Mae 0.40%–0.44% due 7/19/2016–10/7/2016 | 80,000 | 79,965 |
| Federal Farm Credit Banks 0.48% due 11/10/2016 | 30,600 | 30,556 |
| Federal Home Loan Bank 0.26%–0.59% due 7/5/2016–2/16/2017 | 1,502,270 | 1,501,574 |
| Freddie Mac 0.33%–0.48% due 9/7/2016–1/3/2017 | 292,200 | 291,818 |
| Intel Corp. 0.41% due 8/30/2016 | 13,200 | 13,190 |
| Johnson & Johnson 0.30% due 7/1/20164 | 65,000 | 65,000 |
| Jupiter Securitization Co., LLC 1.00% due 10/18/20164 | 25,500 | 25,444 |
| Microsoft Corp. 0.45%–0.47% due 8/3/2016–10/5/20164 | 110,700 | 110,602 |
| PepsiCo Inc. 0.40%–0.41% due 7/15/2016–8/10/20164 | 75,000 | 74,970 |
| Pfizer Inc. 0.41%–0.55% due 8/24/2016–9/16/20164 | 109,110 | 109,000 |
| Qualcomm Inc. 0.43%–0.51% due 7/7/2016–9/27/20164 | 79,500 | 79,443 |
| U.S. Treasury Bills 0.41% due 12/8/2016 | 70,000 | 69,914 |
Fundamental Investors — Page 4 of 5
| Short-term securities | Principal amount
(000) | Value
(000) |
| United Parcel Service Inc. 0.49% due 7/1/20164 | $31,200 | $31,200 |
| Wal-Mart Stores, Inc. 0.38% due 7/25/20164 | 83,000 | 82,978 |
| Walt Disney Co. 0.50% due 7/22/20164 | 57,000 | 56,986 |
| Wells Fargo Bank, N.A. 0.81% due 8/16/2016 | 30,500 | 30,508 |
| Total short-term securities (cost: $3,293,924,000) | | 3,294,340 |
| Total investment securities 99.98% (cost: $52,622,087,000) | | 75,334,427 |
| Other assets less liabilities 0.02% | | 18,493 |
| Net assets 100.00% | | $75,352,920 |
As permitted by U.S. Securities and Exchange Commission regulations, “Miscellaneous” securities include holdings in their first year of acquisition that have not previously been publicly disclosed.
The following footnotes apply to either the individual securities noted or one or more of the securities aggregated and listed as a single line item.
| 1 | Valued under fair value procedures adopted by authority of the board of trustees. The total value of all such securities, including those in “Miscellaneous,“ was $4,627,304,000, which represented 6.14% of the net assets of the fund. This entire amount relates to certain securities trading outside the U.S. whose values were adjusted as a result of significant market movements following the close of local trading. |
| 2 | Security did not produce income during the last 12 months. |
| 3 | Represents an affiliated company as defined under the Investment Company Act of 1940. |
| 4 | Acquired in a transaction exempt from registration under Section 4(2) of the Securities Act of 1933. May be resold in the U.S. in transactions exempt from registration, normally to qualified institutional buyers. The total value of all such securities was $1,082,171,000, which represented 1.44% of the net assets of the fund. |
| |
| |
| Key to abbreviations |
| ADR = American Depositary Receipts |
| CAD = Canadian dollars |
| GBP = British pounds |
Investments are not FDIC-insured, nor are they deposits of or guaranteed by a bank or any other entity, so they may lose value.
Investors should carefully consider investment objectives, risks, charges and expenses. This and other important information is contained in the fund prospectus and summary prospectus, which can be obtained from your financial professional and should be read carefully before investing. You may also call American Funds Service Company (AFS) at (800) 421-4225 or visit the American Funds website at americanfunds.com.
| MFGEFPX-010-0816O-S54139 | Fundamental Investors — Page 5 of 5 |
ITEM 7 – Disclosure of Proxy Voting Policies and Procedures for Closed-End Management Investment Companies
Not applicable to this Registrant, insofar as the Registrant is not a closed-end management investment company.
ITEM 8 – Portfolio Managers of Closed-End Management Investment Companies
Not applicable to this Registrant, insofar as the Registrant is not a closed-end management investment company.
ITEM 9 – Purchases of Equity Securities by Closed-End Management Investment Company and Affiliated Purchasers
Not applicable to this Registrant, insofar as the Registrant is not a closed-end management investment company.
ITEM 10 – Submission of Matters to a Vote of Security Holders
There have been no material changes to the procedures by which shareholders may recommend nominees to the Registrant’s board of trustees since the Registrant last submitted a proxy statement to its shareholders. The procedures are as follows. The Registrant has a nominating and governance committee comprised solely of persons who are not considered ‘‘interested persons’’ of the Registrant within the meaning of the Investment Company Act of 1940, as amended. The committee periodically reviews such issues as the board’s composition, responsibilities, committees, compensation and other relevant issues, and recommends any appropriate changes to the full board of trustees. While the committee normally is able to identify from its own resources an ample number of qualified candidates, it will consider shareholder suggestions of persons to be considered as nominees to fill future vacancies on the board. Such suggestions must be sent in writing to the nominating and governance committee of the Registrant, c/o the Registrant’s Secretary, and must be accompanied by complete biographical and occupational data on the prospective nominee, along with a written consent of the prospective nominee for consideration of his or her name by the nominating and governance committee.
ITEM 11 – Controls and Procedures
| (a) | The Registrant’s Principal Executive Officer and Principal Financial Officer have concluded, based on their evaluation of the Registrant’s disclosure controls and procedures (as such term is defined in Rule 30a-3 under the Investment Company Act of 1940), that such controls and procedures are adequate and reasonably designed to achieve the purposes described in paragraph (c) of such rule. |
| | |
| (b) | There were no changes in the Registrant’s internal controls over financial reporting (as defined in Rule 30a-3(d) under the Investment Company Act of 1940) that occurred during the Registrant’s second fiscal quarter of the period covered by this report that has materially affected, or is reasonably likely to materially affect, the Registrant’s internal control over financial reporting. |
ITEM 12 – Exhibits
| (a)(1) | Not applicable for filing of semi-annual reports to shareholders. |
| | |
| (a)(2) | The certifications required by Rule 30a-2 of the Investment Company Act of 1940 and Sections 302 and 906 of the Sarbanes-Oxley Act of 2002 are attached as exhibits hereto. |
SIGNATURES
Pursuant to the requirements of the Securities Exchange Act of 1934 and the Investment Company Act of 1940, the Registrant has duly caused this report to be signed on its behalf by the undersigned, thereunto duly authorized.
| | AMERICAN FUNDS FUNDAMENTAL INVESTORS |
| | |
| | By /s/ Paul F. Roye |
| | Paul F. Roye, Executive Vice President and Principal Executive Officer |
| | |
| | Date: August 31, 2016 |
Pursuant to the requirements of the Securities Exchange Act of 1934 and the Investment Company Act of 1940, this report has been signed below by the following persons on behalf of the Registrant and in the capacities and on the dates indicated.
| By /s/ Paul F. Roye |
Paul F. Roye, Executive Vice President and Principal Executive Officer |
| |
| Date: August 31, 2016 |
| By /s/ Kimberley H. Monasterio |
Kimberley H. Monasterio, Treasurer and Principal Financial Officer |
| |
| Date: August 31, 2016 |