UNITED STATES
SECURITIES AND EXCHANGE COMMISSION
Washington, D.C. 20549
FORM N-CSR
CERTIFIED SHAREHOLDER REPORT OF REGISTERED
MANAGEMENT INVESTMENT COMPANIES
Investment Company Act file number: 811- 01494
General Electric RSP U.S. Equity Fund
(Exact name of registrant as specified in charter)
1600 Summer Street
Stamford, Connecticut 06905
(Address of principal executive offices)(Zip code)
GE Asset Management, Inc.
1600 Summer Street
Stamford, Connecticut 06905
(Name and Address of Agent for Service)
Registrant’s telephone number, including area code: 800-242-0134
Date of fiscal year end: 12/31
Date of reporting period: 12/31/15
| Item 1. | Reports to Stockholders |
GE RSP Funds
U.S. Equity Fund
Income Fund
Annual Report
December 31, 2015


The information provided on the performance pages relates to the GE RSP U.S. Equity Fund and GE RSP Income Fund (each a “Fund” and collectively the “Funds”).
Total returns take into account changes in share price and assume reinvestment of dividends and capital gains distributions, if any. Total returns shown are net of Fund expenses.
The performance data quoted represents past performance; past performance does not guarantee future results. Investment return and principal value will fluctuate so your shares, when redeemed, may be worth more or less than their original cost. Current performance may be higher or lower than the performance data quoted. Periods less than one year are not annualized. Please call toll-free (800) 242-0134 or visit the Funds’ website at http://www.geam.com for the most recent month-end performance data.
An investment in a Fund is not a deposit of any bank and is not insured or guaranteed by the Federal Deposit Insurance Corporation (FDIC) or any other government agency. An investment in a Fund is subject to risk, including possible loss of principal invested.
The Standard & Poor’s (“S&P”) 500® Composite Price Index of stocks (“S&P 500 Index”) is an unmanaged, market capitalization-weighted index of stocks of 500 large U.S. companies, which is widely used as a measure of large-cap stock market performance.
The Barclays U.S. Aggregate Bond Index is an unmanaged market value-weighted index of taxable investment grade debt issues, including government, corporate, asset-backed and mortgage-backed securities, with maturities of one year or more. This index is designed to represent the performance of the U.S. investment-grade first rate bond market.
The results shown for the foregoing indices assume the reinvestment of net dividends or interest and do not reflect fees, expenses, or taxes. As such, index returns do not reflect the actual cost of investing in the instruments that comprise an index.
The peer universe of underlying funds used for the peer group average annual total return calculation is based on a blend of Morningstar peer categories, as shown.
Morningstar is an independent mutual fund rating service. A Fund’s performance may be compared to or ranked within a universe of mutual funds with investment objectives and policies similar but not necessarily identical to that of the Fund.
©2016 Morningstar, Inc. All Rights Reserved. The Morningstar information contained herein: (1) is proprietary to Morningstar and/or its content providers; (2) may not be copied or distributed; and (3) is not warranted to be accurate, complete or timely. Neither Morningstar nor its content providers are responsible for any damage or losses relating from any use of this information. Past performance is no guarantee of future results.
The views expressed in this document reflect our judgment as of the publication date and are subject to change at any time without notice.
1
(Unaudited)


David B. Carlson
Chief Investment Officer — U.S. Equities

Stephen V. Gelhaus
Senior Vice President

Paul C. Reinhardt
Senior Vice President
The GE RSP U.S. Equity Fund is managed by a team of portfolio managers that includes David B. Carlson, Stephen V. Gelhaus, and Paul C. Reinhardt. Each of the foregoing portfolio managers manages one of three sub-portfolios, which comprise the Fund. A sub-portfolio refers to the portion of the Fund’s assets that are allocated to, and managed by, a particular portfolio manager on the Fund’s portfolio management team. The three sub-portfolios are managed independently of each other and the portfolio managers have full discretion over their sub-portfolio. However, as lead portfolio manager for the Fund, Mr. Carlson is vested with the authority to adjust the allocation of assets to each sub-portfolio.
David B. Carlson is Chief Investment Officer — U.S. Equities at GE Asset Management (GEAM). He manages the overall U.S. equity investments for GEAM. Mr. Carlson has served as a portfolio manager for the GE RSP U.S. Equity Fund since May 2011. Mr. Carlson joined GEAM in 1982 as a securities analyst for investment operations. He became a Vice President for Mutual Fund Portfolios in 1987, a Senior Vice President in 1989 and an Executive Vice President in 2003.
Stephen V. Gelhaus is a Senior Vice President of GEAM. He has served as a portfolio manager for the GE RSP U.S. Equity Fund since January 2002. Mr. Gelhaus joined GEAM in June 1991 and was a research analyst in the U.S. Equities group from 1995 through 2001.
Paul C. Reinhardt is a Senior Vice President of GEAM. He has served as a portfolio manager for the GE RSP U.S. Equity Fund since January 2001. Mr. Reinhardt joined GEAM in 1982 as an equity analyst and has been a portfolio manager since 1987.
| Q. | How did the GE RSP U.S. Equity Fund perform compared to its benchmark and Morningstar peer group for the twelve-month period ended December 31, 2015? |
| A. | For the twelve-month period ended December 31, 2015, the Fund returned -2.05%. The S&P 500® Index (S&P 500 Index), the Fund’s benchmark, returned 1.38% and the Fund’s Morningstar peer group of 1,650 U.S. Large Blend Funds returned an average of -1.46% over the same period. |
| Q. | What market factors affected the Fund’s performance? |
| A. | From a price perspective, the flat performance of the S&P 500 Index belied tremendous volatility in sectors of the economy and markets around the globe. Several macro themes have driven the market, including the strengthening U.S. dollar, low interest rates and falling energy prices. Energy dropped 21% — the worst performing S&P 500 Index sector. Growth concerns stemming from China and the emerging markets exacerbated commodity weakness, creating headwinds for materials and industrial companies, while a strong dollar pressured many multi-nationals. In the past year the growth style of investing has significantly outperformed value, in part because of relative strength in some of the higher-priced momentum driven Internet and technology stocks. The Fund underperformed the S&P 500 Index due in part due to its valuation-conscious discipline in each of the underlying portfolios in this multi-manager Fund. It also seems that a portfolio’s positioning in what have been dubbed the “FANG” stocks mattered (i.e., Facebook, Amazon, Netflix and Google). |
| Q. | What were the primary drivers behind Fund performance? |
| A. | The Fund’s sector allocation effect was positive, bolstered by overweights in consumer discretionary and health care; two of the period’s strongest performing S&P 500 sectors. In these sectors, Amazon (+118%), Boston Scientific (+42%), Actavis (+23%), and Lowe’s (+14%) contributed most positively to portfolio returns. Underweighting the struggling energy and materials sectors was another positive factor. Underperformance for the Fund, therefore, was driven mostly by positioning for higher interest rates and individual stock selections within sectors. |
| | Stock selection among technology companies was a key driver of Fund |
2
(Unaudited)

| | performance relative to the S&P 500 Index. Western Digital (-35%) paid dearly for its SanDisk acquisition and we reduced the position. Qualcomm (-29%) suffered unexpected market share losses and we trimmed the holding to reflect changing market dynamics. Baidu (-17%) weighed on returns as it invested in new businesses to bolster its leading on-line presence in China. We believed Baidu’s margin compression would be short-lived and added to the position on weakness (in fact, it was performing better in the last quarter of 2015). Other lagging older-line tech names included Hewlett Packard (-32% and reduced) and EMC (-12% and eliminated). Fed tightening expectations got pushed out over the course of the year, and our tilt towards higher rates was not rewarded in this scenario. The Fund was underweight in the high yielding REITs, and over weighted interest-rate and market sensitive financials holdings (e.g., Ameriprise -15% Invesco -13%, and State Street -10%). American Express (-16%) underperformed as profit outlook dimmed, losing key customers (we eliminated the name). As oil prices pulled back, commodity-sensitive companies like Cenovus (-36%), Hess (-31%), Archer Daniels Midland (-26%), Monsanto (-14%) and Schlumberger (-14%) underperformed. |
| Q. | Were there any significant changes in the Fund during the period? |
| A. | The Fund ended the year with 94 equity holdings, exactly flat with the beginning of 2015. There were no changes in terms of the process; however we took advantage of market swings to upgrade certain holdings. For example, media was a challenging place to invest this year, as investors grew concerned about cord-cutting and the demise of traditional media. We eliminated Discovery — a content provider caught in the cross hairs of this debate — and added SiriusXM, a satellite radio broadcaster immune to cord-cutting fears. We eliminated EMC in technology, for example, as fears of slowing growth in traditional enterprise storage impaired its growth rate. We added to Google and initiated a new position in VMWare, with more exposure to Cloud data storage. In industrials we added to more domestically-oriented industries including defense/aerospace, professional services, and the airlines which |
| | benefitted from falling oil prices. We switched from Dover to United Rentals to reduce energy end-market exposure in the industrial sector. |
| | At year-end, the Fund’s largest sector overweights were in health care and financials. Consumer discretionary went from a key overweight to an underweight, due to eliminations of some auto-related companies (BorgWarner and AutoZone), selected retailers (Target and Dick’s Sporting Goods) and Discovery in media. Despite any changes in positioning, the Fund maintained its bottom-up stock selection approach with a focus on the long-term investment horizon. We believe the Fund is well-positioned to add value through active stock selection going into the next year. |
3
(Unaudited)
Understanding Your Fund’s Expenses
As a shareholder of the Fund you incur ongoing costs. Ongoing costs include portfolio management fees, professional fees, administrative fees and other Fund expenses. The following example is intended to help you understand your ongoing costs (in dollars) of investing in the Fund and to compare these costs with the ongoing costs of investing in other mutual funds.
To illustrate these ongoing costs, we have provided an example and calculated the expenses paid by investors in shares of the Fund during the period. The information in the following table is based on an investment of $1,000, which is invested at the beginning of the period and held for the entire six-month period ended December 31, 2015.
Actual Expenses
The first section of the table provides information about actual account values and actual expenses. You may use the information in this section, together with the amount you invested, to estimate the expenses that you paid over the period. To do so, simply divide your account value by $1,000 (for example, an $8,600 account value divided by $1,000 = 8.6), then multiply the result by the number given under the heading “Expenses paid during
the period” to estimate the expenses you paid on your account during the period.
Hypothetical Example for Comparison Purposes
The second section of the table provides information about hypothetical account values and hypothetical expenses based on the Fund’s actual expense ratio and an assumed rate of return of 5% per year before expenses, which is not the Fund’s actual return. The hypothetical account values and expenses may not be used to estimate the actual ending account balance or expenses you paid for the period. You may use this information to compare the ongoing costs of investing in the Fund and other funds. To do so, compare this 5% hypothetical example with the 5% hypothetical examples that appear in the shareholders reports of other funds.
Please note that the expenses shown in the table are meant to highlight and help you compare ongoing costs only and do not reflect transaction costs, such as sales charges or redemption fees, if any. Therefore, the second section of the table is useful in comparing ongoing costs only, and will not help you determine the relative total costs of owning different funds.
July 1, 2015 – December 31, 2015
| | | | | | | | | | | | |
| | | Account value at
the beginning of
the period ($) | | | Account value
at the end of
the period ($) | | | Expenses
paid during
the period ($)* | |
Actual Fund Return | | | 1,000.00 | | | | 967.00 | | | | 0.84 | |
Hypothetical 5% Return
(2.5% for the period) | | | 1,000.00 | | | | 1,024.35 | | | | 0.87 | |
| * | | Expenses are equal to the Fund’s annualized net expense ratio of 0.17%** (for the period July 1, 2015 – December 31, 2015), multiplied by the average account value over the period, multiplied by 184/365 (to reflect the one-half year period). |
| ** | | May differ from expense ratio disclosed in the financial highlights, which is calculated based on the entire fiscal year’s data. |
4
(Unaudited)
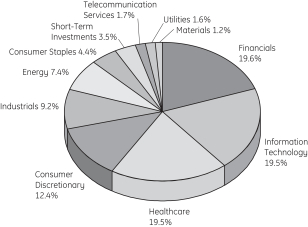
A mutual fund designed for investors who seek long-term growth of capital and income. The Fund seeks to achieve its investment objectives by investing at least 80% of its net assets under normal circumstances in equity securities of U.S. companies, such as common and preferred stocks.
(as a % of Fair Value of Investments of $4,935,053 (in thousands) on December 31, 2015) (a)
| | | | |
Allergan PLC | | | 3.33% | |
JPMorgan Chase & Co. | | | 2.82% | |
Comcast Corp., Class A | | | 2.74% | |
Amgen Inc. | | | 2.72% | |
Apple Inc. | | | 2.40% | |
Johnson & Johnson | | | 2.16% | |
Exxon Mobil Corp. | | | 2.14% | |
Cisco Systems Inc. | | | 2.10% | |
Medtronic PLC | | | 2.03% | |
PepsiCo Inc. | | | 1.99% | |
Portfolio composition as a % of Fair Value of Investments of $4,935,053 (in thousands) on December 31, 2015 (a)
|
| Morningstar Performance Comparison |
Based on average annual returns for periods ended December 31, 2015
| | | | | | | | | | | | |
| | | One
Year | | | Five
Year | | | Ten
Year | |
Number of funds in peer group | | | 1,650 | | | | 1,420 | | | | 1,228 | |
Peer group average annual total return | | | -1.46 | % | | | 10.16 | % | | | 5.95 | % |
Morningstar Category in peer group: U.S. Large Growth | |
|
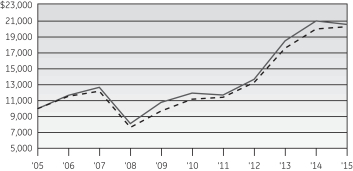
| Change in Value of a $10,000 Investment |

|
| Average Annual Total Return |
For the periods ended December 31, 2015
| | | | | | | | | | | | | | | | | | | | |
| | | One
Year | | Five
Year | | Ten
Year | | Ending value of a
$10,000
investment |
GE RSP U.S. Equity Fund | | | | -2.05% | | | | | 11.37% | | | | | 7.45% | | | | | $20,522 | |
S&P 500 Index | | | | 1.38% | | | | | 12.57% | | | | | 7.31% | | | | | $20,242 | |
| (a) | The securities information regarding holdings, allocations and other characteristics is presented to illustrate examples of securities that the Fund has bought and the diversity of areas in which the Fund may invest as of a particular date. It may not be representative of the Fund’s current or future investments and should not be construed as a recommendation to purchase or sell a particular security. |
See Notes to Performance beginning on page 1 for further information, including an explanation of Morningstar peer categories.
Past performance does not predict future performance. The performance shown in the graphs and tables does not reflect the deduction of taxes that a shareholder would pay on Fund distributions or the redemption of Fund shares and does not reflect the fees or charges that would be associated with variable contracts through which shares of the Fund are offered.
5
| | |
GE RSP U.S. Equity Fund | | December 31, 2015 |

| | | | | | | | | | |
| | | Number
of Shares | | | Fair
Value | | | |
Common Stock — 96.4%† |
|
Aerospace & Defense — 4.2% |
| | | |
General Dynamics Corp. | | | 284,343 | | | $ | 39,057,354 | | | |
Hexcel Corp. | | | 784,035 | | | | 36,418,426 | | | |
Honeywell International Inc. | | | 797,991 | | | | 82,647,928 | | | |
The Boeing Co. | | | 165,170 | | | | 23,881,930 | | | |
United Technologies Corp. | | | 250,495 | | | | 24,065,055 | | | |
| | | | | | | 206,070,693 | | | |
|
Agricultural Products — 0.8% |
| | | |
Archer-Daniels-Midland Co. | | | 1,091,523 | | | | 40,037,064 | | | |
|
Air Freight & Logistics — 0.3% |
| | | |
United Parcel Service Inc., Class B | | | 167,261 | | | | 16,095,526 | | | |
|
Airlines — 1.0% |
| | | |
Delta Air Lines Inc. | | | 1,003,565 | | | | 50,870,710 | | | |
|
Application Software — 0.7% |
| | | |
Intuit Inc. | | | 376,337 | | | | 36,316,520 | | | |
|
Asset Management & Custody Banks — 4.0% |
| | | |
Ameriprise Financial Inc. | | | 533,144 | | | | 56,737,185 | | | |
Invesco Ltd. | | | 2,108,356 | | | | 70,587,759 | | | |
State Street Corp. | | | 1,041,198 | | | | 69,093,899 | | | (e) |
| | | | | | | 196,418,843 | | | |
|
Auto Parts & Equipment — 0.7% |
| | | |
Delphi Automotive PLC | | | 382,609 | | | | 32,801,070 | | | |
|
Automobile Manufacturers — 0.6% |
| | | |
Ford Motor Co. | | | 2,090,760 | | | | 29,458,808 | | | |
|
Automotive Retail — 0.2% |
| | | |
Advance Auto Parts Inc. | | | 62,723 | | | | 9,440,439 | | | |
|
Biotechnology — 5.3% |
| | | |
Alexion Pharmaceuticals Inc. | | | 234,165 | | | | 44,666,974 | | | (a) |
Amgen Inc. | | | 825,850 | | | | 134,060,231 | | | |
Gilead Sciences Inc. | | | 829,265 | | | | 83,913,325 | | | |
| | | | | | | 262,640,530 | | | |
|
Broadcasting — 0.3% |
| | | |
CBS Corp., Class B | | | 271,799 | | | | 12,809,887 | | | |
|
Cable & Satellite — 4.3% |
| | | |
Comcast Corp., Class A | | | 2,395,467 | | | | 135,176,203 | | | |
Liberty Global PLC, Class C | | | 1,317,179 | | | | 53,701,388 | | | (a) |
Sirius XM Holdings Inc. | | | 5,435,976 | | | | 22,124,422 | | | (a) |
| | | | | | | 211,002,013 | | | |
| | | | | | | | | | |
| | | Number
of Shares | | | Fair
Value | | | |
|
Casinos & Gaming — 0.3% |
| | | |
Las Vegas Sands Corp. | | | 347,066 | | | $ | 15,215,373 | | | |
|
Communications Equipment — 3.7% |
| | | |
Cisco Systems Inc. | | | 3,815,637 | | | | 103,613,623 | | | |
QUALCOMM Inc. | | | 1,545,665 | | | | 77,260,065 | | | |
| | | | | | | 180,873,688 | | | |
|
Consumer Finance — 1.3% |
| | | |
Discover Financial Services | | | 1,244,002 | | | | 66,703,387 | | | |
|
Data Processing & Outsourced Services — 2.0% |
| | | |
PayPal Holdings Inc. | | | 752,674 | | | | 27,246,799 | | | (a) |
Visa Inc., Class A | | | 919,934 | | | | 71,340,881 | | | |
| | | | | | | 98,587,680 | | | |
|
Diversified Banks — 6.9% |
| | | |
Bank of America Corp. | | | 5,546,264 | | | | 93,343,623 | | | |
Citigroup Inc. | | | 250,891 | | | | 12,983,609 | | | |
JPMorgan Chase & Co. | | | 2,107,207 | | | | 139,138,878 | | | |
Wells Fargo & Co. | | | 1,756,238 | | | | 95,469,098 | | | |
| | | | | | | 340,935,208 | | | |
|
Diversified Chemicals — 0.1% |
| | | |
The Dow Chemical Co. | | | 146,353 | | | | 7,534,252 | | | |
|
Drug Retail — 0.2% |
| | | |
CVS Health Corp. | | | 104,538 | | | | 10,220,680 | | | |
|
Electric Utilities — 0.7% |
| | | |
NextEra Energy Inc. | | | 319,120 | | | | 33,153,377 | | | |
|
Fertilizers & Agricultural Chemicals — 0.9% |
| | | |
Monsanto Co. | | | 439,060 | | | | 43,256,191 | | | |
|
General Merchandise Stores — 0.9% |
| | | |
Dollar General Corp. | | | 614,683 | | | | 44,177,267 | | | |
|
Healthcare Distributors — 0.7% |
| | | |
Cardinal Health Inc. | | | 376,337 | | | | 33,595,604 | | | |
| | | |
Healthcare Equipment — 4.6% | | | | | | | | | | |
| | | |
Abbott Laboratories | | | 1,003,565 | | | | 45,070,104 | | | |
Boston Scientific Corp. | | | 3,491,569 | | | | 64,384,533 | | | (a) |
Medtronic PLC | | | 1,304,634 | | | | 100,352,447 | | | |
Stryker Corp. | | | 183,451 | | | | 17,049,936 | | | |
| | | | | | | 226,857,020 | | | |
|
Healthcare Supplies — 0.6% |
| | | |
The Cooper Companies Inc. | | | 204,894 | | | | 27,496,775 | | | |
|
Home Improvement Retail — 1.7% |
| | | |
Lowe’s Companies Inc. | | | 1,093,467 | | | | 83,147,231 | | | |
See Notes to Schedules of Investments and Notes to Financial Statements.
6
| | |
GE RSP U.S. Equity Fund | | December 31, 2015 |
| | | | | | | | | | |
| | | Number
of Shares | | | Fair
Value | | | |
|
Household Products — 0.3% |
| | | |
The Procter & Gamble Co. | | | 165,534 | | | $ | 13,145,055 | | | |
|
Independent Power Producers & Energy Traders — 0.2% |
| | | |
Calpine Corp. | | | 626,599 | | | | 9,066,887 | | | (a) |
|
Industrial Machinery — 1.5% |
| | | |
Dover Corp. | | | 182,519 | | | | 11,190,240 | | | |
Ingersoll-Rand PLC | | | 1,129,010 | | | | 62,422,963 | | | |
| | | | | | | 73,613,203 | | | |
|
Integrated Oil & Gas — 4.9% |
| | | |
Cenovus Energy Inc. | | | 1,998,108 | | | | 25,216,123 | | | |
Chevron Corp. | | | 491,329 | | | | 44,199,957 | | | |
Exxon Mobil Corp. | | | 1,355,108 | | | | 105,630,669 | | | |
Occidental Petroleum Corp. | | | 960,073 | | | | 64,910,535 | | | |
| | | | | | | 239,957,284 | | | |
|
Integrated Telecommunication Services — 0.5% |
| | | |
Verizon Communications Inc. | | | 585,413 | | | | 27,057,789 | | | |
|
Internet Retail — 1.5% |
| | | |
Amazon.com Inc. | | | 108,720 | | | | 73,482,761 | | | (a) |
|
Internet Software & Services — 6.3% |
| | | |
Alphabet Inc., Class A | | | 86,072 | | | | 66,964,877 | | | (a) |
Alphabet Inc., Class C | | | 104,538 | | | | 79,331,797 | | | (a) |
Baidu Inc. ADR | | | 301,069 | | | | 56,914,084 | | | (a) |
eBay Inc. | | | 1,824,560 | | | | 50,138,909 | | | (a) |
Facebook Inc., Class A | | | 355,429 | | | | 37,199,199 | | | (a) |
LinkedIn Corp., Class A | | | 100,356 | | | | 22,588,128 | | | (a) |
| | | | | | | 313,136,994 | | | |
|
Investment Banking & Brokerage — 1.0% |
| | | |
The Charles Schwab Corp. | | | 1,505,347 | | | | 49,571,077 | | | |
|
IT Consulting & Other Services — 0.3% |
| | | |
Cognizant Technology Solutions Corp., Class A | | | 278,013 | | | | 16,686,340 | | | (a) |
|
Life & Health Insurance — 0.5% |
| | | |
Lincoln National Corp. | | | 459,967 | | | | 23,117,941 | | | |
|
Movies & Entertainment — 2.0% |
| | | |
The Walt Disney Co. | | | 401,426 | | | | 42,181,844 | | | |
Time Warner Inc. | | | 909,481 | | | | 58,816,136 | | | |
| | | | | | | 100,997,980 | | | |
|
Multi-Line Insurance — 1.9% |
| | | |
American International Group Inc. | | | 439,235 | | | | 27,219,393 | | | |
The Hartford Financial Services Group Inc. | | | 1,553,448 | | | | 67,512,850 | | | |
| | | | | | | 94,732,243 | | | |
| | | | | | | | | | |
| | | Number
of Shares | | | Fair
Value | | | |
|
Multi-Utilities — 0.7% |
| | | |
Dominion Resources Inc. | | | 547,779 | | | $ | 37,051,772 | | | |
|
Oil & Gas Equipment & Services — 1.3% |
| | | |
Schlumberger Ltd. | | | 935,567 | | | | 65,255,798 | | | |
|
Oil & Gas Exploration & Production — 1.2% |
| | | |
Hess Corp. | | | 1,011,762 | | | | 49,050,222 | | | |
Marathon Oil Corp. | | | 838,257 | | | | 10,553,655 | | | |
| | | | | | | 59,603,877 | | | |
|
Packaged Foods & Meats — 1.1% |
| | | |
Mondelez International Inc., Class A | | | 1,170,826 | | | | 52,499,838 | | | |
|
Paper Packaging — 0.2% |
| | | |
Packaging Corporation of America | | | 146,353 | | | | 9,227,557 | | | |
|
Pharmaceuticals — 8.3% |
| | | |
Allergan PLC | | | 526,583 | | | | 164,557,188 | | | (a) |
Johnson & Johnson | | | 1,037,271 | | | | 106,548,477 | | | |
Merck & Company Inc. | | | 1,651,700 | | | | 87,242,794 | | | |
Pfizer Inc. | | | 1,641,247 | | | | 52,979,453 | | | |
| | | | | | | 411,327,912 | | | |
|
Property & Casualty Insurance — 0.9% |
| | | |
ACE Ltd. | | | 375,629 | | | | 43,892,249 | | | |
|
Railroads — 0.2% |
| | | |
CSX Corp. | | | 355,429 | | | | 9,223,382 | | | |
|
Real Estate Services — 0.3% |
| | | |
CBRE Group Inc., Class A | | | 406,524 | | | | 14,057,600 | | | (a) |
|
Regional Banks — 0.2% |
| | | |
First Republic Bank | | | 154,704 | | | | 10,219,746 | | | |
|
Research & Consulting Services — 1.2% |
| | | |
Nielsen Holdings PLC | | | 1,318,563 | | | | 61,445,036 | | | |
|
Semiconductor Equipment — 1.1% |
| | | |
Applied Materials Inc. | | | 2,843,434 | | | | 53,086,913 | | | |
|
Soft Drinks — 2.0% |
| | | |
PepsiCo Inc. | | | 980,566 | | | | 97,978,155 | | | |
|
Specialized Finance — 2.0% |
| | | |
CME Group Inc. | | | 564,505 | | | | 51,144,153 | | | |
McGraw Hill Financial Inc. | | | 501,782 | | | | 49,465,670 | | | |
| | | | | | | 100,609,823 | | | |
|
Specialized REITs — 0.6% |
| | | |
American Tower Corp. | | | 286,511 | | | | 27,777,241 | | | |
See Notes to Schedules of Investments and Notes to Financial Statements.
7
| | |
GE RSP U.S. Equity Fund | | December 31, 2015 |
| | | | | | | | | | |
| | | Number
of Shares | | | Fair
Value | | | |
|
Systems Software — 1.5% |
| | | |
Microsoft Corp. | | | 554,051 | | | $ | 30,738,750 | | | |
Oracle Corp. | | | 857,209 | | | | 31,313,845 | | | |
VMware Inc., Class A | | | 257,455 | | | | 14,564,229 | | | (a) |
| | | | | | | 76,616,824 | | | |
|
Technology Hardware, Storage & Peripherals — 3.8% |
| | | |
Apple Inc. | | | 1,124,829 | | | | 118,399,501 | | | |
HP Inc. | | | 2,487,999 | | | | 29,457,908 | | | |
Western Digital Corp. | | | 658,588 | | | | 39,548,209 | | | |
| | | | | | | 187,405,618 | | | |
|
Trading Companies & Distributors — 0.7% |
| | | |
United Rentals Inc. | | | 501,782 | | | | 36,399,266 | | | (a) |
|
Wireless Telecommunication Services — 1.2% |
| | | |
SBA Communications Corp., Class A | | | 561,157 | | | | 58,960,766 | | | (a) |
| | | |
Total Common Stock
(Cost $4,115,867,372) | | | | | | | 4,762,920,763 | | | |
| | | | | | | | | | |
| | | Principal Amount | | | Fair
Value | | | |
Short-Term Investments — 3.5% |
| | |
Time Deposit — 3.5% | | | | | | | |
| | | |
State Street Corp. | | | | | | | | | | |
0.01% 01/04/16 | | $ | 172,132,649 | | | $ | 172,132,649 | | | (e) |
(Cost $172,132,649) | | | | | | | | | | |
| | | |
Total Investments
(Cost $4,288,000,021) | | | | | | | 4,935,053,412 | | | |
| | | |
Other Assets and Liabilities, net — 0.1% | | | | | | | 6,483,867 | | | |
| | | | | | | | | | |
| | | |
NET ASSETS — 100.0% | | | | | | $ | 4,941,537,279 | | | |
| | | | | | | | | | |
See Notes to Schedules of Investments and Notes to Financial Statements.
8
(Unaudited)


William M. Healey
Senior Vice
President and
Chief Investment
Officer – Core
Fixed Income
Investments

Mark H. Johnson
Senior Vice
President and
Chief Investment
Officer – Insurance
and Long Duration
The GE RSP Income Fund (the “Fund”) is co-managed by William M. Healey and Mark H. Johnson. Messrs. Healey and Johnson are each responsible for a portion of the Fund, the size of which is determined by consensus and adjusted on a periodic basis, if necessary. Although each portfolio manager manages his portion of the Fund independent of the other, they are highly collaborative and communicative.
William M. Healey is a Senior Vice President and Chief Investment Officer – Core Fixed Income Investments of GEAM. He has served on the portfolio management team for the GE RSP Income Fund since joining GEAM as a portfolio manager in 1996. He became Vice President in June 2001, Senior Vice President in January 2007 and Chief Investment Officer – Core Fixed Income Investments in April 2012. Prior to joining GEAM, Mr. Healey spent over 11 years in the fixed income group at MetLife.
Mark H. Johnson is a Senior Vice President and Chief Investment Officer – Insurance and Long Duration of GEAM. He has been a member of the portfolio management team for the GE RSP Income Fund since 2007. Mr. Johnson joined GE in 1998 and GEAM as a Vice President and portfolio manager in 2002. He became Senior Vice President in 2007 and Chief Investment Officer – Long Duration Fixed Income & Insurance Investments in April 2012. Prior to joining GEAM, Mr. Johnson held positions at various insurance companies and public accounting firms.
| Q. | How did the GE RSP Income Fund perform compared to its benchmark for the twelve-month period ended December 31, 2015? |
| A. | For the twelve-month period ended December 31, 2015, the Fund returned 0.34%. The Barclay’s Capital U.S. Aggregate Bond Index, the Fund’s benchmark, returned 0.55% and the Fund’s Morningstar peer group of 1,086 U.S. Intermediate-Term Funds returned an average of -0.27% over the same period. |
| Q. | What market factors affected the Fund’s performance? |
| A. | The two major factors which affected the Fund’s performance were the movement in |
| | interest rates and credit spreads. The 10-year US Treasury note finished the year at 2.3%, up just 10 bps but traded down to 1.65% in January, then moved to 2.5% by the end of June before drifting down by year end as inflation remained well below the Fed’s target of 2%. The 2-year treasury yield, basically unchanged for the first nine months of the year, jumped from 0.65% to 1.05% in the fourth quarter as expectations for a Fed Funds rate hike became reality in December. Economic growth in the US slowed from 3% in Q1 to 2% (Bloomberg estimate) in Q4 as the price of oil plummeted over 30% and the US dollar rose 9% versus a basket of major world currencies. As economic growth decelerated, credit spreads widened putting pressure on corporate bond prices. The option-adjusted spread (OAS) of the Barclays Investment Grade Bond Index widened 35 bps beginning in May and the OAS of Barclays US High Yield Index hurt primarily by the energy sector widened 180 bps. |
| Q. | What were the primary drivers of Fund performance? |
| A. | The primary driver of the Fund’s underperformance versus its benchmark was the allocation to high yield securities which are not in the index. The significant widening of credit spreads resulted in a negative return for the high yield market of -4.5% and while the Fund was not heavily exposed to energy companies, the allocation was the largest performance detractor. The overweight in high grade corporate bonds also negatively impacted the Fund’s total return. Security selection among the high grade credit sector, primarily underweight commodity-related sectors and overweight financials, and residential mortgage-backed securities contributed positively to the Fund’s performance. Tactically trading the Fund’s duration relative to the index, as treasury yields bounced within a range, also benefited the Fund. |
9
(Unaudited)
| Q. | Were there any significant changes to the Fund during the period? |
| A. | The most significant change to the Fund was a general increase in the allocation to spread sectors during the year. The allocation to high grade credit started the year slightly overweight and ended the year 10% overweight by market value, which added roughly 0.3 years to the Fund’s spread duration. The allocation to commercial mortgage-backed securities was also increased from 3% to 10% overweight by market value and from 0.1 to 0.5 spread duration contribution. The Fund’s duration was tactically traded within neutral to 0.5 years long relative to the benchmark during the period. |
10
(Unaudited)

Understanding Your Fund’s Expenses
As a shareholder of the Fund you incur ongoing costs. Ongoing costs include portfolio management fees, professional fees, administrative fees and other Fund expenses. The following example is intended to help you understand your ongoing costs (in dollars) of investing in the Fund and to compare these costs with the ongoing costs of investing in other mutual funds.
To illustrate these ongoing costs, we have provided an example and calculated the expenses paid by investors in shares of the Fund during the period. The information in the following table is based on an investment of $1,000, which is invested at the beginning of the period and held for the entire six-month period ended December 31, 2015.
Actual Expenses
The first section of the table provides information about actual account values and actual expenses. You may use the information in this section, together with the amount you invested, to estimate the expenses that you paid over the period. To do so, simply divide your account value by $1,000 (for example, an $8,600 account value divided by $1,000 = 8.6), then multiply the result by the number given under the heading “Expenses
paid during the period” to estimate the expenses you paid on your account during the period.
Hypothetical Example for Comparison Purposes
The second section of the table provides information about hypothetical account values and hypothetical expenses based on the Fund’s actual expense ratio and an assumed rate of return of 5% per year before expenses, which is not the Fund’s actual return. The hypothetical account values and expenses may not be used to estimate the actual ending account balance or expenses you paid for the period. You may use this information to compare the ongoing costs of investing in the Fund and other funds. To do so, compare this 5% hypothetical example with the 5% hypothetical examples that appear in the shareholders reports of other funds.
Please note that the expenses shown in the table are meant to highlight and help you compare ongoing costs only and do not reflect transaction costs, such as sales charges or redemption fees, if any. Therefore, the second section of the table is useful in comparing ongoing costs only, and will not help you determine the relative total costs of owning different funds.
July 1, 2015 – December 31, 2015
| | | | | | | | | | | | |
| | | Account value at
the beginning of
the period ($) | | | Account value
at the end of
the period ($) | | | Expenses
paid during
the period ($)* | |
Actual Fund Return | | | 1,000.00 | | | | 1,003.20 | | | | 1.01 | |
Hypothetical 5% Return
(2.5% for the period) | | | 1,000.00 | | | | 1,024.20 | | | | 1.02 | |
| * | | Expenses are equal to the Fund’s annualized net expense ratio of 0.20%** (for the period July 1, 2015 – December 31, 2015), multiplied by the average account value over the period, multiplied by 184/365 (to reflect the one-half year period). |
| ** | | May differ from expense ratio disclosed in the financial highlights, which is calculated based on the entire fiscal year’s data. |
11
(Unaudited)
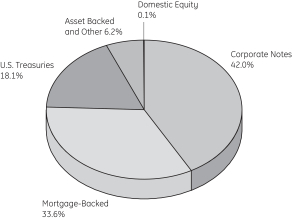
A mutual fund designed for investors who seek a high interest rate of return over a long-term period consistent with the preservation of capital. The Fund seeks to achieve its investment objective by investing at least 80% of its net assets under normal circumstances in debt securities and investing primarily in a variety of investment-grade debt securities, such as U.S. Government securities, mortgage-backed securities, corporate bonds, and money market instruments.
(as a % of Fair Value of Investments of $2,562,439 (in thousands) on December 31, 2015) (a)
| | | | |
| Moody’s/S&P/Rating * | | Percentage of
Fair Value | |
| |
Aaa / AAA | | | 3.9% | |
| |
Aa / AA | | | 48.7% | |
| |
A / A | | | 9.6% | |
| |
Baa / BBB | | | 20.8% | |
| |
Ba / BB and lower | | | 10.0% | |
| |
NR / Other | | | 7.0% | |
Portfolio composition as a % of Fair Value of Investments of $2,562,439 (in thousands) on December 31, 2015 (a)
|
| Morningstar Performance Comparison |
Based on average annual returns for periods ended December 31, 2015
| | | | | | | | | | | | |
| | | One
Year | | | Five
Year | | | Ten
Year | |
Number of funds in peer group | | | 1,086 | | | | 990 | | | | 860 | |
Peer group average annual total return | | | -0.27 | % | | | 3.17 | % | | | 3.98 | % |
Morningstar Category in peer group: Intermediate-Term Bond | |
|
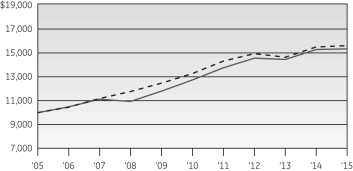
| Change in Value of a $10,000 Investment |

|
| Average Annual Total Return |
For the periods ended December 31, 2015
| | | | | | | | | | | | | | | | | | | | |
| | | One
Year | | Five
Year | | Ten
Year | | Ending value of a
$10,000
investment |
GE RSP Income Fund | | | | 0.34% | | | | | 3.78% | | | | | 4.34% | | | | | $15,300 | |
Barclays U.S. Aggregate Bond Index | | | | 0.55% | | | | | 3.25% | | | | | 4.51% | | | | | $15,552 | |
| (a) | The securities information regarding holdings, allocations and other characteristics is presented to illustrate examples of securities that the Fund has bought and the diversity of areas in which the Fund may invest as of a particular date. It may not be representative of the Fund’s current or future investments and should not be construed as a recommendation to purchase or sell a particular security. |
| * | Moody’s Investors Services, Inc. (“Moody’s”) and Standard & Poor’s Corporation (“S&P”) are nationally recognized statistical rating organizations. The quality ratings represent the lower of Moody’s or S&P credit ratings. When a rating from only one of the rating agencies is available, that rating is used. Securities not rated by Moody’s or S&P are categorized as not rated. Credit quality measures a bond issuer’s ability to repay interest and principal in a timely manner. Credit quality ratings assigned by a rating agency are subject to change periodically and are not absolute standards of quality. In formulating investment decisions for the Fund, GEAM develops its own analysis of the credit quality and risks associated with individual debt instruments, rather than relying exclusively on rating agency ratings. |
See Notes to Performance beginning on page 1 for further information, including an explanation of Morningstar peer categories.
Past performance does not predict future performance. The performance shown in the graphs and tables does not reflect the deduction of taxes that a shareholder would pay on Fund distributions or the redemption of Fund shares and does not reflect the fees or charges that would be associated with variable contracts through which shares of the Fund are offered.
12
| | |
GE RSP Income Fund | | December 31, 2015 |
| | | | | | | | | | | | |
| | | Principal
Amount | | | Fair
Value | | | |
Bonds and Notes – 98.9%† | | | |
| |
U.S. Treasuries — 18.8% | | | |
| |
U.S. Treasury Bonds | | | |
| 2.50% | | 02/15/45 | | $ | 1,721,000 | | | $ | 1,540,973 | | | (m) |
| 3.13% | | 11/15/41 | | | 61,519,000 | | | | 63,425,658 | | | (m) |
U.S. Treasury Notes | | | |
| 0.63% | | 05/31/17 - 07/31/17 | | | 33,033,500 | | | | 32,874,026 | | | (m) |
| 0.75% | | 12/31/17 | | | 50,000,000 | | | | 49,666,250 | | | (m) |
| 0.88% | | 10/15/18 | | | 44,127,000 | | | | 43,645,177 | | | (m) |
| 1.38% | | 10/31/20 | | | 123,986,200 | | | | 121,826,236 | | | (m) |
| 1.88% | | 10/31/22 | | | 112,680,400 | | | | 111,256,233 | | | (m) |
| 2.00% | | 08/15/25 | | | 40,531,000 | | | | 39,517,077 | | | (m) |
| | | | 463,751,630 | | | |
| |
Agency Mortgage Backed — 23.9% | | | |
| | | |
Federal Home Loan Mortgage Corp. | | | | | | | | | | |
| 4.50% | | 06/01/33 - 02/01/35 | | | 137,387 | | | | 148,537 | | | |
| 5.00% | | 07/01/35 - 06/01/41 | | | 9,461,460 | | | | 10,550,702 | | | |
| 5.50% | | 05/01/20 - 04/01/39 | | | 2,742,363 | | | | 3,084,910 | | | |
| 6.00% | | 04/01/17 - 11/01/37 | | | 5,076,721 | | | | 5,759,293 | | | |
| 6.50% | | 07/01/29 | | | 24,153 | | | | 27,687 | | | |
| 7.00% | | 10/01/16 - 08/01/36 | | | 899,900 | | | | 1,013,268 | | | |
| 7.50% | | 01/01/28 - 09/01/33 | | | 50,779 | | | | 55,090 | | | |
| 8.00% | | 11/01/30 | | | 4,046 | | | | 4,343 | | | |
| 8.50% | | 04/01/30 | | | 11,264 | | | | 13,693 | | | |
| 9.00% | | 05/01/16 - 11/01/16 | | | 5,052 | | | | 5,105 | | | |
Federal National Mortgage Assoc. | | | | | | | | | | |
| 2.22% | | 04/01/37 | | | 18,971 | | | | 19,320 | | | (h) |
| 3.00% | | 02/01/43 - 06/01/43 | | | 103,664,261 | | | | 103,995,438 | | | |
| 3.50% | | 11/01/42 - 08/01/45 | | | 68,812,379 | | | | 71,043,747 | | | |
| 4.00% | | 05/01/19 - 03/01/44 | | | 60,526,313 | | | | 64,297,514 | | | |
| 4.50% | | 05/01/18 - 01/01/41 | | | 52,082,249 | | | | 56,317,687 | | | |
| 5.00% | | 07/01/20 - 06/01/41 | | | 16,226,731 | | | | 18,182,543 | | | |
| 5.50% | | 03/01/16 - 01/01/39 | | | 16,550,667 | | | | 18,488,677 | | | |
| 6.00% | | 05/01/19 - 05/01/41 | | | 24,765,805 | | | | 28,169,721 | | | |
| 6.50% | | 03/01/16 - 08/01/36 | | | 1,086,908 | | | | 1,224,951 | | | |
| 7.00% | | 10/01/16 - 02/01/34 | | | 100,274 | | | | 104,609 | | | |
| 7.50% | | 03/01/17 - 12/01/33 | | | 539,412 | | | | 608,749 | | | |
| 8.00% | | 06/01/24 - 01/01/33 | | | 192,855 | | | | 213,777 | | | |
| 8.50% | | 04/01/30 | | | 30,797 | | | | 38,904 | | | |
| 9.00% | | 01/01/17 - 12/01/22 | | | 120,160 | | | | 129,265 | | | |
| 2.50% | | TBA | | | 31,677,489 | | | | 31,862,956 | | | (c) |
| 3.00% | | TBA | | | 3,215,000 | | | | 3,213,881 | | | (c) |
| 3.50% | | TBA | | | 20,980,779 | | | | 21,639,496 | | | (c) |
| 4.00% | | TBA | | | 10,297,187 | | | | 10,893,503 | | | (c) |
Government National Mortgage Assoc. | | | | | | | | | | |
| 1.63% | | 11/20/21 - 10/20/25 | | | 9,587 | | | | 9,709 | | | (h) |
| 1.75% | | 05/20/21 - 04/20/24 | | | 7,812 | | | | 8,024 | | | (h) |
| | | | | | | | | | | | |
| | | Principal
Amount | | | Fair
Value | | | |
| 1.88% | | 08/20/23 - 09/20/24 | | $ | 5,416 | | | $ | 5,563 | | | (h) |
| 3.00% | | 04/20/43 - 06/20/43 | | | 30,583,318 | | | | 31,107,220 | | | |
| 3.50% | | 05/20/43 | | | 21,672,361 | | | | 22,647,084 | | | |
| 4.00% | | 01/20/41 - 04/20/43 | | | 26,111,671 | | | | 27,953,585 | | | |
| 4.50% | | 08/15/33 - 03/20/41 | | | 11,521,634 | | | | 12,544,782 | | | |
| 5.00% | | 08/15/33 | | | 537,468 | | | | 597,701 | | | |
| 6.00% | | 04/15/27 - 09/15/36 | | | 1,323,637 | | | | 1,518,959 | | | |
| 6.50% | | 04/15/19 - 09/15/36 | | | 1,181,006 | | | | 1,349,011 | | | |
| 7.00% | | 03/15/26 - 10/15/36 | | | 689,050 | | | | 756,878 | | | |
| 7.50% | | 11/15/22 - 11/15/31 | | | 246,501 | | | | 262,293 | | | |
| 8.00% | | 12/15/29 - 06/15/30 | | | 3,473 | | | | 3,884 | | | |
| 8.50% | | 10/15/17 | | | 33,670 | | | | 34,671 | | | |
| 9.00% | | 11/15/16 - 12/15/21 | | | 162,525 | | | | 168,819 | | | |
| 3.00% | | TBA | | | 16,800,032 | | | | 17,021,713 | | | (c) |
| 4.00% | | TBA | | | 7,679,113 | | | | 8,143,778 | | | (c) |
| 5.00% | | TBA | | | 12,587,000 | | | | 13,787,748 | | | (c) |
| 5.50% | | TBA | | | 1,900,000 | | | | 2,110,717 | | | (c) |
| | | | 591,139,505 | | | |
| |
Agency Collateralized Mortgage Obligations — 0.3% | | | |
| | | |
Collateralized Mortgage Obligation Trust | | | | | | | | | | |
| 0.01% | | 11/01/18 | | | 20,986 | | | | 20,856 | | | (d,f) |
Federal Home Loan Mortgage Corp. | | | | | | | | | | |
| 0.08% | | 09/25/43 | | | 8,778,461 | | | | 24,991 | | | (g,h) |
Federal Home Loan Mortgage Corp. REMIC | | | | | | | | | | |
| 3.50% | | 11/15/24 - 11/15/30 | | | 7,973,940 | | | | 646,449 | | | (g) |
| 5.00% | | 02/15/38 | | | 81,694 | | | | 1,443 | | | (g) |
| 5.50% | | 06/15/33 | | | 465,060 | | | | 97,283 | | | (g) |
| 6.27% | | 08/15/25 | | | 2,901,759 | | | | 285,873 | | | (g,h) |
| 7.50% | | 07/15/27 | | | 17,709 | | | | 2,345 | | | (g) |
| 8.00% | | 04/15/20 | | | 11,103 | | | | 11,489 | | | |
Federal Home Loan Mortgage Corp. STRIPS | | | | | | | | | | |
| 1.47% | | 08/01/27 | | | 12,698 | | | | 11,544 | | | (d,f) |
| 5.62% | | 08/15/43 | | | 6,575,042 | | | | 1,420,816 | | | (g,h) |
| 8.00% | | 02/01/23 - 07/01/24 | | | 45,449 | | | | 9,555 | | | (g) |
Federal National Mortgage Assoc. REMIC | | | | | | | | | | |
| 0.51% | | 12/25/22 | | | 41,756 | | | | 40,391 | | | (d,f) |
| 1.22% | | 12/25/42 | | | 1,332,627 | | | | 44,276 | | | (g,h) |
| 5.00% | | 02/25/40 - 09/25/40 | | | 3,815,616 | | | | 415,844 | | | (g) |
| 5.58% | | 07/25/38 | | | 776,267 | | | | 107,130 | | | (g,h) |
| 7.08% | | 05/25/18 | | | 96,178 | | | | 5,412 | | | (g,h) |
| 8.00% | | 05/25/22 | | | 60 | | | | 971 | | | (g) |
Federal National Mortgage Assoc. STRIPS | | | | | | | | | | |
| 1.87% | | 12/25/34 | | | 472,481 | | | | 436,941 | | | (f,d) |
| 4.50% | | 08/25/35 - 01/25/36 | | | 1,257,569 | | | | 225,804 | | | (g) |
| 5.00% | | 03/25/38 - 05/25/38 | | | 692,776 | | | | 125,446 | | | (g) |
| 5.50% | | 12/25/33 | | | 168,309 | | | | 32,892 | | | (g) |
| 6.00% | | 01/25/35 | | | 649,634 | | | | 134,041 | | | (g) |
| 7.50% | | 11/25/23 | | | 188,824 | | | | 40,480 | | | (g) |
See Notes to Schedules of Investments and Notes to Financial Statements.
13
| | |
GE RSP Income Fund | | December 31, 2015 |
| | | | | | | | | | | | |
| | | Principal
Amount | | | Fair
Value | | | |
| 8.00% | | 08/25/23 - 07/25/24 | | $ | 94,006 | | | $ | 19,953 | | | (g) |
| 8.50% | | 03/25/17 - 07/25/22 | | | 66,214 | | | | 7,730 | | | (g) |
| 9.00% | | 05/25/22 | | | 34,535 | | | | 6,052 | | | (g) |
Government National Mortgage Assoc. | | | | | | | | | | |
| 4.50% | | 10/20/37 - 08/16/39 | | | 6,191,630 | | | | 411,300 | | | (g) |
| 5.00% | | 10/20/37 - 09/20/38 | | | 3,131,820 | | | | 185,190 | | | (g) |
| 5.85% | | 02/20/40 | | | 2,695,304 | | | | 461,170 | | | (g,h) |
| 6.46% | | 01/16/40 | | | 4,547,204 | | | | 840,279 | | | (g,h) |
| | | | 6,073,946 | | | |
|
Asset Backed — 0.1% |
| | | |
Capital One Multi-Asset Execution Trust 2006-B1 | | | | | | | | | | |
| 0.61% | | 01/15/19 | | | 1,000,000 | | | | 999,382 | | | (h) |
Chase Funding Trust 2004-1 | | | | | | | | | | |
| 3.99% | | 11/25/33 | | | 1,098,837 | | | | 1,122,146 | | | (i) |
Irwin Home Equity Loan Trust 2006-2 | | | | | | | | | | |
| 0.37% | | 02/25/36 | | | 163,763 | | | | 141,959 | | | (b,h) |
| | | | 2,263,487 | | | |
|
Corporate Notes — 43.5% |
| | | |
21st Century Fox America Inc. | | | | | | | | | | |
| 3.70% | | 10/15/25 | | | 845,000 | | | | 843,476 | | | (b) |
| 4.95% | | 10/15/45 | | | 338,000 | | | | 332,900 | | | (b) |
| 6.65% | | 11/15/37 | | | 1,846,000 | | | | 2,145,165 | | | |
ABB Finance USA Inc. | | | | | | | | | | |
| 1.63% | | 05/08/17 | | | 3,213,000 | | | | 3,215,284 | | | |
AbbVie Inc. | | | | | | | | | | |
| 1.75% | | 11/06/17 | | | 2,949,000 | | | | 2,943,429 | | | |
| 2.00% | | 11/06/18 | | | 2,313,000 | | | | 2,303,285 | | | |
| 2.50% | | 05/14/20 | | | 3,380,000 | | | | 3,346,585 | | | |
| 3.60% | | 05/14/25 | | | 1,360,000 | | | | 1,342,404 | | | |
| 4.70% | | 05/14/45 | | | 675,000 | | | | 660,108 | | | |
Abengoa Greenfield S.A. | | | | | | | | | | |
| 6.50% | | 10/01/19 | | | 2,275,000 | | | | 250,250 | | | (b) |
ACCO Brands Corp. | | | | | | | | | | |
| 6.75% | | 04/30/20 | | | 3,446,000 | | | | 3,549,380 | | | |
ACE INA Holdings Inc. | | | | | | | | | | |
| 2.30% | | 11/03/20 | | | 3,376,000 | | | | 3,353,242 | | | |
| 3.15% | | 03/15/25 | | | 2,365,000 | | | | 2,338,730 | | | |
| 3.35% | | 05/03/26 | | | 2,363,000 | | | | 2,356,185 | | | |
| 4.35% | | 11/03/45 | | | 709,000 | | | | 720,512 | | | |
Actavis Funding SCS | | | | | | | | | | |
| 1.30% | | 06/15/17 | | | 3,992,000 | | | | 3,954,208 | | | |
| 3.00% | | 03/12/20 | | | 1,689,000 | | | | 1,687,654 | | | |
| 3.45% | | 03/15/22 | | | 2,365,000 | | | | 2,368,777 | | | |
| 3.80% | | 03/15/25 | | | 3,378,000 | | | | 3,361,059 | | | |
| 4.75% | | 03/15/45 | | | 338,000 | | | | 329,502 | | | |
Activision Blizzard Inc. | | | | | | | | | | |
| 5.63% | | 09/15/21 | | | 3,378,000 | | | | 3,538,455 | | | (b) |
Aetna Inc. | | | | | | | | | | |
| 3.50% | | 11/15/24 | | | 2,106,000 | | | | 2,103,814 | | | |
| | | | | | | | | | | | |
| | | Principal
Amount | | | Fair
Value | | | |
Agrium Inc. | | | | | | | | | | |
| 3.38% | | 03/15/25 | | $ | 845,000 | | | $ | 771,385 | | | |
| 4.90% | | 06/01/43 | | | 1,562,000 | | | | 1,397,282 | | | |
Alibaba Group Holding Ltd. | | | | | | | | | | |
| 4.50% | | 11/28/34 | | | 1,350,000 | | | | 1,291,630 | | | |
Altria Group Inc. | | | | | | | | | | |
| 2.95% | | 05/02/23 | | | 1,681,000 | | | | 1,636,062 | | | |
| 4.50% | | 05/02/43 | | | 1,681,000 | | | | 1,594,338 | | | |
America Movil SAB de C.V. | | | | | | | | | | |
| 3.13% | | 07/16/22 | | | 1,670,000 | | | | 1,640,887 | | | |
| 5.00% | | 03/30/20 | | | 2,650,000 | | | | 2,875,838 | | | |
American Axle & Manufacturing Inc. | | | | | | | | | | |
| 6.25% | | 03/15/21 | | | 2,250,000 | | | | 2,328,750 | | | |
| 6.63% | | 10/15/22 | | | 717,000 | | | | 751,058 | | | |
American Campus Communities Operating Partnership LP | | | | | | | | | | |
| 3.35% | | 10/01/20 | | | 1,358,000 | | | | 1,356,413 | | | |
| 4.13% | | 07/01/24 | | | 1,030,000 | | | | 1,022,813 | | | |
American Electric Power Company Inc. | | | | | | | | | | |
| 2.95% | | 12/15/22 | | | 2,694,000 | | | | 2,662,612 | | | |
American Express Co. | | | | | | | | | | |
| 3.63% | | 12/05/24 | | | 3,368,000 | | | | 3,296,164 | | | |
American Express Credit Corp. | | | | | | | | | | |
| 2.60% | | 09/14/20 | | | 3,380,000 | | | | 3,389,515 | | | |
American International Group Inc. | | | | | | | | | | |
| 3.75% | | 07/10/25 | | | 3,381,000 | | | | 3,352,748 | | | |
| 4.13% | | 02/15/24 | | | 1,013,000 | | | | 1,041,078 | | | |
| 4.50% | | 07/16/44 | | | 676,000 | | | | 625,197 | | | |
| 4.80% | | 07/10/45 | | | 1,690,000 | | | | 1,634,139 | | | |
American Tower Corp. (REIT) | | | | | | | | | | |
| 3.40% | | 02/15/19 | | | 4,077,000 | | | | 4,182,957 | | | |
Amgen Inc. | | | | | | | | | | |
| 2.20% | | 05/22/19 | | | 4,996,000 | | | | 4,990,454 | | | |
Amkor Technology Inc. | | | | | | | | | | |
| 6.63% | | 06/01/21 | | | 3,389,000 | | | | 3,363,582 | | | |
Anadarko Petroleum Corp. | | | | | | | | | | |
| 3.45% | | 07/15/24 | | | 672,000 | | | | 597,286 | | | |
| 6.20% | | 03/15/40 | | | 1,766,000 | | | | 1,624,722 | | | |
Anheuser-Busch InBev Worldwide Inc. | | | | | | | | | | |
| 2.50% | | 07/15/22 | | | 4,861,000 | | | | 4,679,014 | | | |
Anthem Inc. | | | | | | | | | | |
| 3.30% | | 01/15/23 | | | 1,732,000 | | | | 1,683,968 | | | |
Apache Corp. | | | | | | | | | | |
| 5.10% | | 09/01/40 | | | 1,689,000 | | | | 1,443,859 | | | |
Apple Inc. | | | | | | | | | | |
| 2.50% | | 02/09/25 | | | 1,831,000 | | | | 1,752,042 | | | |
| 2.85% | | 05/06/21 | | | 5,169,000 | | | | 5,295,961 | | | |
| 3.45% | | 02/09/45 | | | 1,690,000 | | | | 1,454,865 | | | |
Aramark Services Inc. | | | | | | | | | | |
| 5.75% | | 03/15/20 | | | 3,778,000 | | | | 3,907,869 | | | |
See Notes to Schedules of Investments and Notes to Financial Statements.
14
| | |
GE RSP Income Fund | | December 31, 2015 |
| | | | | | | | | | | | |
| | | Principal
Amount | | | Fair
Value | | | |
Ascension Health | | | | | | | | | | |
| 4.85% | | 11/15/53 | | $ | 2,608,000 | | | $ | 2,809,958 | | | |
AstraZeneca PLC | | | | | | | | | | |
| 2.38% | | 11/16/20 | | | 1,189,000 | | | | 1,180,959 | | | |
| 3.38% | | 11/16/25 | | | 1,689,000 | | | | 1,676,935 | | | |
| 4.38% | | 11/16/45 | | | 673,000 | | | | 674,456 | | | |
AT&T Inc. | | | | | | | | | | |
| 2.38% | | 11/27/18 | | | 3,936,000 | | | | 3,966,331 | | | (m) |
| 2.45% | | 06/30/20 | | | 3,389,000 | | | | 3,338,853 | | | (m) |
| 3.40% | | 05/15/25 | | | 3,389,000 | | | | 3,257,558 | | | (m) |
| 4.50% | | 05/15/35 | | | 1,689,000 | | | | 1,562,251 | | | (m) |
| 4.75% | | 05/15/46 | | | 844,000 | | | | 772,618 | | | (m) |
| 4.80% | | 06/15/44 | | | 1,339,000 | | | | 1,226,706 | | | (m) |
AutoNation Inc. | | | | | | | | | | |
| 4.50% | | 10/01/25 | | | 2,366,000 | | | | 2,401,980 | | | |
AutoZone Inc. | | | | | | | | | | |
| 3.25% | | 04/15/25 | | | 3,378,000 | | | | 3,268,864 | | | |
Bank of America Corp. | | | | | | | | | | |
| 1.70% | | 08/25/17 | | | 8,512,000 | | | | 8,488,337 | | | (m) |
| 2.60% | | 01/15/19 | | | 1,476,000 | | | | 1,481,011 | | | (m) |
| 3.88% | | 08/01/25 | | | 669,000 | | | | 679,186 | | | (m) |
| 3.95% | | 04/21/25 | | | 2,026,000 | | | | 1,973,038 | | | (m) |
| 4.00% | | 01/22/25 | | | 1,691,000 | | | | 1,656,734 | | | (m) |
| 4.10% | | 07/24/23 | | | 1,981,000 | | | | 2,049,150 | | | (m) |
| 4.25% | | 10/22/26 | | | 3,030,000 | | | | 2,999,506 | | | (m) |
Barclays Bank PLC | | | | | | | | | | |
| 2.25% | | 05/10/17 | | | 8,801,000 | | | | 8,894,687 | | | (b) |
Barclays PLC | | | | | | | | | | |
| 5.25% | | 08/17/45 | | | 1,670,000 | | | | 1,682,166 | | | |
Barrick Gold Corp. | | | | | | | | | | |
| 4.10% | | 05/01/23 | | | 530,000 | | | | 454,699 | | | |
Baxalta Inc. | | | | | | | | | | |
| 2.88% | | 06/23/20 | | | 3,381,000 | | | | 3,340,425 | | | (b) |
| 4.00% | | 06/23/25 | | | 2,537,000 | | | | 2,512,003 | | | (b) |
Bed Bath & Beyond Inc. | | | | | | | | | | |
| 4.92% | | 08/01/34 | | | 498,000 | | | | 444,052 | | | |
Berkshire Hathaway Energy Co. | | | | | | | | | | |
| 6.13% | | 04/01/36 | | | 3,165,000 | | | | 3,688,538 | | | |
Berkshire Hathaway Finance Corp. | | | | | | | | | | |
| 3.00% | | 05/15/22 | | | 1,056,000 | | | | 1,074,636 | | | |
Berkshire Hathaway Inc. | | | | | | | | | | |
| 4.50% | | 02/11/43 | | | 521,000 | | | | 524,208 | | | |
Berry Plastics Corp. | | | | | | | | | | |
| 5.13% | | 07/15/23 | | | 2,045,000 | | | | 1,988,763 | | | |
| 6.00% | | 10/15/22 | | | 1,300,000 | | | | 1,322,750 | | | (b) |
BHP Billiton Finance USA Ltd. | | | | | | | | | | |
| 5.00% | | 09/30/43 | | | 924,000 | | | | 837,311 | | | |
Biogen Inc. | | | | | | | | | | |
| 2.90% | | 09/15/20 | | | 1,693,000 | | | | 1,689,284 | | | |
| 4.05% | | 09/15/25 | | | 1,692,000 | | | | 1,700,780 | | | |
| 5.20% | | 09/15/45 | | | 677,000 | | | | 677,194 | | | |
| | | | | | | | | | | | |
| | | Principal
Amount | | | Fair
Value | | | |
Bombardier Inc. | | | | | | | | | | |
| 4.75% | | 04/15/19 | | $ | 1,371,000 | | | $ | 1,127,648 | | | (b) |
| 6.00% | | 10/15/22 | | | 1,407,000 | | | | 986,307 | | | (b) |
| 7.75% | | 03/15/20 | | | 1,372,000 | | | | 1,107,890 | | | (b) |
Boston Scientific Corp. | | | | | | | | | | |
| 3.85% | | 05/15/25 | | | 1,705,000 | | | | 1,677,904 | | | |
BP Capital Markets PLC | | | | | | | | | | |
| 1.38% | | 05/10/18 | | | 1,688,000 | | | | 1,663,914 | | | |
| 3.81% | | 02/10/24 | | | 1,633,000 | | | | 1,632,685 | | | |
Branch Banking & Trust Co. | | | | | | | | | | |
| 3.63% | | 09/16/25 | | | 3,400,000 | | | | 3,433,667 | | | |
Building Materials Corporation of America | | | | | | | | | | |
| 5.38% | | 11/15/24 | | | 4,068,000 | | | | 4,057,830 | | | (b) |
Burlington Northern Santa Fe LLC | | | | | | | | | | |
| 3.65% | | 09/01/25 | | | 1,165,000 | | | | 1,180,625 | | | |
Calpine Corp. | | | | | | | | | | |
| 5.75% | | 01/15/25 | | | 2,054,000 | | | | 1,812,655 | | | |
| 5.88% | | 01/15/24 | | | 4,556,000 | | | | 4,669,900 | | | (b) |
Calumet Specialty Products Partners LP/Calumet Finance Corp. | | | | | | | | | | |
| 6.50% | | 04/15/21 | | | 3,402,000 | | | | 2,959,740 | | | |
Canadian Pacific Railway Co. | | | | | | | | | | |
| 2.90% | | 02/01/25 | | | 1,690,000 | | | | 1,590,937 | | | |
Capital One Financial Corp. | | | | | | | | | | |
| 4.20% | | 10/29/25 | | | 3,376,000 | | | | 3,335,032 | | | |
Capital One NA | | | | | | | | | | |
| 2.35% | | 08/17/18 | | | 1,340,000 | | | | 1,342,762 | | | |
Caterpillar Inc. | | | | | | | | | | |
| 4.30% | | 05/15/44 | | | 1,089,000 | | | | 1,050,864 | | | |
Catholic Health Initiatives | | | | | | | | | | |
| 2.60% | | 08/01/18 | | | 1,030,000 | | | | 1,034,258 | | | |
| 4.35% | | 11/01/42 | | | 1,029,000 | | | | 962,315 | | | |
CBS Corp. | | | | | | | | | | |
| 3.70% | | 08/15/24 | | | 2,624,000 | | | | 2,553,236 | | | |
CCO Safari II LLC | | | | | | | | | | |
| 3.58% | | 07/23/20 | | | 2,534,000 | | | | 2,519,485 | | | (b) |
| 4.91% | | 07/23/25 | | | 2,534,000 | | | | 2,531,509 | | | (b) |
| 6.38% | | 10/23/35 | | | 338,000 | | | | 341,121 | | | (b) |
| 6.48% | | 10/23/45 | | | 676,000 | | | | 676,240 | | | (b) |
Celgene Corp. | | | | | | | | | | |
| 3.88% | | 08/15/25 | | | 3,380,000 | | | | 3,369,258 | | | |
| 5.00% | | 08/15/45 | | | 1,690,000 | | | | 1,696,466 | | | |
CenturyLink Inc. | | | | | | | | | | |
| 5.80% | | 03/15/22 | | | 6,803,000 | | | | 6,234,949 | | | |
Cequel Capital Corp. | | | | | | | | | | |
| 5.13% | | 12/15/21 | | | 3,893,000 | | | | 3,503,700 | | | (b) |
Chevron Corp. | | | | | | | | | | |
| 3.33% | | 11/17/25 | | | 2,365,000 | | | | 2,382,049 | | | |
Cigna Corp. | | | | | | | | | | |
| 3.25% | | 04/15/25 | | | 3,379,000 | | | | 3,318,472 | | | |
See Notes to Schedules of Investments and Notes to Financial Statements.
15
| | |
GE RSP Income Fund | | December 31, 2015 |
| | | | | | | | | | | | |
| | | Principal
Amount | | | Fair
Value | | | |
Cinemark USA Inc. | | | | | | | | | | |
| 4.88% | | 06/01/23 | | $ | 3,403,000 | | | $ | 3,317,925 | | | |
Citigroup Inc. | | | | | | | | | | |
| 1.55% | | 08/14/17 | | | 7,436,000 | | | | 7,405,944 | | | (m) |
| 1.75% | | 05/01/18 | | | 3,366,000 | | | | 3,337,746 | | | (m) |
| 1.85% | | 11/24/17 | | | 1,625,000 | | | | 1,622,686 | | | (m) |
| 2.05% | | 12/07/18 | | | 3,069,000 | | | | 3,052,722 | | | (m) |
| 2.65% | | 10/26/20 | | | 1,680,000 | | | | 1,667,798 | | | (m) |
| 4.40% | | 06/10/25 | | | 1,693,000 | | | | 1,710,743 | | | (m) |
| 4.45% | | 09/29/27 | | | 1,000,000 | | | | 994,048 | | | (m) |
| 4.65% | | 07/30/45 | | | 2,704,000 | | | | 2,734,899 | | | (m) |
CMS Energy Corp. | | | | | | | | | | |
| 4.88% | | 03/01/44 | | | 1,699,000 | | | | 1,722,852 | | | |
CNA Financial Corp. | | | | | | | | | | |
| 5.88% | | 08/15/20 | | | 2,898,000 | | | | 3,212,572 | | | |
CNOOC Nexen Finance 2014 ULC | | | | | | | | | | |
| 4.25% | | 04/30/24 | | | 3,448,000 | | | | 3,475,322 | | | |
Cogeco Cable Inc. | | | | | | | | | | |
| 4.88% | | 05/01/20 | | | 3,215,000 | | | | 3,206,963 | | | (b) |
Colgate-Palmolive Co. | | | | | | | | | | |
| 4.00% | | 08/15/45 | | | 1,690,000 | | | | 1,693,747 | | | |
Columbia Pipeline Group Inc. | | | | | | | | | | |
| 3.30% | | 06/01/20 | | | 2,366,000 | | | | 2,304,723 | | | (b) |
| 4.50% | | 06/01/25 | | | 1,689,000 | | | | 1,530,879 | | | (b) |
Comcast Corp. | | | | | | | | | | |
| 3.38% | | 08/15/25 | | | 5,747,000 | | | | 5,821,556 | | | |
| 4.20% | | 08/15/34 | | | 1,693,000 | | | | 1,676,808 | | | |
| 4.60% | | 08/15/45 | | | 1,690,000 | | | | 1,710,997 | | | |
ConocoPhillips Co. | | | | | | | | | | |
| 3.35% | | 11/15/24 | | | 1,000,000 | | | | 914,965 | | | |
Continental Resources Inc. | | | | | | | | | | |
| 3.80% | | 06/01/24 | | | 735,000 | | | | 517,950 | | | |
| 4.50% | | 04/15/23 | | | 677,000 | | | | 486,680 | | | |
| 4.90% | | 06/01/44 | | | 399,000 | | | | 240,668 | | | |
Corp Andina de Fomento | | | | | | | | | | |
| 4.38% | | 06/15/22 | | | 4,826,000 | | | | 5,137,760 | | | |
Credit Suisse AG | | | | | | | | | | |
| 1.70% | | 04/27/18 | | | 3,437,000 | | | | 3,412,542 | | | |
| 2.60% | | 05/27/16 | | | 3,681,000 | | | | 3,700,697 | | | (b) |
Credit Suisse Group Funding Guernsey Ltd. | | | | | | | | | | |
| 3.75% | | 03/26/25 | | | 3,390,000 | | | | 3,275,069 | | | (b) |
Crown Americas LLC/Crown Americas Capital Corp. IV | | | | | | | | | | |
| 4.50% | | 01/15/23 | | | 4,092,000 | | | | 3,999,930 | | | |
CSX Corp. | | | | | | | | | | |
| 4.50% | | 08/01/54 | | | 1,018,000 | | | | 923,377 | | | |
CubeSmart LP | | | | | | | | | | |
| 4.00% | | 11/15/25 | | | 946,000 | | | | 939,289 | | | |
CVS Health Corp. | | | | | | | | | | |
| 2.25% | | 08/12/19 | | | 5,080,000 | | | | 5,075,204 | | | |
| 3.88% | | 07/20/25 | | | 3,381,000 | | | | 3,451,142 | | | |
| 5.13% | | 07/20/45 | | | 2,536,000 | | | | 2,671,504 | | | |
| | | | | | | | | | | | |
| | | Principal
Amount | | | Fair
Value | | | |
Daimler Finance North America LLC | | | | | | | | | | |
| 2.38% | | 08/01/18 | | $ | 8,030,000 | | | $ | 8,042,230 | | | (b) |
Danaher Corp. | | | | | | | | | | |
| 2.40% | | 09/15/20 | | | 1,689,000 | | | | 1,689,130 | | | |
| 3.35% | | 09/15/25 | | | 1,693,000 | | | | 1,719,688 | | | |
| 4.38% | | 09/15/45 | | | 902,000 | | | | 931,701 | | | |
Denbury Resources Inc. | | | | | | | | | | |
| 5.50% | | 05/01/22 | | | 3,402,000 | | | | 1,129,396 | | | |
| 6.38% | | 08/15/21 | | | 2,076,000 | | | | 747,360 | | | |
Deutsche Bank AG | | | | | | | | | | |
| 4.50% | | 04/01/25 | | | 3,426,000 | | | | 3,151,992 | | | |
Devon Energy Corp. | | | | | | | | | | |
| 5.85% | | 12/15/25 | | | 1,388,000 | | | | 1,350,012 | | | |
Dexia Credit Local S.A. | | | | | | | | | | |
| 2.25% | | 01/30/19 | | | 6,894,000 | | | | 6,938,873 | | | (b) |
Diageo Investment Corp. | | | | | | | | | | |
| 2.88% | | 05/11/22 | | | 4,105,000 | | | | 4,069,512 | | | |
DigitalGlobe Inc. | | | | | | | | | | |
| 5.25% | | 02/01/21 | | | 3,520,000 | | | | 2,956,800 | | | (b) |
DIRECTV Holdings LLC/DIRECTV Financing Company Inc. | | | | | | | | | | |
| 4.45% | | 04/01/24 | | | 2,595,000 | | | | 2,665,519 | | | |
Discover Bank | | | | | | | | | | |
| 3.10% | | 06/04/20 | | | 2,360,000 | | | | 2,366,464 | | | |
Dollar General Corp. | | | | | | | | | | |
| 1.88% | | 04/15/18 | | | 3,370,000 | | | | 3,337,584 | | | |
| 4.13% | | 07/15/17 | | | 3,373,000 | | | | 3,463,835 | | | |
| 4.15% | | 11/01/25 | | | 1,688,000 | | | | 1,677,992 | | | |
Dollar Tree Inc. | | | | | | | | | | |
| 5.75% | | 03/01/23 | | | 4,084,000 | | | | 4,257,570 | | | (b) |
Dominion Resources Inc. | | | | | | | | | | |
| 1.95% | | 08/15/16 | | | 3,151,000 | | | | 3,158,915 | | | |
Dr Pepper Snapple Group Inc. | | | | | | | | | | |
| 3.40% | | 11/15/25 | | | 3,376,000 | | | | 3,316,616 | | | |
Duke Energy Progress LLC | | | | | | | | | | |
| 4.15% | | 12/01/44 | | | 1,010,000 | | | | 986,400 | | | |
Eastman Chemical Co. | | | | | | | | | | |
| 3.60% | | 08/15/22 | | | 3,368,000 | | | | 3,353,386 | | | |
Ecopetrol S.A. | | | | | | | | | | |
| 5.88% | | 05/28/45 | | | 851,000 | | | | 604,210 | | | |
Electricite de France S.A. | | | | | | | | | | |
| 2.15% | | 01/22/19 | | | 6,811,000 | | | | 6,779,349 | | | (b) |
Eli Lilly & Co. | | | | | | | | | | |
| 3.70% | | 03/01/45 | | | 338,000 | | | | 316,138 | | | |
EMD Finance LLC | | | | | | | | | | |
| 3.25% | | 03/19/25 | | | 1,689,000 | | | | 1,601,572 | | | (b) |
Energizer Holdings Inc. | | | | | | | | | | |
| 5.50% | | 06/15/25 | | | 3,394,000 | | | | 3,190,360 | | | (b) |
Energy Transfer Equity LP | | | | | | | | | | |
| 5.88% | | 01/15/24 | | | 6,800,000 | | | | 5,542,000 | | | |
Energy Transfer Partners LP | | | | | | | | | | |
| 4.05% | | 03/15/25 | | | 675,000 | | | | 554,653 | | | |
See Notes to Schedules of Investments and Notes to Financial Statements.
16
| | |
GE RSP Income Fund | | December 31, 2015 |
| | | | | | | | | | | | |
| | | Principal
Amount | | | Fair
Value | | | |
| 5.15% | | 03/15/45 | | $ | 1,182,000 | | | $ | 835,545 | | | |
| 6.50% | | 02/01/42 | | | 2,729,000 | | | | 2,219,635 | | | |
Ensco PLC | | | | | | | | | | |
| 4.50% | | 10/01/24 | | | 1,678,000 | | | | 1,155,588 | | | |
| 5.20% | | 03/15/25 | | | 1,014,000 | | | | 721,972 | | | |
| 5.75% | | 10/01/44 | | | 676,000 | | | | 445,365 | | | |
Enterprise Products Operating LLC | | | | | | | | | | |
| 3.70% | | 02/15/26 | | | 3,380,000 | | | | 3,034,385 | | | |
Equinix Inc. | | | | | | | | | | |
| 5.88% | | 01/15/26 | | | 675,000 | | | | 695,250 | | | |
ERP Operating LP | | | | | | | | | | |
| 4.50% | | 07/01/44 | | | 688,000 | | | | 690,408 | | | |
European Investment Bank | | | | | | | | | | |
| 4.88% | | 01/17/17 | | | 6,925,000 | | | | 7,200,033 | | | |
FedEx Corp. | | | | | | | | | | |
| 3.20% | | 02/01/25 | | | 1,073,000 | | | | 1,044,498 | | | |
Fiat Chrysler Automobiles N.V. | | | | | | | | | | |
| 4.50% | | 04/15/20 | | | 2,050,000 | | | | 2,075,625 | | | |
| 5.25% | | 04/15/23 | | | 1,400,000 | | | | 1,375,500 | | | |
Five Corners Funding Trust | | | | | | | | | | |
| 4.42% | | 11/15/23 | | | 3,703,000 | | | | 3,866,291 | | | (b) |
Florida Power & Light Co. | | | | | | | | | | |
| 4.13% | | 02/01/42 | | | 1,675,000 | | | | 1,667,020 | | | |
Ford Motor Credit Company LLC | | | | | | | | | | |
| 3.20% | | 01/15/21 | | | 3,401,000 | | | | 3,378,251 | | | |
| 3.22% | | 01/09/22 | | | 3,400,000 | | | | 3,328,889 | | | |
| 5.88% | | 08/02/21 | | | 2,569,000 | | | | 2,864,892 | | | |
Fresenius Medical Care US Finance Inc. | | | | | | | | | | |
| 5.75% | | 02/15/21 | | | 3,833,000 | | | | 4,101,310 | | | (b) |
Frontier Communications Corp. | | | | | | | | | | |
| 7.13% | | 03/15/19 | | | 3,979,000 | | | | 3,978,602 | | | |
| 11.00% | | 09/15/25 | | | 3,069,000 | | | | 3,038,310 | | | (b) |
General Motors Co. | | | | | | | | | | |
| 5.20% | | 04/01/45 | | | 338,000 | | | | 318,204 | | | (m) |
General Motors Financial Company Inc. | | | | | | | | | | |
| 3.15% | | 01/15/20 | | | 2,366,000 | | | | 2,344,969 | | | |
| 3.20% | | 07/13/20 | | | 6,761,000 | | | | 6,656,887 | | | (m) |
| 4.30% | | 07/13/25 | | | 3,380,000 | | | | 3,279,766 | | | (m) |
Georgia-Pacific LLC | | | | | | | | | | |
| 3.60% | | 03/01/25 | | | 2,545,000 | | | | 2,516,779 | | | (b) |
Gilead Sciences Inc. | | | | | | | | | | |
| 2.55% | | 09/01/20 | | | 1,690,000 | | | | 1,690,155 | | | |
| 3.65% | | 03/01/26 | | | 1,895,000 | | | | 1,911,841 | | | |
| 4.80% | | 04/01/44 | | | 767,000 | | | | 769,419 | | | |
Grupo Televisa SAB | | | | | | | | | | |
| 5.00% | | 05/13/45 | | | 967,000 | | | | 830,822 | | | |
Halliburton Co. | | | | | | | | | | |
| 2.70% | | 11/15/20 | | | 1,689,000 | | | | 1,670,179 | | | |
| 3.80% | | 11/15/25 | | | 1,696,000 | | | | 1,652,489 | | | |
| 5.00% | | 11/15/45 | | | 1,013,000 | | | | 1,000,672 | | | |
| | | | | | | | | | | | |
| | | Principal
Amount | | | Fair
Value | | | |
HCA Inc. | | | | | | | | | | |
| 4.75% | | 05/01/23 | | $ | 5,690,000 | | | $ | 5,633,100 | | | |
| 6.50% | | 02/15/20 | | | 2,903,000 | | | | 3,162,819 | | | |
HSBC Holdings PLC | | | | | | | | | | |
| 4.25% | | 08/18/25 | | | 1,357,000 | | | | 1,346,917 | | | |
HSBC USA Inc. | | | | | | | | | | |
| 2.75% | | 08/07/20 | | | 5,059,000 | | | | 5,061,671 | | | |
Hyundai Capital America | | | | | | | | | | |
| 2.13% | | 10/02/17 | | | 1,488,000 | | | | 1,479,149 | | | (b) |
Illinois Tool Works Inc. | | | | | | | | | | |
| 3.50% | | 03/01/24 | | | 3,402,000 | | | | 3,497,603 | | | |
ING Bank N.V. | | | | | | | | | | |
| 2.70% | | 08/17/20 | | | 1,400,000 | | | | 1,406,833 | | | (b) |
Ingersoll-Rand Luxembourg Finance S.A. | | | | | | | | | | |
| 3.55% | | 11/01/24 | | | 2,358,000 | | | | 2,308,664 | | | |
Ingles Markets Inc. | | | | | | | | | | |
| 5.75% | | 06/15/23 | | | 5,729,000 | | | | 5,714,677 | | | |
Intel Corp. | | | | | | | | | | |
| 2.45% | | 07/29/20 | | | 1,690,000 | | | | 1,710,064 | | | |
Intelsat Jackson Holdings S.A. | | | | | | | | | | |
| 5.50% | | 08/01/23 | | | 3,422,000 | | | | 2,686,270 | | | |
International Business Machines Corp. | | | | | | | | | | |
| 3.63% | | 02/12/24 | | | 3,479,000 | | | | 3,583,106 | | | |
Interstate Power & Light Co. | | | | | | | | | | |
| 3.40% | | 08/15/25 | | | 3,380,000 | | | | 3,400,364 | | | |
Intesa Sanpaolo S.p.A. | | | | | | | | | | |
| 5.02% | | 06/26/24 | | | 1,167,000 | | | | 1,148,733 | | | (b) |
Invesco Finance PLC | | | | | | | | | | |
| 3.13% | | 11/30/22 | | | 4,673,000 | | | | 4,610,017 | | | |
JB Poindexter & Company Inc. | | | | | | | | | | |
| 9.00% | | 04/01/22 | | | 962,000 | | | | 1,005,290 | | | (b) |
JBS USA LLC/JBS USA Finance Inc. | | | | | | | | | | |
| 5.75% | | 06/15/25 | | | 2,722,000 | | | | 2,368,140 | | | (b) |
| 5.88% | | 07/15/24 | | | 1,896,000 | | | | 1,715,880 | | | (b) |
Jefferies Group LLC | | | | | | | | | | |
| 5.13% | | 01/20/23 | | | 1,378,000 | | | | 1,367,279 | | | |
| 6.50% | | 01/20/43 | | | 1,123,000 | | | | 1,038,248 | | | |
Johnson Controls Inc. | | | | | | | | | | |
| 4.63% | | 07/02/44 | | | 1,663,000 | | | | 1,409,378 | | | |
JPMorgan Chase & Co. | | | | | | | | | | |
| 2.55% | | 10/29/20 | | | 1,679,000 | | | | 1,664,052 | | | (m) |
| 3.88% | | 09/10/24 | | | 5,053,000 | | | | 5,029,008 | | | (m) |
| 3.90% | | 07/15/25 | | | 3,000 | | | | 3,090 | | | (m) |
| 4.25% | | 10/01/27 | | | 1,000,000 | | | | 998,575 | | | (m) |
| 5.00% | | 12/29/49 | | | 2,443,000 | | | | 2,320,850 | | | (h,m) |
| 6.10% | | 10/29/49 | | | 4,040,000 | | | | 4,060,604 | | | (h,m) |
KB Home | | | | | | | | | | |
| 7.00% | | 12/15/21 | | | 4,119,000 | | | | 4,062,364 | | | |
Keysight Technologies Inc. | | | | | | | | | | |
| 4.55% | | 10/30/24 | | | 3,365,000 | | | | 3,235,209 | | | |
See Notes to Schedules of Investments and Notes to Financial Statements.
17
| | |
GE RSP Income Fund | | December 31, 2015 |
| | | | | | | | | | | | |
| | | Principal
Amount | | | Fair
Value | | | |
KFW | | | | | | | | | | | | |
| 2.00% | | 10/04/22 | | $ | 10,325,000 | | | $ | 10,158,478 | | | |
| 4.50% | | 07/16/18 | | | 2,938,000 | | | | 3,158,418 | | | |
Kinder Morgan Energy Partners LP | | | | | | | | | | |
| 3.50% | | 09/01/23 | | | 1,096,000 | | | | 909,226 | | | |
| 4.30% | | 05/01/24 | | | 1,756,000 | | | | 1,509,953 | | | |
Kinder Morgan Inc. | | | | | | | | | | |
| 3.05% | | 12/01/19 | | | 673,000 | | | | 623,094 | | | |
| 4.30% | | 06/01/25 | | | 1,346,000 | | | | 1,163,559 | | | |
| 5.55% | | 06/01/45 | | | 1,014,000 | | | | 791,845 | | | |
Kinross Gold Corp. | | | | | | | | | | |
| 6.88% | | 09/01/41 | | | 225,000 | | | | 123,282 | | | |
Kraft Heinz Foods Co. | | | | | | | | | | |
| 2.80% | | 07/02/20 | | | 5,071,000 | | | | 5,059,114 | | | (b,m) |
| 3.95% | | 07/15/25 | | | 4,395,000 | | | | 4,437,548 | | | (b,m) |
L Brands Inc. | | | | | | | | | | |
| 5.63% | | 02/15/22 | | | 3,628,000 | | | | 3,854,750 | | | |
L-3 Communications Corp. | | | | | | | | | | |
| 1.50% | | 05/28/17 | | | 2,332,000 | | | | 2,303,069 | | | |
Lee Enterprises Inc. | | | | | | | | | | |
| 9.50% | | 03/15/22 | | | 2,712,000 | | | | 2,495,040 | | | (b) |
Lennar Corp. | | | | | | | | | | |
| 4.50% | | 11/15/19 | | | 4,067,000 | | | | 4,135,631 | | | |
| 4.75% | | 05/30/25 | | | 1,355,000 | | | | 1,324,513 | | | |
Levi Strauss & Co. | | | | | | | | | | |
| 5.00% | | 05/01/25 | | | 2,041,000 | | | | 2,030,795 | | | |
Lockheed Martin Corp. | | | | | | | | | | |
| 2.50% | | 11/23/20 | | | 2,365,000 | | | | 2,356,678 | | | (m) |
| 3.55% | | 01/15/26 | | | 3,379,000 | | | | 3,396,351 | | | (m) |
| 3.80% | | 03/01/45 | | | 705,000 | | | | 624,464 | | | (m) |
| 4.70% | | 05/15/46 | | | 761,000 | | | | 783,082 | | | (m) |
Lowe’s Companies Inc. | | | | | | | | | | |
| 4.38% | | 09/15/45 | | | 1,350,000 | | | | 1,387,600 | | | |
LyondellBasell Industries N.V. | | | | | | | | | | |
| 4.63% | | 02/26/55 | | | 676,000 | | | | 548,205 | | | |
Macquarie Bank Ltd. | | | | | | | | | | |
| 4.88% | | 06/10/25 | | | 3,428,000 | | | | 3,385,164 | | | (b) |
Marathon Petroleum Corp. | | | | | | | | | | |
| 3.63% | | 09/15/24 | | | 3,370,000 | | | | 3,141,993 | | | |
Marsh & McLennan Companies Inc. | | | | | | | | | | |
| 3.50% | | 03/10/25 | | | 2,383,000 | | | | 2,347,362 | | | |
| 3.75% | | 03/14/26 | | | 2,365,000 | | | | 2,365,147 | | | |
Mattel Inc. | | | | | | | | | | |
| 2.35% | | 05/06/19 | | | 5,171,000 | | | | 5,127,951 | | | |
McDonald’s Corp. | | | | | | | | | | |
| 2.75% | | 12/09/20 | | | 921,000 | | | | 920,546 | | | |
| 3.70% | | 01/30/26 | | | 2,148,000 | | | | 2,146,769 | | | |
| 4.88% | | 12/09/45 | | | 706,000 | | | | 709,802 | | | |
Mead Johnson Nutrition Co. | | | | | | | | | | |
| 3.00% | | 11/15/20 | | | 2,363,000 | | | | 2,363,347 | | | |
| 4.13% | | 11/15/25 | | | 2,363,000 | | | | 2,381,996 | | | |
| | | | | | | | | | | | |
| | | Principal
Amount | | | Fair
Value | | | |
Medtronic Inc. | | | | | | | | | | |
| 2.50% | | 03/15/20 | | $ | 1,009,000 | | | $ | 1,016,426 | | | |
| 3.50% | | 03/15/25 | | | 4,042,000 | | | | 4,089,853 | | | |
| 4.63% | | 03/15/45 | | | 1,685,000 | | | | 1,737,281 | | | |
Memorial Sloan-Kettering Cancer Center | | | | | | | | | | |
| 4.13% | | 07/01/52 | | | 1,325,000 | | | | 1,235,993 | | | |
Merck & Company Inc. | | | | | | | | | | |
| 2.75% | | 02/10/25 | | | 3,380,000 | | | | 3,290,775 | | | |
MetLife Inc. | | | | | | | | | | |
| 3.60% | | 11/13/25 | | | 1,690,000 | | | | 1,703,016 | | | |
| 4.05% | | 03/01/45 | | | 843,000 | | | | 781,029 | | | |
| 4.72% | | 12/15/44 | | | 1,036,000 | | | | 1,058,017 | | | |
MGM Resorts International | | | | | | | | | | |
| 5.25% | | 03/31/20 | | | 2,037,000 | | | | 2,016,630 | | | |
| 6.63% | | 12/15/21 | | | 3,402,000 | | | | 3,482,797 | | | |
Microsoft Corp. | | | | | | | | | | |
| 4.00% | | 02/12/55 | | | 1,600,000 | | | | 1,436,139 | | | |
Mid-America Apartments LP | | | | | | | | | | |
| 4.00% | | 11/15/25 | | | 1,696,000 | | | | 1,684,952 | | | |
Mizuho Bank Ltd. | | | | | | | | | | |
| 2.45% | | 04/16/19 | | | 4,151,000 | | | | 4,154,039 | | | (b) |
Monsanto Co. | | | | | | | | | | |
| 4.70% | | 07/15/64 | | | 984,000 | | | | 747,142 | | | |
Morgan Stanley | | | | | | | | | | |
| 2.65% | | 01/27/20 | | | 1,690,000 | | | | 1,685,995 | | | (m) |
| 3.70% | | 10/23/24 | | | 3,371,000 | | | | 3,387,518 | | | (m) |
| 3.95% | | 04/23/27 | | | 3,378,000 | | | | 3,280,021 | | | (m) |
| 4.10% | | 05/22/23 | | | 5,543,000 | | | | 5,603,596 | | | (m) |
| 4.88% | | 11/01/22 | | | 872,000 | | | | 925,980 | | | (m) |
| 5.00% | | 11/24/25 | | | 1,293,000 | | | | 1,373,379 | | | (m) |
Motorola Solutions Inc. | | | | | | | | | | |
| 4.00% | | 09/01/24 | | | 1,176,000 | | | | 1,020,669 | | | |
National Agricultural Cooperative Federation | | | | | | | | | | |
| 4.25% | | 01/28/16 | | | 1,434,000 | | | | 1,436,353 | | | (b) |
National Retail Properties Inc. | | | | | | | | | | |
| 4.00% | | 11/15/25 | | | 1,688,000 | | | | 1,658,474 | | | |
NCL Corporation Ltd. | | | | | | | | | | |
| 4.63% | | 11/15/20 | | | 1,697,000 | | | | 1,661,736 | | | (b) |
Newfield Exploration Co. | | | | | | | | | | |
| 5.63% | | 07/01/24 | | | 3,507,000 | | | | 2,989,718 | | | |
| 5.75% | | 01/30/22 | | | 3,425,000 | | | | 3,031,125 | | | |
Newmont Mining Corp. | | | | | | | | | | |
| 4.88% | | 03/15/42 | | | 1,293,000 | | | | 923,711 | | | |
Nexen Energy ULC | | | | | | | | | | |
| 6.40% | | 05/15/37 | | | 1,775,000 | | | | 1,985,176 | | | |
NIKE Inc. | | | | | | | | | | |
| 3.88% | | 11/01/45 | | | 1,688,000 | | | | 1,627,708 | | | |
Noble Energy Inc. | | | | | | | | | | |
| 3.90% | | 11/15/24 | | | 2,021,000 | | | | 1,799,767 | | | |
Northern States Power Co. | | | | | | | | | | |
| 2.20% | | 08/15/20 | | | 3,380,000 | | | | 3,357,188 | | | |
See Notes to Schedules of Investments and Notes to Financial Statements.
18
| | |
GE RSP Income Fund | | December 31, 2015 |
| | | | | | | | | | | | |
| | | Principal
Amount | | | Fair
Value | | | |
Northrop Grumman Corp. | | | | | | | | | | |
| 3.85% | | 04/15/45 | | $ | 393,000 | | | $ | 353,351 | | | |
Novartis Capital Corp. | | | | | | | | | | |
| 3.00% | | 11/20/25 | | | 4,471,000 | | | | 4,407,485 | | | (m) |
| 4.00% | | 11/20/45 | | | 2,235,000 | | | | 2,187,039 | | | (m) |
NRG Energy Inc. | | | | | | | | | | |
| 6.25% | | 07/15/22 | | | 2,099,000 | | | | 1,820,883 | | | |
Occidental Petroleum Corp. | | | | | | | | | | |
| 3.50% | | 06/15/25 | | | 3,381,000 | | | | 3,304,174 | | | |
Omnicom Group Inc. | | | | | | | | | | |
| 3.63% | | 05/01/22 | | | 1,321,000 | | | | 1,333,927 | | | |
Oracle Corp. | | | | | | | | | | |
| 2.25% | | 10/08/19 | | | 6,690,000 | | | | 6,762,239 | | | |
| 2.95% | | 05/15/25 | | | 3,380,000 | | | | 3,300,077 | | | |
| 4.13% | | 05/15/45 | | | 676,000 | | | | 639,796 | | | |
Owens & Minor Inc. | | | | | | | | | | |
| 3.88% | | 09/15/21 | | | 3,365,000 | | | | 3,351,893 | | | |
Pacific Gas & Electric Co. | | | | | | | | | | |
| 3.40% | | 08/15/24 | | | 5,053,000 | | | | 5,073,965 | | | |
PacifiCorp | | | | | | | | | | |
| 6.25% | | 10/15/37 | | | 2,644,000 | | | | 3,270,366 | | | |
Penn National Gaming Inc. | | | | | | | | | | |
| 5.88% | | 11/01/21 | | | 2,034,000 | | | | 1,972,980 | | | |
People’s United Bank NA | | | | | | | | | | |
| 4.00% | | 07/15/24 | | | 3,905,000 | | | | 3,861,768 | | | |
PepsiCo Inc. | | | | | | | | | | |
| 3.10% | | 07/17/22 | | | 851,000 | | | | 872,768 | | | |
| 4.25% | | 10/22/44 | | | 1,001,000 | | | | 993,229 | | | |
| 4.60% | | 07/17/45 | | | 1,014,000 | | | | 1,072,166 | | | |
Petrobras Global Finance BV | | | | | | | | | | |
| 3.88% | | 01/27/16 | | | 1,175,000 | | | | 1,170,300 | | | |
Petroleos Mexicanos | | | | | | | | | | |
| 3.50% | | 01/30/23 | | | 1,614,000 | | | | 1,408,215 | | | |
Pfizer Inc. | | | | | | | | | | |
| 4.40% | | 05/15/44 | | | 1,064,000 | | | | 1,080,473 | | | |
Philip Morris International Inc. | | | | | | | | | | |
| 4.13% | | 03/04/43 | | | 1,682,000 | | | | 1,590,127 | | | |
Phillips 66 Partners LP | | | | | | | | | | |
| 2.65% | | 02/15/20 | | | 1,014,000 | | | | 957,062 | | | |
| 3.61% | | 02/15/25 | | | 1,690,000 | | | | 1,484,018 | | | |
Pitney Bowes Inc. | | | | | | | | | | |
| 4.63% | | 03/15/24 | | | 2,917,000 | | | | 2,858,952 | | | |
Plains All American Pipeline LP/PAA Finance Corp. | | | | | | | | | | |
| 4.65% | | 10/15/25 | | | 1,014,000 | | | | 885,671 | | | |
PNC Bank NA | | | | | | | | | | |
| 2.40% | | 10/18/19 | | | 3,357,000 | | | | 3,370,210 | | | |
Precision Castparts Corp. | | | | | | | | | | |
| 4.38% | | 06/15/45 | | | 1,014,000 | | | | 1,016,042 | | | |
Principal Financial Group Inc. | | | | | | | | | | |
| 4.70% | | 05/15/55 | | | 3,380,000 | | | | 3,359,720 | | | (h) |
Prologis LP | | | | | | | | | | |
| 3.75% | | 11/01/25 | | | 1,688,000 | | | | 1,674,430 | | | |
| | | | | | | | | | | | |
| | | Principal
Amount | | | Fair
Value | | | |
Prudential Financial Inc. | | | | | | | | | | |
| 5.38% | | 05/15/45 | | $ | 1,690,000 | | | $ | 1,687,888 | | | (h) |
| 5.63% | | 06/15/43 | | | 2,060,000 | | | | 2,106,350 | | | (h) |
Public Service Electric & Gas Co. | | | | | | | | | | |
| 2.38% | | 05/15/23 | | | 5,064,000 | | | | 4,851,555 | | | |
QUALCOMM Inc. | | | | | | | | | | |
| 2.25% | | 05/20/20 | | | 1,352,000 | | | | 1,339,459 | | | |
| 3.45% | | 05/20/25 | | | 1,199,000 | | | | 1,150,221 | | | |
| 4.80% | | 05/20/45 | | | 1,200,000 | | | | 1,066,697 | | | |
Quest Diagnostics Inc. | | | | | | | | | | |
| 4.70% | | 03/30/45 | | | 1,014,000 | | | | 913,112 | | | |
Regency Energy Partners LP/Regency Energy Finance Corp. | | | | | | | | | | |
| 4.50% | | 11/01/23 | | | 2,366,000 | | | | 2,047,889 | | | |
Revlon Consumer Products Corp. | | | | | | | | | | |
| 5.75% | | 02/15/21 | | | 5,522,000 | | | | 5,342,535 | | | |
Reynolds American Inc. | | | | | | | | | | |
| 4.45% | | 06/12/25 | | | 1,015,000 | | | | 1,062,113 | | | |
Rio Tinto Finance USA Ltd. | | | | | | | | | | |
| 3.75% | | 06/15/25 | | | 845,000 | | | | 767,651 | | | |
Roche Holdings Inc. | | | | | | | | | | |
| 2.25% | | 09/30/19 | | | 1,596,000 | | | | 1,604,893 | | | (b) |
| 3.35% | | 09/30/24 | | | 1,400,000 | | | | 1,433,592 | | | (b) |
Rogers Communications Inc. | | | | | | | | | | |
| 5.00% | | 03/15/44 | | | 1,074,000 | | | | 1,080,498 | | | |
Rowan Companies Inc. | | | | | | | | | | |
| 5.85% | | 01/15/44 | | | 682,000 | | | | 411,525 | | | |
Royal Bank of Canada | | | | | | | | | | |
| 1.20% | | 09/19/17 | | | 5,587,000 | | | | 5,560,903 | | | |
Ryder System Inc. | | | | | | | | | | |
| 2.45% | | 09/03/19 | | | 4,135,000 | | | | 4,074,960 | | | |
Santander Bank NA | | | | | | | | | | |
| 2.00% | | 01/12/18 | | | 4,110,000 | | | | 4,080,149 | | | |
Santander UK Group Holdings PLC | | | | | | | | | | |
| 4.75% | | 09/15/25 | | | 957,000 | | | | 944,374 | | | (b) |
Schaeffler Holding Finance BV
(6.25% Cash/7.00% PIK) | | | | | | | | | | |
| 6.25% | | 11/15/19 | | | 2,135,000 | | | | 2,231,075 | | | (b,l) |
Schaeffler Holding Finance BV
(6.75% Cash/7.50% PIK) | | | | | | | | | | |
| 6.75% | | 11/15/22 | | | 740,000 | | | | 795,500 | | | (b,l) |
Schaeffler Holding Finance BV
(6.88% Cash/7.63% PIK) | | | | | | | | | | |
| 6.88% | | 08/15/18 | | | 1,900,000 | | | | 1,957,000 | | | (b,l) |
Schlumberger Holdings Corp. | | | | | | | | | | |
| 3.00% | | 12/21/20 | | | 4,603,000 | | | | 4,544,215 | | | (b) |
| 4.00% | | 12/21/25 | | | 3,069,000 | | | | 3,030,051 | | | (b) |
Sealed Air Corp. | | | | | | | | | | |
| 4.88% | | 12/01/22 | | | 2,038,000 | | | | 2,043,095 | | | (b) |
| 5.13% | | 12/01/24 | | | 2,038,000 | | | | 2,038,000 | | | (b) |
Shell International Finance BV | | | | | | | | | | |
| 2.25% | | 11/10/20 | | | 3,378,000 | | | | 3,327,330 | | | |
| 3.40% | | 08/12/23 | | | 5,178,000 | | | | 5,148,563 | | | |
See Notes to Schedules of Investments and Notes to Financial Statements.
19
| | |
GE RSP Income Fund | | December 31, 2015 |
| | | | | | | | | | | | |
| | | Principal
Amount | | | Fair
Value | | | |
Sinclair Television Group Inc. | | | | | | | | | | |
| 5.38% | | 04/01/21 | | $ | 3,562,000 | | | $ | 3,570,905 | | | |
Sinopec Capital 2013 Ltd. | | | | | | | | | | |
| 3.13% | | 04/24/23 | | | 2,653,000 | | | | 2,529,073 | | | (b) |
Southern California Edison Co. | | | | | | | | | | |
| 2.40% | | 02/01/22 | | | 1,345,000 | | | | 1,318,986 | | | |
Spectra Energy Partners LP | | | | | | | | | | |
| 4.75% | | 03/15/24 | | | 1,705,000 | | | | 1,652,367 | | | |
Sprint Corp. | | | | | | | | | | |
| 7.25% | | 09/15/21 | | | 1,895,000 | | | | 1,411,775 | | | (m) |
| 7.63% | | 02/15/25 | | | 3,612,000 | | | | 2,636,760 | | | (m) |
State Street Corp. | | | | | | | | | | |
| 3.55% | | 08/18/25 | | | 3,380,000 | | | | 3,486,811 | | | (e,m) |
Statoil ASA | | | | | | | | | | |
| 3.70% | | 03/01/24 | | | 1,505,000 | | | | 1,525,570 | | | |
| 3.95% | | 05/15/43 | | | 845,000 | | | | 763,267 | | | |
Sunoco LP/Sunoco Finance Corp. | | | | | | | | | | |
| 5.50% | | 08/01/20 | | | 1,361,000 | | | | 1,289,548 | | | (b) |
SUPERVALU Inc. | | | | | | | | | | |
| 6.75% | | 06/01/21 | | | 3,394,000 | | | | 3,071,570 | | | (m) |
T-Mobile USA Inc. | | | | | | | | | | |
| 6.25% | | 04/01/21 | | | 1,946,000 | | | | 2,009,245 | | | (m) |
| 6.50% | | 01/15/26 | | | 1,019,000 | | | | 1,028,670 | | | (m) |
| 6.63% | | 04/01/23 | | | 3,402,000 | | | | 3,470,040 | | | (m) |
Tampa Electric Co. | | | | | | | | | | |
| 4.35% | | 05/15/44 | | | 1,666,000 | | | | 1,632,064 | | | |
Target Corp. | | | | | | | | | | |
| 3.50% | | 07/01/24 | | | 2,134,000 | | | | 2,215,169 | | | |
TD Ameritrade Holding Corp. | | | | | | | | | | |
| 2.95% | | 04/01/22 | | | 1,690,000 | | | | 1,675,131 | | | |
Teachers Insurance & Annuity Association of America | | | | | | | | | | |
| 4.90% | | 09/15/44 | | | 2,365,000 | | | | 2,388,778 | | | (b) |
Teck Resources Ltd. | | | | | | | | | | |
| 2.50% | | 02/01/18 | | | 985,000 | | | | 748,600 | | | |
| 3.15% | | 01/15/17 | | | 1,356,000 | | | | 1,220,400 | | | |
Telecom Italia S.p.A. | | | | | | | | | | |
| 5.30% | | 05/30/24 | | | 4,900,000 | | | | 4,838,750 | | | (b,m) |
Tenet Healthcare Corp. | | | | | | | | | | |
| 4.75% | | 06/01/20 | | | 1,271,000 | | | | 1,277,355 | | | |
| 6.00% | | 10/01/20 | | | 3,421,000 | | | | 3,600,602 | | | (m) |
The Allstate Corp. | | | | | | | | | | |
| 5.75% | | 08/15/53 | | | 1,900,000 | | | | 1,953,200 | | | (h) |
The Bank of Tokyo-Mitsubishi UFJ Ltd. | | | | | | | | | | |
| 2.30% | | 03/10/19 | | | 4,200,000 | | | | 4,183,305 | | | (b) |
The Boeing Co. | | | | | | | | | | |
| 1.65% | | 10/30/20 | | | 1,688,000 | | | | 1,652,533 | | | |
| 2.60% | | 10/30/25 | | | 1,688,000 | | | | 1,634,141 | | | |
| 2.85% | | 10/30/24 | | | 2,358,000 | | | | 2,335,766 | | | |
The Coca-Cola Co. | | | | | | | | | | |
| 2.88% | | 10/27/25 | | | 3,376,000 | | | | 3,328,831 | | | |
| | | | | | | | | | | | |
| | | Principal
Amount | | | Fair
Value | | | |
The Dow Chemical Co. | | | | | | | | | | |
| 4.25% | | 10/01/34 | | $ | 1,690,000 | | | $ | 1,524,946 | | | |
The Goldman Sachs Group Inc. | | | | | | | | | | |
| 2.38% | | 01/22/18 | | | 4,023,000 | | | | 4,058,028 | | | (m) |
| 2.60% | | 04/23/20 | | | 3,380,000 | | | | 3,372,327 | | | (m) |
| 2.63% | | 01/31/19 | | | 1,717,000 | | | | 1,729,514 | | | (m) |
| 2.90% | | 07/19/18 | | | 1,381,000 | | | | 1,408,014 | | | (m) |
| 3.75% | | 05/22/25 | | | 2,873,000 | | | | 2,893,315 | | | |
| 4.00% | | 03/03/24 | | | 1,706,000 | | | | 1,751,907 | | | |
| 4.25% | | 10/21/25 | | | 562,000 | | | | 558,054 | | | |
| 4.80% | | 07/08/44 | | | 3,682,000 | | | | 3,657,305 | | | |
| 5.15% | | 05/22/45 | | | 1,689,000 | | | | 1,639,524 | | | |
The Home Depot Inc. | | | | | | | | | | |
| 3.35% | | 09/15/25 | | | 2,365,000 | | | | 2,418,156 | | | |
The Korea Development Bank | | | | | | | | | | |
| 3.25% | | 03/09/16 | | | 2,799,000 | | | | 2,810,064 | | | |
| 3.38% | | 09/16/25 | | | 1,670,000 | | | | 1,700,336 | | | |
| 4.00% | | 09/09/16 | | | 1,627,000 | | | | 1,657,269 | | | |
The Kroger Co. | | | | | | | | | | |
| 2.95% | | 11/01/21 | | | 2,358,000 | | | | 2,335,145 | | | |
The Progressive Corp. | | | | | | | | | | |
| 3.70% | | 01/26/45 | | | 262,000 | | | | 237,114 | | | |
The Toronto-Dominion Bank | | | | | | | | | | |
| 2.50% | | 12/14/20 | | | 3,069,000 | | | | 3,067,625 | | | |
The Williams Companies Inc. | | | | | | | | | | |
| 8.75% | | 03/15/32 | | | 687,000 | | | | 517,879 | | | |
TIAA Asset Management Finance Company LLC | | | | | | | | | | |
| 4.13% | | 11/01/24 | | | 1,691,000 | | | | 1,697,669 | | | (b) |
Time Inc. | | | | | | | | | | |
| 5.75% | | 04/15/22 | | | 3,420,000 | | | | 3,129,300 | | | (b,m) |
Time Warner Cable Inc. | | | | | | | | | | |
| 4.50% | | 09/15/42 | | | 338,000 | | | | 265,241 | | | |
| 6.55% | | 05/01/37 | | | 1,004,000 | | | | 1,015,486 | | | |
Time Warner Inc. | | | | | | | | | | |
| 3.60% | | 07/15/25 | | | 1,859,000 | | | | 1,810,514 | | | (m) |
| 3.88% | | 01/15/26 | | | 3,095,000 | | | | 3,069,568 | | | (m) |
| 5.35% | | 12/15/43 | | | 2,767,000 | | | | 2,760,641 | | | (m) |
Tyco Electronics Group S.A. | | | | | | | | | | |
| 2.35% | | 08/01/19 | | | 3,384,000 | | | | 3,372,938 | | | (m) |
Tyco International Finance S.A. | | | | | | | | | | |
| 5.13% | | 09/14/45 | | | 1,015,000 | | | | 1,053,081 | | | |
Tyson Foods Inc. | | | | | | | | | | |
| 2.65% | | 08/15/19 | | | 1,693,000 | | | | 1,694,361 | | | (m) |
| 3.95% | | 08/15/24 | | | 1,129,000 | | | | 1,159,253 | | | (m) |
| 5.15% | | 08/15/44 | | | 1,129,000 | | | | 1,179,014 | | | (m) |
U.S. Bancorp | | | | | | | | | | |
| 3.44% | | 02/01/16 | | | 5,157,000 | | | | 5,163,591 | | | (m) |
| 5.13% | | 12/29/49 | | | 3,379,000 | | | | 3,394,881 | | | (h,m) |
UBS Group Funding Jersey Ltd. | | | | | | | | | | |
| 2.95% | | 09/24/20 | | | 763,000 | | | | 755,958 | | | (b) |
| 4.13% | | 09/24/25 | | | 1,750,000 | | | | 1,749,279 | | | (b) |
Ultra Petroleum Corp. | | | | | | | | | | |
| 6.13% | | 10/01/24 | | | 3,380,000 | | | | 768,950 | | | (b) |
See Notes to Schedules of Investments and Notes to Financial Statements.
20
| | |
GE RSP Income Fund | | December 31, 2015 |
| | | | | | | | | | | | |
| | | Principal
Amount | | | Fair
Value | | | |
United Rentals North America Inc. | | | | | | | | | | |
| 6.13% | | 06/15/23 | | $ | 2,729,000 | | | $ | 2,790,403 | | | |
UnitedHealth Group Inc. | | | | | | | | | | |
| 2.70% | | 07/15/20 | | | 4,056,000 | | | | 4,100,085 | | | (m) |
| 4.75% | | 07/15/45 | | | 2,706,000 | | | | 2,847,567 | | | (m) |
US Bank NA | | | | | | | | | | |
| 2.80% | | 01/27/25 | | | 2,495,000 | | | | 2,429,394 | | | (m) |
Valeant Pharmaceuticals International Inc. | | | | | | | | | | |
| 6.13% | | 04/15/25 | | | 2,722,000 | | | | 2,429,385 | | | (b) |
| 6.38% | | 10/15/20 | | | 1,833,000 | | | | 1,768,845 | | | (b) |
Ventas Realty LP | | | | | | | | | | |
| 4.13% | | 01/15/26 | | | 1,352,000 | | | | 1,347,706 | | | |
Verizon Communications Inc. | | | | | | | | | | |
| 1.35% | | 06/09/17 | | | 8,312,000 | | | | 8,288,336 | | | (m) |
| 3.50% | | 11/01/24 | | | 1,679,000 | | | | 1,659,166 | | | (m) |
| 4.15% | | 03/15/24 | | | 3,369,000 | | | | 3,464,346 | | | (m) |
| 4.40% | | 11/01/34 | | | 1,684,000 | | | | 1,553,709 | | | (m) |
| 4.67% | | 03/15/55 | | | 1,197,000 | | | | 1,038,360 | | | (m) |
| 4.86% | | 08/21/46 | | | 1,690,000 | | | | 1,598,855 | | | (m) |
| 5.05% | | 03/15/34 | | | 1,039,000 | | | | 1,034,575 | | | (m) |
| 5.15% | | 09/15/23 | | | 2,035,000 | | | | 2,237,364 | | | (m) |
| 6.55% | | 09/15/43 | | | 1,138,000 | | | | 1,351,007 | | | (m) |
Virgin Media Finance PLC | | | | | | | | | | |
| 5.75% | | 01/15/25 | | | 3,724,000 | | | | 3,584,350 | | | (b,m) |
Visa Inc. | | | | | | | | | | |
| 2.80% | | 12/14/22 | | | 2,148,000 | | | | 2,151,862 | | | |
| 3.15% | | 12/14/25 | | | 2,148,000 | | | | 2,152,539 | | | |
| 4.30% | | 12/14/45 | | | 1,009,000 | | | | 1,022,710 | | | |
Volkswagen Group of America Finance LLC | | | | | | | | | | |
| 0.81% | | 11/20/17 | | | 1,669,000 | | | | 1,603,770 | | | (b,h) |
| 2.13% | | 05/23/19 | | | 5,263,000 | | | | 4,994,508 | | | (b) |
| 2.45% | | 11/20/19 | | | 1,350,000 | | | | 1,294,514 | | | (b) |
W.R. Grace & Co. | | | | | | | | | | |
| 5.13% | | 10/01/21 | | | 1,283,000 | | | | 1,295,830 | | | (b) |
| 5.63% | | 10/01/24 | | | 3,379,000 | | | | 3,412,790 | | | (b) |
Wal-Mart Stores Inc. | | | | | | | | | | |
| 4.30% | | 04/22/44 | | | 3,096,000 | | | | 3,156,682 | | | |
Wells Fargo & Co. | | | | | | | | | | |
| 2.55% | | 12/07/20 | | | 3,069,000 | | | | 3,053,609 | | | |
| 3.00% | | 02/19/25 | | | 1,689,000 | | | | 1,642,978 | | | |
| 3.90% | | 05/01/45 | | | 1,690,000 | | | | 1,558,194 | | | |
| 4.10% | | 06/03/26 | | | 2,180,000 | | | | 2,200,701 | | | |
| 4.30% | | 07/22/27 | | | 1,353,000 | | | | 1,382,286 | | | |
| 5.88% | | 12/29/49 | | | 2,359,000 | | | | 2,482,848 | | | (h) |
| 5.90% | | 12/29/49 | | | 2,229,000 | | | | 2,248,504 | | | (h) |
Williams Partners LP | | | | | | | | | | |
| 5.40% | | 03/04/44 | | | 338,000 | | | | 226,446 | | | |
Windstream Services LLC | | | | | | | | | | |
| 6.38% | | 08/01/23 | | | 3,218,000 | | | | 2,316,960 | | | |
WMG Acquisition Corp. | | | | | | | | | | |
| 6.00% | | 01/15/21 | | | 715,000 | | | | 718,575 | | | (b) |
| | | | | | | | | | | | |
| | | Principal
Amount | | | Fair
Value | | | |
WPP Finance 2010 | | | | | | | | | | |
| 3.75% | | 09/19/24 | | $ | 3,365,000 | | | $ | 3,349,380 | | | |
WPX Energy Inc. | | | | | | | | | | |
| 5.25% | | 01/15/17 | | | 3,212,000 | | | | 3,003,220 | | | |
XLIT Ltd. | | | | | | | | | | |
| 5.25% | | 12/15/43 | | | 1,406,000 | | | | 1,454,005 | | | |
Zimmer Biomet Holdings Inc. | | | | | | | | | | |
| 3.55% | | 04/01/25 | | | 1,689,000 | | | | 1,642,132 | | | |
| | | | 1,076,008,155 | | | |
|
Non-Agency Collateralized Mortgage Obligations — 10.7% |
| | | |
American Tower Trust I (REIT) | | | | | | | | | | |
| 1.55% | | 03/15/43 | | | 5,061,000 | | | | 4,942,796 | | | (b) |
Banc of America Commercial Mortgage Trust 2006-4 | | | | | | | | | | |
| 5.63% | | 07/10/46 | | | 208,488 | | | | 210,179 | | | |
| 5.68% | | 07/10/46 | | | 1,450,000 | | | | 1,480,213 | | | |
Banc of America Commercial Mortgage Trust 2007-1 | | | | | | | | | | |
| 5.48% | | 01/15/49 | | | 7,120,000 | | | | 7,290,713 | | | (h) |
Banc of America Commercial Mortgage Trust 2007-4 | | | | | | | | | | |
| 5.74% | | 02/10/51 | | | 240,484 | | | | 250,196 | | | (h) |
Banc of America Commercial Mortgage Trust 2008-1 | | | | | | | | | | |
| 6.22% | | 02/10/51 | | | 1,793,417 | | | | 1,899,239 | | | (h) |
Banc of America Merrill Lynch Commercial Mortgage Inc. 2005-1 | | | | | | | | | | |
| 5.34% | | 11/10/42 | | | 765,690 | | | | 764,838 | | | (h) |
Banc of America Merrill Lynch Commercial Mortgage Trust 2014-520M | | | | | | | | | | |
| 4.18% | | 08/15/46 | | | 1,353,328 | | | | 1,398,143 | | | (b,h) |
Bear Stearns Commercial Mortgage Securities Trust 2006-T22 | | | | | | | | | | |
| 5.62% | | 04/12/38 | | | 1,690,000 | | | | 1,701,395 | | | (h) |
Bear Stearns Commercial Mortgage Securities Trust 2007-PW18 | | | | | | | | | | |
| 6.09% | | 06/11/50 | | | 3,450,000 | | | | 3,661,108 | | | (h) |
Citigroup Commercial Mortgage Trust 2014-GC23 | | | | | | | | | | |
| 4.51% | | 07/10/47 | | | 6,872,000 | | | | 5,731,384 | | | (b,h) |
Citigroup Commercial Mortgage Trust 2015-GC33 | | | | | | | | | | |
| 3.17% | | 09/10/58 | | | 1,572,216 | | | | 1,098,725 | | | |
Citigroup Commercial Mortgage Trust 2015-P1 | | | | | | | | | | |
| 3.72% | | 09/15/48 | | | 6,475,522 | | | | 6,598,934 | | | |
COMM 2013-CR12 Mortgage Trust | | | | | | | | | | |
| 5.08% | | 10/10/46 | | | 701,250 | | | | 658,654 | | | (b,h) |
See Notes to Schedules of Investments and Notes to Financial Statements.
21
| | |
GE RSP Income Fund | | December 31, 2015 |
| | | | | | | | | | | | |
| | | Principal
Amount | | | Fair
Value | | | |
COMM 2013-LC13 Mortgage Trust | | | | | | | | | | |
| 4.56% | | 08/10/46 | | $ | 1,375,000 | | | $ | 1,477,306 | | | (b,h) |
COMM 2014-CR14 Mortgage Trust | | | | | | | | | | |
| 4.53% | | 02/10/47 | | | 1,940,000 | | | | 2,081,357 | | | (h) |
COMM 2014-CR19 Mortgage Trust | | | | | | | | | | |
| 4.72% | | 08/10/47 | | | 3,334,957 | | | | 2,884,809 | | | (b,h) |
COMM 2014-CR20 Mortgage Trust | | | | | | | | | | |
| 4.51% | | 11/10/47 | | | 1,691,008 | | | | 1,643,484 | | | (h) |
COMM 2014-CR21 Mortgage Trust | | | | | | | | | | |
| 3.99% | | 12/10/47 | | | 3,356,796 | | | | 3,455,212 | | | |
COMM 2015-CR23 Mortgage Trust | | | | | | | | | | |
| 4.26% | | 05/10/48 | | | 1,655,394 | | | | 1,525,252 | | | (h) |
COMM 2015-CR24 Mortgage Trust | | | | | | | | | | |
| 3.46% | | 08/10/55 | | | 3,147,315 | | | | 2,332,943 | | | |
| 3.70% | | 08/10/55 | | | 3,142,462 | | | | 3,193,717 | | | |
| 4.37% | | 08/10/55 | | | 2,829,717 | | | | 2,694,117 | | | (h) |
COMM 2015-LC19 Mortgage Trust | | | | | | | | | | |
| 2.87% | | 02/10/48 | | | 2,650,000 | | | | 1,971,834 | | | (b) |
COMM 2015-PC1 Mortgage Trust | | | | | | | | | | |
| 4.44% | | 07/10/50 | | | 1,643,711 | | | | 1,636,404 | | | (h) |
Core Industrial Trust 2015-CALW | | | | | | | | | | |
| 3.25% | | 02/10/34 | | | 3,313,248 | | | | 3,293,368 | | | (b) |
Credit Suisse Commercial Mortgage Trust 2006-C1 | | | | | | | | | | |
| 5.46% | | 02/15/39 | | | 4,111,793 | | | | 4,108,192 | | | (h) |
CSAIL 2015-C2 Commercial Mortgage Trust | | | | | | | | | | |
| 4.21% | | 06/15/57 | | | 1,142,000 | | | | 883,371 | | | (h) |
CSAIL 2015-C3 Commercial Mortgage Trust | | | | | | | | | | |
| 3.36% | | 08/15/48 | | | 1,886,261 | | | | 1,363,567 | | | (h) |
| 4.11% | | 08/15/48 | | | 2,515,014 | | | | 2,463,530 | | | (h) |
GS Mortgage Securities Corp. II 2012-GCJ9 | | | | | | | | | | |
| 2.33% | | 11/10/45 | | | 7,480,723 | | | | 720,302 | | | (g,h) |
GS Mortgage Securities Corp. Trust 2012-ALOH | | | | | | | | | | |
| 3.55% | | 04/10/34 | | | 1,720,000 | | | | 1,767,909 | | | (b) |
GS Mortgage Securities Trust 2011-GC5 | | | | | | | | | | |
| 3.00% | | 08/10/44 | | | 2,966,120 | | | | 2,980,949 | | | |
| 5.31% | | 08/10/44 | | | 1,470,000 | | | | 1,619,542 | | | (b,h) |
GS Mortgage Securities Trust 2014-GC20 | | | | | | | | | | |
| 4.26% | | 04/10/47 | | | 1,735,000 | | | | 1,813,015 | | | |
GS Mortgage Securities Trust 2014-NEW | | | | | | | | | | |
| 3.79% | | 01/10/31 | | | 3,405,000 | | | | 3,398,991 | | | (b) |
| | | | | | | | | | | | |
| | | Principal
Amount | | | Fair
Value | | | |
GS Mortgage Securities Trust 2015-GC28 | | | | | | | | | | |
| 1.17% | | 02/10/48 | | $ | 22,939,493 | | | $ | 1,572,578 | | | (g,h) |
GS Mortgage Securities Trust 2015-GC32 | | | | | | | | | | |
| 3.35% | | 07/10/48 | | | 1,729,178 | | | | 1,259,468 | | | |
| 4.41% | | 07/10/48 | | | 811,770 | | | | 781,363 | | | (h) |
GS Mortgage Securities Trust 2015-GC34 | | | | | | | | | | |
| 2.98% | | 10/10/48 | | | 3,864,693 | | | | 2,683,449 | | | |
GS Mortgage Securities Trust 2015-GS1 | | | | | | | | | | |
| 3.27% | | 11/10/48 | | | 4,429,384 | | | | 3,205,302 | | | |
Impac CMB Trust Series 2004-5 | | | | | | | | | | |
| 1.14% | | 10/25/34 | | | 1,256,407 | | | | 1,183,948 | | | (h) |
JP Morgan Chase Commercial Mortgage Securities Corp. 2012-LC9 | | | | | | | | | | |
| 1.87% | | 12/15/47 | | | 9,880,699 | | | | 754,043 | | | (g,h) |
JP Morgan Chase Commercial Mortgage Securities Trust 2006-LDP8 | | | | | | | | | | |
| 5.44% | | 05/15/45 | | | 2,010,000 | | | | 2,045,001 | | | |
JP Morgan Chase Commercial Mortgage Securities Trust 2007-CB18 | | | | | | | | | | |
| 5.44% | | 06/12/47 | | | 4,606,960 | | | | 4,717,393 | | | |
JPMBB Commercial Mortgage Securities Trust 2013-C12 | | | | | | | | | | |
| 4.03% | | 07/15/45 | | | 1,010,000 | | | | 1,049,636 | | | (h) |
JPMBB Commercial Mortgage Securities Trust 2013-C15 | | | | | | | | | | |
| 5.08% | | 11/15/45 | | | 1,365,000 | | | | 1,419,259 | | | (h) |
JPMBB Commercial Mortgage Securities Trust 2013-C17 | | | | | | | | | | |
| 4.89% | | 01/15/47 | | | 2,521,000 | | | | 2,543,487 | | | (h) |
JPMBB Commercial Mortgage Securities Trust 2014-C18 | | | | | | | | | | |
| 4.81% | | 02/15/47 | | | 1,710,000 | | | | 1,706,622 | | | (h) |
| 4.81% | | 02/15/47 | | | 976,394 | | | | 847,179 | | | (b,h) |
JPMBB Commercial Mortgage Securities Trust 2015-C29 | | | | | | | | | | |
| 3.70% | | 05/15/48 | | | 3,203,635 | | | | 2,391,319 | | | (h) |
JPMBB Commercial Mortgage Securities Trust 2015-C30 | | | | | | | | | | |
| 4.31% | | 07/15/48 | | | 3,143,960 | | | | 2,798,969 | | | (h) |
JPMBB Commercial Mortgage Securities Trust 2015-C31 | | | | | | | | | | |
| 3.80% | | 08/15/48 | | | 4,715,667 | | | | 4,821,829 | | | |
LB-UBS Commercial Mortgage Trust 2004-C8 | | | | | | | | | | |
| 0.47% | | 12/15/39 | | | 1,322,268 | | | | 6,837 | | | (b,g,h) |
LB-UBS Commercial Mortgage Trust 2006-C4 | | | | | | | | | | |
| 5.82% | | 06/15/38 | | | 1,205,429 | | | | 1,215,988 | | | (h) |
See Notes to Schedules of Investments and Notes to Financial Statements.
22
| | |
GE RSP Income Fund | | December 31, 2015 |
| | | | | | | | | | | | |
| | | Principal
Amount | | | Fair
Value | | | |
LB-UBS Commercial Mortgage Trust 2007-C6 | | | | | | | | | | |
| 6.11% | | 07/15/40 | | $ | 1,893,058 | | | $ | 1,976,947 | | | (h) |
| 6.11% | | 07/15/40 | | | 4,180,000 | | | | 4,365,569 | | | (b) |
MASTR Alternative Loan Trust 2003-5 | | | | | | | | | | |
| 5.00% | | 08/25/18 | | | 182,500 | | | | 7,599 | | | (g) |
ML-CFC Commercial Mortgage Trust 2006-3 | | | | | | | | | | |
| 5.46% | | 07/12/46 | | | 4,580,000 | | | | 4,655,015 | | | (h) |
Morgan Stanley Bank of America Merrill Lynch Trust 2013-C10 | | | | | | | | | | |
| 4.08% | | 07/15/46 | | | 3,154,000 | | | | 3,067,152 | | | (h) |
Morgan Stanley Bank of America Merrill Lynch Trust 2013-C9 | | | | | | | | | | |
| 4.16% | | 05/15/46 | | | 1,201,767 | | | | 1,087,828 | | | (b,h) |
Morgan Stanley Bank of America Merrill Lynch Trust 2014-C14 | | | | | | | | | | |
| 4.83% | | 02/15/47 | | | 1,723,654 | | | | 1,600,494 | | | (b,h) |
Morgan Stanley Bank of America Merrill Lynch Trust 2014-C15 | | | | | | | | | | |
| 4.90% | | 04/15/47 | | | 5,094,625 | | | | 4,620,752 | | | (b,h) |
Morgan Stanley Bank of America Merrill Lynch Trust 2014-C18 | | | | | | | | | | |
| 3.39% | | 10/15/47 | | | 6,936,108 | | | | 5,346,829 | | | (b) |
Morgan Stanley Bank of America Merrill Lynch Trust 2014-C19 | | | | | | | | | | |
| 3.25% | | 12/15/47 | | | 2,016,506 | | | | 1,501,239 | | | (b) |
Morgan Stanley Bank of America Merrill Lynch Trust 2015-C20 | | | | | | | | | | |
| 1.42% | | 02/15/48 | | | 25,715,280 | | | | 2,220,319 | | | (g,h) |
Morgan Stanley Bank of America Merrill Lynch Trust 2015-C21 | | | | | | | | | | |
| 0.99% | | 03/15/48 | | | 31,393,956 | | | | 2,024,358 | | | (g,h) |
Morgan Stanley Bank of America Merrill Lynch Trust 2015-C22 | | | | | | | | | | |
| 3.88% | | 04/15/48 | | | 2,979,954 | | | | 2,910,599 | | | (h) |
| 4.24% | | 04/15/48 | | | 7,963,855 | | | | 6,464,748 | | | (b,h) |
Morgan Stanley Bank of America Merrill Lynch Trust 2015-C23 | | | | | | | | | | |
| 4.14% | | 07/15/50 | | | 8,153,333 | | | | 6,596,416 | | | (b,h) |
Morgan Stanley Bank of America Merrill Lynch Trust 2015-C24 | | | | | | | | | | |
| 3.73% | | 05/15/48 | | | 6,525,397 | | | | 6,653,491 | | | |
| 4.35% | | 05/15/48 | | | 6,568,055 | | | | 6,507,605 | | | (h) |
Morgan Stanley Capital I Trust 2005-T17 | | | | | | | | | | |
| 4.84% | | 12/13/41 | | | 525,731 | | | | 527,633 | | | (h) |
Morgan Stanley Capital I Trust 2006-IQ11 | | | | | | | | | | |
| 5.78% | | 10/15/42 | | | 2,300,000 | | | | 2,298,346 | | | (h) |
Morgan Stanley Capital I Trust 2006-T21 | | | | | | | | | | |
| 5.27% | | 10/12/52 | | | 1,899,477 | | | | 1,898,372 | | | (h) |
| | | | | | | | | | | | |
| | | Principal
Amount | | | Fair
Value | | | |
Morgan Stanley Capital I Trust 2006-T23 | | | | | | | | | | |
| 5.85% | | 08/12/41 | | $ | 990,981 | | | $ | 997,928 | | | (h) |
Morgan Stanley Capital I Trust 2007-IQ16 | | | | | | | | | | |
| 6.05% | | 12/12/49 | | | 3,450,000 | | | | 3,617,275 | | | (h) |
Morgan Stanley Capital I Trust 2008-T29 | | | | | | | | | | |
| 6.27% | | 01/11/43 | | | 1,525,000 | | | | 1,633,890 | | | (h) |
Morgan Stanley Capital I Trust 2012-C4 | | | | | | | | | | |
| 5.21% | | 03/15/45 | | | 1,510,000 | | | | 1,625,609 | | | (b,h) |
Morgan Stanley Capital I Trust 2015-MS1 | | | | | | | | | | |
| 4.03% | | 05/15/48 | | | 2,300,000 | | | | 1,806,916 | | | (b,h) |
Morgan Stanley Capital I Trust 2015-UBS8 | | | | | | | | | | |
| 3.81% | | 12/15/48 | | | 6,206,063 | | | | 6,311,940 | | | |
Wells Fargo Commercial Mortgage Trust 2015-C26 | | | | | | | | | | |
| 1.41% | | 02/15/48 | | | 26,652,386 | | | | 2,297,462 | | | (g,h) |
Wells Fargo Commercial Mortgage Trust 2015-C29 | | | | | | | | | | |
| 4.01% | | 06/15/48 | | | 4,936,290 | | | | 5,034,016 | | | |
| 4.22% | | 06/15/48 | | | 2,568,603 | | | | 2,018,048 | | | (h) |
Wells Fargo Commercial Mortgage Trust 2015-C30 | | | | | | | | | | |
| 4.50% | | 09/15/58 | | | 1,571,968 | | | | 1,278,551 | | | (b,h) |
Wells Fargo Commercial Mortgage Trust 2015-C31 | | | | | | | | | | |
| 3.70% | | 11/15/48 | | | 3,144,033 | | | | 3,187,860 | | | |
Wells Fargo Commercial Mortgage Trust 2015-LC22 | | | | | | | | | | |
| 4.54% | | 09/15/58 | | | 1,573,321 | | | | 1,285,978 | | | (h) |
Wells Fargo Commercial Mortgage Trust 2015-NXS2 | | | | | | | | | | |
| 4.25% | | 07/15/58 | | | 1,572,276 | | | | 1,238,756 | | | (h) |
Wells Fargo Commercial Mortgage Trust 2015-P2 | | | | | | | | | | |
| 4.90% | | 12/15/48 | | | 7,971,671 | | | | 7,796,690 | | | (h) |
Wells Fargo Commercial Mortgage Trust 2015-SG1 | | | | | | | | | | |
| 3.79% | | 12/15/47 | | | 4,087,062 | | | | 4,180,059 | | | |
| 4.47% | | 12/15/47 | | | 1,571,889 | | | | 1,481,262 | | | (h) |
Wells Fargo Mortgage Backed Securities Trust 2006-3 | | | | | | | | | | |
| 5.50% | | 03/25/36 | | | 633,405 | | | | 25,432 | | | |
WFRBS Commercial Mortgage Trust 2013-C17 | | | | | | | | | | |
| 4.26% | | 12/15/46 | | | 1,880,000 | | | | 1,987,221 | | | |
| 5.13% | | 12/15/46 | | | 1,385,000 | | | | 1,318,528 | | | (b,h) |
WFRBS Commercial Mortgage Trust 2013-C18 | | | | | | | | | | |
| 4.67% | | 12/15/46 | | | 1,939,955 | | | | 1,803,072 | | | (b,h) |
See Notes to Schedules of Investments and Notes to Financial Statements.
23
| | |
GE RSP Income Fund | | December 31, 2015 |
| | | | | | | | | | | | |
| | | Principal
Amount | | | Fair
Value | | | |
WFRBS Commercial Mortgage Trust 2014-C19 | | | | | | | | | | |
| 4.23% | | 03/15/47 | | $ | 3,147,086 | | | $ | 2,641,937 | | | (b) |
| 4.72% | | 03/15/47 | | | 2,365,000 | | | | 2,477,887 | | | (h) |
WFRBS Commercial Mortgage Trust 2014-C22 | | | | | | | | | | |
| 3.91% | | 09/15/57 | | | 4,451,839 | | | | 3,591,485 | | | (b,h) |
WFRBS Commercial Mortgage Trust 2014-C24 | | | | | | | | | | |
| 3.69% | | 11/15/47 | | | 6,130,338 | | | | 4,713,198 | | | (b) |
WFRBS Commercial Mortgage Trust 2014-C25 | | | | | | | | | | |
| 3.80% | | 11/15/47 | | | 816,000 | | | | 624,088 | | | (b,h) |
WFRBS Commercial Mortgage Trust 2014-LC14 | | | | | | | | | | |
| 4.35% | | 03/15/47 | | | 4,333,000 | | | | 4,572,273 | | | (h) |
| 4.59% | | 03/15/47 | | | 4,843,169 | | | | 4,146,866 | | | (b,h) |
WFRBS Commercial Mortgage Trust 2015-C31 | | | | | | | | | | |
| 3.85% | | 11/15/48 | | | 785,963 | | | | 577,436 | | | |
| | | | 264,602,332 | | | |
|
Sovereign Bonds — 1.0% |
| | | |
Government of Chile | | | | | | | | | | |
| 3.63% | | 10/30/42 | | | 700,000 | | | | 609,000 | | | |
Government of Colombia | | | | | | | | | | |
| 2.63% | | 03/15/23 | | | 2,597,000 | | | | 2,281,464 | | | |
| 5.63% | | 02/26/44 | | | 1,740,000 | | | | 1,587,750 | | | |
Government of Mexico | | | | | | | | | | |
| 3.60% | | 01/30/25 | | | 3,314,000 | | | | 3,229,493 | | | |
| 4.00% | | 10/02/23 | | | 1,684,000 | | | | 1,705,892 | | | |
| 4.60% | | 01/23/46 | | | 2,370,000 | | | | 2,097,450 | | | |
| 4.75% | | 03/08/44 | | | 3,730,000 | | | | 3,398,030 | | | |
Government of Panama | | | | | | | | | | |
| 4.00% | | 09/22/24 | | | 1,673,000 | | | | 1,673,000 | | | |
Government of Peru | | | | | | | | | | |
| 4.13% | | 08/25/27 | | | 1,015,000 | | | | 994,700 | | | |
| 5.63% | | 11/18/50 | | | 544,000 | | | | 554,880 | | | |
Government of Philippines | | | | | | | | | | |
| 3.95% | | 01/20/40 | | | 835,000 | | | | 844,716 | | | |
| 4.20% | | 01/21/24 | | | 1,514,000 | | | | 1,639,944 | | | |
Government of Turkey | | | | | | | | | | |
| 3.25% | | 03/23/23 | | | 2,038,000 | | | | 1,866,922 | | | |
| 4.88% | | 04/16/43 | | | 1,669,000 | | | | 1,468,720 | | | |
| 6.63% | | 02/17/45 | | | 655,000 | | | | 733,993 | | | |
| | | | 24,685,954 | | | |
|
Municipal Bonds and Notes — 0.6% |
| | | |
American Municipal Power Inc. | | | | | | | | | | |
| 6.27% | | 02/15/50 | | | 2,105,000 | | | | 2,447,968 | | | |
Municipal Electric Authority of Georgia | | | | | | | | | | |
| 6.64% | | 04/01/57 | | | 2,369,000 | | | | 2,843,060 | | | |
New Jersey Transportation Trust Fund Authority | | | | | | | | | | |
| 6.88% | | 12/15/39 | | | 880,000 | | | | 922,170 | | | |
| | | | | | | | | | | | |
| | | Principal
Amount | | | Fair
Value | | | |
Port Authority of New York & New Jersey | | | | | | | | | | |
| 4.46% | | 10/01/62 | | $ | 4,095,000 | | | $ | 3,935,582 | | | |
South Carolina State Public Service Authority | | | | | | | | | | |
| 6.45% | | 01/01/50 | | | 1,495,000 | | | | 1,872,592 | | | |
State of California | | | | | | | | | | |
| 5.70% | | 11/01/21 | | | 2,075,000 | | | | 2,434,182 | | | |
State of Illinois | | | | | | | | | | |
| 5.10% | | 06/01/33 | | | 1,015,000 | | | | 959,835 | | | |
| | | | 15,415,389 | | | |
|
FNMA (TBA) — 0.0%* |
| | | |
Lehman TBA | | | | | | | | | | |
| 5.50% | | TBA | | | 1,230,277 | | | | 67,662 | | | (j,k) |
| | | |
Total Bonds and Notes
(Cost $2,474,995,649) | | | | | | | 2,444,008,060 | | | |
| | | | | | | | | | | | |
| | | Number
of Shares | | | Fair
Value | | | |
Domestic Equity — 0.1% |
|
Preferred Stock — 0.1% |
| | | |
Wells Fargo & Co. | | | | | | | | | | |
(Cost $2,594,700) | | | 103,788 | | | $ | 2,710,943 | | | |
| | | |
Total Investments in Securities
(Cost $2,477,590,349) | | | | | | | 2,446,719,003 | | | |
| | | | | | | | | | | | |
| | | Principal
Amount | | | Fair
Value | | | |
Short-Term Investments — 4.7% |
| | | | | | | | | | | | |
Time Deposit — 2.3% |
| | | |
State Street Corp. | | | | | | | | | | |
| 0.01% | | 01/04/16 | | $ | 55,730,102 | | | $ | 55,730,102 | | | (e) |
| | | | | | | | | | | | |
U.S. Treasuries — 2.4% |
| | | |
U.S. Treasury Bills | | | | | | | | | | |
| 0.01% | | 03/17/16 | | | 60,000,000 | | | | 59,989,500 | | | (d) |
| | | |
Total Short-Term Investments
(Cost $115,703,819) | | | | | | | 115,719,602 | | | |
| | | |
Total Investments
(Cost $2,593,294,168) | | | | | | | 2,562,438,605 | | | |
| | | |
Liabilities in Excess of Other Assets, net — (3.7)% | | | | | | | (90,552,671 | ) | | |
| | | | | | | | | | | | |
| | | |
NET ASSETS — 100.0% | | | | | | $ | 2,471,885,934 | | | |
| | | | | | | | | | | | |
See Notes to Schedules of Investments and Notes to Financial Statements.
24
| | |
GE RSP Income Fund | | December 31, 2015 |
Centrally Cleared Credit Default Swaps – Sell Protection
| | | | | | | | | | | | | | | | | | | | | | | | | | | | | | | | |
Reference Entity | | Counterparty | | Notional
Amount
(000s
omitted) | | Contract
annual
Fixed Rate | | Termination
Date | | Market
Value | | Unamortized
Upfront
Payments
Received | | Unrealized
Appreciation |
Markit CDX North America High Yield Index | | CME Group Inc. | | | $ | 25,800 | | | | | 5.00 | % | | | | 12/20/20 | | | | $ | 331,033 | | | | $ | (138,036 | ) | | | $ | 469,069 | |
The Fund had the following long futures contracts open at December 31, 2015:
| | | | | | | | | | | | | | | | | |
| Description | | Expiration
date | | Number
of
Contracts | | Current Notional Value | | Unrealized
Depreciation |
U.S. Long Bond Futures | | March 2016 | | | | 27 | | | | $ | 4,151,250 | | | | $ | (60,079 | ) |
Ultra Long-Term U.S. Treasury Bond Futures | | March 2016 | | | | 52 | | | | | 8,251,750 | | | | | (4,120 | ) |
2 Yr. U.S. Treasury Notes Futures | | March 2016 | | | | 1,009 | | | | | 219,189,486 | | | | | (489,498 | ) |
| | | | | | | | | | | | | | | | | |
| | | | | | | | | | | | | | | $ | (553,697 | ) |
| | | | | | | | | | | | | | | | | |
The Fund had the following short futures contracts open at December 31, 2015:
| | | | | | | | | | | | | | | | | |
| Description | | Expiration
date | | Number
of
Contracts | | Current Notional Value | | Unrealized
Appreciation |
5 Yr. U.S. Treasury Notes Futures | | March 2016 | | | | 53 | | | | $ | (6,270,977 | ) | | | $ | 20,362 | |
10 Yr. U.S. Treasury Notes Futures | | March 2016 | | | | 2,049 | | | | | (257,981,906 | ) | | | | 1,705,751 | |
| | | | | | | | | | | | | | | | | |
| | | | | | | | | | | | | | | $ | 1,726,113 | |
| | | | | | | | | | | | | | | | | |
| | | | | | | | | | | | | | | $ | 1,172,416 | |
| | | | | | | | | | | | | | | | | |
See Notes to Schedules of Investments and Notes to Financial Statements.
25

December 31, 2015
The views expressed in this document reflect our judgment as of the publication date and are subject to change at any time without notice. The securities cited may not be representative of the Funds’ future investments and should not be construed as a recommendation to purchase or sell a particular security. See the Funds’ Supplemental Information Documents and Consolidated Profile for complete descriptions of investment objectives, policies, risks and permissible investments.
| (a) | Non-income producing security. |
| (b) | Pursuant to Rule 144A of the Securities Act of 1933, as amended, these securities may be resold in transactions exempt from registration, normally to qualified institutional buyers. At December 31, 2015, these securities amounted to $285,947,178 or 11.57% of the net assets of the GE RSP Income Fund. These securities have been determined to be liquid using procedures established by the Fund’s Board of Trustees. |
| (c) | Settlement is on a delayed delivery or when-issued basis with final maturity to be announced (TBA) in the future. |
| (d) | Coupon amount represents effective yield. |
| (e) | State Street Corp. is the parent company of State Street Bank & Trust Co., the Fund’s sub-administrator, custodian and accounting agent. |
| (f) | Principal only security. These securities represent the right to receive the monthly principal payments on an underlying pool of mortgages. No payments of interest on the pool are passed through to the “principal only” holder. |
| (g) | Interest only security. These securities represent the right to receive the monthly interest payments on an underlying pool of mortgages. Payments of principal on the pool reduce the value of the “interest only” holding. |
| (h) | Variable or floating rate security. The stated rate represents the rate at December 31, 2015. |
| (j) | Security is in default. |
| (k) | Security is fair valued by the Valuation Committee, in accordance with the procedures approved by the Board of Trustees. |
| (l) | Represents a payment-in-kind security in which may pay all or a portion of interest in additional par. |
| (m) | At December 31, 2015, all or a portion of this security was pledged to cover collateral requirements for futures and/or TBA’s. |
| † | Percentages are based on net assets as of December 31, 2015. |
Abbreviations:
| | | | |
| ADR | | — | | American Depositary Receipt |
| | |
| REIT | | — | | Real Estate Investment Trust |
| | |
| REMIC | | — | | Real Estate Mortgage Investment Conduit |
| | |
| STRIPS | | — | | Separate Trading of Registered Interest and Principal of Security |
| | |
| TBA | | — | | To Be Announced |
26

Selected data based on a share outstanding throughout the fiscal years indicated
| | | | | | | | | | | | | | | | | | | | |
| GE RSP U.S. Equity Fund | | 12/31/15 | | | 12/31/14 | | | 12/31/13 | | | 12/31/12 | | | 12/31/11 | |
Net asset value, beginning of period | | $ | 54.31 | | | $ | 54.73 | | | $ | 44.41 | | | $ | 38.75 | | | $ | 40.23 | |
Income/(loss) from investment operations: | | | | | | | | | | | | | | | | | | | | |
Net investment income | | | 0.92 | | | | 0.93 | | | | 0.89 | | | | 0.84 | | | | 0.60 | |
Net realized and unrealized gains/(losses) on investments | | | (1.94) | | | | 6.40 | | | | 14.69 | | | | 5.66 | | | | (1.47) | |
Total income/(loss) from investment operations | | | (1.02) | | | | 7.33 | | | | 15.58 | | | | 6.50 | | | | (0.87) | |
| | | | | |
Less distributions from: | | | | | | | | | | | | | | | | | | | | |
Net investment income | | | 0.92 | | | | 0.92 | | | | 0.89 | | | | 0.84 | | | | 0.61 | |
Net realized gains | | | 4.78 | | | | 6.83 | | | | 4.37 | | | | — | | | | — | |
Total distributions | | | 5.70 | | | | 7.75 | | | | 5.26 | | | | 0.84 | | | | 0.61 | |
| | | | | |
Net asset value, end of period | | $ | 47.59 | | | $ | 54.31 | | | $ | 54.73 | | | $ | 44.41 | | | $ | 38.75 | |
| | | | | |
TOTAL RETURN(a) | | | (2.05)% | | | | 13.27% | | | | 35.15% | | | | 16.78% | | | | (2.16)% | |
| | | | | |
RATIOS/SUPPLEMENTAL DATA: | | | | | | | | | | | | | | | | | | | | |
Net assets, end of period (in thousands) | | $ | 4,941,537 | | | $ | 5,445,144 | | | $ | 5,056,561 | | | $ | 3,960,011 | | | $ | 3,595,722 | |
Ratios to average net assets: | | | | | | | | | | | | | | | | | | | | |
Net expenses | | | 0.16% | | | | 0.14% | | | | 0.12% | | | | 0.17% | | | | 0.16% | |
Gross expenses | | | 0.16% | | | | 0.14% | | | | 0.12% | | | | 0.17% | | | | 0.16% | |
Net investment income | | | 1.62% | | | | 1.58% | | | | 1.66% | | | | 1.88% | | | | 1.45% | |
Portfolio turnover rate | | | 37% | | | | 41% | | | | 40% | | | | 68% | | | | 39% | |
| (a) | Total returns are historical and assume changes in share price, reinvestment of dividends and capital gains distributions. Past performance does not guarantee future results. |
The accompanying Notes are an integral part of these financial statements.
27
Selected data based on a share outstanding throughout the fiscal years indicated
| | | | | | | | | | | | | | | | | | | | |
| GE RSP Income Fund | | 12/31/15 | | | 12/31/14 | | | 12/31/13 | | | 12/31/12 | | | 12/31/11 | |
Net asset value, beginning of period | | $ | 11.67 | | | $ | 11.33 | | | $ | 11.75 | | | $ | 11.67 | | | $ | 11.27 | |
Income/(loss) from investment operations: | | | | | | | | | | | | | | | | | | | | |
Net investment income | | | 0.33 | | | | 0.30 | | | | 0.30 | | | | 0.27 | | | | 0.40 | |
Net realized and unrealized gains/(losses) on investments | | | (0.29) | | | | 0.35 | | | | (0.40) | | | | 0.41 | | | | 0.49 | |
Total income/(loss) from investment operations | | | 0.04 | | | | 0.65 | | | | (0.10) | | | | 0.68 | | | | 0.89 | |
| | | | | |
Less distributions from: | | | | | | | | | | | | | | | | | | | | |
Net investment income | | | 0.33 | | | | 0.31 | | | | 0.29 | | | | 0.27 | | | | 0.40 | |
Net realized gains | | | 0.02 | | | | 0.00 | * | | | 0.03 | | | | 0.33 | | | | 0.09 | |
Total distributions | | | 0.35 | | | | 0.31 | | | | 0.32 | | | | 0.60 | | | | 0.49 | |
| | | | | |
Net asset value, end of period | | $ | 11.36 | | | $ | 11.67 | | | $ | 11.33 | | | $ | 11.75 | | | $ | 11.67 | |
| | | | | |
TOTAL RETURN(a) | | | 0.34% | | | | 5.83% | | | | (0.85)% | | | | 5.87% | | | | 8.01% | |
| | | | | |
RATIOS/SUPPLEMENTAL DATA: | | | | | | | | | | | | | | | | | | | | |
Net assets, end of period (in thousands) | | $ | 2,471,886 | | | $ | 2,613,303 | | | $ | 2,601,277 | | | $ | 2,932,275 | | | $ | 2,755,370 | |
Ratios to average net assets: | | | | | | | | | | | | | | | | | | | | |
Net expenses | | | 0.18% | | | | 0.11% | | | | 0.19% | | | | 0.19% | | | | 0.16% | |
Gross expenses | | | 0.18% | | | | 0.11% | | | | 0.19% | | | | 0.19% | | | | 0.16% | |
Net investment income | | | 2.79% | | | | 2.68% | | | | 2.58% | | | | 2.22% | | | | 3.46% | |
Portfolio turnover rate | | | 271% | | | | 319% | | | | 335% | | | | 398% | | | | 439% | |
| (a) | Total returns are historical and assume changes in share price, reinvestment of dividends and capital gains distributions. Past performance does not guarantee future results. |
| * | Rounds to less than $0.005. |
The accompanying Notes are an integral part of these financial statements.
28
| | | | | | | | |
| | |
Statements of Assets and Liabilities December 31, 2015 | | GE RSP
U.S. EQUITY FUND | | | GE RSP
INCOME FUND | |
| | |
ASSETS | | | | | | | | |
Investments in securities, at fair value (cost $4,115,867,372 and $2,477,590,349, respectively) | | $ | 4,762,920,763 | | | $ | 2,446,719,003 | |
Short-term investments (cost $172,132,649 and $115,703,819, respectively) | | | 172,132,649 | | | | 115,719,602 | |
Cash | | | 613,924 | | | | — | |
Restricted cash(1) | | | — | | | | 250,000 | |
Receivable for investments sold | | | — | | | | 34,826,597 | |
Income receivables | | | 8,004,206 | | | | 16,319,115 | |
Receivable for fund shares sold | | | 508 | | | | 483,903 | |
Receivable for variation margin on open centrally cleared swap contracts | | | — | | | | 11,403 | |
Other assets | | | 109,579 | | | | 27,168 | |
Total assets | | | 4,943,781,629 | | | | 2,614,356,791 | |
LIABILITIES | | | | | | | | |
Distribution payable to shareholders | | | — | | | | 232,117 | |
Payable for investments purchased | | | — | | | | 140,856,327 | |
Payable for fund shares redeemed | | | 1,196,142 | | | | 56,025 | |
Payable to GEAM | | | 446,316 | | | | 299,519 | |
Accrued other expenses | | | 601,892 | | | | 471,900 | |
Variation margin payable on open futures contracts | | | — | | | | 554,969 | |
Total liabilities | | | 2,244,350 | | | | 142,470,857 | |
NET ASSETS | | $ | 4,941,537,279 | | | $ | 2,471,885,934 | |
NET ASSETS CONSIST OF: | | | | | | | | |
Capital paid in | | $ | 4,325,871,769 | | | $ | 2,505,171,064 | |
Undistributed (distributions in excess of) net investment income | | | — | | | | 1,073,219 | |
Accumulated net realized loss | | | (31,385,127 | ) | | | (5,144,271 | ) |
Net unrealized appreciation (depreciation) on: | | | | | | | | |
Investments | | | 647,053,391 | | | | (30,855,563 | ) |
Futures | | | — | | | | 1,172,416 | |
Swap contracts | | | — | | | | 469,069 | |
Foreign currency related transactions | | | (2,754 | ) | | | — | |
NET ASSETS | | $ | 4,941,537,279 | | | $ | 2,471,885,934 | |
Shares outstanding ($25.00 and $10.00 par value, respectively; unlimited shares authorized) | | | 103,834,165 | | | | 217,597,388 | |
Net asset value per share | | | $47.59 | | | | $11.36 | |
| (1) | Deposits at broker for futures contracts. |
The accompanying Notes are an integral part of these financial statements.
29
| | | | | | | | |
| | |
Statements of Operations For the year ended December 31, 2015 | | GE RSP
U.S. EQUITY FUND | | | GE RSP
INCOME FUND | |
| | |
INVESTMENT INCOME | | | | | | | | |
Income | | | | | | | | |
Dividend | | $ | 94,416,338 | | | $ | 165,581 | |
Interest | | | 10,651 | | | | 75,665,208 | |
Less: Foreign taxes withheld | | | (326,149 | ) | | | — | |
Total income | | | 94,100,840 | | | | 75,830,789 | |
Expenses | | | | | | | | |
Advisory and administration fees | | | 6,894,861 | | | | 3,516,614 | |
Transfer agent fees | | | 511,371 | | | | 496,340 | |
Custody and accounting expenses | | | 177,101 | | | | 262,011 | |
Registration fees | | | 484,641 | | | | 115,956 | |
Professional fees | | | 34,180 | | | | — | |
Other expenses | | | 234,747 | | | | 182,056 | |
Total expenses | | | 8,336,901 | | | | 4,572,977 | |
Net investment income | | $ | 85,763,939 | | | $ | 71,257,812 | |
NET REALIZED AND UNREALIZED GAIN (LOSS) ON INVESTMENTS | | | | | | | | |
| | |
Realized gain (loss) on: | | | | | | | | |
Investments | | $ | 426,238,362 | | | $ | (6,615,633 | ) |
Futures | | | — | | | | 4,600,347 | |
Swap contracts | | | — | | | | 936,760 | |
Foreign currency transactions | | | (1,008 | ) | | | — | |
| | |
Increase (decrease) in unrealized appreciation/depreciation on: | | | | | | | | |
Investments | | | (614,428,846 | ) | | | (63,281,692 | ) |
Futures | | | — | | | | 1,370,311 | |
Swap contracts | | | — | | | | 469,069 | |
Foreign currency translations | | | (2,754 | ) | | | — | |
Net realized and unrealized gain (loss) on investments | | | (188,194,246 | ) | | | (62,520,838 | ) |
Net increase (decrease) in net assets resulting from operations | | $ | (102,430,307 | ) | | $ | 8,736,974 | |
The accompanying Notes are an integral part of these financial statements.
30
| | | | | | | | | | | | | | | | |
Statements of Changes in Net Assets For the year ended December 31, 2015 and 2014 | | GE RSP U.S. EQUITY FUND | | | GE RSP INCOME FUND | |
| | | | |
| | | 2015 | | | 2014 | | | 2015 | | | 2014 | |
INCREASE (DECREASE) IN NET ASSETS | | | | | | | | | | | | | | | | |
Operations: | | | | | | | | | | | | | | | | |
Net investment income | | $ | 85,763,939 | | | $ | 82,833,080 | | | $ | 71,257,812 | | | $ | 70,023,260 | |
Net realized gain (loss) on investments, futures and foreign currency related transactions | | | 426,237,354 | | | | 603,553,092 | | | | (1,078,526 | ) | | | 11,077,197 | |
Net increase (decrease) in unrealized appreciation/depreciation on investments, futures, swap contracts and foreign currency translations | | | (614,431,600 | ) | | | (32,752,260 | ) | | | (61,442,312 | ) | | | 67,574,238 | |
Net increase (decrease) from operations | | | (102,430,307 | ) | | | 653,633,912 | | | | 8,736,974 | | | | 148,674,695 | |
Distributions to shareholders from: | | | | | | | | | | | | | | | | |
Net investment income | | | (85,737,412 | ) | | | (81,448,877 | ) | | | (72,255,472 | ) | | | (70,314,635 | ) |
Net realized gains | | | (446,832,286 | ) | | | (605,267,559 | ) | | | (5,182,882 | ) | | | (721,874 | ) |
Total distributions | | | (532,569,698 | ) | | | (686,716,436 | ) | | | (77,438,354 | ) | | | (71,036,509 | ) |
Increase (decrease) in assets from operations and distributions | | | (635,000,005 | ) | | | (33,082,524 | ) | | | (68,701,380 | ) | | | 77,638,186 | |
Share transactions: | | | | | | | | | | | | | | | | |
Proceeds from sale of shares | | | 64,586,809 | | | | 87,919,353 | | | | 53,064,170 | | | | 57,162,322 | |
Value of distributions reinvested | | | 504,347,323 | | | | 650,505,937 | | | | 74,699,779 | | | | 68,458,328 | |
Cost of shares redeemed | | | (437,541,290 | ) | | | (316,758,887 | ) | | | (200,479,813 | ) | | | (191,232,569 | ) |
Net increase (decrease) from share transactions | | | 131,392,842 | | | | 421,666,403 | | | | (72,715,864 | ) | | | (65,611,919 | ) |
Total increase (decrease) in net assets | | | (503,607,163 | ) | | | 388,583,879 | | | | (141,417,244 | ) | | | 12,026,267 | |
| | | | |
NET ASSETS | | | | | | | | | | | | | | | | |
Beginning of year | | | 5,445,144,442 | | | | 5,056,560,563 | | | | 2,613,303,178 | | | | 2,601,276,911 | |
End of year | | $ | 4,941,537,279 | | | $ | 5,445,144,442 | | | $ | 2,471,885,934 | | | $ | 2,613,303,178 | |
Undistributed (distributions in excess of) net investment income, end of year | | $ | — | | | $ | — | | | $ | 1,073,219 | | | $ | 872,125 | |
| | | | | | | | | | | | | | | | |
CHANGES IN FUND SHARES | | | | | | | | | | | | |
| | | | |
Shares sold | | | 1,186,324 | | | | 1,522,146 | | | | 4,565,895 | | | | 4,932,812 | |
Shares issued for distributions reinvested | | | 10,435,597 | | | | 11,879,219 | | | | 6,446,701 | | | | 5,902,968 | |
Shares redeemed | | | (8,050,094 | ) | | | (5,525,831 | ) | | | (17,284,644 | ) | | | (16,542,710 | ) |
Net increase (decrease) in fund shares | | | 3,571,827 | | | | 7,875,534 | | | | (6,272,048 | ) | | | (5,706,930 | ) |
The accompanying Notes are an integral part of these financial statements.
31
December 31, 2015

| 1. | Organization of the Funds |
The GE RSP U.S. Equity Fund and GE RSP Income Fund (each a “Fund” collectively, the “Funds”) are registered under the Investment Company Act of 1940, as amended (the “1940 Act”), as open-end management investment companies. The Funds are two of the investment options offered under the GE Retirement Savings Plan (the “RSP” or the “Plan”). The Plan, through a trust, owns 71% of the GE RSP U.S. Equity Fund and 75% of the GE RSP Income Fund. The Funds operate as Employees’ Securities Companies (as defined in the 1940 Act) and as such are exempt from certain provisions of the 1940 Act. Each Fund is an investment company and accordingly follows the investment company accounting and reporting guidance of the Financial Accounting Standards Board (“FASB”) Accounting Standard Codification (“ASC”) Topic 946 Financial Services — Investment Companies.
GE Asset Management Incorporated (“GEAM”) is the Funds’ investment adviser and a wholly-owned subsidiary of General Electric Company.
| 2. | Summary of Significant Accounting Policies |
The preparation of financial statements in conformity with U.S. generally accepted accounting principles (“GAAP”) requires management to make estimates and assumptions that affect the reported amounts of assets and liabilities and disclosure of contingent assets and liabilities at the date of the financial statements and the reported amounts of increases and decreases in net assets from operations during the reporting period. Actual results may differ from those estimates.
Subsequent events after the balance sheet date through the date the financial statements were issued have been evaluated in the preparation of the financial statements. There are no items to report.
The following summarizes the significant accounting policies of the Funds:
Securities Valuation and Transactions All investments in securities are recorded at their estimated fair value, as described in Note 3.
Securities transactions are accounted for as of the trade date. Realized gains and losses on investments sold are recorded on the basis of identified cost for both financial statement and federal tax purposes.
Foreign Currency Accounting records of the Funds are maintained in U.S. dollars. Investment securities and other assets and liabilities denominated in a foreign currency are translated to U.S. dollars at the prevailing rates of exchange at period end. Purchases and sales of securities, income receipts and expense payments denominated in foreign currencies are translated into U.S. dollars at the prevailing exchange rate on the respective dates of such transactions.
All assets and liabilities of the Funds initially expressed in foreign currency values will be converted into U.S. dollars at the WM/Reuters exchange rate computed at 11:00 a.m., Eastern time.
The Funds do not isolate the portion of the results of operations resulting from changes in foreign exchange rates from the fluctuations arising from changes in the market prices of securities during the year. Such fluctuations are included in the net realized or unrealized gain or loss from investments. Net realized gains or losses on foreign currency transactions represent net gains or losses on sales and maturities of foreign currency contracts, disposition of foreign currencies, the difference between the amount of net investment income and withholding taxes accrued and the U.S. dollar amount actually received or paid, and gains or losses between the trade and settlement date on purchases and sales of foreign securities. Net unrealized foreign exchange gains and losses arising from changes in the value of other assets and liabilities (including foreign currencies and open foreign currency contracts) as a result of changes in foreign exchange rates are included as increases or decreases in unrealized appreciation/depreciation on foreign currency related transactions.
Derivatives The Funds are subject to equity price risk, interest rate risk, credit risk and foreign currency exchange rate risk in the normal course of pursuing their investment objectives.
Futures Contracts A futures contract is an agreement to buy or sell a specific amount of a commodity, financial instrument, currency or index at a particular price and future date. Certain Funds may invest in interest rate, financial and stock or bond index futures contracts subject to certain limitations. During the year ended December 31, 2015, the GE RSP Income Fund invested in futures contracts on bonds and notes to manage duration of fixed income securities. Buying futures tends
32
December 31, 2015
to increase a Fund’s exposure to the underlying instrument while selling futures tends to decrease a Fund’s exposure to the underlying instrument, or hedge other Fund investments. With futures contracts, there is minimal counterparty credit risk to a Fund since futures contracts are exchange traded and the exchange’s clearinghouse, as counterparty to all traded futures, guarantees the futures against default. A Fund’s risks in using these contracts include changes in the value of the underlying instruments, non-performance of the counterparties under the contracts’ terms and changes in the liquidity of the secondary market for the contracts. Futures contracts are valued at the settlement price established each day by the board of trade or exchange on which they principally trade.
Upon entering into a financial futures contract, a Fund is required to pledge to the broker an amount of cash and/or other assets equal to a certain percentage of the contract amount, known as initial margin deposit. Subsequent payments, known as variation margin, are made or received by a Fund each day, depending on the daily fluctuation in the fair value of the underlying security. A Fund records an unrealized gain or loss equal to the daily variation margin. Should market conditions move unexpectedly, a Fund may not achieve the anticipated benefits of the futures contracts and may incur a loss. A Fund recognizes a realized gain or loss on the expiration or closing of a futures contract.
Credit Default Swaps During the year ended December 31, 2015, the RSP Income Fund engaged in credit default swaps to manage credit risk. When a Fund is the buyer in a credit default swap contract, a Fund is entitled to receive the par (or other agreed upon) value (full notional value) of a referenced debt obligation (or basket of debt obligations) from the counterparty (or central clearing party (“CCP”) in the case of a centrally cleared swap) to the contract if a credit event by a third party, such as a U.S. or foreign corporate issuer or sovereign issuer, on the debt obligation occurs. In return, a Fund pays the counterparty a periodic stream of payments over the term of the contract provided that no credit event has occurred. If no credit event occurs, a Fund loses its investment and recovers nothing. However, if a credit event occurs, a Fund receives full notional value for a referenced debt obligation that may have little or no value. When a Fund is the seller of a credit default swap, it receives a fixed rate of income throughout the term of
the contract, provided there is no credit event. If a credit event occurs, a Fund is obligated to pay the notional amount of the swap and in certain instances take delivery of securities of the reference entity upon the occurence of a credit event, as defined under the terms of that particular swap agreement. Credit events are contract specific but may include bankruptcy, failure to pay, restructuring, obligation acceleration and repudiation/moratorium. If a Fund is a seller of protection and a credit event occurs, the maximum potential amount of future payments that a Fund could be required to make would be an amount equal to the notional amount of the agreement. This potential amount would be partially offset by any recovery value of the respective referenced obligation, or net amount received from the settlement of a buy protection credit default swap agreement entered into by a Fund for the same referenced obligation. As the seller, a Fund may create economic leverage to its portfolio because, in addition to its total net assets, a Fund is subject to investment exposure on the notional amount of the swap. The interest fee paid or received on the swap, which is based on a specified interest rate on a fixed notional amount, is accrued daily as a component of unrealized appreciation (depreciation) and is recorded as realized gain upon receipt or realized loss upon payment. A Fund also records an increase or decrease to unrealized appreciation (depreciation) in an amount equal to the daily valuation. For centrally cleared swaps, the daily change in valuation is recorded as a receivable or payable for variation margin and settled in cash with the CCP daily. All upfront payments, if any, are amortized over the life of the swap as realized gains or losses. Those upfront payments that are paid or received, typically for non-centrally cleared swaps, are recorded as other assets or other liabilities, respectively, net of amortization. For financial reporting purposes, unamortized upfront payments, if any, are netted with unrealized appreciation or depreciation on swaps to determine the market value of swaps. A Fund segregates assets in the form of cash or liquid securities in an amount equal to the notional amount of the credit default swaps of which it is the seller. A Fund segregates assets in the form of cash or liquid securities in an amount equal to any unrealized depreciation of the credit default swaps of which it is the buyer, marked to market on a daily basis. Credit default swaps involve greater risks than if a Fund had invested in the referenced debt obligation directly. If a Fund is a buyer of a credit default swap and no credit event occurs, the Fund will not earn any return on
33
December 31, 2015
its investment. If a Fund is a seller of a credit default swap, a Fund’s risk of loss may be the entire notional amount of the swap. Swaps may also subject a Fund to the risk that the counterparty to the transaction may not fulfill its obligation. In the case of centrally cleared swaps, counterparty risk is minimal due to protections provided by the CCP.
When-Issued Securities and Forward Commitments The GE RSP Income Fund may purchase or sell securities on a when-issued or forward commitment basis. These transactions are arrangements in which the Fund purchases and sells securities with payment and delivery scheduled a month or more after entering into the transaction. The price of the underlying securities and the date when these securities will be delivered and paid for are fixed at the time the transaction is negotiated. Losses may arise due to changes in the market value of the underlying securities or if the counterparty does not perform under the commitments. In connection with such purchases, the Fund maintains cash or liquid assets in an amount equal to the purchase commitments for such underlying securities until settlement date and for sales commitments the Fund maintains equivalent deliverable securities as “cover” for the transaction. Unsettled commitments are valued at the current market value of the underlying security. Daily fluctuations in the value of such commitments are recorded as unrealized gains or losses. The Fund will not enter into such commitments for the purpose of investment leverage.
Investments in Foreign Markets Investments in foreign markets involve special risks and considerations not typically associated with investing in the United States. These risks include revaluation of currencies, high rates of inflation, restrictions on repatriation of income and capital, and adverse political and economic developments. Moreover, securities issued in these markets may be less liquid, subject to government ownership controls, tariffs and taxes, subject to delays in settlements, and their prices may be more volatile.
A Fund may be subject to capital gains and repatriation taxes imposed by certain countries in which it invests. Such taxes are generally based upon income and/or capital gains earned or repatriated. Taxes are accrued based on net investment income, net realized gains and net unrealized appreciation as income and/or capital gains are earned.
Investment Income Corporate actions (including cash dividends) are recorded on the ex-dividend date, net of applicable withholding taxes, except for certain foreign corporate actions which are recorded as soon after the ex-dividend date as such information becomes available. Withholding taxes on foreign dividends, if any, have been provided for in accordance with a Fund’s understanding of the applicable country’s tax rules and rates.
Interest income is recorded on the accrual basis. Accretion of discounts and amortization of premiums on taxable bonds are to the call or maturity date, whichever is shorter, using the effective yield method.
Expenses Fund specific expenses are charged to the Fund that incurs such expenses. Such expenses may include custodial fees, legal and accounting fees, printing costs and registration fees. Expenses that are not fund specific are allocated pro rata across the Funds. Expenses of the Fund are generally paid directly by the Fund; however, expenses may be paid by GEAM and reimbursed by the Fund.
Federal Income Taxes The Funds intend to comply with all sections of the Internal Revenue Code of 1986, as amended (the “Internal Revenue Code”) applicable to regulated investment companies, including the distribution of substantially all of their taxable net investment income, tax-exempt income and net realized capital gains to their shareholders. Therefore, no provision for federal income tax has been made. Each Fund is treated as a separate taxpayer for federal income tax purposes.
| 3. | Security Valuation and Transactions |
The Funds utilize various methods to measure the fair value of most of their investments on a recurring basis. GAAP establishes a framework for measuring fair value and providing related disclosures. Broadly, the framework requires fair value to be determined based on the exchange price that would be received for an asset or paid to transfer a liability (an exit price) in the principal or most advantageous market for the asset or liability in an orderly transaction between market participants at the measurement date. In the absence of active markets for the identical assets or liabilities, such measurements involve developing assumptions based on market observable data and, in the absence of such data, internal information that is consistent with what market participants would use in a hypothetical transaction that
34
December 31, 2015
occurs at the measurement date. It also establishes a three-level valuation hierarchy based upon observable and non-observable inputs.
Observable inputs reflect market data obtained from independent sources, while unobservable inputs reflect our market assumptions. Preference is given to observable inputs. These two types of inputs create the following fair value hierarchy:
Level 1 – Quoted prices for identical investments in active markets.
Level 2 – Quoted prices for similar investments in active markets; quoted prices for identical or similar investments in markets that are not active; and model-derived valuations whose inputs are observable or whose significant value drivers are observable.
Level 3 – Significant inputs to the valuation model are unobservable.
Policies and procedures are maintained to value investments using the best and most relevant data available. In addition, pricing vendors are utilized to assist in valuing investments. GEAM performs periodic reviews of the methodologies used by independent pricing services including price validation of individual securities.
Fair Value Measurement The following section describes the valuation methodologies the Funds use to measure different financial investments at fair value.
A Fund’s portfolio securities are valued generally on the basis of market quotations. Equity securities generally are valued at the last reported sale price on the primary market in which they are traded. Portfolio securities listed on NASDAQ are valued using the NASDAQ Official Closing Price. Level 1 securities primarily include publicly-traded equity securities, which may not necessarily represent the last sales price. If no sales occurred on the exchange or NASDAQ that day, the portfolio security generally is valued using the last reported bid price. In those circumstances the Fund typically classifies the investment securities in Level 2.
Debt securities (other than short-term securities described below) generally are valued at an evaluated bid price as reported by independent pricing services. The pricing services use various pricing models for each asset class. The inputs and assumptions to the model of the pricing services are derived from market observable sources, which may include: benchmark yields, reported
trades, broker/dealer quotes, issuer spreads, benchmark securities, bids, offers and other market related data. Since many fixed income securities do not trade on a daily basis, the methodology of the pricing service may also use other available information such as benchmark curves, benchmarking of similar securities, sector groupings and matrix pricing. Thus, certain securities may not be priced using quoted prices, but rather determined from market observable information. These investments are included in Level 2 and are primarily comprised of corporate fixed income, government, mortgage and asset-backed securities. In the absence of a reliable bid price from such a pricing service, debt securities may be valued based on broker or dealer supplied valuations or quotations. In these infrequent circumstances, pricing services may provide the Funds with valuations that are based on significant unobservable inputs, and in those circumstances the investment securities are classified as Level 3.
A Fund may use non-binding broker or dealer quotes for valuation when there is limited or no relevant market activity for a specific investment or for other investments that share similar characteristics and a price is not provided by a pricing service or is deemed not to be reliable. The Funds have not adjusted the prices obtained. Investment securities priced using non-binding broker or dealer quotes are included in Level 3.
Short-term securities of sufficient credit quality with remaining maturities of sixty days or less at the time of purchase are typically valued on the basis of amortized cost which approximates fair value and these are included in Level 2. If it is determined that amortized cost does not approximate fair value, securities may be valued based on dealer supplied valuations or quotations. In these infrequent circumstances, pricing services may provide the Fund with valuations that are based on significant unobservable inputs, and in those circumstances the investment securities are classified in Level 3.
Investments in registered investment companies are valued at the published daily net asset value (“NAV”) and classified in Level 1.
If prices are not readily available for a portfolio security, or if it is believed that a price for a portfolio security does not represent its fair value, the security may be valued using procedures approved by the Funds’ Board of Trustees that are designed to establish its “fair” value. These securities are typically classified in Level 3. Those
35
December 31, 2015
procedures require that the fair value of a security be established by a valuation committee of GEAM. The valuation committee follows different protocols for different types of investments and circumstances. The fair value procedures may be used to value any investment of any Fund in the appropriate circumstances.
Fair value determinations generally are used for securities whose value is affected by a significant event that will materially affect the value of a security and which occurs subsequent to the time of the close of the principal market on which such security trades but prior to the calculation of a Fund’s NAV.
The value established for such a portfolio security valued other than by use of a market quotation (as described above) may be different than what would be produced through the use of market quotations or another methodology. Portfolio securities that are valued using techniques other than market quotations, including “fair valued” securities, may be subject to greater fluctuation in their value from one day to the next than would be the case if market quotations were used. In addition, there is
no assurance that a Fund could sell a portfolio security for the value established for it at any time and it is possible that a Fund would incur a loss because a portfolio security is sold at a discount to its established value.
Other financial investments are derivative instruments that are not reflected in total investments, such as futures, forwards, swaps, and written options contracts, which are valued based on fair value as discussed above.
The Funds use closing prices for derivatives included in Level 1, which are traded either on exchanges or liquid over-the-counter markets. Derivative assets and liabilities included in Level 2 primarily represent interest rate swaps, cross-currency swaps and foreign currency and commodity forward and option contracts. Derivative assets and liabilities included in Level 3 primarily represent interest rate products that contain embedded optionality or prepayment features.
The inputs or methodology used for valuing securities are not an indication of the risk associated with investing in those securities.
The following tables present each Fund’s investments measured at fair value on a recurring basis at December 31, 2015:
| | | | | | | | | | | | | | | | | | |
| Fund | | Investments | | Level 1 | | | Level 2 | | | Level 3 | | | Total | |
| | | | | |
| GE RSP U.S. Equity Fund | | Investments in Securities† | | | | | | | | | | | | | | | | |
| | Common Stock | | $ | 4,762,920,763 | | | $ | — | | | $ | — | | | $ | 4,762,920,763 | |
| | Short-Term Investments | | | — | | | | 172,132,649 | | | | — | | | | 172,132,649 | |
| | | | | | | | | | | | | | | | | | |
| | Total Investments in Securities | | $ | 4,762,920,763 | | | $ | 172,132,649 | | | $ | — | | | $ | 4,935,053,412 | |
| | | | | | | | | | | | | | | | | | |
| | | | | |
| | | | | | | | | | | | | | | | | | | |
| | | | | |
| GE RSP Income Fund | | Investments in Securities† | | | | | | | | | | | | | | | | |
| | U.S. Treasuries | | $ | — | | | $ | 463,751,630 | | | $ | — | | | $ | 463,751,630 | |
| | Agency Mortgage Backed | | | — | | | | 591,139,505 | | | | — | | | | 591,139,505 | |
| | Agency Collateralized Mortgage Obligations | | | — | | | | 6,073,946 | | | | — | | | | 6,073,946 | |
| | Asset Backed | | | — | | | | 2,263,487 | | | | — | | | | 2,263,487 | |
| | Corporate Notes | | | — | | | | 1,076,008,155 | | | | — | | | | 1,076,008,155 | |
| | Non-Agency Collateralized Mortgage Obligations | | | — | | | | 264,602,332 | | | | — | | | | 264,602,332 | |
| | Sovereign Bonds | | | — | | | | 24,685,954 | | | | — | | | | 24,685,954 | |
| | Municipal Bonds and Notes | | | — | | | | 15,415,389 | | | | — | | | | 15,415,389 | |
| | FNMA (TBA) | | | — | | | | — | | | | 67,662 | | | | 67,662 | |
| | Preferred Stock | | | 2,710,943 | | | | — | | | | — | | | | 2,710,943 | |
| | Short-Term Investments | | | — | | | | 115,719,602 | | | | — | | | | 115,719,602 | |
| | | | | | | | | | | | | | | | | | |
| | Total Investments in Securities | | $ | 2,710,943 | | | $ | 2,559,660,000 | | | $ | 67,662 | | | $ | 2,562,438,605 | |
| | | | | | | | | | | | | | | | | | |
36
December 31, 2015
| | | | | | | | | | | | | | | | | | |
| Fund | | Investments | | Level 1 | | | Level 2 | | | Level 3 | | | Total | |
| | | | | |
| | Other Financial Instruments* | | | | | | | | | | | | | | | | |
| | Credit Default Swap Contracts — Unrealized Appreciation | | $ | — | | | $ | 469,069 | | | $ | — | | | $ | 469,069 | |
| | Long Futures Contracts — Unrealized Depreciation | | | (553,697 | ) | | | — | | | | — | | | | (553,697 | ) |
| | Short Futures Contracts — Unrealized Appreciation | | | 1,726,113 | | | | — | | | | — | | | | 1,726,113 | |
| | | | | | | | | | | | | | | | | | |
| | Total Other Financial Instruments | | $ | 1,172,416 | | | $ | 469,069 | | | $ | — | | | $ | 1,641,485 | |
| | | | | | | | | | | | | | | | | | |
| | | | | |
| | | | | | | | | | | | | | | | | | | |
| † | See Schedules of Investments for Industry Classification. |
| * | Other financial instruments include derivative instruments such as futures contracts and credit default swaps. Amounts shown represent unrealized appreciation (depreciation), at period end. |
There were no transfers between fair value levels during the period. Transfers between fair value levels are considered to occur at the beginning of the period.
Level 3 investments at the beginning and/or end of the period in relation to net assets were not significant and, accordingly, a reconciliation of Level 3 assets for the year ended December 31, 2015 is not presented.
| 4. | Derivatives Transactions |
Shown below are the derivative contracts entered into by the GE RSP Income Fund, summarized by primary risk exposure as they appear on the Statement of Assets and Liabilities, none of which are accounted for as hedging instruments under FASB (“ASC”) No. 815 Derivatives and Hedging (“ASC 815”) as of December 31, 2015.
| | | | | | | | | | | | |
| | | Asset Derivatives December 31, 2015 | | | Liability Derivatives December 31, 2015 | |
Derivatives not accounted for as hedging instruments under ASC 815 | | Location in the Statements of Assets and Liabilities | | Fair
Value ($) | | | Location in the Statements of Assets and Liabilities | | Fair
Value ($) | |
| GE RSP Income Fund | |
Interest Rate Contracts | | Assets, Net Assets — Net Unrealized Appreciation/(Depreciation) on Futures | | | 1,726,113 | * | | Liabilities, Net Assets — Net Unrealized Appreciation/(Depreciation) on Futures | | | (553,697 | )* |
Credit Risk Contracts | | Assets, Net Assets — Net Unrealized Appreciation/(Depreciation) on Swap Contracts | | | 469,069 | * | | Liabilities, Net Assets — Net Unrealized Appreciation/(Depreciation) on Swap Contracts | | | — | |
| * | Includes cumulative unrealized appreciation/(depreciation) of futures and credit default swap contracts as reported in the Schedule of Investments and within the components of the net assets section of the Statement of Assets and Liabilities. Only the current day’s variation margin is reported within the Assets and/or Liabilities section on the Statement of Assets and Liabilities. |
Shown below are the effects of derivative instruments on the Fund’s Statement of Operations, summarized by primary risk exposure, none of which are accounted for as hedging instruments under ASC 815.
| | | | | | | | | | | | |
Derivatives not accounted
for as hedging instruments
under ASC 815 | | Location in the
Statements of Operations | | Total
Notional Amount of
Futures Contracts
Purchased/(Sold) ($) | | Realized Gain (Loss) on
Derivatives Recognized
in Income($) | | | Change in Unrealized
Appreciation (Depreciation)
on Derivatives
Recognized in Income($) | |
| GE RSP Income Fund | |
Interest Rate Contracts | | Realized gain/(loss) on Futures, Increase/(decrease) in unrealized appreciation/ (depreciation) on Futures | | 9,061,635,008/
(9,124,446,963) | | | 4,600,347 | | | | 1,370,311 | |
Credit Risk Contracts | | Realized gain/(loss) on Swap Contracts Increase/ (decrease) in unrealized appreciation/(depreciation) on Swap Contracts | | —/— | | | 936,760 | | | | 469,069 | |
37
December 31, 2015
During the year ended December 31, 2015, the GE RSP Income Fund had an average notional value of $145,188,959 and $263,264,420 on long and short futures contracts, respectively, and $64,542,730 on credit default swaps. Please refer to the table following the Schedule of Investments for open credit default swaps and futures contracts at December 31, 2015.
The Funds share a revolving credit facility of up to $150 million with a number of their affiliates. The credit facility is with the Funds’ custodian bank, State Street Bank and Trust Company (“State Street”). The revolving credit facility requires the payment of a commitment fee equal to 0.20% (0.125% prior to October 28, 2015) per annum on the daily unused portion of the credit facility, payable quarterly. The portion borne by each Fund generally is borne proportionally based upon net assets. In addition, the Funds had a $100 million uncommitted, unsecured line of credit with State Street, which expired effective October 28, 2015. Generally, borrowings under the credit facilities would accrue interest at the higher of the 1-Month LIBOR plus 1.25% and the Overnight Federal Funds Rate plus 1.25% and would be borne by the borrowing Fund. The
maximum amount allowed to be borrowed by any one Fund is the lesser (i) of its prospectus limitation, (ii) 20% of its net assets, or (iii) $150 million. The credit facilities were not utilized by the Funds during the year ended December 31, 2015.
| 6. | Compensation and Fees Paid to Affiliates |
Advisory and Administration Expenses
During 2015, the Funds incurred expenses for the cost of services rendered by GEAM as investment adviser and for services GEAM rendered as shareholder servicing agent. These expenses are included as advisory and administration expenses and shareholder servicing agent expense in the Statements of Operations. The Trustees received no compensation as Trustees for the Funds.
| 7. | Investment Transactions |
Purchases and Sales of Securities
The cost of purchases and the proceeds from sales of investments, other than short-term securities, for the year ended December 31, 2015, were as follows:
| | | | | | | | | | | | | | | | |
| | | U.S. Government Securities | | | Other Securities | |
| Fund | | Purchases | | | Sales | | | Purchases | | | Sales | |
GE RSP U.S. Equity Fund | | $ | — | | | $ | — | | | $ | 1,929,810,356 | | | $ | 2,288,182,953 | |
GE RSP Income Fund | | | 5,900,950,340 | | | | 6,149,615,204 | | | | 949,567,089 | | | | 766,897,487 | |
The Funds are subject to ASC 740, Income Taxes (“ASC 740”). ASC 740 provides guidance for financial accounting and reporting for the effects of income taxes that result from an entity’s activities during the year. ASC 740 also provides guidance regarding how uncertain tax positions should be recognized, measured, presented and disclosed in the financial statements. ASC 740 requires
evaluation of tax positions taken or expected to be taken in the course of preparing each Fund’s tax returns to determine whether the tax positions are “more likely than not” of being sustained by the applicable tax authority. There are no adjustments to any Fund’s net assets required under ASC 740. Each Fund’s 2012, 2013, 2014 and 2015 fiscal year tax returns are still open to examination by the Federal and applicable state tax authorities.
38
December 31, 2015
At December 31, 2015, information on the tax cost of investments and distributable earnings on a tax basis was as follows:
| | | | | | | | | | | | | | | | | | | | | | | | | | | | | | | | |
Fund | | Cost of
Investment
for Tax
Purposes | | | Gross Tax | | | Net Tax Appreciation/
(Depreciation) | | | Undistributed | |
| | | Appreciation | | | Depreciation | | | Investments | | | Derivatives/
Currency | | | Income | | | Accum.
Capital
Gain/(Loss) | | | Late-Year
Losses | |
GE RSP U.S. Equity Fund | | $ | 4,321,478,808 | | | $ | 802,104,565 | | | $ | (188,529,961 | ) | | $ | 613,574,604 | | | $ | (2,754 | ) | | $ | — | | | $ | 2,093,659 | | | $ | — | |
GE RSP Income Fund | | | 2,593,496,455 | | | | 22,607,692 | | | | (53,665,542 | ) | | | (31,057,850 | ) | | | 1,641,485 | | | | 1,073,219 | | | | — | | | | (3,730,151 | ) |
As of December 31, 2015, the Funds had no capital loss carryovers. Capital loss carryovers are available to offset future realized capital gains to the extent provided in the Internal Revenue Code and regulations thereunder. To the extent that these carryover losses are used to offset future capital gains, it is probable that gains offset will not be distributed to shareholders because they would be taxable as ordinary income.
Any qualified late-year loss is deemed to arise on the first day of a Fund’s next tax year (if the Fund elects to defer such loss). Under this regime, generally, a Fund can elect to defer any post-October capital loss and/or any late-year ordinary loss as defined by the Internal Revenue Code.
The following Funds elected to defer qualified late-year losses for the year ended December 31, 2015 as follows:
| | | | | | | | |
| Fund | | Capital | | | Ordinary | |
GE RSP Income Fund | | $ | (3,730,151 | ) | | $ | — | |
Distributions to Shareholders
GE RSP Income Fund declares investment income dividends daily and pays them monthly. The GE RSP U.S. Equity Fund declares and pays dividends from investment income annually. The Funds declare and pay net realized capital gains in excess of capital loss carryforwards distributions annually. The character of income and gains to be distributed is determined in accordance with income tax regulations which may differ from GAAP. These differences include (but are not limited to) treatment of investments in futures, distribution re-designations, distributions from Real Estate Investment Trusts (REITs) and other equity investments, investments in swap contracts, foreign currency gain (loss), mixed straddles and losses due to wash sale transactions.
The tax character of distributions paid during the years ended December 31, 2015 and December 31, 2014 was as follows:
| | | | | | | | | | | | | | | | |
| | | December 31, 2015 | | | December 31, 2014 | |
| Fund | | Ordinary
Income | | | Long Term
Capital Gains | | | Ordinary
Income | | | Long Term
Capital Gains | |
GE RSP U.S. Equity Fund | | $ | 85,602,426 | | | $ | 446,967,272 | | | $ | 88,818,648 | | | $ | 597,897,788 | |
GE RSP Income Fund | | | 77,438,354 | | | | — | | | | 71,036,509 | | | | — | |
Reclassifications are made to a Fund’s capital accounts to reflect income and gains available for distribution (or available capital loss carryovers) under income tax regulations. These reclassifications have no impact on net investment income, realized gains or losses, or the NAV of either Fund. The calculation of net investment income per share in the Financial Highlights table excludes these adjustments.
The reclassifications for the year ended December 31, 2015 were as follows:
| | | | | | | | | | | | |
| Fund | | Undistributed
Net Investment
Income | | | Accumulated
Net Realized
Gain (Loss) | | | Paid In
Capital | |
GE RSP U.S. Equity Fund | | $ | (26,527 | ) | | $ | 26,527 | | | $ | — | |
GE RSP Income Fund | | | 1,198,754 | | | | (1,198,754 | ) | | | — | |
39


The Unitholders and Board of Trustees
GE RSP Funds:
We have audited the accompanying statement of assets and liabilities, including the schedule of investments, of GE RSP U.S. Equity Fund and GE RSP Income Fund, each a series of GE RSP Funds (collectively, the “Funds”), as of December 31, 2015, and the related statement of operations for the year then ended, the statements of changes in net assets for each of the years in the two-year period then ended, and the financial highlights for each of the years in the five-year period then ended. These financial statements and financial highlights are the responsibility of the Funds’ management. Our responsibility is to express an opinion on these financial statements and financial highlights based on our audits.
We conducted our audits in accordance with the auditing standards of the Public Company Accounting Oversight Board (United States). Those standards require that we plan and perform the audit to obtain reasonable assurance about whether the financial statements and financial highlights are free of material misstatement. An audit includes examining, on a test basis, evidence supporting the amounts and disclosures in the financial statements. Our procedures included confirmation of securities owned as of December 31, 2015, by correspondence with the custodian and brokers. An audit also includes assessing the accounting principles used and significant estimates made by management, as well as evaluating the overall financial statement presentation. We believe that our audits provide a reasonable basis for our opinion.
In our opinion, the financial statements and financial highlights referred to above present fairly, in all material respects, the financial position of GE RSP U.S. Equity Fund and GE RSP Income Fund as of December 31, 2015, the results of its operations for the year then ended, the changes in its net assets for each of the years in the two-year period then ended, and the financial highlights for each of the years in the five-year period then ended, in conformity with U.S. generally accepted accounting principles.

Boston, Massachusetts
February 22, 2016
40

Summary
For the fiscal year ended December 31, 2015, certain dividends paid by the fund may be subject to a maximum income tax rate of 20% as provided for by the American Taxpayer Relief Act of 2012. The following represent the amounts that may be considered qualified dividend income:
| | | | | |
| Fund name | | Qualified
Dividend
Income |
GE RSP U.S Equity Fund | | | $ | 92,368,979 | |
For corporate shareholders, of the ordinary dividends paid, the following represent the amounts that may be eligible for the dividends received deduction:
| | | | | |
| Fund name | | Dividends
Received
Deduction |
GE RSP U.S. Equity Fund | | | | 96.32% | |
For the year ended December 31, 2015, the following Funds hereby designate as capital gain dividends the amounts set forth, or the amount ultimately treated as capital gain net income:
| | | | | |
| Fund name | | Long Term
Capital Gain
Distributions |
GE RSP U.S. Equity Fund | | | $ | 446,967,272 | |
The amounts presented herein may differ from amounts presented elsewhere in the financial statements due to differences between tax and financial accounting principles. Please consult a tax advisor if you have any questions about Federal or State income tax laws or on how to prepare your tax returns. If you have specific questions about your Fund account, please consult your investment representative or call 1-800-242-0134.
41

The Board of Trustees of the GE RSP Mutual Funds1 (the “Board”) considered and all those that were present unanimously approved the continuance for an additional year of the investment advisory agreements with GE Asset Management Incorporated (“GEAM”) at a meeting held on December 14, 2015.
In considering whether to approve the Funds’ investment advisory agreements, the Board members considered and discussed a substantial amount of information and analysis provided by GEAM personnel. The Board members also considered detailed information regarding performance and expenses of other investment companies, including those with similar investment strategies and sizes, which was prepared by an independent third party provider, Morningstar, Inc. (“Morningstar”). The Board members reviewed the fees charged by GEAM for other mutual funds and investment products other than mutual funds that employ similar investment strategies as the Funds. The Board had the opportunity to ask questions and request additional information in connection with its considerations.
Before approving each Fund’s investment advisory agreement, the Board members received and considered memoranda prepared by GEAM personnel that set forth detailed information, including numerous exhibits and other materials related to GEAM’s business and the services it provides to each Fund. The Board members also reviewed materials discussing the legal standards for the consideration of the proposed continuances. The Board members reviewed and discussed the proposed continuance of the agreements with GEAM personnel, including representatives from the legal, compliance and finance departments and senior members of each relevant investment group (e.g., equity, fixed income). The Board members also heard presentations by these representatives, and posed questions and engaged in substantive discussions with them concerning the Funds’ operations and the investment process employed for each Fund. The Board members took into account that many of them possess multi-year experience as Board members and that all of them possess a great deal of knowledge about GEAM and the Funds in their capacities as senior officers of GEAM. They also took into account their consideration of these types of agreements in
recent years. The information was presented in a manner to facilitate comparisons to prior periods and to reflect certain enhancements to GEAM’s infrastructure, systems, research and analytics capabilities and shareholder servicing model. To focus their review, the Board members asked GEAM personnel, in its oral presentations, to highlight material differences from the information presented in recent years.
In reaching their determinations relating to the continuance of the Funds’ investment advisory agreements, the Board members considered all factors that they deemed relevant, including the factors discussed below. In their deliberations, the Board members did not identify any particular information that was all-important or controlling, and each Board member may have attributed different weights to the various factors. The Board members evaluated this information, and all other information available to them, for each Fund separately, and their determinations were made separately in respect of each Fund. In particular, the Board members focused on the following with respect to each Fund:
The Nature, Extent And Quality Of Services Provided
The Board members reviewed the services provided by GEAM and concurred that GEAM provides high quality advisory and administrative services to the Funds. In connection with their consideration of GEAM’s services, the Board members focused on the favorable attributes of GEAM, including (i) an investment philosophy oriented toward long-term performance; (ii) effective processes used for selecting investments and brokers; (iii) effective processes used for providing Fund administration, including controllership and compliance functions, the optimization of its Fund administration platform and the continued oversight of the performance of other companies that provide services to the Funds; (iv) highly skilled professionals, including analysts, research professionals and portfolio managers with a depth of experience relevant to the Funds; (v) access to significant and enhanced technological resources from which the Funds may benefit, including a platform that increases the quality and efficiency of analytics and research; and (vi) a favorable history and reputation. The Board members noted that each Fund represents only a small amount of the overall assets managed by GEAM, but benefits from a full array of services and resources
1 The GE RSP Mutual Funds include the GE RSP Income Fund and GE RSP U.S. Equity Fund (each, a “Fund” and collectively, the “Funds”).
42
provided by GEAM. In particular, the Board members discussed that the Funds benefit from a large staff of research analysts employed by GEAM.
In light of the foregoing, the Board members concluded that the services provided by GEAM continue to be satisfactory.
Investment Performance Of The Funds
The Board members considered the investment performance of the Funds for various periods. The Board members reviewed detailed comparisons of the performance of the Funds with the relevant securities indices and peer and category groupings of mutual funds prepared by Morningstar with respect to various periods. The Board members also engaged in discussions with GEAM personnel regarding the investment process and performance results for each Fund. These discussions focused on each Fund’s investment objective, the number and experience of portfolio management and supporting research personnel, the investment style and approach employed, the likely market cycles for the investment style and, in some instances, relative underperformance of the GE RSP U.S. Equity Fund in certain periods and the competitive performance of the GE RSP Income Fund for the 3 year and 5 year periods. The Board members discussed GEAM’s investment approach with respect to each of the Funds, and the reasons for the GE RSP U.S. Equity Fund’s relative underperformance.
The Board members concluded that the Funds’ performance was acceptable overall, taking into consideration the factors discussed above.
Cost Of The Services Provided To The Funds
The Board members considered the cost of the services provided by GEAM, noting that, pursuant to each investment advisory agreement, GEAM is reimbursed for its reasonable costs incurred in providing the services contemplated by those agreements and is not paid a management fee. The Board also noted that GE Investment Distributors, Inc. (“GEID”), a subsidiary of GEAM, is reimbursed for its reasonable costs incurred in providing services specified in its agreement with the Funds as unitholder servicing agent and is not paid a unitholder servicing fee. The Board members considered that the charges resulting from this arrangement involve all of the expenses incurred by GEAM and GEID with respect to the management and unitholder operations of
the Funds, including, without limitation, indirect allocable overhead costs and the direct and indirect costs of GEAM and GEID personnel providing investment management and other services to the Funds. The Board members noted and discussed the additional services provided by GEAM to the Funds compared to other investment products managed by GEAM and the charges that result from those services. The Board members also noted that none of the charges resulting from the Funds’ arrangements with GEAM and GEID may include any element of profit.
The Board members also noted that the Board had in prior years reviewed with GEAM personnel the underlying assumptions and methods of cost allocation used by GEAM in allocating its costs and those of the other Fund service providers, including GEID, to the Funds, and that such assumptions and methods used in cost allocation had not changed for this year. The Board members also discussed with GEAM personnel that the basis for their belief that the methods of allocation used by GEAM continue to be reasonable for each area of GEAM’s business.
Based on their review, the Board members concluded that they were satisfied that the assumptions and methods used in cost allocation and the level of expenses incurred by the Funds were not unreasonable or excessive.
The Extent To Which Economies Of Scale Would Be Realized For The Benefit Of Fund Shareholders As The Funds Grow
Although the Funds did not experience an increase in assets over the past year, the Board members considered the extent to which economies of scale would be realized for the benefit of Fund investors as the Funds grow. The Board noted that the Funds continue to enjoy fee and expense levels within or below the group of lowest fee and expense funds in their respective peer group comparisons.
The Board members recognized the significant benefits to the Funds resulting from their arrangement with GEAM, which causes them to bear only the reasonable costs incurred by GEAM and GEID, without any element of profit, for the substantial services they provide to the Funds. The Board members also recognized the benefits to the Funds of being able to leverage a favorable cost
43
structure achieved with respect to the Funds’ other operating expenses as a result of GEAM’s large overall base of assets under management and its vendor management practices.
Comparison Of Services To Be Rendered And Costs To Be Incurred
The Board members discussed the services provided to the Funds by GEAM, and the costs incurred by the Funds for those services. The Board members reviewed information concerning the Funds’ expense ratios, and comparative information with respect to peer groupings of mutual funds prepared by Morningstar. They discussed that, in all cases, the Funds enjoy expense levels within or below the group of lowest cost funds in each peer group comparison. In light of this information, the Board members determined that the level of expenses incurred, considered in relation to the services provided to the Funds, supported the Board’s approval of the investment advisory agreements.
Fall-Out Benefits
The Board members considered other actual and potential financial benefits that GEAM may derive from its relationship with the Funds, including, where applicable, soft dollar commission benefits generated through Fund portfolio transactions. The Board members noted, however, that the Funds benefit from the vast array of resources available through GEAM, and that each Fund represents only a small amount of the overall assets managed by GEAM.
Conclusion
No single factor was determinative to the Board’s decision. Based on their discussion and such other matters as were deemed relevant, the Board members concluded that the proposed level of cost reimbursement to GEAM and projected total expense ratios for the Funds are reasonable in relation to the services provided. In view of these facts, the Board members concluded that the renewal of each investment advisory agreement was in the best interests of the Funds.
44

The GE RSP U.S. Equity Fund
Investments by the GE RSP U.S. Equity Fund are subject to the following restrictions:
| a. | Moneys in the GE RSP U.S. Equity Fund will not be used in the underwriting of securities or for the purchase of real estate, interests in real estate, investment trusts, commodities or commodity contracts, or invested in companies for the purpose of exercising control or management, or invested in securities of registered investment companies. |
| b. | Moneys in the GE RSP U.S. Equity Fund will not be lent to others, although they may be applied to the purchase of bonds and debt securities of a type publicly distributed or customarily purchased by institutional investors. |
| c. | The GE RSP U.S. Equity Fund will not acquire any securities if immediately after such acquisition and as a result thereof (i) the GE RSP U.S. Equity Fund would hold more than 10% of the outstanding voting securities of any issuer, (ii) more than 5% of the value of the total assets in the GE RSP U.S. Equity Fund would be represented by the securities of any one issuer (except securities of the U.S. Government and its instrumentalities), (iii) more than 25% of the value of the total assets in the GE RSP U.S. Equity Fund would be invested in any particular industry, or (iv) more than 5% of the value of the total assets in the GE RSP U.S. Equity Fund would be invested in issuers which (including predecessors) have not been in continuous operation for at least three years. |
| d. | The GE RSP U.S. Equity Fund will not invest in securities of GE or its affiliates, or in securities of the investment adviser, and will not during the existence of any underwriting syndicate purchase any securities for which its investment adviser is acting as principal underwriter. |
| e. | The GE RSP U.S. Equity Fund will not purchase from or sell any of its portfolio securities to GE or its affiliates or its investment adviser or any officer or director thereof. This investment restriction is not intended to prohibit the GE RSP U.S. Equity Fund from engaging in such transactions with other investment companies or accounts managed by the investment adviser or the investment adviser’s affiliates when the transactions are entered into in accordance with the Investment Company Act and the rules thereunder. |
| f. | The GE RSP U.S. Equity Fund will not engage in margin transactions or short sales or participate in a joint trading account. |
| g. | The GE RSP U.S. Equity Fund will not invest in puts, calls or similar options. |
| h. | The GE RSP U.S. Equity Fund may borrow money from the GE Savings and Security Trust and secure repayment by pledging assets of the GE RSP U.S. Equity Fund. The GE RSP U.S. Equity Fund may also borrow money as a temporary measure to meet cash or administrative needs. Except with respect to borrowings from the GE Savings and Security Trust, the GE RSP U.S. Equity Fund will not mortgage or pledge any of its assets. |
The GE RSP Income Fund
The GE RSP Income Fund will not:
| a. | purchase securities on margin or sell short or participate in a joint trading account; |
| b. | deal in options to buy or sell securities except to the extent permitted by law; |
| c. | borrow money or property except as a temporary measure to meet the cash or administrative needs of the GE RSP Income Fund. In no event will the amount of such borrowings exceed 10% of such the GE RSP Income Funds’ total assets taken at market value at the time of such borrowing; |
| d. | make cash loans to others except through the purchase of debt securities in accordance with the GE RSP Income Fund’s investment objectives; |
| e. | invest in interests in oil, gas or other mineral lease or production agreements; |
| f. | act as an underwriter of securities for other issuers except that the GE RSP Income Fund may acquire securities under circumstances where if they are later resold it may be deemed to be an underwriter under the Securities Act of 1933, as amended (“Securities Act”); |
| g. | purchase securities for the purpose of exercising control or management; |
| h. | pledge, mortgage or hypothecate any of its assets except, that, to secure borrowings permitted by subparagraph c, it may pledge securities which, together with all such securities previously so pledged, at the time of pledge, do not exceed 10% of the GE RSP Income Fund’s total assets; |
| i. | unless otherwise permitted by law, purchase from or sell directly to any of its officers or Trustees or the officers or directors of its investment adviser, or any other affiliate (as defined in the Investment Company Act) of the GE RSP Income Fund or any affiliate of such affiliate, portfolio securities or other property of the RSP Income Fund; |
| j. | unless otherwise permitted by law, invest in securities of GE or its affiliates, or in securities of an investment adviser of the GE RSP Income Fund and will not during the existence of any underwriting syndicate purchase any securities for which its investment adviser is acting as principal underwriter; |
| k. | purchase any security if as a result of such purchase more than 25% of its total assets would be invested in a particular industry; |
| l. | purchase any security if as a result of such purchase more than 25% of its total assets would be subject to legal or contractual restrictions on resale; or |
| m. | invest in the securities of registered investment companies. |
45

Information about Trustees and Executive Officers:
The business and affairs of the Trust are managed under the direction of the GE RSP Mutual Funds’ Board of Trustees. Information pertaining to the Trustees and officers of the Trust is set forth below.
Interested Trustees and Executive Officers
Dmitri Stockton
Address c/o GEAM 1600 Summer St. Stamford, CT 06905
Age 51
Position(s) Held with Fund Chairman of the Board and President
Term of Office and Length of Time Served Until successor is elected and qualified – 4 years
Principal Occupation(s) During Past 5 Years Director of Synchrony Financial since February 2014; President and Chief Executive Officer of GEAM since May 2011; President and Chief Executive Officer of GE Capital’s Global Banking unit from January 2009 to April 2011; President and CEO of GE Money’s Central and Eastern European Banking Group from January 2005 to December 2008.
Number of Portfolios in Fund Complex Overseen by Trustee 8
Other Directorships Held by Trustee Director of GEAM since May 2011; Member of the Board of the GE Foundation since November 2009; Member of the Executive Advisory Council at North Carolina A&T State University School of Business and Economics since March 2011; Trustee of Elfun Funds and General Electric Pension Trust since May 2011 and Member of the National Board of Directors of A Better Chance since January 2012.
George A. Bicher
Address c/o GEAM 1600 Summer St. Stamford, CT 06905
Age 57
Position(s) Held with Fund Trustee
Term of Office and Length of Time Served Until successor is elected and qualified – 4 years
Principal Occupation(s) During Past 5 Years Chief Investment Officer – Emerging Markets Equities since February 2014; Chief Risk Officer of GEAM from March 2011 to February 2014; Senior Vice President and Portfolio Manager of GEAM from 2009 to 2011; Director of U.S. Equity Research and Portfolio Manager of GEAM from 2006 to 2009; U.S. equity research analyst of GEAM from 2002 to 2006.
Number of Portfolios in Fund Complex Overseen by Trustee 8
Other Directorships Held by Trustee Trustee of Elfun Funds and General Electric Pension Trust and Director of GEAM since March 2011.
JoonWon Choe
Address c/o GEAM 1600 Summer St. Stamford, CT 06905
Age 46
Position(s) Held with Fund Assistant Secretary
Term of Office and Length of Time Served Until successor is elected and qualified – 5 years
Principal Occupation(s) During Past 5 Years Senior Vice President and Deputy General Counsel of GEAM since March 2011;
Vice President and Secretary of GE Institutional Funds and GE Investments Funds, Inc. since September 2010; Vice President and Assistant Secretary of Elfun Funds since September 2010; Senior Vice President and Associate General Counsel of GEAM from June 2010 to March 2011; Vice President and Associate General Counsel of GEAM from November 2005 to June 2010; and Vice President and Secretary of GE Funds from September 2010 to February 2011.
Number of Portfolios in Fund Complex Overseen by Officer N/A
Other Directorships Held by Officer N/A
Paul M. Colonna
Address c/o GEAM, 1600 Summer St. Stamford, CT 06905
Age 47
Position Held with Fund Trustee
Term of Office and Length of Time Served Until successor is elected and qualified – 8 years
Principal Occupation(s) During Past 5 Years President and Chief Investment Officer – Public Investments of GEAM since March 2012; President and Chief Investment Officer – Fixed Income Investments of GEAM from March 2007 to March 2012; Executive Vice President of GEAM from February 2007 to March 2007; Senior Vice President – Total Return Management of GEAM from March 2005 to March 2007.
Number of Portfolios in Fund Complex Overseen by Trustee 8
Other Directorships Held by Trustee Trustee of Elfun Funds and General Electric Pension Trust since February 2007; Director of GEAM since March 2007 and Director of GE Asset Management Limited since December 2007.
Gregory B. Hartch
Address c/o GEAM 1600 Summer St. Stamford, CT 06905
Age 46
Position(s) Held with Fund Trustee
Term of Office and Length of Time Served Until successor is elected and qualified – 4 years
Principal Occupation(s) During Past 5 Years Chief Risk Officer of GEAM since February 2014; Executive Vice President and Strategy and Business Development Leader of GEAM from December 2011 to February 2014; Senior Vice President– Tactical Asset Allocation from 2010 to December 2011; Managing Director – International Real Estate from 2007 to 2010; and Director of Fixed Income Research from 2004 to 2007.
Number of Portfolios in Fund Complex Overseen by Trustee 8
Other Directorships Held by Trustee Trustee of Elfun Funds and General Electric Pension Trust since January 2012.
Arthur A. Jensen
Address c/o GEAM 1600 Summer St. Stamford, CT 06905
Age 49
Position(s) Held with Fund Treasurer
Term of Office and Length of Time Served Until successor is elected and qualified – 4 years
Principal Occupation(s) During Past 5 Years Treasurer of GE Institutional Funds, GE Investments Funds, Inc., and Elfun Funds since June 2011; Mutual Funds Controller of GEAM since April 2011; Senior Vice President at Citigroup from 2008 to 2010; and Vice President at JPMorgan from 2005 to 2008.
46
Number of Portfolios in Fund Complex Overseen by Officer N/A
Other Directorships Held by Officer N/A
Jeanne M. La Porta
Address c/o GEAM 1600 Summer St. Stamford, CT 06905
Age 50
Position(s) Held with Fund Trustee
Term of Office and Length of Time Served Until successor is elected and qualified – 1 years
Principal Occupation(s) During Past 5 Years Senior Vice President and Commercial Operations Leader at GEAM since March 2014; President of GE Institutional Funds and GE Investments Funds, Inc. since April 2014; President and Trustee of GEAM’s UCITs Funds since March 2014; Senior Vice President and Commercial Administrative Officer at GEAM from April 2010 to March 2014; Vice President of GE Investments Funds, Inc. and GE Institutional Funds since July 2003; Vice President of Elfun Funds and GE Retirement Savings Funds since October 2003; Secretary of GE Funds from July 2007 to September 2010 and Vice President from July 2007 to February 2011; Senior Vice President and Deputy General Counsel of GEAM from October 2007 to April 2010; Vice President and Assistant Secretary of GE Funds from September 2003 to July 2007 and Assistant Secretary of Elfun Funds and GE Retirement Savings Plan Funds from July 2003 to June 2010; and Vice President and Associate General Counsel – Marketing and Client Services (formerly Asset Management Services) of GEAM from May 1997 to October 2007.
Number of Portfolios in Fund Complex Overseen by Trustee 24
Other Directorships Held by Trustee Director of GE Investments Funds, Inc. since 2014; Trustee of GE Institutional Funds since 2014; Trustee of Elfun Funds and General Electric Pension Trust since 2014; Director of GE Investment Distributors, Inc. since June 2011.
Ralph R. Layman
Address c/o GEAM 1600 Summer St. Stamford, CT 06905
Age 60
Position(s) Held with Fund Trustee
Term of Office and Length of Time Served Until successor is elected and qualified –24 years
Principal Occupation(s) During Past 5 Years Executive Vice President and Chief Investment Officer – Emeritus of GEAM since March 2012; President and Chief Investment Officer – Public Equity Investments of GEAM from June 2009 to March 2012; President – International Equities from March 2007 to July 2009; Executive Vice President – International Equity Investments of GEAM from 1992 to March 2007 and Senior Vice President International Investments from 1991 to 1992.
Number of Portfolios in Fund Complex Overseen by Trustee 8
Other Directorships Held by Trustee Trustee of Elfun Funds and General Electric Pension Trust since 1993; Director of GE Asset Management Limited since September 1995 and Director of GEAM since July 2009.
Matthew J. Simpson
Address c/o GEAM 1600 Summer St. Stamford, CT 06905
Age 54
Position(s) Held with Fund Trustee
Term of Office and Length of Time Served 8 years
Principal Occupation(s) During Past 5 Years Executive Vice President, General Counsel and Secretary of GEAM since July 2007; Secretary of Elfun Funds Funds since July 2007; Senior Vice President and General Counsel – Marketing and Client Services (formerly Asset Management Services) of GEAM and Senior Vice President and General Counsel of GE Asset Management Services from February 1997 to July 2007; Vice President and Associate General Counsel of GEAM from October 1992 to February 1997; Secretary of GE Institutional Funds and GE Investments Funds, Inc. from 1997 to July 2007 and Vice President from September 2003 to July 2007; Assistant Secretary of Elfun Funds and GE Retirement Savings Plan Funds from 1998 to July 2007 and Vice President from October 2003 to July 2007; and Secretary of GE Funds from 1993 to July 2007 and Vice President from September 2003 to July 2007.
Number of Portfolios in Fund Complex Overseen by Trustee 24
Other Directorships Held by Trustee Trustee of Elfun Funds and General Electric Pension Trust since July 2007; Trustee of GE Institutional Funds since July 2007: Director of GE Investments Funds, Inc. and GEAM since July 2007; and Trustee of GE Funds from July 2007 to February 2011.
Donald W. Torey
Address c/o GEAM 1600 Summer St. Stamford, CT 06905
Age 58
Position(s) Held with Fund Trustee
Term of Office and Length of Time Served Until successor is elected and qualified – 22 years
Principal Occupation(s) During Past 5 years President and Chief Investment Officer – Alternative Investments of GEAM since March 2007; Executive Vice President from 1997 to March 2007; Executive Vice President – Alternative Investments of GEIC from 1997 to March 2007.
Number of Portfolios in Fund Complex Overseen by Trustee 8
Other Directorships Held by Trustee Trustee of Elfun Funds and General Electric Pension Trust since 1993 and Director of GEAM since 1997.
David Wiederecht
Address c/o GEAM, 1600 Summer St. Stamford, CT 06905
Age 59
Position Held with Fund Trustee
Term of Office and Length of Time Served Until successor is elected and qualified – 7 years
Principal Occupation(s) During Past 5 Years President and Chief Investment Officer – Investment Solutions of GEAM since 2008; Portfolio Manager – GE Institutional Funds since September 2010; Managing Director – Alternative Investments from 2004 to 2008; Vice President – Alternative Investments/Private Equity/Hedge Fund from 1998 to 2004.
Number of Portfolios in Fund Complex Overseen by Trustee 8
Other Directorships Held by Trustee Trustee of Elfun Funds and General Electric Pension Trust since 2008; Director of GEAM since August 2008 and Director of Edmunds Holding Company since 1999.
47
Matthew Zakrzewski
Address c/o GEAM 1600 Summer St. Stamford, CT 06905
Age 55
Position(s) Held with Fund Trustee
Term of Office and Length of Time Served Until successor is elected and qualified – 2 years
Principal Occupation(s) During Past 5 Years Executive Vice President and Chief Financial Officer of GEAM since August 2013; formerly, Chief Financial Officer for GE Ventures from 2012 to 2013 and Chief Financial Officer for GE Risk, Insurance and Corporate Financing from 2006 to 2012.
Number of Portfolios in Fund Complex Overseen by Trustee 8
Other Directorships Held by Trustee Trustee of Elfun Funds and General Electric Pension Trust since September 2013 and Director of GEAM since September 2013.
48

Investment Adviser
GE Asset Management Incorporated
Plan Trustees and Officers of the Investment Adviser
Dmitri Stockton, Trustee, President and Chief Executive Officer, GE Asset Management Incorporated (since May 2011)
George A. Bicher, Trustee, Chief Investment Officer – Emerging Markets Equities
Paul M. Colonna, Trustee, President and Chief Investment Officer – Public Investments
Tim Hanlon, HR Leader
Gregory B. Hartch, Trustee, Chief Risk Officer
Ralph R. Layman, Trustee, Executive Vice President, Chief Investment Officer Emeritus
Jeanne LaPorta, Trustee, Senior Vice President and Commercial Operations Leader
Maureen B. Mitchell, President of Global Sales and Marketing
Susan Lasota, Senior Vice President – Services and Technology
Matthew J. Simpson, Trustee, Executive Vice President, General Counsel and Secretary
Donald W. Torey, Trustee, President and Chief Investment Officer – Alternative Investments
David Wiederecht, Trustee, President and Chief Investment Officer – Investment Solutions
Matthew Zakrzewski, Executive Vice President, Chief Financial Officer
Portfolio Managers
GE RSP U.S. Equity Fund
David B. Carlson
Stephen V. Gelhaus
Paul C. Reinhardt
GE RSP Income Fund
William M. Healey
Mark H. Johnson
Independent Registered Public Accounting Firm
KPMG LLP
Custodian
State Street Bank & Trust Company
Shareholder Servicing Agent
Address all inquiries inside the Plan to:
GE Retirement Savings Plan Service Center
c/o Fidelity Investments
P.O. Box 770003
Cincinnati, OH 45277-0065
Address all inquiries outside the Plan to:
GE RSP Mutual Funds
U.S. Bancorp Fund Services, LLC
P.O. Box 701
Milwaukee, WI 53201-0701
49

INSIDE THE RETIREMENT SAVINGS PLAN
Shares or units held inside the Plan have been credited to your account as a result of contributions and investment earnings. For a statement summarizing your account balance in the Plan, please refer to your GE RSP Retirement Savings Statement, which is provided quarterly and is available online at any time or upon request. You may obtain additional information and process transactions on investments held inside the Plan by calling:
GE Retirement Savings Plan Service Center: 1-877-55-GERSP (1-877-554-3777)
or visit OneHR.ge.com > Retirement (or RSP) > My GE RSP
OUTSIDE THE RETIREMENT SAVINGS PLAN
If shares of the GE RSP U.S. Equity and the GE RSP Income Funds have been distributed to you from the Plan, information on these investments may be obtained by calling:
GE Asset Management — Shareholder Services: 1-800-242-0134
or visit www.geam.com
50

| | | | | | | | | | |
| M O R N I N G S T A R R A T I N G S™ |
| Through December 31, 2015 |
| | | FUND
(CATEGORY) | | | | NUMBER OF
FUNDS IN CATEGORY | | STAR
RATING | | |
| GE RSP U.S. Equity — (Large-Growth) | | | | |
| | Overall | | | | 1,688 | | ¶ ¶ ¶ ¶ | | |
| | 3 year | | | | 1,530 | | ¶ ¶ ¶ | | |
| | 5 year | | | | 1,420 | | ¶ ¶ ¶ | | |
| | | 10 year | | | | 1,228 | | ¶ ¶ ¶ ¶ | | |
| GE RSP Income — (Intermediate-Term Bond Fund) | | | | |
| | Overall | | | | 1,107 | | ¶ ¶ ¶ ¶ | | |
| | 3 year | | | | 1,040 | | ¶ ¶ ¶ ¶ | | |
| | 5 year | | | | 990 | | ¶ ¶ ¶ ¶ | | |
| | 10 year | | | | 860 | | ¶ ¶ ¶ | | |
Morningstar is an independent fund rating company that seeks to provide a non-biased rating system used in making investment decisions. A fund is rated in its category on a scale of one to five stars through the evaluation of the historical balance of risk and adjusted return after 3 years of performance.
Morningstar calculates a Morningstar Rating based on a Morningstar Risk-Adjusted Return measure that accounts for variation in a fund’s monthly performance (including the effects of sales charges, loads and redemption fees), placing more emphasis on downward variations and rewarding consistent performance. The top ten percent of the funds in each category receive five stars, the next 22.5% receive four stars, the next 35% receive three stars, the next 22.5% receive 2 stars and the bottom 10% receive 1 star. The ratings are subject to change every month. The overall Morningstar Rating for a fund is derived from a weighted average of the performance figures associated with its three-, five- and ten year (if applicable) Morningstar Rating metrics.
Investment return and principal value of an investment will fluctuate and you may have a gain or loss when you sell your shares. Returns assume changes in share price and reinvestment of dividends and capital gains.
Past performance is no guarantee of future results.
This does not constitute a part of the Funds’ Shareholder Report
GE RSP Funds
1600 Summer Street
Stamford, CT 06905
Or at:
PO Box 7900
Stamford, CT 06904-7900
www.geam.com
The Funds file their complete schedules of portfolio holdings with the Securities and Exchange Commission for the first, second and third quarters of each fiscal year on Form N-Q. The Funds’ Forms N-Q, as well as a description of the policies and procedures that the Funds use to determine how to vote proxies (if any) relating to portfolio securities is available without charge (i) upon request, by calling 1-800-242-0134; (ii) on the Funds’ website at http://www.geam.com; and (iii) on the Commission’s website at http://www.sec.gov. The Funds’ Forms N-Q may be reviewed and copied at the Commission’s Public Reference Room in Washington, DC — information on the operation of the Public Reference Room may be obtained by calling 1-800-SEC-0330.
Information (if any) regarding how the Funds voted proxies relating to portfolio securities during the most recently disclosed 12-months period ended June 30 is available without charge (i) through the Funds’ website at http://www.geam.com; and (ii) on the Commission’s website at http://www.sec.gov.

RSP-1 (2/16)
The Registrant has adopted a code of ethics, as defined in Item 2 of Form N-CSR, applicable to its principal executive officer, principal financial officer, principal accounting officer or controller, or persons performing similar functions. A copy of this code of ethics is filed as an exhibit to this Form N-CSR and is included in the following link:
https://www.geam.com/ExternalWar/common/docs/pdf/Spirit_Letter.pdf
There have been no amendments to, nor any waivers granted from, a provision that relates to any element of the code of ethics definition set forth in paragraph (b) of Item 2 of Form N-CSR during the period covered by this report.
| Item 3. | Audit Committee Financial Expert. |
The Board of Trustees of the Registrant has determined that Matthew Zakrzewski and Donald W. Torey are designated as the audit committee financial experts for the Registrant; and further that it is the finding of the Board of Trustees that Messrs. Zakrzewski and Torey qualify as audit committee financial experts and are deemed to be “interested persons” of the Registrant as defined in Section 2(a)(19) of the Act (15 U.S.C. 80a-2(a)(19)).
| Item 4. | Principal Accountant Fees and Services. |
(a) AUDIT FEES. The aggregate fees billed for each of the last two fiscal years (the “Reporting Periods”) for professional services rendered by the Registrant’s principal accountant (the “Auditor”) for the audit of the Registrant’s annual financial statements, or services that are normally provided by the Auditor in connection with the statutory and regulatory filings or engagements for the Reporting Periods were $19,100 in 2014 and $19,500 in 2015.
(b) AUDIT RELATED FEES. There were no fees billed by the Auditor for assurance and related services that were related to the performance of the audit of the Registrant during the Reporting Periods.
(c) TAX FEES. There were no fees billed for professional services rendered by the Auditor for tax compliance, tax advice or tax planning for the Registrant during the Reporting Periods.
(d) ALL OTHER FEES. There were no fees billed for products and services provided by the Auditor, other than the services reported in paragraphs (a) through (c) of this Item for the Registrant during the Reporting Periods.
(e)(1) AUDIT COMMITTEE PRE-APPROVAL POLICIES AND PROCEDURES.
The Audit Committee of the GE RSP Funds (the “Funds”) Board of Trustees is responsible for, among other things, the appointment, compensation and oversight of the work of the Funds’ Auditor. As part of this responsibility and to ensure that the Auditor’s independence is not impaired, the Audit Committee (1) pre-approves the audit and non-audit services provided to the Funds by the Auditor, and (2) all non-audit services provided to the Funds’ investment adviser and Covered Affiliates (as defined in the Audit Committee Charter) that provide ongoing services to the Funds if the services directly impact the Funds’ operations or financial reporting, in accordance with the Audit Committee Charter. The following excerpt from the Audit Committee Charter sets forth the pre-approval policies and procedures:
Pre-Approval of Audit Related Services and Permissible Non-Audit Services. The Audit Committee shall pre-approve both audit (including audit, review, and attest) services and permissible non-audit services provided to the Fund and, if the nature of the engagement relates directly to the operations and financial reporting of the Fund, permissible non-audit services provided to any Covered Affiliate.
The Audit Committee may determine to delegate the authority to grant pre-approvals to one or more Audit Committee members, each acting on behalf of the Audit Committee. In this event, the member of the Audit Committee so delegated shall report each delegated pre-approval to the Audit Committee at its next regularly scheduled meeting. The Audit Committee may also adopt and follow, in lieu of explicit pre-approval described above, written policies and procedures detailed as to the particular service, designed to safeguard the continued independence of the Auditor, consistent with the requirements of the Investment Company Act of 1940, as amended (the “1940 Act”), and SEC regulations there under.
Notwithstanding the foregoing, the pre-approval requirement concerning permissible non-audit services provided to the Fund or any Covered Affiliate is waived if: (1) the aggregate amount of all such non-audit services provided constitutes no more than five percent (5%) of the total amount of revenues paid to the Auditor by the Fund and the Covered Affiliates during the fiscal year in which the services are provided that would have to be pre-approved by the Audit Committee, (2) the non-audit services were not recognized as non-audit services at the time of the engagement, and (3) such non-audit services are promptly brought to the attention of the Audit Committee and approved by the Audit Committee or one or more designated members of the Audit Committee prior to the completion of the audit.
(2) PERCENTAGE OF SERVICES DESCRIBED IN PARAGRAPHS (b) THROUGH (d) APPROVED BY AUDIT COMMITTEE. No fees were charged during the Reporting Periods for audit related, tax or other services as indicated in sections (b) through (d) of this Item.
(f) Not applicable.
(g) NON-AUDIT FEES. The aggregate non-audit fees billed by the Auditor for services rendered to the Registrant, and rendered to the Registrant’s investment adviser and any entity controlling, controlled by, or under common control with the Registrant’s adviser (“Service Affiliates”), for the Reporting Periods were $0 in 2014 and $0 in 2015.
(h) AUDITOR INDEPENDENCE. There were no non-audit services rendered to Service Affiliates during the Reporting Periods that were not pre-approved.
| Item 5. | Audit Committee of Listed Registrants. |
Applicable only to Closed-End Management Investment Companies.
| Item 6. | Schedule of Investments. |
(a) Schedule of Investments is included as part of the Report to Shareholders filed under Item 1 of this Form N-CSR.
(b) Not applicable.
| Item 7. | Disclosure of Proxy Voting Policies and Procedures for Closed-End Management Investment Companies. |
Applicable only to Closed-End Management Investment Companies.
| Item 8. | Portfolio Managers of Closed-End Management Investment Companies. |
Applicable only to Closed-End Management Investment Companies.
| Item 9. | Purchases of Equity Securities by Closed-End Management Investment Company and Affiliated Purchasers. |
Applicable only to Closed-End Management Investment Companies.
| Item 10. | Submission of Matters to a Vote of Security Holders. |
During the reporting period, there have been no material changes to the procedures by which the shareholders may recommend nominees to the Registrant’s Board of Trustees.
| Item 11. | Controls and Procedures. |
(a) The Registrant’s principal executive officer and principal financial officer have concluded that the Registrant’s disclosure controls and procedures (as defined in Rule 30a-3(c) under the 1940 Act) are effective as of a date within 90 days of the filing date of the report included in Item 1 of this Form N-CSR, based on the evaluation of these controls and procedures required by Rule 30a-3(b) under the 1940 Act and Rules 13a-15(b) or 15d-15(b) under the Securities Exchange Act of 1934, as amended.
(b) There were no changes in the Registrant’s internal control over financial reporting (as defined in Rule 30a-3(d) under the 1940 Act) that occurred during the Registrant’s second fiscal quarter of the period covered by this Form N-CSR that have materially affected, or are reasonably likely to materially affect, the Registrant’s internal control over financial reporting.
(a)(1) The Code of Ethics that applies to the Registrant’s principal executive officer and principal financial officer is attached hereto.
(a)(2) The certifications required by Rule 30a-2(a) under the 1940 Act and Section 302 of the Sarbanes-Oxley Act of 2002 are attached hereto.
(a)(3) Not applicable.
(b) The certifications by the Registrant’s principal executive officer and principal financial officer, as required by Rule 30a-2(b) under the 1940 Act and Section 906 of the Sarbanes-Oxley Act of 2002, are attached hereto.
SIGNATURES
Pursuant to the requirements of the Securities Exchange Act of 1934 and the Investment Company Act of 1940, the below Registrants have duly caused each report to be signed on their behalf by the undersigned, thereunto duly authorized.
| | |
| General Electric RSP Income Fund |
| General Electric RSP U.S. Equity Fund |
| |
| By: | | /s/ Dmitri L. Stockton |
| | Dmitri L. Stockton |
| | Trustee, President and Chief Executive Officer |
| | GE Asset Management Incorporated |
|
| Date: February 18, 2016 |
Pursuant to the requirements of the Securities Exchange Act of 1934 and the Investment Company Act of 1940, each report has been signed below by the following persons on behalf of the Registrants and in the capacities and on the dates indicated.
| | |
| By: | | /s/ Dmitri L. Stockton |
| | Dmitri L. Stockton |
| | Trustee, President and Chief Executive Officer |
| | GE Asset Management Incorporated |
|
| Date: February 18, 2016 |
| |
| By: | | /s/ Arthur A. Jensen |
| | Arthur A. Jensen |
| | Treasurer, GE RSP Funds |
|
| Date: February 18, 2016 |