Table of Contents
UNITED STATES
SECURITIES AND EXCHANGE COMMISSION
Washington, D.C. 20549
FORM N-CSR
CERTIFIED SHAREHOLDER REPORT OF REGISTERED
MANAGEMENT INVESTMENT COMPANIES
Investment Company Act file number: 811-01494
GENERAL ELECTRIC RSP U.S. EQUITY FUND
(Exact name of registrant as specified in charter)
1600 Summer Street, Stamford, Connecticut 06905
(Address of principal executive offices)(Zip code)
Joshua A. Weinberg, Esq.
Managing Director and Managing Counsel
SSGA Funds Management, Inc.
One Lincoln Street
Boston, Massachusetts 02111
(Name and Address of Agent for Service)
Registrant’s telephone number, including area code: 800-242-0134
Date of fiscal year end: December 31
Date of reporting period: December 31, 2017
Table of Contents
| Item 1. | Shareholder Reports. |
Table of Contents
Annual Report
December 31, 2017
GE RSP Funds
U.S. Equity Fund
Income Fund

Table of Contents
GE RSP Funds
Annual Report
December 31, 2017
| Page | ||||
| Notes to Performance | 1 | |||
| Manager Reviews and Schedule of Investments | 2 | |||
| Financial Statements | ||||
| 32 | ||||
| 34 | ||||
| 35 | ||||
| 36 | ||||
| Notes to Financial Statements | 37 | |||
| Report of Independent Registered Public Accounting Firm | 44 | |||
| Tax Information | 45 | |||
| Additional Information | 46 | |||
| Investment Team | 52 | |||
This report has been prepared for shareholders and may be distributed to others only if accompanied with a current prospectus and/or summary prospectus.
Table of Contents
GE RSP Funds
Notes to Performance — December 31, 2017 (Unaudited)
The information provided on the performance pages relates to the GE RSP U.S. Equity Fund and GE RSP Income Fund (each, a “Fund” and collectively, the “Funds”).
Total returns take into account changes in share price and assume reinvestment of dividends and capital gains distributions, if any. Total returns shown are net of Fund expenses.
The performance data quoted represents past performance; past performance does not guarantee future results. Investment return and principal value will fluctuate so your shares, when redeemed, may be worth more or less than their original cost. Current performance may be higher or lower than the performance data quoted. Periods less than one year are not annualized. Please call toll-free (800) 242-0134 or visit the Funds’ website at http://www.ssga.com/geam for the most recent month-end performance data.
An investment in a Fund is not a deposit of any bank and is not insured or guaranteed by the Federal Deposit Insurance Corporation (“FDIC”) or any other government agency. An investment in a Fund is subject to risk, including possible loss of principal invested.
The S&P® 500 Index is an unmanaged, market capitalization-weighted index of stocks of 500 large U.S. companies, which is widely used as a measure of large-cap stock market performance.
The Bloomberg Barclays U.S. Aggregate Bond Index is an unmanaged market value-weighted index of taxable investment grade debt issues, including government, corporate, asset-backed and mortgage-backed securities, with maturities of one year or more. This index is designed to represent the performance of the U.S. investment-grade first rate bond market.
The results shown for the foregoing indices assume the reinvestment of net dividends or interest and do not reflect fees, expenses, or taxes. As such, index returns do not reflect the actual cost of investing in the instruments that comprise an index.
The peer universe of underlying funds used for the peer group average annual total return calculation is based on a blend of Morningstar peer categories, as shown. Morningstar is an independent mutual fund rating service. A Fund’s performance may be compared to or ranked within a universe of mutual funds with investment objectives and policies similar but not necessarily identical to that of the Fund.
©2018 Morningstar, Inc. All Rights Reserved. The Morningstar information contained herein: (1) is proprietary to Morningstar and/or its content providers; (2) may not be copied or distributed; and (3) is not warranted to be accurate, complete or timely. Neither Morningstar nor its content providers are responsible for any damage or losses relating from any use of this information. Past performance is no guarantee of future results.
The views expressed in this document reflect our judgment as of the publication date and are subject to change at any time without notice.
| Notes to Performance | 1 |
Table of Contents
GE RSP U.S. Equity Fund
Portfolio Management Discussion and Analysis — December 31, 2017 (Unaudited)
| Q. | How did the GE RSP U.S. Equity Fund (the “Fund”) perform compared to its benchmark and Morningstar peer group for the twelve-month period ended December 31, 2017? |
| A. | For the twelve-month period ended December 31, 2017, the Fund returned 20.50%. The S&P 500® Index (S&P 500), the Fund’s benchmark, returned 21.83% and the Fund’s Morningstar peer group of 1,342 U.S. Large Blend Funds returned an average of 20.46% over the same period. |
| Q. | What market factors affected the Fund’s performance? |
| A. | A variety of factors drove the strong equity market return. Economic growth strengthened, earnings growth accelerated (S&P 500 operating earnings grew about 12% for the year), and dividend growth picked up. The recovery in energy prices resulted in an increase in U.S. drilling activity. The new political administration rolled back regulation and undertook initiatives which the market viewed as supportive of business, culminating in a cut in the corporate tax rate at year-end. It was the most favorable environment for equities since the end of the recession of 2008-09. It’s also notable that every month of 2017 had a positive return for the S&P 500 — a very rare occurrence in stock market history. |
| Q. | What were the primary drivers of Fund performance? |
| A. | While the Fund put up double-digit returns, it failed to capture all of the upside of the broad market, due primarily to a handful of individual stock selections. On the positive side, the Fund’s holdings in industrials outperformed those of the S&P 500 Index (driven by strength in equipment rental company United Rentals +62.8% in the Fund). Within the S&P 500 benchmark, Technology was a top performing sector, advancing 38.8%. Tech bellwethers such as Apple (+48.5%), Google (+35.6%), Facebook (+53.4%), and Microsoft (+40.7%) helped drive the S&P 500 Tech sector return. Amazon, which is in the Consumer Discretionary sector was also a strong performer (+56.0%). The Fund owned all of these tech bellwethers to varying degrees, and at year-end the Fund maintained a sector overweight in Technology relative to the S&P 500 Index. Underweights in the lagging Real Estate and Telecommunications sectors also bolstered results relative to the S&P 500 Index. |
| The primary detractors from performance included holdings in the Energy, Consumer Discretionary and Health Care sectors. Energy was the best performing S&P 500 sector in 2016 with a 27.3% return, but lagged significantly last year. While the Fund reduced its Energy exposure over the course of the year, Noble, Antero, Schlumberger and Pioneer underperformed within the Fund, with pullbacks ranging from -22.4% to -4.0%. Within Consumer Discretionary, Newell Brands (-29.4%) suffered as hurricane-related input shortages and a tough back-to-school season pressured the stock. The Fund maintained an overweight in the Health Care sector. Unfortunately, the Fund’s holdings in pharma/biotech lagged the market, including Allergan (-21.1%) and Alexion (-2.3%). |
| Q. | Were there any significant changes in the Fund during the period? |
| A. | The investment philosophy did not change in any material way during the period. During the year, the Fund’s portfolio was rebalanced to ensure continued alignment with its principal investment strategies, which resulted in higher portfolio turnover. |
| 2 | GE RSP U.S. Equity Fund |
Table of Contents
GE RSP U.S. Equity Fund
Understanding Your Fund’s Expenses — December 31, 2017 (Unaudited)
As a shareholder of the Fund you incur ongoing costs. Ongoing costs include portfolio management fees, professional fees, administrative fees and other Fund expenses. The following example is intended to help you understand your ongoing costs (in dollars) of investing in the Fund and to compare these costs with the ongoing costs of investing in other mutual funds.
To illustrate these ongoing costs, we have provided an example and calculated the expenses paid by investors in shares of the Fund during the period. The information in the following table is based on an investment of $1,000, which is invested at the beginning of the period and held for the entire six-month period ended December 31, 2017.
Actual Expenses
The first section of the table provides information about actual account values and actual expenses. You may use the information in this section, together with the amount you invested, to estimate the expenses that you paid over the period. To do so, simply divide your account value by $1,000 (for example, an $8,600 account value divided by $1,000 = 8.6), then multiply the result by the number given under the heading “Expenses paid during the period” to estimate the expenses you paid on your account during the period.
Hypothetical Example for Comparison Purposes
The second section of the table provides information about hypothetical account values and hypothetical expenses based on the Fund’s actual expense ratio and an assumed rate of return of 5% per year before expenses, which is not the Fund’s actual return. The hypothetical account values and expenses may not be used to estimate the actual ending account balance or expenses you paid for the period. You may use this information to compare the ongoing costs of investing in the Fund and other funds. To do so, compare this 5% hypothetical example with the 5% hypothetical examples that appear in the shareholders reports of other funds.
Please note that the expenses shown in the table are meant to highlight and help you compare ongoing costs only and do not reflect transaction costs, such as sales charges or redemption fees, if any. Therefore, the second section of the table is useful in comparing ongoing costs only, and will not help you determine the relative total costs of owning different funds.
July 1, 2017 - December 31, 2017
| Actual Fund Return | Hypothetical 5% Return (2.5% for the period) | |||||||
Account value at the beginning of the period | $ | 1,000.00 | $ | 1,000.00 | ||||
Account value at the end of the period | $ | 1,090.10 | $ | 1,024.50 | ||||
Expenses paid during the period* | $ | 0.74 | $ | 0.71 | ||||
| * | Expenses are equal to the Fund’s annualized expense ratio of 0.14% (for the period July 1, 2017-December 31, 2017), multiplied by the average account value over the period, multiplied by 184/365 (to reflect the one-half year period). |
| GE RSP U.S. Equity Fund | 3 |
Table of Contents
GE RSP U.S. Equity Fund
Performance Summary — December 31, 2017 (Unaudited)
Morningstar Performance Comparison
Based on average annual returns for periods ended December 31, 2017
| One Year | Five Year | Ten Year | ||||||||||
Number of funds in peer group | 1,342 | 1,200 | 1,063 | |||||||||
Peer group average annual total return | 20.46 | % | 14.25 | % | 7.54 | % | ||||||
Morningstar Category in peer group: U.S. Large Blend Funds |
| |||||||||||
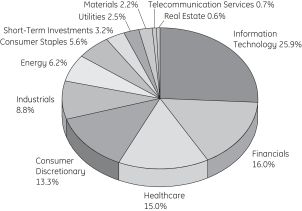
Top Ten Largest Holdings
as of December 31, 2017 (as a % of Fair Value) (a)
Apple Inc. | 3.82 | % | ||
Microsoft Corp. | 3.54 | % | ||
JPMorgan Chase & Co. | 3.43 | % | ||
Visa Inc., Class A | 3.00 | % | ||
Pfizer Inc. | 2.77 | % | ||
PepsiCo Inc. | 2.65 | % | ||
Facebook Inc., Class A | 2.48 | % | ||
Alphabet Inc., Class A | 2.33 | % | ||
Amazon.com Inc. | 2.25 | % | ||
The Goldman Sachs Group Inc. | 1.99 | % |
Sector Allocation as of December 31, 2017
Portfolio composition as a % of Fair Value of $5,430,843 (in thousands) as of December 31, 2017 (a)
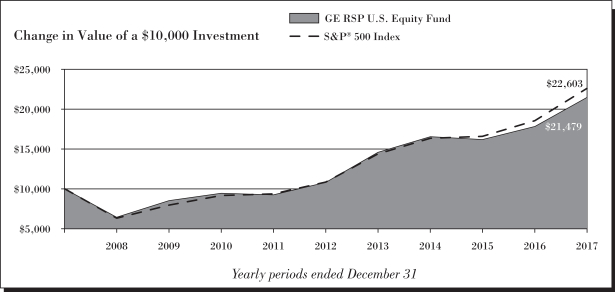
Average Annual Total Return for the periods ended December 31, 2017
| One Year | Five Year | Ten Year | Ending Value of a $10,000 Investment | |||||||||||||
GE RSP U.S. Equity Fund | 20.50 | % | 14.75 | % | 7.94 | % | $ | 21,479 | ||||||||
S&P 500® Index | 21.83 | % | 15.79 | % | 8.50 | % | $ | 22,603 | ||||||||
| 4 | GE RSP U.S. Equity Fund |
Table of Contents
GE RSP U.S. Equity Fund
Performance Summary, continued — December 31, 2017 (Unaudited)
| (a) | The securities information regarding holdings, allocations and other characteristics is presented to illustrate examples of securities that the Fund has bought and the diversity of areas in which the Fund may invest as of a particular date. It may not be representative of the Fund’s current or future investments and should not be construed as a recommendation to purchase or sell a particular security. |
See Notes to Performance beginning on page 1 for further information, including an explanation of Morningstar peer categories.
Past performance does not predict future performance. The performance shown in the graphs and tables does not reflect the deduction of taxes that a shareholder would pay on Fund distributions or the redemption of Fund shares and does not reflect the fees or charges that would be associated with variable contracts through which shares of the Fund are offered.
| GE RSP U.S. Equity Fund | 5 |
Table of Contents
GE RSP U.S. Equity Fund
Schedule of Investments — December 31, 2017
| Number of Shares | Fair Value $ | |||||||
| Common Stock - 96.7%† | ||||||||
Aerospace & Defense - 1.4% |
| |||||||
General Dynamics Corp. | 149,600 | 30,436,120 | ||||||
Hexcel Corp. | 226,132 | 13,986,264 | ||||||
Raytheon Co. | 174,416 | 32,764,046 | ||||||
|
| |||||||
| 77,186,430 | ||||||||
|
| |||||||
Air Freight & Logistics - 0.5% |
| |||||||
FedEx Corp. | 41,272 | 10,299,015 | ||||||
United Parcel Service Inc., Class B | 140,456 | 16,735,332 | ||||||
|
| |||||||
| 27,034,347 | ||||||||
|
| |||||||
Airlines - 0.4% |
| |||||||
Alaska Air Group Inc. | 271,100 | 19,928,561 | ||||||
|
| |||||||
Aluminum - 0.1% |
| |||||||
Alcoa Corp. (a) | 79,025 | 4,257,077 | ||||||
|
| |||||||
Application Software - 2.0% |
| |||||||
Adobe Systems Inc. (a) | 84,258 | 14,765,372 | ||||||
Intuit Inc. | 123,803 | 19,533,637 | ||||||
salesforce.com Inc. (a) | 706,453 | 72,220,690 | ||||||
|
| |||||||
| 106,519,699 | ||||||||
|
| |||||||
Asset Management & Custody Banks - 0.8% |
| |||||||
Ameriprise Financial Inc. | 122,778 | 20,807,188 | ||||||
BlackRock Inc. | 42,364 | 21,762,810 | ||||||
|
| |||||||
| 42,569,998 | ||||||||
|
| |||||||
Auto Parts & Equipment - 0.2% |
| |||||||
Aptiv PLC | 136,091 | 11,544,600 | ||||||
|
| |||||||
Automobile Manufacturers - 0.2% |
| |||||||
General Motors Co. | 255,062 | 10,454,991 | ||||||
|
| |||||||
Automotive Retail - 1.2% |
| |||||||
AutoZone Inc. (a) | 89,127 | 63,402,274 | ||||||
|
| |||||||
Biotechnology - 5.0% |
| |||||||
Alexion Pharmaceuticals Inc. (a) | 661,033 | 79,052,936 | ||||||
Amgen Inc. | 462,662 | 80,456,922 | ||||||
Biogen Inc. (a) | 267,474 | 85,209,192 | ||||||
Vertex Pharmaceuticals Inc. (a) | 194,746 | 29,184,636 | ||||||
|
| |||||||
| 273,903,686 | ||||||||
|
| |||||||
Building Products - 0.4% |
| |||||||
Allegion PLC | 252,911 | 20,121,599 | ||||||
|
| |||||||
| Number of Shares | Fair Value $ | |||||||
Cable & Satellite - 2.2% |
| |||||||
Charter Communications Inc., Class A (a) | 184,258 | 61,903,318 | ||||||
Comcast Corp., Class A (a) | 1,096,544 | 43,916,587 | ||||||
Liberty Global PLC, Class C | 432,901 | 14,649,370 | ||||||
|
| |||||||
| 120,469,275 | ||||||||
|
| |||||||
Communications Equipment - 0.6% |
| |||||||
Cisco Systems Inc. | 830,715 | 31,816,384 | ||||||
|
| |||||||
Consumer Finance - 0.6% |
| |||||||
American Express Co. | 200,996 | 19,960,913 | ||||||
Discover Financial Services | 143,115 | 11,008,406 | ||||||
|
| |||||||
| 30,969,319 | ||||||||
|
| |||||||
Data Processing & Outsourced Services - 3.3% |
| |||||||
PayPal Holdings Inc. (a) | 212,116 | 15,615,980 | ||||||
Visa Inc., Class A | 1,429,961 | 163,044,153 | ||||||
|
| |||||||
| 178,660,133 | ||||||||
|
| |||||||
Diversified Banks - 5.0% |
| |||||||
Bank of America Corp. | 2,264,706 | 66,854,121 | ||||||
JPMorgan Chase & Co. | 1,744,200 | 186,524,748 | ||||||
U.S. Bancorp | 329,417 | 17,650,163 | ||||||
|
| |||||||
| 271,029,032 | ||||||||
|
| |||||||
Diversified Chemicals - 0.6% |
| |||||||
DowDuPont Inc. | 418,947 | 29,837,405 | ||||||
|
| |||||||
Electric Utilities - 1.5% |
| |||||||
American Electric Power Company Inc. | 185,630 | 13,656,799 | ||||||
Duke Energy Corp. | 102,896 | 8,654,583 | ||||||
Edison International | 105,338 | 6,661,575 | ||||||
Exelon Corp. | 462,708 | 18,235,322 | ||||||
NextEra Energy Inc. | 182,633 | 28,525,448 | ||||||
PG&E Corp. | 157,023 | 7,039,341 | ||||||
|
| |||||||
| 82,773,068 | ||||||||
|
| |||||||
Electrical Components & Equipment - 0.4% |
| |||||||
Acuity Brands Inc. | 72,819 | 12,816,144 | ||||||
Rockwell Automation Inc. | 58,244 | 11,436,209 | ||||||
|
| |||||||
| 24,252,353 | ||||||||
|
| |||||||
Environmental & Facilities Services - 0.4% |
| |||||||
Republic Services Inc. | 357,212 | 24,151,103 | ||||||
|
| |||||||
Fertilizers & Agricultural Chemicals - 0.1% |
| |||||||
Monsanto Co. | 67,924 | 7,932,165 | ||||||
|
| |||||||
Financial Exchanges & Data - 1.8% |
| |||||||
CME Group Inc. | 459,510 | 67,111,435 | ||||||
See Notes to Schedules of Investments and Notes to Financial Statements.
| 6 | GE RSP U.S. Equity Fund |
Table of Contents
GE RSP U.S. Equity Fund
Schedule of Investments, continued — December 31, 2017
| Number of Shares | Fair Value $ | |||||||
S&P Global Inc. | 184,589 | 31,269,377 | ||||||
|
| |||||||
| 98,380,812 | ||||||||
|
| |||||||
Footwear - 1.1% |
| |||||||
NIKE Inc., Class B | 910,594 | 56,957,655 | ||||||
|
| |||||||
Gold - 0.0%* |
| |||||||
B2Gold Corp. (a) | 709,646 | 2,199,903 | ||||||
|
| |||||||
Healthcare Equipment - 2.1% |
| |||||||
Abbott Laboratories | 517,977 | 29,560,947 | ||||||
Boston Scientific Corp. (a) | 1,446,498 | 35,858,686 | ||||||
Medtronic PLC | 613,863 | 49,569,437 | ||||||
|
| |||||||
| 114,989,070 | ||||||||
|
| |||||||
Healthcare Supplies - 0.5% |
| |||||||
The Cooper Companies Inc. | 121,595 | 26,493,119 | ||||||
|
| |||||||
Home Entertainment Software - 0.4% |
| |||||||
Activision Blizzard Inc. | 186,799 | 11,828,113 | ||||||
Electronic Arts Inc. (a) | 88,343 | 9,281,315 | ||||||
|
| |||||||
| 21,109,428 | ||||||||
|
| |||||||
Home Improvement Retail - 1.0% |
| |||||||
Lowe’s Companies Inc. | 44,240 | 4,111,666 | ||||||
The Home Depot Inc. | 259,661 | 49,213,549 | ||||||
|
| |||||||
| 53,325,215 | ||||||||
|
| |||||||
Hotels, Resorts & Cruise Lines - 0.3% |
| |||||||
Marriott International Inc., Class A | 133,349 | 18,099,460 | ||||||
|
| |||||||
Housewares & Specialties - 0.9% |
| |||||||
Newell Brands Inc. | 1,626,361 | 50,254,555 | ||||||
|
| |||||||
Hypermarkets & Super Centers - 0.4% |
| |||||||
Wal-Mart Stores Inc. | 237,574 | 23,460,432 | ||||||
|
| |||||||
Independent Power Producers & Energy Traders - 0.1% |
| |||||||
Calpine Corp. (a) | 168,048 | 2,542,566 | ||||||
|
| |||||||
Industrial Conglomerates - 1.1% |
| |||||||
Honeywell International Inc. | 229,708 | 35,228,019 | ||||||
Roper Technologies Inc. | 100,957 | 26,147,863 | ||||||
|
| |||||||
| 61,375,882 | ||||||||
|
| |||||||
Industrial Machinery - 2.3% |
| |||||||
Ingersoll-Rand PLC | 729,286 | 65,045,018 | ||||||
Xylem Inc. | 888,554 | 60,599,383 | ||||||
|
| |||||||
| 125,644,401 | ||||||||
|
| |||||||
| Number of Shares | Fair Value $ | |||||||
Insurance Brokers - 0.3% |
| |||||||
Marsh & McLennan Companies Inc. | 178,107 | 14,496,129 | ||||||
|
| |||||||
Integrated Oil & Gas - 2.7% |
| |||||||
Chevron Corp. | 752,557 | 94,212,611 | ||||||
Exxon Mobil Corp. | 650,655 | 54,420,784 | ||||||
|
| |||||||
| 148,633,395 | ||||||||
|
| |||||||
Integrated Telecommunication Services - 0.5% |
| |||||||
Verizon Communications Inc. | 501,225 | 26,529,839 | ||||||
|
| |||||||
Internet & Direct Marketing Retail - 3.1% |
| |||||||
Amazon.com Inc. (a) | 104,663 | 122,400,238 | ||||||
Netflix Inc. (a) | 41,506 | 7,967,492 | ||||||
The Priceline Group Inc. (a) | 21,151 | 36,754,939 | ||||||
|
| |||||||
| 167,122,669 | ||||||||
|
| |||||||
Internet Software & Services - 6.2% |
| |||||||
Alphabet Inc., Class A (a) | 119,848 | 126,247,883 | ||||||
Alphabet Inc., Class C (a) | 70,455 | 73,724,112 | ||||||
Facebook Inc., Class A (a) | 763,073 | 134,651,862 | ||||||
|
| |||||||
| 334,623,857 | ||||||||
|
| |||||||
Investment Banking & Brokerage - 3.5% |
| |||||||
The Charles Schwab Corp. | 1,610,236 | 82,717,823 | ||||||
The Goldman Sachs Group Inc. | 424,550 | 108,158,358 | ||||||
|
| |||||||
| 190,876,181 | ||||||||
|
| |||||||
IT Consulting & Other Services - 0.7% |
| |||||||
Accenture PLC, Class A | 105,923 | 16,215,752 | ||||||
International Business Machines Corp. | 143,375 | 21,996,593 | ||||||
|
| |||||||
| 38,212,345 | ||||||||
|
| |||||||
Life & Health Insurance - 0.4% |
| |||||||
Prudential Financial Inc. | 170,104 | 19,558,558 | ||||||
|
| |||||||
Life Sciences Tools & Services - 1.5% |
| |||||||
Illumina Inc. (a) | 118,774 | 25,950,931 | ||||||
IQVIA Holdings Inc. (a) | 324,561 | 31,774,522 | ||||||
Thermo Fisher Scientific Inc. | 131,830 | 25,031,881 | ||||||
|
| |||||||
| 82,757,334 | ||||||||
|
| |||||||
Managed Healthcare - 1.5% |
| |||||||
Humana Inc. | 98,043 | 24,321,527 | ||||||
UnitedHealth Group Inc. | 248,756 | 54,840,748 | ||||||
|
| |||||||
| 79,162,275 | ||||||||
|
| |||||||
See Notes to Schedules of Investments and Notes to Financial Statements.
| GE RSP U.S. Equity Fund | 7 |
Table of Contents
GE RSP U.S. Equity Fund
Schedule of Investments, continued — December 31, 2017
| Number of Shares | Fair Value $ | |||||||
Metal & Glass Containers - 0.2% |
| |||||||
Ball Corp. | 281,309 | 10,647,546 | ||||||
|
| |||||||
Movies & Entertainment - 1.9% |
| |||||||
The Walt Disney Co. | 736,006 | 79,128,005 | ||||||
Time Warner Inc. | 271,430 | 24,827,702 | ||||||
|
| |||||||
| 103,955,707 | ||||||||
|
| |||||||
Multi-Line Insurance - 0.2% |
| |||||||
The Hartford Financial Services Group Inc. | 228,596 | 12,865,383 | ||||||
|
| |||||||
Multi-Sector Holdings - 1.1% |
| |||||||
Berkshire Hathaway Inc., Class B (a) | 300,615 | 59,587,905 | ||||||
|
| |||||||
Multi-Utilities - 0.9% |
| |||||||
Dominion Energy Inc. | 127,354 | 10,323,315 | ||||||
Sempra Energy | 363,983 | 38,917,063 | ||||||
|
| |||||||
| 49,240,378 | ||||||||
|
| |||||||
Oil & Gas Equipment & Services - 1.2% |
| |||||||
Schlumberger Ltd. | 945,700 | 63,730,723 | ||||||
|
| |||||||
Oil & Gas Exploration & Production - 2.0% |
| |||||||
Concho Resources Inc. (a) | 91,450 | 13,737,619 | ||||||
ConocoPhillips | 286,697 | 15,736,798 | ||||||
Diamondback Energy Inc. (a) | 191,142 | 24,131,678 | ||||||
EOG Resources Inc. | 178,050 | 19,213,376 | ||||||
Pioneer Natural Resources Co. | 201,345 | 34,802,483 | ||||||
|
| |||||||
| 107,621,954 | ||||||||
|
| |||||||
Oil & Gas Refining & Marketing - 0.3% |
| |||||||
Valero Energy Corp. | 172,455 | 15,850,339 | ||||||
|
| |||||||
Packaged Foods & Meats - 1.4% |
| |||||||
Mondelez International Inc., Class A | 1,152,550 | 49,329,140 | ||||||
The Kraft Heinz Co. | 363,435 | 28,260,706 | ||||||
|
| |||||||
| 77,589,846 | ||||||||
|
| |||||||
Paper Packaging - 0.3% |
| |||||||
Packaging Corporation of America | 117,758 | 14,195,727 | ||||||
|
| |||||||
Pharmaceuticals - 4.4% |
| |||||||
Allergan PLC | 552,806 | 90,428,005 | ||||||
Pfizer Inc. | 4,147,595 | 150,225,891 | ||||||
|
| |||||||
| 240,653,896 | ||||||||
|
| |||||||
Property & Casualty Insurance - 0.7% |
| |||||||
Chubb Ltd. | 141,043 | 20,610,614 | ||||||
| Number of Shares | Fair Value $ | |||||||
The Allstate Corp. | 177,917 | 18,629,689 | ||||||
|
| |||||||
| 39,240,303 | ||||||||
|
| |||||||
Railroads - 0.4% |
| |||||||
Union Pacific Corp. | 178,803 | 23,977,482 | ||||||
|
| |||||||
Regional Banks - 1.6% |
| |||||||
First Republic Bank | 916,308 | 79,388,925 | ||||||
The PNC Financial Services Group Inc. | 66,122 | 9,540,743 | ||||||
|
| |||||||
| 88,929,668 | ||||||||
|
| |||||||
Restaurants - 1.0% |
| |||||||
McDonald’s Corp. | 166,118 | 28,592,230 | ||||||
Starbucks Corp. | 416,518 | 23,920,629 | ||||||
|
| |||||||
| 52,512,859 | ||||||||
|
| |||||||
Semiconductor Equipment - 2.0% |
| |||||||
Applied Materials Inc. | 1,905,567 | 97,412,585 | ||||||
Lam Research Corp. | 68,587 | 12,624,809 | ||||||
|
| |||||||
| 110,037,394 | ||||||||
|
| |||||||
Semiconductors - 2.5% |
| |||||||
Broadcom Ltd. | 381,209 | 97,932,592 | ||||||
Intel Corp. | 438,427 | 20,237,790 | ||||||
QUALCOMM Inc. | 256,779 | 16,438,992 | ||||||
|
| |||||||
| 134,609,374 | ||||||||
|
| |||||||
Soft Drinks - 2.6% |
| |||||||
PepsiCo Inc. | 1,197,981 | 143,661,881 | ||||||
|
| |||||||
Specialized REITs - 0.6% |
| |||||||
American Tower Corp. | 240,187 | 34,267,479 | ||||||
|
| |||||||
Specialty Chemicals - 0.9% |
| |||||||
Albemarle Corp. | 174,276 | 22,288,158 | ||||||
GCP Applied Technologies Inc. (a) | 230,957 | 7,367,528 | ||||||
The Sherwin-Williams Co. | 39,982 | 16,394,219 | ||||||
|
| |||||||
| 46,049,905 | ||||||||
|
| |||||||
Specialty Stores - 0.2% |
| |||||||
Signet Jewelers Ltd. | 80,711 | 4,564,207 | ||||||
Ulta Salon Cosmetics & Fragrance Inc. (a) | 34,550 | 7,727,453 | ||||||
|
| |||||||
| 12,291,660 | ||||||||
|
| |||||||
Steel - 0.1% |
| |||||||
ArcelorMittal (a) | 241,676 | 7,808,552 | ||||||
|
| |||||||
See Notes to Schedules of Investments and Notes to Financial Statements.
| 8 | GE RSP U.S. Equity Fund |
Table of Contents
GE RSP U.S. Equity Fund
Schedule of Investments, continued — December 31, 2017
| Number of Shares | Fair Value $ | |||||||
Systems Software - 4.4% |
| |||||||
Microsoft Corp. | 2,248,377 | 192,326,169 | ||||||
Oracle Corp. | 699,737 | 33,083,565 | ||||||
Proofpoint Inc. (a) | 142,820 | 12,683,844 | ||||||
|
| |||||||
| 238,093,578 | ||||||||
|
| |||||||
Technology Hardware, Storage & Peripherals - 3.9% |
| |||||||
Apple Inc. | 1,225,400 | 207,374,442 | ||||||
Hewlett Packard Enterprise Co. | 290,788 | 4,175,716 | ||||||
|
| |||||||
| 211,550,158 | ||||||||
|
| |||||||
Tobacco - 1.1% |
| |||||||
Philip Morris International Inc. | 568,744 | 60,087,804 | ||||||
|
| |||||||
Trading Companies & Distributors - 1.3% |
| |||||||
United Rentals Inc. (a) | 421,681 | 72,491,181 | ||||||
|
| |||||||
| Number of Shares | Fair Value $ | |||||||
Wireless Telecommunication Services - 0.2% |
| |||||||
T-Mobile US Inc. (a) | 170,867 | 10,851,763 | ||||||
|
| |||||||
| Total Common Stock (Cost $4,123,847,006) | 5,258,019,024 | |||||||
|
| |||||||
| Short-Term Investments - 3.2% | ||||||||
Time Deposit - 3.2% |
| |||||||
State Street Corp. | 172,823,564 | 172,823,564 | ||||||
|
| |||||||
| Total Investments (Cost $4,296,670,570) | 5,430,842,588 | |||||||
| Other Assets and Liabilities, net - 0.1% | 4,670,399 | |||||||
|
| |||||||
| NET ASSETS - 100.0% | $ | 5,435,512,987 | ||||||
|
| |||||||
The following table presents the Fund’s investments measured at fair value on a recurring basis at December 31, 2017:
| Fund | Investments | Level 1 | Level 2 | Level 3 | Total | |||||||||||||
| GE RSP U.S. Equity Fund | Investments in Securities | |||||||||||||||||
Common Stock | $ | 5,258,019,024 | $ | — | $ | — | $ | 5,258,019,024 | ||||||||||
Short-Term Investments | — | 172,823,564 | — | 172,823,564 | ||||||||||||||
|
|
|
|
|
|
|
| |||||||||||
Total Investments in Securities | $ | 5,258,019,024 | $ | 172,823,564 | $ | — | $ | 5,430,842,588 | ||||||||||
|
|
|
|
|
|
|
| |||||||||||
Affiliate Table
| Number of Shares Held at 12/31/16 | Value At 12/31/16 | Cost of Purchases | Proceeds from Shares Sold | Number of Shares Held at 12/31/17 | Value at 12/31/17 | Dividend Income | ||||||||||||||||||||||
State Street Corporation (Time Deposit) | 39,432,643 | $ | 39,432,643 | $ | 29,327,151,619 | $ | 29,193,760,698 | 172,823,564 | $ | 172,823,564 | $ | 116,734 | ||||||||||||||||
See Notes to Schedules of Investments and Notes to Financial Statements.
| GE RSP U.S. Equity Fund | 9 |
Table of Contents
GE RSP Income Fund
Portfolio Management Discussion and Analysis — December 31, 2017 (Unaudited)
How did the General Electric RSP Income Fund (the “Fund”) perform compared to its benchmark for the twelve-month period ended December 31, 2017?
For the twelve-month period ended December 31, 2017, the Fund returned 3.99%. The Bloomberg Barclays U.S. Aggregate Bond Index, the Fund’s benchmark, returned 3.54% and the Fund’s Morningstar peer group of 1,001 U.S. Intermediate-Term Bond Funds returned an average of 3.80% over the same period.
| Q. | What market factors affected the Fund’s performance? |
| A. | The most significant market factor that affected the Fund’s performance was a continuation of credit spread tightening over the last twelve months. Investment grade and high yield credit spreads tightened approximately -30 and -55 bps respectively driven by stronger economic fundamentals. This generated returns of +335 bps from U.S. investment grade credit and +610 bps from U.S. high yield credit. The U.S. Treasury yield curve flattened during the year. Short-term rates moved higher as the Federal Reserve (the “Fed”) hiked its Fed Funds target 3 times to 1.25-1.5% and long–term rates moved lower due to moderate inflation expectations, demand for duration and low non-U.S. rates. The U.S. Treasury 2-year note yield ended the year at 1.88%, up +70bps. While the 30-year bond yield fell -33 bps to 2.74%. |
| Q. | What were the primary drivers of Fund performance? |
| A. | The most significant positive contributors to the Fund’s performance was strong security selection in investment grade credit and commercial mortgage-backed securities. The non-index exposure to high yield and overweight in investment grade credit also benefited the Fund’s return. A spread widening trade taking advantage of the richness of treasury swaps versus cash treasuries due to past regulation added value in the fourth quarter. Yield curve positioning biased to a steeper yield curve, adverse security selection in residential mortgage-backed securities and a position in CDXHY (high yield credit swap) as a hedge against cash positions all negatively impacted the Fund’s performance. |
| Q. | Were there any significant changes to the Fund’s portfolio during the period? |
| A. | The most significant change to the Fund’s portfolio during the period was the reduction in exposure to residential mortgage-backed securities. The active spread duration in this sector was reduced from neutral to -1.0 years as the Fed announced the rollback of its buying program. The allocation to investment grade credit was gradually increased from +0.35 years active spread duration to +0.50 years by the end of September, then reduced to +0.25 years by yearend as credit spreads continued to tighten and valuations richen. Exposure to asset backed securities was initiated in the fourth quarter to a slight overweight versus the index. |
| 10 | GE RSP Income Fund |
Table of Contents
GE RSP Income Fund
Understanding Your Fund’s Expenses — December 31, 2017 (Unaudited)
As a shareholder of the Fund you incur ongoing costs. Ongoing costs include portfolio management fees, professional fees, administrative fees and other Fund expenses. The following example is intended to help you understand your ongoing costs (in dollars) of investing in the Fund and to compare these costs with the ongoing costs of investing in other mutual funds.
To illustrate these ongoing costs, we have provided an example and calculated the expenses paid by investors in shares of the Fund during the period. The information in the following table is based on an investment of $1,000, which is invested at the beginning of the period and held for the entire six-month period ended December 31, 2017.
Actual Expenses
The first section of the table provides information about actual account values and actual expenses. You may use the information in this section, together with the amount you invested, to estimate the expenses that you paid over the period. To do so, simply divide your account value by $1,000 (for example, an $8,600 account value divided by $1,000 = 8.6), then multiply the result by the number given under the heading “Expenses paid during the period” to estimate the expenses you paid on your account during the period.
Hypothetical Example for Comparison Purposes
The second section of the table provides information about hypothetical account values and hypothetical expenses based on the Fund’s actual expense ratio and an assumed rate of return of 5% per year before expenses, which is not the Fund’s actual return. The hypothetical account values and expenses may not be used to estimate the actual ending account balance or expenses you paid for the period. You may use this information to compare the ongoing costs of investing in the Fund and other funds. To do so, compare this 5% hypothetical example with the 5% hypothetical examples that appear in the shareholders reports of other funds.
Please note that the expenses shown in the table are meant to highlight and help you compare ongoing costs only and do not reflect transaction costs, such as sales charges or redemption fees, if any. Therefore, the second section of the table is useful in comparing ongoing costs only, and will not help you determine the relative total costs of owning different funds.
July 1, 2017 - December 31, 2017
| Actual Fund Return | Hypothetical 5% Return (2.5% for the period) | |||||||
Account value at the beginning of the period | $ | 1,000.00 | $ | 1,000.00 | ||||
Account value at the end of the period | $ | 1,013.60 | $ | 1,024.40 | ||||
Expenses paid during the period* | $ | 0.81 | $ | 0.82 | ||||
| * | Expenses are equal to the Fund’s annualized expense ratio of 0.16% (for the period July 1, 2017-December 31, 2017), multiplied by the average account value over the period, multiplied by 184/365 (to reflect the one-half year period). |
| GE RSP Income Fund | 11 |
Table of Contents
GE RSP Income Fund
Performance Summary — December 31, 2017 (Unaudited)
Morningstar Performance Comparison
Based on average annual returns for periods ended December 31, 2017
| One Year | Five Year | Ten Year | ||||||||||
Number of funds in peer group | 1001 | 911 | 802 | |||||||||
Peer group average annual total return | 3.80 | % | 2.11 | % | 4.07 | % | ||||||
Morningstar Category in peer group: U.S. Intermediate-Term Bond Funds |
| |||||||||||
Quality Ratings
as of December 31, 2017 as a % of Fair Value (a)
Moody’s / S&P /Rating* | Percentage of Fair Value | |||
Aaa / AAA | 9.17 | % | ||
Aa / AA | 54.78 | % | ||
A / A | 8.35 | % | ||
Baa / BBB | 20.17 | % | ||
Ba / BB and lower | 7.33 | % | ||
NR / Other | 0.20 | % | ||
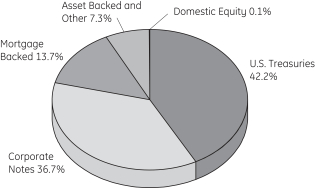
Sector Allocation
Portfolio composition as a % of Investments of $2,391,685 (in thousands) on December 31, 2017 (a)
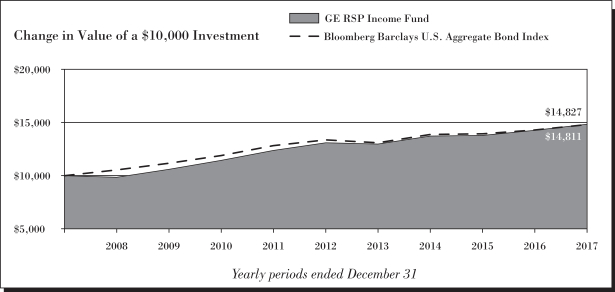
Average Annual Total Return for the periods ended December 31, 2017
Investment Class Shares
| One Year | Five Year | Ten Year | Ending Value of a $10,000 Investment | |||||||||||||
GE RSP Income Fund | 3.99 | % | 2.53 | % | 4.02 | % | $ | 14,827 | ||||||||
Bloomberg Barclays U.S. Aggregate Bond Index | 3.54 | % | 2.10 | % | 4.01 | % | $ | 14,811 | ||||||||
| 12 | GE RSP Income Fund |
Table of Contents
GE RSP Income Fund
Performance Summary, continued — December 31, 2017 (Unaudited)
| (a) | The securities information regarding holdings, allocations and other characteristics is presented to illustrate examples of securities that the Fund has bought and the diversity of areas in which the Fund may invest as of a particular date. It may not be representative of the Fund’s current or future investments and should not be construed as a recommendation to purchase or sell a particular security. |
| * | Moody’s Investors Services, Inc. (“Moody’s”) and S&P Global Ratings (“S&P”) are nationally recognized statistical rating organizations. The quality ratings represent the lower of Moody’s or S&P credit ratings. When a rating from only one of the rating agencies is available, that rating is used. Securities not rated by Moody’s or S&P are categorized as not rated. Credit quality measures a bond issuer’s ability to repay interest and principal in a timely manner. Credit quality ratings assigned by a rating agency are subject to change periodically and are not absolute standards of quality. In formulating investment decisions for the Fund, SSGA Funds Management, Inc. develops its own analysis of the credit quality and risks associated with individual debt instruments, rather than relying exclusively on rating agency ratings. |
See Notes to Performance beginning on page 1 for further information, including an explanation of Morningstar peer categories.
Past performance does not predict future performance. The performance shown in the graphs and tables does not reflect the deduction of taxes that a shareholder would pay on Fund distributions or the redemption of Fund shares and does not reflect the fees or charges that would be associated with variable contracts through which shares of the Fund are offered.
| GE RSP Income Fund | 13 |
Table of Contents
GE RSP Income Fund
Schedule of Investments — December 31, 2017
| Principal Amount ($) or Number of Shares | Fair Value $ | |||||||
| Bonds and Notes - 99.0%† | ||||||||
U.S. Treasuries - 43.3% |
| |||||||
U.S. Treasury Bonds | 51,632,700 | 51,704,985 | ||||||
3.75%, 11/15/43 | 5,615,000 | 6,690,946 | ||||||
4.50%, 02/15/36 | 31,065,500 | 40,007,705 | ||||||
U.S. Treasury Notes | 179,121,700 | 178,106,869 | ||||||
1.25%, 12/31/18 (l) | 49,564,900 | 49,293,782 | ||||||
1.25%, 08/31/19 | 62,557,000 | 61,923,298 | ||||||
1.38%, 12/15/19 (l) | 95,734,800 | 94,796,596 | ||||||
1.50%, 08/15/20 | 65,328,000 | 64,612,005 | ||||||
1.63%, 10/15/20 - 08/31/22 | 94,404,000 | 92,834,130 | ||||||
1.75%, 09/30/22 | 72,441,400 | 70,992,572 | ||||||
1.88%, 10/31/22 - 08/31/24 | 72,424,000 | 70,943,143 | ||||||
2.00%, 02/15/25 | 79,721,700 | 77,932,743 | ||||||
2.13%, 05/15/25 | 61,143,100 | 60,211,889 | ||||||
2.25%, 02/15/27 (l) | 13,559,300 | 13,384,385 | ||||||
2.25%, 08/15/27 | 64,827,400 | 63,925,004 | ||||||
2.38%, 05/15/27 | 12,121,000 | 12,087,788 | ||||||
|
| |||||||
| 1,009,447,840 | ||||||||
|
| |||||||
Agency Mortgage Backed - 10.4% |
| |||||||
Federal Home Loan Mortgage Corp. | 87,324 | 93,245 | ||||||
5.00%, 07/01/35 - 06/01/41 (l) | 6,320,302 | 6,857,565 | ||||||
5.50%, 05/01/20 - 01/01/38 | 1,513,137 | 1,662,897 | ||||||
5.50%, 04/01/39 (l) | 250,759 | 276,177 | ||||||
6.00%, 07/01/19 - 06/01/37 | 1,019,874 | 1,135,475 | ||||||
6.00%, 06/01/33 - 11/01/37 (l) | 2,215,786 | 2,471,730 | ||||||
6.50%, 07/01/29 (l) | 18,842 | 20,871 | ||||||
7.00%, 01/01/27 - 08/01/36 (l) | 689,503 | 749,175 | ||||||
7.50%, 01/01/28 - 09/01/33 (l) | 43,428 | 46,013 | ||||||
8.00%, 11/01/30 (l) | 3,565 | 3,939 | ||||||
8.50%, 04/01/30 (l) | 9,908 | 11,617 | ||||||
Federal National Mortgage Assoc. | 20,390,221 | 20,511,952 | ||||||
3.50%, 11/01/42 - 08/01/45 (l) | 15,672,665 | 16,173,861 | ||||||
4.00%, 05/01/19 | 15,348 | 15,795 | ||||||
4.00%, 06/01/19 - 12/01/41 (l) | 15,167,459 | 15,967,713 | ||||||
4.50%, 05/01/18 - 01/01/41 (l) | 30,605,983 | 32,799,709 | ||||||
5.00%, 07/01/20 - 06/01/41 (l) | 10,492,139 | 11,375,537 | ||||||
5.50%, 06/01/20 - 01/01/39 (l) | 8,871,917 | 9,751,911 | ||||||
5.50%, 11/01/35 | 710,082 | 787,407 | ||||||
6.00%, 05/01/19 - 05/01/41 (l) | 15,286,217 | 16,967,755 | ||||||
6.50%, 01/01/19 - 08/01/36 (l) | 665,156 | 738,387 | ||||||
7.00%, 10/01/32 - 02/01/34 (l) | 48,432 | 50,147 | ||||||
7.50%, 11/01/22 - 12/01/33 (l) | 343,822 | 372,382 | ||||||
8.00%, 06/01/24 - 10/01/31 (l) | 126,040 | 135,822 | ||||||
| Principal Amount ($) or Number of Shares | Fair Value $ | |||||||
8.50%, 04/01/30 (l) | 24,006 | 29,344 | ||||||
9.00%, 03/01/18 - 12/01/22 (l) | 30,520 | 32,023 | ||||||
Federal National Mortgage Assoc. 1.60% + 12 month USD LIBOR | 17,717 | 18,203 | ||||||
Federal National Mortgage Assoc. TBA | 32,546,291 | 32,926,358 | ||||||
3.50%, TBA (c) | 26,720,320 | 27,573,233 | ||||||
Government National Mortgage Assoc. | 16,175,137 | 17,062,876 | ||||||
4.50%, 08/15/33 - 03/20/41 (l) | 6,582,247 | 7,019,093 | ||||||
4.50%, 09/15/34 | 218,867 | 232,366 | ||||||
5.00%, 08/15/33 (l) | 351,794 | 380,493 | ||||||
6.00%, 04/15/27 - 09/15/36 (l) | 977,950 | 1,113,367 | ||||||
6.50%, 04/15/19 - 08/15/27 | 33,631 | 36,805 | ||||||
6.50%, 01/15/24 - 09/15/36 (l) | 781,281 | 865,860 | ||||||
7.00%, 03/15/26 - 10/15/36 (l) | 483,488 | 517,323 | ||||||
7.00%, 10/15/27 | 4,807 | 5,279 | ||||||
7.50%, 11/15/22 - 11/15/31 (l) | 77,141 | 80,096 | ||||||
7.50%, 02/15/28 - 10/15/28 | 103,724 | 108,961 | ||||||
8.00%, 12/15/29 - 05/15/30 (l) | 1,370 | 1,443 | ||||||
9.00%, 06/15/18 - 12/15/19 (l) | 13,057 | 13,104 | ||||||
9.00%, 11/15/19 - 12/15/21 | 17,402 | 18,288 | ||||||
Government National Mortgage Assoc. 1.50% + 1 year CMT | 7,240 | 7,336 | ||||||
2.38%, 01/20/24 - 03/20/24 (h) | 2,543 | 2,604 | ||||||
2.63%, 05/20/21 - 04/20/24 (h) | 2,118 | 2,160 | ||||||
2.75%, 08/20/23 - 09/20/24 (h) | 3,417 | 3,474 | ||||||
Government National Mortgage Assoc. TBA | 12,587,000 | 13,533,417 | ||||||
5.50%, TBA (c) | 1,900,000 | 2,081,009 | ||||||
|
| |||||||
| 242,641,597 | ||||||||
|
| |||||||
Agency Collateralized Mortgage Obligations - 0.2% |
| |||||||
Federal Home Loan Mortgage Corp. | 6,679,335 | 14,002 | ||||||
Federal Home Loan Mortgage Corp. REMIC | 3,760,586 | 273,503 | ||||||
5.50%, 06/15/33 (g) | 289,116 | 57,650 | ||||||
7.50%, 07/15/27 (g) | 13,181 | 2,004 | ||||||
Federal Home Loan Mortgage Corp. REMIC 6.60% - 1 month USD LIBOR | 1,452,322 | 109,025 | ||||||
See Notes to Schedules of Investments and Notes to Financial Statements.
| 14 | GE RSP Income Fund |
Table of Contents
GE RSP Income Fund
Schedule of Investments, continued — December 31, 2017
| Principal Amount ($) or Number of Shares | Fair Value $ | |||||||
Federal Home Loan Mortgage Corp. STRIPS | 8,715 | 8,031 | ||||||
8.00%, 02/01/23 - 07/01/24 (g) | 28,480 | 4,488 | ||||||
Federal National Mortgage Assoc. REMIC | 15,703 | 15,400 | ||||||
1.19%, 12/25/42 (g)(h) | 1,004,498 | 40,685 | ||||||
5.00%, 02/25/40 - 09/25/40 (g) | 1,616,533 | 186,941 | ||||||
8.00%, 05/25/22 (g) | 28 | 395 | ||||||
Federal National Mortgage Assoc. REMIC 6.00% - 1 month USD LIBOR | 5,505,305 | 947,112 | ||||||
Federal National Mortgage Assoc. REMIC 6.60% - 1 month USD LIBOR | 9,658,097 | 2,033,559 | ||||||
Federal National Mortgage Assoc. REMIC 7.50% - 1 month USD LIBOR | 234 | 1 | ||||||
Federal National Mortgage Assoc. STRIPS | 286,425 | 245,754 | ||||||
4.50% 08/25/35 - 01/25/36 (g) | 730,993 | 133,745 | ||||||
5.00%, 03/25/38 - 05/25/38 (g) | 399,492 | 76,001 | ||||||
5.50%, 12/25/33 (g) | 108,669 | 23,920 | ||||||
6.00%, 01/25/35 (g) | 418,133 | 82,663 | ||||||
7.50%, 11/25/23 (g) | 104,298 | 15,342 | ||||||
8.00%, 08/25/23 - 07/25/24 (g) | 56,720 | 10,673 | ||||||
8.50%, 07/25/22 (g) | 17,341 | 1,869 | ||||||
9.00%, 05/25/22 (g) | 14,997 | 1,532 | ||||||
Government National Mortgage Assoc. REMIC | 1,292,259 | 81,749 | ||||||
5.00%, 01/20/38 - 09/20/38 (g) | 449,269 | 14,608 | ||||||
Government National Mortgage Assoc. REMIC 6.80% - 1 month USD LIBOR | 2,357,079 | 390,001 | ||||||
|
| |||||||
| 4,770,653 | ||||||||
|
| |||||||
Asset Backed - 2.4% |
| |||||||
American Express Credit Account Master Trust 2017-6 | 13,794,124 | 13,719,525 | ||||||
BA Credit Card Trust 2017-A2 | 13,380,000 | 13,241,173 | ||||||
Chase Funding Trust 2004-1 | 842,759 | 871,584 | ||||||
| Principal Amount ($) or Number of Shares | Fair Value $ | |||||||
Citibank Credit Card Issuance Trust 2014-A6 | 6,666,000 | 6,672,647 | ||||||
Citibank Credit Card Issuance Trust 2016-A1 | 16,512,000 | 16,399,025 | ||||||
Citibank Credit Card Issuance Trust 2017-A8 | 5,078,000 | 5,029,020 | ||||||
Irwin Home Equity Loan Trust 2006-2 0.15% + 1 month USD LIBOR | 69,387 | 63,758 | ||||||
|
| |||||||
| 55,996,732 | ||||||||
|
| |||||||
Corporate Notes - 37.7% |
| |||||||
21st Century Fox America Inc. | 331,000 | 337,819 | ||||||
4.75%, 11/15/46 | 201,000 | 231,996 | ||||||
6.65%, 11/15/37 | 1,484,000 | 2,043,171 | ||||||
Abbott Laboratories | 2,927,000 | 2,957,265 | ||||||
3.75%, 11/30/26 | 2,047,000 | 2,101,839 | ||||||
4.90%, 11/30/46 | 879,000 | 1,009,795 | ||||||
AbbVie Inc. | ||||||||
2.00%, 11/06/18 (l) | 2,018,000 | 2,017,213 | ||||||
3.20%, 05/14/26 (l) | 2,049,000 | 2,043,877 | ||||||
4.45%, 05/14/46 (l) | 681,000 | 739,157 | ||||||
4.70%, 05/14/45 (l) | 539,000 | 604,510 | ||||||
Acadia Healthcare Company Inc. | 1,706,000 | 1,782,770 | ||||||
AES Corp. | 2,936,000 | 2,998,390 | ||||||
Aetna Inc. | 1,840,000 | 1,871,446 | ||||||
Aflac Inc. | 745,000 | 779,322 | ||||||
Agrium Inc. | 693,000 | 773,000 | ||||||
Alibaba Group Holding Ltd. | 1,683,000 | 1,679,348 | ||||||
3.40%, 12/06/27 | 2,448,000 | 2,446,458 | ||||||
4.00%, 12/06/37 | 848,000 | 876,349 | ||||||
4.20%, 12/06/47 | 848,000 | 882,251 | ||||||
4.40%, 12/06/57 | 848,000 | 885,278 | ||||||
4.50%, 11/28/34 (l) | 1,149,000 | 1,270,484 | ||||||
Alimentation Couche-Tard Inc. | 1,968,000 | 1,948,733 | ||||||
3.55%, 07/26/27 (b) | 1,968,000 | 1,964,340 | ||||||
4.50%, 07/26/47 (b) | 562,000 | 588,307 | ||||||
Allergan Funding SCS | 1,354,000 | 1,366,159 | ||||||
See Notes to Schedules of Investments and Notes to Financial Statements.
| GE RSP Income Fund | 15 |
Table of Contents
GE RSP Income Fund
Schedule of Investments, continued — December 31, 2017
| Principal Amount ($) or Number of Shares | Fair Value $ | |||||||
3.45%, 03/15/22 (l) | 1,486,000 | 1,509,360 | ||||||
3.80%, 03/15/25 (l) | 1,033,000 | 1,051,336 | ||||||
4.55%, 03/15/35 (l) | 560,000 | 589,411 | ||||||
4.75%, 03/15/45 (l) | 536,000 | 571,585 | ||||||
Altria Group Inc. | 1,348,000 | 1,357,557 | ||||||
3.88%, 09/16/46 (l) | 30,000 | 29,844 | ||||||
4.50%, 05/02/43 (l) | 727,000 | 790,278 | ||||||
Amazon.com Inc. | 1,109,000 | 1,105,873 | ||||||
3.15%, 08/22/27 (b) | 1,048,000 | 1,052,485 | ||||||
3.88%, 08/22/37 (b) | 1,151,000 | 1,221,775 | ||||||
4.05%, 08/22/47 (b) | 734,000 | 788,052 | ||||||
4.25%, 08/22/57 (b) | 1,255,000 | 1,373,146 | ||||||
AMC Networks Inc. | 90,000 | 89,100 | ||||||
America Movil SAB de C.V. | 1,469,000 | 1,487,994 | ||||||
5.00%, 03/30/20 (l) | 2,443,000 | 2,576,070 | ||||||
American Axle & Manufacturing Inc. | 1,389,000 | 1,461,922 | ||||||
6.50%, 04/01/27 (b)(l) | 694,000 | 732,170 | ||||||
6.63%, 10/15/22 (l) | 717,000 | 743,439 | ||||||
American Campus Communities Operating Partnership LP | 1,288,000 | 1,313,296 | ||||||
4.13%, 07/01/24 (l) | 980,000 | 1,019,661 | ||||||
American Electric Power Company Inc. | 2,483,000 | 2,517,712 | ||||||
American Express Co. | 1,132,000 | 1,128,491 | ||||||
American International Group Inc. | 1,411,000 | 1,527,450 | ||||||
4.80%, 07/10/45 (l) | 455,000 | 511,566 | ||||||
American Tower Corp. (REIT) | 677,000 | 665,241 | ||||||
3.40%, 02/15/19 (l) | 3,556,000 | 3,595,401 | ||||||
American Water Capital Corp. | 1,705,000 | 1,687,643 | ||||||
Amgen Inc. | 3,092,000 | 3,092,495 | ||||||
2.65%, 05/11/22 | 1,958,000 | 1,951,793 | ||||||
3.20%, 11/02/27 | 3,232,000 | 3,230,287 | ||||||
4.56%, 06/15/48 (l) | 1,021,000 | 1,141,233 | ||||||
Amkor Technology Inc. | 1,695,000 | 1,713,009 | ||||||
Anadarko Petroleum Corp. | 154,000 | 162,736 | ||||||
6.20%, 03/15/40 (l) | 881,000 | 1,063,667 | ||||||
6.60%, 03/15/46 (l) | 171,000 | 219,102 | ||||||
| Principal Amount ($) or Number of Shares | Fair Value $ | |||||||
Andeavor Logistics LP/Tesoro Logistics Finance Corp. | 1,773,000 | 1,789,471 | ||||||
5.20%, 12/01/47 | 532,000 | 552,503 | ||||||
5.25%, 01/15/25 | 5,660,000 | 5,953,612 | ||||||
Anheuser-Busch InBev Finance Inc. | 999,000 | 1,004,854 | ||||||
3.65%, 02/01/26 (l) | 1,825,000 | 1,883,035 | ||||||
4.70%, 02/01/36 (l) | 835,000 | 936,068 | ||||||
4.90%, 02/01/46 (l) | 1,383,000 | 1,602,717 | ||||||
Anheuser-Busch InBev Worldwide Inc. | 2,513,000 | 2,494,152 | ||||||
Anthem Inc. | 1,514,000 | 1,536,362 | ||||||
Apache Corp. | 864,000 | 927,970 | ||||||
Apple Inc. | 887,000 | 888,056 | ||||||
2.85%, 05/11/24 | 1,958,000 | 1,965,088 | ||||||
3.35%, 02/09/27 (l) | 1,001,000 | 1,024,413 | ||||||
3.45%, 02/09/45 (l) | 760,000 | 742,292 | ||||||
3.85%, 08/04/46 (l) | 2,558,000 | 2,662,980 | ||||||
4.25%, 02/09/47 (l) | 303,000 | 336,263 | ||||||
4.65%, 02/23/46 (l) | 331,000 | 387,472 | ||||||
Applied Materials Inc. | 526,000 | 534,411 | ||||||
4.35%, 04/01/47 | 584,000 | 655,172 | ||||||
Aptiv PLC | 788,000 | 816,526 | ||||||
Aramark Services Inc. | 1,619,000 | 1,696,914 | ||||||
Archer-Daniels-Midland Co. | 1,391,000 | 1,324,427 | ||||||
Arconic Inc. | 715,000 | 769,519 | ||||||
Ardagh Packaging Finance PLC/Ardagh Holdings USA Inc. | 1,350,000 | 1,373,625 | ||||||
Ascension Health | 649,000 | 757,597 | ||||||
AstraZeneca PLC | 565,000 | 563,802 | ||||||
3.13%, 06/12/27 (l) | 695,000 | 690,281 | ||||||
3.38%, 11/16/25 (l) | 943,000 | 960,625 | ||||||
AT&T Inc. | 1,510,000 | 1,507,237 | ||||||
2.85%, 02/14/23 | 1,257,000 | 1,261,299 | ||||||
3.00%, 06/30/22 (l) | 899,000 | 900,483 | ||||||
3.40%, 08/14/24 | 950,000 | 954,579 | ||||||
3.90%, 08/14/27 | 615,000 | 618,450 | ||||||
See Notes to Schedules of Investments and Notes to Financial Statements.
| 16 | GE RSP Income Fund |
Table of Contents
GE RSP Income Fund
Schedule of Investments, continued — December 31, 2017
| Principal Amount ($) or Number of Shares | Fair Value $ | |||||||
4.45%, 04/01/24 (l) | 1,346,000 | 1,422,305 | ||||||
4.50%, 05/15/35 (l) | 1,460,000 | 1,449,284 | ||||||
4.75%, 05/15/46 | 1,050,000 | 1,027,110 | ||||||
4.80%, 06/15/44 (l) | 1,160,000 | 1,142,449 | ||||||
4.90%, 08/14/37 | 1,572,000 | 1,590,439 | ||||||
5.15%, 02/14/50 | 2,362,000 | 2,382,243 | ||||||
5.25%, 03/01/37 (l) | 1,263,000 | 1,337,176 | ||||||
5.30%, 08/14/58 | 944,000 | 947,785 | ||||||
5.45%, 03/01/47 (l) | 1,578,000 | 1,690,748 | ||||||
Avangrid Inc. | 2,482,000 | 2,473,834 | ||||||
Baidu Inc. | 911,000 | 902,728 | ||||||
3.63%, 07/06/27 | 801,000 | 793,775 | ||||||
Bank of America Corp. | 2,328,000 | 2,343,435 | ||||||
3.95%, 04/21/25 (l) | 1,767,000 | 1,826,495 | ||||||
4.25%, 10/22/26 (l) | 777,000 | 818,756 | ||||||
Bank of America Corp. (2.37% fixed rate until 07/21/20; 0.66% + 3 month USD LIBOR thereafter) | 1,570,000 | 1,566,546 | ||||||
Bank of America Corp. (3.12%, fixed rate until 01/20/22; 1.16% + 3 month USD LIBOR thereafter) | 2,230,000 | 2,260,774 | ||||||
Bank of America Corp. (3.42%, fixed rate until 12/20/27; 1.04% + 3 month USD LIBOR thereafter) | 2,134,000 | 2,131,226 | ||||||
Bank of America Corp. (4.24% fixed rate until 04/24/37; 1.81% + 3 month USD LIBOR thereafter) | 2,340,000 | 2,536,583 | ||||||
Bank of America Corp. (4.44% fixed rate until 01/20/47; 1.99% + 3 month USD LIBOR thereafter) | 524,000 | 588,138 | ||||||
Bank of America Corp. (8.00% fixed rate until 01/30/18; 3.63% + 3 month USD LIBOR thereafter) | 3,646,000 | 3,661,824 | ||||||
Barclays PLC | 633,000 | 655,263 | ||||||
4.38%, 01/12/26 (l) | 1,513,000 | 1,576,198 | ||||||
4.84%, 05/09/28 | 478,000 | 496,981 | ||||||
5.25%, 08/17/45 (l) | 676,000 | 786,526 | ||||||
| Principal Amount ($) or Number of Shares | Fair Value $ | |||||||
Barrick North America Finance LLC | 328,000 | 401,147 | ||||||
BAT Capital Corp. | 1,572,000 | 1,562,914 | ||||||
2.76%, 08/15/22 (b) | 1,572,000 | 1,561,499 | ||||||
3.56%, 08/15/27 (b) | 1,220,000 | 1,221,220 | ||||||
4.39%, 08/15/37 (b) | 733,000 | 769,174 | ||||||
4.54%, 08/15/47 (b) | 1,143,000 | 1,206,448 | ||||||
Baxalta Inc. | 1,435,000 | 1,443,466 | ||||||
Becton Dickinson and Co. | 1,398,000 | 1,389,742 | ||||||
3.70%, 06/06/27 (l) | 2,386,000 | 2,403,274 | ||||||
3.73%, 12/15/24 (l) | 104,000 | 106,311 | ||||||
4.67%, 06/06/47 (l) | 418,000 | 451,114 | ||||||
4.69%, 12/15/44 (l) | 69,000 | 75,623 | ||||||
Berkshire Hathaway Energy Co. | 808,000 | 1,083,617 | ||||||
Berkshire Hathaway Inc. | 462,000 | 530,002 | ||||||
Berry Global Inc. | 2,045,000 | 2,126,800 | ||||||
BHP Billiton Finance USA Ltd. | 518,000 | 634,281 | ||||||
Biogen Inc. | 546,000 | 553,884 | ||||||
BNP Paribas S.A. (5.13% fixed rate until 11/15/27; 2.84% + USD 5 year Swap Rate thereafter) | 1,000,000 | 998,770 | ||||||
BP Capital Markets PLC | 1,354,000 | 1,351,933 | ||||||
3.22%, 11/28/23 (l) | 1,463,000 | 1,496,444 | ||||||
3.28%, 09/19/27 | 2,196,000 | 2,222,923 | ||||||
Braskem Netherlands Finance BV | 1,519,000 | 1,493,359 | ||||||
4.50%, 01/10/28 (b) | 1,129,000 | 1,114,933 | ||||||
Brighthouse Financial Inc. | 221,000 | 217,020 | ||||||
4.70%, 06/22/47 (b)(l) | 119,000 | 121,304 | ||||||
Brixmor Operating Partnership LP | 1,185,000 | 1,174,098 | ||||||
Broadcom Corp./Broadcom Cayman Finance Ltd. | 650,000 | 635,056 | ||||||
2.65%, 01/15/23 (b) | 541,000 | 521,286 | ||||||
3.13%, 01/15/25 (b) | 671,000 | 641,617 | ||||||
3.88%, 01/15/27 (b)(l) | 249,000 | 245,646 | ||||||
Buckeye Partners LP | 887,000 | 932,370 | ||||||
See Notes to Schedules of Investments and Notes to Financial Statements.
| GE RSP Income Fund | 17 |
Table of Contents
GE RSP Income Fund
Schedule of Investments, continued — December 31, 2017
| Principal Amount ($) or Number of Shares | Fair Value $ | |||||||
Bunge Limited Finance Corp. | 1,574,000 | 1,550,327 | ||||||
Burlington Northern Santa Fe LLC | 1,011,000 | 1,061,843 | ||||||
Canadian Natural Resources Ltd. | 516,000 | 526,093 | ||||||
4.95%, 06/01/47 (l) | 399,000 | 447,658 | ||||||
Capital One Financial Corp. | 1,866,000 | 1,919,722 | ||||||
Capital One NA | 1,340,000 | 1,341,662 | ||||||
Cardinal Health Inc. | 695,000 | 683,234 | ||||||
3.08%, 06/15/24 (l) | 839,000 | 826,105 | ||||||
3.41%, 06/15/27 (l) | 379,000 | 371,651 | ||||||
4.37%, 06/15/47 (l) | 351,000 | 349,663 | ||||||
Carlson Travel Inc. | 2,075,000 | 1,877,875 | ||||||
Caterpillar Financial Services Corp. | 2,452,000 | 2,440,549 | ||||||
Caterpillar Inc. | 878,000 | 1,003,115 | ||||||
Catholic Health Initiatives | 1,030,000 | 1,033,275 | ||||||
4.35%, 11/01/42 | 1,029,000 | 979,176 | ||||||
CBL & Associates LP | 239,000 | 222,554 | ||||||
CBS Corp. | 1,511,000 | 1,472,409 | ||||||
2.90%, 01/15/27 (l) | 833,000 | 781,346 | ||||||
CCO Holdings LLC/CCO Holdings Capital Corp. | 1,444,000 | 1,505,370 | ||||||
Celgene Corp. | 1,615,000 | 1,615,711 | ||||||
4.35%, 11/15/47 | 745,000 | 775,985 | ||||||
5.00%, 08/15/45 (l) | 799,000 | 908,799 | ||||||
Cenovus Energy Inc. | 279,000 | 293,368 | ||||||
CenterPoint Energy Inc. | 1,572,000 | 1,551,627 | ||||||
CenturyLink Inc. | 2,712,000 | 2,652,065 | ||||||
Cequel Communications Holdings I LLC/Cequel Capital Corp. | 2,467,000 | 2,473,167 | ||||||
CF Industries Inc. | 1,426,000 | 1,554,340 | ||||||
| Principal Amount ($) or Number of Shares | Fair Value $ | |||||||
Charter Communications Operating LLC/Charter Communications Operating Capital | 2,034,000 | 2,065,527 | ||||||
4.91%, 07/23/25 (l) | 2,034,000 | 2,160,495 | ||||||
5.38%, 05/01/47 | 682,000 | 703,435 | ||||||
6.38%, 10/23/35 (l) | 269,000 | 314,859 | ||||||
6.48%, 10/23/45 (l) | 539,000 | 631,298 | ||||||
Chevron Corp. | 1,347,000 | 1,383,167 | ||||||
Church & Dwight Company Inc. | 843,000 | 831,544 | ||||||
3.15%, 08/01/27 | 1,404,000 | 1,380,258 | ||||||
Cigna Corp. | 1,379,000 | 1,384,226 | ||||||
3.88%, 10/15/47 | 941,000 | 941,508 | ||||||
Cimarex Energy Co. | 974,000 | 997,405 | ||||||
Cinemark USA Inc. | 1,452,000 | 1,470,150 | ||||||
Cisco Systems Inc. | 1,462,000 | 1,414,660 | ||||||
Citigroup Inc. | 1,426,000 | 1,424,811 | ||||||
2.05%, 12/07/18 (l) | 2,682,000 | 2,679,264 | ||||||
2.70%, 10/27/22 | 1,577,000 | 1,562,271 | ||||||
2.90%, 12/08/21 | 1,570,000 | 1,578,180 | ||||||
4.40%, 06/10/25 | 974,000 | 1,028,885 | ||||||
4.45%, 09/29/27 (l) | 2,368,000 | 2,501,082 | ||||||
4.65%, 07/30/45 (l) | 460,000 | 523,245 | ||||||
4.75%, 05/18/46 | 970,000 | 1,073,208 | ||||||
Citigroup Inc. (2.88% fixed rate until 07/24/22; 0.95% + 3 month USD LIBOR thereafter) | 1,411,000 | 1,403,042 | ||||||
Citigroup Inc. (4.28% fixed rate until 04/24/47; 1.84% + 3 month USD LIBOR thereafter) | 1,461,000 | 1,588,005 | ||||||
CMS Energy Corp. | 1,566,000 | 1,831,108 | ||||||
CNA Financial Corp. | 943,000 | 928,968 | ||||||
5.88%, 08/15/20 (l) | 2,533,000 | 2,727,788 | ||||||
CNOOC Nexen Finance 2014 ULC | 2,718,000 | 2,868,876 | ||||||
Columbia Pipeline Group Inc. | 935,000 | 947,707 | ||||||
Comcast Corp. | 771,000 | 790,846 | ||||||
See Notes to Schedules of Investments and Notes to Financial Statements.
| 18 | GE RSP Income Fund |
Table of Contents
GE RSP Income Fund
Schedule of Investments, continued — December 31, 2017
| Principal Amount ($) or Number of Shares | Fair Value $ | |||||||
3.97%, 11/01/47 | 630,000 | 647,766 | ||||||
4.20%, 08/15/34 (l) | 1,358,000 | 1,453,671 | ||||||
4.60%, 08/15/45 (l) | 1,355,000 | 1,526,706 | ||||||
Concho Resources Inc. | 471,000 | 475,988 | ||||||
4.88%, 10/01/47 | 629,000 | 686,208 | ||||||
ConocoPhillips Co. | 804,000 | 829,431 | ||||||
5.95%, 03/15/46 (l) | 292,000 | 393,835 | ||||||
Consolidated Edison Company of New York Inc. | 1,447,000 | 1,417,957 | ||||||
Constellation Brands Inc. | 1,397,000 | 1,387,498 | ||||||
4.50%, 05/09/47 (l) | 418,000 | 456,878 | ||||||
Continental Resources Inc. | 713,000 | 723,695 | ||||||
Corning Inc. | 808,000 | 802,021 | ||||||
Corporation Andina de Fomento | 1,710,000 | 1,697,962 | ||||||
4.38%, 06/15/22 (l) | 4,326,000 | 4,609,180 | ||||||
Costco Wholesale Corp. | 632,000 | 632,904 | ||||||
Credit Suisse AG | 3,012,000 | 3,009,759 | ||||||
Credit Suisse Group AG | 1,096,000 | 1,142,689 | ||||||
Credit Suisse Group Funding Guernsey Ltd. | 1,407,000 | 1,424,897 | ||||||
3.80%, 06/09/23 (l) | 1,437,000 | 1,481,101 | ||||||
CRH America Finance Inc. | 739,000 | 738,832 | ||||||
CSX Corp. | 836,000 | 892,756 | ||||||
CVS Health Corp. | 931,000 | 958,986 | ||||||
5.13%, 07/20/45 (l) | 930,000 | 1,065,668 | ||||||
D.R. Horton Inc. | 1,751,000 | 1,748,881 | ||||||
Daimler Finance North America LLC | 6,943,000 | 6,957,650 | ||||||
Dana Financing Luxembourg Sarl | 1,945,000 | 2,107,894 | ||||||
Danaher Corp. | 724,000 | 817,056 | ||||||
Dell International LLC/EMC Corp. | 2,931,000 | 2,967,256 | ||||||
5.45%, 06/15/23 (b) | 1,400,000 | 1,511,328 | ||||||
| Principal Amount ($) or Number of Shares | Fair Value $ | |||||||
6.02%, 06/15/26 (b)(l) | 730,000 | 804,511 | ||||||
8.35%, 07/15/46 (b)(l) | 600,000 | 773,784 | ||||||
Deutsche Bank AG | 1,407,000 | 1,401,062 | ||||||
3.30%, 11/16/22 | 1,760,000 | 1,752,784 | ||||||
3.70%, 05/30/24 | 848,000 | 853,800 | ||||||
Deutsche Telekom International Finance BV | 1,363,000 | 1,320,458 | ||||||
Devon Energy Corp. | 625,000 | 699,325 | ||||||
5.85%, 12/15/25 (l) | 557,000 | 650,320 | ||||||
Dexia Credit Local S.A. | 6,894,000 | 6,901,433 | ||||||
Diageo Investment Corp. | 1,491,000 | 1,511,755 | ||||||
Discover Bank | 2,108,000 | 2,130,598 | ||||||
Discovery Communications LLC | 1,705,000 | 1,697,191 | ||||||
3.95%, 03/20/28 | 1,705,000 | 1,691,616 | ||||||
5.00%, 09/20/37 | 680,000 | 703,467 | ||||||
5.20%, 09/20/47 | 680,000 | 708,594 | ||||||
Dollar General Corp. | 3,006,000 | 3,004,261 | ||||||
Dominion Energy Inc. | 1,098,000 | 1,097,693 | ||||||
3.63%, 12/01/24 (l) | 1,254,000 | 1,297,113 | ||||||
DTE Energy Co. | 1,007,000 | 967,324 | ||||||
Duke Energy Corp. | 1,005,000 | 995,734 | ||||||
Duke Energy Progress LLC | 931,000 | 1,018,961 | ||||||
Duke Realty LP | 1,750,000 | 1,756,125 | ||||||
Duquesne Light Holdings Inc. | 1,577,000 | 1,575,644 | ||||||
Eastman Chemical Co. | 603,000 | 621,494 | ||||||
Eaton Corp. | 1,570,000 | 1,541,850 | ||||||
Ecolab Inc. | 1,064,000 | 1,062,638 | ||||||
3.95%, 12/01/47 (b) | 621,000 | 635,507 | ||||||
Ecopetrol S.A. | 1,031,000 | 1,059,383 | ||||||
EI du Pont de Nemours & Co. 0.53% + 3 month USD LIBOR | 1,509,000 | 1,518,478 | ||||||
Electricite de France S.A. | 3,444,000 | 3,444,431 | ||||||
See Notes to Schedules of Investments and Notes to Financial Statements.
| GE RSP Income Fund | 19 |
Table of Contents
GE RSP Income Fund
Schedule of Investments, continued — December 31, 2017
| Principal Amount ($) or Number of Shares | Fair Value $ | |||||||
Eli Lilly & Co. | 694,000 | 704,452 | ||||||
3.70%, 03/01/45 (l) | 269,000 | 277,508 | ||||||
3.95%, 05/15/47 (l) | 418,000 | 449,743 | ||||||
EMC Corp. | 3,569,000 | 3,519,926 | ||||||
Emera US Finance LP | 1,198,000 | 1,201,055 | ||||||
4.75%, 06/15/46 (l) | 338,000 | 371,290 | ||||||
Enbridge Energy Partners LP | 250,000 | 273,845 | ||||||
Encana Corp. | 1,461,000 | 1,498,438 | ||||||
Endo Dac/Endo Finance LLC/Endo Finco Inc. | 2,075,000 | 2,111,312 | ||||||
Enel Finance International N.V. | 1,211,000 | 1,203,194 | ||||||
Energy Transfer Equity LP | 5,497,000 | 5,778,721 | ||||||
Energy Transfer LP | 681,000 | 675,436 | ||||||
6.50%, 02/01/42 (l) | 1,437,000 | 1,623,350 | ||||||
Energy Transfer LP/Regency Energy Finance Corp. | 1,170,000 | 1,208,867 | ||||||
Entergy Louisiana LLC | 1,007,000 | 975,179 | ||||||
Enterprise Products Operating LLC | 1,944,000 | 2,023,646 | ||||||
Envision Healthcare Corp. | 2,331,000 | 2,409,671 | ||||||
EOG Resources Inc. | 2,467,000 | 2,626,294 | ||||||
EQT Corp. | 630,000 | 623,228 | ||||||
3.90%, 10/01/27 | 933,000 | 929,828 | ||||||
ERP Operating LP | 607,000 | 665,260 | ||||||
Exelon Corp. | 1,079,000 | 1,098,724 | ||||||
4.45%, 04/15/46 (l) | 1,474,000 | 1,597,713 | ||||||
Express Scripts Holding Co. | 1,465,000 | 1,435,803 | ||||||
4.80%, 07/15/46 (l) | 439,000 | 466,885 | ||||||
Exxon Mobil Corp. | 928,000 | 927,230 | ||||||
3.04%, 03/01/26 (l) | 742,000 | 753,115 | ||||||
FirstEnergy Corp. | 943,000 | 966,754 | ||||||
4.85%, 07/15/47 | 330,000 | 366,475 | ||||||
| Principal Amount ($) or Number of Shares | Fair Value $ | |||||||
Florida Power & Light Co. | 873,000 | 962,806 | ||||||
Ford Motor Co. | 1,537,000 | 1,605,581 | ||||||
Ford Motor Credit Company LLC | 1,999,000 | 2,012,813 | ||||||
Freeport-McMoRan Inc. | 2,142,000 | 2,128,720 | ||||||
Frontier Communications Corp. | 3,333,000 | 3,191,347 | ||||||
General Dynamics Corp. | 677,000 | 634,572 | ||||||
General Motors Co. | 269,000 | 284,067 | ||||||
General Motors Financial Company Inc. | 1,904,000 | 1,924,167 | ||||||
3.20%, 07/13/20 (l) | 118,000 | 119,477 | ||||||
5.25%, 03/01/26 (l) | 1,473,000 | 1,617,236 | ||||||
Georgia-Pacific LLC | 552,000 | 567,303 | ||||||
Gilead Sciences Inc. | 881,000 | 859,900 | ||||||
2.95%, 03/01/27 | 707,000 | 695,207 | ||||||
3.65%, 03/01/26 (l) | 1,053,000 | 1,092,793 | ||||||
4.15%, 03/01/47 (l) | 868,000 | 923,595 | ||||||
4.80%, 04/01/44 (l) | 614,000 | 711,442 | ||||||
Glencore Finance Canada Ltd. | 374,000 | 413,249 | ||||||
Glencore Funding LLC | 973,000 | 963,679 | ||||||
4.00%, 03/27/27 (b)(l) | 959,000 | 962,853 | ||||||
Grupo Televisa SAB | 382,000 | 389,292 | ||||||
H&E Equipment Services Inc. | 185,000 | 193,787 | ||||||
Halliburton Co. | 1,360,000 | 1,410,470 | ||||||
5.00%, 11/15/45 (l) | 815,000 | 934,846 | ||||||
HCA Inc. | 4,352,000 | 4,504,320 | ||||||
Hess Corp. | 358,000 | 357,878 | ||||||
5.60%, 02/15/41 (l) | 397,000 | 427,001 | ||||||
5.80%, 04/01/47 (l) | 250,000 | 277,920 | ||||||
Hewlett Packard Enterprise Co. | 440,000 | 469,190 | ||||||
Hilcorp Energy I LP/Hilcorp Finance Co. | 1,595,000 | 1,634,875 | ||||||
Honeywell International Inc. | 816,000 | 790,247 | ||||||
See Notes to Schedules of Investments and Notes to Financial Statements.
| 20 | GE RSP Income Fund |
Table of Contents
GE RSP Income Fund
Schedule of Investments, continued — December 31, 2017
| Principal Amount ($) or Number of Shares | Fair Value $ | |||||||
HSBC Holdings PLC | 2,590,000 | 2,608,803 | ||||||
4.25%, 03/14/24 (l) | 1,025,000 | 1,069,485 | ||||||
HSBC Holdings PLC (3.26% fixed rate until 03/13/22; 1.06% + 3 month USD LIBOR thereafter) | 2,983,000 | 3,022,465 | ||||||
HSBC Holdings PLC (6.00% fixed rate until 05/22/27; 3.75% + USD 5 year Mid-Market Swap Rate thereafter) | 2,028,000 | 2,131,935 | ||||||
Hyundai Capital America | 762,000 | 757,938 | ||||||
Icahn Enterprises LP/Icahn Enterprises Finance Corp. | 2,142,000 | 2,198,977 | ||||||
ING Bank N.V. | 1,400,000 | 1,406,289 | ||||||
Ingersoll-Rand Luxembourg Finance S.A. | 1,898,000 | 1,959,020 | ||||||
Intel Corp. | 2,465,000 | 2,409,316 | ||||||
2.88%, 05/11/24 (l) | 1,388,000 | 1,400,214 | ||||||
International Business Machines Corp. | 542,000 | 554,141 | ||||||
3.63%, 02/12/24 | 1,308,000 | 1,368,874 | ||||||
International Paper Co. | 1,357,000 | 1,425,922 | ||||||
Interstate Power & Light Co. | 3,116,000 | 3,162,499 | ||||||
Intesa Sanpaolo S.p.A. | 1,412,000 | 1,410,828 | ||||||
IPALCO Enterprises Inc. | 180,000 | 179,411 | ||||||
j2 Cloud Services LLC/j2 Global Co-Obligor Inc. | 1,274,000 | 1,340,885 | ||||||
JB Poindexter & Company Inc. | 771,000 | 799,912 | ||||||
Jefferies Group LLC | 1,197,000 | 1,294,508 | ||||||
6.50%, 01/20/43 | 989,000 | 1,159,039 | ||||||
Johnson & Johnson | 3,234,000 | 3,223,554 | ||||||
3.63%, 03/03/37 | 1,021,000 | 1,077,849 | ||||||
| Principal Amount ($) or Number of Shares | Fair Value $ | |||||||
Johnson Controls International PLC | 560,000 | 613,161 | ||||||
JPMorgan Chase & Co. | 1,407,000 | 1,393,648 | ||||||
2.55%, 10/29/20 | 1,589,000 | 1,593,084 | ||||||
3.30%, 04/01/26 | 1,359,000 | 1,368,486 | ||||||
3.63%, 12/01/27 | 958,000 | 968,298 | ||||||
JPMorgan Chase & Co. (3.88% fixed rate until 07/24/37; 1.36% + 3 month USD LIBOR thereafter) | 2,062,000 | 2,117,179 | ||||||
JPMorgan Chase & Co. (4.03% fixed rate until 07/24/47; 1.46% + 3 month USD LIBOR thereafter) | 1,053,000 | 1,094,499 | ||||||
JPMorgan Chase & Co. (4.63% fixed rate until 11/01/22; 2.58% + 3 month USD LIBOR thereafter) | 1,626,000 | 1,591,773 | ||||||
JPMorgan Chase & Co. (6.10% fixed rate until 10/01/24; 3.33% + 3 month USD LIBOR thereafter) | 3,531,000 | 3,879,863 | ||||||
JPMorgan Chase & Co. (7.90% fixed rate until 04/30/18; 3.47% + 3 month USD LIBOR thereafter) | 1,571,000 | 1,592,020 | ||||||
Kinder Morgan Energy Partners LP | 884,000 | 886,820 | ||||||
6.38%, 03/01/41 | 581,000 | 674,309 | ||||||
Kinder Morgan Inc. | 537,000 | 541,704 | ||||||
5.05%, 02/15/46 | 581,000 | 601,155 | ||||||
5.55%, 06/01/45 | 1,019,000 | 1,113,543 | ||||||
Kraft Heinz Foods Co. | 1,100,000 | 1,057,573 | ||||||
4.38%, 06/01/46 | 1,129,000 | 1,118,263 | ||||||
Kreditanstalt fuer Wiederaufbau | 2,407,000 | 2,368,151 | ||||||
4.50%, 07/16/18 (l) | 2,709,000 | 2,748,335 | ||||||
Lee Enterprises Inc. | 2,712,000 | 2,801,835 | ||||||
Lennar Corp. | 1,207,000 | 1,233,252 | ||||||
See Notes to Schedules of Investments and Notes to Financial Statements.
| GE RSP Income Fund | 21 |
Table of Contents
GE RSP Income Fund
Schedule of Investments, continued — December 31, 2017
| Principal Amount ($) or Number of Shares | Fair Value $ | |||||||
4.75%, 05/30/25 | 1,355,000 | 1,405,812 | ||||||
4.75%, 11/29/27 (b) | 1,529,000 | 1,567,225 | ||||||
Levi Strauss & Co. | 2,041,000 | 2,122,640 | ||||||
Lincoln National Corp. | 817,000 | 834,729 | ||||||
Lithia Motors Inc. | 453,000 | 472,252 | ||||||
Lloyds Banking Group PLC 3.75%, 01/11/27 | 774,000 | 786,833 | ||||||
Lloyds Banking Group PLC (2.91% fixed rate until 11/07/22; 0.81% + 3 month USD LIBOR thereafter) | 1,584,000 | 1,568,714 | ||||||
Lockheed Martin Corp. | 1,435,000 | 1,491,094 | ||||||
3.80%, 03/01/45 | 563,000 | 569,739 | ||||||
Lowe’s Companies Inc. | 695,000 | 697,606 | ||||||
LYB International Finance BV | 440,000 | 492,457 | ||||||
LYB International Finance II BV | 1,252,000 | 1,257,446 | ||||||
Macy’s Retail Holdings Inc. | 347,000 | 278,989 | ||||||
Marathon Oil Corp. | 732,000 | 744,671 | ||||||
Marathon Petroleum Corp. | 1,241,000 | 1,267,719 | ||||||
Marsh & McLennan Companies Inc. | 1,495,000 | 1,539,506 | ||||||
Masco Corp. | 631,000 | 622,633 | ||||||
McDonald’s Corp. | 706,000 | 735,243 | ||||||
4.88%, 12/09/45 | 564,000 | 652,418 | ||||||
Medtronic Inc. | 1,330,000 | 1,381,923 | ||||||
4.63%, 03/15/45 | 869,000 | 1,011,203 | ||||||
Memorial Sloan-Kettering Cancer Center | 1,088,000 | 1,150,016 | ||||||
Merck & Company Inc. | 2,712,000 | 2,703,755 | ||||||
MetLife Inc. | 909,000 | 1,052,886 | ||||||
Mexichem SAB de C.V. | 913,000 | 892,969 | ||||||
MGM Resorts International | 1,303,000 | 1,319,287 | ||||||
6.63%, 12/15/21 | 3,402,000 | 3,732,674 | ||||||
| Principal Amount ($) or Number of Shares | Fair Value $ | |||||||
Microsoft Corp. | 1,459,000 | 1,420,993 | ||||||
2.40%, 08/08/26 | 1,694,000 | 1,632,847 | ||||||
3.45%, 08/08/36 | 879,000 | 905,678 | ||||||
3.70%, 08/08/46 | 879,000 | 916,270 | ||||||
4.00%, 02/12/55 | 1,307,000 | 1,407,822 | ||||||
4.10%, 02/06/37 | 450,000 | 502,344 | ||||||
4.25%, 02/06/47 | 655,000 | 749,182 | ||||||
4.50%, 02/06/57 | 485,000 | 572,935 | ||||||
Mizuho Bank Ltd. | 3,931,000 | 3,933,886 | ||||||
Mizuho Financial Group Inc. | 1,664,000 | 1,659,304 | ||||||
Molina Healthcare Inc. | 1,431,000 | 1,427,422 | ||||||
Molson Coors Brewing Co. | 1,238,000 | 1,212,906 | ||||||
3.00%, 07/15/26 | 583,000 | 570,471 | ||||||
4.20%, 07/15/46 | 611,000 | 623,416 | ||||||
Monsanto Co. | 354,000 | 368,928 | ||||||
Morgan Stanley | 5,268,000 | 5,279,221 | ||||||
2.63%, 11/17/21 | 1,715,000 | 1,706,597 | ||||||
2.65%, 01/27/20 | 1,600,000 | 1,607,088 | ||||||
2.75%, 05/19/22 | 1,570,000 | 1,563,720 | ||||||
3.70%, 10/23/24 | 1,453,000 | 1,500,978 | ||||||
3.95%, 04/23/27 | 1,378,000 | 1,402,873 | ||||||
4.10%, 05/22/23 | 3,326,000 | 3,469,517 | ||||||
4.38%, 01/22/47 | 1,346,000 | 1,477,625 | ||||||
Morgan Stanley (3.97% fixed rate until 07/22/37; 1.46% + 3 month USD LIBOR thereafter) | 945,000 | 975,580 | ||||||
MPLX LP | 281,000 | 306,582 | ||||||
Murphy Oil Corp. | 2,473,000 | 2,527,097 | ||||||
Mylan N.V. | 754,000 | 757,860 | ||||||
3.95%, 06/15/26 | 718,000 | 723,615 | ||||||
National Retail Properties Inc. | 1,494,000 | 1,529,453 | ||||||
Navient Corp. | 2,855,000 | 3,086,969 | ||||||
Newell Brands Inc. | 1,599,000 | 1,655,253 | ||||||
4.20%, 04/01/26 | 1,599,000 | 1,671,579 | ||||||
5.50%, 04/01/46 | 658,000 | 785,474 | ||||||
Newmont Mining Corp. | 1,164,000 | 1,288,187 | ||||||
See Notes to Schedules of Investments and Notes to Financial Statements.
| 22 | GE RSP Income Fund |
Table of Contents
GE RSP Income Fund
Schedule of Investments, continued — December 31, 2017
| Principal Amount ($) or Number of Shares | Fair Value $ | |||||||
Nexen Energy ULC | 668,000 | 873,964 | ||||||
NGPL PipeCo LLC | 416,000 | 431,080 | ||||||
Noble Energy Inc. | 1,619,000 | 1,672,427 | ||||||
Nordstrom Inc. | 78,000 | 75,213 | ||||||
Northern States Power Co. | 3,116,000 | 3,112,012 | ||||||
Northrop Grumman Corp. | 650,000 | 644,664 | ||||||
2.55%, 10/15/22 | 1,626,000 | 1,613,756 | ||||||
2.93%, 01/15/25 | 1,635,000 | 1,623,915 | ||||||
3.25%, 01/15/28 | 1,404,000 | 1,406,401 | ||||||
3.85%, 04/15/45 | 315,000 | 318,960 | ||||||
4.03%, 10/15/47 | 699,000 | 729,553 | ||||||
Novartis Capital Corp. | 209,000 | 211,178 | ||||||
NRG Energy Inc. | 2,099,000 | 2,182,960 | ||||||
Nucor Corp. | 671,000 | 709,026 | ||||||
NuStar Logistics LP | 1,426,000 | 1,444,716 | ||||||
Occidental Petroleum Corp. | 738,000 | 782,863 | ||||||
Omnicom Group Inc. | 1,060,000 | 1,095,849 | ||||||
Oncor Electric Delivery Company LLC | 253,000 | 262,993 | ||||||
Oracle Corp. | 1,061,000 | 1,043,483 | ||||||
2.40%, 09/15/23 | 1,000,000 | 987,930 | ||||||
3.25%, 11/15/27 | 1,618,000 | 1,645,490 | ||||||
3.80%, 11/15/37 | 646,000 | 678,539 | ||||||
4.00%, 07/15/46 - 11/15/47 | 1,525,000 | 1,622,229 | ||||||
4.13%, 05/15/45 | 539,000 | 580,945 | ||||||
Owens-Brockway Glass Container Inc. | 1,300,000 | 1,452,750 | ||||||
Pacific Gas & Electric Co. | 4,659,000 | 4,744,353 | ||||||
PacifiCorp | 2,437,000 | 3,346,342 | ||||||
Packaging Corporation of America | 1,745,000 | 1,753,376 | ||||||
Parker-Hannifin Corp. | 2,976,000 | 2,999,868 | ||||||
Penske Automotive Group Inc. | 795,000 | 806,925 | ||||||
| Principal Amount ($) or Number of Shares | Fair Value $ | |||||||
PepsiCo Inc. | 541,000 | 524,754 | ||||||
Perrigo Finance Unlimited Co. | 768,000 | 778,522 | ||||||
3.90%, 12/15/24 | 1,409,000 | 1,433,446 | ||||||
Petroleos Mexicanos | 1,043,000 | 1,041,425 | ||||||
5.38%, 03/13/22 (b)(l) | 1,678,000 | 1,781,919 | ||||||
5.63%, 01/23/46 (l) | 620,000 | 576,414 | ||||||
6.38%, 01/23/45 (l) | 838,000 | 845,986 | ||||||
6.50%, 03/13/27 (b) | 1,447,000 | 1,586,520 | ||||||
6.75%, 09/21/47 | 1,342,000 | 1,405,530 | ||||||
PetSmart Inc. | 2,091,000 | 1,589,160 | ||||||
Pfizer Inc. | 1,201,000 | 1,209,191 | ||||||
4.13%, 12/15/46 | 730,000 | 808,541 | ||||||
4.40%, 05/15/44 | 431,000 | 493,892 | ||||||
Philip Morris International Inc. | 1,349,000 | 1,392,357 | ||||||
Phillips 66 Partners LP | 1,626,000 | 1,624,472 | ||||||
4.68%, 02/15/45 | 975,000 | 999,590 | ||||||
Plains All American Pipeline LP/PAA Finance Corp. | 575,000 | 538,200 | ||||||
5.75%, 01/15/20 | 1,071,000 | 1,128,352 | ||||||
PNC Bank NA | 1,179,000 | 1,180,415 | ||||||
Potash Corporation of Saskatchewan Inc. | 678,000 | 704,754 | ||||||
PPL Capital Funding Inc. | 1,842,000 | 1,808,033 | ||||||
Precision Castparts Corp. | 880,000 | 990,431 | ||||||
Prudential Financial Inc. (4.50% fixed rate until 09/15/27; 2.38% + 3 month USD LIBOR thereafter) | 785,000 | 795,260 | ||||||
Prudential Financial Inc. (5.38% fixed rate until 05/15/25; 3.03% + 3 month USD LIBOR thereafter) | 1,475,000 | 1,585,227 | ||||||
Public Service Electric & Gas Co. | 3,198,000 | 3,145,425 | ||||||
PulteGroup Inc. | 650,000 | 669,094 | ||||||
5.50%, 03/01/26 (l) | 1,700,000 | 1,844,500 | ||||||
See Notes to Schedules of Investments and Notes to Financial Statements.
| GE RSP Income Fund | 23 |
Table of Contents
GE RSP Income Fund
Schedule of Investments, continued — December 31, 2017
| Principal Amount ($) or Number of Shares | Fair Value $ | |||||||
QUALCOMM Inc. | 142,000 | 138,574 | ||||||
3.00%, 05/20/22 | 874,000 | 875,608 | ||||||
3.25%, 05/20/27 | 524,000 | 511,340 | ||||||
4.30%, 05/20/47 | 324,000 | 326,718 | ||||||
Realty Income Corp. | 648,000 | 620,525 | ||||||
Republic Services Inc. | 702,000 | 708,213 | ||||||
Reynolds American Inc. | 124,000 | 132,225 | ||||||
Rio Tinto Finance USA PLC | 759,000 | 821,238 | ||||||
Roche Holdings Inc. | 1,195,000 | 1,197,174 | ||||||
Rockwell Collins Inc. | 764,000 | 776,736 | ||||||
Rogers Communications Inc. | 493,000 | 568,197 | ||||||
Royal Bank of Scotland Group PLC (3.50% fixed rate until 05/15/22; 1.48% + 3 month USD LIBOR thereafter) | 1,937,000 | 1,941,009 | ||||||
RPM International Inc. | 1,527,000 | 1,547,279 | ||||||
Ryder System Inc. | 3,608,000 | 3,605,547 | ||||||
Sabine Pass Liquefaction LLC | 1,188,000 | 1,206,153 | ||||||
5.00%, 03/15/27 | 700,000 | 748,356 | ||||||
Santander Holdings USA Inc. | 3,018,000 | 3,014,288 | ||||||
3.70%, 03/28/22 (b) | 2,492,000 | 2,525,019 | ||||||
4.40%, 07/13/27 (b) | 1,104,000 | 1,129,801 | ||||||
Santander UK Group Holdings PLC | 557,000 | 583,952 | ||||||
Schlumberger Holdings Corp. | 1,106,000 | 1,120,326 | ||||||
4.00%, 12/21/25 (b) | 601,000 | 631,555 | ||||||
Select Income REIT | 1,698,000 | 1,683,957 | ||||||
Shell International Finance BV | 1,463,000 | 1,459,211 | ||||||
3.40%, 08/12/23 (l) | 1,774,000 | 1,839,514 | ||||||
3.75%, 09/12/46 (l) | 546,000 | 556,964 | ||||||
4.13%, 05/11/35 | 835,000 | 915,010 | ||||||
Shire Acquisitions Investments Ireland DAC | 1,185,000 | 1,165,804 | ||||||
| Principal Amount ($) or Number of Shares | Fair Value $ | |||||||
2.88%, 09/23/23 (l) | 1,679,000 | 1,648,123 | ||||||
3.20%, 09/23/26 (l) | 649,000 | 634,034 | ||||||
Siemens Financieringsmaatschappij N.V. | 416,000 | 423,899 | ||||||
Simon Property Group LP | 1,569,000 | 1,580,124 | ||||||
Sinclair Television Group Inc. | 3,562,000 | 3,624,335 | ||||||
Smithfield Foods Inc. | 650,000 | 645,758 | ||||||
4.25%, 02/01/27 (b)(l) | 861,000 | 883,554 | ||||||
Southern California Edison Co. | 1,240,000 | 1,228,877 | ||||||
Southern Copper Corp. | 672,000 | 813,241 | ||||||
Spectra Energy Partners LP | 490,000 | 483,703 | ||||||
4.50%, 03/15/45 | 290,000 | 299,187 | ||||||
Sprint Corp. | 3,612,000 | 3,774,540 | ||||||
Standard Industries Inc. | 4,068,000 | 4,251,060 | ||||||
Statoil ASA | 845,000 | 882,755 | ||||||
Sumitomo Life Insurance Co. (4.00%, fixed rate until 09/14/27; 2.99% + 3 month USD LIBOR thereafter) | 1,514,000 | 1,480,934 | ||||||
Sumitomo Mitsui Banking Corp. | 2,436,000 | 2,433,856 | ||||||
Suncor Energy Inc. | 431,000 | 440,805 | ||||||
Sunoco Logistics Partners Operations LP | 1,542,000 | 1,556,479 | ||||||
Sysco Corp. | 1,402,000 | 1,402,519 | ||||||
T-Mobile USA Inc. | 2,032,000 | 2,108,200 | ||||||
Tampa Electric Co. | 1,222,000 | 1,326,713 | ||||||
Target Corp. | 1,467,000 | 1,410,066 | ||||||
Teachers Insurance & Annuity Association of America | 1,335,000 | 1,527,074 | ||||||
Teck Resources Ltd. | 1,459,000 | 1,515,536 | ||||||
Telefonica Emisiones SAU | 2,047,000 | 2,110,109 | ||||||
See Notes to Schedules of Investments and Notes to Financial Statements.
| 24 | GE RSP Income Fund |
Table of Contents
GE RSP Income Fund
Schedule of Investments, continued — December 31, 2017
| Principal Amount ($) or Number of Shares | Fair Value $ | |||||||
Tenet Healthcare Corp. | 3,413,000 | 3,485,526 | ||||||
6.00%, 10/01/20 (l) | 3,421,000 | 3,609,155 | ||||||
Teva Pharmaceutical Finance Netherlands III BV | 2,758,000 | 2,738,584 | ||||||
1.70%, 07/19/19 | 3,825,000 | 3,716,447 | ||||||
3.15%, 10/01/26 (l) | 1,092,000 | 901,806 | ||||||
4.10%, 10/01/46 (l) | 283,000 | 215,971 | ||||||
The Allstate Corp. | 645,000 | 704,417 | ||||||
The Allstate Corp. (5.75% fixed rate until 08/15/23; 2.94% + 3 month USD LIBOR thereafter) | 1,660,000 | 1,811,840 | ||||||
The Bank of New York Mellon Corp. (2.66% fixed rate until 05/16/22; 0.63% + 3 month USD LIBOR thereafter) | 1,562,000 | 1,557,704 | ||||||
The Bank of New York Mellon Corp. (4.63% fixed rate until 09/20/26; 3.13% + 3 month USD LIBOR thereafter) | 2,890,000 | 2,936,962 | ||||||
The Bank of Nova Scotia (4.65% fixed rate until 10/12/22; 2.65% + 3 month USD LIBOR thereafter) | 2,209,000 | 2,196,387 | ||||||
The Bank of Tokyo-Mitsubishi UFJ Ltd. | 3,669,000 | 3,670,708 | ||||||
The Dow Chemical Co. | 1,355,000 | 1,423,238 | ||||||
The Goldman Sachs Group Inc. | 5,380,000 | 5,368,702 | ||||||
2.35%, 11/15/21 (l) | 1,715,000 | 1,688,435 | ||||||
2.38%, 01/22/18 (l) | 3,813,000 | 3,813,780 | ||||||
2.63%, 04/25/21 (l) | 2,285,000 | 2,283,743 | ||||||
2.90%, 07/19/18 (l) | 1,301,000 | 1,306,516 | ||||||
3.85%, 01/26/27 (l) | 1,342,000 | 1,377,858 | ||||||
4.25%, 10/21/25 (l) | 1,874,000 | 1,957,618 | ||||||
4.80%, 07/08/44 (l) | 2,164,000 | 2,475,183 | ||||||
5.15%, 05/22/45 (l) | 1,474,000 | 1,711,255 | ||||||
The Goldman Sachs Group Inc. (2.91% fixed rate until 06/05/22; 1.05% + 3 month USD LIBOR thereafter) | 3,139,000 | 3,115,803 | ||||||
| Principal Amount ($) or Number of Shares | Fair Value $ | |||||||
The Goldman Sachs Group Inc. (3.27% fixed rate until 09/29/24; 1.20% + 3 month USD LIBOR thereafter) | 1,764,000 | 1,755,727 | ||||||
The Goldman Sachs Group Inc. (4.02% fixed rate until 10/31/37; 1.37% + 3 month USD LIBOR thereafter) | 1,078,000 | 1,109,154 | ||||||
The Home Depot Inc. | 803,000 | 828,800 | ||||||
3.50%, 09/15/56 | 1,035,000 | 994,821 | ||||||
3.90%, 06/15/47 (l) | 834,000 | 879,795 | ||||||
The Korea Development Bank | 920,000 | 929,200 | ||||||
The Kroger Co. | 2,058,000 | 2,078,806 | ||||||
4.65%, 01/15/48 | 1,067,000 | 1,096,791 | ||||||
The Mosaic Co. | 291,000 | 314,996 | ||||||
The Nielsen Company Luxembourg Sarl | 1,302,000 | 1,347,570 | ||||||
The Sherwin-Williams Co. | 1,396,000 | 1,391,910 | ||||||
2.75%, 06/01/22 | 555,000 | 553,374 | ||||||
3.45%, 06/01/27 | 32,000 | 32,502 | ||||||
4.50%, 06/01/47 | 673,000 | 738,436 | ||||||
The Southern Co. | 760,000 | 746,791 | ||||||
4.40%, 07/01/46 (l) | 536,000 | 572,812 | ||||||
The Southern Co. (5.50% fixed rate until 03/15/22; 3.63% + 3 month USD LIBOR thereafter) | 1,046,000 | 1,108,070 | ||||||
The Toronto-Dominion Bank (3.63% fixed rate until 09/15/26; 2.21% + USD 5 year Swap Rate thereafter) | 3,064,000 | 3,054,165 | ||||||
The Walt Disney Co. | 586,000 | 632,798 | ||||||
Time Warner Cable LLC | 269,000 | 251,351 | ||||||
6.55%, 05/01/37 (l) | 907,000 | 1,060,664 | ||||||
Time Warner Inc. | 1,923,000 | 2,129,896 | ||||||
Tyco Electronics Group S.A. | 2,716,000 | 2,713,648 | ||||||
3.13%, 08/15/27 | 1,572,000 | 1,564,140 | ||||||
See Notes to Schedules of Investments and Notes to Financial Statements.
| GE RSP Income Fund | 25 |
Table of Contents
GE RSP Income Fund
Schedule of Investments, continued — December 31, 2017
| Principal Amount ($) or Number of Shares | Fair Value $ | |||||||
Tyson Foods Inc. | 557,000 | 559,523 | ||||||
4.55%, 06/02/47 | 558,000 | 609,436 | ||||||
U.S. Bancorp (5.13% fixed rate until 01/15/21; 3.49% + 3 month USD LIBOR thereafter) | 3,115,000 | 3,239,600 | ||||||
UBS Group Funding Switzerland AG | 2,479,000 | 2,504,830 | ||||||
Union Pacific Corp. | 377,000 | 388,178 | ||||||
4.10%, 09/15/67 | 629,000 | 657,909 | ||||||
United Technologies Corp. | 1,461,000 | 1,408,346 | ||||||
3.75%, 11/01/46 (l) | 515,000 | 513,676 | ||||||
UnitedHealth Group Inc. | 1,281,000 | 1,509,454 | ||||||
Vale Overseas Ltd. | 841,000 | 870,872 | ||||||
5.88%, 06/10/21 (l) | 1,680,000 | 1,832,561 | ||||||
6.25%, 08/10/26 (l) | 392,000 | 454,759 | ||||||
6.88%, 11/10/39 (l) | 503,000 | 617,709 | ||||||
Valeant Pharmaceuticals International Inc. | 2,788,000 | 2,997,100 | ||||||
Valvoline Inc. | 1,190,000 | 1,198,818 | ||||||
Ventas Realty LP | 1,586,000 | 1,547,492 | ||||||
Verizon Communications Inc. | 1,624,000 | 1,632,705 | ||||||
4.40%, 11/01/34 (l) | 1,351,000 | 1,375,021 | ||||||
4.67%, 03/15/55 (l) | 958,000 | 928,829 | ||||||
4.86%, 08/21/46 (l) | 3,016,000 | 3,140,923 | ||||||
5.01%, 04/15/49 | 648,000 | 679,311 | ||||||
5.25%, 03/16/37 (l) | 1,006,000 | 1,106,499 | ||||||
Viacom Inc. | 830,000 | 792,824 | ||||||
5.25%, 04/01/44 | 304,000 | 299,759 | ||||||
Virgin Media Finance PLC | 3,724,000 | 3,798,480 | ||||||
Virginia Electric & Power Co. | 1,678,000 | 1,796,265 | ||||||
Visa Inc. | 822,000 | 840,109 | ||||||
4.30%, 12/14/45 (l) | 812,000 | 924,884 | ||||||
Vornado Realty LP | 1,048,000 | 1,047,549 | ||||||
Vulcan Materials Co. | 713,000 | 729,035 | ||||||
| Principal Amount ($) or Number of Shares | Fair Value $ | |||||||
Wabtec Corp. | 437,000 | 427,360 | ||||||
Wal-Mart Stores Inc. | 865,000 | 906,814 | ||||||
Walgreens Boots Alliance Inc. | 440,000 | 464,662 | ||||||
WEC Energy Group Inc. | 1,343,000 | 1,376,750 | ||||||
WellCare Health Plans Inc. | 1,667,000 | 1,762,852 | ||||||
Wells Fargo & Co. | 3,153,000 | 3,134,649 | ||||||
3.90%, 05/01/45 (l) | 803,000 | 831,523 | ||||||
4.75%, 12/07/46 (l) | 1,310,000 | 1,461,004 | ||||||
Wells Fargo & Co. (3.58% fixed rate until 05/22/27; 1.31% + 3 month USD LIBOR thereafter) | 1,567,000 | 1,596,413 | ||||||
Wells Fargo & Co. (5.88% fixed rate until 06/15/25; 3.99% + 3 month USD LIBOR thereafter) | 2,174,000 | 2,407,814 | ||||||
Wells Fargo & Co. (5.90% fixed rate until 06/15/24; 3.11% + 3 month USD LIBOR thereafter) | 2,055,000 | 2,198,233 | ||||||
Wells Fargo & Co. (7.98% fixed rate until 03/15/18; 3.77% + 3 month USD LIBOR thereafter) | 1,704,000 | 1,721,517 | ||||||
Western Digital Corp. | 325,000 | 350,187 | ||||||
Western Gas Partners LP | 1,331,000 | 1,410,221 | ||||||
Westlake Chemical Corp. | 993,000 | 1,001,172 | ||||||
4.38%, 11/15/47 | 211,000 | 218,149 | ||||||
5.00%, 08/15/46 | 449,000 | 503,917 | ||||||
WestRock Co. | 1,208,000 | 1,195,606 | ||||||
Williams Partners LP | 567,000 | 568,055 | ||||||
3.90%, 01/15/25 | 943,000 | 963,897 | ||||||
4.90%, 01/15/45 | 446,000 | 473,184 | ||||||
5.40%, 03/04/44 | 269,000 | 303,319 | ||||||
Willis North America Inc. | 1,569,000 | 1,593,351 | ||||||
WPP Finance 2010 | 1,027,000 | 1,049,748 | ||||||
Wynn Las Vegas LLC/Wynn Las Vegas Capital Corp. | 1,668,000 | 1,689,851 | ||||||
See Notes to Schedules of Investments and Notes to Financial Statements.
| 26 | GE RSP Income Fund |
Table of Contents
GE RSP Income Fund
Schedule of Investments, continued — December 31, 2017
| Principal Amount ($) or Number of Shares | Fair Value $ | |||||||
Xilinx Inc. | 1,115,000 | 1,107,964 | ||||||
XLIT Ltd. | 585,000 | 666,865 | ||||||
XPO Logistics Inc. | 1,231,000 | 1,284,856 | ||||||
Yamana Gold Inc. | 1,051,000 | 1,057,169 | ||||||
Zoetis Inc. | 697,000 | 681,157 | ||||||
|
| |||||||
| 878,807,917 | ||||||||
|
| |||||||
Non-Agency Collateralized Mortgage Obligations - 3.5% |
| |||||||
American Tower Trust I (REIT) | 5,061,000 | 5,054,136 | ||||||
BXP Trust 2017-GM | 6,314,000 | 6,449,979 | ||||||
Citigroup Commercial Mortgage Trust 2016-P5 | 3,484,742 | 3,439,837 | ||||||
Citigroup Commercial Mortgage Trust 2016-P6 | 8,504,458 | 8,890,702 | ||||||
4.03%, 12/10/49 (h) | 2,942,926 | 3,073,506 | ||||||
COMM 2013-LC13 Mortgage Trust | 1,375,000 | 1,463,215 | ||||||
COMM 2014-CR14 Mortgage Trust | 1,940,000 | 2,070,688 | ||||||
GS Mortgage Securities Corp. II | 7,000,045 | 7,168,873 | ||||||
GS Mortgage Securities Trust 2015-GC28 | 22,493,549 | 1,166,198 | ||||||
GS Mortgage Securities Trust 2016-GS3 | 6,656,000 | 6,532,101 | ||||||
GS Mortgage Securities Trust 2017-GS5 | 7,241,532 | 7,593,803 | ||||||
GS Mortgage Securities Trust II 2012-GCJ9 | 5,852,589 | 462,020 | ||||||
Impac CMB Trust 2004-5 0.72% + 1 month USD LIBOR | 750,412 | 731,442 | ||||||
JP Morgan Chase Commercial Mortgage Securities Corp. 2012-LC9 | 7,449,460 | 425,919 | ||||||
| Principal Amount ($) or Number of Shares | Fair Value $ | |||||||
JPMBB Commercial Mortgage Securities Trust 2013-C12 | 1,010,000 | 1,054,532 | ||||||
LB-UBS Commercial Mortgage Trust 2004-C8 | 642,480 | 1,317 | ||||||
LB-UBS Commercial Mortgage Trust 2007-C6 | 499,278 | 499,023 | ||||||
6.11%, 07/15/40 (b)(l) | 1,102,440 | 1,102,220 | ||||||
MASTR Alternative Loan Trust 2003-5 | 19,412 | 171 | ||||||
Morgan Stanley Bank of America Merrill Lynch Trust 2015-C20 | 25,129,582 | 1,703,137 | ||||||
Morgan Stanley Bank of America Merrill Lynch Trust 2015-C21 | 30,831,446 | 1,549,752 | ||||||
Morgan Stanley Capital I Trust 2006-IQ11 | 2,300,000 | 2,396,370 | ||||||
Morgan Stanley Capital I Trust 2006-T21 | 721,443 | 720,875 | ||||||
Morgan Stanley Capital I Trust 2007-IQ16 | 67,505 | 67,464 | ||||||
Morgan Stanley Capital I Trust 2008-T29 | 99,122 | 99,060 | ||||||
Morgan Stanley Capital I Trust 2016-UBS9 | 22,950,153 | 1,603,511 | ||||||
Wells Fargo Commercial Mortgage Trust 2015-C26 | 25,375,345 | 1,708,740 | ||||||
Wells Fargo Commercial Mortgage Trust 2017-RB1 | 4,226,569 | 4,386,754 | ||||||
WFRBS Commercial Mortgage Trust 2013-C17 | 1,880,000 | 1,979,752 | ||||||
WFRBS Commercial Mortgage Trust 2014-C25 | 816,000 | 617,174 | ||||||
WFRBS Commercial Mortgage Trust 2014-LC14 | 4,333,000 | 4,585,167 | ||||||
4.59%, 03/15/47 (b)(h) | 3,178,169 | 2,529,498 | ||||||
|
| |||||||
| 81,126,936 | ||||||||
|
| |||||||
See Notes to Schedules of Investments and Notes to Financial Statements.
| GE RSP Income Fund | 27 |
Table of Contents
GE RSP Income Fund
Schedule of Investments, continued — December 31, 2017
| Principal Amount ($) or Number of Shares | Fair Value $ | |||||||
Sovereign Bonds - 1.0% |
| |||||||
Government of Chile | 150,000 | 151,404 | ||||||
3.86%, 06/21/47 | 1,632,000 | 1,680,324 | ||||||
Government of Colombia | 711,000 | 695,002 | ||||||
3.88%, 04/25/27 | 1,185,000 | 1,207,539 | ||||||
5.00%, 06/15/45 | 1,271,000 | 1,354,200 | ||||||
Government of Mexico | 1,808,000 | 1,834,433 | ||||||
4.00%, 10/02/23 | 768,000 | 804,772 | ||||||
4.60%, 02/10/48 | 2,360,000 | 2,344,683 | ||||||
4.75%, 03/08/44 (l) | 2,354,000 | 2,381,165 | ||||||
Government of Oman | 2,103,000 | 2,115,618 | ||||||
Government of Panama | 1,673,000 | 1,778,951 | ||||||
4.50%, 05/15/47 (l) | 530,000 | 571,737 | ||||||
Government of Peru | 1,006,000 | 1,292,660 | ||||||
Government of Philippines | 835,000 | 862,221 | ||||||
4.20%, 01/21/24 | 1,313,000 | 1,426,588 | ||||||
Government of Saudi Arabia | 1,173,000 | 1,154,197 | ||||||
3.63%, 03/04/28 (b) | 831,000 | 825,083 | ||||||
Government of Uruguay | 1,006,656 | 1,121,757 | ||||||
|
| |||||||
| 23,602,334 | ||||||||
|
| |||||||
Municipal Bonds and Notes - 0.5% |
| |||||||
American Municipal Power Inc. | 1,080,000 | 1,412,975 | ||||||
New Jersey Transportation Trust Fund Authority | 880,000 | 914,162 | ||||||
| Principal Amount ($) or Number of Shares | Fair Value $ | |||||||
Port Authority of New York & New Jersey | 4,095,000 | 4,728,619 | ||||||
State of California | 2,075,000 | 2,313,708 | ||||||
State of Illinois | 745,000 | 743,763 | ||||||
The University of Texas System | 1,025,000 | 1,030,699 | ||||||
|
| |||||||
| 11,143,926 | ||||||||
|
| |||||||
FNMA (TBA) - 0.0%* |
| |||||||
Lehman | 1,154,568 | 24,939 | ||||||
|
| |||||||
| Total Bonds and Notes (Cost $2,287,248,619) | 2,307,562,874 | |||||||
|
| |||||||
| Domestic Equity - 0.1% | ||||||||
Preferred Stock - 0.1% |
| |||||||
Wells Fargo & Co. 3.09% + 3 month USD LIBOR (Cost $1,375,850) (h) | 55,034 | 1,485,918 | ||||||
|
| |||||||
| Total Investments in Securities (Cost $2,288,624,469) | 2,309,048,792 | |||||||
|
| |||||||
| Short-Term Investments - 3.6% | ||||||||
Time Deposit - 3.6% |
| |||||||
State Street Corp. | 82,636,353 | 82,636,353 | ||||||
|
| |||||||
| Total Investments (Cost $2,371,260,822) | 2,391,685,145 | |||||||
| Liabilities in Excess of Other Assets, net - (2.7)% | (62,010,921 | ) | ||||||
|
| |||||||
| NET ASSETS - 100.0% | $ | 2,329,674,224 | ||||||
|
| |||||||
Other Information:
Centrally Cleared Credit Default Swaps - Buy Protection
| Reference Entity | Counterparty | Notional Amount (000s omitted) | Contract Annual Fixed Rate | Payment Frequency | Termination Date | Market Value | Unamortized Upfront Payments (Received)/ Paid | Unrealized Depreciation | ||||||||||||||||||||||
Markit CDX North America Investment Grade Index | CME Group Inc. | $ | 60,466 | 1.00% | Quarterly | 12/20/22 | $ | (1,440,806 | ) | $ | (1,290,873 | ) | $ | (149,933 | ) | |||||||||||||||
|
| |||||||||||||||||||||||||||||
See Notes to Schedules of Investments and Notes to Financial Statements.
| 28 | GE RSP Income Fund |
Table of Contents
GE RSP Income Fund
Schedule of Investments, continued — December 31, 2017
Centrally Cleared Interest Rate Swaps
| Counterparty | Notional Amount (000s omitted) | Fund Pays/ Received | Floating Rate | Contract annual Fixed Rate | Termination Date | Market Value | Unamortized Upfront Payments (Received)/ Paid | Unrealized Depreciation | ||||||||||||||||||||
CME Group Inc. | $ | 17,199 | Receives/ Quarterly | 3 month U.S. Dollar LIBOR | 2.62% | 10/16/43 | $ | (157,011 | ) | $ | — | $ | (157,011 | ) | ||||||||||||||
CME Group Inc. | 5,159 | Receives/ Quarterly | 3 month U.S. Dollar LIBOR | 2.65% | 10/10/43 | (74,422 | ) | 77 | (74,499 | ) | ||||||||||||||||||
CME Group Inc. | 6,532 | Receives/ Quarterly | 3 month U.S. Dollar LIBOR | 2.65% | 11/07/43 | (91,693 | ) | — | (91,693 | ) | ||||||||||||||||||
CME Group Inc. | 10,553 | Receives/ Quarterly | 3 month U.S. Dollar LIBOR | 2.67% | 10/24/43 | (200,047 | ) | — | (200,047 | ) | ||||||||||||||||||
|
| |||||||||||||||||||||||||||
| $ | (523,250 | ) | ||||||||||||||||||||||||||
|
| |||||||||||||||||||||||||||
| $ | (673,183 | ) | ||||||||||||||||||||||||||
|
| |||||||||||||||||||||||||||
During the year ended December 31, 2017, average notional values related to swap contracts was $112,545,013.
The Fund had the following long futures contracts open at December 31, 2017:
| Description | Expiration date | Number of Contracts | Notional Amount | Value | Unrealized Appreciation (Depreciation) | |||||||||||||||
Ultra Long-Term U.S. Treasury Bond Futures | March 2018 | 607 | 101,225,915 | $ | 101,767,344 | $ | 541,429 | |||||||||||||
2 Yr. U.S. Treasury Notes Futures | March 2018 | 177 | 37,983,656 | 37,897,359 | (86,297 | ) | ||||||||||||||
5 Yr. U.S. Treasury Notes Futures | March 2018 | 474 | 55,313,600 | 55,061,766 | (251,834 | ) | ||||||||||||||
10 Yr. U.S. Treasury Notes Futures | March 2018 | 664 | 82,481,315 | 82,367,125 | (114,190 | ) | ||||||||||||||
|
| |||||||||||||||||||
| $ | 89,108 | |||||||||||||||||||
|
| |||||||||||||||||||
The Fund had the following short futures contracts open at December 31, 2017:
| Description | Expiration date | Number of Contracts | Notional Amount | Value | Unrealized Appreciation | |||||||||||||||
U.S. Long Bond Futures | March 2018 | 147 | $ | (22,515,182 | ) | $ | (22,491,000 | ) | $ | 24,182 | ||||||||||
10 Yr. U.S. Treasury Ultra Futures | March 2018 | 538 | (72,097,631 | ) | (71,856,625 | ) | 241,006 | |||||||||||||
|
| |||||||||||||||||||
| $ | 265,188 | |||||||||||||||||||
|
| |||||||||||||||||||
| $ | 354,296 | |||||||||||||||||||
|
| |||||||||||||||||||
During the year ended December 31, 2017, average notional values related to long futures contracts and short futures contracts were $259,967,008 and $135,023,907, respectively.
See Notes to Schedules of Investments and Notes to Financial Statements.
| GE RSP Income Fund | 29 |
Table of Contents
GE RSP Income Fund
Schedule of Investments, continued — December 31, 2017
The following table presents the Fund’s investments measured at fair value on a recurring basis at December 31, 2017:
| Fund | Investments | Level 1 | Level 2 | Level 3 | Total | |||||||||||||
| GE RSP Income Fund | Investments in Securities | |||||||||||||||||
U.S. Treasuries | $ | — | $ | 1,009,447,840 | $ | — | $ | 1,009,447,840 | ||||||||||
Agency Mortgage Backed | — | 242,641,597 | — | 242,641,597 | ||||||||||||||
Agency Collateralized Mortgage Obligations | — | 4,770,653 | — | 4,770,653 | ||||||||||||||
Asset Backed | — | 55,996,732 | — | 55,996,732 | ||||||||||||||
Corporate Notes | — | 878,807,917 | — | 878,807,917 | ||||||||||||||
Non-Agency Collateralized Mortgage Obligations | — | 81,126,936 | — | 81,126,936 | ||||||||||||||
Sovereign Bonds | — | 23,602,334 | — | 23,602,334 | ||||||||||||||
Municipal Bonds and Notes | — | 11,143,926 | — | 11,143,926 | ||||||||||||||
FNMA (TBA) | — | — | 24,939 | 24,939 | ||||||||||||||
Preferred Stock | 1,485,918 | — | — | 1,485,918 | ||||||||||||||
Short-Term Investments | — | 82,636,353 | — | 82,636,353 | ||||||||||||||
|
|
|
|
|
|
|
| |||||||||||
Total Investments in Securities | $ | 1,485,918 | $ | 2,390,174,288 | $ | 24,939 | $ | 2,391,685,145 | ||||||||||
|
|
|
|
|
|
|
| |||||||||||
Other Financial Instruments | ||||||||||||||||||
Credit Default Swap Contracts — Unrealized Depreciation | $ | — | $ | (149,933 | ) | $ | — | $ | (149,933 | ) | ||||||||
Interest Rate Swap Contracts — Unrealized Depreciation | — | (523,250 | ) | — | (523,250 | ) | ||||||||||||
Long Futures Contracts — Unrealized Appreciation | 541,429 | — | — | 541,429 | ||||||||||||||
Long Futures Contracts — Unrealized Depreciation | (452,321 | ) | — | — | (452,321 | ) | ||||||||||||
Short Futures Contracts — Unrealized Appreciation | 265,188 | — | — | 265,188 | ||||||||||||||
|
|
|
|
|
|
|
| |||||||||||
Total Other Financial Instruments | $ | 354,296 | $ | (673,183 | ) | $ | — | $ | (318,887 | ) | ||||||||
|
|
|
|
|
|
|
| |||||||||||
Affiliate Table
| Number of Shares Held at 12/31/16 | Value At 12/31/16 | Cost of Purchases | Proceeds from Shares Sold | Number of Shares Held at 12/31/17 | Value at 12/31/17 | Dividend Income | ||||||||||||||||||||||
State Street Corporation (Time Deposit) | 77,465,557 | $ | 77,465,557 | $ | 19,123,137,301 | $ | 19,117,966,505 | 82,636,353 | $ | 82,636,353 | $ | 72,923 | ||||||||||||||||
See Notes to Schedules of Investments and Notes to Financial Statements.
| 30 | GE RSP Income Fund |
Table of Contents
GE RSP Funds
Notes to Schedule of Investments — December 31, 2017
The views expressed in this document reflect our judgment as of the publication date and are subject to change at any time without notice. The securities cited may not be representative of the Funds’ future investments and should not be construed as a recommendation to purchase or sell a particular security. See the Funds’ Supplemental Information Documents and Consolidated Profile for complete descriptions of investment objectives, policies, risks and permissible investments.
| (a) | Non-income producing security. |
| (b) | Pursuant to Rule 144A of the Securities Act of 1933, as amended, these securities may be resold in transactions exempt from registration, normally to qualified institutional buyers. At December 31, 2017, these securities amounted to $161,372,231 or 6.93% of the net assets of the GE RSP Income Fund. These securities have been determined to be liquid using procedures established by the Fund’s Board of Trustees. |
| (c) | Settlement is on a delayed delivery or when-issued basis with final maturity to be announced (TBA) in the future. |
| (d) | Coupon amount represents effective yield. |
| (e) | State Street Corporation is the parent company of SSGA Funds Management, Inc., the Funds’ investment adviser and administrator, and State Street Bank & Trust Co., the Funds’ sub-administrator, custodian and accounting agent. |
| (f) | Principal only security. These securities represent the right to receive the monthly principal payments on an underlying pool of mortgages. No payments of interest on the pool are passed through to the “principal only” holder. |
| (g) | Interest only security. These securities represent the right to receive the monthly interest payments on an underlying pool of mortgages. Payments of principal on the pool reduce the value of the “interest only” holding. |
| (h) | Variable or floating rate security. The stated rate represents the rate at December 31, 2017. |
| (i) | Step coupon bond. |
| (j) | Security is in default. |
| (k) | Security is fair valued by the Oversight Committee, in accordance with the procedures approved by the Board of Trustees. |
| (l) | At December 31, 2017, all or a portion of this security was pledged to cover collateral requirements for current or potential holdings of futures, TBAs and/or swap contracts. |
| † | Percentages are based on net assets as of December 31, 2017. |
| * | Less than 0.05% |
Abbreviations:
ADR - American Depositary Receipt
LIBOR - London Interbank Offered Rate
REIT - Real Estate Investment Trust
REMIC - Real Estate Mortgage Investment Conduit
STRIPS - Separate Trading of Registered Interest and Principal of Security
TBA - To Be Announced
| Notes to Schedule of Investments | 31 |
Table of Contents
GE RSP U.S. Equity Fund
Selected data based on a share outstanding throughout the fiscal years indicated
| 12/31/17 | 12/31/16 | 12/31/15* | 12/31/14* | 12/31/13* | ||||||||||||||||
Net asset value, beginning of period | $ | 49.27 | $ | 47.59 | $ | 54.31 | $ | 54.73 | $ | 44.41 | ||||||||||
|
|
|
|
|
|
|
|
|
| |||||||||||
Income/(loss) from investment operations: |
| |||||||||||||||||||
Net investment income | 0.76 | (a) | 0.92 | 0.92 | 0.93 | 0.89 | ||||||||||||||
Net realized and unrealized gains/(losses) on investments | 9.35 | 3.92 | (1.94 | ) | 6.40 | 14.69 | ||||||||||||||
|
|
|
|
|
|
|
|
|
| |||||||||||
Total income/(loss) from investment operations | 10.11 | 4.84 | (1.02 | ) | 7.33 | 15.58 | ||||||||||||||
|
|
|
|
|
|
|
|
|
| |||||||||||
Less distributions from: | ||||||||||||||||||||
Net investment income | 0.81 | 0.91 | 0.92 | 0.92 | 0.89 | |||||||||||||||
Net realized gains | 6.12 | 2.25 | 4.78 | 6.83 | 4.37 | |||||||||||||||
|
|
|
|
|
|
|
|
|
| |||||||||||
Total distributions | 6.93 | 3.16 | 5.70 | 7.75 | 5.26 | |||||||||||||||
|
|
|
|
|
|
|
|
|
| |||||||||||
Net asset value, end of period | $ | 52.45 | $ | 49.27 | $ | 47.59 | $ | 54.31 | $ | 54.73 | ||||||||||
|
|
|
|
|
|
|
|
|
| |||||||||||
Total return(b) | 20.50 | % | 10.13 | % | (2.05 | )% | 13.27 | % | 35.15 | % | ||||||||||
Ratios/Supplemental Data: | ||||||||||||||||||||
Net assets, end of period (in thousands) | $ | 5,435,513 | $ | 4,914,567 | $ | 4,941,537 | $ | 5,445,144 | $ | 5,056,561 | ||||||||||
Ratios to average net assets: | ||||||||||||||||||||
Gross expenses | 0.14 | % | 0.16 | % | 0.16 | % | 0.14 | % | 0.12 | % | ||||||||||
Net investment income | 1.39 | % | 1.79 | % | 1.62 | % | 1.58 | % | 1.66 | % | ||||||||||
Portfolio turnover rate | 77 | % | 38 | % | 37 | % | 41 | % | 40 | % | ||||||||||
| (a) | Per share values have been calculated using the average share method. |
| (b) | Total returns are historical and assume changes in share price, reinvestment of dividends and capital gains distributions. Past performance does not guarantee future results. |
| * | Beginning with year ended December 31, 2016, the Funds were audited by BBD, LLP. The previous years were audited by another independent registered public accounting firm. |
The accompanying Notes are an integral part of these financial statements.
| 32 | Financial Highlights |
Table of Contents
GE RSP Income Fund
Financial Highlights
Selected data based on a share outstanding throughout the fiscal years indicated
| 12/31/17 | 12/31/16 | 12/31/15* | 12/31/14* | 12/31/13* | ||||||||||||||||
Net asset value, beginning of period | $ | 11.38 | $ | 11.36 | $ | 11.67 | $ | 11.33 | $ | 11.75 | ||||||||||
|
|
|
|
|
|
|
|
|
| |||||||||||
Income/(loss) from investment operations: |
| |||||||||||||||||||
Net investment income | 0.29 | (a) | 0.31 | 0.33 | 0.30 | 0.30 | ||||||||||||||
Net realized and unrealized gains/(losses) on investments | 0.16 | 0.09 | (0.29 | ) | 0.35 | (0.40 | ) | |||||||||||||
|
|
|
|
|
|
|
|
|
| |||||||||||
Total income/(loss) from investment operations | 0.45 | 0.40 | 0.04 | 0.65 | (0.10 | ) | ||||||||||||||
|
|
|
|
|
|
|
|
|
| |||||||||||
Less distributions from: | ||||||||||||||||||||
Net investment income | 0.28 | 0.29 | 0.33 | 0.31 | 0.29 | |||||||||||||||
Net realized gains | — | 0.09 | 0.02 | 0.00 | (b) | 0.03 | ||||||||||||||
|
|
|
|
|
|
|
|
|
| |||||||||||
Total distributions | 0.28 | 0.38 | 0.35 | 0.31 | 0.32 | |||||||||||||||
|
|
|
|
|
|
|
|
|
| |||||||||||
Net asset value, end of period | $ | 11.55 | $ | 11.38 | $ | 11.36 | $ | 11.67 | $ | 11.33 | ||||||||||
|
|
|
|
|
|
|
|
|
| |||||||||||
Total return(c) | 3.99 | % | 3.50 | % | 0.34 | % | 5.83 | % | (0.85 | )% | ||||||||||
Ratios/Supplemental Data: | ||||||||||||||||||||
Net assets, end of period (in thousands) | $ | 2,329,674 | $ | 2,427,975 | $ | 2,471,886 | $ | 2,613,303 | $ | 2,601,277 | ||||||||||
Ratios to average net assets: | ||||||||||||||||||||
Gross expenses | 0.16 | % | 0.21 | % | 0.18 | % | 0.11 | % | 0.19 | % | ||||||||||
Net investment income | 2.55 | % | 2.66 | % | 2.79 | % | 2.68 | % | 2.58 | % | ||||||||||
Portfolio turnover rate | 297 | % | 242 | % | 271 | % | 319 | % | 335 | % | ||||||||||
| (a) | Per share values have been calculated using the average share method. |
| (b) | Rounds to less than $0.005. |
| (c) | Total returns are historical and assume changes in share price, reinvestment of dividends and capital gains distributions. Past performance does not guarantee future results. |
| * | Beginning with year ended December 31, 2016, the Funds were audited by BBD, LLP. The previous years were audited by another independent registered public accounting firm. |
The accompanying Notes are an integral part of these financial statements.
| Financial Highlights | 33 |
Table of Contents
GE RSP Funds
Statements of Assets and Liabilities — December 31, 2017
| GE RSP U.S. Equity Fund | GE RSP Income Fund | |||||||
Assets | ||||||||
Investments in securities, at fair value (cost $4,123,847,006 and $2,288,624,469, respectively) | $ | 5,258,019,024 | $ | 2,309,048,792 | ||||
Short-term affiliated investments, at fair value | 172,823,564 | 82,636,353 | ||||||
Cash | 383,135 | 852,424 | ||||||
Receivable for investments sold | — | 849,148 | ||||||
Income receivables | 6,464,227 | 15,444,083 | ||||||
Receivable for fund shares sold | — | 3,090 | ||||||
Receivable for variation margin on open futures contracts | — | 244,196 | ||||||
Other assets | 6,382 | 3,130 | ||||||
|
|
|
| |||||
Total assets | 5,437,696,332 | 2,409,081,216 | ||||||
|
|
|
| |||||
Liabilities | ||||||||
Distribution payable to shareholders | — | 162,966 | ||||||
Payable for investments purchased | — | 77,956,187 | ||||||
Payable for fund shares redeemed | 1,415,247 | 464,757 | ||||||
Payable for variation margin on open centrally cleared swap contracts | — | 395,887 | ||||||
Payable to the Adviser (Note 5) | 556,382 | 258,319 | ||||||
Payable to the Custodian (Note 5) | 8,230 | 20,556 | ||||||
Accrued other expenses | 203,486 | 148,320 | ||||||
|
|
|
| |||||
Total liabilities | 2,183,345 | 79,406,992 | ||||||
|
|
|
| |||||
Net Assets | $ | 5,435,512,987 | $ | 2,329,674,224 | ||||
|
|
|
| |||||
Net Assets Consist of: | ||||||||
Capital paid in | $ | 4,316,661,156 | $ | 2,322,301,773 | ||||
Undistributed (distributions in excess of) net investment income | — | 1,465,427 | ||||||
Accumulated net realized loss | (15,320,187 | ) | (14,198,412 | ) | ||||
Net unrealized appreciation (depreciation) on: | ||||||||
Unaffiliated Investments | 1,134,172,018 | 20,424,323 | ||||||
Futures | — | 354,296 | ||||||
Swap contracts | — | (673,183 | ) | |||||
|
|
|
| |||||
Net Assets | $ | 5,435,512,987 | $ | 2,329,674,224 | ||||
|
|
|
| |||||
Shares outstanding ($25.00 and $10.00 par value, respectively; unlimited shares authorized) | 103,632,973 | 201,744,243 | ||||||
Net asset value, offering and redemption price per share | $ | 52.45 | $ | 11.55 | ||||
The accompanying Notes are an integral part of these financial statements.
| 34 | Statements of Assets and Liabilities |
Table of Contents
GE RSP Funds
Statements of Operations — For the year ended December 31, 2017
| GE RSP U.S. Equity Fund | GE RSP Income Fund | |||||||
Investment Income | ||||||||
Income | ||||||||
Dividend | $ | 80,605,729 | $ | 317,477 | ||||
Interest | — | 64,822,208 | ||||||
Income from affiliated investments | 116,734 | 72,923 | ||||||
Less: Foreign taxes withheld | (113,737 | ) | — | |||||
|
|
|
| |||||
Total income | 80,608,726 | 65,212,608 | ||||||
|
|
|
| |||||
Expenses | ||||||||
Advisory and administration fees (Note 5) | 6,539,343 | 3,238,188 | ||||||
Transfer agent fees | 424,001 | 408,701 | ||||||
Custody and accounting expenses — net (Note 5) | 120,998 | 219,434 | ||||||
Professional fees | 10,000 | 11,630 | ||||||
Other expenses | 182,676 | 84,436 | ||||||
|
|
|
| |||||
Total expenses | 7,277,018 | 3,962,389 | ||||||
|
|
|
| |||||
Net investment income | $ | 73,331,708 | $ | 61,250,219 | ||||
|
|
|
| |||||
Net Realized and Unrealized Gain (Loss) on Investments | ||||||||
Realized gain (loss) on: | ||||||||
Unaffiliated investments | $ | 589,564,507 | $ | 8,110,109 | ||||
Futures | — | 106,702 | ||||||
Written options | — | 688,265 | ||||||
Swap contracts | — | (5,500,543 | ) | |||||
Foreign currency transactions | 305 | — | ||||||
Increase (decrease) in unrealized appreciation/depreciation on: | ||||||||
Unaffiliated investments | 312,351,199 | 26,399,841 | ||||||
Futures | — | 681,176 | ||||||
Swap contracts | — | 1,293,472 | ||||||
|
|
|
| |||||
Net realized and unrealized gain (loss) on investments | 901,916,011 | 31,779,022 | ||||||
|
|
|
| |||||
Net Increase in Net Assets Resulting from Operations | $ | 975,247,719 | $ | 93,029,241 | ||||
|
|
|
| |||||
The accompanying Notes are an integral part of these financial statements.
| Statements of Operations | 35 |
Table of Contents
GE RSP Funds
Statements of Changes in Net Assets
| GE RSP U.S. Equity Fund | GE RSP Income Fund | |||||||||||||||
| Year Ended December 31, 2017 | Year Ended December 31, 2016 | Year Ended December 31, 2017 | Year Ended December 31, 2016 | |||||||||||||
Increase (Decrease) in Net Assets | ||||||||||||||||
Operations: | ||||||||||||||||
Net investment income | $ | 73,331,708 | $ | 85,883,601 | $ | 61,250,219 | $ | 66,844,867 | ||||||||
Net realized gain (loss) on investments, futures, swap contracts, options contracts, and foreign currency related transactions | 589,564,812 | 203,246,871 | 3,404,533 | (475,145 | ) | |||||||||||
Net increase (decrease) in unrealized appreciation/depreciation on investments, futures, swap contracts and foreign currency translations | 312,351,199 | 174,770,182 | 28,374,489 | 20,945,025 | ||||||||||||
|
|
|
|
|
|
|
| |||||||||
Net increase (decrease) from operations | 975,247,719 | 463,900,654 | 93,029,241 | 87,314,747 | ||||||||||||
|
|
|
|
|
|
|
| |||||||||
Distributions to shareholders from: | ||||||||||||||||
Net investment income | (74,706,277 | ) | (85,649,625 | ) | (58,342,653 | ) | (62,653,422 | ) | ||||||||
Net realized gains | (565,114,322 | ) | (211,685,454 | ) | — | (18,690,332 | ) | |||||||||
|
|
|
|
|
|
|
| |||||||||
Total distributions | (639,820,599 | ) | (297,335,079 | ) | (58,342,653 | ) | (81,343,754 | ) | ||||||||
|
|
|
|
|
|
|
| |||||||||
Increase (decrease) in assets from operations and distributions | 335,427,120 | 166,565,575 | 34,686,588 | 5,970,993 | ||||||||||||
|
|
|
|
|
|
|
| |||||||||
Share transactions: | ||||||||||||||||
Proceeds from sale of shares | 63,469,221 | 34,956,223 | 49,857,089 | 58,096,752 | ||||||||||||
Value of distributions reinvested | 606,140,697 | 281,547,325 | 56,333,920 | 78,636,618 | ||||||||||||
Cost of shares redeemed | (484,090,590 | ) | (510,039,863 | ) | (239,178,639 | ) | (186,615,031 | ) | ||||||||
|
|
|
|
|
|
|
| |||||||||
Net increase (decrease) from share transactions | 185,519,328 | (193,536,315 | ) | (132,987,630 | ) | (49,881,661 | ) | |||||||||
|
|
|
|
|
|
|
| |||||||||
Total increase (decrease) in net assets | 520,946,448 | (26,970,740 | ) | (98,301,042 | ) | (43,910,668 | ) | |||||||||
Net Assets | ||||||||||||||||
Beginning of year | 4,914,566,539 | 4,941,537,279 | 2,427,975,266 | 2,471,885,934 | ||||||||||||
|
|
|
|
|
|
|
| |||||||||
End of year | $ | 5,435,512,987 | $ | 4,914,566,539 | $ | 2,329,674,224 | $ | 2,427,975,266 | ||||||||
|
|
|
|
|
|
|
| |||||||||
Undistributed (distributions in excess of) net investment income, end of year | $ | — | $ | — | $ | 1,465,427 | $ | 638,661 | ||||||||
Changes in Fund Shares | ||||||||||||||||
Shares sold | 1,164,531 | 729,525 | 4,329,637 | 4,981,396 | ||||||||||||
Issued for distributions reinvested | 11,534,548 | 5,679,801 | 4,887,562 | 6,798,909 | ||||||||||||
Shares redeemed | (8,812,363 | ) | (10,497,234 | ) | (20,768,695 | ) | (16,081,954 | ) | ||||||||
|
|
|
|
|
|
|
| |||||||||
Net increase (decrease) in fund shares | 3,886,716 | (4,087,908 | ) | (11,551,496 | ) | (4,301,649 | ) | |||||||||
|
|
|
|
|
|
|
| |||||||||
The accompanying Notes are an integral part of these financial statements.
| 36 | Statements of Changes in Net Assets |
Table of Contents
GE RSP Funds
Notes to Financial Statements — December 31, 2017
| 1. | Organization of the Funds |
The GE RSP U.S. Equity Fund and GE RSP Income Fund (each, a “Fund” and collectively, the “Funds”) are registered under the Investment Company Act of 1940, as amended (the “1940 Act”), as open-end management investment companies. The Funds are two of the investment options offered under the GE Retirement Savings Plan (the “RSP” or the “Plan”). The Plan, through a trust, owns 71% of the GE RSP U.S. Equity Fund and 76% of the GE RSP Income Fund. The Funds operate as Employees’ Securities Companies (as defined in the 1940 Act) and as such are exempt from certain provisions of the 1940 Act.
| 2. | Summary of Significant Accounting Policies |
The following is a summary of significant accounting policies followed by the Funds in the preparation of its financial statements:
The preparation of financial statements in accordance with U.S. generally accepted accounting principles (“U.S. GAAP”) requires management to make estimates and assumptions that affect the reported amounts and disclosures in the financial statements. Actual results could differ from those estimates. Each Fund is an investment company under U.S. GAAP and follows the accounting and reporting guidance applicable to investment companies.
Security Valuation Each Fund’s investments are valued at fair value each day that the New York Stock Exchange (“NYSE”) is open and, for financial reporting purposes, as of the report date should the reporting period end on a day that the NYSE is not open. Fair value is generally defined as the price a fund would receive to sell an asset or pay to transfer a liability in an orderly transaction between market participants at the measurement date. By its nature, a fair value price is a good faith estimate of the valuation in a current sale and may not reflect an actual market price. The investments of each Fund are valued pursuant to the policy and procedures developed by the Oversight Committee (the “Committee”) and approved by the Board of Trustees (the “Board”). The Committee provides oversight of the valuation of investments for the Funds. The Board has responsibility for determining the fair value of investments.
Valuation techniques used to value each Fund’s investments by major category are as follows:
| • | Equity investments (including preferred stocks) traded on a recognized securities exchange for which market quotations are readily available are valued at the last sale price or official closing price, as applicable, on the primary market or exchange on which they trade. Equity investments traded on a recognized exchange for which there were no sales on that day are valued at the last published sale price or at fair value. |
| • | Government and municipal fixed income securities are generally valued using quotations from independent pricing services or brokers. Certain government inflation-indexed securities may require a calculated fair valuation as the cumulative inflation is contained within the price provided by the pricing service or broker. For these securities, the inflation component of the price is “cleaned” from the pricing service or broker price utilizing the published inflation factors in order to ensure proper accrual of income. |
| • | Debt obligations (including short term investments and convertible debt securities) are valued using quotations from independent pricing services or brokers or are generally valued at the last reported evaluated prices. |
| • | Exchange-traded futures contracts are valued at the closing settlement price on the primary market on which they are traded most extensively. Exchange-traded futures contracts traded on a recognized exchange for which there were no sales on that day are valued at the last reported sale price obtained from independent pricing services or brokers or at fair value. |
| • | Swap agreements are valued daily based upon prices supplied by Board approved pricing vendors or through brokers. Depending on the product and terms of the transaction, the value of agreements is determined using a series of techniques including valuation models that incorporate a number of market data factors, such as discounted cash flows, yields, curves, trades and values of the underlying reference instruments. In the event SSGA Funds Management, Inc. (the “Advisor” or “SSGA FM”) is unable to obtain an independent, third–party valuation the agreements will be fair valued. |
| • | Options on futures are priced at their last sale price on the principal market on which they are traded on the valuation date. If there were no sales on that day, options on futures are valued at either the last reported sale or official closing price on their primary exchange determined in accordance with valuation policy and procedures approved by the Board. |
| Notes to Financial Statements | 37 |
Table of Contents
GE RSP Funds
Notes to Financial Statements, continued — December 31, 2017
In the event prices or quotations are not readily available or that the application of these valuation methods results in a price for an investment that is deemed to be not representative of the fair value of such investment, fair value will be determined in good faith by the Committee, in accordance with the valuation policy and procedures approved by the Board.
The Funds value their assets and liabilities at fair value using a fair value hierarchy consisting of three broad levels that prioritize the inputs to valuation techniques giving the highest priority to readily available unadjusted quoted prices in active markets for identical assets or liabilities (Level 1 measurements) and the lowest priority to unobservable inputs (Level 3 measurements) when market prices are not readily available or reliable. The categorization of a value determined for an investment within the hierarchy is based upon the pricing transparency of the investment and is not necessarily an indication of the risk associated with investing in it.
The three levels of the fair value hierarchy are as follows:
| • | Level 1 — Unadjusted quoted prices in active markets for an identical asset or liability; |
| • | Level 2 — Inputs other than quoted prices included within Level 1 that are observable for the asset or liability either directly or indirectly, including quoted prices for similar assets or liabilities in active markets, quoted prices for identical or similar assets or liabilities in markets that are not considered to be active, inputs other than quoted prices that are observable for the asset or liability (such as exchange rates, financing terms, interest rates, yield curves, volatilities, prepayment speeds, loss severities, credit risks and default rates) or other market-corroborated inputs; and |
| • | Level 3 — Unobservable inputs for the asset or liability, including the Committee’s assumptions used in determining the fair value of investments. |
The value of each Fund’s investments according to the fair value hierarchy as of December 31, 2017 is disclosed in each Fund’s respective Schedule of Investments.
Changes in valuation techniques may result in transfers in or out of an assigned level within the fair value hierarchy. Transfers between different levels of the fair value hierarchy are recognized at the beginning of the reporting period. The Funds had no material transfers between levels for the year ended December 31, 2017.
Investment Transactions and Income Recognition Investment transactions are accounted for on trade date for financial reporting purposes. Realized gains and losses from the sale or disposition of investments and foreign exchange transactions, if any, are determined using the identified cost method.
Dividend income and capital gain distributions, if any, are recognized on the ex-dividend date, net of any foreign taxes withheld at source, if any.
Interest income is recorded daily on an accrual basis. All premiums and discounts are amortized/accreted for financial reporting purposes.
Non-cash dividends received in the form of stock are recorded as dividend income at fair value.
Expenses Certain expenses, which are directly identifiable to a specific Fund, are applied to the Fund that incurs such expenses. Other expenses which cannot be attributed to a specific Fund are allocated in such a manner as deemed equitable, taking into consideration the nature and type of expense and the relative net assets of the Fund.
Distributions The GE RSP Income Fund declares net investment income dividends daily and pays them monthly. The GE RSP U.S. Equity Fund declares and pays dividends from net investment income annually.
Net realized capital gains, if any, are distributed annually, unless additional distributions are required for compliance with applicable tax regulations. The amount and character of income and capital gains to be distributed are determined in accordance with applicable tax regulations which may differ from net investment income and realized gains recognized for U.S. GAAP purposes.
| 3. | Securities and Other Investments |
Delayed Delivery Transactions and When-Issued Securities During the year ended December 31, 2017, the GE RSP Income Fund transacted in securities on a delayed delivery or when-issued basis. Payment and delivery may take place after
| 38 | Notes to Financial Statements |
Table of Contents
GE RSP Funds
Notes to Financial Statements, continued — December 31, 2017
the customary settlement period for that security. The price of the underlying securities and the date when the securities will be delivered and paid for are fixed at the time the transaction is negotiated.
The securities purchased on a delayed delivery or when-issued basis are identified as such in the Funds’ Schedule of Investments. A Fund may receive compensation for interest forgone in the purchase of a delayed delivery or when-issued security. With respect to such purchase commitments, a Fund identifies securities as segregated in its records with a value at least equal to the amount of the commitment. Losses may arise due to changes in the value of the underlying securities or if the counterparty does not perform under the contract’s terms, or if the issuer does not issue the securities due to political, economic or other factors.
To-Be-Announced Transactions The GE RSP Income Fund may seek to obtain exposure to U.S. agency mortgage pass-through securities through the use of “to-be-announced” or “TBA transactions.” “TBA” refers to a commonly used mechanism for the forward settlement of U.S. agency mortgage pass-through securities. In a TBA transaction, the buyer and seller decide on general trade parameters, such as agency, settlement date, coupon, and price.
The GE RSP Income Fund may use TBA transactions to “roll over” such agreements prior to the settlement date. This type of TBA transaction is sometimes known as a “TBA roll.” In a “TBA roll,” the Fund generally will sell the obligation to purchase the pools stipulated in the TBA agreement prior to the settlement date and will enter into a new TBA agreement for future delivery of pools of mortgage pass-through securities. The Fund may also enter into TBA agreements and settle such transactions on the stipulated settlement date by accepting actual receipt or delivery of the pools of mortgage pass-through securities.
Default by or bankruptcy of a counterparty to a TBA transaction would expose the Fund to possible loss because of adverse market action, expenses or delays in connection with the purchase or sale of the pools of mortgage pass-through securities specified in the TBA transaction. To minimize this risk, the Fund will enter into TBA transactions only with established counterparties. The Fund’s use of “TBA rolls” may impact portfolio turnover, transaction costs and capital gain distributions to shareholders.
| 4. | Derivative Financial Instruments |
Futures Contracts The GE RSP Income Fund may enter into futures contracts to meet the Fund’s objectives. A futures contract is a standardized, exchange-traded agreement to buy or sell a financial instrument at a set price on a future date. Upon entering into a futures contract, the Fund is required to deposit with the broker, cash or securities in an amount equal to the minimum initial margin requirements of the clearing house. Subsequent payments are made or received by the Fund equal to the daily change in the contract value and are recorded as variation margin receivable or payable with a corresponding offset to unrealized gains or losses. The Fund recognizes a realized gain or loss when the contract is closed.
Losses may arise if the value of a futures contract decreases due to unfavorable changes in the market rates or values of the underlying instrument during the term of the contract or if the counterparty does not perform under the contract. The use of futures contracts also involves the risk that the movements in the price of the futures contracts do not correlate the movement of the assets underlying such contracts.
For the year ended December 31, 2017, the GE RSP Income Fund entered into futures contracts for management of interest rate risk.
Options on Futures Contracts The GE RSP Income Fund may purchase and write options, including options on futures contracts, subject to certain limitations. Writing puts and buying calls tend to increase the Fund’s exposure to the underlying instrument while buying puts and writing calls tend to decrease the Fund’s exposure to the underlying instrument. The Fund will not enter into a transaction involving options for speculative purposes. The Fund’s risks in using these contracts include changes in the value of the underlying instruments, non-performance of thecounterparties under the contracts’ terms and changes in the liquidity of the secondary market for the contracts.
When the Fund writes an option, the amount of the premium received is recorded as a liability and is subsequently adjusted to the current fair value of the option written. Premiums received from writing options that expire unexercised are treated by the Fund on the expiration date as realized gain from investments. The difference between the premium and the amount paid on effecting a closing purchase transaction, including brokerage commissions, is also treated as a realized gain, or if the premium is less than the amount paid for the closing purchase, as a realized loss. When an option is exercised, the proceeds from the sale of the underlying instrument or the cost basis of the securities purchased is adjusted by the original premium received or
| Notes to Financial Statements | 39 |
Table of Contents
GE RSP Funds
Notes to Financial Statements, continued — December 31, 2017
paid. In return for a premium paid, call and put options on futures contracts give the holder the right, but not the obligation, to purchase or sell, respectively, a position in a particular futures contract at a specified exercise price.
For the year ended December 31, 2017, the GE RSP Income Fund purchased and wrote options in order to hedge against changes in market conditions and interest rates.
Credit Default Swaps During the year ended December 31, 2017, the GE RSP Income Fund engaged in credit default swaps to manage credit risk. When a Fund is the buyer in a credit default swap contract, a Fund is entitled to receive the par (or other agreed upon) value (full notional value) of a referenced debt obligation (or basket of debt obligations) from the counterparty (or central clearing party (“CCP”) in the case of a centrally cleared swap) to the contract if a credit event by a third party, such as a U.S. or foreign corporate issuer or sovereign issuer, on the debt obligation occurs. In return, a Fund pays the counterparty a periodic stream of payments over the term of the contract provided that no credit event has occurred. If no credit event occurs, a Fund loses its investment and recovers nothing. However, if a credit event occurs, a Fund receives full notional value for a referenced debt obligation that may have little or no value. When a Fund is the seller of a credit default swap, it receives a fixed rate of income throughout the term of the contract, provided there is no credit event. If a credit event occurs, a Fund is obligated to pay the notional amount of the swap and in certain instances take delivery of securities of the reference entity upon the occurrence of a credit event, as defined under the terms of that particular swap agreement. Credit events are contract specific but may include bankruptcy, failure to pay, restructuring, obligation acceleration and repudiation/moratorium. If a Fund is a seller of protection and a credit event occurs, the maximum potential amount of future payments that a Fund could be required to make would be an amount equal to the notional amount of the agreement. This potential amount would be partially offset by any recovery value of the respective referenced obligation, or net amount received from the settlement of a buy protection credit default swap agreement entered into by a Fund for the same referenced obligation.
As the seller, a Fund may create economic leverage to its portfolio because, in addition to its total net assets, a Fund is subject to investment exposure on the notional amount of the swap. The interest fee paid or received on the swap, which is based on a specified interest rate on a fixed notional amount, is accrued daily as a component of unrealized appreciation (depreciation) and is recorded as realized gain upon receipt or realized loss upon payment. A Fund also records an increase or decrease to unrealized appreciation (depreciation) in an amount equal to the daily valuation. For centrally cleared swaps, the daily change in valuation is recorded as a receivable or payable for variation margin and settled in cash with the CCP daily. All upfront payments, if any, are amortized over the life of the swap as realized gains or losses. Those upfront payments that are paid or received, typically for non-centrally cleared swaps, are recorded as other assets or other liabilities, respectively, net of amortization. For financial reporting purposes, unamortized upfront payments, if any, are netted with unrealized appreciation or depreciation on swaps to determine the market value of swaps. A Fund segregates assets in the form of cash or liquid securities in an amount equal to the notional amount of the credit default swaps of which it is the seller. A Fund segregates assets in the form of cash or liquid securities in an amount equal to any unrealized depreciation of the credit default swaps of which it is the buyer, marked to market on a daily basis. Credit default swaps involve greater risks than if a Fund had invested in the referenced debt obligation directly. If a Fund is a buyer of a credit default swap and no credit event occurs, a Fund will not earn any return on its investment. If a Fund is a seller of a credit default swap, a Fund’s risk of loss may be the entire notional amount of the swap. Swaps may also subject a Fund to the risk that the counterparty to the transaction may not fulfill its obligation. In the case of centrally cleared swaps, counterparty risk is minimal due to protections provided by the CCP.
Interest Rate Swaps Interest rate swaps involve the exchange by a Fund with another party of their respective commitments to pay or receive interest, such as an exchange of fixed rate payments for floating rate payments.
During the year ended December 31, 2017, the GE RSP Income Fund entered into interest rate swaps in order to manage exposure to interest rates.
| 40 | Notes to Financial Statements |
Table of Contents
GE RSP Funds
Notes to Financial Statements, continued — December 31, 2017
The following tables summarize the value of the Fund’s derivative instruments as of December 31, 2017 and the related location in the accompanying Statements of Assets and Liabilities and Statements of Operations, presented by primary underlying risk exposure:
Asset Derivatives
| Interest Rate Contracts Risk | Foreign Exchange Contracts Risk | Credit Contracts Risk | Equity Contracts Risk | Commodity Contracts Risk | Total | |||||||||||||||||||
GERSP Income Fund |
| |||||||||||||||||||||||
Futures Contracts(a) | $ | 806,617 | $ | — | $ | — | $ | — | $ | — | $ | 806,617 | ||||||||||||
| (a) | Unrealized appreciation on open futures contracts. The Statements of Assets and Liabilities only reflect the current day’s net variation margin. |
Liability Derivatives
| Interest Rate Contracts Risk | Foreign Exchange Contracts Risk | Credit Contracts Risk | Equity Contracts Risk | Commodity Contracts Risk | Total | |||||||||||||||||||
GERSP Income Fund | ||||||||||||||||||||||||
Futures Contracts(a) | $ | (452,321 | ) | $ | — | $ | — | $ | — | $ | — | $ | (452,321 | ) | ||||||||||
Swap Contracts(b) | (523,250 | ) | — | (149,933 | ) | — | — | (673,183 | ) | |||||||||||||||
| (a) | Unrealized depreciation on open futures contracts. The Statements of Assets and Liabilities only reflect the current day’s net variation margin. |
| (b) | Unrealized depreciation on swap contracts. The Statements of Assets and Liabilities only reflect the current day’s net variation margin. |
Net Realized Gain (Loss)
| Interest Rate Contracts Risk | Foreign Exchange Contracts Risk | Credit Contracts Risk | Equity Contracts Risk | Commodity Contracts Risk | Total | |||||||||||||||||||
GERSP Income Fund | ||||||||||||||||||||||||
Futures Contracts | $ | 106,702 | $ | — | $ | — | $ | — | $ | — | $ | 106,702 | ||||||||||||
Swap Contracts | — | — | (5,500,543 | ) | — | — | (5,500,543 | ) | ||||||||||||||||
Purchased Option Contracts(a) | (1,034,800 | ) | — | — | — | — | (1,034,800 | ) | ||||||||||||||||
Written Option Contracts | 688,265 | — | — | — | — | 688,265 | ||||||||||||||||||
| (a) | Options purchased are included in net realized gain (loss) from investments. |
Net Change in Unrealized Appreciation (Depreciation)
| Interest Rate Contracts Risk | Foreign Exchange Contracts Risk | Credit Contracts Risk | Equity Contracts Risk | Commodity Contracts Risk | Total | |||||||||||||||||||
GERSP Income Fund | ||||||||||||||||||||||||
Futures Contracts | $ | 681,176 | $ | — | $ | — | $ | — | $ | — | $ | 681,176 | ||||||||||||
Swap Contracts | (523,250 | ) | — | 1,816,722 | — | — | 1,293,472 | |||||||||||||||||
| Notes to Financial Statements | 41 |
Table of Contents
GE RSP Funds
Notes to Financial Statements, continued — December 31, 2017
| 5. | Fees and Transactions with Affiliates |
Advisory Fee SSGA FM, a registered investment adviser, was retained by the Board to act as investment adviser and administrator of each Fund. SSGA FM’s compensation for investment advisory and administrative services (“Management Fee”) is paid monthly based on the average daily net assets of each Fund. The Management Fee is stated in the following schedule:
| Fund | Average Daily Net Assets of Fund | Management Fee | ||||
GE RSP U.S. Equity Fund | All Assets | 0.12 | % | |||
GE RSP Income Fund | All Assets | 0.13 | % | |||
State Street Bank & Trust Company (“State Street”) serves as the sub-administrator and custodian to the Funds. Amounts paid by the Funds to State Street for performing such services are included in advisory and administration and custody and accounting expenses, respectively.
Due to Custodian In certain circumstances, the Funds may have cash overdraft with the custodian. The Due to Custodian amount, if any, reflects cash overdrawn with State Street as custodian who is an affiliate of the Funds.
| 6. | Investment Transactions |
Purchases and sales of investments (excluding in-kind transactions, short term investments and derivative contracts) for the year ended, December 31, 2017 were as follows:
| Non-U.S. Government Securities | U.S. Government Securities | |||||||||||||||
| Purchases | Sales | Purchases | Sales | |||||||||||||
GE RSP U.S. Equity Fund | $ | 3,981,801,504 | $ | 4,492,627,596 | $ | — | $ | — | ||||||||
GE RSP Income Fund | 826,266,381 | 978,752,796 | 6,140,729,898 | 6,147,264,201 | ||||||||||||
| 7. | Income Taxes |
The Funds have qualified and intend to continue to qualify as regulated investment companies Subchapter M of the Internal Revenue Code of 1986, as amended. Each Fund will not be subject to federal income taxes to the extent they distribute their taxable income, including any net realized capital gains, for each fiscal year. Therefore, no provision for federal income tax is required.
The Funds file federal and various state and local tax returns as required. No income tax returns are currently under examination. Generally, the federal returns are subject to examination by the Internal Revenue Service for a period of three years from date of filing, while the state returns may remain open for an additional year depending upon jurisdiction. SSGA FM has analyzed each Fund’s tax positions taken on tax returns for all open years and does not believe there are any uncertain tax positions that would require recognition of a tax liability.
Distributions to shareholders are recorded on ex-dividend date. Income dividends and gain distributions are determined in accordance with income tax rules and regulations, which may differ from generally accepted accounting principles. Certain capital accounts in the financial statements have been adjusted for permanent book- tax differences. These adjustments have no impact on net asset values or results of operations. Temporary book-tax differences will reverse in the future. These book-tax differences are primarily due to differing treatments for bond basis adjustments, swap contracts, futures contracts, foreign currency gains and losses, distribution re-designations, return of capital adjustments, and wash sale loss deferrals.
The tax character of distributions paid during the year ended December 31, 2017 was as follows:
| Fund | Exempt Income | Ordinary Income | Long-Term Capital Gains | Return of Capital | Total | |||||||||||||||
GE RSP U.S. Equity Fund | $ | — | $ | 189,794,874 | $ | 450,025,725 | $ | — | $ | 639,820,599 | ||||||||||
GE RSP Income Fund | — | 58,342,653 | — | — | 58,342,653 | |||||||||||||||
| 42 | Notes to Financial Statements |
Table of Contents
GE RSP Funds
Notes to Financial Statements, continued — December 31, 2017
The tax character of distributions paid during the year ended December 31, 2016 was as follows:
| Fund | Exempt Income | Ordinary Income | Long-Term Capital Gains | Return of Capital | Total | |||||||||||||||
GE RSP U.S. Equity Fund | $ | — | $ | 85,649,625 | $ | 211,685,454 | $ | — | $ | 297,335,079 | ||||||||||
GE RSP Income Fund | — | 81,343,754 | — | — | 81,343,754 | |||||||||||||||
At December 31, 2017 the components of distributable earnings on a tax basis were as follows:
| Undistributed Ordinary Income | Capital Loss Carryforwards* | Undistributed Long Term Gain | Net Unrealized Gains (Losses) | Total | ||||||||||||||||
GE RSP U.S. Equity Fund | $ | — | $ | — | $ | — | $ | 1,118,851,831 | $ | 1,118,851,831 | ||||||||||
GE RSP Income Fund | 1,465,427 | (11,762,540 | ) | — | 17,669,564 | 7,372,451 | ||||||||||||||
| * | A portion of the Fund’s Capital Loss Carryover may be subject to limitations. |
As of December 31, 2017, capital loss carryforwards available to offset future realized capital gains through the indicated expiration dates as follows:
| Non-Expiring Short-Term* | Non-Expiring Long-Term* | |||||
GE RSP Income Fund | $2,958,163 | $ | 8,804,377 | |||
| * | Must be utilized prior to losses subject to expiration. |
As of December 31, 2017, gross unrealized appreciation and gross unrealized depreciation of investments based on cost for federal income tax purposes were as follows:
| Tax Cost | Gross Unrealized Appreciation | Gross Unrealized Depreciation | Net Unrealized Appreciation (Depreciation) | |||||||||||||||||
| GE RSP U.S. Equity Fund | $ | 4,311,990,757 | $ | 1,208,628,535 | $ | 89,776,704 | $ | 1,118,851,831 | ||||||||||||
| GE RSP Income Fund | 2,372,226,659 | 34,736,894 | 15,597,295 | 19,139,599 | ||||||||||||||||
| 8. | Line of Credit |
The Funds and other affiliated funds (each a “Participant” and, collectively, the “Participants”) participate in a $500 million revolving credit facility provided by a syndication of banks under which the Participants may borrow to fund shareholder redemptions. This agreement expires in October, 2018 unless extended or renewed.
The Participants are charged an annual commitment fee which is calculated based on the unused portion of the shared credit line. Commitment fees are allocated among each of the Participants based on relative net assets. Commitment fees are ordinary fund operation expenses. A Participant incurs and pays the interest expense related to its borrowing. Interest is calculated at a rate per annum equal to the sum of 1% plus the greater of the New York Fed Bank Rate and 1-month LIBOR rate.
Prior to October 12, 2017, the Participants could borrow up to $360 million at any time outstanding, subject to asset coverage and other limitations as specified in the agreements.
The Funds had no outstanding loans as of December 31, 2017.
| 9. | New Accounting Pronouncement |
In March 2017, the Financial Accounting Standards Board (FASB) issued Accounting Standards Update (ASU) No. 2017-08, Receivables — Nonrefundable Fees and Other Costs (Subtopic 310-20): Premium Amortization on Purchased Callable Debt Securities. The amendments in the ASU shorten the amortization period for certain callable debt securities, held at a premium, to be amortized to the earliest call date. The ASU does not require an accounting change for securities held at a discount; which continues to be amortized to maturity. The ASU is effective for fiscal years and interim periods within those fiscal years beginning after December 15, 2018. Management is currently evaluating the impact, if any, of applying this provision.
| 10. | Subsequent Events |
Management has evaluated the impact of all subsequent events on the Fund through the date on which the financial statements were available to be issued and has determined that there were no subsequent events requiring adjustment or disclosure in the financial statements.
| Notes to Financial Statements | 43 |
Table of Contents
GE RSP Funds
Report of Independent Registered Public Accounting Firm

To the Board of Trustees and the Shareholders of
General Electric RSP U.S. Equity Fund and General Electric RSP Income Fund
Opinion on the Financial Statements
We have audited the accompanying statements of assets and liabilities of General Electric RSP U.S. Equity Fund and General Electric RSP Income Fund (each a “Fund” and collectively the “Funds”) including the schedules of investments, as of December 31, 2017, and the related statements of operations for the year then ended, the statements of changes in net assets for each of the years in the two-year period then ended and the financial highlights for each of the years in the two-year period then ended, and the related notes and schedules (collectively referred to as the “financial statements”). In our opinion, the financial statements present fairly, in all material respects, the financial position of the Funds as of December 31, 2017, and the results of their operations for the year then ended, the changes in their net assets for each of the years in the two-year period then ended and their financial highlights for each of the years in the two-year period then ended, in conformity with accounting principles generally accepted in the United States of America (“GAAP”). The statements of changes in net assets and the financial highlights for each of the years presented through December 31, 2015 were audited by other auditors, whose report dated February 22, 2016 expressed an unqualified opinion on those financial statements and financial highlights.
Basis for Opinion
These financial statements and financial highlights are the responsibility of the Funds’ management. Our responsibility is to express an opinion on the Funds’ financial statements and financial highlights based on our audits. We are a public accounting firm registered with the Public Company Accounting Oversight Board (United States) (“PCAOB”) and are required to be independent with respect to the Funds in accordance with the U.S. federal securities law and the applicable rules and regulations of the Securities and Exchange Commission and the PCAOB.
We conducted our audits in accordance with the standards of the PCAOB. Those standards require that we plan and perform the audits to obtain reasonable assurance about whether the financial statements and financial highlights are free of material misstatement, whether due to error or fraud. The Funds are not required to have, nor were we engaged to perform, an audit of their internal control over financial reporting. As part of our audits we are required to obtain an understanding of internal control over financial reporting but not for the purpose of expressing an opinion on the effectiveness of the Funds’ internal control over financial reporting. Accordingly, we express no such opinion.
Our audits included performing procedures to assess the risk of material misstatement of those financial statements, whether due to error or fraud, and performing procedures that respond to those risks. Such procedures included examining, on a test basis, evidence regarding the amounts and disclosures in the financial statements. Our procedures included confirmation of securities owned as of December 31, 2017 by correspondence with the custodian and brokers, or by other appropriate auditing procedures where replies from brokers were not received. Our audits also included evaluating the accounting principles used and significant estimates made by management, as well as evaluating the overall presentation of the financial statements. We believe that our audits provide a reasonable basis for our opinion.

BBD, LLP
We have served as the auditor of one or more of the Funds since 2016.
Philadelphia, Pennsylvania
February 23, 2018
| 44 | Report of Independent Registered Public Accounting Firm |
Table of Contents
GE RSP Funds
Tax Information — December 31, 2017 (Unaudited)
For federal income tax purposes, the following information is furnished with respect to the distributions paid from the Funds during the fiscal year ended December 31, 2017.
Dividends Received Deduction
The GE RSP U.S. Equity Fund reports the maximum amount allowable of its net taxable income as eligible for the corporate dividends received deduction.
Qualified Dividend Income
A portion of dividends distributed by the GE RSP U.S. Equity Fund during the fiscal year ended December 31, 2017 is considered qualified dividend income and are eligible for reduced tax rates. These lower rates range from 5% to 20% depending on the individual’s tax bracket. The GE RSP U.S. Equity Fund reports the maximum amount allowable of its net taxable income as qualified dividend income as provided in the Jobs and Growth Tax Relief Reconciliation Act of 2003.
Long Term Capital Gain Distributions
Long term capital gains dividends were paid from the GE RSP U.S. Equity Fund during the year ended December 31, 2017 in the amount of $450,025,725.
| Tax Information | 45 |
Table of Contents
GE RSP Funds
Additional Information — December 31, 2017 (Unaudited)
Name, Address and Age | Position(s) Held with Fund | Term of Office and Length of Time Served | Principal Occupation(s) During Past 5 years | Number of Portfolios in Fund Complex Overseen by Trustee/ Officer | Other Directorships Held by Trustee/Officer | |||||||
INTERESTED TRUSTEES AND EXECUTIVE OFFICERS | ||||||||||||
Jeanne M. La Porta SSGA FM 1600 Summer St. Stamford, CT 06905
Age 52 | President | Term: Until successor is elected and qualified Served: Since July 2016 | Senior Managing Director at State Street Global Advisors (July 2016 – present); Director of State Street Global Advisors Funds Distributors, LLC (May 2017 – present); President of GE Retirement Savings Plan Funds (July 2016 – present); Senior Vice President and Commercial Operations Leader at GE Asset Management Incorporated (“GEAM”) (March 2014 – July 2016); President of State Street Institutional Funds and State Street Variable Insurance Series Funds, Inc. (April 2014 – present); President and Trustee of GEAM’s UCITs Funds (March 2014 – November 2014); Senior Vice President and Commercial Administrative Officer at GEAM (April 2010 – March 2014); Vice President of State Street Institutional Funds (July 2003 – present); Vice President of Elfun Funds and GE Retirement Savings Plan Funds (October 2003 – July 2016); Secretary of GE Funds (July 2007 – September 2010) and Vice President (July 2007 – February 2011); Senior Vice President and Deputy General Counsel of GEAM (October 2007 – April 2010); Vice President and Assistant Secretary of Elfun Funds and GE Retirement Savings Plan Funds (July 2003 – June 2010); and Vice President and Associate General Counsel – Marketing and Client Services (formerly Asset Management Services) at GEAM (May 1997 – October 2007). | N/A | Director of State Street Variable Insurance Series Funds, Inc. (2014 – present); Trustee and President of State Street Institutional Funds (2014 – present); Trustee of Elfun Funds (2014 – present). | |||||||
| 46 | Additional Information |
Table of Contents
GE RSP Funds
Additional Information — December 31, 2017 (Unaudited), continued
Name, Address and Age | Position(s) Held with Fund | Term of Office and Length of Time Served | Principal Occupation(s) During Past 5 years | Number of Portfolios in Fund Complex Overseen by Trustee/ Officer | Other Directorships Held by Trustee/Officer | |||||||
INTERESTED TRUSTEES AND EXECUTIVE OFFICERS (continued) | ||||||||||||
Arthur A. Jensen SSGA FM 1600 Summer St. Stamford, CT 06905
Age 51 | Treasurer | Term: Until successor is elected and qualified Served: Since June 2011 | Vice President at State Street Global Advisors (July 2016 – present); Deputy Treasurer of Elfun Funds (July 2016 – present); Treasurer of State Street Institutional Funds, State Street Variable Insurance Series Funds, Inc. and GE Retirement Savings Plan Funds (June 2011 – present); Treasurer of Elfun Funds (June 2011 – July 2016); Mutual Funds Controller of GEAM (April 2011 – July 2016). | N/A | N/A | |||||||
Robert Herlihy SSGA FM 1600 Summer St. Stamford, CT 06905
Age 50 | Chief Compliance Officer | Term: Until successor is elected and qualified Served: Since July 2005 | Managing Director at State Street Global Advisors (July 2016 – present); Deputy Chief Compliance Officer of Elfun Funds (July 2016 – present); Chief Compliance Officer of State Street Institutional Funds, State Street Variable Insurance Series Funds, Inc. and GE Retirement Savings Plan Funds (July 2005 – present); Chief Compliance Officer of GEAM and Elfun Funds (July 2005 – July 2016). | N/A | N/A | |||||||
Brian Harris SSGA FM State Street Financial Center One Lincoln Street Boston, MA 02111-2900
Age 44 | Anti-Money Laundering Officer | Term: Until successor is elected and qualified Served: Since December 2016 | Managing Director, State Street Global Advisors and SSGA Funds Management, Inc. (June 2013 – present)*; Senior Vice President and Global Head of Investment Compliance, BofA Global Capital Management (2010 – 2013). | N/A | N/A | |||||||
Bruce S. Rosenberg SSGA FM State Street Financial Center One Lincoln Street Boston, MA 02111-2900
Age 56 | Assistant Treasurer | Term: Until successor is elected and qualified Served: Since March 2017 | Managing Director, State Street Global Advisors and SSGA Funds Management, Inc. (July 2015 – present); Director, Credit Suisse (April 2008 – July 2015). | N/A | N/A | |||||||
| Additional Information | 47 |
Table of Contents
GE RSP Funds
Additional Information — December 31, 2017 (Unaudited), continued
Name, Address and Age | Position(s) Held with Fund | Term of Office and Length of Time Served | Principal Occupation(s) During Past 5 years | Number of Portfolios in Fund Complex Overseen by Trustee/ Officer | Other Directorships Held by Trustee/Officer | |||||||
INTERESTED TRUSTEES AND EXECUTIVE OFFICERS (continued) | ||||||||||||
Ann M. Carpenter SSGA FM State Street Financial Center One Lincoln Street Boston, MA 02111-2900
Age 51 | Assistant Treasurer | Term: Until successor is elected and qualified Served: Since March 2017 | Chief Operating Officer, SSGA Funds Management, Inc. (2005- present)*; Managing Director, State Street Global Advisors (2005 – present).* | N/A | N/A | |||||||
Chad C. Hallett SSGA FM State Street Financial Center One Lincoln Street Boston, MA 02111-2900
Age 48 | Assistant Treasurer | Term: Until successor is elected and qualified Served: Since March 2017 | Vice President, State Street Global Advisors and SSGA Funds Management, Inc. (November 2014 – present); Vice President, State Street Bank and Trust Company (2001 – November 2014). | N/A | N/A | |||||||
Darlene Anderson-Vasquez SSGA FM State Street Financial Center One Lincoln Street Boston, MA 02111-2900
Age 49 | Assistant Treasurer | Term: Until successor is elected and qualified Served: Since March 2017 | Managing Director, State Street Global Advisors and SSGA Funds Management, Inc. (May 2016 – present); Senior Vice President, John Hancock Investments (September 2007 – May 2016). | N/A | N/A | |||||||
Daniel G. Plourde SSGA FM State Street Financial Center One Lincoln Street Boston, MA 02111-2900
Age 38 | Assistant Treasurer | Term: Until successor is elected and qualified Served: Since June 2017 | Assistant Vice President, SSGA Funds Management, Inc. (May 2015 – present); Officer, State Street Bank and Trust Company (March 2009 – May 2015). | |||||||||
Jesse D. Hallee State Street Bank and Trust Company 100 Summer Street, Floor 7 Mail Stop SUM0703 Boston, MA 02111
Age 41 | Secretary | Term: Until successor is elected and qualified Served: Since March 2017 | Vice President and Managing Counsel, State Street Bank and Trust Company (2013 – present); Vice President and Counsel, Brown Brothers Harriman & Co. (2007 – 2013). | N/A | N/A | |||||||
| * | Served in various capacities and/or with various affiliated entities during noted time period. |
| 48 | Additional Information |
Table of Contents
GE RSP Funds
Additional Information — December 31, 2017 (Unaudited), continued
Name, and Age | Position(s) Held with Fund | Term of Office and Length of Time Served | Principal Occupation(s) During Past 5 years | Number of Portfolios in Fund Complex Overseen by Trustee/ Officer | Other Directorships Held by Trustee/Officer | |||||||
INTERESTED TRUSTEES AND EXECUTIVE OFFICERS | ||||||||||||
Matthew Zakrzewski c/o SSGA FM 1600 Summer St. Stamford, CT 06905
Age 57 | Chairman of the Board of Trustees | Term: Until successor is elected and qualified Served: Since 2014 | Managing Director, Benefit Plans since July 2016; Executive Vice President and Chief Financial Officer of GEAM from August 2013 to June 2016; formerly, Chief Financial Officer for GE Ventures from 2012 to 2013 and Chief Financial Officer for GE Risk, Insurance and Corporate Financing from 2006 to 2012. | 2 | GEAM; GE Asset Management Limited; GE Asset Management Canada Company; GE Investment Distributors, Inc. (“GEID”); GE Pension Trust Limited; Common Investment Fund. | |||||||
Scott Silberstein c/o SSGA FM 1600 Summer St. Stamford, CT 06905
Age 53 | Trustee | Term: Until successor is elected and qualified Served: Since July 2016 | Executive Counsel, GE since 2016; Senior Vice President & Deputy General Counsel of GEAM from 1995 – 2016. | 2 | GEAM; GE Asset Management Limited; GE International Management Incorporated; GE International Management II Incorporated; GEID. | |||||||
Gregory Bouleris c/o SSGA FM 1600 Summer St. Stamford, CT 06905
Age 52 | Trustee | Term: Until successor is elected and qualified Served: Since July 2016 | Investment Oversight Leader, GE since 2016; Multi-Manager Programs Leader from 2015 – 2016; Senior Vice-President Product Management 2008 – 2015. | 2 | GEID. | |||||||
Vaidheesh Krishnamurti c/o SSGA FM 1600 Summer St. Stamford, CT 06905
Age 39 | Trustee | Term: Until successor is elected and qualified Served: Since July 2016 | Chief Financial Officer of Benefit Plans since May 2016; Manager, Financial Planning and Analysis at GEAM from December 2014 to May 2016; Manager, Investment Performance at GEAM from May 2012 to December 2014; Operational Controller/Senior Analyst at GEAM from June 2008 to May 2012. | 2 | GEAM. | |||||||
Pamela Westmoreland c/o SSGA FM 1600 Summer St. Stamford, CT 06905
Age 59 | Trustee | Term: Until successor is elected and qualified Served: Since July 2016 | Risk and Asset Allocation Leader at GE Benefit Plans from 2016 to present; Head of Fixed Income Credit Research at GEAM from 2013 to 2016; Fixed Income Strategist from 2012 to 2013; Team Leader, Fixed Income Research from 2007 to 2012. | 2 | ||||||||
| Additional Information | 49 |
Table of Contents
GE RSP Funds
Investment Restrictions (Unaudited)
The GE RSP U.S. Equity Fund
Investments by the GE RSP U.S. Equity Fund are subject to the following restrictions:
| a. | Moneys in the GE RSP U.S. Equity Fund will not be used in the underwriting of securities or for the purchase of real estate, interests in real estate, investment trusts, commodities or commodity contracts, or invested in companies for the purpose of exercising control or management, or invested in securities of registered investment companies. |
| b. | Moneys in the GE RSP U.S. Equity Fund will not be lent to others, although they may be applied to the purchase of bonds and debt securities of a type publicly distributed or customarily purchased by institutional investors. |
| c. | The GE RSP U.S. Equity Fund will not acquire any securities if immediately after such acquisition and as a result thereof (i) the GE RSP U.S. Equity Fund would hold more than 10% of the outstanding voting securities of any issuer, (ii) more than 5% of the value of the total assets in the GE RSP U.S. Equity Fund would be represented by the securities of any one issuer (except securities of the U.S. Government and its instrumentalities), (iii) more than 25% of the value of the total assets in the GE RSP U.S. Equity Fund would be invested in any particular industry, or (iv) more than 5% of the value of the total assets in the GE RSP U.S. Equity Fund would be invested in issuers which (including predecessors) have not been in continuous operation for at least three years. |
| d. | The GE RSP U.S. Equity Fund will not invest in securities of GE or its affiliates, or in securities of the investment adviser, and will not during the existence of any underwriting syndicate purchase any securities for which its investment adviser is acting as principal underwriter. |
| e. | The GE RSP U.S. Equity Fund will not purchase from or sell any of its portfolio securities to GE or its affiliates or its investment adviser or any officer or director thereof. This investment restriction is not intended to prohibit the GE RSP U.S. Equity Fund from engaging in such transactions with other investment companies or accounts managed by the investment adviser or the investment adviser’s affiliates when the transactions are entered into in accordance with the Investment Company Act and the rules thereunder. |
| f. | The GE RSP U.S. Equity Fund will not engage in margin transactions or short sales or participate in a joint trading account. |
| g. | The GE RSP U.S. Equity Fund will not invest in puts, calls or similar options. |
| h. | The GE RSP U.S. Equity Fund may borrow money from the GE Savings and Security Trust and secure repayment by pledging assets of the GE RSP U.S. Equity Fund. The GE RSP U.S. Equity Fund may also borrow money as a temporary measure to meet cash or administrative needs. Except with respect to borrowings from the GE Savings and Security Trust, the GE RSP U.S. Equity Fund will not mortgage or pledge any of its assets. |
The GE RSP Income Fund
The GE RSP Income Fund will not:
| a. | purchase securities on margin or sell short or participate in a joint trading account; |
| b. | deal in options to buy or sell securities except to the extent permitted by law; |
| c. | borrow money or property except as a temporary measure to meet the cash or administrative needs of the GE RSP Income Fund. In no event will the amount of such borrowings exceed 10% of such the GE RSP Income Funds’ total assets taken at market value at the time of such borrowing; |
| d. | make cash loans to others except through the purchase of debt securities in accordance with the GE RSP Income Fund’s investment objectives; |
| e. | invest in interests in oil, gas or other mineral lease or production agreements; |
| f. | act as an underwriter of securities for other issuers except that the GE RSP Income Fund may acquire securities under circumstances where if they are later resold it may be deemed to be an underwriter under the Securities Act of 1933, as amended (“Securities Act”); |
| g. | purchase securities for the purpose of exercising control or management; |
| 50 | Investment Restrictions |
Table of Contents
GE RSP Funds
Investment Restrictions (Unaudited), continued
| h. | pledge, mortgage or hypothecate any of its assets except, that, to secure borrowings permitted by subparagraph c, it may pledge securities which, together with all such securities previously so pledged, at the time of pledge, do not exceed 10% of the GE RSP Income Fund’s total assets; |
| i. | unless otherwise permitted by law, purchase from or sell directly to any of its officers or Trustees or the officers or directors of its investment adviser, or any other affiliate (as defined in the Investment Company Act) of the GE RSP Income Fund or any affiliate of such affiliate, portfolio securities or other property of the RSP Income Fund; |
| j. | unless otherwise permitted by law, invest in securities of GE or its affiliates, or in securities of an investment adviser of the GE RSP Income Fund and will not during the existence of any underwriting syndicate purchase any securities for which its investment adviser is acting as principal underwriter; |
| k. | purchase any security if as a result of such purchase more than 25% of its total assets would be invested in a particular industry; |
| l. | purchase any security if as a result of such purchase more than 25% of its total assets would be subject to legal or contractual restrictions on resale; or |
| m. | invest in the securities of registered investment companies. |
| Investment Restrictions | 51 |
Table of Contents
GE RSP Funds
Investment Adviser
SSGA Funds Management, Inc.
Board of Trustees
Matthew Zakrzewski, Chairman
Scott Silberstein
Gregory Bouleris
Pamela Westmoreland
Vaidheesh Krishnamurti
Portfolio Managers
GE RSP U.S. Equity Fund
David B. Carlson
Thomas Lincoln
Christopher Sierakowski
GE RSP Income Fund
Matthew Nest
Mark H. Johnson
Independent Registered Public Accounting Firm
BBD, LLP
Custodian
State Street Bank & Trust Company
Shareholder Servicing Agent
Address all inquiries inside the Plan to:
GE Retirement Savings Plan Service Center
c/o Fidelity Investments
P.O. Box 770003
Cincinnati, OH 45277-0065
Address all inquiries outside the Plan to:
GE RSP Mutual Funds
U.S. Bancorp Fund Services, LLC
P.O. Box 701
Milwaukee, WI 53201-0701
| 52 | Investment Team |
Table of Contents
GE RSP Funds
Shareholder Services
INSIDE THE RETIREMENT SAVINGS PLAN
Shares or units held inside the Plan have been credited to your account as a result of contributions and investment earnings. For a statement summarizing your account balance in the Plan, please refer to your GE RSP Retirement Savings Statement, which is provided quarterly and is available online at any time or upon request. You may obtain additional information and process transactions on investments held inside the Plan by calling:
GE Retirement Savings Plan Service Center: 1-877-55-GERSP (1-877-554-3777)
or visit OneHR.ge.com > Retirement (or RSP) > My GE RSP
OUTSIDE THE RETIREMENT SAVINGS PLAN
If shares of the GE RSP U.S. Equity and the GE RSP Income Funds have been distributed to you from the Plan, information on these investments may be obtained by calling:
SSGA Funds Management, Inc.: 1-800-242-0134
or visit www.ssga.com/geam
| Shareholder Services | 53 |
Table of Contents
GE RSP Funds
1600 Summer Street
Stamford, CT 06905
Or at:
PO Box 7900
Stamford, CT 06904-7900
www.ssga.com/geam
The Funds file their complete schedules of portfolio holdings with the Securities and Exchange Commission for the first, second and third quarters of each fiscal year on Form N-Q. The Funds’ Forms N-Q, as well as a description of the policies and procedures that the Funds use to determine how to vote proxies (if any) relating to portfolio securities is available without charge (i) upon request, by calling 1-800-242-0134; (ii) on the Funds’ website at http://www.ssga.com/geam; and (iii) on the Commission’s website at http://www.sec.gov. The Funds’ Forms N-Q may be reviewed and copied at the Commission’s Public Reference Room in Washington, DC — information on the operation of the Public Reference Room may be obtained by calling 1-800-SEC-0330.
Information (if any) regarding how the Funds voted proxies relating to portfolio securities during the most recently disclosed 12-months period ended June 30 is available without charge (i) through the Funds’ website at http://www.ssga.com/geam; and (ii) on the Commission’s website at http://www.sec.gov.
Table of Contents
| Item 2. | Code of Ethics. |
As of the end of the period covered by this report, General Electric RSP U.S. Equity Fund (the “Registrant” or the “Fund”) has adopted a code of ethics, as defined in Item 2(b) of Form N-CSR, that applies to the Registrant’s principal executive officer, principal financial officer, principal accounting officer or controller, or persons performing similar functions, regardless of whether these individuals are employed by the Registrant or a third party (the “Code”). That Code comprises written standards that are reasonably designed to deter wrongdoing and to promote: (1) honest and ethical conduct, including the ethical handling of actual or apparent conflicts of interest between personal and professional relationships; (2) full, fair, accurate, timely and understandable disclosure in reports and documents that the Registrant files with, or submits to, the U.S. Securities Exchange Commission (the “SEC”) and in other public communications made by the Registrant; (3) compliance with applicable laws and governmental rules and regulations; (4) the prompt internal reporting to an appropriate person or persons identified in the Code of violations of the Code; and (5) accountability for adherence to the Code. The Registrant has not made any amendments to the Code that relates to any element of the code of ethics definition set forth in Item 2(b) of Form N-CSR during the covered period. The Registrant has not granted any waivers from any provisions of the Code during the covered period. A copy of the Code is filed as Exhibit 13(a)(1) to this Form N-CSR.
| Item 3. | Audit Committee Financial Expert. |
The Fund’s Board of Trustees (the “Board”) has determined that the Fund has the following “audit committee financial experts” as defined in Item 3(b) of Form N-CSR serving on its audit committee (the “Audit Committee”): Mr. Matthew Zakrzewski and Mr. Vaidheesh Krishnamurti. Each of the “audit committee financial experts” are deemed to be “interested persons” of the Registrant as defined in Section 2(a)(19) of the Act (15 U.S.C. 80a-2(a)(19)).
An “audit committee financial expert” is not an “expert” for any purpose, including for purposes of Section 11 of the Securities Act of 1933, as amended, as a result of being designated as an “audit committee financial expert.” Further, the designation of a person as an “audit committee financial expert” does not mean that the person has any greater duties, obligations, or liability than those imposed on the person without the “audit committee financial expert” designation. Similarly, the designation of a person as an “audit committee financial expert” does not affect the duties, obligations, or liability of any other member of the Audit Committee or the Board.
Table of Contents
| Item 4. | Principal Accountant Fees and Services. |
| (a) | Audit Fees |
For the fiscal years ended December 31, 2017 and December 31, 2016, the aggregate audit fees billed for professional services rendered BBD, LLP (“BBD”), the Registrant’s principal accountant, for the audit of the Registrant’s annual financial statements, or services that are normally provided by BBD in connection with the Registrant’s statutory and regulatory filings and engagements were $14,000 and $14,000, respectively.
| (b) | Audit-Related Fees |
For the fiscal years ended December 31, 2017 and December 31, 2016, there were no fees for assurance and related services by BBD reasonably related to the performance of the audit of the Fund’s financial statements that were not reported under paragraph (a) of this Item.
| (c) | Tax Fees |
For the fiscal years ended December 31, 2017 and December 31, 2016, there were no fees for professional services rendered by BBD for tax compliance, tax advice or tax planning.
| (d) | All Other Fees |
For the fiscal years ended December 31, 2017 and December 31, 2016, there were no fees billed for professional services rendered by BBD for products and services provided by BBD to the Fund, other than the services reported in paragraphs (a) through (c). During the fiscal years ended December 31, 2017 and December 31, 2016, fees were billed for a Security Count under Rule 17f-2 in the amount of $9,000 and $1,000, respectively.
| (e)(1) | Audit Committee Pre-Approval Policies and Procedures |
The Audit Committee of the General Electric RSP Funds (the “Funds”) Board of Trustees is responsible for, among other things, the appointment, compensation and oversight of the work of the Funds’ Auditor. As part of this responsibility and to ensure that the Auditor’s independence is not impaired, the Audit Committee (1) pre-approves the audit and non-audit services provided to the Funds by the Auditor, and (2) all non-audit services provided to the Funds’ investment adviser and Covered Affiliates (as defined in the Audit Committee Charter) that provide ongoing services to the Funds if the services directly impact the Funds’ operations or financial reporting, in accordance with the Audit Committee Charter. The following excerpt from the Audit Committee Charter sets forth the pre-approval policies and procedures:
Pre-Approval of Audit Related Services and Permissible Non-Audit Services. The Audit Committee shall pre-approve both audit (including audit, review, and attest) services and permissible non-audit services provided to the Fund and, if the nature of the engagement relates directly to the operations and financial reporting of the Fund, permissible non-audit services provided to any Covered Affiliate.
Table of Contents
The Audit Committee may determine to delegate the authority to grant pre-approvals to one or more Audit Committee members, each acting on behalf of the Audit Committee. In this event, the member of the Audit Committee so delegated shall report each delegated pre-approval to the Audit Committee at its next regularly scheduled meeting. The Audit Committee may also adopt and follow, in lieu of explicit pre-approval described above, written policies and procedures detailed as to the particular service, designed to safeguard the continued independence of the Auditor, consistent with the requirements of the Investment Company Act of 1940, as amended (the “1940 Act”), and SEC regulations thereunder.
Notwithstanding the foregoing, the pre-approval requirement concerning permissible non-audit services provided to the Fund or any Covered Affiliate is waived if: (1) the aggregate amount of all such non-audit services provided constitutes no more than five percent (5%) of the total amount of revenues paid to the Auditor by the Fund and the Covered Affiliates during the fiscal year in which the services are provided that would have to be pre-approved by the Audit Committee, (2) the non-audit services were not recognized as non-audit services at the time of the engagement, and (3) such non-audit services are promptly brought to the attention of the Audit Committee and approved by the Audit Committee or one or more designated members of the Audit Committee prior to the completion of the audit.
| (e)(2) | Percentages of Services |
None of the services described in paragraphs (b) through (d) of this Item were performed in reliance on paragraph (c)(7)(i)(C) of Rule 2-01 of Regulation S-X during the period of time for which such rule was effective.
| (f) | Not applicable. |
| (g) | Total Fees Paid By Adviser and Certain Affiliates |
For the fiscal years ended December 31, 2017 and December 31, 2016, the aggregate non-audit fees billed by BBD for services rendered to the Fund and SSGA Funds Management, Inc. (“SSGA FM” or the “Adviser”) and any entity controlling, controlled by, or under common control with the Adviser that provided ongoing services to the Funds were $0 and $0, respectively.
| (h) | BBD notified the Fund’s Audit Committee of all non-audit services that were rendered by BBD to the Adviser and any entity controlling, controlled by, or under common control with BBD that provides services to the Fund, which services were not required to be pre-approved pursuant to paragraph (c)(7)(ii) of Rule 2-01 of Regulation S-X, allowing the Fund’s Audit Committee to consider whether such services were compatible with maintaining BBD’s independence. |
| Item 5. | Audit Committee of Listed Registrants. |
Not applicable to the Registrant.
Table of Contents
| Item 6. | Schedule of Investments. |
| (a) | Schedule of Investments is included as part of the report to shareholders filed under Item 1 of this Form N-CSR. |
| (b) | Not applicable to the Registrant. |
| Item 7. | Disclosure of Proxy Voting Policies and Procedures for Closed-End Management Investment Companies. |
Not applicable to the Registrant.
| Item 8. | Portfolio Managers of Closed-End Management Investment Companies. |
Not applicable to the Registrant.
| Item 9. | Purchases of Equity Securities by Closed-End Management Investment Company and Affiliated Purchasers. |
Not applicable to the Registrant.
| Item 10. | Submission of Matters to a Vote of Security Holders. |
There were no material changes to the procedures by which shareholders may recommend nominees to the Registrant’s Board.
| Item 11. | Controls and Procedures. |
(a) The Registrant’s principal executive officer and principal financial officer have concluded that the Registrant’s disclosure controls and procedures (as defined in Rule 30a-3(c) under the 1940 Act) are effective to provide reasonable assurance that information required to be disclosed by the Registrant on Form N-CSR is recorded, processed, summarized and reported as of a date within 90 days of the filing date of this report, based on their evaluation of these controls and procedures required by Rule 30a-3(b) under the 1940 Act and Rules 13a-15(b) or 15d-15(b) under the Securities Exchange Act of 1934, as amended.
(b) There were no changes in the Registrant’s internal control over financial reporting (as defined in Rule 30a-3(d) under the 1940 Act) that occurred during the Registrant’s last fiscal quarter of the period covered by this Form N-CSR filing that have materially affected, or are reasonably likely to materially affect, the Registrant’s internal control over financial reporting.
| Item 12. | Disclosure of Securities Lending Activities for Closed-End Management Investment Companies. |
(a) Not applicable.
(b) Not applicable.
Table of Contents
| Item 13. | Exhibits. | |
| (a)(1) | Code of Ethics pursuant to Item 2 of Form N-CSR is attached hereto. | |
| (a)(2) | Certifications of principal executive officer and principal financial and accounting officer of the Registrant as required by Rule 30a-2(a) under the 1940 Act are attached hereto. | |
| (a)(3) | Not applicable to the Registrant. | |
| (b) | Certifications of principal executive officer and principal financial and accounting officer of the Registrant as required by Rule 30a-2(b) under the 1940 Act and Section 906 of the Sarbanes-Oxley Act of 2002 are attached hereto. | |
Table of Contents
SIGNATURES
Pursuant to the requirements of the Securities Exchange Act of 1934 and the Investment Company Act of 1940, the Registrant has duly caused this report to be signed on its behalf by the undersigned, thereunto duly authorized.
| Registrant: | GENERAL ELECTRIC RSP U.S. EQUITY FUND | |
| By: | /s/ Jeanne M. La Porta | |
| Jeanne M. La Porta | ||
| President | ||
| Date: | February 16, 2018 | |
Pursuant to the requirements of the Securities Exchange Act of 1934 and the Investment Company Act of 1940, this report has been signed below by the following persons on behalf of the Registrant and in the capacities and on the dates indicated.
| By: | /s/ Jeanne M. La Porta | |
| Jeanne M. La Porta | ||
| President (Principal Executive Officer) | ||
| Date: | February 16, 2018 | |
| By: | /s/ Arthur A. Jensen | |
| Arthur A. Jensen | ||
| Treasurer (Principal Financial and Accounting Officer) | ||
| Date: | February 16, 2018 | |