Exhibit 99.2

Ally Financial Inc. 1Q Earnings Review Contact Ally Investor Relations at (866) 710 - 4623 or investor.relations@ally.com May 1, 2013
2 1Q 2013 Preliminary Results Forward - Looking Statements and Additional Information The following should be read in conjunction with the financial statements, notes and other information contained in the Compa ny’ s Annual Reports on Form 10 - K, Quarterly Reports on Form 10 - Q, and Current Reports on Form 8 - K . This information is preliminary and based on company data available at the time of the presentation In the presentation that follows and related comments by Ally Financial Inc. (“Ally”) management, the use of the words “expec t,” “anticipate,” “estimate,” “forecast,” “initiative,” “objective,” “plan,” “goal,” “project,” “outlook,” “priorities,” “target,” “intend,” “e val uate,” “pursue,” “seek,” “may,” “ would, ” “ could, ” “ should, ” “ believe, ” “ potential, ” “ continue,” , or the negative of these words, or similar expressions is intended to identify forward - looking statements. All statements herein and in related management comments, other than statements of historical fact, including without limitation, statements about future events and financial performance, are forward - looking statements that involve certain risks and uncertainties. While these statements represent Ally’s current judgment on what the future may hold, and Ally believes these judgments are reasonable, these statements are not guarantees of any events or financial results, and Ally’s actual results may differ materially due to nume rou s important factors that are described in the most recent reports on SEC Forms 10 - K and 10 - Q for Ally, each of which may be revised or supplemented in subsequent reports filed with the SEC. Such factors include, among others, the following: maintaining the mutually beneficial relationsh ip between Ally and General Motors (“GM”), and Ally and Chrysler Group LLC (“Chrysler”); the profitability and financial condition of GM and Chry sle r; resolution of the bankruptcy filings by Residential Capital, LLC and certain of its subsidiaries; our ability to realize the anticipated benefi ts associated with being a bank holding company, and the increased regulation and restrictions that we are now subject to; the potential for deteriorati on in the residual value of off - lease vehicles; disruptions in the market in which we fund our operations, with resulting negative impact on our liquidit y; changes in our accounting assumptions that may require or that result from changes in the accounting rules or their application, which could re sult in an impact on earnings; changes in the credit ratings of Ally, Chrysler, or GM; changes in economic conditions, currency exchange rates or pol itical stability in the markets in which we operate; and changes in the existing or the adoption of new laws, regulations, policies or other acti vit ies of governments, agencies and similar organizations (including as a result of the Dodd - Frank Act and Basel III). Investors are cautioned not to place undue reliance on forward - looking statements. Ally undertakes no obligation to update publi cly or otherwise revise any forward - looking statements except where expressly required by law. Reconciliation of non - GAAP financial measures incl uded within this presentation are provided in this presentation. Use of the term “loans” describes products associated with direct and indirect lending activities of Ally’s global operations . T he specific products include retail installment sales contracts, loans, lines of credit, leases or other financing products. The term “originate” ref ers to Ally’s purchase, acquisition or direct origination of various “loan” products .
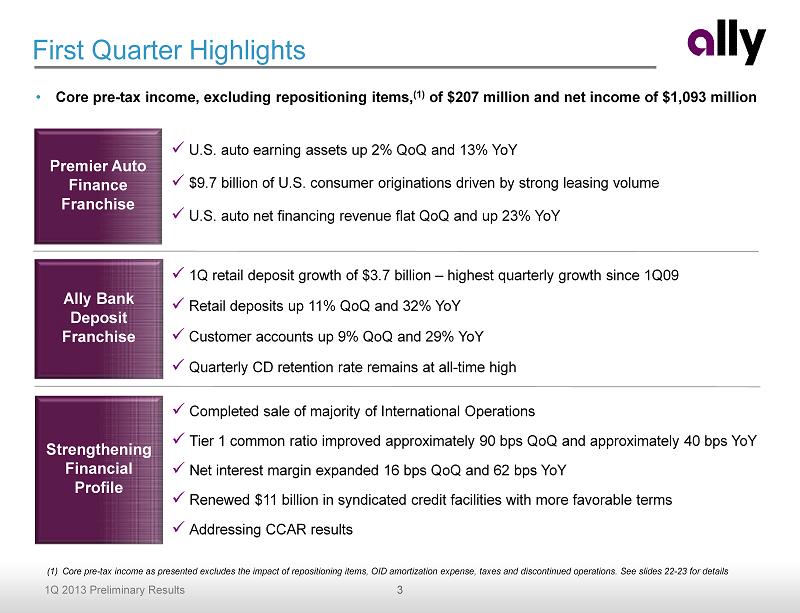
3 1Q 2013 Preliminary Results x 1Q retail deposit growth of $3.7 billion – highest quarterly growth since 1Q09 x Retail deposits up 11% QoQ and 32% YoY x Customer accounts up 9% QoQ and 29% YoY x Quarterly CD retention rate remains at all - time high Premier Auto Finance Franchise x Completed sale of majority of International Operations x Tier 1 common ratio improved approximately 90 bps QoQ and approximately 40 bps YoY x Net interest margin expanded 16 bps QoQ and 62 bps YoY x Renewed $11 billion in syndicated credit facilities with more favorable terms x Addressing CCAR results Strengthening Financial Profile Ally Bank Deposit Franchise x U.S. auto earning assets up 2% QoQ and 13% YoY x $9.7 billion of U.S. consumer originations driven by strong leasing volume x U.S. auto net financing revenue flat QoQ and up 23% YoY First Quarter Highlights (1) Core pre - tax income as presented excludes the impact of repositioning items, OID amortization expense, taxes and discontinued op erations. See slides 22 - 23 for details • Core pre - tax income, excluding repositioning items, (1) of $207 million and net income of $1,093 million
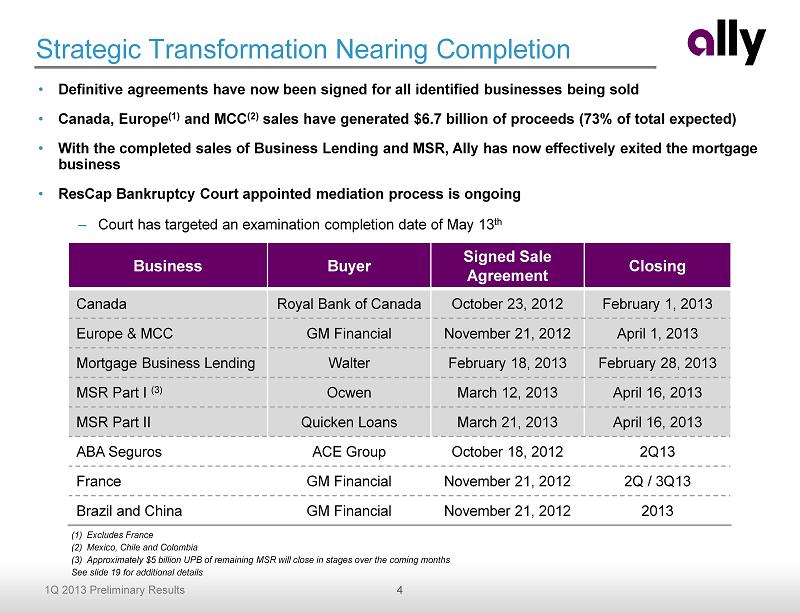
4 1Q 2013 Preliminary Results Strategic Transformation Nearing Completion • Definitive agreements have now been signed for all identified businesses being sold • Canada, Europe (1) and MCC (2) sales have generated $6.7 billion of proceeds (73% of total expected) • With the completed sales of Business Lending and MSR, Ally has now effectively exited the mortgage business • ResCap Bankruptcy Court appointed mediation process is ongoing – Court has targeted an examination completion date of May 13 th Business Buyer Signed Sale Agreement Closing Canada Royal Bank of Canada October 23, 2012 February 1, 2013 Europe & MCC GM Financial November 21, 2012 April 1, 2013 Mortgage Business Lending Walter February 18, 2013 February 28, 2013 MSR Part I (3) Ocwen March 12, 2013 April 16, 2013 MSR Part II Quicken Loans March 21, 2013 April 16, 2013 ABA Seguros ACE Group October 18, 2012 2Q13 France GM Financial November 21, 2012 2Q / 3Q13 Brazil and China GM Financial November 21, 2012 2013 (1) Excludes France (2) Mexico, Chile and Colombia (3) Approximately $5 billion UPB of remaining MSR will close in stages over the coming months See slide 19 for additional details
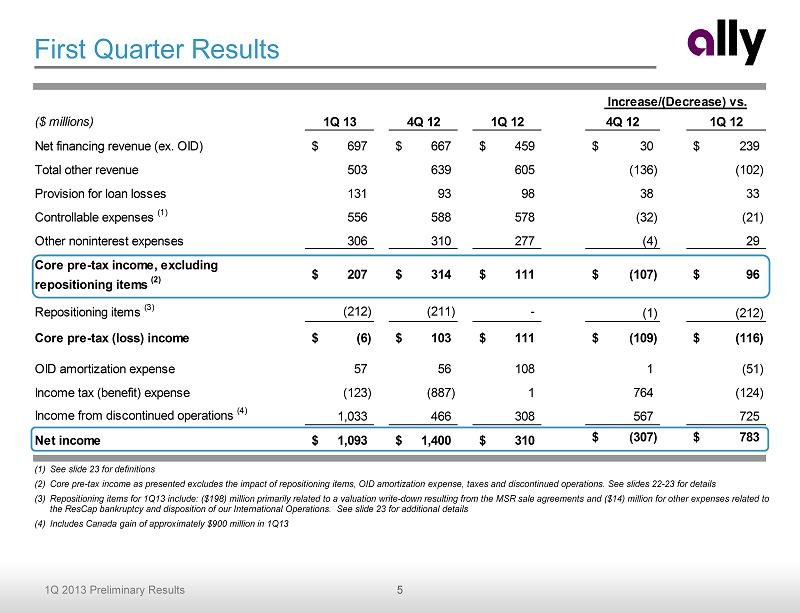
5 1Q 2013 Preliminary Results ($ millions) 1Q 13 4Q 12 1Q 12 4Q 12 1Q 12 Net financing revenue (ex. OID) 697$ 667$ 459$ 30$ 239$ Total other revenue 503 639 605 (136) (102) Provision for loan losses 131 93 98 38 33 Controllable expenses (1) 556 588 578 (32) (21) Other noninterest expenses 306 310 277 (4) 29 Core pre-tax income, excluding repositioning items (2) 207$ 314$ 111$ (107)$ 96$ Repositioning items (3) (212) (211) - (1) (212) Core pre-tax (loss) income (6)$ 103$ 111$ (109)$ (116)$ OID amortization expense 57 56 108 1 (51) Income tax (benefit) expense (123) (887) 1 764 (124) Income from discontinued operations (4) 1,033 466 308 567 725 Net income 1,093$ 1,400$ 310$ (307)$ 783$ Increase/(Decrease) vs. First Quarter Results (1) See slide 23 for definitions (2) Core pre - tax income as presented excludes the impact of repositioning items, OID amortization expense, taxes and discontinued op erations. See slides 22 - 23 for details (3) Repositioning items for 1Q13 include: ($198) million primarily related to a valuation write - down resulting from the MSR sale agr eements and ($14) million for other expenses related to the ResCap bankruptcy and disposition of our International Operations. See slide 23 for additional details (4) Includes Canada gain of approximately $900 million in 1Q13
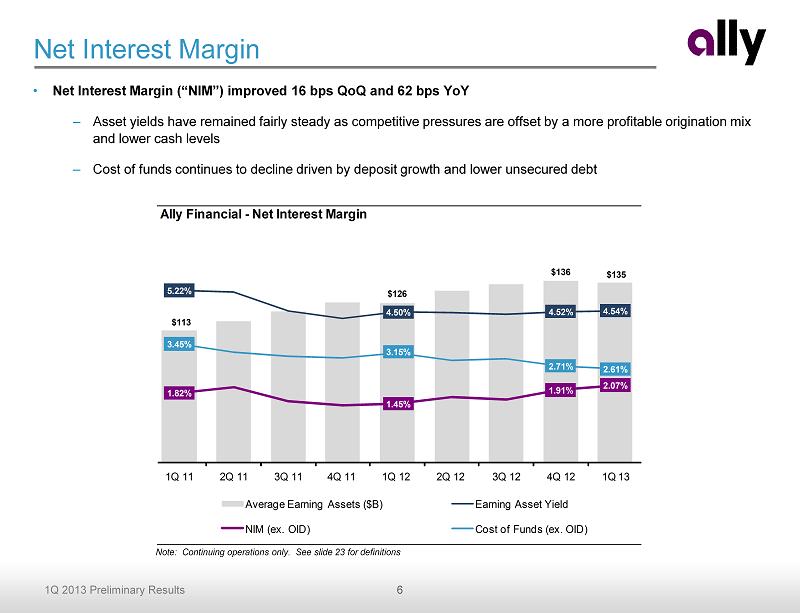
6 1Q 2013 Preliminary Results Net Interest Margin • Net Interest Margin (“NIM”) improved 16 bps QoQ and 62 bps YoY – Asset yields have remained fairly steady as competitive pressures are offset by a more profitable origination mix and lower cash levels – Cost of funds continues to decline driven by deposit growth and lower unsecured debt Note: Continuing operations only. See slide 23 for definitions Ally Financial - Net Interest Margin $113 $126 $136 $135 5.22% 4.50% 4.52% 4.54% 1.82% 1.45% 1.91% 2.07% 3.45% 3.15% 2.71% 2.61% 1Q 11 2Q 11 3Q 11 4Q 11 1Q 12 2Q 12 3Q 12 4Q 12 1Q 13 Average Earning Assets ($B) Earning Asset Yield NIM (ex. OID) Cost of Funds (ex. OID)
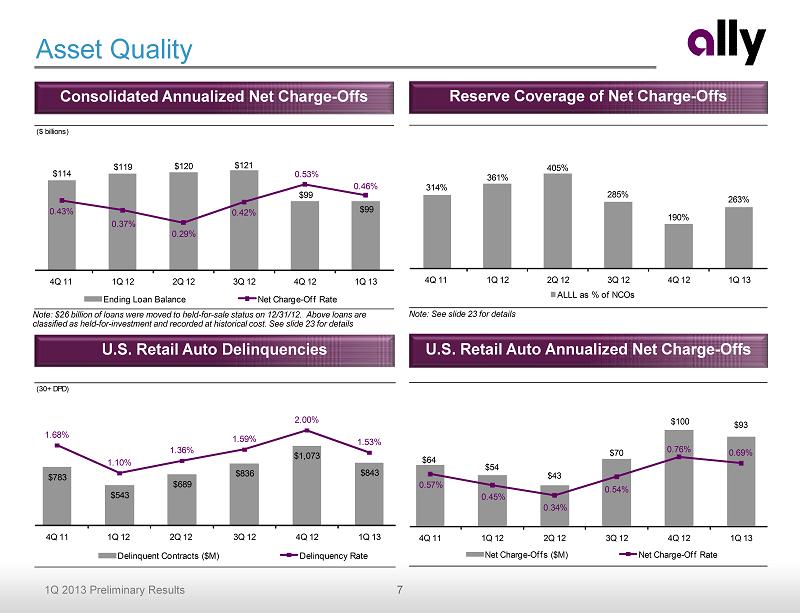
7 1Q 2013 Preliminary Results Consolidated Annualized Net Charge - Offs Reserve C overage of Net Charge - Offs Asset Quality U.S. Retail Auto Annualized Net Charge - Offs U.S. Retail Auto Delinquencies Note: $26 billion of loans were moved to held - for - sale status on 12/31/12. Above loans are classified as held - for - investment and recorded at historical cost. See slide 23 for details Note: See slide 23 for details (30+ DPD) $783 $543 $689 $836 $1,073 $843 1.68% 1.10% 1.36% 1.59% 2.00% 1.53% 4Q 11 1Q 12 2Q 12 3Q 12 4Q 12 1Q 13 Delinquent Contracts ($M) Delinquency Rate $64 $54 $43 $70 $100 $93 0.57% 0.45% 0.34% 0.54% 0.76% 0.69% 4Q 11 1Q 12 2Q 12 3Q 12 4Q 12 1Q 13 Net Charge - Offs ($M) Net Charge - Off Rate 314% 361% 405% 285% 190% 263% 4Q 11 1Q 12 2Q 12 3Q 12 4Q 12 1Q 13 ALLL as % of NCOs ($ billions) $114 $119 $120 $121 $99 $99 0.43% 0.37% 0.29% 0.42% 0.53% 0.46% 4Q 11 1Q 12 2Q 12 3Q 12 4Q 12 1Q 13 Ending Loan Balance Net Charge - Off Rate
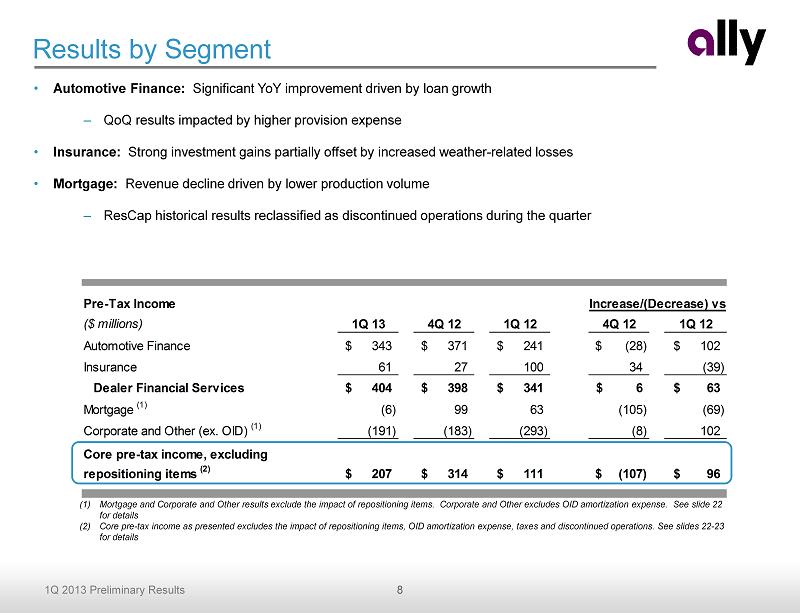
8 1Q 2013 Preliminary Results Pre-Tax Income ($ millions) 1Q 13 4Q 12 1Q 12 4Q 12 1Q 12 Automotive Finance 343$ 371$ 241$ (28)$ 102$ Insurance 61 27 100 34 (39) Dealer Financial Services 404$ 398$ 341$ 6$ 63$ Mortgage (1) (6) 99 63 (105) (69) Corporate and Other (ex. OID) (1) (191) (183) (293) (8) 102 Core pre-tax income, excluding repositioning items (2) 207$ 314$ 111$ (107)$ 96$ Increase/(Decrease) vs. • Automotive Finance: Significant YoY improvement driven by loan growth – QoQ results impacted by higher provision expense • Insurance: Strong investment gains partially offset by increased weather - related losses • Mortgage: Revenue decline driven by lower production volume – ResCap historical results reclassified as discontinued operations during the quarter Results by Segment (1) Mortgage and Corporate and Other results exclude the impact of repositioning items. Corporate and Other excludes OID amortiz ati on expense. See slide 22 for details (2) Core pre - tax income as presented excludes the impact of repositioning items, OID amortization expense, taxes and discontinued op erations. See slides 22 - 23 for details

9 1Q 2013 Preliminary Results Key Financials ($ millions) 1Q 13 4Q 12 1Q 12 Net financing revenue 773$ 776$ 630$ Total other revenue 82 58 77 Total net revenue 855 834 707 Provision for loan losses 112 59 78 Noninterest expense 400 404 388 Pre-tax income 343$ 371$ 241$ Total assets 118,882$ 128,411$ 119,081$ U.S. auto earning assets 101,716$ 100,085$ 90,398$ • Auto finance reported pre - tax income of $343 million in 1Q – Net financing revenue continues to be strong primarily driven by growth in consumer and commercial portfolios ▪ Day count impact of ($12) million vs. 4Q – Provision increased from prior periods as the portfolio continues to shift to a more diversified mix ▪ QoQ change driven primarily by a qualitative reserve release in 4Q • $9.7 billion of U.S. consumer originations contributing to earning asset growth – Subvented originations continue to decline as expected – Leases now comprise 28% of originations • Average floorplan outstandings up 8% YoY • Recipient of two Dealers’ Choice Awards for Auto Finance and SmartAuction businesses (1) – Ninth consecutive year of recognition for Ally SmartAuction Auto Finance – Results (1) Source: Auto Dealer Monthly’s 2013 “Dealers’ Choice Awards” U.S. Auto Earning Asset Composition (EOP) 11% 4% 19% 4% 15% 16% 28% 3% New GM Subvented New Chrysler Subvented New Standard Rate New Diversified Lease Used Floorplan Other Commercial See slide 23 for definitions
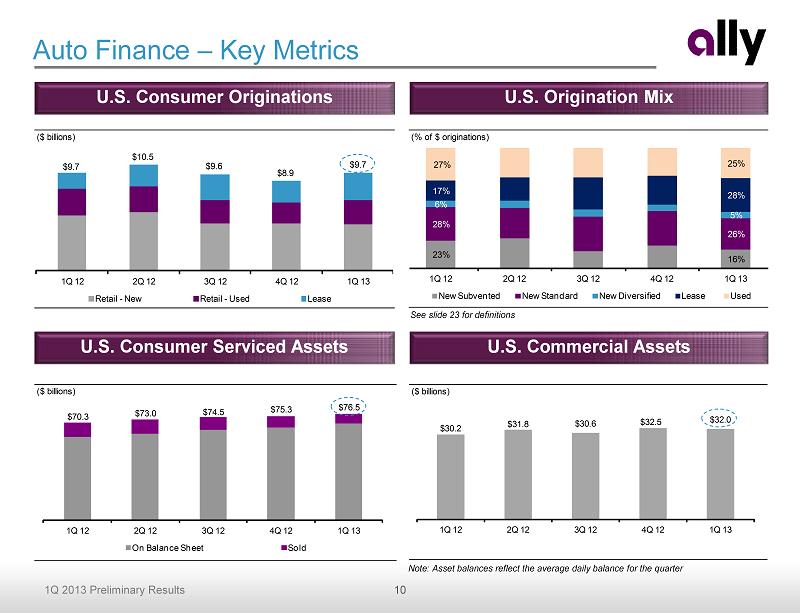
10 1Q 2013 Preliminary Results ($ billions) $9.7 $10.5 $9.6 $8.9 $9.7 1Q 12 2Q 12 3Q 12 4Q 12 1Q 13 Retail - New Retail - Used Lease ($ billions) $30.2 $31.8 $30.6 $32.5 $32.0 1Q 12 2Q 12 3Q 12 4Q 12 1Q 13 ($ billions) $70.3 $73.0 $74.5 $75.3 $76.5 1Q 12 2Q 12 3Q 12 4Q 12 1Q 13 On Balance Sheet Sold Auto Finance – Key Metrics See slide 23 for definitions U.S. Consumer Serviced Assets U.S. Commercial Assets U.S. Consumer Originations U.S. Origination Mix Note: Asset balances reflect the average daily balance for the quarter (% of $ originations) 23% 16% 28% 26% 6% 5% 17% 28% 27% 25% 1Q 12 2Q 12 3Q 12 4Q 12 1Q 13 New Subvented New Standard New Diversified Lease Used
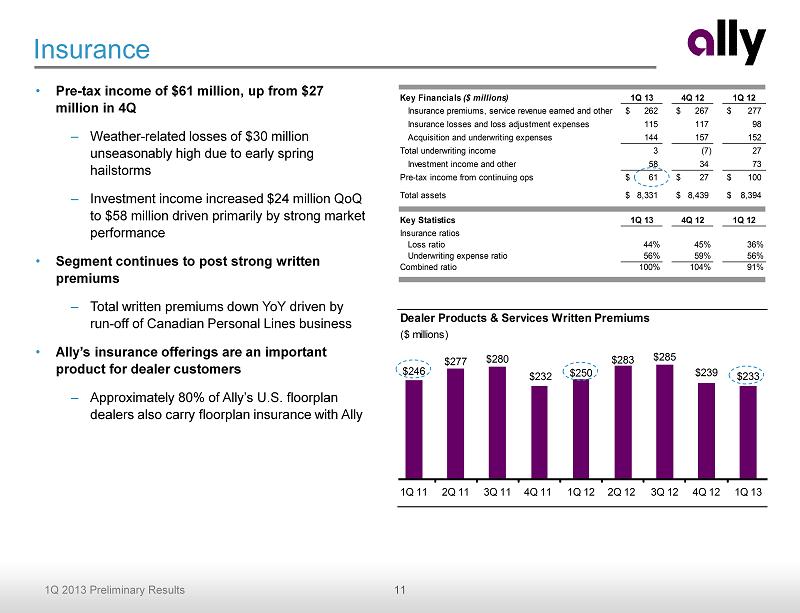
11 1Q 2013 Preliminary Results Key Financials ($ millions) 1Q 13 4Q 12 1Q 12 Insurance premiums, service revenue earned and other 262$ 267$ 277$ Insurance losses and loss adjustment expenses 115 117 98 Acquisition and underwriting expenses 144 157 152 Total underwriting income 3 (7) 27 Investment income and other 58 34 73 Pre-tax income from continuing ops 61$ 27$ 100$ Total assets 8,331$ 8,439$ 8,394$ Key Statistics 1Q 13 4Q 12 1Q 12 Insurance ratios Loss ratio 44% 45% 36% Underwriting expense ratio 56% 59% 56% Combined ratio 100% 104% 91% Dealer Products & Services Written Premiums ($ millions) $246 $277 $280 $232 $250 $283 $285 $239 $233 1Q 11 2Q 11 3Q 11 4Q 11 1Q 12 2Q 12 3Q 12 4Q 12 1Q 13 Insurance • Pre - tax income of $61 million, up from $27 million in 4Q – Weather - related losses of $30 million unseasonably high due to early spring hailstorms – Investment income increased $24 million QoQ to $58 million driven primarily by strong market performance • Segment continues to post strong written premiums – Total written premiums down YoY driven by run - off of Canadian Personal Lines business • Ally’s insurance offerings are an important product for dealer customers – Approximately 80% of Ally’s U.S. floorplan dealers also carry floorplan insurance with Ally
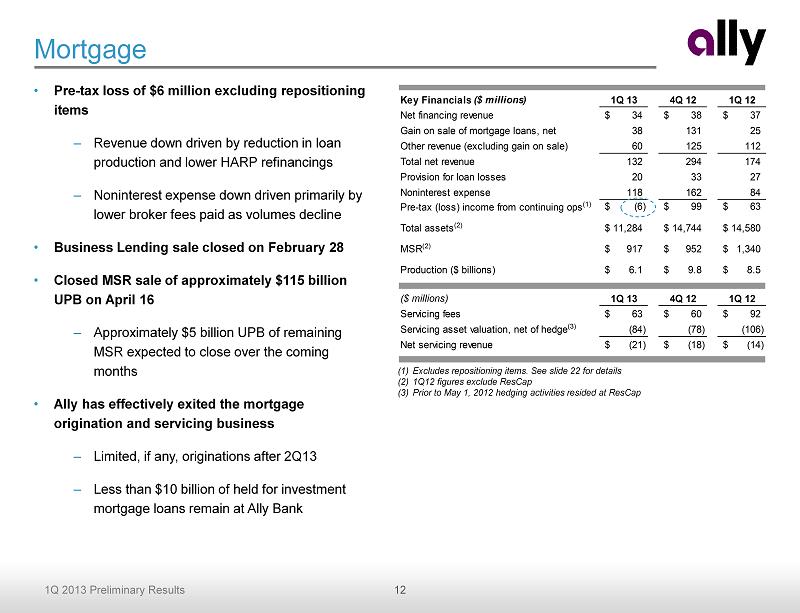
12 1Q 2013 Preliminary Results Key Financials ($ millions) 1Q 13 4Q 12 1Q 12 Net financing revenue 34$ 38$ 37$ Gain on sale of mortgage loans, net 38 131 25 Other revenue (excluding gain on sale) 60 125 112 Total net revenue 132 294 174 Provision for loan losses 20 33 27 Noninterest expense 118 162 84 Pre-tax (loss) income from continuing ops (1) (6)$ 99$ 63$ Total assets (2) 11,284$ 14,744$ 14,580$ MSR (2) 917$ 952$ 1,340$ Production ($ billions) 6.1$ 9.8$ 8.5$ TRUE ($ millions) 1Q 13 4Q 12 1Q 12 Servicing fees 63$ 60$ 92$ Servicing asset valuation, net of hedge (3) (84) (78) (106) Net servicing revenue (21)$ (18)$ (14)$ Mortgage • Pre - tax loss of $6 million excluding repositioning items – Revenue down driven by reduction in loan production and lower HARP refinancings – Noninterest expense down driven primarily by lower broker fees paid as volumes decline • Business Lending sale closed on February 28 • Closed MSR sale of approximately $115 billion UPB on April 16 – Approximately $5 billion UPB of remaining MSR expected to close over the coming months • Ally has effectively exited the mortgage origination and servicing business – Limited, if any, originations after 2Q13 – Less than $10 billion of held for investment mortgage loans remain at Ally Bank (1) Excludes repositioning items. See slide 22 for details (2) 1Q12 figures exclude ResCap (3) Prior to May 1, 2012 hedging activities resided at ResCap
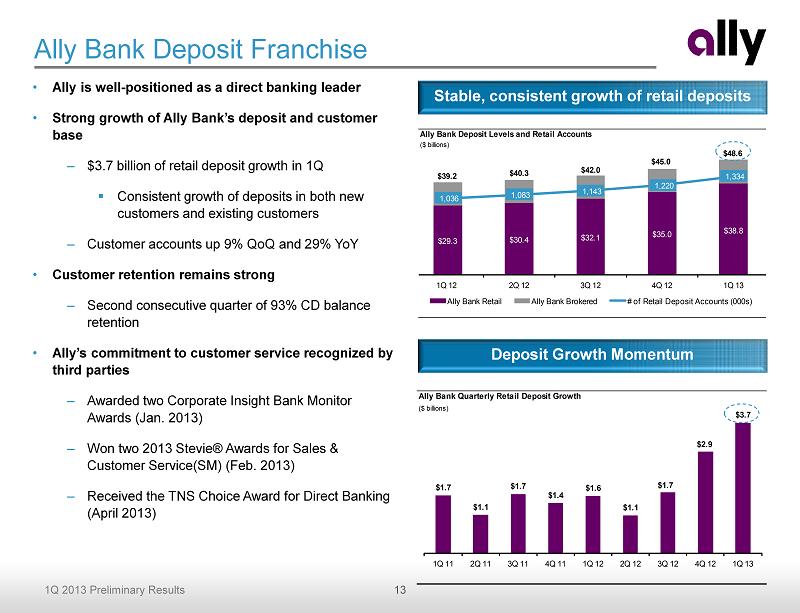
13 1Q 2013 Preliminary Results Ally Bank Deposit Levels and Retail Accounts ($ billions) $29.3 $30.4 $32.1 $35.0 $38.8 $39.2 $40.3 $42.0 $45.0 $48.6 1,036 1,083 1,143 1,220 1,334 1Q 12 2Q 12 3Q 12 4Q 12 1Q 13 Ally Bank Retail Ally Bank Brokered # of Retail Deposit Accounts (000s) Ally Bank Quarterly Retail Deposit Growth ($ billions) $1.7 $1.1 $1.7 $1.4 $1.6 $1.1 $1.7 $2.9 $3.7 1Q 11 2Q 11 3Q 11 4Q 11 1Q 12 2Q 12 3Q 12 4Q 12 1Q 13 Ally Bank Deposit Franchise • Ally is well - positioned as a direct banking leader • Strong growth of Ally Bank’s deposit and customer base – $3.7 billion of retail deposit growth in 1Q ▪ Consistent growth of deposits in both new customers and existing customers – Customer accounts up 9% QoQ and 29% YoY • Customer retention remains strong – Second consecutive quarter of 93% CD balance retention • Ally’s commitment to customer service recognized by third parties – Awarded two Corporate Insight Bank Monitor Awards (Jan. 2013) – Won two 2013 Stevie® Awards for Sales & Customer Service(SM) (Feb. 2013) – Received the TNS Choice Award for Direct Banking (April 2013) Stable, consistent growth of retail deposits Deposit Growth Momentum
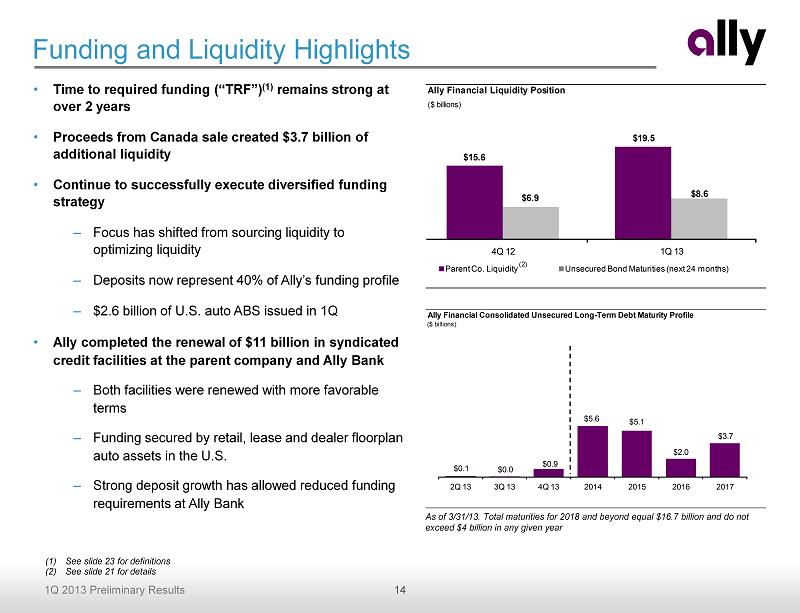
14 1Q 2013 Preliminary Results Ally Financial Consolidated Unsecured Long-Term Debt Maturity Profile ($ billions) $0.1 $0.0 $0.9 $5.6 $5.1 $2.0 $3.7 2Q 13 3Q 13 4Q 13 2014 2015 2016 2017 Ally Financial Liquidity Position ($ billions) $15.6 $19.5 $6.9 $8.6 4Q 12 1Q 13 Parent Co. Liquidity Unsecured Bond Maturities (next 24 months) • Time to required funding (“TRF”) (1) remains strong at over 2 years • Proceeds from Canada sale created $3.7 billion of additional liquidity • Continue to successfully execute diversified funding strategy – Focus has shifted from sourcing liquidity to optimizing liquidity – Deposits now represent 40% of Ally’s funding profile – $2.6 billion of U.S. auto ABS issued in 1Q • Ally completed the renewal of $11 billion in syndicated credit facilities at the parent company and Ally Bank – Both facilities were renewed with more favorable terms – Funding secured by retail, lease and dealer floorplan auto assets in the U.S. – Strong deposit growth has allowed reduced funding requirements at Ally Bank Funding and Liquidity Highlights (1) See slide 23 for definitions (2) See slide 21 for details (2) As of 3/31/13. Total maturities for 2018 and beyond equal $16.7 billion and do not exceed $4 billion in any given year
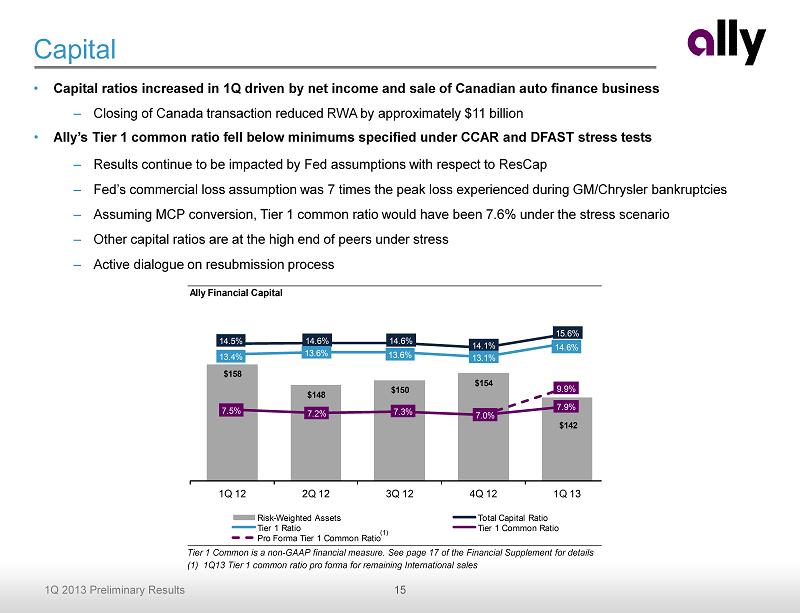
15 1Q 2013 Preliminary Results Ally Financial Capital $158 $148 $150 $154 $142 14.5% 14.6% 14.6% 14.1% 15.6% 13.4% 13.6% 13.6% 13.1% 14.6% 7.5% 7.2% 7.3% 7.0% 7.9% 9.9% 1Q 12 2Q 12 3Q 12 4Q 12 1Q 13 Risk - Weighted Assets Total Capital Ratio Tier 1 Ratio Tier 1 Common Ratio Pro Forma Tier 1 Common Ratio Capital • Capital ratios increased in 1Q driven by net income and sale of Canadian auto finance business – Closing of Canada transaction reduced RWA by approximately $11 billion • Ally’s Tier 1 common ratio fell below minimums specified under CCAR and DFAST stress tests – Results continue to be impacted by Fed assumptions with respect to ResCap – Fed’s commercial loss assumption was 7 times the peak loss experienced during GM/Chrysler bankruptcies – Assuming MCP conversion, Tier 1 common ratio would have been 7.6% under the stress scenario – Other capital ratios are at the high end of peers under stress – Active dialogue on resubmission process Tier 1 Common is a non - GAAP financial measure. See page 17 of the Financial Supplement for details (1) 1Q13 Tier 1 common ratio pro forma for remaining International sales (1)

16 1Q 2013 Preliminary Results Conclusion • Positive core business trends – Earning asset growth – Stable loss performance – Cost of funds declining – Strong deposit growth • Priorities – CCAR requirements – ongoing regulatory dialogue – Improve business efficiencies and reduce noninterest expense – U.S. Treasury repayment – ResCap bankruptcy process Positioned for Future Success as Strategic Transformation Nears Completion
Supplemental Charts

18 1Q 2013 Preliminary Results Corporate and Other • Lower net financing loss driven by declining cost of funds • OID amortization expense of $57 million in 1Q • Commercial Finance pre - tax income of $18 million in 1Q • Other revenue impacted by derivative activity • Noninterest expense impacted by payroll tax accruals and higher FDIC fees Supplemental (1) Excludes repositioning items. See slide 22 for details (2) Primarily bond exchange OID amortization expense used for calculating core pre - tax income (3) Excludes ResCap impact in 1Q12 As of 3/31/13. Primarily represents bond exchange OID amortization expense used for calculating core pre - tax income Key Financials ($ millions) 1Q 13 4Q 12 1Q 12 Net financing loss (122)$ (169)$ (220)$ Total other revenue 15 46 53 Total net loss (ex. OID) (107) (123) (167) Provision for loan losses (1) 1 (7) Noninterest expense 86 59 133 Core pre-tax loss (1) (191)$ (183)$ (293)$ OID amortization expense (2) 57 56 108 Pre-tax loss from continuing ops (1) (249)$ (239)$ (401)$ Total assets (3) 27,702$ 30,753$ 37,005$ OID Amortization Schedule ($ millions) $192 $176 Avg = $52/yr $962 $336 $249 2011 2012 2013 2014 2015 and thereafter Remaining Previous/Current Period
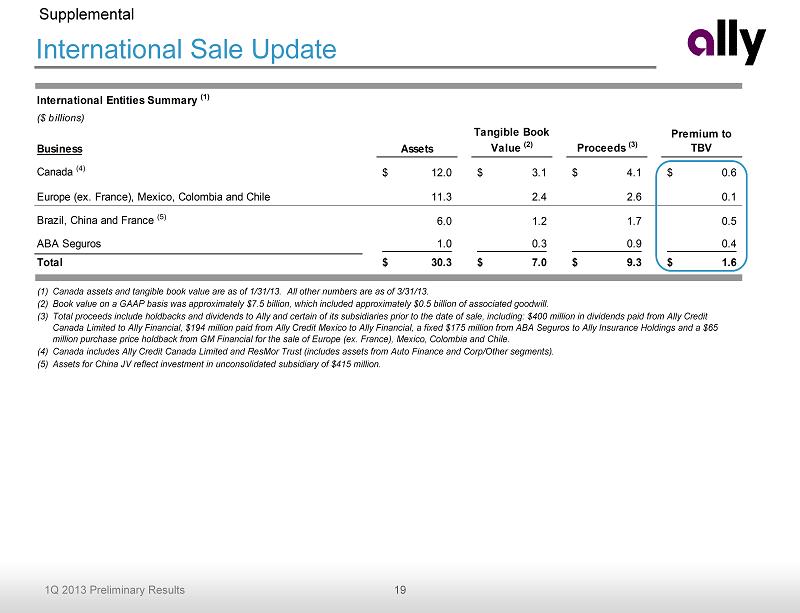
19 1Q 2013 Preliminary Results International Sale Update (1) Canada assets and tangible book value are as of 1/31/13. All other numbers are as of 3/31/13. (2) Book value on a GAAP basis was approximately $ 7.5 billion, which included approximately $0.5 billion of associated goodwill. (3) Total proceeds include holdbacks and dividends to Ally and certain of its subsidiaries prior to the date of sale, including: $40 0 million in dividends paid from Ally Credit Canada Limited to Ally Financial, $194 million paid from Ally Credit Mexico to Ally Financial, a fixed $175 million from ABA Seguros to Ally Insurance Holdings and a $65 million purchase price holdback from GM Financial for the sale of Europe (ex. France), Mexico, Colombia and Chile. (4) Canada includes Ally Credit Canada Limited and ResMor Trust (includes assets from Auto Finance and Corp/Other segments). (5) Assets for China JV reflect investment in unconsolidated subsidiary of $415 million. Supplemental International Entities Summary (1) ($ billions) Business Assets Tangible Book Value (2) Proceeds (3) Premium to TBV Canada (4) 12.0$ 3.1$ 4.1$ 0.6$ Europe (ex. France), Mexico, Colombia and Chile 11.3 2.4 2.6 0.1 Brazil, China and France (5) 6.0 1.2 1.7 0.5 ABA Seguros 1.0 0.3 0.9 0.4 Total 30.3$ 7.0$ 9.3$ 1.6$
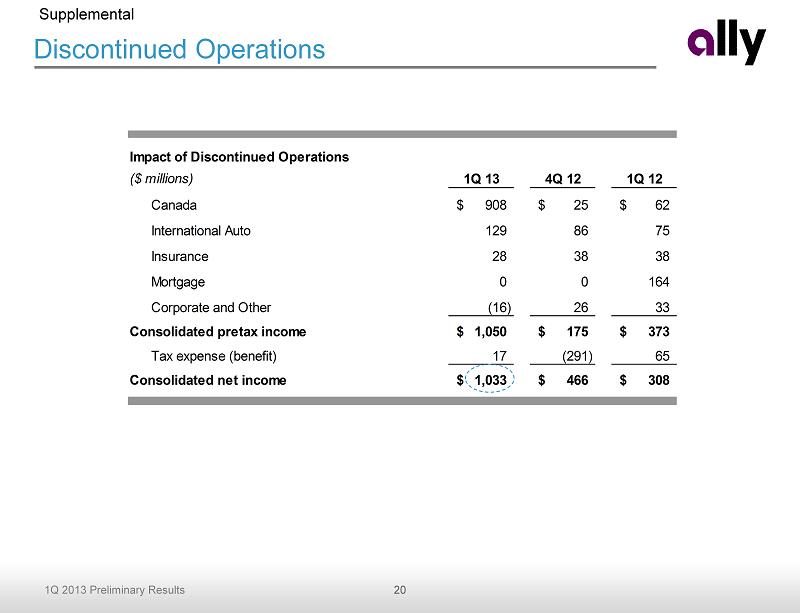
20 1Q 2013 Preliminary Results Impact of Discontinued Operations ($ millions) 1Q 13 4Q 12 1Q 12 Canada 908$ 25$ 62$ International Auto 129 86 75 Insurance 28 38 38 Mortgage 0 0 164 Corporate and Other (16) 26 33 Consolidated pretax income 1,050$ 175$ 373$ Tax expense (benefit) 17 (291) 65 Consolidated net income 1,033$ 466$ 308$ Discontinued Operations Supplemental
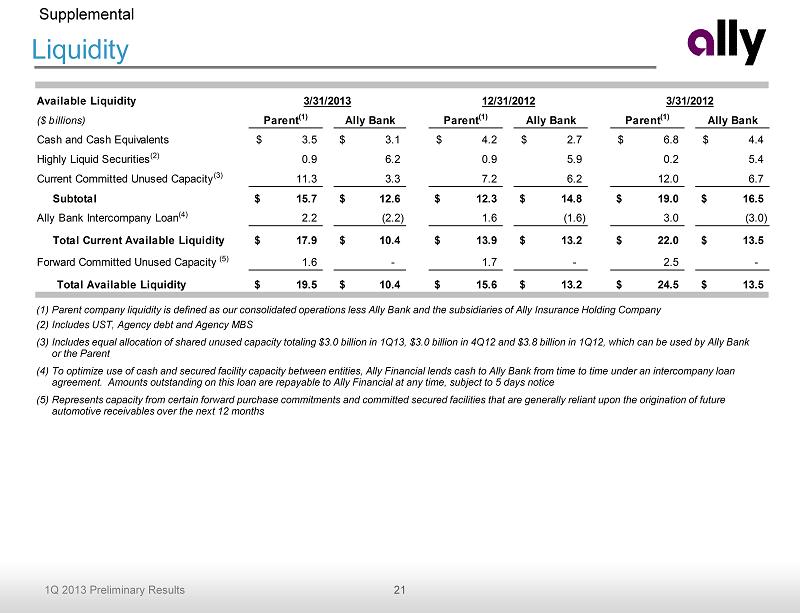
21 1Q 2013 Preliminary Results Liquidity Supplemental (1) Parent company liquidity is defined as our consolidated operations less Ally Bank and the subsidiaries of Ally Insurance Hold ing Company (2) Includes UST, Agency debt and Agency MBS (3) Includes equal allocation of shared unused capacity totaling $3.0 billion in 1Q13, $3.0 billion in 4Q12 and $3.8 billion in 1 Q12 , which can be used by Ally Bank or the Parent (4) To optimize use of cash and secured facility capacity between entities, Ally Financial lends cash to Ally Bank from time to time un der an intercompany loan agreement. Amounts outstanding on this loan are repayable to Ally Financial at any time, subject to 5 days notice (5) Represents capacity from certain forward purchase commitments and committed secured facilities that are generally reliant upo n t he origination of future automotive receivables over the next 12 months Available Liquidity 3/31/2013 12/31/2012 3/31/2012 ($ billions) Parent (1) Ally Bank Parent (1) Ally Bank Parent (1) Ally Bank Cash and Cash Equivalents 3.5$ 3.1$ 4.2$ 2.7$ 6.8$ 4.4$ Highly Liquid Securities (2) 0.9 6.2 0.9 5.9 0.2 5.4 Current Committed Unused Capacity (3) 11.3 3.3 7.2 6.2 12.0 6.7 Subtotal 15.7$ 12.6$ 12.3$ 14.8$ 19.0$ 16.5$ Ally Bank Intercompany Loan (4) 2.2 (2.2) 1.6 (1.6) 3.0 (3.0) SubtotalTotal Current Available Liquidity 17.9$ 10.4$ 13.9$ 13.2$ 22.0$ 13.5$ Forward Committed Unused Capacity (5) 1.6 - 1.7 - 2.5 - Total Available Liquidity 19.5$ 10.4$ 15.6$ 13.2$ 24.5$ 13.5$
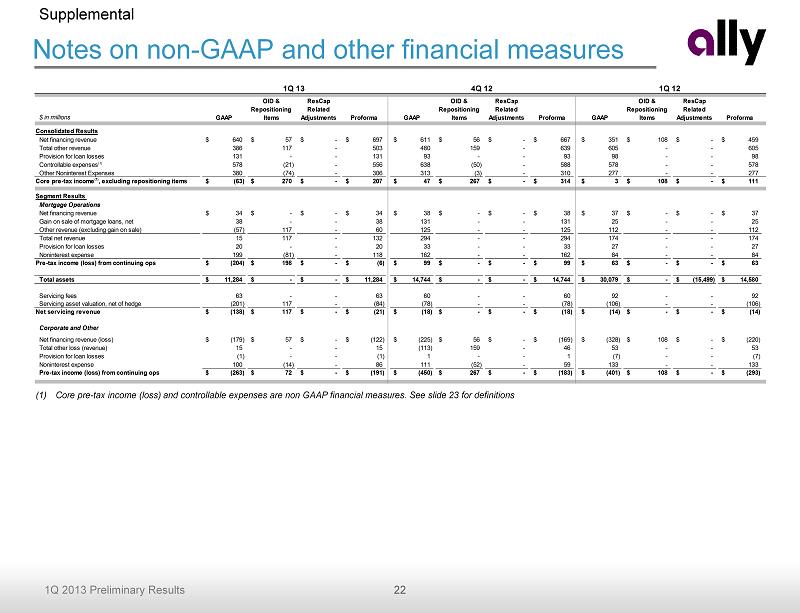
22 1Q 2013 Preliminary Results Notes on non - GAAP and other financial measures Supplemental (1) Core pre - tax income (loss) and controllable expenses are non GAAP financial measures. See slide 23 for definitions $ in millions GAAP OID & Repositioning Items ResCap Related Adjustments Proforma GAAP OID & Repositioning Items ResCap Related Adjustments Proforma GAAP OID & Repositioning Items ResCap Related Adjustments Proforma Consolidated Results Net financing revenue 640$ 57$ -$ 697$ 611$ 56$ -$ 667$ 351$ 108$ -$ 459$ Total other revenue 386 117 - 503 480 159 - 639 605 - - 605 Provision for loan losses 131 - - 131 93 - - 93 98 - - 98 Controllable expenses(1) 578 (21) - 556 638 (50) - 588 578 - - 578 Other Noninterest Expenses 380 (74) - 306 313 (3) - 310 277 - - 277 Core pre-tax income(1), excluding repositioning items (63)$ 270$ -$ 207$ 47$ 267$ -$ 314$ 3$ 108$ -$ 111$ Segment Results Mortgage Operations Net financing revenue 34$ -$ -$ 34$ 38$ -$ -$ 38$ 37$ -$ -$ 37$ Gain on sale of mortgage loans, net 38 - - 38 131 - - 131 25 - - 25 Other revenue (excluding gain on sale) (57) 117 - 60 125 - - 125 112 - - 112 Total net revenue 15 117 - 132 294 - - 294 174 - - 174 Provision for loan losses 20 - - 20 33 - - 33 27 - - 27 Noninterest expense 199 (81) - 118 162 - - 162 84 - - 84 Pre-tax income (loss) from continuing ops (204)$ 198$ -$ (6)$ 99$ -$ -$ 99$ 63$ -$ -$ 63$ Total assets 11,284$ -$ -$ 11,284$ 14,744$ -$ -$ 14,744$ 30,079$ -$ (15,499)$ 14,580$ Servicing fees 63 - - 63 60 - - 60 92 - - 92 Servicing asset valuation, net of hedge (201) 117 - (84) (78) - - (78) (106) - - (106) Net servicing revenue (138)$ 117$ -$ (21)$ (18)$ -$ -$ (18)$ (14)$ -$ -$ (14)$ Corporate and Other Net financing revenue (loss) (179)$ 57$ -$ (122)$ (225)$ 56$ -$ (169)$ (328)$ 108$ -$ (220)$ Total other loss (revenue) 15 - - 15 (113) 159 - 46 53 - - 53 Provision for loan losses (1) - - (1) 1 - - 1 (7) - - (7) Noninterest expense 100 (14) - 86 111 (52) - 59 133 - - 133 Pre-tax income (loss) from continuing ops (263)$ 72$ -$ (191)$ (450)$ 267$ -$ (183)$ (401)$ 108$ -$ (293)$ 1Q 13 4Q 12 1Q 12
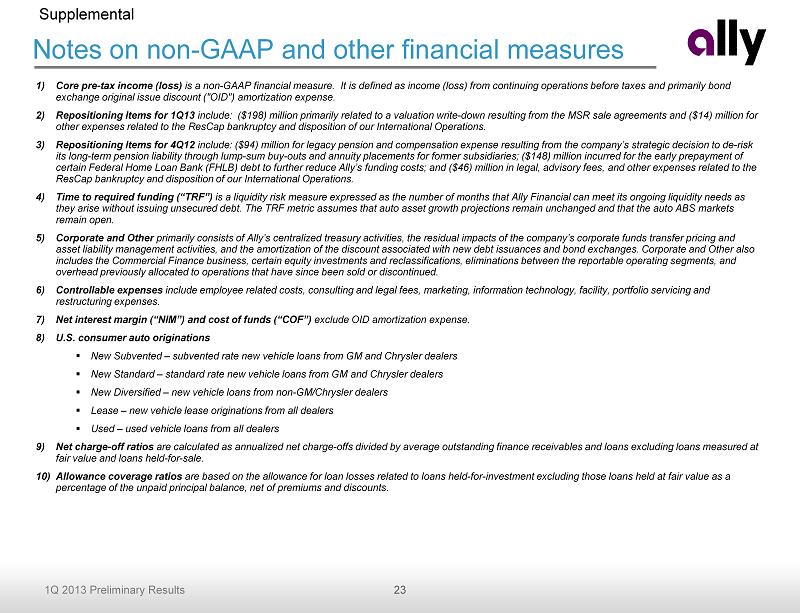
23 1Q 2013 Preliminary Results Notes on non - GAAP and other financial measures Supplemental 1) Core pre - tax income (loss) is a non - GAAP financial measure. It is defined as income (loss) from continuing operations before taxes and primarily bond exchange original issue discount ("OID") amortization expense . 2) Repositioning Items for 1Q13 include: ($198) million primarily related to a valuation write - down resulting from the MSR sale agreements and ($14) million fo r other expenses related to the ResCap bankruptcy and disposition of our International Operations. 3) Repositioning Items for 4Q12 include: ($94) million for legacy pension and compensation expense resulting from the company’s strategic decision to de - risk its long - term pension liability through lump - sum buy - outs and annuity placements for former subsidiaries; ($148) million incurre d for the early prepayment of certain Federal Home Loan Bank (FHLB) debt to further reduce Ally’s funding costs; and ($46) million in legal, advisory fees, an d other expenses related to the ResCap bankruptcy and disposition of our International Operations. 4) Time to required funding (“TRF”) is a liquidity risk measure expressed as the number of months that Ally Financial can meet its ongoing liquidity needs as they arise without issuing unsecured debt. The TRF metric assumes that auto asset growth projections remain unchanged and tha t t he auto ABS markets remain open. 5) Corporate and Other primarily consists of Ally’s centralized treasury activities, the residual impacts of the company’s corporate funds transfer pri cing and asset liability management activities, and the amortization of the discount associated with new debt issuances and bond excha nge s. Corporate and Other also includes the Commercial Finance business, certain equity investments and reclassifications, eliminations between the reportab le operating segments, and overhead previously allocated to operations that have since been sold or discontinued. 6) Controllable expenses include employee related costs, consulting and legal fees, marketing, information technology, facility, portfolio servicing a nd restructuring expenses. 7) Net interest margin (“NIM”) and cost of funds (“COF”) exclude OID amortization expense. 8) U.S. consumer auto originations ▪ New Subvented – subvented rate new vehicle loans from GM and Chrysler dealers ▪ New Standard – standard rate new vehicle loans from GM and Chrysler dealers ▪ New Diversified – new vehicle loans from non - GM/Chrysler dealers ▪ Lease – new vehicle lease originations from all dealers ▪ Used – used vehicle loans from all dealers 9) Net charge - off ratios are calculated as annualized net charge - offs divided by average outstanding finance receivables and loans excluding loans measur ed at fair value and loans held - for - sale. 10) Allowance coverage ratios are based on the allowance for loan losses related to loans held - for - investment excluding those loans held at fair value as a percentage of the unpaid principal balance, net of premiums and discounts .