
Ally Financial Inc. 2Q Earnings Review Contact Ally Investor Relations at (866) 710 - 4623 or investor.relations@ally.com July 31, 2013
2 2Q 2013 Preliminary Results Forward - Looking Statements and Additional Information The following should be read in conjunction with the financial statements, notes and other information contained in the Compa ny’ s Annual Reports on Form 10 - K, Quarterly Reports on Form 10 - Q, and Current Reports on Form 8 - K . This information is preliminary and based on company data available at the time of the presentation In the presentation that follows and related comments by Ally Financial Inc. (“Ally”) management, the use of the words “expec t,” “anticipate,” “estimate,” “forecast,” “initiative,” “objective,” “plan,” “goal,” “project,” “outlook,” “priorities,” “target ,” “explore,” “positions,” “intend,” “evaluate,” “pursue,” “seek,” “may,” “ would, ” “ could, ” “ should, ” “ believe, ” “ potential, ” “ continue,” , or the negative of these words, or similar expressions is intended to identify forward - looking statements. All statements herein and in related management comments, other than statements of historical fact, including without limitation, statements about future events and financial performance, are forward - looking statements tha t involve certain risks and uncertainties. While these statements represent our current judgment on what the future may hold, and we believe these judgments are reasonable, these statements are not guarantees of any events or financial results, and Ally’s actual results may differ mate ria lly due to numerous important factors that are described in the most recent reports on SEC Forms 10 - K and 10 - Q for Ally, each of which may be revise d or supplemented in subsequent reports filed with the SEC. Such factors include, among others, the following: maintaining the mut ual ly beneficial relationship between Ally and General Motors (“GM”), and Ally and Chrysler Group LLC (“Chrysler”); the profitability and fina nci al condition of GM and Chrysler; resolution of the bankruptcy filings by Residential Capital, LLC and certain of its subsidiaries; our ability to realize the anticipated benefits associated with being a bank holding company, and the increased regulation and restrictions that we are now subject to; the potential for deterioration in the residual value of off - lease vehicles; disruptions in the market in which we fund our operations, with resul ting negative impact on our liquidity; changes in our accounting assumptions that may require or that result from changes in the accounting rules or the ir application, which could result in an impact on earnings; changes in the credit ratings of Ally, Chrysler, or GM; changes in economic conditions , c urrency exchange rates or political stability in the markets in which we operate; and changes in the existing or the adoption of new laws, reg ula tions, policies or other activities of governments, agencies and similar organizations (including as a result of the Dodd - Frank Act and Basel III). Investors are cautioned not to place undue reliance on forward - looking statements. Ally undertakes no obligation to update publi cly or otherwise revise any forward - looking statements, whether as a result of new information, future events or other such factors that affect the subject of these statements, except where expressly required by law. Reconciliation of non - GAAP financial measures included within this presentation are provided in this presentation. Use of the term “loans” describes products associated with direct and indirect lending activities of Ally’s global operations . T he specific products include retail installment sales contracts, loans, lines of credit, leases or other financing products. The term “originate” ref ers to Ally’s purchase, acquisition or direct origination of various “loan” products .
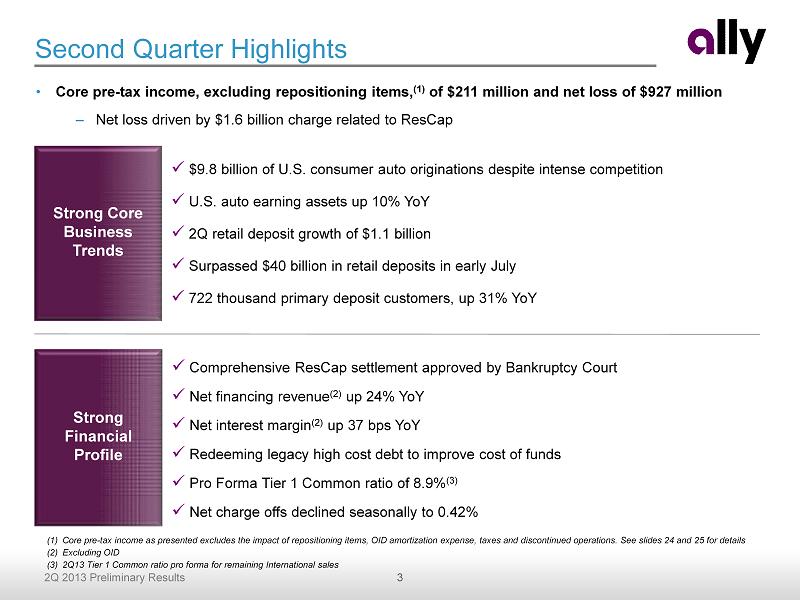
3 2Q 2013 Preliminary Results Strong Core Business Trends x Comprehensive ResCap settlement approved by Bankruptcy Court x Net financing revenue (2) up 24% YoY x Net interest margin (2) up 37 bps YoY x Redeeming legacy high cost debt to improve cost of funds x Pro Forma Tier 1 Common ratio of 8.9% (3) x Net charge offs declined seasonally to 0.42% Strong Financial Profile x $9.8 billion of U.S. consumer auto originations despite intense competition x U.S. auto earning assets up 10% YoY x 2Q retail deposit growth of $1.1 billion x Surpassed $40 billion in retail deposits in early July x 722 thousand primary deposit customers, up 31% YoY Second Quarter Highlights (1) Core pre - tax income as presented excludes the impact of repositioning items, OID amortization expense, taxes and discontinued op erations. See slides 24 and 25 for details (2) Excluding OID (3) 2Q13 Tier 1 Common ratio pro forma for remaining International sales • Core pre - tax income, excluding repositioning items, (1) of $211 million and net loss of $927 million – Net loss driven by $1.6 billion charge related to ResCap

4 2Q 2013 Preliminary Results Strategic Update • Streamlined company to create a more predictable and transparent earnings profile • Majority of IO sales have been completed, generating $7.7 billion of proceeds (84% of total expected) • Exited mortgage origination and servicing business – Only $9 billion of mortgage assets remain (6% of balance sheet) • Reached comprehensive settlement agreement with ResCap and its creditors – Approved by the Bankruptcy Court on June 26 th – Subject to Bankruptcy Plan confirmation • Scalable auto finance and deposit platforms • Cost of funds improvement – Liability management transactions underway • Noninterest expense expected to decline materially over time • Addressing regulatory impact Strategic Transformation Nearly Complete Focused on Improving Profitability
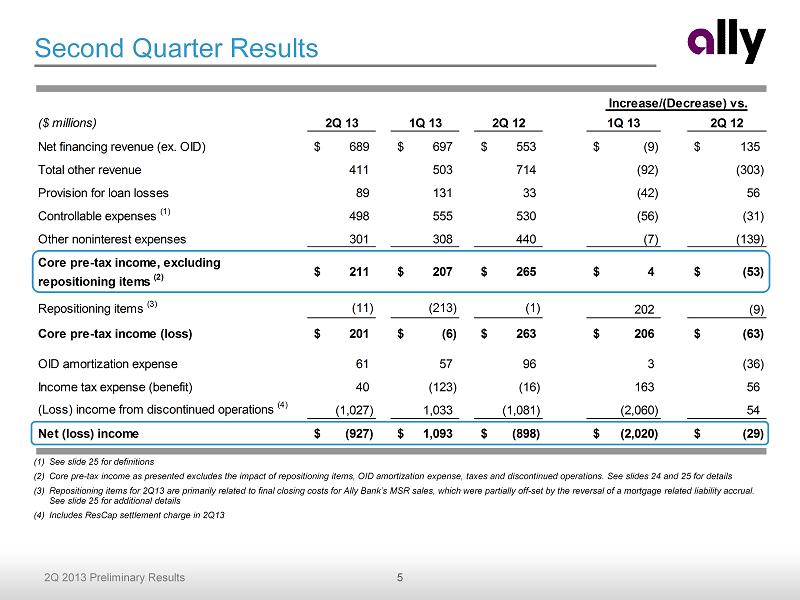
5 2Q 2013 Preliminary Results ($ millions) 2Q 13 1Q 13 2Q 12 1Q 13 2Q 12 Net financing revenue (ex. OID) 689$ 697$ 553$ (9)$ 135$ Total other revenue 411 503 714 (92) (303) Provision for loan losses 89 131 33 (42) 56 Controllable expenses (1) 498 555 530 (56) (31) Other noninterest expenses 301 308 440 (7) (139) Core pre-tax income, excluding repositioning items (2) 211$ 207$ 265$ 4$ (53)$ Repositioning items (3) (11) (213) (1) 202 (9) Core pre-tax income (loss) 201$ (6)$ 263$ 206$ (63)$ OID amortization expense 61 57 96 3 (36) Income tax expense (benefit) 40 (123) (16) 163 56 (Loss) income from discontinued operations (4) (1,027) 1,033 (1,081) (2,060) 54 Net (loss) income (927)$ 1,093$ (898)$ (2,020)$ (29)$ Increase/(Decrease) vs. Second Quarter Results (1) See slide 25 for definitions (2) Core pre - tax income as presented excludes the impact of repositioning items, OID amortization expense, taxes and discontinued op erations. See slides 24 and 25 for details (3) Repositioning items for 2Q13 are primarily related to final closing costs for Ally Bank’s MSR sales, which were partially off - se t by the reversal of a mortgage related liability accrual. See slide 25 for additional details (4) Includes ResCap settlement charge in 2Q13
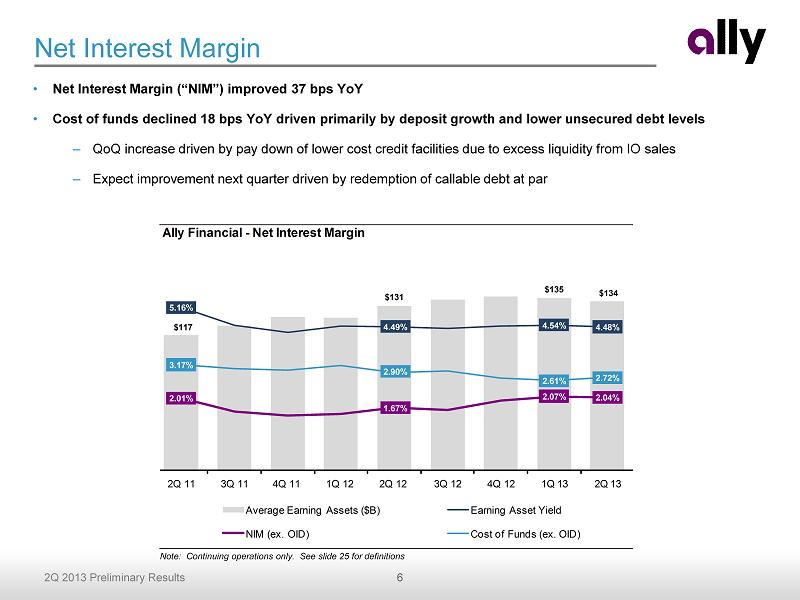
6 2Q 2013 Preliminary Results Net Interest Margin • Net Interest Margin (“NIM”) improved 37 bps YoY • Cost of funds declined 18 bps YoY driven primarily by deposit growth and lower unsecured debt levels – QoQ increase driven by pay down of lower cost credit facilities due to excess liquidity from IO sales – Expect improvement next quarter driven by redemption of callable debt at par Note: Continuing operations only. See slide 25 for definitions Ally Financial - Net Interest Margin $117 $131 $135 $134 5.16% 4.49% 4.54% 4.48% 2.01% 1.67% 2.07% 2.04% 3.17% 2.90% 2.61% 2.72% 2Q 11 3Q 11 4Q 11 1Q 12 2Q 12 3Q 12 4Q 12 1Q 13 2Q 13 Average Earning Assets ($B) Earning Asset Yield NIM (ex. OID) Cost of Funds (ex. OID)
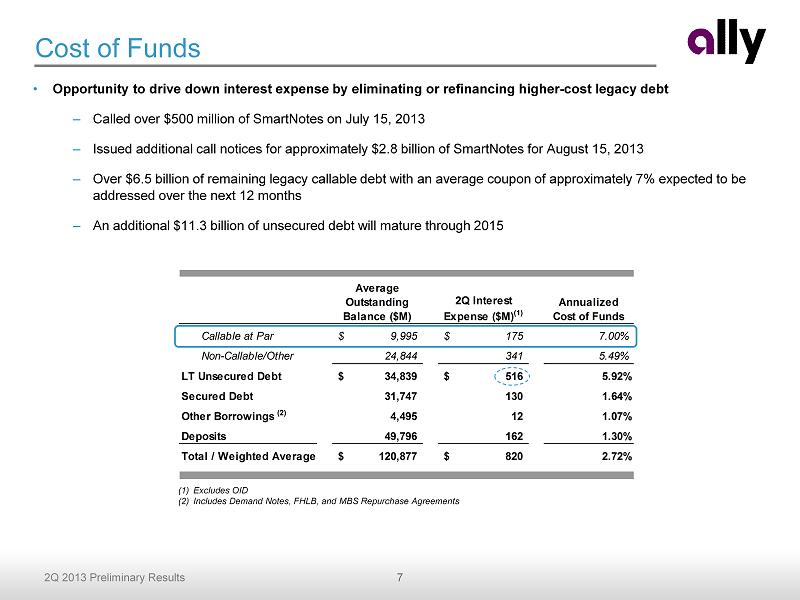
7 2Q 2013 Preliminary Results Average Outstanding Balance ($M) 2Q Interest Expense ($M) (1) Annualized Cost of Funds Callable at Par 9,995$ 175$ 7.00% Non-Callable/Other 24,844 341 5.49% LT Unsecured Debt 34,839$ 516$ 5.92% Secured Debt 31,747 130 1.64% Other Borrowings (2) 4,495 12 1.07% Deposits 49,796 162 1.30% Total / Weighted Average 120,877$ 820$ 2.72% Cost of Funds • Opportunity to drive down interest expense by eliminating or refinancing higher - cost legacy debt – Called over $500 million of SmartNotes on July 15, 2013 – Issued additional call notices for approximately $2.8 billion of SmartNotes for August 15, 2013 – Over $6.5 billion of remaining legacy callable debt with an average coupon of approximately 7% expected to be addressed over the next 12 months – An additional $11.3 billion of unsecured debt will mature through 2015 (1) Excludes OID (2) Includes Demand Notes, FHLB, and MBS Repurchase Agreements
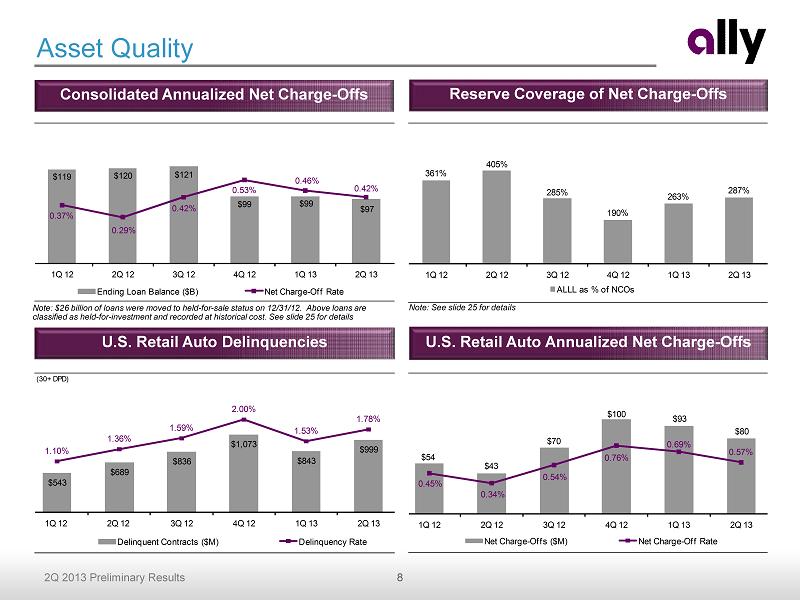
8 2Q 2013 Preliminary Results $119 $120 $121 $99 $99 $97 0.37% 0.29% 0.42% 0.53% 0.46% 0.42% 1Q 12 2Q 12 3Q 12 4Q 12 1Q 13 2Q 13 Ending Loan Balance ($B) Net Charge - Off Rate 361% 405% 285% 190% 263% 287% 1Q 12 2Q 12 3Q 12 4Q 12 1Q 13 2Q 13 ALLL as % of NCOs Consolidated Annualized Net Charge - Offs Reserve C overage of Net Charge - Offs Asset Quality U.S. Retail Auto Annualized Net Charge - Offs U.S. Retail Auto Delinquencies Note: $26 billion of loans were moved to held - for - sale status on 12/31/12. Above loans are classified as held - for - investment and recorded at historical cost. See slide 25 for details Note: See slide 25 for details $54 $43 $70 $100 $93 $80 0.45% 0.34% 0.54% 0.76% 0.69% 0.57% 1Q 12 2Q 12 3Q 12 4Q 12 1Q 13 2Q 13 Net Charge - Offs ($M) Net Charge - Off Rate (30+ DPD) $543 $689 $836 $1,073 $843 $999 1.10% 1.36% 1.59% 2.00% 1.53% 1.78% 1Q 12 2Q 12 3Q 12 4Q 12 1Q 13 2Q 13 Delinquent Contracts ($M) Delinquency Rate
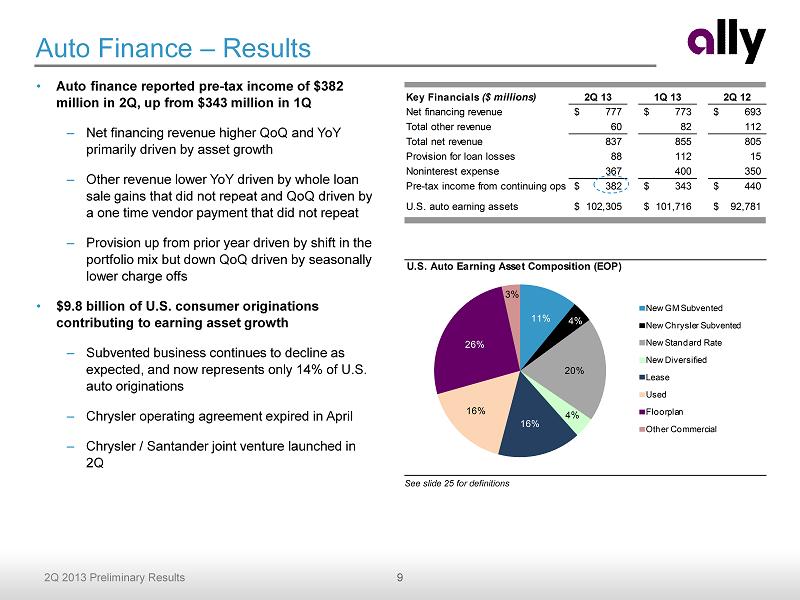
9 2Q 2013 Preliminary Results Key Financials ($ millions) 2Q 13 1Q 13 2Q 12 Net financing revenue 777$ 773$ 693$ Total other revenue 60 82 112 Total net revenue 837 855 805 Provision for loan losses 88 112 15 Noninterest expense 367 400 350 Pre-tax income from continuing ops 382$ 343$ 440$ U.S. auto earning assets 102,305$ 101,716$ 92,781$ • Auto finance reported pre - tax income of $382 million in 2Q, up from $343 million in 1Q – Net financing revenue higher QoQ and YoY primarily driven by asset growth – Other revenue lower YoY driven by whole loan sale gains that did not repeat and QoQ driven by a one time vendor payment that did not repeat – Provision up from prior year driven by shift in the portfolio mix but down QoQ driven by seasonally lower charge offs • $9.8 billion of U.S. consumer originations contributing to earning asset growth – Subvented business continues to decline as expected, and now represents only 14% of U.S. auto originations – Chrysler operating agreement expired in April – Chrysler / Santander joint venture launched in 2Q Auto Finance – Results See slide 25 for definitions U.S. Auto Earning Asset Composition (EOP) 11% 4% 20% 4% 16% 16% 26% 3% New GM Subvented New Chrysler Subvented New Standard Rate New Diversified Lease Used Floorplan Other Commercial
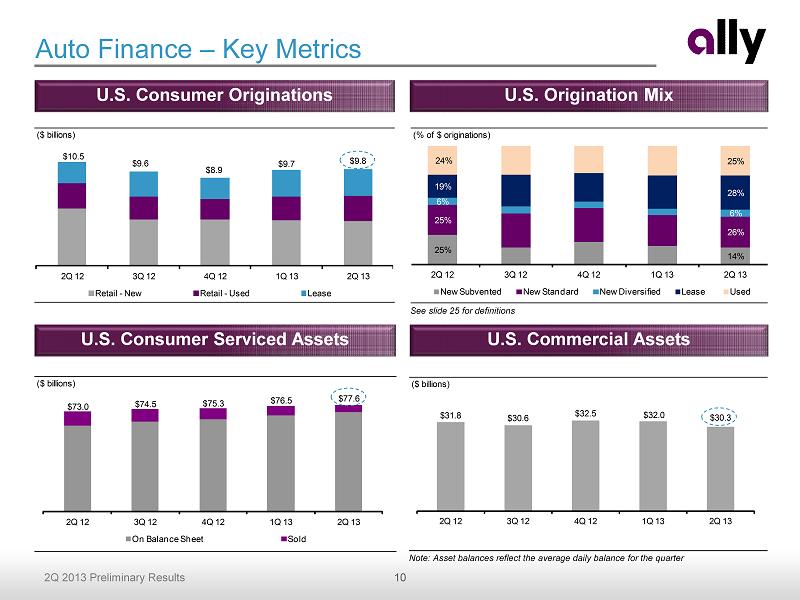
10 2Q 2013 Preliminary Results ($ billions) $31.8 $30.6 $32.5 $32.0 $30.3 2Q 12 3Q 12 4Q 12 1Q 13 2Q 13 ($ billions) $73.0 $74.5 $75.3 $76.5 $77.6 2Q 12 3Q 12 4Q 12 1Q 13 2Q 13 On Balance Sheet Sold ($ billions) $10.5 $9.6 $8.9 $9.7 $9.8 2Q 12 3Q 12 4Q 12 1Q 13 2Q 13 Retail - New Retail - Used Lease Auto Finance – Key Metrics See slide 25 for definitions U.S. Consumer Serviced Assets U.S. Commercial Assets U.S. Consumer Originations U.S. Origination Mix Note: Asset balances reflect the average daily balance for the quarter (% of $ originations) 25% 14% 25% 26% 6% 6% 19% 28% 24% 25% 2Q 12 3Q 12 4Q 12 1Q 13 2Q 13 New Subvented New Standard New Diversified Lease Used
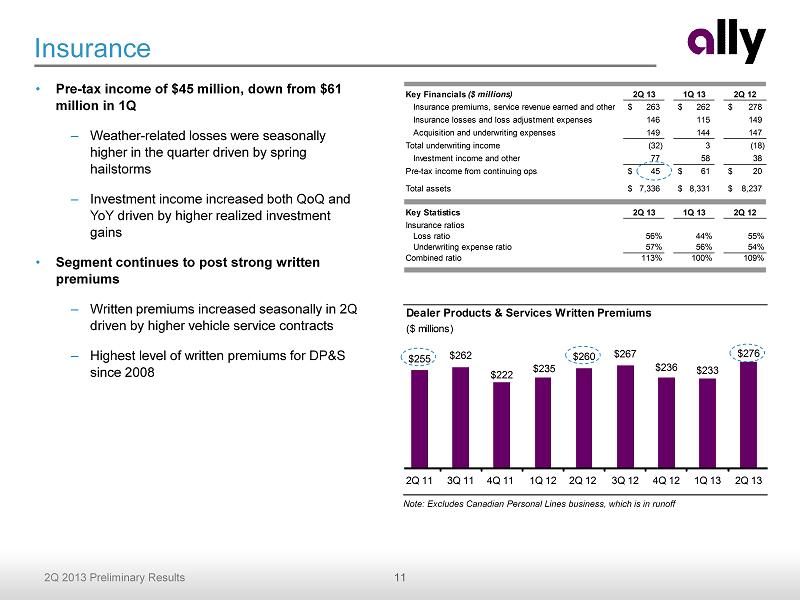
11 2Q 2013 Preliminary Results Key Financials ($ millions) 2Q 13 1Q 13 2Q 12 Insurance premiums, service revenue earned and other 263$ 262$ 278$ Insurance losses and loss adjustment expenses 146 115 149 Acquisition and underwriting expenses 149 144 147 Total underwriting income (32) 3 (18) Investment income and other 77 58 38 Pre-tax income from continuing ops 45$ 61$ 20$ Total assets 7,336$ 8,331$ 8,237$ Key Statistics 2Q 13 1Q 13 2Q 12 Insurance ratios Loss ratio 56% 44% 55% Underwriting expense ratio 57% 56% 54% Combined ratio 113% 100% 109% Dealer Products & Services Written Premiums ($ millions) $255 $262 $222 $235 $260 $267 $236 $233 $276 2Q 11 3Q 11 4Q 11 1Q 12 2Q 12 3Q 12 4Q 12 1Q 13 2Q 13 Insurance • Pre - tax income of $45 million, down from $61 million in 1Q – Weather - related losses were seasonally higher in the quarter driven by spring hailstorms – Investment income increased both QoQ and YoY driven by higher realized investment gains • Segment continues to post strong written premiums – Written premiums increased seasonally in 2Q driven by higher vehicle service contracts – Highest level of written premiums for DP&S since 2008 Note: Excludes Canadian Personal Lines business, which is in runoff
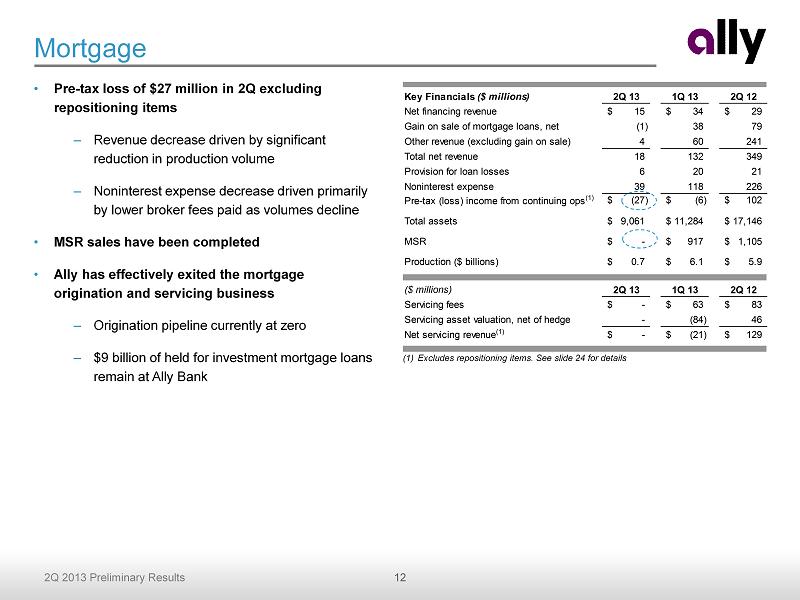
12 2Q 2013 Preliminary Results Key Financials ($ millions) 2Q 13 1Q 13 2Q 12 Net financing revenue 15$ 34$ 29$ Gain on sale of mortgage loans, net (1) 38 79 Other revenue (excluding gain on sale) 4 60 241 Total net revenue 18 132 349 Provision for loan losses 6 20 21 Noninterest expense 39 118 226 Pre-tax (loss) income from continuing ops (1) (27)$ (6)$ 102$ Total assets 9,061$ 11,284$ 17,146$ MSR -$ 917$ 1,105$ Production ($ billions) 0.7$ 6.1$ 5.9$ TRUE ($ millions) 2Q 13 1Q 13 2Q 12 Servicing fees -$ 63$ 83$ Servicing asset valuation, net of hedge - (84) 46 Net servicing revenue (1) -$ (21)$ 129$ Mortgage • Pre - tax loss of $27 million in 2Q excluding repositioning items – Revenue decrease driven by significant reduction in production volume – Noninterest expense decrease driven primarily by lower broker fees paid as volumes decline • MSR sales have been completed • Ally has effectively exited the mortgage origination and servicing business – Origination pipeline currently at zero – $9 billion of held for investment mortgage loans remain at Ally Bank (1) Excludes repositioning items. See slide 24 for details
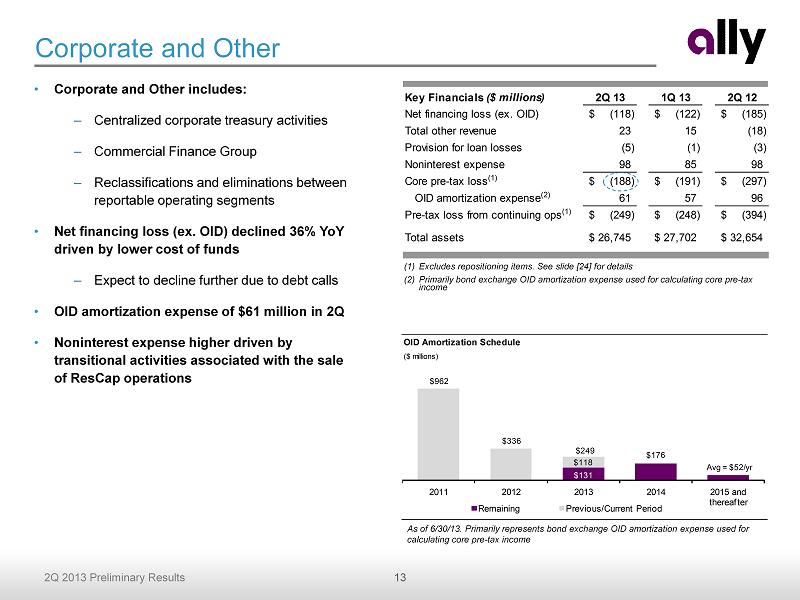
13 2Q 2013 Preliminary Results Key Financials ($ millions) 2Q 13 1Q 13 2Q 12 Net financing loss (ex. OID) (118)$ (122)$ (185)$ Total other revenue 23 15 (18) Provision for loan losses (5) (1) (3) Noninterest expense 98 85 98 Core pre-tax loss (1) (188)$ (191)$ (297)$ OID amortization expense (2) 61 57 96 Pre-tax loss from continuing ops (1) (249)$ (248)$ (394)$ Total assets 26,745$ 27,702$ 32,654$ OID Amortization Schedule ($ millions) $131 $176 Avg = $52/yr $962 $336 $118 2011 2012 2013 2014 2015 and thereafter Remaining Previous/Current Period $249 Corporate and Other • Corporate and Other includes: – Centralized corporate treasury activities – Commercial Finance Group – Reclassifications and eliminations between reportable operating segments • Net financing loss (ex. OID) declined 36% YoY driven by lower cost of funds – Expect to decline further due to debt calls • OID amortization expense of $61 million in 2Q • Noninterest expense higher driven by transitional activities associated with the sale of ResCap operations (1) Excludes repositioning items. See slide [24] for details (2) Primarily bond exchange OID amortization expense used for calculating core pre - tax income As of 6/30/13. Primarily represents bond exchange OID amortization expense used for calculating core pre - tax income
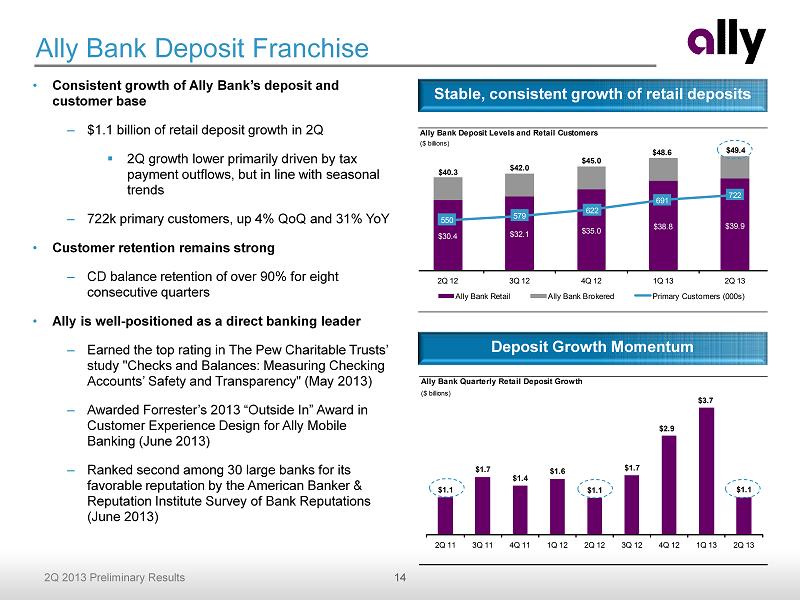
14 2Q 2013 Preliminary Results Ally Bank Deposit Levels and Retail Customers ($ billions) $30.4 $32.1 $35.0 $38.8 $39.9 $40.3 $42.0 $45.0 $48.6 $49.4 550 579 622 691 722 2Q 12 3Q 12 4Q 12 1Q 13 2Q 13 Ally Bank Retail Ally Bank Brokered Primary Customers (000s) Ally Bank Quarterly Retail Deposit Growth ($ billions) $1.1 $1.7 $1.4 $1.6 $1.1 $1.7 $2.9 $3.7 $1.1 2Q 11 3Q 11 4Q 11 1Q 12 2Q 12 3Q 12 4Q 12 1Q 13 2Q 13 Ally Bank Deposit Franchise • Consistent growth of Ally Bank’s deposit and customer base – $1.1 billion of retail deposit growth in 2Q ▪ 2Q growth lower primarily driven by tax payment outflows, but in line with seasonal trends – 722k primary customers, up 4% QoQ and 31% YoY • Customer retention remains strong – CD balance retention of over 90% for eight consecutive quarters • Ally is well - positioned as a direct banking leader – Earned the top rating in The Pew Charitable Trusts’ study "Checks and Balances: Measuring Checking Accounts’ Safety and Transparency" (May 2013) – Awarded Forrester’s 2013 “Outside In” Award in Customer Experience Design for Ally Mobile Banking (June 2013) – Ranked second among 30 large banks for its favorable reputation by the American Banker & Reputation Institute Survey of Bank Reputations (June 2013) Stable, consistent growth of retail deposits Deposit Growth Momentum
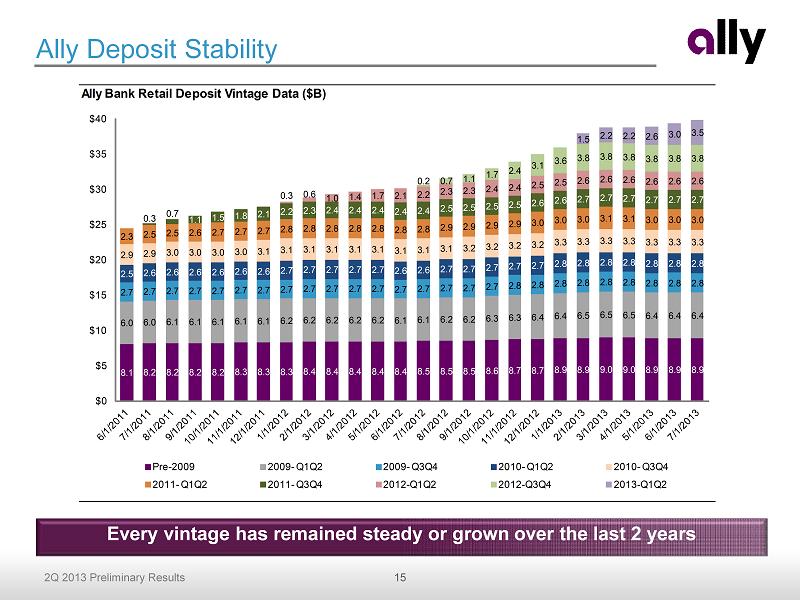
15 2Q 2013 Preliminary Results Ally Deposit Stability Every vintage has remained steady or grown over the last 2 years Ally Bank Retail Deposit Vintage Data ($B) 8.1 8.2 8.2 8.2 8.2 8.3 8.3 8.3 8.4 8.4 8.4 8.4 8.4 8.5 8.5 8.5 8.6 8.7 8.7 8.9 8.9 9.0 9.0 8.9 8.9 8.9 6.0 6.0 6.1 6.1 6.1 6.1 6.1 6.2 6.2 6.2 6.2 6.2 6.1 6.1 6.2 6.2 6.3 6.3 6.4 6.4 6.5 6.5 6.5 6.4 6.4 6.4 2.7 2.7 2.7 2.7 2.7 2.7 2.7 2.7 2.7 2.7 2.7 2.7 2.7 2.7 2.7 2.7 2.7 2.8 2.8 2.8 2.8 2.8 2.8 2.8 2.8 2.8 2.5 2.6 2.6 2.6 2.6 2.6 2.6 2.7 2.7 2.7 2.7 2.7 2.6 2.6 2.7 2.7 2.7 2.7 2.7 2.8 2.8 2.8 2.8 2.8 2.8 2.8 2.9 2.9 3.0 3.0 3.0 3.0 3.1 3.1 3.1 3.1 3.1 3.1 3.1 3.1 3.1 3.2 3.2 3.2 3.2 3.3 3.3 3.3 3.3 3.3 3.3 3.3 2.3 2.5 2.5 2.6 2.7 2.7 2.7 2.8 2.8 2.8 2.8 2.8 2.8 2.8 2.9 2.9 2.9 2.9 3.0 3.0 3.0 3.1 3.1 3.0 3.0 3.0 0.3 0.7 1.1 1.5 1.8 2.1 2.2 2.3 2.4 2.4 2.4 2.4 2.4 2.5 2.5 2.5 2.5 2.6 2.6 2.7 2.7 2.7 2.7 2.7 2.7 0.3 0.6 1.0 1.4 1.7 2.1 2.2 2.3 2.3 2.4 2.4 2.5 2.5 2.6 2.6 2.6 2.6 2.6 2.6 0.2 0.7 1.1 1.7 2.4 3.1 3.6 3.8 3.8 3.8 3.8 3.8 3.8 1.5 2.2 2.2 2.6 3.0 3.5 $0 $5 $10 $15 $20 $25 $30 $35 $40 Pre - 2009 2009 - Q1Q2 2009 - Q3Q4 2010 - Q1Q2 2010 - Q3Q4 2011 - Q1Q2 2011 - Q3Q4 2012 - Q1Q2 2012 - Q3Q4 2013 - Q1Q2
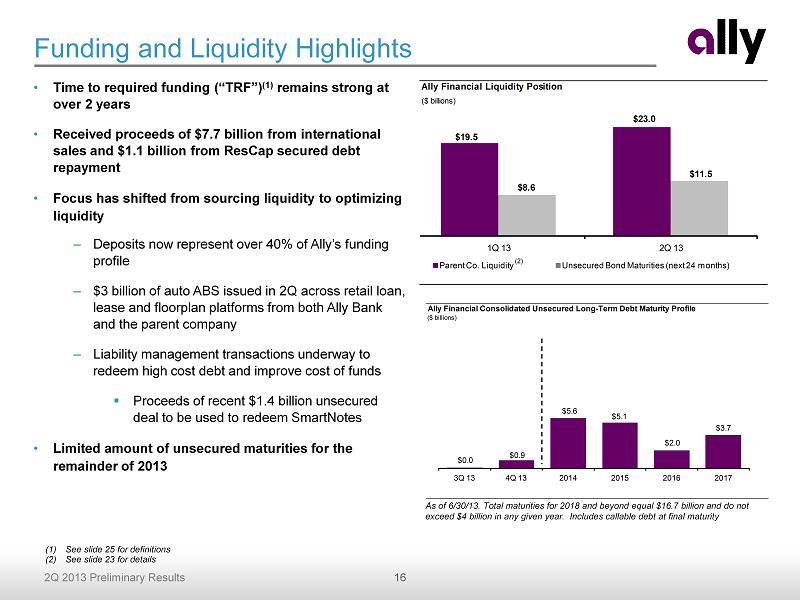
16 2Q 2013 Preliminary Results Ally Financial Liquidity Position ($ billions) $19.5 $23.0 $8.6 $11.5 1Q 13 2Q 13 Parent Co. Liquidity Unsecured Bond Maturities (next 24 months) Ally Financial Consolidated Unsecured Long-Term Debt Maturity Profile ($ billions) $0.0 $0.9 $5.6 $5.1 $2.0 $3.7 3Q 13 4Q 13 2014 2015 2016 2017 • Time to required funding (“TRF”) (1) remains strong at over 2 years • Received proceeds of $7.7 billion from international sales and $1.1 billion from ResCap secured debt repayment • Focus has shifted from sourcing liquidity to optimizing liquidity – Deposits now represent over 40% of Ally’s funding profile – $3 billion of auto ABS issued in 2Q across retail loan, lease and floorplan platforms from both Ally Bank and the parent company – Liability management transactions underway to redeem high cost debt and improve cost of funds ▪ Proceeds of recent $1.4 billion unsecured deal to be used to redeem SmartNotes • Limited amount of unsecured maturities for the remainder of 2013 Funding and Liquidity Highlights (1) See slide 25 for definitions (2) See slide 23 for details (2) As of 6/30/13. Total maturities for 2018 and beyond equal $16.7 billion and do not exceed $4 billion in any given year. Includes callable debt at final maturity
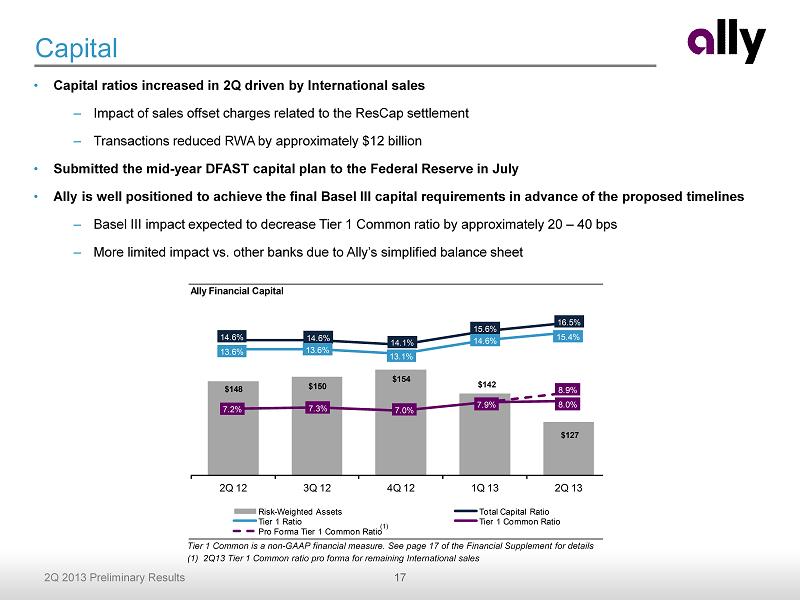
17 2Q 2013 Preliminary Results Capital • Capital ratios increased in 2Q driven by International sales – Impact of sales offset charges related to the ResCap settlement – Transactions reduced RWA by approximately $12 billion • Submitted the mid - year DFAST capital plan to the Federal Reserve in July • Ally is well positioned to achieve the final Basel III capital requirements in advance of the proposed timelines – Basel III impact expected to decrease Tier 1 Common ratio by approximately 20 – 40 bps – More limited impact vs. other banks due to Ally’s simplified balance sheet Tier 1 Common is a non - GAAP financial measure. See page 17 of the Financial Supplement for details (1) 2Q13 Tier 1 Common ratio pro forma for remaining International sales (1) Ally Financial Capital $148 $150 $154 $142 $127 14.6% 14.6% 14.1% 15.6% 16.5% 13.6% 13.6% 13.1% 14.6% 15.4% 7.2% 7.3% 7.0% 7.9% 8.0% 8.9% 2Q 12 3Q 12 4Q 12 1Q 13 2Q 13 Risk - Weighted Assets Total Capital Ratio Tier 1 Ratio Tier 1 Common Ratio Pro Forma Tier 1 Common Ratio
18 2Q 2013 Preliminary Results Conclusion • Positive core business trends – Solid auto finance performance – Continued emphasis on profitability and asset quality – Steady deposit growth • Strategic transformation nearly complete – Comprehensive settlement agreement with ResCap and its creditors approved by the Bankruptcy Court – Streamlined company to create a more predictable and transparent earnings profile • Focus on improving profitability – Cost of funds improvement – Noninterest expense expected to decline materially over time – Addressing regulatory impact Positioned for Future Success as Strategic Transformation Nears Completion
Supplemental Charts
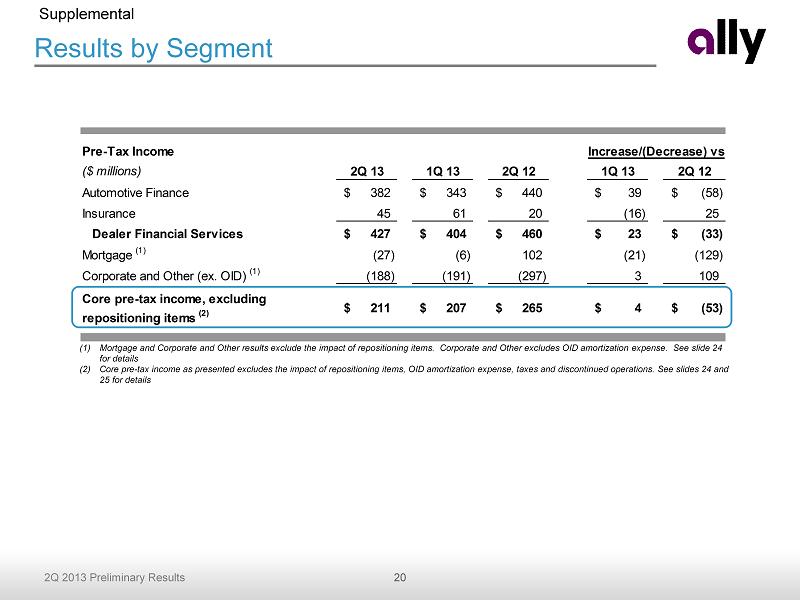
20 2Q 2013 Preliminary Results Results by Segment (1) Mortgage and Corporate and Other results exclude the impact of repositioning items. Corporate and Other excludes OID amortiz ati on expense. See slide 24 for details (2) Core pre - tax income as presented excludes the impact of repositioning items, OID amortization expense, taxes and discontinued op erations. See slides 24 and 25 for details Supplemental Pre-Tax Income ($ millions) 2Q 13 1Q 13 2Q 12 1Q 13 2Q 12 Automotive Finance 382$ 343$ 440$ 39$ (58)$ Insurance 45 61 20 (16) 25 Dealer Financial Services 427$ 404$ 460$ 23$ (33)$ Mortgage (1) (27) (6) 102 (21) (129) Corporate and Other (ex. OID) (1) (188) (191) (297) 3 109 Core pre-tax income, excluding repositioning items (2) 211$ 207$ 265$ 4$ (53)$ Increase/(Decrease) vs.
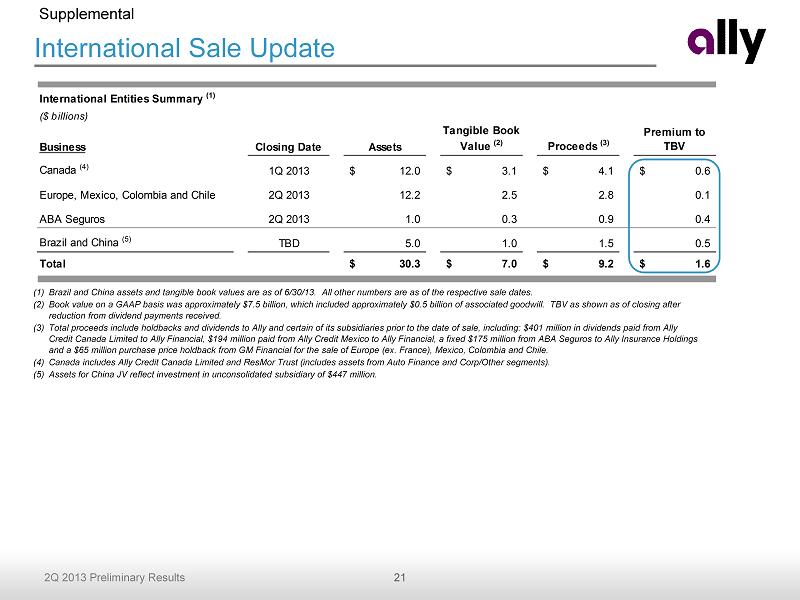
21 2Q 2013 Preliminary Results International Sale Update Supplemental (1) Brazil and China assets and tangible book values are as of 6/30/13. All other numbers are as of the respective sale dates . (2) Book value on a GAAP basis was approximately $ 7.5 billion, which included approximately $0.5 billion of associated goodwill . TBV as shown as of closing after reduction from dividend payments received. (3) Total proceeds include holdbacks and dividends to Ally and certain of its subsidiaries prior to the date of sale, including: $40 1 million in dividends paid from Ally Credit Canada Limited to Ally Financial, $194 million paid from Ally Credit Mexico to Ally Financial, a fixed $175 million fr om ABA Seguros to Ally Insurance Holdings and a $65 million purchase price holdback from GM Financial for the sale of Europe (ex. France), Mexico, Colombia and Chile. (4) Canada includes Ally Credit Canada Limited and ResMor Trust (includes assets from Auto Finance and Corp/Other segments). (5) Assets for China JV reflect investment in unconsolidated subsidiary of $447 million. International Entities Summary (1) ($ billions) Business Closing Date Assets Tangible Book Value (2) Proceeds (3) Premium to TBV Canada (4) 1Q 2013 12.0$ 3.1$ 4.1$ 0.6$ Europe, Mexico, Colombia and Chile 2Q 2013 12.2 2.5 2.8 0.1 ABA Seguros 2Q 2013 1.0 0.3 0.9 0.4 Brazil and China (5) TBD 5.0 1.0 1.5 0.5 Total 30.3$ 7.0$ 9.2$ 1.6$
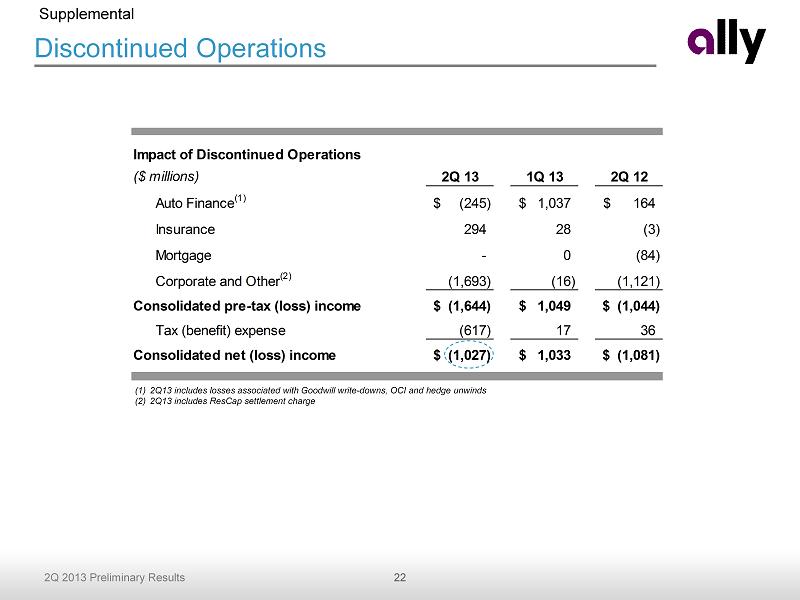
22 2Q 2013 Preliminary Results Impact of Discontinued Operations ($ millions) 2Q 13 1Q 13 2Q 12 Auto Finance (1) (245)$ 1,037$ 164$ Insurance 294 28 (3) Mortgage - 0 (84) Corporate and Other (2) (1,693) (16) (1,121) Consolidated pre-tax (loss) income (1,644)$ 1,049$ (1,044)$ Tax (benefit) expense (617) 17 36 Consolidated net (loss) income (1,027)$ 1,033$ (1,081)$ Discontinued Operations Supplemental (1) 2Q13 includes losses associated with Goodwill write - downs, OCI and hedge unwinds (2) 2Q13 includes ResCap settlement charge
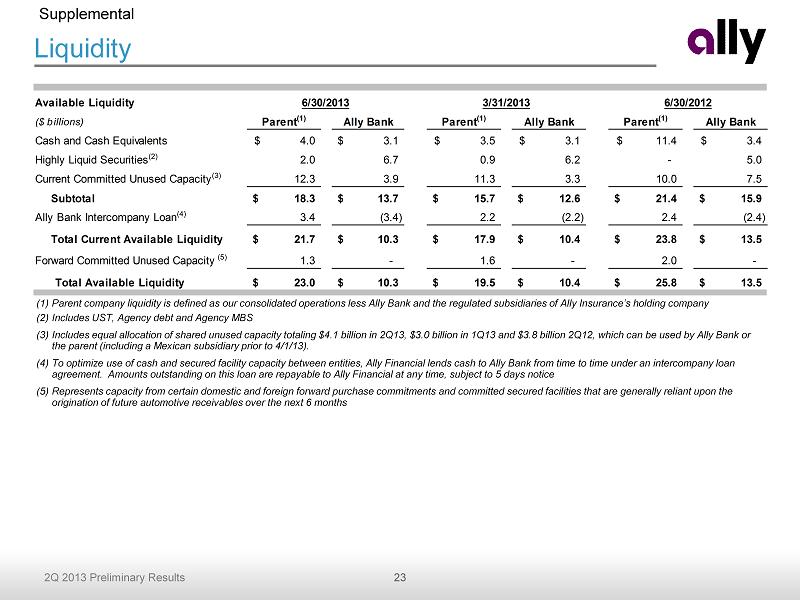
23 2Q 2013 Preliminary Results Liquidity Supplemental (1) Parent company liquidity is defined as our consolidated operations less Ally Bank and the regulated subsidiaries of Ally Insu ran ce’s holding company (2) Includes UST, Agency debt and Agency MBS (3) Includes equal allocation of shared unused capacity totaling $4.1 billion in 2Q13, $3.0 billion in 1Q13 and $3.8 billion 2Q12 , w hich can be used by Ally Bank or the parent (including a Mexican subsidiary prior to 4/1/13). (4) To optimize use of cash and secured facility capacity between entities, Ally Financial lends cash to Ally Bank from time to t ime under an intercompany loan agreement. Amounts outstanding on this loan are repayable to Ally Financial at any time, subject to 5 days notice (5) Represents capacity from certain domestic and foreign forward purchase commitments and committed secured facilities that are gen erally reliant upon the origination of future automotive receivables over the next 6 months Available Liquidity 6/30/2013 3/31/2013 6/30/2012 ($ billions) Parent (1) Ally Bank Parent (1) Ally Bank Parent (1) Ally Bank Cash and Cash Equivalents 4.0$ 3.1$ 3.5$ 3.1$ 11.4$ 3.4$ Highly Liquid Securities (2) 2.0 6.7 0.9 6.2 - 5.0 Current Committed Unused Capacity (3) 12.3 3.9 11.3 3.3 10.0 7.5 Subtotal 18.3$ 13.7$ 15.7$ 12.6$ 21.4$ 15.9$ Ally Bank Intercompany Loan (4) 3.4 (3.4) 2.2 (2.2) 2.4 (2.4) SubtotalTotal Current Available Liquidity 21.7$ 10.3$ 17.9$ 10.4$ 23.8$ 13.5$ Forward Committed Unused Capacity (5) 1.3 - 1.6 - 2.0 - Total Available Liquidity 23.0$ 10.3$ 19.5$ 10.4$ 25.8$ 13.5$
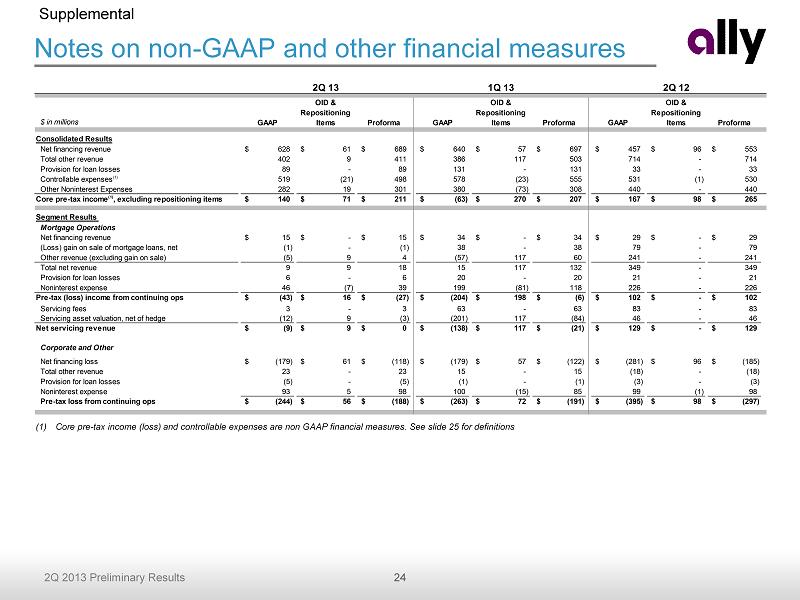
24 2Q 2013 Preliminary Results Notes on non - GAAP and other financial measures Supplemental (1) Core pre - tax income (loss) and controllable expenses are non GAAP financial measures. See slide 25 for definitions $ in millions GAAP OID & Repositioning Items Proforma GAAP OID & Repositioning Items Proforma GAAP OID & Repositioning Items Proforma Consolidated Results Net financing revenue 628$ 61$ 689$ 640$ 57$ 697$ 457$ 96$ 553$ Total other revenue 402 9 411 386 117 503 714 - 714 Provision for loan losses 89 - 89 131 - 131 33 - 33 Controllable expenses(1) 519 (21) 498 578 (23) 555 531 (1) 530 Other Noninterest Expenses 282 19 301 380 (73) 308 440 - 440 Core pre-tax income(1), excluding repositioning items 140$ 71$ 211$ (63)$ 270$ 207$ 167$ 98$ 265$ Segment Results Mortgage Operations Net financing revenue 15$ -$ 15$ 34$ -$ 34$ 29$ -$ 29$ (Loss) gain on sale of mortgage loans, net (1) - (1) 38 - 38 79 - 79 Other revenue (excluding gain on sale) (5) 9 4 (57) 117 60 241 - 241 Total net revenue 9 9 18 15 117 132 349 - 349 Provision for loan losses 6 - 6 20 - 20 21 - 21 Noninterest expense 46 (7) 39 199 (81) 118 226 - 226 Pre-tax (loss) income from continuing ops (43)$ 16$ (27)$ (204)$ 198$ (6)$ 102$ -$ 102$ Servicing fees 3 - 3 63 - 63 83 - 83 Servicing asset valuation, net of hedge (12) 9 (3) (201) 117 (84) 46 - 46 Net servicing revenue (9)$ 9$ 0$ (138)$ 117$ (21)$ 129$ -$ 129$ Corporate and Other Net financing loss (179)$ 61$ (118)$ (179)$ 57$ (122)$ (281)$ 96$ (185)$ Total other revenue 23 - 23 15 - 15 (18) - (18) Provision for loan losses (5) - (5) (1) - (1) (3) - (3) Noninterest expense 93 5 98 100 (15) 85 99 (1) 98 Pre-tax loss from continuing ops (244)$ 56$ (188)$ (263)$ 72$ (191)$ (395)$ 98$ (297)$ 2Q 13 1Q 13 2Q 12
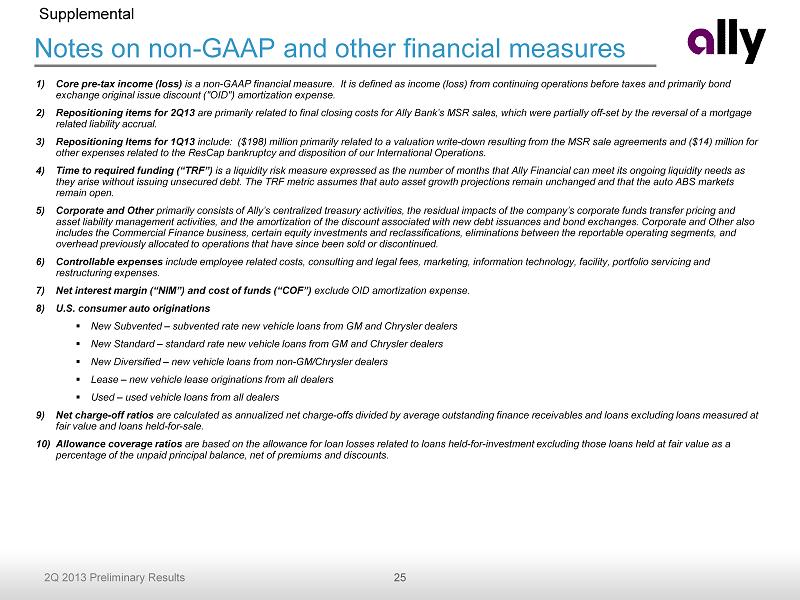
25 2Q 2013 Preliminary Results Notes on non - GAAP and other financial measures Supplemental 1) Core pre - tax income (loss) is a non - GAAP financial measure. It is defined as income (loss) from continuing operations before taxes and primarily bond exchange original issue discount ("OID") amortization expense . 2) Repositioning items for 2Q13 are primarily related to final closing costs for Ally Bank’s MSR sales, which were partially off - set by the reversal of a mortga ge related liability accrual. 3) Repositioning Items for 1Q13 include: ($198) million primarily related to a valuation write - down resulting from the MSR sale agreements and ($14) million fo r other expenses related to the ResCap bankruptcy and disposition of our International Operations. 4) Time to required funding (“TRF”) is a liquidity risk measure expressed as the number of months that Ally Financial can meet its ongoing liquidity needs as they arise without issuing unsecured debt. The TRF metric assumes that auto asset growth projections remain unchanged and tha t t he auto ABS markets remain open. 5) Corporate and Other primarily consists of Ally’s centralized treasury activities, the residual impacts of the company’s corporate funds transfer pri cing and asset liability management activities, and the amortization of the discount associated with new debt issuances and bond excha nge s. Corporate and Other also includes the Commercial Finance business, certain equity investments and reclassifications, eliminations between the reportab le operating segments, and overhead previously allocated to operations that have since been sold or discontinued. 6) Controllable expenses include employee related costs, consulting and legal fees, marketing, information technology, facility, portfolio servicing a nd restructuring expenses. 7) Net interest margin (“NIM”) and cost of funds (“COF”) exclude OID amortization expense. 8) U.S. consumer auto originations ▪ New Subvented – subvented rate new vehicle loans from GM and Chrysler dealers ▪ New Standard – standard rate new vehicle loans from GM and Chrysler dealers ▪ New Diversified – new vehicle loans from non - GM/Chrysler dealers ▪ Lease – new vehicle lease originations from all dealers ▪ Used – used vehicle loans from all dealers 9) Net charge - off ratios are calculated as annualized net charge - offs divided by average outstanding finance receivables and loans excluding loans measur ed at fair value and loans held - for - sale. 10) Allowance coverage ratios are based on the allowance for loan losses related to loans held - for - investment excluding those loans held at fair value as a percentage of the unpaid principal balance, net of premiums and discounts .