SECOND QUARTER 2013 FINANCIAL SUPPLEMENT
ALLY FINANCIAL INC. FORWARD-LOOKING STATEMENTS AND ADDITIONAL INFORMATION The following should be read in conjunction with the financial statements, notes and other information contained in the Company’s Annual Reports on Form 10-K, Quarterly Reports on Form 10-Q, and Current Reports on Form 8-K. This information is preliminary and based on company data available at the time of the presentation In the presentation that follows and related comments by Ally Financial Inc. (“Ally”) management, the use of the words “expect,” “anticipate,” “estimate,” “forecast,” “initiative,” “objective,” “plan,” “goal,” “project,” “outlook,” “priorities,” “target,” “explore,” “positions," “intend,” “evaluate,” “pursue,” “seek,” “may,” “would, ” “could, ” “should, ” “believe, ” “potential, ” “continue,” , or the negative of these words, or similar expressions is intended to identify forward-looking statements. All statements herein and in related management comments, other than statements of historical fact, including without limitation, statements about future events and financial performance, are forward- looking statements that involve certain risks and uncertainties. While these statements represent Ally’s current judgment on what the future may hold, and Ally believes these judgments are reasonable, these statements are not guarantees of any events or financial results, and Ally’s actual results may differ materially due to numerous important factors that are described in the most recent reports on SEC Forms 10-K and 10-Q for Ally, each of which may be revised or supplemented in subsequent reports filed with the SEC. Such factors include, among others, the following: maintaining the mutually beneficial relationship between Ally and General Motors (“GM”), and Ally and Chrysler Group LLC (“Chrysler”); the profitability and financial condition of GM and Chrysler; resolution of the Residential Capital, LLC and certain of its subsidiaries; our ability to realize the anticipated benefits associated with being a bank holding company, and the increased regulation and restrictions that we are now subject to; the potential for deterioration in the residual value of off-lease vehicles; disruptions in the market in which we fund our operations, with resulting negative impact on our liquidity; changes in our accounting assumptions that may require or that result from changes in the accounting rules or their application, which could result in an impact on earnings; changes in the credit ratings of Ally the credit ratings of Allythe credit ratings of Ally, ,, Chry ChryChrysler, sler,sler, or GM; changes in econom or GM; changes in economor GM; changes in economic conditions, cur ic conditions, curic conditions, currency exc rency excrency exchange rates or political s hange rates or political shange rates or political stability in the m tability in the mtability in the mark arkarkets etsets in inin which we operate; and changes in the existing or the adoption of new laws, regulations, policies or other activities of governments, agencies and similar organizations (including lt of the Dodd Frank Act and Basel III). agencies and similar organizations (including as a result of the Dodd-Frank Act and Basel III). Investors are cautioned not to place undue reliance on forward-looking statements. Ally undertakes no obligation to update publicly or otherwise revise any forward-looking statements except where expressly required by law. Reconciliation of non-GAAP financial measures included within this presentation are provided in this presentation. Use of the term “loans” describes products associated with direct and indirect lending activities of Ally’s global operations. The specific products include retail installment sales contracts, loans, lines of credit, leases or other financing products. The term “originate” refers to Ally’s purchase, acquisition or direct origination of various “loan” products. 2Q 2013 Prelim 2Q 2013 Prelim2Q 2013 Preliminary inaryinary Results ResultsResults
ALLY FINANCIAL INC. TABLE OF CONTENTS TABLE OF CONTENTS Page(s) Consolidated Results Consolidated Financial Highlights 4 Consolidated Income Statement 5 Consolidated Period-End Balance Sheet 6 Consolidated Average Balance Sheet 7 Segment Detail Segment Highlights 8 Automotive Finance 9-10 Insurance 11 Mortgage 12 Corporate and Other 13 Credit Related Information 14-16 Supplemental Detail Capital 17 Liquidity 18 Liquidity Deposits 19 Ally Bank Consumer Mortgage HFI Portfolio 20 Discontinued Operations 21 Ownership 22 2Q 2013 Prelim 2Q 2013 Prelim2Q 2013 Preliminary inaryinary Results ResultsResults
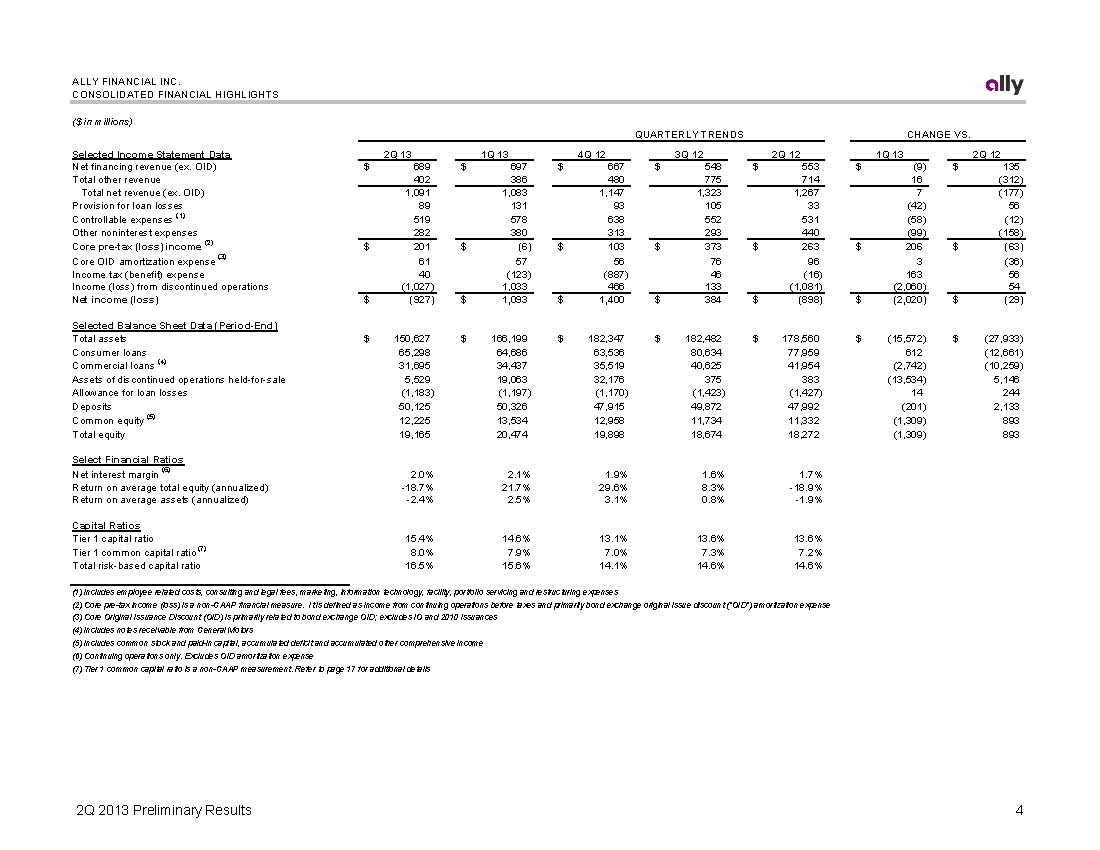
ALLY FINANCIAL INC. CONSOLIDATED FINANCIAL HIGHLIGHTS ($ in millions) QUARTERLY TRENDS CHANGE VS. Selected Income Statement Data Net financing revenue (ex. OID) Total other revenue Total net revenue (ex. OID) Provision for loan losses Controllable expenses (1) Other noninterest expenses Core pre-tax (loss) income (2) Core OID amortization expense (3) Income tax (benefit) expense Income (loss) from discontinued operations Net income (loss) 2Q 13 1Q 13 4Q 12 3Q 12 2Q 12 689$ 697$ 667$ 548$ 553$ 402 386 480 775 714 1,091 1,083 1,147 1,323 1,267 89 131 93 105 33 519 578 638 552 531 282 380 313 293 440 201$ (6)$ 103$ 373$ 263$ 61 57 56 76 96 40 (123) (887) 46 (16) (1,027) 1,033 466 133 (1,081) (927)$ 1,093$ 1,400$ 384$ (898)$ $ $ $ 1Q 13 2Q 12 (9) 135$ 16 (312) 7 (177) (42) 56 (58) (12) (99) (158) 206 (63)$ 3 (36) 163 56 (2,060) 54 (2,020) (29)$ Selected Balance Sheet Data (Period-End) Total assets Consumer loans Commercial loans (4) Assets of discontinued operations held-for-sale Allowance for loan losses Deposits Common equity (5) Total equity 150,627$ 166,199$ 182,347$ 182,482$ 178,560$ 65,298 64,686 63,536 80,634 77,959 31,695 34,437 35,519 40,625 41,954 5,529 19,063 32,176 375 383 (1,183) (1,197) (1,170) (1,423) (1,427) 50,125 50,326 47,915 49,872 47,992 12,225 13,534 12,958 11,734 11,332 19,165 20,474 19,898 18,674 18,272 $ (15,572) 612 (2,742) (13,534) 14 (201) (1,309) (1,309) $ (27,933) (12,661) (10,259) 5,146 244 2,133 893 893 Select Financial Ratios Net interest margin (6)Net interest margin (6) Return on average total equity (annualized) Return on average assets (annualized) 2.0%2.0% -18.7% -2.4% 2.1%2.1% 21.7% 2.5% 1.9%1.9% 29.6% 3.1% 1.6%1.6% 8.3% 0.8% 1.7%1.7% -18.9% -1.9% Capital Ratios Tier 1 capital ratio Tier 1 common capital ratio (7) Total risk-based capital ratio 15.4% 8.0% 16.5% 14.6% 7.9% 15.6% 13.1% 7.0% 14.1% 13.6% 7.3% 14.6% 13.6% 7.2% 14.6% (1) Includes employee related costs, consulting and legal fees, marketing, information technology, facility, portfolio servicing and restructuring expenses (2) Core pre-tax income (loss) is a non-GAAP financial measure. It is defined as income from continuing operations before taxes and primarily bond exchange original issue discount ("OID") amortization expense (3) Core Original Issuance Discount (OID) is primarily related to bond exchange OID; excludes IO and 2010 issuances (4) Includes notes receivable from General Motors (5) Includes common stock and paid-in capital, accumulated deficit and accumulated other comprehensive income (6) Continuing operations only. Excludes OID amortization expense (7) Tier 1 common capital ratio is a non-GAAP measurement. Refer to page 17 for additional details 2Q 2013 Prelim 2Q 2013 Prelim2Q 2013 Preliminary inaryinary Results ResultsResults
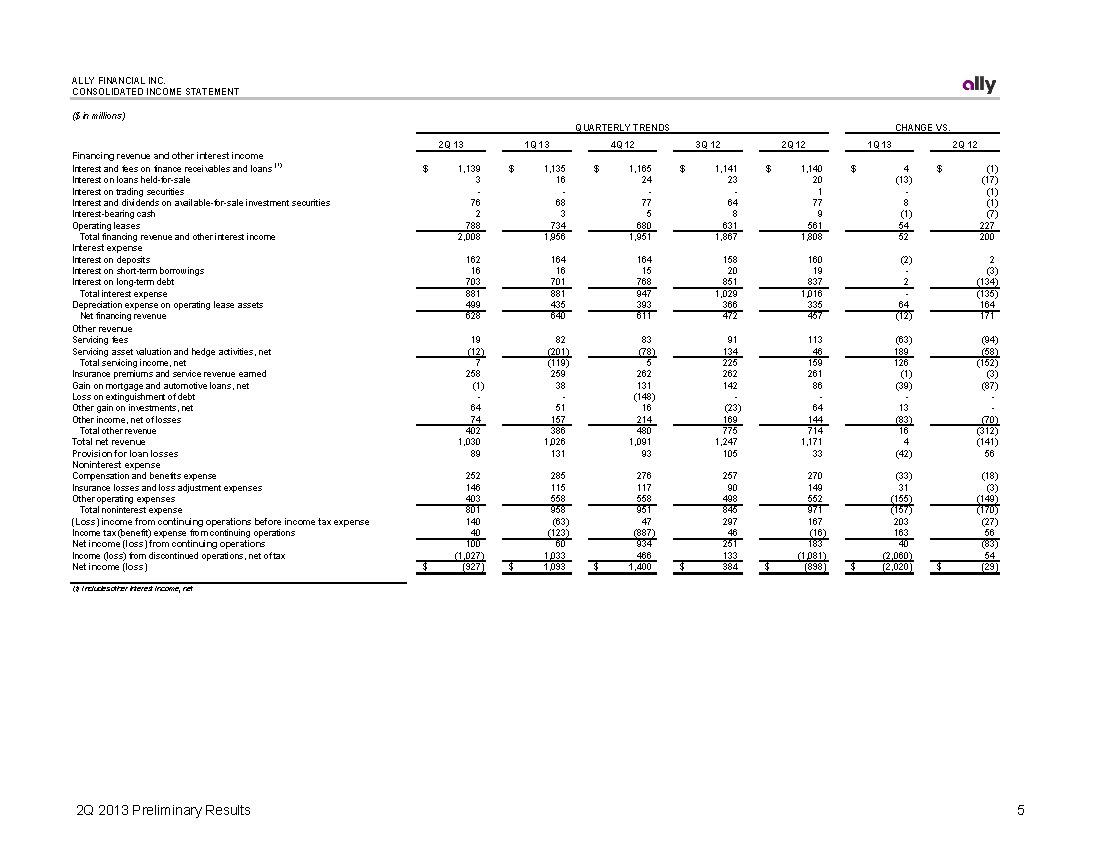
ALLY FINANCIAL INC. CONSOLIDATED INCOME STATEMENT CONSOLIDATED INCOME STATEMENT ($ in millions) QUARTERLY TRENDS CHANGE VS. 2Q 13 1Q 13 4Q 12 3Q 12 2Q 12 1Q 13 2Q 12 Financing revenue and other interest income Interest and fees on finance receivables and loans (1) $ 1,139 $ 1,135 1,165$ $ 1,141 $ 1,140 $ 4 $ (1) Interest on loans held-for-sale 3 16 24 23 20 (13) (17) Interest on trading securities ----1 -(1) Interest and dividends on available-for-sale investment securities 76 68 77 64 77 8 (1) Interest-bearing cash 2 3 5 8 9 (1) (7) Operating leases 788 734 680 631 561 54 227 Total financing revenue and other interest income 2,008 1,956 1,951 1,867 1,808 52 200 Interest expense Interest on deposits 162 164 164 158 160 (2) 2 Interest on short-term borrowings 16 16 15 20 19 -(3) Interest on long-term debt 703 701 768 851 837 2 (134) Total interest expense 881 881 947 1,029 1,016 -(135) Depreciation expense on operating lease assets 499 435 393 366 335 64 164 Net financing revenue 628 640 611 472 457 (12) 171 Other revenue Servicing fees 19 82 83 91 113 (63) (94) Servicing asset valuation and hedge activities, net (12) (201) (78) 134 46 189 (58) Total servicing income, net 7 (119) 5 225 159 126 (152) Insurance premiums and service revenue earned 258 259 262 262 261 (1) (3) Gain on mortgage and automotive loans, net (1) 38 131 142 86 (39) (87) Loss on extinguishment of debt --(148) ---- Other gain on investments, net 64 51 16 (23) 64 13 - Other income, net of losses 74 157 214 169 144 (83) (70) Total other revenue 402 386 480 775 714 16 (312) Total net revenue 1,030 1,026 1,091 1,247 1,171 4 (141) Provision for loan losses 89 131 93 105 33 (42) 56 Noninterest expense Compensati d benefiCompensation and benefits expense 252252 285285 276276 257257 270270 (33)(33) (18)(18) Insurance losses and loss adjustment expenses 146 115 117 90 149 31 (3) Other operating expenses 403 558 558 498 552 (155) (149) Total noninterest expense 801 958 951 845 971 (157) (170) (Loss) income from continuing operations before income tax expense 140 (63) 47 297 167 203 (27) Income tax (benefit) expense from continuing operations 40 (123) (887) 46 (16) 163 56 Net income (loss) from continuing operations 100 60 934 251 183 40 (83) Income (loss) from discontinued operations, net of tax (1,027) 1,033 466 133 (1,081) (2,060) 54 Net income (loss) $ (927) $ 1,093 1,400$ $ 384 $ (898) $ (2,020) $ (29) (1) Includes other interest income, net 2Q 2013 Prelim 2Q 2013 Prelim2Q 2013 Preliminary inaryinary Results ResultsResults
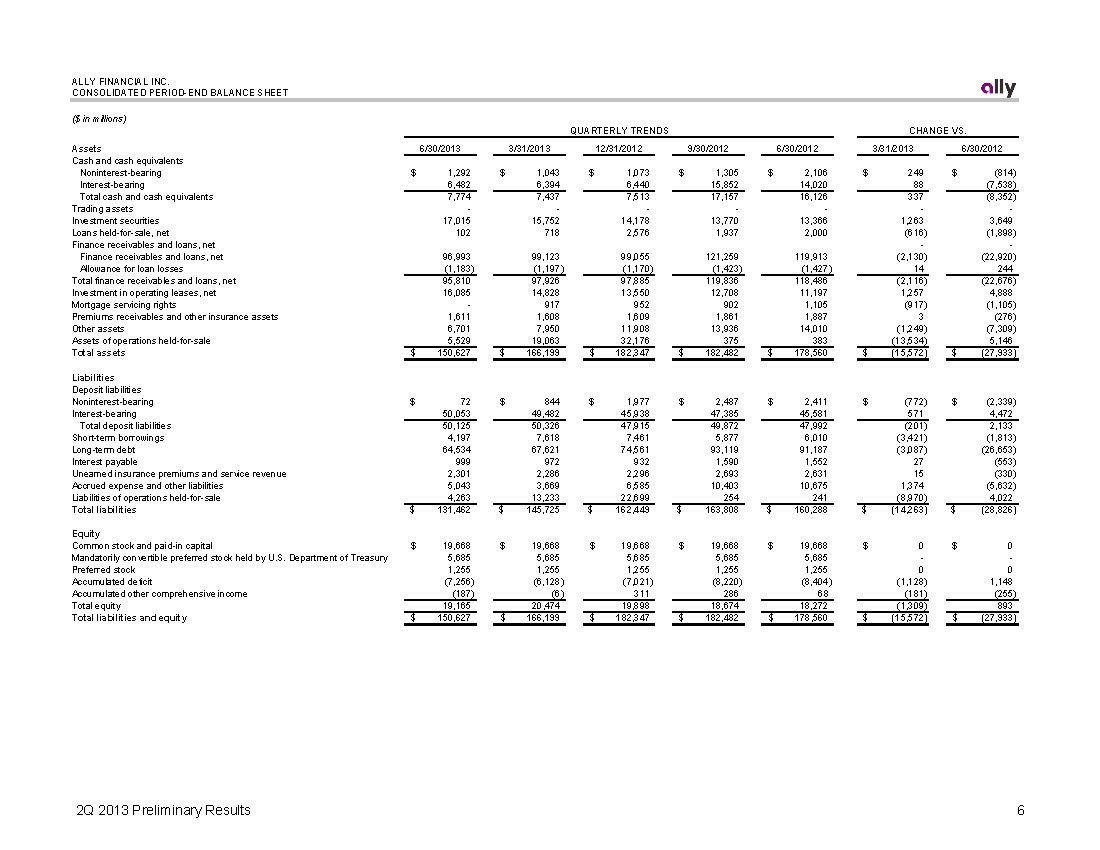
ALLY FINANCIAL INC. CONSOLIDATED PERIOD-END BALANCE SHEET ($ in millions) QUARTERLY TRENDS CHANGE VS. Assets 6/30/2013 3/31/2013 12/31/2012 9/30/2012 6/30/2012 3/31/2013 6/30/2012 Cash and cash equivalents Noninterest-bearing $ 1,292 $ 1,043 1,073$ $ 1,305 $ 2,106 $ 249 (814)$ Interest-bearing 6,482 6,394 6,440 15,852 14,020 88 (7,538) Total cash and cash equivalents 7,774 7,437 7,513 17,157 16,126 337 (8,352) Trading assets ------- Investment securities 17,015 15,752 14,178 13,770 13,366 1,263 3,649 Loans held-for-sale, net 102 718 2,576 1,937 2,000 (616) (1,898) Finance receivables and loans, net -- Finance receivables and loans, net 96,993 99,123 99,055 121,259 119,913 (2,130) (22,920) Allowance for loan losses (1,183) (1,197) (1,170) (1,423) (1,427) 14 244 Total finance receivables and loans, net 95,810 97,926 97,885 119,836 118,486 (2,116) (22,676) Investment in operating leases, net 16,085 14,828 13,550 12,708 11,197 1,257 4,888 Mortgage servicing rights -917 952 902 1,105 (917) (1,105) Premiums receivables and other insurance assets 1,611 1,608 1,609 1,861 1,887 3 (276) Other assets 6,701 7,950 11,908 13,936 14,010 (1,249) (7,309) Assets of operations held-for-sale 5,529 19,063 32,176 375 383 (13,534) 5,146 Total assets $ 150,627 $ 166,199 182,347$ $ 182,482 $ 178,560 $ (15,572) (27,933)$ Liabilities Deposit liabilities Noninterest-bearing $ 72 $ 844 1,977$ $ 2,487 $ 2,411 $ (772) (2,339)$ Interest-bearing 50,053 49,482 45,938 47,385 45,581 571 4,472 Total deposit liabilities 50,125 50,326 47,915 49,872 47,992 (201) 2,133 Short-term borrowings 4,197 7,618 7,461 5,877 6,010 (3,421) (1,813) Long-term debt 64,534 67,621 74,561 93,119 91,187 (3,087) (26,653) Interest payable 999 972 932 1,590 1,552 27 (553) Unearned insurance premiums and service revenueUnearned insurance premiums and service revenue 2,3012,301 2,2862,286 2,2962,296 2,6932,693 2,6312,631 15 (330)15 (330) Accrued expense and other liabilities 5,043 3,669 6,585 10,403 10,675 1,374 (5,632) Liabilities of operations held-for-sale 4,263 13,233 22,699 254 241 (8,970) 4,022 Total liabilities $ 131,462 $ 145,725 162,449$ $ 163,808 $ 160,288 $ (14,263) (28,826)$ Equity Common stock and paid-in capital $ 19,668 $ 19,668 19,668$ $ 19,668 $ 19,668 $ 0 0$ Mandatorily convertible preferred stock held by U.S. Department of Treasury 5,685 5,685 5,685 5,685 5,685 -- Preferred stock 1,255 1,255 1,255 1,255 1,255 0 0 Accumulated deficit (7,256) (6,128) (7,021) (8,220) (8,404) (1,128) 1,148 Accumulated other comprehensive income (187) (6) 311 286 68 (181) (255) Total equity 19,165 20,474 19,898 18,674 18,272 (1,309) 893 Total liabilities and equity $ 150,627 $ 166,199 182,347$ $ 182,482 $ 178,560 $ (15,572) (27,933)$ 2Q 2013 Prelim 2Q 2013 Prelim2Q 2013 Preliminary inaryinary Results ResultsResults
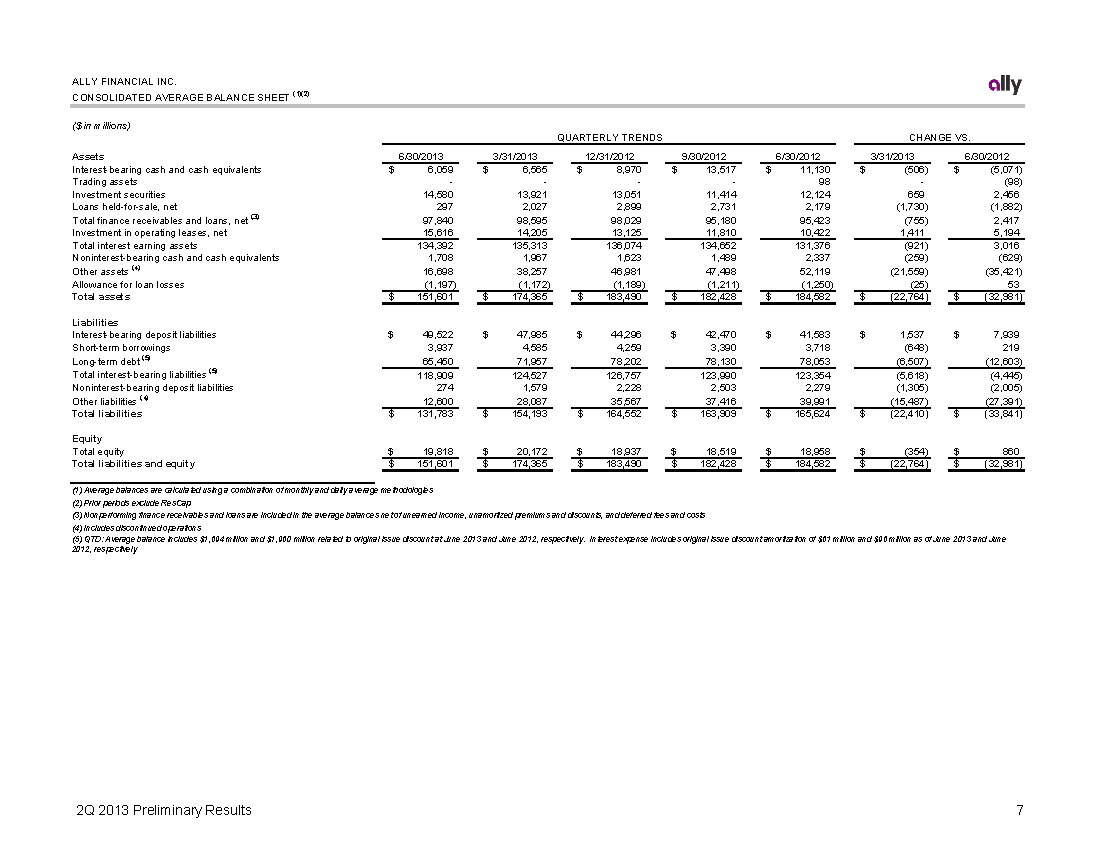
ALLY FINANCIAL INC. CONSOLIDATED AVERAGE BALANCE SHEET (1)(2) ($ in millions) QUARTERLY TRENDS CHANGE VS. Assets Interest-bearing cash and cash equivalents Trading assets Investment securities Loans held-for-sale, net Total finance receivables and loans, net (3) Investment in operating leases, net Total interest earning assets Noninterest-bearing cash and cash equivalents Other assets (4) Allowance for loan losses Total assets 6/30/2013 3/31/2013 12/31/2012 9/30/2012 6/30/2012 6,059$ 6,565$ 8,970$ 13,517$ 11,130$ ----98 14,580 13,921 13,051 11,414 12,124 297 2,027 2,899 2,731 2,179 97,840 98,595 98,029 95,180 95,423 15,616 14,205 13,125 11,810 10,422 134,392 135,313 136,074 134,652 131,376 1,708 1,967 1,623 1,489 2,337 16,698 38,257 46,981 47,498 52,119 (1,197) (1,172) (1,189) (1,211) (1,250) 151,601$ 174,365$ 183,490$ 182,428$ 184,582$ 3/31/2013 (506)$ - 659 (1,730) (755) 1,411 (921) (259) (21,559) (25) (22,764)$ $ $ 6/30/2012 (5,071) (98) 2,456 (1,882) 2,417 5,194 3,016 (629) (35,421) 53 (32,981) Liabilities Interest-bearing deposit liabilities $ 49,522 $ 47,985 $ 44,296 $ 42,470 $ 41,583 $ 1,537 $ 7,939 Short-term borrowings 3,937 4,585 4,259 3,390 3,718 (648) 219 Long-term debt (5) 65,450 71,957 78,202 78,130 78,053 (6,507) (12,603) Total interest-bearing liabilities (5) 118,909 124,527 126,757 123,990 123,354 (5,618) (4,445) Noninterest-bearing deposit liabilities 274 1,579 2,228 2,503 2,279 (1,305) (2,005) Other liabilities (4) 12,600 28,087 35,567 37,416 39,991 (15,487) (27,391) Total liabilities $ 131,783 $ 154,193 $ 164,552 $ 163,909 $ 165,624 $ (22,410) $ (33,841) Equity Total equity $ 19,818 $ 20,172 $ 18,937 $ 18,519 $ 18,958 $ (354) $ 860 Total liabilities and equity $ 151,601 $ 174,365 $ 183,490 $ 182,428 $ 184,582 $ (22,764) $ (32,981) (1) Average balances are calculated using a combination of monthly and daily average methodologies (2) Prior periods exclude ResCap (3) Nonperforming finance receivables and loans are included in the average balances net of unearned income, unamortized premiums and discounts, and deferred fees and costs (4) Includes discontinued operations (5) QTD: Average balance includes $1,694 million and $1,960 million related to original issue discount at June 2013 and June 2012, respectively. Interest expense includes original issue discount amortization of $61 million and $96 million as of June 2013 and June 2012, respectively 2Q 2013 Prelim 2Q 2013 Prelim2Q 2013 Preliminary inaryinary Results ResultsResults
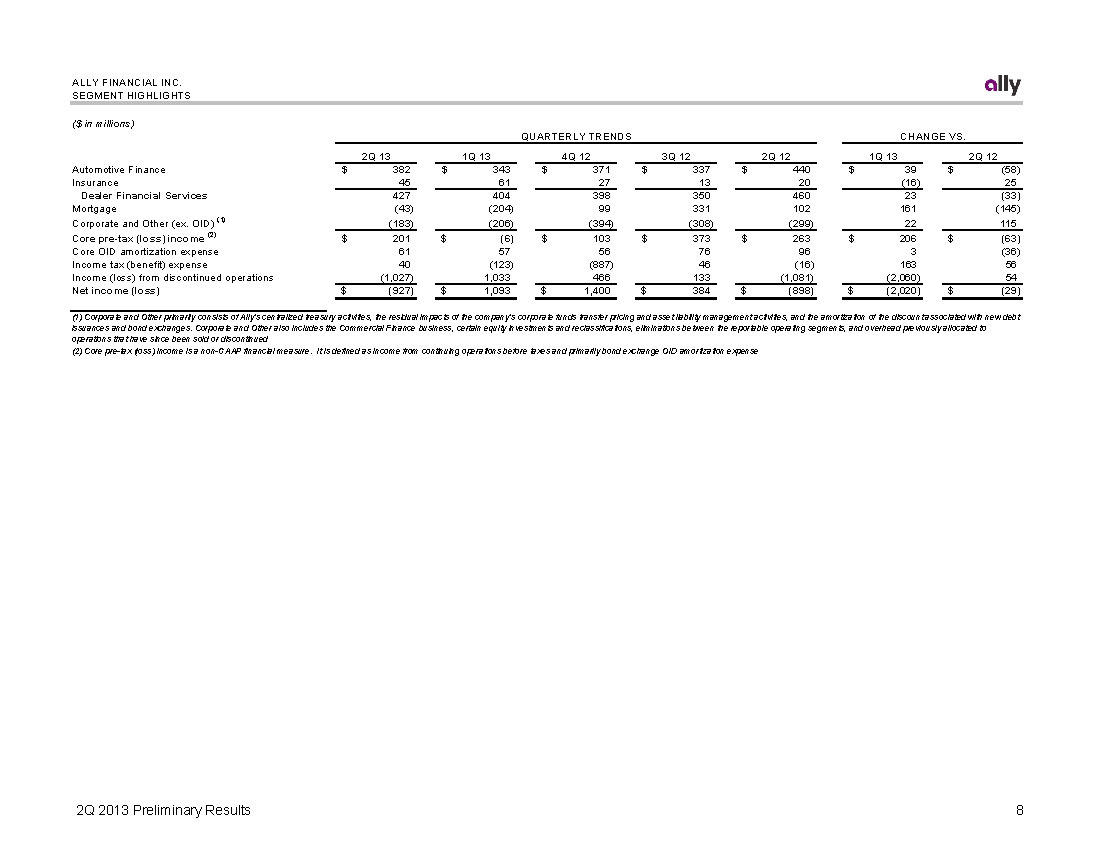
ALLY FINANCIAL INC. SEGMENT HIGHLIGHTS SEGMENT HIGHLIGHTS ($ in millions) QUARTERLY TRENDS CHANGE VS. 2Q 13 1Q 13 4Q 12 3Q 12 2Q 12 1Q 13 2Q 12 Automotive Finance $ 382 $ 343 $ 371 $ 337 $ 440 $ 39 $ (58) Insurance 45 61 27 13 20 (16) 25 Dealer Financial Services 427 404 398 350 460 23 (33) Mortgage (43) (204) 99 331 102 161 (145) Corporate and Other (ex. OID) (1) (183) (206) (394) (308) (299) 22 115 Core pre-tax (loss) income (2) $ 201 $ (6) $ 103 $ 373 $ 263 $ 206 $ (63) Core OID amortization expense 61 57 56 76 96 3 (36) Income tax (benefit) expense 40 (123) (887) 46 (16) 163 56 Income (loss) from discontinued operations (1,027) 1,033 466 133 (1,081) (2,060) 54 Net income (loss) $ (927) $ 1,093 $ 1,400 $ 384 $ (898) $ (2,020) $ (29) (1) Corporate and Other primarily consists of Ally’s centralized treasury activities, the residual impacts of the company’s corporate funds transfer pricing and asset liability management activities, and the amortization of the discount associated with new debt issuances and bond exchanges. Corporate and Other also includes the Commercial Finance business, certain equity investments and reclassifications, eliminations between the reportable operating segments, and overhead previously allocated to operations that have since been sold or discontinued (2) Core pre-tax (loss) income is a non-GAAP financial measure. It is defined as income from continuing operations before taxes and primarily bond exchange OID amortization expense 2Q 2013 Prelim 2Q 2013 Prelim2Q 2013 Preliminary inaryinary Results ResultsResults
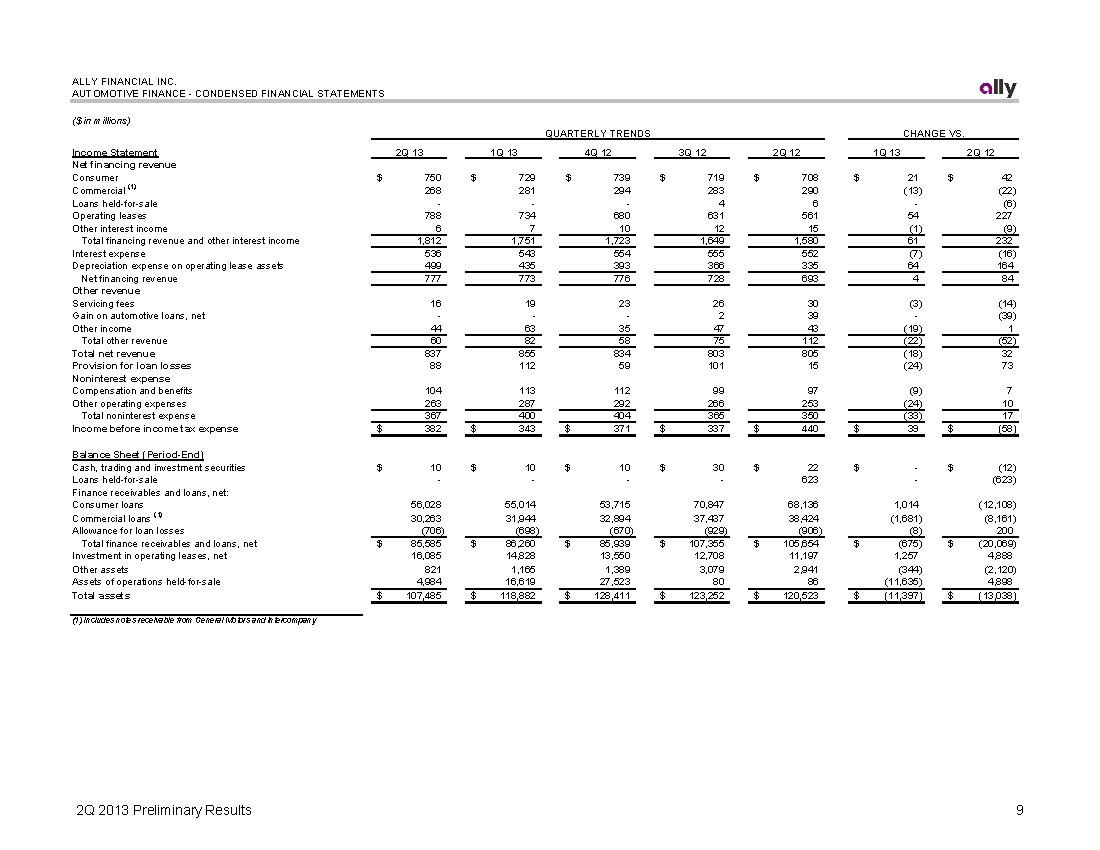
ALLY FINANCIAL INC. AUTOMOTIVE FINANCE - CONDENSED FINANCIAL STATEMENTS ($ in millions) QUARTERLY TRENDS CHANGE VS. Income Statement 2Q 13 1Q 13 4Q 12 3Q 12 2Q 12 1Q 13 2Q 12 Net financing revenue Consumer $ 750 $ 729 739$ $ 719 $ 708 $ 21 42$ Commercial (1) 268 281 294 283 290 (13) (22) Loans held-for-sale ---4 6 -(6) Operating leases 788 734 680 631 561 54 227 Other interest income 6 7 10 12 15 (1) (9) Total financing revenue and other interest income 1,812 1,751 1,723 1,649 1,580 61 232 Interest expense 536 543 554 555 552 (7) (16) Depreciation expense on operating lease assets 499 435 393 366 335 64 164 Net financing revenue 777 773 776 728 693 4 84 Other revenue Servicing fees 16 19 23 26 30 (3) (14) Gain on automotive loans, net ---2 39 -(39) Other income 44 63 35 47 43 (19) 1 Total other revenue 60 82 58 75 112 (22) (52) Total net revenue 837 855 834 803 805 (18) 32 Provision for loan losses 88 112 59 101 15 (24) 73 Noninterest expense Compensation and benefits 104 113 112 99 97 (9) 7 Other operating expenses 263 287 292 266 253 (24) 10 Total noninterest expense 367 400 404 365 350 (33) 17 Income before income tax expense $ 382 $ 343 371$ $ 337 $ 440 $ 39 (58)$ Balance Sheet (Period-End) Cash, trading and investment securitiesCash, ading and inv $ 10 $ 10 10$ $ 30 $ 22 $ -(12)$ (12) Loans held-for-sale ----623 -(623) Finance receivables and loans, net: Consumer loans Commercial loans (1) 56,028 30,263 55,014 53,715 31,944 32,894 70,847 37,437 68,136 38,424 1,014 (12,108) (1,681) (8,161) Allowance for loan losses (706) (698) (670) (929) (906) (8) 200 Total finance receivables and loans, net $ 85,585 $ 86,260 85,939$ $ 107,355 $ 105,654 $ (675) (20,069)$ Investment in operating leases, net 16,085 14,828 13,550 12,708 11,197 1,257 4,888 Other assets 821 1,165 1,389 3,079 2,941 (344) (2,120) Assets of operations held-for-sale 4,984 16,619 27,523 80 86 (11,635) 4,898 Total assets $ 107,485 $ 118,882 128,411$ $ 123,252 $ 120,523 $ (11,397) (13,038)$ (1) Includes notes receivable from General Motors and intercompany 2Q 2013 Prelim 2Q 2013 Prelim2Q 2013 Preliminary inaryinary Results ResultsResults
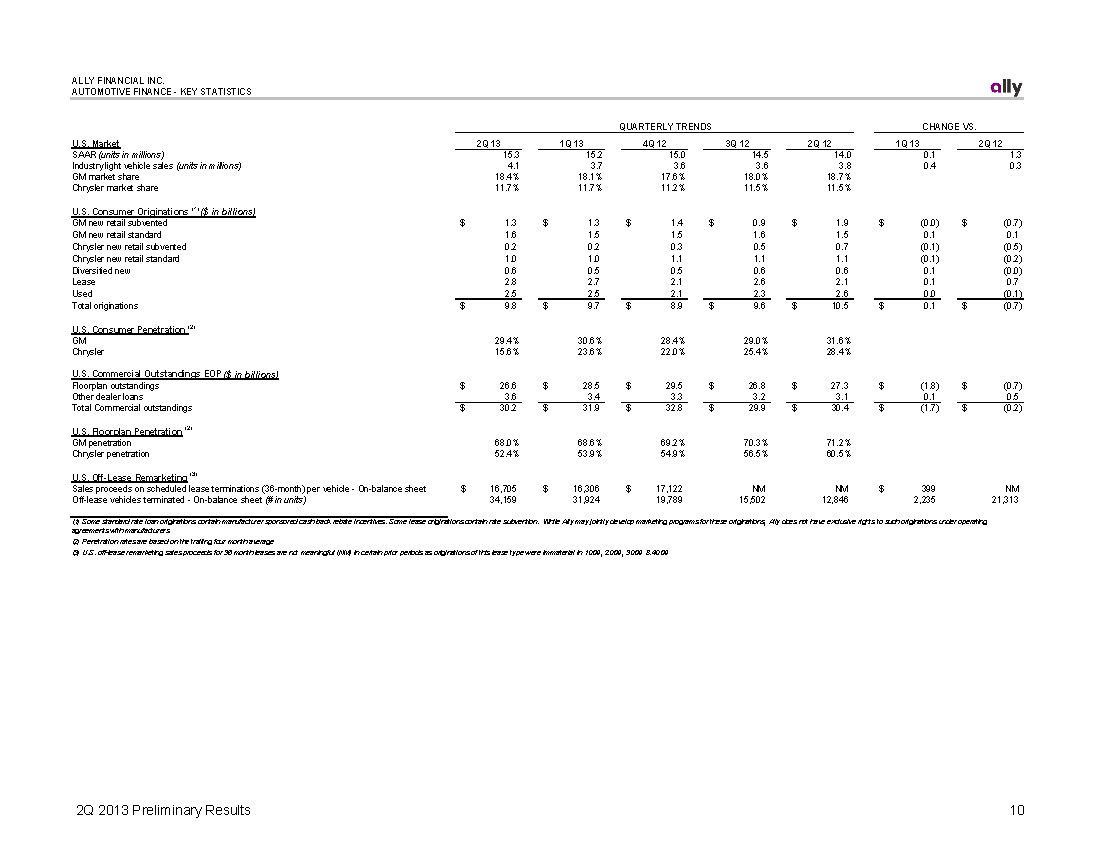
ALLY FINANCIAL INC. AUTOMOTIVE FINANCE - KEY STATISTICS QUARTERLY TRENDS CHANGE VS. U.S. Market 2Q 13 1Q 13 4Q 12 3Q 12 2Q 12 1Q 13 2Q 12 SAAR (units in millions) 15.3 15.2 15.0 14.5 14.0 0.1 1.3 Industry light vehicle sales (units in millions) 4.1 3.7 3.6 3.6 3.8 0.4 0.3 GM market share 18.4% 18.1% 17.6% 18.0% 18.7% Chrysler market share 11.7% 11.7% 11.2% 11.5% 11.5% U.S. Consumer Originations (1) ($ in billions) GM new retail subvented $ 1.3 $ 1.3 $ 1.4 $ 0.9 $ 1.9 $ (0.0) $ (0.7) GM new retail standard 1.6 1.5 1.5 1.6 1.5 0.1 0.1 Chrysler new retail subvented 0.2 0.2 0.3 0.5 0.7 (0.1) (0.5) Chrysler new retail standard 1.0 1.0 1.1 1.1 1.1 (0.1) (0.2) Diversified new 0.6 0.5 0.5 0.6 0.6 0.1 (0.0) Lease 2.8 2.7 2.1 2.6 2.1 0.1 0.7 Used 2.5 2.5 2.1 2.3 2.6 0.0 (0.1) Total originations $ 9.8 $ 9.7 $ 8.9 $ 9.6 $ 10.5 $ 0.1 $ (0.7) U.S. Consumer Penetration (2) GM 29.4% 30.6% 28.4% 29.0% 31.6% Chrysler 15.6% 23.6% 22.0% 25.4% 28.4% U.S. Commercial Outstandings EOP ($ in billions) Floorplan outstandings $ 26.6 $ 28.5 $ 29.5 $ 26.8 $ 27.3 $ (1.8) $ (0.7) Other dealer loans 3.6 3.4 3.3 3.2 3.1 0.1 0.5 Total Commercial outstandings $ 30.2 $ 31.9 $ 32.8 $ 29.9 $ 30.4 $ (1.7) $ (0.2) U.S. Floorplan Penetration (2) GM penetration 68.0% 68.6% 69.2% 70.3% 71.2% Chrysler penetration 52.4% 53.9% 54.9% 56.5% 60.5% U.S. Off-Lease Remarketing (3)(3) Sales proceeds on scheduled lease terminations (36-month) per vehicle -On-balance sheet $ 16,705 $ 16,306 $ 17,122 NM NM $ 399 NM Off-lease vehicles terminated -On-balance sheet (# in units) 34,159 31,924 19,789 15,502 12,846 2,235 21,313 (1) Some standard rate loan originations contain manufacturer sponsored cash back rebate incentives. Some lease originations contain rate subvention. While Ally may jointly develop marketing programs for these originations, Ally does not have exclusive rights to such originations under operating agreements with manufacturers (2) Penetration rates are based on the trailing four month average (3) U.S. off-lease remarketing sales proceeds for 36 month leases are not meaningful (NM) in certain prior periods as originations of this lease type were immaterial in 1Q09, 2Q09, 3Q09 & 4Q09 2Q 2013 Prelim 2Q 2013 Prelim2Q 2013 Preliminary inaryinary Results ResultsResults
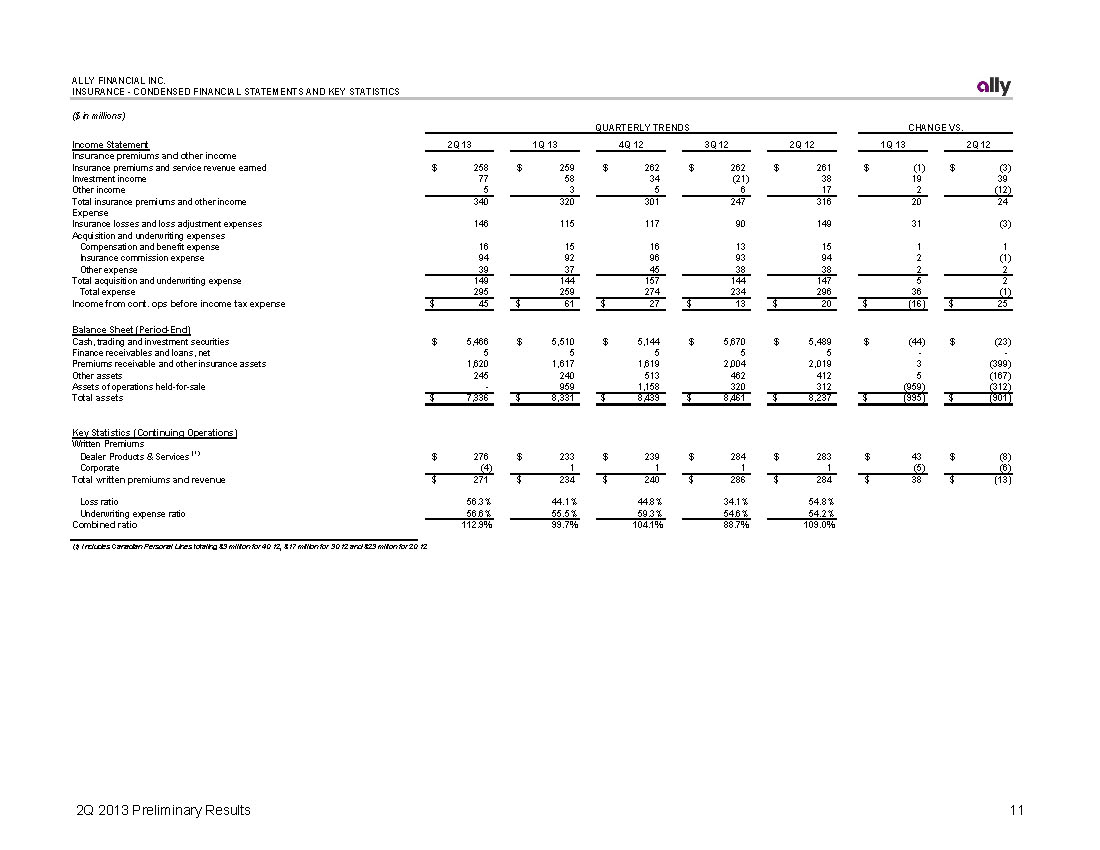
ALLY FINANCIAL INC. INSURANCE - CONDENSED FINANCIAL STATEMENTS AND KEY STATISTICS ($ in millions) QUARTERLY TRENDS CHANGE VS. Income Statement Insurance premiums and other income Insurance premiums and service revenue earned Investment income Other income Total insurance premiums and other income Expense Insurance losses and loss adjustment expenses Acquisition and underwriting expenses Compensation and benefit expense Insurance commission expense Other expense Total acquisition and underwriting expense Total expense Income from cont. ops before income tax expense $ $ 2Q 13 258 77 5 340 146 16 94 39 149 295 45 $ $ 1Q 13 259 58 3 320 115 15 92 37 144 259 61 4Q 12 262$ $ 34 5 301 117 16 96 45 157 274 27$ $ 3Q 12 262 (21) 6 247 90 13 93 38 144 234 13 $ $ 2Q 12 261 38 17 316 149 15 94 38 147 296 20 $ $ 1Q 13 2Q 12 (1) (3)$ 19 39 2 (12) 20 24 31 (3) 1 1 2 (1) 2 2 5 2 36 (1) (16) 25$ Balance Sheet (Period-End) Cash, trading and investment securities Finance receivables and loans, net Premiums receivable and other insurance assets Other assets Assets of operations held-for-sale Total assets $ $ 5,466 5 1,620 245 - 7,336 $ $ 5,510 5 1,617 240 959 8,331 5,144$ $ 5 1,619 513 1,158 8,439$ $ 5,670 5 2,004 462 320 8,461 $ $ 5,489 5 2,019 412 312 8,237 $ $ (44) - 3 5 (959) (995) $ $ (23) - (399) (167) (312) (901) Key Statistics (Continuing Operations) Written Premiums Dealer Products & Services (1) CorporateCorporate Total written premiums and revenue $ $ 276 (4)(4) 271 $ $ 233 11 234 239$ $ 11 240$ $ 284 11 286 $ $ 283 11 284 $ $ 43 (5)(5) 38 $ $ (8) (6)(6) (13) Loss ratio 56.3% 44.1% 44.8% 34.1% 54.8% Underwriting expense ratio Combined ratio 56.6% 112.9% 55.5% 99.7% 59.3% 104.1% 54.6% 88.7% 54.2% 109.0% (1) Includes Canadian Personal Lines totaling $3 million for 4Q12, $17 million for 3Q12 and $23 milion for 2Q12 2Q 2013 Prelim 2Q 2013 Prelim2Q 2013 Preliminary inaryinary Results ResultsResults
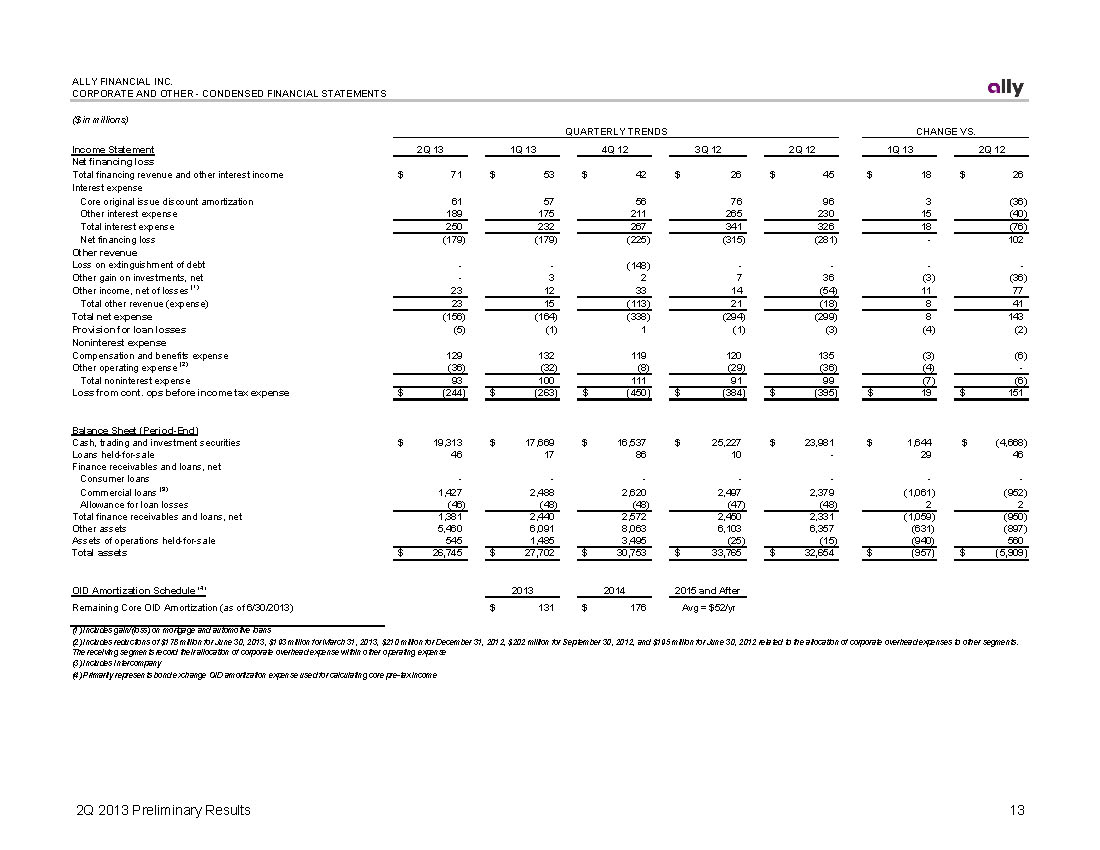
ALLY FINANCIAL INC. CORPORATE AND OTHER - CONDENSED FINANCIAL STATEMENTS ($ in millions) QUARTERLY TRENDS CHANGE VS. Income Statement 2Q 13 1Q 13 4Q 12 3Q 12 2Q 12 1Q 13 2Q 12 Net financing loss Total financing revenue and other interest income $ 71 $ 53 $ 42 $ 26 $ 45 $ 18 $ 26 Interest expense Core original issue discount amortization 61 57 56 76 96 3 (36) Other interest expense 189 175 211 265 230 15 (40) Total interest expense 250 232 267 341 326 18 (76) Net financing loss (179) (179) (225) (315) (281) -102 Other revenue Loss on extinguishment of debt --(148) ---Other gain on investments, net -3 2 7 36 (3) (36) Other income, net of losses (1) 23 12 33 14 (54) 11 77 Total other revenue (expense) 23 15 (113) 21 (18) 8 41 Total net expense (156) (164) (338) (294) (299) 8 143 Provision for loan losses (5) (1) 1 (1) (3) (4) (2) Noninterest expense Compensation and benefits expense 129 132 119 120 135 (3) (6) Other operating expense (2) (36) (32) (8) (29) (36) (4) Total noninterest expense 93 100 111 91 99 (7) (6) Loss from cont. ops before income tax expense $ (244) $ (263) $ (450) $ (384) $ (395) $ 19 $ 151 Balance Sheet (Period-End) Cash, trading and investment securities $ 19,313 $ 17,669 $ 16,537 $ 25,227 $ 23,981 $ 1,644 $ (4,668) Loans held-for-sale 46 17 86 10 -29 46 Finance receivables and loans, net es and loans, net Consumer loans ------Commercial loans (3) 1,427 2,488 2,620 2,497 2,379 (1,061) (952) Allowance for loan losses (46) (48) (48) (47) (48) 2 2 Total finance receivables and loans, net 1,381 2,440 2,572 2,450 2,331 (1,059) (950) Other assets 5,460 6,091 8,063 6,103 6,357 (631) (897) Assets of operations held-for-sale 545 1,485 3,495 (25) (15) (940) 560 Total assets $ 26,745 $ 27,702 $ 30,753 $ 33,765 $ 32,654 $ (957) $ (5,909) OID Amortization Schedule (4) 2013 2014 2015 and After Remaining Core OID Amortization (as of 6/30/2013) $ 131 $ 176 Avg = $52/yr (1) Includes gain/(loss) on mortgage and automotive loans (2) Includes reductions of $178 million for June 30, 2013, $193 million for March 31, 2013, $210 million for December 31, 2012, $202 million for September 30, 2012, and $195 million for June 30, 2012 related to the allocation of corporate overhead expenses to other segments. The receiving segments record their allocation of corporate overhead expense within other operating expense (3) Includes Intercompany (4) Primarily represents bond exchange OID amortization expense used for calculating core pre-tax income 2Q 2013 Prelim 2Q 2013 Prelim2Q 2013 Preliminary inaryinary Results ResultsResults
ALLY FINANCIAL INC. CORPORATE AND OTHER - CONDENSED FINANCIAL STATEMENTS ($ in millions) QUARTERLY TRENDS CHANGE VS. Income Statement 2Q 13 1Q 13 4Q 12 3Q 12 2Q 12 1Q 13 2Q 12 Net financing loss Total financing revenue and other interest income $ 71 $ 53 $ 42 $ 26 $ 45 $ 18 $ 26 Interest expense Core original issue discount amortization 61 57 56 76 96 3 (36) Other interest expense 189 175 211 265 230 15 (40) Total interest expense 250 232 267 341 326 18 (76) Net financing loss (179) (179) (225) (315) (281) -102 Other revenue Loss on extinguishment of debt --(148) ---Other gain on investments, net -3 2 7 36 (3) (36) Other income, net of losses (1) 23 12 33 14 (54) 11 77 Total other revenue (expense) 23 15 (113) 21 (18) 8 41 Total net expense (156) (164) (338) (294) (299) 8 143 Provision for loan losses (5) (1) 1 (1) (3) (4) (2) Noninterest expense Compensation and benefits expense 129 132 119 120 135 (3) (6) Other operating expense (2) (36) (32) (8) (29) (36) (4) Total noninterest expense 93 100 111 91 99 (7) (6) Loss from cont. ops before income tax expense $ (244) $ (263) $ (450) $ (384) $ (395) $ 19 $ 151 Balance Sheet (Period-End) Cash, trading and investment securities $ 19,313 $ 17,669 $ 16,537 $ 25,227 $ 23,981 $ 1,644 $ (4,668) Loans held-for-sale 46 17 86 10 -29 46 Finance receivables and loans, net es and loans, net Consumer loans ------Commercial loans (3) 1,427 2,488 2,620 2,497 2,379 (1,061) (952) Allowance for loan losses (46) (48) (48) (47) (48) 2 2 Total finance receivables and loans, net 1,381 2,440 2,572 2,450 2,331 (1,059) (950) Other assets 5,460 6,091 8,063 6,103 6,357 (631) (897) Assets of operations held-for-sale 545 1,485 3,495 (25) (15) (940) 560 Total assets $ 26,745 $ 27,702 $ 30,753 $ 33,765 $ 32,654 $ (957) $ (5,909) OID Amortization Schedule (4) 2013 2014 2015 and After Remaining Core OID Amortization (as of 6/30/2013) $ 131 $ 176 Avg = $52/yr (1) Includes gain/(loss) on mortgage and automotive loans (2) Includes reductions of $178 million for June 30, 2013, $193 million for March 31, 2013, $210 million for December 31, 2012, $202 million for September 30, 2012, and $195 million for June 30, 2012 related to the allocation of corporate overhead expenses to other segments. The receiving segments record their allocation of corporate overhead expense within other operating expense (3) Includes Intercompany (4) Primarily represents bond exchange OID amortization expense used for calculating core pre-tax income 2Q 2013 Prelim 2Q 2013 Prelim2Q 2013 Preliminary inaryinary Results ResultsResults
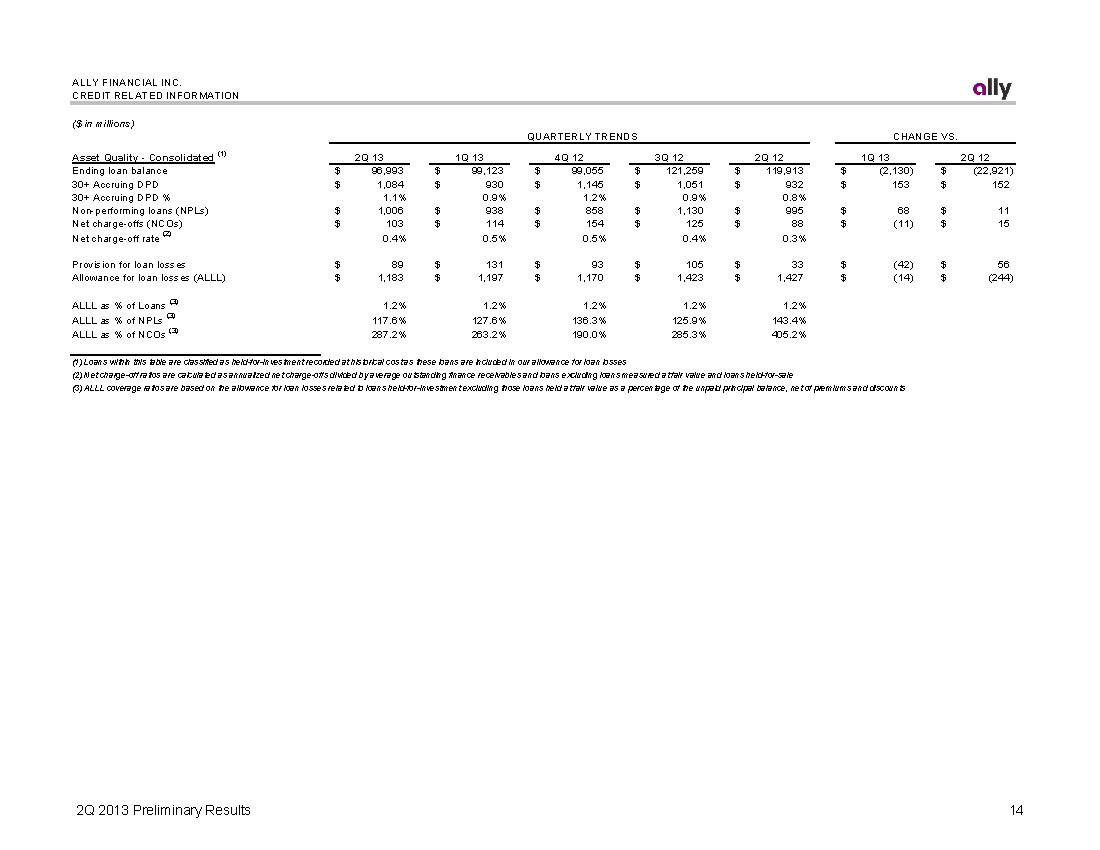
ALLY FINANCIAL INC. CREDIT RELATED INFORMATION ($ in millions) QUARTERLY TRENDS CHANGE VS. Asset Quality - Consolidated (1) 2Q 13 1Q 13 4Q 12 3Q 12 2Q 12 1Q 13 2Q 12 Ending loan balance $ 96,993 $ 99,123 $ 99,055 $ 121,259 $ 119,913 $ (2,130) $ (22,921) 30+ Accruing DPD $ 1,084 $ 930 $ 1,145 $ 1,051 $ 932 $ 153 $ 152 30+ Accruing DPD % 1.1% 0.9% 1.2% 0.9% 0.8% Non-performing loans (NPLs) $ 1,006 $ 938 $ 858 $ 1,130 $ 995 $ 68 $ 11 Net charge-offs (NCOs) $ 103 $ 114 $ 154 $ 125 $ 88 $ (11) $ 15 Net charge-off rate (2) 0.4% 0.5% 0.5% 0.4% 0.3% Provision for loan losses $ 89 $ 131 $ 93 $ 105 $ 33 $ (42) $ 56 Allowance for loan losses (ALLL) $ 1,183 $ 1,197 $ 1,170 $ 1,423 $ 1,427 $ (14) $ (244) ALLL as % of Loans (3) 1.2% 1.2% 1.2% 1.2% 1.2% ALLL as % of NPLs (3) 117.6% 127.6% 136.3% 125.9% 143.4% ALLL as % of NCOs (3) 287.2% 263.2% 190.0% 285.3% 405.2% (1) Loans within this table are classified as held-for-investment recorded at historical cost as these loans are included in our allowance for loan losses (2) Net charge-off ratios are calculated as annualized net charge-offs divided by average outstanding finance receivables and loans excluding loans measured at fair value and loans held-for-sale (3) ALLL coverage ratios are based on the allowance for loan losses related to loans held-for-investment excluding those loans held at fair value as a percentage of the unpaid principal balance, net of premiums and discounts 2Q 2013 Prelim 2Q 2013 Prelim2Q 2013 Preliminary inaryinary Results ResultsResults
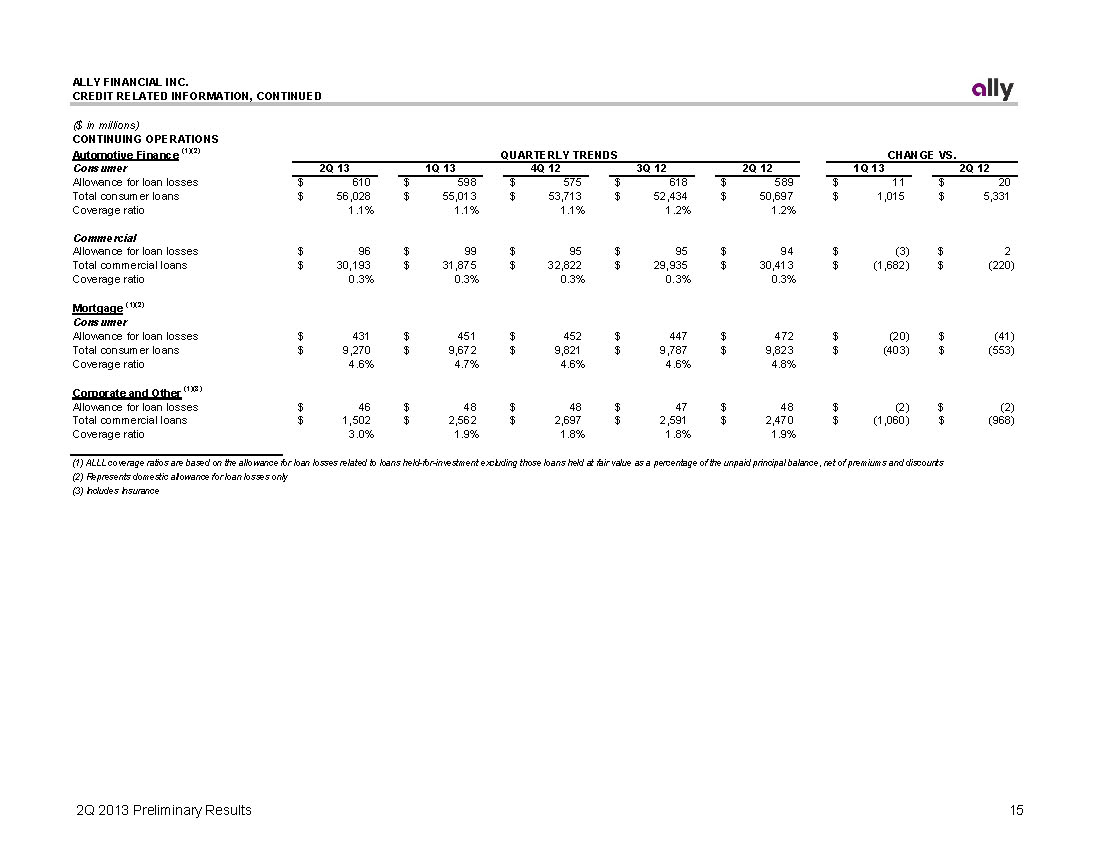
ALLY FINANCIAL INC. CREDIT RELATED INFORMATION, CONTINUED ($ in millions) CONTINUING OPERATIONS Automotive Finance (1)(2) QUARTERLY TRENDS CHANGE VS. Consumer 2Q 13 1Q 13 4Q 12 3Q 12 2Q 12 1Q 13 2Q 12 Allowance for loan losses $ 610 $ 598 $ 575 $ 618 $ 589 $ 11 $ 20 Total consumer loans $ 56,028 $ 55,013 $ 53,713 $ 52,434 $ 50,697 $ 1,015 $ 5,331 Coverage ratio 1.1% 1.1% 1.1% 1.2% 1.2% Commercial Allowance for loan losses $ 96 $ 99 $ 95 $ 95 $ 94 $ (3) $ 2 Total commercial loans $ 30,193 $ 31,875 $ 32,822 $ 29,935 $ 30,413 $ (1,682) $ (220) Coverage ratio 0.3% 0.3% 0.3% 0.3% 0.3% Mortgage (1)(2) Consumer Allowance for loan losses $ 431 $ 451 $ 452 $ 447 $ 472 $ (20) $ (41) Total consumer loans $ 9,270 $ 9,672 $ 9,821 $ 9,787 $ 9,823 $ (403) $ (553) Coverage ratio 4.6% 4.7% 4.6% 4.6% 4.8% Corporate and Other (1)(3) Allowance for loan losses $ 46 $ 48 $ 48 $ 47 $ 48 $ (2) $ (2) Total commercial loans $ 1,502 $ 2,562 $ 2,697 $ 2,591 $ 2,470 $ (1,060) $ (968) Coverage ratio 3.0% 1.9% 1.8% 1.8% 1.9% (1) ALLL coverage ratios are based on the allowance for loan losses related to loans held-for-investment excluding those loans held at fair value as a percentage of the unpaid principal balance, net of premiums and discounts (2) Repr domestic all e for loan l only (2) Represents domestic allowance for loan losses only (3) Includes Insurance 2Q 2013 Prelim 2Q 2013 Prelim2Q 2013 Preliminary inaryinary Results ResultsResults
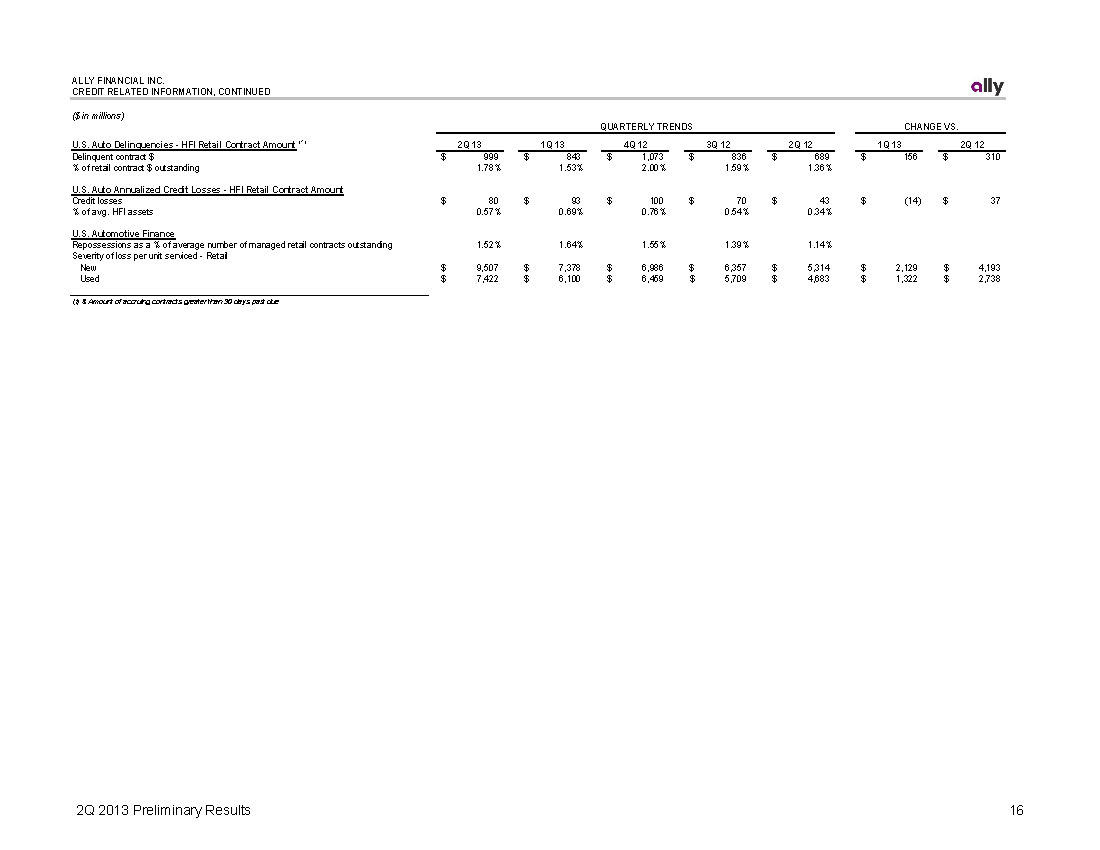
ALLY FINANCIAL INC. CREDIT RELATED INFORMATION, CONTINUED ($ in millions) U.S. Auto Delinquencies - HFI Retail Contract Amount (1) Delinquent contract $ % of retail contract $ outstanding $ 2Q 13 999 1.78% $ 1Q 13 843 1.53% QUARTERLY TRENDS 4Q 12 1,073$ $ 2.00% 3Q 12 836 1.59% $ 2Q 12 689 1.36% $ CHANGE VS. 1Q 13 2Q 12 156 310$ U.S. Auto Annualized Credit Losses - HFI Retail Contract Amount Credit losses % of avg. HFI assets $ 80 0.57% $ 93 0.69% 100$ $ 0.76% 70 0.54% $ 43 0.34% $ (14) 37$ U.S. Automotive Finance Repossessions as a % of average number of managed retail contracts outstanding Severity of loss per unit serviced -Retail New Used $ $ 1.52% 9,507 7,422 $ $ 1.64% 7,378 6,100 1.55% 6,986$ $ 6,459$ $ 1.39% 6,357 5,709 $ $ 1.14% 5,314 4,683 $ $ 2,129 4,193$ 1,322 2,738$ (1) $ Amount of accruing contracts greater than 30 days past due 2Q 2013 Prelim 2Q 2013 Prelim2Q 2013 Preliminary inaryinary Results ResultsResults
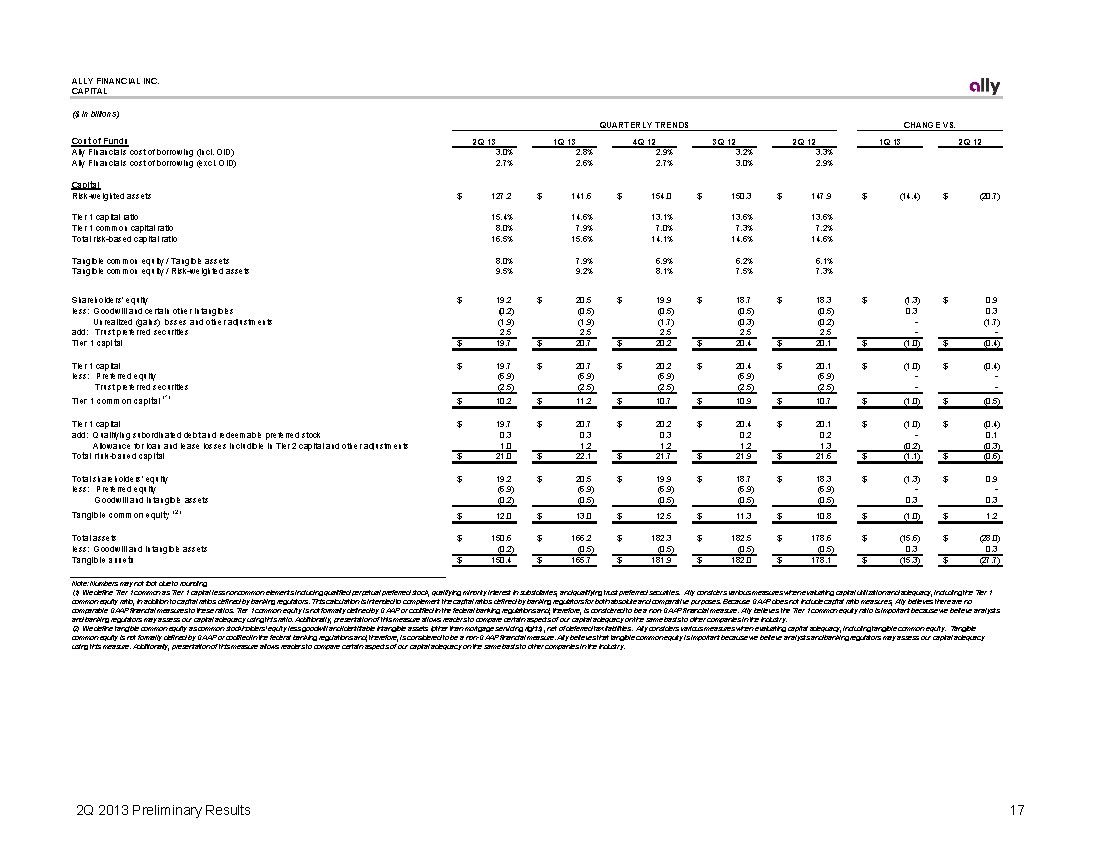
ALLY FINANCIAL INC. CAPITAL CAPITAL ($ in billions) QUARTERLY TRENDS CHANGE VS. Cost of Funds 2Q 13 1Q 13 4Q 12 3Q 12 2Q 12 1Q 13 2Q 12 Ally Financial's cost of borrowing (incl. OID) 3.0% 2.8% 2.9% 3.2% 3.3% Ally Financial's cost of borrowing (excl. OID) 2.7% 2.6% 2.7% 3.0% 2.9% Capital Risk-weighted assets $ 127.2 $ 141.6 $ 154.0 $ 150.3 $ 147.9 $ (14.4) $ (20.7) Tier 1 capital ratio 15.4% 14.6% 13.1% 13.6% 13.6% Tier 1 common capital ratio 8.0% 7.9% 7.0% 7.3% 7.2% Total risk-based capital ratio 16.5% 15.6% 14.1% 14.6% 14.6% Tangible common equity / Tangible assets 8.0% 7.9% 6.9% 6.2% 6.1% Tangible common equity / Risk-weighted assets 9.5% 9.2% 8.1% 7.5% 7.3% Shareholders’ equity $ 19.2 $ 20.5 $ 19.9 $ 18.7 $ 18.3 $ (1.3) $ 0.9 less: Goodwill and certain other intangibles (0.2) (0.5) (0.5) (0.5) (0.5) 0.3 0.3 Unrealized (gains) losses and other adjustments (1.9) (1.9) (1.7) (0.3) (0.2) -(1.7) add: Trust preferred securities 2.5 2.5 2.5 2.5 2.5 -Tier 1 capital $ 19.7 $ 20.7 $ 20.2 $ 20.4 $ 20.1 $ (1.0) $ (0.4) Tier 1 capital $ 19.7 $ 20.7 $ 20.2 $ 20.4 $ 20.1 $ (1.0) $ (0.4) less: Preferred equity (6.9) (6.9) (6.9) (6.9) (6.9) - Trust preferred securities (2.5) (2.5) (2.5) (2.5) (2.5) -Tier 1 common capital (1) $ 10.2 $ 11.2 $ 10.7 $ 10.9 $ 10.7 $ (1.0) $ (0.5) Tier 1 capital $ 19.7 $ 20.7 $ 20.2 $ 20.4 $ 20.1 $ (1.0) $ (0.4) add: Qualifying subordinated debt and redeemable preferred stock 0.3 0.3 0.3 0.2 0.2 -0.1 Allowance for loan and lease losses includible in Tier 2 capital and other adjustments 1.0 1.2 1.2 1.2 1.3 (0.2) (0.3) Total risk-based capital $ 21.0 $ 22.1 $ 21.7 $ 21.9 $ 21.6 $ (1.1) $ (0.6) Total shareholders' equity $ 19.2 $ 20.5 $ 19.9 $ 18.7 $ 18.3 $ (1.3) $ 0.9 less: Preferred equity (6.9) (6.9) (6.9) (6.9) (6.9) - Goodwill and intangible assets (0.2) (0.5) (0.5) (0.5) (0.5) 0.3 0.3 Tangible common equity (2) $ 12.0 $ 13.0 $ 12.5 $ 11.3 $ 10.8 $ (1.0) $ 1.2 Total assets $ 150.6 $ 166.2 $ 182.3 $ 182.5 $ 178.6 $ (15.6) $ (28.0) less: Goodwill and intangible assets (0.2) (0.5) (0.5) (0.5) (0.5) 0.3 0.3 Tangible assets $ 150.4 $ 165.7 $ 181.9 $ 182.0 $ 178.1 $ (15.3) $ (27.7) Note: Numbers may not foot due to rounding (1) We define Tier 1 common as Tier 1 capital less noncommon elements including qualified perpetual preferred stock, qualifying minority interest in subsidiaries, and qualifying trust preferred securities. Ally considers various measures when evaluating capital utilization and adequacy, including the Tier 1 common equity ratio, in addition to capital ratios defined by banking regulators. This calculation is intended to complement the capital ratios defined by banking regulators for both absolute and comparative purposes. Because GAAP does not include capital ratio measures, Ally believes there are no comparable GAAP financial measures to these ratios. Tier 1 common equity is not formally defined by GAAP or codified in the federal banking regulations and, therefore, is considered to be a non-GAAP financial measure. Ally believes the Tier 1 common equity ratio is important because we believe analysts and banking regulators may assess our capital adequacy using this ratio. Additionally, presentation of this measure allows readers to compare certain aspects of our capital adequacy on the same basis to other companies in the industry. (2) We define tangible common equity as common stockholders’ equity less goodwill and identifiable intangible assets (other than mortgage servicing rights), net of deferred tax liabilities. Ally considers various measures when evaluating capital adequacy, including tangible common equity. Tangible common equity is not formally defined by GAAP or codified in the federal banking regulations and, therefore, is considered to be a non-GAAP financial measure. Ally believes that tangible common equity is important because we believe analysts and banking regulators may assess our capital adequacy using this measure. Additionally, presentation of this measure allows readers to compare certain aspects of our capital adequacy on the same basis to other companies in the industry. 2Q 2013 Prelim 2Q 2013 Prelim2Q 2013 Preliminary inaryinary Results ResultsResults
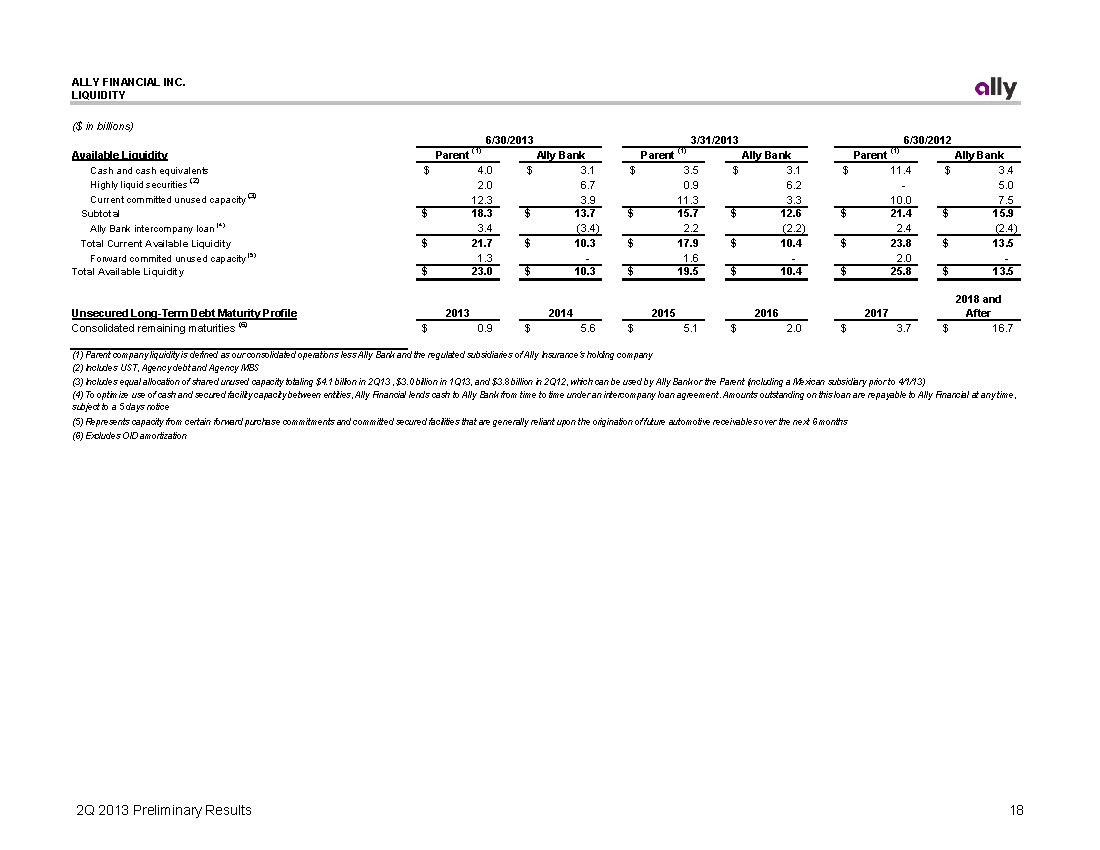
ALLY FINANCIAL INC. LIQUIDITY LIQUIDITY ($ in billions) 6/30/2013 3/31/2013 6/30/2012 Available Liquidity Parent (1) Ally Bank Parent (1) Ally Bank Parent (1) Ally Bank Cash and cash equivalents $ 4.0 $ 3.1 $ 3.5 $ 3.1 $ 11.4 $ 3.4 Highly liquid securities (2) 2.0 6.7 0.9 6.2 -5.0 Current committed unused capacity (3) 12.3 3.9 11.3 3.3 10.0 7.5 Subtotal $ 18.3 $ 13.7 $ 15.7 $ 12.6 $ 21.4 $ 15.9 Ally Bank intercompany loan (4) 3.4 (3.4) 2.2 (2.2) 2.4 (2.4) Total Current Available Liquidity $ 21.7 $ 10.3 $ 17.9 $ 10.4 $ 23.8 $ 13.5 Forward commited unused capacity (5) 1.3 -1.6 -2.0 Total Available Liquidity $ 23.0 $ 10.3 $ 19.5 $ 10.4 $ 25.8 $ 13.5 2018 and Unsecured Long-Term Debt Maturity Profile 2013 2014 2015 2016 2017 After Consolidated remaining maturities (6) $ 0.9 $ 5.6 $ 5.1 $ 2.0 $ 3.7 $ 16.7 (1) Parent company liquidity is defined as our consolidated operations less Ally Bank and the regulated subsidiaries of Ally Insurance's holding company (2) Includes UST, Agency debt and Agency MBS (3) Includes equal allocation of shared unused capacity totaling $4.1 billion in 2Q13 , $3.0 billion in 1Q13, and $3.8 billion in 2Q12, which can be used by Ally Bank or the Parent (including a Mexican subsidiary prior to 4/1/13) (4) To optimize use of cash and secured facility capacity between entities, Ally Financial lends cash to Ally Bank from time to time under an intercompany loan agreement. Amounts outstanding on this loan are repayable to Ally Financial at any time, subject to a 5 days notice (5) Represents capacity from certain forward purchase commitments and committed secured facilities that are generally reliant upon the origination of future automotive receivables over the next 6 months (6) Excludes OID amortization 2Q 2013 Prelim 2Q 2013 Prelim2Q 2013 Preliminary inaryinary Results ResultsResults
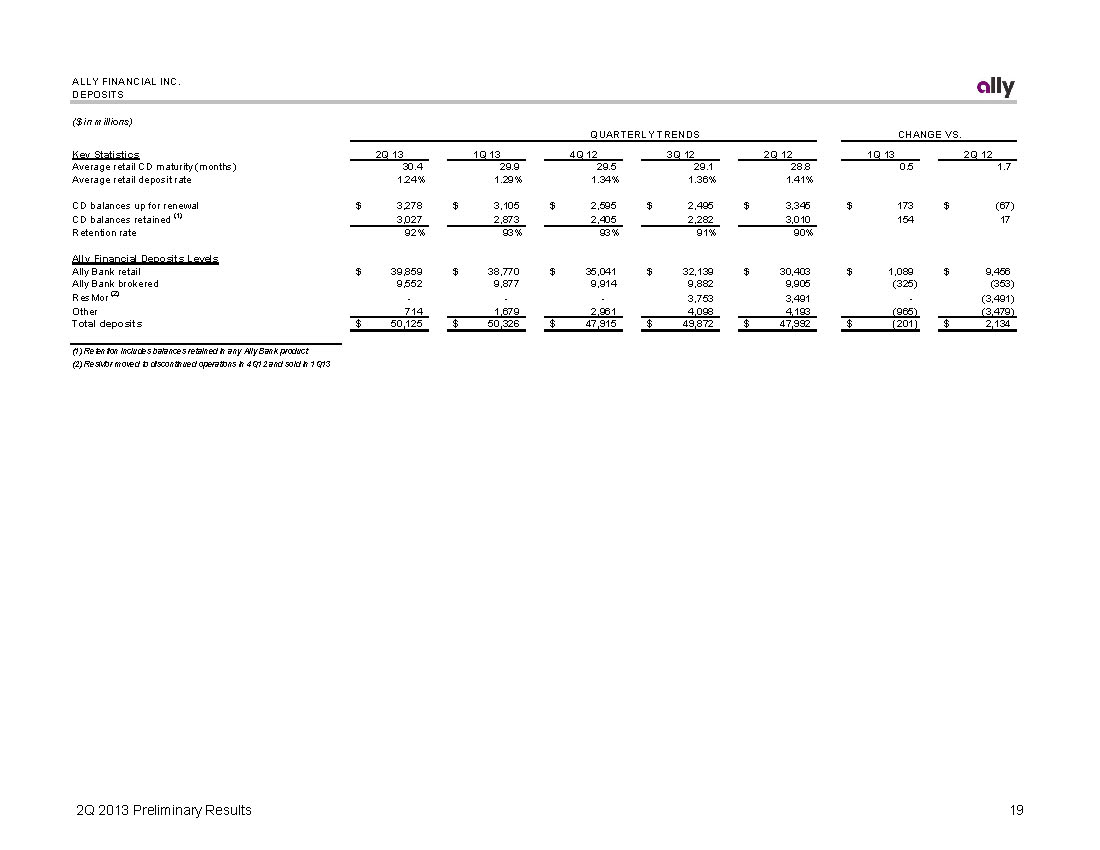
ALLY FINANCIAL INC. DEPOSITS DEPOSITS ($ in millions) QUARTERLY TRENDS CHANGE VS. Key Statistics Average retail CD maturity (months) Average retail deposit rate 2Q 13 30.4 1.24% 1Q 13 29.9 1.29% 4Q 12 29.5 1.34% 3Q 12 29.1 1.36% 2Q 12 28.8 1.41% 1Q 13 0.5 2Q 12 1.7 CD balances up for renewal CD balances retained (1) Retention rate $ 3,278 3,027 92% $ 3,105 2,873 93% $ 2,595 2,495$ 2,405 2,282 93% 91% $ 3,345 3,010 90% $ 173 154 $ (67) 17 Ally Financial Deposits Levels Ally Bank retail Ally Bank brokered ResMor (2) Other Total deposits $ $ 39,859 9,552 - 714 50,125 $ $ 38,770 9,877 - 1,679 50,326 $ $ 35,041 32,139$ 9,914 9,882 -3,753 2,961 4,098 47,915 49,872$ $ $ 30,403 9,905 3,491 4,193 47,992 $ $ 1,089 9,456$ (325) (353) -(3,491) (965) (3,479) (201) 2,134$ (1) Retention includes balances retained in any Ally Bank product (2) ResMor moved to discontinued operations in 4Q12 and sold in 1Q13 2Q 2013 Prelim 2Q 2013 Prelim2Q 2013 Preliminary inaryinary Results ResultsResults
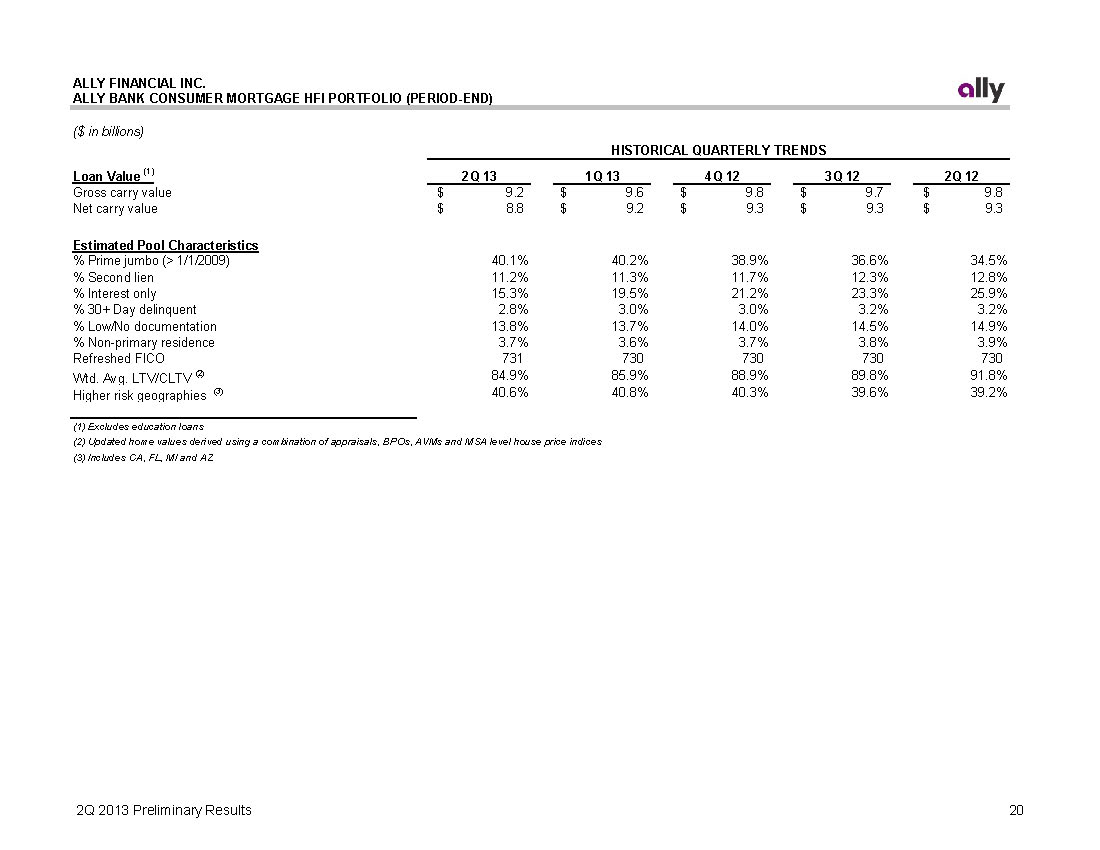
ALLY FINANCIAL INC. ALLY BANK CONSUMER MORTGAGE HFI PORTFOLIO (PERIOD-END) ($ in billions) HISTORICAL QUARTERLY TRENDS Loan Value (1) 2Q 13 1Q 13 4Q 12 3Q 12 2Q 12 Gross carry value 9.2$ 9.6$ 9.8$ 9.7$ 9.8$ Net carry value 8.8$ 9.2$ 9.3$ 9.3$ 9.3$ Estimated Pool Characteristics % Prime jumbo (> 1/1/2009) 40.1% 40.2% 38.9% 36.6% 34.5% % Second lien 11.2% 11.3% 11.7% 12.3% 12.8% % Interest only 15.3% 19.5% 21.2% 23.3% 25.9% % 30+ Day delinquent 2.8% 3.0% 3.0% 3.2% 3.2% % Low/No documentation 13.8% 13.7% 14.0% 14.5% 14.9% % Non-primary residence 3.7% 3.6% 3.7% 3.8% 3.9% Refreshed FICO 731 730 730 730 730 Wtd. Avg. LTV/CLTV (2) 84.9% 85.9% 88.9% 89.8% 91.8% Higher risk geographies (3) 40.6% 40.8% 40.3% 39.6% 39.2% (1) Excludes education loans (2) Updated home values derived using a combination of appraisals, BPOs, AVMs and MSA level house price indices (3) Includes CA, FL, MI and AZ ALLY BANK CONSUMER MORTGAGE HFI PORTFOLIO (PERIOD-END) ($ in billions) HISTORICAL QUARTERLY TRENDS Loan Value (1) 2Q 13 1Q 13 4Q 12 3Q 12 2Q 12 Gross carry value 9.2$ 9.6$ 9.8$ 9.7$ 9.8$ Net carry value 8.8$ 9.2$ 9.3$ 9.3$ 9.3$ Estimated Pool Characteristics % Prime jumbo (> 1/1/2009) 40.1% 40.2% 38.9% 36.6% 34.5% % Second lien 11.2% 11.3% 11.7% 12.3% 12.8% % Interest only 15.3% 19.5% 21.2% 23.3% 25.9% % 30+ Day delinquent 2.8% 3.0% 3.0% 3.2% 3.2% % Low/No documentation 13.8% 13.7% 14.0% 14.5% 14.9% % Non-primary residence 3.7% 3.6% 3.7% 3.8% 3.9% Refreshed FICO 731 730 730 730 730 Wtd. Avg. LTV/CLTV (2) 84.9% 85.9% 88.9% 89.8% 91.8% Higher risk geographies (3) 40.6% 40.8% 40.3% 39.6% 39.2% (1) Excludes education loans (2) Updated home values derived using a combination of appraisals, BPOs, AVMs and MSA level house price indices (3) Includes CA, FL, MI and AZ 2Q 2013 Prelim 2Q 2013 Prelim2Q 2013 Preliminary inaryinary Results ResultsResults
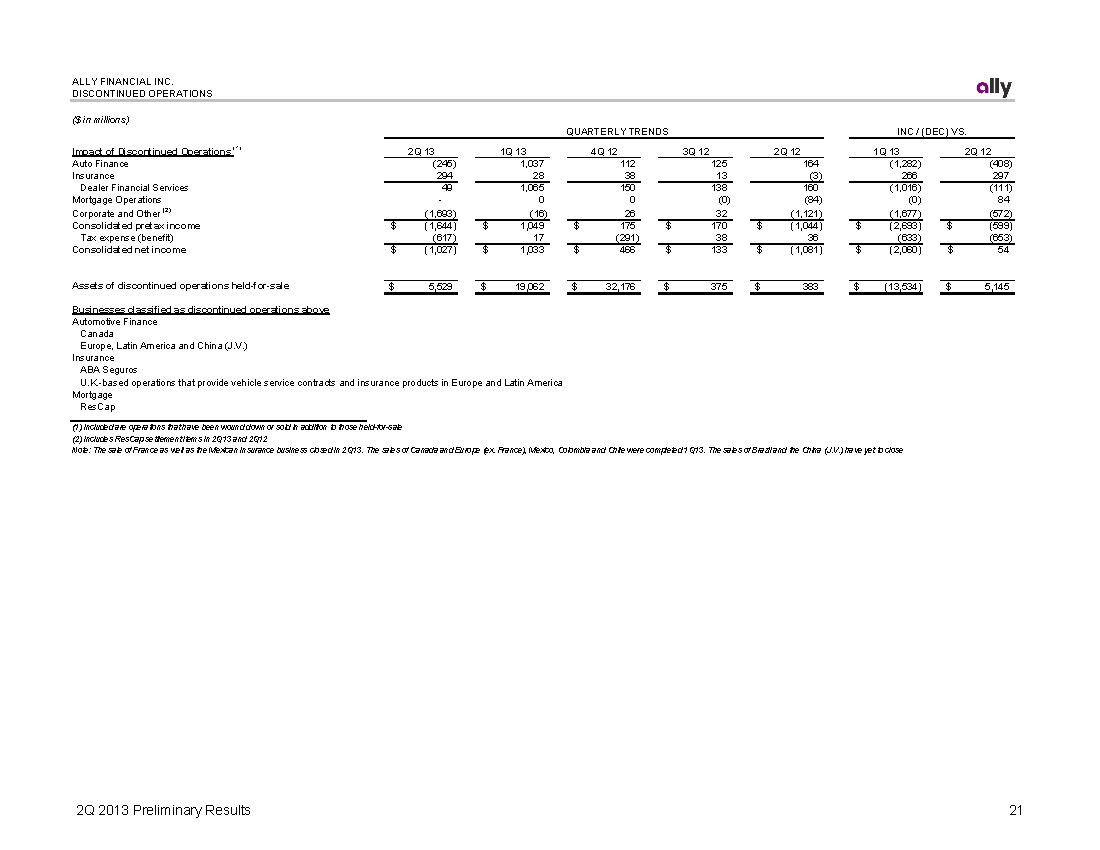
ALLY FINANCIAL INC. DISCONTINUED OPERATIONS ($ in millions) QUARTERLY TRENDS INC / (DEC) VS. Impact of Discontinued Operations (1) 2Q 13 1Q 13 4Q 12 3Q 12 2Q 12 1Q 13 2Q 12 Auto Finance (245) 1,037 112 125 164 (1,282) (408) Insurance 294 28 38 13 (3) 266 297 Dealer Financial Services 49 1,065 150 138 160 (1,016) (111) Mortgage Operations -0 0 (0) (84) (0) 84 Corporate and Other (2) (1,693) (16) 26 32 (1,121) (1,677) (572) Consolidated pretax income $ (1,644) $ 1,049 $ 175 $ 170 $ (1,044) $ (2,693) $ (599) Tax expense (benefit) (617) 17 (291) 38 36 (633) (653) Consolidated net income $ (1,027) $ 1,033 $ 466 $ 133 $ (1,081) $ (2,060) $ 54 Assets of discontinued operations held-for-sale $ 5,529 $ 19,062 $ 32,176 $ 375 $ 383 $ (13,534) $ 5,145 Businesses classified as discontinued operations above Automotive Finance Canada Europe, Latin America and China (J.V.) Insurance ABA Seguros U.K.-based operations that provide vehicle service contracts and insurance products in Europe and Latin America Mortgage ResCap (1) Included are operations that have been wound down or sold in addition to those held-for-sale (2) Includes ResCap settlement items in 2Q13 and 2Q12 Note: The sale of France as well as the Mexican Insurance business closed in 2Q13. The sales of Canada and Europe (ex. France), Mexico, Colombia and Chile were completed 1Q13. The sales of Brazil and the China (J.V.) have yet to close 2Q 2013 Prelim 2Q 2013 Prelim2Q 2013 Preliminary inaryinary Results ResultsResults
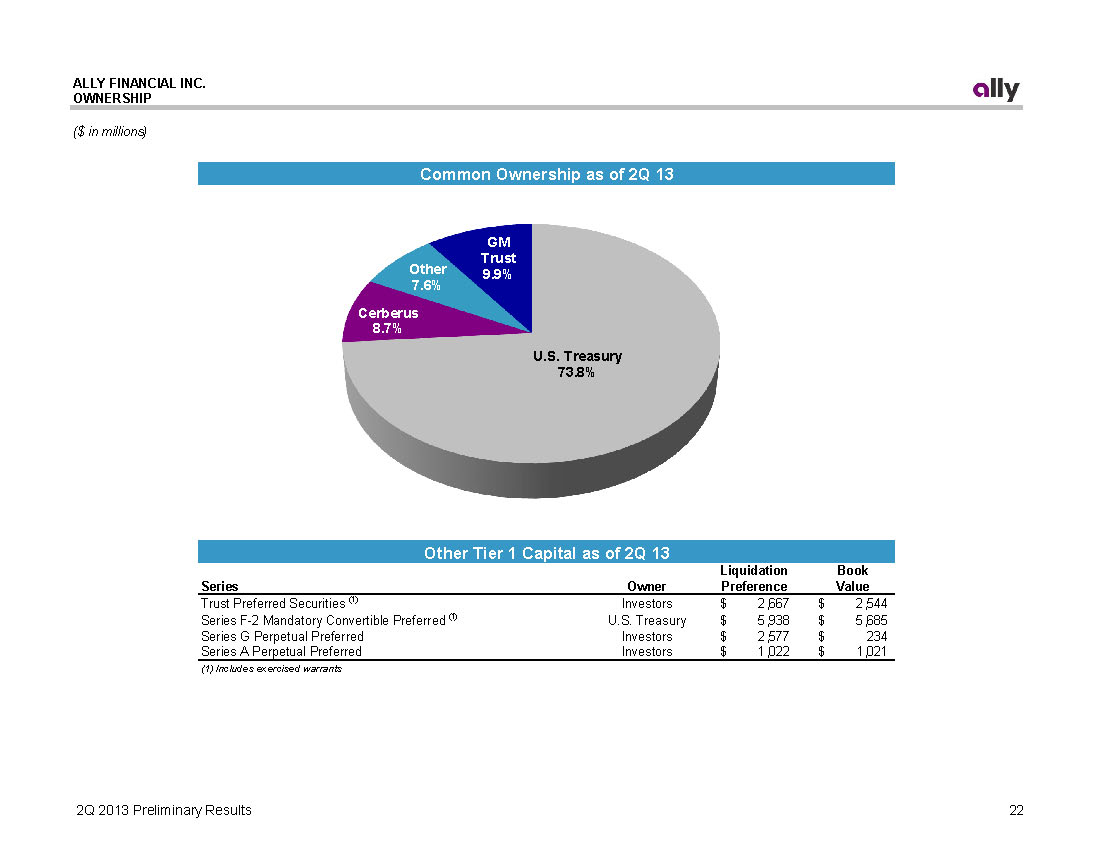
ALLY FINANCIAL INC. OWNERSHIP OWNERSHIP ($ in millions) Common Ownership as of 2Q 13 U.S. Treasury 73.8% Cerberus 8.7% Other 7.6% GM Trust 9.9% Other Tier 1 Capital as of 2Q 13 Liquidation Book Series Owner Preference Value Trust Preferred Securities (1) Investors $ 2,667 $ 2,544 Series F-2 Mandatory Convertible Preferred (1) U.S. Treasury $ 5,938 $ 5,685 Series G Perpetual Preferred Investors $ 2,577 $ 234 Series A Perpetual Preferred Investors $ 1,022 $ 1,021 (1) Includes exercised warrants 2Q 2013 Preliminary Results