
1Q 2023 Preliminary Results Exhibit 99.2 Ally Financial Inc. 1Q 2023 Earnings Review April 19, 2023 Contact Ally Investor Relations at (866) 710-4623 or investor.relations@ally.com 1
1Q 2023 Preliminary Results Forward-Looking Statements and Additional Information This presentation and related communications should be read in conjunction with the financial statements, notes, and other information contained in our Annual Reports on Form 10-K, Quarterly Reports on Form 10-Q, and Current Reports on Form 8-K. This information is preliminary and based on company and third-party data available at the time of the presentation or related communication. This presentation and related communications contain forward-looking statements within the meaning of the Private Securities Litigation Reform Act of 1995. These statements can be identified by the fact that they do not relate strictly to historical or current facts—such as statements about the outlook for financial and operating metrics and performance and future capital allocation and actions. Forward-looking statements often use words such as “believe,” “expect,” “anticipate,” “intend,” “pursue,” “seek,” “continue,” “estimate,” “project,” “outlook,” “forecast,” “potential,” “target,” “objective,” “trend,” “plan,” “goal,” “initiative,” “priorities,” or other words of comparable meaning or future-tense or conditional verbs such as “may,” “will,” “should,” “would,” or “could.” Forward-looking statements convey our expectations, intentions, or forecasts about future events, circumstances, or results. All forward-looking statements, by their nature, are subject to assumptions, risks, and uncertainties, which may change over time and many of which are beyond our control. You should not rely on any forward-looking statement as a prediction or guarantee about the future. Actual future objectives, strategies, plans, prospects, performance, conditions, or results may differ materially from those set forth in any forward-looking statement. Some of the factors that may cause actual results or other future events or circumstances to differ from those in forward-looking statements are described in our Annual Report on Form 10-K for the year ended December 31, 2022, our subsequent Quarterly Reports on Form 10-Q or Current Reports on Form 8-K, or other applicable documents that are filed or furnished with the U.S. Securities and Exchange Commission (collectively, our “SEC filings”). Any forward-looking statement made by us or on our behalf speaks only as of the date that it was made. We do not undertake to update any forward-looking statement to reflect the impact of events, circumstances, or results that arise after the date that the statement was made, except as required by applicable securities laws. You, however, should consult further disclosures (including disclosures of a forward-looking nature) that we may make in any subsequent SEC filings. This presentation and related communications contain specifically identified non-GAAP financial measures, which supplement the results that are reported according to U.S. generally accepted accounting principles (“GAAP”). These non-GAAP financial measures may be useful to investors but should not be viewed in isolation from, or as a substitute for, GAAP results. Differences between non-GAAP financial measures and comparable GAAP financial measures are reconciled in the presentation. Unless the context otherwise requires, the following definitions apply. The term “loans” means the following consumer and commercial products associated with our direct and indirect financing activities: loans, retail installment sales contracts, lines of credit, and other financing products excluding operating leases. The term “operating leases” means consumer- and commercial-vehicle lease agreements where Ally is the lessor and the lessee is generally not obligated to acquire ownership of the vehicle at lease-end or compensate Ally for the vehicle’s residual value. The terms “lend,” “finance,” and “originate” mean our direct extension or origination of loans, our purchase or acquisition of loans, or our purchase of operating leases, as applicable. The term “consumer” means all consumer products associated with our loan and operating-lease activities and all commercial retail installment sales contracts. The term “commercial” means all commercial products associated with our loan activities, other than commercial retail installment sales contracts. The term “partnerships” means business arrangements rather than partnerships as defined by law. 2
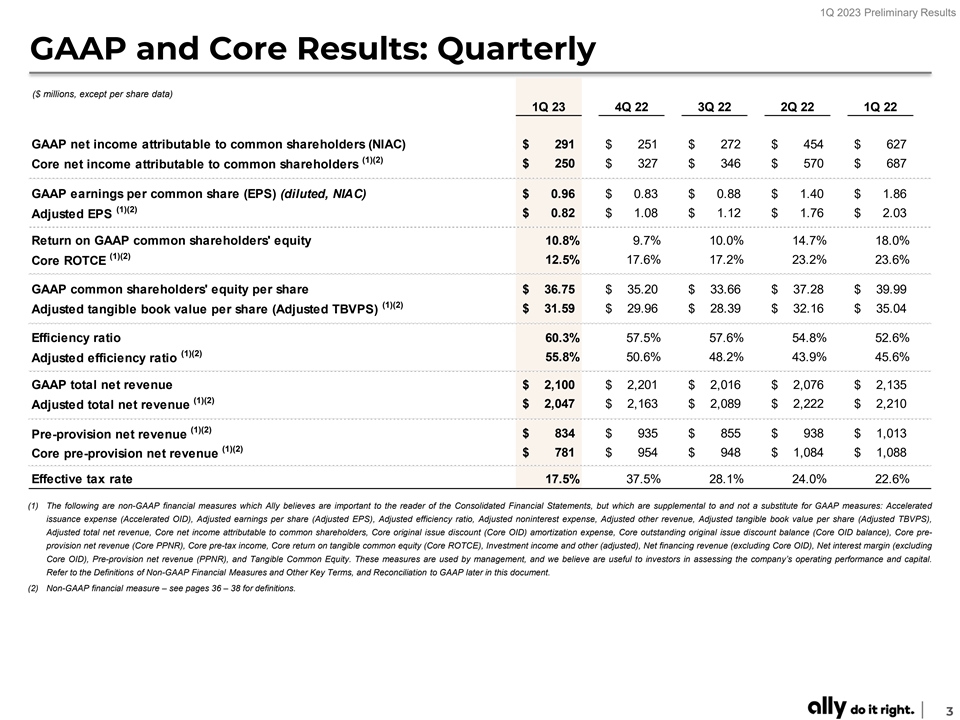
1Q 2023 Preliminary Results GAAP and Core Results: Quarterly ($ millions, except per share data) 1Q 23 4Q 22 3Q 22 2Q 22 1Q 22 GAAP net income attributable to common shareholders (NIAC) $ 291 $ 251 $ 272 $ 454 $ 627 (1)(2) $ 250 $ 327 $ 346 $ 570 $ 687 Core net income attributable to common shareholders GAAP earnings per common share (EPS) (diluted, NIAC) $ 0.96 $ 0.83 $ 0.88 $ 1.40 $ 1.86 (1)(2) $ 0.82 $ 1.08 $ 1.12 $ 1.76 $ 2.03 Adjusted EPS Return on GAAP common shareholders' equity 10.8% 9.7% 10.0% 14.7% 18.0% (1)(2) 12.5% 17.6% 17.2% 23.2% 23.6% Core ROTCE GAAP common shareholders' equity per share $ 36.75 $ 3 5.20 $ 3 3.66 $ 37.28 $ 3 9.99 (1)(2) Adjusted tangible book value per share (Adjusted TBVPS) $ 3 1.59 $ 29.96 $ 28.39 $ 3 2.16 $ 3 5.04 Efficiency ratio 60.3% 57.5% 57.6% 54.8% 52.6% (1)(2) 55.8% 50.6% 48.2% 43.9% 45.6% Adjusted efficiency ratio GAAP total net revenue $ 2,100 $ 2,201 $ 2 ,016 $ 2,076 $ 2,135 (1)(2) $ 2 ,047 $ 2,163 $ 2 ,089 $ 2 ,222 $ 2 ,210 Adjusted total net revenue (1)(2) $ 834 $ 935 $ 855 $ 938 $ 1,013 Pre-provision net revenue (1)(2) Core pre-provision net revenue $ 781 $ 954 $ 948 $ 1 ,084 $ 1 ,088 Effective tax rate 17.5% 37.5% 28.1% 24.0% 22.6% (1) The following are non-GAAP financial measures which Ally believes are important to the reader of the Consolidated Financial Statements, but which are supplemental to and not a substitute for GAAP measures: Accelerated issuance expense (Accelerated OID), Adjusted earnings per share (Adjusted EPS), Adjusted efficiency ratio, Adjusted noninterest expense, Adjusted other revenue, Adjusted tangible book value per share (Adjusted TBVPS), Adjusted total net revenue, Core net income attributable to common shareholders, Core original issue discount (Core OID) amortization expense, Core outstanding original issue discount balance (Core OID balance), Core pre- provision net revenue (Core PPNR), Core pre-tax income, Core return on tangible common equity (Core ROTCE), Investment income and other (adjusted), Net financing revenue (excluding Core OID), Net interest margin (excluding Core OID), Pre-provision net revenue (PPNR), and Tangible Common Equity. These measures are used by management, and we believe are useful to investors in assessing the company’s operating performance and capital. Refer to the Definitions of Non-GAAP Financial Measures and Other Key Terms, and Reconciliation to GAAP later in this document. (2) Non-GAAP financial measure – see pages 36 – 38 for definitions. 3
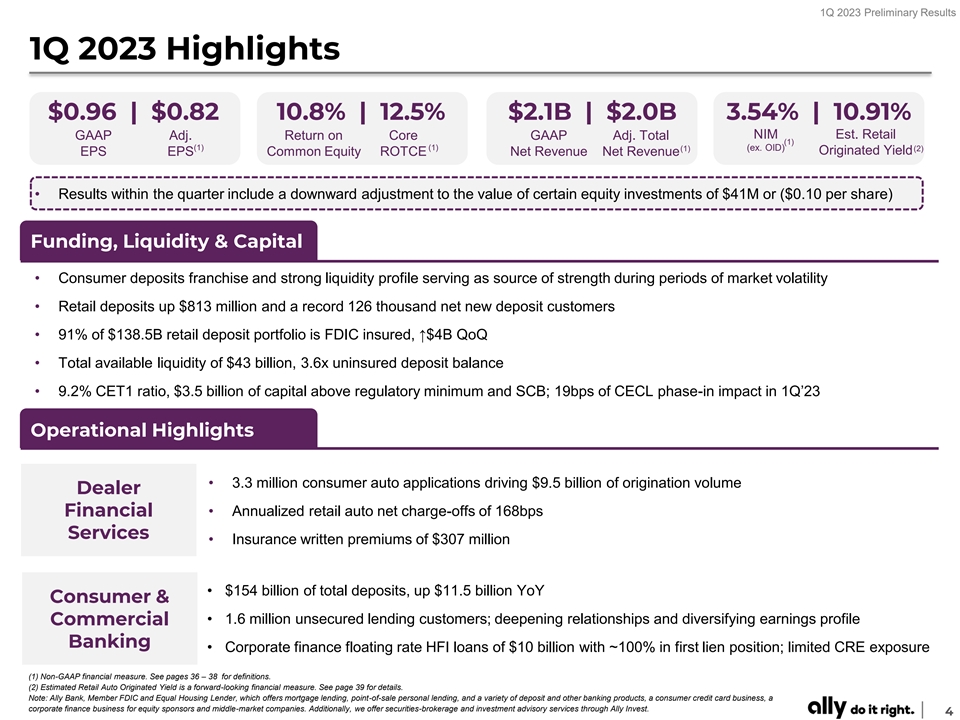
1Q 2023 Preliminary Results 1Q 2023 Highlights $0.96 | $0.82 10.8% | 12.5% $2.1B | $2.0B 3.54% | 10.91% NIM Est. Retail GAAP Adj. Return on Core GAAP Adj. Total (1) (1) (1) (ex. OID) (1) (2) Originated Yield EPS EPS Common Equity ROTCE Net Revenue Net Revenue • Results within the quarter include a downward adjustment to the value of certain equity investments of $41M or ($0.10 per share) Funding, Liquidity & Capital • Consumer deposits franchise and strong liquidity profile serving as source of strength during periods of market volatility • Retail deposits up $813 million and a record 126 thousand net new deposit customers • 91% of $138.5B retail deposit portfolio is FDIC insured, ↑$4B QoQ • Total available liquidity of $43 billion, 3.6x uninsured deposit balance • 9.2% CET1 ratio, $3.5 billion of capital above regulatory minimum and SCB; 19bps of CECL phase-in impact in 1Q’23 Operational Highlights • 3.3 million consumer auto applications driving $9.5 billion of origination volume Dealer • Annualized retail auto net charge-offs of 168bps Financial Services • Insurance written premiums of $307 million • $154 billion of total deposits, up $11.5 billion YoY Consumer & • 1.6 million unsecured lending customers; deepening relationships and diversifying earnings profile Commercial Banking • Corporate finance floating rate HFI loans of $10 billion with ~100% in first lien position; limited CRE exposure (1) Non-GAAP financial measure. See pages 36 – 38 for definitions. (2) Estimated Retail Auto Originated Yield is a forward-looking financial measure. See page 39 for details. Note: Ally Bank, Member FDIC and Equal Housing Lender, which offers mortgage lending, point-of-sale personal lending, and a variety of deposit and other banking products, a consumer credit card business, a corporate finance business for equity sponsors and middle-market companies. Additionally, we offer securities-brokerage and investment advisory services through Ally Invest. 4

1Q 2023 Preliminary Results Purpose-Driven Culture Powered by our “LEAD” core values and “Do it Right” approach Look Employees L externally Invest in our people and culture to drive purpose Execute with E excellence Customers Treat customers Delivering equally with honesty long-term and integrity Act with value for all A professionalism stakeholders Communities Make an impact in the Deliver communities in which D we live and work results 5
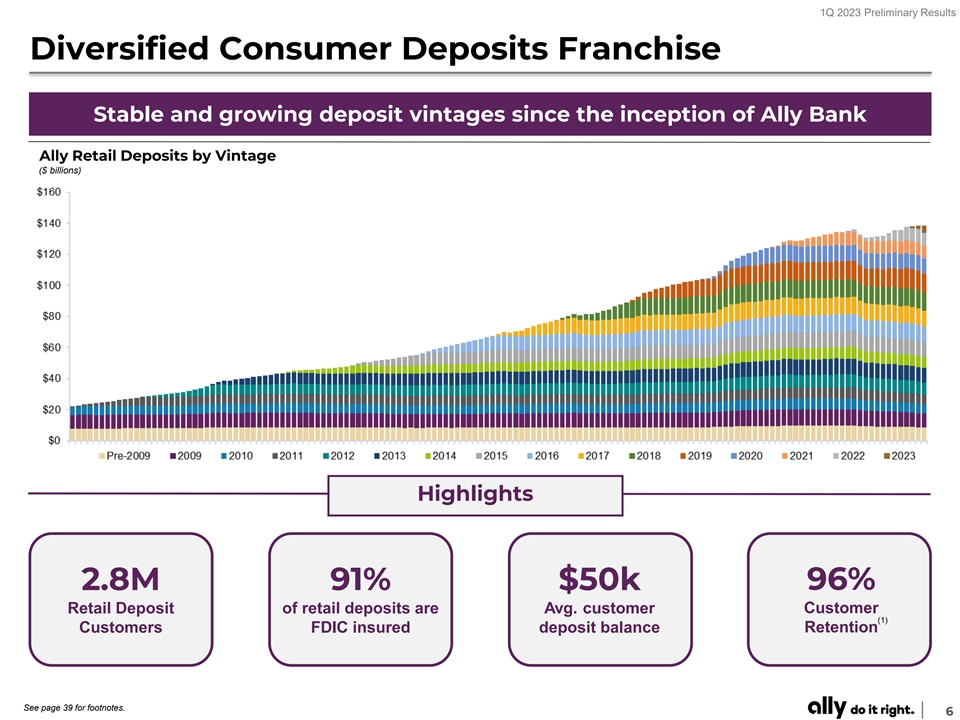
1Q 2023 Preliminary Results Diversified Consumer Deposits Franchise Stable and growing deposit vintages since the inception of Ally Bank Ally Retail Deposits by Vintage ($ billions) Highlights 2.8M 91% $50k 96% Retail Deposit of retail deposits are Avg. customer Customer (1) Retention Customers FDIC insured deposit balance See page 39 for footnotes. 6
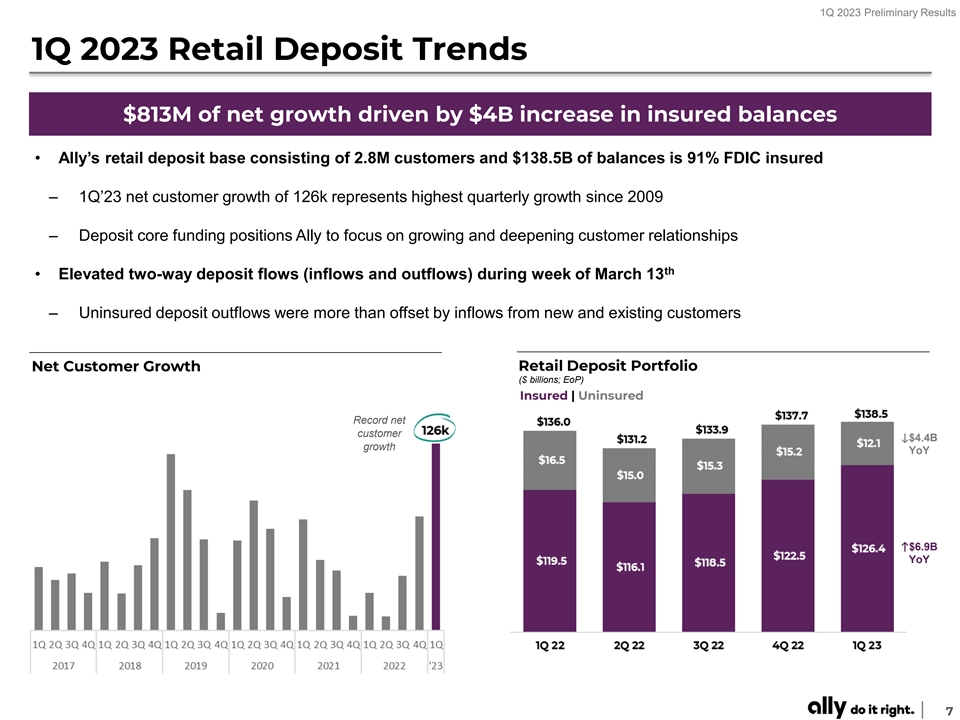
1Q 2023 Preliminary Results 1Q 2023 Retail Deposit Trends $813M of net growth driven by $4B increase in insured balances • Ally’s retail deposit base consisting of 2.8M customers and $138.5B of balances is 91% FDIC insured – 1Q’23 net customer growth of 126k represents highest quarterly growth since 2009 – Deposit core funding positions Ally to focus on growing and deepening customer relationships th • Elevated two-way deposit flows (inflows and outflows) during week of March 13 – Uninsured deposit outflows were more than offset by inflows from new and existing customers Retail Deposit Portfolio Net Customer Growth ($ billions; EoP) Insured | Uninsured Record net customer ↓$4.4B growth YoY ↑$6.9B YoY 7
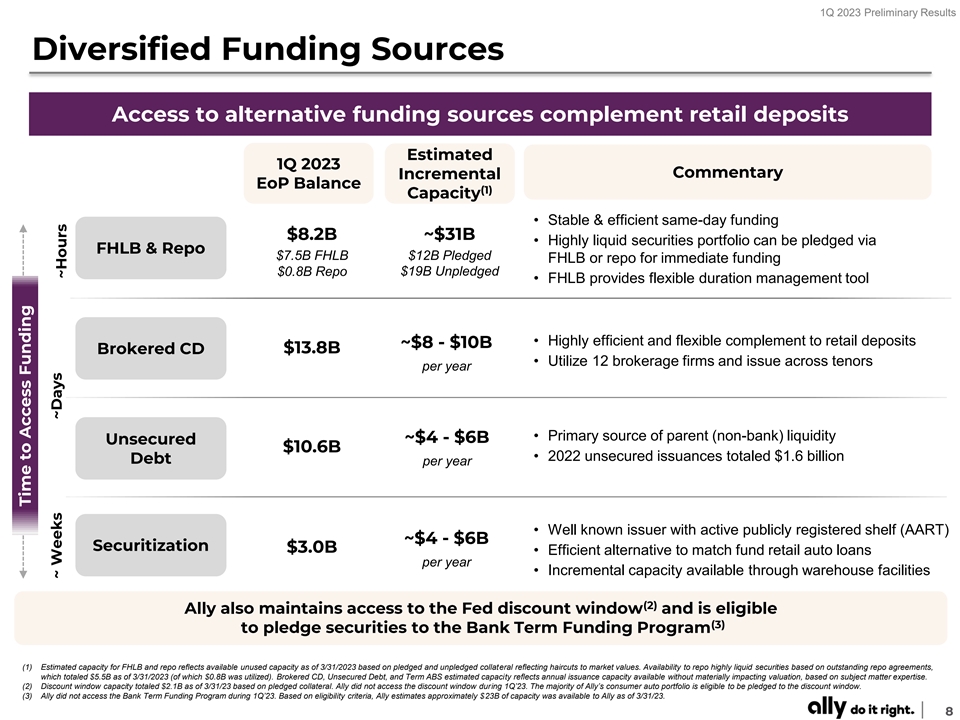
1Q 2023 Preliminary Results Diversified Funding Sources Access to alternative funding sources complement retail deposits Estimated 1Q 2023 Commentary Incremental EoP Balance (1) Capacity • Stable & efficient same-day funding $8.2B ~$31B • Highly liquid securities portfolio can be pledged via FHLB & Repo $7.5B FHLB $12B Pledged FHLB or repo for immediate funding $0.8B Repo $19B Unpledged • FHLB provides flexible duration management tool • Highly efficient and flexible complement to retail deposits ~$8 - $10B $13.8B Brokered CD • Utilize 12 brokerage firms and issue across tenors per year • Primary source of parent (non-bank) liquidity ~$4 - $6B Unsecured $10.6B • 2022 unsecured issuances totaled $1.6 billion Debt per year • Well known issuer with active publicly registered shelf (AART) ~$4 - $6B Securitization $3.0B • Efficient alternative to match fund retail auto loans per year • Incremental capacity available through warehouse facilities (2) Ally also maintains access to the Fed discount window and is eligible (3) to pledge securities to the Bank Term Funding Program (1) Estimated capacity for FHLB and repo reflects available unused capacity as of 3/31/2023 based on pledged and unpledged collateral reflecting haircuts to market values. Availability to repo highly liquid securities based on outstanding repo agreements, which totaled $5.5B as of 3/31/2023 (of which $0.8B was utilized). Brokered CD, Unsecured Debt, and Term ABS estimated capacity reflects annual issuance capacity available without materially impacting valuation, based on subject matter expertise. (2) Discount window capacity totaled $2.1B as of 3/31/23 based on pledged collateral. Ally did not access the discount window during 1Q’23. The majority of Ally’s consumer auto portfolio is eligible to be pledged to the discount window. (3) Ally did not access the Bank Term Funding Program during 1Q’23. Based on eligibility criteria, Ally estimates approximately $23B of capacity was available to Ally as of 3/31/23. 8 Time to Access Funding ~ Weeks ~Days ~Hours
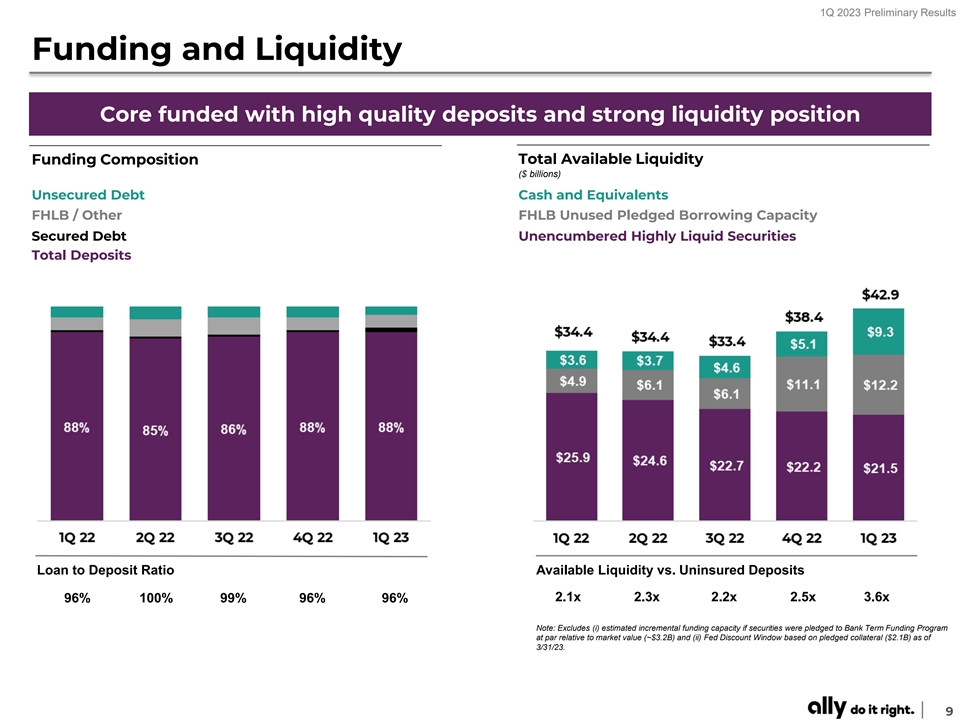
1Q 2023 Preliminary Results Funding and Liquidity Core funded with high quality deposits and strong liquidity position Total Available Liquidity Funding Composition ($ billions) Unsecured Debt Cash and Equivalents FHLB / Other FHLB Unused Pledged Borrowing Capacity Secured Debt Unencumbered Highly Liquid Securities Total Deposits Loan to Deposit Ratio Available Liquidity vs. Uninsured Deposits 2.1x 2.3x 2.2x 2.5x 3.6x 96% 100% 99% 96% 96% Note: Excludes (i) estimated incremental funding capacity if securities were pledged to Bank Term Funding Program at par relative to market value (~$3.2B) and (ii) Fed Discount Window based on pledged collateral ($2.1B) as of 3/31/23. 9
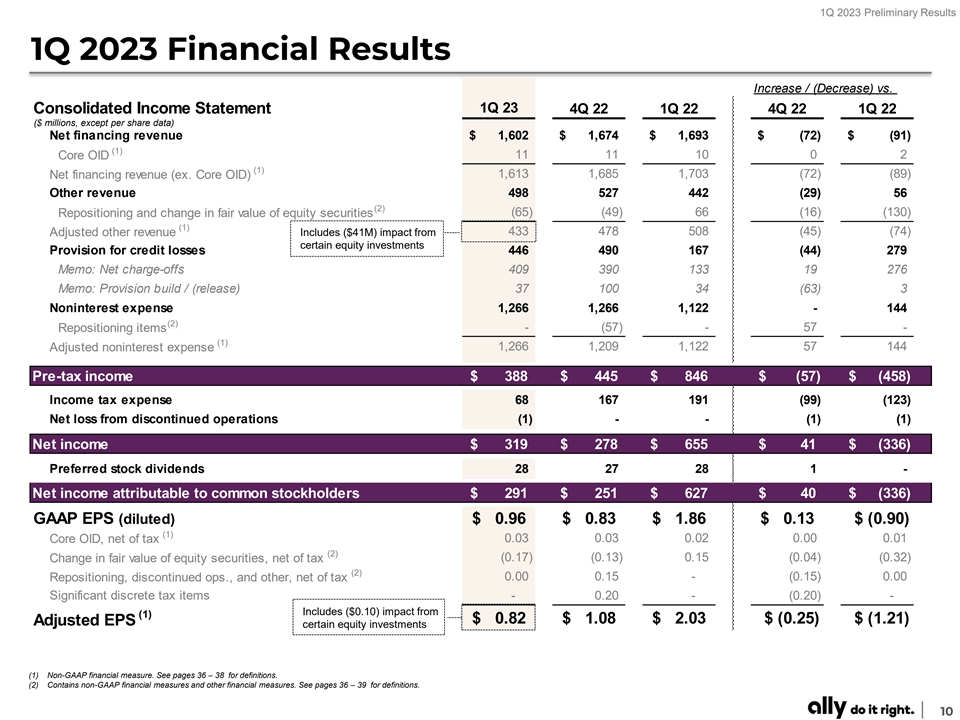
1Q 2023 Preliminary Results 1Q 2023 Financial Results Increase / (Decrease) vs. Consolidated Income Statement 1Q 23 4Q 22 1Q 22 4Q 22 1Q 22 ($ millions, except per share data) Net financing revenue $ 1,602 $ 1,674 $ 1,693 $ (72) $ (91) (1) 11 11 10 0 2 Core OID (1) Net financing revenue (ex. Core OID) 1,613 1,685 1,703 (72) ( 89) Other revenue 498 527 442 ( 29) 56 (2) ( 65) ( 49) 66 (16) (130) Repositioning and change in fair value of equity securities (1) Adjusted other revenue Includes ($41M) impact from 433 478 508 (45) ( 74) certain equity investments Provision for credit losses 446 490 167 ( 44) 279 Memo: Net charge-offs 409 390 133 19 276 Memo: Provision build / (release) 37 100 34 (63) 3 Noninterest expense 1,266 1,266 1,122 - 144 (2) Repositioning items - (57) - 57 - (1) 1,266 1,209 1,122 57 144 Adjusted noninterest expense Pre-tax income $ 388 $ 445 $ 846 $ (57) $ (458) Income tax expense 68 167 191 ( 99) (123) Net loss from discontinued operations (1) - - (1) (1) Net income $ 319 $ 278 $ 655 $ 41 $ (336) Preferred stock dividends 28 27 28 1 - Net income attributable to common stockholders $ 291 $ 251 $ 627 $ 40 $ (336) GAAP EPS (diluted) $ 0.96 $ 0.83 $ 1.86 $ 0 .13 $ ( 0.90) (1) Core OID, net of tax 0 .03 0.03 0 .02 0.00 0 .01 (2) ( 0.17) (0.13) 0.15 ( 0.04) (0.32) Change in fair value of equity securities, net of tax (2) Repositioning, discontinued ops., and other, net of tax 0 .00 0 .15 - (0.15) 0 .00 Significant discrete tax items - 0 .20 - ( 0.20) - Includes ($0.10) impact from (1) $ 0.82 $ 1.08 $ 2 .03 $ ( 0.25) $ ( 1.21) Adjusted EPS certain equity investments (1) Non-GAAP financial measure. See pages 36 – 38 for definitions. (2) Contains non-GAAP financial measures and other financial measures. See pages 36 – 39 for definitions. 10
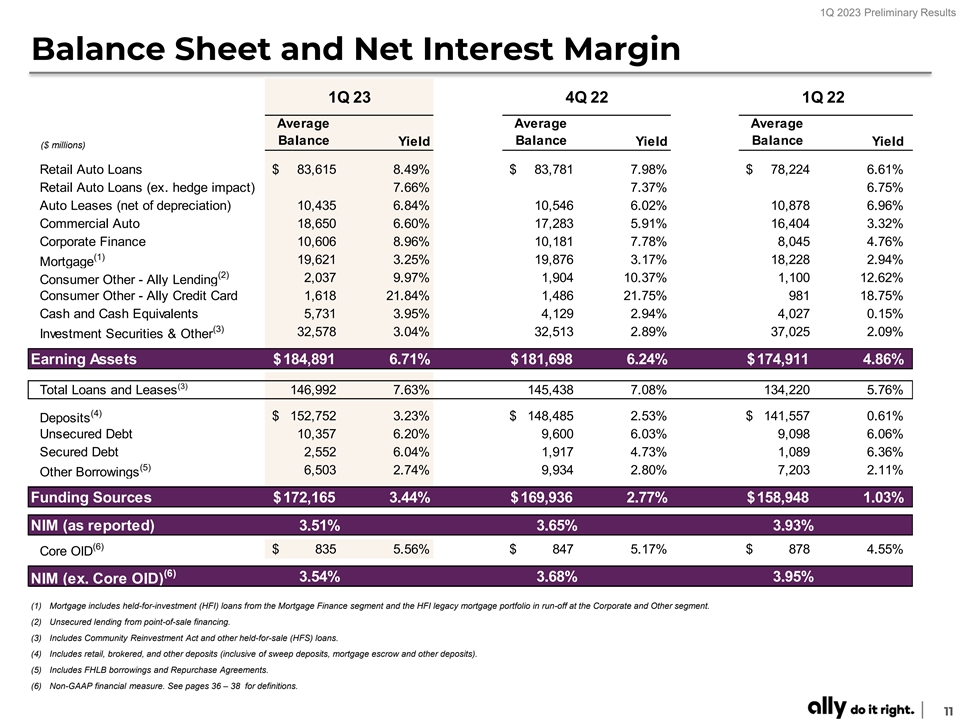
1Q 2023 Preliminary Results Balance Sheet and Net Interest Margin 1Q 23 4Q 22 1Q 22 Average Average Average Balance Balance Balance Yield Yield Yield ($ millions) Retail Auto Loans $ 83,615 8.49% $ 83,781 7.98% $ 78,224 6.61% Retail Auto Loans (ex. hedge impact) 7.66% 7.37% 6.75% Auto Leases (net of depreciation) 10,435 6.84% 10,546 6.02% 10,878 6.96% Commercial Auto 18,650 6.60% 17,283 5.91% 16,404 3.32% Corporate Finance 10,606 8.96% 10,181 7.78% 8,045 4.76% (1) 19,621 3.25% 19,876 3.17% 18,228 2.94% Mortgage (2) 2,037 9.97% 1 ,904 10.37% 1,100 12.62% Consumer Other - Ally Lending Consumer Other - Ally Credit Card 1 ,618 21.84% 1,486 21.75% 981 18.75% Cash and Cash Equivalents 5,731 3.95% 4 ,129 2.94% 4,027 0.15% (3) 32,578 3.04% 32,513 2.89% 37,025 2.09% Investment Securities & Other Earning Assets $ 184,891 6.71% $ 181,698 6.24% $ 174,911 4.86% (3) Total Loans and Leases 146,992 7.63% 145,438 7.08% 134,220 5.76% (4) $ 152,752 3.23% $ 148,485 2.53% $ 141,557 0.61% Deposits Unsecured Debt 10,357 6.20% 9,600 6.03% 9 ,098 6.06% Secured Debt 2,552 6.04% 1 ,917 4.73% 1,089 6.36% (5) 6 ,503 2.74% 9 ,934 2.80% 7,203 2.11% Other Borrowings Funding Sources $ 172,165 3.44% $ 169,936 2.77% $ 158,948 1.03% NIM (as reported) 3.51% 3.65% 3.93% (6) $ 835 5.56% $ 847 5.17% $ 878 4.55% Core OID (6) 3.54% 3.68% 3.95% NIM (ex. Core OID) (1) Mortgage includes held-for-investment (HFI) loans from the Mortgage Finance segment and the HFI legacy mortgage portfolio in run-off at the Corporate and Other segment. (2) Unsecured lending from point-of-sale financing. (3) Includes Community Reinvestment Act and other held-for-sale (HFS) loans. (4) Includes retail, brokered, and other deposits (inclusive of sweep deposits, mortgage escrow and other deposits). (5) Includes FHLB borrowings and Repurchase Agreements. (6) Non-GAAP financial measure. See pages 36 – 38 for definitions. 11
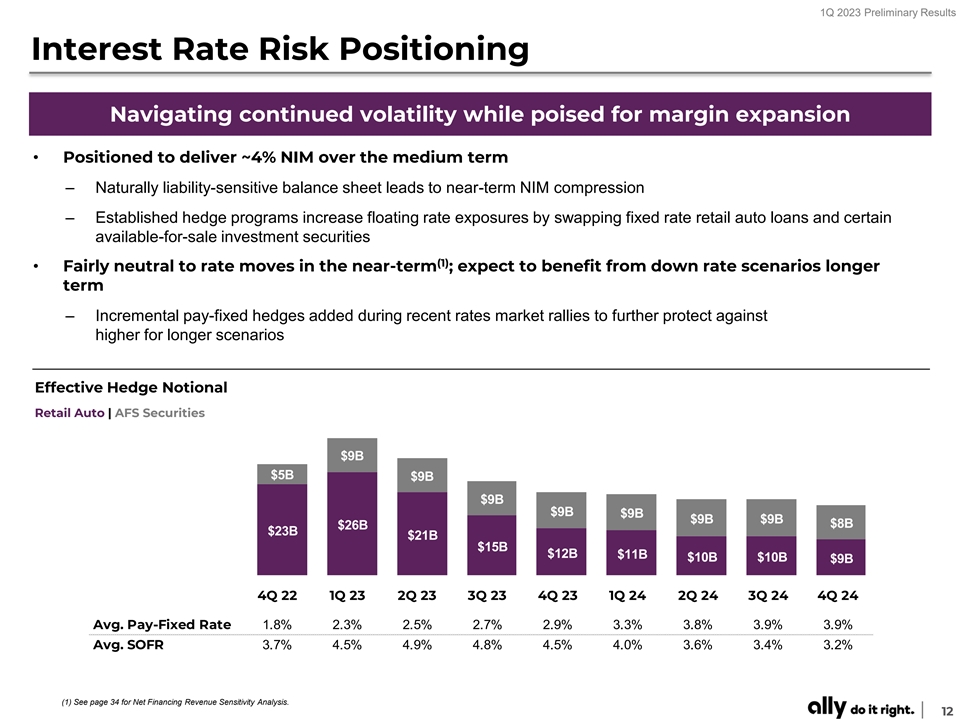
1Q 2023 Preliminary Results Interest Rate Risk Positioning Navigating continued volatility while poised for margin expansion • Positioned to deliver ~4% NIM over the medium term – Naturally liability-sensitive balance sheet leads to near-term NIM compression – Established hedge programs increase floating rate exposures by swapping fixed rate retail auto loans and certain available-for-sale investment securities (1) • Fairly neutral to rate moves in the near-term ; expect to benefit from down rate scenarios longer term – Incremental pay-fixed hedges added during recent rates market rallies to further protect against higher for longer scenarios Effective Hedge Notional Retail Auto | AFS Securities $9B $5B $9B $9B $9B $9B $9B $9B $8B $26B $23B $21B $15B $12B $11B $10B $10B $9B 4Q 22 1Q 23 2Q 23 3Q 23 4Q 23 1Q 24 2Q 24 3Q 24 4Q 24 Avg. Pay-Fixed Rate 1.8% 2.3% 2.5% 2.7% 2.9% 3.3% 3.8% 3.9% 3.9% Avg. SOFR 3.7% 4.5% 4.9% 4.8% 4.5% 4.0% 3.6% 3.4% 3.2% (1) See page 34 for Net Financing Revenue Sensitivity Analysis. 12
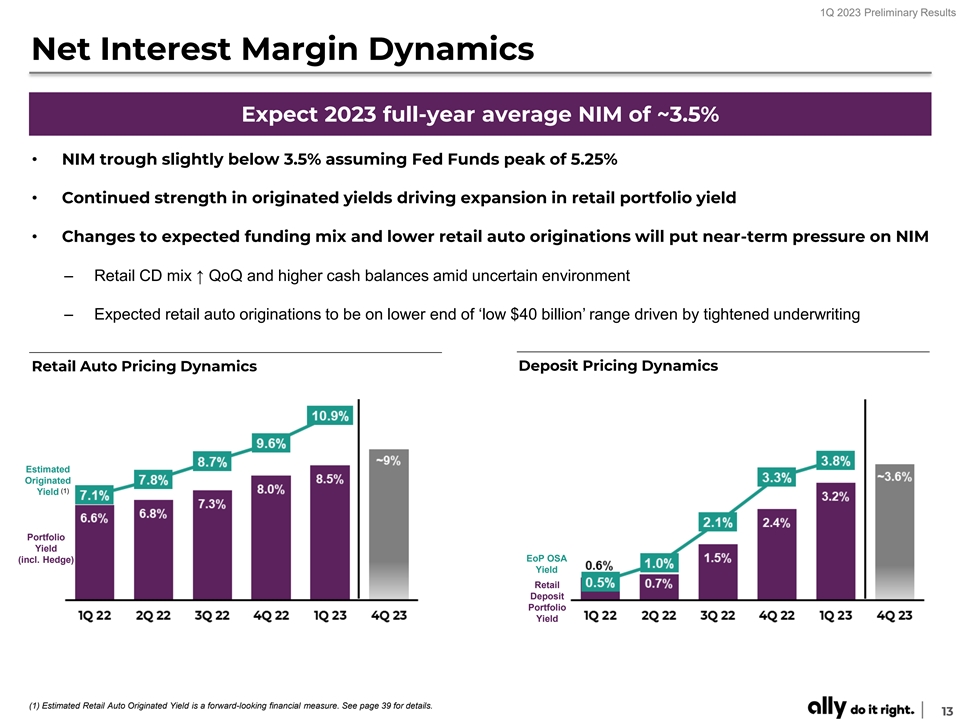
1Q 2023 Preliminary Results Net Interest Margin Dynamics Expect 2023 full-year average NIM of ~3.5% • NIM trough slightly below 3.5% assuming Fed Funds peak of 5.25% • Continued strength in originated yields driving expansion in retail portfolio yield • Changes to expected funding mix and lower retail auto originations will put near-term pressure on NIM – Retail CD mix ↑ QoQ and higher cash balances amid uncertain environment – Expected retail auto originations to be on lower end of ‘low $40 billion’ range driven by tightened underwriting Deposit Pricing Dynamics Retail Auto Pricing Dynamics Estimated Originated (1) Yield Portfolio Yield EoP OSA (incl. Hedge) Yield Retail Deposit Portfolio Yield (1) Estimated Retail Auto Originated Yield is a forward-looking financial measure. See page 39 for details. 13
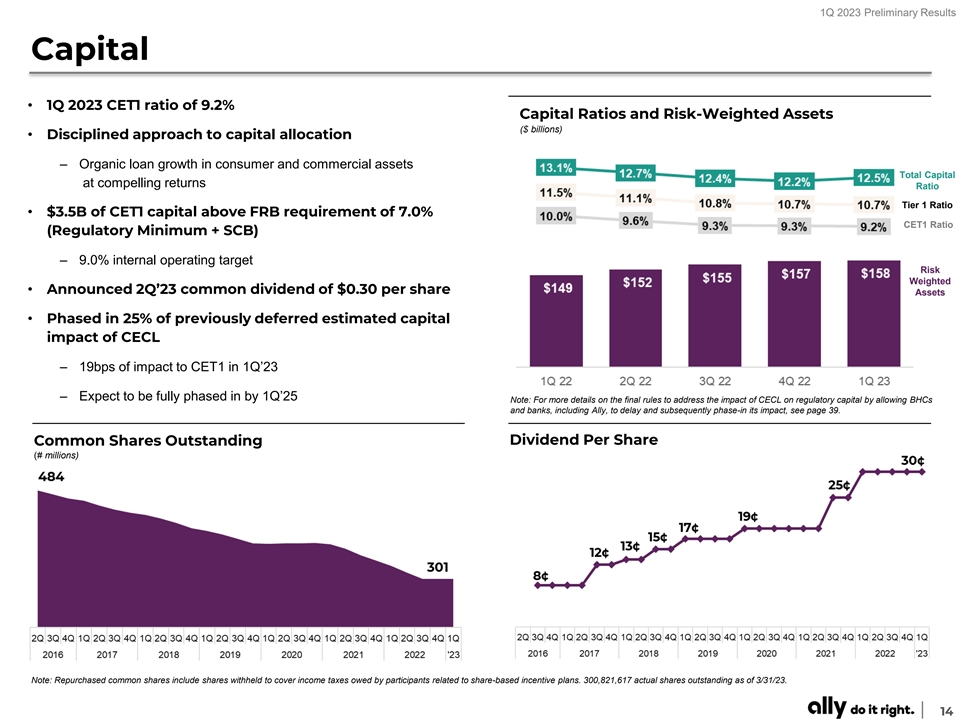
1Q 2023 Preliminary Results Capital • 1Q 2023 CET1 ratio of 9.2% Capital Ratios and Risk-Weighted Assets ($ billions) • Disciplined approach to capital allocation – Organic loan growth in consumer and commercial assets Total Capital at compelling returns Ratio Tier 1 Ratio • $3.5B of CET1 capital above FRB requirement of 7.0% CET1 Ratio (Regulatory Minimum + SCB) – 9.0% internal operating target Risk Weighted • Announced 2Q’23 common dividend of $0.30 per share Assets • Phased in 25% of previously deferred estimated capital impact of CECL – 19bps of impact to CET1 in 1Q’23 – Expect to be fully phased in by 1Q’25 Note: For more details on the final rules to address the impact of CECL on regulatory capital by allowing BHCs and banks, including Ally, to delay and subsequently phase-in its impact, see page 39. Common Shares Outstanding Dividend Per Share (# millions) Note: Repurchased common shares include shares withheld to cover income taxes owed by participants related to share-based incentive plans. 300,821,617 actual shares outstanding as of 3/31/23. 14
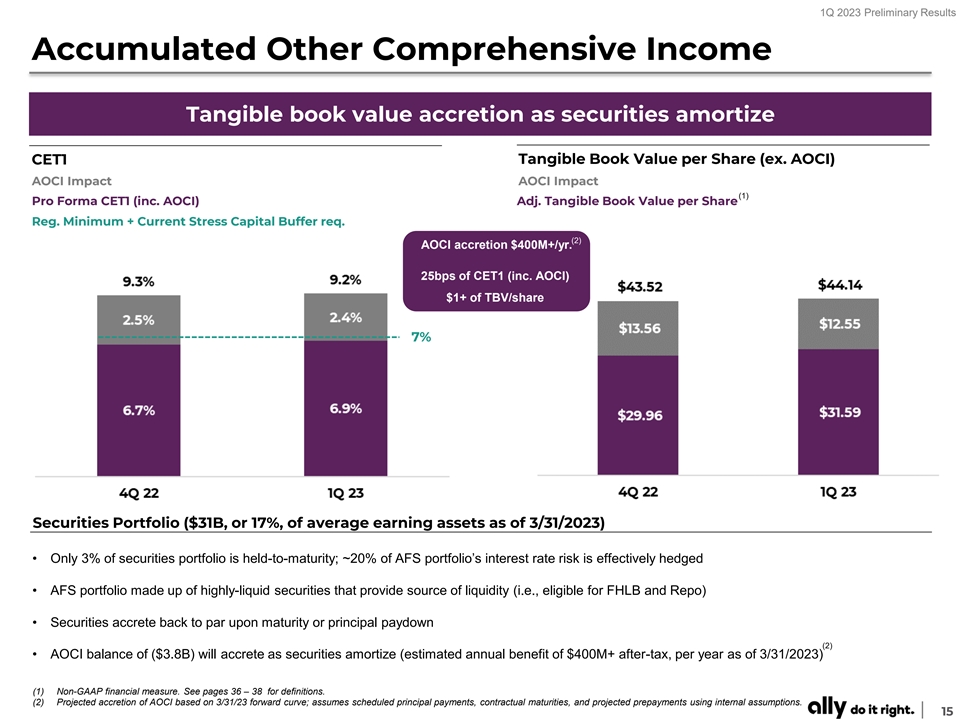
1Q 2023 Preliminary Results Accumulated Other Comprehensive Income Tangible book value accretion as securities amortize Tangible Book Value per Share (ex. AOCI) CET1 AOCI Impact AOCI Impact (1) Pro Forma CET1 (inc. AOCI) Adj. Tangible Book Value per Share Reg. Minimum + Current Stress Capital Buffer req. (2) AOCI accretion $400M+/yr. 25bps of CET1 (inc. AOCI) $1+ of TBV/share 7% $14 $30 Securities Portfolio ($31B, or 17%, of average earning assets as of 3/31/2023) • Only 3% of securities portfolio is held-to-maturity; ~20% of AFS portfolio’s interest rate risk is effectively hedged • AFS portfolio made up of highly-liquid securities that provide source of liquidity (i.e., eligible for FHLB and Repo) • Securities accrete back to par upon maturity or principal paydown (2) • AOCI balance of ($3.8B) will accrete as securities amortize (estimated annual benefit of $400M+ after-tax, per year as of 3/31/2023) (1) Non-GAAP financial measure. See pages 36 – 38 for definitions. (2) Projected accretion of AOCI based on 3/31/23 forward curve; assumes scheduled principal payments, contractual maturities, and projected prepayments using internal assumptions. 15
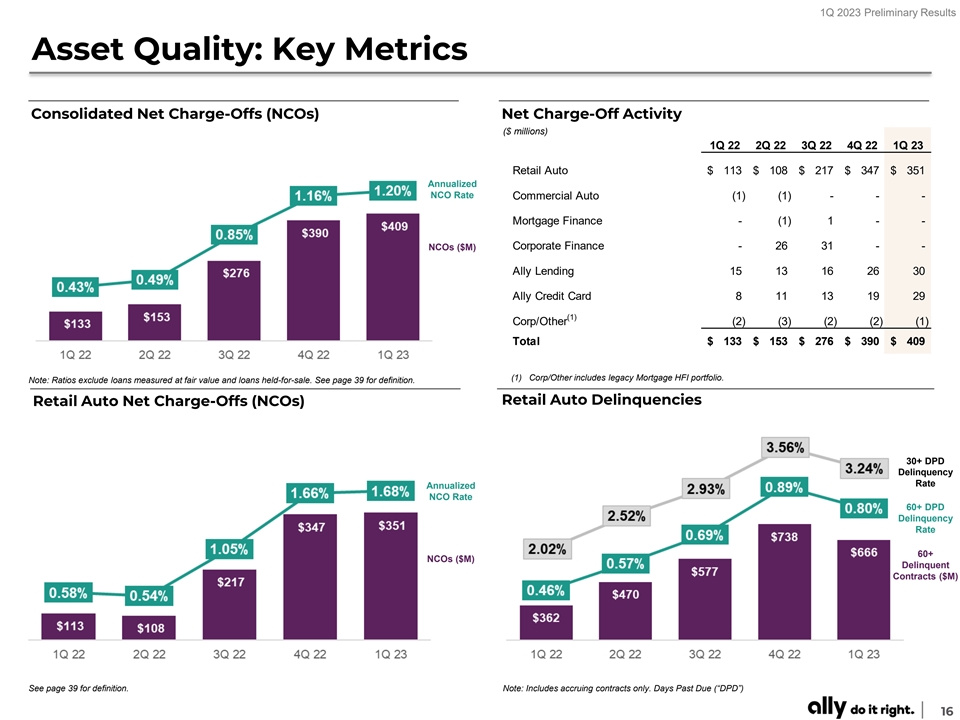
1Q 2023 Preliminary Results Asset Quality: Key Metrics Consolidated Net Charge-Offs (NCOs) Net Charge-Off Activity ($ millions) 1Q 22 2Q 22 3Q 22 4Q 22 1Q 23 Retail Auto $ 113 $ 108 $ 217 $ 347 $ 351 Annualized NCO Rate Commercial Auto (1) (1) - - - Mortgage Finance - ( 1) 1 - - Corporate Finance - 26 31 - - NCOs ($M) Ally Lending 15 13 16 26 30 Ally Credit Card 8 11 13 19 29 (1) Corp/Other (2) (3) (2) (2) (1) Total $ 133 $ 153 $ 276 $ 390 $ 409 (1) Corp/Other includes legacy Mortgage HFI portfolio. Note: Ratios exclude loans measured at fair value and loans held-for-sale. See page 39 for definition. Retail Auto Delinquencies Retail Auto Net Charge-Offs (NCOs) 30+ DPD Delinquency Rate Annualized NCO Rate 60+ DPD Delinquency Rate 60+ NCOs ($M) Delinquent Contracts ($M) See page 39 for definition. Note: Includes accruing contracts only. Days Past Due (“DPD”) 16
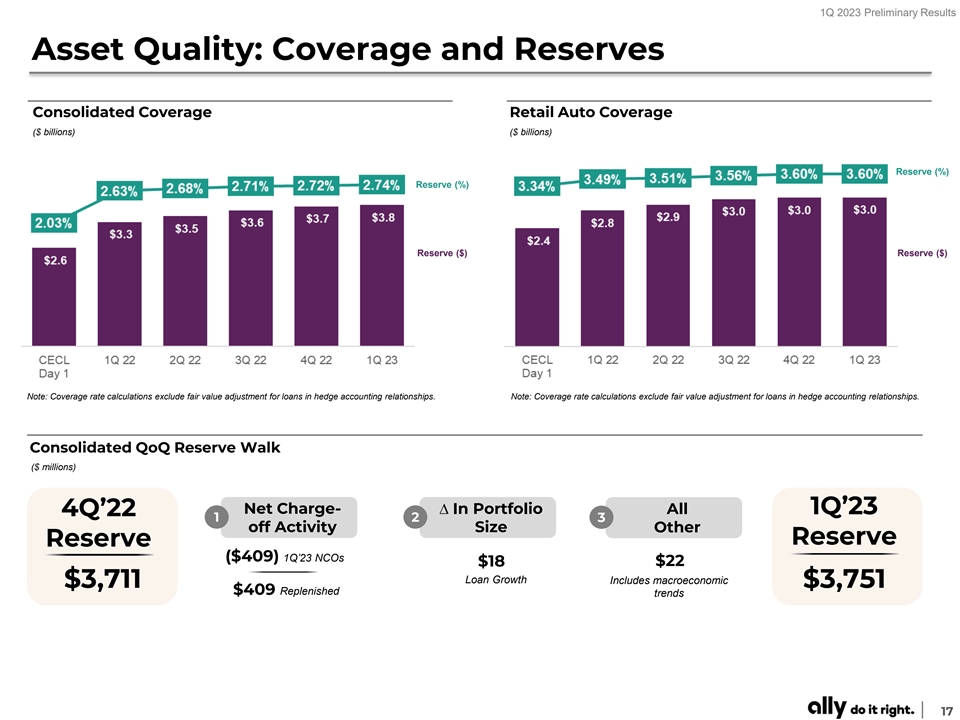
1Q 2023 Preliminary Results Asset Quality: Coverage and Reserves Consolidated Coverage Retail Auto Coverage ($ billions) ($ billions) Reserve (%) Reserve (%) Reserve ($) Reserve ($) Note: Coverage rate calculations exclude fair value adjustment for loans in hedge accounting relationships. Note: Coverage rate calculations exclude fair value adjustment for loans in hedge accounting relationships. Consolidated QoQ Reserve Walk ($ millions) Net Charge- ∆ In Portfolio All 1Q’23 4Q’22 1 2 3 off Activity Size Other Reserve Reserve ($409) 1Q’23 NCOs $18 $22 Loan Growth Includes macroeconomic $3,711 $3,751 $409 Replenished trends 17
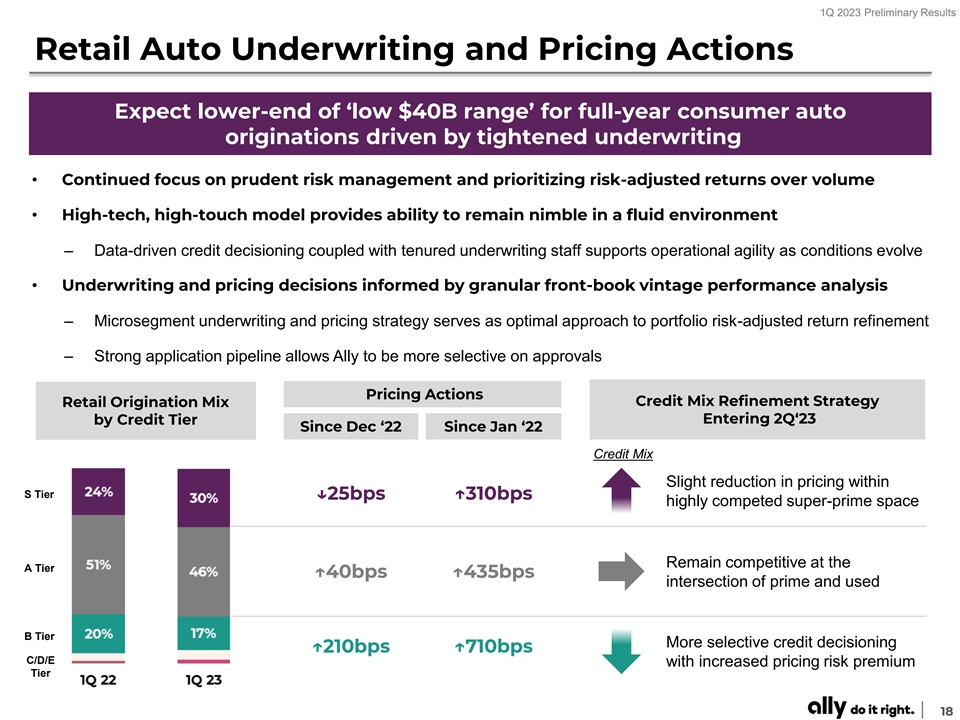
1Q 2023 Preliminary Results Retail Auto Underwriting and Pricing Actions Expect lower-end of ‘low $40B range’ for full-year consumer auto originations driven by tightened underwriting • Continued focus on prudent risk management and prioritizing risk-adjusted returns over volume • High-tech, high-touch model provides ability to remain nimble in a fluid environment – Data-driven credit decisioning coupled with tenured underwriting staff supports operational agility as conditions evolve • Underwriting and pricing decisions informed by granular front-book vintage performance analysis – Microsegment underwriting and pricing strategy serves as optimal approach to portfolio risk-adjusted return refinement – Strong application pipeline allows Ally to be more selective on approvals Pricing Actions Credit Mix Refinement Strategy Retail Origination Mix Entering 2Q‘23 by Credit Tier Since Dec ‘22 Since Jan ‘22 Credit Mix Slight reduction in pricing within S Tier ↓25bps ↑310bps highly competed super-prime space Remain competitive at the A Tier ↑40bps ↑435bps intersection of prime and used B Tier More selective credit decisioning ↑210bps ↑710bps C/D/E with increased pricing risk premium Tier 18
1Q 2023 Preliminary Results Used Vehicle Value Outlook Used vehicle values ↑ 8% in 1Q’23 – maintaining cautious outlook for 2H‘23 • Stronger than expected consumer demand and dealer activity drove auction values ↑ in 1Q’23 • Continue to expect medium-term decline in used values, while remaining above pre-pandemic levels – Used vehicle values are expected to remain above previous forecast in 2Q’23 – Potential for modest favorability through year-end, however, consumer demand outlook remains uncertain – Ongoing lack of used vehicle supply expected to keep auction prices above pre-pandemic levels well beyond 2023 Ally Used Vehicle Value Index 3-year-old vehicles, adjusted for seasonality, mix, mileage, and MSRP inflation ↑ 8% YTD ↓ 15% ↓ 9% FY’23 19
1Q 2023 Preliminary Results Retail Auto NCO Outlook Maintaining full-year 2023 NCO range of 1.6 – 1.8% • 1Q NCO rate of 1.68% in-line with 1.70% guide due to ↑ used auction prices, partially offset by ↑ loss frequency • Range of outcomes (1.60% - 1.80%) for full-year 2023 will be influenced by the following factors: [1] Used vehicle values [2] Front book performance [3] Delinquencies [4] Flow-to-loss rates [5] Origination volumes • Targeted pricing and curtailment actions implemented over last 9 months will drive originations into higher quality credit mix, primarily impacting 2024 NCOs NCO Tailwinds NCO Headwinds • Used values ↑ relative to Ally outlook (↓9% FY’23 vs • Delinquency rates elevated in 1Q’23 13% in original 2023 guidance) ̶ Fewer delinquent customers migrating to current ̶ Other industry forecasts assume used vehicle status in 2023 tax return season compared to prior values end 2023 materially flat to December 2022 years ̶ 1% change in used values = ~2bps of NCOs̶ Higher delinquency poses risk to forward defaults without flow-to-loss favorability • Favorable delinquency flow-to-loss rates relative to historical rates driven by strategic servicing • Macroeconomic deterioration and continued changes inflationary pressures – Strategic digital outreach based on stage of ̶ Current outlook assumes peak unemployment rate delinquency (30+, 60+, etc.) of 4.6% in 2Q‘24 – Timing of repossession assignment 20
1Q 2023 Preliminary Results Ally Bank: Deposit and Customer Trends $ # 2.8M 56 138B 14+ 1 Largest All-Digital, Ally Bank Consecutive Quarters Retail Deposit Consecutive Years of (1) Direct U.S. Bank Deposit Customers of Customer Growth Balances Retail Deposit Growth Total Deposits: Retail & Brokered • Total deposits of $154 billion, up $11.5 billion YoY ($ billions; EoP) Avg. Retail Portfolio – Retail deposits of $138.5 billion, up $2.5 billion YoY Interest Rate and $813 million QoQ • Migration into short-term retail CDs from new and Brokered / Other existing customers – New volume primarily concentrated in shorter-term CDs (18 months or less) Retail Balances • 2.8 million retail deposit customers, up 12% YoY – ~10% multi-product relationship customers – Industry leading 96% customer retention rate Note: Brokered / Other includes sweep deposits, mortgage escrow and other deposits. Ally Bank: Multi-product Relationship Customers Retail Deposit Mix Deposit customers with an Ally Invest, Ally Home or Ally Credit Card relationship Retail CDs Checking, OSA and Money Market See page 40 for footnotes. Note: Ally Bank, Member FDIC and Equal Housing Lender, which offers mortgage lending, point-of-sale personal lending, and a variety of deposit and other banking products, a consumer credit card business, a corporate finance business for equity sponsors and middle-market companies. Additionally, we offer securities-brokerage and investment advisory services through 21 Ally Invest.
1Q 2023 Preliminary Results Ally Bank: Leading, Growing and Diversified Growing consumer engagement and adoption trends Ally Invest (Brokerage & Wealth) • Leading, all-digital direct bank demonstrating Net Customer Assets ($ in billions) | Acquired: 2Q’16 growing momentum % of New Accts from – Complementary product suite to meet customer needs Existing Customers ▪ 86% of new Ally Invest accounts from existing customers – 1.1 million active cardholders and nearly 500 thousand active borrowers for Credit Card and Lending, respectively ▪ Significant opportunity to deepen customer relationships and diversify earnings profile – Balanced approach to growing unsecured balances ▪ Pricing and underwriting actions taken to navigate evolving macro environment Ally Lending (Point of Sale) Ally Credit Card EoP Portfolio Balances ($ in billions) | 3.3k merchant relationships EoP Portfolio Balances ($ in billions) | 58% Customer CAGR since 2017 Acquired: 4Q’19 Acquired: 4Q’21 Note: Ally Bank, Member FDIC and Equal Housing Lender, which offers mortgage lending, point-of-sale personal lending, and a variety of deposit and other banking products, a consumer credit card business, a corporate finance business for equity sponsors and middle-market companies. Additionally, we offer securities-brokerage and investment advisory services through 22 Ally Invest.
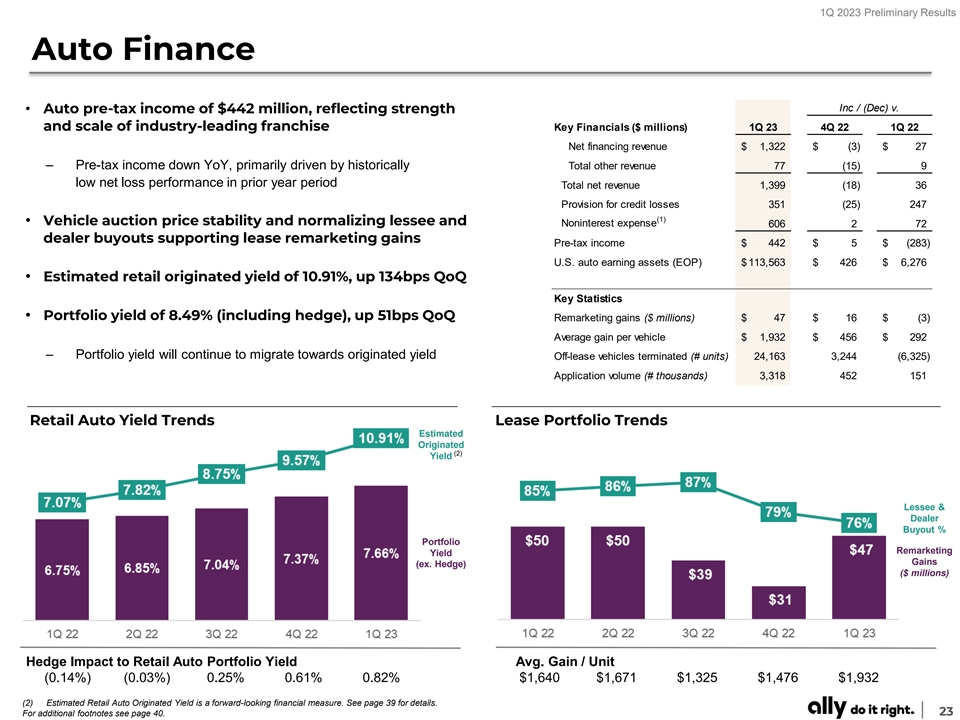
1Q 2023 Preliminary Results Auto Finance Inc / (Dec) v. • Auto pre-tax income of $442 million, reflecting strength and scale of industry-leading franchise Key Financials ($ millions) 1Q 23 4Q 22 1Q 22 Net financing revenue $ 1 ,322 $ (3) $ 27 – Pre-tax income down YoY, primarily driven by historically Total other revenue 77 (15) 9 low net loss performance in prior year period Total net revenue 1,399 (18) 36 Provision for credit losses 351 (25) 247 (1) • Vehicle auction price stability and normalizing lessee and Noninterest expense 606 2 72 dealer buyouts supporting lease remarketing gains Pre-tax income $ 442 $ 5 $ (283) U.S. auto earning assets (EOP) $ 113,563 $ 426 $ 6,276 • Estimated retail originated yield of 10.91%, up 134bps QoQ Key Statistics • Portfolio yield of 8.49% (including hedge), up 51bps QoQ Remarketing gains ($ millions) $ 47 $ 16 $ (3) Average gain per vehicle $ 1 ,932 $ 456 $ 292 – Portfolio yield will continue to migrate towards originated yield Off-lease vehicles terminated (# units) 2 4,163 3,244 (6,325) Application volume (# thousands) 3,318 452 151 Retail Auto Yield Trends Lease Portfolio Trends Estimated Originated (2) Yield Lessee & Dealer Buyout % Portfolio Remarketing Yield Gains (ex. Hedge) ($ millions) Hedge Impact to Retail Auto Portfolio Yield Avg. Gain / Unit (0.14%) (0.03%) 0.25% 0.61% 0.82% $1,640 $1,671 $1,325 $1,476 $1,932 (2) Estimated Retail Auto Originated Yield is a forward-looking financial measure. See page 39 for details. For additional footnotes see page 40. 23
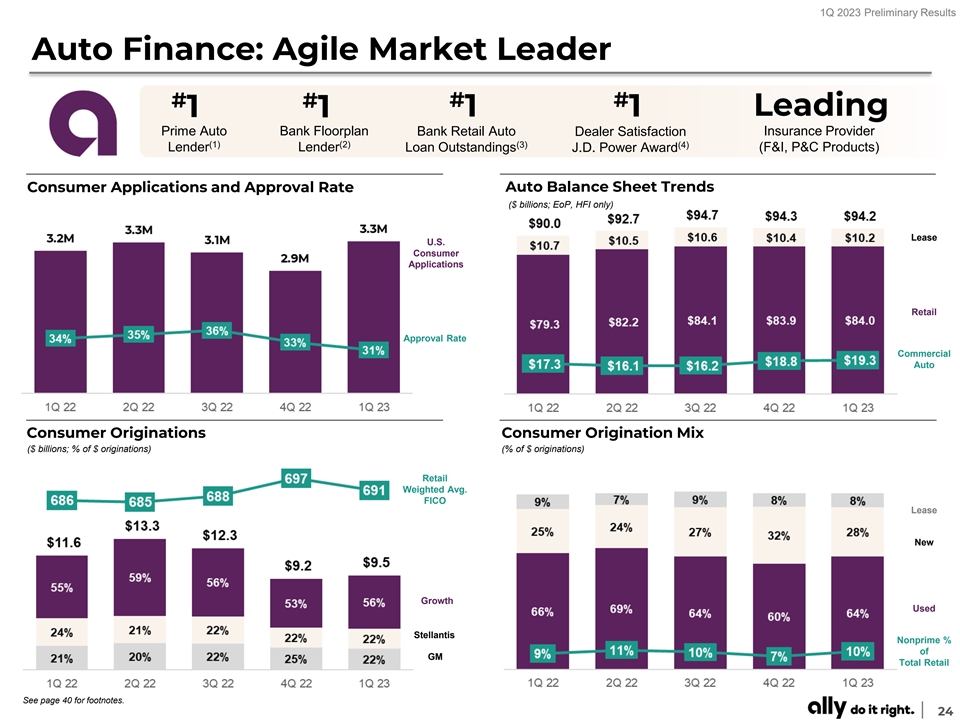
1Q 2023 Preliminary Results Auto Finance: Agile Market Leader # # # # Leading 1 1 1 1 Prime Auto Bank Floorplan Bank Retail Auto Dealer Satisfaction Insurance Provider (1) (2) (3) (4) Lender Lender Loan Outstandings J.D. Power Award (F&I, P&C Products) Consumer Applications and Approval Rate Auto Balance Sheet Trends ($ billions; EoP, HFI only) Lease U.S. Consumer Applications Retail Approval Rate Commercial Auto Consumer Originations Consumer Origination Mix ($ billions; % of $ originations) (% of $ originations) Retail Weighted Avg. FICO Lease New Growth Used Stellantis Nonprime % of GM Total Retail See page 40 for footnotes. 24
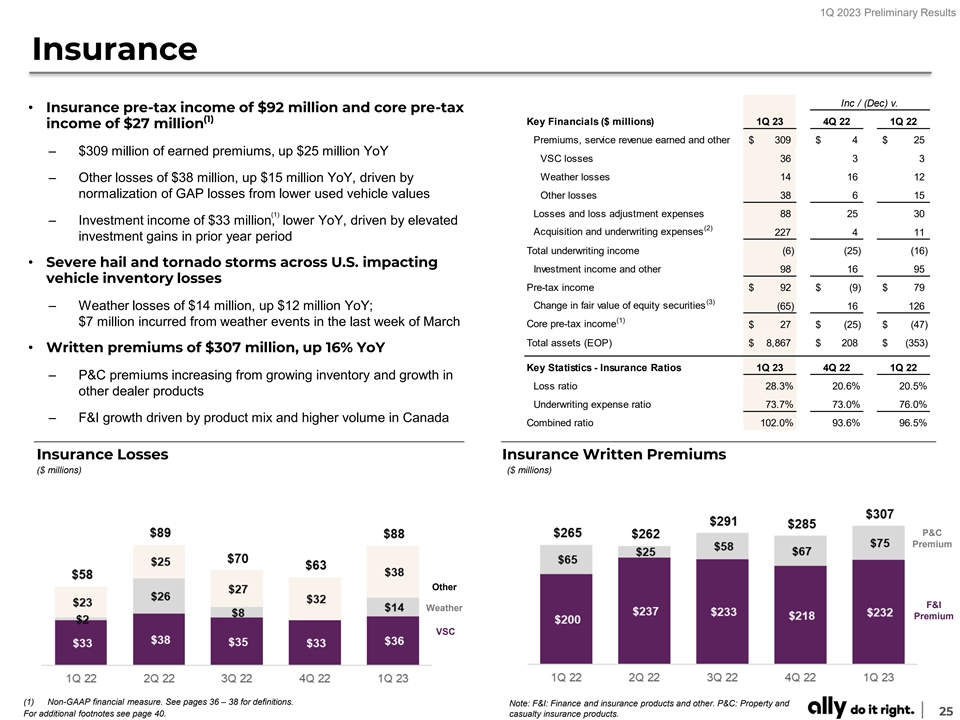
1Q 2023 Preliminary Results Insurance Inc / (Dec) v. • Insurance pre-tax income of $92 million and core pre-tax (1) Key Financials ($ millions) 1Q 23 4Q 22 1Q 22 income of $27 million Premiums, service revenue earned and other $ 309 $ 4 $ 25 – $309 million of earned premiums, up $25 million YoY VSC losses 36 3 3 Weather losses 14 16 12 – Other losses of $38 million, up $15 million YoY, driven by normalization of GAP losses from lower used vehicle values Other losses 38 6 15 (1) Losses and loss adjustment expenses 88 25 30 – Investment income of $33 million, lower YoY, driven by elevated (2) Acquisition and underwriting expenses 227 4 11 investment gains in prior year period Total underwriting income ( 6) (25) (16) • Severe hail and tornado storms across U.S. impacting Investment income and other 98 16 95 vehicle inventory losses Pre-tax income $ 92 $ (9) $ 79 (3) Change in fair value of equity securities (65) 16 126 – Weather losses of $14 million, up $12 million YoY; (1) $7 million incurred from weather events in the last week of March Core pre-tax income $ 27 $ (25) $ (47) Total assets (EOP) $ 8,867 $ 208 $ (353) • Written premiums of $307 million, up 16% YoY Key Statistics - Insurance Ratios 1Q 23 4Q 22 1Q 22 – P&C premiums increasing from growing inventory and growth in Loss ratio 28.3% 20.6% 20.5% other dealer products Underwriting expense ratio 73.7% 73.0% 76.0% – F&I growth driven by product mix and higher volume in Canada Combined ratio 102.0% 93.6% 96.5% Insurance Losses Insurance Written Premiums ($ millions) ($ millions) P&C Premium Other F&I Weather Premium VSC (1) Non-GAAP financial measure. See pages 36 – 38 for definitions. Note: F&I: Finance and insurance products and other. P&C: Property and 25 For additional footnotes see page 40. casualty insurance products.
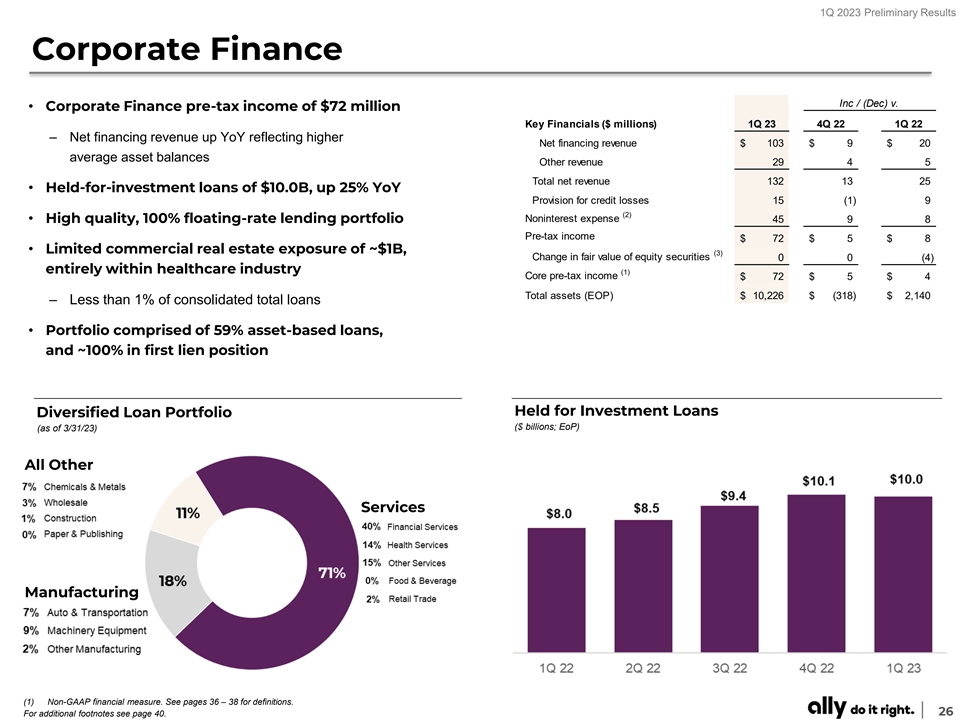
1Q 2023 Preliminary Results Corporate Finance Inc / (Dec) v. • Corporate Finance pre-tax income of $72 million Key Financials ($ millions) 1Q 23 4Q 22 1Q 22 – Net financing revenue up YoY reflecting higher Net financing revenue $ 103 $ 9 $ 20 average asset balances Other revenue 29 4 5 Total net revenue 132 13 25 • Held-for-investment loans of $10.0B, up 25% YoY Provision for credit losses 15 ( 1) 9 (2) • High quality, 100% floating-rate lending portfolio Noninterest expense 45 9 8 Pre-tax income $ 72 $ 5 $ 8 • Limited commercial real estate exposure of ~$1B, (3) Change in fair value of equity securities 0 0 ( 4) entirely within healthcare industry (1) Core pre-tax income $ 72 $ 5 $ 4 Total assets (EOP) $ 10,226 $ (318) $ 2 ,140 – Less than 1% of consolidated total loans • Portfolio comprised of 59% asset-based loans, and ~100% in first lien position Held for Investment Loans Diversified Loan Portfolio ($ billions; EoP) (as of 3/31/23) All Other Services Manufacturing (1) Non-GAAP financial measure. See pages 36 – 38 for definitions. 26 For additional footnotes see page 40.
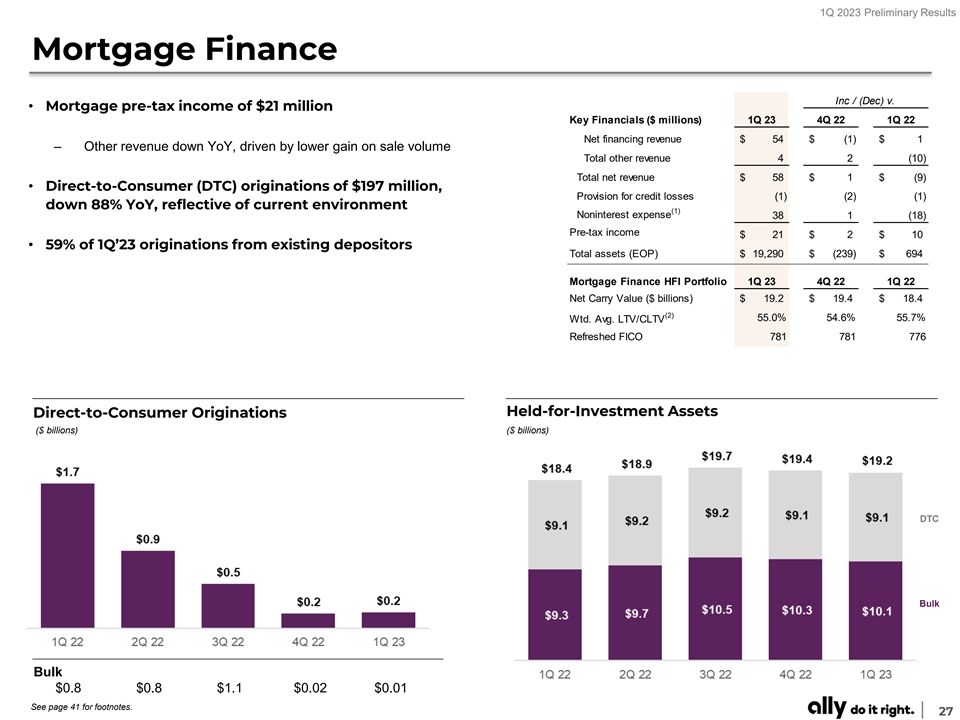
1Q 2023 Preliminary Results Mortgage Finance Inc / (Dec) v. • Mortgage pre-tax income of $21 million Key Financials ($ millions) 1Q 23 4Q 22 1Q 22 Net financing revenue $ 54 $ (1) $ 1 – Other revenue down YoY, driven by lower gain on sale volume Total other revenue 4 2 (10) Total net revenue $ 58 $ 1 $ (9) • Direct-to-Consumer (DTC) originations of $197 million, Provision for credit losses ( 1) ( 2) ( 1) down 88% YoY, reflective of current environment (1) Noninterest expense 38 1 (18) Pre-tax income $ 21 $ 2 $ 10 • 59% of 1Q’23 originations from existing depositors Total assets (EOP) $ 19,290 $ (239) $ 694 Mortgage Finance HFI Portfolio 1Q 23 4Q 22 1Q 22 Net Carry Value ($ billions) $ 19.2 $ 19.4 $ 18.4 (2) 55.0% 54.6% 55.7% Wtd. Avg. LTV/CLTV Refreshed FICO 781 781 776 Held-for-Investment Assets Direct-to-Consumer Originations ($ billions) ($ billions) DTC Bulk Bulk $0.8 $0.8 $1.1 $0.02 $0.01 See page 41 for footnotes. 27
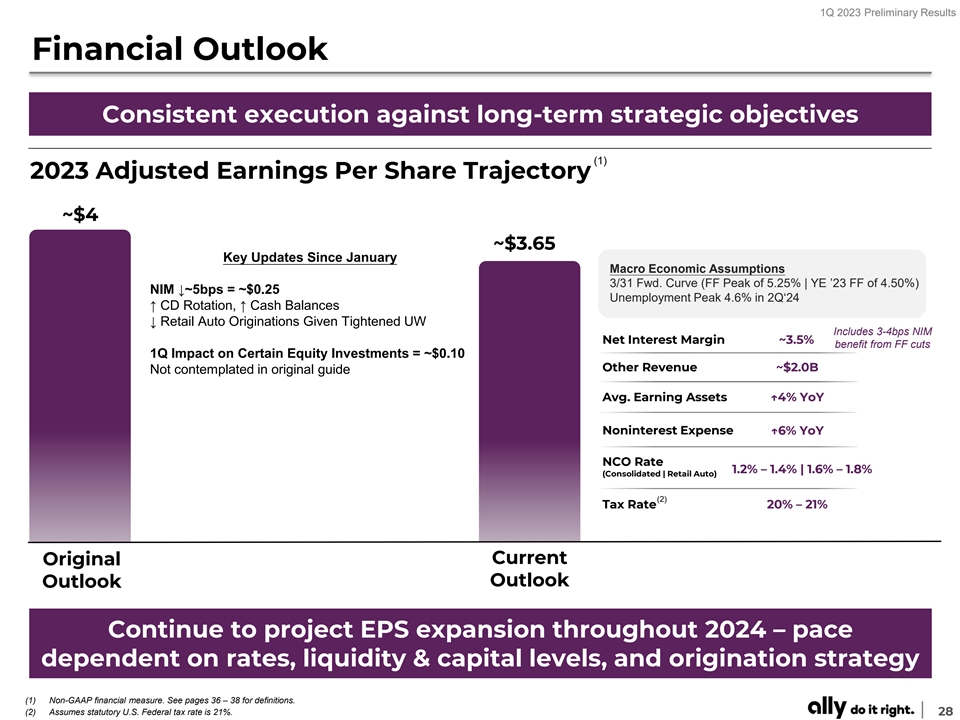
1Q 2023 Preliminary Results Financial Outlook Consistent execution against long-term strategic objectives (1) 2023 Adjusted Earnings Per Share Trajectory ~$4 ~$3.65 Key Updates Since January Macro Economic Assumptions 3/31 Fwd. Curve (FF Peak of 5.25% | YE ’23 FF of 4.50%) NIM ↓~5bps = ~$0.25 Unemployment Peak 4.6% in 2Q‘24 ↑ CD Rotation, ↑ Cash Balances ↓ Retail Auto Originations Given Tightened UW Includes 3-4bps NIM Net Interest Margin ~3.5% benefit from FF cuts 1Q Impact on Certain Equity Investments = ~$0.10 Other Revenue ~$2.0B Not contemplated in original guide Avg. Earning Assets ↑4% YoY Noninterest Expense ↑6% YoY NCO Rate 1.2% – 1.4% | 1.6% – 1.8% (Consolidated | Retail Auto) (2) Tax Rate 20% – 21% Current Original Outlook Outlook Continue to project EPS expansion throughout 2024 – pace dependent on rates, liquidity & capital levels, and origination strategy (1) Non-GAAP financial measure. See pages 36 – 38 for definitions. (2) Assumes statutory U.S. Federal tax rate is 21%. 28
1Q 2023 Preliminary Results Strategic Priorities Focused execution on driving long-term value for all stakeholders Ensure culture remains aligned with relentless focus on customers, communities, employees, and shareholders Differentiate as a financial ally for our consumer and commercial customers Continue to grow and diversify by scaling existing businesses Constant evolution to maintain leading digital experiences and brand Driving disciplined risk management and accretive capital deployment Delivering sustainable, enhanced results, and value for ALL stakeholders 29

1Q 2023 Preliminary Results Supplemental 30
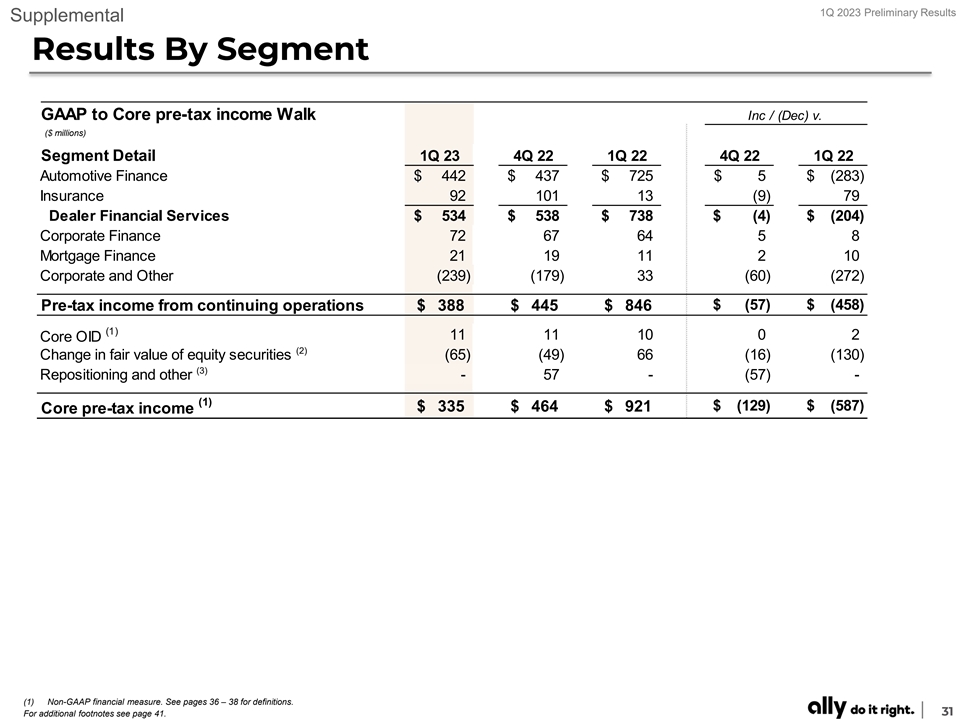
1Q 2023 Preliminary Results Supplemental Results By Segment GAAP to Core pre-tax income Walk Inc / (Dec) v. ($ millions) Segment Detail 1Q 23 4Q 22 1Q 22 4Q 22 1Q 22 Automotive Finance $ 442 $ 437 $ 725 $ 5 $ (283) Insurance 92 101 13 (9) 79 Dealer Financial Services $ 534 $ 538 $ 738 $ (4) $ (2 04) Corporate Finance 72 67 64 5 8 Mortgage Finance 21 19 11 2 10 Corporate and Other (2 39) (1 79) 33 (60) (272) $ (57) $ (458) Pre-tax income from continuing operations $ 388 $ 445 $ 846 (1) 11 11 10 0 2 Core OID (2) Change in fair value of equity securities (65) (49) 66 (1 6) (1 30) (3) Repositioning and other - 57 - (5 7) - (1) $ (129) $ (587) $ 335 $ 464 $ 921 Core pre-tax income (1) Non-GAAP financial measure. See pages 36 – 38 for definitions. 31 For additional footnotes see page 41.
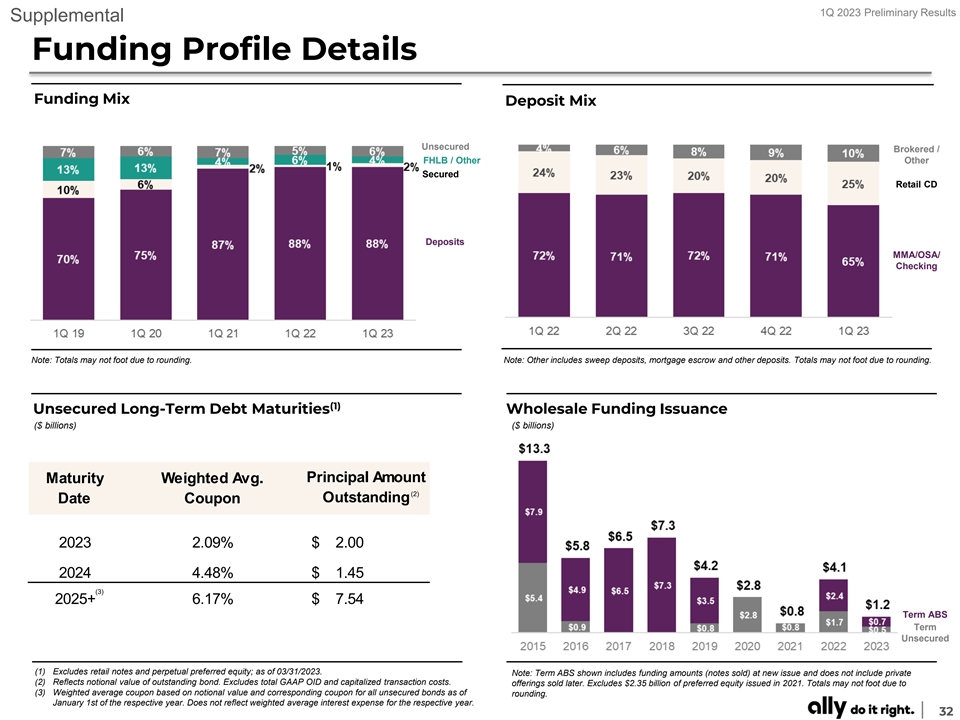
1Q 2023 Preliminary Results Supplemental Funding Profile Details Funding Mix Deposit Mix Unsecured Brokered / FHLB / Other Other Secured Retail CD Deposits MMA/OSA/ Checking Note: Totals may not foot due to rounding. Note: Other includes sweep deposits, mortgage escrow and other deposits. Totals may not foot due to rounding. (1) Unsecured Long-Term Debt Maturities Wholesale Funding Issuance ($ billions) ($ billions) Principal Amount Maturity Weighted Avg. (2) Outstanding Date Coupon 2023 2.09% $ 2.00 2024 4.48% $ 1.45 (3) 2025+ 6.17% $ 7.54 Term ABS Term Unsecured (1) Excludes retail notes and perpetual preferred equity; as of 03/31/2023. Note: Term ABS shown includes funding amounts (notes sold) at new issue and does not include private (2) Reflects notional value of outstanding bond. Excludes total GAAP OID and capitalized transaction costs. offerings sold later. Excludes $2.35 billion of preferred equity issued in 2021. Totals may not foot due to (3) Weighted average coupon based on notional value and corresponding coupon for all unsecured bonds as of rounding. January 1st of the respective year. Does not reflect weighted average interest expense for the respective year. 32
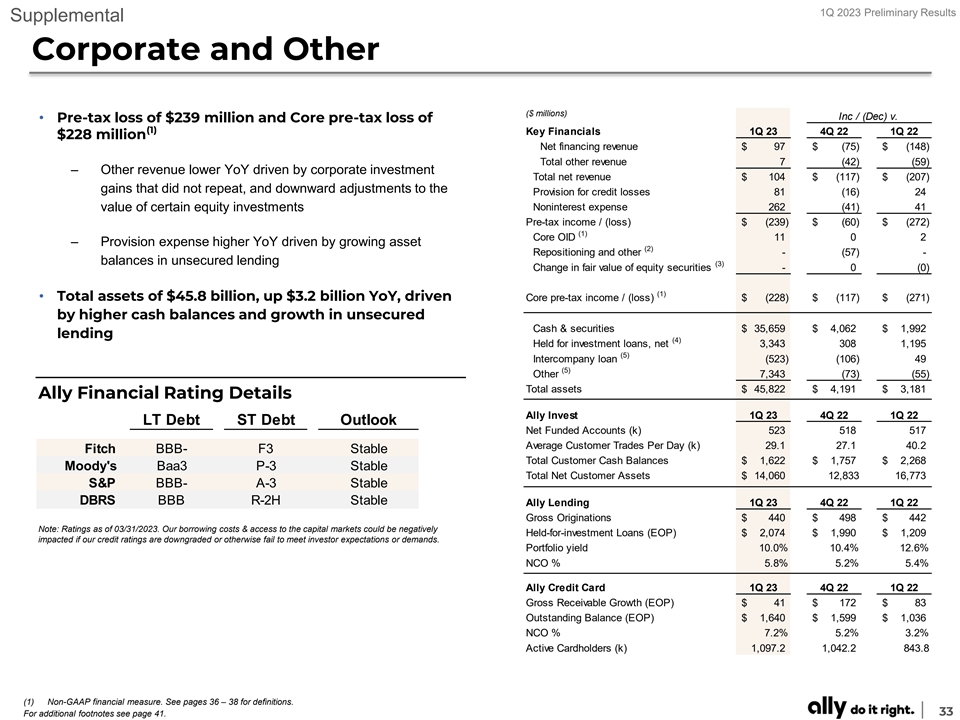
1Q 2023 Preliminary Results Supplemental Corporate and Other ($ millions) Inc / (Dec) v. • Pre-tax loss of $239 million and Core pre-tax loss of (1) Key Financials 1Q 23 4Q 22 1Q 22 $228 million Net financing revenue $ 97 $ (75) $ (148) Total other revenue 7 (42) (59) – Other revenue lower YoY driven by corporate investment Total net revenue $ 104 $ (117) $ (207) gains that did not repeat, and downward adjustments to the Provision for credit losses 81 (16) 24 Noninterest expense 262 (41) 41 value of certain equity investments Pre-tax income / (loss) $ (239) $ (60) $ (272) (1) Core OID 11 0 2 – Provision expense higher YoY driven by growing asset (2) Repositioning and other - (57) - balances in unsecured lending (3) Change in fair value of equity securities - 0 ( 0) (1) • Total assets of $45.8 billion, up $3.2 billion YoY, driven Core pre-tax income / (loss) $ (228) $ (117) $ (271) by higher cash balances and growth in unsecured Cash & securities $ 35,659 $ 4 ,062 $ 1,992 lending (4) Held for investment loans, net 3,343 308 1,195 (5) Intercompany loan (523) (106) 49 (5) Other 7,343 (73) (55) Total assets $ 45,822 $ 4 ,191 $ 3 ,181 Ally Financial Rating Details Ally Invest 1Q 23 4Q 22 1Q 22 LT Debt ST Debt Outlook Net Funded Accounts (k) 523 518 517 Average Customer Trades Per Day (k) 29.1 27.1 40.2 Fitch BBB- F3 Stable Total Customer Cash Balances $ 1 ,622 $ 1 ,757 $ 2,268 Moody's Baa3 P-3 Stable Total Net Customer Assets $ 14,060 12,833 1 6,773 S&P BBB- A-3 Stable DBRS BBB R-2H Stable Ally Lending 1Q 23 4Q 22 1Q 22 Gross Originations $ 440 $ 498 $ 442 Note: Ratings as of 03/31/2023. Our borrowing costs & access to the capital markets could be negatively Held-for-investment Loans (EOP) $ 2 ,074 $ 1 ,990 $ 1 ,209 impacted if our credit ratings are downgraded or otherwise fail to meet investor expectations or demands. Portfolio yield 10.0% 10.4% 12.6% NCO % 5.8% 5.2% 5.4% Ally Credit Card 1Q 23 4Q 22 1Q 22 Gross Receivable Growth (EOP) $ 41 $ 172 $ 83 Outstanding Balance (EOP) $ 1 ,640 $ 1,599 $ 1,036 NCO % 7.2% 5.2% 3.2% Active Cardholders (k) 1,097.2 1,042.2 843.8 (1) Non-GAAP financial measure. See pages 36 – 38 for definitions. 33 For additional footnotes see page 41.
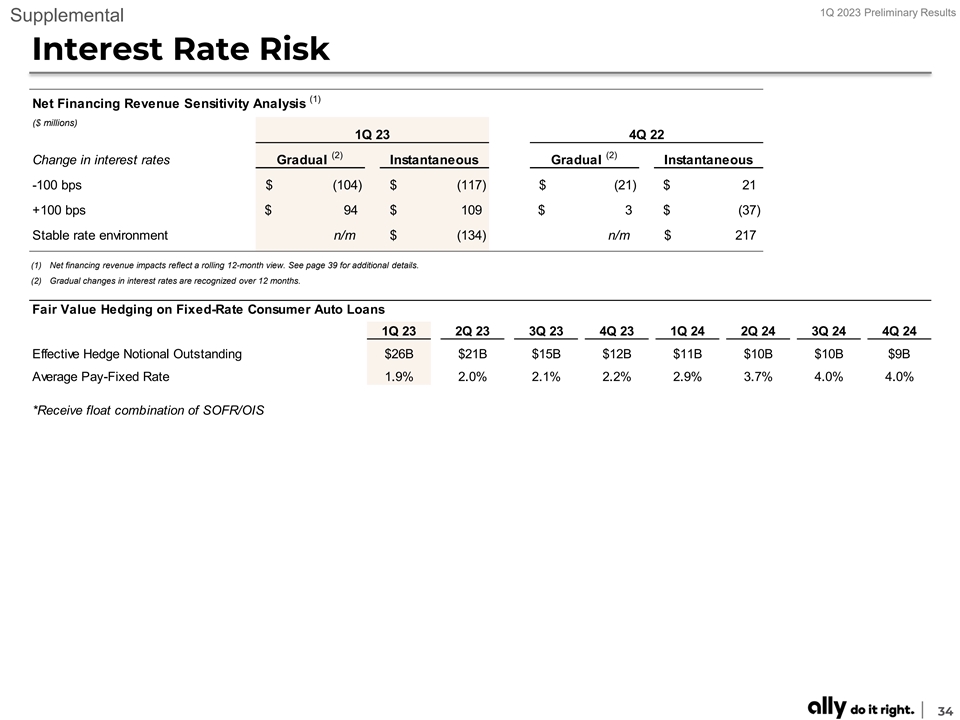
1Q 2023 Preliminary Results Supplemental Interest Rate Risk (1) Net Financing Revenue Sensitivity Analysis ($ millions) 1Q 23 4Q 22 (2) (2) Change in interest rates Gradual Instantaneous Gradual Instantaneous -100 bps $ ( 104) $ (117) $ (21) $ 21 +100 bps $ 94 $ 109 $ 3 $ (37) Stable rate environment n/m $ (134) n/m $ 217 (1) Net financing revenue impacts reflect a rolling 12-month view. See page 39 for additional details. (2) Gradual changes in interest rates are recognized over 12 months. Fair Value Hedging on Fixed-Rate Consumer Auto Loans 1Q 23 2Q 23 3Q 23 4Q 23 1Q 24 2Q 24 3Q 24 4Q 24 Effective Hedge Notional Outstanding $26B $21B $15B $12B $11B $10B $10B $9B Average Pay-Fixed Rate 1.9% 2.0% 2.1% 2.2% 2.9% 3.7% 4.0% 4.0% *Receive float combination of SOFR/OIS 34
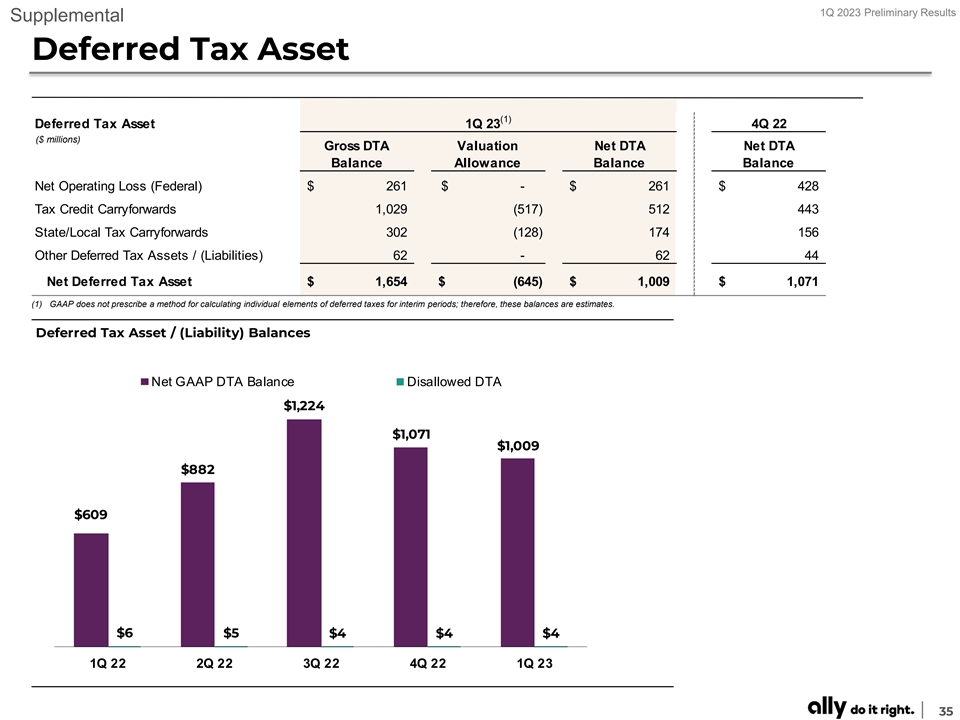
1Q 2023 Preliminary Results Supplemental Deferred Tax Asset (1) Deferred Tax Asset 1Q 23 4Q 22 ($ millions) Gross DTA Valuation Net DTA Net DTA Balance Allowance Balance Balance Net Operating Loss (Federal) $ 261 $ - $ 261 $ 428 Tax Credit Carryforwards 1,029 (517) 512 443 State/Local Tax Carryforwards 302 ( 128) 174 156 Other Deferred Tax Assets / (Liabilities) 62 - 62 44 Net Deferred Tax Asset $ 1,654 $ ( 645) $ 1,009 $ 1,071 (1) GAAP does not prescribe a method for calculating individual elements of deferred taxes for interim periods; therefore, these balances are estimates. Deferred Tax Asset / (Liability) Balances ($ millions) Net GAAP DTA Balance Disallowed DTA $1,224 $1,071 $1,009 $882 $609 $6 $5 $4 $4 $4 1Q 22 2Q 22 3Q 22 4Q 22 1Q 23 35
1Q 2023 Preliminary Results Supplemental Notes on Non-GAAP Financial Measures The following are non-GAAP financial measures which Ally believes are important to the reader of the Consolidated Financial Statements, but which are supplemental to and not a substitute for GAAP measures: Accelerated issuance expense (Accelerated OID), Adjusted earnings per share (Adjusted EPS), Adjusted efficiency ratio, Adjusted noninterest expense, Adjusted other revenue, Adjusted tangible book value per share (Adjusted TBVPS), Adjusted total net revenue, Core net income attributable to common shareholders, Core original issue discount (Core OID) amortization expense, Core outstanding original issue discount balance (Core OID balance), Core pre-provision net revenue (Core PPNR), Core pre-tax income, Core return on tangible common equity (Core ROTCE), Investment income and other (adjusted), Net financing revenue (excluding Core OID), Net interest margin (excluding Core OID), Pre-provision net revenue (PPNR), and Tangible Common Equity. These measures are used by management, and we believe are useful to investors in assessing the company’s operating performance and capital. For calculation methodology, refer to the Reconciliation to GAAP later in this document. 1) Accelerated issuance expense (Accelerated OID) is the recognition of issuance expenses related to calls of redeemable debt. 2) Adjusted earnings per share (Adjusted EPS) is a non-GAAP financial measure that adjusts GAAP EPS for revenue and expense items that are typically strategic in nature or that management otherwise does not view as reflecting the operating performance of the company. Management believes Adjusted EPS can help the reader better understand the operating performance of the core businesses and their ability to generate earnings. In the numerator of Adjusted EPS, GAAP net income attributable to common shareholders is adjusted for the following items: (1) excludes discontinued operations, net of tax, as Ally is primarily a domestic company and sales of international businesses and other discontinued operations in the past have significantly impacted GAAP EPS, (2) adds back the tax-effected non-cash Core OID, (3) adjusts for tax-effected repositioning and other which are primarily related to the extinguishment of high cost legacy debt, strategic activities and significant other one-time items, (4) change in fair value of equity securities, (5) excludes significant discrete tax items that do not relate to the operating performance of the core businesses, and adjusts for preferred stock capital actions that have been taken by the company to normalize its capital structure, as applicable for respective periods. See page 42 for calculation methodology and details. 3) Adjusted efficiency ratio is a non-GAAP financial measure that management believes is helpful to readers in comparing the efficiency of its core banking and lending businesses with those of its peers. See page 45 for calculation details. (1) In the numerator of Adjusted efficiency ratio, total noninterest expense is adjusted for Rep and warrant expense, Insurance segment expense, and repositioning and other which are primarily related to the extinguishment of high-cost legacy debt, strategic activities and significant other one-time items, as applicable for respective periods. (2) In the denominator, total net revenue is adjusted for Core OID and Insurance segment revenue. See page 25 for the combined ratio for the Insurance segment which management uses as a primary measure of underwriting profitability for the Insurance segment. 4) Adjusted noninterest expense is a non-GAAP financial measure that adjusts GAAP noninterest expense for repositioning items. Management believes adjusted noninterest expense is a helpful financial metric because it enables the reader better understand the business' expenses excluding nonrecurring items. See page 47 for calculation methodology and details. 5) Adjusted other revenue is a non-GAAP financial measure that adjusts GAAP other revenue for OID expenses, repositioning, and change in fair value of equity securities. Management believes adjusted other revenue is a helpful financial metric because it enables the reader to better understand the business' ability to generate other revenue. See page 47 for calculation methodology and details. 36
1Q 2023 Preliminary Results Supplemental Notes on Non-GAAP Financial Measures 6) Adjusted tangible book value per share (Adjusted TBVPS) is a non-GAAP financial measure that reflects the book value of equity attributable to shareholders even if Core OID balance were accelerated immediately through the financial statements. As a result, management believes Adjusted TBVPS provides the reader with an assessment of value that is more conservative than GAAP common shareholder’s equity per share. Adjusted TBVPS generally adjusts common equity for: (1) goodwill and identifiable intangibles, net of DTLs, (2) tax-effected Core OID balance to reduce tangible common equity in the event the corresponding discounted bonds are redeemed/tendered, and (3) Series G discount which reduces tangible common equity as the company has normalized its capital structure, as applicable for respective periods. Note: In December 2017, tax-effected Core OID balance was adjusted from a statutory U.S. Federal tax rate of 35% to 21% (“rate”) as a result of changes to U.S. tax law. The adjustment conservatively increased the tax-effected Core OID balance and consequently reduced Adjusted TBVPS as any acceleration of the non-cash charge in future periods would flow through the financial statements at a 21% rate versus a previously modeled 35% rate. See pages 43 for calculation methodology and details. 7) Adjusted total net revenue is a non-GAAP financial measure that management believes is helpful for readers to understand the ongoing ability of the company to generate revenue. For purposes of this calculation, GAAP net financing revenue is adjusted by excluding Core OID to calculate net financing revenue ex. core OID. GAAP other revenue is adjusted for OID expenses, repositioning, and change in fair value of equity securities to calculate adjusted other revenue. Adjusted total net revenue is calculated by adding net financing revenue ex. core OID to adjusted other revenue. See page 47 for calculation methodology and details. 8) Core net income attributable to common shareholders is a non-GAAP financial measure that serves as the numerator in the calculations of Adjusted EPS and Core ROTCE and that, like those measures, is believed by management to help the reader better understand the operating performance of the core businesses and their ability to generate earnings. Core net income attributable to common shareholders adjusts GAAP net income attributable to common shareholders for discontinued operations net of tax, tax-effected Core OID expense, tax-effected repositioning and other primarily related to the extinguishment of high-cost legacy debt and strategic activities and significant other, preferred stock capital actions, significant discrete tax items and tax-effected changes in equity investments measured at fair value, as applicable for respective periods. See pages 42 and 44 for calculation methodology and details. 9) Core original issue discount (Core OID) amortization expense is a non-GAAP financial measure for OID and is believed by management to help the reader better understand the activity removed from: Core pre-tax income (loss), Core net income (loss) attributable to common shareholders, Adjusted EPS, Core ROTCE, Adjusted efficiency ratio, Adjusted total net revenue, and Net financing revenue (excluding Core OID). Core OID is primarily related to bond exchange OID which excludes international operations and future issuances. Core OID for all periods shown is applied to the pre-tax income of the Corporate and Other segment. See page 47 for calculation methodology and details. 10) Core outstanding original issue discount balance (Core OID balance) is a non-GAAP financial measure for outstanding OID and is believed by management to help the reader better understand the balance removed from Core ROTCE and Adjusted TBVPS. Core OID balance is primarily related to bond exchange OID which excludes international operations and future issuances. See page 47 for calculation methodology and details. 11) Core pre-provision net revenue (Core PPNR) is a non-GAAP financial measure calculated by adding GAAP net financing revenue and GAAP other revenue and subtracting GAAP noninterest expense then adding Core OID and repositioning expenses, excluding provision for credit losses. Management believes that Core PPNR is a helpful financial metric because it enables the reader to assess the core business' ability to generate earnings to cover credit losses. See page 47 for calculation methodology and details. 12) Core pre-tax income is a non-GAAP financial measure that adjusts pre-tax income from continuing operations by excluding (1) Core OID, and (2) change in fair value of equity securities (change in fair value of equity securities impacts the Insurance and Corporate Finance segments), and (3) Repositioning and other which are primarily related to the extinguishment of high cost legacy debt, strategic activities and significant other one-time items, as applicable for respective periods or businesses. Management believes core pre-tax income can help the reader better understand the operating performance of the core businesses and their ability to generate earnings. See page 46 for calculation methodology and details. 37
1Q 2023 Preliminary Results Supplemental Notes on Non-GAAP Financial Measures 13) Core return on tangible common equity (Core ROTCE) is a non-GAAP financial measure that management believes is helpful for readers to better understand the ongoing ability of the company to generate returns on its equity base that supports core operations. For purposes of this calculation, tangible common equity is adjusted for Core OID balance and net DTA. Ally’s Core net income attributable to common shareholders for purposes of calculating Core ROTCE is based on the actual effective tax rate for the period adjusted for significant discrete tax items including tax reserve releases, which aligns with the methodology used in calculating adjusted earnings per share. See page 44 for calculation details. (1) In the numerator of Core ROTCE, GAAP net income attributable to common shareholders is adjusted for discontinued operations net of tax, tax-effected Core OID, tax-effected repositioning and other which are primarily related to the extinguishment of high-cost legacy debt, strategic activities and significant other one- time items, change in fair value of equity securities, significant discrete tax items, and preferred stock capital actions, as applicable for respective periods. (2) In the denominator, GAAP shareholder’s equity is adjusted for goodwill and identifiable intangibles net of DTL, Core OID balance, and net DTA. 14) Investment income and other (adjusted) is a non-GAAP financial measure that adjusts GAAP investment income and other for repositioning, and the change in fair value of equity securities. Management believes investment income and other (adjusted) is a helpful financial metric because it enables the reader to better understand the business' ability to generate investment income. 15) Net financing revenue excluding core OID is calculated using a non-GAAP measure that adjusts net financing revenue by excluding Core OID. The Core OID balance is primarily related to bond exchange OID which excludes international operations and future issuances. Management believes net financing revenue ex. Core OID is a helpful financial metric because it enables the reader to better understand the business' ability to generate revenue. See page 47 for calculation methodology and details. 16) Net interest margin excluding core OID is calculated using a non-GAAP measure that adjusts net interest margin by excluding Core OID. The Core OID balance is primarily related to bond exchange OID which excludes international operations and future issuances. Management believes net interest margin ex. Core OID is a helpful financial metric because it enables the reader to better understand the business' profitability and margins. See page 11 for calculation methodology and details. 17) Pre-provision net revenue (PPNR) is a non-GAAP financial measure calculated by adding GAAP net financing revenue and GAAP other revenue then subtracting GAAP noninterest expense, excluding provision for credit losses. Management believes that PPNR is a helpful financial metric because it enables the reader to assess the business’ ability to generate earnings to cover credit losses and as it is utilized by Federal Reserve's approach to modeling within the Supervisory Stress Test Framework that generally follows U.S. generally accepted accounting principles (GAAP) and includes a calculation of PPNR as a component of projected pre-tax net income. See page 47 for calculation methodology and details. 18) Tangible Common Equity is a non-GAAP financial measure that is defined as common stockholders’ equity less goodwill and identifiable intangible assets, net of deferred tax liabilities. Ally considers various measures when evaluating capital adequacy, including tangible common equity. Ally believes that tangible common equity is important because we believe readers may assess our capital adequacy using this measure. Additionally, presentation of this measure allows readers to compare certain aspects of our capital adequacy on the same basis to other companies in the industry. For purposes of calculating Core return on tangible common equity (Core ROTCE), tangible common equity is further adjusted for Core OID balance and net deferred tax asset. See page 44 for calculation methodology and details. 38
1Q 2023 Preliminary Results Supplemental Notes on Other Financial Measures 1) Change in fair value of equity securities impacts the Insurance, Corporate Finance and Corporate and Other segments. The change reflects fair value adjustments to equity securities that are reported at fair value. Management believes the change in fair value of equity securities should be removed from select financial measures because it enables the reader to better understand the business’ ongoing ability to generate revenue and income. 2) Customer retention rate is the annualized 3-month rolling average of 1 minus the monthly attrition rate; excludes escheatment. 3) Estimated impact of CECL on regulatory capital per final rule issued by U.S. banking agencies - In December 2018, the FRB and other U.S. banking agencies approved a final rule to address the impact of CECL on regulatory capital by allowing BHCs and banks, including Ally, the option to phase in the day-one impact of CECL over a three-year period. In March 2020, the FRB and other U.S. banking agencies issued an interim final rule that became effective on March 31, 2020 and provided an alternative option for banks to temporarily delay the impacts of CECL, relative to the incurred loss methodology for estimating the allowance for loan losses, on regulatory capital. A final rule that was largely unchanged from the March 2020 interim final rule was issued by the FRB and other U.S. banking agencies in August 2020, and became effective in September 2020. For regulatory capital purposes, these rules permitted us to delay recognizing the estimated impact of CECL on regulatory capital until after a two-year deferral period, which for us extended through December 31, 2021. Beginning on January 1, 2022, we are required to phase in 25% of the previously deferred estimated capital impact of CECL, with an additional 25% to be phased in at the beginning of each subsequent year until fully phased in by the first quarter of 2025. Under these rules, firms that adopt CECL and elect the five-year transition will calculate the estimated impact of CECL on regulatory capital as the day-one impact of adoption plus 25% of the subsequent change in allowance during the two-year deferral period, which according to the final rule approximates the impact of CECL relative to an incurred loss model. We adopted this transition option during the first quarter of 2020, and beginning January 1, 2022 are phasing in the regulatory capital impacts of CECL based on this five-year transition period. 4) Estimated retail auto originated yield is a financial measure determined by calculating the estimated average annualized yield for loans originated during the period. At this time there currently is no comparable GAAP financial measure for Estimated Retail Auto Originated Yield and therefore this forecasted estimate of yield at the time of origination cannot be quantitatively reconciled to comparable GAAP information. 5) Interest rate risk modeling – We prepare our forward-looking baseline forecasts of net financing revenue taking into consideration anticipated future business growth, asset/liability positioning, and interest rates based on the implied forward curve. The analysis is highly dependent upon a variety of assumptions including the repricing characteristics of retail deposits with both contractual and non-contractual maturities. We continually monitor industry and competitive repricing activity along with other market factors when contemplating deposit pricing actions. Please see our SEC filings for more details. 6) Net charge-off ratios are calculated as annualized net charge-offs divided by average outstanding finance receivables and loans excluding loans measured at fair value and loans held-for-sale. 7) Repositioning is primarily related to the extinguishment of high-cost legacy debt, strategic activities, and significant other one-time items. 8) U.S. consumer auto originations ▪ New Retail – standard and subvented rate new vehicle loans; Lease – new vehicle lease originations; Used – used vehicle loans; Growth – total originations from non-GM/Stellantis dealers and direct-to-consumer loans. Note: Stellantis N.V. (“Stellantis”) announced January 17, 2021, following completion of the merger of Peugeot S.A. (“Groupe PSA”) and Fiat Chrysler Automobiles N.V. (“FCA”) on January 16, 2021, the combined company was renamed Stellantis; Nonprime – originations with a FICO® score of less than 620 39

1Q 2023 Preliminary Results Supplemental Additional Notes Page – 21 | Ally Bank: Deposit and Customer Trends (1) Source: FDIC, FFIEC Call Reports and Company filings of branchless banks including Marcus, Discover, American Express, Synchrony. Page – 23 | Auto Finance (1) Noninterest expense includes corporate allocations of $271 million in 1Q 2023, $290 million in 4Q 2022, and $248 million in 1Q 2022. Page – 24 | Auto Finance: Agile Market Leader (1) ‘Prime Auto Lender’ - Source: PIN Navigator Data & Analytics, a business division of J.D. Power. The credit scores provided within these reports have been provided by FICO® Risk Score, Auto 08 FICO® is a registered trademark of Fair Isaac Corporation in the United States and other countries. Ally management defines retail auto market segmentation (unit based) for consumer automotive loans primarily as those loans with a FICO® Score (or an equivalent score) at origination by the following: • Super-prime 720+, Prime 620 – 719, Nonprime less than 620 (2) ‘Bank Floorplan Lender’ - Source: Company filings, including WFC and HBAN. (3) ‘Retail Auto Loan Outstandings’ - Source: Big Wheels Auto Finance Data 2021. (4) ‘#1 Dealer Satisfaction among Non-Captive Lenders with Sub-Prime Credit’ - Source: J.D. Power. Page – 25 | Insurance (2) Acquisition and underwriting expenses includes corporate allocations of $24 million in 1Q 2023, $24 million in 4Q 2022, and $23 million in 1Q 2022. (3) Change in fair value of equity securities impacts the Insurance segment. The change reflects fair value adjustments to equity securities that are reported at fair value. Management believes the change in fair value of equity securities should be removed from select financial measures because it enables the reader to better understand the business’ ongoing ability to generate revenue and income. Page – 26 | Corporate Finance (2) Noninterest expense includes corporate allocations of $15 million in 1Q 2023, $13 million in 4Q 2022, and $13 million in 1Q 2022. (3) Change in fair value of equity securities impacts the Corporate Finance segment. The change reflects fair value adjustments to equity securities that are reported at fair value. Management believes the change in fair value of equity securities should be removed from select financial measures because it enables the reader to better understand the business’ ongoing ability to generate revenue and income. 40

1Q 2023 Preliminary Results Supplemental Additional Notes Page – 27 | Mortgage Finance (1) Noninterest expense includes corporate allocations of $24 million in 1Q 2023, $23 million in 4Q 2022, and $27 million in 1Q 2022. (2) 1st lien only. Updated home values derived using a combination of appraisals, Broker price opinion (BPOs), Automated Valuation Models (AVMs) and Metropolitan Statistical Area (MSA) level house price indices. Page – 31 | Results by Segment (2) Change in fair value of equity securities impacts the Insurance, Corporate Finance and Corporate and Other segments. The change reflects fair value adjustments to equity securities that are reported at fair value. Management believes the change in fair value of equity securities should be removed from select financial measures because it enables the reader to better understand the business’ ongoing ability to generate revenue and income. (3) Repositioning and other which are primarily related to the extinguishment of high-cost legacy debt, strategic activities and significant other one-time items, as applicable for respective periods or businesses. Page – 33 | Corporate and Other (2) Repositioning and other which are primarily related to the extinguishment of high-cost legacy debt, strategic activities and significant other one-time items, as applicable for respective periods or businesses. (3) Change in fair value of equity securities impacts the Corporate and Other segments. The change reflects fair value adjustments to equity securities that are reported at fair value. Management believes the change in fair value of equity securities should be removed from select financial measures because it enables the reader to better understand the business’ ongoing ability to generate revenue and income. (4) HFI legacy mortgage portfolio, HFI Ally Lending portfolio and HFI Ally Credit Card portfolio. (5) Intercompany loan related to activity between Insurance and Corporate for liquidity purposes from the wind down of the Demand Notes program. Includes loans held-for-sale. 41
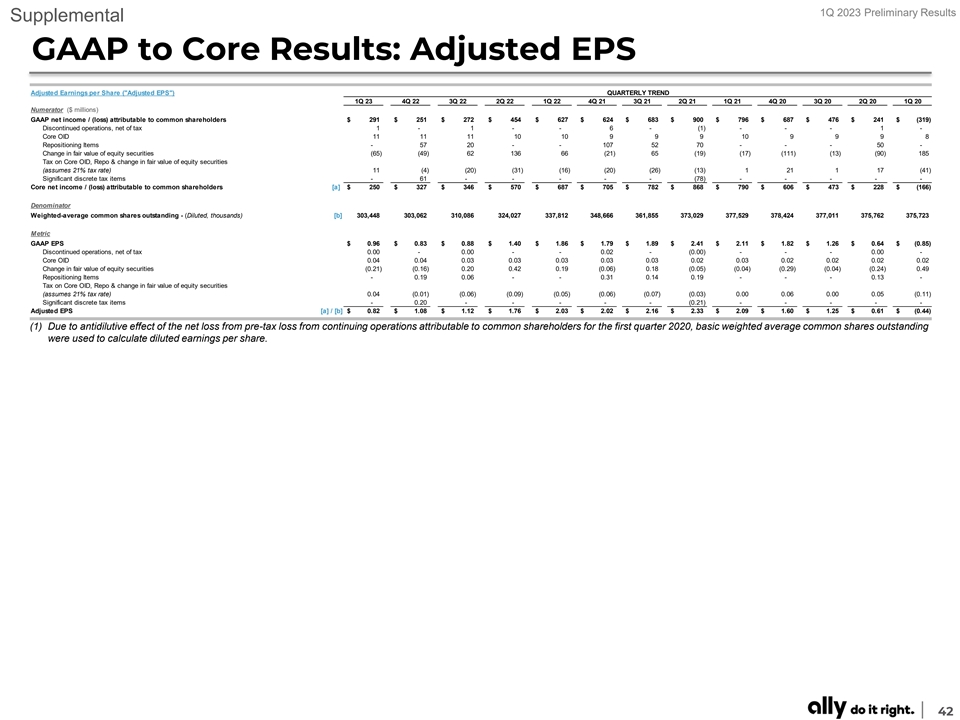
1Q 2023 Preliminary Results Supplemental GAAP to Core Results: Adjusted EPS Adjusted Earnings per Share ( Adjusted EPS ) QUARTERLY TREND 1Q 23 4Q 22 3Q 22 2Q 22 1Q 22 4Q 21 3Q 21 2Q 21 1Q 21 4Q 20 3Q 20 2Q 20 1Q 20 Numerator ($ millions) GAAP net income / (loss) attributable to common shareholders $ 291 $ 251 $ 272 $ 454 $ 627 $ 624 $ 683 $ 900 $ 796 $ 687 $ 476 $ 241 $ (319) Discontinued operations, net of tax 1 - 1 - - 6 - (1) - - - 1 - Core OID 11 11 11 10 10 9 9 9 10 9 9 9 8 Repositioning Items - 57 20 - - 107 52 70 - - - 50 - Change in fair value of equity securities ( 65) (49) 62 136 66 ( 21) 65 ( 19) ( 17) (111) ( 13) (90) 185 Tax on Core OID, Repo & change in fair value of equity securities (assumes 21% tax rate) 11 (4) ( 20) ( 31) (16) ( 20) ( 26) (13) 1 21 1 17 ( 41) Significant discrete tax items - 61 - - - - - ( 78) - - - - - Core net income / (loss) attributable to common shareholders [a] $ 250 $ 327 $ 346 $ 570 $ 687 $ 705 $ 782 $ 868 $ 790 $ 606 $ 473 $ 228 $ (166) Denominator Weighted-average common shares outstanding - (Diluted, thousands) [b] 3 03,448 3 03,062 3 10,086 3 24,027 3 37,812 348,666 361,855 3 73,029 3 77,529 3 78,424 377,011 3 75,762 375,723 Metric GAAP EPS $ 0.96 $ 0.83 $ 0.88 $ 1.40 $ 1.86 $ 1.79 $ 1.89 $ 2.41 $ 2.11 $ 1.82 $ 1.26 $ 0.64 $ (0.85) Discontinued operations, net of tax 0.00 - 0.00 - - 0.02 - (0.00) - - - 0.00 - Core OID 0.04 0.04 0.03 0.03 0.03 0.03 0.03 0.02 0.03 0.02 0.02 0.02 0.02 Change in fair value of equity securities (0.21) (0.16) 0.20 0.42 0.19 (0.06) 0.18 (0.05) (0.04) (0.29) (0.04) (0.24) 0.49 Repositioning Items - 0.19 0.06 - - 0.31 0.14 0.19 - - - 0.13 - Tax on Core OID, Repo & change in fair value of equity securities (assumes 21% tax rate) 0.04 (0.01) (0.06) (0.09) (0.05) (0.06) (0.07) (0.03) 0.00 0.06 0.00 0.05 (0.11) Significant discrete tax items - 0.20 - - - - - (0.21) - - - - - Adjusted EPS [a] / [b] $ 0.82 $ 1.08 $ 1.12 $ 1.76 $ 2.03 $ 2.02 $ 2.16 $ 2.33 $ 2.09 $ 1.60 $ 1.25 $ 0.61 $ (0.44) (1) Due to antidilutive effect of the net loss from pre-tax loss from continuing operations attributable to common shareholders for the first quarter 2020, basic weighted average common shares outstanding were used to calculate diluted earnings per share. 42
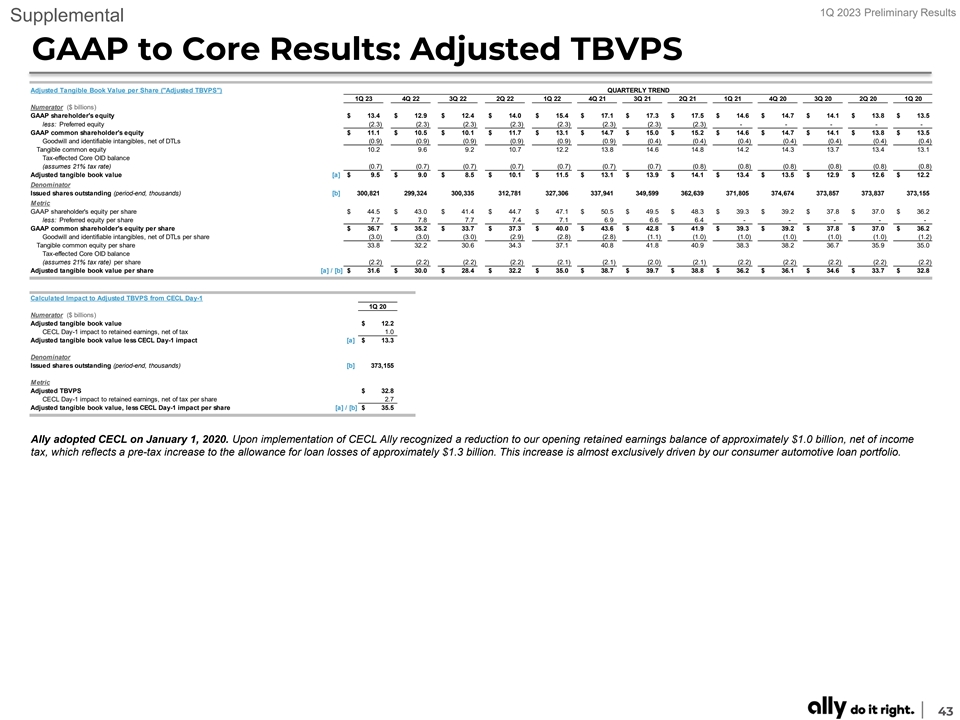
1Q 2023 Preliminary Results Supplemental GAAP to Core Results: Adjusted TBVPS Adjusted Tangible Book Value per Share ( Adjusted TBVPS ) QUARTERLY TREND 1Q 23 4Q 22 3Q 22 2Q 22 1Q 22 4Q 21 3Q 21 2Q 21 1Q 21 4Q 20 3Q 20 2Q 20 1Q 20 Numerator ($ billions) GAAP shareholder's equity $ 13.4 $ 12.9 $ 12.4 $ 14.0 $ 15.4 $ 17.1 $ 17.3 $ 17.5 $ 14.6 $ 14.7 $ 14.1 $ 13.8 $ 13.5 less: Preferred equity (2.3) (2.3) (2.3) ( 2.3) ( 2.3) (2.3) (2.3) (2.3) - - - - - GAAP common shareholder's equity $ 11.1 $ 10.5 $ 10.1 $ 11.7 $ 13.1 $ 14.7 $ 15.0 $ 15.2 $ 14.6 $ 14.7 $ 14.1 $ 13.8 $ 13.5 Goodwill and identifiable intangibles, net of DTLs (0.9) (0.9) (0.9) (0.9) (0.9) ( 0.9) (0.4) ( 0.4) (0.4) (0.4) (0.4) (0.4) ( 0.4) Tangible common equity 10.2 9 .6 9 .2 10.7 12.2 13.8 14.6 14.8 14.2 14.3 13.7 13.4 13.1 Tax-effected Core OID balance (assumes 21% tax rate) (0.7) (0.7) ( 0.7) (0.7) (0.7) (0.7) (0.7) (0.8) (0.8) (0.8) (0.8) ( 0.8) ( 0.8) Adjusted tangible book value [a] $ 9.5 $ 9.0 $ 8.5 $ 10.1 $ 11.5 $ 13.1 $ 13.9 $ 14.1 $ 13.4 $ 13.5 $ 12.9 $ 12.6 $ 12.2 Denominator Issued shares outstanding (period-end, thousands) [b] 3 00,821 2 99,324 300,335 312,781 3 27,306 337,941 349,599 362,639 371,805 3 74,674 373,857 373,837 373,155 Metric GAAP shareholder's equity per share $ 44.5 $ 43.0 $ 41.4 $ 44.7 $ 47.1 $ 50.5 $ 49.5 $ 48.3 $ 39.3 $ 39.2 $ 37.8 $ 37.0 $ 36.2 less: Preferred equity per share 7 .7 7.8 7 .7 7.4 7.1 6.9 6 .6 6 .4 - - - - - GAAP common shareholder's equity per share $ 36.7 $ 35.2 $ 33.7 $ 37.3 $ 40.0 $ 43.6 $ 42.8 $ 41.9 $ 39.3 $ 39.2 $ 37.8 $ 37.0 $ 36.2 Goodwill and identifiable intangibles, net of DTLs per share (3.0) (3.0) (3.0) ( 2.9) (2.8) ( 2.8) ( 1.1) (1.0) (1.0) ( 1.0) (1.0) (1.0) (1.2) Tangible common equity per share 33.8 32.2 30.6 34.3 37.1 40.8 41.8 40.9 38.3 38.2 36.7 35.9 35.0 Tax-effected Core OID balance (assumes 21% tax rate) per share (2.2) (2.2) (2.2) (2.2) (2.1) (2.1) (2.0) (2.1) (2.2) ( 2.2) ( 2.2) (2.2) (2.2) Adjusted tangible book value per share [a] / [b] $ 31.6 $ 30.0 $ 28.4 $ 32.2 $ 35.0 $ 38.7 $ 39.7 $ 38.8 $ 36.2 $ 36.1 $ 34.6 $ 33.7 $ 32.8 Calculated Impact to Adjusted TBVPS from CECL Day-1 1Q 20 Numerator ($ billions) Adjusted tangible book value $ 12.2 CECL Day-1 impact to retained earnings, net of tax 1.0 Adjusted tangible book value less CECL Day-1 impact [a] $ 13.3 Denominator Issued shares outstanding (period-end, thousands) [b] 373,155 Metric Adjusted TBVPS $ 32.8 CECL Day-1 impact to retained earnings, net of tax per share 2.7 Adjusted tangible book value, less CECL Day-1 impact per share [a] / [b] $ 35.5 Ally adopted CECL on January 1, 2020. Upon implementation of CECL Ally recognized a reduction to our opening retained earnings balance of approximately $1.0 billion, net of income tax, which reflects a pre-tax increase to the allowance for loan losses of approximately $1.3 billion. This increase is almost exclusively driven by our consumer automotive loan portfolio. 43
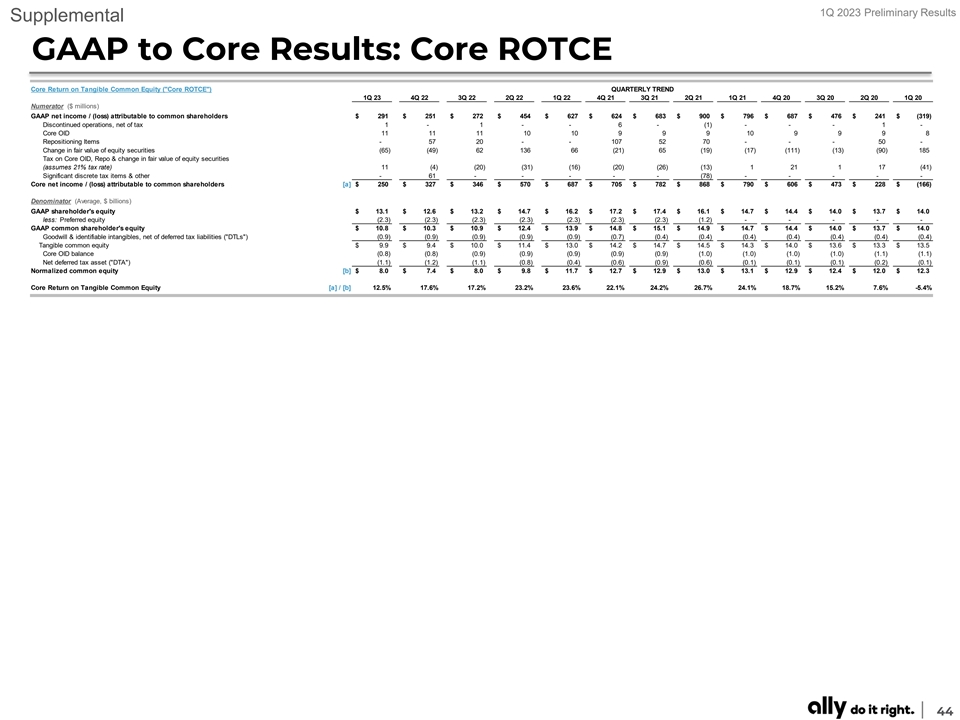
1Q 2023 Preliminary Results Supplemental GAAP to Core Results: Core ROTCE Core Return on Tangible Common Equity ( Core ROTCE ) QUARTERLY TREND 1Q 23 4Q 22 3Q 22 2Q 22 1Q 22 4Q 21 3Q 21 2Q 21 1Q 21 4Q 20 3Q 20 2Q 20 1Q 20 Numerator ($ millions) GAAP net income / (loss) attributable to common shareholders $ 291 $ 251 $ 272 $ 454 $ 627 $ 624 $ 683 $ 900 $ 796 $ 687 $ 476 $ 241 $ (319) Discontinued operations, net of tax 1 - 1 - - 6 - (1) - - - 1 - Core OID 11 11 11 10 10 9 9 9 10 9 9 9 8 Repositioning Items - 57 20 - - 107 52 70 - - - 50 - Change in fair value of equity securities (65) (49) 62 136 66 (21) 65 ( 19) (17) (111) (13) ( 90) 185 Tax on Core OID, Repo & change in fair value of equity securities (assumes 21% tax rate) 11 (4) ( 20) ( 31) (16) ( 20) ( 26) (13) 1 21 1 17 (41) Significant discrete tax items & other - 61 - - - - - (78) - - - - - Core net income / (loss) attributable to common shareholders [a] $ 250 $ 327 $ 346 $ 570 $ 687 $ 705 $ 782 $ 868 $ 790 $ 606 $ 473 $ 228 $ (166) Denominator (Average, $ billions) GAAP shareholder's equity $ 13.1 $ 12.6 $ 13.2 $ 14.7 $ 16.2 $ 17.2 $ 17.4 $ 16.1 $ 14.7 $ 14.4 $ 14.0 $ 13.7 $ 14.0 less: Preferred equity ( 2.3) ( 2.3) ( 2.3) ( 2.3) (2.3) ( 2.3) (2.3) ( 1.2) - - - - - GAAP common shareholder's equity $ 10.8 $ 10.3 $ 10.9 $ 12.4 $ 13.9 $ 14.8 $ 15.1 $ 14.9 $ 14.7 $ 14.4 $ 14.0 $ 13.7 $ 14.0 Goodwill & identifiable intangibles, net of deferred tax liabilities ( DTLs ) (0.9) (0.9) ( 0.9) (0.9) ( 0.9) ( 0.7) ( 0.4) ( 0.4) (0.4) ( 0.4) ( 0.4) ( 0.4) (0.4) Tangible common equity $ 9.9 $ 9.4 $ 10.0 $ 11.4 $ 13.0 $ 14.2 $ 14.7 $ 14.5 $ 14.3 $ 14.0 $ 13.6 $ 13.3 $ 13.5 Core OID balance (0.8) ( 0.8) (0.9) ( 0.9) ( 0.9) ( 0.9) (0.9) ( 1.0) (1.0) ( 1.0) ( 1.0) (1.1) (1.1) Net deferred tax asset ( DTA ) (1.1) (1.2) ( 1.1) (0.8) (0.4) (0.6) ( 0.9) ( 0.6) ( 0.1) (0.1) (0.1) ( 0.2) ( 0.1) Normalized common equity [b] $ 8.0 $ 7.4 $ 8.0 $ 9.8 $ 11.7 $ 12.7 $ 12.9 $ 13.0 $ 13.1 $ 12.9 $ 12.4 $ 12.0 $ 12.3 Core Return on Tangible Common Equity [a] / [b] 12.5% 17.6% 17.2% 23.2% 23.6% 22.1% 24.2% 26.7% 24.1% 18.7% 15.2% 7.6% -5.4% 44
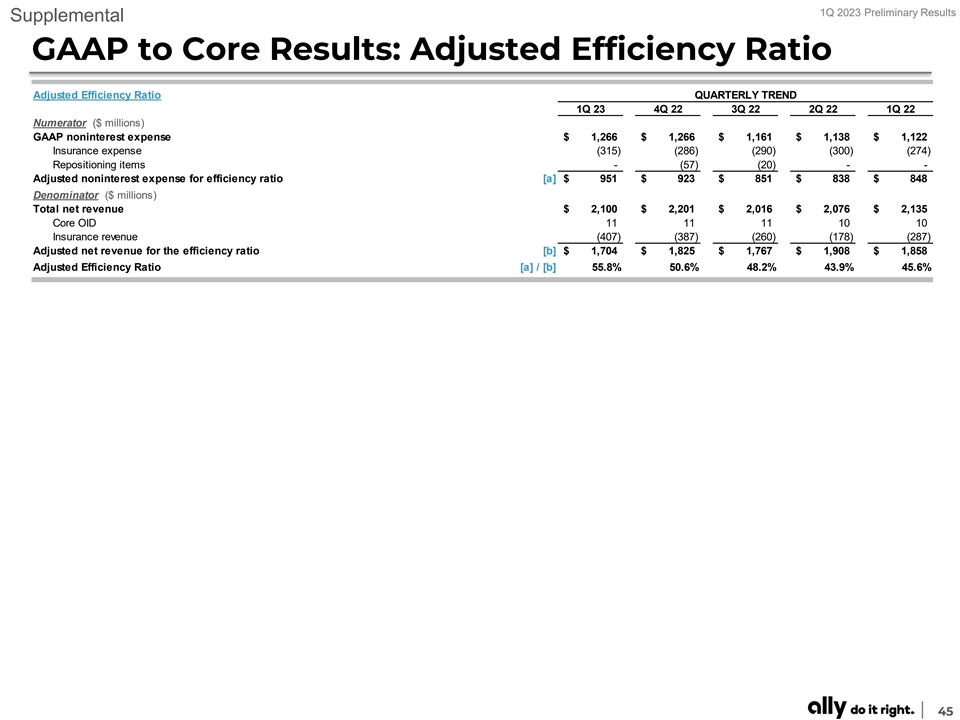
1Q 2023 Preliminary Results Supplemental GAAP to Core Results: Adjusted Efficiency Ratio Adjusted Efficiency Ratio QUARTERLY TREND 1Q 23 4Q 22 3Q 22 2Q 22 1Q 22 Numerator ($ millions) GAAP noninterest expense $ 1,266 $ 1,266 $ 1,161 $ 1,138 $ 1,122 Insurance expense (315) (286) (290) (300) (274) Repositioning items - (57) ( 20) - - Adjusted noninterest expense for efficiency ratio [a] $ 951 $ 923 $ 851 $ 838 $ 848 Denominator ($ millions) Total net revenue $ 2,100 $ 2,201 $ 2,016 $ 2,076 $ 2,135 Core OID 11 11 11 10 10 Insurance revenue (407) (387) (260) (178) (287) Adjusted net revenue for the efficiency ratio [b] $ 1,704 $ 1,825 $ 1,767 $ 1,908 $ 1,858 Adjusted Efficiency Ratio [a] / [b] 55.8% 50.6% 48.2% 43.9% 45.6% 45
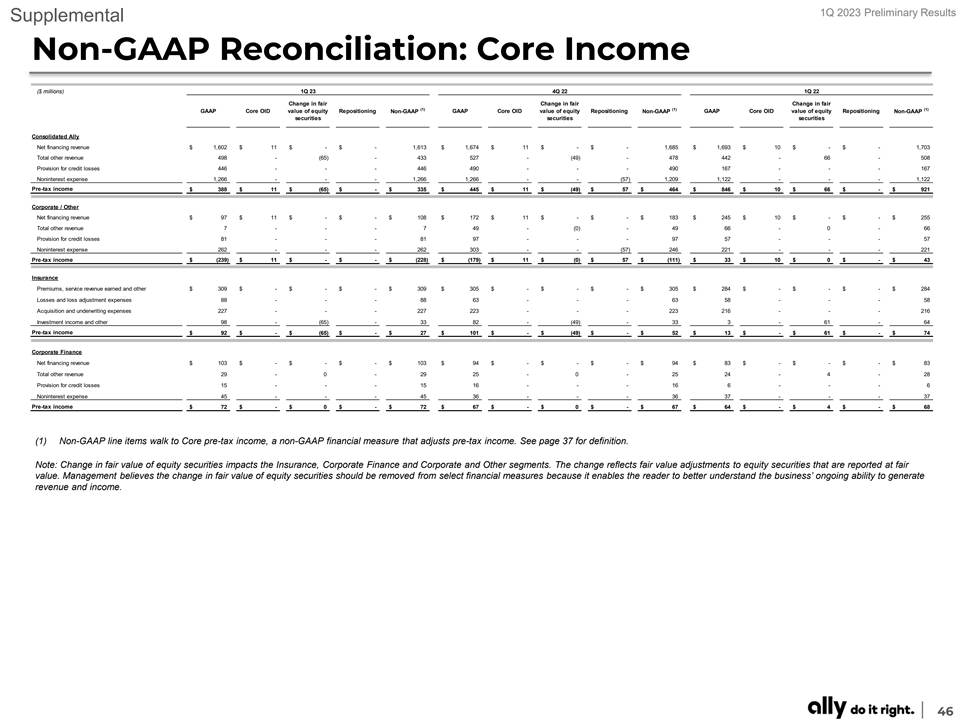
1Q 2023 Preliminary Results Supplemental Non-GAAP Reconciliation: Core Income ($ millions) 1Q 23 4Q 22 1Q 22 Change in fair Change in fair Change in fair (1) (1) (1) GAAP Core OID value of equity Repositioning Non-GAAP GAAP Core OID value of equity Repositioning Non-GAAP GAAP Core OID value of equity Repositioning Non-GAAP securities securities securities Consolidated Ally Net financing revenue $ 1,602 $ 11 $ - $ - 1 ,613 $ 1,674 $ 11 $ - $ - 1,685 $ 1,693 $ 10 $ - $ - 1 ,703 Total other revenue 498 - ( 65) - 433 527 - ( 49) - 478 442 - 66 - 508 Provision for credit losses 446 - - - 446 490 - - - 490 167 - - - 167 Noninterest expense 1 ,266 - - - 1,266 1,266 - - (57) 1,209 1,122 - - - 1 ,122 Pre-tax income $ 388 $ 11 $ (65) $ - $ 335 $ 445 $ 11 $ (49) $ 57 $ 464 $ 846 $ 10 $ 66 $ - $ 921 Corporate / Other Net financing revenue $ 97 $ 11 $ - $ - $ 108 $ 172 $ 11 $ - $ - $ 183 $ 245 $ 10 $ - $ - $ 255 Total other revenue 7 - - - 7 49 - (0) - 49 66 - 0 - 66 Provision for credit losses 81 - - - 81 97 - - - 97 57 - - - 57 Noninterest expense 262 - - - 262 303 - - (57) 246 221 - - - 221 Pre-tax income $ (239) $ 11 $ - $ - $ (228) $ (179) $ 11 $ (0) $ 57 $ (111) $ 33 $ 10 $ 0 $ - $ 43 Insurance Premiums, service revenue earned and other $ 309 $ - $ - $ - $ 309 $ 305 $ - $ - $ - $ 305 $ 284 $ - $ - $ - $ 284 Losses and loss adjustment expenses 88 - - - 88 63 - - - 63 58 - - - 58 Acquisition and underwriting expenses 227 - - - 227 223 - - - 223 216 - - - 216 Investment income and other 98 - (65) - 33 82 - (49) - 33 3 - 61 - 64 Pre-tax income $ 92 $ - $ (65) $ - $ 27 $ 101 $ - $ (49) $ - $ 52 $ 13 $ - $ 61 $ - $ 74 Corporate Finance Net financing revenue $ 103 $ - $ - $ - $ 103 $ 94 $ - $ - $ - $ 94 $ 83 $ - $ - $ - $ 83 Total other revenue 29 - 0 - 29 25 - 0 - 25 24 - 4 - 28 Provision for credit losses 15 - - - 15 16 - - - 16 6 - - - 6 Noninterest expense 45 - - - 45 36 - - - 36 37 - - - 37 Pre-tax income $ 72 $ - $ 0 $ - $ 72 $ 67 $ - $ 0 $ - $ 67 $ 64 $ - $ 4 $ - $ 68 (1) Non-GAAP line items walk to Core pre-tax income, a non-GAAP financial measure that adjusts pre-tax income. See page 37 for definition. Note: Change in fair value of equity securities impacts the Insurance, Corporate Finance and Corporate and Other segments. The change reflects fair value adjustments to equity securities that are reported at fair value. Management believes the change in fair value of equity securities should be removed from select financial measures because it enables the reader to better understand the business’ ongoing ability to generate revenue and income. 46
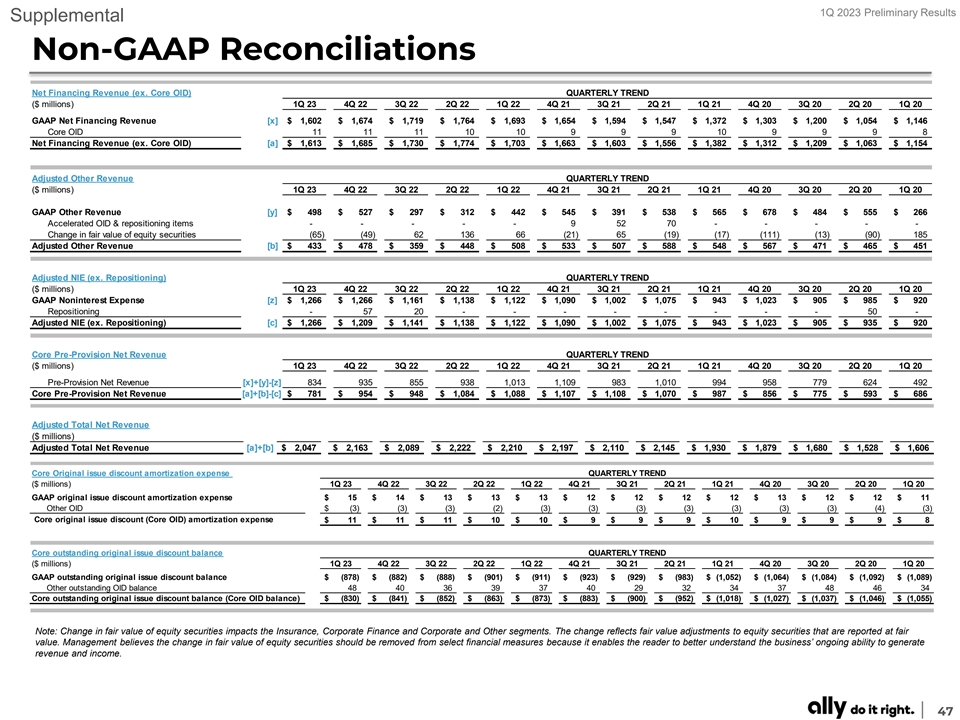
1Q 2023 Preliminary Results Supplemental Non-GAAP Reconciliations Net Financing Revenue (ex. Core OID) QUARTERLY TREND ($ millions) 1Q 23 4Q 22 3Q 22 2Q 22 1Q 22 4Q 21 3Q 21 2Q 21 1Q 21 4Q 20 3Q 20 2Q 20 1Q 20 GAAP Net Financing Revenue [x] $ 1,602 $ 1,674 $ 1,719 $ 1,764 $ 1,693 $ 1,654 $ 1,594 $ 1,547 $ 1,372 $ 1,303 $ 1,200 $ 1,054 $ 1 ,146 Core OID 11 11 11 10 10 9 9 9 10 9 9 9 8 Net Financing Revenue (ex. Core OID) [a] $ 1,613 $ 1,685 $ 1,730 $ 1,774 $ 1,703 $ 1 ,663 $ 1 ,603 $ 1 ,556 $ 1,382 $ 1 ,312 $ 1 ,209 $ 1 ,063 $ 1,154 Adjusted Other Revenue QUARTERLY TREND ($ millions) 1Q 23 4Q 22 3Q 22 2Q 22 1Q 22 4Q 21 3Q 21 2Q 21 1Q 21 4Q 20 3Q 20 2Q 20 1Q 20 GAAP Other Revenue [y] $ 498 $ 527 $ 297 $ 312 $ 442 $ 545 $ 391 $ 538 $ 565 $ 678 $ 484 $ 555 $ 266 Accelerated OID & repositioning items - - - - - 9 52 70 - - - - - Change in fair value of equity securities (65) (49) 62 136 66 (21) 65 (19) (17) (111) (13) (90) 185 Adjusted Other Revenue [b] $ 433 $ 478 $ 359 $ 448 $ 508 $ 533 $ 507 $ 588 $ 548 $ 567 $ 471 $ 465 $ 451 Adjusted NIE (ex. Repositioning) QUARTERLY TREND ($ millions) 1Q 23 4Q 22 3Q 22 2Q 22 1Q 22 4Q 21 3Q 21 2Q 21 1Q 21 4Q 20 3Q 20 2Q 20 1Q 20 GAAP Noninterest Expense [z] $ 1,266 $ 1,266 $ 1,161 $ 1,138 $ 1,122 $ 1,090 $ 1,002 $ 1,075 $ 943 $ 1,023 $ 905 $ 985 $ 920 Repositioning - 57 20 - - - - - - - - 50 - Adjusted NIE (ex. Repositioning) [c] $ 1,266 $ 1,209 $ 1,141 $ 1,138 $ 1,122 $ 1,090 $ 1,002 $ 1 ,075 $ 943 $ 1,023 $ 905 $ 935 $ 920 Core Pre-Provision Net Revenue QUARTERLY TREND ($ millions) 1Q 23 4Q 22 3Q 22 2Q 22 1Q 22 4Q 21 3Q 21 2Q 21 1Q 21 4Q 20 3Q 20 2Q 20 1Q 20 Pre-Provision Net Revenue [x]+[y]-[z] 834 935 855 938 1 ,013 1,109 983 1,010 994 958 779 624 492 Core Pre-Provision Net Revenue [a]+[b]-[c] $ 781 $ 954 $ 948 $ 1,084 $ 1,088 $ 1 ,107 $ 1 ,108 $ 1 ,070 $ 987 $ 856 $ 775 $ 593 $ 686 Adjusted Total Net Revenue ($ millions) Adjusted Total Net Revenue [a]+[b] $ 2,047 $ 2,163 $ 2,089 $ 2,222 $ 2,210 $ 2 ,197 $ 2 ,110 $ 2,145 $ 1 ,930 $ 1,879 $ 1,680 $ 1,528 $ 1 ,606 Core Original issue discount amortization expense QUARTERLY TREND ($ millions) 1Q 23 4Q 22 3Q 22 2Q 22 1Q 22 4Q 21 3Q 21 2Q 21 1Q 21 4Q 20 3Q 20 2Q 20 1Q 20 GAAP original issue discount amortization expense $ 15 $ 14 $ 13 $ 13 $ 13 $ 12 $ 12 $ 12 $ 12 $ 13 $ 12 $ 12 $ 11 Other OID $ (3) (3) (3) (2) (3) (3) (3) (3) (3) (3) (3) (4) (3) Core original issue discount (Core OID) amortization expense $ 11 $ 11 $ 11 $ 10 $ 10 $ 9 $ 9 $ 9 $ 10 $ 9 $ 9 $ 9 $ 8 11.44717 11.03419 10.62108 10.22349 9.84083 9.488234 9.223518 9.293366 9.530045 9.450602 9.126675 8.76168 8.311428 Core outstanding original issue discount balance QUARTERLY TREND ($ millions) 1Q 23 4Q 22 3Q 22 2Q 22 1Q 22 4Q 21 3Q 21 2Q 21 1Q 21 4Q 20 3Q 20 2Q 20 1Q 20 GAAP outstanding original issue discount balance $ ( 878) $ ( 882) $ ( 888) $ (901) $ ( 911) $ ( 923) $ (929) $ (983) $ (1,052) $ (1,064) $ (1,084) $ (1,092) $ (1,089) Other outstanding OID balance 48 40 36 39 37 40 29 32 34 37 48 46 34 Core outstanding original issue discount balance (Core OID balance) $ ( 830) $ (841) $ ( 852) $ (863) $ ( 873) $ ( 883) $ (900) $ ( 952) $ (1,018) $ (1,027) $ (1,037) $ (1,046) $ (1,055) Note: Change in fair value of equity securities impacts the Insurance, Corporate Finance and Corporate and Other segments. The change reflects fair value adjustments to equity securities that are reported at fair value. Management believes the change in fair value of equity securities should be removed from select financial measures because it enables the reader to better understand the business’ ongoing ability to generate revenue and income. 47