Exhibit 99.3 FIRST QUARTER 2023 FINANCIAL SUPPLEMENT
ALLY FINANCIAL INC. FORWARD-LOOKING STATEMENTS AND ADDITIONAL INFORMATION This document and related communications should be read in conjunction with the financial statements, notes, and other information contained in our Annual Reports on Form 10-K, Quarterly Reports on Form 10-Q, and Current Reports on Form 8-K. This information is preliminary and based on company and third-party data available at the time of the presentation or related communication. This document and related communications contain forward-looking statements within the meaning of the Private Securities Litigation Reform Act of 1995. These statements can be identified by the fact that they do not relate strictly to historical or current facts—such as statements about the outlook for financial and operating metrics, and future capital allocation and actions. Forward-looking statements often use words such as “believe,” “expect,” “anticipate,” “intend,” “pursue,” “seek,” “continue,” “estimate,” “project,” “outlook,” “forecast,” “potential,” “target,” “objective,” “trend,” “plan,” “goal,” “initiative,” “priorities,” or other words of comparable meaning or future-tense or conditional verbs such as “may,” “will,” “should,” “would,” or “could.” Forward-looking statements convey our expectations, intentions, or forecasts about future events, circumstances, or results. All forward-looking statements, by their nature, are subject to assumptions, risks, and uncertainties, which may change over time and many of which are beyond our control. You should not rely on any forward-looking statement as a prediction or guarantee about the future. Actual future objectives, strategies, plans, prospects, performance, conditions, or results may differ materially from those set forth in any forward-looking statement. Some of the factors that may cause actual results or other future events or circumstances to differ from those in forward-looking statements are described in our Annual Report on Form 10-K for the year ended December 31, 2022, our subsequent Quarterly Reports on Form 10-Q or Current Reports on Form 8-K, or other applicable documents that are filed or furnished with the U.S. Securities and Exchange Commission (collectively, our “SEC filings”). Any forward-looking statement made by us or on our behalf speaks only as of the date that it was made. We do not undertake to update any forward-looking statement to reflect the impact of events, circumstances, or results that arise after the date that the statement was made, except as required by applicable securities laws. You, however, should consult further disclosures (including disclosures of a forward-looking nature) that we may make in any subsequent SEC filings. This document and related communications contain specifically identified non-GAAP financial measures, which supplement the results that are reported according to U.S. generally accepted accounting principles (“GAAP”). These non-GAAP financial measures may be useful to investors but should not be viewed in isolation from, or as a substitute for, GAAP results. Differences between non-GAAP financial measures and comparable GAAP financial measures are reconciled in the presentation. Unless the context otherwise requires, the following definitions apply. The term “loans” means the following consumer and commercial products associated with our direct and indirect financing activities: loans, retail installment sales contracts, lines of credit, and other financing products excluding operating leases. The term “operating leases” means consumer- and commercial-vehicle lease agreements where Ally is the lessor and the lessee is generally not obligated to acquire ownership of the vehicle at lease-end or compensate Ally for the vehicle’s residual value. The terms “lend,” “finance,” and “originate” mean our direct extension or origination of loans, our purchase or acquisition of loans, or our purchase of operating leases, as applicable. The term “consumer” means all consumer products associated with our loan and operating-lease activities and all commercial retail installment sales contracts. The term “commercial” means all commercial products associated with our loan activities, other than commercial retail installment sales contracts. The term “partnerships” means business arrangements rather than partnerships as defined by law. 1Q 2023 Preliminary Results2
ALLY FINANCIAL INC. TABLE OF CONTENTS Page(s) Consolidated Results Consolidated Financial Highlights 4 Consolidated Income Statement 5 Consolidated Period-End Balance Sheet 6 Consolidated Average Balance Sheet 7 Segment Detail Segment Highlights 8 Automotive Finance 9-10 Insurance 11 Mortgage Finance 12 Corporate Finance 13 Corporate and Other 14 Credit Related Information 15-16 Supplemental Detail Capital 17 Liquidity and Deposits 18 Net Interest Margin 19 Ally Bank Consumer Mortgage HFI Portfolios 20 Earnings Per Share Related Information 21 Adjusted Tangible Book Per Share Related Information 22 Core ROTCE Related Information 23 Adjusted Efficiency Ratio Related Information 24 1Q 2023 Preliminary Results3
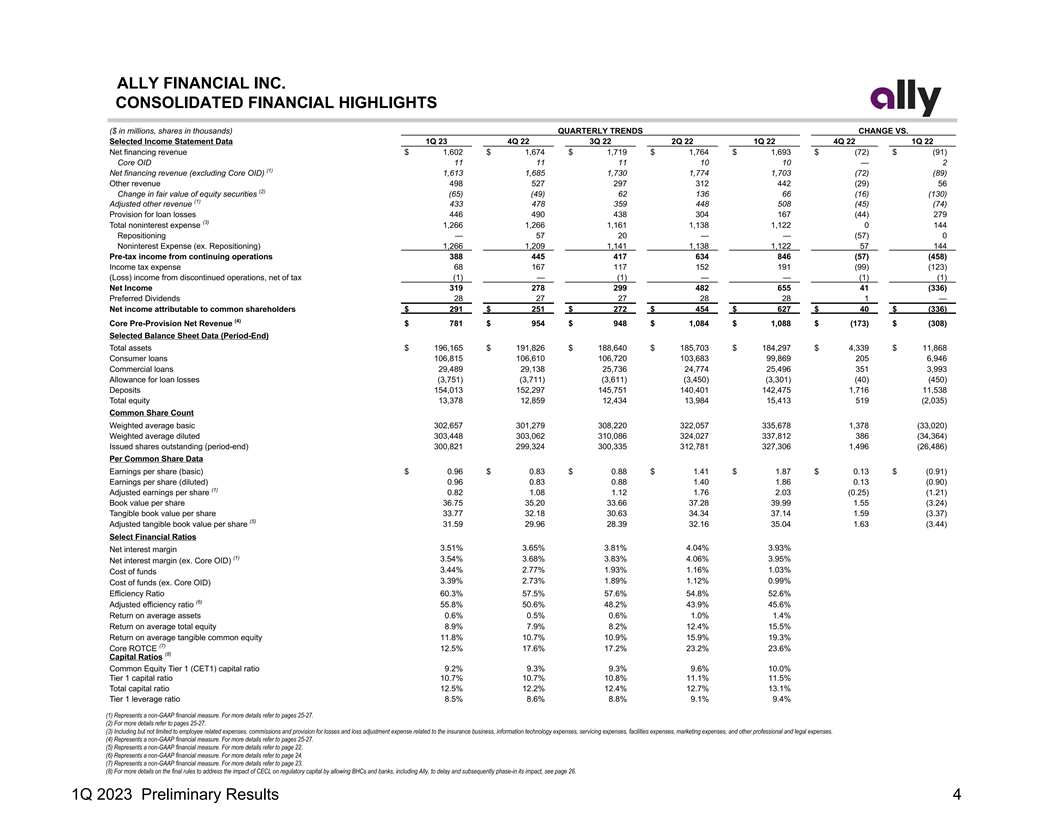
ALLY FINANCIAL INC. CONSOLIDATED FINANCIAL HIGHLIGHTS ($ in millions, shares in thousands) QUARTERLY TRENDS CHANGE VS. Selected Income Statement Data 1Q 23 4Q 22 3Q 22 2Q 22 1Q 22 4Q 22 1Q 22 Net financing revenue $ 1,602 $ 1,674 $ 1,719 $ 1,764 $ 1,693 $ (72) $ (91) Core OID 11 11 11 10 10 — 2 (1) Net financing revenue (excluding Core OID) 1,613 1,685 1,730 1,774 1,703 (72) (89) Other revenue 498 527 297 312 442 (29) 56 (2) Change in fair value of equity securities (65) (49) 62 136 66 (16) (130) (1) Adjusted other revenue 433 478 359 448 508 (45) (74) Provision for loan losses 446 490 438 304 167 (44) 279 (3) Total noninterest expense 1,266 1,266 1,161 1,138 1,122 0 144 Repositioning — 57 20 — — (57) 0 Noninterest Expense (ex. Repositioning) 1,266 1,209 1,141 1,138 1,122 57 144 Pre-tax income from continuing operations 388 445 417 634 846 (57) (458) Income tax expense 68 167 117 152 191 (99) (123) (Loss) income from discontinued operations, net of tax (1) — (1) — — (1) (1) Net Income 319 278 299 482 655 41 (336) Preferred Dividends 28 27 27 28 28 1 — Net income attributable to common shareholders $ 291 $ 251 $ 272 $ 454 $ 627 $ 40 $ (336) (4) Core Pre-Provision Net Revenue $ 781 $ 954 $ 948 $ 1,084 $ 1,088 $ (173) $ (308) Selected Balance Sheet Data (Period-End) Total assets $ 196,165 $ 191,826 $ 188,640 $ 185,703 $ 184,297 $ 4,339 $ 11,868 Consumer loans 106,815 106,610 106,720 103,683 99,869 205 6,946 Commercial loans 29,489 29,138 25,736 24,774 25,496 351 3,993 Allowance for loan losses (3,751) (3,711) (3,611) (3,450) (3,301) (40) (450) Deposits 154,013 152,297 145,751 140,401 142,475 1,716 11,538 Total equity 13,378 12,859 12,434 13,984 15,413 519 (2,035) Common Share Count Weighted average basic 302,657 301,279 308,220 322,057 335,678 1,378 (33,020) Weighted average diluted 303,448 303,062 310,086 324,027 337,812 386 (34,364) Issued shares outstanding (period-end) 300,821 299,324 300,335 312,781 327,306 1,496 (26,486) Per Common Share Data Earnings per share (basic) $ 0.96 $ 0.83 $ 0.88 $ 1.41 $ 1.87 $ 0.13 $ (0.91) Earnings per share (diluted) 0.96 0.83 0.88 1.40 1.86 0.13 (0.90) (1) Adjusted earnings per share 0.82 1.08 1.12 1.76 2.03 (0.25) (1.21) Book value per share 36.75 35.20 33.66 37.28 39.99 1.55 (3.24) Tangible book value per share 33.77 32.18 30.63 34.34 37.14 1.59 (3.37) (5) Adjusted tangible book value per share 31.59 29.96 28.39 32.16 35.04 1.63 (3.44) Select Financial Ratios 3 .51 % 3.65 % 3.81% 4.04% 3 .93 % Net interest margin (1) 3 .54 % 3 .68% 3 .83% 4.06% 3.95 % Net interest margin (ex. Core OID) 3 .44% 2.77 % 1.93 % 1 .16% 1 .03 % Cost of funds 3 .39 % 2.73 % 1.89 % 1 .12 % 0.99% Cost of funds (ex. Core OID) Efficiency Ratio 6 0.3 % 5 7.5% 57.6% 5 4.8% 52.6% (6) Adjusted efficiency ratio 55.8 % 5 0.6% 4 8.2% 4 3.9 % 4 5.6% Return on average assets 0.6% 0 .5% 0.6% 1.0% 1 .4 % Return on average total equity 8.9% 7 .9% 8.2% 12.4% 1 5.5% Return on average tangible common equity 11.8 % 1 0.7% 1 0.9 % 15.9% 1 9.3 % (7) Core ROTCE 12.5% 17.6% 1 7.2% 23.2% 2 3.6% (8) Capital Ratios Common Equity Tier 1 (CET1) capital ratio 9.2% 9.3% 9.3% 9.6% 10.0 % Tier 1 capital ratio 1 0.7 % 1 0.7% 1 0.8 % 1 1.1% 1 1.5% Total capital ratio 1 2.5% 1 2.2% 12.4% 1 2.7% 13.1 % Tier 1 leverage ratio 8.5% 8 .6% 8.8% 9 .1% 9 .4 % (1) Represents a non-GAAP financial measure. For more details refer to pages 25-27. (2) For more details refer to pages 25-27. (3) Including but not limited to employee related expenses, commissions and provision for losses and loss adjustment expense related to the insurance business, information technology expenses, servicing expenses, facilities expenses, marketing expenses, and other professional and legal expenses. (4) Represents a non-GAAP financial measure. For more details refer to pages 25-27. (5) Represents a non-GAAP financial measure. For more details refer to page 22. (6) Represents a non-GAAP financial measure. For more details refer to page 24. (7) Represents a non-GAAP financial measure. For more details refer to page 23. (8) For more details on the final rules to address the impact of CECL on regulatory capital by allowing BHCs and banks, including Ally, to delay and subsequently phase-in its impact, see page 26. 1Q 2023 Preliminary Results4
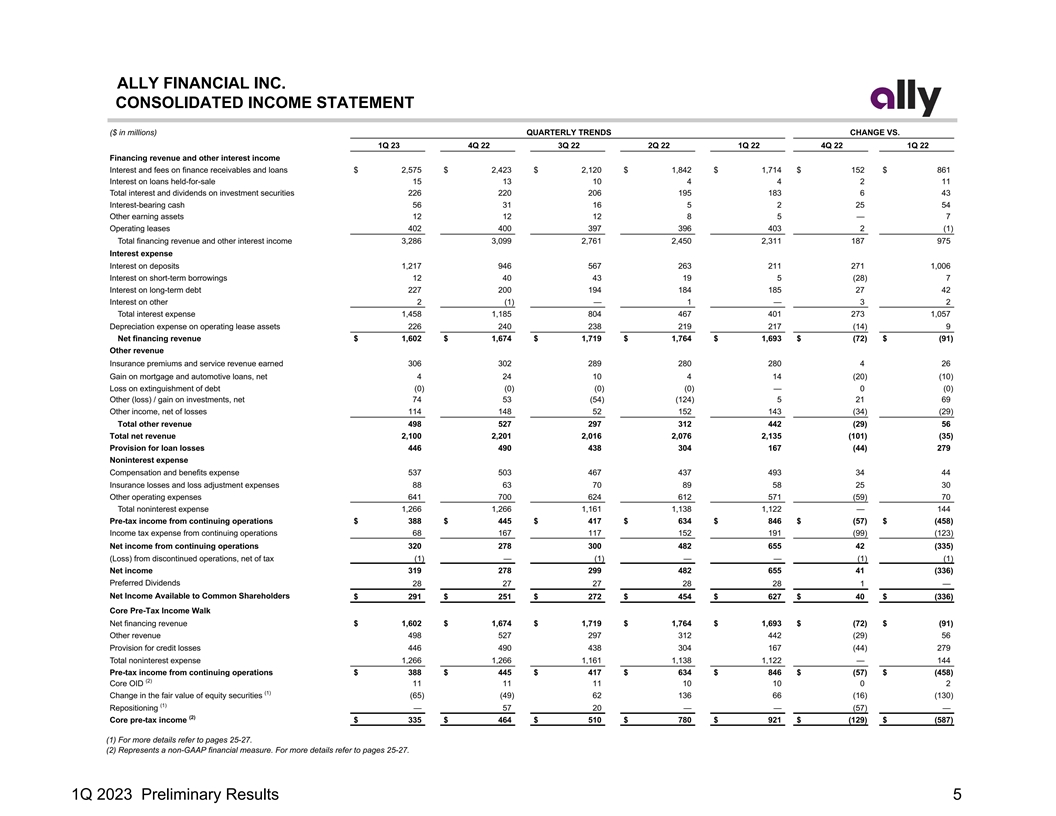
ALLY FINANCIAL INC. CONSOLIDATED INCOME STATEMENT ($ in millions) QUARTERLY TRENDS CHANGE VS. 1Q 23 4Q 22 3Q 22 2Q 22 1Q 22 4Q 22 1Q 22 Financing revenue and other interest income Interest and fees on finance receivables and loans $ 2,575 $ 2,423 $ 2,120 $ 1,842 $ 1,714 $ 152 $ 861 Interest on loans held-for-sale 15 13 10 4 4 2 11 Total interest and dividends on investment securities 226 220 206 195 183 6 43 Interest-bearing cash 56 31 16 5 2 25 54 Other earning assets 12 12 12 8 5 — 7 Operating leases 402 400 397 396 403 2 (1) Total financing revenue and other interest income 3,286 3,099 2,761 2,450 2,311 187 975 Interest expense Interest on deposits 1,217 946 567 263 211 271 1,006 Interest on short-term borrowings 12 40 43 19 5 (28) 7 Interest on long-term debt 227 200 194 184 185 27 42 Interest on other 2 (1) — 1 — 3 2 Total interest expense 1,458 1,185 804 467 401 273 1,057 Depreciation expense on operating lease assets 226 240 238 219 217 (14) 9 Net financing revenue $ 1,602 $ 1,674 $ 1,719 $ 1,764 $ 1,693 $ (72) $ (91) Other revenue Insurance premiums and service revenue earned 306 302 289 280 280 4 26 Gain on mortgage and automotive loans, net 4 24 10 4 14 (20) (10) Loss on extinguishment of debt (0) (0) (0) (0) — 0 (0) Other (loss) / gain on investments, net 74 53 (54) (124) 5 21 69 Other income, net of losses 114 148 52 152 143 (34) (29) Total other revenue 498 527 297 312 442 (29) 56 Total net revenue 2,100 2,201 2,016 2,076 2,135 (101) (35) Provision for loan losses 446 490 438 304 167 (44) 279 Noninterest expense Compensation and benefits expense 537 503 467 437 493 34 44 Insurance losses and loss adjustment expenses 88 63 70 89 58 25 30 Other operating expenses 641 700 624 612 571 (59) 70 Total noninterest expense 1,266 1,266 1,161 1,138 1,122 — 144 Pre-tax income from continuing operations $ 388 $ 445 $ 417 $ 634 $ 846 $ (57) $ (458) Income tax expense from continuing operations 68 167 117 152 191 (99) (123) Net income from continuing operations 320 278 300 482 655 42 (335) (Loss) from discontinued operations, net of tax (1) — (1) — — (1) (1) Net income 319 278 299 482 655 41 (336) Preferred Dividends 28 27 27 28 28 1 — Net Income Available to Common Shareholders $ 291 $ 251 $ 272 $ 454 $ 627 $ 40 $ (336) Core Pre-Tax Income Walk Net financing revenue $ 1,602 $ 1,674 $ 1,719 $ 1,764 $ 1,693 $ (72) $ (91) Other revenue 498 527 297 312 442 (29) 56 Provision for credit losses 446 490 438 304 167 (44) 279 Total noninterest expense 1,266 1,266 1,161 1,138 1,122 — 144 Pre-tax income from continuing operations $ 388 $ 445 $ 417 $ 634 $ 846 $ (57) $ (458) (2) Core OID 11 11 11 10 10 0 2 (1) Change in the fair value of equity securities (65) (49) 62 136 66 (16) (130) (1) Repositioning — 57 20 — — (57) — (2) Core pre-tax income $ 335 $ 464 $ 510 $ 780 $ 921 $ (129) $ (587) (1) For more details refer to pages 25-27. (2) Represents a non-GAAP financial measure. For more details refer to pages 25-27. 1Q 2023 Preliminary Results5

ALLY FINANCIAL INC. CONSOLIDATED PERIOD-END BALANCE SHEET ($ in millions) QUARTERLY TRENDS CHANGE VS. Assets 1Q 23 4Q 22 3Q 22 2Q 22 1Q 22 4Q 22 1Q 22 Cash and cash equivalents Noninterest-bearing $ 554 $ 542 $ 638 $ 801 $ 470 $ 12 $ 84 Interest-bearing 9,226 5,029 4,366 3,366 3,462 4,197 5,764 Total cash and cash equivalents 9,780 5,571 5,004 4,167 3,932 4,209 5,848 (1) Investment securities 31,215 31,284 31,344 33,590 35,413 (69) (4,198) Loans held-for-sale, net 524 654 808 798 471 (130) 53 Finance receivables and loans, net 136,304 135,748 132,456 128,457 125,365 556 10,939 Allowance for loan losses (3,751) (3,711) (3,611) (3,450) (3,301) (40) (450) Total finance receivables and loans, net 132,553 132,037 128,845 125,007 122,064 516 10,489 Investment in operating leases, net 10,236 10,444 10,577 10,516 10,730 (208) (494) Premiums receivables and other insurance assets 2,713 2,698 2,719 2,743 2,730 15 (17) Other assets 9,144 9,138 9,343 8,882 8,957 6 187 Total assets $ 196,165 $ 191,826 $ 188,640 $ 185,703 $ 184,297 $ 4,339 $ 11,868 Liabilities Deposit liabilities Noninterest-bearing $ 174 $ 185 $ 220 $ 185 $ 175 $ (11) $ (1) Interest-bearing 153,839 152,112 145,531 140,216 142,300 1,727 11,539 Total deposit liabilities 154,013 152,297 145,751 140,401 142,475 1,716 11,538 Short-term borrowings 1,455 2,399 7,200 7,775 3,950 (944) (2,495) Long-term debt 20,480 17,762 16,628 16,984 15,885 2,718 4,595 Interest payable 759 408 484 270 302 351 457 Unearned insurance premiums and service revenue 3,455 3,453 3,468 3,490 3,500 2 (45) Accrued expense and other liabilities 2,625 2,648 2,675 2,799 2,772 (23) (147) Total liabilities $ 182,787 $ 178,967 $ 176,206 $ 171,719 $ 168,884 $ 3,820 $ 13,903 Equity (2) Common stock and paid-in capital $ 15,015 $ 14,978 $ 14,994 $ 15,390 $ 15,956 $ 37 $ (941) Preferred stock 2,324 2,324 2,324 2,324 2,324 — — Accumulated deficit (185) (384) (544) (721) (1,076) 199 891 Accumulated other comprehensive income / (loss) (3,776) (4,059) (4,340) (3,009) (1,791) 283 (1,985) Total equity 13,378 12,859 12,434 13,984 15,413 519 (2,035) Total liabilities and equity $ 196,165 $ 191,826 $ 188,640 $ 185,703 $ 184,297 $ 4,339 $ 11,868 (1) Includes Held-to-maturity securities. (2) Includes Treasury stock. 1Q 2023 Preliminary Results6

ALLY FINANCIAL INC. (1) CONSOLIDATED AVERAGE BALANCE SHEET ($ in millions) QUARTERLY TRENDS CHANGE VS. Assets 1Q 23 4Q 22 3Q 22 2Q 22 1Q 22 4Q 22 1Q 22 Interest-bearing cash and cash equivalents $ 5,731 $ 4,129 $ 3,627 $ 3,761 $ 4,027 $ 1,602 $ 1,704 Investment securities and other earning assets 32,168 32,131 34,166 34,679 36,664 37 (4,496) Loans held-for-sale, net 738 722 748 420 570 16 168 (2) Total finance receivables and loans, net 135,819 134,170 129,996 125,628 122,772 1,649 13,047 Investment in operating leases, net 10,435 10,546 10,588 10,615 10,878 (111) (443) Total interest earning assets 184,891 181,698 179,125 175,103 174,911 3,193 9,980 Noninterest-bearing cash and cash equivalents 333 395 503 343 422 (62) (89) Other assets 10,817 11,082 10,338 10,510 9,825 (265) 992 Allowance for loan losses (3,729) (3,641) (3,494) (3,339) (3,279) (88) (450) Total assets $ 192,312 $ 189,534 $ 186,472 $ 182,617 $ 181,879 $ 2,778 $ 10,433 Liabilities Interest-bearing deposit liabilities Retail deposit liabilities $ 138,071 $ 135,340 $ 131,868 $ 132,111 $ 135,046 $ 2,731 $ 3,025 (3) Other interest-bearing deposit liabilities 14,503 12,933 10,717 7,522 6,340 1,570 8,163 Total Interest-bearing deposit liabilities 152,573 148,273 142,586 139,633 141,387 4,300 11,186 Short-term borrowings 1,024 4,169 6,266 5,695 980 (3,145) 44 (4) Long-term debt 18,389 17,282 16,798 16,231 16,410 1,107 1,979 (4) Total interest-bearing liabilities 171,986 169,724 165,650 161,559 158,777 2,262 13,209 Noninterest-bearing deposit liabilities 179 212 207 181 171 (33) 8 Other liabilities 6,662 6,809 6,435 6,408 6,772 (147) (110) Total liabilities $ 178,827 $ 176,745 $ 172,292 $ 168,148 $ 165,720 $ 2,082 $ 13,107 Equity Total equity $ 13,485 $ 12,789 $ 14,180 $ 14,469 $ 16,159 $ 696 $ (2,674) Total liabilities and equity $ 192,312 $ 189,534 $ 186,472 $ 182,617 $ 181,879 $ 2,778 $ 10,433 (1) Average balances are calculated using a combination of monthly and daily average methodologies. (2) Nonperforming finance receivables and loans are included in the average balances net of unearned income, unamortized premiums and discounts, and deferred fees and costs. (3) Includes brokered (inclusive of sweep deposits) and other deposits (inclusive of mortgage escrow and other deposits). (4) Includes average Core OID balance of $835 million in 1Q23, $847 million in 4Q22, $858 million in 3Q22, $868 million in 2Q22, and $878 million in 1Q22. 1Q 2023 Preliminary Results7
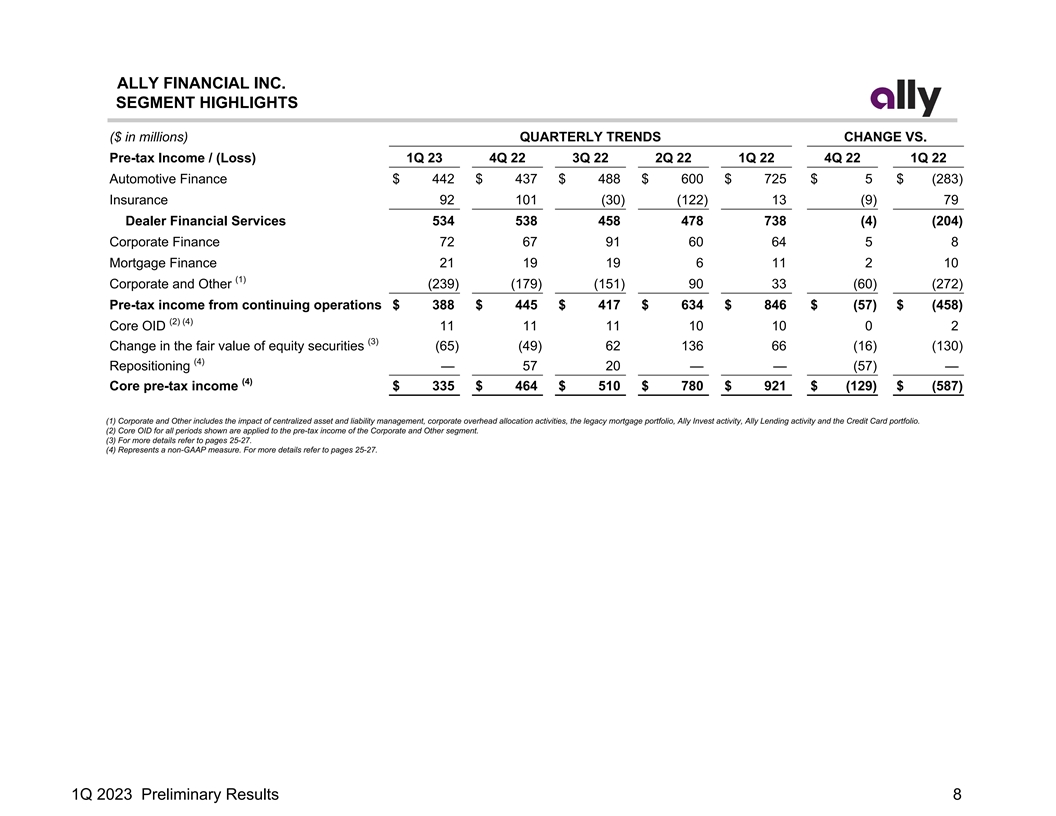
ALLY FINANCIAL INC. SEGMENT HIGHLIGHTS ($ in millions) QUARTERLY TRENDS CHANGE VS. Pre-tax Income / (Loss) 1Q 23 4Q 22 3Q 22 2Q 22 1Q 22 4Q 22 1Q 22 Automotive Finance $ 442 $ 437 $ 488 $ 600 $ 725 $ 5 $ (283) Insurance 92 101 (30) (122) 13 (9) 79 Dealer Financial Services 534 538 458 478 738 (4) (204) Corporate Finance 72 67 91 60 64 5 8 Mortgage Finance 21 19 19 6 11 2 10 (1) Corporate and Other (239) (179) (151) 90 33 (60) (272) Pre-tax income from continuing operations $ 388 $ 445 $ 417 $ 634 $ 846 $ (57) $ (458) (2) (4) Core OID 11 11 11 10 10 0 2 (3) Change in the fair value of equity securities (65) (49) 62 136 66 (16) (130) (4) Repositioning — 57 20 — — (57) — (4) Core pre-tax income $ 335 $ 464 $ 510 $ 780 $ 921 $ (129) $ (587) (1) Corporate and Other includes the impact of centralized asset and liability management, corporate overhead allocation activities, the legacy mortgage portfolio, Ally Invest activity, Ally Lending activity and the Credit Card portfolio. (2) Core OID for all periods shown are applied to the pre-tax income of the Corporate and Other segment. (3) For more details refer to pages 25-27. (4) Represents a non-GAAP measure. For more details refer to pages 25-27. 1Q 2023 Preliminary Results8

ALLY FINANCIAL INC. AUTOMOTIVE FINANCE - CONDENSED FINANCIAL STATEMENTS ($ in millions) QUARTERLY TRENDS CHANGE VS. Income Statement 1Q 23 4Q 22 3Q 22 2Q 22 1Q 22 4Q 22 1Q 22 Net financing revenue Consumer $ 1,576 $ 1,555 $ 1,461 $ 1,362 $ 1,302 $ 21 $ 274 Commercial 299 252 189 142 129 47 170 Loans held-for-sale 3 2 — — — 1 3 Operating leases 402 400 397 396 403 2 (1) Total financing revenue and other interest income 2,280 2,209 2,047 1,900 1,834 71 446 Interest expense 732 644 506 380 322 88 410 Depreciation expense on operating lease assets: Depreciation expense on operating lease assets (ex. remarketing) 272 271 277 269 266 2 7 Remarketing gains 47 31 39 50 50 16 (3) Total depreciation expense on operating lease assets 226 240 238 219 217 (14) 9 Net financing revenue 1,322 1,325 1,303 1,301 1,295 (3) 27 Other revenue Total other revenue 77 92 74 72 68 (15) 9 Total net revenue 1,399 1,417 1,377 1,373 1,363 (18) 36 Provision for credit losses 351 376 328 228 104 (25) 247 Noninterest expense Compensation and benefits 181 154 155 152 168 27 13 Other operating expenses 425 450 406 393 366 (25) 59 Total noninterest expense 606 604 561 545 534 2 72 Pre-tax Income $ 442 $ 437 $ 488 $ 600 $ 725 $ 5 $ (283) Memo: Net lease revenue Operating lease revenue $ 402 $ 400 $ 397 $ 396 $ 403 $ 2 $ (1) Depreciation expense on operating lease assets (ex. remarketing) 272 271 277 269 266 2 7 Remarketing gains, net of repo valuation 47 31 39 50 50 16 (3) Total depreciation expense on operating lease assets 226 240 238 219 217 (14) 9 Net lease revenue $ 176 $ 160 $ 159 $ 177 $ 186 $ 16 $ (10) Balance Sheet (Period-End) Cash, trading and investment securities $ — $ — $ — $ 23 $ 24 $ — $ (24) Loans held-for-sale, net 19 6 6 — — 13 19 Consumer loans 84,042 83,903 84,116 82,191 79,262 139 4,780 Commercial loans 19,266 18,784 16,163 16,109 17,295 482 1,971 Allowance for loan losses (3,053) (3,053) (3,024) (2,914) (2,794) — (259) Total finance receivables and loans, net 100,255 99,634 97,255 95,386 93,763 621 6,492 Investment in operating leases, net 10,236 10,444 10,577 10,516 10,730 (208) (494) Other assets 1,450 1,379 1,276 1,253 1,237 71 213 Total assets $ 111,960 $ 111,463 $ 109,114 $ 107,178 $ 105,754 $ 497 $ 6,206 1Q 2023 Preliminary Results9
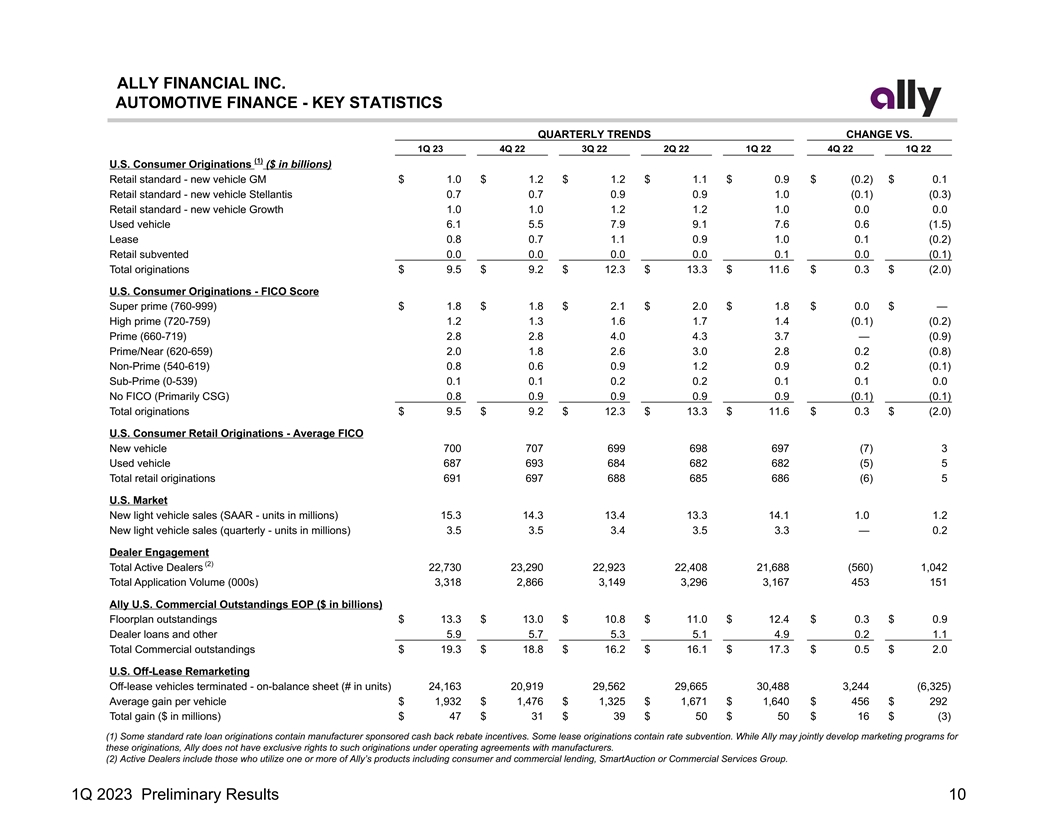
ALLY FINANCIAL INC. AUTOMOTIVE FINANCE - KEY STATISTICS QUARTERLY TRENDS CHANGE VS. 1Q 23 4Q 22 3Q 22 2Q 22 1Q 22 4Q 22 1Q 22 (1) U.S. Consumer Originations ($ in billions) Retail standard - new vehicle GM $ 1.0 $ 1.2 $ 1.2 $ 1.1 $ 0.9 $ (0.2) $ 0.1 Retail standard - new vehicle Stellantis 0.7 0.7 0.9 0.9 1.0 (0.1) (0.3) Retail standard - new vehicle Growth 1.0 1.0 1.2 1.2 1.0 0.0 0.0 Used vehicle 6.1 5.5 7.9 9.1 7.6 0.6 (1.5) Lease 0.8 0.7 1.1 0.9 1.0 0.1 (0.2) Retail subvented 0.0 0.0 0.0 0.0 0.1 0.0 (0.1) Total originations $ 9.5 $ 9.2 $ 12.3 $ 13.3 $ 11.6 $ 0.3 $ (2.0) U.S. Consumer Originations - FICO Score Super prime (760-999) $ 1.8 $ 1.8 $ 2.1 $ 2.0 $ 1.8 $ 0.0 $ — High prime (720-759) 1.2 1.3 1.6 1.7 1.4 (0.1) (0.2) Prime (660-719) 2.8 2.8 4.0 4.3 3.7 — (0.9) Prime/Near (620-659) 2.0 1.8 2.6 3.0 2.8 0.2 (0.8) Non-Prime (540-619) 0.8 0.6 0.9 1.2 0.9 0.2 (0.1) Sub-Prime (0-539) 0.1 0.1 0.2 0.2 0.1 0.1 0.0 No FICO (Primarily CSG) 0.8 0.9 0.9 0.9 0.9 (0.1) (0.1) Total originations $ 9.5 $ 9.2 $ 12.3 $ 13.3 $ 11.6 $ 0.3 $ (2.0) U.S. Consumer Retail Originations - Average FICO New vehicle 700 707 699 698 697 (7) 3 Used vehicle 687 693 684 682 682 (5) 5 Total retail originations 691 697 688 685 686 (6) 5 U.S. Market New light vehicle sales (SAAR - units in millions) 15.3 14.3 13.4 13.3 14.1 1.0 1.2 New light vehicle sales (quarterly - units in millions) 3.5 3.5 3.4 3.5 3.3 — 0.2 Dealer Engagement (2) Total Active Dealers 22,730 23,290 22,923 22,408 21,688 (560) 1,042 Total Application Volume (000s) 3,318 2,866 3,149 3,296 3,167 453 151 Ally U.S. Commercial Outstandings EOP ($ in billions) Floorplan outstandings $ 13.3 $ 13.0 $ 10.8 $ 11.0 $ 12.4 $ 0.3 $ 0.9 Dealer loans and other 5.9 5.7 5.3 5.1 4.9 0.2 1.1 Total Commercial outstandings $ 19.3 $ 18.8 $ 16.2 $ 16.1 $ 17.3 $ 0.5 $ 2.0 U.S. Off-Lease Remarketing Off-lease vehicles terminated - on-balance sheet (# in units) 24,163 20,919 29,562 29,665 30,488 3,244 (6,325) Average gain per vehicle $ 1,932 $ 1,476 $ 1,325 $ 1,671 $ 1,640 $ 456 $ 292 Total gain ($ in millions) $ 47 $ 31 $ 39 $ 50 $ 50 $ 16 $ (3) (1) Some standard rate loan originations contain manufacturer sponsored cash back rebate incentives. Some lease originations contain rate subvention. While Ally may jointly develop marketing programs for these originations, Ally does not have exclusive rights to such originations under operating agreements with manufacturers. (2) Active Dealers include those who utilize one or more of Ally’s products including consumer and commercial lending, SmartAuction or Commercial Services Group. 1Q 2023 Preliminary Results10
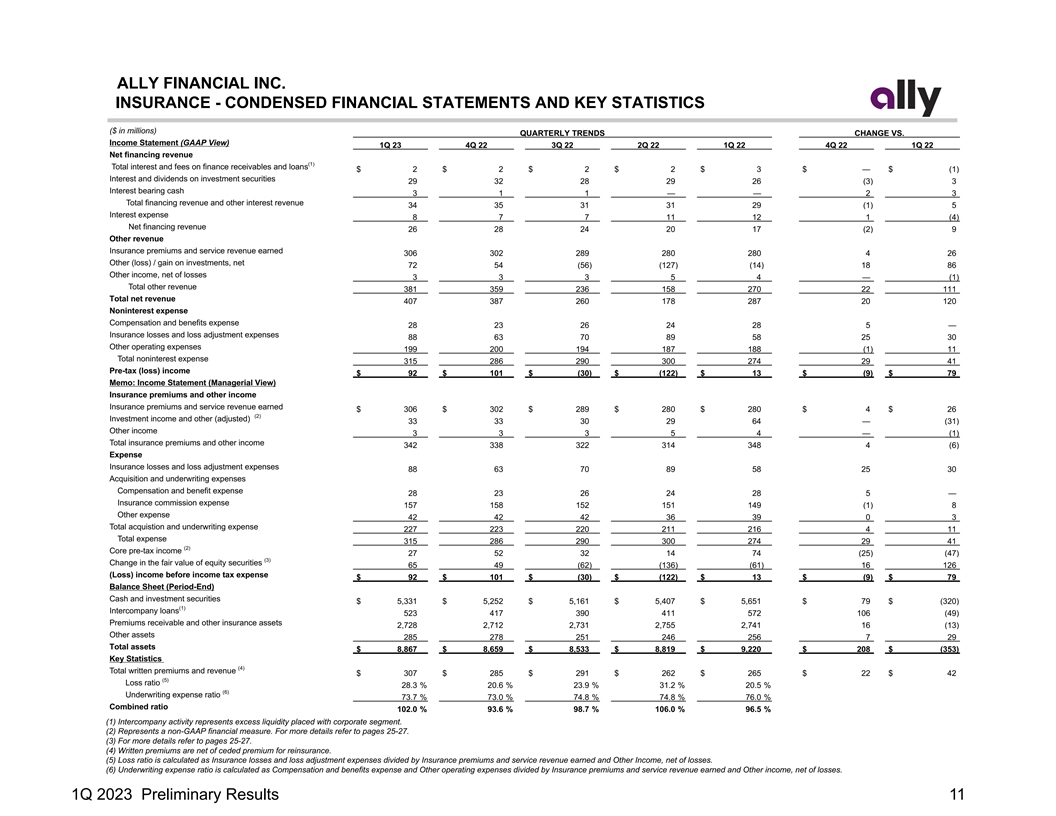
ALLY FINANCIAL INC. INSURANCE - CONDENSED FINANCIAL STATEMENTS AND KEY STATISTICS ($ in millions) QUARTERLY TRENDS CHANGE VS. Income Statement (GAAP View) 1Q 23 4Q 22 3Q 22 2Q 22 1Q 22 4Q 22 1Q 22 Net financing revenue (1) Total interest and fees on finance receivables and loans $ 2 $ 2 $ 2 $ 2 $ 3 $ — $ (1) Interest and dividends on investment securities 29 32 28 29 26 (3) 3 Interest bearing cash 3 1 1 — — 2 3 Total financing revenue and other interest revenue 34 35 31 31 29 (1) 5 Interest expense 8 7 7 11 12 1 (4) Net financing revenue 26 28 24 20 17 (2) 9 Other revenue Insurance premiums and service revenue earned 306 302 289 280 280 4 26 Other (loss) / gain on investments, net 72 54 (56) (127) (14) 18 86 Other income, net of losses 3 3 3 5 4 — (1) Total other revenue 381 359 236 158 270 22 111 Total net revenue 407 387 260 178 287 20 120 Noninterest expense Compensation and benefits expense 28 23 26 24 28 5 — Insurance losses and loss adjustment expenses 88 63 70 89 58 25 30 Other operating expenses 199 200 194 187 188 (1) 11 Total noninterest expense 315 286 290 300 274 29 41 Pre-tax (loss) income $ 92 $ 101 $ (30) $ (122) $ 13 $ (9) $ 79 Memo: Income Statement (Managerial View) Insurance premiums and other income Insurance premiums and service revenue earned $ 306 $ 302 $ 289 $ 280 $ 280 $ 4 $ 26 (2) Investment income and other (adjusted) 33 33 30 29 64 — (31) Other income 3 3 3 5 4 — (1) Total insurance premiums and other income 342 338 322 314 348 4 (6) Expense Insurance losses and loss adjustment expenses 88 63 70 89 58 25 30 Acquisition and underwriting expenses Compensation and benefit expense 28 23 26 24 28 5 — Insurance commission expense 157 158 152 151 149 (1) 8 Other expense 42 42 42 36 39 0 3 Total acquistion and underwriting expense 227 223 220 211 216 4 11 Total expense 315 286 290 300 274 29 41 (2) Core pre-tax income 27 52 32 14 74 (25) (47) (3) Change in the fair value of equity securities 65 49 (62) (136) (61) 16 126 (Loss) income before income tax expense $ 92 $ 101 $ (30) $ (122) $ 13 $ (9) $ 79 Balance Sheet (Period-End) Cash and investment securities $ 5,331 $ 5,252 $ 5,161 $ 5,407 $ 5,651 $ 79 $ (320) (1) Intercompany loans 523 417 390 411 572 106 (49) Premiums receivable and other insurance assets 2,728 2,712 2,731 2,755 2,741 16 (13) Other assets 285 278 251 246 256 7 29 Total assets $ 8,867 $ 8,659 $ 8,533 $ 8,819 $ 9,220 $ 208 $ (353) Key Statistics (4) Total written premiums and revenue $ 307 $ 285 $ 291 $ 262 $ 265 $ 22 $ 42 (5) Loss ratio 28.3 % 2 0.6 % 2 3.9 % 31.2 % 20.5 % (6) Underwriting expense ratio 7 3.7 % 7 3.0 % 74.8 % 7 4.8 % 76.0 % Combined ratio 1 02.0 % 93.6 % 98.7 % 1 06.0 % 9 6.5 % (1) Intercompany activity represents excess liquidity placed with corporate segment. (2) Represents a non-GAAP financial measure. For more details refer to pages 25-27. (3) For more details refer to pages 25-27. (4) Written premiums are net of ceded premium for reinsurance. (5) Loss ratio is calculated as Insurance losses and loss adjustment expenses divided by Insurance premiums and service revenue earned and Other Income, net of losses. (6) Underwriting expense ratio is calculated as Compensation and benefits expense and Other operating expenses divided by Insurance premiums and service revenue earned and Other income, net of losses. 1Q 2023 Preliminary Results11
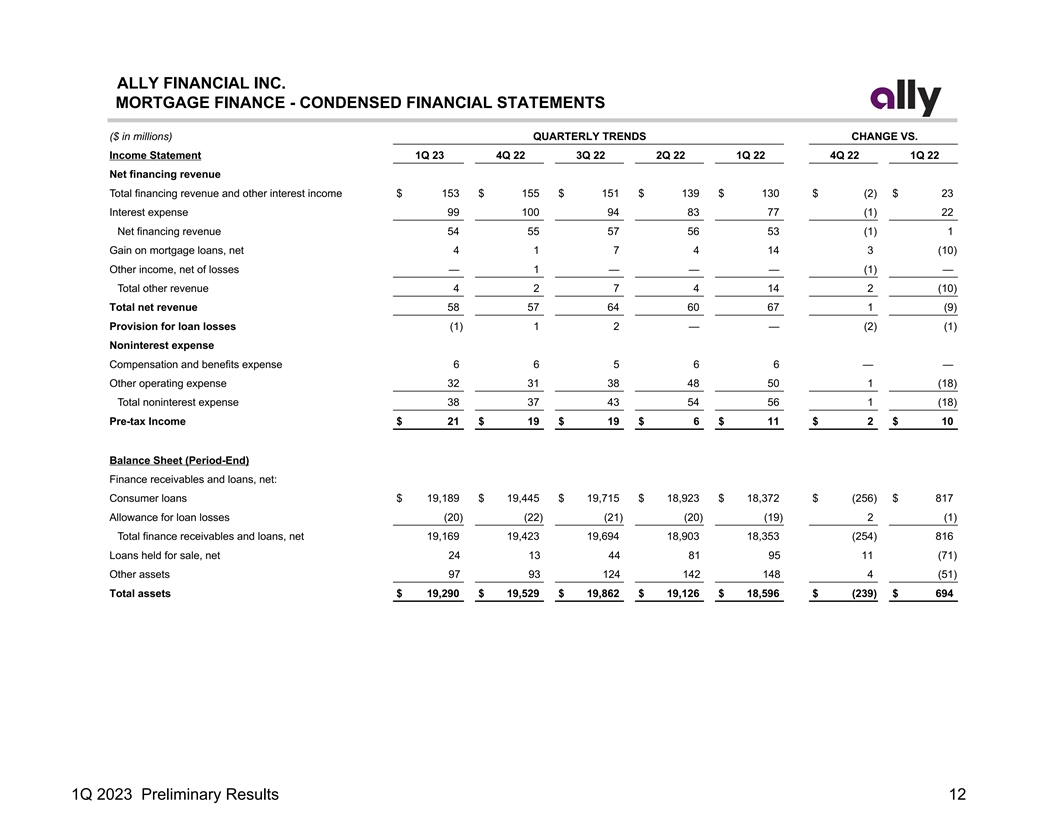
ALLY FINANCIAL INC. MORTGAGE FINANCE - CONDENSED FINANCIAL STATEMENTS ($ in millions) QUARTERLY TRENDS CHANGE VS. Income Statement 1Q 23 4Q 22 3Q 22 2Q 22 1Q 22 4Q 22 1Q 22 Net financing revenue Total financing revenue and other interest income $ 153 $ 155 $ 151 $ 139 $ 130 $ (2) $ 23 Interest expense 99 100 94 83 77 (1) 22 Net financing revenue 54 55 57 56 53 (1) 1 Gain on mortgage loans, net 4 1 7 4 14 3 (10) Other income, net of losses — 1 — — — (1) — Total other revenue 4 2 7 4 14 2 (10) Total net revenue 58 57 64 60 67 1 (9) Provision for loan losses (1) 1 2 — — (2) (1) Noninterest expense Compensation and benefits expense 6 6 5 6 6 — — Other operating expense 32 31 38 48 50 1 (18) Total noninterest expense 38 37 43 54 56 1 (18) Pre-tax Income $ 21 $ 19 $ 19 $ 6 $ 11 $ 2 $ 10 Balance Sheet (Period-End) Finance receivables and loans, net: Consumer loans $ 19,189 $ 19,445 $ 19,715 $ 18,923 $ 18,372 $ (256) $ 817 Allowance for loan losses (20) (22) (21) (20) (19) 2 (1) Total finance receivables and loans, net 19,169 19,423 19,694 18,903 18,353 (254) 816 Loans held for sale, net 24 13 44 81 95 11 (71) Other assets 97 93 124 142 148 4 (51) Total assets $ 19,290 $ 19,529 $ 19,862 $ 19,126 $ 18,596 $ (239) $ 694 1Q 2023 Preliminary Results12
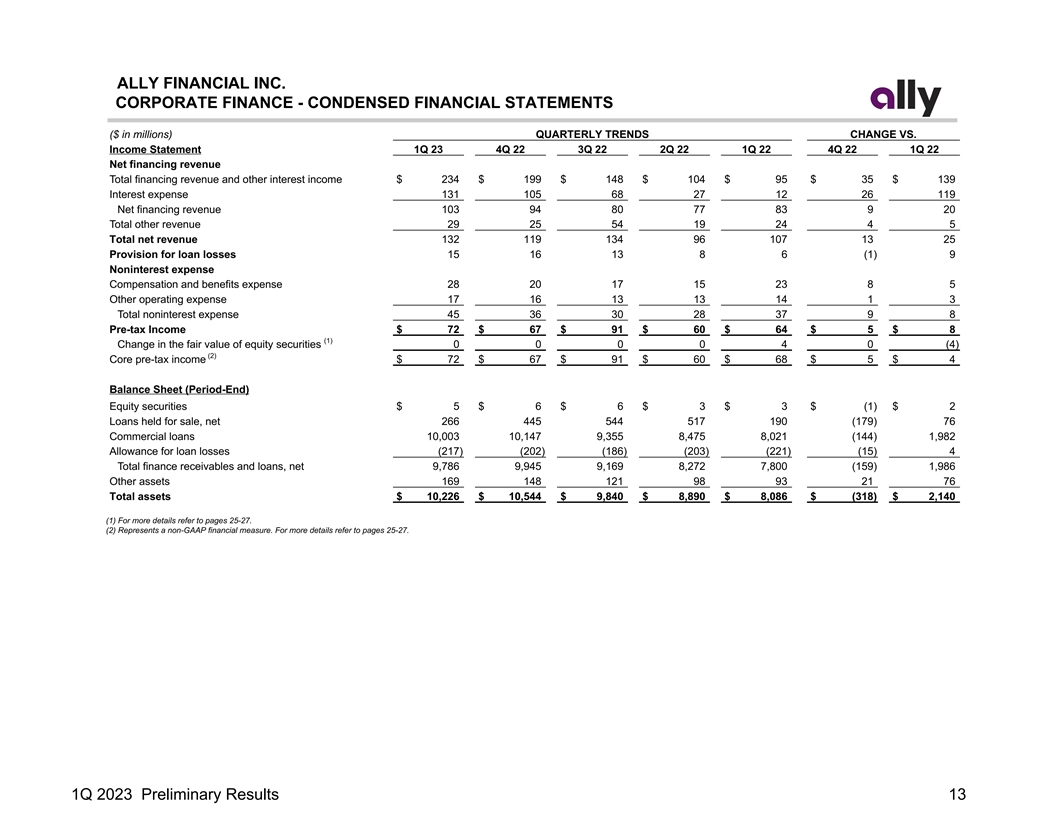
ALLY FINANCIAL INC. CORPORATE FINANCE - CONDENSED FINANCIAL STATEMENTS ($ in millions) QUARTERLY TRENDS CHANGE VS. Income Statement 1Q 23 4Q 22 3Q 22 2Q 22 1Q 22 4Q 22 1Q 22 Net financing revenue Total financing revenue and other interest income $ 234 $ 199 $ 148 $ 104 $ 95 $ 35 $ 139 Interest expense 131 105 68 27 12 26 119 Net financing revenue 103 94 80 77 83 9 20 Total other revenue 29 25 54 19 24 4 5 Total net revenue 132 119 134 96 107 13 25 Provision for loan losses 15 16 13 8 6 (1) 9 Noninterest expense Compensation and benefits expense 28 20 17 15 23 8 5 Other operating expense 17 16 13 13 14 1 3 Total noninterest expense 45 36 30 28 37 9 8 Pre-tax Income $ 72 $ 67 $ 91 $ 60 $ 64 $ 5 $ 8 (1) Change in the fair value of equity securities 0 0 0 0 4 0 (4) (2) Core pre-tax income $ 72 $ 67 $ 91 $ 60 $ 68 $ 5 $ 4 Balance Sheet (Period-End) Equity securities $ 5 $ 6 $ 6 $ 3 $ 3 $ (1) $ 2 Loans held for sale, net 266 445 544 517 190 (179) 76 Commercial loans 10,003 10,147 9,355 8,475 8,021 (144) 1,982 Allowance for loan losses (217) (202) (186) (203) (221) (15) 4 Total finance receivables and loans, net 9,786 9,945 9,169 8,272 7,800 (159) 1,986 Other assets 169 148 121 98 93 21 76 Total assets $ 10,226 $ 10,544 $ 9,840 $ 8,890 $ 8,086 $ (318) $ 2,140 (1) For more details refer to pages 25-27. (2) Represents a non-GAAP financial measure. For more details refer to pages 25-27. 1Q 2023 Preliminary Results13
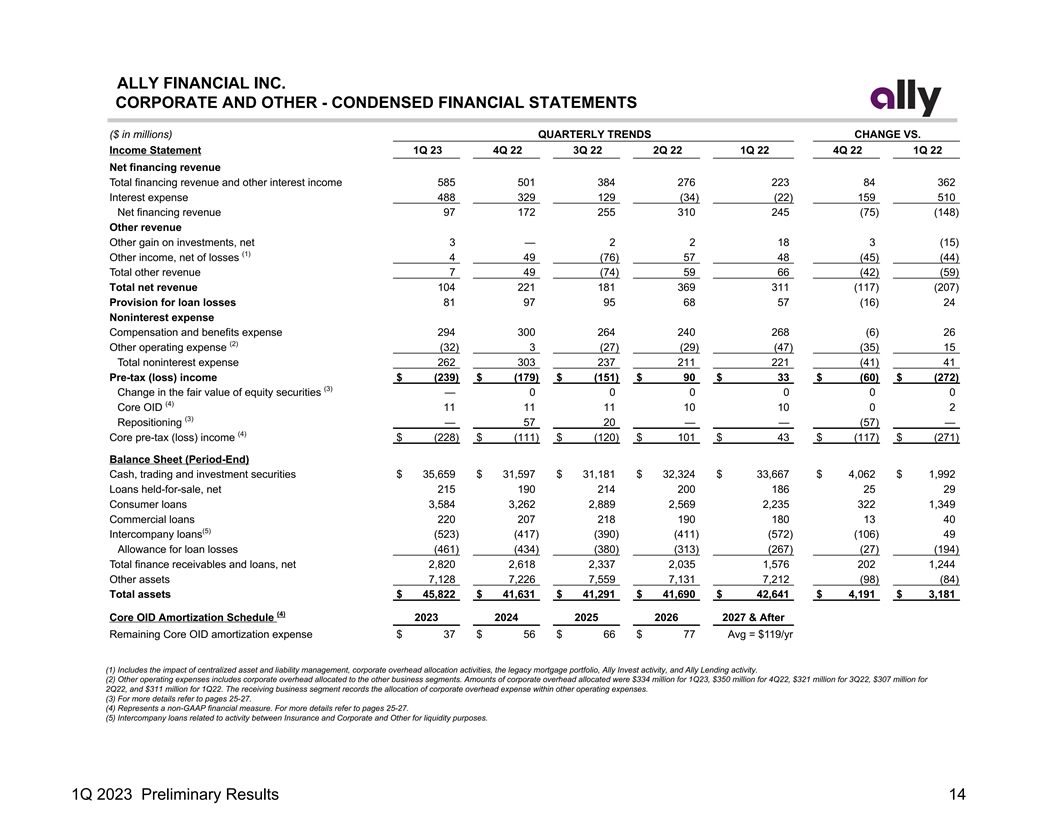
ALLY FINANCIAL INC. CORPORATE AND OTHER - CONDENSED FINANCIAL STATEMENTS ($ in millions) QUARTERLY TRENDS CHANGE VS. Income Statement 1Q 23 4Q 22 3Q 22 2Q 22 1Q 22 4Q 22 1Q 22 Net financing revenue Total financing revenue and other interest income 585 501 384 276 223 84 362 Interest expense 488 329 129 (34) (22) 159 510 Net financing revenue 97 172 255 310 245 (75) (148) Other revenue Other gain on investments, net 3 — 2 2 18 3 (15) (1) Other income, net of losses 4 49 (76) 57 48 (45) (44) Total other revenue 7 49 (74) 59 66 (42) (59) Total net revenue 104 221 181 369 311 (117) (207) Provision for loan losses 81 97 95 68 57 (16) 24 Noninterest expense Compensation and benefits expense 294 300 264 240 268 (6) 26 (2) Other operating expense (32) 3 (27) (29) (47) (35) 15 Total noninterest expense 262 303 237 211 221 (41) 41 Pre-tax (loss) income $ (239) $ (179) $ (151) $ 90 $ 33 $ (60) $ (272) (3) Change in the fair value of equity securities — 0 0 0 0 0 0 (4) Core OID 11 11 11 10 10 0 2 (3) Repositioning — 57 20 — — (57) — (4) Core pre-tax (loss) income $ (228) $ (111) $ (120) $ 101 $ 43 $ (117) $ (271) Balance Sheet (Period-End) Cash, trading and investment securities $ 35,659 $ 31,597 $ 31,181 $ 32,324 $ 33,667 $ 4,062 $ 1,992 Loans held-for-sale, net 215 190 214 200 186 25 29 Consumer loans 3,584 3,262 2,889 2,569 2,235 322 1,349 Commercial loans 220 207 218 190 180 13 40 (5) Intercompany loans (523) (417) (390) (411) (572) (106) 49 Allowance for loan losses (461) (434) (380) (313) (267) (27) (194) Total finance receivables and loans, net 2,820 2,618 2,337 2,035 1,576 202 1,244 Other assets 7,128 7,226 7,559 7,131 7,212 (98) (84) Total assets $ 45,822 $ 41,631 $ 41,291 $ 41,690 $ 42,641 $ 4,191 $ 3,181 (4) Core OID Amortization Schedule 2023 2024 2025 2026 2027 & After Remaining Core OID amortization expense $ 37 $ 56 $ 66 $ 77 Avg = $119/yr (1) Includes the impact of centralized asset and liability management, corporate overhead allocation activities, the legacy mortgage portfolio, Ally Invest activity, and Ally Lending activity. (2) Other operating expenses includes corporate overhead allocated to the other business segments. Amounts of corporate overhead allocated were $334 million for 1Q23, $350 million for 4Q22, $321 million for 3Q22, $307 million for 2Q22, and $311 million for 1Q22. The receiving business segment records the allocation of corporate overhead expense within other operating expenses. (3) For more details refer to pages 25-27. (4) Represents a non-GAAP financial measure. For more details refer to pages 25-27. (5) Intercompany loans related to activity between Insurance and Corporate and Other for liquidity purposes. 1Q 2023 Preliminary Results14
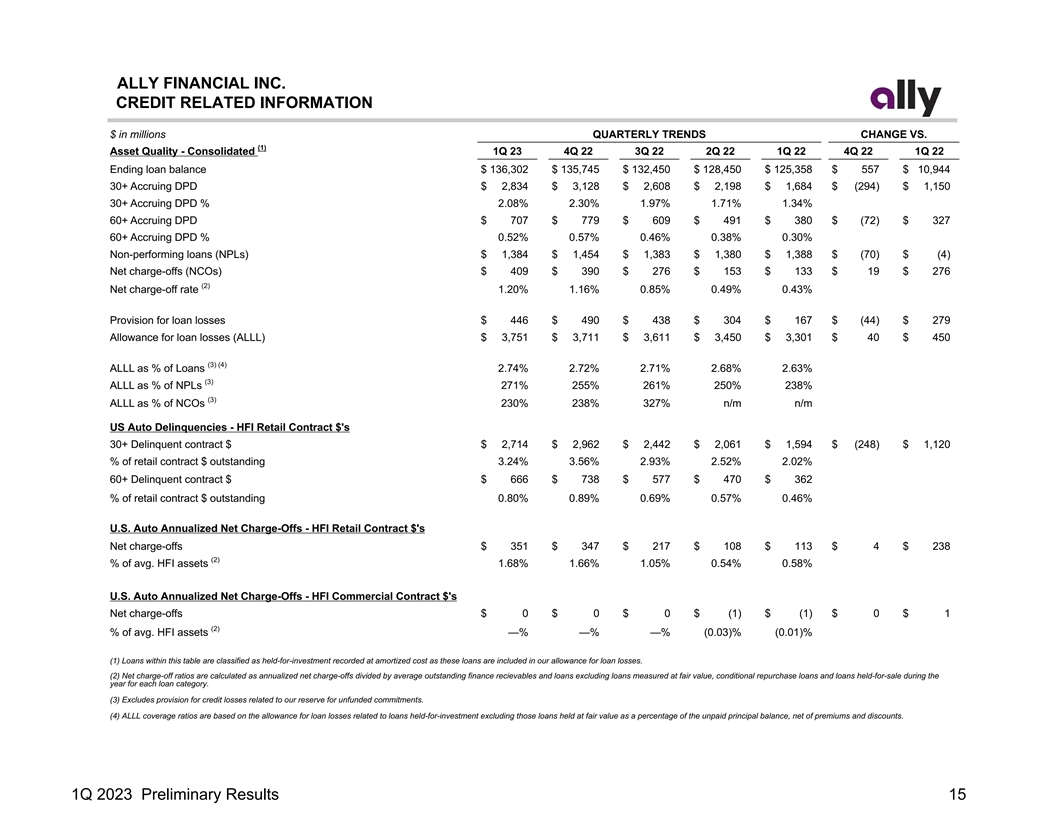
ALLY FINANCIAL INC. CREDIT RELATED INFORMATION $ in millions QUARTERLY TRENDS CHANGE VS. (1) Asset Quality - Consolidated 1Q 23 4Q 22 3Q 22 2Q 22 1Q 22 4Q 22 1Q 22 Ending loan balance $ 136,302 $ 135,745 $ 132,450 $ 128,450 $ 125,358 $ 557 $ 10,944 30+ Accruing DPD $ 2,834 $ 3,128 $ 2,608 $ 2,198 $ 1,684 $ (294) $ 1,150 30+ Accruing DPD % 2.08% 2 .30% 1.97 % 1 .71% 1 .34 % 60+ Accruing DPD $ 707 $ 779 $ 609 $ 491 $ 380 $ (72) $ 327 60+ Accruing DPD % 0 .52% 0.57 % 0 .46 % 0 .38 % 0.30% Non-performing loans (NPLs) $ 1,384 $ 1,454 $ 1,383 $ 1,380 $ 1,388 $ (70) $ (4) Net charge-offs (NCOs) $ 409 $ 390 $ 276 $ 153 $ 133 $ 19 $ 276 (2) Net charge-off rate 1.20% 1.16% 0.85 % 0 .49% 0 .43% Provision for loan losses $ 446 $ 490 $ 438 $ 304 $ 167 $ (44) $ 279 Allowance for loan losses (ALLL) $ 3,751 $ 3,711 $ 3,611 $ 3,450 $ 3,301 $ 40 $ 450 (3) (4) ALLL as % of Loans 2.74 % 2.72 % 2 .71 % 2 .68 % 2 .63 % (3) ALLL as % of NPLs 271% 255 % 2 61 % 250% 238% (3) ALLL as % of NCOs 230% 238% 327 % n/m n/m US Auto Delinquencies - HFI Retail Contract $'s 30+ Delinquent contract $ $ 2,714 $ 2,962 $ 2,442 $ 2,061 $ 1,594 $ (248) $ 1,120 % of retail contract $ outstanding 3 .24 % 3 .56 % 2 .93 % 2 .52 % 2 .02% 60+ Delinquent contract $ $ 666 $ 738 $ 577 $ 470 $ 362 % of retail contract $ outstanding 0.80% 0 .89% 0.69% 0 .57 % 0 .46 % U.S. Auto Annualized Net Charge-Offs - HFI Retail Contract $'s Net charge-offs $ 351 $ 347 $ 217 $ 108 $ 113 $ 4 $ 238 (2) % of avg. HFI assets 1 .68% 1.66 % 1 .05% 0 .54 % 0.58 % U.S. Auto Annualized Net Charge-Offs - HFI Commercial Contract $'s Net charge-offs $ 0 $ 0 $ 0 $ (1) $ (1) $ 0 $ 1 (2) % of avg. HFI assets —% — % — % (0.03)% ( 0.01) % (1) Loans within this table are classified as held-for-investment recorded at amortized cost as these loans are included in our allowance for loan losses. (2) Net charge-off ratios are calculated as annualized net charge-offs divided by average outstanding finance recievables and loans excluding loans measured at fair value, conditional repurchase loans and loans held-for-sale during the year for each loan category. (3) Excludes provision for credit losses related to our reserve for unfunded commitments. (4) ALLL coverage ratios are based on the allowance for loan losses related to loans held-for-investment excluding those loans held at fair value as a percentage of the unpaid principal balance, net of premiums and discounts. 1Q 2023 Preliminary Results15
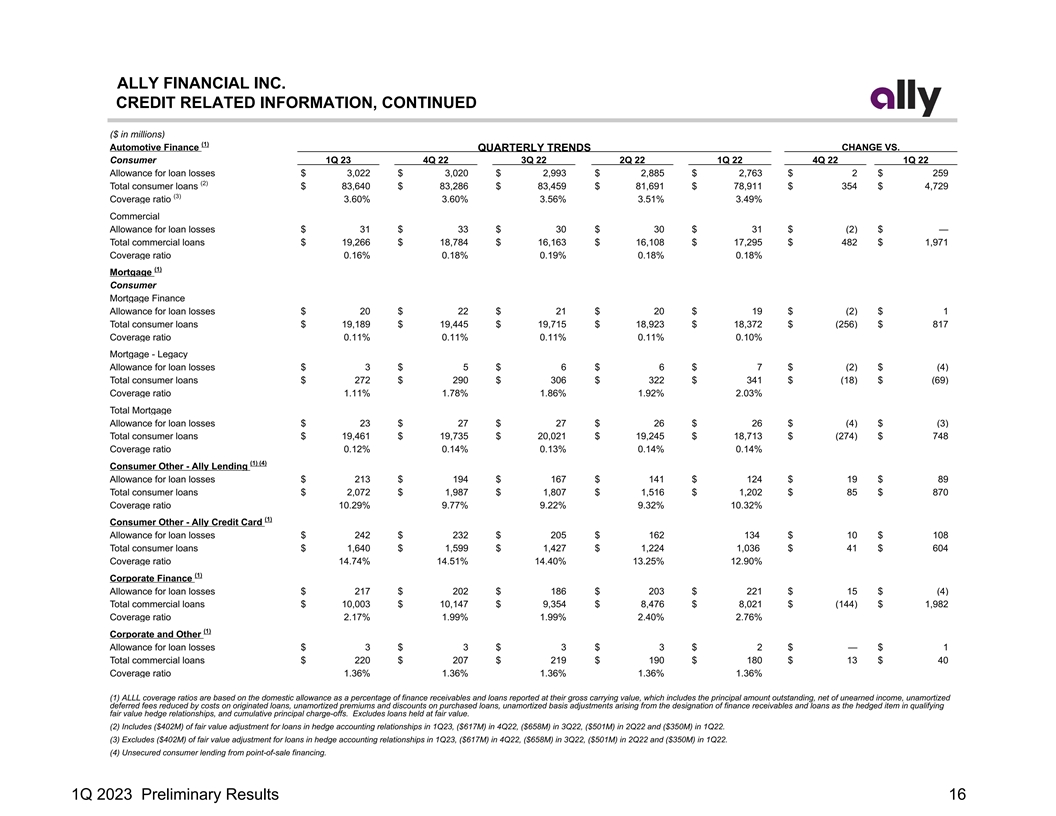
ALLY FINANCIAL INC. CREDIT RELATED INFORMATION, CONTINUED ($ in millions) (1) Automotive Finance CHANGE VS. QUARTERLY TRENDS Consumer 1Q 23 4Q 22 3Q 22 2Q 22 1Q 22 4Q 22 1Q 22 Allowance for loan losses $ 3,022 $ 3,020 $ 2,993 $ 2,885 $ 2,763 $ 2 $ 259 (2) Total consumer loans $ 83,640 $ 83,286 $ 83,459 $ 81,691 $ 78,911 $ 354 $ 4,729 (3) Coverage ratio 3.60 % 3.60 % 3.56% 3 .51 % 3 .49 % Commercial Allowance for loan losses $ 31 $ 33 $ 30 $ 30 $ 31 $ (2) $ — Total commercial loans $ 19,266 $ 18,784 $ 16,163 $ 16,108 $ 17,295 $ 482 $ 1,971 Coverage ratio 0.16% 0.18% 0.19% 0 .18% 0.18 % (1) Mortgage Consumer Mortgage Finance Allowance for loan losses $ 20 $ 22 $ 21 $ 20 $ 19 $ (2) $ 1 Total consumer loans $ 19,189 $ 19,445 $ 19,715 $ 18,923 $ 18,372 $ (256) $ 817 Coverage ratio 0.11 % 0 .11 % 0 ..11 % 0 .11 % 0.10% Mortgage - Legacy Allowance for loan losses $ 3 $ 5 $ 6 $ 6 $ 7 $ (2) $ (4) Total consumer loans $ 272 $ 290 $ 306 $ 322 $ 341 $ (18) $ (69) Coverage ratio 1 .11% 1 .78% 1.86 % 1.92% 2.03 % Total Mortgage Allowance for loan losses $ 23 $ 27 $ 27 $ 26 $ 26 $ (4) $ (3) Total consumer loans $ 19,461 $ 19,735 $ 20,021 $ 19,245 $ 18,713 $ (274) $ 748 Coverage ratio 0.12 % 0.14% 0 .13 % 0 .14 % 0 .14% (1) (4) Consumer Other - Ally Lending Allowance for loan losses $ 213 $ 194 $ 167 $ 141 $ 124 $ 19 $ 89 Total consumer loans $ 2,072 $ 1,987 $ 1,807 $ 1,516 $ 1,202 $ 85 $ 870 Coverage ratio 10.29 % 9 .77 % 9 .22% 9 .32 % 10.32 % (1) Consumer Other - Ally Credit Card Allowance for loan losses $ 242 $ 232 $ 205 $ 162 134 $ 10 $ 108 Total consumer loans $ 1,640 $ 1,599 $ 1,427 $ 1,224 1,036 $ 41 $ 604 Coverage ratio 1 4.74% 1 4.51% 1 4.40% 1 3.25% 1 2.90 % (1) Corporate Finance Allowance for loan losses $ 217 $ 202 $ 186 $ 203 $ 221 $ 15 $ (4) Total commercial loans $ 10,003 $ 10,147 $ 9,354 $ 8,476 $ 8,021 $ (144) $ 1,982 Coverage ratio 2 .17% 1.99% 1.99% 2.40% 2 .76% (1) Corporate and Other Allowance for loan losses $ 3 $ 3 $ 3 $ 3 $ 2 $ — $ 1 Total commercial loans $ 220 $ 207 $ 219 $ 190 $ 180 $ 13 $ 40 Coverage ratio 1 .36 % 1 .36 % 1 .36% 1.36 % 1 .36 % (1) ALLL coverage ratios are based on the domestic allowance as a percentage of finance receivables and loans reported at their gross carrying value, which includes the principal amount outstanding, net of unearned income, unamortized deferred fees reduced by costs on originated loans, unamortized premiums and discounts on purchased loans, unamortized basis adjustments arising from the designation of finance receivables and loans as the hedged item in qualifying fair value hedge relationships, and cumulative principal charge-offs. Excludes loans held at fair value. (2) Includes ($402M) of fair value adjustment for loans in hedge accounting relationships in 1Q23, ($617M) in 4Q22, ($658M) in 3Q22, ($501M) in 2Q22 and ($350M) in 1Q22. (3) Excludes ($402M) of fair value adjustment for loans in hedge accounting relationships in 1Q23, ($617M) in 4Q22, ($658M) in 3Q22, ($501M) in 2Q22 and ($350M) in 1Q22. (4) Unsecured consumer lending from point-of-sale financing. 1Q 2023 Preliminary Results16
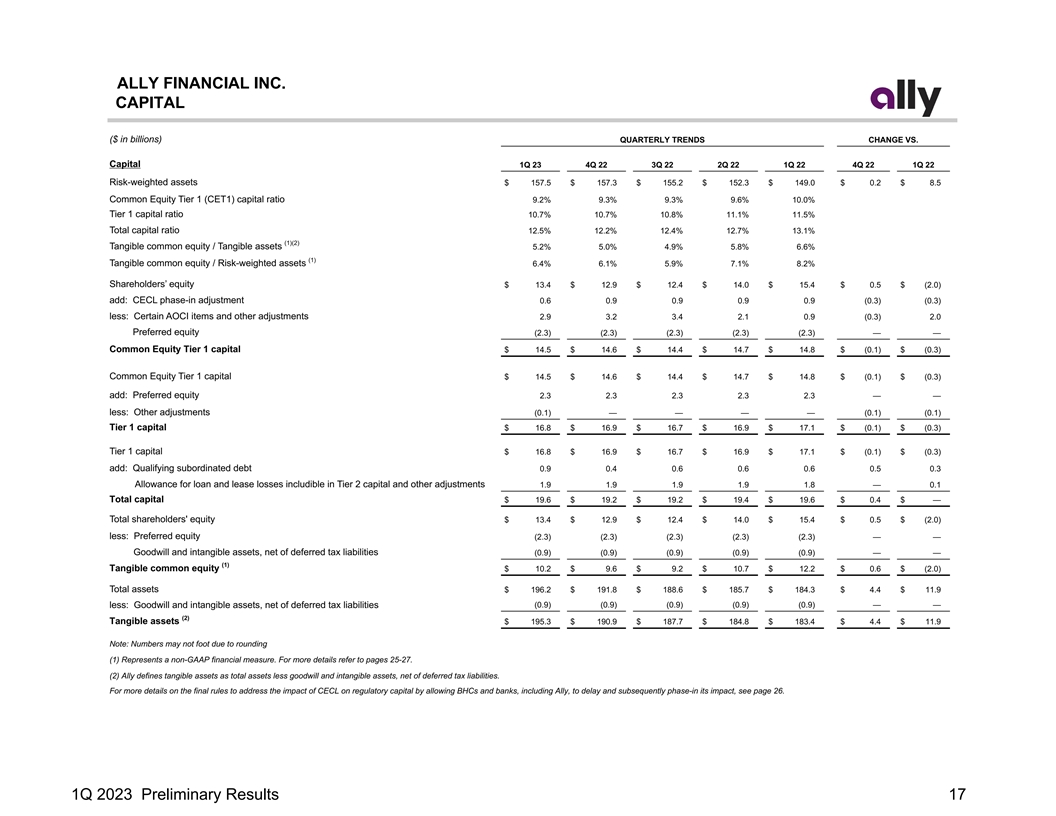
ALLY FINANCIAL INC. CAPITAL ($ in billions) QUARTERLY TRENDS CHANGE VS. Capital 1Q 23 4Q 22 3Q 22 2Q 22 1Q 22 4Q 22 1Q 22 Risk-weighted assets $ 157.5 $ 157.3 $ 155.2 $ 152.3 $ 149.0 $ 0.2 $ 8.5 Common Equity Tier 1 (CET1) capital ratio 9.2 % 9 .3 % 9 .3 % 9.6% 1 0.0 % Tier 1 capital ratio 1 0.7% 10.7% 1 0.8% 1 1.1 % 1 1.5% Total capital ratio 1 2.5 % 1 2.2% 1 2.4 % 1 2.7 % 13.1 % (1)(2) Tangible common equity / Tangible assets 5.2 % 5 .0% 4.9% 5 .8 % 6 .6% (1) Tangible common equity / Risk-weighted assets 6 .4 % 6.1% 5.9 % 7.1 % 8.2% Shareholders’ equity $ 13.4 $ 12.9 $ 12.4 $ 14.0 $ 15.4 $ 0.5 $ (2.0) add: CECL phase-in adjustment 0.6 0.9 0.9 0.9 0.9 (0.3) (0.3) less: Certain AOCI items and other adjustments 2.9 3.2 3.4 2.1 0.9 (0.3) 2.0 Preferred equity (2.3) (2.3) (2.3) (2.3) (2.3) — — Common Equity Tier 1 capital $ 14.5 $ 14.6 $ 14.4 $ 14.7 $ 14.8 $ (0.1) $ (0.3) Common Equity Tier 1 capital $ 14.5 $ 14.6 $ 14.4 $ 14.7 $ 14.8 $ (0.1) $ (0.3) add: Preferred equity 2.3 2.3 2.3 2.3 2.3 — — less: Other adjustments (0.1) — — — — (0.1) (0.1) Tier 1 capital $ 16.8 $ 16.9 $ 16.7 $ 16.9 $ 17.1 $ (0.1) $ (0.3) Tier 1 capital $ 16.8 $ 16.9 $ 16.7 $ 16.9 $ 17.1 $ (0.1) $ (0.3) add: Qualifying subordinated debt 0.9 0.4 0.6 0.6 0.6 0.5 0.3 Allowance for loan and lease losses includible in Tier 2 capital and other adjustments 1.9 1.9 1.9 1.9 1.8 — 0.1 Total capital $ 19.6 $ 19.2 $ 19.2 $ 19.4 $ 19.6 $ 0.4 $ — Total shareholders' equity $ 13.4 $ 12.9 $ 12.4 $ 14.0 $ 15.4 $ 0.5 $ (2.0) less: Preferred equity (2.3) (2.3) (2.3) (2.3) (2.3) — — Goodwill and intangible assets, net of deferred tax liabilities (0.9) (0.9) (0.9) (0.9) (0.9) — — (1) Tangible common equity $ 10.2 $ 9.6 $ 9.2 $ 10.7 $ 12.2 $ 0.6 $ (2.0) Total assets $ 196.2 $ 191.8 $ 188.6 $ 185.7 $ 184.3 $ 4.4 $ 11.9 less: Goodwill and intangible assets, net of deferred tax liabilities (0.9) (0.9) (0.9) (0.9) (0.9) — — (2) Tangible assets $ 195.3 $ 190.9 $ 187.7 $ 184.8 $ 183.4 $ 4.4 $ 11.9 Note: Numbers may not foot due to rounding (1) Represents a non-GAAP financial measure. For more details refer to pages 25-27. (2) Ally defines tangible assets as total assets less goodwill and intangible assets, net of deferred tax liabilities. For more details on the final rules to address the impact of CECL on regulatory capital by allowing BHCs and banks, including Ally, to delay and subsequently phase-in its impact, see page 26. 1Q 2023 Preliminary Results17
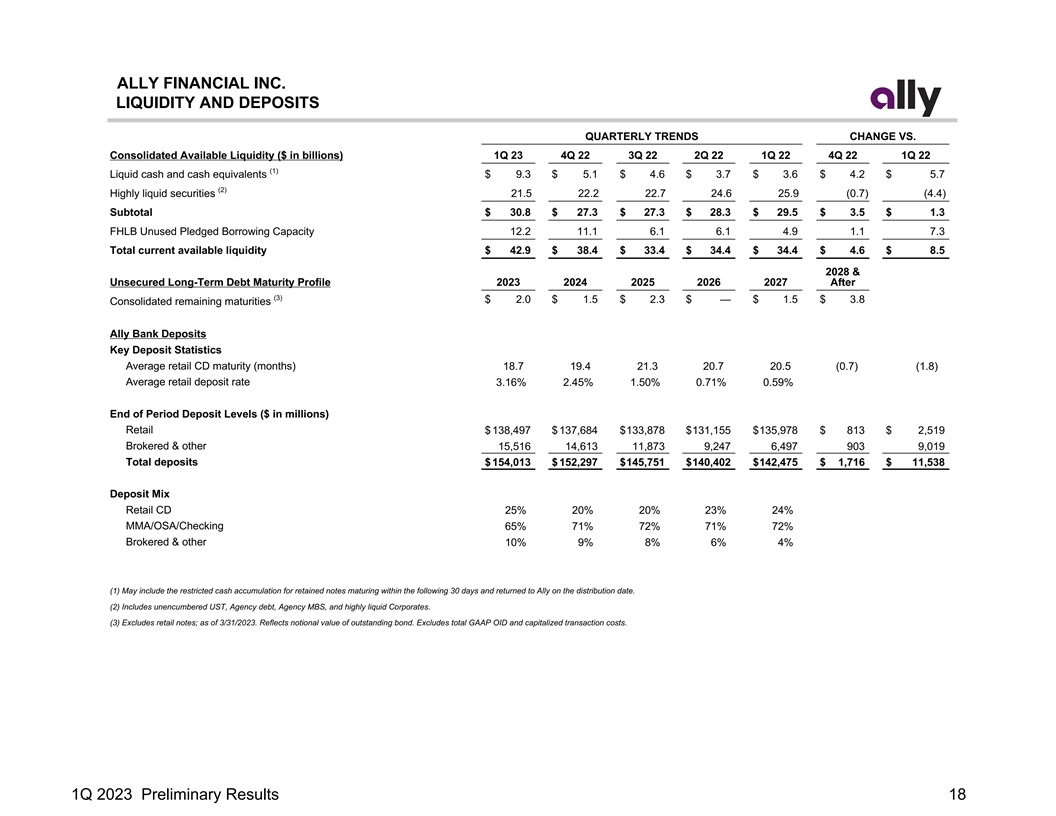
ALLY FINANCIAL INC. LIQUIDITY AND DEPOSITS QUARTERLY TRENDS CHANGE VS. Consolidated Available Liquidity ($ in billions) 1Q 23 4Q 22 3Q 22 2Q 22 1Q 22 4Q 22 1Q 22 (1) Liquid cash and cash equivalents $ 9.3 $ 5.1 $ 4.6 $ 3.7 $ 3.6 $ 4.2 $ 5.7 (2) Highly liquid securities 21.5 22.2 22.7 24.6 25.9 (0.7) (4.4) Subtotal $ 30.8 $ 27.3 $ 27.3 $ 28.3 $ 29.5 $ 3.5 $ 1.3 FHLB Unused Pledged Borrowing Capacity 12.2 11.1 6.1 6.1 4.9 1.1 7.3 Total current available liquidity $ 42.9 $ 38.4 $ 33.4 $ 34.4 $ 34.4 $ 4.6 $ 8.5 2028 & Unsecured Long-Term Debt Maturity Profile 2023 2024 2025 2026 2027 After (3) $ 2.0 $ 1.5 $ 2.3 $ — $ 1.5 $ 3.8 Consolidated remaining maturities Ally Bank Deposits Key Deposit Statistics Average retail CD maturity (months) 18.7 19.4 21.3 20.7 20.5 (0.7) (1.8) Average retail deposit rate 3 .16% 2 .45 % 1.50% 0 .71% 0 .59 % End of Period Deposit Levels ($ in millions) Retail $ 138,497 $ 137,684 $ 133,878 $ 131,155 $ 135,978 $ 813 $ 2,519 Brokered & other 15,516 14,613 11,873 9,247 6,497 903 9,019 Total deposits $ 154,013 $ 152,297 $ 145,751 $ 140,402 $ 142,475 $ 1,716 $ 11,538 Deposit Mix Retail CD 2 5 % 20 % 20 % 2 3 % 24 % MMA/OSA/Checking 65% 71% 7 2% 7 1% 72% Brokered & other 1 0% 9% 8% 6% 4% (1) May include the restricted cash accumulation for retained notes maturing within the following 30 days and returned to Ally on the distribution date. (2) Includes unencumbered UST, Agency debt, Agency MBS, and highly liquid Corporates. (3) Excludes retail notes; as of 3/31/2023. Reflects notional value of outstanding bond. Excludes total GAAP OID and capitalized transaction costs. 1Q 2023 Preliminary Results18

ALLY FINANCIAL INC. NET INTEREST MARGIN ($ in millions) QUARTERLY TRENDS CHANGE VS. Average Balance Details 1Q 23 4Q 22 3Q 22 2Q 22 1Q 22 4Q 22 1Q 22 Retail Auto Loans $ 83,615 $ 83,781 $ 82,362 $ 79,695 $ 78,224 $ (166) $ 5,391 Auto Lease (net of dep) 10,435 10,546 10,588 10,615 10,878 (111) (443) Dealer Floorplan 12,893 11,822 10,886 11,372 11,594 1,071 1,299 Other Dealer Loans 5,756 5,462 5,059 4,839 4,810 294 946 Corporate Finance 10,606 10,181 9,291 8,351 8,045 425 2,561 (1) Mortgage 19,621 19,876 19,762 18,980 18,228 (255) 1,393 2,037 1,904 1,672 1,346 1,100 133 937 Consumer Other - Ally Lending Consumer Other - Ally Credit Card 1,618 1,486 1,300 1,093 981 132 637 Cash and Cash Equivalents 5,731 4,129 3,627 3,761 4,027 1,602 1,704 Investment Securities and Other 32,578 32,513 34,578 35,050 37,025 65 (4,447) Total Earning Assets $ 184,891 $ 181,698 $ 179,125 $ 175,103 $ 174,911 $ 3,193 $ 9,980 3,060 2,859 2,523 2,231 2,094 201 966 Interest Revenue (2) Unsecured Debt (ex. Core OID balance) $ 11,193 $ 10,447 $ 10,046 $ 9,674 $ 9,976 $ 746 $ 1,217 Secured Debt 2,552 1,917 1,374 1,154 1,089 635 1,463 (3) Deposits 152,752 148,485 142,793 139,814 141,557 4,267 11,195 Other Borrowings 6,503 9,934 12,502 11,966 7,203 (3,431) (700) (2) Total Funding Sources (ex. Core OID balance) $ 173,000 $ 170,783 $ 166,715 $ 162,608 $ 159,826 $ 2,217 $ 13,174 (2) Interest Expense (ex. Core OID) 1,447 1,174 793 457 391 273 1,056 (2) Net Financing Revenue (ex. Core OID) $ 1,613 $ 1,685 $ 1,730 $ 1,774 $ 1,703 $ (72) $ (90) Net Interest Margin (yield details) 8 .49% 7.98 % 7 .29% 6 .82% 6.61% 0 .51% 1.88 % Retail Auto Loan Retail Auto Loan (excl. hedge impact) 7 .66% 7 .37 % 7 .04 % 6 .85 % 6.75 % 0.29% 0.91% Auto Lease (net of dep) 6 .84 % 6 .02% 5 .98% 6 .66 % 6.96 % 0 ..82 % ( 0.12)% Dealer Floorplan 7.29% 6.42% 5 .03 % 3.45 % 2.97% 0 .87% 4.32 % Other Dealer Loans 5 .04% 4.82% 4 .33 % 4 .13 % 4 .17% 0.22 % 0 .87 % 8.96 % 7.78 % 6.30 % 5 .02% 4 .76 % 1 .18% 4 .20 % Corporate Finance Mortgage 3 .25 % 3.17 % 3.10 % 3.01% 2 .94 % 0 .08 % 0.31 % Consumer Other - Ally Lending 9 .97% 10.37% 1 1.04% 1 1.94% 1 2.62% (0.40) % (2.65)% Consumer Other - Ally Credit Card 21.84% 2 1.75 % 2 1.17% 1 9.71% 1 8.75 % 0.09 % 3 .09% Cash and Cash Equivalents 3.95% 2.94 % 1 .73 % 0.61% 0 .15% 1 .01% 3 .80 % 3 .04% 2.89% 2.55% 2.35% 2.09 % 0 .15 % 0 .95% Investment Securities and Other Total Earning Assets 6.71% 6 .24% 5 .59 % 5.11% 4.86% 0.47% 1 .85% (2) Unsecured Debt (ex. Core OID & Core OID balance) 5.34 % 5.12 % 4.99% 5 .04 % 5 .12 % 0.22 % 0 .22% 6 .04% 4.73 % 6.08 % 6 .61% 6.36% 1.31 % ( 0.32) % Secured Debt (3) Deposits 3 .23% 2.53% 1 .58 % 0 .76% 0.61 % 0 .70% 2.62% (4) Other Borrowings 2 .74 % 2.80 % 2 .48 % 1 .75% 2.11 % ( 0.06) % 0.63% (2) Total Funding Sources (ex. Core OID & Core OID balance) 3 .39% 2.73% 1.89% 1 .12% 0.99 % 0.66% 2.40% NIM (as reported) 3 .51 % 3.65 % 3.81% 4 .04% 3 .93 % ( 0.14) % (0.42)% (2) NIM (ex. Core OID & Core OID balance) 3.54% 3.68% 3.83% 4.06 % 3 .95 % ( 0.14)% (0.41) % (1) Mortgage includes held-for-investment (HFI) loans from the Mortgage Finance segment and the HFI legacy mortgage portfolio in run-off at the Corporate and Other segment. (2) Represents a non-GAAP financial measure. Excludes Core OID from interest expense and Core OID balance from Unsecured Debt. For more details refer to pages 25-27. (3) Includes retail, brokered, and other deposits. Other includes sweep deposits and other deposits. (4) Includes FHLB Borrowings, Repurchase Agreements and other. 1Q 2023 Preliminary Results19
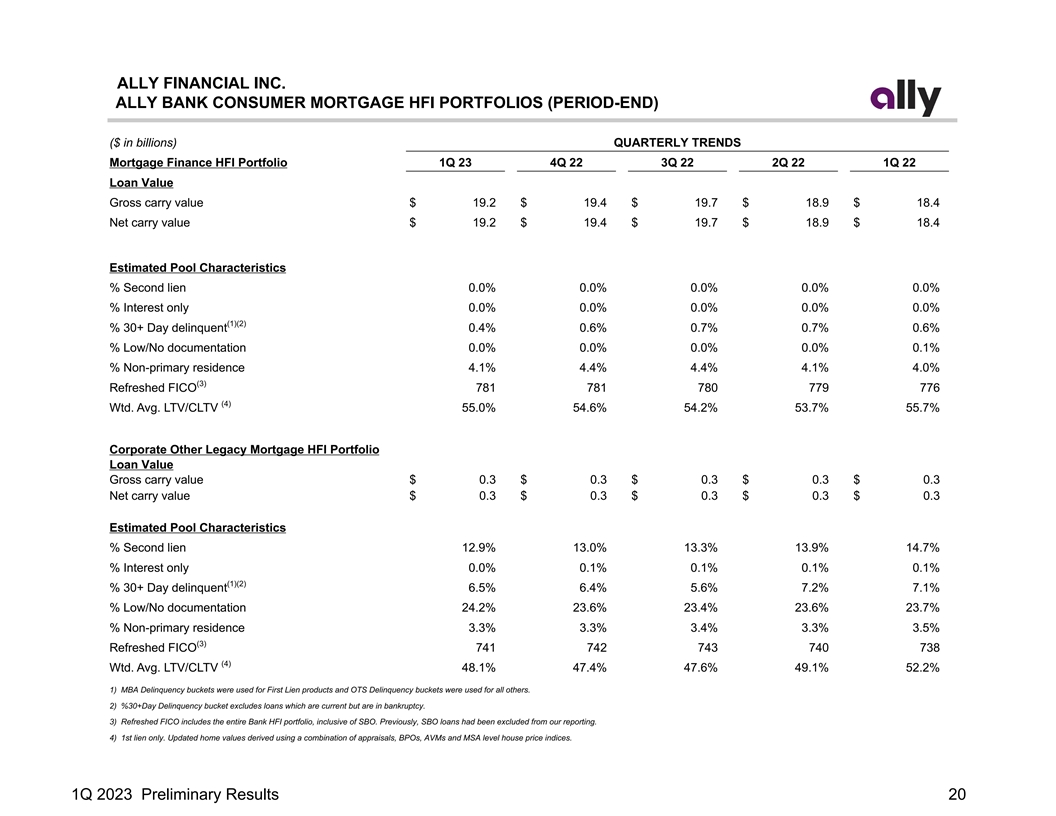
ALLY FINANCIAL INC. ALLY BANK CONSUMER MORTGAGE HFI PORTFOLIOS (PERIOD-END) ($ in billions) QUARTERLY TRENDS Mortgage Finance HFI Portfolio 1Q 23 4Q 22 3Q 22 2Q 22 1Q 22 Loan Value Gross carry value $ 19.2 $ 19.4 $ 19.7 $ 18.9 $ 18.4 Net carry value $ 19.2 $ 19.4 $ 19.7 $ 18.9 $ 18.4 Estimated Pool Characteristics % Second lien 0.0 % 0.0 % 0.0 % 0.0% 0.0 % % Interest only 0 .0 % 0 .0 % 0.0 % 0.0 % 0 .0 % (1)(2) % 30+ Day delinquent 0.4% 0.6% 0.7 % 0.7 % 0 .6 % % Low/No documentation 0.0 % 0 .0 % 0 .0% 0.0% 0 .1 % % Non-primary residence 4 .1 % 4 .4 % 4 .4% 4.1% 4.0% (3) Refreshed FICO 781 781 780 779 776 (4) Wtd. Avg. LTV/CLTV 5 5.0% 5 4.6% 5 4.2% 53.7% 5 5.7 % Corporate Other Legacy Mortgage HFI Portfolio Loan Value Gross carry value $ 0.3 $ 0.3 $ 0.3 $ 0.3 $ 0.3 Net carry value $ 0.3 $ 0.3 $ 0.3 $ 0.3 $ 0.3 Estimated Pool Characteristics % Second lien 12.9% 13.0 % 1 3.3% 1 3.9% 1 4.7 % % Interest only 0.0% 0.1% 0.1 % 0 .1% 0.1% (1)(2) % 30+ Day delinquent 6 .5% 6 .4% 5.6 % 7 .2% 7 .1% % Low/No documentation 24.2% 2 3.6 % 2 3.4% 2 3.6% 2 3.7% % Non-primary residence 3 .3 % 3.3 % 3 .4% 3 .3 % 3 .5% (3) Refreshed FICO 741 742 743 740 738 (4) Wtd. Avg. LTV/CLTV 48.1 % 47.4% 47.6 % 49.1% 52.2 % 1) MBA Delinquency buckets were used for First Lien products and OTS Delinquency buckets were used for all others. 2) %30+Day Delinquency bucket excludes loans which are current but are in bankruptcy. 3) Refreshed FICO includes the entire Bank HFI portfolio, inclusive of SBO. Previously, SBO loans had been excluded from our reporting. 4) 1st lien only. Updated home values derived using a combination of appraisals, BPOs, AVMs and MSA level house price indices. 1Q 2023 Preliminary Results20
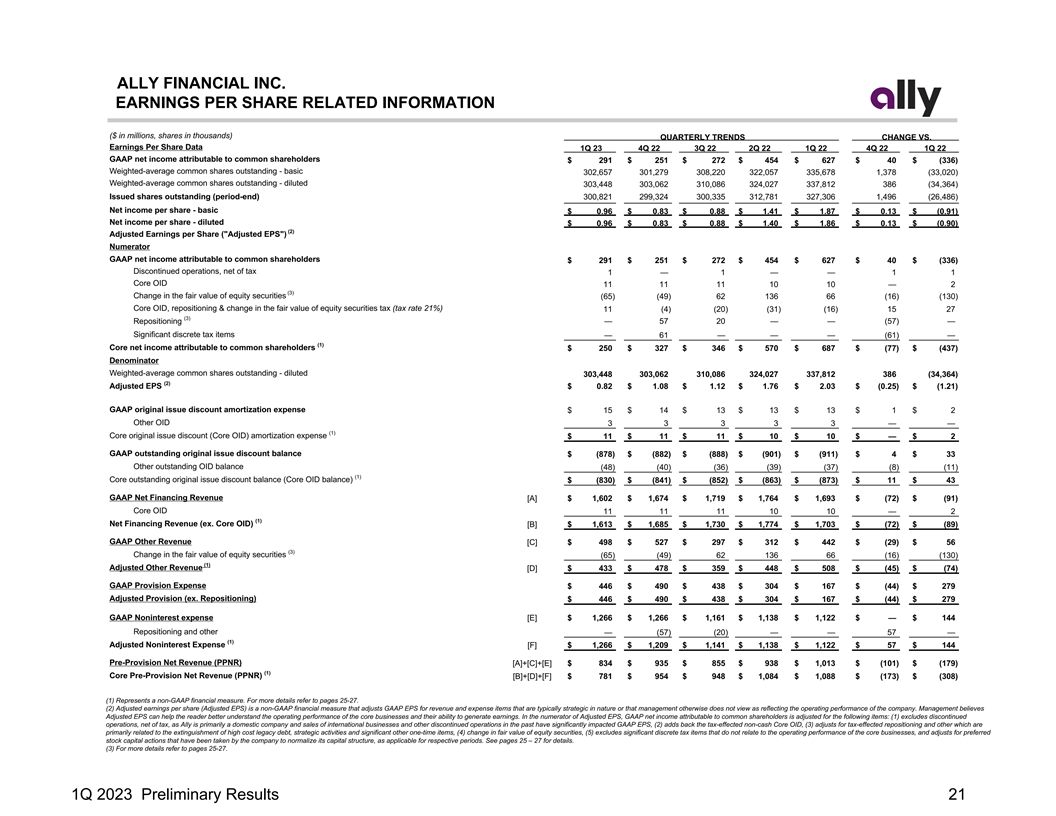
ALLY FINANCIAL INC. EARNINGS PER SHARE RELATED INFORMATION ($ in millions, shares in thousands) QUARTERLY TRENDS CHANGE VS. Earnings Per Share Data 1Q 23 4Q 22 3Q 22 2Q 22 1Q 22 4Q 22 1Q 22 GAAP net income attributable to common shareholders $ 291 $ 251 $ 272 $ 454 $ 627 $ 40 $ (336) Weighted-average common shares outstanding - basic 302,657 301,279 308,220 322,057 335,678 1,378 (33,020) Weighted-average common shares outstanding - diluted 303,448 303,062 310,086 324,027 337,812 386 (34,364) Issued shares outstanding (period-end) 300,821 299,324 300,335 312,781 327,306 1,496 (26,486) Net income per share - basic $ 0.96 $ 0.83 $ 0.88 $ 1.41 $ 1.87 $ 0.13 $ (0.91) Net income per share - diluted $ 0.96 $ 0.83 $ 0.88 $ 1.40 $ 1.86 $ 0.13 $ (0.90) (2) Adjusted Earnings per Share ( Adjusted EPS ) Numerator GAAP net income attributable to common shareholders $ 291 $ 251 $ 272 $ 454 $ 627 $ 40 $ (336) Discontinued operations, net of tax 1 — 1 — — 1 1 Core OID 11 11 11 10 10 — 2 (3) Change in the fair value of equity securities (65) (49) 62 136 66 (16) (130) Core OID, repositioning & change in the fair value of equity securities tax (tax rate 21%) 11 (4) (20) (31) (16) 15 27 (3) Repositioning — 57 20 — — (57) — Significant discrete tax items — 61 — — — (61) — (1) Core net income attributable to common shareholders $ 250 $ 327 $ 346 $ 570 $ 687 $ (77) $ (437) Denominator Weighted-average common shares outstanding - diluted 303,448 303,062 310,086 324,027 337,812 386 (34,364) (2) Adjusted EPS $ 0.82 $ 1.08 $ 1.12 $ 1.76 $ 2.03 $ (0.25) $ (1.21) GAAP original issue discount amortization expense $ 15 $ 14 $ 13 $ 13 $ 13 $ 1 $ 2 Other OID 3 3 3 3 3 — — (1) Core original issue discount (Core OID) amortization expense $ 11 $ 11 $ 11 $ 10 $ 10 $ — $ 2 GAAP outstanding original issue discount balance $ (878) $ (882) $ (888) $ (901) $ (911) $ 4 $ 33 Other outstanding OID balance (48) (40) (36) (39) (37) (8) (11) (1) Core outstanding original issue discount balance (Core OID balance) $ (830) $ (841) $ (852) $ (863) $ (873) $ 11 $ 43 GAAP Net Financing Revenue [A] $ 1,602 $ 1,674 $ 1,719 $ 1,764 $ 1,693 $ (72) $ (91) Core OID 11 11 11 10 10 — 2 (1) Net Financing Revenue (ex. Core OID) [B] $ 1,613 $ 1,685 $ 1,730 $ 1,774 $ 1,703 $ (72) $ (89) GAAP Other Revenue [C] $ 498 $ 527 $ 297 $ 312 $ 442 $ (29) $ 56 (3) Change in the fair value of equity securities (65) (49) 62 136 66 (16) (130) (1) Adjusted Other Revenue [D] $ 433 $ 478 $ 359 $ 448 $ 508 $ (45) $ (74) GAAP Provision Expense $ 446 $ 490 $ 438 $ 304 $ 167 $ (44) $ 279 Adjusted Provision (ex. Repositioning) $ 446 $ 490 $ 438 $ 304 $ 167 $ (44) $ 279 GAAP Noninterest expense [E] $ 1,266 $ 1,266 $ 1,161 $ 1,138 $ 1,122 $ — $ 144 Repositioning and other — (57) (20) — — 57 — (1) Adjusted Noninterest Expense [F] $ 1,266 $ 1,209 $ 1,141 $ 1,138 $ 1,122 $ 57 $ 144 Pre-Provision Net Revenue (PPNR) [A]+[C]+[E] $ 834 $ 935 $ 855 $ 938 $ 1,013 $ (101) $ (179) (1) Core Pre-Provision Net Revenue (PPNR) [B]+[D]+[F] $ 781 $ 954 $ 948 $ 1,084 $ 1,088 $ (173) $ (308) (1) Represents a non-GAAP financial measure. For more details refer to pages 25-27. (2) Adjusted earnings per share (Adjusted EPS) is a non-GAAP financial measure that adjusts GAAP EPS for revenue and expense items that are typically strategic in nature or that management otherwise does not view as reflecting the operating performance of the company. Management believes Adjusted EPS can help the reader better understand the operating performance of the core businesses and their ability to generate earnings. In the numerator of Adjusted EPS, GAAP net income attributable to common shareholders is adjusted for the following items: (1) excludes discontinued operations, net of tax, as Ally is primarily a domestic company and sales of international businesses and other discontinued operations in the past have significantly impacted GAAP EPS, (2) adds back the tax-effected non-cash Core OID, (3) adjusts for tax-effected repositioning and other which are primarily related to the extinguishment of high cost legacy debt, strategic activities and significant other one-time items, (4) change in fair value of equity securities, (5) excludes significant discrete tax items that do not relate to the operating performance of the core businesses, and adjusts for preferred stock capital actions that have been taken by the company to normalize its capital structure, as applicable for respective periods. See pages 25 – 27 for details. (3) For more details refer to pages 25-27. 1Q 2023 Preliminary Results21
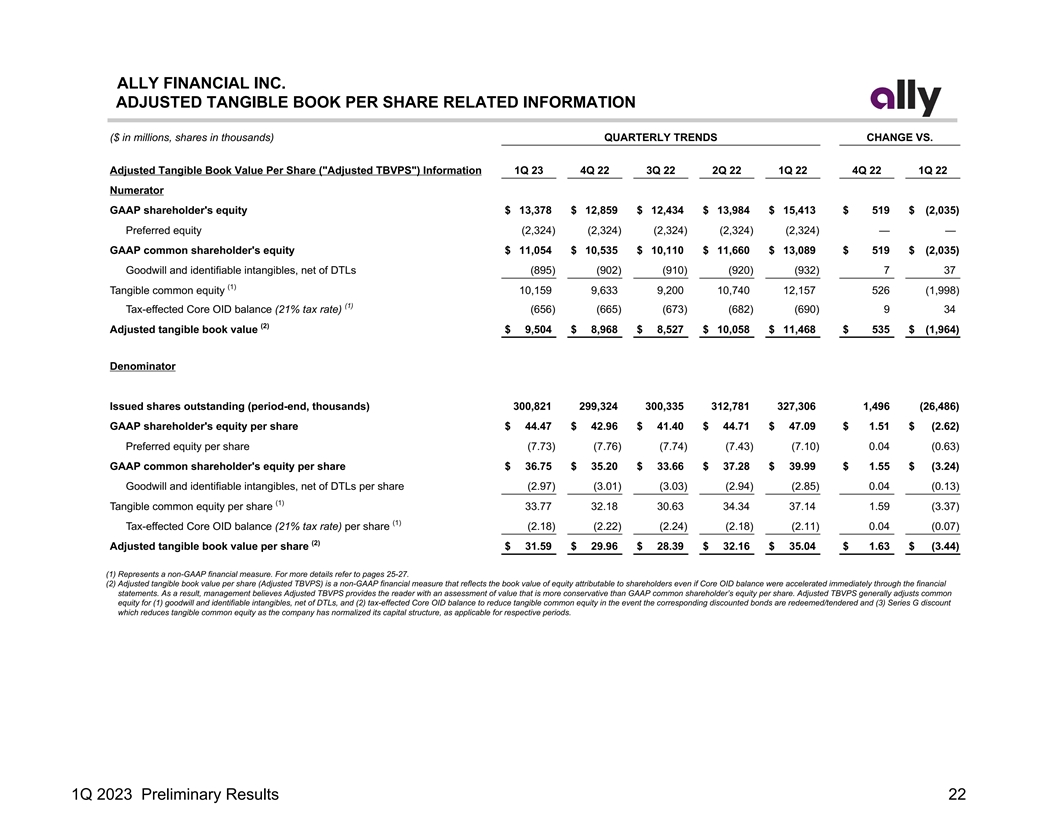
ALLY FINANCIAL INC. ADJUSTED TANGIBLE BOOK PER SHARE RELATED INFORMATION ($ in millions, shares in thousands) QUARTERLY TRENDS CHANGE VS. Adjusted Tangible Book Value Per Share ( Adjusted TBVPS ) Information 1Q 23 4Q 22 3Q 22 2Q 22 1Q 22 4Q 22 1Q 22 Numerator GAAP shareholder's equity $ 13,378 $ 12,859 $ 12,434 $ 13,984 $ 15,413 $ 519 $ (2,035) Preferred equity (2,324) (2,324) (2,324) (2,324) (2,324) — — GAAP common shareholder's equity $ 11,054 $ 10,535 $ 10,110 $ 11,660 $ 13,089 $ 519 $ (2,035) Goodwill and identifiable intangibles, net of DTLs (895) (902) (910) (920) (932) 7 37 (1) Tangible common equity 10,159 9,633 9,200 10,740 12,157 526 (1,998) (1) Tax-effected Core OID balance (21% tax rate) (656) (665) (673) (682) (690) 9 34 (2) Adjusted tangible book value $ 9,504 $ 8,968 $ 8,527 $ 10,058 $ 11,468 $ 535 $ (1,964) Denominator Issued shares outstanding (period-end, thousands) 300,821 299,324 300,335 312,781 327,306 1,496 (26,486) GAAP shareholder's equity per share $ 44.47 $ 42.96 $ 41.40 $ 44.71 $ 47.09 $ 1.51 $ (2.62) Preferred equity per share (7.73) (7.76) (7.74) (7.43) (7.10) 0.04 (0.63) GAAP common shareholder's equity per share $ 36.75 $ 35.20 $ 33.66 $ 37.28 $ 39.99 $ 1.55 $ (3.24) Goodwill and identifiable intangibles, net of DTLs per share (2.97) (3.01) (3.03) (2.94) (2.85) 0.04 (0.13) (1) Tangible common equity per share 33.77 32.18 30.63 34.34 37.14 1.59 (3.37) (1) Tax-effected Core OID balance (21% tax rate) per share (2.18) (2.22) (2.24) (2.18) (2.11) 0.04 (0.07) (2) Adjusted tangible book value per share $ 31.59 $ 29.96 $ 28.39 $ 32.16 $ 35.04 $ 1.63 $ (3.44) (1) Represents a non-GAAP financial measure. For more details refer to pages 25-27. (2) Adjusted tangible book value per share (Adjusted TBVPS) is a non-GAAP financial measure that reflects the book value of equity attributable to shareholders even if Core OID balance were accelerated immediately through the financial statements. As a result, management believes Adjusted TBVPS provides the reader with an assessment of value that is more conservative than GAAP common shareholder’s equity per share. Adjusted TBVPS generally adjusts common equity for (1) goodwill and identifiable intangibles, net of DTLs, and (2) tax-effected Core OID balance to reduce tangible common equity in the event the corresponding discounted bonds are redeemed/tendered and (3) Series G discount which reduces tangible common equity as the company has normalized its capital structure, as applicable for respective periods. 1Q 2023 Preliminary Results22
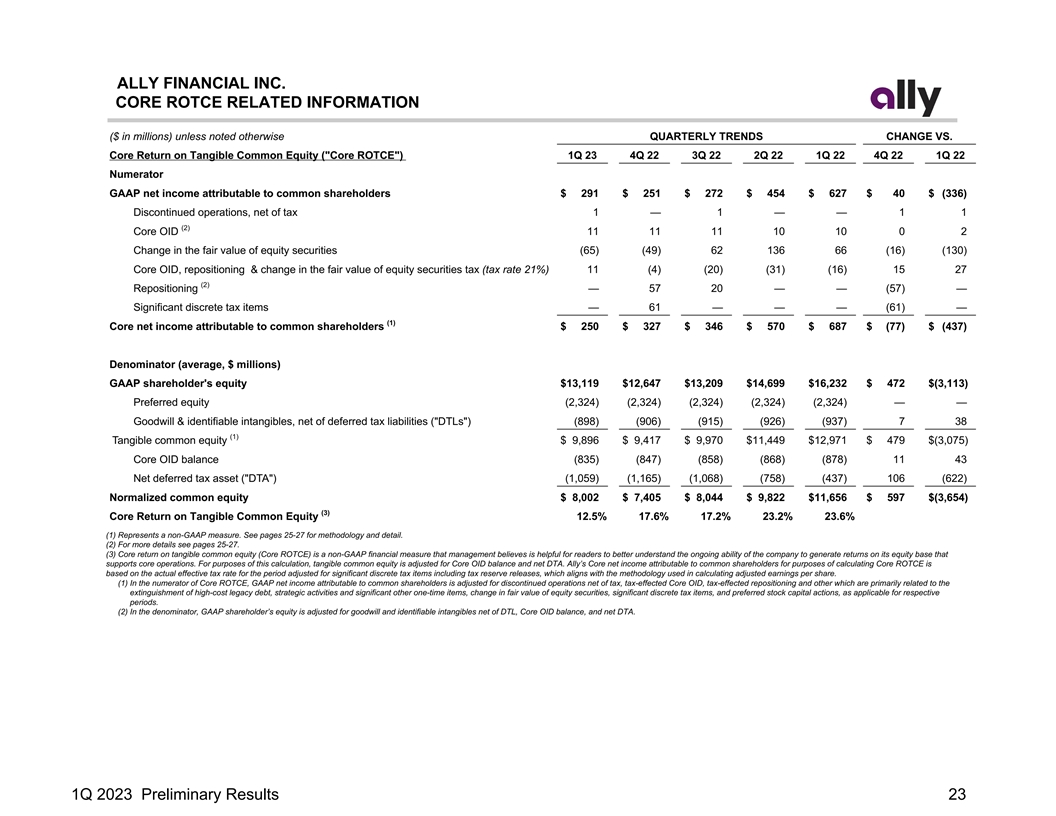
ALLY FINANCIAL INC. CORE ROTCE RELATED INFORMATION ($ in millions) unless noted otherwise QUARTERLY TRENDS CHANGE VS. Core Return on Tangible Common Equity ( Core ROTCE ) 1Q 23 4Q 22 3Q 22 2Q 22 1Q 22 4Q 22 1Q 22 Numerator GAAP net income attributable to common shareholders $ 291 $ 251 $ 272 $ 454 $ 627 $ 40 $ (336) Discontinued operations, net of tax 1 — 1 — — 1 1 (2) Core OID 11 11 11 10 10 0 2 Change in the fair value of equity securities (65) (49) 62 136 66 (16) (130) Core OID, repositioning & change in the fair value of equity securities tax (tax rate 21%) 11 (4) (20) (31) (16) 15 27 (2) Repositioning — 57 20 — — (57) — Significant discrete tax items — 61 — — — (61) — (1) Core net income attributable to common shareholders $ 250 $ 327 $ 346 $ 570 $ 687 $ (77) $ (437) Denominator (average, $ millions) GAAP shareholder's equity $ 13,119 $ 12,647 $ 13,209 $ 14,699 $ 16,232 $ 472 $( 3,113) Preferred equity (2,324) (2,324) (2,324) (2,324) (2,324) — — Goodwill & identifiable intangibles, net of deferred tax liabilities ( DTLs ) (898) (906) (915) (926) (937) 7 38 (1) Tangible common equity $ 9,896 $ 9,417 $ 9,970 $ 11,449 $ 12,971 $ 479 $ (3,075) Core OID balance (835) (847) (858) (868) (878) 11 43 Net deferred tax asset ( DTA ) (1,059) (1,165) (1,068) (758) (437) 106 (622) Normalized common equity $ 8,002 $ 7,405 $ 8,044 $ 9,822 $ 11,656 $ 597 $ (3,654) (3) Core Return on Tangible Common Equity 1 2.5% 17.6% 17.2% 2 3.2 % 23.6 % (1) Represents a non-GAAP measure. See pages 25-27 for methodology and detail. (2) For more details see pages 25-27. (3) Core return on tangible common equity (Core ROTCE) is a non-GAAP financial measure that management believes is helpful for readers to better understand the ongoing ability of the company to generate returns on its equity base that supports core operations. For purposes of this calculation, tangible common equity is adjusted for Core OID balance and net DTA. Ally’s Core net income attributable to common shareholders for purposes of calculating Core ROTCE is based on the actual effective tax rate for the period adjusted for significant discrete tax items including tax reserve releases, which aligns with the methodology used in calculating adjusted earnings per share. (1) In the numerator of Core ROTCE, GAAP net income attributable to common shareholders is adjusted for discontinued operations net of tax, tax-effected Core OID, tax-effected repositioning and other which are primarily related to the extinguishment of high-cost legacy debt, strategic activities and significant other one-time items, change in fair value of equity securities, significant discrete tax items, and preferred stock capital actions, as applicable for respective periods. (2) In the denominator, GAAP shareholder’s equity is adjusted for goodwill and identifiable intangibles net of DTL, Core OID balance, and net DTA. 1Q 2023 Preliminary Results23
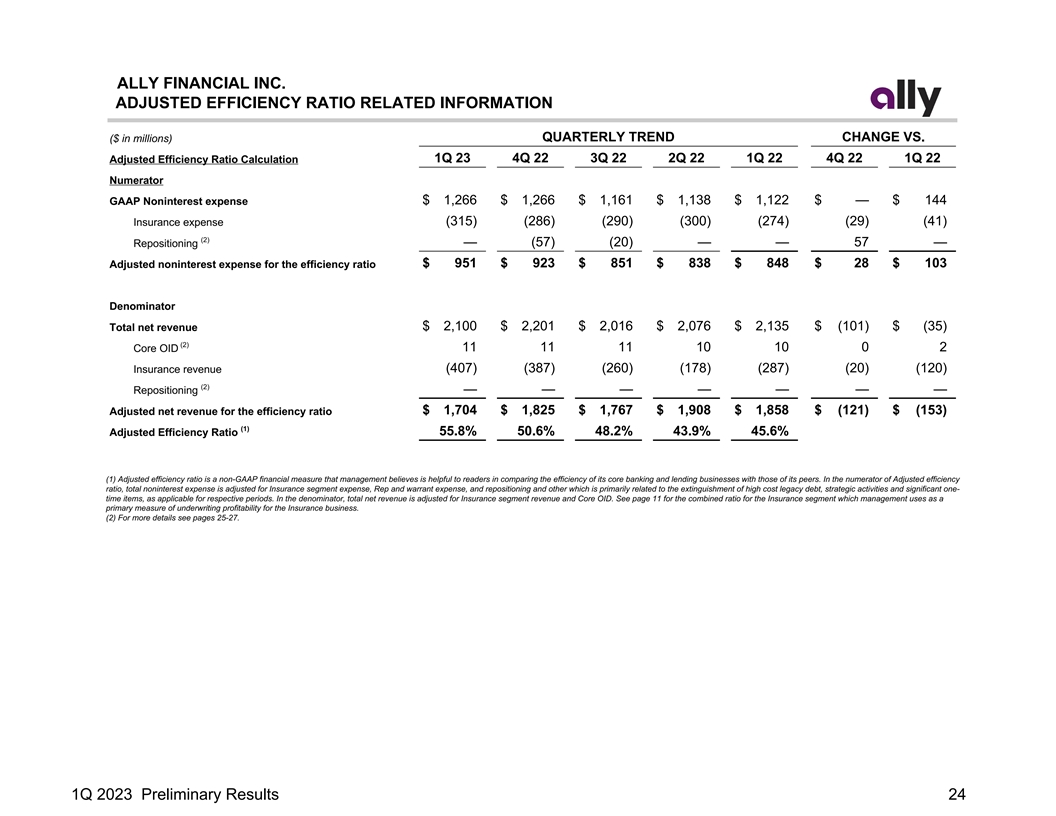
ALLY FINANCIAL INC. ADJUSTED EFFICIENCY RATIO RELATED INFORMATION QUARTERLY TREND CHANGE VS. ($ in millions) Adjusted Efficiency Ratio Calculation 1Q 23 4Q 22 3Q 22 2Q 22 1Q 22 4Q 22 1Q 22 Numerator $ 1,266 $ 1,266 $ 1,161 $ 1,138 $ 1,122 $ — $ 144 GAAP Noninterest expense (315) (286) (290) (300) (274) (29) (41) Insurance expense (2) Repositioning — (57) (20) — — 57 — Adjusted noninterest expense for the efficiency ratio $ 951 $ 923 $ 851 $ 838 $ 848 $ 28 $ 103 Denominator Total net revenue $ 2,100 $ 2,201 $ 2,016 $ 2,076 $ 2,135 $ (101) $ (35) (2) Core OID 11 11 11 10 10 0 2 (407) (387) (260) (178) (287) (20) (120) Insurance revenue (2) — — — — — — — Repositioning Adjusted net revenue for the efficiency ratio $ 1,704 $ 1,825 $ 1,767 $ 1,908 $ 1,858 $ (121) $ (153) (1) Adjusted Efficiency Ratio 5 5.8 % 50.6 % 4 8.2% 4 3.9% 4 5.6% (1) Adjusted efficiency ratio is a non-GAAP financial measure that management believes is helpful to readers in comparing the efficiency of its core banking and lending businesses with those of its peers. In the numerator of Adjusted efficiency ratio, total noninterest expense is adjusted for Insurance segment expense, Rep and warrant expense, and repositioning and other which is primarily related to the extinguishment of high cost legacy debt, strategic activities and significant one- time items, as applicable for respective periods. In the denominator, total net revenue is adjusted for Insurance segment revenue and Core OID. See page 11 for the combined ratio for the Insurance segment which management uses as a primary measure of underwriting profitability for the Insurance business. (2) For more details see pages 25-27. 1Q 2023 Preliminary Results24
ALLY FINANCIAL INC. The following are non-GAAP financial measures which Ally believes are important to the reader of the Consolidated Financial Statements, but which are supplemental to and not a substitute for GAAP measures: Accelerated issuance expense (Accelerated OID), Adjusted earnings per share (Adjusted EPS), Adjusted efficiency ratio, Adjusted noninterest expense, Adjusted other revenue, Adjusted tangible book value per share (Adjusted TBVPS), Adjusted total net revenue, Core net income attributable to common shareholders, Core original issue discount (Core OID) amortization expense, Core outstanding original issue discount balance (Core OID balance), Core pre-provision net revenue (Core PPNR), Core pre-tax income, Core return on tangible common equity (Core ROTCE), Investment income and other (adjusted), Net financing revenue (excluding Core OID), Net interest margin (excluding Core OID), Pre-provision net revenue (PPNR), and Tangible Common Equity. These measures are used by management and we believe are useful to investors in assessing the company’s operating performance and capital. 1) Accelerated issuance expense (Accelerated OID) is the recognition of issuance expenses related to calls of redeemable debt. 2) Adjusted earnings per share (Adjusted EPS) is a non-GAAP financial measure that adjusts GAAP EPS for revenue and expense items that are typically strategic in nature or that management otherwise does not view as reflecting the operating performance of the company. Management believes Adjusted EPS can help the reader better understand the operating performance of the core businesses and their ability to generate earnings. In the numerator of Adjusted EPS, GAAP net income attributable to common shareholders is adjusted for the following items: (1) excludes discontinued operations, net of tax, as Ally is primarily a domestic company and sales of international businesses and other discontinued operations in the past have significantly impacted GAAP EPS, (2) adds back the tax-effected non-cash Core OID, (3) adjusts for tax-effected repositioning and other which are primarily related to the extinguishment of high cost legacy debt, strategic activities and significant other one- time items, (4) change in fair value of equity securities, (5) excludes significant discrete tax items that do not relate to the operating performance of the core businesses, and adjusts for preferred stock capital actions that have been taken by the company to normalize its capital structure, as applicable for respective periods. 3) Adjusted efficiency ratio is a non-GAAP financial measure that management believes is helpful to readers in comparing the efficiency of its core banking and lending businesses with those of its peers. (1) In the numerator of Adjusted efficiency ratio, total noninterest expense is adjusted for Rep and warrant expense, Insurance segment expense, and repositioning and other which are primarily related to the extinguishment of high-cost legacy debt, strategic activities and significant other one-time items, as applicable for respective periods. (2) In the denominator, total net revenue is adjusted for Core OID and Insurance segment revenue. 4) Adjusted noninterest expense is a non-GAAP financial measure that adjusts GAAP noninterest expense for repositioning items. Management believes adjusted noninterest expense is a helpful financial metric because it enables the reader better understand the business' expenses excluding nonrecurring items. 5) Adjusted other revenue is a non-GAAP financial measure that adjusts GAAP other revenue for OID expenses, repositioning, and change in fair value of equity securities. Management believes adjusted other revenue is a helpful financial metric because it enables the reader to better understand the business' ability to generate other revenue. 6) Adjusted tangible book value per share (Adjusted TBVPS) is a non-GAAP financial measure that reflects the book value of equity attributable to shareholders even if Core OID balance were accelerated immediately through the financial statements. As a result, management believes Adjusted TBVPS provides the reader with an assessment of value that is more conservative than GAAP common shareholder’s equity per share. Adjusted TBVPS generally adjusts common equity for: (1) goodwill and identifiable intangibles, net of DTLs, (2) tax-effected Core OID balance to reduce tangible common equity in the event the corresponding discounted bonds are redeemed/tendered, and (3) Series G discount which reduces tangible common equity as the company has normalized its capital structure, as applicable for respective periods. Note: In December 2017, tax-effected Core OID balance was adjusted from a statutory U.S. Federal tax rate of 35% to 21% (“rate”) as a result of changes to U.S. tax law. The adjustment conservatively increased the tax-effected Core OID balance and consequently reduced Adjusted TBVPS as any acceleration of the non-cash charge in future periods would flow through the financial statements at a 21% rate versus a previously modeled 35% rate. 7) Adjusted total net revenue is a non-GAAP financial measure that management believes is helpful for readers to understand the ongoing ability of the company to generate revenue. For purposes of this calculation, GAAP net financing revenue is adjusted by excluding Core OID to calculate net financing revenue ex. core OID. GAAP other revenue is adjusted for OID expenses, repositioning, and change in fair value of equity securities to calculate adjusted other revenue. Adjusted total net revenue is calculated by adding net financing revenue ex. core OID to adjusted other revenue. 8) Change in fair value of equity securities impacts the Insurance, Corporate Finance and Corporate and Other segments. The change reflects fair value adjustments to equity securities that are reported at fair value. Management believes the change in fair value of equity securities should be removed from select financial measures because it enables the reader to better understand the business’ ongoing ability to generate revenue and income. 9) Core net income attributable to common shareholders is a non-GAAP financial measure that serves as the numerator in the calculations of Adjusted EPS and Core ROTCE and that, like those measures, is believed by management to help the reader better understand the operating performance of the core businesses and their ability to generate earnings. Core net income attributable to common shareholders adjusts GAAP net income attributable to common shareholders for discontinued operations net of tax, tax-effected Core OID expense, tax-effected repositioning and other primarily related to the extinguishment of high-cost legacy debt and strategic activities and significant other, preferred stock capital actions, significant discrete tax items and tax-effected changes in equity investments measured at fair value, as applicable for respective periods. 1Q 2023 Preliminary Results25
ALLY FINANCIAL INC. The following are non-GAAP financial measures which Ally believes are important to the reader of the Consolidated Financial Statements, but which are supplemental to and not a substitute for GAAP measures: Accelerated issuance expense (Accelerated OID), Adjusted earnings per share (Adjusted EPS), Adjusted efficiency ratio, Adjusted noninterest expense, Adjusted other revenue, Adjusted tangible book value per share (Adjusted TBVPS), Adjusted total net revenue, Core net income attributable to common shareholders, Core original issue discount (Core OID) amortization expense, Core outstanding original issue discount balance (Core OID balance), Core pre-provision net revenue (Core PPNR), Core pre-tax income, Core return on tangible common equity (Core ROTCE), Investment income and other (adjusted), Net financing revenue (excluding Core OID), Net interest margin (excluding Core OID), Pre-provision net revenue (PPNR), and Tangible Common Equity. These measures are used by management and we believe are useful to investors in assessing the company’s operating performance and capital. 10) Core original issue discount (Core OID) amortization expense is a non-GAAP financial measure for OID and is believed by management to help the reader better understand the activity removed from: Core pre-tax income (loss), Core net income (loss) attributable to common shareholders, Adjusted EPS, Core ROTCE, Adjusted efficiency ratio, Adjusted total net revenue, and Net financing revenue (excluding Core OID). Core OID is primarily related to bond exchange OID which excludes international operations and future issuances. Core OID for all periods shown is applied to the pre-tax income of the Corporate and Other segment. 11) Core outstanding original issue discount balance (Core OID balance) is a non-GAAP financial measure for outstanding OID and is believed by management to help the reader better understand the balance removed from Core ROTCE and Adjusted TBVPS. Core OID balance is primarily related to bond exchange OID which excludes international operations and future issuances. 12) Core pre-provision net revenue (Core PPNR) is a non-GAAP financial measure calculated by adding GAAP net financing revenue and GAAP other revenue and subtracting GAAP noninterest expense then adding Core OID and repositioning expenses, excluding provision for credit losses. Management believes that Core PPNR is a helpful financial metric because it enables the reader to assess the core business' ability to generate earnings to cover credit losses. 13) Core pre-tax income is a non-GAAP financial measure that adjusts pre-tax income from continuing operations by excluding (1) Core OID, and (2) change in fair value of equity securities (change in fair value of equity securities impacts the Insurance and Corporate Finance segments), and (3) Repositioning and other which are primarily related to the extinguishment of high cost legacy debt, strategic activities and significant other one-time items, as applicable for respective periods or businesses. Management believes core pre-tax income can help the reader better understand the operating performance of the core businesses and their ability to generate earnings. 14) Core return on tangible common equity (Core ROTCE) is a non-GAAP financial measure that management believes is helpful for readers to better understand the ongoing ability of the company to generate returns on its equity base that supports core operations. For purposes of this calculation, tangible common equity is adjusted for Core OID balance and net DTA. Ally’s Core net income attributable to common shareholders for purposes of calculating Core ROTCE is based on the actual effective tax rate for the period adjusted for significant discrete tax items including tax reserve releases, which aligns with the methodology used in calculating adjusted earnings per share. (1) In the numerator of Core ROTCE, GAAP net income attributable to common shareholders is adjusted for discontinued operations net of tax, tax-effected Core OID, tax-effected repositioning and other which are primarily related to the extinguishment of high-cost legacy debt, strategic activities and significant other one- time items, change in fair value of equity securities, significant discrete tax items, and preferred stock capital actions, as applicable for respective periods. (2) In the denominator, GAAP shareholder’s equity is adjusted for goodwill and identifiable intangibles net of DTL, Core OID balance, and net DTA. 15) Estimated impact of CECL on regulatory capital per final rule issued by U.S. banking agencies - In December 2018, the FRB and other U.S. banking agencies approved a final rule to address the impact of CECL on regulatory capital by allowing BHCs and banks, including Ally, the option to phase in the day-one impact of CECL over a three-year period. In March 2020, the FRB and other U.S. banking agencies issued an interim final rule that became effective on March 31, 2020 and provided an alternative option for banks to temporarily delay the impacts of CECL, relative to the incurred loss methodology for estimating the allowance for loan losses, on regulatory capital. A final rule that was largely unchanged from the March 2020 interim final rule was issued by the FRB and other U.S. banking agencies in August 2020, and became effective in September 2020. For regulatory capital purposes, these rules permitted us to delay recognizing the estimated impact of CECL on regulatory capital until after a two-year deferral period, which for us extended through December 31, 2021. Beginning on January 1, 2022, we are required to phase in 25% of the previously deferred estimated capital impact of CECL, with an additional 25% to be phased in at the beginning of each subsequent year until fully phased in by the first quarter of 2025. Under these rules, firms that adopt CECL and elect the five-year transition will calculate the estimated impact of CECL on regulatory capital as the day-one impact of adoption plus 25% of the subsequent change in allowance during the two-year deferral period, which according to the final rule approximates the impact of CECL relative to an incurred loss model. We adopted this transition option during the first quarter of 2020, and beginning January 1, 2022, are phasing in the regulatory capital impacts of CECL based on this five-year transition period. 16) Investment income and other (adjusted) is a non-GAAP financial measure that adjusts GAAP investment income and other for repositioning, and the change in fair value of equity securities. Management believes investment income and other (adjusted) is a helpful financial metric because it enables the reader to better understand the business' ability to generate investment income. 17) Net financing revenue excluding core OID is calculated using a non-GAAP measure that adjusts net financing revenue by excluding Core OID. The Core OID balance is primarily related to bond exchange OID which excludes international operations and future issuances. Management believes net financing revenue ex. Core OID is a helpful financial metric because it enables the reader to better understand the business' ability to generate revenue. 18) Net interest margin excluding core OID is calculated using a non-GAAP measure that adjusts net interest margin by excluding Core OID. The Core OID balance is primarily related to bond exchange OID which excludes international operations and future issuances. Management believes net interest margin ex. Core OID is a helpful financial metric because it enables the reader to better understand the business' profitability and margins. 1Q 2023 Preliminary Results26
ALLY FINANCIAL INC. The following are non-GAAP financial measures which Ally believes are important to the reader of the Consolidated Financial Statements, but which are supplemental to and not a substitute for GAAP measures: Accelerated issuance expense (Accelerated OID), Adjusted earnings per share (Adjusted EPS), Adjusted efficiency ratio, Adjusted noninterest expense, Adjusted other revenue, Adjusted tangible book value per share (Adjusted TBVPS), Adjusted total net revenue, Core net income attributable to common shareholders, Core original issue discount (Core OID) amortization expense, Core outstanding original issue discount balance (Core OID balance), Core pre-provision net revenue (Core PPNR), Core pre-tax income, Core return on tangible common equity (Core ROTCE), Investment income and other (adjusted), Net financing revenue (excluding Core OID), Net interest margin (excluding Core OID), Pre-provision net revenue (PPNR), and Tangible Common Equity. These measures are used by management and we believe are useful to investors in assessing the company’s operating performance and capital. 19) Pre-provision net revenue (PPNR) is a non-GAAP financial measure calculated by adding GAAP net financing revenue and GAAP other revenue then subtracting GAAP noninterest expense, excluding provision for credit losses. Management believes that PPNR is a helpful financial metric because it enables the reader to assess the business’ ability to generate earnings to cover credit losses and as it is utilized by Federal Reserve's approach to modeling within the Supervisory Stress Test Framework that generally follows U.S. generally accepted accounting principles (GAAP) and includes a calculation of PPNR as a component of projected pre-tax net income. 20) Repositioning is primarily related to the extinguishment of high-cost legacy debt, strategic activities and other one-time items. 21) Tangible Common Equity is a non-GAAP financial measure that is defined as common stockholders’ equity less goodwill and identifiable intangible assets, net of deferred tax liabilities. Ally considers various measures when evaluating capital adequacy, including tangible common equity. Ally believes that tangible common equity is important because we believe readers may assess our capital adequacy using this measure. Additionally, presentation of this measure allows readers to compare certain aspects of our capital adequacy on the same basis to other companies in the industry. For purposes of calculating Core return on tangible common equity (Core ROTCE), tangible common equity is further adjusted for Core OID balance and net deferred tax asset. 1Q 2023 Preliminary Results27