UNITED STATES
SECURITIES AND EXCHANGE COMMISSION
Washington, D.C. 20549
FORM N-CSR
Certified Shareholder Report of
Registered Management Investment Companies
Investment Company Act File Number: 811-00862
The Growth Fund of America, Inc.
(Exact Name of Registrant as Specified in Charter)
P.O. Box 7650, One Market, Steuart Tower
San Francisco, California 94120
(Address of Principal Executive Offices)
Registrant's telephone number, including area code: (415) 421-9360
Date of fiscal year end: August 31
Date of reporting period: February 28, 2013
Patrick F. Quan
The Growth Fund of America, Inc.
P.O. Box 7650, One Market, Steuart Tower
San Francisco, California 94120
(Name and Address of Agent for Service)
Copies to:
Mark D. Perlow
K&L Gates LLP
Four Embarcadero Center, Suite 1200
San Francisco, California 94111
(Counsel for the Registrant)
ITEM 1 – Reports to Stockholders

The right choice for the long term®
The Growth Fund
of America ®
Semi-annual report for the six months ended February 28, 2013
The Growth Fund of America invests in a wide range of companies that appear to offer superior opportunities for growth of capital.
This fund is one of more than 40 offered by American Funds, which is one of the nation’s largest mutual fund families. For more than 80 years, Capital Research and Management Company,SM the American Funds adviser, has invested with a long-term focus based on thorough research and attention to risk.
Fund results shown in this report, unless otherwise indicated, are for Class A shares at net asset value. If a sales charge (maximum 5.75%) had been deducted, the results would have been lower. Results are for past periods and are not predictive of results for future periods. Current and future results may be lower or higher than those shown. Share prices and returns will vary, so investors may lose money. Investing for short periods makes losses more likely. Investments are not FDIC-insured, nor are they deposits of or guaranteed by a bank or any other entity, so they may lose value. For current information and month-end results, visit americanfunds.com.
Here are the average annual total returns on a $1,000 investment with all distributions reinvested for periods ended March 31, 2013 (the most recent calendar quarter-end):
| | | 1 year | | | 5 years | | | 10 years | |
| Class A shares | | | | | | | | | | | | |
| |
| Reflecting 5.75% maximum sales charge | | | 7.63% | | | | 3.22% | | | | 8.76% | |
The total annual fund operating expense ratio was 0.71% for Class A shares as of the prospectus dated November 1, 2012.
Investment results assume all distributions are reinvested and reflect applicable fees and expenses. When applicable, investment results reflect fee waivers, without which results would have been lower. Visit americanfunds.com for more information.
Results for other share classes can be found on page 30.
Refer to the fund prospectus and the Risk Factors section of this report for more information on risks associated with investing in the fund.

Fellow investors:
U.S. stocks produced solid gains for the six months ended February 28, 2013. The unmanaged Standard & Poor’s 500 Composite Index, a broad measure of the U.S. stock market, ended the period near its all-time high. While market returns were temporarily hampered by the uncertainty around the U.S. presidential election and the fiscal cliff debate, stocks have generally done well since a bottom in mid-November. Corporate earnings and the economy have resumed their slow advance. For example, the Commerce Department reported that January new home sales rose almost 16% to their highest level in more than four years.
However, core challenges remain, so investors will continue to evaluate whether progress on these issues looks good. Paramount on the list of challenges is the trajectory of U.S. deficits and debt, as well as European sovereign debt and economic issues.
Results at a glance
Total returns for periods ended February 28, 2013, with all distributions reinvested
| | | Total returns | | | Average annual total returns |
| | | 6 months | | | 1 year | | | 5 years | | | 10 years | | | Lifetime1 | |
The Growth Fund of America
(Class A shares) | | | 10.9 | % | | | 13.2 | % | | | 3.5 | % | | | 9.1 | % | | | 13.5 | % |
| Standard & Poor’s 500 Composite Index2 | | | 8.9 | | | | 13.4 | | | | 4.9 | | | | 8.2 | | | | 10.6 | |
| Lipper Capital Appreciation Funds Index | | | 9.6 | | | | 10.0 | | | | 3.7 | | | | 8.9 | | | | 10.6 | |
| Lipper Growth Funds Index | | | 9.0 | | | | 11.1 | | | | 4.0 | | | | 7.3 | | | | 9.5 | |
| Lipper Large-Cap Core Funds Index | | | 9.9 | | | | 12.9 | | | | 4.1 | | | | 7.2 | | | | — | 3 |
| Lipper Large-Cap Growth Funds Index | | | 6.6 | | | | 7.4 | | | | 4.3 | | | | 7.3 | | | | — | 3 |
| 1 | Since Capital Research and Management Company (CRMC) began managing the fund on December 1, 1973. |
| 2 | The S&P 500 is unmanaged and, therefore, has no expenses. |
| 3 | This Lipper index was not in existence when CRMC began managing the fund. |
| The Growth Fund of America | 1 |
The Growth Fund of America (GFA) posted a total return of 10.9% for the six months ended February 28, compared with 8.9% for the S&P 500. GFA’s return also exceeded the four Lipper peer indexes. We are pleased to report that the results are satisfying on both an absolute and relative basis.
Over longer periods of 10 years or more, GFA has continued to outpace the S&P 500 and the four Lipper peer indexes. For the 10 years ended February 28, the fund had an average annual total return of 9.1%, compared with 8.2% by the S&P 500. Over its 39-year lifetime, GFA had an average annual total return of 13.5%, compared with 10.6% by the S&P 500. The two applicable Lipper indexes posted returns of 10.6% and 9.5% over the same period.
Investment analysis
Information technology, consumer discretionary and health care sectors made major contributions to the fund in the past six months. Our investment decisions on Apple helped on a relative basis, as we had established a significant position at lower prices and lightened up in the period at higher prices. In the consumer discretionary sector, Virgin Media (+68.3%) led the group, helped by the fact that in early February, the United Kingdom-based cable TV company was acquired by Liberty Global for $23 billion. Other major contributors included Home Depot (+20.7%), Comcast (+18.2%) and Google (+17.0%).
In health care, Gilead Sciences, the fund’s largest holding, rose 48.1%. Gilead develops drugs to treat infectious diseases like hepatitis C. BioMarin Pharmaceuticals was also a strong contributor, as it increased 55.3%. BioMarin develops and commercializes innovative biopharmaceuticals for serious diseases and medical conditions such as genetically defined cancers.
The fund’s materials and energy holdings produced weaker returns when compared with the same sectors in the S&P 500. Two mining companies, Barrick Gold (–21.5%) and Newmont Mining (–20.5%), were among the largest detractors. Apache, an independent oil and gas exploration company, declined 13.4%.
The fund’s cash holdings of 9.6% of total assets detracted from results in the strong up market. Many of the fund’s portfolio counselors believed it was wise to hold some cash
| 2 | The Growth Fund of America |
in this uncertain environment. As a reminder, holding cash is not a top-down decision but an aggregate of the individual decisions of the portfolio counselors. It reflects a concern of some counselors, who are still apprehensive about the fragility of the U.S. economy.
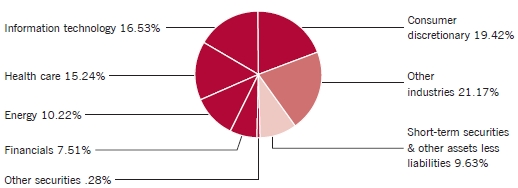
As of February 28, 2013, GFA had 19.4% of its net assets in the consumer discretionary sector, 16.5% in information technology, 15.2% in health care, 11.2% in energy and 7.5% in financial companies. These are the largest sectors in which the fund is invested.
The road ahead
For the next six months, it appears that jobs, housing and consumer spending will continue their slow recovery. This is the good news upon which investors have recently focused. But local, state and federal governments may continue to cut spending as they struggle to balance their budgets. This paints an overall picture of positive but muted economic growth. However, the stock market is not the same as the economy because it anticipates future developments. Investor enthusiasm may wax and wane in the near term, driving markets both ways. This is why we focus on investing for the long term. By investing in fundamentally strong companies selling for reasonable valuations, we believe our time-tested approach will help our investors do well and meet their own long-term financial goals.
As always, we will be using our extensive experience and global research perspective to navigate the challenging times ahead. We welcome our new investors and we thank our veteran investors for their continuing confidence in The Growth Fund of America.
Cordially,

James F. Rothenberg
Vice Chairman of the Board

Donald D. O’Neal
President
April 8, 2013
For current information about the fund, visit americanfunds.com.
| The Growth Fund of America | 3 |
| Summary investment portfolio February 28, 2013 | unaudited |
The following summary investment portfolio is designed to streamline the report and help investors better focus on the fund’s principal holdings. See page 32 for details on how to obtain a complete schedule of portfolio holdings.
| Industry sector diversification | Percent of
net assets |
 |
| Largest equity holdings | | Percent of
net assets | |
| Gilead Sciences | | | 3.8 | % |
| Amazon | | | 3.6 | |
| Google | | | 3.0 | |
| Home Depot | | | 2.5 | |
| Comcast | | | 2.3 | |
| Oracle | | | 1.9 | |
| Philip Morris International | | | 1.6 | |
| EOG Resources | | | 1.6 | |
| Costco Wholesale | | | 1.2 | |
| Allergan | | | 1.1 | |
| Common stocks — 90.09% | | Shares | | | Value
(000) | | | Percent of
net assets | |
| Consumer discretionary — 19.42% | | | | | | | | | |
| Amazon.com, Inc.1 | | | 16,032,600 | | | $ | 4,236,935 | | | | 3.63 | % |
| Home Depot, Inc. | | | 42,205,200 | | | | 2,891,056 | | | | 2.47 | |
| Comcast Corp., Class A | | | 54,735,578 | | | | 2,177,929 | | | | | |
| Comcast Corp., Class A, special nonvoting shares | | | 14,000,000 | | | | 536,340 | | | | 2.32 | |
| NIKE, Inc., Class B | | | 22,700,000 | | | | 1,236,242 | | | | 1.06 | |
| News Corp., Class A | | | 35,644,800 | | | | 1,026,570 | | | | .88 | |
| YUM! Brands, Inc. | | | 11,181,000 | | | | 732,132 | | | | .63 | |
| Las Vegas Sands Corp. | | | 14,122,000 | | | | 727,142 | | | | .62 | |
| DIRECTV1 | | | 13,362,579 | | | | 643,675 | | | | .55 | |
| General Motors Co.1 | | | 20,042,600 | | | | 544,157 | | | | .47 | |
| Johnson Controls, Inc. | | | 16,575,300 | | | | 521,625 | | | | .45 | |
| Other securities | | | | | | | 7,401,755 | | | | 6.34 | |
| | | | | | | | 22,675,558 | | | | 19.42 | |
| 4 | The Growth Fund of America |
| | | | Value | | Percent of | |
| | | Shares | | | (000) | | | net assets | |
| Information technology — 16.53% | | | | | | | | | |
| Google Inc., Class A1 | | 4,406,336 | | $ | 3,530,356 | | | 3.02 | % |
| Oracle Corp. | | 63,743,676 | | | 2,183,858 | | | 1.87 | |
| Texas Instruments Inc. | | 34,144,000 | | | 1,173,529 | | | 1.01 | |
| Microsoft Corp. | | 33,630,608 | | | 934,931 | | | .80 | |
| ASML Holding NV (New York registered) | | 7,523,789 | | | 534,038 | | | | |
| ASML Holding NV | | 4,042,648 | | | 287,750 | | | .70 | |
| Accenture PLC, Class A | | 9,250,000 | | | 687,830 | | | .59 | |
| Taiwan Semiconductor Manufacturing Co. Ltd.2 | | 151,046,000 | | | 531,582 | | | | |
| Taiwan Semiconductor Manufacturing Co. Ltd. (ADR) | | 7,565,000 | | | 138,061 | | | .57 | |
| Apple Inc. | | 1,460,000 | | | 644,444 | | | .55 | |
| Visa Inc., Class A | | 3,925,000 | | | 622,662 | | | .53 | |
| Avago Technologies Ltd.3 | | 16,208,820 | | | 554,666 | | | .48 | |
| Rackspace Hosting, Inc.1,3 | | 9,925,087 | | | 554,415 | | | .48 | |
| Other securities | | | | | 6,919,496 | | | 5.93 | |
| | | | | | 19,297,618 | | | 16.53 | |
| Health care — 15.24% | | | | | | |
| Gilead Sciences, Inc.1,3 | | 103,328,800 | | | 4,413,173 | | | 3.78 | |
| Allergan, Inc. | | 12,132,900 | | | 1,315,449 | | | 1.13 | |
| UnitedHealth Group Inc. | | 24,582,200 | | | 1,313,919 | | | 1.13 | |
| Express Scripts Holding Co.1 | | 17,370,000 | | | 988,527 | | | .85 | |
| Alexion Pharmaceuticals, Inc.1,3 | | 9,762,000 | | | 846,756 | | | .72 | |
| Intuitive Surgical, Inc.1 | | 1,578,694 | | | 804,960 | | | .69 | |
| Edwards Lifesciences Corp.1,3 | | 9,232,700 | | | 793,366 | | | .68 | |
| Biogen Idec Inc.1 | | 4,687,000 | | | 779,636 | | | .67 | |
| Amgen Inc. | | 8,149,600 | | | 744,955 | | | .64 | |
| Merck & Co., Inc. | | 15,067,700 | | | 643,843 | | | .55 | |
| Regeneron Pharmaceuticals, Inc.1 | | 3,481,357 | | | 581,387 | | | .50 | |
| BioMarin Pharmaceutical Inc.1,3 | | 9,667,500 | | | 560,425 | | | .48 | |
| Other securities | | | | | 3,998,213 | | | 3.42 | |
| | | | | | 17,784,609 | | | 15.24 | |
| Energy — 10.22% | | | | | | |
| EOG Resources, Inc.3 | | 14,806,537 | | | 1,861,330 | | | 1.59 | |
| Schlumberger Ltd. | | 13,115,000 | | | 1,021,003 | | | .88 | |
| Noble Energy, Inc. | | 8,891,000 | | | 985,390 | | | .84 | |
| Apache Corp. | | 12,150,000 | | | 902,381 | | | .77 | |
| FMC Technologies, Inc.1,3 | | 16,479,100 | | | 855,430 | | | .73 | |
| Suncor Energy Inc. | | 24,712,520 | | | 748,864 | | | .64 | |
| Pioneer Natural Resources Co. | | 5,785,000 | | | 727,811 | | | .62 | |
| Canadian Natural Resources, Ltd. | | 16,980,000 | | | 518,991 | | | .44 | |
| Other securities | | | | | 4,335,155 | | | 3.71 | |
| | | | | | 11,956,355 | | | 10.22 | |
| The Growth Fund of America | 5 |
| Common stocks | | | Value | | Percent of | |
| | Shares | | | (000) | | | net assets | |
| Financials — 7.51% | | | | | | | | | |
| Goldman Sachs Group, Inc. | | 5,469,696 | | $ | 819,142 | | | .70 | % |
| Bank of America Corp. | | 70,000,000 | | | 786,100 | | | .67 | |
| Wells Fargo & Co. | | 21,992,178 | | | 771,486 | | | .66 | |
| Citigroup Inc. | | 16,924,500 | | | 710,321 | | | .61 | |
| Aon PLC, Class A | | 10,624,000 | | | 649,020 | | | .56 | |
| Other securities | | | | | 5,033,621 | | | 4.31 | |
| | | | | | 8,769,690 | | | 7.51 | |
| | | | | | | | | | |
| Industrials — 6.69% | | | | | | |
| Union Pacific Corp. | | 8,813,300 | | | 1,208,392 | | | 1.03 | |
| Boeing Co. | | 7,050,000 | | | 542,145 | | | .46 | |
| CSX Corp. | | 23,174,801 | | | 531,630 | | | .46 | |
| Other securities | | | | | 5,528,484 | | | 4.74 | |
| | | | | | 7,810,651 | | | 6.69 | |
| | | | | | | | | | |
| Consumer staples — 4.54% | | | | | | | | | |
| Philip Morris International Inc. | | 20,931,000 | | | 1,920,419 | | | 1.65 | |
| Costco Wholesale Corp. | | 13,618,183 | | | 1,379,386 | | | 1.18 | |
| Other securities | | | | | 1,999,755 | | | 1.71 | |
| | | | | | 5,299,560 | | | 4.54 | |
Materials — 3.02% | | | | | | | | | |
| Praxair, Inc. | | 5,572,437 | | | 629,964 | | | .54 | |
| Other securities | | | | | 2,898,618 | | | 2.48 | |
| | | | | | 3,528,582 | | | 3.02 | |
Telecommunication services — 2.07% | | | | | | | | | |
| Crown Castle International Corp.1,3 | | 16,405,430 | | | 1,145,099 | | | .98 | |
| SOFTBANK CORP. | | 22,060,000 | | | 817,522 | | | .70 | |
| Other securities | | | | | 457,770 | | | .39 | |
| | | | | | 2,420,391 | | | 2.07 | |
| | | | | | | | | | |
| Utilities — 0.01% | | | | | | | | | |
| Other securities | | | | | 13,420 | | | .01 | |
| |
| Miscellaneous — 4.84% | | | | | | | | | |
| Other common stocks in initial period of acquisition | | | | | 5,634,173 | | | 4.84 | |
| | | | | | | | | | |
| Total common stocks (cost: $68,635,483,000) | | | | | 105,190,607 | | | 90.09 | |
| 6 | The Growth Fund of America |
| Warrants — 0.15% | Value | | Percent of | |
| | (000) | | | net assets | |
| Other — 0.01% | | | | | | |
| Other securities | $ | 12,455 | | | .01 | % |
| | | | | | | |
| Miscellaneous — 0.14% | | | | | | |
| Other warrants in initial period of acquisition | | 163,651 | | | .14 | |
| | | | | | | |
| Total warrants (cost: $135,002,000) | | 176,106 | | | .15 | |
| | | | | | | |
| Convertible securities — 0.06% | | | | | | |
| Telecommunication services — 0.06% | | | | | | |
| Other securities | | 69,971 | | | .06 | |
Total convertible securities (cost: $63,813,000) | | 69,971 | | | .06 | |
| Bonds & notes — 0.07% | Principal amount | | | | | |
| | (000) | | | | | | | |
| Federal agency bonds & notes — 0.04% | | | | | | | | | |
| Federal Home Loan Bank, Series 2753, 0.28% 2013 | $ | 50,000 | | | 50,016 | | | .04 | |
| | | | | | | | | | |
| Telecommunication services — 0.03% | | | | | | | | | |
| Other securities | | | | | 29,250 | | | .03 | |
| | | | | | | | | | |
| Total bonds & notes (cost: $79,423,000) | | | | | 79,266 | | | .07 | |
| The Growth Fund of America | 7 |
| Short-term securities — 9.48% | | Principal amount | | | Value | | | Percent of | |
| | (000) | | | (000) | | | net assets | |
| Fannie Mae 0.10%–0.16% due 3/1–12/19/2013 | | | 2,884,316 | | | $ | 2,882,902 | | | | 2.47 | % |
| U.S. Treasury Bills 0.08%–0.18% due 3/7–10/17/2013 | | | 2,632,550 | | | | 2,631,601 | | | | 2.25 | |
| Freddie Mac 0.09%–0.20% due 3/4–11/5/2013 | | | 2,332,480 | | | | 2,331,684 | | | | 2.00 | |
| Federal Home Loan Bank 0.08%–0.20% due 3/13/2013–1/2/2014 | | | 1,769,728 | | | | 1,769,158 | | | | 1.51 | |
| Google Inc. 0.09%–0.15% due 3/6–4/9/20134 | | | 148,600 | | | | 148,587 | | | | .13 | |
| Other securities | | | | | | | 1,305,059 | | | | 1.12 | |
| | | | | | | | | | | | | |
| Total short-term securities (cost: $11,068,670,000) | | | | | | | 11,068,991 | | | | 9.48 | |
| | | | | | | | | | | | | |
| Total investment securities (cost: $79,982,391,000) | | | | | | | 116,584,941 | | | | 99.85 | |
| Other assets less liabilities | | | | | | | 172,656 | | | | .15 | |
| | | | | | | | | | | | | |
| Net assets | | | | | | $ | 116,757,597 | | | | 100.00 | % |
As permitted by U.S. Securities and Exchange Commission regulations, “Miscellaneous” securities include holdings in their first year of acquisition that have not previously been publicly disclosed.
“Other securities” includes all issues that are not disclosed separately in the summary investment portfolio. Some of these securities (with an aggregate value of $26,307,000, an aggregate cost of $62,524,000, and which represented .02% of the net assets of the fund) were acquired from 7/7/2000 to 6/21/2011 through private placement transactions exempt from registration under the Securities Act of 1933, which may subject them to legal or contractual restrictions on resale.
| 8 | The Growth Fund of America |
Investments in affiliates
A company is considered to be an affiliate of the fund under the Investment Company Act of 1940 if the fund’s holdings in that company represent 5% or more of the outstanding voting shares. The value of the fund’s affiliated-company holdings is either shown in the summary investment portfolio or included in the value of “Other securities” under the respective industry sectors. Further details on such holdings and related transactions during the six months ended February 28, 2013, appear below.
| | | | | | | | | | | | | | | | | | Value of | |
| | | | | | | | | | | | | | | Dividend | | | affiliates at | |
| | | Beginning | | | | | | | | | Ending | | | income | | | 2/28/2013 | |
| | | shares | | | Additions | | | Reductions | | | shares | | | (000) | | | (000) | |
| Gilead Sciences, Inc.1 | | | 48,457,166 | | | | 55,171,634 | | | | 300,000 | | | | 103,328,800 | | | $ | — | | | $ | 4,413,173 | |
| EOG Resources, Inc. | | | 13,837,152 | | | | 969,385 | | | | — | | | | 14,806,537 | | | | 4,925 | | | | 1,861,330 | |
| Crown Castle | | | | | | | | | | | | | | | | | | | | | | | | |
| International Corp.1 | | | 18,177,430 | | | | 490,000 | | | | 2,262,000 | | | | 16,405,430 | | | | — | | | | 1,145,099 | |
| FMC Technologies, Inc.1 | | | 15,179,100 | | | | 1,300,000 | | | | — | | | | 16,479,100 | | | | — | | | | 855,430 | |
| Alexion Pharmaceuticals, Inc.1 | | | 9,250,000 | | | | 512,000 | | | | — | | | | 9,762,000 | | | | — | | | | 846,756 | |
| Edwards Lifesciences Corp.1 | | | 8,408,109 | | | | 1,349,050 | | | | 524,459 | | | | 9,232,700 | | | | — | | | | 793,366 | |
| BioMarin | | | | | | | | | | | | | | | | | | | | | | | | |
| Pharmaceutical Inc.1 | | | 6,512,500 | | | | 3,155,000 | | | | — | | | | 9,667,500 | | | | — | | | | 560,425 | |
| Avago Technologies Ltd. | | | 14,517,620 | | | | 1,691,200 | | | | — | | | | 16,208,820 | | | | 4,917 | | | | 554,666 | |
| Rackspace Hosting, Inc.1 | | | 4,470,000 | | | | 5,555,087 | | | | 100,000 | | | | 9,925,087 | | | | — | | | | 554,415 | |
| Celanese Corp., Series A | | | 10,160,000 | | | | — | | | | 1,285,000 | | | | 8,875,000 | | | | 1,331 | | | | 415,794 | |
| Hologic, Inc.1 | | | 4,595,000 | | | | 11,059,300 | | | | — | | | | 15,654,300 | | | | — | | | | 341,733 | |
| Illumina, Inc.1 | | | 7,246,900 | | | | — | | | | 625,417 | | | | 6,621,483 | | | | — | | | | 331,935 | |
| KBR, Inc. | | | 7,401,289 | | | | 3,061,300 | | | | �� | | | | 10,462,589 | | | | 840 | | | | 317,958 | |
| Aon PLC, Class A5 | | | 18,142,995 | | | | — | | | | 7,518,995 | | | | 10,624,000 | | | | 5,149 | | | | — | |
| Flextronics International Ltd.1,5 | | | 34,040,464 | | | | — | | | | 16,746,548 | | | | 17,293,916 | | | | — | | | | — | |
| Southwestern Energy Co.1,5 | | | 16,930,000 | | | | 1,200,000 | | | | 7,238,900 | | | | 10,891,100 | | | | — | | | | — | |
| Virgin Media Inc.5 | | | 18,635,400 | | | | — | | | | 12,385,400 | | | | 6,250,000 | | | | — | | | | — | |
| | | | | | | | | | | | | | | | | | | $ | 17,162 | | | $ | 12,992,080 | |
The following footnotes apply to either the individual securities noted or one or more of the securities aggregated and listed as a single line item.
| 1 | Security did not produce income during the last 12 months. |
| 2 | Valued under fair value procedures adopted by authority of the board of directors. The total value of all such securities, including those in “Other securities,” was $565,230,000, which represented .48% of the net assets of the fund. This amount includes $538,923,000 related to certain securities trading outside the U.S. whose values were adjusted as a result of significant market movements following the close of local trading. |
| 3 | Represents an affiliated company as defined under the Investment Company Act of 1940. |
| 4 | Acquired in a transaction exempt from registration under Rule 144A or section 4(2) of the Securities Act of 1933. May be resold in the U.S. in transactions exempt from registration, normally to qualified institutional buyers. The total value of all such securities, including those in “Other securities,” was $924,619,000, which represented .79% of the net assets of the fund. |
| 5 | Unaffiliated issuer at 2/28/2013. |
Key to abbreviation
ADR = American Depositary Receipts
See Notes to Financial Statements
| The Growth Fund of America | 9 |
Financial statements
| Statement of assets and liabilities | | | | | unaudited | |
| at February 28, 2013 | | (dollars in thousands) | |
| | | | |
| Assets: | | | | | | | | |
| Investment securities, at value: | | | | | | | | |
| Unaffiliated issuers (cost: $72,187,145) | | $ | 103,592,861 | | | | | |
| Affiliated issuers (cost: $7,795,246) | | | 12,992,080 | | | $ | 116,584,941 | |
| Cash denominated in currencies other than | | | | | | | | |
| U.S. dollars (cost: $16,042) | | | | | | | 16,022 | |
| Cash | | | | | | | 117 | |
| Receivables for: | | | | | | | | |
| Sales of investments | | | 467,184 | | | | | |
| Sales of fund’s shares | | | 104,424 | | | | | |
| Dividends and interest | | | 105,941 | | | | 677,549 | |
| | | | | | | | 117,278,629 | |
| Liabilities: | | | | | | | | |
| Payables for: | | | | | | | | |
| Purchases of investments | | | 222,441 | | | | | |
| Repurchases of fund’s shares | | | 195,036 | | | | | |
| Investment advisory services | | | 25,220 | | | | | |
| Services provided by related parties | | | 72,723 | | | | | |
| Directors’ deferred compensation | | | 4,513 | | | | | |
| Other | | | 1,099 | | | | 521,032 | |
| Net assets at February 28, 2013 | | | | | | $ | 116,757,597 | |
| | | | | | | | | |
| Net assets consist of: | | | | | | | | |
| Capital paid in on shares of capital stock | | | | | | $ | 77,316,354 | |
| Distributions in excess of net investment income | | | | | | | (167 | ) |
| Undistributed net realized gain | | | | | | | 2,838,930 | |
| Net unrealized appreciation | | | | | | | 36,602,480 | |
| Net assets at February 28, 2013 | | | | | | $ | 116,757,597 | |
(dollars and shares in thousands, except per-share amounts)
Total authorized capital stock — 7,500,000 shares, $.001 par value
(3,252,820 total shares outstanding) | |
| | | | | | | | | | |
| | | Net assets | | | Shares outstanding | | | Net asset value per share | |
| Class A | | $ 58,253,210 | | | | 1,614,200 | | | | $ 36.09 | |
| Class B | | | 1,315,840 | | | | 37,580 | | | | 35.01 | |
| Class C | | | 5,816,736 | | | | 167,518 | | | | 34.72 | |
| Class F-1 | | | 10,907,555 | | | | 304,047 | | | | 35.87 | |
| Class F-2 | | | 3,944,497 | | | | 109,392 | | | | 36.06 | |
| Class 529-A | | | 4,228,244 | | | | 117,926 | | | | 35.86 | |
| Class 529-B | | | 211,818 | | | | 6,055 | | | �� | 34.98 | |
| Class 529-C | | | 1,094,440 | | | | 31,374 | | | | 34.88 | |
| Class 529-E | | | 198,916 | | | | 5,586 | | | | 35.61 | |
| Class 529-F-1 | | | 139,784 | | | | 3,905 | | | | 35.80 | |
| Class R-1 | | | 463,428 | | | | 13,222 | | | | 35.05 | |
| Class R-2 | | | 2,182,293 | | | | 61,943 | | | | 35.23 | |
| Class R-3 | | | 7,513,886 | | | | 211,081 | | | | 35.60 | |
| Class R-4 | | | 7,191,346 | | | | 200,537 | | | | 35.86 | |
| Class R-5 | | | 5,140,744 | | | | 142,571 | | | | 36.06 | |
| Class R-6 | | | 8,154,860 | | | | 225,883 | | | | 36.10 | |
|
See Notes to Financial Statements
| 10 | The Growth Fund of America |
| Statement of operations | | | | | unaudited | |
| for the six months ended February 28, 2013 | | (dollars in thousands) | |
| | | | | | | |
| Investment income: | | | | | | | | |
| Income: | | | | | | | | |
| Dividends (net of non-U.S. taxes of $10,867; also includes $17,162 from affiliates) | | $ | 813,451 | | | | | |
| Interest | | | 11,557 | | | $ | 825,008 | |
| | | | | | | | | |
| Fees and expenses*: | | | | | | | | |
| Investment advisory services | | | 160,153 | | | | | |
| Distribution services | | | 166,014 | | | | | |
| Transfer agent services | | | 79,440 | | | | | |
| Administrative services | | | 16,934 | | | | | |
| Reports to shareholders | | | 3,123 | | | | | |
| Registration statement and prospectus | | | 711 | | | | | |
| Directors’ compensation | | | 645 | | | | | |
| Auditing and legal | | | 70 | | | | | |
| Custodian | | | 1,414 | | | | | |
| Other | | | 2,968 | | | | 431,472 | |
| Net investment income | | | | | | | 393,536 | |
| | | | | | | | | |
| Net realized gain and unrealized appreciation on investments and currency: | | | | | | | | |
| Net realized gain on: | | | | | | | | |
| Investments (net of non-U.S. taxes of $8; also includes $144,844 net gain from affiliates) | | | 6,266,625 | | | | | |
| Currency transactions | | | 1,922 | | | | 6,268,547 | |
| Net unrealized appreciation on: | | | | | | | | |
| Investments | | | 5,215,030 | | | | | |
| Currency translations | | | 449 | | | | 5,215,479 | |
| Net realized gain and unrealized appreciation on investments and currency | | | | | | | 11,484,026 | |
| Net increase in net assets resulting from operations | | | | | | $ | 11,877,562 | |
*Additional information related to class-specific fees and expenses is included in the Notes to Financial Statements.
See Notes to Financial Statements
| The Growth Fund of America | 11 |
Statements of changes in net assets
| | | (dollars in thousands) | |
| |
| | | Six months | | | Year ended | |
| | | | ended February 28, | | | | August 31, | |
| | | | 2013* | | | | 2012 | |
| Operations: | | | | | | | | |
| Net investment income | | $ | 393,536 | | | $ | 768,290 | |
| Net realized gain on investments and currency transactions | | | 6,268,547 | | | | 4,493,906 | |
| Net unrealized appreciation on investments and currency translations | | | 5,215,479 | | | | 9,613,541 | |
| Net increase in net assets resulting from operations | | | 11,877,562 | | | | 14,875,737 | |
| | | | | | | | | |
| Dividends paid to shareholders from net investment income | | | (865,222 | ) | | | (884,496 | ) |
| | | | | | | | | |
| Net capital share transactions | | | (9,028,378 | ) | | | (36,704,124 | ) |
| | | | | | | | | |
| Total increase (decrease) in net assets | | | 1,983,962 | | | | (22,712,883 | ) |
| | | | | | | | | |
| Net assets: | | | | | | | | |
| Beginning of period | | | 114,773,635 | | | | 137,486,518 | |
| End of period (including distributions in excess of and undistributed net investment income: $(167) and $471,519, respectively) | | $ | 116,757,597 | | | $ | 114,773,635 | |
*Unaudited.
See Notes to Financial Statements
| 12 | The Growth Fund of America |
| Notes to financial statements | unaudited |
1. Organization
The Growth Fund of America, Inc. (the “fund”) is registered under the Investment Company Act of 1940 as an open-end, diversified management investment company. The fund invests in a wide range of companies that appear to offer superior opportunities for growth of capital. Shareholders approved a proposal to reorganize the fund from a Maryland corporation to a Delaware statutory trust. The reorganization may be completed in 2013; however, the fund reserves the right to delay the implementation.
The fund has 16 share classes consisting of five retail share classes (Classes A, B and C, as well as two F share classes, F-1 and F-2), five 529 college savings plan share classes (Classes 529-A, 529-B, 529-C, 529-E and 529-F-1) and six retirement plan share classes (Classes R-1, R-2, R-3, R-4, R-5 and R-6). The 529 college savings plan share classes can be used to save for college education. The retirement plan share classes are generally offered only through eligible employer-sponsored retirement plans. The fund’s share classes are further described below:
| Share class | | Initial sales charge | | Contingent deferred sales
charge upon redemption | | Conversion feature |
| Classes A and 529-A | | Up to 5.75% | | None (except 1% for certain redemptions within one year of purchase without an initial sales charge) | | None |
| Classes B and 529-B* | | None | | Declines from 5% to 0% for redemptions within six years of purchase | | Classes B and 529-B converts to Classes A and 529-A, respectively, after eight years |
| Class C | | None | | 1% for redemptions within one year of purchase | | Class C converts to Class F-1 after 10 years |
| Class 529-C | | None | | 1% for redemptions within one year of purchase | | None |
| Class 529-E | | None | | None | | None |
Classes F-1, F-2 and
529-F-1 | | None | | None | | None |
Classes R-1, R-2, R-3,
R-4, R-5 and R-6 | | None | | None | | None |
*Class B and 529-B shares of the fund are not available for purchase.
Holders of all share classes have equal pro rata rights to assets, dividends and liquidation proceeds. Each share class has identical voting rights, except for the exclusive right to vote on matters affecting only its class. Share classes have different fees and expenses (“class-specific fees and expenses”), primarily due to different arrangements for distribution, administrative and shareholder services. Differences in class-specific fees and expenses will result in differences in net investment income and, therefore, the payment of different per-share dividends by each class.
| The Growth Fund of America | 13 |
2. Significant accounting policies
The financial statements have been prepared to comply with accounting principles generally accepted in the United States of America. These principles require management to make estimates and assumptions that affect reported amounts and disclosures. Actual results could differ from those estimates. The fund follows the significant accounting policies described below, as well as the valuation policies described in the next section on valuation.
Security transactions and related investment income — Security transactions are recorded by the fund as of the date the trades are executed with brokers. Realized gains and losses from security transactions are determined based on the specific identified cost of the securities. In the event a security is purchased with a delayed payment date, the fund will segregate liquid assets sufficient to meet its payment obligations. Dividend income is recognized on the ex-dividend date and interest income is recognized on an accrual basis. Market discounts, premiums and original issue discounts on fixed-income securities are amortized daily over the expected life of the security.
Class allocations — Income, fees and expenses (other than class-specific fees and expenses) and realized and unrealized gains and losses are allocated daily among the various share classes based on their relative net assets. Class-specific fees and expenses, such as distribution, administrative and shareholder services, are charged directly to the respective share class.
Dividends and distributions to shareholders — Dividends and distributions to shareholders are recorded on the ex-dividend date.
Currency translation — Assets and liabilities, including investment securities, denominated in currencies other than U.S. dollars are translated into U.S. dollars at the exchange rates supplied by one or more pricing vendors on the valuation date. Purchases and sales of investment securities and income and expenses are translated into U.S. dollars at the exchange rates on the dates of such transactions. On the accompanying financial statements, the effects of changes in exchange rates on investment securities are included with the net realized gain or loss and net unrealized appreciation or depreciation on investments. The realized gain or loss and unrealized appreciation or depreciation resulting from all other transactions denominated in currencies other than U.S. dollars are disclosed separately.
| 14 | The Growth Fund of America |
3. Valuation
Capital Research and Management Company (“CRMC”), the fund’s investment adviser, values the fund’s investments at fair value as defined by accounting principles generally accepted in the United States of America. The net asset value of each share class of the fund is generally determined as of approximately 4:00 p.m. New York time each day the New York Stock Exchange is open.
Methods and inputs — The fund’s investment adviser uses the following methods and inputs to establish the fair value of the fund’s assets and liabilities. Use of particular methods and inputs may vary over time based on availability and relevance as market and economic conditions evolve.
Equity securities are generally valued at the official closing price of, or the last reported sale price on, the exchange or market on which such securities are traded, as of the close of business on the day the securities are being valued or, lacking any sales, at the last available bid price. Prices for each security are taken from the principal exchange or market on which the security trades.
Fixed-income securities, including short-term securities purchased with more than 60 days left to maturity, are generally valued at prices obtained from one or more pricing vendors. Vendors value such securities based on one or more of the inputs described in the following table. The table provides examples of inputs that are commonly relevant for valuing particular classes of fixed-income securities in which the fund is authorized to invest. However, these classifications are not exclusive, and any of the inputs may be used to value any other class of fixed-income security.
| Fixed-income class | Examples of standard inputs |
| All | Benchmark yields, transactions, bids, offers, quotations from dealers and trading systems, new issues, spreads and other relationships observed in the markets among comparable securities; and proprietary pricing models such as yield measures calculated using factors such as cash flows, financial or collateral performance and other reference data (collectively referred to as “standard inputs”) |
| Corporate bonds & notes; convertible securities | Standard inputs and underlying equity of the issuer |
| Bonds & notes of governments & government agencies | Standard inputs and interest rate volatilities |
| The Growth Fund of America | 15 |
When the fund’s investment adviser deems it appropriate to do so (such as when vendor prices are unavailable or not deemed to be representative), fixed-income securities will be valued in good faith at the mean quoted bid and ask prices that are reasonably and timely available (or bid prices, if ask prices are not available) or at prices for securities of comparable maturity, quality and type.
Securities with both fixed-income and equity characteristics, or equity securities traded principally among fixed-income dealers, are generally valued in the manner described above for either equity or fixed-income securities, depending on which method is deemed most appropriate by the fund’s investment adviser. Short-term securities purchased within 60 days to maturity are valued at amortized cost, which approximates fair value. The value of short-term securities originally purchased with maturities greater than 60 days is determined based on an amortized value to par when they reach 60 days.
Securities and other assets for which representative market quotations are not readily available or are considered unreliable by the fund’s investment adviser are fair valued as determined in good faith under fair value guidelines adopted by authority of the fund’s board of directors as further described below. The investment adviser follows fair valuation guidelines, consistent with U.S. Securities and Exchange Commission rules and guidance, to consider relevant principles and factors when making fair value determinations. The investment adviser considers relevant indications of value that are reasonably and timely available to it in determining the fair value to be assigned to a particular security, such as the type and cost of the security; contractual or legal restrictions on resale of the security; relevant financial or business developments of the issuer; actively traded similar or related securities; conversion or exchange rights on the security; related corporate actions; significant events occurring after the close of trading in the security; and changes in overall market conditions. In addition, the closing prices of equity securities that trade in markets outside U.S. time zones may be adjusted to reflect significant events that occur after the close of local trading but before the net asset value of each share class of the fund is determined. Fair valuations and valuations of investments that are not actively trading involve judgment and may differ materially from valuations that would have been used had greater market activity occurred.
Processes and structure — The fund’s board of directors has delegated authority to the fund’s investment adviser to make fair value determinations, subject to board oversight. The investment adviser has established a Joint Fair Valuation Committee (the “Fair Valuation Committee”) to administer, implement and oversee the fair valuation process, and to make fair value decisions. The Fair Valuation Committee regularly reviews its own fair value decisions, as well as decisions made under its standing instructions to the investment adviser’s valuation teams. The Fair Valuation Committee reviews changes in fair value measurements from period to period and may, as deemed appropriate, update the fair valuation guidelines to better reflect the results of back testing and address new or evolving issues. The Fair Valuation Committee reports any changes to the fair valuation guidelines to the board of directors with supplemental information to support the changes.
| 16 | The Growth Fund of America |
The fund’s board and audit committee also regularly review reports that describe fair value determinations and methods.
The fund’s investment adviser has also established a Fixed-Income Pricing Review Group to administer and oversee the fixed-income valuation process, including the use of fixed-income pricing vendors. This group regularly reviews pricing vendor information and market data. Pricing decisions, processes and controls over security valuation are also subject to additional internal reviews, including an annual control self-evaluation program facilitated by the investment adviser’s compliance group.
Classifications — The fund’s investment adviser classifies the fund’s assets and liabilities into three levels based on the inputs used to value the assets or liabilities. Level 1 values are based on quoted prices in active markets for identical securities. Level 2 values are based on significant observable market inputs, such as quoted prices for similar securities and quoted prices in inactive markets. Certain securities trading outside the U.S. may transfer between Level 1 and Level 2 due to valuation adjustments resulting from significant market movements following the close of local trading. Level 3 values are based on significant unobservable inputs that reflect the investment adviser’s determination of assumptions that market participants might reasonably use in valuing the securities. The valuation levels are not necessarily an indication of the risk or liquidity associated with the underlying investment. For example, U.S. government securities are reflected as Level 2 because the inputs used to determine fair value may not always be quoted prices in an active market. The following table presents the fund’s valuation levels as of February 28, 2013 (dollars in thousands):
| | | Investment securities | |
| | | Level 1 | | | Level 2 | | | Level 3 | | | Total | |
| Assets: | | | | | | | | | | | | | | | | |
| Common stocks: | | | | | | | | | | | | | | | | |
| Consumer discretionary | | $ | 22,675,558 | | | $ | — | | | $ | — | | | $ | 22,675,558 | |
| Information technology | | | 18,758,695 | | | | 538,923 | | | | — | | | | 19,297,618 | |
| Health care | | | 17,784,609 | | | | — | | | | — | | | | 17,784,609 | |
| Energy | | | 11,930,100 | | | | — | | | | 26,255 | | | | 11,956,355 | |
| Financials | | | 8,769,690 | | | | — | | | | — | | | | 8,769,690 | |
| Industrials | | | 7,810,651 | | | | — | | | | — | | | | 7,810,651 | |
| Consumer staples | | | 5,299,560 | | | | — | | | | — | | | | 5,299,560 | |
| Materials | | | 3,528,582 | | | | — | | | | — | | | | 3,528,582 | |
| Telecommunication services | | | 2,420,376 | | | | — | | | | 15 | | | | 2,420,391 | |
| Utilities | | | 13,420 | | | | — | | | | — | | | | 13,420 | |
| Miscellaneous | | | 5,634,173 | | | | — | | | | — | | | | 5,634,173 | |
| Warrants | | | 176,069 | | | | — | | | | 37 | | | | 176,106 | |
| Convertible securities | | | — | | | | 69,971 | | | | — | | | | 69,971 | |
| Bonds & notes | | | — | | | | 79,266 | | | | — | | | | 79,266 | |
| Short-term securities | | | — | | | | 11,068,991 | | | | — | | | | 11,068,991 | |
| Total | | $ | 104,801,483 | | | $ | 11,757,151 | | | $ | 26,307 | | | $ | 116,584,941 | |
| The Growth Fund of America | 17 |
4. Risk factors
Investing in the fund may involve certain risks including, but not limited to, those described below.
Market conditions — The prices of, and the income generated by, the common stocks and other securities held by the fund may decline due to market conditions and other factors, including those directly involving the issuers of securities held by the fund.
Investing in growth-oriented stocks — Growth-oriented stocks may involve larger price swings and greater potential for loss than other types of investments.
Investing outside the U.S. — Securities of issuers domiciled outside the U.S., or with significant operations outside the U.S., may lose value because political, social, economic or market developments or instability in the countries or regions in which the issuer operates. These securities may also lose value due to changes in foreign currency exchange rates against the U.S. dollar and/or currencies of other countries. Securities markets in certain countries may be more volatile and/or less liquid than those in the U.S. Investments outside the U.S. may also be subject to different settlement and accounting practices and different regulatory, legal and reporting standards, and may be more difficult to value, than those in the U.S. The risks of investing outside the U.S. may be heightened in connection with investments in emerging and developing countries.
Management — The investment adviser to the fund actively manages the fund’s investments. Consequently, the fund is subject to the risk that the methods and analyses employed by the investment adviser in this process may not produce the desired results. This could cause the fund to lose value or its investment results to lag relevant benchmarks or other funds with similar objectives.
5. Taxation and distributions
Federal income taxation — The fund complies with the requirements under Subchapter M of the Internal Revenue Code applicable to mutual funds and intends to distribute substantially all of its net taxable income and net capital gains each year. The fund is not subject to income taxes to the extent such distributions are made. Therefore, no federal income tax provision is required.
As of and during the period ended February 28, 2013, the fund did not have a liability for any unrecognized tax benefits. The fund recognizes interest and penalties, if any, related to unrecognized tax benefits as income tax expense in the statement of operations. During the period, the fund did not incur any interest or penalties.
| 18 | The Growth Fund of America |
The fund is not subject to examination by U.S. federal tax authorities for tax years before 2008, by state tax authorities for tax years before 2007 and by tax authorities outside the U.S. for tax years before 2005.
Non-U.S. taxation — Dividend and interest income are recorded net of non-U.S. taxes paid. Gains realized by the fund on the sale of securities in certain countries are subject to non-U.S. taxes. The fund records a liability based on unrealized gains to provide for potential non-U.S. taxes payable upon the sale of these securities.
Distributions — Distributions paid to shareholders are based on net investment income and net realized gains determined on a tax basis, which may differ from net investment income and net realized gains for financial reporting purposes. These differences are due primarily to different treatment for items such as currency gains and losses; short-term capital gains and losses; capital losses related to sales of certain securities within 30 days of purchase; cost of investments sold; and net capital losses. The fiscal year in which amounts are distributed may differ from the year in which the net investment income and net realized gains are recorded by the fund for financial reporting purposes.
The components of distributable earnings on a tax basis are reported as of the fund’s most recent year-end. As of August 31, 2012, the components of distributable earnings on a tax basis were as follows (dollars in thousands):
| Undistributed ordinary income | | $ | 480,778 | |
| Capital loss carryforward expiring 2018* | | | (2,526,373 | ) |
| Post-October capital loss deferral† | | | (414,628 | ) |
| * | The capital loss carryforward will be used to offset any capital gains realized by the fund in the current year or in subsequent years through the expiration date. The fund will not make distributions from capital gains while a capital loss carryforward remains. |
| † | This deferral is considered incurred in the subsequent year. |
Under the Regulated Investment Company Modernization Act of 2010 (the “Act”), net capital losses recognized after August 31, 2011, may be carried forward indefinitely, and their character is retained as short-term and/or long-term losses. Previously, net capital losses were carried forward for eight years and treated as short-term losses. As a transition rule, the Act requires that post-enactment net capital losses be used before pre-enactment net capital losses.
As of February 28, 2013, the tax basis unrealized appreciation (depreciation) and cost of investment securities were as follows (dollars in thousands):
| Gross unrealized appreciation on investment securities | | $ | 37,832,189 | |
| Gross unrealized depreciation on investment securities | | | (1,503,127 | ) |
| Net unrealized appreciation on investment securities | | | 36,329,062 | |
| Cost of investment securities | | | 80,255,879 | |
| The Growth Fund of America | 19 |
Tax-basis distributions paid to shareholders from ordinary income were as follows (dollars in thousands):
| | | Six months ended | | | Year ended | |
| Share class | | February 28, 2013 | | | August 31, 2012 | |
| Class A | | $ | 460,633 | | | $ | 405,819 | |
| Class B | | | — | | | | — | |
| Class C | | | 1,750 | | | | — | |
| Class F-1 | | | 86,604 | | | | 87,419 | |
| Class F-2 | | | 41,950 | | | | 33,344 | |
| Class 529-A | | | 31,603 | | | | 25,030 | |
| Class 529-B | | | — | | | | — | |
| Class 529-C | | | 645 | | | | — | |
| Class 529-E | | | 1,056 | | | | 767 | |
| Class 529-F-1 | | | 1,305 | | | | 1,045 | |
| Class R-1 | | | 153 | | | | — | |
| Class R-2 | | | 3,112 | | | | — | |
| Class R-3 | | | 35,811 | | | | 34,926 | |
| Class R-4 | | | 54,792 | | | | 85,157 | |
| Class R-5 | | | 59,533 | | | | 96,087 | |
| Class R-6 | | | 86,275 | | | | 114,902 | |
| Total | | $ | 865,222 | | | $ | 884,496 | |
6. Fees and transactions with related parties
CRMC, the fund’s investment adviser, is the parent company of American Funds Distributors,® Inc. (“AFD”), the principal underwriter of the fund’s shares, and American Funds Service Company® (“AFS”), the fund’s transfer agent. CRMC, AFD and AFS are considered related parties to the fund.
Investment advisory services — The fund has an investment advisory and service agreement with CRMC that provides for monthly fees accrued daily. These fees are based on a series of decreasing annual rates beginning with 0.500% on the first $1 billion of daily net assets and decreasing to 0.233% on such assets in excess of $210 billion. For the six months ended February 28, 2013, the investment advisory services fee was $160,153,000, which was equivalent to an annualized rate of 0.281% of average daily net assets.
Class-specific fees and expenses — Expenses that are specific to individual share classes are accrued directly to the respective share class. The principal class-specific fees and expenses are described on the following page:
| 20 | The Growth Fund of America |
Distribution services — The fund has plans of distribution for all share classes, except Class F-2, R-5 and R-6 shares. Under the plans, the board of directors approves certain categories of expenses that are used to finance activities primarily intended to sell fund shares and service existing accounts. The plans provide for payments, based on an annualized percentage of average daily net assets, ranging from 0.25% to 1.00% as noted below. In some cases, the board of directors has limited the amounts that may be paid to less than the maximum allowed by the plans. All share classes with a plan may use up to 0.25% of average daily net assets to pay service fees, or to compensate AFD for paying service fees, to firms that have entered into agreements with AFD to provide certain shareholder services. The remaining amounts available to be paid under each plan are paid to dealers to compensate them for their sales activities.
For Class A and 529-A shares, distribution-related expenses include the reimbursement of dealer and wholesaler commissions paid by AFD for certain shares sold without a sales charge. These share classes reimburse AFD for amounts billed within the prior 15 months but only to the extent that the overall annual expense limit of 0.25% is not exceeded. As of February 28, 2013, there were no unreimbursed expenses subject to reimbursement for Class A or 529-A shares.
| Share class | | Currently approved limits | | Plan limits |
| Class A | | | 0.25 | % | | | 0.25 | % | |
| Class 529-A | | | 0.25 | | | | 0.50 | | |
| Classes B and 529-B | | | 1.00 | | | | 1.00 | | |
| Classes C, 529-C and R-1 | | | 1.00 | | | | 1.00 | | |
| Class R-2 | | | 0.75 | | | | 1.00 | | |
| Classes 529-E and R-3 | | | 0.50 | | | | 0.75 | | |
| Classes F-1, 529-F-1 and R-4 | | | 0.25 | | | | 0.50 | | |
Transfer agent services — The fund has a shareholder services agreement with AFS under which the fund compensates AFS for providing transfer agent services to each of the fund’s share classes. These services include recordkeeping, shareholder communications and transaction processing. In addition, the fund reimburses AFS for amounts paid to third parties for performing transfer agent services on behalf of fund shareholders.
Administrative services — The fund has an administrative services agreement with CRMC under which the fund compensates CRMC for providing administrative services to Class A, C, F, 529 and R shares. These services include, but are not limited to, coordinating, monitoring, assisting and overseeing third parties that provide services to fund shareholders. Under the agreement, Class A shares pay an annual fee of 0.01% and Class C, F, 529 and R shares pay an annual fee of 0.05% of their respective average daily net assets.
| The Growth Fund of America | 21 |
529 plan services — Each 529 share class is subject to service fees to compensate the Commonwealth of Virginia for the maintenance of the 529 college savings plan. The quarterly fee is based on a series of decreasing annual rates beginning with 0.10% on the first $30 billion of the net assets invested in Class 529 shares of the American Funds and decreasing to 0.06% on such assets between $120 billion and $150 billion. The fee for any given calendar quarter is accrued and calculated on the basis of the average net assets of Class 529 shares of the American Funds for the last month of the prior calendar quarter. The fee is included in other expenses on the accompanying financial statements. The Commonwealth of Virginia is not considered a related party.
Class-specific expenses under the agreements described on the previous page for the six months ended February 28, 2013, were as follows (dollars in thousands):
| Share class | | Distribution
services | | | Transfer agent
services | | | Administrative
services | | | 529 plan
services |
| Class A | | | $67,198 | | | | $48,303 | | | | $2,812 | | | Not applicable |
| Class B | | | 6,948 | | | | 1,235 | | | | Not applicable | | | Not applicable |
| Class C | | | 28,492 | | | | 4,838 | | | | 1,428 | | | Not applicable |
| Class F-1 | | | 13,581 | | | | 6,235 | | | | 2,736 | | | Not applicable |
| Class F-2 | | | Not applicable | | | | 1,801 | | | | 839 | | | Not applicable |
| Class 529-A | | | 4,326 | | | | 2,421 | | | | 996 | | | $1,967 |
| Class 529-B | | | 1,105 | | | | 153 | | | | 55 | | | 110 |
| Class 529-C | | | 5,173 | | | | 675 | | | | 260 | | | 514 |
| Class 529-E | | | 471 | | | | 82 | | | | 47 | | | 93 |
| Class 529-F-1 | | | — | | | | 80 | | | | 33 | | | 65 |
| Class R-1 | | | 2,371 | | | | 248 | | | | 119 | | | Not applicable |
| Class R-2 | | | 8,069 | | | | 3,212 | | | | 544 | | | Not applicable |
| Class R-3 | | | 18,883 | | | | 5,287 | | | | 1,901 | | | Not applicable |
| Class R-4 | | | 9,397 | | | | 3,540 | | | | 1,889 | | | Not applicable |
| Class R-5 | | | Not applicable | | | | 1,313 | | | | 1,401 | | | Not applicable |
| Class R-6† | | | Not applicable | | | | 17 | | | | 1,874 | | | Not applicable |
| Total class-specific expenses | | | $166,014 | | | | $79,440 | | | | $16,934 | | | $2,749 |
Directors’ deferred compensation — Directors who are unaffiliated with CRMC may elect to defer the cash payment of part or all of their compensation. These deferred amounts, which remain as liabilities of the fund, are treated as if invested in shares of the fund or other American Funds. These amounts represent general, unsecured liabilities of the fund and vary according to the total returns of the selected funds. Directors’ compensation of $645,000, shown on the accompanying financial statements, includes $199,000 in current fees (either paid in cash or deferred) and a net increase of $446,000 in the value of the deferred amounts.
Affiliated officers and directors — Officers and certain directors of the fund are or may be considered to be affiliated with CRMC, AFD and AFS. No affiliated officers or directors received any compensation directly from the fund.
| 22 | The Growth Fund of America |
7. Capital share transactions
Capital share transactions in the fund were as follows (dollars and shares in thousands):
| | | Sales* | | | Reinvestment of
dividends | | | Repurchases* | | | Net
(decrease) increase | |
| Share class | | Amount | | | Shares | | | Amount | | | Shares | | | Amount | | | Shares | | | Amount | | | Shares | |
| | | | | | | | | | | | | | | | | | | | | | | | | | |
| Six months ended February 28, 2013 | | | | | | | | | | | | | | | | | | | | | | | | | |
| | | | | | | | | | | | | | | | | | | | | | | | | | | | | | | | | |
| Class A | | $ | 2,213,175 | | | | 63,941 | | | $ | 451,228 | | | | 13,079 | | | $ | (5,259,360 | ) | | | (152,992 | ) | | $ | (2,594,957 | ) | | | (75,972 | ) |
| Class B | | | 7,657 | | | | 228 | | | | — | | | | — | | | | (334,846 | ) | | | (10,092 | ) | | | (327,189 | ) | | | (9,864 | ) |
| Class C | | | 221,304 | | | | 6,641 | | | | 1,694 | | | | 51 | | | | (718,040 | ) | | | (21,790 | ) | | | (495,042 | ) | | | (15,098 | ) |
| Class F-1 | | | 746,453 | | | | 21,761 | | | | 84,930 | | | | 2,476 | | | | (2,279,794 | ) | | | (67,440 | ) | | | (1,448,411 | ) | | | (43,203 | ) |
| Class F-2 | | | 1,268,946 | | | | 37,444 | | | | 38,930 | | | | 1,130 | | | | (554,516 | ) | | | (16,134 | ) | | | 753,360 | | | | 22,440 | |
| Class 529-A | | | 255,082 | | | | 7,434 | | | | 31,588 | | | | 921 | | | | (263,596 | ) | | | (7,697 | ) | | | 23,074 | | | | 658 | |
| Class 529-B | | | 1,474 | | | | 44 | | | | — | | | | — | | | | (48,767 | ) | | | (1,471 | ) | | | (47,293 | ) | | | (1,427 | ) |
| Class 529-C | | | 62,955 | | | | 1,889 | | | | 645 | | | | 20 | | | | (80,654 | ) | | | (2,426 | ) | | | (17,054 | ) | | | (517 | ) |
| Class 529-E | | | 10,911 | | | | 321 | | | | 1,056 | | | | 31 | | | | (13,273 | ) | | | (390 | ) | | | (1,306 | ) | | | (38 | ) |
| Class 529-F-1 | | | 15,150 | | | | 441 | | | | 1,304 | | | | 38 | | | | (13,920 | ) | | | (407 | ) | | | 2,534 | | | | 72 | |
| Class R-1 | | | 21,911 | | | | 653 | | | | 153 | | | | 4 | | | | (102,777 | ) | | | (3,092 | ) | | | (80,713 | ) | | | (2,435 | ) |
| Class R-2 | | | 226,433 | | | | 6,725 | | | | 3,110 | | | | 92 | | | | (446,192 | ) | | | (13,262 | ) | | | (216,649 | ) | | | (6,445 | ) |
| Class R-3 | | | 583,759 | | | | 17,108 | | | | 35,719 | | | | 1,049 | | | | (1,766,366 | ) | | | (52,249 | ) | | | (1,146,888 | ) | | | (34,092 | ) |
| Class R-4 | | | 595,537 | | | | 17,363 | | | | 54,759 | | | | 1,597 | | | | (2,286,611 | ) | | | (66,951 | ) | | | (1,636,315 | ) | | | (47,991 | ) |
| Class R-5 | | | 386,411 | | | | 11,134 | | | | 59,353 | | | | 1,723 | | | | (2,145,906 | ) | | | (62,623 | ) | | | (1,700,142 | ) | | | (49,766 | ) |
| Class R-6 | | | 1,315,625 | | | | 37,791 | | | | 86,216 | | | | 2,500 | | | | (1,497,228 | ) | | | (43,683 | ) | | | (95,387 | ) | | | (3,392 | ) |
| Total net increase (decrease) | | $ | 7,932,783 | | | | 230,918 | | | $ | 850,685 | | | | 24,711 | | | $ | (17,811,846 | ) | | | (522,699 | ) | | $ | (9,028,378 | ) | | | (267,070 | ) |
| | | | | | | | | | | | | | | | | | | | | | | | | | |
| Year ended August 31, 2012 | | | | | | | | | | | | | | | | | | | | | | | | | |
| | | | | | | | | | | | | | | | | | | | | | | | | | | | | | | | | |
| Class A | | $ | 4,056,002 | | | | 132,752 | | | $ | 396,549 | | | | 13,933 | | | $ | (12,449,147 | ) | | | (409,483 | ) | | $ | (7,996,596 | ) | | | (262,798 | ) |
| Class B | | | 18,334 | | | | 621 | | | | — | | | | — | | | | (941,726 | ) | | | (32,105 | ) | | | (923,392 | ) | | | (31,484 | ) |
| Class C | | | 344,694 | | | | 11,701 | | | | — | | | | — | | | | (1,826,411 | ) | | | (62,463 | ) | | | (1,481,717 | ) | | | (50,762 | ) |
| Class F-1 | | | 1,569,854 | | | | 51,387 | | | | 85,810 | | | | 3,033 | | | | (4,685,153 | ) | | | (155,576 | ) | | | (3,029,489 | ) | | | (101,156 | ) |
| Class F-2 | | | 468,120 | | | | 15,316 | | | | 29,280 | | | | 1,030 | | | | (1,705,637 | ) | | | (56,440 | ) | | | (1,208,237 | ) | | | (40,094 | ) |
| Class 529-A | | | 437,279 | | | | 14,429 | | | | 25,020 | | | | 884 | | | | (413,594 | ) | | | (13,610 | ) | | | 48,705 | | | | 1,703 | |
| Class 529-B | | | 3,392 | | | | 115 | | | | — | | | | — | | | | (105,825 | ) | | | (3,606 | ) | | | (102,433 | ) | | | (3,491 | ) |
| Class 529-C | | | 111,493 | | | | 3,782 | | | | — | | | | — | | | | (148,414 | ) | | | (5,033 | ) | | | (36,921 | ) | | | (1,251 | ) |
| Class 529-E | | | 19,359 | | | | 646 | | | | 767 | | | | 27 | | | | (23,332 | ) | | | (776 | ) | | | (3,206 | ) | | | (103 | ) |
| Class 529-F-1 | | | 25,480 | | | | 843 | | | | 1,045 | | | | 37 | | | | (21,798 | ) | | | (716 | ) | | | 4,727 | | | | 164 | |
| Class R-1 | | | 60,061 | | | | 2,037 | | | | — | | | | — | | | | (182,869 | ) | | | (6,219 | ) | | | (122,808 | ) | | | (4,182 | ) |
| Class R-2 | | | 451,015 | | | | 15,168 | | | | — | | | | — | | | | (861,004 | ) | | | (29,009 | ) | | | (409,989 | ) | | | (13,841 | ) |
| Class R-3 | | | 1,182,793 | | | | 39,448 | | | | 34,831 | | | | 1,241 | | | | (5,075,759 | ) | | | (170,102 | ) | | | (3,858,135 | ) | | | (129,413 | ) |
| Class R-4 | | | 1,511,447 | | | | 50,226 | | | | 85,127 | | | | 3,013 | | | | (9,641,535 | ) | | | (319,950 | ) | | | (8,044,961 | ) | | | (266,711 | ) |
| Class R-5 | | | 1,456,386 | | | | 48,366 | | | | 95,857 | | | | 3,374 | | | | (7,494,604 | ) | | | (248,104 | ) | | | (5,942,361 | ) | | | (196,364 | ) |
| Class R-6 | | | 2,664,486 | | | | 88,730 | | | | 114,760 | | | | 4,034 | | | | (6,376,557 | ) | | | (206,751 | ) | | | (3,597,311 | ) | | | (113,987 | ) |
| Total net increase (decrease) | | $ | 14,380,195 | | | | 475,567 | | | $ | 869,046 | | | | 30,606 | | | $ | (51,953,365 | ) | | | (1,719,943 | ) | | $ | (36,704,124 | ) | | | (1,213,770 | ) |
*Includes exchanges between share classes of the fund.
8. Investment transactions
The fund made purchases and sales of investment securities, excluding short-term securities and U.S. government obligations, if any, of $16,428,193,000 and $26,795,330,000, respectively, during the six months ended February 28, 2013.
| The Growth Fund of America | 23 |
Financial highlights
| | | | | | | | Income (loss) from investment operations1 | |
| | | | | Net asset
value,
beginning
of period | | | Net
investment
income (loss) | | | Net gains (losses)
on securities
(both realized
and unrealized) | | | Total from
investment
operations | |
| Class A: | | Six months ended 2/28/20134,5 | | $ | 32.80 | | | $ | .13 | | | $ | 3.44 | | | $ | 3.57 | |
| | | Year ended 8/31/2012 | | | 29.23 | | | | .20 | | | | 3.59 | | | | 3.79 | |
| | | Year ended 8/31/2011 | | | 25.53 | | | | .20 | | | | 3.75 | | | | 3.95 | |
| | | Year ended 8/31/2010 | | | 24.93 | | | | .21 | | | | .60 | | | | .81 | |
| | | Year ended 8/31/2009 | | | 30.61 | | | | .22 | | | | (5.67 | ) | | | (5.45 | ) |
| | | Year ended 8/31/2008 | | | 35.77 | | | | .36 | | | | (3.10 | ) | | | (2.74 | ) |
| Class B: | | Six months ended 2/28/20134,5 | | | 31.69 | | | | — | 7 | | | 3.32 | | | | 3.32 | |
| | | Year ended 8/31/2012 | | | 28.23 | | | | (.03 | ) | | | 3.49 | | | | 3.46 | |
| | | Year ended 8/31/2011 | | | 24.65 | | | | (.03 | ) | | | 3.61 | | | | 3.58 | |
| | | Year ended 8/31/2010 | | | 24.08 | | | | — | 7 | | | .58 | | | | .58 | |
| | | Year ended 8/31/2009 | | | 29.44 | | | | .06 | | | | (5.41 | ) | | | (5.35 | ) |
| | | Year ended 8/31/2008 | | | 34.48 | | | | .11 | | | | (2.99 | ) | | | (2.88 | ) |
| Class C: | | Six months ended 2/28/20134,5 | | | 31.44 | | | | (.01 | ) | | | 3.30 | | | | 3.29 | |
| | | Year ended 8/31/2012 | | | 28.02 | | | | (.04 | ) | | | 3.46 | | | | 3.42 | |
| | | Year ended 8/31/2011 | | | 24.49 | | | | (.03 | ) | | | 3.58 | | | | 3.55 | |
| | | Year ended 8/31/2010 | | | 23.96 | | | | — | 7 | | | .57 | | | | .57 | |
| | | Year ended 8/31/2009 | | | 29.30 | | | | .06 | | | | (5.39 | ) | | | (5.33 | ) |
| | | Year ended 8/31/2008 | | | 34.34 | | | | .09 | | | | (2.97 | ) | | | (2.88 | ) |
| Class F-1: | | Six months ended 2/28/20134,5 | | | 32.61 | | | | .12 | | | | 3.42 | | | | 3.54 | |
| | | Year ended 8/31/2012 | | | 29.04 | | | | .21 | | | | 3.58 | | | | 3.79 | |
| | | Year ended 8/31/2011 | | | 25.37 | | | | .20 | | | | 3.72 | | | | 3.92 | |
| | | Year ended 8/31/2010 | | | 24.78 | | | | .21 | | | | .60 | | | | .81 | |
| | | Year ended 8/31/2009 | | | 30.41 | | | | .24 | | | | (5.63 | ) | | | (5.39 | ) |
| | | Year ended 8/31/2008 | | | 35.56 | | | | .36 | | | | (3.08 | ) | | | (2.72 | ) |
| Class F-2: | | Six months ended 2/28/20134,5 | | | 32.83 | | | | .17 | | | | 3.45 | | | | 3.62 | |
| | | Year ended 8/31/2012 | | | 29.25 | | | | .28 | | | | 3.60 | | | | 3.88 | |
| | | Year ended 8/31/2011 | | | 25.55 | | | | .28 | | | | 3.74 | | | | 4.02 | |
| | | Year ended 8/31/2010 | | | 24.97 | | | | .28 | | | | .59 | | | | .87 | |
| | | Year ended 8/31/2009 | | | 30.61 | | | | .26 | | | | (5.63 | ) | | | (5.37 | ) |
| | | Period from 8/1/2008 to 8/31/20084 | | | 30.43 | | | | .03 | | | | .15 | | | | .18 | |
| Class 529-A: | | Six months ended 2/28/20134,5 | | | 32.59 | | | | .11 | | | | 3.43 | | | | 3.54 | |
| | | Year ended 8/31/2012 | | | 29.06 | | | | .18 | | | | 3.57 | | | | 3.75 | |
| | | Year ended 8/31/2011 | | | 25.39 | | | | .19 | | | | 3.72 | | | | 3.91 | |
| | | Year ended 8/31/2010 | | | 24.81 | | | | .20 | | | | .59 | | | | .79 | |
| | | Year ended 8/31/2009 | | | 30.47 | | | | .22 | | | | (5.64 | ) | | | (5.42 | ) |
| | | Year ended 8/31/2008 | | | 35.62 | | | | .34 | | | | (3.08 | ) | | | (2.74 | ) |
| Class 529-B: | | Six months ended 2/28/20134,5 | | | 31.67 | | | | (.02 | ) | | | 3.33 | | | | 3.31 | |
| | | Year ended 8/31/2012 | | | 28.25 | | | | (.06 | ) | | | 3.48 | | | | 3.42 | |
| | | Year ended 8/31/2011 | | | 24.69 | | | | (.06 | ) | | | 3.62 | | | | 3.56 | |
| | | Year ended 8/31/2010 | | | 24.14 | | | | (.02 | ) | | | .59 | | | | .57 | |
| | | Year ended 8/31/2009 | | | 29.56 | | | | .04 | | | | (5.45 | ) | | | (5.41 | ) |
| | | Year ended 8/31/2008 | | | 34.62 | | | | .07 | | | | (2.99 | ) | | | (2.92 | ) |
| Class 529-C: | | Six months ended 2/28/20134,5 | | | 31.60 | | | | (.02 | ) | | | 3.32 | | | | 3.30 | |
| | | Year ended 8/31/2012 | | | 28.18 | | | | (.06 | ) | | | 3.48 | | | | 3.42 | |
| | | Year ended 8/31/2011 | | | 24.66 | | | | (.05 | ) | | | 3.60 | | | | 3.55 | |
| | | Year ended 8/31/2010 | | | 24.13 | | | | (.02 | ) | | | .59 | | | | .57 | |
| | | Year ended 8/31/2009 | | | 29.55 | | | | .04 | | | | (5.44 | ) | | | (5.40 | ) |
| | | Year ended 8/31/2008 | | | 34.62 | | | | .07 | | | | (2.99 | ) | | | (2.92 | ) |
| Class 529-E: | | Six months ended 2/28/20134,5 | | | 32.33 | | | | .07 | | | | 3.40 | | | | 3.47 | |
| | | Year ended 8/31/2012 | | | 28.82 | | | | .10 | | | | 3.54 | | | | 3.64 | |
| | | Year ended 8/31/2011 | | | 25.19 | | | | .10 | | | | 3.69 | | | | 3.79 | |
| | | Year ended 8/31/2010 | | | 24.63 | | | | .12 | | | | .59 | | | | .71 | |
| | | Year ended 8/31/2009 | | | 30.21 | | | | .15 | | | | (5.57 | ) | | | (5.42 | ) |
| | | Year ended 8/31/2008 | | | 35.34 | | | | .24 | | | | (3.06 | ) | | | (2.82 | ) |
| 24 | The Growth Fund of America |
| Dividends and distributions | | | | | | | | | | | | |
Dividends
(from net
investment
income) | | | Distributions
(from capital
gains) | | | Total
dividends
and
distributions | | | Net asset
value, end
of period | | | Total
return2,3 | | | Net assets,
end of period
(in millions) | | | Ratio of
expenses to
average net
assets before
waivers | | | Ratio of
expenses to
average net
assets after
waivers3 | | | Ratio of
net income
(loss) to
average
net assets3 | |
| $ | (.28 | ) | | $ | — | | | $ | (.28 | ) | | $ | 36.09 | | | | 10.93 | % | | $ | 58,253 | | | | .71 | %6 | | | .71 | %6 | | | .73 | %6 |
| | (.22 | ) | | | — | | | | (.22 | ) | | | 32.80 | | | | 13.07 | | | | 55,441 | | | | .71 | | | | .71 | | | | .66 | |
| | (.25 | ) | | | — | | | | (.25 | ) | | | 29.23 | | | | 15.42 | | | | 57,082 | | | | .68 | | | | .68 | | | | .67 | |
| | (.21 | ) | | | — | | | | (.21 | ) | | | 25.53 | | | | 3.20 | | | | 57,890 | | | | .69 | | | | .69 | | | | .76 | |
| | (.23 | ) | | | — | | | | (.23 | ) | | | 24.93 | | | | (17.59 | ) | | | 61,587 | | | | .76 | | | | .75 | | | | 1.00 | |
| | (.36 | ) | | | (2.06 | ) | | | (2.42 | ) | | | 30.61 | | | | (8.24 | ) | | | 81,529 | | | | .65 | | | | .62 | | | | 1.09 | |
|
| | — | | | | — | | | | — | | | | 35.01 | | | | 10.48 | | | | 1,316 | | | | 1.47 | 6 | | | 1.47 | 6 | | | (.02 | )6 |
| | — | | | | — | | | | — | | | | 31.69 | | | | 12.26 | | | | 1,503 | | | | 1.46 | | | | 1.46 | | | | (.10 | ) |
| | — | | | | — | | | | — | | | | 28.23 | | | | 14.52 | | | | 2,228 | | | | 1.43 | | | | 1.43 | | | | (.09 | ) |
| | (.01 | ) | | | — | | | | (.01 | ) | | | 24.65 | | | | 2.42 | | | | 2,911 | | | | 1.45 | | | | 1.45 | | | | (.01 | ) |
| | (.01 | ) | | | — | | | | (.01 | ) | | | 24.08 | | | | (18.18 | ) | | | 4,063 | | | | 1.50 | | | | 1.49 | | | | .27 | |
| | (.10 | ) | | | (2.06 | ) | | | (2.16 | ) | | | 29.44 | | | | (8.91 | ) | | | 6,367 | | | | 1.39 | | | | 1.37 | | | | .34 | |
|
| | (.01 | ) | | | — | | | | (.01 | ) | | | 34.72 | | | | 10.47 | | | | 5,817 | | | | 1.51 | 6 | | | 1.51 | 6 | | | (.06 | )6 |
| | — | | | | — | | | | — | | | | 31.44 | | | | 12.21 | | | | 5,741 | | | | 1.49 | | | | 1.49 | | | | (.13 | ) |
| | (.02 | ) | | | — | | | | (.02 | ) | | | 28.02 | | | | 14.51 | | | | 6,539 | | | | 1.46 | | | | 1.46 | | | | (.12 | ) |
| | (.04 | ) | | | — | | | | (.04 | ) | | | 24.49 | | | | 2.38 | | | | 6,959 | | | | 1.47 | | | | 1.47 | | | | (.02 | ) |
| | (.01 | ) | | | — | | | | (.01 | ) | | | 23.96 | | | | (18.18 | ) | | | 7,502 | | | | 1.50 | | | | 1.49 | | | | .26 | |
| | (.10 | ) | | | (2.06 | ) | | | (2.16 | ) | | | 29.30 | | | | (8.95 | ) | | | 10,209 | | | | 1.44 | | | | 1.41 | | | | .29 | |
|
| | (.28 | ) | | | — | | | | (.28 | ) | | | 35.87 | | | | 10.90 | | | | 10,908 | | | | .70 | 6 | | | .70 | 6 | | | .74 | 6 |
| | (.22 | ) | | | — | | | | (.22 | ) | | | 32.61 | | | | 13.15 | | | | 11,323 | | | | .68 | | | | .68 | | | | .69 | |
| | (.25 | ) | | | — | | | | (.25 | ) | | | 29.04 | | | | 15.40 | | | | 13,023 | | | | .67 | | | | .67 | | | | .67 | |
| | (.22 | ) | | | — | | | | (.22 | ) | | | 25.37 | | | | 3.22 | | | | 14,714 | | | | .67 | | | | .67 | | | | .79 | |
| | (.24 | ) | | | — | | | | (.24 | ) | | | 24.78 | | | | (17.52 | ) | | | 16,531 | | | | .69 | | | | .68 | | | | 1.08 | |
| | (.37 | ) | | | (2.06 | ) | | | (2.43 | ) | | | 30.41 | | | | (8.23 | ) | | | 25,528 | | | | .63 | | | | .61 | | | | 1.09 | |
|
| | (.39 | ) | | | — | | | | (.39 | ) | | | 36.06 | | | | 11.07 | | | | 3,945 | | | | .45 | 6 | | | .45 | 6 | | | 1.02 | 6 |
| | (.30 | ) | | | — | | | | (.30 | ) | | | 32.83 | | | | 13.42 | | | | 2,855 | | | | .44 | | | | .44 | | | | .93 | |
| | (.32 | ) | | | — | | | | (.32 | ) | | | 29.25 | | | | 15.69 | | | | 3,717 | | | | .43 | | | | .43 | | | | .91 | |
| | (.29 | ) | | | — | | | | (.29 | ) | | | 25.55 | | | | 3.43 | | | | 3,884 | | | | .44 | | | | .44 | | | | 1.02 | |
| | (.27 | ) | | | — | | | | (.27 | ) | | | 24.97 | | | | (17.31 | ) | | | 3,247 | | | | .46 | | | | .46 | | | | 1.19 | |
| | — | | | | — | | | | — | | | | 30.61 | | | | .59 | | | | 114 | | | | .04 | | | | .03 | | | | .09 | |
|
| | (.27 | ) | | | — | | | | (.27 | ) | | | 35.86 | | | | 10.90 | | | | 4,228 | | | | .78 | 6 | | | .78 | 6 | | | .67 | 6 |
| | (.22 | ) | | | — | | | | (.22 | ) | | | 32.59 | | | | 13.00 | | | | 3,822 | | | | .77 | | | | .77 | | | | .60 | |
| | (.24 | ) | | | — | | | | (.24 | ) | | | 29.06 | | | | 15.38 | | | | 3,358 | | | | .73 | | | | .73 | | | | .62 | |
| | (.21 | ) | | | — | | | | (.21 | ) | | | 25.39 | | | | 3.14 | | | | 2,793 | | | | .73 | | | | .73 | | | | .73 | |
| | (.24 | ) | | | — | | | | (.24 | ) | | | 24.81 | | | | (17.60 | ) | | | 2,543 | | | | .77 | | | | .76 | | | | .99 | |
| | (.35 | ) | | | (2.06 | ) | | | (2.41 | ) | | | 30.47 | | | | (8.27 | ) | | | 2,859 | | | | .69 | | | | .66 | | | | 1.03 | |
|
| | — | | | | — | | | | — | | | | 34.98 | | | | 10.45 | | | | 212 | | | | 1.57 | 6 | | | 1.57 | 6 | | | (.12 | )6 |
| | — | | | | — | | | | — | | | | 31.67 | | | | 12.11 | | | | 237 | | | | 1.57 | | | | 1.57 | | | | (.21 | ) |
| | — | | | | — | | | | — | | | | 28.25 | | | | 14.42 | | | | 310 | | | | 1.53 | | | | 1.53 | | | | (.19 | ) |
| | (.02 | ) | | | — | | | | (.02 | ) | | | 24.69 | | | | 2.36 | | | | 358 | | | | 1.53 | | | | 1.53 | | | | (.08 | ) |
| | (.01 | ) | | | — | | | | (.01 | ) | | | 24.14 | | | | (18.28 | ) | | | 416 | | | | 1.58 | | | | 1.57 | | | | .17 | |
| | (.08 | ) | | | (2.06 | ) | | | (2.14 | ) | | | 29.56 | | | | (9.00 | ) | | | 514 | | | | 1.50 | | | | 1.48 | | | | .23 | |
|
| | (.02 | ) | | | — | | | | (.02 | ) | | | 34.88 | | | | 10.45 | | | | 1,094 | | | | 1.56 | 6 | | | 1.56 | 6 | | | (.12 | )6 |
| | — | | | | — | | | | — | | | | 31.60 | | | | 12.14 | | | | 1,008 | | | | 1.56 | | | | 1.56 | | | | (.19 | ) |
| | (.03 | ) | | | — | | | | (.03 | ) | | | 28.18 | | | | 14.40 | | | | 934 | | | | 1.53 | | | | 1.53 | | | | (.18 | ) |
| | (.04 | ) | | | — | | | | (.04 | ) | | | 24.66 | | | | 2.33 | | | | 811 | | | | 1.53 | | | | 1.53 | | | | (.07 | ) |
| | (.02 | ) | | | — | | | | (.02 | ) | | | 24.13 | | | | (18.25 | ) | | | 767 | | | | 1.58 | | | | 1.57 | | | | .18 | |
| | (.09 | ) | | | (2.06 | ) | | | (2.15 | ) | | | 29.55 | | | | (8.99 | ) | | | 881 | | | | 1.50 | | | | 1.47 | | | | .23 | |
|
| | (.19 | ) | | | — | | | | (.19 | ) | | | 35.61 | | | | 10.76 | | | | 199 | | | | 1.03 | 6 | | | 1.03 | 6 | | | .42 | 6 |
| | (.13 | ) | | | — | | | | (.13 | ) | | | 32.33 | | | | 12.71 | | | | 182 | | | | 1.03 | | | | 1.03 | | | | .35 | |
| | (.16 | ) | | | — | | | | (.16 | ) | | | 28.82 | | | | 15.04 | | | | 165 | | | | 1.01 | | | | 1.01 | | | | .34 | |
| | (.15 | ) | | | — | | | | (.15 | ) | | | 25.19 | | | | 2.83 | | | | 142 | | | | 1.02 | | | | 1.02 | | | | .44 | |
| | (.16 | ) | | | — | | | | (.16 | ) | | | 24.63 | | | | (17.82 | ) | | | 133 | | | | 1.07 | | | | 1.06 | | | | .68 | |
| | (.25 | ) | | | (2.06 | ) | | | (2.31 | ) | | | 30.21 | | | | (8.55 | ) | | | 147 | | | | .99 | | | | .97 | | | | .73 | |
| See page 27 for footnotes. | | |
| | | |
| The Growth Fund of America | 25 |
Financial highlights (continued)
| | | | | | Income (loss) from investment operations1 | |
| | | | Net asset
value,
beginning
of period | | Net
investment
income (loss) | | Net gains (losses)
on securities
(both realized
and unrealized) | | Total from
investment
operations | |
| | | | | | | | | | |
| Class 529-F-1: | | Six months ended 2/28/20134,5 | | | $ | 32.57 | | | $ | .15 | | | $ | 3.42 | | | $ | 3.57 | |
| | | Year ended 8/31/2012 | | | | 29.04 | | | | .25 | | | | 3.56 | | | | 3.81 | |
| | | Year ended 8/31/2011 | | | | 25.38 | | | | .25 | | | | 3.71 | | | | 3.96 | |
| | | Year ended 8/31/2010 | | | | 24.79 | | | | .25 | | | | .60 | | | | .85 | |
| | | Year ended 8/31/2009 | | | | 30.46 | | | | .26 | | | | (5.64 | ) | | | (5.38 | ) |
| | | Year ended 8/31/2008 | | | | 35.61 | | | | .41 | | | | (3.08 | ) | | | (2.67 | ) |
|
| Class R-1: | | Six months ended 2/28/20134,5 | | | | 31.72 | | | | — | 7 | | | 3.34 | | | | 3.34 | |
| | | Year ended 8/31/2012 | | | | 28.26 | | | | (.02 | ) | | | 3.48 | | | | 3.46 | |
| | | Year ended 8/31/2011 | | | | 24.72 | | | | (.03 | ) | | | 3.63 | | | | 3.60 | |
| | | Year ended 8/31/2010 | | | | 24.19 | | | | — | 7 | | | .60 | | | | .60 | |
| | | Year ended 8/31/2009 | | | | 29.65 | | | | .06 | | | | (5.46 | ) | | | (5.40 | ) |
| | | Year ended 8/31/2008 | | | | 34.76 | | | | .10 | | | | (3.02 | ) | | | (2.92 | ) |
|
| Class R-2: | | Six months ended 2/28/20134,5 | | | | 31.91 | | | | .01 | | | | 3.36 | | | | 3.37 | |
| | | Year ended 8/31/2012 | | | | 28.42 | | | | (.01 | ) | | | 3.50 | | | | 3.49 | |
| | | Year ended 8/31/2011 | | | | 24.84 | | | | (.01 | ) | | | 3.64 | | | | 3.63 | |
| | | Year ended 8/31/2010 | | | | 24.30 | | | | .01 | | | | .59 | | | | .60 | |
| | | Year ended 8/31/2009 | | | | 29.77 | | | | .06 | | | | (5.48 | ) | | | (5.42 | ) |
| | | Year ended 8/31/2008 | | | | 34.84 | | | | .12 | | | | (3.01 | ) | | | (2.89 | ) |
|
| Class R-3: | | Six months ended 2/28/20134,5 | | | | 32.29 | | | | .08 | | | | 3.39 | | | | 3.47 | |
| | | Year ended 8/31/2012 | | | | 28.74 | | | | .11 | | | | 3.55 | | | | 3.66 | |
| | | Year ended 8/31/2011 | | | | 25.12 | | | | .11 | | | | 3.68 | | | | 3.79 | |
| | | Year ended 8/31/2010 | | | | 24.55 | | | | .13 | | | | .60 | | | | .73 | |
| | | Year ended 8/31/2009 | | | | 30.11 | | | | .16 | | | | (5.56 | ) | | | (5.40 | ) |
| | | Year ended 8/31/2008 | | | | 35.23 | | | | .26 | | | | (3.05 | ) | | | (2.79 | ) |
|
| Class R-4: | | Six months ended 2/28/20134,5 | | | | 32.56 | | | | .13 | | | | 3.42 | | | | 3.55 | |
| | | Year ended 8/31/2012 | | | | 28.99 | | | | .20 | | | | 3.57 | | | | 3.77 | |
| | | Year ended 8/31/2011 | | | | 25.33 | | | | .20 | | | | 3.71 | | | | 3.91 | |
| | | Year ended 8/31/2010 | | | | 24.75 | | | | .21 | | | | .60 | | | | .81 | |
| | | Year ended 8/31/2009 | | | | 30.38 | | | | .23 | | | | (5.62 | ) | | | (5.39 | ) |
| | | Year ended 8/31/2008 | | | | 35.52 | | | | .35 | | | | (3.08 | ) | | | (2.73 | ) |
|
| Class R-5: | | Six months ended 2/28/20134,5 | | | | 32.82 | | | | .18 | | | | 3.44 | | | | 3.62 | |
| | | Year ended 8/31/2012 | | | | 29.24 | | | | .29 | | | | 3.60 | | | | 3.89 | |
| | | Year ended 8/31/2011 | | | | 25.54 | | | | .29 | | | | 3.74 | | | | 4.03 | |
| | | Year ended 8/31/2010 | | | | 24.94 | | | | .29 | | | | .60 | | | | .89 | |
| | | Year ended 8/31/2009 | | | | 30.66 | | | | .30 | | | | (5.69 | ) | | | (5.39 | ) |
| | | Year ended 8/31/2008 | | | | 35.82 | | | | .45 | | | | (3.09 | ) | | | (2.64 | ) |
|
| Class R-6: | | Six months ended 2/28/20134,5 | | | | 32.87 | | | | .19 | | | | 3.45 | | | | 3.64 | |
| | | Year ended 8/31/2012 | | | | 29.30 | | | | .31 | | | | 3.60 | | | | 3.91 | |
| | | Year ended 8/31/2011 | | | | 25.60 | | | | .31 | | | | 3.74 | | | | 4.05 | |
| | | Year ended 8/31/2010 | | | | 24.97 | | | | .31 | | | | .60 | | | | .91 | |
| | | Period from 5/1/2009 to 8/31/20094 | | | | 21.68 | | | | .09 | | | | 3.20 | | | | 3.29 | |
| | | Six months ended | | | | | | | | | | |
| | | February 28, | | | | Year ended August 31 | | |
| | | 20134,5 | | 2012 | | 2011 | | 2010 | | 2009 | | 2008 |
| | | | | | | | | | | | | | | | | | | | | | | | | |
| Portfolio turnover rate for all share classes | | | 16% | | | | 18 | % | | | 34 | % | | | 33 | % | | | 38 | % | | | 32 | % |
| 26 | The Growth Fund of America |
| Dividends and distributions | | | | | | | | | | | | |
Dividends
(from net
investment
income) | | Distributions
(from capital
gains) | | Total
dividends
and
distributions | | Net asset
value, end
of period | | Total
return3 | | Net assets,
end of period
(in millions) | | Ratio of
expenses to
average net
assets before
waivers | | Ratio of
expenses to
average net
assets after
waivers3 | | Ratio of
net income
(loss) to
average
net assets3 |
| $ | (.34 | ) | | $ | — | | | $ | (.34 | ) | | $ | 35.80 | | | | 11.01 | % | | $ | 140 | | | | .56 | %6 | | | .56 | %6 | | | .88 | %6 |
| | (.28 | ) | | | — | | | | (.28 | ) | | | 32.57 | | | | 13.27 | | | | 125 | | | | .56 | | | | .56 | | | | .81 | |
| | (.30 | ) | | | — | | | | (.30 | ) | | | 29.04 | | | | 15.56 | | | | 106 | | | | .52 | | | | .52 | | | | .83 | |
| | (.26 | ) | | | — | | | | (.26 | ) | | | 25.38 | | | | 3.37 | | | | 92 | | | | .52 | | | | .52 | | | | .94 | |
| | (.29 | ) | | | — | | | | (.29 | ) | | | 24.79 | | | | (17.41 | ) | | | 79 | | | | .57 | | | | .56 | | | | 1.18 | |
| | (.42 | ) | | | (2.06 | ) | | | (2.48 | ) | | | 30.46 | | | | (8.09 | ) | | | 85 | | | | .49 | | | | .47 | | | | 1.24 | |
|
| | (.01 | ) | | | — | | | | (.01 | ) | | | 35.05 | | | | 10.53 | | | | 463 | | | | 1.44 | 6 | | | 1.44 | 6 | | | — | 6,8 |
| | — | | | | — | | | | — | | | | 31.72 | | | | 12.24 | | | | 497 | | | | 1.44 | | | | 1.44 | | | | (.07 | ) |
| | (.06 | ) | | | — | | | | (.06 | ) | | | 28.26 | | | | 14.54 | | | | 561 | | | | 1.43 | | | | 1.43 | | | | (.09 | ) |
| | (.07 | ) | | | — | | | | (.07 | ) | | | 24.72 | | | | 2.45 | | | | 539 | | | | 1.44 | | | | 1.44 | | | | .02 | |
| | (.06 | ) | | | — | | | | (.06 | ) | | | 24.19 | | | | (18.17 | ) | | | 476 | | | | 1.47 | | | | 1.46 | | | | .29 | |
| | (.13 | ) | | | (2.06 | ) | | | (2.19 | ) | | | 29.65 | | | | (8.96 | ) | | | 503 | | | | 1.42 | | | | 1.39 | | | | .30 | |
|
| | (.05 | ) | | | — | | | | (.05 | ) | | | 35.23 | | | | 10.56 | | | | 2,182 | | | | 1.38 | 6 | | | 1.38 | 6 | | | .07 | 6 |
| | — | | | | — | | | | — | | | | 31.91 | | | | 12.28 | | | | 2,182 | | | | 1.41 | | | | 1.41 | | | | (.04 | ) |
| | (.05 | ) | | | — | | | | (.05 | ) | | | 28.42 | | | | 14.60 | | | | 2,337 | | | | 1.39 | | | | 1.39 | | | | (.04 | ) |
| | (.06 | ) | | | — | | | | (.06 | ) | | | 24.84 | | | | 2.44 | | | | 2,327 | | | | 1.41 | | | | 1.41 | | | | .04 | |
| | (.05 | ) | | | — | | | | (.05 | ) | | | 24.30 | | | | (18.17 | ) | | | 2,367 | | | | 1.48 | | | | 1.47 | | | | .27 | |
| | (.12 | ) | | | (2.06 | ) | | | (2.18 | ) | | | 29.77 | | | | (8.87 | ) | | | 2,708 | | | | 1.36 | | | | 1.33 | | | | .37 | |
|
| | (.16 | ) | | | — | | | | (.16 | ) | | | 35.60 | | | | 10.78 | | | | 7,514 | | | | .98 | 6 | | | .98 | 6 | | | .47 | 6 |
| | (.11 | ) | | | — | | | | (.11 | ) | | | 32.29 | | | | 12.78 | | | | 7,916 | | | | .98 | | | | .98 | | | | .38 | |
| | (.17 | ) | | | — | | | | (.17 | ) | | | 28.74 | | | | 15.06 | | | | 10,765 | | | | .97 | | | | .97 | | | | .38 | |
| | (.16 | ) | | | — | | | | (.16 | ) | | | 25.12 | | | | 2.94 | | | | 11,422 | | | | .97 | | | | .97 | | | | .48 | |
| | (.16 | ) | | | — | | | | (.16 | ) | | | 24.55 | | | | (17.78 | ) | | | 11,477 | | | | .99 | | | | .98 | | | | .76 | |
| | (.27 | ) | | | (2.06 | ) | | | (2.33 | ) | | | 30.11 | | | | (8.50 | ) | | | 13,098 | | | | .94 | | | | .91 | | | | .79 | |
|
| | (.25 | ) | | | — | | | | (.25 | ) | | | 35.86 | | | | 10.95 | | | | 7,191 | | | | .68 | 6 | | | .68 | 6 | | | .77 | 6 |
| | (.20 | ) | | | — | | | | (.20 | ) | | | 32.56 | | | | 13.10 | | | | 8,093 | | | | .69 | | | | .69 | | | | .66 | |
| | (.25 | ) | | | — | | | | (.25 | ) | | | 28.99 | | | | 15.40 | | | | 14,937 | | | | .68 | | | | .68 | | | | .66 | |
| | (.23 | ) | | | — | | | | (.23 | ) | | | 25.33 | | | | 3.20 | | | | 16,442 | | | | .68 | | | | .68 | | | | .77 | |
| | (.24 | ) | | | — | | | | (.24 | ) | | | 24.75 | | | | (17.53 | ) | | | 15,985 | | | | .70 | | | | .69 | | | | 1.04 | |
| | (.35 | ) | | | (2.06 | ) | | | (2.41 | ) | | | 30.38 | | | | (8.26 | ) | | | 17,215 | | | | .67 | | | | .64 | | | | 1.06 | |
|
| | (.38 | ) | | | — | | | | (.38 | ) | | | 36.06 | | | | 11.09 | | | | 5,141 | | | | .39 | 6 | | | .39 | 6 | | | 1.05 | 6 |
| | (.31 | ) | | | — | | | | (.31 | ) | | | 32.82 | | | | 13.48 | | | | 6,312 | | | | .39 | | | | .39 | | | | .97 | |
| | (.33 | ) | | | — | | | | (.33 | ) | | | 29.24 | | | | 15.75 | | | | 11,366 | | | | .38 | | | | .38 | | | | .96 | |
| | (.29 | ) | | | — | | | | (.29 | ) | | | 25.54 | | | | 3.51 | | | | 12,874 | | | | .39 | | | | .39 | | | | 1.07 | |
| | (.33 | ) | | | — | | | | (.33 | ) | | | 24.94 | | | | (17.30 | ) | | | 14,023 | | | | .40 | | | | .40 | | | | 1.36 | |
| | (.46 | ) | | | (2.06 | ) | | | (2.52 | ) | | | 30.66 | | | | (7.96 | ) | | | 17,362 | | | | .37 | | | | .34 | | | | 1.35 | |
|
| | (.41 | ) | | | — | | | | (.41 | ) | | | 36.10 | | | | 11.13 | | | | 8,155 | | | | .34 | 6 | | | .34 | 6 | | | 1.10 | 6 |
| | (.34 | ) | | | — | | | | (.34 | ) | | | 32.87 | | | | 13.52 | | | | 7,537 | | | | .34 | | | | .34 | | | | 1.02 | |
| | (.35 | ) | | | — | | | | (.35 | ) | | | 29.30 | | | | 15.78 | | | | 10,059 | | | | .33 | | | | .33 | | | | 1.02 | |
| | (.28 | ) | | | — | | | | (.28 | ) | | | 25.60 | | | | 3.58 | | | | 6,061 | | | | .34 | | | | .34 | | | | 1.16 | |
| | — | | | | — | | | | — | | | | 24.97 | | | | 15.17 | | | | 2,134 | | | | .14 | | | | .14 | | | | .38 | |
| 1 | Based on average shares outstanding. |
| 2 | Total returns exclude any applicable sales charges, including contingent deferred sales charges. |
| 3 | This column reflects the impact, if any, of certain waivers from CRMC. During some of the periods shown, CRMC reduced fees for investment advisory services. |
| 4 | Based on operations for the period shown and, accordingly, is not representative of a full year. |
| 5 | Unaudited. |
| 6 | Annualized. |
| 7 | Amount less than $.01. |
| 8 | Amount less than .01%. |
See Notes to Financial Statements
| The Growth Fund of America | 27 |
As a shareholder of the fund, you incur two types of costs: (1) transaction costs, such as initial sales charges on purchase payments and contingent deferred sales charges on redemptions (loads), and (2) ongoing costs, including management fees, distribution and service (12b-1) fees, and other expenses. This example is intended to help you understand your ongoing costs (in dollars) of investing in the fund so you can compare these costs with the ongoing costs of investing in other mutual funds. The example is based on an investment of $1,000 invested at the beginning of the period and held for the entire six-month period (September 1, 2012, through February 28, 2013).
Actual expenses:
The first line of each share class in the table on the next page provides information about actual account values and actual expenses. You may use the information in this line, together with the amount you invested, to estimate the expenses that you paid over the period. Simply divide your account value by $1,000 (for example, an $8,600 account value divided by $1,000 = 8.6), then multiply the result by the number in the first line under the heading entitled “Expenses paid during period” to estimate the expenses you paid on your account during this period.
Hypothetical example for comparison purposes:
The second line of each share class in the table on the next page provides information about hypothetical account values and hypothetical expenses based on the actual expense ratio for the share class and an assumed rate of return of 5.00% per year before expenses, which is not the actual return of the share class. The hypothetical account values and expenses may not be used to estimate the actual ending account balance or expenses you paid for the period. You may use this information to compare the ongoing costs of investing in the fund and other funds. To do so, compare this 5.00% hypothetical example with the 5.00% hypothetical examples that appear in the shareholder reports of the other funds.
Notes:
There are some account fees that are charged to certain types of accounts, such as individual retirement accounts and 529 college savings plan accounts (generally, a $10 fee is charged to set up the account and an additional $10 fee is charged to the account annually), that would increase the amount of expenses paid on your account. In addition, retirement plan participants may be subject to certain fees charged by the plan sponsor, and Class F-1, F-2 and 529-F-1 shareholders may be subject to fees charged by financial intermediaries, typically ranging from 0.75% to 1.50% of assets annually depending on services offered. You can estimate the impact of these fees by adding the amount of the fees to the total estimated expenses you paid on your account during the period as calculated above. In addition, your ending account value would be lower by the amount of these fees.
Note that the expenses shown in the table are meant to highlight your ongoing costs only and do not reflect any transactional costs, such as sales charges (loads). Therefore, the second line of each share class in the table is useful in comparing ongoing costs only and will not help you determine the relative total costs of owning different funds. In addition, if these transactional costs were included, your costs would have been higher.
| 28 | The Growth Fund of America |
| | | Beginning | | | Ending | | | | | | | |
| | | account value | | | account value | | | Expenses paid | | | Annualized | |
| | | 9/1/2012 | | | 2/28/2013 | | | during period* | | | expense ratio | |
| Class A — actual return | | $ | 1,000.00 | | | $ | 1,109.33 | | | $ | 3.71 | | | | .71 | % |
| Class A — assumed 5% return | | | 1,000.00 | | | | 1,021.27 | | | | 3.56 | | | | .71 | |
| Class B — actual return | | | 1,000.00 | | | | 1,104.78 | | | | 7.67 | | | | 1.47 | |
| Class B — assumed 5% return | | | 1,000.00 | | | | 1,017.50 | | | | 7.35 | | | | 1.47 | |
| Class C — actual return | | | 1,000.00 | | | | 1,104.69 | | | | 7.88 | | | | 1.51 | |
| Class C — assumed 5% return | | | 1,000.00 | | | | 1,017.31 | | | | 7.55 | | | | 1.51 | |
| Class F-1 — actual return | | | 1,000.00 | | | | 1,108.99 | | | | 3.66 | | | | .70 | |
| Class F-1 — assumed 5% return | | | 1,000.00 | | | | 1,021.32 | | | | 3.51 | | | | .70 | |
| Class F-2 — actual return | | | 1,000.00 | | | | 1,110.68 | | | | 2.35 | | | | .45 | |
| Class F-2 — assumed 5% return | | | 1,000.00 | | | | 1,022.56 | | | | 2.26 | | | | .45 | |
| Class 529-A — actual return | | | 1,000.00 | | | | 1,109.01 | | | | 4.08 | | | | .78 | |
| Class 529-A — assumed 5% return | | | 1,000.00 | | | | 1,020.93 | | | | 3.91 | | | | .78 | |
| Class 529-B — actual return | | | 1,000.00 | | | | 1,104.53 | | | | 8.19 | | | | 1.57 | |
| Class 529-B — assumed 5% return | | | 1,000.00 | | | | 1,017.01 | | | | 7.85 | | | | 1.57 | |
| Class 529-C — actual return | | | 1,000.00 | | | | 1,104.48 | | | | 8.14 | | | | 1.56 | |
| Class 529-C — assumed 5% return | | | 1,000.00 | | | | 1,017.06 | | | | 7.80 | | | | 1.56 | |
| Class 529-E — actual return | | | 1,000.00 | | | | 1,107.58 | | | | 5.38 | | | | 1.03 | |
| Class 529-E — assumed 5% return | | | 1,000.00 | | | | 1,019.69 | | | | 5.16 | | | | 1.03 | |
| Class 529-F-1 — actual return | | | 1,000.00 | | | | 1,110.12 | | | | 2.93 | | | | .56 | |
| Class 529-F-1 — assumed 5% return | | | 1,000.00 | | | | 1,022.02 | | | | 2.81 | | | | .56 | |
| Class R-1 — actual return | | | 1,000.00 | | | | 1,105.34 | | | | 7.52 | | | | 1.44 | |
| Class R-1 — assumed 5% return | | | 1,000.00 | | | | 1,017.65 | | | | 7.20 | | | | 1.44 | |
| Class R-2 — actual return | | | 1,000.00 | | | | 1,105.62 | | | | 7.20 | | | | 1.38 | |
| Class R-2 — assumed 5% return | | | 1,000.00 | | | | 1,017.95 | | | | 6.90 | | | | 1.38 | |
| Class R-3 — actual return | | | 1,000.00 | | | | 1,107.77 | | | | 5.12 | | | | .98 | |
| Class R-3 — assumed 5% return | | | 1,000.00 | | | | 1,019.93 | | | | 4.91 | | | | .98 | |
| Class R-4 — actual return | | | 1,000.00 | | | | 1,109.51 | | | | 3.56 | | | | .68 | |
| Class R-4 — assumed 5% return | | | 1,000.00 | | | | 1,021.42 | | | | 3.41 | | | | .68 | |
| Class R-5 — actual return | | | 1,000.00 | | | | 1,110.94 | | | | 2.04 | | | | .39 | |
| Class R-5 — assumed 5% return | | | 1,000.00 | | | | 1,022.86 | | | | 1.96 | | | | .39 | |
| Class R-6 — actual return | | | 1,000.00 | | | | 1,111.27 | | | | 1.78 | | | | .34 | |
| Class R-6 — assumed 5% return | | | 1,000.00 | | | | 1,023.11 | | | | 1.71 | | | | .34 | |
| * | The “expenses paid during period” are equal to the “annualized expense ratio,” multiplied by the average account value over the period, multiplied by the number of days in the period, and divided by 365 (to reflect the one-half year period). |
| The Growth Fund of America | 29 |
| Other share class results | unaudited |
Classes B, C, F and 529
Fund results shown are for past periods and are not predictive of results for future periods. Current and future results may be lower or higher than those shown. Share prices and returns will vary, so investors may lose money. For current information and month-end results, visit americanfunds.com.
| Average annual total returns for periods ended March 31, 2013 | | | | | | | | | | | 10 years/ | |
| (the most recent calendar quarter-end): | | | 1 year | | | | 5 years | | | | Life of class1 | |
| Class B shares2 | | | | | | | | | | | | |
| Reflecting applicable contingent deferred sales charge (CDSC), maximum of 5%, payable only if shares are sold within six years of purchase | | | 8.32 | % | | | 3.31 | % | | | 8.75 | % |
| Not reflecting CDSC | | | 13.32 | | | | 3.66 | | | | 8.75 | |
| | | | | | | | | | | | | |
| Class C shares | | | | | | | | | | | | |
| Reflecting CDSC, maximum of 1%, payable only if shares are sold within one year of purchase | | | 12.31 | | | | 3.64 | | | | 8.54 | |
| Not reflecting CDSC | | | 13.31 | | | | 3.64 | | | | 8.54 | |
| | | | | | | | | | | | | |
| Class F-1 shares3 | | | | | | | | | | | | |
| Not reflecting annual asset-based fee charged by sponsoring firm | | | 14.20 | | | | 4.47 | | | | 9.41 | |
| | | | | | | | | | | | | |
| Class F-2 shares3 — first sold 8/1/08 | | | | | | | | | | | | |
| Not reflecting annual asset-based fee charged by sponsoring firm | | | 14.49 | | | | — | | | | 5.71 | |
| | | | | | | | | | | | | |
| Class 529-A shares4 | | | | | | | | | | | | |
| Reflecting 5.75% maximum sales charge | | | 7.52 | | | | 3.17 | | | | 8.71 | |
| Not reflecting maximum sales charge | | | 14.09 | | | | 4.40 | | | | 9.36 | |
| | | | | | | | | | | | | |
| Class 529-B shares2,4 | | | | | | | | | | | | |
| Reflecting applicable CDSC, maximum of 5%, payable only if shares are sold within six years of purchase | | | 8.20 | | | | 3.21 | | | | 8.62 | |
| Not reflecting CDSC | | | 13.20 | | | | 3.56 | | | | 8.62 | |
| | | | | | | | | | | | | |
| Class 529-C shares4 | | | | | | | | | | | | |
| Reflecting CDSC, maximum of 1%, payable only if shares are sold within one year of purchase | | | 12.23 | | | | 3.57 | | | | 8.46 | |
| Not reflecting CDSC | | | 13.23 | | | | 3.57 | | | | 8.46 | |
| | | | | | | | | | | | | |
| Class 529-E shares3,4 | | | 13.83 | | | | 4.10 | | | | 9.02 | |
| | | | | | | | | | | | | |
| Class 529-F-1 shares3,4 | | | | | | | | | | | | |
| Not reflecting annual asset-based fee charged by sponsoring firm | | | 14.35 | | | | 4.61 | | | | 9.50 | |
| 1 | Applicable to Class F-2 shares only. All other share classes reflect 10-year results. |
| 2 | These shares are not available for purchase. |
| 3 | These shares are sold without any initial or contingent deferred sales charge. |
| 4 | Results shown do not reflect the $10 account setup fee and an annual $10 account maintenance fee. |
Investment results assume all distributions are reinvested and reflect applicable fees and expenses. When applicable, investment results reflect fee waivers, without which results would have been lower. Visit americanfunds.com for more information.
For information regarding the differences among the various share classes, refer to the fund prospectus.
| 30 | The Growth Fund of America |
Office of the fund
One Market
Steuart Tower, Suite 2000
Mailing address: P.O. Box 7650
San Francisco, CA 94120-7650
Investment adviser
Capital Research and Management Company
333 South Hope Street
Los Angeles, CA 90071-1406
6455 Irvine Center Drive
Irvine, CA 92618
Principal underwriter
American Funds Distributors, Inc.
333 South Hope Street
Los Angeles, CA 90071-1406
Custodian of assets
State Street Bank and Trust Company
One Lincoln Street
Boston, MA 02111
Transfer agent for shareholder accounts
American Funds Service Company
(Write to the address near you.)
P.O. Box 6007
Indianapolis, IN 46206-6007
P.O. Box 2280
Norfolk, VA 23501-2280
Counsel
K&L Gates LLP
Four Embarcadero Center, Suite 1200
San Francisco, CA 94111-5994
Independent registered public accounting firm
Deloitte & Touche LLP
695 Town Center Drive
Suite 1200
Costa Mesa, CA 92626-7188
| The Growth Fund of America | 31 |
Investors should carefully consider investment objectives, risks, charges and expenses. This and other important information is contained in the fund prospectus and summary prospectus, which can be obtained from your financial professional and should be read carefully before investing. You may also call American Funds Service Company (AFS) at 800/421-4225 or visit the American Funds website at americanfunds.com.
“American Funds Proxy Voting Procedures and Principles” — which describes how we vote proxies relating to portfolio securities �� is available on the American Funds website or upon request by calling AFS. The fund files its proxy voting record with the U.S. Securities and Exchange Commission (SEC) for the 12 months ended June 30 by August 31. The proxy voting record is available free of charge on the SEC website at sec.gov and on the American Funds website.
A complete February 28, 2013, portfolio of The Growth Fund of America’s investments is available free of charge by calling AFS or visiting the SEC website (where it is part of Form N-CSR).
The Growth Fund of America files a complete list of its portfolio holdings with the SEC for the first and third quarters of each fiscal year on Form N-Q. This filing is available free of charge on the SEC website. You may also review or, for a fee, copy this filing at the SEC’s Public Reference Room in Washington, D.C. Additional information regarding the operation of the Public Reference Room may be obtained by calling the SEC’s Office of Investor Education and Advocacy at 800/SEC-0330.
Additionally, the list of portfolio holdings is available by calling AFS.
This report is for the information of shareholders of The Growth Fund of America, but it also may be used as sales literature when preceded or accompanied by the current prospectus or summary prospectus, which gives details about charges, expenses, investment objectives and operating policies of the fund. If used as sales material after June 30, 2013, this report must be accompanied by an American Funds statistical update for the most recently completed calendar quarter.
| 32 | The Growth Fund of America |
This page intentionally left blank.
| The Growth Fund of America | 33 |
This page intentionally left blank.
| 34 | The Growth Fund of America |
This page intentionally left blank.
| The Growth Fund of America | 35 |
This page intentionally left blank.
| 36 | The Growth Fund of America |
This page intentionally left blank.
 | The right choice for the long term® |
The American Funds difference
Since 1931, American Funds has helped investors pursue long-term investment success Our consistent approach — in combination with a proven system — has resulted in a superior long-term track record.
 | Consistent approach
We base our decisions on a long-term perspective because we believe it is the best way to achieve superior long-term investment results. Our portfolio counselors average 25 years of investment experience, including 20 years at our company, reflecting a career commitment to our long-term approach.1 |
| | |
 | Proven system
Our system combines individual accountability with teamwork. Each fund is divided into portions that are managed by investment professionals with varied backgrounds, ages and investment styles. An extensive global research effort is the backbone of our system. |
| | |
 | Superior long-term track record
Our equity funds have beaten their Lipper peer indexes in 90% of 10-year periods and 96% of 20-year periods. Our fixed-income funds have beaten their Lipper indexes in 58% of 10-year periods and 63% of 20-year periods.2 Our fund management fees have been among the lowest in the industry.3 |
| | 1 | As of 12/31/12. |
| | 2 | Based on Class A share results for rolling periods through 12/31/12. Periods covered are the shorter of the fund’s lifetime or since the comparable Lipper index inception date. |
| | 3 | Based on management fees for the 20-year period ended 12/31/12 versus comparable Lipper categories, excluding funds of funds. |
| | American Funds span a range of investment objectives | |
| ¢ | Growth funds | |
| | AMCAP Fund® | |
| | EuroPacific Growth Fund® | |
| | The Growth Fund of America® | |
| | The New Economy Fund® |
| | New Perspective Fund® |
| | New World Fund® |
| | SMALLCAP World Fund® |
| ¢ | Growth-and-income funds | |
| | American Mutual Fund® | |
| | Capital World Growth and Income Fund® |
| | Fundamental InvestorsSM |
| | International Growth and Income FundSM |
| | The Investment Company of America® |
| | Washington Mutual Investors FundSM |
| ¢ | Equity-income funds | |
| | Capital Income Builder® | |
| | The Income Fund of America® |
| ¢ | Balanced funds | |
| | American Balanced Fund® | |
| | American Funds Global Balanced FundSM |
| ¢ | Bond funds | |
| | American Funds Mortgage Fund® |
| | American High-Income Trust® |
| | The Bond Fund of America® |
| | Capital World Bond Fund® | |
| | Intermediate Bond Fund of America® |
| | Short-Term Bond Fund of America® |
| | U.S. Government Securities Fund® |
| ¢ | Tax-exempt bond funds | |
| | American Funds Short-Term Tax-Exempt Bond Fund® |
| | American High-Income Municipal Bond Fund® |
| | Limited Term Tax-Exempt Bond Fund of America® |
| The Tax-Exempt Bond Fund of America® |
| State-specific tax-exempt funds |
| | American Funds Tax-Exempt Fund of New York® |
| | The Tax-Exempt Fund of California® |
| | The Tax-Exempt Fund of Maryland® |
| | The Tax-Exempt Fund of Virginia® |
| ¢ | Money market fund | |
| | American Funds Money Market Fund® |
| ¢ | American Funds Portfolio SeriesSM | |
| | American Funds Global Growth PortfolioSM |
| | American Funds Growth PortfolioSM |
| | American Funds Growth and Income PortfolioSM |
| | American Funds Balanced PortfolioSM |
| | American Funds Income PortfolioSM |
| | American Funds Tax-Advantaged Income PortfolioSM |
| | American Funds Preservation PortfolioSM |
| | American Funds Tax-Exempt Preservation PortfolioSM |
| ¢ | American Funds Target Date Retirement Series® | |
| ¢ | American Funds College Target Date SeriesSM | |

| The Capital Group Companies |
| American Funds | Capital Research and Management | Capital International | Capital Guardian | Capital Bank and Trust |
ITEM 2 – Code of Ethics
Not applicable for filing of semi-annual reports to shareholders.
ITEM 3 – Audit Committee Financial Expert
Not applicable for filing of semi-annual reports to shareholders.
ITEM 4 – Principal Accountant Fees and Services
Not applicable for filing of semi-annual reports to shareholders.
ITEM 5 – Audit Committee of Listed Registrants
Not applicable to this Registrant, insofar as the Registrant is not a listed issuer as defined in Rule 10A-3 under the Securities Exchange Act of 1934.
ITEM 6 – Schedule of Investments

The Growth Fund of America®
Investment portfolio
February 28, 2013
unaudited
| Common stocks — 90.09% | Shares | Value (000) |
| | | |
| CONSUMER DISCRETIONARY — 19.42% | | |
| Amazon.com, Inc.1 | 16,032,600 | $4,236,935 |
| Home Depot, Inc. | 42,205,200 | 2,891,056 |
| Comcast Corp., Class A | 54,735,578 | 2,177,929 |
| Comcast Corp., Class A, special nonvoting shares | 14,000,000 | 536,340 |
| NIKE, Inc., Class B | 22,700,000 | 1,236,242 |
| News Corp., Class A | 35,644,800 | 1,026,570 |
| YUM! Brands, Inc. | 11,181,000 | 732,132 |
| Las Vegas Sands Corp. | 14,122,000 | 727,142 |
| DIRECTV1 | 13,362,579 | 643,675 |
| General Motors Co.1 | 20,042,600 | 544,157 |
| Johnson Controls, Inc. | 16,575,300 | 521,625 |
| Time Warner Cable Inc. | 5,772,090 | 498,651 |
| lululemon athletica inc.1 | 7,162,100 | 480,219 |
| Sands China Ltd. | 89,096,800 | 424,484 |
| Time Warner Inc. | 7,950,000 | 422,701 |
| CBS Corp., Class B | 9,295,000 | 403,310 |
| Liberty Media Corp., Class A1 | 3,391,290 | 366,259 |
| Nikon Corp. | 15,635,000 | 350,856 |
| Naspers Ltd., Class N | 4,740,000 | 306,462 |
| Virgin Media Inc. | 6,250,000 | 290,000 |
| Toyota Motor Corp. | 5,205,000 | 267,578 |
| AutoNation, Inc.1 | 6,000,000 | 262,620 |
| Lowe’s Companies, Inc. | 6,400,000 | 244,160 |
| Marriott International, Inc., Class A | 6,143,059 | 242,344 |
| Volkswagen AG, nonvoting preferred | 930,000 | 203,068 |
| Industria de Diseño Textil, SA | 1,370,000 | 183,600 |
| priceline.com Inc.1 | 267,000 | 183,584 |
| Tesla Motors, Inc.1 | 4,710,500 | 164,067 |
| Wynn Resorts, Ltd. | 1,300,000 | 151,970 |
| D.R. Horton, Inc. | 6,685,000 | 149,075 |
| British Sky Broadcasting Group PLC | 11,480,000 | 148,121 |
| Shaw Communications Inc., Class B, nonvoting | 6,123,900 | 146,422 |
| Bayerische Motoren Werke AG | 1,385,500 | 127,885 |
| Expedia, Inc. | 2,000,000 | 127,680 |
| Toll Brothers, Inc.1 | 3,700,000 | 126,244 |
| Weight Watchers International, Inc. | 2,780,000 | 119,095 |
| Darden Restaurants, Inc. | 2,443,000 | 113,038 |
| Tiffany & Co. | 1,640,000 | 110,142 |
| Nordstrom, Inc. | 2,025,000 | 109,795 |
| Starbucks Corp. | 2,000,000 | 109,640 |
| Harley-Davidson, Inc. | 2,028,500 | 106,760 |
| Mattel, Inc. | 2,420,000 | 98,615 |
| Swatch Group Ltd, non-registered shares | 120,000 | 68,239 |
| Burberry Group PLC | 2,725,000 | 56,883 |
| Daimler AG | 943,000 | 56,220 |
| Kia Motors Corp. | 950,000 | 49,043 |
| Li & Fung Ltd. | 34,030,000 | 45,633 |
| Tata Motors Ltd. | 6,671,739 | 35,263 |
| Hyundai Mobis Co., Ltd. | 74,000 | 21,390 |
| Maruti Suzuki India Ltd. | 665,097 | 16,557 |
| Ctrip.com International, Ltd. (ADR)1 | 730,000 | 14,082 |
| | | 22,675,558 |
| | | |
| INFORMATION TECHNOLOGY — 16.53% | | |
| Google Inc., Class A1 | 4,406,336 | 3,530,356 |
| Oracle Corp. | 63,743,676 | 2,183,858 |
| Texas Instruments Inc. | 34,144,000 | 1,173,529 |
| Microsoft Corp. | 33,630,608 | 934,931 |
| ASML Holding NV (New York registered) | 7,523,789 | 534,038 |
| ASML Holding NV | 4,042,648 | 287,750 |
| Accenture PLC, Class A | 9,250,000 | 687,830 |
| Taiwan Semiconductor Manufacturing Co. Ltd.2 | 151,046,000 | 531,582 |
| Taiwan Semiconductor Manufacturing Co. Ltd. (ADR) | 7,565,000 | 138,061 |
| Apple Inc. | 1,460,000 | 644,444 |
| Visa Inc., Class A | 3,925,000 | 622,662 |
| Avago Technologies Ltd.3 | 16,208,820 | 554,666 |
| Rackspace Hosting, Inc.1,3 | 9,925,087 | 554,415 |
| salesforce.com, inc.1 | 3,045,681 | 515,390 |
| Samsung Electronics Co. Ltd. | 354,000 | 504,769 |
| Intuit Inc. | 5,905,100 | 380,761 |
| Motorola Solutions, Inc. | 5,900,000 | 367,039 |
| Murata Manufacturing Co., Ltd. | 5,604,700 | 360,989 |
| Facebook, Inc., Class A1 | 12,707,220 | 346,272 |
| Adobe Systems Inc.1 | 8,672,800 | 340,841 |
| Arm Holdings PLC | 21,005,000 | 304,317 |
| Altera Corp. | 8,500,000 | 301,070 |
| KLA-Tencor Corp. | 5,000,000 | 273,800 |
| Baidu, Inc., Class A (ADR)1 | 2,747,000 | 249,318 |
| EMC Corp.1 | 9,800,000 | 225,498 |
| Automatic Data Processing, Inc. | 3,650,000 | 223,964 |
| Broadcom Corp., Class A | 6,533,000 | 222,841 |
| International Business Machines Corp. | 1,000,000 | 200,830 |
| Linear Technology Corp. | 5,215,000 | 199,422 |
| TE Connectivity Ltd. | 4,623,000 | 185,521 |
| Maxim Integrated Products, Inc. | 5,902,120 | 184,028 |
| Mail.Ru Group Ltd. (GDR) | 4,265,910 | 143,249 |
| Mail.Ru Group Ltd. (GDR)4 | 860,490 | 28,895 |
| SINA Corp.1 | 3,300,000 | 170,544 |
| MasterCard Inc., Class A | 265,000 | 137,222 |
| Electronic Arts Inc.1 | 7,481,500 | 131,151 |
| Intel Corp. | 6,000,000 | 125,100 |
| National Instruments Corp. | 4,105,010 | 123,479 |
| Amphenol Corp. | 1,730,000 | 122,588 |
| Flextronics International Ltd.1 | 17,293,916 | 115,005 |
| Dolby Laboratories, Inc., Class A | 2,650,000 | 84,482 |
| FactSet Research Systems, Inc. | 765,000 | 74,427 |
| Yahoo! Inc.1 | 3,100,400 | 66,069 |
| Nokia Corp. (ADR) | 13,089,474 | 47,777 |
| Nokia Corp. | 1,000,000 | 3,624 |
| Gemalto NV | 511,512 | 46,573 |
| Infineon Technologies AG | 3,575,000 | 30,622 |
| FLIR Systems, Inc. | 1,160,000 | 30,554 |
| MercadoLibre, Inc. | 350,000 | 29,963 |
| Compuware Corp.1 | 878,700 | 10,202 |
| MediaTek Inc.2 | 652,000 | 7,341 |
| Analog Devices, Inc. | 87,559 | 3,959 |
| | | 19,297,618 |
| | | |
| HEALTH CARE — 15.24% | | |
| Gilead Sciences, Inc.1,3 | 103,328,800 | 4,413,173 |
| Allergan, Inc. | 12,132,900 | 1,315,449 |
| UnitedHealth Group Inc. | 24,582,200 | 1,313,919 |
| Express Scripts Holding Co.1 | 17,370,000 | 988,527 |
| Alexion Pharmaceuticals, Inc.1,3 | 9,762,000 | 846,756 |
| Intuitive Surgical, Inc.1 | 1,578,694 | 804,960 |
| Edwards Lifesciences Corp.1,3 | 9,232,700 | 793,366 |
| Biogen Idec Inc.1 | 4,687,000 | 779,636 |
| Amgen Inc. | 8,149,600 | 744,955 |
| Merck & Co., Inc. | 15,067,700 | 643,843 |
| Regeneron Pharmaceuticals, Inc.1 | 3,481,357 | 581,387 |
| BioMarin Pharmaceutical Inc.1,3 | 9,667,500 | 560,425 |
| Celgene Corp.1 | 4,770,000 | 492,169 |
| St. Jude Medical, Inc. | 10,385,000 | 425,785 |
| Stryker Corp. | 6,262,616 | 400,056 |
| Vertex Pharmaceuticals Inc.1 | 7,410,000 | 346,936 |
| Hologic, Inc.1,3 | 15,654,300 | 341,733 |
| Illumina, Inc.1,3 | 6,621,483 | 331,935 |
| Bristol-Myers Squibb Co. | 8,400,000 | 310,548 |
| Thermo Fisher Scientific Inc. | 3,439,300 | 253,820 |
| Baxter International Inc. | 3,179,100 | 214,907 |
| Aetna Inc. | 3,450,000 | 162,805 |
| Forest Laboratories, Inc.1 | 4,110,000 | 151,248 |
| Grifols, SA, Class A1 | 3,617,000 | 128,845 |
| Grifols, SA, Class B1 | 761,185 | 21,714 |
| Zimmer Holdings, Inc. | 1,780,000 | 133,429 |
| Abbott Laboratories | 2,500,000 | 84,475 |
| Novo Nordisk A/S, Class B | 410,123 | 71,625 |
| Boston Scientific Corp.1 | 6,770,000 | 50,030 |
| Cardinal Health, Inc. | 900,000 | 41,589 |
| Incyte Corp.1 | 1,557,000 | 34,564 |
| | | 17,784,609 |
| | | |
| ENERGY — 10.22% | | |
| EOG Resources, Inc.3 | 14,806,537 | 1,861,330 |
| Schlumberger Ltd. | 13,115,000 | 1,021,003 |
| Noble Energy, Inc. | 8,891,000 | 985,390 |
| Apache Corp. | 12,150,000 | 902,381 |
| FMC Technologies, Inc.1,3 | 16,479,100 | 855,430 |
| Suncor Energy Inc. | 24,712,520 | 748,864 |
| Pioneer Natural Resources Co. | 5,785,000 | 727,811 |
| Canadian Natural Resources, Ltd. | 16,980,000 | 518,991 |
| Baker Hughes Inc. | 9,025,000 | 404,500 |
| Concho Resources Inc.1 | 4,287,506 | 385,704 |
| Southwestern Energy Co.1 | 10,891,100 | 373,238 |
| Cobalt International Energy, Inc.1 | 14,716,200 | 363,049 |
| Devon Energy Corp. | 5,959,900 | 323,384 |
| Technip SA | 2,670,000 | 289,183 |
| CONSOL Energy Inc. | 8,235,000 | 264,755 |
| Core Laboratories NV | 1,920,000 | 263,328 |
| Pacific Rubiales Energy Corp. | 10,421,000 | 255,157 |
| Denbury Resources Inc.1 | 13,202,500 | 239,229 |
| Murphy Oil Corp. | 3,456,000 | 210,401 |
| Royal Dutch Shell PLC, Class B (ADR) | 2,520,000 | 169,697 |
| Chevron Corp. | 1,350,000 | 158,152 |
| Cimarex Energy Co. | 2,239,800 | 150,761 |
| BG Group PLC | 7,475,000 | 132,167 |
| Petróleo Brasileiro SA – Petrobras, ordinary nominative (ADR) | 3,589,200 | 52,654 |
| BP PLC | 9,720,000 | 65,722 |
| BP PLC (ADR) | 1,138,700 | 46,003 |
| Ultra Petroleum Corp.1 | 4,510,900 | 76,956 |
| Talisman Energy Inc. | 3,250,000 | 40,755 |
| Range Resources Corp. | 360,000 | 27,648 |
| Laricina Energy Ltd.1,2,5 | 950,000 | 26,255 |
| Oceaneering International, Inc. | 258,800 | 16,457 |
| | | 11,956,355 |
| | | |
| FINANCIALS — 7.51% | | |
| Goldman Sachs Group, Inc. | 5,469,696 | 819,142 |
| Bank of America Corp. | 70,000,000 | 786,100 |
| Wells Fargo & Co. | 21,992,178 | 771,486 |
| Citigroup Inc. | 16,924,500 | 710,321 |
| Aon PLC, Class A | 10,624,000 | 649,020 |
| ACE Ltd. | 4,446,100 | 379,652 |
| American Express Co. | 4,966,200 | 308,649 |
| Agricultural Bank of China, Class H | 588,184,000 | 303,360 |
| Legal & General Group PLC | 123,984,892 | 301,134 |
| AIA Group Ltd. | 67,400,000 | 292,001 |
| American Tower Corp. | 3,615,000 | 280,524 |
| Berkshire Hathaway Inc., Class A1 | 400 | 61,040 |
| Charles Schwab Corp. | 15,700,000 | 254,968 |
| American International Group, Inc.1 | 6,500,000 | 247,065 |
| JPMorgan Chase & Co. | 4,931,712 | 241,259 |
| Onex Corp. | 5,200,000 | 234,473 |
| Morgan Stanley | 10,000,000 | 225,500 |
| CME Group Inc., Class A | 3,712,090 | 222,057 |
| Fifth Third Bancorp | 14,000,000 | 221,760 |
| ICICI Bank Ltd. (ADR) | 4,815,000 | 201,845 |
| ICICI Bank Ltd. | 480,708 | 9,193 |
| Industrial and Commercial Bank of China Ltd., Class H | 263,820,000 | 189,473 |
| XL Group PLC | 5,835,000 | 167,114 |
| AMP Ltd. | 22,673,816 | 126,918 |
| Popular, Inc.1 | 4,080,000 | 113,914 |
| UBS AG | 6,274,666 | 99,278 |
| HDFC Bank Ltd. (ADR) | 2,480,000 | 94,364 |
| Deutsche Bank AG | 2,000,000 | 91,623 |
| Toronto-Dominion Bank | 1,025,000 | 84,336 |
| BOK Financial Corp. | 1,250,000 | 74,287 |
| State Street Corp. | 860,933 | 48,720 |
| Jefferies Group, Inc. | 1,962,700 | 42,630 |
| First Republic Bank | 1,110,000 | 40,459 |
| Bank of Nova Scotia | 450,000 | 26,806 |
| Zions Bancorporation | 1,005,000 | 24,261 |
| Credit Suisse Group AG | 468,000 | 12,538 |
| Weyerhaeuser Co.1 | 422,321 | 12,420 |
| | | 8,769,690 |
| | | |
| INDUSTRIALS — 6.69% | | |
| Union Pacific Corp. | 8,813,300 | 1,208,392 |
| Boeing Co. | 7,050,000 | 542,145 |
| CSX Corp. | 23,174,801 | 531,630 |
| Precision Castparts Corp. | 2,639,000 | 492,411 |
| United Continental Holdings, Inc.1 | 16,529,000 | 441,490 |
| Cummins Inc. | 2,995,000 | 347,031 |
| General Dynamics Corp. | 5,104,600 | 346,960 |
| KBR, Inc.3 | 10,462,589 | 317,958 |
| Rockwell Collins, Inc. | 5,178,700 | 311,292 |
| United Parcel Service, Inc., Class B | 3,710,000 | 306,631 |
| Ryanair Holdings PLC (ADR) | 6,285,000 | 242,978 |
| MTU Aero Engines Holding AG | 2,330,000 | 216,646 |
| United Technologies Corp. | 2,335,000 | 211,434 |
| Norfolk Southern Corp. | 2,736,700 | 199,916 |
| SGS SA | 75,000 | 190,601 |
| Fastenal Co. | 3,600,000 | 185,868 |
| Danaher Corp. | 3,009,448 | 185,382 |
| Textron Inc. | 6,377,400 | 183,988 |
| European Aeronautic Defence and Space Co. EADS NV | 3,514,844 | 179,789 |
| Deere & Co. | 1,795,000 | 157,655 |
| Meggitt PLC | 19,385,099 | 133,689 |
| Caterpillar Inc. | 1,400,000 | 129,318 |
| FedEx Corp. | 1,100,000 | 115,973 |
| Delta Air Lines, Inc.1 | 7,800,000 | 111,306 |
| General Electric Co. | 4,250,000 | 98,685 |
| Lockheed Martin Corp. | 1,000,000 | 88,000 |
| Bureau Veritas SA | 564,010 | 72,743 |
| Globaltrans Investment PLC (GDR)4 | 2,300,000 | 36,777 |
| Globaltrans Investment PLC (GDR) | 1,433,942 | 22,929 |
| Southwest Airlines Co. | 5,000,000 | 58,500 |
| Honeywell International Inc. | 650,000 | 45,565 |
| KONE Oyj, Class B | 540,000 | 43,710 |
| Stericycle, Inc.1 | 290,484 | 27,863 |
| Chart Industries, Inc.1 | 350,000 | 25,396 |
| | | 7,810,651 |
| | | |
| CONSUMER STAPLES — 4.54% | | |
| Philip Morris International Inc. | 20,931,000 | 1,920,419 |
| Costco Wholesale Corp. | 13,618,183 | 1,379,386 |
| Kerry Group PLC, Class A | 7,765,824 | 435,557 |
| CVS/Caremark Corp. | 7,595,000 | 388,256 |
| Green Mountain Coffee Roasters, Inc.1 | 6,623,023 | 316,316 |
| Estée Lauder Companies Inc., Class A | 2,420,000 | 155,122 |
| Whole Foods Market, Inc. | 1,690,000 | 144,698 |
| PepsiCo, Inc. | 1,680,000 | 127,294 |
| Danone SA | 1,570,000 | 109,024 |
| Avon Products, Inc. | 5,354,472 | 104,680 |
| Nestlé SA | 1,345,000 | 93,991 |
| Colgate-Palmolive Co. | 500,000 | 57,215 |
| Coca-Cola Co. | 1,140,400 | 44,156 |
| British American Tobacco PLC | 450,000 | 23,446 |
| | | 5,299,560 |
| | | |
| MATERIALS — 3.02% | | |
| Praxair, Inc. | 5,572,437 | 629,964 |
| Celanese Corp., Series A3 | 8,875,000 | 415,794 |
| LyondellBasell Industries NV, Class A | 6,225,000 | 364,910 |
| Dow Chemical Co. | 10,215,800 | 324,045 |
| Newmont Mining Corp. | 7,980,000 | 321,514 |
| Syngenta AG | 700,000 | 297,312 |
| Sigma-Aldrich Corp. | 3,100,000 | 238,886 |
| Barrick Gold Corp. | 7,750,000 | 234,360 |
| Potash Corp. of Saskatchewan Inc. | 5,180,000 | 207,666 |
| Nitto Denko Corp. | 1,478,600 | 86,939 |
| Steel Dynamics, Inc. | 5,208,000 | 79,526 |
| FMC Corp. | 1,000,000 | 60,260 |
| Nucor Corp. | 1,300,000 | 58,565 |
| Alcoa Inc. | 6,510,000 | 55,465 |
| ArcelorMittal | 2,850,000 | 42,845 |
| United States Steel Corp. | 1,982,200 | 41,309 |
| James Hardie Industries PLC (CDI) | 3,570,000 | 35,736 |
| Cliffs Natural Resources Inc. | 1,315,219 | 33,486 |
| | | 3,528,582 |
| | | |
| TELECOMMUNICATION SERVICES — 2.07% | | |
| Crown Castle International Corp.1,3 | 16,405,430 | 1,145,099 |
| SOFTBANK CORP. | 22,060,000 | 817,522 |
| Sprint Nextel Corp., Series 11 | 60,274,000 | 349,589 |
| MetroPCS Communications, Inc.1 | 8,908,275 | 87,301 |
| Leap Wireless International, Inc.1 | 3,900,000 | 20,865 |
| Broadview Networks Holdings, Inc.1,2,5 | 893 | 15 |
| | | 2,420,391 |
| | | |
| UTILITIES — 0.01% | | |
| Power Grid Corp. of India Ltd. | 7,000,000 | 13,420 |
| | | |
| MISCELLANEOUS — 4.84% | | |
| Other common stocks in initial period of acquisition | | 5,634,173 |
| | | |
| | | |
| Total common stocks (cost: $68,635,483,000) | | 105,190,607 |
| | | |
| | | |
| | | |
| Warrants — 0.15% | | |
| | | |
| FINANCIALS — 0.01% | | |
| Citigroup Inc., Class A, warrants, expire 20191 | 25,500,000 | 12,418 |
| | | |
| | | |
| TELECOMMUNICATION SERVICES — 0.00% | | |
| Broadview Networks Holdings, Inc., Series A1, warrants, expire 20201,2,5 | 4,414 | 28 |
| Broadview Networks Holdings, Inc., Series A2, warrants, expire 20201,2,5 | 1,672 | 9 |
| | | 37 |
| | | |
| MISCELLANEOUS — 0.14% | | |
| Other warrants in initial period of acquisition | | 163,651 |
| | | |
| | | |
| Total warrants (cost: $135,002,000) | | 176,106 |
| | | |
| | | |
| | | |
| | Principal amount | |
| Convertible securities — 0.06% | (000) | |
| | | |
| TELECOMMUNICATION SERVICES — 0.06% | | |
| Clearwire Corp. 8.25% convertible notes 20404 | $63,755 | 69,971 |
| | | |
| | | |
| Total convertible securities (cost: $63,813,000) | | 69,971 |
| | | |
| | | |
| | | |
| | Principal amount | Value |
| Bonds & notes — 0.07% | (000) | (000) |
| | | |
| FEDERAL AGENCY BONDS & NOTES — 0.04% | | |
| Federal Home Loan Bank, Series 2753, 0.28% 2013 | $ 50,000 | $ 50,016 |
| | | |
| TELECOMMUNICATION SERVICES — 0.03% | | |
| LightSquared, Term Loan B, 12.00% 20146,7,8,9 | 31,780 | 29,250 |
| | | |
| | | |
| Total bonds & notes (cost: $79,423,000) | | 79,266 |
| | | |
| | | |
| | | |
| Short-term securities — 9.48% | | |
| | | |
| Fannie Mae 0.10%–0.16% due 3/1–12/19/2013 | 2,884,316 | 2,882,902 |
| U.S. Treasury Bills 0.08%–0.18% due 3/7–10/17/2013 | 2,632,550 | 2,631,601 |
| Freddie Mac 0.09%–0.20% due 3/4–11/5/2013 | 2,332,480 | 2,331,684 |
| Federal Home Loan Bank 0.08%–0.20% due 3/13/2013–1/2/2014 | 1,769,728 | 1,769,158 |
| Federal Farm Credit Banks 0.14%–0.22% due 3/1–12/4/2013 | 336,000 | 335,829 |
| General Electric Capital Corp. 0.19%–0.23% due 3/15–5/30/2013 | 141,500 | 141,476 |
| General Electric Co. 0.14% due 3/15/2013 | 30,000 | 29,998 |
| Variable Funding Capital Company LLC 0.14%–0.16% due 3/1–4/25/20134 | 90,000 | 89,989 |
| Wells Fargo & Co. 0.13%–0.14% due 3/13–5/15/2013 | 60,500 | 60,482 |
| Google Inc. 0.09%–0.15% due 3/6–4/9/20134 | 148,600 | 148,587 |
| Coca-Cola Co. 0.13%–0.14% due 4/22–6/18/20134 | 135,000 | 134,969 |
| Private Export Funding Corp. 0.15%–0.19% due 3/18–5/13/20134 | 117,000 | 116,972 |
| Chariot Funding, LLC 0.18%–0.19% due 4/29–5/28/20134 | 70,000 | 69,980 |
| Jupiter Securitization Co., LLC 0.16% due 3/13/20134 | 40,000 | 39,998 |
| National Rural Utilities Cooperative Finance Corp. 0.15% due 3/5/2013 | 50,000 | 49,999 |
| Regents of the University of California 0.13%–0.17% due 5/7–5/21/2013 | 46,900 | 46,886 |
| Abbott Laboratories 0.14% due 5/8/20134 | 45,000 | 44,992 |
| John Deere Credit Ltd. 0.12%–0.13% due 3/11–4/16/20134 | 42,500 | 42,497 |
| Honeywell International Inc. 0.11% due 3/25/20134 | 40,000 | 39,995 |
| United Parcel Service Inc. 0.11% due 3/25/20134 | 31,000 | 30,998 |
| Procter & Gamble Co. 0.16% due 3/11/20134 | 30,000 | 29,999 |
| | | |
| Total short-term securities (cost: $11,068,670,000) | | 11,068,991 |
| | | |
| | | |
| Total investment securities (cost: $79,982,391,000) | | 116,584,941 |
| Other assets less liabilities | | 172,656 |
| | | |
| Net assets | | $116,757,597 |
As permitted by U.S. Securities and Exchange Commission regulations, “Miscellaneous” securities include holdings in their first year of acquisition that have not previously been publicly disclosed.
1Security did not produce income during the last 12 months.
2Valued under fair value procedures adopted by authority of the board of directors. The total value of all such securities was $565,230,000, which represented .48% of the net assets of the fund. This amount includes $538,923,000 related to certain securities trading outside the U.S. whose values were adjusted as a result of significant market movements following the close of local trading.
3Represents an affiliated company as defined under the Investment Company Act of 1940.
4Acquired in a transaction exempt from registration under Rule 144A or section 4(2) of the Securities Act of 1933. May be resold in the U.S. in transactions exempt from registration, normally to qualified institutional buyers. The total value of all such securities was $924,619,000, which represented .79% of the net assets of the fund.
5Acquired through a private placement transaction exempt from registration under the Securities Act of 1933. May be subject to legal or contractual restrictions on resale. Further details on these holdings appear below.
| | Acquisition | Cost | Value | Percent of |
| | date(s) | (000) | (000) | net assets |
| Laricina Energy Ltd. | 6/21/2011 | $41,523 | $26,255 | .02% |
| Broadview Networks Holdings, Inc., Series A1, warrants, expire 2020 | 7/7/2000–3/6/2002 | 11,176 | 28 | .00 |
| Broadview Networks Holdings, Inc. | 7/7/2000–3/6/2002 | 6,199 | 15 | .00 |
| Broadview Networks Holdings, Inc., Series A2, warrants, expire 2020 | 7/7/2000–3/6/2002 | 3,626 | 9 | .00 |
| Total restricted securities | | $62,524 | $26,307 | .02% |
6Payment in kind; the issuer has the option of paying additional securities in lieu of cash.
7Principal payments may be made periodically. Therefore, the effective maturity date may be earlier than the stated maturity date.
8Scheduled interest and/or principal payment was not received.
9Loan participations and assignments; may be subject to legal or contractual restrictions on resale. The total value of all such loans was $29,250,000, which represented .03% of the net assets of the fund.
Key to abbreviations
ADR = American Depositary Receipts
CDI = CREST Depository Interest
GDR = Global Depositary Receipts
Investments are not FDIC-insured, nor are they deposits of or guaranteed by a bank or any other entity, so they may lose value.
Investors should carefully consider investment objectives, risks, charges and expenses. This and other important information is contained in the fund prospectus and summary prospectus, which can be obtained from your financial professional and should be read carefully before investing. You may also call American Funds Service Company (AFS) at 800/421-4225 or visit the American Funds website at americanfunds.com.
MFGEPRX-005-0413O-S32814
ITEM 7 – Disclosure of Proxy Voting Policies and Procedures for Closed-End Management Investment Companies
Not applicable to this Registrant, insofar as the Registrant is not a closed-end management investment company.
ITEM 8 – Portfolio Managers of Closed-End Management Investment Companies
Not applicable to this Registrant, insofar as the Registrant is not a closed-end management investment company.
ITEM 9 – Purchases of Equity Securities by Closed-End Management Investment Company and Affiliated Purchasers
Not applicable to this Registrant, insofar as the Registrant is not a closed-end management investment company.
ITEM 10 – Submission of Matters to a Vote of Security Holders
There have been no material changes to the procedures by which shareholders may recommend nominees to the Registrant’s board of directors since the Registrant last submitted a proxy statement to its shareholders. The procedures are as follows. The Registrant has a nominating and governance committee comprised solely of persons who are not considered ‘‘interested persons’’ of the Registrant within the meaning of the Investment Company Act of 1940, as amended. The committee periodically reviews such issues as the board’s composition, responsibilities, committees, compensation and other relevant issues, and recommends any appropriate changes to the full board of directors. While the committee normally is able to identify from its own resources an ample number of qualified candidates, it will consider shareholder suggestions of persons to be considered as nominees to fill future vacancies on the board. Such suggestions must be sent in writing to the nominating and governance committee of the Registrant, c/o the Registrant’s Secretary, and must be accompanied by complete biographical and occupational data on the prospective nominee, along with a written consent of the prospective nominee for consideration of his or her name by the nominating and governance committee.
ITEM 11 – Controls and Procedures
| (a) | The Registrant’s Principal Executive Officer and Principal Financial Officer have concluded, based on their evaluation of the Registrant’s disclosure controls and procedures (as such term is defined in Rule 30a-3 under the Investment Company Act of 1940), that such controls and procedures are adequate and reasonably designed to achieve the purposes described in paragraph (c) of such rule. |
| | |
| (b) | There were no changes in the Registrant’s internal controls over financial reporting (as defined in Rule 30a-3(d) under the Investment Company Act of 1940) that occurred during the Registrant’s second fiscal quarter of the period covered by this report that has materially affected, or is reasonably likely to materially affect, the Registrant’s internal control over financial reporting. |
ITEM 12 – Exhibits
| (a)(1) | The Code of Ethics that is the subject of the disclosure required by Item 2 is attached as an exhibit hereto. |
| | |
| (a)(2) | The certifications required by Rule 30a-2 of the Investment Company Act of 1940 and Sections 302 and 906 of the Sarbanes-Oxley Act of 2002 are attached as exhibits hereto. |
SIGNATURES
Pursuant to the requirements of the Securities Exchange Act of 1934 and the Investment Company Act of 1940, the Registrant has duly caused this report to be signed on its behalf by the undersigned, thereunto duly authorized.
| | THE GROWTH FUND OF AMERICA, Inc. |
| | |
| | By /s/ Paul F. Roye |
| | Paul F. Roye, Executive Vice President and Principal Executive Officer |
| | |
| | Date: April 30, 2013 |
Pursuant to the requirements of the Securities Exchange Act of 1934 and the Investment Company Act of 1940, this report has been signed below by the following persons on behalf of the Registrant and in the capacities and on the dates indicated.
| By /s/ Paul F. Roye |
Paul F. Roye, Executive Vice President and Principal Executive Officer |
| |
| Date: April 30, 2013 |
| By /s/ Jeffrey P. Regal |
Jeffrey P. Regal, Treasurer and Principal Financial Officer |
| |
| Date: April 30, 2013 |