UNITED STATES
SECURITIES AND EXCHANGE COMMISSION
Washington, D.C. 20549
FORM N-CSR
Certified Shareholder Report of
Registered Management Investment Companies
Investment Company Act File Number: 811-00862
The Growth Fund of America
(Exact Name of Registrant as Specified in Charter)
One Market, Steuart Tower
Suite 2000
San Francisco, California 94105
(Address of Principal Executive Offices)
Registrant's telephone number, including area code: (415) 421-9360
Date of fiscal year end: August 31
Date of reporting period: February 28, 2015
Michael W. Stockton
The Growth Fund of America
One Market, Steuart Tower
Suite 2000
San Francisco, California 94105
(Name and Address of Agent for Service)
Copies to:
Mark D. Perlow
K&L Gates LLP
Four Embarcadero Center, Suite 1200
San Francisco, California 94111
(Counsel for the Registrant)
ITEM 1 – Reports to Stockholders

 | The Growth Fund
of America® Semi-annual report
for the six months ended
February 28, 2015 |
The Growth Fund of America invests in a wide range of companies that appear to offer superior opportunities for growth of capital.
This fund is one of more than 40 offered by one of the nation’s largest mutual fund families, American Funds, from Capital Group. For more than 80 years, Capital has invested with a long-term focus based on thorough research and attention to risk.
Fund results shown in this report, unless otherwise indicated, are for Class A shares at net asset value. If a sales charge (maximum 5.75%) had been deducted, the results would have been lower. Results are for past periods and are not predictive of results for future periods. Current and future results may be lower or higher than those shown. Share prices and returns will vary, so investors may lose money. Investing for short periods makes losses more likely. Investments are not FDIC-insured, nor are they deposits of or guaranteed by a bank or any other entity, so they may lose value. For current information and month-end results, visit americanfunds.com.
Here are the average annual total returns on a $1,000 investment with all distributions reinvested for periods ended March 31, 2015 (the most recent calendar quarter-end):
| Class A shares | 1 year | 5 years | 10 years |
| | | | |
| Reflecting 5.75% maximum sales charge | 5.51% | 11.98% | 7.97% |
For other share class results, visit americanfunds.com.
The total annual fund operating expense ratio was 0.66% for Class A shares as of the prospectus dated November 1, 2014.
Investment results assume all distributions are reinvested and reflect applicable fees and expenses. When applicable, investment results reflect fee waivers, without which results would have been lower. Visit americanfunds.com for more information.
Refer to the fund prospectus and the Risk Factors section of this report for more information on risks associated with investing in the fund.

The Growth Fund of
America continues
its fundamental
research and long-
term approach to
investing.
Fellow investors:
Continued economic growth and improved corporate earnings helped fuel equity-market growth in the first half of The Growth Fund of America’s current fiscal year, a six-month period ended February 28, 2015. This improvement was reflected by gains in the unmanaged Standard & Poor’s 500 Composite Index, a broad measure of the U.S. equity market. A sharp decline in oil prices, however, truncated some of that growth near the end of 2014, particularly among energy stocks.
For the six-month period, The Growth Fund of America (GFA) saw a total return of 4.93%, compared with a return of 6.11% for the S&P 500.
Results at a glance
Total returns for periods ended February 28, 2015, with all distributions reinvested
| | | Cumulative total returns | | Average annual total returns |
| | | 6 months | | 1 year | | 5 years | | 10 years | | Lifetime1 |
| | | | | | | | | | | |
| The Growth Fund of America (Class A shares) | | | 4.93 | % | | | 10.50 | % | | | 14.80 | % | | | 8.54 | % | | | 13.79 | % |
| Standard & Poor’s 500 Composite Index2 | | | 6.11 | | | | 15.48 | | | | 16.17 | | | | 7.98 | | | | 11.09 | |
| Lipper Large-Cap Growth Funds Index | | | 7.43 | | | | 11.80 | | | | 15.59 | | | | 8.15 | | | | — | 3 |
| Lipper Growth Funds Index | | | 5.74 | | | | 11.47 | | | | 15.57 | | | | 7.56 | | | | 10.06 | |
| Lipper Large-Cap Core Funds Index | | | 5.13 | | | | 12.82 | | | | 14.54 | | | | 7.32 | | | | — | 3 |
| Lipper Capital Appreciation Funds Index | | | 4.91 | | | | 10.53 | | | | 14.12 | | | | 8.50 | | | | 11.06 | |
| 1 | Since Capital Research and Management Company (CRMC) began managing the fund on December 1, 1973. |
| 2 | The S&P 500 is unmanaged and, therefore, has no expenses. Investors cannot invest directly in an index. |
| 3 | This Lipper index was not in existence when CRMC began managing the fund. |
The Growth Fund of America 1
We note that the fund’s results, on an absolute and relative basis, remain strong over longer time periods, which we believe illustrates our commitment to long-term investing over short-term tactical moves. The fund’s 10-year and lifetime returns continue to surpass those of the S&P 500, as well as the fund’s four Lipper peer indexes. Over the 41 years since CRMC began managing the fund, GFA has posted an average annual total return of 13.79%, compared to 11.09% for the S&P 500, while the two applicable Lipper indexes posted returns of 11.06% and 10.06% over the same period.
Investment analysis
While economic growth and joblessness improved during the period, a sharp drop in oil prices led to a decline in the energy sector, limiting the gains of both the S&P 500 and the fund. Among sectors, the energy sector was the fund’s leading detractor in both relative and absolute returns. Noble Energy (down 34.1%), for example, was among the fund’s holdings with the worst results.
Information technology, industrials and health care stocks added to returns, both relative and absolute. Top holding Amazon rose 12.1% for the period, leading many consumer discretionary shares, and the technology sector was beneficial to the fund despite slight declines from top-10 holdings Google (down 2.8%) and Microsoft (down 2.2%).
Among large health care holdings, Amgen climbed 14.2% and UnitedHealth Group rose 32.1%, both significantly helping returns during this period. Gilead Sciences, our third-largest holding, declined 3.8% for the period, however, on fears of increased competitive pressures. Among other companies, fourth-largest holding Home Depot gained 24% for the period.
The fund’s biggest overall detractor relative to the S&P 500 during this short period was cash holdings, representing 8.6% of the total portfolio. We do not set a fixed target for how much cash the fund should have on hand, leaving it to the discretion of individual portfolio managers. However, investors should note having liquidity during volatile times allows the managers to seize opportunities to make long-term investments at good short-term prices. In addition, cash can serve as a cushion in the case of market downturns.
The fund continues to hold just over 10% of the portfolio in stocks issued by corporations outside the U.S. The strong dollar, compared to other currencies, further hampered returns from these investments during the period, though we believe our investors will benefit in the long run from our extensive global research which identifies these investments.
2 The Growth Fund of America
The road ahead
We expect the U.S. economy to continue its upward trajectory over the short to medium term. Overseas, concerns remain about economic growth in Europe and China, two major consumers of American exports and the strong dollar which may further impact earnings growth of U.S. exporters. Overall, the American economy is on a good track.
The price of oil remains something of a wild card. While we expect prices to reach a higher equilibrium at some point in the months ahead, it remains to be seen whether OPEC will respond by cutting output, or whether continued crises in the Middle East will have an impact. We continue to assess our energy holdings in this light, with our global research effort focused on which energy companies can withstand further fluctuation in the oil market.
The U.S. equity market is slightly overvalued versus its historical average, but still looks to be attractive compared to bonds and other asset classes. We expect the Federal Reserve to maintain interest rates at current levels through the spring; after that, it remains to be seen whether and by how much the Fed will move rates higher.
The issues above inform our investment decisions, but we remain committed to our investment approach — employing intensive, bottom-up research into individual companies while paying close attention to valuation in order to invest for long-term results. We feel this is where our true competitive advantage lies. We believe the fund remains well positioned to help our investors meet their financial goals.
Once again, we thank both our new and veteran investors for your continuing confidence in The Growth Fund of America. We look forward to reporting to you again in six months.
Cordially,
 |  |
| | |
| James F. Rothenberg | Donald D. O’Neal |
| Vice Chairman of the Board | President |
April 6, 2015
For current information about the fund, visit americanfunds.com.
The Growth Fund of America 3
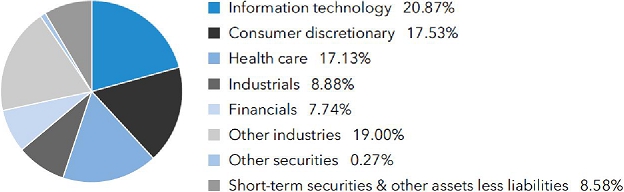
| Summary investment portfolio February 28, 2015 | unaudited |
| Industry sector diversification | Percent of net assets |
| Largest equity holdings | Percent of
net assets |
| Amazon | 4.48 | % |
| Google | 3.14 | |
| Gilead Sciences | 2.40 | |
| Home Depot | 1.91 | |
| UnitedHealth Group | 1.86 | |
| Comcast | 1.85 | |
| Avago Technologies | 1.50 | |
| Amgen | 1.50 | |
| Microsoft | 1.22 | |
| Costco | 1.15 | |
| Common stocks 91.15% | | | Shares | | | | Value
(000) | |
| Information technology 20.87% | | | | | | | | |
| Google Inc., Class C1 | | | 4,521,797 | | | $ | 2,524,972 | |
| Google Inc., Class A1 | | | 3,766,097 | | | | 2,118,919 | |
| Avago Technologies Ltd.2 | | | 17,407,082 | | | | 2,221,492 | |
| Microsoft Corp. | | | 41,077,600 | | | | 1,801,253 | |
| Oracle Corp. | | | 38,797,000 | | | | 1,700,084 | |
| Visa Inc., Class A | | | 5,648,000 | | | | 1,532,359 | |
| ASML Holding NV (New York registered) | | | 8,767,040 | | | | 944,035 | |
| ASML Holding NV | | | 5,109,442 | | | | 552,389 | |
| Texas Instruments Inc. | | | 18,520,100 | | | | 1,088,982 | |
| salesforce.com, inc.1 | | | 14,927,697 | | | | 1,035,684 | |
| Intuit Inc. | | | 10,195,000 | | | | 995,338 | |
| LinkedIn Corp., Class A1 | | | 3,432,500 | | | | 917,164 | |
| Accenture PLC, Class A | | | 10,000,000 | | | | 900,300 | |
| Apple Inc. | | | 6,776,213 | | | | 870,472 | |
| Adobe Systems Inc.1 | | | 8,672,800 | | | | 686,018 | |
| Other securities | | | | | | | 10,952,395 | |
| | | | | | | | 30,841,856 | |
| | | | | | | | | |
| Consumer discretionary 17.53% | | | | | | | | |
| Amazon.com, Inc.1 | | | 17,438,095 | | | | 6,629,266 | |
| Home Depot, Inc. | | | 24,651,200 | | | | 2,828,725 | |
| Comcast Corp., Class A | | | 38,003,578 | | | | 2,256,653 | |
4 The Growth Fund of America
| | | Shares | | | Value
(000) | |
| Comcast Corp., Class A, special nonvoting shares | | | 8,000,000 | | | $ | 471,560 | |
| Priceline Group Inc.1 | | | 882,215 | | | | 1,091,723 | |
| NIKE, Inc., Class B | | | 11,222,000 | | | | 1,089,881 | |
| Twenty-First Century Fox, Inc., Class A | | | 31,032,200 | | | | 1,086,127 | |
| Netflix, Inc.1 | | | 2,025,767 | | | | 962,057 | |
| MGM Resorts International1,2 | | | 36,299,600 | | | | 788,790 | |
| Johnson Controls, Inc. | | | 13,625,000 | | | | 692,286 | |
| Other securities | | | | | | | 8,011,238 | |
| | | | | | | | 25,908,306 | |
| | | | | | | | | |
| Health care 17.13% | | | | | | | | |
| Gilead Sciences, Inc.1 | | | 34,239,148 | | | | 3,544,779 | |
| UnitedHealth Group Inc. | | | 24,139,200 | | | | 2,742,937 | |
| Amgen Inc. | | | 14,009,100 | | | | 2,209,515 | |
| Alexion Pharmaceuticals, Inc.1 | | | 9,261,061 | | | | 1,670,418 | |
| Express Scripts Holding Co.1 | | | 18,870,600 | | | | 1,600,038 | |
| Regeneron Pharmaceuticals, Inc.1 | | | 3,362,300 | | | | 1,391,454 | |
| Vertex Pharmaceuticals Inc.1 | | | 9,337,600 | | | | 1,115,190 | |
| Thermo Fisher Scientific Inc. | | | 7,233,052 | | | | 940,297 | |
| Illumina, Inc.1 | | | 4,672,501 | | | | 913,287 | |
| BioMarin Pharmaceutical Inc.1 | | | 7,860,288 | | | | 841,601 | |
| Novartis AG1 | | | 7,455,000 | | | | 762,039 | |
| Other securities | | | | | | | 7,591,668 | |
| | | | | | | | 25,323,223 | |
| | | | | | | | | |
| Industrials 8.88% | | | | | | | | |
| Union Pacific Corp. | | | 12,601,600 | | | | 1,515,468 | |
| Precision Castparts Corp. | | | 6,452,109 | | | | 1,395,591 | |
| American Airlines Group Inc. | | | 23,370,000 | | | | 1,119,423 | |
| United Continental Holdings, Inc.1 | | | 16,949,000 | | | | 1,104,736 | |
| Boeing Co. | | | 6,150,000 | | | | 927,727 | |
| CSX Corp. | | | 21,174,801 | | | | 726,507 | |
| Other securities | | | | | | | 6,334,279 | |
| | | | | | | | 13,123,731 | |
| | | | | | | | | |
| Financials 7.74% | | | | | | | | |
| Crown Castle International Corp. | | | 13,450,912 | | | | 1,160,948 | |
| American International Group, Inc. | | | 20,345,000 | | | | 1,125,689 | |
| Goldman Sachs Group, Inc. | | | 3,938,996 | | | | 747,582 | |
| Other securities | | | | | | | 8,397,337 | |
| | | | | | | | 11,431,556 | |
| | | | | | | | | |
| Energy 6.56% | | | | | | | | |
| EOG Resources, Inc. | | | 18,669,000 | | | | 1,674,983 | |
| Noble Energy, Inc.2 | | | 20,639,621 | | | | 974,809 | |
| Concho Resources Inc.1,2 | | | 8,834,006 | | | | 962,200 | |
| Pioneer Natural Resources Co. | | | 4,567,700 | | | | 696,666 | |
| Other securities | | | | | | | 5,390,794 | |
| | | | | | | | 9,699,452 | |
| The Growth Fund of America | 5 |
| Common stocks (continued) | | Shares | | | Value
(000) | |
| Consumer staples 4.22% | | | | | | | | |
| Costco Wholesale Corp. | | | 11,583,183 | | | $ | 1,702,265 | |
| Philip Morris International Inc. | | | 20,117,588 | | | | 1,668,955 | |
| Other securities | | | | | | | 2,869,114 | |
| | | | | | | | 6,240,334 | |
| | | | | | | | | |
| Materials 2.59% | | | | | | | | |
| Monsanto Co. | | | 6,055,000 | | | | 729,204 | |
| Other securities | | | | | | | 3,094,435 | |
| | | | | | | | 3,823,639 | |
| | | | | | | | | |
| Other 0.63% | | | | | | | | |
| Other securities | | | | | | | 921,553 | |
| | | | | | | | | |
| Miscellaneous 5.00% | | | | | | | | |
| Other common stocks in initial period of acquisition | | | | | | | 7,396,359 | |
| | | | | | | | | |
| Total common stocks (cost: $75,868,819,000) | | | | | | | 134,710,009 | |
| | | | | | | | | |
| Preferred securities 0.01% | | | | | | | | |
| Financials 0.01% | | | | | | | | |
| Fannie Mae, Series S, 8.25% noncumulative1 | | | 4,095,858 | | | | 18,431 | |
| | | | | | | | | |
| Miscellaneous 0.00% | | | | | | | | |
| Other preferred securities in initial period of acquisition | | | | | | | 3,107 | |
| | | | | | | | | |
| Total preferred securities (cost: $48,162,000) | | | | | | | 21,538 | |
| | | | | | | | | |
| Rights & warrants 0.08% | | | | | | | | |
| Other 0.08% | | | | | | | | |
| Other securities | | | | | | | 120,928 | |
| | | | | | | | | |
| Total rights & warrants (cost: $122,540,000) | | | | | | | 120,928 | |
| | | | | | | | | |
| Convertible bonds 0.03% | Principal amount
(000) | | | | | |
| Telecommunication services 0.03% | | | | | | | | |
| Other securities | | | | | | | 47,993 | |
| | | | | | | | | |
| Total convertible bonds (cost: $43,829,000) | | | | | | | 47,993 | |
| | | | | | | | | |
| Bonds, notes & other debt instruments 0.15% | | | | | | | |
| U.S. Treasury bonds & notes 0.08% | | | | | | | | |
| Other securities | | | | | | | 116,511 | |
| | | | | | | | | |
| Corporate bonds & notes 0.05% | | | | | | | | |
| Other securities | | | | | | | 67,737 | |
| 6 | The Growth Fund of America |
| | Principal amount
(000) | | | Value
(000) | |
| Federal agency bonds & notes 0.02% | | | | | | | | |
| Other securities | | | | | | $ | 33,499 | |
| | | | | | | | | |
| Total bonds, notes & other debt instruments (cost: $193,928,000) | | | | | | | 217,747 | |
| | | | | | | | | |
| Short-term securities 8.82% | | | | | | | | |
| Fannie Mae 0.08%–0.24% due 4/1/2015–1/19/2016 | | $ | 2,273,378 | | | | 2,272,632 | |
| Federal Farm Credit Banks 0.10%–0.24% due 3/2/2015–10/6/2015 | | | 780,800 | | | | 780,501 | |
| Federal Home Loan Bank 0.06%–0.24% due 3/4/2015–1/22/2016 | | | 4,686,038 | | | | 4,685,059 | |
| Freddie Mac 0.09%–0.23% due 3/6/2015–1/20/2016 | | | 2,901,837 | | | | 2,900,863 | |
| Microsoft Corp. 0.10% due 4/15/2015–4/22/20153 | | | 93,000 | | | | 92,991 | |
| Other securities | | | | | | | 2,297,739 | |
| | | | | | | | | |
| Total short-term securities (cost: $13,027,502,000) | | | | | | | 13,029,785 | |
| Total investment securities 100.24% (cost: $89,304,780,000) | | | | | | | 148,148,000 | |
| Other assets less liabilities (0.24)% | | | | | | | (354,580 | ) |
| | | | | | | | | |
| Net assets 100.00% | | | | | | $ | 147,793,420 | |
| The Growth Fund of America | 7 |
This summary investment portfolio is designed to streamline the report and help investors better focus on the fund’s principal holdings. See the inside back cover for details on how to obtain a complete schedule of portfolio holdings.
As permitted by U.S. Securities and Exchange Commission regulations, “Miscellaneous” securities include holdings in their first year of acquisition that have not previously been publicly disclosed.
“Other securities” includes all issues that are not disclosed separately in the summary investment portfolio, including securities which were valued under fair value procedures adopted by authority of the board of trustees. The securities which were valued under fair value procedures (with an aggregate value of $325,155,000, an aggregate cost of $281,325,000, and which represented .22% of the net assets of the fund) were acquired from 7/7/2000 to 6/26/2014 through private placement transactions exempt from registration under the Securities Act of 1933, which may subject them to legal or contractual restrictions on resale.
| 8 | The Growth Fund of America |
Investments in affiliates
A company is an affiliate of the fund under the Investment Company Act of 1940 if the fund’s holdings in that company represent 5% or more of the outstanding voting shares. The value of the fund’s affiliated-company holdings is either shown in the summary investment portfolio or included in the value of “Other securities” under the respective industry sectors. Further details on such holdings and related transactions during the six months ended February 28, 2015, appear below.
| | | Beginning
shares | | | Additions | | | Reductions | | | Ending
shares | | | Dividend
income
(000) | | | Value of
affiliates at
2/28/2015
(000) | |
| Avago Technologies Ltd. | | | 17,601,820 | | | | 555,262 | | | | 750,000 | | | | 17,407,082 | | | $ | 11,988 | | | $ | 2,221,492 | |
| Noble Energy, Inc. | | | 16,677,621 | | | | 3,962,000 | | | | — | | | | 20,639,621 | | | | 6,267 | | | | 974,809 | |
| Concho Resources Inc.1 | | | 8,578,506 | | | | 255,500 | | | | — | | | | 8,834,006 | | | | — | | | | 962,200 | |
| MGM Resorts International1 | | | 29,412,600 | | | | 6,887,000 | | | | — | | | | 36,299,600 | | | | — | | | | 788,790 | |
| AutoNation, Inc.1 | | | 6,000,000 | | | | — | | | | — | | | | 6,000,000 | | | | — | | | | 369,000 | |
| Sprouts Farmers Market, Inc.1 | | | 8,270,446 | | | | 1,167,554 | | | | — | | | | 9,438,000 | | | | — | | | | 347,413 | |
| athenahealth, Inc.1 | | | 2,522,484 | | | | 7,377 | | | | — | | | | 2,529,861 | | | | — | | | | 321,469 | |
| Oshkosh Corp. | | | 4,368,000 | | | | — | | | | — | | | | 4,368,000 | | | | 1,485 | | | | 213,115 | |
| Finisar Corp.1 | | | 4,930,000 | | | | 3,343,000 | | | | — | | | | 8,273,000 | | | | — | | | | 173,816 | |
| Cheniere Energy, Inc.1,4 | | | 11,859,300 | | | | — | | | | 10,075,720 | | | | 1,783,580 | | | | — | | | | — | |
| Edwards Lifesciences Corp.1,4 | | | 6,132,700 | | | | — | | | | 1,631,228 | | | | 4,501,472 | | | | — | | | | — | |
| FMC Technologies, Inc.1,4 | | | 15,179,100 | | | | — | | | | 4,972,312 | | | | 10,206,788 | | | | — | | | | — | |
| Herbalife Ltd.4 | | | 5,442,001 | | | | 800,000 | | | | 2,055,601 | | | | 4,186,400 | | | | — | | | | — | |
| Hologic, Inc.1,4 | | | 17,126,960 | | | | 134,800 | | | | 3,295,660 | | | | 13,966,100 | | | | — | | | | — | |
| Toll Brothers, Inc.1,4 | | | 10,628,300 | | | | — | | | | 8,803,300 | | | | 1,825,000 | | | | — | | | | — | |
| Towers Watson & Co., Class A4 | | | 3,825,000 | | | | 131,937 | | | | 1,925,000 | | | | 2,031,937 | | | | 603 | | | | — | |
| | | | | | | | | | | | | | | | | | | $ | 20,343 | | | $ | 6,372,104 | |
The following footnotes apply to either the individual securities noted or one or more of the securities aggregated and listed as a single line item.
| 1 | Security did not produce income during the last 12 months. |
| 2 | Represents an affiliated company as defined under the Investment Company Act of 1940. |
| 3 | Acquired in a transaction exempt from registration under Rule 144A or Section 4(2) of the Securities Act of 1933. May be resold in the U.S. in transactions exempt from registration, normally to qualified institutional buyers. The total value of all such securities, including those in “Other securities,” was $1,799,234,000, which represented 1.22% of the net assets of the fund. |
| 4 | Unaffiliated issuer at 2/28/2015. |
See Notes to Financial Statements
| The Growth Fund of America | 9 |
Financial statements
| Statement of assets and liabilities | | unaudited | |
| at February 28, 2015 | | (dollars in thousands) | |
| | | | |
| Assets: | | | | | | | | |
| Investment securities, at value: | | | | | | | | |
| Unaffiliated issuers (cost: $85,268,519) | | $ | 141,775,896 | | | | | |
| Affiliated issuers (cost: $4,036,261) | | | 6,372,104 | | | $ | 148,148,000 | |
| Cash | | | | | | | 1,469 | |
| Receivables for: | | | | | | | | |
| Sales of investments | | | 354,073 | | | | | |
| Sales of fund’s shares | | | 137,824 | | | | | |
| Dividends and interest | | | 110,088 | | | | 601,985 | |
| | | | | | | | 148,751,454 | |
| Liabilities: | | | | | | | | |
| Payables for: | | | | | | | | |
| Purchases of investments | | | 676,386 | | | | | |
| Repurchases of fund’s shares | | | 170,260 | | | | | |
| Investment advisory services | | | 30,538 | | | | | |
| Services provided by related parties | | | 67,783 | | | | | |
| Trustees’ deferred compensation | | | 5,652 | | | | | |
| Other | | | 7,415 | | | | 958,034 | |
| Net assets at February 28, 2015 | | | | | | $ | 147,793,420 | |
| | | | | | | | | |
| Net assets consist of: | | | | | | | | |
| Capital paid in on shares of beneficial interest | | | | | | $ | 82,391,248 | |
| Undistributed net investment income | | | | | | | 90,151 | |
| Undistributed net realized gain | | | | | | | 6,473,369 | |
| Net unrealized appreciation | | | | | | | 58,838,652 | |
| Net assets at February 28, 2015 | | | | | | $ | 147,793,420 | |
(dollars and shares in thousands, except per-share amounts)
Shares of beneficial interest issued and outstanding (no stated par value) —
unlimited shares authorized (3,341,085 total shares outstanding)
| | | | | | Shares | | | Net asset value | |
| | | Net assets | | | outstanding | | | per share | |
| Class A | | $ | 75,553,447 | | | | 1,697,920 | | | $ | 44.50 | |
| Class B | | | 701,130 | | | | 16,476 | | | | 42.55 | |
| Class C | | | 6,048,167 | | | | 143,676 | | | | 42.10 | |
| Class F-1 | | | 8,829,277 | | | | 199,526 | | | | 44.25 | |
| Class F-2 | | | 10,910,567 | | | | 245,537 | | | | 44.44 | |
| Class 529-A | | | 6,078,320 | | | | 137,689 | | | | 44.15 | |
| Class 529-B | | | 129,383 | | | | 3,052 | | | | 42.40 | |
| Class 529-C | | | 1,491,605 | | | | 35,291 | | | | 42.27 | |
| Class 529-E | | | 271,596 | | | | 6,203 | | | | 43.78 | |
| Class 529-F-1 | | | 213,332 | | | | 4,841 | | | | 44.07 | |
| Class R-1 | | | 529,487 | | | | 12,430 | | | | 42.60 | |
| Class R-2 | | | 2,462,216 | | | | 57,375 | | | | 42.91 | |
| Class R-2E | | | 76 | | | | 2 | | | | 44.35 | |
| Class R-3 | | | 8,082,076 | | | | 184,537 | | | | 43.80 | |
| Class R-4 | | | 7,743,480 | | | | 175,281 | | | | 44.18 | |
| Class R-5 | | | 5,259,912 | | | | 118,292 | | | | 44.47 | |
| Class R-6 | | | 13,489,349 | | | | 302,957 | | | | 44.53 | |
See Notes to Financial Statements
| 10 | The Growth Fund of America |
| Statement of operations | | unaudited | |
| for the six months ended February 28, 2015 | | (dollars in thousands) | |
| | | | |
| Investment income: | | | | | | | | |
| Income: | | | | | | | | |
| Dividends (net of non-U.S. taxes of $8,368; also includes $20,343 from affiliates) | | $ | 767,980 | | | | | |
| Interest | | | 9,795 | | | $ | 777,775 | |
| Fees and expenses*: | | | | | | | | |
| Investment advisory services | | | 194,132 | | | | | |
| Distribution services | | | 186,505 | | | | | |
| Transfer agent services | | | 80,188 | | | | | |
| Administrative services | | | 20,755 | | | | | |
| Reports to shareholders | | | 2,977 | | | | | |
| Registration statement and prospectus | | | 2,962 | | | | | |
| Trustees’ compensation | | | 341 | | | | | |
| Auditing and legal | | | 90 | | | | | |
| Custodian | | | 1,161 | | | | | |
| Other | | | 3,671 | | | | 492,782 | |
| Net investment income | | | | | | | 284,993 | |
| | | | | | | | | |
| Net realized gain and unrealized depreciation on investments, forward currency contracts and currency: | | | | | | | | |
| Net realized gain (loss) on: | | | | | | | | |
| Investments (includes $1,826,187 net gain from affiliates) | | | 7,105,220 | | | | | |
| Forward currency contracts | | | 11,032 | | | | | |
| Currency transactions | | | (2,836 | ) | | | 7,113,416 | |
| Net unrealized depreciation on: | | | | | | | | |
| Investments (net of non-U.S. taxes of $4,002) | | | (490,758 | ) | | | | |
| Forward currency contracts | | | (1,264 | ) | | | | |
| Currency translations | | | (362 | ) | | | (492,384 | ) |
| Net realized gain and unrealized depreciation on investments, forward currency contracts and currency | | | | | | | 6,621,032 | |
| | | | | | | | | |
| Net increase in net assets resulting from operations | | | | | | $ | 6,906,025 | |
*Additional information related to class-specific fees and expenses is included in the Notes to Financial Statements.
See Notes to Financial Statements
| The Growth Fund of America | 11 |
Statements of changes in net assets
(dollars in thousands)
| | | Six months ended | | | Year ended | |
| | | February 28, 2015* | | | August 31, 2014 | |
| Operations: | | | | | | | | |
| Net investment income | | $ | 284,993 | | | $ | 471,645 | |
| Net realized gain on investments, forward currency contracts and currency transactions | | | 7,113,416 | | | | 13,458,166 | |
| Net unrealized (depreciation) appreciation on investments, forward currency contracts and currency translations | | | (492,384 | ) | | | 16,096,277 | |
| Net increase in net assets resulting from operations | | | 6,906,025 | | | | 30,026,088 | |
| | | | | | | | | |
| Dividends and distributions paid to shareholders: | | | | | | | | |
| Dividends from net investment income | | | (510,334 | ) | | | (409,908 | ) |
| Distributions from net realized gain on investments | | | (12,500,232 | ) | | | (8,412,644 | ) |
| Total dividends and distributions paid to shareholders | | | (13,010,566 | ) | | | (8,822,552 | ) |
| | | | | | | | | |
| Net capital share transactions | | | 8,696,201 | | | | 507,086 | |
| | | | | | | | | |
| Total increase in net assets | | | 2,591,660 | | | | 21,710,622 | |
| | | | | | | | | |
| Net assets: | | | | | | | | |
| Beginning of period | | | 145,201,760 | | | | 123,491,138 | |
| End of period (including undistributed net investment income: $90,151 and $315,492, respectively) | | $ | 147,793,420 | | | $ | 145,201,760 | |
*Unaudited.
See Notes to Financial Statements
| 12 | The Growth Fund of America |
| Notes to financial statements | unaudited |
1. Organization
The Growth Fund of America (the “fund”) is registered under the Investment Company Act of 1940 as an open-end, diversified investment company. The fund invests in a wide range of companies that appear to offer superior opportunities for growth of capital.
The fund has 17 share classes consisting of five retail share classes (Classes A, B and C, as well as two F share classes, F-1 and F-2), five 529 college savings plan share classes (Classes 529-A, 529-B, 529-C, 529-E and 529-F-1) and seven retirement plan share classes (Classes R-1, R-2, R-2E, R-3, R-4, R-5 and R-6). The 529 college savings plan share classes can be used to save for college education. The retirement plan share classes are generally offered only through eligible employer-sponsored retirement plans. The fund’s share classes are described further in the following table:
| Share class | | Initial sales
charge | | Contingent deferred sales
charge upon redemption | | Conversion feature |
| Classes A and 529-A | | Up to 5.75% | | None (except 1% for certain redemptions within one year of purchase without an initial sales charge) | | None |
| Classes B and 529-B* | | None | | Declines from 5% to 0% for redemptions within six years of purchase | | Classes B and 529-B convert to Classes A and 529-A, respectively, after eight years |
| Class C | | None | | 1% for redemptions within one year of purchase | | Class C converts to Class F-1 after 10 years |
| Class 529-C | | None | | 1% for redemptions within one year of purchase | | None |
| Class 529-E | | None | | None | | None |
| Classes F-1, F-2 and 529-F-1 | | None | | None | | None |
| Classes R-1, R-2, R-2E, R-3, R-4, R-5 and R-6 | | None | | None | | None |
*Class B and 529-B shares of the fund are not available for purchase.
Holders of all share classes have equal pro rata rights to the assets, dividends and liquidation proceeds of the fund. Each share class has identical voting rights, except for the exclusive right to vote on matters affecting only its class. Share classes have different fees and expenses (“class-specific fees and expenses”), primarily due to different arrangements for distribution, transfer agent and administrative services. Differences in class-specific fees and expenses will result in differences in net investment income and, therefore, the payment of different per-share dividends by each share class.
2. Significant accounting policies
The fund is an investment company that applies the accounting and reporting guidance issued in Topic 946 by the U.S. Financial Accounting Standards Board. The fund’s financial statements have been prepared to comply with U.S. generally accepted accounting
| The Growth Fund of America | 13 |
principles (“U.S. GAAP”). These principles require the fund’s investment adviser to make estimates and assumptions that affect reported amounts and disclosures. Actual results could differ from those estimates. The fund follows the significant accounting policies described in this section, as well as the valuation policies described in the next section on valuation.
Security transactions and related investment income — Security transactions are recorded by the fund as of the date the trades are executed with brokers. Realized gains and losses from security transactions are determined based on the specific identified cost of the securities. In the event a security is purchased with a delayed payment date, the fund will segregate liquid assets sufficient to meet its payment obligations. Dividend income is recognized on the ex-dividend date and interest income is recognized on an accrual basis. Market discounts, premiums and original issue discounts on fixed-income securities are amortized daily over the expected life of the security.
Class allocations — Income, fees and expenses (other than class-specific fees and expenses) and realized and unrealized gains and losses are allocated daily among the various share classes based on their relative net assets. Class-specific fees and expenses, such as distribution, transfer agent and administrative services, are charged directly to the respective share class.
Dividends and distributions to shareholders — Dividends and distributions to shareholders are recorded on the ex-dividend date.
Currency translation — Assets and liabilities, including investment securities, denominated in currencies other than U.S. dollars are translated into U.S. dollars at the exchange rates supplied by one or more pricing vendors on the valuation date. Purchases and sales of investment securities and income and expenses are translated into U.S. dollars at the exchange rates on the dates of such transactions. The effects of changes in exchange rates on investment securities are included with the net realized gain or loss and net unrealized appreciation or depreciation on investments in the fund’s statement of operations. The realized gain or loss and unrealized appreciation or depreciation resulting from all other transactions denominated in currencies other than U.S. dollars are disclosed separately.
3. Valuation
Capital Research and Management Company (“CRMC”), the fund’s investment adviser, values the fund’s investments at fair value as defined by U.S. GAAP. The net asset value of each share class of the fund is generally determined as of approximately 4:00 p.m. New York time each day the New York Stock Exchange is open.
Methods and inputs — The fund’s investment adviser uses the following methods and inputs to establish the fair value of the fund’s assets and liabilities. Use of particular methods and inputs may vary over time based on availability and relevance as market and economic conditions evolve.
| 14 | The Growth Fund of America |
Equity securities are generally valued at the official closing price of, or the last reported sale price on, the exchange or market on which such securities are traded, as of the close of business on the day the securities are being valued or, lacking any sales, at the last available bid price. Prices for each security are taken from the principal exchange or market on which the security trades.
Fixed-income securities, including short-term securities, are generally valued at prices obtained from one or more pricing vendors. Vendors value such securities based on one or more of the inputs described in the following table. The table provides examples of inputs that are commonly relevant for valuing particular classes of fixed-income securities in which the fund is authorized to invest. However, these classifications are not exclusive, and any of the inputs may be used to value any other class of fixed-income security.
| Fixed-income class | Examples of standard inputs |
| All | Benchmark yields, transactions, bids, offers, quotations from dealers and trading systems, new issues, spreads and other relationships observed in the markets among comparable securities; and proprietary pricing models such as yield measures calculated using factors such as cash flows, financial or collateral performance and other reference data (collectively referred to as “standard inputs”) |
| Corporate bonds & notes; convertible securities | Standard inputs and underlying equity of the issuer |
| Bonds & notes of governments & government agencies | Standard inputs and interest rate volatilities |
When the fund’s investment adviser deems it appropriate to do so (such as when vendor prices are unavailable or deemed to be not representative), fixed-income securities will be valued in good faith at the mean quoted bid and ask prices that are reasonably and timely available (or bid prices, if ask prices are not available) or at prices for securities of comparable maturity, quality and type.
Securities with both fixed-income and equity characteristics, or equity securities traded principally among fixed-income dealers, are generally valued in the manner described for either equity or fixed-income securities, depending on which method is deemed most appropriate by the fund’s investment adviser. Forward currency contracts are valued at the mean of representative quoted bid and ask prices, generally based on prices supplied by one or more pricing vendors.
Securities and other assets for which representative market quotations are not readily available or are considered unreliable by the fund’s investment adviser are fair valued as determined in good faith under fair valuation guidelines adopted by authority of the fund’s board of trustees as further described. The investment adviser follows fair valuation guidelines, consistent with U.S. Securities and Exchange Commission rules and guidance, to consider relevant principles and factors when making fair value determinations. The investment adviser considers relevant indications of value that are reasonably and timely available to it in determining the fair value to be assigned to a particular security, such as
| The Growth Fund of America | 15 |
the type and cost of the security; contractual or legal restrictions on resale of the security; relevant financial or business developments of the issuer; actively traded similar or related securities; conversion or exchange rights on the security; related corporate actions; significant events occurring after the close of trading in the security; and changes in overall market conditions. In addition, the closing prices of equity securities that trade in markets outside U.S. time zones may be adjusted to reflect significant events that occur after the close of local trading but before the net asset value of each share class of the fund is determined. Fair valuations and valuations of investments that are not actively trading involve judgment and may differ materially from valuations that would have been used had greater market activity occurred.
Processes and structure — The fund’s board of trustees has delegated authority to the fund’s investment adviser to make fair value determinations, subject to board oversight. The investment adviser has established a Joint Fair Valuation Committee (the “Fair Valuation Committee”) to administer, implement and oversee the fair valuation process, and to make fair value decisions. The Fair Valuation Committee regularly reviews its own fair value decisions, as well as decisions made under its standing instructions to the investment adviser’s valuation teams. The Fair Valuation Committee reviews changes in fair value measurements from period to period and may, as deemed appropriate, update the fair valuation guidelines to better reflect the results of back testing and address new or evolving issues. The Fair Valuation Committee reports any changes to the fair valuation guidelines to the board of trustees with supplemental information to support the changes. The fund’s board and audit committee also regularly review reports that describe fair value determinations and methods.
The fund’s investment adviser has also established a Fixed-Income Pricing Review Group to administer and oversee the fixed-income valuation process, including the use of fixed-income pricing vendors. This group regularly reviews pricing vendor information and market data. Pricing decisions, processes and controls over security valuation are also subject to additional internal reviews, including an annual control self-evaluation program facilitated by the investment adviser’s compliance group.
Classifications — The fund’s investment adviser classifies the fund’s assets and liabilities into three levels based on the inputs used to value the assets or liabilities. Level 1 values are based on quoted prices in active markets for identical securities. Level 2 values are based on significant observable market inputs, such as quoted prices for similar securities and quoted prices in inactive markets. Certain securities trading outside the U.S. may transfer between Level 1 and Level 2 due to valuation adjustments resulting from significant market movements following the close of local trading. Level 3 values are based on significant unobservable inputs that reflect the investment adviser’s determination of assumptions that market participants might reasonably use in valuing the securities. The valuation levels are not necessarily an indication of the risk or liquidity associated with the underlying investment. For example, U.S. government securities are
| 16 | The Growth Fund of America |
reflected as Level 2 because the inputs used to determine fair value may not always be quoted prices in an active market. The following table presents the fund’s valuation levels as of February 28, 2015 (dollars in thousands):
| | | Investment securities | |
| Investment securities | | Level 1 | | | Level 2 | | | Level 3 | | | Total | |
| Assets: | | | | | | | | | | | | | | | | |
| Common stocks: | | | | | | | | | | | | | | | | |
| Information technology | | $ | 30,518,981 | | | $ | — | | | $ | 322,875 | | | $ | 30,841,856 | |
| Consumer discretionary | | | 25,908,306 | | | | — | | | | — | | | | 25,908,306 | |
| Health care | | | 25,323,223 | | | | — | | | | — | | | | 25,323,223 | |
| Industrials | | | 13,123,731 | | | | — | | | | — | | | | 13,123,731 | |
| Financials | | | 11,431,556 | | | | — | | | | — | | | | 11,431,556 | |
| Energy | | | 9,697,172 | | | | — | | | | 2,280 | | | | 9,699,452 | |
| Consumer staples | | | 6,240,334 | | | | — | | | | — | | | | 6,240,334 | |
| Materials | | | 3,823,639 | | | | — | | | | — | | | | 3,823,639 | |
| Other | | | 921,553 | | | | — | | | | — | | | | 921,553 | |
| Miscellaneous | | | 7,396,359 | | | | — | | | | — | | | | 7,396,359 | |
| Preferred securities | | | 21,538 | | | | — | | | | — | | | | 21,538 | |
| Rights & warrants | | | 120,928 | | | | — | | | | — | | | | 120,928 | |
| Convertible bonds | | | — | | | | 47,993 | | | | — | | | | 47,993 | |
| Bonds, notes & other debt instruments | | | — | | | | 217,747 | | | | — | | | | 217,747 | |
| Short-term securities | | | — | | | | 13,029,785 | | | | — | | | | 13,029,785 | |
| Total | | $ | 134,527,320 | | | $ | 13,295,525 | | | $ | 325,155 | | | $ | 148,148,000 | |
4. Risk factors
Investing in the fund may involve certain risks including, but not limited to, those described below.
Market conditions — The prices of, and the income generated by, the common stocks and other securities held by the fund may decline – sometimes rapidly or unpredictably – due to various factors, including events or conditions affecting the general economy or particular industries; overall market changes; local, regional or global political, social or economic instability; governmental or governmental agency responses to economic conditions; and currency, interest rate and commodity price fluctuations.
Issuer risks — The values of, and the income generated by, securities held by the fund may also decline in response to various factors directly related to the issuers of such securities, including reduced demand for an issuer’s goods or services, poor management performance and strategic initiatives such as mergers, acquisitions or dispositions and the market response to any such initiative.
Investing in growth-oriented stocks — Growth-oriented common stocks and other equity-type securities (such as preferred stocks, convertible preferred stocks and convertible bonds) may involve larger price swings and greater potential for loss than other types of investments.
| The Growth Fund of America | 17 |
Investing outside the U.S. — Securities of issuers domiciled outside the U.S., or with significant operations outside the U.S., may lose value because of adverse political, social, economic or market developments (including social instability, regional conflicts, terrorism and war) in the countries or regions in which the issuers are domiciled or operate. These securities may also lose value due to changes in foreign currency exchange rates against the U.S. dollar and/or currencies of other countries. Securities markets in certain countries may be more volatile and/or less liquid than those in the U.S. Investments outside the U.S. may also be subject to different accounting practices and different regulatory, legal and reporting standards, and may be more difficult to value, than those in the U.S. In addition, the value of investments outside the U.S. may be reduced by foreign taxes, including foreign withholding taxes on interest and dividends. Further, there may be increased risks of delayed settlement of securities purchased or sold by the fund. The risks of investing outside the U.S. may be heightened in connection with investments in emerging markets.
Management — The investment adviser to the fund actively manages the fund’s investments. Consequently, the fund is subject to the risk that the methods and analyses employed by the investment adviser in this process may not produce the desired results. This could cause the fund to lose value or its investment results to lag relevant benchmarks or other funds with similar objectives.
5. Certain investment techniques
Loan transactions — The fund has entered into loan transactions in which the fund acquires a loan either through an agent, by assignment from another holder, or as a participation interest in another holder’s portion of a loan. The loan is often administered by a financial institution that acts as agent for the holders of the loan, and the fund may be required to receive approval from the agent and/or borrower prior to the sale of the investment. The loan’s interest rate and maturity date may change based on the terms of the loan, including potential early payments of principal.
Forward currency contracts — The fund has entered into forward currency contracts, which represent agreements to exchange currencies on specific future dates at predetermined rates. The fund’s investment adviser uses forward currency contracts to manage the fund’s exposure to changes in exchange rates. Upon entering into these contracts, risks may arise from the potential inability of counterparties to meet the terms of their contracts and from possible movements in exchange rates.
On a daily basis, the fund’s investment adviser values forward currency contracts and records unrealized appreciation or depreciation for open forward currency contracts in the fund’s statement of assets and liabilities. Realized gains or losses are recorded at the time the forward currency contract is closed or offset by another contract with the same broker for the same settlement date and currency.
Closed forward currency contracts that have not reached their settlement date are included in the respective receivables or payables for closed forward currency contracts in the fund’s statement of assets and liabilities. Net realized gains or losses from closed
| 18 | The Growth Fund of America |
forward currency contracts and net unrealized appreciation or depreciation from open forward currency contracts are recorded in the fund’s statement of operations. As of February 28, 2015, the fund did not have any open forward currency contracts.
The following table presents the financial statement impacts resulting from the fund’s use of forward currency contracts as of February 28, 2015 (dollars in thousands):
| | | Net realized gain | | Net unrealized depreciation |
| | | Location on statement of | | | | Location on statement of | | | |
| Contract | | operations | | Value | | operations | | Value | |
| Forward currency | | Net realized gain on forward currency contracts | | $11,032 | | Net unrealized depreciation on forward currency contracts | | $(1,264 | ) |
Collateral — The fund participates in a collateral program due to its use of forward currency contracts. The program calls for the fund to either receive or pledge collateral based on the net gain or loss on unsettled forward currency contracts by counterparty. The purpose of the collateral is to cover potential losses that could occur in the event that either party cannot meet its contractual obligations.
6. Taxation and distributions
Federal income taxation — The fund complies with the requirements under Subchapter M of the Internal Revenue Code applicable to mutual funds and intends to distribute substantially all of its net taxable income and net capital gains each year. The fund is not subject to income taxes to the extent such distributions are made. Therefore, no federal income tax provision is required.
As of and during the period ended February 28, 2015, the fund did not have a liability for any unrecognized tax benefits. The fund recognizes interest and penalties, if any, related to unrecognized tax benefits as income tax expense in the statement of operations. During the period, the fund did not incur any interest or penalties.
The fund is not subject to examination by U.S. federal tax authorities for tax years before 2010, by state tax authorities for tax years before 2009 and by tax authorities outside the U.S. for tax years before 2007.
Non-U.S. taxation — Dividend and interest income are recorded net of non-U.S. taxes paid. Gains realized by the fund on the sale of securities in certain countries are subject to non-U.S. taxes. The fund records a liability based on unrealized gains to provide for potential non-U.S. taxes payable upon the sale of these securities.
Distributions — Distributions paid to shareholders are based on net investment income and net realized gains determined on a tax basis, which may differ from net investment income and net realized gains for financial reporting purposes. These differences are due primarily to different treatment for items such as currency gains and losses; short-term
| The Growth Fund of America | 19 |
capital gains and losses; capital losses related to sales of certain securities within 30 days of purchase; and unrealized appreciation of certain investments in securities outside the U.S. The fiscal year in which amounts are distributed may differ from the year in which the net investment income and net realized gains are recorded by the fund for financial reporting purposes.
The components of distributable earnings on a tax basis are reported as of the fund’s most recent year-end. As of August 31, 2014, the fund had tax basis undistributed ordinary income of $335,585,000 and undistributed long-term capital gains of $12,065,769,000.
As of February 28, 2015, the tax basis unrealized appreciation (depreciation) and cost of investment securities were as follows (dollars in thousands):
| Gross unrealized appreciation on investment securities | | $ | 60,547,860 | |
| Gross unrealized depreciation on investment securities | | | (1,873,117 | ) |
| Net unrealized appreciation on investment securities | | | 58,674,743 | |
| Cost of investment securities | | | 89,473,257 | |
The tax character of distributions paid to shareholders was as follows (dollars in thousands):
| | | Six months ended February 28, 2015 | | | Year ended August 31, 2014 | |
| | | | | | | | | Total | | | | | | | | | Total | |
| | | Ordinary | | | Long-term | | | distributions | | | Ordinary | | | Long-term | | | distributions | |
| Share class | | income | | | capital gains | | | paid | | | income | | | capital gains | | | paid | |
| Class A | | $ | 262,559 | | | $ | 6,340,498 | | | $ | 6,603,057 | | | $ | 213,008 | | | $ | 4,257,047 | | | $ | 4,470,055 | |
| Class B | | | — | | | | 67,369 | | | | 67,369 | | | | — | | | | 73,067 | | | | 73,067 | |
| Class C | | | — | * | | | 544,071 | | | | 544,071 | | | | — | | | | 405,551 | | | | 405,551 | |
| Class F-1 | | | 18,273 | | | | 755,708 | | | | 773,981 | | | | 31,682 | | | | 746,681 | | | | 778,363 | |
| Class F-2 | | | 65,863 | | | | 914,144 | | | | 980,007 | | | | 29,050 | | | | 328,248 | | | | 357,298 | |
| Class 529-A | | | 16,901 | | | | 507,145 | | | | 524,046 | | | | 13,249 | | | | 324,205 | | | | 337,454 | |
| Class 529-B | | | — | * | | | 12,440 | | | | 12,440 | | | | — | | | | 12,376 | | | | 12,376 | |
| Class 529-C | | | — | | | | 130,678 | | | | 130,678 | | | | — | | | | 84,925 | | | | 84,925 | |
| Class 529-E | | | 130 | | | | 23,003 | | | | 23,133 | | | | 78 | | | | 15,116 | | | | 15,194 | |
| Class 529-F-1 | | | 1,021 | | | | 17,658 | | | | 18,679 | | | | 791 | | | | 10,945 | | | | 11,736 | |
| Class R-1 | | | — | | | | 47,645 | | | | 47,645 | | | | — | | | | 33,348 | | | | 33,348 | |
| Class R-2 | | | — | * | | | 216,665 | | | | 216,665 | | | | — | | | | 155,143 | | | | 155,143 | |
| Class R-2E† | | | — | * | | | 1 | | | | 1 | | | | — | | | | — | | | | — | |
| Class R-3 | | | 2,227 | | | | 705,934 | | | | 708,161 | | | | 2,312 | | | | 516,611 | | | | 518,923 | |
| Class R-4 | | | 25,099 | | | | 666,839 | | | | 691,938 | | | | 23,161 | | | | 477,099 | | | | 500,260 | |
| Class R-5 | | | 33,323 | | | | 464,423 | | | | 497,746 | | | | 32,633 | | | | 346,504 | | | | 379,137 | |
| Class R-6 | | | 84,938 | | | | 1,086,011 | | | | 1,170,949 | | | | 63,944 | | | | 625,778 | | | | 689,722 | |
| Total | | $ | 510,334 | | | $ | 12,500,232 | | | $ | 13,010,566 | | | $ | 409,908 | | | $ | 8,412,644 | | | $ | 8,822,552 | |
*Amount less than one thousand.
†Class R-2E shares were offered beginning August 29, 2014.
| 20 | The Growth Fund of America |
7. Fees and transactions with related parties
CRMC, the fund’s investment adviser, is the parent company of American Funds Distributors,® Inc. (“AFD”), the principal underwriter of the fund’s shares, and American Funds Service Company® (“AFS”), the fund’s transfer agent. CRMC, AFD and AFS are considered related parties to the fund.
Investment advisory services — The fund has an investment advisory and service agreement with CRMC that provides for monthly fees accrued daily. These fees are based on a series of decreasing annual rates beginning with 0.500% on the first $1 billion of daily net assets and decreasing to 0.233% on such assets in excess of $210 billion. For the six months ended February 28, 2015, the investment advisory services fee was $194,132,000, which was equivalent to an annualized rate of 0.274% of average daily net assets.
Class-specific fees and expenses — Expenses that are specific to individual share classes are accrued directly to the respective share class. The principal class-specific fees and expenses are further described below:
Distribution services — The fund has plans of distribution for all share classes, except Class F-2, R-5 and R-6 shares. Under the plans, the board of trustees approves certain categories of expenses that are used to finance activities primarily intended to sell fund shares and service existing accounts. The plans provide for payments, based on an annualized percentage of average daily net assets, ranging from 0.25% to 1.00% as noted in this section. In some cases, the board of trustees has limited the amounts that may be paid to less than the maximum allowed by the plans. All share classes with a plan may use up to 0.25% of average daily net assets to pay service fees, or to compensate AFD for paying service fees, to firms that have entered into agreements with AFD to provide certain shareholder services. The remaining amounts available to be paid under each plan are paid to dealers to compensate them for their sales activities.
For Class A and 529-A shares, distribution-related expenses include the reimbursement of dealer and wholesaler commissions paid by AFD for certain shares sold without a sales charge. These share classes reimburse AFD for amounts
| The Growth Fund of America | 21 |
billed within the prior 15 months but only to the extent that the overall annual expense limit of 0.25% is not exceeded. As of February 28, 2015, there were no unreimbursed expenses subject to reimbursement for Class A or 529-A shares.
| Share class | | Currently approved limits | | Plan limits |
| Class A | | | 0.25 | % | | | 0.25 | % |
| Class 529-A | | | 0.25 | | | | 0.50 | |
| Classes B and 529-B | | | 1.00 | | | | 1.00 | |
| Classes C, 529-C and R-1 | | | 1.00 | | | | 1.00 | |
| Class R-2 | | | 0.75 | | | | 1.00 | |
| Class R-2E | | | 0.60 | | | | 0.85 | |
| Classes 529-E and R-3 | | | 0.50 | | | | 0.75 | |
| Classes F-1, 529-F-1 and R-4 | | | 0.25 | | | | 0.50 | |
Transfer agent services — The fund has a shareholder services agreement with AFS under which the fund compensates AFS for providing transfer agent services to each of the fund’s share classes. These services include recordkeeping, shareholder communications and transaction processing. In addition, the fund reimburses AFS for amounts paid to third parties for performing transfer agent services on behalf of fund shareholders.
Administrative services — The fund has an administrative services agreement with CRMC under which the fund compensates CRMC for providing administrative services to Class A, C, F, 529 and R shares. These services include, but are not limited to, coordinating, monitoring, assisting and overseeing third parties that provide services to fund shareholders. Under the agreement, Class A shares pay an annual fee of 0.01% and Class C, F, 529 and R shares pay an annual fee of 0.05% of their respective average daily net assets.
529 plan services — Each 529 share class is subject to service fees to compensate the Virginia College Savings Plan (“Virginia529“) for its oversight and administration of the 529 college savings plan. The quarterly fee is based on a series of decreasing annual rates beginning with 0.10% on the first $30 billion of the net assets invested in Class 529 shares of the American Funds and decreasing to 0.05% on such assets in excess of $70 billion. The fee for any given calendar quarter is accrued and calculated on the basis of the average net assets of Class 529 shares of the American Funds for the last month of the prior calendar quarter. The fee is included in other expenses in the fund’s statement of operations. Virginia529 is not considered a related party to the fund.
| 22 | The Growth Fund of America |
For the six months ended February 28, 2015, class-specific expenses under the agreements were as follows (dollars in thousands):
| Share class | | Distribution
services | | Transfer agent
services | | Administrative
services | | 529 plan
services |
| Class A | | $86,441 | | | $47,772 | | | $3,609 | | | Not applicable |
| Class B | | 3,781 | | | 533 | | | Not applicable | | | Not applicable |
| Class C | | 29,560 | | | 3,888 | | | 1,482 | | | Not applicable |
| Class F-1 | | 11,446 | | | 5,803 | | | 2,300 | | | Not applicable |
| Class F-2 | | Not applicable | | | 4,662 | | | 2,411 | | | Not applicable |
| Class 529-A | | 6,357 | | | 2,866 | | | 1,433 | | | $2,565 |
| Class 529-B | | 693 | | | 84 | | | 35 | | | 63 |
| Class 529-C | | 7,034 | | | 749 | | | 354 | | | 634 |
| Class 529-E | | 642 | | | 89 | | | 65 | | | 115 |
| Class 529-F-1 | | — | | | 99 | | | 50 | | | 89 |
| Class R-1 | | 2,590 | | | 238 | | | 130 | | | Not applicable |
| Class R-2 | | 8,903 | | | 3,366 | | | 598 | | | Not applicable |
| Class R-2E | | — | * | | — | * | | — | * | | Not applicable |
| Class R-3 | | 19,714 | | | 5,393 | | | 1,983 | | | Not applicable |
| Class R-4 | | 9,344 | | | 3,432 | | | 1,886 | | | Not applicable |
| Class R-5 | | Not applicable | | | 1,192 | | | 1,314 | | | Not applicable |
| Class R-6 | | Not applicable | | | 22 | | | 3,105 | | | Not applicable |
| Total class-specific expenses | | $186,505 | | | $80,188 | | | $20,755 | | | $3,466 |
*Amount less than one thousand.
Trustees’ deferred compensation — Trustees who are unaffiliated with CRMC may elect to defer the cash payment of part or all of their compensation. These deferred amounts, which remain as liabilities of the fund, are treated as if invested in shares of the fund or other American Funds. These amounts represent general, unsecured liabilities of the fund and vary according to the total returns of the selected funds. Trustees’ compensation of $341,000 in the fund’s statement of operations includes $195,000 in current fees (either paid in cash or deferred) and a net increase of $146,000 in the value of the deferred amounts.
Affiliated officers and trustees — Officers and certain trustees of the fund are or may be considered to be affiliated with CRMC, AFD and AFS. No affiliated officers or trustees received any compensation directly from the fund.
| The Growth Fund of America | 23 |
8. Capital share transactions
Capital share transactions in the fund were as follows (dollars and shares in thousands):
| | | Sales1 | | | Reinvestments of
dividends and distributions | | | Repurchases1 | | | Net increase
(decrease) |
| Share class | | Amount | | | Shares | | | Amount | | | Shares | | | Amount | | | Shares | | | Amount | | | Shares | |
| | | | | | | | | | | | | | | | | | | | | | | | | |
| Six months ended February 28, 2015 |
| |
| Class A | | $ | 2,531,396 | | | | 56,894 | | | $ | 6,497,797 | | | | 155,673 | | | $ | (4,389,460 | ) | | | (98,760 | ) | | $ | 4,639,733 | | | | 113,807 | |
| Class B | | | 3,446 | | | | 81 | | | | 66,738 | | | | 1,669 | | | | (202,904 | ) | | | (4,750 | ) | | | (132,720 | ) | | | (3,000 | ) |
| Class C | | | 314,247 | | | | 7,451 | | | | 531,474 | | | | 13,438 | | | | (741,377 | ) | | | (17,546 | ) | | | 104,344 | | | | 3,343 | |
| Class F-1 | | | 683,017 | | | | 15,435 | | | | 758,009 | | | | 18,257 | | | | (2,838,754 | ) | | | (61,945 | ) | | | (1,397,728 | ) | | | (28,253 | ) |
| Class F-2 | | | 2,843,529 | | | | 61,450 | | | | 935,000 | | | | 22,438 | | | | (1,026,205 | ) | | | (23,241 | ) | | | 2,752,324 | | | | 60,647 | |
| Class 529-A | | | 288,836 | | | | 6,559 | | | | 523,935 | | | | 12,649 | | | | (293,332 | ) | | | (6,644 | ) | | | 519,439 | | | | 12,564 | |
| Class 529-B | | | 995 | | | | 24 | | | | 12,435 | | | | 312 | | | | (35,657 | ) | | | (838 | ) | | | (22,227 | ) | | | (502 | ) |
| Class 529-C | | | 74,652 | | | | 1,765 | | | | 130,646 | | | | 3,289 | | | | (87,356 | ) | | | (2,064 | ) | | | 117,942 | | | | 2,990 | |
| Class 529-E | | | 12,690 | | | | 291 | | | | 23,130 | | | | 563 | | | | (16,688 | ) | | | (381 | ) | | | 19,132 | | | | 473 | |
| Class 529-F-1 | | | 20,009 | | | | 454 | | | | 18,675 | | | | 452 | | | | (16,493 | ) | | | (378 | ) | | | 22,191 | | | | 528 | |
| Class R-1 | | | 24,391 | | | | 567 | | | | 47,586 | | | | 1,189 | | | | (59,619 | ) | | | (1,402 | ) | | | 12,358 | | | | 354 | |
| Class R-2 | | | 207,120 | | | | 4,821 | | | | 216,483 | | | | 5,371 | | | | (347,567 | ) | | | (8,078 | ) | | | 76,036 | | | | 2,114 | |
| Class R-2E | | | 65 | | | | 2 | | | | — | | | | — | | | | — | | | | — | | | | 65 | | | | 2 | |
| Class R-3 | | | 544,316 | | | | 12,433 | | | | 706,137 | | | | 17,177 | | | | (1,151,265 | ) | | | (26,300 | ) | | | 99,188 | | | | 3,310 | |
| Class R-4 | | | 618,783 | | | | 13,953 | | | | 691,521 | | | | 16,687 | | | | (1,073,904 | ) | | | (24,297 | ) | | | 236,400 | | | | 6,343 | |
| Class R-5 | | | 422,809 | | | | 9,427 | | | | 496,393 | | | | 11,907 | | | | (866,376 | ) | | | (19,662 | ) | | | 52,826 | | | | 1,672 | |
| Class R-6 | | | 1,656,602 | | | | 37,706 | | | | 1,169,078 | | | | 28,009 | | | | (1,228,782 | ) | | | (27,845 | ) | | | 1,596,898 | | | | 37,870 | |
| Total net increase (decrease) | | $ | 10,246,903 | | | | 229,313 | | | $ | 12,825,037 | | | | 309,080 | | | $ | (14,375,739 | ) | | | (324,131 | ) | | $ | 8,696,201 | | | | 214,262 | |
| 24 | The Growth Fund of America |
| | | Sales1 | | | Reinvestments of
dividends and distributions | | | Repurchases1 | | | Net increase
(decrease) |
| Share class | | Amount | | | Shares | | | Amount | | | Shares | | | Amount | | | Shares | | | Amount | | | Shares | |
| | | | | | | | | | | | | | | | | | | | | | | | | |
| Year ended August 31, 2014 |
| |
| Class A | | $ | 4,872,369 | | | | 112,000 | | | $ | 4,400,188 | | | | 104,866 | | | $ | (8,746,833 | ) | | | (200,482 | ) | | $ | 525,724 | | | | 16,384 | |
| Class B | | | 11,914 | | | | 283 | | | | 72,274 | | | | 1,785 | | | | (539,076 | ) | | | (12,858 | ) | | | (454,888 | ) | | | (10,790 | ) |
| Class C | | | 589,215 | | | | 14,177 | | | | 395,280 | | | | 9,852 | | | | (1,669,594 | ) | | | (40,112 | ) | | | (685,099 | ) | | | (16,083 | ) |
| Class F-1 | | | 1,966,996 | | | | 45,494 | | | | 766,656 | | | | 18,385 | | | | (5,162,516 | ) | | | (117,797 | ) | | | (2,428,864 | ) | | | (53,918 | ) |
| Class F-2 | | | 4,197,627 | | | | 94,539 | | | | 336,879 | | | | 8,040 | | | | (1,163,863 | ) | | | (26,782 | ) | | | 3,370,643 | | | | 75,797 | |
| Class 529-A | | | 520,202 | | | | 12,020 | | | | 337,362 | | | | 8,098 | | | | (547,317 | ) | | | (12,568 | ) | | | 310,247 | | | | 7,550 | |
| Class 529-B | | | 2,827 | | | | 67 | | | | 12,374 | | | | 306 | | | | (79,301 | ) | | | (1,891 | ) | | | (64,100 | ) | | | (1,518 | ) |
| Class 529-C | | | 141,556 | | | | 3,384 | | | | 84,892 | | | | 2,107 | | | | (172,142 | ) | | | (4,094 | ) | | | 54,306 | | | | 1,397 | |
| Class 529-E | | | 22,555 | | | | 526 | | | | 15,192 | | | | 367 | | | | (29,542 | ) | | | (683 | ) | | | 8,205 | | | | 210 | |
| Class 529-F-1 | | | 33,200 | | | | 767 | | | | 11,729 | | | | 282 | | | | (29,923 | ) | | | (689 | ) | | | 15,006 | | | | 360 | |
| Class R-1 | | | 51,488 | | | | 1,227 | | | | 33,311 | | | | 822 | | | | (104,301 | ) | | | (2,481 | ) | | | (19,502 | ) | | | (432 | ) |
| Class R-2 | | | 408,882 | | | | 9,666 | | | | 155,043 | | | | 3,801 | | | | (711,243 | ) | | | (16,802 | ) | | | (147,318 | ) | | | (3,335 | ) |
| Class R-2E2 | | | 10 | | | | — | 3 | | | — | | | | — | | | | — | | | | — | | | | 10 | | | | — | 3 |
| Class R-3 | | | 1,103,363 | | | | 25,691 | | | | 517,551 | | | | 12,510 | | | | (2,337,394 | ) | | | (54,505 | ) | | | (716,480 | ) | | | (16,304 | ) |
| Class R-4 | | | 1,226,995 | | | | 28,344 | | | | 499,936 | | | | 11,995 | | | | (2,251,635 | ) | | | (52,055 | ) | | | (524,704 | ) | | | (11,716 | ) |
| Class R-5 | | | 832,003 | | | | 19,162 | | | | 378,067 | | | | 9,023 | | | | (1,890,849 | ) | | | (43,521 | ) | | | (680,779 | ) | | | (15,336 | ) |
| Class R-6 | | | 3,126,918 | | | | 71,442 | | | | 689,522 | | | | 16,437 | | | | (1,871,761 | ) | | | (42,841 | ) | | | 1,944,679 | | | | 45,038 | |
| Total net increase (decrease) | | $ | 19,108,120 | | | | 438,789 | | | $ | 8,706,256 | | | | 208,676 | | | $ | (27,307,290 | ) | | | (630,161 | ) | | $ | 507,086 | | | | 17,304 | |
1 Includes exchanges between share classes of the fund.
2 Class R-2E shares were offered beginning August 29, 2014.
3 Amount less than one thousand.
9. Investment transactions
The fund made purchases and sales of investment securities, excluding short-term securities and U.S. government obligations, if any, of $15,861,116,000 and $21,554,579,000, respectively, during the six months ended February 28, 2015.
| The Growth Fund of America | 25 |
Financial highlights
| | | | | | Income from investment operations1 | |
| | | Net asset
value,
beginning
of period | | | Net
investment
income
(loss) | | | Net gains
on securities
(both realized
and unrealized) | | | Total from
investment
operations | |
| Class A: | | | | | | | | | | | | | | | | |
| Six months ended 2/28/20154,5 | | $ | 46.70 | | | $ | .10 | | | $ | 1.93 | | | $ | 2.03 | |
| Year ended 8/31/2014 | | | 39.93 | | | | .17 | | | | 9.49 | | | | 9.66 | |
| Year ended 8/31/2013 | | | 32.80 | | | | .22 | | | | 7.19 | | | | 7.41 | |
| Year ended 8/31/2012 | | | 29.23 | | | | .20 | | | | 3.59 | | | | 3.79 | |
| Year ended 8/31/2011 | | | 25.53 | | | | .20 | | | | 3.75 | | | | 3.95 | |
| Year ended 8/31/2010 | | | 24.93 | | | | .21 | | | | .60 | | | | .81 | |
| Class B: | | | | | | | | | | | | | | | | |
| Six months ended 2/28/20154,5 | | | 44.84 | | | | (.07 | ) | | | 1.84 | | | | 1.77 | |
| Year ended 8/31/2014 | | | 38.60 | | | | (.15 | ) | | | 9.14 | | | | 8.99 | |
| Year ended 8/31/2013 | | | 31.69 | | | | (.05 | ) | | | 6.96 | | | | 6.91 | |
| Year ended 8/31/2012 | | | 28.23 | | | | (.03 | ) | | | 3.49 | | | | 3.46 | |
| Year ended 8/31/2011 | | | 24.65 | | | | (.03 | ) | | | 3.61 | | | | 3.58 | |
| Year ended 8/31/2010 | | | 24.08 | | | | — | 7 | | | .58 | | | | .58 | |
| Class C: | | | | | | | | | | | | | | | | |
| Six months ended 2/28/20154,5 | | | 44.41 | | | | (.08 | ) | | | 1.83 | | | | 1.75 | |
| Year ended 8/31/2014 | | | 38.27 | | | | (.17 | ) | | | 9.06 | | | | 8.89 | |
| Year ended 8/31/2013 | | | 31.44 | | | | (.07 | ) | | | 6.91 | | | | 6.84 | |
| Year ended 8/31/2012 | | | 28.02 | | | | (.04 | ) | | | 3.46 | | | | 3.42 | |
| Year ended 8/31/2011 | | | 24.49 | | | | (.03 | ) | | | 3.58 | | | | 3.55 | |
| Year ended 8/31/2010 | | | 23.96 | | | | — | 7 | | | .57 | | | | .57 | |
| Class F-1: | | | | | | | | | | | | | | | | |
| Six months ended 2/28/20154,5 | | | 46.40 | | | | .09 | | | | 1.92 | | | | 2.01 | |
| Year ended 8/31/2014 | | | 39.69 | | | | .15 | | | | 9.43 | | | | 9.58 | |
| Year ended 8/31/2013 | | | 32.61 | | | | .21 | | | | 7.15 | | | | 7.36 | |
| Year ended 8/31/2012 | | | 29.04 | | | | .21 | | | | 3.58 | | | | 3.79 | |
| Year ended 8/31/2011 | | | 25.37 | | | | .20 | | | | 3.72 | | | | 3.92 | |
| Year ended 8/31/2010 | | | 24.78 | | | | .21 | | | | .60 | | | | .81 | |
| Class F-2: | | | | | | | | | | | | | | | | |
| Six months ended 2/28/20154,5 | | | 46.71 | | | | .15 | | | | 1.93 | | | | 2.08 | |
| Year ended 8/31/2014 | | | 39.95 | | | | .27 | | | | 9.48 | | | | 9.75 | |
| Year ended 8/31/2013 | | | 32.83 | | | | .32 | | | | 7.19 | | | | 7.51 | |
| Year ended 8/31/2012 | | | 29.25 | | | | .28 | | | | 3.60 | | | | 3.88 | |
| Year ended 8/31/2011 | | | 25.55 | | | | .28 | | | | 3.74 | | | | 4.02 | |
| Year ended 8/31/2010 | | | 24.97 | | | | .28 | | | | .59 | | | | .87 | |
| Class 529-A: | | | | | | | | | | | | | | | | |
| Six months ended 2/28/20154,5 | | | 46.35 | | | | .08 | | | | 1.92 | | | | 2.00 | |
| Year ended 8/31/2014 | | | 39.66 | | | | .13 | | | | 9.42 | | | | 9.55 | |
| Year ended 8/31/2013 | | | 32.59 | | | | .19 | | | | 7.15 | | | | 7.34 | |
| Year ended 8/31/2012 | | | 29.06 | | | | .18 | | | | 3.57 | | | | 3.75 | |
| Year ended 8/31/2011 | | | 25.39 | | | | .19 | | | | 3.72 | | | | 3.91 | |
| Year ended 8/31/2010 | | | 24.81 | | | | .20 | | | | .59 | | | | .79 | |
| 26 | The Growth Fund of America |
| Dividends and distributions | | | | | | | | | | | | | | | | |
Dividends
(from net
investment
income) | | | Distributions
(from capital
gains) | | | Total
dividends
and
distributions | | | Net asset
value, end
of period | | | Total
return2,3 | | | Net assets,
end of period
(in millions) | | | Ratio of
expenses
to average
net assets | | | Ratio of net
income (loss)
to average
net assets | |
| | | | | | | | | | | | | | | | | | | | | | | |
| $ | (.17 | ) | | $ | (4.06 | ) | | $ | (4.23 | ) | | $ | 44.50 | | | | 4.93 | % | | $ | 75,553 | | | | .67 | %6 | | | .43 | %6 |
| | (.14 | ) | | | (2.75 | ) | | | (2.89 | ) | | | 46.70 | | | | 25.00 | | | | 73,975 | | | | .66 | | | | .39 | |
| | (.28 | ) | | | — | | | | (.28 | ) | | | 39.93 | | | | 22.74 | | | | 62,602 | | | | .70 | | | | .60 | |
| | (.22 | ) | | | — | | | | (.22 | ) | | | 32.80 | | | | 13.07 | | | | 55,441 | | | | .71 | | | | .66 | |
| | (.25 | ) | | | — | | | | (.25 | ) | | | 29.23 | | | | 15.42 | | | | 57,082 | | | | .68 | | | | .67 | |
| | (.21 | ) | | | — | | | | (.21 | ) | | | 25.53 | | | | 3.20 | | | | 57,890 | | | | .69 | | | | .76 | |
| | | | | | | | | | | | | | | | | | | | | | | | | | | | | | | |
| | — | | | | (4.06 | ) | | | (4.06 | ) | | | 42.55 | | | | 4.52 | | | | 701 | | | | 1.42 | 6 | | | (.32 | )6 |
| | — | | | | (2.75 | ) | | | (2.75 | ) | | | 44.84 | | | | 24.05 | | | | 873 | | | | 1.41 | | | | (.37 | ) |
| | — | | | | — | | | | — | | | | 38.60 | | | | 21.81 | | | | 1,168 | | | | 1.46 | | | | (.14 | ) |
| | — | | | | — | | | | — | | | | 31.69 | | | | 12.26 | | | | 1,503 | | | | 1.46 | | | | (.10 | ) |
| | — | | | | — | | | | — | | | | 28.23 | | | | 14.52 | | | | 2,228 | | | | 1.43 | | | | (.09 | ) |
| | (.01 | ) | | | — | | | | (.01 | ) | | | 24.65 | | | | 2.42 | | | | 2,911 | | | | 1.45 | | | | (.01 | ) |
| | | | | | | | | | | | | | | | | | | | | | | | | | | | | | | |
| | — | | | | (4.06 | ) | | | (4.06 | ) | | | 42.10 | | | | 4.52 | | | | 6,048 | | | | 1.46 | 6 | | | (.36 | )6 |
| | — | | | | (2.75 | ) | | | (2.75 | ) | | | 44.41 | | | | 23.99 | | | | 6,232 | | | | 1.45 | | | | (.41 | ) |
| | (.01 | ) | | | — | | | | (.01 | ) | | | 38.27 | | | | 21.76 | | | | 5,986 | | | | 1.50 | | | | (.20 | ) |
| | — | | | | — | | | | — | | | | 31.44 | | | | 12.21 | | | | 5,741 | | | | 1.49 | | | | (.13 | ) |
| | (.02 | ) | | | — | | | | (.02 | ) | | | 28.02 | | | | 14.51 | | | | 6,539 | | | | 1.46 | | | | (.12 | ) |
| | (.04 | ) | | | — | | | | (.04 | ) | | | 24.49 | | | | 2.38 | | | | 6,959 | | | | 1.47 | | | | (.02 | ) |
| | | | | | | | | | | | | | | | | | | | | | | | | | | | | | | |
| | (.10 | ) | | | (4.06 | ) | | | (4.16 | ) | | | 44.25 | | | | 4.91 | | | | 8,829 | | | | .71 | 6 | | | .39 | 6 |
| | (.12 | ) | | | (2.75 | ) | | | (2.87 | ) | | | 46.40 | | | | 24.93 | | | | 10,569 | | | | .69 | | | | .36 | |
| | (.28 | ) | | | — | | | | (.28 | ) | | | 39.69 | | | | 22.71 | | | | 11,180 | | | | .71 | | | | .59 | |
| | (.22 | ) | | | — | | | | (.22 | ) | | | 32.61 | | | | 13.15 | | | | 11,323 | | | | .68 | | | | .69 | |
| | (.25 | ) | | | — | | | | (.25 | ) | | | 29.04 | | | | 15.40 | | | | 13,023 | | | | .67 | | | | .67 | |
| | (.22 | ) | | | — | | | | (.22 | ) | | | 25.37 | | | | 3.22 | | | | 14,714 | | | | .67 | | | | .79 | |
| | | | | | | | | | | | | | | | | | | | | | | | | | | | | | | |
| | (.29 | ) | | | (4.06 | ) | | | (4.35 | ) | | | 44.44 | | | | 5.07 | | | | 10,911 | | | | .43 | 6 | | | .67 | 6 |
| | (.24 | ) | | | (2.75 | ) | | | (2.99 | ) | | | 46.71 | | | | 25.27 | | | | 8,637 | | | | .43 | | | | .62 | |
| | (.39 | ) | | | — | | | | (.39 | ) | | | 39.95 | | | | 23.05 | | | | 4,358 | | | | .44 | | | | .86 | |
| | (.30 | ) | | | — | | | | (.30 | ) | | | 32.83 | | | | 13.42 | | | | 2,855 | | | | .44 | | | | .93 | |
| | (.32 | ) | | | — | | | | (.32 | ) | | | 29.25 | | | | 15.69 | | | | 3,717 | | | | .43 | | | | .91 | |
| | (.29 | ) | | | — | | | | (.29 | ) | | | 25.55 | | | | 3.43 | | | | 3,884 | | | | .44 | | | | 1.02 | |
| | | | | | | | | | | | | | | | | | | | | | | | | | | | | | | |
| | (.14 | ) | | | (4.06 | ) | | | (4.20 | ) | | | 44.15 | | | | 4.89 | | | | 6,078 | | | | .75 | 6 | | | .35 | 6 |
| | (.11 | ) | | | (2.75 | ) | | | (2.86 | ) | | | 46.35 | | | | 24.89 | | | | 5,799 | | | | .74 | | | | .31 | |
| | (.27 | ) | | | — | | | | (.27 | ) | | | 39.66 | | | | 22.65 | | | | 4,663 | | | | .77 | | | | .52 | |
| | (.22 | ) | | | — | | | | (.22 | ) | | | 32.59 | | | | 13.00 | | | | 3,822 | | | | .77 | | | | .60 | |
| | (.24 | ) | | | — | | | | (.24 | ) | | | 29.06 | | | | 15.38 | | | | 3,358 | | | | .73 | | | | .62 | |
| | (.21 | ) | | | — | | | | (.21 | ) | | | 25.39 | | | | 3.14 | | | | 2,793 | | | | .73 | | | | .73 | |
See page 31 for footnotes.
| The Growth Fund of America | 27 |
Financial highlights (continued)
| | | | | | Income from investment operations1 | |
| | | Net asset
value,
beginning
of period | | | Net
investment
income
(loss) | | | Net gains
on securities
(both realized
and unrealized) | | | Total from
investment
operations | |
| Class 529-B: | | | | | | | | | | | | | | | | |
| Six months ended 2/28/20154,5 | | $ | 44.71 | | | $ | (.09 | ) | | $ | 1.84 | | | $ | 1.75 | |
| Year ended 8/31/2014 | | | 38.54 | | | | (.20 | ) | | | 9.12 | | | | 8.92 | |
| Year ended 8/31/2013 | | | 31.67 | | | | (.09 | ) | | | 6.96 | | | | 6.87 | |
| Year ended 8/31/2012 | | | 28.25 | | | | (.06 | ) | | | 3.48 | | | | 3.42 | |
| Year ended 8/31/2011 | | | 24.69 | | | | (.06 | ) | | | 3.62 | | | | 3.56 | |
| Year ended 8/31/2010 | | | 24.14 | | | | (.02 | ) | | | .59 | | | | .57 | |
| Class 529-C: | | | | | | | | | | | | | | | | |
| Six months ended 2/28/20154,5 | | | 44.58 | | | | (.09 | ) | | | 1.84 | | | | 1.75 | |
| Year ended 8/31/2014 | | | 38.43 | | | | (.20 | ) | | | 9.10 | | | | 8.90 | |
| Year ended 8/31/2013 | | | 31.60 | | | | (.09 | ) | | | 6.94 | | | | 6.85 | |
| Year ended 8/31/2012 | | | 28.18 | | | | (.06 | ) | | | 3.48 | | | | 3.42 | |
| Year ended 8/31/2011 | | | 24.66 | | | | (.05 | ) | | | 3.60 | | | | 3.55 | |
| Year ended 8/31/2010 | | | 24.13 | | | | (.02 | ) | | | .59 | | | | .57 | |
| Class 529-E: | | | | | | | | | | | | | | | | |
| Six months ended 2/28/20154,5 | | | 45.94 | | | | .02 | | | | 1.90 | | | | 1.92 | |
| Year ended 8/31/2014 | | | 39.34 | | | | .03 | | | | 9.33 | | | | 9.36 | |
| Year ended 8/31/2013 | | | 32.33 | | | | .10 | | | | 7.10 | | | | 7.20 | |
| Year ended 8/31/2012 | | | 28.82 | | | | .10 | | | | 3.54 | | | | 3.64 | |
| Year ended 8/31/2011 | | | 25.19 | | | | .10 | | | | 3.69 | | | | 3.79 | |
| Year ended 8/31/2010 | | | 24.63 | | | | .12 | | | | .59 | | | | .71 | |
| Class 529-F-1: | | | | | | | | | | | | | | | | |
| Six months ended 2/28/20154,5 | | | 46.33 | | | | .13 | | | | 1.90 | | | | 2.03 | |
| Year ended 8/31/2014 | | | 39.64 | | | | .23 | | | | 9.41 | | | | 9.64 | |
| Year ended 8/31/2013 | | | 32.57 | | | | .27 | | | | 7.14 | | | | 7.41 | |
| Year ended 8/31/2012 | | | 29.04 | | | | .25 | | | | 3.56 | | | | 3.81 | |
| Year ended 8/31/2011 | | | 25.38 | | | | .25 | | | | 3.71 | | | | 3.96 | |
| Year ended 8/31/2010 | | | 24.79 | | | | .25 | | | | .60 | | | | .85 | |
| Class R-1: | | | | | | | | | | | | | | | | |
| Six months ended 2/28/20154,5 | | | 44.88 | | | | (.07 | ) | | | 1.85 | | | | 1.78 | |
| Year ended 8/31/2014 | | | 38.64 | | | | (.16 | ) | | | 9.15 | | | | 8.99 | |
| Year ended 8/31/2013 | | | 31.72 | | | | (.05 | ) | | | 6.98 | | | | 6.93 | |
| Year ended 8/31/2012 | | | 28.26 | | | | (.02 | ) | | | 3.48 | | | | 3.46 | |
| Year ended 8/31/2011 | | | 24.72 | | | | (.03 | ) | | | 3.63 | | | | 3.60 | |
| Year ended 8/31/2010 | | | 24.19 | | | | — | 7 | | | .60 | | | | .60 | |
| Class R-2: | | | | | | | | | | | | | | | | |
| Six months ended 2/28/20154,5 | | | 45.17 | | | | (.06 | ) | | | 1.86 | | | | 1.80 | |
| Year ended 8/31/2014 | | | 38.85 | | | | (.14 | ) | | | 9.21 | | | | 9.07 | |
| Year ended 8/31/2013 | | | 31.91 | | | | (.02 | ) | | | 7.01 | | | | 6.99 | |
| Year ended 8/31/2012 | | | 28.42 | | | | (.01 | ) | | | 3.50 | | | | 3.49 | |
| Year ended 8/31/2011 | | | 24.84 | | | | (.01 | ) | | | 3.64 | | | | 3.63 | |
| Year ended 8/31/2010 | | | 24.30 | | | | .01 | | | | .59 | | | | .60 | |
| 28 | The Growth Fund of America |
| Dividends and distributions | | | | | | | | | | | | | | | | |
Dividends
(from net
investment
income) | | | Distributions
(from capital
gains) | | | Total
dividends
and
distributions | | | Net asset
value, end
of period | | | Total
return2,3 | | | Net assets,
end of period
(in millions) | | | Ratio of
expenses
to average
net assets | | | Ratio of net
income (loss)
to average
net assets | |
| | | | | | | | | | | | | | | | | | | | | | | |
| $ | — | | | $ | (4.06 | ) | | $ | (4.06 | ) | | $ | 42.40 | | | | 4.49 | % | | $ | 129 | | | | 1.54 | %6 | | | (.44 | )%6 |
| | — | | | | (2.75 | ) | | | (2.75 | ) | | | 44.71 | | | | 23.90 | | | | 159 | | | | 1.53 | | | | (.49 | ) |
| | — | | | | — | | | | — | | | | 38.54 | | | | 21.69 | | | | 195 | | | | 1.56 | | | | (.25 | ) |
| | — | | | | — | | | | — | | | | 31.67 | | | | 12.11 | | | | 237 | | | | 1.57 | | | | (.21 | ) |
| | — | | | | — | | | | — | | | | 28.25 | | | | 14.42 | | | | 310 | | | | 1.53 | | | | (.19 | ) |
| | (.02 | ) | | | — | | | | (.02 | ) | | | 24.69 | | | | 2.36 | | | | 358 | | | | 1.53 | | | | (.08 | ) |
| | | | | | | | | | | | | | | | | | | | | | | | | | | | | | | |
| | — | | | | (4.06 | ) | | | (4.06 | ) | | | 42.27 | | | | 4.50 | | | | 1,492 | | | | 1.52 | 6 | | | (.42 | )6 |
| | — | | | | (2.75 | ) | | | (2.75 | ) | | | 44.58 | | | | 23.91 | | | | 1,440 | | | | 1.52 | | | | (.47 | ) |
| | (.02 | ) | | | — | | | | (.02 | ) | | | 38.43 | | | | 21.69 | | | | 1,188 | | | | 1.56 | | | | (.26 | ) |
| | — | | | | — | | | | — | | | | 31.60 | | | | 12.14 | | | | 1,008 | | | | 1.56 | | | | (.19 | ) |
| | (.03 | ) | | | — | | | | (.03 | ) | | | 28.18 | | | | 14.40 | | | | 934 | | | | 1.53 | | | | (.18 | ) |
| | (.04 | ) | | | — | | | | (.04 | ) | | | 24.66 | | | | 2.33 | | | | 811 | | | | 1.53 | | | | (.07 | ) |
| | | | | | | | | | | | | | | | | | | | | | | | | | | | | | | |
| | (.02 | ) | | | (4.06 | ) | | | (4.08 | ) | | | 43.78 | | | | 4.76 | | | | 272 | | | | .99 | 6 | | | .11 | 6 |
| | (.01 | ) | | | (2.75 | ) | | | (2.76 | ) | | | 45.94 | | | | 24.57 | | | | 263 | | | | .99 | | | | .06 | |
| | (.19 | ) | | | — | | | | (.19 | ) | | | 39.34 | | | | 22.36 | | | | 217 | | | | 1.02 | | | | .28 | |
| | (.13 | ) | | | — | | | | (.13 | ) | | | 32.33 | | | | 12.71 | | | | 182 | | | | 1.03 | | | | .35 | |
| | (.16 | ) | | | — | | | | (.16 | ) | | | 28.82 | | | | 15.04 | | | | 165 | | | | 1.01 | | | | .34 | |
| | (.15 | ) | | | — | | | | (.15 | ) | | | 25.19 | | | | 2.83 | | | | 142 | | | | 1.02 | | | | .44 | |
| | | | | | | | | | | | | | | | | | | | | | | | | | | | | | | |
| | (.23 | ) | | | (4.06 | ) | | | (4.29 | ) | | | 44.07 | | | | 5.00 | | | | 213 | | | | .52 | 6 | | | .57 | 6 |
| | (.20 | ) | | | (2.75 | ) | | | (2.95 | ) | | | 46.33 | | | | 25.16 | | | | 200 | | | | .52 | | | | .53 | |
| | (.34 | ) | | | — | | | | (.34 | ) | | | 39.64 | | | | 22.92 | | | | 157 | | | | .56 | | | | .74 | |
| | (.28 | ) | | | — | | | | (.28 | ) | | | 32.57 | | | | 13.27 | | | | 125 | | | | .56 | | | | .81 | |
| | (.30 | ) | | | — | | | | (.30 | ) | | | 29.04 | | | | 15.56 | | | | 106 | | | | .52 | | | | .83 | |
| | (.26 | ) | | | — | | | | (.26 | ) | | | 25.38 | | | | 3.37 | | | | 92 | | | | .52 | | | | .94 | |
| | | | | | | | | | | | | | | | | | | | | | | | | | | | | | | |
| | — | | | | (4.06 | ) | | | (4.06 | ) | | | 42.60 | | | | 4.54 | | | | 530 | | | | 1.42 | 6 | | | (.32 | )6 |
| | — | | | | (2.75 | ) | | | (2.75 | ) | | | 44.88 | | | | 24.02 | | | | 542 | | | | 1.43 | | | | (.38 | ) |
| | (.01 | ) | | | — | | | | (.01 | ) | | | 38.64 | | | | 21.86 | | | | 483 | | | | 1.44 | | | | (.13 | ) |
| | — | | | | — | | | | — | | | | 31.72 | | | | 12.24 | | | | 497 | | | | 1.44 | | | | (.07 | ) |
| | (.06 | ) | | | — | | | | (.06 | ) | | | 28.26 | | | | 14.54 | | | | 561 | | | | 1.43 | | | | (.09 | ) |
| | (.07 | ) | | | — | | | | (.07 | ) | | | 24.72 | | | | 2.45 | | | | 539 | | | | 1.44 | | | | .02 | |
| | | | | | | | | | | | | | | | | | | | | | | | | | | | | | | |
| | — | | | | (4.06 | ) | | | (4.06 | ) | | | 42.91 | | | | 4.58 | | | | 2,462 | | | | 1.36 | 6 | | | (.26 | )6 |
| | — | | | | (2.75 | ) | | | (2.75 | ) | | | 45.17 | | | | 24.10 | | | | 2,496 | | | | 1.38 | | | | (.33 | ) |
| | (.05 | ) | | | — | | | | (.05 | ) | | | 38.85 | | | | 21.92 | | | | 2,277 | | | | 1.37 | | | | (.07 | ) |
| | — | | | | — | | | | — | | | | 31.91 | | | | 12.28 | | | | 2,182 | | | | 1.41 | | | | (.04 | ) |
| | (.05 | ) | | | — | | | | (.05 | ) | | | 28.42 | | | | 14.60 | | | | 2,337 | | | | 1.39 | | | | (.04 | ) |
| | (.06 | ) | | | — | | | | (.06 | ) | | | 24.84 | | | | 2.44 | | | | 2,327 | | | | 1.41 | | | | .04 | |
See page 31 for footnotes.
| The Growth Fund of America | 29 |
Financial highlights (continued)
| | | | | | Income from investment operations1 | |
| | | Net asset
value,
beginning
of period | | | Net
investment
income
(loss) | | | Net gains
on securities
(both realized
and unrealized) | | | Total from
investment
operations | |
| Class R-2E: | | | | | | | | | | | | | | | | |
| Six months ended 2/28/20154,5 | | $ | 46.70 | | | $ | .03 | | | $ | 1.98 | | | $ | 2.01 | |
| Period from 8/29/2014 to 8/31/20145,10 | | | 46.70 | | | | — | | | | — | | | | — | |
| Class R-3: | | | | | | | | | | | | | | | | |
| Six months ended 2/28/20154,5 | | | 45.94 | | | | .03 | | | | 1.90 | | | | 1.93 | |
| Year ended 8/31/2014 | | | 39.33 | | | | .03 | | | | 9.34 | | | | 9.37 | |
| Year ended 8/31/2013 | | | 32.29 | | | | .12 | | | | 7.08 | | | | 7.20 | |
| Year ended 8/31/2012 | | | 28.74 | | | | .11 | | | | 3.55 | | | | 3.66 | |
| Year ended 8/31/2011 | | | 25.12 | | | | .11 | | | | 3.68 | | | | 3.79 | |
| Year ended 8/31/2010 | | | 24.55 | | | | .13 | | | | .60 | | | | .73 | |
| Class R-4: | | | | | | | | | | | | | | | | |
| Six months ended 2/28/20154,5 | | | 46.38 | | | | .09 | | | | 1.92 | | | | 2.01 | |
| Year ended 8/31/2014 | | | 39.68 | | | | .16 | | | | 9.42 | | | | 9.58 | |
| Year ended 8/31/2013 | | | 32.56 | | | | .23 | | | | 7.14 | | | | 7.37 | |
| Year ended 8/31/2012 | | | 28.99 | | | | .20 | | | | 3.57 | | | | 3.77 | |
| Year ended 8/31/2011 | | | 25.33 | | | | .20 | | | | 3.71 | | | | 3.91 | |
| Year ended 8/31/2010 | | | 24.75 | | | | .21 | | | | .60 | | | | .81 | |
| Class R-5: | | | | | | | | | | | | | | | | |
| Six months ended 2/28/20154,5 | | | 46.73 | | | | .16 | | | | 1.93 | | | | 2.09 | |
| Year ended 8/31/2014 | | | 39.96 | | | | .29 | | | | 9.49 | | | | 9.78 | |
| Year ended 8/31/2013 | | | 32.82 | | | | .34 | | | | 7.18 | | | | 7.52 | |
| Year ended 8/31/2012 | | | 29.24 | | | | .29 | | | | 3.60 | | | | 3.89 | |
| Year ended 8/31/2011 | | | 25.54 | | | | .29 | | | | 3.74 | | | | 4.03 | |
| Year ended 8/31/2010 | | | 24.94 | | | | .29 | | | | .60 | | | | .89 | |
| Class R-6: | | | | | | | | | | | | | | | | |
| Six months ended 2/28/20154,5 | | | 46.80 | | | | .17 | | | | 1.94 | | | | 2.11 | |
| Year ended 8/31/2014 | | | 40.02 | | | | .31 | | | | 9.50 | | | | 9.81 | |
| Year ended 8/31/2013 | | | 32.87 | | | | .35 | | | | 7.21 | | | | 7.56 | |
| Year ended 8/31/2012 | | | 29.30 | | | | .31 | | | | 3.60 | | | | 3.91 | |
| Year ended 8/31/2011 | | | 25.60 | | | | .31 | | | | 3.74 | | | | 4.05 | |
| Year ended 8/31/2010 | | | 24.97 | | | | .31 | | | | .60 | | | | .91 | |
| | | Six months
ended
February 28, | | Year ended August 31 |
| | | 20152, 4, 5 | | 2014 | | 2013 | | 2012 | | 2011 | | 2010 |
| Portfolio turnover rate for all share classes | | | 12 | % | | | 26% | | | | 27% | | | | 18% | | | | 34% | | | | 33% | |
See Notes to Financial Statements
| 30 | The Growth Fund of America |
| Dividends and distributions | | | | | | | | | | | | | | | | |
Dividends
(from net
investment
income) | | | Distributions
(from capital
gains) | | | Total
dividends
and
distributions | | | Net asset
value, end
of period | | | Total
return2,3 | | | Net assets,
end of period
(in millions) | | | Ratio of
expenses
to average
net assets | | | Ratio of net
income (loss)
to average
net assets | |
| | | | | | | | | | | | | | | | | | | | | | | |
| $ | (.30 | ) | | $ | (4.06 | ) | | $ | (4.36 | ) | | $ | 44.35 | | | | 4.90 | %8 | | $ | — | 9 | | | .92 | %6,8 | | | .14 | %6,8 |
| | — | | | | — | | | | — | | | | 46.70 | | | | .00 | | | | — | 9 | | | — | | | | — | |
| | | | | | | | | | | | | | | | | | | | | | | | | | | | | | | |
| | (.01 | ) | | | (4.06 | ) | | | (4.07 | ) | | | 43.80 | | | | 4.78 | | | | 8,082 | | | | .97 | 6 | | | .13 | 6 |
| | (.01 | ) | | | (2.75 | ) | | | (2.76 | ) | | | 45.94 | | | | 24.60 | | | | 8,325 | | | | .98 | | | | .07 | |
| | (.16 | ) | | | — | | | | (.16 | ) | | | 39.33 | | | | 22.38 | | | | 7,769 | | | | .98 | | | | .33 | |
| | (.11 | ) | | | — | | | | (.11 | ) | | | 32.29 | | | | 12.78 | | | | 7,916 | | | | .98 | | | | .38 | |
| | (.17 | ) | | | — | | | | (.17 | ) | | | 28.74 | | | | 15.06 | | | | 10,765 | | | | .97 | | | | .38 | |
| | (.16 | ) | | | — | | | | (.16 | ) | | | 25.12 | | | | 2.94 | | | | 11,422 | | | | .97 | | | | .48 | |
| | | | | | | | | | | | | | | | | | | | | | | | | | | | | | | |
| | (.15 | ) | | | (4.06 | ) | | | (4.21 | ) | | | 44.18 | | | | 4.93 | | | | 7,744 | | | | .67 | 6 | | | .42 | 6 |
| | (.13 | ) | | | (2.75 | ) | | | (2.88 | ) | | | 46.38 | | | | 24.97 | | | | 7,835 | | | | .68 | | | | .37 | |
| | (.25 | ) | | | — | | | | (.25 | ) | | | 39.68 | | | | 22.77 | | | | 7,169 | | | | .68 | | | | .63 | |
| | (.20 | ) | | | — | | | | (.20 | ) | | | 32.56 | | | | 13.10 | | | | 8,093 | | | | .69 | | | | .66 | |
| | (.25 | ) | | | — | | | | (.25 | ) | | | 28.99 | | | | 15.40 | | | | 14,937 | | | | .68 | | | | .66 | |
| | (.23 | ) | | | — | | | | (.23 | ) | | | 25.33 | | | | 3.20 | | | | 16,442 | | | | .68 | | | | .77 | |
| | | | | | | | | | | | | | | | | | | | | | | | | | | | | | | |
| | (.29 | ) | | | (4.06 | ) | | | (4.35 | ) | | | 44.47 | | | | 5.09 | | | | 5,260 | | | | .38 | 6 | | | .72 | 6 |
| | (.26 | ) | | | (2.75 | ) | | | (3.01 | ) | | | 46.73 | | | | 25.33 | | | | 5,450 | | | | .38 | | | | .67 | |
| | (.38 | ) | | | — | | | | (.38 | ) | | | 39.96 | | | | 23.11 | | | | 5,273 | | | | .39 | | | | .92 | |
| | (.31 | ) | | | — | | | | (.31 | ) | | | 32.82 | | | | 13.48 | | | | 6,312 | | | | .39 | | | | .97 | |
| | (.33 | ) | | | — | | | | (.33 | ) | | | 29.24 | | | | 15.75 | | | | 11,366 | | | | .38 | | | | .96 | |
| | (.29 | ) | | | — | | | | (.29 | ) | | | 25.54 | | | | 3.51 | | | | 12,874 | | | | .39 | | | | 1.07 | |
| | | | | | | | | | | | | | | | | | | | | | | | | | | | | | | |
| | (.32 | ) | | | (4.06 | ) | | | (4.38 | ) | | | 44.53 | | | | 5.12 | | | | 13,489 | | | | .34 | 6 | | | .76 | 6 |
| | (.28 | ) | | | (2.75 | ) | | | (3.03 | ) | | | 46.80 | | | | 25.39 | | | | 12,407 | | | | .33 | | | | .72 | |
| | (.41 | ) | | | — | | | | (.41 | ) | | | 40.02 | | | | 23.19 | | | | 8,806 | | | | .34 | | | | .96 | |
| | (.34 | ) | | | — | | | | (.34 | ) | | | 32.87 | | | | 13.52 | | | | 7,537 | | | | .34 | | | | 1.02 | |
| | (.35 | ) | | | — | | | | (.35 | ) | | | 29.30 | | | | 15.78 | | | | 10,059 | | | | .33 | | | | 1.02 | |
| | (.28 | ) | | | — | | | | (.28 | ) | | | 25.60 | | | | 3.58 | | | | 6,061 | | | | .34 | | | | 1.16 | |
| 1 | Based on average shares outstanding. |
| 2 | Not annualized. |
| 3 | Total returns exclude any applicable sales charges, including contingent deferred sales charges. |
| 4 | Unaudited. |
| 5 | Based on operations for the period shown and, accordingly, is not representative of a full year. |
| 6 | Annualized. |
| 7 | Amount less than $.01. |
| 8 | Although the fund has a plan of distribution for Class R-2E shares, fees for distribution services are not paid by the fund on accounts for which a broker-dealer (or other financial intermediary) has not been assigned, including amounts invested in the fund by CRMC and/or its affiliates. If fees for distribution services were charged on these assets, fund expenses would be higher and net income and total return would be lower. |
| 9 | Amount less than $1 million. |
| 10 | Class R-2E shares were offered beginning August 29, 2014. |
| The Growth Fund of America | 31 |
As a fund shareholder, you incur two types of costs: (1) transaction costs, such as initial sales charges on purchase payments and contingent deferred sales charges on redemptions (loads), and (2) ongoing costs, including management fees, distribution and service (12b-1) fees, and other expenses. This example is intended to help you understand your ongoing costs (in dollars) of investing in the fund so you can compare these costs with the ongoing costs of investing in other mutual funds. The example is based on an investment of $1,000 invested at the beginning of the period and held for the entire six-month period (September 1, 2014, through February 28, 2015).
Actual expenses:
The first line of each share class in the table on the following page provides information about actual account values and actual expenses. You may use the information in this line, together with the amount you invested, to estimate the expenses that you paid over the period. Simply divide your account value by $1,000 (for example, an $8,600 account value divided by $1,000 = 8.6), then multiply the result by the number in the first line under the heading entitled “Expenses paid during period” to estimate the expenses you paid on your account during this period.
Hypothetical example for comparison purposes:
The second line of each share class in the table on the following page provides information about hypothetical account values and hypothetical expenses based on the actual expense ratio for the share class and an assumed rate of return of 5.00% per year before expenses, which is not the actual return of the share class. The hypothetical account values and expenses may not be used to estimate the actual ending account balance or expenses you paid for the period. You may use this information to compare the ongoing costs of investing in the fund and other funds. To do so, compare this 5.00% hypothetical example with the 5.00% hypothetical examples that appear in the shareholder reports of the other funds.
Notes:
Retirement plan participants may be subject to certain fees charged by the plan sponsor, and Class F-1, F-2 and 529-F-1 shareholders may be subject to fees charged by financial intermediaries, typically ranging from 0.75% to 1.50% of assets annually depending on services offered. You can estimate the impact of these fees by adding the amount of the fees to the total estimated expenses you paid on your account during the period as calculated above. In addition, your ending account value would be lower by the amount of these fees.
Note that the expenses shown in the table on the following page are meant to highlight your ongoing costs only and do not reflect any transactional costs, such as sales charges (loads). Therefore, the second line of each share class in the table is useful in comparing ongoing costs only and will not help you determine the relative total costs of owning different funds. In addition, if these transactional costs were included, your costs would have been higher.
| 32 | The Growth Fund of America |
| | | Beginning
account value
9/1/2014 | | | Ending
account value
2/28/2015 | | | Expenses paid
during period* | | | Annualized
expense ratio | |
| Class A - actual return | | $ | 1,000.00 | | | $ | 1,049.31 | | | $ | 3.40 | | | | .67 | % |
| Class A - assumed 5% return | | | 1,000.00 | | | | 1,021.47 | | | | 3.36 | | | | .67 | |
| Class B - actual return | | | 1,000.00 | | | | 1,045.24 | | | | 7.20 | | | | 1.42 | |
| Class B - assumed 5% return | | | 1,000.00 | | | | 1,017.75 | | | | 7.10 | | | | 1.42 | |
| Class C - actual return | | | 1,000.00 | | | | 1,045.22 | | | | 7.40 | | | | 1.46 | |
| Class C - assumed 5% return | | | 1,000.00 | | | | 1,017.55 | | | | 7.30 | | | | 1.46 | |
| Class F-1 - actual return | | | 1,000.00 | | | | 1,049.12 | | | | 3.61 | | | | .71 | |
| Class F-1 - assumed 5% return | | | 1,000.00 | | | | 1,021.27 | | | | 3.56 | | | | .71 | |
| Class F-2 - actual return | | | 1,000.00 | | | | 1,050.69 | | | | 2.19 | | | | .43 | |
| Class F-2 - assumed 5% return | | | 1,000.00 | | | | 1,022.66 | | | | 2.16 | | | | .43 | |
| Class 529-A - actual return | | | 1,000.00 | | | | 1,048.92 | | | | 3.81 | | | | .75 | |
| Class 529-A - assumed 5% return | | | 1,000.00 | | | | 1,021.08 | | | | 3.76 | | | | .75 | |
| Class 529-B - actual return | | | 1,000.00 | | | | 1,044.91 | | | | 7.81 | | | | 1.54 | |
| Class 529-B - assumed 5% return | | | 1,000.00 | | | | 1,017.16 | | | | 7.70 | | | | 1.54 | |
| Class 529-C - actual return | | | 1,000.00 | | | | 1,045.04 | | | | 7.71 | | | | 1.52 | |
| Class 529-C - assumed 5% return | | | 1,000.00 | | | | 1,017.26 | | | | 7.60 | | | | 1.52 | |
| Class 529-E - actual return | | | 1,000.00 | | | | 1,047.61 | | | | 5.03 | | | | .99 | |
| Class 529-E - assumed 5% return | | | 1,000.00 | | | | 1,019.89 | | | | 4.96 | | | | .99 | |
| Class 529-F-1 - actual return | | | 1,000.00 | | | | 1,049.97 | | | | 2.64 | | | | .52 | |
| Class 529-F-1 - assumed 5% return | | | 1,000.00 | | | | 1,022.22 | | | | 2.61 | | | | .52 | |
| Class R-1 - actual return | | | 1,000.00 | | | | 1,045.45 | | | | 7.20 | | | | 1.42 | |
| Class R-1 - assumed 5% return | | | 1,000.00 | | | | 1,017.75 | | | | 7.10 | | | | 1.42 | |
| Class R-2 - actual return | | | 1,000.00 | | | | 1,045.83 | | | | 6.90 | | | | 1.36 | |
| Class R-2 - assumed 5% return | | | 1,000.00 | | | | 1,018.05 | | | | 6.80 | | | | 1.36 | |
| Class R-2E - actual return | | | 1,000.00 | | | | 1,048.97 | | | | 4.67 | | | | .92 | |
| Class R-2E - assumed 5% return | | | 1,000.00 | | | | 1,020.23 | | | | 4.61 | | | | .92 | |
| Class R-3 - actual return | | | 1,000.00 | | | | 1,047.83 | | | | 4.93 | | | | .97 | |
| Class R-3 - assumed 5% return | | | 1,000.00 | | | | 1,019.98 | | | | 4.86 | | | | .97 | |
| Class R-4 - actual return | | | 1,000.00 | | | | 1,049.32 | | | | 3.40 | | | | .67 | |
| Class R-4 - assumed 5% return | | | 1,000.00 | | | | 1,021.47 | | | | 3.36 | | | | .67 | |
| Class R-5 - actual return | | | 1,000.00 | | | | 1,050.92 | | | | 1.93 | | | | .38 | |
| Class R-5 - assumed 5% return | | | 1,000.00 | | | | 1,022.91 | | | | 1.91 | | | | .38 | |
| Class R-6 - actual return | | | 1,000.00 | | | | 1,051.22 | | | | 1.73 | | | | .34 | |
| Class R-6 - assumed 5% return | | | 1,000.00 | | | | 1,023.11 | | | | 1.71 | | | | .34 | |
| * | The “expenses paid during period” are equal to the “annualized expense ratio,” multiplied by the average account value over the period, multiplied by the number of days in the period, and divided by 365 (to reflect the one-half year period). |
| The Growth Fund of America | 33 |
This page was intentionally left blank.
| 34 | The Growth Fund of America |
This page was intentionally left blank.
| The Growth Fund of America | 35 |
Office of the fund
One Market
Steuart Tower, Suite 2000
San Francisco, CA 94105-1409
Investment adviser
Capital Research and Management Company
333 South Hope Street
Los Angeles, CA 90071-1406
6455 Irvine Center Drive
Irvine, CA 92618-4518
Transfer agent for shareholder accounts
American Funds Service Company
(Write to the address near you.)
P.O. Box 6007
Indianapolis, IN 46206-6007
P.O. Box 2280
Norfolk, VA 23501-2280
Custodian of assets
State Street Bank and Trust Company
One Lincoln Street
Boston, MA 02111
Counsel
K&L Gates LLP
Four Embarcadero Center, Suite 1200
San Francisco, CA 94111-5994
Independent registered public accounting firm
Deloitte & Touche LLP
695 Town Center Drive
Suite 1200
Costa Mesa, CA 92626-7188
Principal underwriter
American Funds Distributors, Inc.
333 South Hope Street
Los Angeles, CA 90071-1406
| 36 | The Growth Fund of America |
Investors should carefully consider investment objectives, risks, charges and expenses. This and other important information is contained in the fund prospectus and summary prospectus, which can be obtained from your financial professional and should be read carefully before investing. You may also call American Funds Service Company (AFS) at (800) 421-4225 or visit the American Funds website at americanfunds.com.
“American Funds Proxy Voting Procedures and Principles” — which describes how we vote proxies relating to portfolio securities — is available on the American Funds website or upon request by calling AFS. The fund files its proxy voting record with the U.S. Securities and Exchange Commission (SEC) for the 12 months ended June 30 by August 31. The proxy voting record is available free of charge on the SEC website at sec.gov and on the American Funds website.
A complete February 28, 2015, portfolio of The Growth Fund of America’s investments is available free of charge by calling AFS or visiting the SEC website (where it is part of Form N-CSR).
The Growth Fund of America files a complete list of its portfolio holdings with the SEC for the first and third quarters of each fiscal year on Form N-Q. This filing is available free of charge on the SEC website. You may also review or, for a fee, copy this filing at the SEC’s Public Reference Room in Washington, D.C. Additional information regarding the operation of the Public Reference Room may be obtained by calling the SEC’s Office of Investor Education and Advocacy at (800) SEC-0330. Additionally, the list of portfolio holdings is available by calling AFS.
This report is for the information of shareholders of The Growth Fund of America, but it also may be used as sales literature when preceded or accompanied by the current prospectus or summary prospectus, which gives details about charges, expenses, investment objectives and operating policies of the fund. If used as sales material after June 30, 2015, this report must be accompanied by an American Funds statistical update for the most recently completed calendar quarter.
The American Funds Advantage
Since 1931, American Funds, part of Capital Group, has helped investors pursue long-term investment success. Our consistent approach — in combination with The Capital SystemSM — has resulted in a superior long-term track record.
| | Aligned with investor success |
| | We base our decisions on a long-term perspective, which we believe aligns our goals with the interests of our clients. Our portfolio managers average 27 years of investment experience, including 22 years at our company, reflecting a career commitment to our long-term approach.1 |
| | |
| | The Capital SystemSM |
| | Our investment process, The Capital System, combines individual accountability with teamwork. Each fund is divided into portions that are managed independently by investment professionals with diverse backgrounds, ages and investment approaches. An extensive global research effort is the backbone of our system. |
| | |
| | Superior long-term track record |
| | Our equity funds have beaten their Lipper peer indexes in 91% of 10-year periods and 96% of 20-year periods. Our fixed-income funds have beaten their Lipper indexes in 54% of 10-year periods and 57% of 20-year periods.2 Our fund management fees have been among the lowest in the industry.3 |
| | 1 | Portfolio manager experience as of December 31, 2014. |
| | 2 | Based on Class A share results for rolling periods through December 31, 2014. Periods covered are the shorter of the fund’s lifetime or since the comparable Lipper index inception date (except SMALLCAP World Fund, for which the Lipper average was used). |
| | 3 | On average, our management fees were in the lowest quintile 70% of the time, based on the 20-year period ended December 31, 2014, versus comparable Lipper categories, excluding funds of funds. |

ITEM 2 – Code of Ethics
Not applicable for filing of semi-annual reports to shareholders.
ITEM 3 – Audit Committee Financial Expert
Not applicable for filing of semi-annual reports to shareholders.
ITEM 4 – Principal Accountant Fees and Services
Not applicable for filing of semi-annual reports to shareholders.
ITEM 5 – Audit Committee of Listed Registrants
Not applicable to this Registrant, insofar as the Registrant is not a listed issuer as defined in Rule 10A-3 under the Securities Exchange Act of 1934.
ITEM 6 – Schedule of Investments
The Growth Fund of America®
Investment portfolio
February 28, 2015
Common stocks 91.15%
Information technology 20.87% | Shares | Value
(000) |
| Google Inc., Class C1 | 4,521,797 | $2,524,972 |
| Google Inc., Class A1 | 3,766,097 | 2,118,919 |
| Avago Technologies Ltd.2 | 17,407,082 | 2,221,492 |
| Microsoft Corp. | 41,077,600 | 1,801,253 |
| Oracle Corp. | 38,797,000 | 1,700,084 |
| Visa Inc., Class A | 5,648,000 | 1,532,359 |
| ASML Holding NV (New York registered) | 8,767,040 | 944,035 |
| ASML Holding NV | 5,109,442 | 552,389 |
| Texas Instruments Inc. | 18,520,100 | 1,088,982 |
| salesforce.com, inc.1 | 14,927,697 | 1,035,684 |
| Intuit Inc. | 10,195,000 | 995,338 |
| LinkedIn Corp., Class A1 | 3,432,500 | 917,164 |
| Accenture PLC, Class A | 10,000,000 | 900,300 |
| Apple Inc. | 6,776,213 | 870,472 |
| Adobe Systems Inc.1 | 8,672,800 | 686,018 |
| Taiwan Semiconductor Manufacturing Co. Ltd. | 96,121,000 | 460,634 |
| Taiwan Semiconductor Manufacturing Co. Ltd. (ADR) | 4,160,000 | 102,045 |
| Palo Alto Networks, Inc.1 | 3,803,400 | 540,920 |
| Murata Manufacturing Co., Ltd. | 4,174,300 | 514,525 |
| EMC Corp. | 16,120,000 | 466,513 |
| TE Connectivity Ltd. | 6,223,000 | 448,865 |
| Yahoo! Inc.1 | 10,025,000 | 443,907 |
| Cognizant Technology Solutions Corp., Class A1 | 6,692,000 | 418,150 |
| Freescale Semiconductor, Ltd.1 | 10,755,500 | 388,381 |
| Qorvo, Inc.1 | 5,336,243 | 370,335 |
| Cisco Systems, Inc. | 11,780,500 | 347,643 |
| FireEye, Inc.1 | 7,486,250 | 331,416 |
| Amphenol Corp., Class A | 5,854,500 | 330,545 |
| MasterCard Inc., Class A | 3,650,000 | 328,974 |
| Nintendo Co., Ltd. | 3,064,940 | 327,439 |
| First Data Holdings, Inc., Class B1,3,4 | 56,250,000 | 322,875 |
| Autodesk, Inc.1 | 4,930,000 | 316,703 |
| VeriSign, Inc.1 | 4,745,000 | 303,775 |
| Hewlett-Packard Co. | 8,500,000 | 296,140 |
| Baidu, Inc., Class A (ADR)1 | 1,425,000 | 290,344 |
| Altera Corp. | 7,750,000 | 286,827 |
| Motorola Solutions, Inc. | 4,142,300 | 281,428 |
| Hexagon AB, Class B | 7,041,102 | 254,297 |
| KLA-Tencor Corp. | 3,750,000 | 243,581 |
| Facebook, Inc., Class A1 | 3,000,000 | 236,910 |
| Samsung SDI Co., Ltd. | 1,650,000 | 205,207 |
| NetSuite Inc.1 | 2,122,874 | 204,687 |
| VMware, Inc., Class A1 | 2,400,000 | 204,168 |
| Finisar Corp.1,2 | 8,273,000 | 173,816 |
| Broadcom Corp., Class A | 3,690,000 | 166,899 |
| Linear Technology Corp. | 3,280,000 | 158,047 |
| Gemalto NV | 1,870,000 | 151,799 |
The Growth Fund of America — Page 1 of 9
Common stocks
Information technology (continued) | Shares | Value
(000) |
| MercadoLibre, Inc. | 965,000 | $126,386 |
| Samsung Electronics Co. Ltd. | 99,200 | 122,650 |
| Twitter, Inc.1 | 2,500,000 | 120,200 |
| Dolby Laboratories, Inc., Class A | 2,650,000 | 107,245 |
| ARM Holdings PLC | 5,685,000 | 101,723 |
| National Instruments Corp. | 3,135,000 | 97,624 |
| CommScope Holding Co., Inc.1 | 3,000,000 | 94,500 |
| Automatic Data Processing, Inc. | 1,000,000 | 88,840 |
| Demandware, Inc.1 | 1,210,000 | 76,460 |
| Analog Devices, Inc. | 875,000 | 51,222 |
| Mail.Ru Group Ltd. (GDR)1 | 1,199,085 | 22,771 |
| Workday, Inc., Class A1 | 180,000 | 15,390 |
| ASM Pacific Technology Ltd. | 945,000 | 9,589 |
| | | 30,841,856 |
| Consumer discretionary 17.53% | | |
| Amazon.com, Inc.1 | 17,438,095 | 6,629,266 |
| Home Depot, Inc. | 24,651,200 | 2,828,725 |
| Comcast Corp., Class A | 38,003,578 | 2,256,653 |
| Comcast Corp., Class A, special nonvoting shares | 8,000,000 | 471,560 |
| Priceline Group Inc.1 | 882,215 | 1,091,723 |
| NIKE, Inc., Class B | 11,222,000 | 1,089,881 |
| Twenty-First Century Fox, Inc., Class A | 31,032,200 | 1,086,127 |
| Netflix, Inc.1 | 2,025,767 | 962,057 |
| MGM Resorts International1,2 | 36,299,600 | 788,790 |
| Johnson Controls, Inc. | 13,625,000 | 692,286 |
| Walt Disney Co. | 5,905,000 | 614,592 |
| Time Warner Inc. | 7,160,000 | 586,118 |
| CBS Corp., Class B | 8,439,012 | 498,746 |
| BorgWarner Inc. | 7,100,000 | 436,366 |
| Liberty Global PLC, Class C1 | 4,976,520 | 259,625 |
| Liberty Global PLC, Class A1 | 2,894,280 | 156,465 |
| Tesla Motors, Inc.1 | 2,014,800 | 409,689 |
| Naspers Ltd., Class N | 2,630,000 | 385,996 |
| Toyota Motor Corp. | 5,690,000 | 383,519 |
| AutoNation, Inc.1,2 | 6,000,000 | 369,000 |
| Ralph Lauren Corp., Class A | 2,675,000 | 367,572 |
| Lowe’s Companies, Inc. | 4,950,000 | 366,746 |
| Expedia, Inc. | 2,599,000 | 238,458 |
| DIRECTV1 | 2,471,200 | 218,948 |
| TJX Companies, Inc. | 3,000,000 | 205,920 |
| Starbucks Corp. | 2,050,000 | 191,644 |
| D.R. Horton, Inc. | 6,685,000 | 182,567 |
| Viacom Inc., Class B | 2,411,000 | 168,625 |
| Luxottica Group SpA | 2,458,300 | 151,716 |
| Lions Gate Entertainment Corp. | 4,619,393 | 150,546 |
| Carnival Corp., units | 3,353,700 | 147,529 |
| Tiffany & Co. | 1,640,000 | 144,681 |
| lululemon athletica inc.1 | 1,915,000 | 131,063 |
| Wynn Resorts, Ltd. | 898,623 | 128,054 |
| Darden Restaurants, Inc. | 2,000,000 | 128,000 |
| Volkswagen AG, nonvoting preferred | 505,000 | 127,435 |
| General Motors Co. | 3,175,000 | 118,459 |
| PulteGroup, Inc. | 5,000,000 | 112,800 |
| Daimler AG | 1,133,000 | 109,685 |
The Growth Fund of America — Page 2 of 9
Common stocks
Consumer discretionary (continued) | Shares | Value
(000) |
| Galaxy Entertainment Group Ltd. | 20,000,000 | $101,601 |
| Renault SA | 1,000,000 | 96,070 |
| Norwegian Cruise Line Holdings Ltd.1 | 1,500,000 | 73,980 |
| Toll Brothers, Inc.1 | 1,825,000 | 69,916 |
| Lennar Corp., Class A | 1,000,000 | 50,210 |
| Las Vegas Sands Corp. | 828,000 | 47,113 |
| zulily, inc., Class A1 | 2,166,130 | 30,348 |
| Hermès International | 84,000 | 27,105 |
| Five Below, Inc.1 | 766,702 | 24,331 |
| | | 25,908,306 |
| Health care 17.13% | | |
| Gilead Sciences, Inc.1 | 34,239,148 | 3,544,779 |
| UnitedHealth Group Inc. | 24,139,200 | 2,742,937 |
| Amgen Inc. | 14,009,100 | 2,209,515 |
| Alexion Pharmaceuticals, Inc.1 | 9,261,061 | 1,670,418 |
| Express Scripts Holding Co.1 | 18,870,600 | 1,600,038 |
| Regeneron Pharmaceuticals, Inc.1 | 3,362,300 | 1,391,454 |
| Vertex Pharmaceuticals Inc.1 | 9,337,600 | 1,115,190 |
| Thermo Fisher Scientific Inc. | 7,233,052 | 940,297 |
| Illumina, Inc.1 | 4,672,501 | 913,287 |
| BioMarin Pharmaceutical Inc.1 | 7,860,288 | 841,601 |
| Novartis AG1 | 7,455,000 | 762,039 |
| St. Jude Medical, Inc. | 10,207,000 | 680,603 |
| Stryker Corp. | 6,778,376 | 642,251 |
| Endo International PLC1 | 7,201,154 | 616,419 |
| Humana Inc. | 3,706,305 | 609,242 |
| Edwards Lifesciences Corp.1 | 4,501,472 | 598,786 |
| Hologic, Inc.1 | 13,966,100 | 452,222 |
| Boston Scientific Corp.1 | 24,800,000 | 419,120 |
| Incyte Corp.1 | 4,445,100 | 381,612 |
| athenahealth, Inc.1,2 | 2,529,861 | 321,469 |
| Biogen Idec Inc.1 | 775,200 | 317,514 |
| Merck & Co., Inc. | 5,414,800 | 316,982 |
| Puma Biotechnology Inc1 | 1,383,000 | 294,593 |
| Grifols, SA, Class B (ADR) | 4,366,508 | 143,047 |
| Grifols, SA, Class B, preferred nonvoting, non-registered shares | 3,870,000 | 128,189 |
| Brookdale Senior Living Inc.1 | 5,278,000 | 197,978 |
| Baxter International Inc. | 2,818,910 | 194,928 |
| Aetna Inc. | 1,938,800 | 193,007 |
| Teva Pharmaceutical Industries Ltd. (ADR) | 2,510,000 | 143,120 |
| Bristol-Myers Squibb Co. | 2,214,100 | 134,883 |
| ResMed Inc. | 1,960,000 | 126,146 |
| Myriad Genetics, Inc.1 | 3,640,000 | 124,015 |
| Intercept Pharmaceuticals, Inc.1 | 500,000 | 110,685 |
| Pharmacyclics, Inc.1 | 471,800 | 101,876 |
| Novo Nordisk A/S, Class B | 1,935,000 | 92,769 |
| Synageva BioPharma Corp.1 | 938,698 | 92,678 |
| PerkinElmer, Inc. | 1,891,922 | 88,920 |
| DaVita HealthCare Partners Inc.1 | 590,000 | 44,014 |
| Intuitive Surgical, Inc.1 | 49,200 | 24,600 |
| | | 25,323,223 |
The Growth Fund of America — Page 3 of 9
Common stocks
Industrials 8.88% | Shares | Value
(000) |
| Union Pacific Corp. | 12,601,600 | $1,515,468 |
| Precision Castparts Corp. | 6,452,109 | 1,395,591 |
| American Airlines Group Inc. | 23,370,000 | 1,119,423 |
| United Continental Holdings, Inc.1 | 16,949,000 | 1,104,736 |
| Boeing Co. | 6,150,000 | 927,727 |
| CSX Corp. | 21,174,801 | 726,507 |
| General Dynamics Corp. | 4,030,200 | 559,311 |
| Cummins Inc. | 3,720,000 | 529,096 |
| Delta Air Lines, Inc. | 11,003,823 | 489,890 |
| Nielsen NV | 10,499,551 | 474,685 |
| Ryanair Holdings PLC (ADR) | 5,538,214 | 350,846 |
| Rockwell Collins, Inc. | 3,845,000 | 342,513 |
| Sensata Technologies Holding NV1 | 5,900,000 | 317,066 |
| Danaher Corp. | 3,509,448 | 306,305 |
| Textron Inc. | 6,658,866 | 295,054 |
| Towers Watson & Co., Class A | 2,031,937 | 267,200 |
| FedEx Corp. | 1,500,000 | 265,470 |
| Meggitt PLC | 26,054,666 | 219,224 |
| Oshkosh Corp.2 | 4,368,000 | 213,115 |
| United Technologies Corp. | 1,640,000 | 199,932 |
| Lockheed Martin Corp. | 877,000 | 175,444 |
| Robert Half International Inc. | 2,627,000 | 162,769 |
| TransDigm Group Inc. | 728,000 | 157,874 |
| Jacobs Engineering Group Inc.1 | 3,484,698 | 154,512 |
| Verisk Analytics, Inc., Class A1 | 2,138,000 | 153,530 |
| Fastenal Co. | 3,655,000 | 151,865 |
| MTU Aero Engines AG | 1,540,000 | 146,449 |
| Caterpillar Inc. | 1,330,000 | 110,257 |
| KONE Oyj, Class B | 1,920,000 | 88,478 |
| Honeywell International Inc. | 700,000 | 71,946 |
| Bureau Veritas SA | 2,256,040 | 53,169 |
| KBR, Inc. | 2,757,023 | 44,912 |
| United Parcel Service, Inc., Class B | 328,000 | 33,367 |
| | | 13,123,731 |
| Financials 7.74% | | |
| Crown Castle International Corp. | 13,450,912 | 1,160,948 |
| American International Group, Inc. | 20,345,000 | 1,125,689 |
| Goldman Sachs Group, Inc. | 3,938,996 | 747,582 |
| Wells Fargo & Co. | 12,014,178 | 658,257 |
| American Express Co. | 6,730,000 | 549,101 |
| JPMorgan Chase & Co. | 8,800,000 | 539,264 |
| Berkshire Hathaway Inc., Class B1 | 2,000,000 | 294,820 |
| Berkshire Hathaway Inc., Class A1 | 970 | 214,544 |
| HDFC Bank Ltd. | 23,293,408 | 397,237 |
| HDFC Bank Ltd. (ADR) | 1,612,000 | 99,960 |
| Legal & General Group PLC | 111,984,892 | 483,222 |
| CME Group Inc., Class A | 4,442,419 | 426,161 |
| ACE Ltd. | 3,696,000 | 421,381 |
| Capital One Financial Corp. | 5,348,000 | 420,941 |
| AIA Group Ltd. | 67,400,000 | 396,711 |
| American Tower Corp. | 3,915,000 | 388,133 |
| Bank of America Corp. | 24,500,000 | 387,345 |
| CIT Group Inc. | 7,011,000 | 324,259 |
| Progressive Corp. | 10,850,000 | 289,152 |
The Growth Fund of America — Page 4 of 9
Common stocks
Financials (continued) | Shares | Value
(000) |
| Charles Schwab Corp. | 8,557,000 | $251,062 |
| Onex Corp. | 4,200,000 | 237,096 |
| Morgan Stanley | 6,500,000 | 232,635 |
| Citigroup Inc. | 3,305,000 | 173,248 |
| McGraw Hill Financial, Inc. | 1,585,595 | 163,475 |
| Signature Bank1 | 1,206,970 | 148,880 |
| Bank of Ireland1 | 383,200,000 | 145,799 |
| UBS Group AG1 | 6,765,666 | 118,870 |
| Fifth Third Bancorp | 4,750,000 | 91,960 |
| U.S. Bancorp | 2,025,000 | 90,335 |
| Bankia, SA1 | 55,495,000 | 80,608 |
| First Republic Bank | 1,370,200 | 78,101 |
| W. R. Berkley Corp. | 1,560,000 | 77,860 |
| Leucadia National Corp. | 2,589,787 | 61,456 |
| Financial Engines, Inc. | 1,360,000 | 54,808 |
| ICICI Bank Ltd. (ADR) | 4,000,000 | 46,600 |
| Prudential PLC | 1,096,900 | 27,595 |
| Weyerhaeuser Co.1 | 422,321 | 14,828 |
| Moody’s Corp. | 120,000 | 11,633 |
| | | 11,431,556 |
| Energy 6.56% | | |
| EOG Resources, Inc. | 18,669,000 | 1,674,983 |
| Noble Energy, Inc.2 | 20,639,621 | 974,809 |
| Concho Resources Inc.1,2 | 8,834,006 | 962,200 |
| Pioneer Natural Resources Co. | 4,567,700 | 696,666 |
| Canadian Natural Resources, Ltd. | 17,351,300 | 504,674 |
| Schlumberger Ltd. | 5,850,000 | 492,336 |
| Suncor Energy Inc. | 14,247,520 | 427,733 |
| FMC Technologies, Inc.1 | 10,206,788 | 407,557 |
| BG Group PLC | 26,139,000 | 386,598 |
| Southwestern Energy Co.1 | 14,753,752 | 370,024 |
| Cabot Oil & Gas Corp. | 11,719,330 | 339,861 |
| Weatherford International PLC1 | 21,968,900 | 278,785 |
| Plains GP Holdings, LP, Class A | 9,526,264 | 272,832 |
| Enbridge Inc. | 4,645,529 | 216,018 |
| CONSOL Energy Inc. | 6,235,000 | 200,767 |
| Cobalt International Energy, Inc.1 | 16,482,353 | 168,779 |
| Royal Dutch Shell PLC, Class B (ADR) | 2,428,800 | 165,523 |
| Chesapeake Energy Corp. | 9,890,877 | 164,980 |
| Apache Corp. | 2,320,000 | 152,749 |
| Cimarex Energy Co. | 1,325,000 | 145,326 |
| Cheniere Energy, Inc.1 | 1,783,580 | 143,810 |
| Murphy Oil Corp. | 2,556,000 | 130,075 |
| Tourmaline Oil Corp.1 | 3,854,600 | 119,822 |
| BP PLC | 7,100,000 | 49,112 |
| BP PLC (ADR) | 1,138,700 | 47,188 |
| Baker Hughes Inc. | 1,300,477 | 81,293 |
| Oil States International, Inc.1 | 1,006,931 | 43,781 |
| Paramount Resources Ltd.1 | 1,440,000 | 35,836 |
| Core Laboratories NV | 197,555 | 21,715 |
| Peyto Exploration & Development Corp. | 730,000 | 20,415 |
The Growth Fund of America — Page 5 of 9
Common stocks
Energy (continued) | Shares | Value
(000) |
| Laricina Energy Ltd.1,3,4 | 950,000 | $2,280 |
| Denbury Resources Inc. | 110,100 | 925 |
| | | 9,699,452 |
| Consumer staples 4.22% | | |
| Costco Wholesale Corp. | 11,583,183 | 1,702,265 |
| Philip Morris International Inc. | 20,117,588 | 1,668,955 |
| Kerry Group PLC, Class A | 6,065,824 | 441,217 |
| Keurig Green Mountain, Inc. | 2,765,663 | 352,843 |
| Sprouts Farmers Market, Inc.1,2 | 9,438,000 | 347,413 |
| Coca-Cola Co. | 6,020,400 | 260,683 |
| Whole Foods Market, Inc. | 4,179,700 | 236,111 |
| Mead Johnson Nutrition Co. | 1,864,600 | 195,336 |
| Procter & Gamble Co. | 2,195,000 | 186,860 |
| Nestlé SA | 2,387,600 | 186,330 |
| Glanbia PLC | 8,320,000 | 151,761 |
| Herbalife Ltd. | 4,186,400 | 129,820 |
| Pernod Ricard SA | 1,056,000 | 125,203 |
| Nu Skin Enterprises, Inc., Class A | 1,920,000 | 104,026 |
| British American Tobacco PLC | 1,493,000 | 87,174 |
| PepsiCo, Inc. | 650,000 | 64,337 |
| | | 6,240,334 |
| Materials 2.59% | | |
| Monsanto Co. | 6,055,000 | 729,204 |
| Praxair, Inc. | 5,186,537 | 663,358 |
| Celanese Corp., Series A | 6,300,000 | 359,793 |
| Rio Tinto PLC | 5,292,000 | 260,788 |
| LyondellBasell Industries NV | 2,890,000 | 248,280 |
| Newmont Mining Corp. | 9,280,000 | 244,342 |
| Potash Corp. of Saskatchewan Inc. | 6,459,000 | 231,878 |
| Barrick Gold Corp. | 15,680,000 | 204,154 |
| Mosaic Co. | 3,420,000 | 182,149 |
| Syngenta AG | 510,000 | 179,638 |
| Sigma-Aldrich Corp. | 1,200,000 | 165,672 |
| FMC Corp. | 1,700,000 | 107,797 |
| First Quantum Minerals Ltd. | 5,640,000 | 71,510 |
| Dow Chemical Co. | 1,430,000 | 70,413 |
| ArcelorMittal | 5,710,000 | 62,428 |
| James Hardie Industries PLC (CDI) | 3,570,000 | 42,235 |
| | | 3,823,639 |
| Telecommunication services 0.57% | | |
| SoftBank Corp. | 7,096,000 | 437,001 |
| T-Mobile US, Inc.1 | 12,065,000 | 398,507 |
| | | 835,508 |
| Utilities 0.06% | | |
| NRG Energy, Inc. | 3,588,200 | 86,045 |
| Miscellaneous 5.00% | | |
| Other common stocks in initial period of acquisition | | 7,396,359 |
| Total common stocks (cost: $75,868,819,000) | | 134,710,009 |
The Growth Fund of America — Page 6 of 9
Preferred securities 0.01%
Financials 0.01% | Shares | Value
(000) |
| Fannie Mae, Series S, 8.25% noncumulative1 | 4,095,858 | $18,431 |
| Miscellaneous 0.00% | | |
| Other preferred securities in initial period of acquisition | | 3,107 |
| Total preferred securities (cost: $48,162,000) | | 21,538 |
Rights & warrants 0.08%
Financials 0.04% | | |
| JP Morgan Chase & Co., warrants, expire 20181 | 2,350,000 | 49,514 |
| Citigroup Inc., Class A, warrants, expire 20191 | 25,500,000 | 17,850 |
| | | 67,364 |
| Energy 0.04% | | |
| Kinder Morgan, Inc., warrants, expire 20171 | 13,876,600 | 53,564 |
| Telecommunication services 0.00% | | |
| Broadview Networks Holdings, Inc., Series A1, warrants, expire 20201,3,4 | 4,414 | — |
| Broadview Networks Holdings, Inc., Series A2, warrants, expire 20201,3,4 | 1,672 | — |
| Total rights & warrants (cost: $122,540,000) | | 120,928 |
Convertible bonds 0.03%
Telecommunication services 0.03% | Principal amount
(000) | |
| Clearwire Corp. 8.25% convertible notes 20405 | $— | 47,993 |
| Total convertible bonds (cost: $43,829,000) | | 47,993 |
Bonds, notes & other debt instruments 0.15%
U.S. Treasury bonds & notes 0.08%
U.S. Treasury 0.08% | | |
| U.S. Treasury 0.125% 2015 | 10,100 | 10,101 |
| U.S. Treasury 0.25% 2015 | 90,685 | 90,726 |
| U.S. Treasury 0.25% 2015 | 15,675 | 15,684 |
| Total U.S. Treasury bonds & notes | | 116,511 |
Corporate bonds & notes 0.05%
Telecommunication services 0.05% | | |
| NII Capital Corp. 10.00% 20166 | 32,300 | 18,088 |
| NII Capital Corp. 7.875% 20195,6 | 27,500 | 26,469 |
| NII Capital Corp. 8.875% 20196 | 1,025 | 574 |
| NII Capital Corp. 11.375% 20195,6 | 19,800 | 19,305 |
| NII Capital Corp. 7.625% 20216 | 9,300 | 3,301 |
| Total corporate bonds & notes | | 67,737 |
| Federal agency bonds & notes 0.02% | | |
| Federal Farm Credit Banks 0.13% 2015 | 33,500 | 33,499 |
| Total bonds, notes & other debt instruments (cost: $193,928,000) | | 217,747 |
The Growth Fund of America — Page 7 of 9
| Short-term securities 8.82% | Principal amount
(000) | Value
(000) |
| 3M Co. 0.10% due 3/18/2015–3/23/20155 | $106,000 | $105,993 |
| Abbott Laboratories 0.13% due 4/7/20155 | 40,000 | 39,998 |
| Apple Inc. 0.10% due 3/24/20155 | 21,600 | 21,598 |
| CAFCO, LLC 0.18%–0.24% due 3/24/2015–5/4/2015 | 42,600 | 42,590 |
| Caterpillar Financial Services Corp. 0.13% due 3/9/2015 | 50,000 | 49,998 |
| Chariot Funding, LLC 0.21%–0.27% due 3/10/2015–5/21/20155 | 304,200 | 304,101 |
| Chevron Corp. 0.14% due 4/13/2015–7/17/20155 | 100,000 | 99,955 |
| Citicorp 0.20% due 3/9/2015 | 36,000 | 35,999 |
| Coca-Cola Co. 0.12%–0.19% due 3/17/2015–5/12/20155 | 161,000 | 160,975 |
| Emerson Electric Co. 0.11%–0.12% due 4/20/2015–5/28/20155 | 32,100 | 32,093 |
| ExxonMobil Corp. 0.12% due 5/19/2015 | 50,000 | 49,980 |
| Fannie Mae 0.08%–0.24% due 4/1/2015–1/19/2016 | 2,273,378 | 2,272,632 |
| Federal Farm Credit Banks 0.10%–0.24% due 3/2/2015–10/6/2015 | 780,800 | 780,501 |
| Federal Home Loan Bank 0.06%–0.24% due 3/4/2015–1/22/2016 | 4,686,038 | 4,685,059 |
| Freddie Mac 0.09%–0.23% due 3/6/2015–1/20/2016 | 2,901,837 | 2,900,863 |
| General Electric Capital Corp. 0.20%–0.24% due 5/13/2015–7/15/2015 | 75,000 | 74,964 |
| General Electric Co. 0.18%–0.24% due 4/22/2015–7/14/2015 | 100,000 | 99,950 |
| John Deere Capital Corp. 0.10% due 3/11/20155 | 97,500 | 97,496 |
| John Deere Financial Ltd. 0.12% due 3/4/20155 | 36,000 | 35,999 |
| JPMorgan Chase & Co. 0.27% due 7/9/20155 | 25,000 | 24,976 |
| Jupiter Securitization Co., LLC 0.25% due 5/18/20155 | 57,000 | 56,974 |
| Kimberly-Clark Corp. 0.11% due 3/16/20155 | 34,900 | 34,898 |
| Merck & Co. Inc. 0.08% due 3/26/20155 | 20,000 | 19,999 |
| Microsoft Corp. 0.10% due 4/15/2015–4/22/20155 | 93,000 | 92,991 |
| National Rural Utilities Cooperative Finance Corp. 0.10%–0.11% due 3/2/2015–3/19/2015 | 56,000 | 55,998 |
| Paccar Financial Corp. 0.12% due 3/6/2015 | 32,100 | 32,099 |
| Pfizer Inc 0.11%–0.15% due 5/7/2015–7/16/20155 | 150,000 | 149,945 |
| Precision Castpart Corp. 0.13% due 7/1/20155 | 40,000 | 39,965 |
| Private Export Funding Corp. 0.12%–0.26% due 3/2/2015–9/23/20155 | 122,700 | 122,655 |
| Procter & Gamble Co. 0.11% due 5/12/2015–5/26/20155 | 150,000 | 149,967 |
| U.S. Treasury Bills 0.10%–0.13% due 6/25/2015–7/23/2015 | 108,700 | 108,686 |
| United Parcel Service Inc. 0.11%–0.13% due 4/16/2015–5/5/20155 | 35,200 | 35,193 |
| Walt Disney Co. 0.12% due 3/20/2015–3/25/20155 | 79,700 | 79,696 |
| Wells Fargo & Co. 0.23% due 4/8/2015 | 50,000 | 49,992 |
| Wells Fargo Bank, N.A. 0.00% due 6/3/2015–8/7/2015 | 85,000 | 85,007 |
| Total short-term securities (cost: $13,027,502,000) | | 13,029,785 |
| Total investment securities 100.24% (cost: $89,304,780,000) | | 148,148,000 |
| Other assets less liabilities (0.24)% | | (354,580) |
| Net assets 100.00% | | $147,793,420 |
As permitted by U.S. Securities and Exchange Commission regulations, “Miscellaneous” securities include holdings in their first year of acquisition that have not previously been publicly disclosed.
| 1 | Security did not produce income during the last 12 months. |
| 2 | Represents an affiliated company as defined under the Investment Company Act of 1940. |
| 3 | Valued under fair value procedures adopted by authority of the board of trustees. The total value of all such securities, including those in “Miscellaneous,“ was $325,155,000, which represented .22% of the net assets of the fund. This entire amount relates to certain securities trading outside the U.S. whose values were adjustedas a result of significant market movements following the close of local trading. |
| 4 | Acquired through a private placement transaction exempt from registration under the Securities Act of 1933. May be subject to legal or contractual restrictions on resale. Further details on these holdings appear below. |
| 5 | Acquired in a transaction exempt from registration under Rule 144A or Section 4(2) of the Securities Act of 1933. May be resold in the U.S. in transactions exempt from registration, normally to qualified institutional buyers. The total value of all such securities was $1,799,234,000, which represented 1.22% of the net assets of the fund. |
| 6 | Scheduled interest and/or principal payment was not received. |
The Growth Fund of America — Page 8 of 9
| Private placement securities | Acquisition
date(s) | Cost
(000) | Value
(000) | Percent
of net
assets |
| First Data Holdings, Inc., Class B | 6/26/2014 | $225,000 | $322,875 | .22% |
| Laricina Energy Ltd. | 6/21/2011 | 41,523 | 2,280 | .00 |
| Broadview Networks Holdings, Inc., Series A1, warrants, expire 2020 | 7/7/2000-3/6/2002 | 11,176 | — | .00 |
| Broadview Networks Holdings, Inc., Series A2, warrants, expire 2020 | 7/7/2000-3/6/2002 | 3,623 | — | .00 |
| Total private placement securities | | $281,325 | $325,155 | .22% |
| Key to abbreviations |
| ADR = American Depositary Receipts |
| CDI = CREST Depository Interest |
| GDR = Global Depositary Receipts |
Investments are not FDIC-insured, nor are they deposits of or guaranteed by a bank or any other entity, so they may lose value.
Investors should carefully consider investment objectives, risks, charges and expenses. This and other important information is contained in the fund prospectus and summary prospectus, which can be obtained from your financial professional and should be read carefully before investing. You may also call American Funds Service Company (AFS) at (800) 421-4225 or visit the American Funds website at americanfunds.com.
| MFGEFPX-005-0415O-S42190 | The Growth Fund of America — Page 9 of 9 |
ITEM 7 – Disclosure of Proxy Voting Policies and Procedures for Closed-End Management Investment Companies
Not applicable to this Registrant, insofar as the Registrant is not a closed-end management investment company.
ITEM 8 – Portfolio Managers of Closed-End Management Investment Companies
Not applicable to this Registrant, insofar as the Registrant is not a closed-end management investment company.
ITEM 9 – Purchases of Equity Securities by Closed-End Management Investment Company and Affiliated Purchasers
Not applicable to this Registrant, insofar as the Registrant is not a closed-end management investment company.
ITEM 10 – Submission of Matters to a Vote of Security Holders
There have been no material changes to the procedures by which shareholders may recommend nominees to the Registrant’s board of trustees since the Registrant last submitted a proxy statement to its shareholders. The procedures are as follows. The Registrant has a nominating and governance committee comprised solely of persons who are not considered ‘‘interested persons’’ of the Registrant within the meaning of the Investment Company Act of 1940, as amended. The committee periodically reviews such issues as the board’s composition, responsibilities, committees, compensation and other relevant issues, and recommends any appropriate changes to the full board of trustees. While the committee normally is able to identify from its own resources an ample number of qualified candidates, it will consider shareholder suggestions of persons to be considered as nominees to fill future vacancies on the board. Such suggestions must be sent in writing to the nominating and governance committee of the Registrant, c/o the Registrant’s Secretary, and must be accompanied by complete biographical and occupational data on the prospective nominee, along with a written consent of the prospective nominee for consideration of his or her name by the nominating and governance committee.
ITEM 11 – Controls and Procedures
| (a) | The Registrant’s Principal Executive Officer and Principal Financial Officer have concluded, based on their evaluation of the Registrant’s disclosure controls and procedures (as such term is defined in Rule 30a-3 under the Investment Company Act of 1940), that such controls and procedures are adequate and reasonably designed to achieve the purposes described in paragraph (c) of such rule. |
| | |
| (b) | There were no changes in our internal control over financial reporting during the quarter ended February 28, 2015, which were identified in connection with management's evaluation required by paragraph (d) of Rule 13a-15 and 15d-15 under the Exchange Act, that have materially affected, or are reasonably likely to materially affect, our internal control over financial reporting, other than as provided below. Effective November 10, 2014, the The Growth Fund of America’s investment adviser implemented a new accounting system. In connection with introducing this new system, additional automated and manual controls were implemented and some existing controls were modified. None of these changes were in response to any identified deficiency or weakness in the The Growth Fund of America’s internal control over financial reporting. |
ITEM 12 – Exhibits
| (a)(1) | Not applicable for filing of semi-annual reports to shareholders. |
| | |
| (a)(2) | The certifications required by Rule 30a-2 of the Investment Company Act of 1940 and Sections 302 and 906 of the Sarbanes-Oxley Act of 2002 are attached as exhibits hereto. |
SIGNATURES
Pursuant to the requirements of the Securities Exchange Act of 1934 and the Investment Company Act of 1940, the Registrant has duly caused this report to be signed on its behalf by the undersigned, thereunto duly authorized.
| | THE GROWTH FUND OF AMERICA |
| | |
| | By /s/ Paul F. Roye |
| | Paul F. Roye, Executive Vice President and Principal Executive Officer |
| | |
| | Date: April 30, 2015 |
Pursuant to the requirements of the Securities Exchange Act of 1934 and the Investment Company Act of 1940, this report has been signed below by the following persons on behalf of the Registrant and in the capacities and on the dates indicated.
| By /s/ Paul F. Roye |
Paul F. Roye, Executive Vice President and Principal Executive Officer |
| |
| Date: April 30, 2015 |
| By _/s/ Jeffrey P. Regal |
Jeffrey P. Regal, Treasurer and Principal Financial Officer |
| |
| Date: April 30, 2015 |