UNITED STATES
SECURITIES AND EXCHANGE COMMISSION
Washington, D.C. 20549
FORM N-CSR
Certified Shareholder Report of
Registered Management Investment Companies
Investment Company Act File Number: 811-00862
The Growth Fund of America
(Exact Name of Registrant as Specified in Charter)
One Market, Steuart Tower
Suite 2000
San Francisco, California 94105
(Address of Principal Executive Offices)
Registrant's telephone number, including area code: (415) 421-9360
Date of fiscal year end: August 31
Date of reporting period: August 31, 2014
Michael W. Stockton
The Growth Fund of America
One Market, Steuart Tower
Suite 2000
San Francisco, California 94105
(Name and Address of Agent for Service)
Copies to:
Mark D. Perlow
K&L Gates LLP
Four Embarcadero Center, Suite 1200
San Francisco, California 94111
(Counsel for the Registrant)
ITEM 1 – Reports to Stockholders

Looking forward at
40: Our past informs
our future.
 | The Growth Fund of America® Annual report
for the year ended
August 31, 2014 |
The Growth Fund of America invests in a wide range of companies that appear to offer superior opportunities for growth of capital.
This fund is one of more than 40 offered by one of the nation’s largest mutual fund families, American Funds, from Capital Group. For more than 80 years, Capital has invested with a long-term focus based on thorough research and attention to risk.
Fund results shown in this report, unless otherwise indicated, are for Class A shares at net asset value. If a sales charge (maximum 5.75%) had been deducted, the results would have been lower. Results are for past periods and are not predictive of results for future periods. Current and future results may be lower or higher than those shown. Share prices and returns will vary, so investors may lose money. Investing for short periods makes losses more likely. Investments are not FDIC-insured, nor are they deposits of or guaranteed by a bank or any other entity, so they may lose value. For current information and month-end results, visit americanfunds.com.
Here are the average annual total returns on a $1,000 investment with all distributions reinvested for periods ended September 30, 2014 (the most recent calendar quarter-end):
| Class A shares | | 1 year | | | 5 years | | | 10 years | |
| | | | | | | | | | |
| Reflecting 5.75% maximum sales charge | | | 9.71% | | | | 12.82% | | | | 8.11% | |
For other share class results, visit americanfunds.com.
The total annual fund operating expense ratio is 0.66% for Class A shares as of the prospectus dated November 1, 2014 (unaudited).
Investment results assume all distributions are reinvested and reflect applicable fees and expenses. When applicable, investment results reflect fee waivers, without which results would have been lower. Visit americanfunds.com for more information.
Refer to the fund prospectus and the Risk Factors section of this report for more information on risks associated with investing in the fund.

The Growth Fund of
America continues its
fundamental research
and long-term
approach to investing.
Fellow investors:
A steady and resilient U.S. equity market helped The Growth Fund of America to strong returns for the 12-month period ended August 31, 2014.
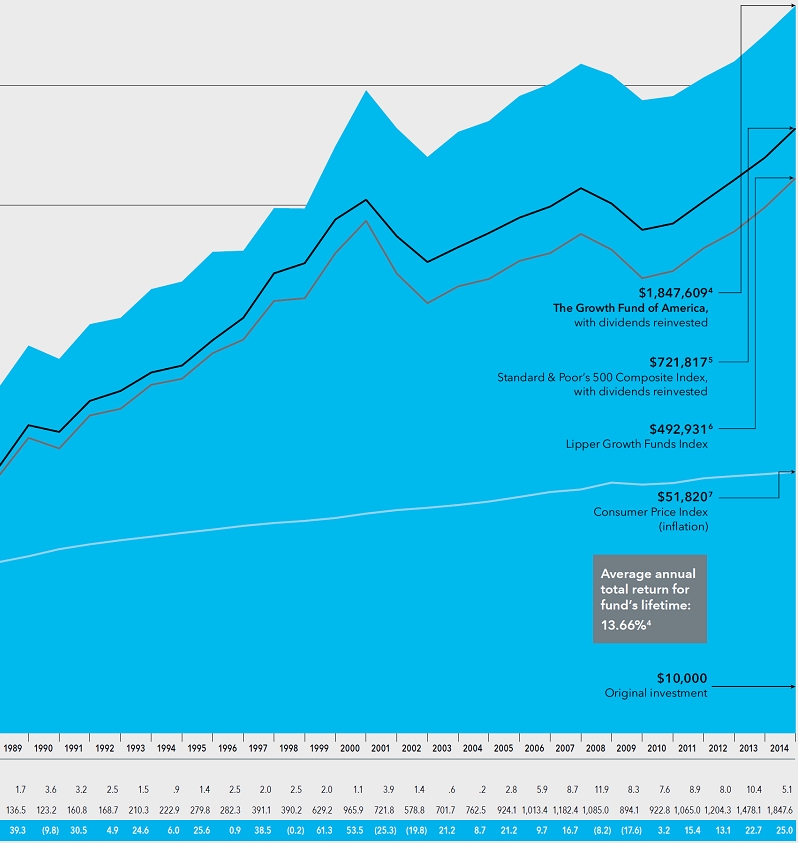
For its most recent fiscal year, The Growth Fund of America (GFA) posted a total return of 25.00%, roughly on par with the unmanaged Standard & Poor’s 500 Composite Index, a broad measure of the U.S. equity market. As you can see in the chart below, the fund’s total return lagged three of the four indexes we use to measure GFA’s progress. Nonetheless, while we are pleased with the one-year return, we continue to believe long-term returns are a better measure of a fund.
It is worth noting that over the 40-year lifetime of the fund, it surpasses the returns of the S&P 500 and its Lipper peer indexes. We believe that this is due to our long-term approach to investing and our intensive research efforts, both of which we believe will continue to serve our investors well for the next 40 years and beyond.
Results at a glance
Total returns for periods ended August 31, 2014, with all distributions reinvested
| | | Cumulative
total returns | | Average annual total returns |
| | | 1 year | | 5 years | | 10 years | | Lifetime1 |
| | | | | | | | | |
| The Growth Fund of America (Class A shares) | | | 25.00 | % | | | 15.62 | % | | | 9.25 | % | | | 13.83 | % |
| Standard & Poor’s 500 Composite Index2 | | | 25.21 | | | | 16.87 | | | | 8.37 | | | | 11.07 | |
| Lipper Large-Cap Growth Funds Index | | | 25.74 | | | | 16.20 | | | | 8.35 | | | | — | 3 |
| Lipper Growth Funds Index | | | 25.14 | | | | 16.62 | | | | 8.05 | | | | 10.04 | |
| Lipper Large-Cap Core Funds Index | | | 22.86 | | | | 15.24 | | | | 7.73 | | | | — | 3 |
| Lipper Capital Appreciation Funds Index | | | 25.49 | | | | 15.31 | | | | 9.34 | | | | 11.07 | |
| 1 | Since Capital Research and Management Company (CRMC) began managing the fund on December 1, 1973. |
| 2 | The S&P 500 is unmanaged and, therefore, has no expenses. Investors cannot invest directly in an index. |
| 3 | This Lipper index was not in existence when CRMC began managing the fund. |
| The Growth Fund of America | 1 |

Over the 40-year lifetime of the fund, its returns surpass those returns of the S&P 500 and the fund’s Lipper peer indexes.
Investment results analysis
Securities markets undergo day-to-day volatility, but the gains in U.S. equities over the past year were noteworthy for how steady they were in the aggregate. This came despite geopolitical instability in places like Syria, Iraq and Ukraine, as well as economic data that showed some unevenness in the U.S. economic recovery.
We feel the Federal Reserve’s policies of providing economic stimulus and keeping interest rates low, mirrored by other central banks around the globe, have encouraged investors to continue buying stocks. Price-to-earnings ratios — a benchmark indicator of value — have continued to climb over the period, a sign that investors remain comfortable investing in the stock market for the time being.
The fund’s top 20 holdings generally fared well during the period, with top holding Amazon.com returning 20.7% and second-largest holding Gilead Sciences returning 78.5%. Other top holdings such as Google (up 37.4%) and EOG Resources (up 39.9%) also helped returns.
Among market sectors, GFA’s investments in health care stocks were the most important contributors to returns, both absolute and relative to the fund’s benchmark index. Telecommunication services and consumer discretionary stocks were also positive for the fund. Examples of these are Comcast (up 31.1%) and Softbank (up 15.6%). Roughly 11% of the fund’s portfolio is invested in non-U.S. equities. While these stocks generally contributed positive returns to the fund on an absolute basis, they did not fare as well as the fund’s U.S. holdings and held back our relative returns compared to the all-U.S. S&P 500 Index. We continue to believe in the value of overseas investing, which over longer periods has been helpful to the fund’s returns and can often provide needed diversification, as well as strong opportunity for capital appreciation.
GFA held roughly 7.5% of its portfolio in cash and short-term liquid securities as of the end of the fiscal year, down from 9.2% one year prior. Holding cash negatively impacted the fund’s returns this year when compared to the benchmark index, but can allow portfolio managers to move quickly and effectively in the future when opportunities present themselves in the market. Cash also provides a buffer against volatility.
The road ahead
Currently, the U.S. economy continues to grow, albeit unsteadily. We have not seen as robust a recovery over the past several years as we’ve seen in prior economic
| 2 | The Growth Fund of America |
For 40 years, we have made bottom-up research and a commitment to long-term investing hallmarks of the fund.
cycles, but it is worth noting that — despite the ups and downs of jobs reports and GDP figures — the economy continues to grow. Certainly, we continue to monitor the economy closely, and while there is a risk of a slowdown, we do not view a U.S. recession as likely at this time.
The economic recovery has been even weaker in Europe, and there is a greater risk of economic difficulty there — especially if the situation in Ukraine and tensions with Russia worsen. While troubles in Europe may affect the U.S. economy to a degree, that could also make U.S. securities more attractive to global investors who might think of the U.S. as a safe haven. Geopolitical uncertainties in Syria and Iraq may also provide some market risk in the months ahead, though we feel some amount of concern has already been built into investors’ expectations.
Finally, it’s worth noting that valuations on many U.S. equities have reached above-average levels. With this in mind, it is prudent to expect that the strong returns of recent years, particularly since the market bottom in 2009, likely will not last. That’s not to say the stock market will reverse itself, but rather that valuations may begin to moderate, producing more modest returns. With that said, there continue to be potentially attractive individual investments which we painstakingly research each day, just as we’ve done since The Growth Fund of America joined the American Funds family in late 1973. For 40 years, we have made bottom-up research and a commitment to long-term investing hallmarks of the fund. For more about our history, and what we have learned from it, please see the special feature beginning on page 6.
We thank you for your continued support of The Growth Fund of America, and look forward to reporting to you again in six months.
Cordially,

James F. Rothenberg
Vice Chairman of the Board

Donald D. O’Neal
President
October 7, 2014
For current information about the fund, visit americanfunds.com.

| The Growth Fund of America | 3 |
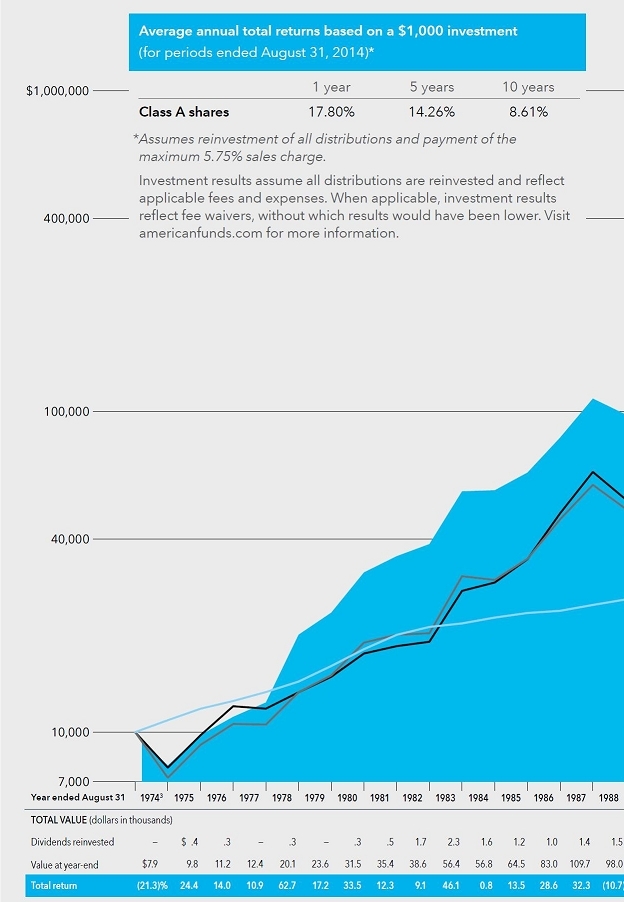
The value of a long-term perspective
Fund results shown are for Class A shares and reflect deduction of the maximum sales charge of 5.75% on the $10,000 investment.¹ Thus, the net amount invested was $9,425.² Results are for past periods and are not predictive of results for future periods. Current and future results may be lower or higher than those shown. Share prices and returns will vary, so investors may lose money. For current information and month-end results, visit americanfunds.com.
The results shown are before taxes on fund distributions and sale of fund shares.
| 1 | As outlined in the prospectus, the sales charge is reduced for accounts (and aggregated investments) of $25,000 or more and is eliminated for purchases of $1 million or more. There is no sales charge on dividends or capital gain distributions that are reinvested in additional shares. |
| 2 | The maximum initial sales charge was 8.5% prior to July 1, 1988. |
| 3 | For the period December 1, 1973 (when Capital Research and Management Company became the fund’s investment adviser), through August 31, 1974. |
| 4 | Includes reinvested dividends of $120,886 and reinvested capital gain distributions of $581,456. |
| 5 | The S&P 500 is unmanaged and, therefore, has no expenses. Investors cannot invest directly in an index. |
| 6 | Results of the Lipper Growth Funds Index do not reflect any sales charges. |
| 7 | Computed from data supplied by the U.S. Department of Labor, Bureau of Labor Statistics. |
| 4 | The Growth Fund of America |
How a $10,000 investment has grown
While notable for their volatility in recent years, financial markets have tended to reward investors over the long term. Active management — bolstered by experience and careful research — can add even more value. As the chart shows, over its lifetime, The Growth Fund of America has done demonstrably better than its relevant benchmark.
| The Growth Fund of America | 5 |
40 years of capital appreciation
The portfolio managers of The Growth Fund of America (GFA) have invested for attractive returns for more than 40 years. They’ve adapted and innovated over that time, but it is their unwavering focus on investors’ needs that have made the fund what it is today.

| 6 | The Growth Fund of America |
 |  |  |
| | | |
| Mike Kerr | Don O’Neal | Donnalisa Barnum |
| Portfolio manager | Portfolio manager | Portfolio manager |
What is success?
For more than 40 years, The Growth Fund of America has been measured in countless ways. During those four decades, it has become the nation’s single largest actively managed equity mutual fund in terms of assets. It has provided positive returns for 33 of those past 40 fiscal years. It has a lifetime average annual total return of 13.83% as of August 31, 2014, well above the 11.07% average annual total return of the unmanaged Standard & Poor’s 500 Composite Index.
The men and women who manage the fund, and the analysts whose work provides the backbone of the fund’s investment decision-making, are very proud of the record — but only insofar as the fund’s shareholders are satisfied.
“We’re successful when the investor succeeds in his or her goals,” says portfolio manager Mike Kerr. “It’s as simple as that.”
Forty years ago, GFA became one of the American Funds. While the fund has been successful by many measures, those who work on behalf of GFA’s investors see this anniversary as less of a celebration and more of an opportunity to see what’s worked and what lessons can be applied in the present. The fund’s fundamental approach to research, its global reach in investing, its flexibility and its system of portfolio managers — The Capital SystemSM — have all contributed.
“The most important thing, I believe, is that we have a durable investment approach,” says portfolio manager Don O’Neal. “We’ve changed and adapted in a lot of ways, but something we’ve never changed is our investment approach. We don’t need to because it’s stood the test of time.”
Breadth and depth of research
The investment analysts who provide research for GFA provide the foundation for the fund’s success. Analysts do more than simply break down balance sheets; they travel extensively to talk to company management, visit facilities and businesses, and engage with suppliers and competitors. “Our investments have always been driven by research,” says portfolio manager Donnalisa Barnum. “I genuinely believe we have some of the most talented analysts in the world, and we give them the freedom to dig deep and make tough calls.”
And as with the other American Funds, each analyst manages a small portion of the fund outright, allowing him or her to put high-conviction ideas to work on behalf of investors — even if others disagree.
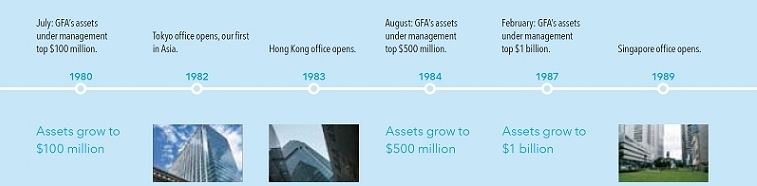
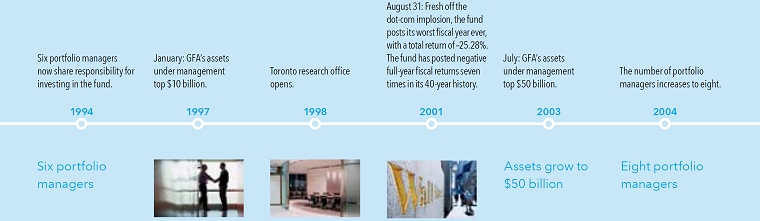
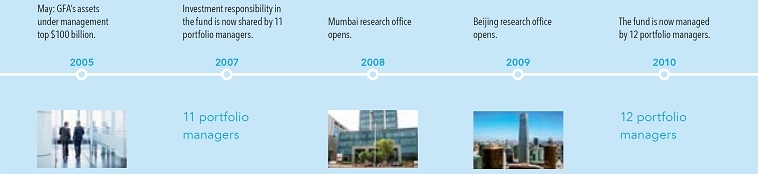
The Growth Fund of America’s 40-year history

| The Growth Fund of America | 7 |
We’re trying to invest in more unique non-U.S. companies that don’t necessarily have good substitutes or parallels in the U.S. We want the best companies, period, no matter where they are. — Jim Rothenberg
“The analysts are encouraged to invest where their conviction is. In fact, we don’t just allow it — we expect it,” says portfolio manager Barry Crosthwaite. “That’s how you develop investors. We require them to think independently and not groupthink.”
“Harnessing our investment professionals’ curiosity is something I think we do well,” adds Greg Wendt, who’s been an analyst working with GFA for 25 years. “We’re given enormous flexibility in how we approach the work, which makes this a great home for long-term investors of every stripe.”
Research fuels the portfolio managers’ decision-making. Analysts not only write research notes and updates, but are called upon to make their case in meetings big and small, to defend their theses as their colleagues “kick the tires.”
“Yes, we have big meetings, but we also have small group meetings and one-on-one sessions,” Don says. “These different settings are numerous enough so that we get to know and calibrate each other well, and they also generate the opportunities to explore a diverse number of viewpoints.”
International investing
The fund’s research capability has grown substantially since 1973. During that time, the number of Capital Group offices has grown from three to eleven. In recent years, Capital Research and Management Company, GFA’s investment adviser, has expanded further into the Asia-Pacific region with its most recent offices in Beijing and Mumbai.
That presence throughout the world is necessary, especially in today’s global economy. Originally, GFA’s mandate allowed it to have up to 15% of its portfolio in non-U.S. equities. In 2010, that limit was increased to 25%.
“This flexibility allows me to be opportunistic,” Donnalisa says. “There is such a global economy now, and maybe there’s an interesting company doing a significant amount of business in the U.S. market that’s actually based overseas. Additionally, there are many U.S. companies that have become truly global. Wherever it is, we can identify that company and make the most of the investment opportunity.”
Even so, the portfolio managers remain judicious about overseas investing, which can carry different risks from similar domestic stocks.
“We’re not going to invest in a Japanese retailer solely because it’s in Japan,” says Jim Rothenberg, GFA portfolio manager and chairman of The Capital Group Companies. “We’re trying to invest in more unique non-U.S. companies that don’t necessarily have good substitutes or parallels in the U.S. We want the
The Growth Fund of America celebrates its 40th year as one of the American Funds
| 8 | The Growth Fund of America |
Fund results shown are for Class A shares at net asset value. If a sales charge (maximum 5.75%) had been deducted, the results would have been lower. Results are for past periods and are not predictive of results for future periods. Current and future results may be lower or higher than those shown. Share prices and returns will vary, so investors may lose money. For current information and month-end results, visit americanfunds.com.
best companies, period, no matter where they are.”
A flexible approach
The best companies, the best investments — those can be pretty subjective. Thankfully, the focus and structure behind GFA allows portfolio managers and analysts to determine “best” as they see fit — and they’re not constrained by arbitrary definitions.
“There are growth funds out there that, when they say growth, they mean they invest in ‘growth’ stocks as determined by Morningstar or Russell, and it is often code for simply high valuation, which is not necessarily good for shareholder return,” Don says. “We’re about capital appreciation, flexibly seeking the best opportunities no matter how they appear. Often it’s a traditional growth company, sometimes it’s a turnaround or a down-and-out. We gravitate toward whatever we think is most attractive that fits our objective of capital appreciation.”

Making trades
Back in 1973, when GFA’s portfolio managers wanted to place an order, they picked up the phone and called the trading desk. In turn, the Los Angeles-based trader would call the appropriate broker and place the order. Within minutes —or sometimes longer — that order would be completed and the fund would own the stocks.
Today, the orders are computerized and the market is more complex. With a huge amount of trading volume, due in part to the advent of high-frequency trading, the fund’s traders work even harder. “Today, when we place an order, we’re talking about potentially hundreds of millions of dollars,” Jim says. “So sure, we can trade faster with computers, but to get the best price, that’s where the experience and knowledge of our traders comes in.”
With our long-term orientation, traders can afford to be patient, waiting out temporary fluctuations to find the best price. Furthermore, the multiple trades that are often necessary to purchase the desired amount of stock means that such fluctuations average out.
“It’s harder to make a very large trade than a very small one,” Don says, “but with our investment style, our low turnover rate and our long-term orientation, it’s not as hard as it might be for other funds, and we remain very effective at implementing our investment ideas.”
| The Growth Fund of America | 9 |
That human element is such a big advantage. You get to work with people for so long, to really get to understand where they’re coming from. You get challenged by new people coming in, too. The way it’s all managed is a big key to our success. — Mike Kerr
A history of returns
Fiscal-year total returns over GFA’s 40-year history

Positive vs. negative fiscal annual returns over 40 years

Lifetime average annual total return: 13.8%
In other words, the only real measure of growth is in the fund’s return, and the fund’s ability to continue growing investors’ money over time.
“Our job is to grow the capital,” Barry says. “We don’t necessarily just do it in growth companies. We do it in value companies, big companies, smaller companies, contrarian companies. If we were pigeonholed into just being a traditional growth stock fund, well, there have been times when that’s been a very popular and crowded part of the market, and our returns might not have been as good. I think having a balance has led to stronger results over time.”
Longevity within The Capital System
Forty years is a long time, and there have been hundreds of investment professionals, both analysts and portfolio managers, who have contributed to the fund’s success over the years. Unlike in other funds, where the management decisions are made by a handful of people, each of the fund’s 12 portfolio managers invest how they see fit, as do each of the dozens of analysts who participate in the fund’s research portfolio.
Changes happen. Portfolio managers assume different responsibilities, or retire. Some analysts often become portfolio managers in their own right, though many continue their analytical work as well. New analysts are hired to explore new markets and companies. But because of The Capital System, the fund adapts — and without the sharp shifts in management style that have sometimes plagued other long-running mutual funds.
“I’ve changed over the past 25 years as an investor, and the people around the table have changed over time, but the process hasn’t changed, and that’s one of the
The Growth Fund of America manages over $140 billion (as of 8/31/14) on behalf of its investors
| 10 | The Growth Fund of America |
 |  |  |
| | | |
| Barry Crosthwaite | Greg Wendt | Jim Rothenberg |
| Portfolio manager | Investment analyst | Portfolio manager |
incredible things about the system,” Greg says. “People have changed, gone on to different things, passed the torch. There’s new tech, new tools, new people, but I would argue that the real DNA of the fund — our process — stayed the same.”
The system also provides for adaptability as well as longevity. GFA’s investment professionals are among the longest-tenured managers and analysts in the mutual fund industry. Over time, their views and thoughts on the markets have evolved. Part of that is experience, and part of that is the consistent introduction of new ideas and new thinking into The Capital System through the people brought in as the fund has grown.
“That human element is such a big advantage,” Mike says. “You get to work with people for so long, to really get to understand where they’re coming from. You get challenged by new people coming in, too. The way it’s all managed is a big key to our success.”
The core mission
Today, The Growth Fund of America manages over $140 billion on behalf of its investors. To put that in perspective, back in 1973, the fund had just $17 million under management — and all the American Funds combined were worth just $3.3 billion.
With size has come challenges but the fund has met those challenges successfully. For example, portfolio managers and analysts have been added to help manage assets — another benefit of The Capital System. As another example, trading ever-larger blocks of stock required more sophisticated trading tools and the exceptional know-how of the fund’s trading desk professionals.
And yet the fund’s returns have not been hampered by its size. Some of its best years have been more recent, even with large assets, and vice versa, some poor years happened twenty and thirty years ago when the fund was much smaller. We believe the fund’s returns ultimately have been determined by the quality of the investment decisions over time, not by size, and we continue to believe that will be the case.
“At the end of the day, the goal is what it’s always been: growing investors’ money,” Don says. “Sure, things change a lot over four decades, and you adapt and grow and evolve with that. You face the challenges that the market gives you. We have a great system in place to make all that as smooth as possible. The fundamental approach to investing, though, that’s stayed the same.”
“To me, it’s nice to recognize this kind of anniversary,” Jim says. “But the real goal is looking at what we’ve done over the past 40 years and making sure we’re doing it for the next 10 years and beyond.” ¢
Rapid communications
In the 1970s, when GFA first joined the American Funds, investment meetings were held regularly to discuss ideas, but conference calls with European or East Coast offices were expensive and, thus, rare. Analysts’ reports were written on typewriters, reproduced via carbon-copy or mimeograph, and distributed by hand through the company’s offices. In some cases, they were mailed to offices around the country or overseas, arriving days later.
“Back then, if you missed the 4 p.m. delivery, you had to wait until the next day,” Mike says. “Tough luck.”
How times have changed.
“When I first got here in the 1980s, we had just gotten voice mail, and everyone complained about it,” Donnalisa says. “To the surprise of many, it quickly became important. When companies reported their earnings, analysts would leave their thoughts on voice mail, and we could access it at any time, from anywhere in the world. Today, we have email and instant messaging, so it’s even more robust, but back then, voice mail was huge.”
Donnalisa points to the advent of rapid, instant communication as an important milestone in the fund’s growth. “You can reach anyone in the world, on the phone, via email or telepresence or however you like. That kind of communication is so important. It lets us test our ideas with one another immediately and, if necessary, to act quickly to put them to work in the fund.”
And there’s a lot less paper; analysts’ reports are simply emailed as soon as they’re ready, ensuring near-instantaneous communication about critical events. “Of course, you still have to read,” Donnalisa notes. “That hasn’t changed — we read a lot!”
| The Growth Fund of America | 11 |
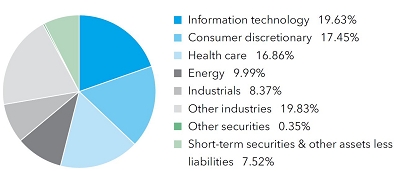
Summary investment portfolio August 31, 2014
| Industry sector diversification | Percent of net assets |
| Largest equity holdings | | Percent of
net assets | |
| Amazon | | | 4.11 | % |
| Gilead Sciences | | | 3.87 | |
| Google | | | 3.63 | |
| Comcast | | | 2.01 | |
| Home Depot | | | 1.74 | |
| EOG Resources | | | 1.70 | |
| UnitedHealth Group | | | 1.43 | |
| Amgen | | | 1.34 | |
| Microsoft | | | 1.29 | |
| Philip Morris | | | 1.15 | |
| | | | | |
| Common stocks 92.13% | | Shares | | | Value
(000) | |
| Information technology 19.63% | | | | | | |
| Google Inc., Class C1 | | | 4,812,697 | | | $ | 2,750,938 | |
| Google Inc., Class A1 | | | 4,333,597 | | | | 2,523,713 | |
| Microsoft Corp. | | | 41,312,600 | | | | 1,876,831 | |
| Oracle Corp. | | | 38,817,000 | | | | 1,612,070 | |
| Avago Technologies Ltd.2 | | | 17,601,820 | | | | 1,444,933 | |
| ASML Holding NV (New York registered) | | | 8,767,040 | | | | 842,688 | |
| ASML Holding NV | | | 5,109,442 | | | | 488,814 | |
| Apple Inc. | | | 12,511,000 | | | | 1,282,377 | |
| salesforce.com, inc.1 | | | 17,805,000 | | | | 1,052,097 | |
| Visa Inc., Class A | | | 4,898,000 | | | | 1,040,923 | |
| Texas Instruments Inc. | | | 20,134,000 | | | | 970,056 | |
| Intuit Inc. | | | 10,295,000 | | | | 856,338 | |
| LinkedIn Corp., Class A1 | | | 3,667,500 | | | | 827,938 | |
| Accenture PLC, Class A | | | 10,000,000 | | | | 810,600 | |
| Murata Manufacturing Co., Ltd. | | | 8,326,300 | | | | 794,978 | |
| Other securities | | | | | | | 9,333,351 | |
| | | | | | | | 28,508,645 | |
| | | | | | | | | |
| Consumer discretionary 17.45% | | | | | | | | |
| Amazon.com, Inc.1 | | | 17,597,195 | | | | 5,966,153 | |
| Comcast Corp., Class A | | | 40,263,578 | | | | 2,203,626 | |
| Comcast Corp., Class A, special nonvoting shares | | | 13,000,000 | | | | 709,800 | |
| Home Depot, Inc. | | | 26,961,200 | | | | 2,520,872 | |
| NIKE, Inc., Class B | | | 19,716,640 | | | | 1,548,742 | |
| Twenty-First Century Fox, Inc., Class A | | | 33,675,400 | | | | 1,192,783 | |
| Johnson Controls, Inc. | | | 15,525,000 | | | | 757,775 | |
| MGM Resorts International1,2 | | | 29,412,600 | | | | 719,726 | |
| Netflix, Inc.1 | | | 1,485,568 | | | | 709,567 | |
| Other securities | | | | | | | 9,004,534 | |
| | | | | | | | 25,333,578 | |
| | | | | | | | | |
| Health care 16.86% | | | | | | | | |
| Gilead Sciences, Inc.1 | | | 52,294,248 | | | | 5,625,815 | |
| UnitedHealth Group Inc. | | | 23,984,700 | | | | 2,078,994 | |
| Amgen Inc. | | | 13,911,100 | | | | 1,938,929 | |
| Alexion Pharmaceuticals, Inc.1 | | | 9,006,061 | | | | 1,524,636 | |
| Regeneron Pharmaceuticals, Inc.1 | | | 3,437,300 | | | | 1,204,842 | |
| Express Scripts Holding Co.1 | | | 16,285,600 | | | | 1,203,994 | |
| Biogen Idec Inc.1 | | | 3,302,200 | | | | 1,132,787 | |
| Illumina, Inc.1 | | | 5,471,701 | | | | 981,404 | |
| Vertex Pharmaceuticals Inc.1 | | | 10,105,600 | | | | 945,581 | |
| Other securities | | | | | | | 7,847,946 | |
| | | | | | | | 24,484,928 | |
| | | | | | | | | |
| 12 | The Growth Fund of America |
| | | Shares | | | Value
(000) | |
| Energy 9.99% | | | | | | | | |
| EOG Resources, Inc. | | | 22,494,000 | | | $ | 2,471,641 | |
| Concho Resources Inc.1,2 | | | 8,578,506 | | | | 1,218,491 | |
| Noble Energy, Inc. | | | 16,677,621 | | | | 1,203,124 | |
| Pioneer Natural Resources Co. | | | 5,132,900 | | | | 1,070,980 | |
| Schlumberger Ltd. | | | 8,950,000 | | | | 981,278 | |
| Cheniere Energy, Inc.1 | | | 11,859,300 | | | | 951,827 | |
| FMC Technologies, Inc.1,2 | | | 15,179,100 | | | | 938,675 | |
| Other securities | | | | | | | 5,664,850 | |
| | | | | | | | 14,500,866 | |
| | | | | | | | | |
| Industrials 8.37% | | | | | | | | |
| Union Pacific Corp. | | | 13,796,600 | | | | 1,452,368 | |
| Precision Castparts Corp. | | | 4,103,367 | | | | 1,001,468 | |
| American Airlines Group Inc. | | | 20,490,000 | | | | 797,266 | |
| Boeing Co. | | | 6,267,000 | | | | 794,656 | |
| United Continental Holdings, Inc.1 | | | 15,369,000 | | | | 731,718 | |
| CSX Corp. | | | 21,674,801 | | | | 669,968 | |
| Other securities | | | | | | | 6,713,016 | |
| | | | | | | | 12,160,460 | |
| | | | | | | | | |
| Financials 8.04% | | | | | | | | |
| Crown Castle International Corp. | | | 13,219,250 | | | | 1,051,063 | |
| Goldman Sachs Group, Inc. | | | 5,363,996 | | | | 960,745 | |
| American International Group, Inc. | | | 17,135,000 | | | | 960,588 | |
| Other securities | | | | | | | 8,694,862 | |
| | | | | | | | 11,667,258 | |
| | | | | | | | | |
| Consumer staples 4.01% | | | | | | | | |
| Philip Morris International Inc. | | | 19,579,433 | | | | 1,675,608 | |
| Costco Wholesale Corp. | | | 11,108,183 | | | | 1,344,979 | |
| Other securities | | | | | | | 2,809,278 | |
| | | | | | | | 5,829,865 | |
| | | | | | | | | |
| Materials 2.21% | | | | | | | | |
| Praxair, Inc. | | | 5,186,537 | | | | 682,289 | |
| Other securities | | | | | | | 2,521,410 | |
| | | | | | | | 3,203,699 | |
| | | | | | | | | |
| Other 0.90% | | | | | | | | |
| Other securities | | | | | | | 1,301,402 | |
| | | | | | | | | |
| Miscellaneous 4.67% | | | | | | | | |
| Other common stocks in initial period of acquisition | | | | | | | 6,787,901 | |
| | | | | | | | | |
| Total common stocks (cost: $74,462,381,000) | | | | | | | 133,778,602 | |
| | | | | | | | | |
| Preferred securities 0.07% | | | | | | | | |
| Miscellaneous 0.07% | | | | | | | | |
| Other preferred securities in initial period of acquisition | | | | | | | 92,503 | |
| | | | | | | | | |
| Total preferred securities (cost: $91,162,000) | | | | | | | 92,503 | |
| | | | | | | | | |
| Rights & warrants 0.08% | | | | | | | | |
| Other 0.05% | | | | | | | | |
| Other securities | | | | | | | 76,162 | |
| | | | | | | | | |
| Miscellaneous 0.03% | | | | | | | | |
| Other rights & warrants in initial period of acquisition | | | | | | | 45,120 | |
| | | | | | | | | |
| Total rights & warrants (cost: $122,540,000) | | | | | | | 121,282 | |
| | |
| The Growth Fund of America | 13 |
| Convertible bonds 0.04% | | Principal amount
(000) | | | Value
(000) | |
| Telecommunication services 0.04% | | | | | | | | |
| Other securities | | | | | | $ | 64,162 | |
| | | | | | | | | |
| Total convertible bonds (cost: $56,297,000) | | | | | | | 64,162 | |
| | | | | | | | | |
| Bonds, notes & other debt instruments 0.16% | | | | | | | |
| Other 0.16% | | | | | | | | |
| Other securities | | | | | | | 225,494 | |
| | | | | | | | | |
| Total bonds, notes & other debt instruments (cost: $213,508,000) | | | | | | | 225,494 | |
| | | | | | | | | |
| Short-term securities 7.56% | | | | | | | | |
| Fannie Mae 0.06%-0.15% due 9/2/2014-7/1/2015 | | $ | 2,351,795 | | | | 2,351,069 | |
| Federal Home Loan Bank 0.06%-0.17% due 9/5/2014-8/28/2015 | | | 3,220,844 | | | | 3,219,777 | |
| Freddie Mac 0.06%-0.17% due 9/17/2014-8/27/2015 | | | 3,070,380 | | | | 3,069,191 | |
| Google Inc. 0.11%-0.13% due 12/11/2014-1/21/20153 | | | 91,000 | | | | 90,962 | |
| Other securities | | | | | | | 2,245,155 | |
| | | | | | | | | |
| Total short-term securities (cost: $10,974,920,000) | | | | | | | 10,976,154 | |
| Total investment securities 100.04% (cost: $85,920,808,000) | | | | | | | 145,258,197 | |
| Other assets less liabilities (0.04)% | | | | | | | (56,437 | ) |
| | | | | | | | | |
| Net assets 100.00% | | | | | | $ | 145,201,760 | |
This summary investment portfolio is designed to streamline the report and help investors better focus on the fund’s principal holdings. See the inside back cover for details on how to obtain a complete schedule of portfolio holdings.
As permitted by U.S. Securities and Exchange Commission regulations, “Miscellaneous” securities include holdings in their first year of acquisition that have not previously been publicly disclosed.
“Other securities” includes all issues that are not disclosed separately in the summary investment portfolio, including securities which were valued under fair value procedures adopted by authority of the board of trustees. The securities which were valued under fair value procedures (with an aggregate value of $240,727,000, an aggregate cost of $281,325,000, and which represented .17% of the net assets of the fund) were acquired from 7/7/2000 to 6/26/2014 through private placement transactions exempt from registration under the Securities Act of 1933, which may subject them to legal or contractual restrictions on resale. “Other securites” also includes loan participations and assignments, which may be subject to legal or contractual restrictions on resale. The total value of all such loans was $34,958,000, which represented ..02% of the net assets of the fund.
Forward currency contracts
The fund has entered into a forward currency contract to sell currency as shown in the following table. The average notional amount of open forward currency contracts was $259,117,000 over the prior 12-month period.
| | | | | | | Contract amount | | | Unrealized appreciation | |
| | | Settlement date | | Counterparty | | Receive
(000) | | Deliver
(000) | | | at 8/31/2014 (000) | |
| Sales: | | | | | | | | | | | | |
| Japanese yen | | 9/18/2014 | | Barclays Bank PLC | | $84,894 | | ¥8,700,000 | | | $1,264 | |
| 14 | The Growth Fund of America |
Investments in affiliates
A company is an affiliate of the fund under the Investment Company Act of 1940 if the fund’s holdings in that company represent 5% or more of the outstanding voting shares. The value of the fund’s affiliated-company holdings is either shown in the summary investment portfolio or included in the value of “Other securities” under the respective industry sectors. Further details on such holdings and related transactions during the year ended August 31, 2014, appear below.
| | | Beginning
shares | | | Additions | | | Reductions | | | Ending
shares | | | Dividend
income
(000) | | | Value of
affiliates at
8/31/2014
(000) | |
| Avago Technologies Ltd. | | | 17,262,820 | | | | 720,655 | | | | 381,655 | | | | 17,601,820 | | | $ | 17,965 | | | $ | 1,444,933 | |
| Concho Resources Inc.1 | | | 4,287,506 | | | | 4,291,000 | | | | — | | | | 8,578,506 | | | | — | | | | 1,218,491 | |
| FMC Technologies, Inc.1 | | | 16,479,100 | | | | — | | | | 1,300,000 | | | | 15,179,100 | | | | — | | | | 938,675 | |
| MGM Resorts International1 | | | 10,000,000 | | | | 19,441,600 | | | | 29,000 | | | | 29,412,600 | | | | — | | | | 719,726 | |
| Edwards Lifesciences Corp.1 | | | 9,182,700 | | | | — | | | | 3,050,000 | | | | 6,132,700 | | | | — | | | | 608,732 | |
| Hologic, Inc.1 | | | 16,551,960 | | | | 575,000 | | | | — | | | | 17,126,960 | | | | — | | | | 425,948 | |
| Towers Watson & Co., Class A | | | 500,000 | | | | 3,490,000 | | | | 165,000 | | | | 3,825,000 | | | | 1,398 | | | | 419,335 | |
| Toll Brothers, Inc.1 | | | 5,625,000 | | | | 5,003,300 | | | | — | | | | 10,628,300 | | | | — | | | | 378,261 | |
| athenahealth, Inc.1 | | | — | | | | 2,522,484 | | | | — | | | | 2,522,484 | | | | — | | | | 364,348 | |
| AutoNation, Inc.1 | | | 6,000,000 | | | | — | | | | — | | | | 6,000,000 | | | | — | | | | 325,500 | |
| Herbalife Ltd. | | | — | | | | 7,079,619 | | | | 1,637,618 | | | | 5,442,001 | | | | 894 | | | | 277,433 | |
| Sprouts Farmers Market, Inc.1,4 | | | 900,725 | | | | 7,369,721 | | | | — | | | | 8,270,446 | | | | — | | | | 255,888 | |
| Oshkosh Corp. | | | 4,368,000 | | | | — | | | | — | | | | 4,368,000 | | | | 2,621 | | | | 217,002 | |
| Ocwen Financial Corp.1,4 | | | 4,922,481 | | | | 1,868,600 | | | | — | | | | 6,791,081 | | | | — | | | | 189,743 | |
| BioMarin Pharmaceutical Inc.1,5 | | | 8,525,693 | | | | 578,980 | | | | 1,809,300 | | | | 7,295,373 | | | | — | | | | — | |
| Celanese Corp., Series A5 | | | 8,875,000 | | | | — | | | | 2,575,000 | | | | 6,300,000 | | | | 5,891 | | | | — | |
| EOG Resources, Inc.5 | | | 14,789,237 | | | | 13,633,737 | | | | 5,928,974 | | | | 22,494,000 | | | | 11,511 | | | | — | |
| Gilead Sciences, Inc.1,5 | | | 81,106,200 | | | | 5,950,000 | | | | 34,761,952 | | | | 52,294,248 | | | | — | | | | — | |
| Rackspace Hosting, Inc.1,5 | | | 10,198,200 | | | | — | | | | 7,250,633 | | | | 2,947,567 | | | | — | | | | — | |
| | | | | | | | | | | | | | | | | | | $ | 40,280 | | | $ | 7,784,015 | |
The following footnotes apply to either the individual securities noted or one or more of the securities aggregated and listed as a single line item.
| 1 | Security did not produce income during the last 12 months. |
| 2 | Represents an affiliated company as defined under the Investment Company Act of 1940. |
| 3 | Acquired in a transaction exempt from registration under Rule 144A or Section 4(2) of the Securities Act of 1933. May be resold in the U.S. in transactions exempt from registration, normally to qualified institutional buyers. The total value of all such securities, including those in “Other securities,” was $1,628,700,000, which represented 1.12% of the net assets of the fund. |
| 4 | This security was an unaffiliated issuer in its initial period of acquisition at 8/31/2013; it was not publicly disclosed. |
| 5 | Unaffiliated issuer at 8/31/2014. |
Key to abbreviation
¥ = Japanese yen
See Notes to Financial Statements
| The Growth Fund of America | 15 |
Financial statements
| Statement of assets and liabilities | | | | |
| at August 31, 2014 | | | (dollars in thousands) |
| | | | | | | | | |
| Assets: | | | | | | | | |
| Investment securities, at value: | | | | | | | | |
| Unaffiliated issuers (cost: $80,600,050) | | $ | 137,474,182 | | | | | |
| Affiliated issuers (cost: $5,320,758) | | | 7,784,015 | | | $ | 145,258,197 | |
| Cash denominated in currencies other than U.S. dollars (cost: $3,733) | | | | | | | 3,733 | |
| Cash | | | | | | | 8,058 | |
| Unrealized appreciation on open forward currency contracts | | | | | | | 1,264 | |
| Receivables for: | | | | | | | | |
| Sales of investments | | | 170,024 | | | | | |
| Sales of fund’s shares | | | 97,091 | | | | | |
| Dividends and interest | | | 120,723 | | | | 387,838 | |
| | | | | | | | 145,659,090 | |
| Liabilities: | | | | | | | | |
| Payables for: | | | | | | | | |
| Purchases of investments | | | 192,223 | | | | | |
| Repurchases of fund’s shares | | | 145,408 | | | | | |
| Investment advisory services | | | 33,045 | | | | | |
| Services provided by related parties | | | 72,040 | | | | | |
| Trustees’ deferred compensation | | | 5,585 | | | | | |
| Other | | | 9,029 | | | | 457,330 | |
| Net assets at August 31, 2014 | | | | | | $ | 145,201,760 | |
| | | | | | | | | |
| Net assets consist of: | | | | | | | | |
| Capital paid in on shares of beneficial interest | | | | | | $ | 73,695,047 | |
| Undistributed net investment income | | | | | | | 315,492 | |
| Undistributed net realized gain | | | | | | | 11,860,185 | |
| Net unrealized appreciation | | | | | | | 59,331,036 | |
| Net assets at August 31, 2014 | | | | | | $ | 145,201,760 | |
(dollars and shares in thousands, except per-share amounts)
Shares of beneficial interest issued and outstanding (no stated par value) —
unlimited shares authorized (3,126,823 total shares outstanding)
| | | | | | | | Shares | | | | Net asset value | |
| | | | Net assets | | | | outstanding | | | | per share | |
| Class A | | $ | 73,975,023 | | | | 1,584,113 | | | $ | 46.70 | |
| Class B | | | 873,237 | | | | 19,476 | | | | 44.84 | |
| Class C | | | 6,231,765 | | | | 140,333 | | | | 44.41 | |
| Class F-1 | | | 10,569,395 | | | | 227,779 | | | | 46.40 | |
| Class F-2 | | | 8,636,656 | | | | 184,890 | | | | 46.71 | |
| Class 529-A | | | 5,799,068 | | | | 125,125 | | | | 46.35 | |
| Class 529-B | | | 158,917 | | | | 3,554 | | | | 44.71 | |
| Class 529-C | | | 1,440,078 | | | | 32,301 | | | | 44.58 | |
| Class 529-E | | | 263,250 | | | | 5,730 | | | | 45.94 | |
| Class 529-F-1 | | | 199,838 | | | | 4,313 | | | | 46.33 | |
| Class R-1 | | | 541,936 | | | | 12,076 | | | | 44.88 | |
| Class R-2 | | | 2,496,054 | | | | 55,261 | | | | 45.17 | |
| Class R-2E | | | 10 | | | | — | * | | | 46.70 | |
| Class R-3 | | | 8,325,311 | | | | 181,227 | | | | 45.94 | |
| Class R-4 | | | 7,835,108 | | | | 168,938 | | | | 46.38 | |
| Class R-5 | | | 5,449,491 | | | | 116,620 | | | | 46.73 | |
| Class R-6 | | | 12,406,623 | | | | 265,087 | | | | 46.80 | |
* Amount less than one thousand.
See Notes to Financial Statements
| 16 | The Growth Fund of America |
| Statement of operations | | | | |
| for the year ended August 31, 2014 | | | (dollars in thousands) |
| | | | | |
| Investment income: | | | | | | | | |
| Income: | | | | | | | | |
| Dividends (net of non-U.S. taxes of $27,257; also includes $40,280 from affiliates) | | $ | 1,421,089 | | | | | |
| Interest | | | 18,541 | | | $ | 1,439,630 | |
| Fees and expenses*: | | | | | | | | |
| Investment advisory services | | | 378,140 | | | | | |
| Distribution services | | | 378,249 | | | | | |
| Transfer agent services | | | 153,990 | | | | | |
| Administrative services | | | 40,125 | | | | | |
| Reports to shareholders | | | 4,784 | | | | | |
| Registration statement and prospectus | | | 1,662 | | | | | |
| Trustees’ compensation | | | 1,069 | | | | | |
| Auditing and legal | | | 205 | | | | | |
| Custodian | | | 2,461 | | | | | |
| Other | | | 7,300 | | | | 967,985 | |
| Net investment income | | | | | | | 471,645 | |
| | | | | | | | | |
| Net realized gain and unrealized appreciation on investments, forward currency contracts and currency: | | | | | | | | |
| Net realized gain (loss) on: | | | | | | | | |
| Investments (includes $1,872,417 net gain from affiliates) | | | 13,442,993 | | | | | |
| Forward currency contracts | | | 20,968 | | | | | |
| Currency transactions | | | (5,795 | ) | | | 13,458,166 | |
| Net unrealized appreciation (depreciation) on: | | | | | | | | |
| Investments (net of non-U.S. taxes of $7,413) | | | 16,096,676 | | | | | |
| Forward currency contracts | | | (246 | ) | | | | |
| Currency translations | | | (153 | ) | | | 16,096,277 | |
| Net realized gain and unrealized appreciation on investments, forward currency contracts and currency | | | | | | | 29,554,443 | |
| Net increase in net assets resulting from operations | | | | | | $ | 30,026,088 | |
* Additional information related to class-specific fees and expenses is included in the Notes to Financial Statements.
| Statements of changes in net assets | | | | | | |
| | | (dollars in thousands) |
| | | |
| | | Year ended August 31 | |
| | | 2014 | | | 2013 | |
| Operations: | | | | | | | | |
| Net investment income | | $ | 471,645 | | | $ | 656,608 | |
| Net realized gain on investments, forward currency contracts and currency transactions | | | 13,458,166 | | | | 11,559,114 | |
| Net unrealized appreciation on investments, forward currency contracts and currency translations | | | 16,096,277 | | | | 11,847,758 | |
| Net increase in net assets resulting from operations | | | 30,026,088 | | | | 24,063,480 | |
| | | | | | | | | |
| Dividends and distributions paid to shareholders: | | | | | | | | |
| Dividends from net investment income | | | (409,908 | ) | | | (865,227 | ) |
| Distributions from net realized gain on investments | | | (8,412,644 | ) | | | — | |
| Total dividends and distributions paid to shareholders | | | (8,822,552 | ) | | | (865,227 | ) |
| | | | | | | | | |
| Net capital share transactions | | | 507,086 | | | | (14,480,750 | ) |
| | | | | | | | | |
| Total increase in net assets | | | 21,710,622 | | | | 8,717,503 | |
| | | | | | | | | |
| Net assets: | | | | | | | | |
| Beginning of year | | | 123,491,138 | | | | 114,773,635 | |
| End of year (including undistributed net investment income: $315,492 and $259,434, respectively) | | $ | 145,201,760 | | | $ | 123,491,138 | |
See Notes to Financial Statements
| The Growth Fund of America | 17 |
Notes to financial statements
1. Organization
The Growth Fund of America (the “fund”) is registered under the Investment Company Act of 1940 as an open-end, diversified management investment company. The fund invests in a wide range of companies that appear to offer superior opportunities for growth of capital.
The fund has 17 share classes consisting of five retail share classes (Classes A, B and C, as well as two F share classes, F-1 and F-2), five 529 college savings plan share classes (Classes 529-A, 529-B, 529-C, 529-E and 529-F-1) and seven retirement plan share classes (Classes R-1, R-2, R-2E, R-3, R-4, R-5 and R-6). The 529 college savings plan share classes can be used to save for college education. The retirement plan share classes are generally offered only through eligible employer-sponsored retirement plans. The fund’s share classes are described further in the following table:
| Share class | | Initial sales charge | | Contingent deferred sales
charge upon redemption | | Conversion feature |
| Classes A and 529-A | | Up to 5.75% | | None (except 1% for certain redemptions within one year of purchase without an initial sales charge) | | None |
| Classes B and 529-B* | | None | | Declines from 5% to 0% for redemptions within six years of purchase | | Classes B and 529-B convert to Classes A and 529-A, respectively, after eight years |
| Class C | | None | | 1% for redemptions within one year of purchase | | Class C converts to Class F-1 after 10 years |
| Class 529-C | | None | | 1% for redemptions within one year of purchase | | None |
| Class 529-E | | None | | None | | None |
Classes F-1, F-2 and
529-F-1 | | None | | None | | None |
| Classes R-1, R-2, R-2E, R-3, R-4, R-5 and R-6 | | None | | None | | None |
* Class B and 529-B shares of the fund are not available for purchase.
On August 29, 2014, the fund made an additional retirement plan share class (Class R-2E) available for sale pursuant to an amendment to its registration statement filed with the U.S. Securities and Exchange Commission. Refer to the fund’s prospectus for more details.
Holders of all share classes have equal pro rata rights to the assets, dividends and liquidation proceeds of the fund. Each share class has identical voting rights, except for the exclusive right to vote on matters affecting only its class. Share classes have different fees and expenses (“class-specific fees and expenses”), primarily due to different arrangements for distribution, transfer agent and administrative services. Differences in class-specific fees and expenses will result in differences in net investment income and, therefore, the payment of different per-share dividends by each share class.
2. Significant accounting policies
The fund is an investment company that applies the accounting and reporting guidance issued in Topic 946 by the U.S. Financial Accounting Standards Board. The fund’s financial statements have been prepared to comply with U.S. generally accepted accounting principles (“U.S. GAAP”). These principles require the fund’s investment adviser to make estimates and assumptions that affect reported amounts and disclosures. Actual results could differ from those estimates. The fund follows the significant accounting policies described in this section, as well as the valuation policies described in the next section on valuation.
Security transactions and related investment income — Security transactions are recorded by the fund as of the date the trades are executed with brokers. Realized gains and losses from security transactions are determined based on the specific identified cost of the securities. In the event a security is purchased with a delayed payment date, the fund will segregate liquid assets sufficient to meet its payment obligations. Dividend income is recognized on the ex-dividend date and interest income is recognized on an accrual basis. Market discounts, premiums and original issue discounts on fixed-income securities are amortized daily over the expected life of the security.
| 18 | The Growth Fund of America |
Class allocations — Income, fees and expenses (other than class-specific fees and expenses) and realized and unrealized gains and losses are allocated daily among the various share classes based on their relative net assets. Class-specific fees and expenses, such as distribution, transfer agent and administrative services, are charged directly to the respective share class.
Dividends and distributions to shareholders — Dividends and distributions to shareholders are recorded on the ex-dividend date.
Currency translation — Assets and liabilities, including investment securities, denominated in currencies other than U.S. dollars are translated into U.S. dollars at the exchange rates supplied by one or more pricing vendors on the valuation date. Purchases and sales of investment securities and income and expenses are translated into U.S. dollars at the exchange rates on the dates of such transactions. The effects of changes in exchange rates on investment securities are included with the net realized gain or loss and net unrealized appreciation or depreciation on investments in the fund’s statement of operations. The realized gain or loss and unrealized appreciation or depreciation resulting from all other transactions denominated in currencies other than U.S. dollars are disclosed separately.
3. Valuation
Capital Research and Management Company (“CRMC”), the fund’s investment adviser, values the fund’s investments at fair value as defined by U.S. GAAP. The net asset value of each share class of the fund is generally determined as of approximately 4:00 p.m. New York time each day the New York Stock Exchange is open.
Methods and inputs — The fund’s investment adviser uses the following methods and inputs to establish the fair value of the fund’s assets and liabilities. Use of particular methods and inputs may vary over time based on availability and relevance as market and economic conditions evolve.
Equity securities are generally valued at the official closing price of, or the last reported sale price on, the exchange or market on which such securities are traded, as of the close of business on the day the securities are being valued or, lacking any sales, at the last available bid price. Prices for each security are taken from the principal exchange or market on which the security trades.
Fixed-income securities, including short-term securities, are generally valued at prices obtained from one or more pricing vendors. Vendors value such securities based on one or more of the inputs described in the following table. The table provides examples of inputs that are commonly relevant for valuing particular classes of fixed-income securities in which the fund is authorized to invest. However, these classifications are not exclusive, and any of the inputs may be used to value any other class of fixed-income security.
| Fixed-income class | | Examples of standard inputs |
| All | | Benchmark yields, transactions, bids, offers, quotations from dealers and trading systems, new issues, spreads and other relationships observed in the markets among comparable securities; and proprietary pricing models such as yield measures calculated using factors such as cash flows, financial or collateral performance and other reference data (collectively referred to as “standard inputs”) |
| Corporate bonds & notes; convertible securities | | Standard inputs and underlying equity of the issuer |
| Bonds & notes of governments & government agencies | | Standard inputs and interest rate volatilities |
When the fund’s investment adviser deems it appropriate to do so (such as when vendor prices are unavailable or deemed to be not representative), fixed-income securities will be valued in good faith at the mean quoted bid and ask prices that are reasonably and timely available (or bid prices, if ask prices are not available) or at prices for securities of comparable maturity, quality and type.
Securities with both fixed-income and equity characteristics, or equity securities traded principally among fixed-income dealers, are generally valued in the manner described for either equity or fixed-income securities, depending on which method is deemed most appropriate by the fund’s investment adviser. Forward currency contracts are valued at the mean of representative quoted bid and ask prices, generally based on prices supplied by one or more pricing vendors.
Securities and other assets for which representative market quotations are not readily available or are considered unreliable by the fund’s investment adviser are fair valued as determined in good faith under fair valuation guidelines adopted by authority of the fund’s board of trustees as further described. The investment adviser follows fair valuation guidelines, consistent with U.S. Securities and Exchange Commission rules and guidance, to consider relevant principles and factors when making fair value determinations. The investment adviser considers relevant indications of value that are reasonably and timely available to it in determining the fair value to be assigned to a particular security, such as the type and cost of the security; contractual or legal restrictions on resale of the security; relevant financial or
| The Growth Fund of America | 19 |
business developments of the issuer; actively traded similar or related securities; conversion or exchange rights on the security; related corporate actions; significant events occurring after the close of trading in the security; and changes in overall market conditions. In addition, the closing prices of equity securities that trade in markets outside U.S. time zones may be adjusted to reflect significant events that occur after the close of local trading but before the net asset value of each share class of the fund is determined. Fair valuations and valuations of investments that are not actively trading involve judgment and may differ materially from valuations that would have been used had greater market activity occurred.
Processes and structure — The fund’s board of trustees has delegated authority to the fund’s investment adviser to make fair value determinations, subject to board oversight. The investment adviser has established a Joint Fair Valuation Committee (the “Fair Valuation Committee”) to administer, implement and oversee the fair valuation process, and to make fair value decisions. The Fair Valuation Committee regularly reviews its own fair value decisions, as well as decisions made under its standing instructions to the investment adviser’s valuation teams. The Fair Valuation Committee reviews changes in fair value measurements from period to period and may, as deemed appropriate, update the fair valuation guidelines to better reflect the results of back testing and address new or evolving issues. The Fair Valuation Committee reports any changes to the fair valuation guidelines to the board of trustees with supplemental information to support the changes. The fund’s board and audit committee also regularly review reports that describe fair value determinations and methods.
The fund’s investment adviser has also established a Fixed-Income Pricing Review Group to administer and oversee the fixed-income valuation process, including the use of fixed-income pricing vendors. This group regularly reviews pricing vendor information and market data. Pricing decisions, processes and controls over security valuation are also subject to additional internal reviews, including an annual control self-evaluation program facilitated by the investment adviser’s compliance group.
Classifications — The fund’s investment adviser classifies the fund’s assets and liabilities into three levels based on the inputs used to value the assets or liabilities. Level 1 values are based on quoted prices in active markets for identical securities. Level 2 values are based on significant observable market inputs, such as quoted prices for similar securities and quoted prices in inactive markets. Certain securities trading outside the U.S. may transfer between Level 1 and Level 2 due to valuation adjustments resulting from significant market movements following the close of local trading. Level 3 values are based on significant unobservable inputs that reflect the investment adviser’s determination of assumptions that market participants might reasonably use in valuing the securities. The valuation levels are not necessarily an indication of the risk or liquidity associated with the underlying investment. For example, U.S. government securities are reflected as Level 2 because the inputs used to determine fair value may not always be quoted prices in an active market. The following tables present the fund’s valuation levels as of August 31, 2014 (dollars in thousands):
| | | Investment securities | |
| | | | Level 1* | | | | Level 2 | | | | Level 3 | | | | Total | |
| Assets: | | | | | | | | | | | | | | | | |
| Common stocks: | | | | | | | | | | | | | | | | |
| Information technology | | $ | 28,283,645 | | | $ | — | | | $ | 225,000 | | | $ | 28,508,645 | |
| Consumer discretionary | | | 25,333,578 | | | | — | | | | — | | | | 25,333,578 | |
| Health care | | | 24,484,928 | | | | — | | | | — | | | | 24,484,928 | |
| Energy | | | 14,485,139 | | | | — | | | | 15,727 | | | | 14,500,866 | |
| Industrials | | | 12,160,460 | | | | — | | | | — | | | | 12,160,460 | |
| Financials | | | 11,667,258 | | | | — | | | | — | | | | 11,667,258 | |
| Consumer staples | | | 5,829,865 | | | | — | | | | — | | | | 5,829,865 | |
| Materials | | | 3,203,699 | | | | — | | | | — | | | | 3,203,699 | |
| Other | | | 1,301,402 | | | | — | | | | — | | | | 1,301,402 | |
| Miscellaneous | | | 6,787,901 | | | | — | | | | — | | | | 6,787,901 | |
| Preferred securities | | | 92,503 | | | | — | | | | — | | | | 92,503 | |
| Rights & warrants | | | 121,282 | | | | — | | | | — | | | | 121,282 | |
| Convertible bonds | | | — | | | | 64,162 | | | | — | | | | 64,162 | |
| Bonds, notes & other debt instruments | | | — | | | | 225,494 | | | | — | | | | 225,494 | |
| Short-term securities | | | — | | | | 10,976,154 | | | | — | | | | 10,976,154 | |
| Total | | $ | 133,751,660 | | | $ | 11,265,810 | | | $ | 240,727 | | | $ | 145,258,197 | |
| 20 | The Growth Fund of America |
| | | Other investments† | |
| | | | Level 1 | | | | Level 2 | | | | Level 3 | | | | Total | |
| Assets: | | | | | | | | | | | | | | | | |
| Unrealized appreciation on open forward currency contracts | | $ | — | | | $ | 1,264 | | | $ | — | | | $ | 1,264 | |
| * | Securities with a value of $9,208,543,000, which represented 6.34% of the net assets of the fund, transferred from Level 2 to Level 1 since the prior fiscal year-end, primarily due to a lack of significant market movements following the close of local trading. |
| † | Forward currency contracts are not included in the investment portfolio. |
4. Risk factors
Investing in the fund may involve certain risks including, but not limited to, those described below.
Market conditions — The prices of, and the income generated by, the common stocks and other securities held by the fund may decline –sometimes rapidly or unpredictably – due to various factors, including events or conditions affecting the general economy or particular industries; overall market changes; local, regional or global political, social or economic instability; governmental or governmental agency responses to economic conditions; and currency, interest rate and commodity price fluctuations.
Issuer risks — The values of, and the income generated by, securities held by the fund may also decline in response to various factors directly related to the issuers of such securities, including reduced demand for an issuer’s goods or services, poor management performance and strategic initiatives such as mergers, acquisitions or dispositions and the market response to any such initiative.
Investing in growth-oriented stocks — Growth-oriented common stocks and other equity-type securities (such as preferred stocks, convertible preferred stocks and convertible bonds) may involve larger price swings and greater potential for loss than other types of investments.
Investing outside the U.S. — Securities of issuers domiciled outside the U.S., or with significant operations outside the U.S., may lose value because of adverse political, social, economic or market developments in the countries or regions in which the issuers operate. These securities may also lose value due to changes in foreign currency exchange rates against the U.S. dollar and/or currencies of other countries. Securities markets in certain countries may be more volatile and/or less liquid than those in the U.S. Investments outside the U.S. may also be subject to different accounting practices and different regulatory, legal and reporting standards, and may be more difficult to value, than those in the U.S. In addition, the value of investments outside the U.S. may be reduced by foreign taxes, including foreign withholding taxes on interest and dividends. Further, there may be increased risks of delayed settlement of securities purchased or sold by the fund. The risks of investing outside the U.S. may be heightened in connection with investments in emerging markets.
Management — The investment adviser to the fund actively manages the fund’s investments. Consequently, the fund is subject to the risk that the methods and analyses employed by the investment adviser in this process may not produce the desired results. This could cause the fund to lose value or its investment results to lag relevant benchmarks or other funds with similar objectives.
5. Certain investment techniques
Loan transactions — The fund has entered into loan transactions in which the fund acquires a loan either through an agent, by assignment from another holder, or as a participation interest in another holder’s portion of a loan. The loan is often administered by a financial institution that acts as agent for the holders of the loan, and the fund may be required to receive approval from the agent and/or borrower prior to the sale of the investment. The loan’s interest rate and maturity date may change based on the terms of the loan, including potential early payments of principal.
Forward currency contracts — The fund has entered into forward currency contracts, which represent agreements to exchange currencies on specific future dates at predetermined rates. The fund’s investment adviser uses forward currency contracts to manage the fund’s exposure to changes in exchange rates. Upon entering into these contracts, risks may arise from the potential inability of counterparties to meet the terms of their contracts and from possible movements in exchange rates.
On a daily basis, the fund’s investment adviser values forward currency contracts and records unrealized appreciation or depreciation for open forward currency contracts in the fund’s statement of assets and liabilities. Realized gains or losses are recorded at the time the forward currency contract is closed or offset by another contract with the same broker for the same settlement date and currency.
| The Growth Fund of America | 21 |
Closed forward currency contracts that have not reached their settlement date are included in the respective receivables or payables for closed forward currency contracts in the fund’s statement of assets and liabilities. Net realized gains or losses from closed forward currency contracts and net unrealized appreciation or depreciation from open forward currency contracts are recorded in the fund’s statement of operations.
The following tables present the financial statement impacts resulting from the fund’s use of forward currency contracts as of August 31, 2014 (dollars in thousands):
| | | Assets | | | Liabilities | |
| Contract | | Location on statement of
assets and liabilities | | | Value | | | Location on statement of
assets and liabilities | | | Value | |
| Forward currency | | Unrealized appreciation on open forward currency contracts | | $ | 1,264 | | | Unrealized depreciation on open forward currency contracts | | $ | — | |
| | | Net realized gain | | | Net unrealized depreciation | |
| Contract | | Location on statement of
operations | | | Value | | | Location on statement of
operations | | | Value | |
| Forward currency | | Net realized gain on forward currency contracts | | $ | 20,968 | | | Net unrealized depreciation on forward currency contracts | | $ | (246 | ) |
Collateral — The fund participates in a collateral program due to its use of forward currency contracts. The program calls for the fund to either receive or pledge collateral based on the net gain or loss on unsettled forward currency contracts by counterparty. The purpose of the collateral is to cover potential losses that could occur in the event that either party cannot meet its contractual obligations.
6. Taxation and distributions
Federal income taxation — The fund complies with the requirements under Subchapter M of the Internal Revenue Code applicable to mutual funds and intends to distribute substantially all of its net taxable income and net capital gains each year. The fund is not subject to income taxes to the extent such distributions are made. Therefore, no federal income tax provision is required.
As of and during the period ended August 31, 2014, the fund did not have a liability for any unrecognized tax benefits. The fund recognizes interest and penalties, if any, related to unrecognized tax benefits as income tax expense in the statement of operations. During the period, the fund did not incur any interest or penalties.
The fund is not subject to examination by U.S. federal tax authorities for tax years before 2010, by state tax authorities for tax years before 2009 and by tax authorities outside the U.S. for tax years before 2007.
Non-U.S. taxation — Dividend and interest income are recorded net of non-U.S. taxes paid. Gains realized by the fund on the sale of securities in certain countries are subject to non-U.S. taxes. The fund records a liability based on unrealized gains to provide for potential non-U.S. taxes payable upon the sale of these securities.
Distributions — Distributions paid to shareholders are based on net investment income and net realized gains determined on a tax basis, which may differ from net investment income and net realized gains for financial reporting purposes. These differences are due primarily to different treatment for items such as currency gains and losses; short-term capital gains and losses; capital losses related to sales of certain securities within 30 days of purchase; and unrealized appreciation of certain investments in securities outside the U.S. The fiscal year in which amounts are distributed may differ from the year in which the net investment income and net realized gains are recorded by the fund for financial reporting purposes. The fund may also designate a portion of the amount paid to redeeming shareholders as a distribution for tax purposes.
During the year ended August 31, 2014, the fund reclassified $5,589,000 and $90,000 from undistributed net investment income to undistributed net realized gain and capital paid in on shares of beneficial interest, respectively and $792,289,000 from undistributed net realized gain to capital paid in on shares of beneficial interest to align financial reporting with tax reporting.
| 22 | The Growth Fund of America |
As of August 31, 2014, the tax-basis components of distributable earnings, unrealized appreciation (depreciation) and cost of investment securities were as follows (dollars in thousands):
| Undistributed ordinary income | | $ | 335,585 | |
| Undistributed long-term capital gains | | | 12,065,769 | |
| Gross unrealized appreciation on investment securities | | | 60,144,811 | |
| Gross unrealized depreciation on investment securities | | | (1,026,249 | ) |
| Net unrealized appreciation on investment securities | | | 59,118,562 | |
| Cost of investment securities | | | 86,139,635 | |
The tax character of distributions paid to shareholders was as follows (dollars in thousands):
| | | Year ended August 31, 2014 | | | Year ended August 31, 2013 | |
| Share class | | Ordinary
income | | | Long-term
capital gains | | | Total
distributions
paid | | | Ordinary
income | | | Long-term
capital gains | | | Total
distributions
paid | |
| Class A | | $ | 213,008 | | | $ | 4,257,047 | | | $ | 4,470,055 | | | $ | 460,637 | | | $ | — | | | $ | 460,637 | |
| Class B | | | — | | | | 73,067 | | | | 73,067 | | | | — | | | | — | | | | — | |
| Class C | | | — | | | | 405,551 | | | | 405,551 | | | | 1,750 | | | | — | | | | 1,750 | |
| Class F-1 | | | 31,682 | | | | 746,681 | | | | 778,363 | | | | 86,604 | | | | — | | | | 86,604 | |
| Class F-2 | | | 29,050 | | | | 328,248 | | | | 357,298 | | | | 41,950 | | | | — | | | | 41,950 | |
| Class 529-A | | | 13,249 | | | | 324,205 | | | | 337,454 | | | | 31,604 | | | | — | | | | 31,604 | |
| Class 529-B | | | — | | | | 12,376 | | | | 12,376 | | | | — | | | | — | | | | — | |
| Class 529-C | | | — | | | | 84,925 | | | | 84,925 | | | | 645 | | | | — | | | | 645 | |
| Class 529-E | | | 78 | | | | 15,116 | | | | 15,194 | | | | 1,056 | | | | — | | | | 1,056 | |
| Class 529-F-1 | | | 791 | | | | 10,945 | | | | 11,736 | | | | 1,305 | | | | — | | | | 1,305 | |
| Class R-1 | | | — | | | | 33,348 | | | | 33,348 | | | | 153 | | | | — | | | | 153 | |
| Class R-2 | | | — | | | | 155,143 | | | | 155,143 | | | | 3,112 | | | | — | | | | 3,112 | |
| Class R-2E* | | | — | | | | — | | | | — | | | | | | | | | | | | | |
| Class R-3 | | | 2,312 | | | | 516,611 | | | | 518,923 | | | | 35,811 | | | | — | | | | 35,811 | |
| Class R-4 | | | 23,161 | | | | 477,099 | | | | 500,260 | | | | 54,792 | | | | — | | | | 54,792 | |
| Class R-5 | | | 32,633 | | | | 346,504 | | | | 379,137 | | | | 59,533 | | | | — | | | | 59,533 | |
| Class R-6 | | | 63,944 | | | | 625,778 | | | | 689,722 | | | | 86,275 | | | | — | | | | 86,275 | |
| Total | | $ | 409,908 | | | $ | 8,412,644 | | | $ | 8,822,552 | | | $ | 865,227 | | | $ | — | | | $ | 865,227 | |
* Class R-2E shares were offered beginning August 29, 2014.
7. Fees and transactions with related parties
CRMC, the fund’s investment adviser, is the parent company of American Funds Distributors,® Inc. (“AFD”), the principal underwriter of the fund’s shares, and American Funds Service Company® (“AFS”), the fund’s transfer agent. CRMC, AFD and AFS are considered related parties to the fund.
Investment advisory services — The fund has an investment advisory and service agreement with CRMC that provides for monthly fees accrued daily. These fees are based on a series of decreasing annual rates beginning with 0.500% on the first $1 billion of daily net assets and decreasing to 0.233% on such assets in excess of $210 billion. For the year ended August 31, 2014, the investment advisory services fee was $378,140,000, which was equivalent to an annualized rate of 0.276% of average daily net assets.
Class-specific fees and expenses — Expenses that are specific to individual share classes are accrued directly to the respective share class. The principal class-specific fees and expenses are further described below:
Distribution services — The fund has plans of distribution for all share classes, except Class F-2, R-5 and R-6 shares. Under the plans, the board of trustees approves certain categories of expenses that are used to finance activities primarily intended to sell fund shares and service existing accounts. The plans provide for payments, based on an annualized percentage of average daily net assets, ranging from 0.25% to 1.00% as noted in this section. In some cases, the board of trustees has limited the amounts that may be paid to less than the maximum allowed by the plans. All share classes with a plan may use up to 0.25% of average daily net assets to pay service fees, or to compensate AFD for paying service fees, to firms that have entered into agreements with AFD to provide certain shareholder services. The remaining amounts available to be paid under each plan are paid to dealers to compensate them for their sales activities.
| The Growth Fund of America | 23 |
For Class A and 529-A shares, distribution-related expenses include the reimbursement of dealer and wholesaler commissions paid by AFD for certain shares sold without a sales charge. These share classes reimburse AFD for amounts billed within the prior 15 months but only to the extent that the overall annual expense limit of 0.25% is not exceeded. As of August 31, 2014, there were no unreimbursed expenses subject to reimbursement for Class A or 529-A shares.
| Share class | | Currently approved limits | | Plan limits |
| Class A | | | 0.25 | % | | | 0.25 | % |
| Class 529-A | | | 0.25 | | | | 0.50 | |
| Classes B and 529-B | | | 1.00 | | | | 1.00 | |
| Classes C, 529-C and R-1 | | | 1.00 | | | | 1.00 | |
| Class R-2 | | | 0.75 | | | | 1.00 | |
| Class R-2E | | | 0.60 | | | | 0.85 | |
| Classes 529-E and R-3 | | | 0.50 | | | | 0.75 | |
| Classes F-1, 529-F-1 and R-4 | | | 0.25 | | | | 0.50 | |
Transfer agent services — The fund has a shareholder services agreement with AFS under which the fund compensates AFS for providing transfer agent services to each of the fund’s share classes. These services include recordkeeping, shareholder communications and transaction processing. In addition, the fund reimburses AFS for amounts paid to third parties for performing transfer agent services on behalf of fund shareholders.
Administrative services — The fund has an administrative services agreement with CRMC under which the fund compensates CRMC for providing administrative services to Class A, C, F, 529 and R shares. These services include, but are not limited to, coordinating, monitoring, assisting and overseeing third parties that provide services to fund shareholders. Under the agreement, Class A shares pay an annual fee of 0.01% and Class C, F, 529 and R shares pay an annual fee of 0.05% of their respective average daily net assets.
529 plan services — Each 529 share class is subject to service fees to compensate the Virginia College Savings Plan (“Virginia529”) for its oversight and administration of the 529 college savings plan. During the period September 1, 2013, to March 31, 2014, the quarterly fee was based on a series of decreasing annual rates beginning with 0.10% on the first $30 billion of the net assets invested in Class 529 shares of the American Funds and decreasing to 0.06% on such assets between $120 billion and $150 billion. Effective April 1, 2014, the quarterly fee was amended to provide for reduced annual rates of 0.07%, 0.06% and 0.05% over $30 billion, $50 billion and $70 billion, respectively, of the net assets invested in Class 529 shares of the American Funds. The fee for any given calendar quarter is accrued and calculated on the basis of the average net assets of Class 529 shares of the American Funds for the last month of the prior calendar quarter. The fee is included in other expenses in the fund’s statement of operations. Virginia529 is not considered a related party to the fund.
For the year ended August 31, 2014, class-specific expenses under the agreements were as follows (dollars in thousands):
| Share class | | Distribution
services | | Transfer agent
services | | Administrative
services | | 529 plan
services |
| Class A | | $164,870 | | $ 88,879 | | $ 6,994 | | Not applicable |
| Class B | | 10,474 | | 1,357 | | Not applicable | | Not applicable |
| Class C | | 62,248 | | 7,780 | | 3,121 | | Not applicable |
| Class F-1 | | 29,506 | | 12,884 | | 5,922 | | Not applicable |
| Class F-2 | | Not applicable | | 5,605 | | 2,893 | | Not applicable |
| Class 529-A | | 11,670 | | 5,167 | | 2,685 | | $5,027 |
| Class 529-B | | 1,810 | | 203 | | 91 | | 172 |
| Class 529-C | | 13,431 | | 1,381 | | 676 | | 1,266 |
| Class 529-E | | 1,229 | | 160 | | 124 | | 231 |
| Class 529-F-1 | | — | | 175 | | 91 | | 171 |
| Class R-1 | | 5,225 | | 534 | | 262 | | Not applicable |
| Class R-2 | | 18,159 | | 7,290 | | 1,220 | | Not applicable |
| Class R-2E* | | — | | — | | — | | Not applicable |
| Class R-3 | | 40,669 | | 12,103 | | 4,100 | | Not applicable |
| Class R-4 | | 18,958 | | 7,692 | | 3,831 | | Not applicable |
| Class R-5 | | Not applicable | | 2,742 | | 2,770 | | Not applicable |
| Class R-6 | | Not applicable | | 38 | | 5,345 | | Not applicable |
| Total class-specific expenses | | $378,249 | | $153,990 | | $40,125 | | $6,867 |
*Class R-2E shares were offered beginning August 29, 2014.
| 24 | The Growth Fund of America |
Trustees’ deferred compensation — Trustees who are unaffiliated with CRMC may elect to defer the cash payment of part or all of their compensation. These deferred amounts, which remain as liabilities of the fund, are treated as if invested in shares of the fund or other American Funds. These amounts represent general, unsecured liabilities of the fund and vary according to the total returns of the selected funds. Trustees’ compensation of $1,069,000 in the fund’s statement of operations includes $336,000 in current fees (either paid in cash or deferred) and a net increase of $733,000 in the value of the deferred amounts.
Affiliated officers and trustees — Officers and certain trustees of the fund are or may be considered to be affiliated with CRMC, AFD and AFS. No affiliated officers or trustees received any compensation directly from the fund.
8. Capital share transactions
Capital share transactions in the fund were as follows (dollars and shares in thousands):
| | | Sales1 | | | Reinvestments of
dividends and distributions | | | Repurchases1 | | | Net increase
(decrease) | |
| Share class | | Amount | | | Shares | | | Amount | | | Shares | | | Amount | | | Shares | | | Amount | | | Shares | |
| | | | | | | | | | | | | | | | | | | | | | | | | | | |
| Year ended August 31, 2014 | | | | | | | | | | | | | | | | | | | | | | | | | | |
| Class A | | $ | 4,872,369 | | | | 112,000 | | | $ | 4,400,188 | | | | 104,866 | | | $ | (8,746,833 | ) | | | (200,482 | ) | | $ | 525,724 | | | | 16,384 | |
| Class B | | | 11,914 | | | | 283 | | | | 72,274 | | | | 1,785 | | | | (539,076 | ) | | | (12,858 | ) | | | (454,888 | ) | | | (10,790 | ) |
| Class C | | | 589,215 | | | | 14,177 | | | | 395,280 | | | | 9,852 | | | | (1,669,594 | ) | | | (40,112 | ) | | | (685,099 | ) | | | (16,083 | ) |
| Class F-1 | | | 1,966,996 | | | | 45,494 | | | | 766,656 | | | | 18,385 | | | | (5,162,516 | ) | | | (117,797 | ) | | | (2,428,864 | ) | | | (53,918 | ) |
| Class F-2 | | | 4,197,627 | | | | 94,539 | | | | 336,879 | | | | 8,040 | | | | (1,163,863 | ) | | | (26,782 | ) | | | 3,370,643 | | | | 75,797 | |
| Class 529-A | | | 520,202 | | | | 12,020 | | | | 337,362 | | | | 8,098 | | | | (547,317 | ) | | | (12,568 | ) | | | 310,247 | | | | 7,550 | |
| Class 529-B | | | 2,827 | | | | 67 | | | | 12,374 | | | | 306 | | | | (79,301 | ) | | | (1,891 | ) | | | (64,100 | ) | | | (1,518 | ) |
| Class 529-C | | | 141,556 | | | | 3,384 | | | | 84,892 | | | | 2,107 | | | | (172,142 | ) | | | (4,094 | ) | | | 54,306 | | | | 1,397 | |
| Class 529-E | | | 22,555 | | | | 526 | | | | 15,192 | | | | 367 | | | | (29,542 | ) | | | (683 | ) | | | 8,205 | | | | 210 | |
| Class 529-F-1 | | | 33,200 | | | | 767 | | | | 11,729 | | | | 282 | | | | (29,923 | ) | | | (689 | ) | | | 15,006 | | | | 360 | |
| Class R-1 | | | 51,488 | | | | 1,227 | | | | 33,311 | | | | 822 | | | | (104,301 | ) | | | (2,481 | ) | | | (19,502 | ) | | | (432 | ) |
| Class R-2 | | | 408,882 | | | | 9,666 | | | | 155,043 | | | | 3,801 | | | | (711,243 | ) | | | (16,802 | ) | | | (147,318 | ) | | | (3,335 | ) |
| Class R-2E2 | | | 10 | | | | — | 3 | | | — | | | | — | | | | — | | | | — | | | | 10 | | | | — | 3 |
| Class R-3 | | | 1,103,363 | | | | 25,691 | | | | 517,551 | | | | 12,510 | | | | (2,337,394 | ) | | | (54,505 | ) | | | (716,480 | ) | | | (16,304 | ) |
| Class R-4 | | | 1,226,995 | | | | 28,344 | | | | 499,936 | | | | 11,995 | | | | (2,251,635 | ) | | | (52,055 | ) | | | (524,704 | ) | | | (11,716 | ) |
| Class R-5 | | | 832,003 | | | | 19,162 | | | | 378,067 | | | | 9,023 | | | | (1,890,849 | ) | | | (43,521 | ) | | | (680,779 | ) | | | (15,336 | ) |
| Class R-6 | | | 3,126,918 | | | | 71,442 | | | | 689,522 | | | | 16,437 | | | | (1,871,761 | ) | | | (42,841 | ) | | | 1,944,679 | | | | 45,038 | |
| Total net increase (decrease) | | $ | 19,108,120 | | | | 438,789 | | | $ | 8,706,256 | | | | 208,676 | | | $ | (27,307,290 | ) | | | (630,161 | ) | | $ | 507,086 | | | | 17,304 | |
| | | | | | | | | | | | | | | | | | | | | | | | | | | | | | | | | |
| Year ended August 31, 2013 | | | | | | | | | | | | | | | | | | | | | | | | | | |
| Class A | | $ | 4,492,422 | | | | 122,892 | | | $ | 451,232 | | | | 13,079 | | | $ | (9,332,251 | ) | | | (258,414 | ) | | $ | (4,388,597 | ) | | | (122,443 | ) |
| Class B | | | 13,799 | | | | 392 | | | | — | | | | — | | | | (614,447 | ) | | | (17,570 | ) | | | (600,648 | ) | | | (17,178 | ) |
| Class C | | | 505,548 | | | | 14,285 | | | | 1,694 | | | | 51 | | | | (1,414,883 | ) | | | (40,536 | ) | | | (907,641 | ) | | | (26,200 | ) |
| Class F-1 | | | 1,673,543 | | | | 45,834 | | | | 84,930 | | | | 2,476 | | | | (4,051,727 | ) | | | (113,863 | ) | | | (2,293,254 | ) | | | (65,553 | ) |
| Class F-2 | | | 1,762,467 | | | | 50,183 | | | | 38,930 | | | | 1,130 | | | | (1,058,403 | ) | | | (29,172 | ) | | | 742,994 | | | | 22,141 | |
| Class 529-A | | | 487,981 | | | | 13,489 | | | | 31,589 | | | | 922 | | | | (511,469 | ) | | | (14,104 | ) | | | 8,101 | | | | 307 | |
| Class 529-B | | | 3,184 | | | | 89 | | | | — | | | | — | | | | (87,389 | ) | | | (2,499 | ) | | | (84,205 | ) | | | (2,410 | ) |
| Class 529-C | | | 125,360 | | | | 3,560 | | | | 645 | | | | 19 | | | | (161,130 | ) | | | (4,566 | ) | | | (35,125 | ) | | | (987 | ) |
| Class 529-E | | | 21,404 | | | | 597 | | | | 1,056 | | | | 31 | | | | (26,386 | ) | | | (732 | ) | | | (3,926 | ) | | | (104 | ) |
| Class 529-F-1 | | | 31,035 | | | | 854 | | | | 1,304 | | | | 38 | | | | (28,006 | ) | | | (772 | ) | | | 4,333 | | | | 120 | |
| Class R-1 | | | 51,840 | | | | 1,452 | | | | 153 | | | | 5 | | | | (159,190 | ) | | | (4,606 | ) | | | (107,197 | ) | | | (3,149 | ) |
| Class R-2 | | | 449,759 | | | | 12,665 | | | | 3,110 | | | | 92 | | | | (794,993 | ) | | | (22,549 | ) | | | (342,124 | ) | | | (9,792 | ) |
| Class R-3 | | | 1,197,017 | | | | 33,228 | | | | 35,719 | | | | 1,049 | | | | (2,896,115 | ) | | | (81,919 | ) | | | (1,663,379 | ) | | | (47,642 | ) |
| Class R-4 | | | 1,136,740 | | | | 31,443 | | | | 54,759 | | | | 1,598 | | | | (3,577,592 | ) | | | (100,915 | ) | | | (2,386,093 | ) | | | (67,874 | ) |
| Class R-5 | | | 868,262 | | | | 23,625 | | | | 59,353 | | | | 1,723 | | | | (3,035,036 | ) | | | (85,729 | ) | | | (2,107,421 | ) | | | (60,381 | ) |
| Class R-6 | | | 2,637,427 | | | | 72,034 | | | | 86,216 | | | | 2,499 | | | | (3,040,211 | ) | | | (83,759 | ) | | | (316,568 | ) | | | (9,226 | ) |
| Total net increase (decrease) | | $ | 15,457,788 | | | | 426,622 | | | $ | 850,690 | | | | 24,712 | | | $ | (30,789,228 | ) | | | (861,705 | ) | | $ | (14,480,750 | ) | | | (410,371 | ) |
| 1 | Includes exchanges between share classes of the fund. |
| 2 | Class R-2E shares were offered beginning August 29, 2014. |
| 3 | Amount less than one thousand. |
| The Growth Fund of America | 25 |
9. Investment transactions
The fund made purchases and sales of investment securities, excluding short-term securities and U.S. government obligations, if any, of $32,616,567,000 and $39,942,992,000, respectively, during the year ended August 31, 2014.
| 26 | The Growth Fund of America |
Financial highlights
| | | | | Income (loss) from
investment operations1 | | Dividends and distributions | | | | | | | | | | | | | | |
| | | Net asset
value,
beginning
of period | | Net
investment
income
(loss) | | | Net gains
on
securities
(both
realized and
unrealized | | Total from
investment
operations | | Dividends
(from net
investment
income) | | | Distributions
(from capital
gains) | | | Total
dividends
and
distributions | | | Net asset
value,
end
of period | | Total
return2 | | | Net assets,
end of period
(in millions) | | Ratio of
expenses to
average net
assets | | | Ratio of
net income
(loss) to
average
net assets | |
| Class A: | | | | | | | | | | | | | | | | | | | | | | | | | | | | | | | | | | | | | | | | | | | |
| Year ended 8/31/2014 | | $ | 39.93 | | $ | .17 | | | $ | 9.49 | | $ | 9.66 | | $ | (.14 | ) | | $ | (2.75 | ) | | $ | (2.89 | ) | | $ | 46.70 | | | 25.00 | % | | $ | 73,975 | | | .66 | % | | | .39 | % |
| Year ended 8/31/2013 | | | 32.80 | | | .22 | | | | 7.19 | | | 7.41 | | | (.28 | ) | | | — | | | | (.28 | ) | | | 39.93 | | | 22.74 | | | | 62,602 | | | .70 | | | | .60 | |
| Year ended 8/31/2012 | | | 29.23 | | | .20 | | | | 3.59 | | | 3.79 | | | (.22 | ) | | | — | | | | (.22 | ) | | | 32.80 | | | 13.07 | | | | 55,441 | | | .71 | | | | .66 | |
| Year ended 8/31/2011 | | | 25.53 | | | .20 | | | | 3.75 | | | 3.95 | | | (.25 | ) | | | — | | | | (.25 | ) | | | 29.23 | | | 15.42 | | | | 57,082 | | | .68 | | | | .67 | |
| Year ended 8/31/2010 | | | 24.93 | | | .21 | | | | .60 | | | .81 | | | (.21 | ) | | | — | | | | (.21 | ) | | | 25.53 | | | 3.20 | | | | 57,890 | | | .69 | | | | .76 | |
| Class B: | | | | | | | | | | | | | | | | | | | | | | | | | | | | | | | | | | | | | | | | | | | |
| Year ended 8/31/2014 | | | 38.60 | | | (.15 | ) | | | 9.14 | | | 8.99 | | | — | | | | (2.75 | ) | | | (2.75 | ) | | | 44.84 | | | 24.05 | | | | 873 | | | 1.41 | | | | (.37 | ) |
| Year ended 8/31/2013 | | | 31.69 | | | (.05 | ) | | | 6.96 | | | 6.91 | | | — | | | | — | | | | — | | | | 38.60 | | | 21.81 | | | | 1,168 | | | 1.46 | | | | (.14 | ) |
| Year ended 8/31/2012 | | | 28.23 | | | (.03 | ) | | | 3.49 | | | 3.46 | | | — | | | | — | | | | — | | | | 31.69 | | | 12.26 | | | | 1,503 | | | 1.46 | | | | (.10 | ) |
| Year ended 8/31/2011 | | | 24.65 | | | (.03 | ) | | | 3.61 | | | 3.58 | | | — | | | | — | | | | — | | | | 28.23 | | | 14.52 | | | | 2,228 | | | 1.43 | | | | (.09 | ) |
| Year ended 8/31/2010 | | | 24.08 | | | — | 3 | | | .58 | | | .58 | | | (.01 | ) | | | — | | | | (.01 | ) | | | 24.65 | | | 2.42 | | | | 2,911 | | | 1.45 | | | | (.01 | ) |
| Class C: | | | | | | | | | | | | | | | | | | | | | | | | | | | | | | | | | | | | | | | | | | | |
| Year ended 8/31/2014 | | | 38.27 | | | (.17 | ) | | | 9.06 | | | 8.89 | | | — | | | | (2.75 | ) | | | (2.75 | ) | | | 44.41 | | | 23.99 | | | | 6,232 | | | 1.45 | | | | (.41 | ) |
| Year ended 8/31/2013 | | | 31.44 | | | (.07 | ) | | | 6.91 | | | 6.84 | | | (.01 | ) | | | — | | | | (.01 | ) | | | 38.27 | | | 21.76 | | | | 5,986 | | | 1.50 | | | | (.20 | ) |
| Year ended 8/31/2012 | | | 28.02 | | | (.04 | ) | | | 3.46 | | | 3.42 | | | — | | | | — | | | | — | | | | 31.44 | | | 12.21 | | | | 5,741 | | | 1.49 | | | | (.13 | ) |
| Year ended 8/31/2011 | | | 24.49 | | | (.03 | ) | | | 3.58 | | | 3.55 | | | (.02 | ) | | | — | | | | (.02 | ) | | | 28.02 | | | 14.51 | | | | 6,539 | | | 1.46 | | | | (.12 | ) |
| Year ended 8/31/2010 | | | 23.96 | | | — | 3 | | | .57 | | | .57 | | | (.04 | ) | | | — | | | | (.04 | ) | | | 24.49 | | | 2.38 | | | | 6,959 | | | 1.47 | | | | (.02 | ) |
| Class F-1: | | | | | | | | | | | | | | | | | | | | | | | | | | | | | | | | | | | | | | | | | | | |
| Year ended 8/31/2014 | | | 39.69 | | | .15 | | | | 9.43 | | | 9.58 | | | (.12 | ) | | | (2.75 | ) | | | (2.87 | ) | | | 46.40 | | | 24.93 | | | | 10,569 | | | .69 | | | | .36 | |
| Year ended 8/31/2013 | | | 32.61 | | | .21 | | | | 7.15 | | | 7.36 | | | (.28 | ) | | | — | | | | (.28 | ) | | | 39.69 | | | 22.71 | | | | 11,180 | | | .71 | | | | .59 | |
| Year ended 8/31/2012 | | | 29.04 | | | .21 | | | | 3.58 | | | 3.79 | | | (.22 | ) | | | — | | | | (.22 | ) | | | 32.61 | | | 13.15 | | | | 11,323 | | | .68 | | | | .69 | |
| Year ended 8/31/2011 | | | 25.37 | | | .20 | | | | 3.72 | | | 3.92 | | | (.25 | ) | | | — | | | | (.25 | ) | | | 29.04 | | | 15.40 | | | | 13,023 | | | .67 | | | | .67 | |
| Year ended 8/31/2010 | | | 24.78 | | | .21 | | | | .60 | | | .81 | | | (.22 | ) | | | — | | | | (.22 | ) | | | 25.37 | | | 3.22 | | | | 14,714 | | | .67 | | | | .79 | |
| Class F-2: | | | | | | | | | | | | | | | | | | | | | | | | | | | | | | | | | | | | | | | | | | | |
| Year ended 8/31/2014 | | | 39.95 | | | .27 | | | | 9.48 | | | 9.75 | | | (.24 | ) | | | (2.75 | ) | | | (2.99 | ) | | | 46.71 | | | 25.27 | | | | 8,637 | | | .43 | | | | .62 | |
| Year ended 8/31/2013 | | | 32.83 | | | .32 | | | | 7.19 | | | 7.51 | | | (.39 | ) | | | — | | | | (.39 | ) | | | 39.95 | | | 23.05 | | | | 4,358 | | | .44 | | | | .86 | |
| Year ended 8/31/2012 | | | 29.25 | | | .28 | | | | 3.60 | | | 3.88 | | | (.30 | ) | | | — | | | | (.30 | ) | | | 32.83 | | | 13.42 | | | | 2,855 | | | .44 | | | | .93 | |
| Year ended 8/31/2011 | | | 25.55 | | | .28 | | | | 3.74 | | | 4.02 | | | (.32 | ) | | | — | | | | (.32 | ) | | | 29.25 | | | 15.69 | | | | 3,717 | | | .43 | | | | .91 | |
| Year ended 8/31/2010 | | | 24.97 | | | .28 | | | | .59 | | | .87 | | | (.29 | ) | | | — | | | | (.29 | ) | | | 25.55 | | | 3.43 | | | | 3,884 | | | .44 | | | | 1.02 | |
| Class 529-A: | | | | | | | | | | | | | | | | | | | | | | | | | | | | | | | | | | | | | | | | | | | |
| Year ended 8/31/2014 | | | 39.66 | | | .13 | | | | 9.42 | | | 9.55 | | | (.11 | ) | | | (2.75 | ) | | | (2.86 | ) | | | 46.35 | | | 24.89 | | | | 5,799 | | | .74 | | | | .31 | |
| Year ended 8/31/2013 | | | 32.59 | | | .19 | | | | 7.15 | | | 7.34 | | | (.27 | ) | | | — | | | | (.27 | ) | | | 39.66 | | | 22.65 | | | | 4,663 | | | .77 | | | | .52 | |
| Year ended 8/31/2012 | | | 29.06 | | | .18 | | | | 3.57 | | | 3.75 | | | (.22 | ) | | | — | | | | (.22 | ) | | | 32.59 | | | 13.00 | | | | 3,822 | | | .77 | | | | .60 | |
| Year ended 8/31/2011 | | | 25.39 | | | .19 | | | | 3.72 | | | 3.91 | | | (.24 | ) | | | — | | | | (.24 | ) | | | 29.06 | | | 15.38 | | | | 3,358 | | | .73 | | | | .62 | |
| Year ended 8/31/2010 | | | 24.81 | | | .20 | | | | .59 | | | .79 | | | (.21 | ) | | | — | | | | (.21 | ) | | | 25.39 | | | 3.14 | | | | 2,793 | | | .73 | | | | .73 | |
| Class 529-B: | | | | | | | | | | | | | | | | | | | | | | | | | | | | | | | | | | | | | | | | | | | |
| Year ended 8/31/2014 | | | 38.54 | | | (.20 | ) | | | 9.12 | | | 8.92 | | | — | | | | (2.75 | ) | | | (2.75 | ) | | | 44.71 | | | 23.90 | | | | 159 | | | 1.53 | | | | (.49 | ) |
| Year ended 8/31/2013 | | | 31.67 | | | (.09 | ) | | | 6.96 | | | 6.87 | | | — | | | | — | | | | — | | | | 38.54 | | | 21.69 | | | | 195 | | | 1.56 | | | | (.25 | ) |
| Year ended 8/31/2012 | | | 28.25 | | | (.06 | ) | | | 3.48 | | | 3.42 | | | — | | | | — | | | | — | | | | 31.67 | | | 12.11 | | | | 237 | | | 1.57 | | | | (.21 | ) |
| Year ended 8/31/2011 | | | 24.69 | | | (.06 | ) | | | 3.62 | | | 3.56 | | | — | | | | — | | | | — | | | | 28.25 | | | 14.42 | | | | 310 | | | 1.53 | | | | (.19 | ) |
| Year ended 8/31/2010 | | | 24.14 | | | (.02 | ) | | | .59 | | | .57 | | | (.02 | ) | | | — | | | | (.02 | ) | | | 24.69 | | | 2.36 | | | | 358 | | | 1.53 | | | | (.08 | ) |
| The Growth Fund of America | 27 |
Financial highlights
| | | | | Income (loss) from
investment operations1 | | Dividends and distributions | | | |
| | | Net asset
value,
beginning
of period | | Net
investment
income
(loss) | | | Net gains
on
securities
(both
realized and
unrealized | | Total from
investment
operations | | Dividends
(from net
investment
income) | | | Distributions
(from capital
gains) | | | Total
dividends
and
distributions | | | Net asset
value,
end
of period | | Total
return2 | | | Net assets,
end of period
(in millions) | | Ratio of
expenses to
average net
assets | | | Ratio of
net income
(loss) to
average
net assets | |
| Class 529-C: | | | | | | | | | | | | | | | | | | | | | | | | | | | | | | | | | | | | | | | | | | | |
| Year ended 8/31/2014 | | $ | 38.43 | | $ | (.20 | ) | | $ | 9.10 | | $ | 8.90 | | $ | — | | | $ | (2.75 | ) | | $ | (2.75 | ) | | $ | 44.58 | | | 23.91 | % | | $ | 1,440 | | | 1.52 | % | | | (.47 | )% |
| Year ended 8/31/2013 | | | 31.60 | | | (.09 | ) | | | 6.94 | | | 6.85 | | | (.02 | ) | | | — | | | | (.02 | ) | | | 38.43 | | | 21.69 | | | | 1,188 | | | 1.56 | | | | (.26 | ) |
| Year ended 8/31/2012 | | | 28.18 | | | (.06 | ) | | | 3.48 | | | 3.42 | | | — | | | | — | | | | — | | | | 31.60 | | | 12.14 | | | | 1,008 | | | 1.56 | | | | (.19 | ) |
| Year ended 8/31/2011 | | | 24.66 | | | (.05 | ) | | | 3.60 | | | 3.55 | | | (.03 | ) | | | — | | | | (.03 | ) | | | 28.18 | | | 14.40 | | | | 934 | | | 1.53 | | | | (.18 | ) |
| Year ended 8/31/2010 | | | 24.13 | | | (.02 | ) | | | .59 | | | .57 | | | (.04 | ) | | | — | | | | (.04 | ) | | | 24.66 | | | 2.33 | | | | 811 | | | 1.53 | | | | (.07 | ) |
| Class 529-E: | | | | | | | | | | | | | | | | | | | | | | | | | | | | | | | | | | | | | | | | | | | |
| Year ended 8/31/2014 | | | 39.34 | | | .03 | | | | 9.33 | | | 9.36 | | | (.01 | ) | | | (2.75 | ) | | | (2.76 | ) | | | 45.94 | | | 24.57 | | | | 263 | | | .99 | | | | .06 | |
| Year ended 8/31/2013 | | | 32.33 | | | .10 | | | | 7.10 | | | 7.20 | | | (.19 | ) | | | — | | | | (.19 | ) | | | 39.34 | | | 22.36 | | | | 217 | | | 1.02 | | | | .28 | |
| Year ended 8/31/2012 | | | 28.82 | | | .10 | | | | 3.54 | | | 3.64 | | | (.13 | ) | | | — | | | | (.13 | ) | | | 32.33 | | | 12.71 | | | | 182 | | | 1.03 | | | | .35 | |
| Year ended 8/31/2011 | | | 25.19 | | | .10 | | | | 3.69 | | | 3.79 | | | (.16 | ) | | | — | | | | (.16 | ) | | | 28.82 | | | 15.04 | | | | 165 | | | 1.01 | | | | .34 | |
| Year ended 8/31/2010 | | | 24.63 | | | .12 | | | | .59 | | | .71 | | | (.15 | ) | | | — | | | | (.15 | ) | | | 25.19 | | | 2.83 | | | | 142 | | | 1.02 | | | | .44 | |
| Class 529-F-1: | | | | | | | | | | | | | | | | | | | | | | | | | | | | | | | | | | | | | | | | | | | |
| Year ended 8/31/2014 | | | 39.64 | | | .23 | | | | 9.41 | | | 9.64 | | | (.20 | ) | | | (2.75 | ) | | | (2.95 | ) | | | 46.33 | | | 25.16 | | | | 200 | | | .52 | | | | .53 | |
| Year ended 8/31/2013 | | | 32.57 | | | .27 | | | | 7.14 | | | 7.41 | | | (.34 | ) | | | — | | | | (.34 | ) | | | 39.64 | | | 22.92 | | | | 157 | | | .56 | | | | .74 | |
| Year ended 8/31/2012 | | | 29.04 | | | .25 | | | | 3.56 | | | 3.81 | | | (.28 | ) | | | — | | | | (.28 | ) | | | 32.57 | | | 13.27 | | | | 125 | | | .56 | | | | .81 | |
| Year ended 8/31/2011 | | | 25.38 | | | .25 | | | | 3.71 | | | 3.96 | | | (.30 | ) | | | — | | | | (.30 | ) | | | 29.04 | | | 15.56 | | | | 106 | | | .52 | | | | .83 | |
| Year ended 8/31/2010 | | | 24.79 | | | .25 | | | | .60 | | | .85 | | | (.26 | ) | | | — | | | | (.26 | ) | | | 25.38 | | | 3.37 | | | | 92 | | | .52 | | | | .94 | |
| Class R-1: | | | | | | | | | | | | | | | | | | | | | | | | | | | | | | | | | | | | | | | | | | | |
| Year ended 8/31/2014 | | | 38.64 | | | (.16 | ) | | | 9.15 | | | 8.99 | | | — | | | | (2.75 | ) | | | (2.75 | ) | | | 44.88 | | | 24.02 | | | | 542 | | | 1.43 | | | | (.38 | ) |
| Year ended 8/31/2013 | | | 31.72 | | | (.05 | ) | | | 6.98 | | | 6.93 | | | (.01 | ) | | | — | | | | (.01 | ) | | | 38.64 | | | 21.86 | | | | 483 | | | 1.44 | | | | (.13 | ) |
| Year ended 8/31/2012 | | | 28.26 | | | (.02 | ) | | | 3.48 | | | 3.46 | | | — | | | | — | | | | — | | | | 31.72 | | | 12.24 | | | | 497 | | | 1.44 | | | | (.07 | ) |
| Year ended 8/31/2011 | | | 24.72 | | | (.03 | ) | | | 3.63 | | | 3.60 | | | (.06 | ) | | | — | | | | (.06 | ) | | | 28.26 | | | 14.54 | | | | 561 | | | 1.43 | | | | (.09 | ) |
| Year ended 8/31/2010 | | | 24.19 | | | — | 3 | | | .60 | | | .60 | | | (.07 | ) | | | — | | | | (.07 | ) | | | 24.72 | | | 2.45 | | | | 539 | | | 1.44 | | | | .02 | |
| Class R-2: | | | | | | | | | | | | | | | | | | | | | | | | | | | | | | | | | | | | | | | | | | | |
| Year ended 8/31/2014 | | | 38.85 | | | (.14 | ) | | | 9.21 | | | 9.07 | | | — | | | | (2.75 | ) | | | (2.75 | ) | | | 45.17 | | | 24.10 | | | | 2,496 | | | 1.38 | | | | (.33 | ) |
| Year ended 8/31/2013 | | | 31.91 | | | (.02 | ) | | | 7.01 | | | 6.99 | | | (.05 | ) | | | — | | | | (.05 | ) | | | 38.85 | | | 21.92 | | | | 2,277 | | | 1.37 | | | | (.07 | ) |
| Year ended 8/31/2012 | | | 28.42 | | | (.01 | ) | | | 3.50 | | | 3.49 | | | — | | | | — | | | | — | | | | 31.91 | | | 12.28 | | | | 2,182 | | | 1.41 | | | | (.04 | ) |
| Year ended 8/31/2011 | | | 24.84 | | | (.01 | ) | | | 3.64 | | | 3.63 | | | (.05 | ) | | | — | | | | (.05 | ) | | | 28.42 | | | 14.60 | | | | 2,337 | | | 1.39 | | | | (.04 | ) |
| Year ended 8/31/2010 | | | 24.30 | | | .01 | | | | .59 | | | .60 | | | (.06 | ) | | | — | | | | (.06 | ) | | | 24.84 | | | 2.44 | | | | 2,327 | | | 1.41 | | | | .04 | |
| Class R-2E: | | | | | | | | | | | | | | | | | | | | | | | | | | | | | | | | | | | | | | | | | | | |
| Period from 8/29/2014 to 8/31/20144,5 | | | 46.70 | | | — | | | | — | | | — | | | — | | | | — | | | | — | | | | 46.70 | | | — | | | | — | 6 | | — | | | | — | |
| Class R-3: | | | | | | | | | | | | | | | | | | | | | | | | | | | | | | | | | | | | | | | | | | | |
| Year ended 8/31/2014 | | | 39.33 | | | .03 | | | | 9.34 | | | 9.37 | | | (.01 | ) | | | (2.75 | ) | | | (2.76 | ) | | | 45.94 | | | 24.60 | | | | 8,325 | | | .98 | | | | .07 | |
| Year ended 8/31/2013 | | | 32.29 | | | .12 | | | | 7.08 | | | 7.20 | | | (.16 | ) | | | — | | | | (.16 | ) | | | 39.33 | | | 22.38 | | | | 7,769 | | | .98 | | | | .33 | |
| Year ended 8/31/2012 | | | 28.74 | | | .11 | | | | 3.55 | | | 3.66 | | | (.11 | ) | | | — | | | | (.11 | ) | | | 32.29 | | | 12.78 | | | | 7,916 | | | .98 | | | | .38 | |
| Year ended 8/31/2011 | | | 25.12 | | | .11 | | | | 3.68 | | | 3.79 | | | (.17 | ) | | | — | | | | (.17 | ) | | | 28.74 | | | 15.06 | | | | 10,765 | | | .97 | | | | .38 | |
| Year ended 8/31/2010 | | | 24.55 | | | .13 | | | | .60 | | | .73 | | | (.16 | ) | | | — | | | | (.16 | ) | | | 25.12 | | | 2.94 | | | | 11,422 | | | .97 | | | | .48 | |
| 28 | The Growth Fund of America |
| | | | | Income (loss) from
investment operations1 | | Dividends and distributions | | | | | | | | | | | | | | |
| | | Net asset
value,
beginning
of period | | Net
investment
income
(loss) | | | Net gains
on
securities
(both
realized and
unrealized | | Total from
investment
operations | | Dividends
(from net
investment
income) | | | Distributions
(from capital
gains) | | | Total
dividends
and
distributions | | | Net asset
value,
end
of period | | Total
return2 | | | Net assets,
end of period
(in millions) | | Ratio of
expenses to
average net
assets | | | Ratio of
net income
(loss) to
average
net assets | |
| Class R-4: | | | | | | | | | | | | | | | | | | | | | | | | | | | | | | | | | | | | | | | | | | | |
| Year ended 8/31/2014 | | $ | 39.68 | | $ | .16 | | | $ | 9.42 | | $ | 9.58 | | $ | (.13 | ) | | $ | (2.75 | ) | | $ | (2.88 | ) | | $ | 46.38 | | | 24.97 | % | | $ | 7,835 | | | .68 | % | | | .37 | % |
| Year ended 8/31/2013 | | | 32.56 | | | .23 | | | | 7.14 | | | 7.37 | | | (.25 | ) | | | — | | | | (.25 | ) | | | 39.68 | | | 22.77 | | | | 7,169 | | | .68 | | | | .63 | |
| Year ended 8/31/2012 | | | 28.99 | | | .20 | | | | 3.57 | | | 3.77 | | | (.20 | ) | | | — | | | | (.20 | ) | | | 32.56 | | | 13.10 | | | | 8,093 | | | .69 | | | | .66 | |
| Year ended 8/31/2011 | | | 25.33 | | | .20 | | | | 3.71 | | | 3.91 | | | (.25 | ) | | | — | | | | (.25 | ) | | | 28.99 | | | 15.40 | | | | 14,937 | | | .68 | | | | .66 | |
| Year ended 8/31/2010 | | | 24.75 | | | .21 | | | | .60 | | | .81 | | | (.23 | ) | | | — | | | | (.23 | ) | | | 25.33 | | | 3.20 | | | | 16,442 | | | .68 | | | | .77 | |
| Class R-5: | | | | | | | | | | | | | | | | | | | | | | | | | | | | | | | | | | | | | | | | | | | |
| Year ended 8/31/2014 | | | 39.96 | | | .29 | | | | 9.49 | | | 9.78 | | | (.26 | ) | | | (2.75 | ) | | | (3.01 | ) | | | 46.73 | | | 25.33 | | | | 5,450 | | | .38 | | | | .67 | |
| Year ended 8/31/2013 | | | 32.82 | | | .34 | | | | 7.18 | | | 7.52 | | | (.38 | ) | | | — | | | | (.38 | ) | | | 39.96 | | | 23.11 | | | | 5,273 | | | .39 | | | | .92 | |
| Year ended 8/31/2012 | | | 29.24 | | | .29 | | | | 3.60 | | | 3.89 | | | (.31 | ) | | | — | | | | (.31 | ) | | | 32.82 | | | 13.48 | | | | 6,312 | | | .39 | | | | .97 | |
| Year ended 8/31/2011 | | | 25.54 | | | .29 | | | | 3.74 | | | 4.03 | | | (.33 | ) | | | — | | | | (.33 | ) | | | 29.24 | | | 15.75 | | | | 11,366 | | | .38 | | | | .96 | |
| Year ended 8/31/2010 | | | 24.94 | | | .29 | | | | .60 | | | .89 | | | (.29 | ) | | | — | | | | (.29 | ) | | | 25.54 | | | 3.51 | | | | 12,874 | | | .39 | | | | 1.07 | |
| Class R-6: | | | | | | | | | | | | | | | | | | | | | | | | | | | | | | | | | | | | | | | | | | | |
| Year ended 8/31/2014 | | | 40.02 | | | .31 | | | | 9.50 | | | 9.81 | | | (.28 | ) | | | (2.75 | ) | | | (3.03 | ) | | | 46.80 | | | 25.39 | | | | 12,407 | | | .33 | | | | .72 | |
| Year ended 8/31/2013 | | | 32.87 | | | .35 | | | | 7.21 | | | 7.56 | | | (.41 | ) | | | — | | | | (.41 | ) | | | 40.02 | | | 23.19 | | | | 8,806 | | | .34 | | | | .96 | |
| Year ended 8/31/2012 | | | 29.30 | | | .31 | | | | 3.60 | | | 3.91 | | | (.34 | ) | | | — | | | | (.34 | ) | | | 32.87 | | | 13.52 | | | | 7,537 | | | .34 | | | | 1.02 | |
| Year ended 8/31/2011 | | | 25.60 | | | .31 | | | | 3.74 | | | 4.05 | | | (.35 | ) | | | — | | | | (.35 | ) | | | 29.30 | | | 15.78 | | | | 10,059 | | | .33 | | | | 1.02 | |
| Year ended 8/31/2010 | | | 24.97 | | | .31 | | | | .60 | | | .91 | | | (.28 | ) | | | — | | | | (.28 | ) | | | 25.60 | | | 3.58 | | | | 6,061 | | | .34 | | | | 1.16 | |
| | | Year ended August 31 |
| | | 2014 | | 2013 | | 2012 | | 2011 | | 2010 |
| Portfolio turnover rate for all share classes | | | 26 | % | | | 27 | % | | | 18 | % | | | 34 | % | | | 33 | % |
| 1 | Based on average shares outstanding. |
| 2 | Total returns exclude any applicable sales charges, including contingent deferred sales charges. |
| 3 | Amount less than $.01. |
| 4 | Based on operations for the period shown and, accordingly, is not representative of a full year. |
| 5 | Class R-2E shares were offered beginning August 29, 2014. |
| 6 | Amount less than $1 million. |
See Notes to Financial Statements
| The Growth Fund of America | 29 |
Report of Independent Registered Public Accounting Firm
To the Shareholders and Board of Trustees of The Growth Fund of America:
We have audited the accompanying statement of assets and liabilities of The Growth Fund of America (the “Fund”), including the summary investment portfolio, as of August 31, 2014, and the related statement of operations for the year then ended, the statements of changes in net assets for each of the two years in the period then ended, and the financial highlights for each of the periods presented. These financial statements and financial highlights are the responsibility of the Fund’s management. Our responsibility is to express an opinion on these financial statements and financial highlights based on our audits.
We conducted our audits in accordance with the standards of the Public Company Accounting Oversight Board (United States). Those standards require that we plan and perform the audit to obtain reasonable assurance about whether the financial statements and financial highlights are free of material misstatement. The Fund is not required to have, nor were we engaged to perform, an audit of its internal control over financial reporting. Our audits included consideration of internal control over financial reporting as a basis for designing audit procedures that are appropriate in the circumstances, but not for the purpose of expressing an opinion on the effectiveness of the Fund’s internal control over financial reporting. Accordingly, we express no such opinion. An audit also includes examining, on a test basis, evidence supporting the amounts and disclosures in the financial statements, assessing the accounting principles used and significant estimates made by management, as well as evaluating the overall financial statement presentation. Our procedures included confirmation of securities owned as of August 31, 2014, by correspondence with the custodian and brokers; where replies were not received from brokers, we performed other auditing procedures. We believe that our audits provide a reasonable basis for our opinion.
In our opinion, such financial statements and financial highlights referred to above present fairly, in all material respects, the financial position of The Growth Fund of America as of August 31, 2014, the results of its operations for the year then ended, the changes in its net assets for each of the two years in the period then ended, and the financial highlights for each of the periods presented, in conformity with accounting principles generally accepted in the United States of America.
Deloitte & Touche LLP
Costa Mesa, California
October 7, 2014
| 30 | The Growth Fund of America |
As a fund shareholder, you incur two types of costs: (1) transaction costs, such as initial sales charges on purchase payments and contingent deferred sales charges on redemptions (loads), and (2) ongoing costs, including management fees, distribution and service (12b-1) fees, and other expenses. This example is intended to help you understand your ongoing costs (in dollars) of investing in the fund so you can compare these costs with the ongoing costs of investing in other mutual funds. The example is based on an investment of $1,000 invested at the beginning of the period and held for the entire six-month period (March 1, 2014, through August 31, 2014).
Actual expenses:
The first line of each share class in the table on the following page provides information about actual account values and actual expenses. You may use the information in this line, together with the amount you invested, to estimate the expenses that you paid over the period. Simply divide your account value by $1,000 (for example, an $8,600 account value divided by $1,000 = 8.6), then multiply the result by the number in the first line under the heading entitled “Expenses paid during period” to estimate the expenses you paid on your account during this period.
Hypothetical example for comparison purposes:
The second line of each share class in the table on the following page provides information about hypothetical account values and hypothetical expenses based on the actual expense ratio for the share class and an assumed rate of return of 5.00% per year before expenses, which is not the actual return of the share class. The hypothetical account values and expenses may not be used to estimate the actual ending account balance or expenses you paid for the period. You may use this information to compare the ongoing costs of investing in the fund and other funds. To do so, compare this 5.00% hypothetical example with the 5.00% hypothetical examples that appear in the shareholder reports of the other funds.
Notes:
Retirement plan participants may be subject to certain fees charged by the plan sponsor, and Class F-1, F-2 and 529-F-1 shareholders may be subject to fees charged by financial intermediaries, typically ranging from 0.75% to 1.50% of assets annually depending on services offered. You can estimate the impact of these fees by adding the amount of the fees to the total estimated expenses you paid on your account during the period as calculated above. In addition, your ending account value would be lower by the amount of these fees.
Note that the expenses shown in the table on the following page are meant to highlight your ongoing costs only and do not reflect any transactional costs, such as sales charges (loads). Therefore, the second line of each share class in the table is useful in comparing ongoing costs only and will not help you determine the relative total costs of owning different funds. In addition, if these transactional costs were included, your costs would have been higher.
| The Growth Fund of America | 31 |
| | | Beginning | | Ending | | | | |
| | | account value | | account value | | Expenses paid | | Annualized |
| | | 3/1/2014 | | 8/31/2014 | | during period* | | expense ratio |
| Class A – actual return | | $ | 1,000.00 | | | $ | 1,052.99 | | | $ | 3.36 | | | | .65 | % |
| Class A – assumed 5% return | | | 1,000.00 | | | | 1,021.93 | | | | 3.31 | | | | .65 | |
| Class B – actual return | | | 1,000.00 | | | | 1,049.12 | | | | 7.23 | | | | 1.40 | |
| Class B – assumed 5% return | | | 1,000.00 | | | | 1,018.15 | | | | 7.12 | | | | 1.40 | |
| Class C – actual return | | | 1,000.00 | | | | 1,048.88 | | | | 7.49 | | | | 1.45 | |
| Class C – assumed 5% return | | | 1,000.00 | | | | 1,017.90 | | | | 7.37 | | | | 1.45 | |
| Class F-1 – actual return | | | 1,000.00 | | | | 1,052.86 | | | | 3.57 | | | | .69 | |
| Class F-1 – assumed 5% return | | | 1,000.00 | | | | 1,021.73 | | | | 3.52 | | | | .69 | |
| Class F-2 – actual return | | | 1,000.00 | | | | 1,054.15 | | | | 2.23 | | | | .43 | |
| Class F-2 – assumed 5% return | | | 1,000.00 | | | | 1,023.04 | | | | 2.19 | | | | .43 | |
| Class 529-A – actual return | | | 1,000.00 | | | | 1,052.70 | | | | 3.78 | | | | .73 | |
| Class 529-A – assumed 5% return | | | 1,000.00 | | | | 1,021.53 | | | | 3.72 | | | | .73 | |
| Class 529-B – actual return | | | 1,000.00 | | | | 1,048.32 | | | | 7.85 | | | | 1.52 | |
| Class 529-B – assumed 5% return | | | 1,000.00 | | | | 1,017.54 | | | | 7.73 | | | | 1.52 | |
| Class 529-C – actual return | | | 1,000.00 | | | | 1,048.43 | | | | 7.80 | | | | 1.51 | |
| Class 529-C – assumed 5% return | | | 1,000.00 | | | | 1,017.59 | | | | 7.68 | | | | 1.51 | |
| Class 529-E – actual return | | | 1,000.00 | | | | 1,051.25 | | | | 5.07 | | | | .98 | |
| Class 529-E – assumed 5% return | | | 1,000.00 | | | | 1,020.27 | | | | 4.99 | | | | .98 | |
| Class 529-F-1 – actual return | | | 1,000.00 | | | | 1,053.68 | | | | 2.64 | | | | .51 | |
| Class 529-F-1 – assumed 5% return | | | 1,000.00 | | | | 1,022.63 | | | | 2.60 | | | | .51 | |
| Class R-1 – actual return | | | 1,000.00 | | | | 1,048.85 | | | | 7.38 | | | | 1.43 | |
| Class R-1 – assumed 5% return | | | 1,000.00 | | | | 1,018.00 | | | | 7.27 | | | | 1.43 | |
| Class R-2 – actual return | | | 1,000.00 | | | | 1,049.25 | | | | 7.13 | | | | 1.38 | |
| Class R-2 – assumed 5% return | | | 1,000.00 | | | | 1,018.25 | | | | 7.02 | | | | 1.38 | |
| Class R-3 – actual return | | | 1,000.00 | | | | 1,051.25 | | | | 5.07 | | | | .98 | |
| Class R-3 – assumed 5% return | | | 1,000.00 | | | | 1,020.27 | | | | 4.99 | | | | .98 | |
| Class R-4 – actual return | | | 1,000.00 | | | | 1,052.87 | | | | 3.52 | | | | .68 | |
| Class R-4 – assumed 5% return | | | 1,000.00 | | | | 1,021.78 | | | | 3.47 | | | | .68 | |
| Class R-5 – actual return | | | 1,000.00 | | | | 1,054.37 | | | | 1.97 | | | | .38 | |
| Class R-5 – assumed 5% return | | | 1,000.00 | | | | 1,023.29 | | | | 1.94 | | | | .38 | |
| Class R-6 – actual return | | | 1,000.00 | | | | 1,054.54 | | | | 1.71 | | | | .33 | |
| Class R-6 – assumed 5% return | | | 1,000.00 | | | | 1,023.54 | | | | 1.68 | | | | .33 | |
| * | The “expenses paid during period” are equal to the “annualized expense ratio,” multiplied by the average account value over the period, multiplied by the number of days in the period, and divided by 365 (to reflect the one-half year period). |
We are required to advise you of the federal tax status of certain distributions received by shareholders during the fiscal year. The fund hereby designates the following amounts for the fund’s fiscal year ended August 31, 2014:
| Long-term capital gains | $8,669,098,000 |
| Qualified dividend income | 100% |
| Corporate dividends received deduction | 100% |
| U.S. government income that may be exempt from state taxation | $1,542,000 |
Individual shareholders should refer to their Form 1099 or other tax information, which will be mailed in January 2015, to determine the calendar year amounts to be included on their 2014 tax returns. Shareholders should consult their tax advisors.
| 32 | The Growth Fund of America |
Approval of Investment Advisory and Service Agreement
The Growth Fund of America board has approved the fund’s Investment Advisory and Service Agreement (the “agreement”) with Capital Research and Management Company (“CRMC”) for an additional one-year term through November 30, 2015. The board approved the agreement following the recommendation of the fund’s Contracts Committee (the “committee”), which is composed of all of the fund’s independent board members. The board and the committee determined that the fund’s advisory fee structure was fair and reasonable in relation to the services provided and that approving the agreement was in the best interests of the fund and its shareholders.
In reaching this decision, the board and the committee took into account information furnished to them throughout the year and otherwise provided to them, as well as information prepared specifically in connection with their review of the agreement, and were advised by their independent counsel. They considered the following factors, among others, but did not identify any single issue or particular piece of information that, in isolation, was the controlling factor, and each board and committee member did not necessarily attribute the same weight to each factor.
1. Nature, extent and quality of services
The board and the committee considered the depth and quality of CRMC’s investment management process, including its global research capabilities; the experience, capability and integrity of its senior management and other personnel; the low turnover rates of its key personnel; the overall financial strength and stability of CRMC and the Capital Group organization; and the ongoing evolution of CRMC’s organizational structure designed to maintain and strengthen these qualities. The board and the committee also considered the nature, extent and quality of administrative, compliance and shareholder services provided by CRMC to the fund under the agreement and other agreements, as well as the benefits to fund shareholders from investing in a fund that is part of a large family of funds. The board and the committee concluded that the nature, extent and quality of the services provided by CRMC have benefited and should continue to benefit the fund and its shareholders.
2. Investment results
The board and the committee considered the investment results of the fund in light of its objective of pursuing growth of capital. They compared the fund’s investment results with those of other relevant funds (including funds that form the basis of the Lipper index for the category in which the fund is included), and data such as relevant market and fund indexes, over various periods through March 31, 2014. This report, including the letter to shareholders and related disclosures, contains certain information about the fund’s investment results. The board and the committee reviewed the fund’s investment results measured against various indexes, including the Lipper Growth Funds Index, the Lipper Large-Cap Core Funds Index, the Lipper Large-Cap Growth Funds Index, and the S&P 500 Index. They noted that the investment results of the fund generally compared favorably to these four indexes for the lifetime period, the 20-year period, and the 10-year period and were mixed for shorter periods. The board and the committee concluded that the fund’s investment results have been satisfactory for renewal of the agreement and that CRMC’s record in managing the fund indicated that its continued management should benefit the fund and its shareholders.
3. Advisory fees and total expenses
The board and the committee compared the advisory fees and total expense levels of the fund to those of other relevant funds. They observed that the fund’s advisory fees and expenses generally compared favorably to those of other similar funds included in the Lipper Growth Funds category. The board and the committee also considered the breakpoint discounts in the fund’s advisory fee structure that reduce the level of fees charged by CRMC to the fund as fund assets increase. In addition, they reviewed information regarding the effective advisory fees charged to non-mutual fund clients by CRMC and its affiliates. They noted that, to the extent there were differences between the advisory fees paid by the fund and the advisory fees paid by those clients, the differences appropriately reflected the investment, operational and regulatory differences between advising the fund and the other clients. The board and the committee concluded that the fund’s cost structure was fair and reasonable in relation to the services provided, and that the fund’s shareholders receive reasonable value in return for the advisory fees and other amounts paid to CRMC by the fund.
| The Growth Fund of America | 33 |
4. Ancillary benefits
The board and the committee considered a variety of other benefits that CRMC and its affiliates receive as a result of CRMC’s relationship with the fund and the other American Funds, including fees for administrative services provided to certain share classes; fees paid to CRMC’s affiliated transfer agent; sales charges and distribution fees received and retained by the fund’s principal underwriter, an affiliate of CRMC; and possible ancillary benefits to CRMC and its institutional management affiliates in managing other investment vehicles. The board and the committee reviewed CRMC’s portfolio trading practices, noting that while CRMC receives the benefit of research provided by broker-dealers executing portfolio transactions on behalf of the fund, it does not obtain third-party research or other services in return for allocating brokerage to such broker-dealers. The board and the committee took these ancillary benefits into account in evaluating the reasonableness of the advisory fees and other amounts paid to CRMC by the fund.
5. Adviser financial information
The board and the committee reviewed information regarding CRMC’s costs of providing services to the American Funds, including personnel, systems and resources of investment, compliance, trading, accounting and other administrative operations. They considered CRMC’s costs and willingness to invest in technology, infrastructure and staff to maintain and expand services and capabilities, respond to industry and regulatory developments, and attract and retain qualified personnel. They noted information regarding the compensation structure for CRMC’s investment professionals. The board and the committee also compared CRMC’s profitability and compensation data to the reported results and data of several large, publicly held investment management companies. The board and the committee noted the competitiveness and cyclicality of both the mutual fund industry and the capital markets, and the importance in that environment of CRMC’s long-term profitability for maintaining its independence, company culture and management continuity. They further considered the breakpoint discounts in the fund’s advisory fee structure. The board and the committee concluded that the fund’s advisory fee structure reflected a reasonable sharing of benefits between CRMC and the fund’s shareholders.
| 34 | The Growth Fund of America |
Board of trustees and other officers
“Independent” trustees1
| Name and age | | Year first
elected
a trustee
of the fund2 | | Principal occupation(s) during past five years | | Number of
portfolios in fund
complex overseen
by trustee | | Other directorships3
held by trustee |
| Ronald P. Badie, 71 | | 2008 | | Retired; former Vice Chairman, Deutsche Bank Alex. Brown (retired 2002) | | 3 | | Amphenol Corporation; Nautilus, Inc. |
Joseph C. Berenato, 68
Chairman of the Board
(Independent and Non-Executive) | | 2003 | | Former Chairman and CEO, Ducommun Incorporated (aerospace components manufacturer) | | 6 | | Ducommun Incorporated |
| Louise H. Bryson, 70 | | 2008 | | Chair Emerita of the Board of Trustees, J. Paul Getty Trust; former President, Distribution, Lifetime Entertainment Network (retired 2008); former Executive Vice President and General Manager, Lifetime Movie Network (retired 2008) | | 7 | | None |
| Robert J. Denison, 73 | | 2005 | | Chair, First Security Management (private investment) | | 6 | | None |
| Mary Anne Dolan, 67 | | 2010 | | Founder and President, MAD Ink (communications company) | | 10 | | None |
| John G. Freund, 60 | | 2010 | | Founder and Managing Director, Skyline Ventures (venture capital investor in health care companies) | | 3 | | Concert Pharmaceuticals, Inc.; Tetraphase Pharmaceuticals, Inc.; XenoPort, Inc. |
| Leonade D. Jones, 66 | | 1993 | | Retired; former Treasurer, The Washington Post Company (retired 1996) | | 10 | | None |
| William H. Kling, 72 | | 2010 | | President Emeritus and former CEO, American Public Media | | 10 | | None |
| Christopher E. Stone, 58 | | 2010 | | President, Open Society Foundations; former Professor of the Practice of Criminal Justice, John F. Kennedy School of Government, Harvard University | | 6 | | None |
“Interested” trustees4,5
Name, age and
position with fund | | Year first
elected
a trustee
or officer
of the fund2 | | Principal occupation(s) during past five years
and positions held with affiliated entities or
the principal underwriter of the fund | | Number of
portfolios in fund
complex overseen
by trustee | | Other directorships3
held by trustee |
James F. Rothenberg, 68
Vice Chairman of the Board | | 1997 | | Director, Capital Research and Management Company; Director, American Funds Distributors, Inc.;6
Director and Chair, The Capital Group Companies, Inc.6 | | 2 | | None |
Donald D. O’Neal, 54
President | | 1995 | | Senior Vice President — Capital Research Global Investors, Capital Research and Management Company;
Director, Capital Research and Management Company | | 26 | | None |
The fund’s statement of additional information includes further details about fund trustees and is available without charge upon request by calling American Funds Service Company at (800) 421-4225 or by visiting the American Funds website at americanfunds.com. The address for all trustees and officers of the fund is 333 South Hope Street, Los Angeles, CA 90071, Attention: Secretary.
| The Growth Fund of America | 35 |
Other officers5
Name, age and
position with fund | | Year first
elected
an officer
of the fund2 | | Principal occupation(s) during past five years and positions held with affiliated entities
or the principal underwriter of the fund |
Michael T. Kerr, 55
Executive Vice President | | 1998 | | Senior Vice President — Capital World Investors, Capital Research and Management Company;
Director, The Capital Group Companies, Inc.6 |
Paul F. Roye, 60
Executive Vice President | | 2012 | | Senior Vice President — Fund Business Management Group, Capital Research and Management Company;
Director, American Funds Service Company6 |
Gregg E. Ireland, 64
Senior Vice President | | 2008 | | Senior Vice President — Capital World Investors, Capital Research and Management Company |
Bradley J. Vogt, 49
Senior Vice President | | 1999 | | Director, Capital Research and Management Company; Chairman, Capital Research Company;6
Senior Vice President — Capital Research Global Investors, Capital Research and Management Company;
Director, American Funds Distributors, Inc.6 |
Brad A. Barrett, 36
Vice President | | 2010 | | Senior Vice President — Capital Research Global Investors, Capital Research and Management Company; Director, American Funds Distributors, Inc.6 |
Walter R. Burkley, 48
Vice President | | 2010 | | Senior Vice President and Senior Counsel — Fund Business Management Group, Capital Research and Management Company; Director, Capital Research Company6 |
Barry S. Crosthwaite, 56
Vice President | | 2010 | | Senior Vice President — Capital Research Global Investors, Capital Research and Management Company; Director, American Funds Service Company6 |
Martin Romo, 47
Vice President | | 2010 | | Director, Capital Research and Management Company; Senior Vice President — Capital World Investors, Capital Research and Management Company; President and Director, Capital Research Company6 |
Lawrence R. Solomon, 52
Vice President | | 2014 | | Senior Vice President — Capital Research Global Investors, Capital Research and Management Company; Chairman of the Board and President, Capital Management Services, Inc.6 |
Michael W. Stockton, 47
Secretary | | 2014 | | Vice President — Fund Business Management Group, Capital Research and Management Company |
Jeffrey P. Regal, 43
Treasurer | | 2006 | | Vice President — Investment Operations, Capital Research and Management Company |
Julie E. Lawton, 41
Assistant Secretary | | 2010 | | Assistant Vice President — Fund Business Management Group, Capital Research and Management Company |
Dori Laskin, 63
Assistant Treasurer | | 2011 | | Vice President — Investment Operations, Capital Research and Management Company |
Neal F. Wellons, 43
Assistant Treasurer | | 2010 | | Vice President — Investment Operations, Capital Research and Management Company |
| 1 | The term “independent” trustee refers to a trustee who is not an “interested person” of the fund within the meaning of the Investment Company Act of 1940. |
| 2 | Trustees and officers of the fund serve until their resignation, removal or retirement. |
| 3 | This includes all directorships/trusteeships (other than those in the American Funds or other funds managed by Capital Research and Management Company or its affiliates) that are held by each trustee as a trustee or director of a public company or a registered investment company. |
| 4 | The term “interested” trustee refers to a trustee who is an “interested person” within the meaning of the Investment Company Act of 1940, on the basis of their affiliation with the fund’s investment adviser, Capital Research and Management Company, or affiliated entities (including the fund’s principal underwriter). |
| 5 | All of the directors/trustees and/or officers listed, except Mr. Barrett, are officers and/or directors/trustees of one or more of the other funds for which Capital Research and Management Company serves as investment adviser. |
| 6 | Company affiliated with Capital Research and Management Company. |
| 36 | The Growth Fund of America |
Office of the fund
One Market
Steuart Tower, Suite 2000
San Francisco, CA 94105-1409
Investment adviser
Capital Research and Management Company
333 South Hope Street
Los Angeles, CA 90071-1406
6455 Irvine Center Drive
Irvine, CA 92618-4518
Transfer agent for shareholder accounts
American Funds Service Company
(Write to the address near you.)
P.O. Box 6007
Indianapolis, IN 46206-6007
P.O. Box 2280
Norfolk, VA 23501-2280
Custodian of assets
State Street Bank and Trust Company
One Lincoln Street
Boston, MA 02111
Counsel
K&L Gates LLP
Four Embarcadero Center, Suite 1200
San Francisco, CA 94111-5994
Independent registered public accounting firm
Deloitte & Touche LLP
695 Town Center Drive
Suite 1200
Costa Mesa, CA 92626-7188
Principal underwriter
American Funds Distributors, Inc.
333 South Hope Street
Los Angeles, CA 90071-1406
Investors should carefully consider investment objectives, risks, charges and expenses. This and other important information is contained in the fund prospectus and summary prospectus, which can be obtained from your financial professional and should be read carefully before investing. You may also call American Funds Service Company (AFS) at (800) 421-4225 or visit the American Funds website at americanfunds.com.
“American Funds Proxy Voting Procedures and Principles” — which describes how we vote proxies relating to portfolio securities — is available on the American Funds website or upon request by calling AFS. The fund files its proxy voting record with the U.S. Securities and Exchange Commission (SEC) for the 12 months ended June 30 by August 31. The proxy voting record is available free of charge on the SEC website at sec.gov and on the American Funds website.
A complete August 31, 2014, portfolio of The Growth Fund of America’s investments is available free of charge by calling AFS or visiting the SEC website (where it is part of Form N-CSR).
The Growth Fund of America files a complete list of its portfolio holdings with the SEC for the first and third quarters of each fiscal year on Form N-Q. This filing is available free of charge on the SEC website. You may also review or, for a fee, copy this filing at the SEC’s Public Reference Room in Washington, D.C. Additional information regarding the operation of the Public Reference Room may be obtained by calling the SEC’s Office of Investor Education and Advocacy at (800) SEC-0330. Additionally, the list of portfolio holdings is available by calling AFS.
This report is for the information of shareholders of The Growth Fund of America, but it also may be used as sales literature when preceded or accompanied by the current prospectus or summary prospectus, which gives details about charges, expenses, investment objectives and operating policies of the fund. If used as sales material after December 31, 2014, this report must be accompanied by an American Funds statistical update for the most recently completed calendar quarter.
The American Funds Advantage
Since 1931, American Funds, part of Capital Group, has helped investors pursue long-term investment success. Our consistent approach — in combination with The Capital SystemSM — has resulted in a superior long-term track record.
| | Aligned with investor success |
| | We base our decisions on a long-term perspective, which we believe aligns our goals with the interests of our clients. Our portfolio managers average 26 years of investment experience, including 21 years at our company, reflecting a career commitment to our long-term approach.1 |
| | |
| | The Capital SystemSM |
| | Our investment process, The Capital System, combines individual accountability with teamwork. Each fund is divided into portions that are managed independently by investment professionals with diverse backgrounds, ages and investment approaches. An extensive global research effort is the backbone of our system. |
| | |
| | Superior long-term track record |
| | Our equity funds have beaten their Lipper peer indexes in 90% of 10-year periods and 96% of 20-year periods. Our fixed-income funds have beaten their Lipper indexes in 56% of 10-year periods and 57% of 20-year periods.2 Our fund management fees have been among the lowest in the industry.3 |
| | 1 | Portfolio manager experience as of December 31, 2013. |
| | 2 | Based on Class A share results for rolling periods through December 31, 2013. Periods covered are the shorter of the fund’s lifetime or since the comparable Lipper index inception date (except SMALLCAP World Fund, for which the Lipper average was used). |
| | 3 | Based on management fees for the 20-year period ended December 31, 2013, versus comparable Lipper categories, excluding funds of funds. |

ITEM 2 – Code of Ethics
The Registrant has adopted a Code of Ethics that applies to its Principal Executive Officer and Principal Financial Officer. The Registrant undertakes to provide to any person without charge, upon request, a copy of the Code of Ethics. Such request can be made to American Funds Service Company at 800/421-9225 or to the Secretary of the Registrant, One Market, Steuart Tower, Suite 2000, San Francisco, California 94105.
ITEM 3 – Audit Committee Financial Expert
The Registrant’s board has determined that Ronald P. Badie, a member of the Registrant’s audit committee, is an “audit committee financial expert” and "independent," as such terms are defined in this Item. This designation will not increase the designee’s duties, obligations or liability as compared to his or her duties, obligations and liability as a member of the audit committee and of the board, nor will it reduce the responsibility of the other audit committee members. There may be other individuals who, through education or experience, would qualify as "audit committee financial experts" if the board had designated them as such. Most importantly, the board believes each member of the audit committee contributes significantly to the effective oversight of the Registrant’s financial statements and condition.
ITEM 4 – Principal Accountant Fees and Services
| | Registrant: |
| | | a) Audit Fees: |
| | | | 2013 | $100,000 |
| | | | 2014 | $101,000 |
| | | | |
| | | b) Audit-Related Fees: |
| | | | 2013 | $28,000 |
| | | | 2014 | $43,000 |
| | | | The audit-related fees consist of assurance and related services relating to the examination of the Registrant’s investment adviser conducted in accordance with Statement on Standards for Attestation Engagements Number 16 issued by the American Institute of Certified Public Accountants. |
| | | | |
| | | c) Tax Fees: |
| | | | 2013 | $22,000 |
| | | | 2014 | $10,000 |
| | | | The tax fees consist of professional services relating to the preparation of the Registrant’s tax returns including returns relating to the Registrant’s investments in non-U.S. jurisdictions. |
| | | | |
| | | d) All Other Fees: |
| | | | 2013 | None |
| | | | 2014 | None |
| | | | |
| | Adviser and affiliates (includes only fees for non-audit services billed to the adviser and affiliates for engagements that relate directly to the operations and financial reporting of the Registrant and were subject to the pre-approval policies described below): |
| | | a) Audit Fees: |
| | | | Not Applicable |
| | | | |
| | | b) Audit-Related Fees: |
| | | | 2013 | $1,011,000 |
| | | | 2014 | $970,000 |
| | | | The audit-related fees consist of assurance and related services relating to the examination of the Registrant’s transfer agent, principal underwriter and investment adviser conducted in accordance with Statement on Standards for Attestation Engagements Number 16 issued by the American Institute of Certified Public Accountants. |
| | | | |
| | | c) Tax Fees: |
| | | | 2013 | $28,000 |
| | | | 2014 | $41,000 |
| | | | The tax fees consist of consulting services relating to the Registrant’s investments. |
| | | | |
| | | d) All Other Fees: |
| | | | 2013 | $2,000 |
| | | | 2014 | $3,000 |
| | | | The other fees consist of subscription services related to an accounting research tool. |
| | | | |
All audit and permissible non-audit services that the Registrant’s audit committee considers compatible with maintaining the independent registered public accounting firm’s independence are required to be pre-approved by the committee. The pre-approval requirement will extend to all non-audit services provided to the Registrant, the investment adviser, and any entity controlling, controlled by, or under common control with the investment adviser that provides ongoing services to the Registrant, if the engagement relates directly to the operations and financial reporting of the Registrant. The committee will not delegate its responsibility to pre-approve these services to the investment adviser. The committee may delegate to one or more committee members the authority to review and pre-approve audit and permissible non-audit services. Actions taken under any such delegation will be reported to the full committee at its next meeting. The pre-approval requirement is waived with respect to non-audit services if certain conditions are met. The pre-approval requirement was not waived for any of the non-audit services listed above provided to the Registrant, adviser and affiliates.
Aggregate non-audit fees paid to the Registrant’s auditors, including fees for all services billed to the Registrant, adviser and affiliates that provide ongoing services to the Registrant, were $1,490,000 for fiscal year 2013 and $1,446,000 for fiscal year 2014. The non-audit services represented by these amounts were brought to the attention of the committee and considered to be compatible with maintaining the auditors’ independence.
ITEM 5 – Audit Committee of Listed Registrants
Not applicable to this Registrant, insofar as the Registrant is not a listed issuer as defined in Rule 10A-3 under the Securities Exchange Act of 1934.
ITEM 6 – Schedule of Investments
The Growth Fund of America®
Investment portfolio
August 31, 2014
Common stocks 92.13%
Information technology 19.63% | Shares | Value
(000) |
| Google Inc., Class C1 | 4,812,697 | $2,750,938 |
| Google Inc., Class A1 | 4,333,597 | 2,523,713 |
| Microsoft Corp. | 41,312,600 | 1,876,831 |
| Oracle Corp. | 38,817,000 | 1,612,070 |
| Avago Technologies Ltd.2 | 17,601,820 | 1,444,933 |
| ASML Holding NV (New York registered) | 8,767,040 | 842,688 |
| ASML Holding NV | 5,109,442 | 488,814 |
| Apple Inc. | 12,511,000 | 1,282,377 |
| salesforce.com, inc.1 | 17,805,000 | 1,052,097 |
| Visa Inc., Class A | 4,898,000 | 1,040,923 |
| Texas Instruments Inc. | 20,134,000 | 970,056 |
| Intuit Inc. | 10,295,000 | 856,338 |
| LinkedIn Corp., Class A1 | 3,667,500 | 827,938 |
| Accenture PLC, Class A | 10,000,000 | 810,600 |
| Murata Manufacturing Co., Ltd. | 8,326,300 | 794,978 |
| Adobe Systems Inc.1 | 8,672,800 | 623,574 |
| EMC Corp. | 16,120,000 | 476,024 |
| Broadcom Corp., Class A | 11,925,000 | 469,606 |
| Cisco Systems, Inc. | 17,160,000 | 428,828 |
| TE Connectivity Ltd. | 6,173,000 | 386,924 |
| Samsung Electronics Co. Ltd. | 311,800 | 379,468 |
| Taiwan Semiconductor Manufacturing Co. Ltd. | 76,121,000 | 315,786 |
| Taiwan Semiconductor Manufacturing Co. Ltd. (ADR) | 2,830,000 | 59,260 |
| Baidu, Inc., Class A (ADR)1 | 1,645,000 | 352,885 |
| Nintendo Co., Ltd. | 3,064,940 | 339,649 |
| KLA-Tencor Corp. | 4,000,000 | 305,680 |
| Cognizant Technology Solutions Corp., Class A1 | 6,477,400 | 296,212 |
| Palo Alto Networks, Inc.1 | 3,473,400 | 295,204 |
| Facebook, Inc., Class A1 | 3,900,000 | 291,798 |
| Concur Technologies, Inc.1 | 2,800,000 | 281,064 |
| Altera Corp. | 7,750,000 | 273,885 |
| VeriSign, Inc.1 | 4,745,000 | 270,821 |
| Automatic Data Processing, Inc. | 3,235,000 | 270,058 |
| Amphenol Corp., Class A | 2,534,000 | 261,027 |
| Motorola Solutions, Inc. | 4,155,000 | 246,807 |
| VMware, Inc., Class A1 | 2,400,000 | 236,592 |
| Hexagon AB, Class B | 7,041,102 | 230,296 |
| First Data Holdings, Inc., Class B1,3,4 | 56,250,000 | 225,000 |
| MasterCard Inc., Class A | 2,650,000 | 200,897 |
| Hewlett-Packard Co. | 5,000,000 | 190,000 |
| NetSuite Inc.1 | 2,122,874 | 186,049 |
| Gemalto NV | 1,870,000 | 183,078 |
| Samsung SDI Co., Ltd. | 1,100,000 | 164,357 |
| Linear Technology Corp. | 3,280,000 | 147,961 |
| Mail.Ru Group Ltd. (GDR)1 | 4,616,260 | 123,947 |
| Mail.Ru Group Ltd. (GDR)1,5 | 711,990 | 19,117 |
| Dolby Laboratories, Inc., Class A1 | 2,650,000 | 123,437 |
The Growth Fund of America — Page 1 of 9
Common stocks
Information technology (continued) | Shares | Value
(000) |
| MercadoLibre, Inc. | 965,000 | $110,917 |
| National Instruments Corp. | 3,135,000 | 103,925 |
| Rackspace Hosting, Inc.1 | 2,947,567 | 101,986 |
| eBay Inc.1 | 1,750,000 | 97,125 |
| ARM Holdings PLC | 5,685,000 | 91,643 |
| Autodesk, Inc.1 | 1,465,000 | 78,583 |
| Analog Devices, Inc. | 875,000 | 44,730 |
| Workday, Inc., Class A1 | 275,000 | 25,044 |
| ASM Pacific Technology Ltd. | 945,000 | 9,834 |
| Demandware, Inc.1 | 140,000 | 7,441 |
| Guidewire Software, Inc.1 | 150,000 | 6,832 |
| | | 28,508,645 |
| Consumer discretionary 17.45% | | |
| Amazon.com, Inc.1 | 17,597,195 | 5,966,153 |
| Comcast Corp., Class A | 40,263,578 | 2,203,626 |
| Comcast Corp., Class A, special nonvoting shares | 13,000,000 | 709,800 |
| Home Depot, Inc. | 26,961,200 | 2,520,872 |
| NIKE, Inc., Class B | 19,716,640 | 1,548,742 |
| Twenty-First Century Fox, Inc., Class A | 33,675,400 | 1,192,783 |
| Johnson Controls, Inc. | 15,525,000 | 757,775 |
| MGM Resorts International1,2 | 29,412,600 | 719,726 |
| Netflix, Inc.1 | 1,485,568 | 709,567 |
| Time Warner Inc. | 7,160,000 | 551,535 |
| Walt Disney Co. | 5,905,000 | 530,741 |
| Tesla Motors, Inc.1 | 1,454,800 | 392,359 |
| CBS Corp., Class B | 6,550,000 | 388,349 |
| Toll Brothers, Inc.1,2 | 10,628,300 | 378,261 |
| Marriott International, Inc., Class A | 5,143,059 | 356,928 |
| DIRECTV1 | 4,111,200 | 355,413 |
| Naspers Ltd., Class N | 2,770,000 | 352,025 |
| Liberty Global PLC, Class C1 | 4,976,520 | 208,666 |
| Liberty Global PLC, Class A1 | 2,894,280 | 126,393 |
| Priceline Group Inc.1 | 267,000 | 332,231 |
| AutoNation, Inc.1,2 | 6,000,000 | 325,500 |
| Toyota Motor Corp. | 5,430,000 | 309,376 |
| Norwegian Cruise Line Holdings Ltd.1 | 9,100,000 | 303,121 |
| Lowe’s Companies, Inc. | 5,300,000 | 278,303 |
| Carnival Corp., units | 6,990,000 | 264,781 |
| BorgWarner Inc. | 3,600,000 | 223,884 |
| Ralph Lauren Corp., Class A | 1,307,095 | 221,160 |
| Expedia, Inc. | 2,569,000 | 220,677 |
| Viacom Inc., Class B | 2,411,000 | 195,653 |
| D.R. Horton, Inc. | 8,095,000 | 175,500 |
| lululemon athletica inc.1 | 4,387,000 | 175,173 |
| General Motors Co. | 4,835,000 | 168,258 |
| Tiffany & Co. | 1,640,000 | 165,542 |
| Lions Gate Entertainment Corp. | 5,049,393 | 163,651 |
| Wynn Resorts, Ltd. | 843,623 | 162,718 |
| Starbucks Corp. | 2,050,000 | 159,510 |
| Galaxy Entertainment Group Ltd. | 20,000,000 | 150,709 |
| Las Vegas Sands Corp. | 2,074,000 | 137,942 |
| Darden Restaurants, Inc. | 2,443,000 | 115,603 |
| Volkswagen AG, nonvoting preferred | 505,000 | 113,367 |
| YUM! Brands, Inc. | 1,500,000 | 108,645 |
The Growth Fund of America — Page 2 of 9
Common stocks
Consumer discretionary (continued) | Shares | Value
(000) |
| Luxottica Group SpA | 1,870,800 | $99,923 |
| Daimler AG | 1,133,000 | 92,657 |
| Five Below, Inc.1 | 2,085,000 | 84,568 |
| Renault SA | 1,000,000 | 78,285 |
| Sands China Ltd. | 12,000,000 | 78,193 |
| Hyatt Hotels Corp., Class A1 | 1,180,000 | 72,086 |
| Lennar Corp., Class A | 1,795,000 | 70,328 |
| Harley-Davidson, Inc. | 1,104,100 | 70,177 |
| Industria de Diseño Textil, SA | 2,388,220 | 69,193 |
| Burberry Group PLC | 2,725,000 | 64,285 |
| Swatch Group Ltd, non-registered shares | 110,000 | 59,646 |
| News Corp., Class A1 | 1,750,000 | 30,844 |
| Hermès International | 37,000 | 12,730 |
| TOD’S SpA | 70,157 | 7,771 |
| Weight Watchers International, Inc. | 75,900 | 1,874 |
| | | 25,333,578 |
| Health care 16.86% | | |
| Gilead Sciences, Inc.1 | 52,294,248 | 5,625,815 |
| UnitedHealth Group Inc. | 23,984,700 | 2,078,994 |
| Amgen Inc. | 13,911,100 | 1,938,929 |
| Alexion Pharmaceuticals, Inc.1 | 9,006,061 | 1,524,636 |
| Regeneron Pharmaceuticals, Inc.1 | 3,437,300 | 1,204,842 |
| Express Scripts Holding Co.1 | 16,285,600 | 1,203,994 |
| Biogen Idec Inc.1 | 3,302,200 | 1,132,787 |
| Illumina, Inc.1 | 5,471,701 | 981,404 |
| Vertex Pharmaceuticals Inc.1 | 10,105,600 | 945,581 |
| Boston Scientific Corp.1 | 52,109,400 | 660,747 |
| St. Jude Medical, Inc. | 9,915,000 | 650,325 |
| Edwards Lifesciences Corp.1,2 | 6,132,700 | 608,732 |
| Thermo Fisher Scientific Inc. | 4,978,100 | 598,417 |
| Merck & Co., Inc. | 9,617,700 | 578,120 |
| Stryker Corp. | 6,778,376 | 564,707 |
| BioMarin Pharmaceutical Inc.1 | 7,295,373 | 519,576 |
| Grifols, SA, Class B (ADR) | 5,409,413 | 217,188 |
| Grifols, SA, Class B, non-registered shares | 4,691,371 | 185,481 |
| Grifols, SA, Class A, non-registered shares | 1,225,000 | 57,028 |
| Humana Inc. | 3,316,305 | 426,941 |
| Hologic, Inc.1,2 | 17,126,960 | 425,948 |
| Endo International PLC1 | 5,785,000 | 368,562 |
| athenahealth, Inc.1,2 | 2,522,484 | 364,348 |
| Incyte Corp.1 | 4,935,800 | 267,520 |
| Baxter International Inc. | 2,818,910 | 211,362 |
| Bristol-Myers Squibb Co. | 3,665,000 | 185,632 |
| Pharmacyclics, Inc.1 | 1,451,922 | 180,605 |
| Brookdale Senior Living Inc.1 | 5,133,000 | 179,398 |
| Intercept Pharmaceuticals, Inc.1 | 606,800 | 175,802 |
| Aetna Inc. | 1,938,800 | 159,234 |
| Celgene Corp.1 | 760,000 | 72,215 |
| ResMed Inc. | 1,210,000 | 64,191 |
| PerkinElmer, Inc. | 1,300,000 | 58,305 |
| DaVita HealthCare Partners Inc.1 | 590,000 | 44,061 |
| Intuitive Surgical, Inc.1 | 50,000 | 23,501 |
| | | 24,484,928 |
The Growth Fund of America — Page 3 of 9
Common stocks
Energy 9.99% | Shares | Value
(000) |
| EOG Resources, Inc. | 22,494,000 | $2,471,641 |
| Concho Resources Inc.1,2 | 8,578,506 | 1,218,491 |
| Noble Energy, Inc. | 16,677,621 | 1,203,124 |
| Pioneer Natural Resources Co. | 5,132,900 | 1,070,980 |
| Schlumberger Ltd. | 8,950,000 | 981,278 |
| Cheniere Energy, Inc.1 | 11,859,300 | 951,827 |
| FMC Technologies, Inc.1,2 | 15,179,100 | 938,675 |
| Suncor Energy Inc. | 14,622,520 | 600,205 |
| Canadian Natural Resources, Ltd. | 13,520,000 | 589,270 |
| Baker Hughes Inc. | 8,429,700 | 582,829 |
| Chesapeake Energy Corp. | 16,673,163 | 453,510 |
| Weatherford International PLC1 | 18,630,000 | 441,345 |
| BG Group PLC | 19,369,000 | 386,348 |
| CONSOL Energy Inc. | 7,235,000 | 291,426 |
| Cabot Oil & Gas Corp. | 8,032,000 | 269,393 |
| Enbridge Inc. | 4,645,529 | 231,700 |
| Royal Dutch Shell PLC, Class B (ADR) | 2,428,800 | 206,084 |
| Cobalt International Energy, Inc.1 | 13,361,200 | 205,094 |
| Apache Corp. | 1,800,000 | 183,294 |
| Cimarex Energy Co. | 1,164,000 | 168,966 |
| Core Laboratories NV | 1,058,562 | 167,242 |
| Murphy Oil Corp. | 2,556,000 | 159,673 |
| Southwestern Energy Co.1 | 2,850,000 | 117,363 |
| Phillips 66 | 1,200,000 | 104,424 |
| Oil States International, Inc.1 | 1,616,931 | 104,373 |
| Denbury Resources Inc. | 5,362,500 | 92,342 |
| BP PLC (ADR) | 1,138,700 | 54,476 |
| BP PLC | 3,800,000 | 30,385 |
| Paramount Resources Ltd.1 | 1,415,000 | 78,474 |
| Tourmaline Oil Corp.1 | 1,478,100 | 74,863 |
| Oceaneering International, Inc. | 433,800 | 30,175 |
| Peyto Exploration & Development Corp. | 730,000 | 25,869 |
| Laricina Energy Ltd.1,3,4 | 950,000 | 15,727 |
| | | 14,500,866 |
| Industrials 8.37% | | |
| Union Pacific Corp. | 13,796,600 | 1,452,368 |
| Precision Castparts Corp. | 4,103,367 | 1,001,468 |
| American Airlines Group Inc. | 20,490,000 | 797,266 |
| Boeing Co. | 6,267,000 | 794,656 |
| United Continental Holdings, Inc.1 | 15,369,000 | 731,718 |
| CSX Corp. | 21,674,801 | 669,968 |
| General Dynamics Corp. | 5,104,600 | 629,142 |
| Cummins Inc. | 3,591,500 | 521,163 |
| Nielsen NV | 10,499,551 | 493,374 |
| Delta Air Lines, Inc. | 12,003,823 | 475,111 |
| Airbus Group NV | 7,342,327 | 451,549 |
| Caterpillar Inc. | 3,935,000 | 429,190 |
| Towers Watson & Co., Class A2 | 3,825,000 | 419,335 |
| Rockwell Collins, Inc. | 5,308,700 | 408,664 |
| Ryanair Holdings PLC (ADR)1 | 5,538,214 | 304,048 |
| Danaher Corp. | 3,509,448 | 268,859 |
| Textron Inc. | 6,658,866 | 253,037 |
| FedEx Corp. | 1,500,000 | 221,820 |
| Oshkosh Corp.2 | 4,368,000 | 217,002 |
The Growth Fund of America — Page 4 of 9
Common stocks
Industrials (continued) | Shares | Value
(000) |
| Meggitt PLC | 26,054,666 | $203,989 |
| United Technologies Corp. | 1,540,000 | 166,289 |
| Fastenal Co. | 3,655,000 | 165,498 |
| General Electric Co. | 6,200,000 | 161,076 |
| Lockheed Martin Corp. | 877,000 | 152,598 |
| Rolls-Royce Holdings PLC1 | 7,375,000 | 125,007 |
| Jacobs Engineering Group Inc.1 | 2,080,000 | 112,133 |
| Sensata Technologies Holding NV1 | 2,250,000 | 110,632 |
| KBR, Inc. | 4,150,000 | 91,383 |
| MTU Aero Engines AG | 1,008,731 | 88,008 |
| KONE Oyj, Class B | 1,920,000 | 81,234 |
| Honeywell International Inc. | 700,000 | 66,661 |
| Bureau Veritas SA | 2,256,040 | 53,595 |
| United Parcel Service, Inc., Class B | 328,000 | 31,924 |
| Chart Industries, Inc.1 | 159,894 | 10,695 |
| | | 12,160,460 |
| Financials 8.04% | | |
| Crown Castle International Corp. | 13,219,250 | 1,051,063 |
| Goldman Sachs Group, Inc. | 5,363,996 | 960,745 |
| American International Group, Inc. | 17,135,000 | 960,588 |
| Wells Fargo & Co. | 12,569,178 | 646,558 |
| JPMorgan Chase & Co. | 9,296,712 | 552,690 |
| Berkshire Hathaway Inc., Class B1 | 2,000,000 | 274,500 |
| Berkshire Hathaway Inc., Class A1 | 955 | 196,615 |
| Legal & General Group PLC | 111,984,892 | 449,349 |
| Capital One Financial Corp. | 5,348,000 | 438,857 |
| American Express Co. | 4,480,000 | 401,184 |
| Bank of America Corp. | 24,500,000 | 394,205 |
| ACE Ltd. | 3,696,000 | 392,996 |
| AIA Group Ltd. | 67,400,000 | 367,871 |
| CME Group Inc., Class A | 4,442,419 | 340,067 |
| CIT Group Inc. | 7,011,000 | 336,248 |
| HDFC Bank Ltd. | 18,293,408 | 254,308 |
| HDFC Bank Ltd. (ADR) | 1,612,000 | 80,100 |
| American Tower Corp. | 3,355,000 | 330,803 |
| Progressive Corp. | 10,850,000 | 271,467 |
| Citigroup Inc. | 5,110,000 | 263,931 |
| Charles Schwab Corp. | 8,887,000 | 253,368 |
| Onex Corp. | 4,200,000 | 244,553 |
| Morgan Stanley | 6,500,000 | 223,015 |
| XL Group PLC | 5,835,000 | 199,440 |
| Ocwen Financial Corp.1,2 | 6,791,081 | 189,743 |
| UBS AG | 9,665,666 | 173,299 |
| Prudential PLC | 6,455,000 | 155,386 |
| Bank of Ireland1 | 383,200,000 | 153,569 |
| McGraw Hill Financial, Inc. | 1,860,600 | 150,950 |
| Signature Bank1 | 1,156,970 | 137,055 |
| Sumitomo Mitsui Financial Group, Inc. | 2,750,000 | 111,023 |
| Fifth Third Bancorp | 4,750,000 | 96,924 |
| U.S. Bancorp | 2,025,000 | 85,617 |
| BOK Financial Corp. | 1,250,000 | 84,225 |
| W. R. Berkley Corp. | 1,560,000 | 75,426 |
| First Republic Bank | 1,340,000 | 65,526 |
| Leucadia National Corp. | 2,589,787 | 64,563 |
The Growth Fund of America — Page 5 of 9
Common stocks
Financials (continued) | Shares | Value
(000) |
| Deutsche Bank AG | 1,570,000 | $53,718 |
| ICICI Bank Ltd. (ADR) | 1,000,000 | 53,500 |
| Popular, Inc.1 | 1,627,191 | 50,378 |
| Financial Engines, Inc. | 1,360,000 | 48,783 |
| Moody’s Corp. | 200,000 | 18,714 |
| Weyerhaeuser Co. | 422,321 | 14,338 |
| | | 11,667,258 |
| Consumer staples 4.01% | | |
| Philip Morris International Inc. | 19,579,433 | 1,675,608 |
| Costco Wholesale Corp. | 11,108,183 | 1,344,979 |
| Keurig Green Mountain, Inc. | 4,119,663 | 549,233 |
| Kerry Group PLC, Class A | 6,565,824 | 493,905 |
| Herbalife Ltd.2 | 5,442,001 | 277,433 |
| Sprouts Farmers Market, Inc.1,2 | 8,270,446 | 255,888 |
| Coca-Cola Co. | 6,020,400 | 251,171 |
| Nestlé SA | 2,387,600 | 185,302 |
| Mead Johnson Nutrition Co. | 1,864,600 | 178,256 |
| Whole Foods Market, Inc. | 4,179,700 | 163,593 |
| PepsiCo, Inc. | 1,680,000 | 155,383 |
| Pernod Ricard SA | 1,056,000 | 124,517 |
| British American Tobacco PLC | 1,493,000 | 88,077 |
| Japan Tobacco Inc. | 1,870,000 | 64,056 |
| Avon Products, Inc. | 1,600,000 | 22,464 |
| | | 5,829,865 |
| Materials 2.21% | | |
| Praxair, Inc. | 5,186,537 | 682,289 |
| Monsanto Co. | 4,270,000 | 493,825 |
| Celanese Corp., Series A | 6,300,000 | 394,002 |
| LyondellBasell Industries NV | 2,890,000 | 330,471 |
| Rio Tinto PLC | 4,682,000 | 249,780 |
| Potash Corp. of Saskatchewan Inc. | 6,060,000 | 213,070 |
| Newmont Mining Corp. | 5,280,000 | 143,035 |
| Sigma-Aldrich Corp. | 1,200,000 | 124,800 |
| Sealed Air Corp. | 2,950,000 | 106,495 |
| ArcelorMittal | 5,710,000 | 83,092 |
| FMC Corp. | 1,200,000 | 79,368 |
| Dow Chemical Co. | 1,430,000 | 76,576 |
| Barrick Gold Corp. | 3,730,000 | 68,595 |
| James Hardie Industries PLC (CDI) | 5,460,000 | 65,323 |
| Smurfit Kappa PLC, Class A | 2,200,000 | 49,908 |
| Syngenta AG | 120,000 | 43,070 |
| | | 3,203,699 |
| Telecommunication services 0.81% | | |
| SoftBank Corp. | 8,351,000 | 602,457 |
| T-Mobile US, Inc.1 | 14,260,100 | 428,944 |
| SBA Communications Corp., Class A1 | 1,315,000 | 145,031 |
| | | 1,176,432 |
| Utilities 0.09% | | |
| NRG Energy, Inc. | 4,060,100 | 124,970 |
The Growth Fund of America — Page 6 of 9
Common stocks
Miscellaneous 4.67% | Shares | Value
(000) |
| Other common stocks in initial period of acquisition | | $6,787,901 |
| Total common stocks (cost: $74,462,381,000) | | 133,778,602 |
Preferred securities 0.07%
Miscellaneous 0.07% | | |
| Other preferred securities in initial period of acquisition | | 92,503 |
| Total preferred securities (cost: $91,162,000) | | 92,503 |
Rights & warrants 0.08%
Energy 0.04% | | |
| Kinder Morgan, Inc., warrants, expire 20171 | 13,876,600 | 54,258 |
| Financials 0.01% | | |
| Citigroup Inc., Class A, warrants, expire 20191 | 25,500,000 | 21,904 |
| Telecommunication services 0.00% | | |
| Broadview Networks Holdings, Inc., Series A1, warrants, expire 20201,3,4 | 4,414 | — |
| Broadview Networks Holdings, Inc., Series A2, warrants, expire 20201,3,4 | 1,672 | — |
| | | — |
| Miscellaneous 0.03% | | |
| Other rights & warrants in initial period of acquisition | | 45,120 |
| Total rights & warrants (cost: $122,540,000) | | 121,282 |
Convertible bonds 0.04%
Telecommunication services 0.04% | Principal amount
(000) | |
| Clearwire Corp. 8.25% convertible notes 20405 | $56,282 | 64,162 |
| Total convertible bonds (cost: $56,297,000) | | 64,162 |
Bonds, notes & other debt instruments 0.16%
U.S. Treasury bonds & notes 0.08%
U.S. Treasury 0.08% | | |
| U.S. Treasury 0.125% 2015 | 10,100 | 10,104 |
| U.S. Treasury 0.25% 2015 | 90,685 | 90,800 |
| U.S. Treasury 0.25% 2015 | 15,675 | 15,696 |
| Total U.S. Treasury bonds & notes | | 116,600 |
Corporate bonds & notes 0.05%
Telecommunication services 0.05% | | |
| LightSquared, Term Loan B, 12.00% 20146,7,8,9 | 25,424 | 34,958 |
| NII Capital Corp. 10.00% 2016 | 32,300 | 9,528 |
| NII Capital Corp. 7.875% 20195 | 27,500 | 18,287 |
| NII Capital Corp. 11.375% 20195 | 17,000 | 11,390 |
| NII Capital Corp. 7.625% 2021 | 8,000 | 1,240 |
| Total corporate bonds & notes | | 75,403 |
The Growth Fund of America — Page 7 of 9
Bonds, notes & other debt instruments
Federal agency bonds & notes 0.03% | Principal amount
(000) | Value
(000) |
| Federal Farm Credit Banks 0.13% 2015 | $33,500 | $33,491 |
| Total bonds, notes & other debt instruments (cost: $213,508,000) | | 225,494 |
| Short-term securities 7.56% | | |
| Abbott Laboratories 0.10% due 9/15/2014–10/14/20145 | 58,000 | 57,998 |
| Apple Inc. 0.09%–0.13% due 10/15/2014–1/7/20155 | 103,194 | 103,142 |
| Chariot Funding, LLC 0.21%–0.27% due 11/21/2014–3/12/20155 | 149,500 | 149,403 |
| Chevron Corp. 0.08% due 10/16/20145 | 74,400 | 74,388 |
| Coca-Cola Co. 0.13%–0.20% due 10/30/2014–1/20/20155 | 199,000 | 198,940 |
| E.I. duPont de Nemours and Co. 0.08% due 9/9/20145 | 36,000 | 35,999 |
| Emerson Electric Co. 0.08%–0.11% due 9/19/2014–11/19/20145 | 52,000 | 51,990 |
| Fannie Mae 0.06%–0.15% due 9/2/2014–7/1/2015 | 2,351,795 | 2,351,069 |
| Federal Farm Credit Banks 0.08%–0.13% due 9/10/2014–6/2/2015 | 423,900 | 423,801 |
| Federal Home Loan Bank 0.06%–0.17% due 9/5/2014–8/28/2015 | 3,220,844 | 3,219,777 |
| Freddie Mac 0.06%–0.17% due 9/17/2014–8/27/2015 | 3,070,380 | 3,069,191 |
| General Electric Capital Corp. 0.12%–0.19% due 10/3/2014–11/14/2014 | 175,000 | 174,976 |
| Google Inc. 0.11%–0.13% due 12/11/2014–1/21/20155 | 91,000 | 90,962 |
| Harvard University 0.14% due 9/8/2014 | 23,665 | 23,665 |
| IBM Corp. 0.08%–0.10% due 9/23/2014–9/29/20145 | 91,200 | 91,198 |
| John Deere Bank SA 0.09% due 9/8/20145 | 50,000 | 49,999 |
| Medtronic Inc. 0.09% due 10/15/20145 | 19,700 | 19,697 |
| Merck & Co. Inc. 0.08%–0.10% due 9/19/2014–10/6/20145 | 78,500 | 78,498 |
| National Rural Utilities Cooperative Finance Corp. 0.10% due 9/4/2014 | 31,100 | 31,099 |
| Paccar Financial Corp. 0.11% due 10/27/2014 | 15,100 | 15,096 |
| PepsiCo Inc. 0.06% due 9/2/20145 | 30,000 | 30,000 |
| Private Export Funding Corp. 0.12%–0.18% due 9/3/2014–11/12/20145 | 56,900 | 56,892 |
| Procter & Gamble Co. 0.10%–0.14% due 9/9/2014–1/5/20155 | 251,700 | 251,653 |
| Regents of the University of California 0.13% due 10/21/2014 | 24,250 | 24,246 |
| U.S. Treasury Bills 0.08% due 9/18/2014 | 81,700 | 81,699 |
| United Parcel Service Inc. 0.12% due 10/2/20145 | 50,000 | 49,997 |
| Wal-Mart Stores, Inc. 0.08%–0.09% due 9/29/2014–10/27/20145 | 125,000 | 124,988 |
| Wells Fargo & Co. 0.14% due 10/22/2014 | 45,800 | 45,791 |
| Total short-term securities (cost: $10,974,920,000) | | 10,976,154 |
| Total investment securities 100.04% (cost: $85,920,808,000) | | 145,258,197 |
| Other assets less liabilities (0.04)% | | (56,437) |
| Net assets 100.00% | | $145,201,760 |
As permitted by U.S. Securities and Exchange Commission regulations, “Miscellaneous” securities include holdings in their first year of acquisition that have not previously been publicly disclosed.
| 1 | Security did not produce income during the last 12 months. |
| 2 | Represents an affiliated company as defined under the Investment Company Act of 1940. |
| 3 | Acquired through a private placement transaction exempt from registration under the Securities Act of 1933. May be subject to legal or contractual restrictions on resale. Further details on these holdings appear below. |
| 4 | Valued under fair value procedures adopted by authority of the board of trustees. The total value of all such securities was $240,727,000, which represented .17% of the net assets of the fund. |
| 5 | Acquired in a transaction exempt from registration under Rule 144A or Section 4(2) of the Securities Act of 1933. May be resold in the U.S. in transactions exempt from registration, normally to qualified institutional buyers. The total value of all such securities was $1,628,700,000, which represented 1.12% of the net assets of the fund. |
| 6 | Scheduled interest and/or principal payment was not received. |
| 7 | Principal payments may be made periodically. Therefore, the effective maturity date may be earlier than the stated maturity date. |
| 8 | Payment in kind; the issuer has the option of paying additional securities in lieu of cash. |
| 9 | Loan participations and assignments; may be subject to legal or contractual restrictions on resale. The total value of all such loans was $34,958,000, which represented .02% of the net assets of the fund. |
The Growth Fund of America — Page 8 of 9
| Private placement securities | Acquisition
date(s) | Cost
(000) | Value
(000) | Percent
of net
assets |
| First Data Holdings, Inc., Class B | 6/26/2014 | $225,000 | $225,000 | .16% |
| Laricina Energy Ltd. | 6/21/2011 | 41,523 | 15,727 | .01 |
| Broadview Networks Holdings, Inc., Series A1, warrants, expire 2020 | 7/7/2000-3/6/2002 | 11,176 | — | .00 |
| Broadview Networks Holdings, Inc., Series A2, warrants, expire 2020 | 7/7/2000-3/6/2002 | 3,626 | — | .00 |
| Total restricted securities | | $281,325 | $240,727 | .17% |
| Key to abbreviations |
| ADR = American Depositary Receipts |
| CDI = CREST Depository Interest |
| GDR = Global Depositary Receipts |
Investments are not FDIC-insured, nor are they deposits of or guaranteed by a bank or any other entity, so they may lose value.
Investors should carefully consider investment objectives, risks, charges and expenses. This and other important information is contained in the fund prospectus and summary prospectus, which can be obtained from your financial professional and should be read carefully before investing. You may also call American Funds Service Company (AFS) at (800) 421-4225 or visit the American Funds website at americanfunds.com.
| MFGEFPX-005-1014O-S42239 | The Growth Fund of America — Page 9 of 9 |
REPORT OF INDEPENDENT REGISTERED PUBLIC ACCOUNTING FIRM
To the Shareholders and Board of Trustees of
The Growth Fund of America:
We have audited the accompanying statement of assets and liabilities of The Growth Fund of America, including the summary schedule of investments, as of August 31, 2014, and the related statements of operations for the year then ended, the statements of changes in net assets for each of the two years in the period then ended (collectively, the “financial statements”), the financial highlights for each of the five years in the period then ended (the financial statements and financial highlights are included in Item 1 of this Form N-CSR), and the schedule of investments in securities as of August 31, 2014 (included in Item 6 of this Form N-CSR). These financial statements, financial highlights, and schedule of investments in securities are the responsibility of the Company’s management. Our responsibility is to express an opinion on these financial statements, financial highlights, and schedule of investments in securities based on our audits.
We conducted our audits in accordance with the standards of the Public Company Accounting Oversight Board (United States). Those standards require that we plan and perform the audit to obtain reasonable assurance about whether the financial statements, financial highlights, and schedule of investments in securities are free of material misstatement. An audit includes examining, on a test basis, evidence supporting the amounts and disclosures in the financial statements and schedule of investments in securities. Our procedures included confirmation of securities owned as of August 31, 2014, by correspondence with the custodian and brokers; where replies were not received from brokers, we performed other auditing procedures. An audit also includes assessing the accounting principles used and significant estimates made by management, as well as evaluating the overall financial statement presentation. We believe that our audits provide a reasonable basis for our opinion.
In our opinion, the financial statements, financial highlights, and schedule of investments in securities referred to above present fairly, in all material respects, the financial position of The Growth Fund of America as of August 31, 2014, and the results of its operations for the year then ended, the changes in its net assets for each of the two years in the period then ended, and the financial highlights for each of the five years in the period then ended, in conformity with accounting principles generally accepted in the United States of America.
DELOITTE & TOUCHE LLP
Costa Mesa, California
October 7, 2014
ITEM 7 – Disclosure of Proxy Voting Policies and Procedures for Closed-End Management Investment Companies
Not applicable to this Registrant, insofar as the Registrant is not a closed-end management investment company.
ITEM 8 – Portfolio Managers of Closed-End Management Investment Companies
Not applicable to this Registrant, insofar as the Registrant is not a closed-end management investment company.
ITEM 9 – Purchases of Equity Securities by Closed-End Management Investment Company and Affiliated Purchasers
Not applicable to this Registrant, insofar as the Registrant is not a closed-end management investment company.
ITEM 10 – Submission of Matters to a Vote of Security Holders
There have been no material changes to the procedures by which shareholders may recommend nominees to the Registrant’s board of trustees since the Registrant last submitted a proxy statement to its shareholders. The procedures are as follows. The Registrant has a nominating and governance committee comprised solely of persons who are not considered ‘‘interested persons’’ of the Registrant within the meaning of the Investment Company Act of 1940, as amended. The committee periodically reviews such issues as the board’s composition, responsibilities, committees, compensation and other relevant issues, and recommends any appropriate changes to the full board of trustees. While the committee normally is able to identify from its own resources an ample number of qualified candidates, it will consider shareholder suggestions of persons to be considered as nominees to fill future vacancies on the board. Such suggestions must be sent in writing to the nominating and governance committee of the Registrant, c/o the Registrant’s Secretary, and must be accompanied by complete biographical and occupational data on the prospective nominee, along with a written consent of the prospective nominee for consideration of his or her name by the nominating and governance committee.
ITEM 11 – Controls and Procedures
| (a) | The Registrant’s Principal Executive Officer and Principal Financial Officer have concluded, based on their evaluation of the Registrant’s disclosure controls and procedures (as such term is defined in Rule 30a-3 under the Investment Company Act of 1940), that such controls and procedures are adequate and reasonably designed to achieve the purposes described in paragraph (c) of such rule. |
| | |
| (b) | There were no changes in the Registrant’s internal controls over financial reporting (as defined in Rule 30a-3(d) under the Investment Company Act of 1940) that occurred during the Registrant’s second fiscal quarter of the period covered by this report that has materially affected, or is reasonably likely to materially affect, the Registrant’s internal control over financial reporting. |
ITEM 12 – Exhibits
| (a)(1) | The Code of Ethics that is the subject of the disclosure required by Item 2 is attached as an exhibit hereto. |
| | |
| (a)(2) | The certifications required by Rule 30a-2 of the Investment Company Act of 1940 and Sections 302 and 906 of the Sarbanes-Oxley Act of 2002 are attached as exhibits hereto. |
SIGNATURES
Pursuant to the requirements of the Securities Exchange Act of 1934 and the Investment Company Act of 1940, the Registrant has duly caused this report to be signed on its behalf by the undersigned, thereunto duly authorized.
| | THE GROWTH FUND OF AMERICA |
| | |
| | By /s/ Paul F. Roye |
| | Paul F. Roye, Executive Vice President and Principal Executive Officer |
| | |
| | Date: October 31, 2014 |
Pursuant to the requirements of the Securities Exchange Act of 1934 and the Investment Company Act of 1940, this report has been signed below by the following persons on behalf of the Registrant and in the capacities and on the dates indicated.
| By /s/ Paul F. Roye |
Paul F. Roye, Executive Vice President and Principal Executive Officer |
| |
| Date: October 31, 2014 |
| By /s/ Jeffrey P. Regal |
Jeffrey P. Regal, Treasurer and Principal Financial Officer |
| |
| Date: October 31, 2014 |