UNITED STATES
SECURITIES AND EXCHANGE COMMISSION
Washington, D.C. 20549
FORM N-CSR
Certified Shareholder Report of
Registered Management Investment Companies
Investment Company Act File Number: 811-00862
The Growth Fund of America
(Exact Name of Registrant as Specified in Charter)
6455 Irvine Center Drive
Irvine, California 92618
(Address of Principal Executive Offices)
Registrant's telephone number, including area code: (213) 486-9200
Date of fiscal year end: August 31
Date of reporting period: August 31, 2016
Michael W. Stockton
The Growth Fund of America
333 South Hope Street
Los Angeles, California 90071
(Name and Address of Agent for Service)
ITEM 1 – Reports to Stockholders

Aiming for consistency
amidst volatility.
Special feature page 6
 | The Growth Fund of America® Annual report
for the year ended
August 31, 2016 |
The Growth Fund of America seeks to provide you with growth of capital.
This fund is one of more than 40 offered by one of the nation’s largest mutual fund families, American Funds, from Capital Group. For 85 years, Capital has invested with a long-term focus based on thorough research and attention to risk.
Fund results shown in this report, unless otherwise indicated, are for Class A shares at net asset value. If a sales charge (maximum 5.75%) had been deducted, the results would have been lower. Results are for past periods and are not predictive of results for future periods. Current and future results may be lower or higher than those shown. Share prices and returns will vary, so investors may lose money. Investing for short periods makes losses more likely. Investments are not FDIC-insured, nor are they deposits of or guaranteed by a bank or any other entity, so they may lose value. For current information and month-end results, visit americanfunds.com.
Here are the average annual total returns on a $1,000 investment with all distributions reinvested for periods ended September 30, 2016 (the most recent calendar quarter-end):
| Class A shares | | 1 year | | 5 years | | 10 years |
| | | | | | | |
| Reflecting 5.75% maximum sales charge | | 8.42% | | 15.19% | | 6.80% |
For other share class results, visit americanfunds.com and americanfundsretirement.com.
The total annual fund operating expense ratio is 0.66% for Class A shares as of the prospectus dated November 1, 2016 (unaudited).
Investment results assume all distributions are reinvested and reflect applicable fees and expenses. When applicable, investment results reflect fee waivers, without which results would have been lower. Visit americanfunds.com for more information.
Investing outside the United States involves risks, such as currency fluctuations, periods of illiquidity and price volatility, as more fully described in the prospectus. These risks may be heightened in connection with investments in developing countries. Refer to the fund prospectus and the Risk Factors section of this report for more information on these and other risks associated with investing in the fund.

Fellow investors:
Despite volatility and concern stemming from a variety of causes — including the British vote to exit the European Union, sharply declining oil prices and continued economic uncertainty — The Growth Fund of America (GFA) achieved a positive return of 9.31% for the fiscal year ended August 31, 2016.
This return includes dividends totaling more than 27 cents a share, along with a one-time capital gains payment of $3.39. By way of comparison, the unmanaged Standard & Poor’s 500 Composite Index, a market capitalization-weighted index based on the results of 500 widely held common stocks, advanced 12.55%. The average return for the four Lipper peer indexes we use for comparison was 7.41%, and the fund’s return surpassed three of the four peer indexes for the period.
As you can see in the table below, the fund’s long-term results are on par with, or have surpassed, those of its peer groups and benchmark at various times. We continue to stress the long term, both in our unique investment process and in how we urge our investors and their advisors to think
Results at a glance
Total returns for periods ended August 31, 2016, with all distributions reinvested
| | | Cumulative | | | | | | | | |
| | | total returns | | Average annual total returns |
| | | 1 year | | 5 years | | 10 years | | Lifetime1 |
| | | | | | | | | | | | | | | | |
| The Growth Fund of America (Class A shares) | | | 9.31 | % | | | 14.13 | % | | | 7.37 | % | | | 13.44 | % |
| Standard & Poor’s 500 Composite Index2 | | | 12.55 | | | | 14.69 | | | | 7.51 | | | | 10.85 | |
| Lipper Large-Cap Growth Funds Index3 | | | 6.08 | | | | 13.04 | | | | 7.68 | | | | — | 4 |
| Lipper Growth Funds Index3 | | | 8.00 | | | | 13.32 | | | | 6.85 | | | | 9.77 | |
| Lipper Large-Cap Core Funds Index3 | | | 10.98 | | | | 13.16 | | | | 6.67 | | | | — | 4 |
| Lipper Capital Appreciation Funds Index3 | | | 4.58 | | | | 11.78 | | | | 7.21 | | | | 10.65 | |
| 1 | Since Capital Research and Management Company (CRMC) began managing the fund on December 1, 1973. |
| 2 | The market index is unmanaged and, therefore, has no expenses. Investors cannot invest directly in an index. |
| 3 | Lipper indexes track the largest mutual funds (no more than 30), represented by one share class per fund, in the corresponding Lipper category. |
| 4 | This index was not in existence when CRMC began managing the fund. |
| The Growth Fund of America | 1 |
about their investments, as that is the steadiest and surest way for shareholders to reach their financial goals.
Investment results analysis
The fund continues to invest primarily in growth-oriented or capital appreciation-oriented opportunities domiciled in the United States, with a small portion of stocks from overseas. Most of the fund’s top 10 holdings, in terms of percentage of total assets, meaningfully contributed to the fund’s return over the period.
Among investments in the information technology sector, Microsoft rose 32.0%, while Alphabet, parent company of Google and the fund’s second-largest holding, climbed 23.0%. Oracle also increased by double digits, gaining 11.1%.
The fund’s largest holding, Amazon, soared 50.0%, while Home Depot improved 15.2%. Netflix struggled, however, falling 15.3%. Among energy stocks, EOG Resources gained 13.0%. Elsewhere among the top 10, health insurer UnitedHealth Group was up 17.6%, while biotechnology giant Amgen advanced 12.0%.
Overall, the fund’s investments in consumer discretionary, information technology and energy stocks boosted returns — both in absolute terms and relative to the S&P 500. Despite solid showings from UnitedHealth and Amgen, health care weighed heavily against the fund’s total return during the period.
The fund saw strong returns from its holdings in Canada, Europe, parts of Asia and some emerging markets. Shares in companies from Japan and the United Kingdom — while totaling less than 2% of the fund’s portfolio —detracted. Roughly 12% of the fund’s holdings were in companies headquartered outside the United States. Finally, 6.6% of the portfolio consisted of cash and other short-term securities. This provides the fund’s managers with a measure of liquidity, and allows them to quickly take advantage of promising investment opportunities when they arise.
The road ahead
The uncertainty that has dogged global equity markets for the past year is likely to continue. While the official U.S. unemployment rate has fallen to levels comparable to those before the 2008 market crisis, economic growth continues at a sluggish pace and stock prices are always vulnerable to occasional market jitters. Nonetheless, with our process, we feel we are easily able to find attractive individual securities that can do well over the long term.
Some jitters may occur in association with the U.S. presidential election, as uncertainty ebbs and flows. Other concerns have to do with the global prevalence of low interest rates.
A number of government bond issuers in various countries have now issued more than $12 trillion in bonds with negative interest rates — essentially charging investors for borrowing money. This somewhat odd situation has a great deal to do with efforts by central banks to stimulate economic activity. It remains to be seen whether these efforts will be enough to ignite growth, but having rates at or near zero for an extended period of time is uncharted

| 2 | The Growth Fund of America |
territory, and The Growth Fund of America’s portfolio managers continue to monitor the situation closely for unintended consequences.
Indeed, the interest rate environment is one of many things they evaluate in their search for new investments. Our primary investment approach is based on deep fundamental analysis, a long-term horizon and keen attention to valuation. This approach has stood the test of time and gives us great confidence in our ability to serve shareholders well. For more on how the fund manages market volatility, see the special feature beginning on page 6.
We thank you for your continued support and look forward to reporting to you again in six months.
Cordially,

Donald D. O’Neal
Vice Chairman of the Board

Michael Kerr
President
October 10, 2016
For current information about the fund, visit americanfunds.com.
The New Geography of Investing®
While just over 12% of The Growth Fund of America’s portfolio is invested in companies domiciled overseas, far more of the fund’s holdings do business on a global basis. The charts below show where the fund’s equities are domiciled, and how much of those companies’ revenues are derived from other countries.
Equity portion breakdown by domicile (%)
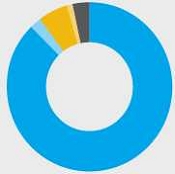
| | Region | | Fund | | | Index | |
| n | United States | | | 88 | % | | | 100 | % |
| n | Canada | | | 2 | | | | — | |
| n | Europe | | | 6 | | | | — | |
| n | Japan | | | 1 | | | | — | |
| n | Asia-Pacific ex. Japan | | | — | | | | — | |
| n | Emerging markets | | | 3 | | | | — | |
| | Total | | | 100 | % | | | 100 | % |
Equity portion breakdown by revenue (%)
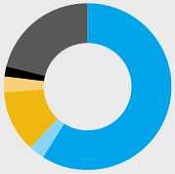
| | Region | | Fund | | | Index | |
| n | United States | | | 59 | % | | | 63 | % |
| n | Canada | | | 3 | | | | 2 | |
| n | Europe | | | 12 | | | | 12 | |
| n | Japan | | | 3 | | | | 3 | |
| n | Asia-Pacific ex. Japan | | | 2 | | | | 1 | |
| n | Emerging markets | | | 21 | | | | 19 | |
| | Total | | | 100 | % | | | 100 | % |
Source: Capital Group (as of August 31, 2016).
| The Growth Fund of America | 3 |
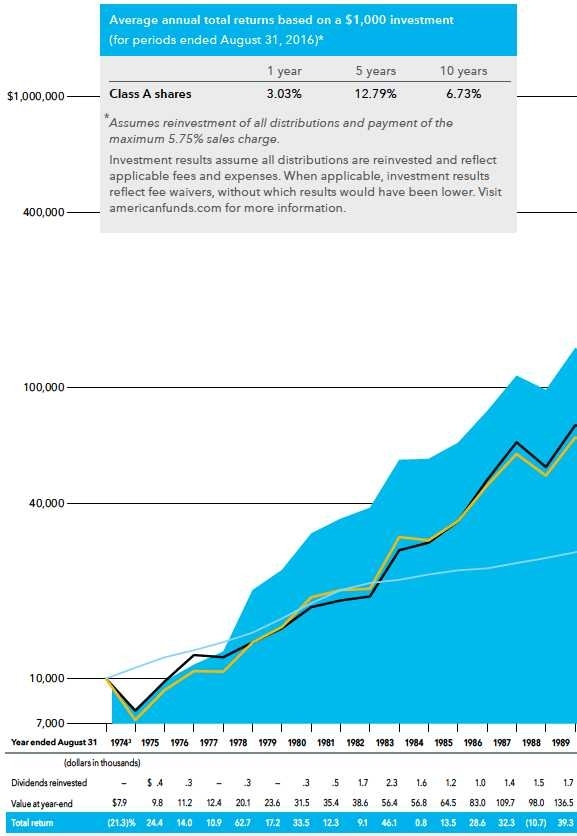
The value of a long-term perspective
Fund results shown are for Class A shares and reflect deduction of the maximum sales charge of 5.75% on the $10,000 investment.¹ Thus, the net amount invested was $9,425.² Results are for past periods and are not predictive of results for future periods. Current and future results may be lower or higher than those shown. Share prices and returns will vary, so investors may lose money. For current information and month-end results, visit americanfunds.com.
The results shown are before taxes on fund distributions and sale of fund shares.
| 1 | As outlined in the prospectus, the sales charge is reduced for accounts (and aggregated investments) of $25,000 or more and is eliminated for purchases of $1 million or more. There is no sales charge on dividends or capital gain distributions that are reinvested in additional shares. |
| 2 | The maximum initial sales charge was 8.5% prior to July 1, 1988. |
| 3 | For the period December 1, 1973 (when Capital Research and Management Company became the fund’s investment adviser), through August 31, 1974. |
| 4 | Includes reinvested dividends of $139,405 and reinvested capital gain distributions of $889,704. |
| 5 | The S&P 500 is unmanaged and, therefore, has no expenses. Investors cannot invest directly in an index. |
| 6 | Results of the Lipper Growth Funds Index do not reflect any sales charges. Lipper indexes track the largest mutual funds (no more than 30), represented by one share class per fund, in the corresponding Lipper category. |
| 7 | Computed from data supplied by the U.S. Department of Labor, Bureau of Labor Statistics. |
| 4 | The Growth Fund of America |
How a $10,000 investment has grown
While notable for their volatility in recent years, financial markets have tended to reward investors over the long term. Active management — bolstered by experience and careful research — can add even more value. As the chart shows, over its lifetime, The Growth Fund of America has done demonstrably better than its relevant benchmark.

| The Growth Fund of America | 5 |

Aiming for
consistency
amidst
volatility.
| 6 | The Growth Fund of America |

Jody Jonsson
Portfolio manager

Don O’Neal
Portfolio manager
For everyday investors, the headlines can be alarming. For the investment professionals working on behalf of The Growth Fund of America, however, economic uncertainty and market volatility can also provide a variety of opportunities.
Jody Jonsson was well aware of the Brexit vote when it occurred this summer. In fact, she was working out of our London office when the historic vote was held. She’d read the reports prepared by the company’s macroeconomic experts, closely followed the movement of the markets and considered the possible scenarios.
“We all thought Britain would vote to remain in the European Union, but they didn’t — and we were ready for that,” she says. “Honestly, though, while it was important to Britain and certainly had some ramifications for the markets, it didn’t change the way I invest.”
Back in her Los Angeles office, Jody takes out a list of the holdings she manages on behalf of The Growth Fund of America. Going through it, she’s clearly excited about the potential these investments have to offer. There’s a good deal to discuss, but what’s notable is what wasn’t on her mind: the Brexit, historically low interest rates, sluggish economic growth and the U.S. presidential election.
“Very few, if any of those things, will help a bad investment,” she states. “And over the long term, very few will keep a great company from providing good returns for its shareholders.”
It’s safe to say that 2016 has been a very unusual year, both at home and abroad. It seems like there’s a lot to worry about. While the fund’s managers certainly take events into account, our process doesn’t waver. We use exhaustive, bottom-up research to identify investment opportunities that fit well with our long-term approach to investing.
“There will always be volatility in the markets. That’s the nature of investing,” says portfolio manager Don O’Neal.
“You can look at it as a bad thing, but that’s not always the case. Volatility doesn’t change the consistency of our approach, for one, and there are even times when it provides opportunities to make investments at lower-than-expected prices.”
Understanding the terrain
The investment professionals of GFA closely study the workings of a company as they weigh the potential of investing. Many times, the vagaries of market movements have little to do with that potential, but it’s worth understanding the market environment regardless.
“I think you do have to tune out the noise to a certain extent,” says portfolio manager James Terrile. “There’s stuff that ultimately doesn’t matter. The trick is to figure out what does.”
So what does matter? The overall trend in the economy may or may not hurt a company’s prospects in the long run, but could very much affect its business in the short or medium term.
Furthermore, today’s speed bump could become tomorrow’s roadblock —or freeway.
“For me, the environment in which we invest is a big factor,” says portfolio
| The Growth Fund of America | 7 |

Darren Peers
Investment analyst
“Several of the companies I cover are tied to supply and demand, and that’s very true of oil and gas,” he explains. “So you get a lot of volatility there; it comes with the territory.”
Energy
Darren Peers is used to volatility. As an energy sector analyst, he’s seen oil prices near $100 a barrel and, more recently, under $30. These dynamics can cause a lot of concern in the marketplace, but Darren remains focused on the fundamentals.
When oil prices are booming, Darren takes the opportunity to see how energy companies allocate their extra cash. Do they invest for the future or pay down debt? Do they reward shareholders by increasing dividend payouts or focus on developing new energy sources? And when oil prices fall, it gives him the chance to look at which companies are best positioned for the inevitable rise in prices down the road.
“Seeing how companies deal with price changes is key to what I do,” he says. “So I pay attention to the big drivers of energy demand, and then figure out which of the firms are poised to make the most of adjustments in that demand.” n

| 8 | The Growth Fund of America |

James Terrile
Portfolio manager

Alan Wilson
Portfolio manager
manager Alan Wilson. “There are always challenges on the horizon. I look two to four years out to try to assess which challenges may persist and which are more likely to be transitory. Sometimes temporary challenges can provide short-term opportunities to buy or sell. The persistent ones, on the other hand, are something you have to really bake into your investment thesis.
“That said, you don’t want to be impatient or act too rashly. We’re long-term investors because we feel it’s the best way to build value, and our results for shareholders bear that out. We can be thoughtful. We can move incrementally and see how things develop. There’s nothing wrong with waiting it out.”
Each portfolio manager has an opinion as to the current market environment. Some believe that the economy’s slow growth is simply in need of a spark to set it off. Others worry about what could happen if that spark isn’t forthcoming. It doesn’t change their goal — to identify stocks with the potential to provide long-term results for investors — but it can inform how they go about it.
In crisis, opportunity
Volatility can be truly upsetting if you make it a point to check your portfolio balance on a daily basis. You may feel compelled to move your assets under the nearest mattress. For our investment professionals, however, the markets’ erratic movements often present attractive opportunities.
“You’ll frequently find that the markets, at least in the short term, take things to an extreme,” portfolio manager Chris Buchbinder acknowledges. “That can either beat prices down or inflate them quite a bit. Our research provides a comprehensive view, and ideally helps us understand which companies are well situated going forward.”
Chris has been known to wait for a spate of volatility in order to purchase shares of a company he believes will be a sound investment at a short-term discount, thus adding to the potential long-term gain.
“Yes, you’re always going to get volatility and scary headlines, but that can be an opportunity for an investor who knows a company well, recognizes its potential and can discern when things are ‘out of whack,’ ” he adds.
Different approaches
For Jody, if there’s an opportunity in a sector known for volatility, she will look to invest in companies that are peripherally connected to it — or that have enough diversification to cushion any downturns.
“If you look at energy, for example, I might choose a supplier to the industry rather than one of the larger companies,” she explains. “I want to participate, but I’ll do so in companies that I feel certain have some distance from the volatility.”
Others, such as investment analyst Keiko McKibben, actively look for contrarian investments — companies that have the capacity to endure, even as their sectors fall out of favor.
“I cover industrials, and they are very cyclical,” Keiko says. “Even when the environment isn’t particularly volatile, you want to buy these stocks when it feels terrible to do so. A contrarian bent comes with this job.”
Keiko will look for market overreaction, whether it’s company-specific bad news or an oversold sector. She focuses on a company’s revenue, debt and profits, as well as the capabilities and track record of its management team. If she believes it has promise, she will patiently wait for a downturn in share price so she can make her investment at a discount.
A singular goal
No matter the philosophy or approach, the objective is the same: to invest in solid companies with the potential for long-term growth.
| The Growth Fund of America | 9 |

Keiko McKibben
Investment analyst
“Essentially, it’s the same investment process that we use elsewhere in the fund – bottom-up research, long-term focus,” she says. “But it keeps you on your toes. Prices move around much more than a company’s fundamentals, which may create a window to buy the same stock at a considerably more attractive price if the timing’s right.”
Industrials
The industrials sector, a catch-all for businesses involved in commercial manufacturing or services, is very cyclical; economic trends have a more significant effect on these companies than others. For analyst Keiko McKibben, that means added volatility — and the potential for greater opportunity.
With a background in mathematics, Keiko tends to view the market in terms of probabilities — determining the best- and worst-case scenarios and finding the most likely one in between. That means the comprehensive study of a variety of companies.
“I think so many industrial companies out there can be positive investments for the fund — at the right price,” she adds. “I get to know them, even when they’re expensive, so that I can act when they become cheap. And chances are, they will at some point.” n

| 10 | The Growth Fund of America |

Chris Buchbinder
Portfolio manager
“We have differing opinions — and that often leads to some robust debates,” Don relates. “But our portfolio managers and analysts make their own decisions. And they’re held accountable.”
Compensation paid to our investment professionals is heavily influenced by results over one-, three-, five- and eight-year periods, with increasing weight placed on each succeeding measurement period to encourage a long-term investment approach. As such, they make their investment decisions with a long-term outlook, and are able to keep short-term volatility in its proper perspective.
“Noisy headlines can create a lot of fear in the market,” Don adds. “For us, the key is to put aside the fear and look at the reality of the situation with one goal in mind — to make the best choices for our investors.” n
Long-term trends
Each portfolio manager and investment analyst has their own view of the world. And each has certain long-term trends they monitor. These trends help to shape broad investment theses which, when paired with bottom-up research, guide their investment decisions.
James Terrile: “Over the past 30 years, we’ve seen interest rates go from very high to near zero, and there are bound to be effects from this move that we’ve yet to see. So that’s something I watch closely.”
Alan Wilson: “The relationship between labor and management is often a tug of war, and it’s one where management has had the edge for almost two decades. I believe we are on the cusp of a long-overdue shift, so I am very interested in companies with a history of effectively balancing the needs of shareholders, customers and employees.”
Darren Peers: “We talk a lot about China and the questions around its economy, but at the end of the day, you’re still talking about a country of over a billion people that’s continuing to industrialize. When I look long-term at energy demand, I absolutely have to take that into account.”
Keiko McKibben: “We’ve seen many manufacturers improve profitability in recent years, in spite of weak revenue growth. At some point these companies actually need to see a fundamental improvement in demand for their products. Cost-cutting only takes you so far. So I think about how at this stage the industrial companies are more dependent on underlying growth than they were earlier in the recovery.”
It’s worth noting that these trends are not the sole basis of investment decisions with respect to individual equities. Rather, they act as a lens — one of many — through which the fund’s professionals view the market environment, helping to further inform their investment choices.
| The Growth Fund of America | 11 |
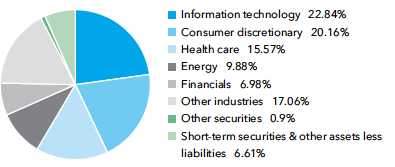
Summary investment portfolio August 31, 2016
| Industry sector diversification | Percent of net assets |
| Largest equity holdings | | Percent of
net assets |
| Amazon | | | 6.76 | % |
| Alphabet | | | 2.78 | |
| Broadcom | | | 2.69 | |
| Home Depot | | | 2.29 | |
| UnitedHealth Group | | | 2.08 | |
| Microsoft | | | 2.06 | |
| Amgen | | | 1.75 | |
| EOG Resources | | | 1.62 | |
| Netflix | | | 1.54 | |
| Oracle | | | 1.44 | |
| Common stocks 92.49% | | Shares | | | Value
(000) | |
| Information technology 22.84% | | | | | | | | |
| Alphabet Inc., Class C1 | | | 3,002,670 | | | $ | 2,303,198 | |
| Alphabet Inc., Class A1 | | | 2,205,770 | | | | 1,742,227 | |
| Broadcom Ltd.2 | | | 22,178,905 | | | | 3,912,802 | |
| Microsoft Corp. | | | 52,167,600 | | | | 2,997,550 | |
| Oracle Corp. | | | 50,881,000 | | | | 2,097,315 | |
| Facebook, Inc., Class A1 | | | 15,718,000 | | | | 1,982,354 | |
| Alibaba Group Holding Ltd. (ADR)1 | | | 16,897,100 | | | | 1,642,229 | |
| ASML Holding NV (New York registered) | | | 8,498,941 | | | | 905,562 | |
| ASML Holding NV | | | 6,609,442 | | | | 703,116 | |
| Visa Inc., Class A | | | 17,158,049 | | | | 1,388,086 | |
| Taiwan Semiconductor Manufacturing Co., Ltd. | | | 195,610,000 | | | | 1,084,993 | |
| Taiwan Semiconductor Manufacturing Co., Ltd. (ADR) | | | 9,913,800 | | | | 284,922 | |
| Intuit Inc. | | | 10,795,000 | | | | 1,203,103 | |
| Apple Inc. | | | 10,683,000 | | | | 1,133,466 | |
| Texas Instruments Inc. | | | 12,190,100 | | | | 847,700 | |
| Intel Corp. | | | 20,157,627 | | | | 723,457 | |
| Other securities | | | | | | | 8,300,003 | |
| | | | | | | | 33,252,083 | |
| | | | | | | | | |
| Consumer discretionary 20.16% | | | | | | | | |
| Amazon.com, Inc.1 | | | 12,799,496 | | | | 9,844,860 | |
| Home Depot, Inc. | | | 24,887,200 | | | | 3,337,871 | |
| Netflix, Inc.1,2 | | | 23,034,761 | | | | 2,244,738 | |
| Comcast Corp., Class A | | | 29,797,000 | | | | 1,944,552 | |
| Priceline Group Inc.1 | | | 1,196,209 | | | | 1,694,705 | |
| Twenty-First Century Fox, Inc., Class A | | | 36,262,906 | | | | 889,892 | |
| Charter Communications, Inc., Class A1 | | | 3,172,860 | | | | 816,091 | |
| Viacom Inc., Class B | | | 18,198,351 | | | | 734,122 | |
| MGM Resorts International1,2 | | | 30,253,344 | | | | 722,752 | |
| Starbucks Corp. | | | 12,600,000 | | | | 708,498 | |
| Other securities | | | | | | | 6,412,714 | |
| | | | | | | | 29,350,795 | |
| | | | | | | | | |
| Health care 15.57% | | | | | | | | |
| UnitedHealth Group Inc. | | | 22,308,505 | | | | 3,035,072 | |
| Amgen Inc. | | | 14,972,709 | | | | 2,546,259 | |
| Express Scripts Holding Co.1 | | | 21,417,793 | | | | 1,557,074 | |
| Illumina, Inc.1,2 | | | 8,315,957 | | | | 1,399,908 | |
| Thermo Fisher Scientific Inc. | | | 8,918,000 | | | | 1,357,230 | |
| Gilead Sciences, Inc. | | | 13,458,198 | | | | 1,054,854 | |
| Regeneron Pharmaceuticals, Inc.1 | | | 2,458,000 | | | | 964,888 | |
| Stryker Corp. | | | 8,278,376 | | | | 957,477 | |
| AbbVie Inc. | | | 12,009,000 | | | | 769,777 | |
| AbbVie Inc.3,4 | | | 2,433,249 | | | | 149,732 | |
| BioMarin Pharmaceutical Inc.1 | | | 8,539,041 | | | | 801,731 | |
| Alexion Pharmaceuticals, Inc.1 | | | 6,289,189 | | | | 791,557 | |
| Aetna Inc. | | | 6,607,800 | | | | 773,906 | |
| 12 | The Growth Fund of America |
| | | Shares | | | Value
(000) | |
| Boston Scientific Corp.1 | | | 32,010,000 | | | $ | 762,478 | |
| Humana Inc. | | | 3,967,000 | | | | 708,943 | |
| Other securities | | | | | | | 5,035,427 | |
| | | | | | | | 22,666,313 | |
| | | | | | | | | |
| Energy 9.88% | | | | | | | | |
| EOG Resources, Inc. | | | 26,662,108 | | | | 2,359,330 | |
| Schlumberger Ltd. | | | 21,480,484 | | | | 1,696,958 | |
| Concho Resources Inc.1,2 | | | 9,516,984 | | | | 1,229,594 | |
| Pioneer Natural Resources Co. | | | 6,839,716 | | | | 1,224,651 | |
| Halliburton Co. | | | 28,133,600 | | | | 1,210,026 | |
| Canadian Natural Resources, Ltd. | | | 36,031,310 | | | | 1,119,075 | |
| Noble Energy, Inc.2 | | | 26,435,185 | | | | 911,485 | |
| Other securities | | | | | | | 4,634,625 | |
| | | | | | | | 14,385,744 | |
| | | | | | | | | |
| Financials 6.98% | | | | | | | | |
| American International Group, Inc. | | | 33,268,000 | | | | 1,990,424 | |
| Berkshire Hathaway Inc., Class A1 | | | 5,132 | | | | 1,158,600 | |
| Berkshire Hathaway Inc., Class B1 | | | 4,513,508 | | | | 679,238 | |
| Goldman Sachs Group, Inc. | | | 4,769,996 | | | | 808,324 | |
| JPMorgan Chase & Co. | | | 10,400,000 | | | | 702,000 | |
| Other securities | | | | | | | 4,828,412 | |
| | | | | | | | 10,166,998 | |
| | | | | | | | | |
| Consumer staples 6.39% | | | | | | | | |
| Philip Morris International Inc. | | | 20,316,433 | | | | 2,030,221 | |
| Costco Wholesale Corp. | | | 10,333,183 | | | | 1,674,906 | |
| Kroger Co.2 | | | 48,872,341 | | | | 1,563,426 | |
| Other securities | | | | | | | 4,043,744 | |
| | | | | | | | 9,312,297 | |
| | | | | | | | | |
| Industrials 4.46% | | | | | | | | |
| Union Pacific Corp. | | | 12,088,739 | | | | 1,154,837 | |
| Other securities | | | | | | | 5,337,499 | |
| | | | | | | | 6,492,336 | |
| | | | | | | | | |
| Materials 2.16% | | | | | | | | |
| E.I. du Pont de Nemours and Co. | | | 11,431,500 | | | | 795,632 | |
| Other securities | | | | | | | 2,350,328 | |
| | | | | | | | 3,145,960 | |
| | | | | | | | | |
| Telecommunication services 0.47% | | | | | | | | |
| Other securities | | | | | | | 679,940 | |
| | | | | | | | | |
| Miscellaneous 3.58% | | | | | | | | |
| Other common stocks in initial period of acquisition | | | | | | | 5,219,235 | |
| | | | | | | | | |
| Total common stocks (cost: $81,484,321,000) | | | | | | | 134,671,701 | |
| | | | | | | | | |
| Rights & warrants 0.04% | | | | | | | | |
| Other 0.04% | | | | | | | | |
| Other securities | | | | | | | 62,039 | |
| | | | | | | | | |
| Total rights & warrants (cost: $78,883,000) | | | | | | | 62,039 | |
| The Growth Fund of America | 13 |
| Convertible stocks 0.10% | | Shares | | | Value
(000) | |
| Consumer discretionary 0.10% | | | | | | |
| Other securities | | | | | | $ | 140,699 | |
| | | | | | | | | |
| Total convertible stocks (cost: $114,350,000) | | | | | | | 140,699 | |
| | | | | | | | | |
| Convertible bonds 0.01% | | | Principal
amount
(000) | | | | | |
| Miscellaneous 0.01% | | | | | | | | |
| Other convertible bonds in initial period of acquisition | | | | | | | 18,230 | |
| | | | | | | | | |
| Total convertible bonds (cost: $17,300,000) | | | | | | | 18,230 | |
| | | | | | | | | |
| Bonds, notes & other debt instruments 0.75% | | | | | | | | |
| U.S. Treasury bonds & notes 0.72% | | | | | | | | |
| U.S. Treasury 0.72% | | | | | | | | |
| U.S. Treasury 1.62%–2.50% 2026–20465 | | | 1,031,765 | | | | 1,051,534 | |
| | | | | | | | | |
| Corporate bonds & notes 0.03% | | | | | | | | |
| Energy 0.03% | | | | | | | | |
| Other securities | | | | | | | 43,114 | |
| | | | | | | | | |
| Total bonds, notes & other debt instruments (cost: $1,045,964,000) | | | | | | | 1,094,648 | |
| | | | | | | | | |
| Short-term securities 6.68% | | | | | | | | |
| Federal Home Loan Bank 0.30%–0.55% due 9/1/2016–5/25/2017 | | $ | 4,301,475 | | | | 4,294,566 | |
| Microsoft Corp. 0.44%–0.50% due 10/5/2016–11/15/20164 | | | 225,000 | | | | 224,844 | |
| U.S. Treasury Bills 0.32%–0.50% due 9/1/2016–2/23/2017 | | | 1,383,900 | | | | 1,382,404 | |
| Other securities | | | | | | | 3,822,445 | |
| | | | | | | | | |
| Total short-term securities (cost: $9,723,298,000) | | | | | | | 9,724,259 | |
| Total investment securities 100.07% (cost: $92,464,116,000) | | | | | | | 145,711,576 | |
| Other assets less liabilities (0.07)% | | | | | | | (96,784 | ) |
| | | | | | | | | |
| Net assets 100.00% | | | | | | $ | 145,614,792 | |
This summary investment portfolio is designed to streamline the report and help investors better focus on the fund’s principal holdings. See the inside back cover for details on how to obtain a complete schedule of portfolio holdings.
As permitted by U.S. Securities and Exchange Commission regulations, “Miscellaneous” securities include holdings in their first year of acquisition that have not previously been publicly disclosed.
“Other securities” includes all issues that are not disclosed separately in the summary investment portfolio. Some of these securities (with aggregate value of $287,345,000, an aggregate cost of $319,891,000, and which represented .20% of the net assets of the fund) were acquired from 7/7/2000 to 8/27/2015 through private placement transactions exempt from registration under the Securities Act of 1933, which may subject them to legal or contractual restrictions on resale.
Forward currency contracts
The fund has entered into forward currency contracts as shown in the following table. The average month-end notional amount of open forward currency contracts while held was $205,426,000.
| | | | | | | Contract amount | | | Unrealized
(depreciation) | |
| | | Settlement date | | Counterparty | | Receive
(000) | | | Deliver
(000) | | | appreciation
at 8/31/2016
(000) | |
| Sales: | | | | | | | | | | | | | | | | |
| British pounds | | 9/20/2016 | | Barclays Bank PLC | | | $8,146 | | | | £6,247 | | | | $ | (61 | ) |
| British pounds | | 9/20/2016 | | HSBC Bank | | | $8,144 | | | | £6,258 | | | | | (78 | ) |
| British pounds | | 9/21/2016 | | UBS AG | | | $8,127 | | | | £6,248 | | | | | (81 | ) |
| British pounds | | 9/28/2016 | | JPMorgan Chase | | | $8,134 | | | | £6,247 | | | | | (75 | ) |
| Euros | | 9/14/2016 | | JPMorgan Chase | | | $102,524 | | | | €91,150 | | | | | 791 | |
| Euros | | 10/6/2016 | | Barclays Bank PLC | | | $70,142 | | | | €62,800 | | | | | (21 | ) |
| | | | | | | | | | | | | | | | $ | 475 | |
| 14 | The Growth Fund of America |
Investments in affiliates
A company is an affiliate of the fund under the Investment Company Act of 1940 if the fund’s holdings in that company represent 5% or more of the outstanding voting shares. The value of the fund’s affiliated-company holdings is either shown in the summary investment portfolio or included in the value of “Other securities” under the respective industry sectors. Further details on such holdings and related transactions during the year ended August 31, 2016, appear below.
| | | Beginning
shares | | | Additions | | | Reductions | | | Ending
shares | | | Dividend
income
(000) | | | Value of
affiliates at
8/31/2016
(000) | |
| Broadcom Ltd.6 | | | 19,886,438 | | | | 4,367,890 | | | | 2,075,423 | | | | 22,178,905 | | | $ | 23,384 | | | $ | 3,912,802 | |
| Netflix, Inc.1 | | | 12,842,669 | | | | 11,038,392 | | | | 846,300 | | | | 23,034,761 | | | | — | | | | 2,244,738 | |
| Kroger Co. | | | 22,045,370 | | | | 28,166,971 | | | | 1,340,000 | | | | 48,872,341 | | | | 17,602 | | | | 1,563,426 | |
| Illumina, Inc.1 | | | 5,172,501 | | | | 3,980,663 | | | | 837,207 | | | | 8,315,957 | | | | — | | | | 1,399,908 | |
| Concho Resources Inc.1 | | | 7,699,684 | | | | 2,999,806 | | | | 1,182,506 | | | | 9,516,984 | | | | — | | | | 1,229,594 | |
| Noble Energy, Inc. | | | 21,081,321 | | | | 12,873,472 | | | | 7,519,608 | | | | 26,435,185 | | | | 9,905 | | | | 911,485 | |
| MGM Resorts International1 | | | 31,884,676 | | | | 5,011,268 | | | | 6,642,600 | | | | 30,253,344 | | | | — | | | | 722,752 | |
| Akamai Technologies, Inc.1 | | | — | | | | 8,750,000 | | | | — | | | | 8,750,000 | | | | — | | | | 480,375 | |
| Juniper Networks, Inc. | | | — | | | | 19,827,923 | | | | — | | | | 19,827,923 | | | | 4,809 | | | | 457,629 | |
| BorgWarner Inc. | | | 8,600,000 | | | | 2,607,259 | | | | — | | | | 11,207,259 | | | | 5,554 | | | | 385,418 | |
| Weatherford International PLC1 | | | 26,180,000 | | | | 43,770,382 | | | | — | | | | 69,950,382 | | | | — | | | | 382,629 | |
| Flextronics International Ltd.1 | | | 13,276,000 | | | | 14,536,000 | | | | — | | | | 27,812,000 | | | | — | | | | 368,231 | |
| AutoNation, Inc.1 | | | 6,000,000 | | | | — | | | | — | | | | 6,000,000 | | | | — | | | | 284,100 | |
| Oshkosh Corp. | | | 4,368,000 | | | | — | | | | 682,400 | | | | 3,685,600 | | | | 3,060 | | | | 198,764 | |
| bluebird bio, Inc.1 | | | 2,056,187 | | | | 295,889 | | | | 455,000 | | | | 1,897,076 | | | | — | | | | 93,602 | |
| athenahealth, Inc.1,7 | | | 2,529,861 | | | | — | | | | 1,518,577 | | | | 1,011,284 | | | | — | | | | — | |
| BioMarin Pharmaceutical Inc.1,7 | | | 8,060,428 | | | | 2,673,905 | | | | 2,195,292 | | | | 8,539,041 | | | | — | | | | — | |
| Finisar Corp.1,7 | | | 6,998,000 | | | | — | | | | 4,930,000 | | | | 2,068,000 | | | | — | | | | — | |
| Herbalife Ltd.1,7 | | | 4,186,400 | | | | 2,030,000 | | | | 1,578,400 | | | | 4,638,000 | | | | — | | | | — | |
| Hologic, Inc.1,7 | | | 15,219,195 | | | | — | | | | 10,311,877 | | | | 4,907,318 | | | | — | | | | — | |
| Myriad Genetics, Inc.1,7 | | | 3,579,785 | | | | — | | | | 3,579,785 | | | | — | | | | — | | | | — | |
| First Quantum Minerals Ltd.7 | | | 34,450,000 | | | | — | | | | — | | | | 34,450,000 | | | | 398 | | | | — | |
| Sprouts Farmers Market, Inc.1,7 | | | 8,088,000 | | | | — | | | | 8,088,000 | | | | — | | | | — | | | | — | |
| | | | | | | | | | | | | | | | | | | $ | 64,712 | | | $ | 14,635,453 | |
The following footnotes apply to either the individual securities noted or one or more of the securities aggregated and listed as a single line item.
| 1 | Security did not produce income during the last 12 months. |
| 2 | Represents an affiliated company as defined under the Investment Company Act of 1940. |
| 3 | Valued under fair value procedures adopted by authority of the board of trustees. The total value of all such securities, including those in “Other securities,” was $862,930,000, which represented .59% of the net assets of the fund. |
| 4 | Acquired in a transaction exempt from registration under Rule 144A or Section 4(2) of the Securities Act of 1933. May be resold in the U.S. in transactions exempt from registration, normally to qualified institutional buyers. The total value of all such securities, including those in “Other securities,” was $2,144,712,000, which represented 1.47% of the net assets of the fund. |
| 5 | A portion of this security was pledged as collateral. The total value of pledged collateral was $1,319,000, which represented less than .01% of the net assets of the fund. |
| 6 | This security changed its name due to a corporate action during the reporting period. |
| 7 | Unaffiliated issuer at 8/31/2016. |
Key to abbreviation and symbols
ADR = American Depositary Receipts
£ = British pounds
€ = Euros
See Notes to Financial Statements
| The Growth Fund of America | 15 |
Financial statements
Statement of assets and liabilities
at August 31, 2016 | | (dollars in thousands) | |
| | | | |
| Assets: | | | | | | | | |
| Investment securities, at value: | | | | | | | | |
| Unaffiliated issuers (cost: $81,930,089) | | $ | 131,076,123 | | | | | |
| Affiliated issuers (cost: $10,534,027) | | | 14,635,453 | | | $ | 145,711,576 | |
| Cash | | | | | | | 90 | |
| Cash denominated in currencies other than U.S. dollars (cost: $1,479) | | | | | | | 1,479 | |
| Unrealized appreciation on open forward currency contracts | | | | | | | 791 | |
| Receivables for: | | | | | | | | |
| Sales of investments | | | 348,982 | | | | | |
| Sales of fund’s shares | | | 109,749 | | | | | |
| Dividends and interest | | | 163,322 | | | | | |
| Other | | | 7 | | | | 622,060 | |
| | | | | | | | 146,335,996 | |
| Liabilities: | | | | | | | | |
| Unrealized depreciation on open forward currency contracts | | | | | | | 316 | |
| Payables for: | | | | | | | | |
| Purchases of investments | | | 422,091 | | | | | |
| Repurchases of fund’s shares | | | 200,474 | | | | | |
| Closed forward currency contracts | | | 912 | | | | | |
| Investment advisory services | | | 33,981 | | | | | |
| Services provided by related parties | | | 55,481 | | | | | |
| Trustees’ deferred compensation | | | 5,220 | | | | | |
| Other | | | 2,729 | | | | 720,888 | |
| Net assets at August 31, 2016 | | | | | | $ | 145,614,792 | |
| | | | | | | | | |
| Net assets consist of: | | | | | | | | |
| Capital paid in on shares of beneficial interest | | | | | | $ | 84,619,386 | |
| Undistributed net investment income | | | | | | | 445,757 | |
| Undistributed net realized gain | | | | | | | 7,302,546 | |
| Net unrealized appreciation | | | | | | | 53,247,103 | |
| Net assets at August 31, 2016 | | | | | | $ | 145,614,792 | |
See Notes to Financial Statements
| 16 | The Growth Fund of America |
(dollars and shares in thousands, except per-share amounts)
Shares of beneficial interest issued and outstanding (no stated par value) —
unlimited shares authorized (3,368,829 total shares outstanding)
| | | | | | Shares | | | Net asset value | |
| | | Net assets | | | outstanding | | | per share | |
| Class A | | $ | 74,847,265 | | | | 1,721,659 | | | $ | 43.47 | |
| Class B | | | 196,109 | | | | 4,760 | | | | 41.20 | |
| Class C | | | 5,008,973 | | | | 123,101 | | | | 40.69 | |
| Class F-1 | | | 8,493,796 | | | | 196,604 | | | | 43.20 | |
| Class F-2 | | | 12,099,993 | | | | 278,479 | | | | 43.45 | |
| Class 529-A | | | 6,229,074 | | | | 144,597 | | | | 43.08 | |
| Class 529-B | | | 40,164 | | | | 981 | | | | 40.95 | |
| Class 529-C | | | 1,468,598 | | | | 35,969 | | | | 40.83 | |
| Class 529-E | | | 271,915 | | | | 6,376 | | | | 42.65 | |
| Class 529-F-1 | | | 231,271 | | | | 5,373 | | | | 43.04 | |
| Class R-1 | | | 437,682 | | | | 10,615 | | | | 41.23 | |
| Class R-2 | | | 2,136,649 | | | | 51,366 | | | | 41.60 | |
| Class R-2E | | | 34,380 | | | | 801 | | | | 42.92 | |
| Class R-3 | | | 6,506,601 | | | | 152,455 | | | | 42.68 | |
| Class R-4 | | | 7,761,844 | | | | 179,962 | | | | 43.13 | |
| Class R-5E | | | 10 | | | | — | * | | | 43.34 | |
| Class R-5 | | | 3,551,286 | | | | 81,645 | | | | 43.50 | |
| Class R-6 | | | 16,299,182 | | | | 374,086 | | | | 43.57 | |
| * | Amount less than one thousand. |
See Notes to Financial Statements
| The Growth Fund of America | 17 |
Statement of operations
for the year ended August 31, 2016 | | (dollars in thousands) | |
| | | | |
| Investment income: | | | | | | | | |
| Income: | | | | | | | | |
| Dividends (net of non-U.S. taxes of $4,811; also includes $64,712 from affiliates) | | $ | 1,659,839 | | | | | |
| Interest | | | 61,512 | | | $ | 1,721,351 | |
| Fees and expenses*: | | | | | | | | |
| Investment advisory services | | | 385,713 | | | | | |
| Distribution services | | | 345,699 | | | | | |
| Transfer agent services | | | 155,201 | | | | | |
| Administrative services | | | 41,133 | | | | | |
| Reports to shareholders | | | 5,124 | | | | | |
| Registration statement and prospectus | | | 1,858 | | | | | |
| Trustees’ compensation | | | 526 | | | | | |
| Auditing and legal | | | 2,653 | | | | | |
| Custodian | | | 2,813 | | | | | |
| Other | | | 7,031 | | | | 947,751 | |
| Net investment income | | | | | | | 773,600 | |
| | | | | | | | | |
| Net realized gain and unrealized appreciation: | | | | | | | | |
| Net realized gain (loss) on: | | | | | | | | |
| Investments (includes $198,188 net loss from affiliates) | | | 8,307,782 | | | | | |
| Forward currency contracts | | | 3,026 | | | | | |
| Currency transactions | | | (3,375 | ) | | | 8,307,433 | |
| Net unrealized appreciation (depreciation) on: | | | | | | | | |
| Investments (net of non-U.S. taxes of $275) | | | 3,579,794 | | | | | |
| Forward currency contracts | | | 475 | | | | | |
| Currency translations | | | (157 | ) | | | 3,580,112 | |
| Net realized gain and unrealized appreciation | | | | | | | 11,887,545 | |
| Net increase in net assets resulting from operations | | | | | | $ | 12,661,145 | |
| * | Additional information related to class-specific fees and expenses is included in the Notes to Financial Statements. |
Statements of changes in net assets
(dollars in thousands)
| | | Year ended August 31 | |
| | | 2016 | | | 2015 | |
| Operations: | | | | | | | | |
| Net investment income | | $ | 773,600 | | | $ | 692,963 | |
| Net realized gain | | | 8,307,433 | | | | 11,999,327 | |
| Net unrealized appreciation (depreciation) | | | 3,580,112 | | | | (9,664,045 | ) |
| Net increase in net assets resulting from operations | | | 12,661,145 | | | | 3,028,245 | |
| | | | | | | | | |
| Dividends and distributions paid to shareholders: | | | | | | | | |
| Dividends from net investment income | | | (859,355 | ) | | | (510,334 | ) |
| Distributions from net realized gain on investments | | | (10,963,179 | ) | | | (12,500,250 | ) |
| Total dividends and distributions paid to shareholders | | | (11,822,534 | ) | | | (13,010,584 | ) |
| Net capital share transactions | | | 3,977,050 | | | | 5,579,710 | |
| | | | | | | | | |
| Total increase (decrease) in net assets | | | 4,815,661 | | | | (4,402,629 | ) |
| | | | | | | | | |
| Net assets: | | | | | | | | |
| Beginning of year | | | 140,799,131 | | | | 145,201,760 | |
| End of year (including undistributed net investment income: $445,757 and $491,714, respectively) | | $ | 145,614,792 | | | $ | 140,799,131 | |
See Notes to Financial Statements
| 18 | The Growth Fund of America |
Notes to financial statements
1. Organization
The Growth Fund of America (the “fund”) is registered under the Investment Company Act of 1940 as an open-end, diversified management investment company. The fund seeks to provide growth of capital.
The fund has 18 share classes consisting of five retail share classes (Classes A, B and C, as well as two F share classes, F-1 and F-2), five 529 college savings plan share classes (Classes 529-A, 529-B, 529-C, 529-E and 529-F-1) and eight retirement plan share classes (Classes R-1, R-2, R-2E, R-3, R-4, R-5E, R-5 and R-6). The 529 college savings plan share classes can be used to save for college education. The retirement plan share classes are generally offered only through eligible employer-sponsored retirement plans. The fund’s share classes are described further in the following table:
| Share class | | Initial sales charge | | Contingent deferred sales charge upon redemption | | Conversion feature |
| Classes A and 529-A | | Up to 5.75% | | None (except 1% for certain redemptions within one year of purchase without an initial sales charge) | | None |
| Classes B and 529-B* | | None | | Declines from 5% to 0% for redemptions within six years of purchase | | Classes B and 529-B convert to Classes A and 529-A, respectively, after eight years |
| Class C | | None | | 1% for redemptions within one year of purchase | | Class C converts to Class F-1 after 10 years |
| Class 529-C | | None | | 1% for redemptions within one year of purchase | | None |
| Class 529-E | | None | | None | | None |
| Classes F-1, F-2 and 529-F-1 | | None | | None | | None |
| Classes R-1, R-2, R-2E, R-3, R-4, R-5E, R-5 and R-6 | | None | | None | | None |
* Class B and 529-B shares of the fund are not available for purchase.
On November 20, 2015, the fund made an additional retirement plan share class (Class R-5E) available for sale pursuant to an amendment to its registration statement filed with the U.S. Securities and Exchange Commission. Refer to the fund’s prospectus for more details.
Holders of all share classes have equal pro rata rights to the assets, dividends and liquidation proceeds of the fund. Each share class has identical voting rights, except for the exclusive right to vote on matters affecting only its class. Share classes have different fees and expenses (“class-specific fees and expenses”), primarily due to different arrangements for distribution, transfer agent and administrative services. Differences in class-specific fees and expenses will result in differences in net investment income and, therefore, the payment of different per-share dividends by each share class.
2. Significant accounting policies
The fund is an investment company that applies the accounting and reporting guidance issued in Topic 946 by the U.S. Financial Accounting Standards Board. The fund’s financial statements have been prepared to comply with U.S. generally accepted accounting principles (“U.S. GAAP”). These principles require the fund’s investment adviser to make estimates and assumptions that affect reported amounts and disclosures. Actual results could differ from those estimates. Subsequent events, if any, have been evaluated through the date of issuance in the preparation of the financial statements. The fund follows the significant accounting policies described in this section, as well as the valuation policies described in the next section on valuation.
Security transactions and related investment income — Security transactions are recorded by the fund as of the date the trades are executed with brokers. Realized gains and losses from security transactions are determined based on the specific identified cost of the securities. In the event a security is purchased with a delayed payment date, the fund will segregate liquid assets sufficient to meet its payment obligations. Dividend income is recognized on the ex-dividend date and interest income is recognized on an accrual basis. Market discounts, premiums and original issue discounts on fixed-income securities are amortized daily over the expected life of the security.
| The Growth Fund of America | 19 |
Class allocations — Income, fees and expenses (other than class-specific fees and expenses) and realized and unrealized gains and losses are allocated daily among the various share classes based on their relative net assets. Class-specific fees and expenses, such as distribution, transfer agent and administrative services, are charged directly to the respective share class.
Dividends and distributions to shareholders — Dividends and distributions to shareholders are recorded on the ex-dividend date.
Currency translation — Assets and liabilities, including investment securities, denominated in currencies other than U.S. dollars are translated into U.S. dollars at the exchange rates supplied by one or more pricing vendors on the valuation date. Purchases and sales of investment securities and income and expenses are translated into U.S. dollars at the exchange rates on the dates of such transactions. The effects of changes in exchange rates on investment securities are included with the net realized gain or loss and net unrealized appreciation or depreciation on investments in the fund’s statement of operations. The realized gain or loss and unrealized appreciation or depreciation resulting from all other transactions denominated in currencies other than U.S. dollars are disclosed separately.
3. Valuation
Capital Research and Management Company (“CRMC”), the fund’s investment adviser, values the fund’s investments at fair value as defined by U.S. GAAP. The net asset value of each share class of the fund is generally determined as of approximately 4:00 p.m. New York time each day the New York Stock Exchange is open.
Methods and inputs — The fund’s investment adviser uses the following methods and inputs to establish the fair value of the fund’s assets and liabilities. Use of particular methods and inputs may vary over time based on availability and relevance as market and economic conditions evolve.
Equity securities are generally valued at the official closing price of, or the last reported sale price on, the exchange or market on which such securities are traded, as of the close of business on the day the securities are being valued or, lacking any sales, at the last available bid price. Prices for each security are taken from the principal exchange or market on which the security trades.
Fixed-income securities, including short-term securities, are generally valued at prices obtained from one or more pricing vendors. Vendors value such securities based on one or more of the inputs described in the following table. The table provides examples of inputs that are commonly relevant for valuing particular classes of fixed-income securities in which the fund is authorized to invest. However, these classifications are not exclusive, and any of the inputs may be used to value any other class of fixed-income security.
| Fixed-income class | | Examples of standard inputs |
| All | | Benchmark yields, transactions, bids, offers, quotations from dealers and trading systems, new issues, spreads and other relationships observed in the markets among comparable securities; and proprietary pricing models such as yield measures calculated using factors such as cash flows, financial or collateral performance and other reference data (collectively referred to as “standard inputs”) |
| Corporate bonds & notes; convertible securities | | Standard inputs and underlying equity of the issuer |
| Bonds & notes of governments & government agencies | | Standard inputs and interest rate volatilities |
When the fund’s investment adviser deems it appropriate to do so (such as when vendor prices are unavailable or deemed to be not representative), fixed-income securities will be valued in good faith at the mean quoted bid and ask prices that are reasonably and timely available (or bid prices, if ask prices are not available) or at prices for securities of comparable maturity, quality and type.
Securities with both fixed-income and equity characteristics, or equity securities traded principally among fixed-income dealers, are generally valued in the manner described for either equity or fixed-income securities, depending on which method is deemed most appropriate by the fund’s investment adviser. Forward currency contracts are valued at the mean of representative quoted bid and ask prices, generally based on prices supplied by one or more pricing vendors.
Securities and other assets for which representative market quotations are not readily available or are considered unreliable by the fund’s investment adviser are fair valued as determined in good faith under fair valuation guidelines adopted by authority of the fund’s board of trustees as further described. The investment adviser follows fair valuation guidelines, consistent with U.S. Securities and Exchange Commission rules and guidance, to consider relevant principles and factors when making fair value determinations. The investment adviser considers relevant indications of value that are reasonably and timely available to it in determining the fair value to be assigned to a particular security, such as the type and cost of the security; contractual or legal restrictions on resale of the security; relevant financial or
| 20 | The Growth Fund of America |
business developments of the issuer; actively traded similar or related securities; conversion or exchange rights on the security; related corporate actions; significant events occurring after the close of trading in the security; and changes in overall market conditions. In addition, the closing prices of equity securities that trade in markets outside U.S. time zones may be adjusted to reflect significant events that occur after the close of local trading but before the net asset value of each share class of the fund is determined. Fair valuations and valuations of investments that are not actively trading involve judgment and may differ materially from valuations that would have been used had greater market activity occurred.
Processes and structure — The fund’s board of trustees has delegated authority to the fund’s investment adviser to make fair value determinations, subject to board oversight. The investment adviser has established a Joint Fair Valuation Committee (the “Fair Valuation Committee”) to administer, implement and oversee the fair valuation process, and to make fair value decisions. The Fair Valuation Committee regularly reviews its own fair value decisions, as well as decisions made under its standing instructions to the investment adviser’s valuation teams. The Fair Valuation Committee reviews changes in fair value measurements from period to period and may, as deemed appropriate, update the fair valuation guidelines to better reflect the results of back testing and address new or evolving issues. The Fair Valuation Committee reports any changes to the fair valuation guidelines to the board of trustees with supplemental information to support the changes. The fund’s board and audit committee also regularly review reports that describe fair value determinations and methods.
The fund’s investment adviser has also established a Fixed-Income Pricing Review Group to administer and oversee the fixed-income valuation process, including the use of fixed-income pricing vendors. This group regularly reviews pricing vendor information and market data. Pricing decisions, processes and controls over security valuation are also subject to additional internal reviews, including an annual control self-evaluation program facilitated by the investment adviser’s compliance group.
Classifications — The fund’s investment adviser classifies the fund’s assets and liabilities into three levels based on the inputs used to value the assets or liabilities. Level 1 values are based on quoted prices in active markets for identical securities. Level 2 values are based on significant observable market inputs, such as quoted prices for similar securities and quoted prices in inactive markets. Certain securities trading outside the U.S. may transfer between Level 1 and Level 2 due to valuation adjustments resulting from significant market movements following the close of local trading. Level 3 values are based on significant unobservable inputs that reflect the investment adviser’s determination of assumptions that market participants might reasonably use in valuing the securities. The valuation levels are not necessarily an indication of the risk or liquidity associated with the underlying investment. For example, U.S. government securities are reflected as Level 2 because the inputs used to determine fair value may not always be quoted prices in an active market. The following tables present the fund’s valuation levels as of August 31, 2016 (dollars in thousands):
| | | Investment securities |
| | | Level 1* | | | Level 2 | | | Level 3 | | | Total | |
| Assets: | | | | | | | | | | | | | | | | |
| Common stocks: | | | | | | | | | | | | | | | | |
| Information technology | | $ | 33,131,606 | | | $ | — | | | $ | 120,477 | | | $ | 33,252,083 | |
| Consumer discretionary | | | 29,350,795 | | | | — | | | | — | | | | 29,350,795 | |
| Health care | | | 22,490,412 | | | | 149,732 | | | | 26,169 | | | | 22,666,313 | |
| Energy | | | 14,385,744 | | | | — | | | | — | | | | 14,385,744 | |
| Financials | | | 9,741,145 | | | | 425,853 | | | | — | | | | 10,166,998 | |
| Consumer staples | | | 9,312,297 | | | | — | | | | — | | | | 9,312,297 | |
| Industrials | | | 6,492,336 | | | | — | | | | — | | | | 6,492,336 | |
| Materials | | | 3,145,960 | | | | — | | | | — | | | | 3,145,960 | |
| Telecommunication services | | | 679,940 | | | | — | | | | — | | | | 679,940 | |
| Miscellaneous | | | 5,219,235 | | | | — | | | | — | | | | 5,219,235 | |
| Rights & warrants | | | 62,039 | | | | — | | | | — | | | | 62,039 | |
| Convertible stocks | | | — | | | | — | | | | 140,699 | | | | 140,699 | |
| Convertible bonds | | | — | | | | 18,230 | | | | — | | | | 18,230 | |
| Bonds, notes & other debt instruments | | | — | | | | 1,094,648 | | | | — | | | | 1,094,648 | |
| Short-term securities | | | — | | | | 9,724,259 | | | | — | | | | 9,724,259 | |
| Total | | $ | 134,011,509 | | | $ | 11,412,722 | | | $ | 287,345 | | | $ | 145,711,576 | |
| The Growth Fund of America | 21 |
| | | Other investments† |
| | | Level 1 | | | Level 2 | | | Level 3 | | | Total | |
| Assets: | | | | | | | | | | | | | | | | |
| Unrealized appreciation on open forward currency contracts | | $ | — | | | $ | 791 | | | $ | — | | | $ | 791 | |
| Liabilities: | | | | | | | | | | | | | | | | |
| Unrealized depreciation on open forward currency contracts | | | — | | | | (316 | ) | | | — | | | | (316 | ) |
| Total | | $ | — | | | $ | 475 | | | $ | — | | | $ | 475 | |
| * | Securities with a value of $6,812,511,000, which represented 4.68% of the net assets of the fund, transferred from Level 2 to Level 1 since the prior fiscal year-end, primarily due to a lack of significant market movements following the close of local trading. |
| † | Forward currency contracts are not included in the investment portfolio. |
4. Risk factors
Investing in the fund may involve certain risks including, but not limited to, those described below.
Market conditions — The prices of, and the income generated by, the common stocks and other securities held by the fund may decline —sometimes rapidly or unpredictably — due to various factors, including events or conditions affecting the general economy or particular industries; overall market changes; local, regional or global political, social or economic instability; governmental or governmental agency responses to economic conditions; and currency exchange rate, interest rate and commodity price fluctuations.
Issuer risks — The prices of, and the income generated by, securities held by the fund may decline in response to various factors directly related to the issuers of such securities, including reduced demand for an issuer’s goods or services, poor management performance and strategic initiatives such as mergers, acquisitions or dispositions and the market response to any such initiatives.
Investing in growth-oriented stocks — Growth-oriented common stocks and other equity-type securities (such as preferred stocks, convertible preferred stocks and convertible bonds) may involve larger price swings and greater potential for loss than other types of investments.
Investing outside the U.S. — Securities of issuers domiciled outside the U.S., or with significant operations or revenues outside the U.S., may lose value because of adverse political, social, economic or market developments (including social instability, regional conflicts, terrorism and war) in the countries or regions in which the issuers operate or generate revenue. These securities may also lose value due to changes in foreign currency exchange rates against the U.S. dollar and/or currencies of other countries. Issuers of these securities may be more susceptible to actions of foreign governments, such as the imposition of price controls or punitive taxes, that could adversely impact the value of these securities. Securities markets in certain countries may be more volatile and/or less liquid than those in the U.S. Investments outside the U.S. may also be subject to different accounting practices and different regulatory, legal and reporting standards and practices, and may be more difficult to value, than those in the U.S. In addition, the value of investments outside the U.S. may be reduced by foreign taxes, including foreign withholding taxes on interest and dividends. Further, there may be increased risks of delayed settlement of securities purchased or sold by the fund. The risks of investing outside the U.S. may be heightened in connection with investments in emerging markets.
Management — The investment adviser to the fund actively manages the fund’s investments. Consequently, the fund is subject to the risk that the methods and analyses employed by the investment adviser in this process may not produce the desired results. This could cause the fund to lose value or its investment results to lag relevant benchmarks or other funds with similar objectives.
5. Certain investment techniques
Forward currency contracts — The fund has entered into forward currency contracts, which represent agreements to exchange currencies on specific future dates at predetermined rates. The fund’s investment adviser uses forward currency contracts to manage the fund’s exposure to changes in exchange rates. Upon entering into these contracts, risks may arise from the potential inability of counterparties to meet the terms of their contracts and from possible movements in exchange rates.
On a daily basis, the fund’s investment adviser values forward currency contracts and records unrealized appreciation or depreciation for open forward currency contracts in the fund’s statement of assets and liabilities. Realized gains or losses are recorded at the time the forward currency contract is closed or offset by another contract with the same broker for the same settlement date and currency.
| 22 | The Growth Fund of America |
Closed forward currency contracts that have not reached their settlement date are included in the respective receivables or payables for closed forward currency contracts in the fund’s statement of assets and liabilities. Net realized gains or losses from closed forward currency contracts and net unrealized appreciation or depreciation from open forward currency contracts are recorded in the fund’s statement of operations.
The following tables present the financial statement impacts resulting from the fund’s use of forward currency contracts as of, or for the year ended, August 31, 2016 (dollars in thousands):
| | | | | Assets | | Liabilities |
| Contract | | Risk type | | Location on statement of
assets and liabilities | Value | | Location on statement of
assets and liabilities | Value |
| Forward currency | | Currency | | Unrealized appreciation on open forward currency contracts | $ | 791 | | Unrealized depreciation on open forward currency contracts | $ | 316 |
| Forward currency | | Currency | | Receivables for closed forward currency contracts | | — | | Payables for closed forward currency contracts | | 912 |
| | | | | | $ | 791 | | | $ | 1,228 |
| | | | | | | | | | | |
| | | | | Net realized gain | | Net unrealized appreciation |
| Contract | | Risk type | | Location on statement of operations | Value | | Location on statement of operations | Value |
| Forward currency | | Currency | | Net realized gain on forward currency contracts | $ | 3,026 | | Net unrealized appreciation on forward currency contracts | $ | 475 |
Collateral — The fund participates in a collateral program due to its use of forward currency contracts. The program calls for the fund to either receive or pledge collateral based on the net gain or loss on unsettled forward currency contracts by counterparty. The purpose of the collateral is to cover potential losses that could occur in the event that either party cannot meet its contractual obligations.
Rights of offset — The fund has entered into enforceable master netting agreements with certain counterparties for forward currency contracts, where on any date amounts payable by each party to the other (in the same currency with respect to the same transaction) may be closed or offset by each party’s payment obligation. If an early termination date occurs under these agreements following an event of default or termination event, all obligations of each party to its counterparty are settled net through a single payment in a single currency (“close-out netting”). For financial reporting purposes, the fund does not offset financial assets and financial liabilities that are subject to these master netting arrangements in the statement of assets and liabilities.
The following table presents the fund’s forward currency contracts by counterparty that are subject to master netting agreements but that are not offset in the fund’s statement of assets and liabilities. The net amount column shows the impact of offsetting on the fund’s statement of assets and liabilities as of August 31, 2016 if close-out netting was exercised (dollars in thousands):
| Gross amounts recognized in the | | | | Gross amounts not offset in the
statement of assets and liabilities and
subject to a master netting agreement | | | | | |
| Counterparty | statement of assets
and liabilities | | | | Available
to offset | | | | Non-cash
collateral* | | | | Cash
collateral | | | | Net
amount | |
| Assets: | | | | | | | | | | | | | | | | | | | | |
| JPMorgan Chase | | $ | 791 | | | $ | (75 | ) | | $ | (326 | ) | | $ | — | | | $ | 390 | |
| Liabilities: | | | | | | | | | | | | | | | | | | | | |
| Barclays Bank PLC | | $ | 994 | | | $ | — | | | $ | (994 | ) | | $ | — | | | $ | — | |
| HSBC Bank | | | 78 | | | | — | | | | — | | | | — | | | | 78 | |
| JPMorgan Chase | | | 75 | | | | (75 | ) | | | — | | | | — | | | | — | |
| UBS AG | | | 81 | | | | — | | | | — | | | | — | | | | 81 | |
| Total | | $ | 1,228 | | | $ | (75 | ) | | $ | (994 | ) | | $ | — | | | $ | 159 | |
* Non-cash collateral is shown on a settlement basis.
| The Growth Fund of America | 23 |
6. Taxation and distributions
Federal income taxation — The fund complies with the requirements under Subchapter M of the Internal Revenue Code applicable to mutual funds and intends to distribute substantially all of its net taxable income and net capital gains each year. The fund is not subject to income taxes to the extent such distributions are made. Therefore, no federal income tax provision is required.
As of and during the period ended August 31, 2016, the fund did not have a liability for any unrecognized tax benefits. The fund recognizes interest and penalties, if any, related to unrecognized tax benefits as income tax expense in the statement of operations. During the period, the fund did not incur any interest or penalties.
The fund is not subject to examination by U.S. federal tax authorities for tax years before 2012, by state tax authorities for tax years before 2011 and by tax authorities outside the U.S. for tax years before 2009.
Non-U.S. taxation — Dividend and interest income are recorded net of non-U.S. taxes paid. The fund may file withholding tax reclaims in certain jurisdictions to recover a portion of amounts previously withheld. As a result of rulings from European courts, the fund filed for additional reclaims related to prior years. These reclaims are recorded when the amount is known and there are no significant uncertainties on collectability. Gains realized by the fund on the sale of securities in certain countries are subject to non-U.S. taxes. The fund records an estimated deferred tax liability based on unrealized gains to provide for potential non-U.S. taxes payable upon the sale of these securities.
Distributions — Distributions paid to shareholders are based on net investment income and net realized gains determined on a tax basis, which may differ from net investment income and net realized gains for financial reporting purposes. These differences are due primarily to different treatment for items such as currency gains and losses; short-term capital gains and losses; capital losses related to sales of certain securities within 30 days of purchase; unrealized appreciation of certain investments in securities outside the U.S.; and cost of investments sold. The fiscal year in which amounts are distributed may differ from the year in which the net investment income and net realized gains are recorded by the fund for financial reporting purposes. The fund may also designate a portion of the amount paid to redeeming shareholders as a distribution for tax purposes.
During the year ended August 31, 2016, the fund reclassified $243,000 from undistributed net investment income to capital paid in on shares of beneficial interest, $40,041,000 from undistributed net realized gain to undistributed net investment income and $578,447,000 from undistributed net realized gain to capital paid in on shares of beneficial interest to align financial reporting with tax reporting.
As of August 31, 2016, the tax basis components of distributable earnings, unrealized appreciation (depreciation) and cost of investment securities were as follows (dollars in thousands):
| Undistributed ordinary income | | $ | 549,946 | |
| Undistributed long-term capital gains | | | 7,396,796 | |
| Gross unrealized appreciation on investment securities | | | 55,848,820 | |
| Gross unrealized depreciation on investment securities | | | (2,794,104 | ) |
| Net unrealized appreciation on investment securities | | | 53,054,716 | |
| Cost of investment securities | | | 92,656,860 | |
| 24 | The Growth Fund of America |
The tax character of distributions paid to shareholders was as follows (dollars in thousands):
| | Year ended August 31, 2016 | | | Year ended August 31, 2015 | |
| Share class | | Ordinary
income | | | Long-term
capital gains | | | Total
dividends and
distributions
paid | | | Ordinary
income | | | Long-term
capital gains | | | Total
dividends and
distributions
paid | |
| Class A | | $ | 450,948 | | | $ | 5,611,765 | | | $ | 6,062,713 | | | $ | 262,560 | | | $ | 6,340,506 | | | $ | 6,603,066 | |
| Class B | | | — | | | | 32,520 | | | | 32,520 | | | | — | | | | 67,369 | | | | 67,369 | |
| Class C | | | 1 | | | | 437,938 | | | | 437,939 | | | | — | | | | 544,072 | | | | 544,072 | |
| Class F-1 | | | 47,315 | | | | 648,267 | | | | 695,582 | | | | 18,273 | | | | 755,708 | | | | 773,981 | |
| Class F-2 | | | 92,798 | | | | 849,837 | | | | 942,635 | | | | 65,863 | | | | 914,144 | | | | 980,007 | |
| Class 529-A | | | 32,055 | | | | 461,533 | | | | 493,588 | | | | 16,901 | | | | 507,144 | | | | 524,045 | |
| Class 529-B | | | — | | | | 6,207 | | | | 6,207 | | | | — | | | | 12,440 | | | | 12,440 | |
| Class 529-C | | | (42 | ) | | | 117,221 | | | | 117,179 | | | | — | | | | 130,689 | | | | 130,689 | |
| Class 529-E | | | 788 | | | | 20,684 | | | | 21,472 | | | | 130 | | | | 23,003 | | | | 23,133 | |
| Class 529-F-1 | | | 1,630 | | | | 16,544 | | | | 18,174 | | | | 1,021 | | | | 17,657 | | | | 18,678 | |
| Class R-1 | | | — | | | | 37,260 | | | | 37,260 | | | | — | | | | 47,645 | | | | 47,645 | |
| Class R-2 | | | — | | | | 176,138 | | | | 176,138 | | | | — | | | | 216,665 | | | | 216,665 | |
| Class R-2E | | | 34 | | | | 284 | | | | 318 | | | | — | | | | 1 | | | | 1 | |
| Class R-3 | | | 17,637 | | | | 545,696 | | | | 563,333 | | | | 2,227 | | | | 705,934 | | | | 708,161 | |
| Class R-4 | | | 41,069 | | | | 546,348 | | | | 587,417 | | | | 25,099 | | | | 666,839 | | | | 691,938 | |
| Class R-5E* | | | — | † | | | 1 | | | | 1 | | | | | | | | | | | | | |
| Class R-5 | | | 43,844 | | | | 379,661 | | | | 423,505 | | | | 33,323 | | | | 464,423 | | | | 497,746 | |
| Class R-6 | | | 131,278 | | | | 1,075,275 | | | | 1,206,553 | | | | 84,937 | | | | 1,086,011 | | | | 1,170,948 | |
| Total | | $ | 859,355 | | | $ | 10,963,179 | | | $ | 11,822,534 | | | $ | 510,334 | | | $ | 12,500,250 | | | $ | 13,010,584 | |
| | |
| * | Class R-5E shares were offered beginning November 20, 2015. |
| † | Amount less than one thousand. |
7. Fees and transactions with related parties
CRMC, the fund’s investment adviser, is the parent company of American Funds Distributors,® Inc. (“AFD”), the principal underwriter of the fund’s shares, and American Funds Service Company® (“AFS”), the fund’s transfer agent. CRMC, AFD and AFS are considered related parties to the fund.
Investment advisory services — The fund has an investment advisory and service agreement with CRMC that provides for monthly fees accrued daily. These fees are based on a series of decreasing annual rates beginning with 0.500% on the first $1 billion of daily net assets and decreasing to 0.233% on such assets in excess of $210 billion. For the year ended August 31, 2016, the investment advisory services fee was $385,713,000, which was equivalent to an annualized rate of 0.275% of average daily net assets.
Class-specific fees and expenses — Expenses that are specific to individual share classes are accrued directly to the respective share class. The principal class-specific fees and expenses are further described below:
Distribution services — The fund has plans of distribution for all share classes, except Class F-2, R-5E, R-5 and R-6 shares. Under the plans, the board of trustees approves certain categories of expenses that are used to finance activities primarily intended to sell fund shares and service existing accounts. The plans provide for payments, based on an annualized percentage of average daily net assets, ranging from 0.25% to 1.00% as noted in this section. In some cases, the board of trustees has limited the amounts that may be paid to less than the maximum allowed by the plans. All share classes with a plan may use up to 0.25% of average daily net assets to pay service fees, or to compensate AFD for paying service fees, to firms that have entered into agreements with AFD to provide certain shareholder services. The remaining amounts available to be paid under each plan are paid to dealers to compensate them for their sales activities.
For Class A and 529-A shares, distribution-related expenses include the reimbursement of dealer and wholesaler commissions paid by AFD for certain shares sold without a sales charge. These share classes reimburse AFD for amounts billed within the prior
| The Growth Fund of America | 25 |
15 months but only to the extent that the overall annual expense limit of 0.25% is not exceeded. As of August 31, 2016, there were no unreimbursed expenses subject to reimbursement for Class A or 529-A shares.
| Share class | | Currently approved limits | | Plan limits |
| Class A | | 0.25 | % | | 0.25 | % |
| Class 529-A | | 0.25 | | | 0.50 | |
| Classes B and 529-B | | 1.00 | | | 1.00 | |
| Classes C, 529-C and R-1 | | 1.00 | | | 1.00 | |
| Class R-2 | | 0.75 | | | 1.00 | |
| Class R-2E | | 0.60 | | | 0.85 | |
| Classes 529-E and R-3 | | 0.50 | | | 0.75 | |
| Classes F-1, 529-F-1 and R-4 | | 0.25 | | | 0.50 | |
Transfer agent services — The fund has a shareholder services agreement with AFS under which the fund compensates AFS for providing transfer agent services to each of the fund’s share classes. These services include recordkeeping, shareholder communications and transaction processing. In addition, the fund reimburses AFS for amounts paid to third parties for performing transfer agent services on behalf of fund shareholders.
Administrative services — The fund has an administrative services agreement with CRMC under which the fund compensates CRMC for providing administrative services to Class A, C, F, 529 and R shares. These services include, but are not limited to, coordinating, monitoring, assisting and overseeing third parties that provide services to fund shareholders. Under the agreement, Class A shares pay an annual fee of 0.01% and Class C, F, 529 and R shares pay an annual fee of 0.05% of their respective average daily net assets.
529 plan services — Each 529 share class is subject to service fees to compensate the Virginia College Savings Plan (“Virginia529”) for its oversight and administration of the 529 college savings plan. From September 1, 2015 to June 30, 2016, the quarterly fee was based on a series of decreasing annual rates beginning with 0.10% on the first $30 billion of the net assets invested in Class 529 shares of the American Funds and decreasing to 0.05% on such assets in excess of $70 billion. Effective July 1, 2016, the quarterly fee was amended to annual rates of 0.10% on the first $20 billion of the net assets invested in the Class 529 shares of the American Funds, 0.05% on such assets between $20 billion and $100 billion, and 0.03% on such assets over $100 billion. The fee for any given calendar quarter is accrued and calculated on the basis of the average net assets of Class 529 shares of the American Funds for the last month of the prior calendar quarter. The fee is included in other expenses in the fund’s statement of operations. Virginia529 is not considered a related party to the fund.
For the year ended August 31, 2016, class-specific expenses under the agreements were as follows (dollars in thousands):
| | Distribution | | | Transfer agent | | | Administrative | | | 529 plan |
| Share class | | services | | | services | | | services | | | services |
| Class A | | | $169,988 | | | | $91,495 | | | | $7,219 | | | | Not applicable |
| Class B | | | 3,322 | | | | 476 | | | | Not applicable | | | | Not applicable |
| Class C | | | 51,354 | | | | 6,532 | | | | 2,579 | | | | Not applicable |
| Class F-1 | | | 20,492 | | | | 10,211 | | | | 4,125 | | | | Not applicable |
| Class F-2 | | | Not applicable | | | | 11,220 | | | | 5,512 | | | | Not applicable |
| Class 529-A | | | 13,044 | | | | 6,244 | | | | 2,973 | | | | $5,074 |
| Class 529-B | | | 641 | | | | 89 | | | | 33 | | | | 56 |
| Class 529-C | | | 14,100 | | | | 1,577 | | | | 713 | | | | 1,218 |
| Class 529-E | | | 1,301 | | | | 168 | | | | 131 | | | | 224 |
| Class 529-F-1 | | | — | | | | 226 | | | | 108 | | | | 184 |
| Class R-1 | | | 4,472 | | | | 440 | | | | 224 | | | | Not applicable |
| Class R-2 | | | 15,935 | | | | 6,907 | | | | 1,070 | | | | Not applicable |
| Class R-2E | | | 90 | | | | 26 | | | | 8 | | | | Not applicable |
| Class R-3 | | | 33,325 | | | | 10,156 | | | | 3,349 | | | | Not applicable |
| Class R-4 | | | 17,635 | | | | 7,072 | | | | 3,537 | | | | Not applicable |
| Class R-5E* | | | Not applicable | | | | — | † | | | — | † | | | Not applicable |
| Class R-5 | | | Not applicable | | | | 2,309 | | | | 2,262 | | | | Not applicable |
| Class R-6 | | | Not applicable | | | | 53 | | | | 7,290 | | | | Not applicable |
| Total class-specific expenses | | | $345,699 | | | | $155,201 | | | | $41,133 | | | | $6,756 |
| | |
| * | Class R-5E shares were offered beginning November 20, 2015. |
| † | Amount less than one thousand. |
Trustees’ deferred compensation — Trustees who are unaffiliated with CRMC may elect to defer the cash payment of part or all of their compensation. These deferred amounts, which remain as liabilities of the fund, are treated as if invested in shares of the fund or other
| 26 | The Growth Fund of America |
American Funds. These amounts represent general, unsecured liabilities of the fund and vary according to the total returns of the selected funds. Trustees’ compensation of $526,000 in the fund’s statement of operations reflects $432,000 in current fees (either paid in cash or deferred) and a net increase of $94,000 in the value of the deferred amounts.
Affiliated officers and trustees — Officers and certain trustees of the fund are or may be considered to be affiliated with CRMC, AFD and AFS. No affiliated officers or trustees received any compensation directly from the fund.
Security transactions with related funds — The fund has purchased from, and sold securities to, other CRMC-managed funds (or funds managed by certain affiliates of CRMC) under procedures adopted by the fund’s board of trustees. The funds involved in such transactions are considered related by virtue of having a common investment adviser (or affiliated investment advisers), common trustees and/or common officers. Each transaction was executed at the current market price of the security and no brokerage commissions or fees were paid in accordance with Rule 17a-7 of the 1940 Act. During the year ended August 31, 2016, the fund engaged in such purchase and sale transactions with related funds in the amounts of $2,911,677,000 and $1,499,605,000, respectively.
8. Capital share transactions
Capital share transactions in the fund were as follows (dollars and shares in thousands):
| | | Sales1 | | | Reinvestments of
dividends and distributions | | | Repurchases1 | | | Net increase (decrease) | |
| Share class | | Amount | | | Shares | | | Amount | | | Shares | | | Amount | | | Shares | | | Amount | | | Shares | |
| | | | | | | | | | | | | | | | | | | | | | | | | |
| Year ended August 31, 2016 | | | | | | | | | | | | | | | | | | | |
| | | | | | | | | | | | | | | | | | | | | | | | | |
| Class A | | $ | 4,924,929 | | | | 118,808 | | | $ | 5,967,182 | | | | 145,116 | | | $ | (8,823,043 | ) | | | (212,227 | ) | | $ | 2,069,068 | | | | 51,697 | |
| Class B | | | 2,900 | | | | 73 | | | | 32,239 | | | | 823 | | | | (311,833 | ) | | | (7,948 | ) | | | (276,694 | ) | | | (7,052 | ) |
| Class C | | | 613,767 | | | | 15,737 | | | | 429,366 | | | | 11,095 | | | | (1,477,000 | ) | | | (38,034 | ) | | | (433,867 | ) | | | (11,202 | ) |
| Class F-1 | | | 1,280,513 | | | | 31,126 | | | | 681,004 | | | | 16,662 | | | | (1,787,811 | ) | | | (43,329 | ) | | | 173,706 | | | | 4,459 | |
| Class F-2 | | | 2,744,672 | | | | 66,007 | | | | 900,960 | | | | 21,959 | | | | (2,359,964 | ) | | | (57,176 | ) | | | 1,285,668 | | | | 30,790 | |
| Class 529-A | | | 545,610 | | | | 13,265 | | | | 493,503 | | | | 12,105 | | | | (703,145 | ) | | | (16,965 | ) | | | 335,968 | | | | 8,405 | |
| Class 529-B | | | 869 | | | | 22 | | | | 6,205 | | | | 159 | | | | (58,490 | ) | | | (1,491 | ) | | | (51,416 | ) | | | (1,310 | ) |
| Class 529-C | | | 134,779 | | | | 3,439 | | | | 117,144 | | | | 3,016 | | | | (204,040 | ) | | | (5,183 | ) | | | 47,883 | | | | 1,272 | |
| Class 529-E | | | 24,266 | | | | 593 | | | | 21,469 | | | | 531 | | | | (34,866 | ) | | | (849 | ) | | | 10,869 | | | | 275 | |
| Class 529-F-1 | | | 40,707 | | | | 985 | | | | 18,175 | | | | 447 | | | | (40,465 | ) | | | (973 | ) | | | 18,417 | | | | 459 | |
| Class R-1 | | | 39,701 | | | | 1,000 | | | | 37,230 | | | | 950 | | | | (121,308 | ) | | | (3,036 | ) | | | (44,377 | ) | | | (1,086 | ) |
| Class R-2 | | | 382,669 | | | | 9,637 | | | | 175,984 | | | | 4,451 | | | | (666,231 | ) | | | (16,699 | ) | | | (107,578 | ) | | | (2,611 | ) |
| Class R-2E | | | 34,224 | | | | 848 | | | | 317 | | | | 8 | | | | (2,323 | ) | | | (57 | ) | | | 32,218 | | | | 799 | |
| Class R-3 | | | 855,016 | | | | 20,987 | | | | 561,836 | | | | 13,890 | | | | (2,131,593 | ) | | | (52,228 | ) | | | (714,741 | ) | | | (17,351 | ) |
| Class R-4 | | | 1,965,510 | | | | 47,586 | | | | 587,103 | | | | 14,390 | | | | (1,995,615 | ) | | | (48,313 | ) | | | 556,998 | | | | 13,663 | |
| Class R-5E2 | | | 10 | | | | — | 3 | | | — | | | | — | | | | — | | | | — | | | | 10 | | | | — | 3 |
| Class R-5 | | | 621,642 | | | | 15,092 | | | | 422,476 | | | | 10,289 | | | | (2,420,640 | ) | | | (58,716 | ) | | | (1,376,522 | ) | | | (33,335 | ) |
| Class R-6 | | | 3,563,488 | | | | 86,963 | | | | 1,204,830 | | | | 29,300 | | | | (2,316,878 | ) | | | (55,403 | ) | | | 2,451,440 | | | | 60,860 | |
| Total net increase (decrease) | | $ | 17,775,272 | | | | 432,168 | | | $ | 11,657,023 | | | | 285,191 | | | $ | (25,455,245 | ) | | | (618,627 | ) | | $ | 3,977,050 | | | | 98,732 | |
| The Growth Fund of America | 27 |
| | | Sales1 | | | Reinvestments of
dividends and distributions | | | Repurchases1 | | | Net increase (decrease) | |
| Share class | | Amount | | | Shares | | | Amount | | | Shares | | | Amount | | | Shares | | | Amount | | | Shares | |
| | | | | | | | | | | | | | | | | | | | | | | | | |
| Year ended August 31, 2015 | | | | | | | | | | | | | | | | | | | |
| | | | | | | | | | | | | | | | | | | | |
| Class A | | $ | 5,260,337 | | | | 117,774 | | | $ | 6,497,807 | | | | 155,673 | | | $ | (8,374,628 | ) | | | (187,598 | ) | | $ | 3,383,516 | | | | 85,849 | |
| Class B | | | 5,609 | | | | 131 | | | | 66,738 | | | | 1,669 | | | | (404,970 | ) | | | (9,464 | ) | | | (332,623 | ) | | | (7,664 | ) |
| Class C | | | 664,603 | | | | 15,725 | | | | 531,475 | | | | 13,438 | | | | (1,489,704 | ) | | | (35,193 | ) | | | (293,626 | ) | | | (6,030 | ) |
| Class F-1 | | | 1,393,975 | | | | 31,354 | | | | 758,009 | | | | 18,257 | | | | (3,883,022 | ) | | | (85,245 | ) | | | (1,731,038 | ) | | | (35,634 | ) |
| Class F-2 | | | 4,028,289 | | | | 87,769 | | | | 935,000 | | | | 22,438 | | | | (2,110,118 | ) | | | (47,408 | ) | | | 2,853,171 | | | | 62,799 | |
| Class 529-A | | | 556,107 | | | | 12,555 | | | | 523,934 | | | | 12,649 | | | | (627,717 | ) | | | (14,137 | ) | | | 452,324 | | | | 11,067 | |
| Class 529-B | | | 1,847 | | | | 44 | | | | 12,435 | | | | 312 | | | | (69,058 | ) | | | (1,619 | ) | | | (54,776 | ) | | | (1,263 | ) |
| Class 529-C | | | 142,924 | | | | 3,367 | | | | 130,656 | | | | 3,290 | | | | (181,005 | ) | | | (4,261 | ) | | | 92,575 | | | | 2,396 | |
| Class 529-E | | | 23,677 | | | | 540 | | | | 23,130 | | | | 563 | | | | (32,202 | ) | | | (732 | ) | | | 14,605 | | | | 371 | |
| Class 529-F-1 | | | 39,647 | | | | 895 | | | | 18,675 | | | | 452 | | | | (32,943 | ) | | | (746 | ) | | | 25,379 | | | | 601 | |
| Class R-1 | | | 48,337 | | | | 1,125 | | | | 47,586 | | | | 1,189 | | | | (114,963 | ) | | | (2,689 | ) | | | (19,040 | ) | | | (375 | ) |
| Class R-2 | | | 413,591 | | | | 9,600 | | | | 216,484 | | | | 5,370 | | | | (700,995 | ) | | | (16,254 | ) | | | (70,920 | ) | | | (1,284 | ) |
| Class R-2E | | | 65 | | | | 2 | | | | — | | | | — | | | | — | | | | — | | | | 65 | | | | 2 | |
| Class R-3 | | | 1,050,117 | | | | 23,889 | | | | 706,137 | | | | 17,177 | | | | (2,304,672 | ) | | | (52,487 | ) | | | (548,418 | ) | | | (11,421 | ) |
| Class R-4 | | | 1,282,747 | | | | 28,832 | | | | 691,521 | | | | 16,687 | | | | (2,136,017 | ) | | | (48,158 | ) | | | (161,749 | ) | | | (2,639 | ) |
| Class R-5 | | | 859,898 | | | | 19,191 | | | | 496,393 | | | | 11,907 | | | | (1,453,483 | ) | | | (32,738 | ) | | | (97,192 | ) | | | (1,640 | ) |
| Class R-6 | | | 3,109,175 | | | | 69,979 | | | | 1,169,078 | | | | 28,009 | | | | (2,210,796 | ) | | | (49,849 | ) | | | 2,067,457 | | | | 48,139 | |
| Total net increase (decrease) | | $ | 18,880,945 | | | | 422,772 | | | $ | 12,825,058 | | | | 309,080 | | | $ | (26,126,293 | ) | | | (588,578 | ) | | $ | 5,579,710 | | | | 143,274 | |
| | |
| 1 | Includes exchanges between share classes of the fund. |
| 2 | Class R-5E shares were offered beginning November 20, 2015. |
| 3 | Amount less than one thousand. |
9. Investment transactions
The fund made purchases and sales of investment securities, excluding short-term securities and U.S. government obligations, if any, of $38,732,910,000 and $44,167,387,000, respectively, during the year ended August 31, 2016.
| 28 | The Growth Fund of America |
Financial highlights
| | | | | | | Income from
investment operations1 | | | Dividends and distributions | | | | | | | | | | | | | | | | | | | | | |
| | | Net asset
value,
beginning
of period | | | Net
investment
income
(loss) | | | Net gains on
securities (both
realized and
unrealized) | | | Total from
investment
operations | | | Dividends
(from net
investment
income) | | | Distributions
(from capital
gains) | | | Total
dividends
and
distributions | | | Net asset
value,
end
of period | | | Total
return2 | | | Net assets,
end of period
(in millions) | | | Ratio of
expenses to
average
net assets | | | Ratio of
net income
(loss) to
average
net assets | |
| Class A: | | | | | | | | | | | | | | | | | | | | | | | | | | | | | | | | | | | | | | | | | | | | | | | | |
| Year ended 8/31/2016 | | $ | 43.31 | | | $ | .24 | | | $ | 3.58 | | | $ | 3.82 | | | $ | (.27 | ) | | $ | (3.39 | ) | | $ | (3.66 | ) | | $ | 43.47 | | | | 9.31 | % | | $ | 74,847 | | | | .66 | % | | | .57 | % |
| Year ended 8/31/2015 | | | 46.70 | | | | .23 | | | | .61 | | | | .84 | | | | (.17 | ) | | | (4.06 | ) | | | (4.23 | ) | | | 43.31 | | | | 2.12 | | | | 72,321 | | | | .65 | | | | .51 | |
| Year ended 8/31/2014 | | | 39.93 | | | | .17 | | | | 9.49 | | | | 9.66 | | | | (.14 | ) | | | (2.75 | ) | | | (2.89 | ) | | | 46.70 | | | | 25.00 | | | | 73,975 | | | | .66 | | | | .39 | |
| Year ended 8/31/2013 | | | 32.80 | | | | .22 | | | | 7.19 | | | | 7.41 | | | | (.28 | ) | | | — | | | | (.28 | ) | | | 39.93 | | | | 22.74 | | | | 62,602 | | | | .70 | | | | .60 | |
| Year ended 8/31/2012 | | | 29.23 | | | | .20 | | | | 3.59 | | | | 3.79 | | | | (.22 | ) | | | — | | | | (.22 | ) | | | 32.80 | | | | 13.07 | | | | 55,441 | | | | .71 | | | | .66 | |
| Class B: | | | | | | | | | | | | | | | | | | | | | | | | | | | | | | | | | | | | | | | | | | | | | | | | |
| Year ended 8/31/2016 | | | 41.26 | | | | (.09 | ) | | | 3.42 | | | | 3.33 | | | | — | | | | (3.39 | ) | | | (3.39 | ) | | | 41.20 | | | | 8.50 | | | | 196 | | | | 1.42 | | | | (.22 | ) |
| Year ended 8/31/2015 | | | 44.84 | | | | (.11 | ) | | | .59 | | | | .48 | | | | — | | | | (4.06 | ) | | | (4.06 | ) | | | 41.26 | | | | 1.36 | | | | 487 | | | | 1.40 | | | | (.25 | ) |
| Year ended 8/31/2014 | | | 38.60 | | | | (.15 | ) | | | 9.14 | | | | 8.99 | | | | — | | | | (2.75 | ) | | | (2.75 | ) | | | 44.84 | | | | 24.05 | | | | 873 | | | | 1.41 | | | | (.37 | ) |
| Year ended 8/31/2013 | | | 31.69 | | | | (.05 | ) | | | 6.96 | | | | 6.91 | | | | — | | | | — | | | | — | | | | 38.60 | | | | 21.81 | | | | 1,168 | | | | 1.46 | | | | (.14 | ) |
| Year ended 8/31/2012 | | | 28.23 | | | | (.03 | ) | | | 3.49 | | | | 3.46 | | | | — | | | | — | | | | — | | | | 31.69 | | | | 12.26 | | | | 1,503 | | | | 1.46 | | | | (.10 | ) |
| Class C: | | | | | | | | | | | | | | | | | | | | | | | | | | | | | | | | | | | | | | | | | | | | | | | | |
| Year ended 8/31/2016 | | | 40.80 | | | | (.09 | ) | | | 3.37 | | | | 3.28 | | | | — | | | | (3.39 | ) | | | (3.39 | ) | | | 40.69 | | | | 8.47 | | | | 5,009 | | | | 1.46 | | | | (.23 | ) |
| Year ended 8/31/2015 | | | 44.41 | | | | (.12 | ) | | | .57 | | | | .45 | | | | — | | | | (4.06 | ) | | | (4.06 | ) | | | 40.80 | | | | 1.29 | | | | 5,480 | | | | 1.45 | | | | (.29 | ) |
| Year ended 8/31/2014 | | | 38.27 | | | | (.17 | ) | | | 9.06 | | | | 8.89 | | | | — | | | | (2.75 | ) | | | (2.75 | ) | | | 44.41 | | | | 23.99 | | | | 6,232 | | | | 1.45 | | | | (.41 | ) |
| Year ended 8/31/2013 | | | 31.44 | | | | (.07 | ) | | | 6.91 | | | | 6.84 | | | | (.01 | ) | | | — | | | | (.01 | ) | | | 38.27 | | | | 21.76 | | | | 5,986 | | | | 1.50 | | | | (.20 | ) |
| Year ended 8/31/2012 | | | 28.02 | | | | (.04 | ) | | | 3.46 | | | | 3.42 | | | | — | | | | — | | | | — | | | | 31.44 | | | | 12.21 | | | | 5,741 | | | | 1.49 | | | | (.13 | ) |
| Class F-1: | | | | | | | | | | | | | | | | | | | | | | | | | | | | | | | | | | | | | | | | | | | | | | | | |
| Year ended 8/31/2016 | | | 43.05 | | | | .22 | | | | 3.57 | | | | 3.79 | | | | (.25 | ) | | | (3.39 | ) | | | (3.64 | ) | | | 43.20 | | | | 9.28 | | | | 8,494 | | | | .71 | | | | .52 | |
| Year ended 8/31/2015 | | | 46.40 | | | | .20 | | | | .61 | | | | .81 | | | | (.10 | ) | | | (4.06 | ) | | | (4.16 | ) | | | 43.05 | | | | 2.07 | | | | 8,273 | | | | .70 | | | | .46 | |
| Year ended 8/31/2014 | | | 39.69 | | | | .15 | | | | 9.43 | | | | 9.58 | | | | (.12 | ) | | | (2.75 | ) | | | (2.87 | ) | | | 46.40 | | | | 24.93 | | | | 10,569 | | | | .69 | | | | .36 | |
| Year ended 8/31/2013 | | | 32.61 | | | | .21 | | | | 7.15 | | | | 7.36 | | | | (.28 | ) | | | — | | | | (.28 | ) | | | 39.69 | | | | 22.71 | | | | 11,180 | | | | .71 | | | | .59 | |
| Year ended 8/31/2012 | | | 29.04 | | | | .21 | | | | 3.58 | | | | 3.79 | | | | (.22 | ) | | | — | | | | (.22 | ) | | | 32.61 | | | | 13.15 | | | | 11,323 | | | | .68 | | | | .69 | |
| Class F-2: | | | | | | | | | | | | | | | | | | | | | | | | | | | | | | | | | | | | | | | | | | | | | | | | |
| Year ended 8/31/2016 | | | 43.29 | | | | .33 | | | | 3.59 | | | | 3.92 | | | | (.37 | ) | | | (3.39 | ) | | | (3.76 | ) | | | 43.45 | | | | 9.57 | | | | 12,100 | | | | .44 | | | | .79 | |
| Year ended 8/31/2015 | | | 46.71 | | | | .33 | | | | .60 | | | | .93 | | | | (.29 | ) | | | (4.06 | ) | | | (4.35 | ) | | | 43.29 | | | | 2.35 | | | | 10,723 | | | | .43 | | | | .73 | |
| Year ended 8/31/2014 | | | 39.95 | | | | .27 | | | | 9.48 | | | | 9.75 | | | | (.24 | ) | | | (2.75 | ) | | | (2.99 | ) | | | 46.71 | | | | 25.27 | | | | 8,637 | | | | .43 | | | | .62 | |
| Year ended 8/31/2013 | | | 32.83 | | | | .32 | | | | 7.19 | | | | 7.51 | | | | (.39 | ) | | | — | | | | (.39 | ) | | | 39.95 | | | | 23.05 | | | | 4,358 | | | | .44 | | | | .86 | |
| Year ended 8/31/2012 | | | 29.25 | | | | .28 | | | | 3.60 | | | | 3.88 | | | | (.30 | ) | | | — | | | | (.30 | ) | | | 32.83 | | | | 13.42 | | | | 2,855 | | | | .44 | | | | .93 | |
| Class 529-A: | | | | | | | | | | | | | | | | | | | | | | | | | | | | | | | | | | | | | | | | | | | | | | | | |
| Year ended 8/31/2016 | | | 42.95 | | | | .20 | | | | 3.56 | | | | 3.76 | | | | (.24 | ) | | | (3.39 | ) | | | (3.63 | ) | | | 43.08 | | | | 9.23 | | | | 6,229 | | | | .74 | | | | .48 | |
| Year ended 8/31/2015 | | | 46.35 | | | | .19 | | | | .61 | | | | .80 | | | | (.14 | ) | | | (4.06 | ) | | | (4.20 | ) | | | 42.95 | | | | 2.04 | | | | 5,849 | | | | .73 | | | | .43 | |
| Year ended 8/31/2014 | | | 39.66 | | | | .13 | | | | 9.42 | | | | 9.55 | | | | (.11 | ) | | | (2.75 | ) | | | (2.86 | ) | | | 46.35 | | | | 24.89 | | | | 5,799 | | | | .74 | | | | .31 | |
| Year ended 8/31/2013 | | | 32.59 | | | | .19 | | | | 7.15 | | | | 7.34 | | | | (.27 | ) | | | — | | | | (.27 | ) | | | 39.66 | | | | 22.65 | | | | 4,663 | | | | .77 | | | | .52 | |
| Year ended 8/31/2012 | | | 29.06 | | | | .18 | | | | 3.57 | | | | 3.75 | | | | (.22 | ) | | | — | | | | (.22 | ) | | | 32.59 | | | | 13.00 | | | | 3,822 | | | | .77 | | | | .60 | |
| Class 529-B: | | | | | | | | | | | | | | | | | | | | | | | | | | | | | | | | | | | | | | | | | | | | | | | | |
| Year ended 8/31/2016 | | | 41.08 | | | | (.13 | ) | | | 3.39 | | | | 3.26 | | | | — | | | | (3.39 | ) | | | (3.39 | ) | | | 40.95 | | | | 8.36 | | | | 40 | | | | 1.54 | | | | (.33 | ) |
| Year ended 8/31/2015 | | | 44.71 | | | | (.16 | ) | | | .59 | | | | .43 | | | | — | | | | (4.06 | ) | | | (4.06 | ) | | | 41.08 | | | | 1.24 | | | | 94 | | | | 1.52 | | | | (.37 | ) |
| Year ended 8/31/2014 | | | 38.54 | | | | (.20 | ) | | | 9.12 | | | | 8.92 | | | | — | | | | (2.75 | ) | | | (2.75 | ) | | | 44.71 | | | | 23.90 | | | | 159 | | | | 1.53 | | | | (.49 | ) |
| Year ended 8/31/2013 | | | 31.67 | | | | (.09 | ) | | | 6.96 | | | | 6.87 | | | | — | | | | — | | | | — | | | | 38.54 | | | | 21.69 | | | | 195 | | | | 1.56 | | | | (.25 | ) |
| Year ended 8/31/2012 | | | 28.25 | | | | (.06 | ) | | | 3.48 | | | | 3.42 | | | | — | | | | — | | | | — | | | | 31.67 | | | | 12.11 | | | | 237 | | | | 1.57 | | | | (.21 | ) |
See page 31 for footnotes.
| The Growth Fund of America | 29 |
Financial highlights (continued)
| | | | | | | Income from
investment operations1 | | | Dividends and distributions | | | | | | | | | | | | | | | | | | | | | |
| | | Net asset
value,
beginning
of period | | | Net
investment
income
(loss) | | | Net gains on
securities (both
realized and
unrealized) | | | Total from
investment
operations | | | Dividends
(from net
investment
income) | | | Distributions
(from capital
gains) | | | Total
dividends
and
distributions | | | Net asset
value,
end
of period | | | Total
return2 | | | Net assets,
end of period
(in millions) | | | Ratio of
expenses to
average
net assets | | | Ratio of
net income
(loss) to
average
net assets | |
| Class 529-C: | | | | | | | | | | | | | | | | | | | | | | | | | | | | | | | | | | | | | | | | | | | | | | | | |
| Year ended 8/31/2016 | | $ | 40.96 | | | $ | (.11 | ) | | $ | 3.37 | | | $ | 3.26 | | | $ | — | | | $ | (3.39 | ) | | $ | (3.39 | ) | | $ | 40.83 | | | | 8.39 | % | | $ | 1,469 | | | | 1.52 | % | | | (.29 | )% |
| Year ended 8/31/2015 | | | 44.58 | | | | (.15 | ) | | | .59 | | | | .44 | | | | — | | | | (4.06 | ) | | | (4.06 | ) | | | 40.96 | | | | 1.27 | | | | 1,421 | | | | 1.51 | | | | (.35 | ) |
| Year ended 8/31/2014 | | | 38.43 | | | | (.20 | ) | | | 9.10 | | | | 8.90 | | | | — | | | | (2.75 | ) | | | (2.75 | ) | | | 44.58 | | | | 23.91 | | | | 1,440 | | | | 1.52 | | | | (.47 | ) |
| Year ended 8/31/2013 | | | 31.60 | | | | (.09 | ) | | | 6.94 | | | | 6.85 | | | | (.02 | ) | | | — | | | | (.02 | ) | | | 38.43 | | | | 21.69 | | | | 1,188 | | | | 1.56 | | | | (.26 | ) |
| Year ended 8/31/2012 | | | 28.18 | | | | (.06 | ) | | | 3.48 | | | | 3.42 | | | | — | | | | — | | | | — | | | | 31.60 | | | | 12.14 | | | | 1,008 | | | | 1.56 | | | | (.19 | ) |
| Class 529-E: | | | | | | | | | | | | | | | | | | | | | | | | | | | | | | | | | | | | | | | | | | | | | | | | |
| Year ended 8/31/2016 | | | 42.54 | | | | .10 | | | | 3.53 | | | | 3.63 | | | | (.13 | ) | | | (3.39 | ) | | | (3.52 | ) | | | 42.65 | | | | 8.99 | | | | 272 | | | | .98 | | | | .25 | |
| Year ended 8/31/2015 | | | 45.94 | | | | .08 | | | | .60 | | | | .68 | | | �� | (.02 | ) | | | (4.06 | ) | | | (4.08 | ) | | | 42.54 | | | | 1.79 | | | | 260 | | | | .98 | | | | .18 | |
| Year ended 8/31/2014 | | | 39.34 | | | | .03 | | | | 9.33 | | | | 9.36 | | | | (.01 | ) | | | (2.75 | ) | | | (2.76 | ) | | | 45.94 | | | | 24.57 | | | | 263 | | | | .99 | | | | .06 | |
| Year ended 8/31/2013 | | | 32.33 | | | | .10 | | | | 7.10 | | | | 7.20 | | | | (.19 | ) | | | — | | | | (.19 | ) | | | 39.34 | | | | 22.36 | | | | 217 | | | | 1.02 | | | | .28 | |
| Year ended 8/31/2012 | | | 28.82 | | | | .10 | | | | 3.54 | | | | 3.64 | | | | (.13 | ) | | | — | | | | (.13 | ) | | | 32.33 | | | | 12.71 | | | | 182 | | | | 1.03 | | | | .35 | |
| Class 529-F-1: | | | | | | | | | | | | | | | | | | | | | | | | | | | | | | | | | | | | | | | | | | | | | | | | |
| Year ended 8/31/2016 | | | 42.92 | | | | .29 | | | | 3.55 | | | | 3.84 | | | | (.33 | ) | | | (3.39 | ) | | | (3.72 | ) | | | 43.04 | | | | 9.46 | | | | 231 | | | | .52 | | | | .70 | |
| Year ended 8/31/2015 | | | 46.33 | | | | .29 | | | | .59 | | | | .88 | | | | (.23 | ) | | | (4.06 | ) | | | (4.29 | ) | | | 42.92 | | | | 2.26 | | | | 211 | | | | .51 | | | | .65 | |
| Year ended 8/31/2014 | | | 39.64 | | | | .23 | | | | 9.41 | | | | 9.64 | | | | (.20 | ) | | | (2.75 | ) | | | (2.95 | ) | | | 46.33 | | | | 25.16 | | | | 200 | | | | .52 | | | | .53 | |
| Year ended 8/31/2013 | | | 32.57 | | | | .27 | | | | 7.14 | | | | 7.41 | | | | (.34 | ) | | | — | | | | (.34 | ) | | | 39.64 | | | | 22.92 | | | | 157 | | | | .56 | | | | .74 | |
| Year ended 8/31/2012 | | | 29.04 | | | | .25 | | | | 3.56 | | | | 3.81 | | | | (.28 | ) | | | — | | | | (.28 | ) | | | 32.57 | | | | 13.27 | | | | 125 | | | | .56 | | | | .81 | |
| Class R-1: | | | | | | | | | | | | | | | | | | | | | | | | | | | | | | | | | | | | | | | | | | | | | | | | |
| Year ended 8/31/2016 | | | 41.29 | | | | (.08 | ) | | | 3.41 | | | | 3.33 | | | | — | | | | (3.39 | ) | | | (3.39 | ) | | | 41.23 | | | | 8.49 | | | | 438 | | | | 1.43 | | | | (.20 | ) |
| Year ended 8/31/2015 | | | 44.88 | | | | (.11 | ) | | | .58 | | | | .47 | | | | — | | | | (4.06 | ) | | | (4.06 | ) | | | 41.29 | | | | 1.33 | | | | 483 | | | | 1.42 | | | | (.27 | ) |
| Year ended 8/31/2014 | | | 38.64 | | | | (.16 | ) | | | 9.15 | | | | 8.99 | | | | — | | | | (2.75 | ) | | | (2.75 | ) | | | 44.88 | | | | 24.02 | | | | 542 | | | | 1.43 | | | | (.38 | ) |
| Year ended 8/31/2013 | | | 31.72 | | | | (.05 | ) | | | 6.98 | | | | 6.93 | | | | (.01 | ) | | | — | | | | (.01 | ) | | | 38.64 | | | | 21.86 | | | | 483 | | | | 1.44 | | | | (.13 | ) |
| Year ended 8/31/2012 | | | 28.26 | | | | (.02 | ) | | | 3.48 | | | | 3.46 | | | | — | | | | — | | | | — | | | | 31.72 | | | | 12.24 | | | | 497 | | | | 1.44 | | | | (.07 | ) |
| Class R-2: | | | | | | | | | | | | | | | | | | | | | | | | | | | | | | | | | | | | | | | | | | | | | | | | |
| Year ended 8/31/2016 | | | 41.62 | | | | (.07 | ) | | | 3.44 | | | | 3.37 | | | | — | | | | (3.39 | ) | | | (3.39 | ) | | | 41.60 | | | | 8.53 | | | | 2,137 | | | | 1.40 | | | | (.18 | ) |
| Year ended 8/31/2015 | | | 45.17 | | | | (.08 | ) | | | .59 | | | | .51 | | | | — | | | | (4.06 | ) | | | (4.06 | ) | | | 41.62 | | | | 1.42 | | | | 2,246 | | | | 1.35 | | | | (.19 | ) |
| Year ended 8/31/2014 | | | 38.85 | | | | (.14 | ) | | | 9.21 | | | | 9.07 | | | | — | | | | (2.75 | ) | | | (2.75 | ) | | | 45.17 | | | | 24.10 | | | | 2,496 | | | | 1.38 | | | | (.33 | ) |
| Year ended 8/31/2013 | | | 31.91 | | | | (.02 | ) | | | 7.01 | | | | 6.99 | | | | (.05 | ) | | | — | | | | (.05 | ) | | | 38.85 | | | | 21.92 | | | | 2,277 | | | | 1.37 | | | | (.07 | ) |
| Year ended 8/31/2012 | | | 28.42 | | | | (.01 | ) | | | 3.50 | | | | 3.49 | | | | — | | | | — | | | | — | | | | 31.91 | | | | 12.28 | | | | 2,182 | | | | 1.41 | | | | (.04 | ) |
| Class R-2E: | | | | | | | | | | | | | | | | | | | | | | | | | | | | | | | | | | | | | | | | | | | | | | | | |
| Year ended 8/31/2016 | | | 43.09 | | | | .07 | | | | 3.55 | | | | 3.62 | | | | (.40 | ) | | | (3.39 | ) | | | (3.79 | ) | | | 42.92 | | | | 8.89 | | | | 34 | | | | 1.11 | | | | .17 | |
| Year ended 8/31/2015 | | | 46.70 | | | | .10 | | | | .65 | | | | .75 | | | | (.30 | ) | | | (4.06 | ) | | | (4.36 | ) | | | 43.09 | | | | 1.92 | 3 | | | — | 4 | | | .96 | 3 | | | .22 | 3 |
| Period from 8/29/2014 to 8/31/20145,6 | | | 46.70 | | | | — | | | | — | | | | — | | | | — | | | | — | | | | — | | | | 46.70 | | | | — | | | | — | 4 | | | — | | | | — | |
| Class R-3: | | | | | | | | | | | | | | | | | | | | | | | | | | | | | | | | | | | | | | | | | | | | | | | | |
| Year ended 8/31/2016 | | | 42.55 | | | | .10 | | | | 3.53 | | | | 3.63 | | | | (.11 | ) | | | (3.39 | ) | | | (3.50 | ) | | | 42.68 | | | | 8.99 | | | | 6,507 | | | | .98 | | | | .24 | |
| Year ended 8/31/2015 | | | 45.94 | | | | .08 | | | | .60 | | | | .68 | | | | (.01 | ) | | | (4.06 | ) | | | (4.07 | ) | | | 42.55 | | | | 1.79 | | | | 7,226 | | | | .97 | | | | .19 | |
| Year ended 8/31/2014 | | | 39.33 | | | | .03 | | | | 9.34 | | | | 9.37 | | | | (.01 | ) | | | (2.75 | ) | | | (2.76 | ) | | | 45.94 | | | | 24.60 | | | | 8,325 | | | | .98 | | | | .07 | |
| Year ended 8/31/2013 | | | 32.29 | | | | .12 | | | | 7.08 | | | | 7.20 | | | | (.16 | ) | | | — | | | | (.16 | ) | | | 39.33 | | | | 22.38 | | | | 7,769 | | | | .98 | | | | .33 | |
| Year ended 8/31/2012 | | | 28.74 | | | | .11 | | | | 3.55 | | | | 3.66 | | | | (.11 | ) | | | — | | | | (.11 | ) | | | 32.29 | | | | 12.78 | | | | 7,916 | | | | .98 | | | | .38 | |
| 30 | The Growth Fund of America |
| | | | | | | Income from
investment operations1 | | | Dividends and distributions | | | | | | | | | | | | | | | | | | | | | |
| | | Net asset
value,
beginning
of period | | | Net
investment
income
(loss) | | | Net gains on
securities (both
realized and
unrealized) | | | Total from
investment
operations | | | Dividends
(from net
investment
income) | | | Distributions
(from capital
gains) | | | Total
dividends
and
distributions | | | Net asset
value,
end
of period | | | Total
return2 | | | Net assets,
end of period
(in millions) | | | Ratio of
expenses to
average
net assets | | | Ratio of
net income
(loss) to
average
net assets | |
| Class R-4: | | | | | | | | | | | | | | | | | | | | | | | | | | | | | | | | | | | | | | | | | | | | | | | | |
| Year ended 8/31/2016 | | $ | 42.99 | | | $ | .22 | | | $ | 3.56 | | | $ | 3.78 | | | $ | (.25 | ) | | $ | (3.39 | ) | | $ | (3.64 | ) | | $ | 43.13 | | | | 9.29 | % | | $ | 7,762 | | | | .68 | % | | | .54 | % |
| Year ended 8/31/2015 | | | 46.38 | | | | .22 | | | | .60 | | | | .82 | | | | (.15 | ) | | | (4.06 | ) | | | (4.21 | ) | | | 42.99 | | | | 2.11 | | | | 7,149 | | | | .67 | | | | .48 | |
| Year ended 8/31/2014 | | | 39.68 | | | | .16 | | | | 9.42 | | | | 9.58 | | | | (.13 | ) | | | (2.75 | ) | | | (2.88 | ) | | | 46.38 | | | | 24.97 | | | | 7,835 | | | | .68 | | | | .37 | |
| Year ended 8/31/2013 | | | 32.56 | | | | .23 | | | | 7.14 | | | | 7.37 | | | | (.25 | ) | | | — | | | | (.25 | ) | | | 39.68 | | | | 22.77 | | | | 7,169 | | | | .68 | | | | .63 | |
| Year ended 8/31/2012 | | | 28.99 | | | | .20 | | | | 3.57 | | | | 3.77 | | | | (.20 | ) | | | — | | | | (.20 | ) | | | 32.56 | | | | 13.10 | | | | 8,093 | | | | .69 | | | | .66 | |
| Class R-5E: | | | | | | | | | | | | | | | | | | | | | | | | | | | | | | | | | | | | | | | | | | | | | | | | |
| Period from 11/20/2015 to 8/31/20166,7 | | | 45.73 | | | | .22 | | | | 1.21 | | | | 1.43 | | | | (.43 | ) | | | (3.39 | ) | | | (3.82 | ) | | | 43.34 | | | | 3.60 | 8 | | | — | 4 | | | .56 | 9 | | | .70 | 9 |
| Class R-5: | | | | | | | | | | | | | | | | | | | | | | | | | | | | | | | | | | | | | | | | | | | | | | | | |
| Year ended 8/31/2016 | | | 43.33 | | | | .35 | | | | 3.60 | | | | 3.95 | | | | (.39 | ) | | | (3.39 | ) | | | (3.78 | ) | | | 43.50 | | | | 9.64 | | | | 3,551 | | | | .39 | | | | .84 | |
| Year ended 8/31/2015 | | | 46.73 | | | | .35 | | | | .60 | | | | .95 | | | | (.29 | ) | | | (4.06 | ) | | | (4.35 | ) | | | 43.33 | | | | 2.40 | | | | 4,982 | | | | .38 | | | | .78 | |
| Year ended 8/31/2014 | | | 39.96 | | | | .29 | | | | 9.49 | | | | 9.78 | | | | (.26 | ) | | | (2.75 | ) | | | (3.01 | ) | | | 46.73 | | | | 25.33 | | | | 5,450 | | | | .38 | | | | .67 | |
| Year ended 8/31/2013 | | | 32.82 | | | | .34 | | | | 7.18 | | | | 7.52 | | | | (.38 | ) | | | — | | | | (.38 | ) | | | 39.96 | | | | 23.11 | | | | 5,273 | | | | .39 | | | | .92 | |
| Year ended 8/31/2012 | | | 29.24 | | | | .29 | | | | 3.60 | | | | 3.89 | | | | (.31 | ) | | | — | | | | (.31 | ) | | | 32.82 | | | | 13.48 | | | | 6,312 | | | | .39 | | | | .97 | |
| Class R-6: | | | | | | | | | | | | | | | | | | | | | | | | | | | | | | | | | | | | | | | | | | | | | | | | |
| Year ended 8/31/2016 | | | 43.40 | | | | .37 | | | | 3.60 | | | | 3.97 | | | | (.41 | ) | | | (3.39 | ) | | | (3.80 | ) | | | 43.57 | | | | 9.68 | | | | 16,299 | | | | .33 | | | | .89 | |
| Year ended 8/31/2015 | | | 46.80 | | | | .37 | | | | .61 | | | | .98 | | | | (.32 | ) | | | (4.06 | ) | | | (4.38 | ) | | | 43.40 | | | | 2.45 | | | | 13,594 | | | | .33 | | | | .83 | |
| Year ended 8/31/2014 | | | 40.02 | | | | .31 | | | | 9.50 | | | | 9.81 | | | | (.28 | ) | | | (2.75 | ) | | | (3.03 | ) | | | 46.80 | | | | 25.39 | | | | 12,407 | | | | .33 | | | | .72 | |
| Year ended 8/31/2013 | | | 32.87 | | | | .35 | | | | 7.21 | | | | 7.56 | | | | (.41 | ) | | | — | | | | (.41 | ) | | | 40.02 | | | | 23.19 | | | | 8,806 | | | | .34 | | | | .96 | |
| Year ended 8/31/2012 | | | 29.30 | | | | .31 | | | | 3.60 | | | | 3.91 | | | | (.34 | ) | | | — | | | | (.34 | ) | | | 32.87 | | | | 13.52 | | | | 7,537 | | | | .34 | | | | 1.02 | |
| | | Year ended August 31 |
| | | 2016 | | 2015 | | 2014 | | 2013 | | 2012 |
| Portfolio turnover rate for all share classes | | | 31 | % | | | 29 | % | | | 26 | % | | | 27 | % | | | 18 | % |
| | |
| 1 | Based on average shares outstanding. |
| 2 | Total returns exclude any applicable sales charges, including contingent deferred sales charges. |
| 3 | All or a significant portion of assets in this class consisted of seed capital invested by CRMC and/or its affiliates. Fees for distribution services are not charged or accrued on these seed capital assets. If such fees were paid by the fund on seed capital assets, fund expenses would have been higher and net income and total return would have been lower. |
| 4 | Amount less than $1 million. |
| 5 | Class R-2E shares were offered beginning August 29, 2014. |
| 6 | Based on operations for the period shown and, accordingly, is not representative of a full year. |
| 7 | Class R-5E shares were offered beginning November 20, 2015. |
| 8 | Not annualized. |
| 9 | Annualized. |
See Notes to Financial Statements
| The Growth Fund of America | 31 |
Report of Independent Registered Public Accounting Firm
To the Shareholders and Board of Trustees of The Growth Fund of America:
We have audited the accompanying statement of assets and liabilities of The Growth Fund of America (the “Fund”), including the summary investment portfolio, as of August 31, 2016, and the related statement of operations for the year then ended, the statements of changes in net assets for each of the two years in the period then ended, and the financial highlights for each of the periods presented. These financial statements and financial highlights are the responsibility of the Fund’s management. Our responsibility is to express an opinion on these financial statements and financial highlights based on our audits.
We conducted our audits in accordance with the standards of the Public Company Accounting Oversight Board (United States). Those standards require that we plan and perform the audit to obtain reasonable assurance about whether the financial statements and financial highlights are free of material misstatement. The Fund is not required to have, nor were we engaged to perform, an audit of its internal control over financial reporting. Our audits included consideration of internal control over financial reporting as a basis for designing audit procedures that are appropriate in the circumstances, but not for the purpose of expressing an opinion on the effectiveness of the Fund’s internal control over financial reporting. Accordingly, we express no such opinion. An audit also includes examining, on a test basis, evidence supporting the amounts and disclosures in the financial statements, assessing the accounting principles used and significant estimates made by management, as well as evaluating the overall financial statement presentation. Our procedures included confirmation of securities owned as of August 31, 2016, by correspondence with the custodians and brokers; where replies were not received from brokers, we performed other auditing procedures. We believe that our audits provide a reasonable basis for our opinion.
In our opinion, such financial statements and financial highlights referred to above present fairly, in all material respects, the financial position of The Growth Fund of America as of August 31, 2016, the results of its operations for the year then ended, the changes in its net assets for each of the two years in the period then ended, and the financial highlights for each of the periods presented, in conformity with accounting principles generally accepted in the United States of America.
Deloitte & Touche LLP
Costa Mesa, California
October 10, 2016
| 32 | The Growth Fund of America |
As a fund shareholder, you incur two types of costs: (1) transaction costs, such as initial sales charges on purchase payments and contingent deferred sales charges on redemptions (loads), and (2) ongoing costs, including management fees, distribution and service (12b-1) fees, and other expenses. This example is intended to help you understand your ongoing costs (in dollars) of investing in the fund so you can compare these costs with the ongoing costs of investing in other mutual funds. The example is based on an investment of $1,000 invested at the beginning of the period and held for the entire six-month period (March 1, 2016, through August 31, 2016).
Actual expenses:
The first line of each share class in the table on the following page provides information about actual account values and actual expenses. You may use the information in this line, together with the amount you invested, to estimate the expenses that you paid over the period. Simply divide your account value by $1,000 (for example, an $8,600 account value divided by $1,000 = 8.6), then multiply the result by the number in the first line under the heading entitled “Expenses paid during period” to estimate the expenses you paid on your account during this period.
Hypothetical example for comparison purposes:
The second line of each share class in the table on the following page provides information about hypothetical account values and hypothetical expenses based on the actual expense ratio for the share class and an assumed rate of return of 5.00% per year before expenses, which is not the actual return of the share class. The hypothetical account values and expenses may not be used to estimate the actual ending account balance or expenses you paid for the period. You may use this information to compare the ongoing costs of investing in the fund and other funds. To do so, compare this 5.00% hypothetical example with the 5.00% hypothetical examples that appear in the shareholder reports of the other funds.
Notes:
Retirement plan participants may be subject to certain fees charged by the plan sponsor, and Class F-1, F-2 and 529-F-1 shareholders may be subject to fees charged by financial intermediaries, typically ranging from 0.75% to 1.50% of assets annually depending on services offered. You can estimate the impact of these fees by adding the amount of the fees to the total estimated expenses you paid on your account during the period as calculated above. In addition, your ending account value would be lower by the amount of these fees.
Note that the expenses shown in the table on the following page are meant to highlight your ongoing costs only and do not reflect any transactional costs, such as sales charges (loads). Therefore, the second line of each share class in the table is useful in comparing ongoing costs only and will not help you determine the relative total costs of owning different funds. In addition, if these transactional costs were included, your costs would have been higher.
| The Growth Fund of America | 33 |
| | | Beginning
account value
3/1/2016 | | | Ending
account value
8/31/2016 | | | Expenses paid
during period* | | | Annualized
expense ratio | |
| Class A - actual return | | $ | 1,000.00 | | | $ | 1,150.30 | | | $ | 3.58 | | | | .66 | % |
| Class A - assumed 5% return | | | 1,000.00 | | | | 1,021.88 | | | | 3.36 | | | | .66 | |
| Class B - actual return | | | 1,000.00 | | | | 1,146.02 | | | | 7.68 | | | | 1.42 | |
| Class B - assumed 5% return | | | 1,000.00 | | | | 1,018.05 | | | | 7.22 | | | | 1.42 | |
| Class C - actual return | | | 1,000.00 | | | | 1,145.87 | | | | 7.84 | | | | 1.45 | |
| Class C - assumed 5% return | | | 1,000.00 | | | | 1,017.90 | | | | 7.37 | | | | 1.45 | |
| Class F-1 - actual return | | | 1,000.00 | | | | 1,150.16 | | | | 3.85 | | | | .71 | |
| Class F-1 - assumed 5% return | | | 1,000.00 | | | | 1,021.63 | | | | 3.62 | | | | .71 | |
| Class F-2 - actual return | | | 1,000.00 | | | | 1,151.60 | | | | 2.39 | | | | .44 | |
| Class F-2 - assumed 5% return | | | 1,000.00 | | | | 1,022.99 | | | | 2.24 | | | | .44 | |
| Class 529-A - actual return | | | 1,000.00 | | | | 1,150.02 | | | | 4.01 | | | | .74 | |
| Class 529-A - assumed 5% return | | | 1,000.00 | | | | 1,021.48 | | | | 3.77 | | | | .74 | |
| Class 529-B - actual return | | | 1,000.00 | | | | 1,145.13 | | | | 8.22 | | | | 1.52 | |
| Class 529-B - assumed 5% return | | | 1,000.00 | | | | 1,017.54 | | | | 7.73 | | | | 1.52 | |
| Class 529-C - actual return | | | 1,000.00 | | | | 1,145.61 | | | | 8.17 | | | | 1.51 | |
| Class 529-C - assumed 5% return | | | 1,000.00 | | | | 1,017.59 | | | | 7.68 | | | | 1.51 | |
| Class 529-E - actual return | | | 1,000.00 | | | | 1,148.65 | | | | 5.25 | | | | .97 | |
| Class 529-E - assumed 5% return | | | 1,000.00 | | | | 1,020.32 | | | | 4.94 | | | | .97 | |
| Class 529-F-1 - actual return | | | 1,000.00 | | | | 1,151.10 | | | | 2.77 | | | | .51 | |
| Class 529-F-1 - assumed 5% return | | | 1,000.00 | | | | 1,022.63 | | | | 2.60 | | | | .51 | |
| Class R-1 - actual return | | | 1,000.00 | | | | 1,145.91 | | | | 7.68 | | | | 1.42 | |
| Class R-1 - assumed 5% return | | | 1,000.00 | | | | 1,018.05 | | | | 7.22 | | | | 1.42 | |
| Class R-2 - actual return | | | 1,000.00 | | | | 1,146.33 | | | | 7.63 | | | | 1.41 | |
| Class R-2 - assumed 5% return | | | 1,000.00 | | | | 1,018.10 | | | | 7.17 | | | | 1.41 | |
| Class R-2E - actual return | | | 1,000.00 | | | | 1,147.59 | | | | 6.12 | | | | 1.13 | |
| Class R-2E - assumed 5% return | | | 1,000.00 | | | | 1,019.51 | | | | 5.75 | | | | 1.13 | |
| Class R-3 - actual return | | | 1,000.00 | | | | 1,148.56 | | | | 5.31 | | | | .98 | |
| Class R-3 - assumed 5% return | | | 1,000.00 | | | | 1,020.27 | | | | 4.99 | | | | .98 | |
| Class R-4 - actual return | | | 1,000.00 | | | | 1,150.15 | | | | 3.69 | | | | .68 | |
| Class R-4 - assumed 5% return | | | 1,000.00 | | | | 1,021.78 | | | | 3.47 | | | | .68 | |
| Class R-5E - actual return | | | 1,000.00 | | | | 1,150.81 | | | | 3.09 | | | | .57 | |
| Class R-5E - assumed 5% return | | | 1,000.00 | | | | 1,022.33 | | | | 2.91 | | | | .57 | |
| Class R-5 - actual return | | | 1,000.00 | | | | 1,152.01 | | | | 2.06 | | | | .38 | |
| Class R-5 - assumed 5% return | | | 1,000.00 | | | | 1,023.29 | | | | 1.94 | | | | .38 | |
| Class R-6 - actual return | | | 1,000.00 | | | | 1,152.34 | | | | 1.79 | | | | .33 | |
| Class R-6 - assumed 5% return | | | 1,000.00 | | | | 1,023.54 | | | | 1.68 | | | | .33 | |
| * | The “expenses paid during period” are equal to the “annualized expense ratio,” multiplied by the average account value over the period, multiplied by the number of days in the period, and divided by 365 (to reflect the one-half year period). |
| 34 | The Growth Fund of America |
We are required to advise you of the federal tax status of certain distributions received by shareholders during the fiscal year. The fund hereby designates the following amounts for the fund’s fiscal year ended August 31, 2016:
| Long-term capital gains | $11,541,625,000 |
| Qualified dividend income | 100% |
| Corporate dividends received deduction | 100% |
| U.S. government income that may be exempt from state taxation | $13,109,000 |
Individual shareholders should refer to their Form 1099 or other tax information, which will be mailed in January 2017, to determine the calendar year amounts to be included on their 2016 tax returns. Shareholders should consult their tax advisors.
| The Growth Fund of America | 35 |
Approval of Investment Advisory and Service Agreement
The Growth Fund of America board has approved the fund’s Investment Advisory and Service Agreement (the “agreement”) with Capital Research and Management Company (“CRMC”) for an additional one-year term through November 30, 2017. The board approved the agreement following the recommendation of the fund’s Contracts Committee (the “committee”), which is composed of all of the fund’s independent board members. The board and the committee determined that the fund’s advisory fee structure was fair and reasonable in relation to the services provided, and that approving the agreement was in the best interests of the fund and its shareholders.
In reaching this decision, the board and the committee took into account information furnished to them throughout the year and otherwise provided to them, as well as information prepared specifically in connection with their review of the agreement, and were advised by their independent counsel. They considered the following factors, among others, but did not identify any single issue or particular piece of information that, in isolation, was the controlling factor, and each board and committee member did not necessarily attribute the same weight to each factor.
1. Nature, extent and quality of services
The board and the committee considered the depth and quality of CRMC’s investment management process, including its global research capabilities; the experience, capability and integrity of its senior management and other personnel; the low turnover rates of its key personnel; the overall financial strength and stability of CRMC and the Capital Group organization; and the ongoing evolution of CRMC’s organizational structure designed to maintain and strengthen these qualities. The board and the committee also considered the nature, extent and quality of administrative, compliance and shareholder services provided by CRMC to the fund under the agreement and other agreements, as well as the benefits to fund shareholders from investing in a fund that is part of a large family of funds. The board and the committee concluded that the nature, extent and quality of the services provided by CRMC have benefited and should continue to benefit the fund and its shareholders.
2. Investment results
The board and the committee considered the investment results of the fund in light of its objective of pursuing growth of capital. They compared the fund’s investment results with those of other funds (including funds that currently form the basis of the Lipper index for the category in which the fund is included), and data such as relevant market and fund indexes, over various periods through March 31, 2016. This report, including the letter to shareholders and related disclosures, contains certain information about the fund’s investment results. The board and the committee reviewed the fund’s investment results measured against various indexes, including the Lipper Growth Funds Index, the Lipper Large-Cap Core Funds Index, the Lipper Large-Cap Growth Funds Index and the Standard & Poor’s 500 Composite Index. They noted that the investment results of the fund generally compared favorably to or were in line with the results of these indexes for the lifetime period, 20-year period, 10-year period and five-year period. The board and the committee concluded that the fund’s investment results have been satisfactory for renewal of the agreement, and that CRMC’s record in managing the fund indicated that its continued management should benefit the fund and its shareholders.
3. Advisory fees and total expenses
The board and the committee compared the advisory fees and total expense levels of the fund to those of other relevant funds. They observed that the fund’s advisory fees and expenses generally compared favorably to those of other similar funds included in the Lipper Growth Funds category. The board and the committee also considered the breakpoint discounts in the fund’s advisory fee structure that reduce the level of fees charged by CRMC to the fund as fund assets increase. In addition, they reviewed information regarding the effective advisory fees charged to non-mutual fund clients by CRMC and its affiliates. They noted that, to the extent there were differences between the advisory fees paid by the fund and the advisory fees paid by those clients, the differences appropriately reflected the investment, operational, regulatory and market differences between advising the fund and the other clients. The board and the committee concluded that the fund’s cost structure was fair and reasonable in relation to the services provided, and that the fund’s shareholders receive reasonable value in return for the advisory fees and other amounts paid to CRMC by the fund.
| 36 | The Growth Fund of America |
4. Ancillary benefits
The board and the committee considered a variety of other benefits that CRMC and its affiliates receive as a result of CRMC’s relationship with the fund and the other American Funds, including fees for administrative services provided to certain share classes; fees paid to CRMC’s affiliated transfer agent; sales charges and distribution fees received and retained by the fund’s principal underwriter, an affiliate of CRMC; and possible ancillary benefits to CRMC and its institutional management affiliates in managing other investment vehicles. The board and the committee reviewed CRMC’s portfolio trading practices, noting the benefits CRMC receives from the research obtained with commissions from portfolio transactions made on behalf of the fund. The board and the committee took these ancillary benefits into account in evaluating the reasonableness of the advisory fees and other amounts paid to CRMC by the fund.
5. Adviser financial information
The board and the committee reviewed information regarding CRMC’s costs of providing services to the American Funds, including personnel, systems and resources of investment, compliance, trading, accounting and other administrative operations. They considered CRMC’s costs and related cost allocation methodology, as well as its willingness to invest in technology, infrastructure and staff to maintain and expand services and capabilities, respond to industry and regulatory developments, and attract and retain qualified personnel. They noted information regarding the compensation structure for CRMC’s investment professionals. The board and the committee also compared CRMC’s profitability and compensation data to the reported results and data of several large, publicly held investment management companies. The board and the committee noted the competitiveness and cyclicality of both the mutual fund industry and the capital markets, and the importance in that environment of CRMC’s long-term profitability for maintaining its independence, company culture and management continuity. They further considered the breakpoint discounts in the fund’s advisory fee structure. The board and the committee concluded that the fund’s advisory fee structure reflected a reasonable sharing of benefits between CRMC and the fund’s shareholders.
| The Growth Fund of America | 37 |
Board of trustees and other officers
Independent trustees1
| Name and year of birth | | Year first
elected
a trustee
of the fund2 | | Principal occupation(s) during past five years | | Number of
portfolios in fund
complex overseen
by trustee3 | | Other directorships4
held by trustee |
| Ronald P. Badie, 1942 | | 2008 | | Retired; former Vice Chairman, Deutsche Bank Alex. Brown (retired 2002) | | 3 | | Amphenol Corporation; Nautilus, Inc. |
| Joseph C. Berenato, 1946 | | 2003 | | Former Chairman and CEO, Ducommun Incorporated (aerospace components manufacturer) | | 15 | | Ducommun Incorporated |
| Louise H. Bryson, 1944 | | 2008 | | Chair Emerita of the Board of Trustees, J. Paul Getty Trust; former President, Distribution, Lifetime Entertainment Network (retired 2008); former Executive Vice President and General Manager, Lifetime Movie Network (retired 2008) | | 7 | | None |
| Robert J. Denison, 1941 | | 2005 | | Chair, First Security Management (private investment) | | 6 | | None |
Mary Anne Dolan, 1947
Chairman of the Board (Independent and Non-Executive) | | 2010 | | Founder and President, MAD Ink (communications company) | | 10 | | None |
| John G. Freund, 1953 | | 2010 | | Founder and Managing Director, Skyline Ventures (venture capital investor in health care companies) | | 6 | | Collegium Pharmaceutical, Inc.; Proteon Therapeutics, Inc.; Tetraphase Pharmaceuticals, Inc. |
| Linda Griego, 1947 | | 2015 | | President and CEO, Griego Enterprises, Inc. (business management company) | | 7 | | AECOM Technology Corporation; CBS Corporation |
| Leonade D. Jones, 1947 | | 1993 | | Retired; former Treasurer, The Washington Post Company (retired 1996) | | 10 | | None |
| William H. Kling, 1942 | | 2010 | | President Emeritus and former CEO, American Public Media | | 10 | | None |
| Kenneth M. Simril,5 1965 | | 2016 | | President and CEO, Green Plains Ingredients (food manufacturing) | | 3 | | None |
| Christopher E. Stone, 1956 | | 2010 | | President, Open Society Foundations; former Professor of the Practice of Criminal Justice, John F. Kennedy School of Government, Harvard University | | 6 | | None |
| Interested trustees6,7 | | | | |
| | | | | |
Name, year of birth and
position with fund | | Year first
elected
a trustee
or officer
of the fund2 | | Principal occupation(s) during past five years
and positions held with affiliated entities or
the principal underwriter of the fund | | Number of
portfolios in fund
complex overseen
by trustee3 | | Other directorships4
held by trustee |
Donald D. O’Neal, 1960
Vice Chairman of the Board | | 1995 | | Partner — Capital Research Global Investors, Capital Research and Management Company; Director, Capital Research and Management Company | | 31 | | None |
Michael T. Kerr, 1959
President | | 1998 | | Partner — Capital World Investors, Capital Research and Management Company; Director, The Capital Group Companies, Inc.8 | | 1 | | None |
The fund’s statement of additional information includes further details about fund trustees and is available without charge upon request by calling American Funds Service Company at (800) 421-4225 or by visiting the American Funds website at americanfunds.com. The address for all trustees and officers of the fund is 333 South Hope Street, Los Angeles, CA 90071, Attention: Secretary.
| 38 | The Growth Fund of America |
Other officers7
Name, year of birth and
position with fund | | Year first
elected
an officer
of the fund2 | | Principal occupation(s) during past five years and positions held with affiliated entities
or the principal underwriter of the fund |
Paul F. Roye, 1953
Executive Vice President | | 2012 | | Director, Capital Research and Management Company; Senior Vice President and Senior Counsel — Fund Business Management Group, Capital Research and Management Company |
Brad A. Barrett, 1977
Senior Vice President | | 2010 | | Partner — Capital Research Global Investors, Capital Research and Management Company |
Christopher D. Buchbinder, 1971
Senior Vice President | | 2015 | | Partner — Capital Research Global Investors, Capital Research and Management Company |
Martin Romo, 1967
Senior Vice President | | 2010 | | Director, Capital Research and Management Company; Partner — Capital World Investors, Capital Research and Management Company; President and Director, Capital Research Company;8 Director, The Capital Group Companies, Inc.8 |
Walter R. Burkley, 1966
Vice President | | 2010 | | Senior Vice President and Senior Counsel — Fund Business Management Group, Capital Research and Management Company; Director, Capital Research Company8 |
Mark L. Casey, 1970
Vice President | | 2016 | | Partner — Capital World Investors, Capital Research and Management Company |
Barry S. Crosthwaite, 1958
Vice President | | 2010 | | Partner — Capital Research Global Investors, Capital Research and Management Company |
Jacinto J. Hernandez, 1978
Vice President | | 2015 | | Partner — Capital World Investors, Capital Research and Management Company |
Anne-Marie Peterson, 1972
Vice President | | 2016 | | Director, Capital Research and Management Company; Partner — Capital World Investors, Capital Research and Management Company |
Lawrence R. Solomon, 1962
Vice President | | 2014 | | Partner — Capital Research Global Investors, Capital Research and Management Company; Chairman of the Board and President, Capital Management Services, Inc.8 |
Michael W. Stockton, 1967
Secretary | | 2014 | | Vice President — Fund Business Management Group, Capital Research and Management Company |
Kimberley H. Monasterio, 1963
Treasurer | | 2016 | | Vice President — Investment Operations, Capital Research and Management Company |
Julie E. Lawton, 1973
Assistant Secretary | | 2010 | | Assistant Vice President — Fund Business Management Group, Capital Research and Management Company; Secretary, Capital Research Company8 |
Brian C. Janssen, 1972
Assistant Treasurer | | 2016 | | Vice President — Investment Operations, Capital Research and Management Company |
Dori Laskin, 1951
Assistant Treasurer | | 2011 | | Vice President — Investment Operations, Capital Research and Management Company |
| 1 | The term independent trustee refers to a trustee who is not an “interested person” of the fund within the meaning of the Investment Company Act of 1940. |
| 2 | Trustees and officers of the fund serve until their resignation, removal or retirement. |
| 3 | Funds managed by Capital Research and Management Company or its affiliates. |
| 4 | This includes all directorships/trusteeships (other than those in the American Funds or other funds managed by Capital Research and Management Company or its affiliates) that are held by each trustee as a trustee or director of a public company or a registered investment company. |
| 5 | Mr. Simril was elected effective October 1, 2016. |
| 6 | The term interested trustee refers to a trustee who is an “interested person” within the meaning of the Investment Company Act of 1940, on the basis of their affiliation with the fund’s investment adviser, Capital Research and Management Company, or affiliated entities (including the fund’s principal underwriter). |
| 7 | All of the directors/trustees and/or officers listed, with the exception of Brad A. Barrett, Jacinto J. Hernandez and Anne-Marie Peterson, are officers and/or directors/trustees of one or more of the other funds for which Capital Research and Management Company serves as investment adviser. |
| 8 | Company affiliated with Capital Research and Management Company. |
| The Growth Fund of America | 39 |
Office of the fund
6455 Irvine Center Drive
Irvine, CA 92618-4518
Investment adviser
Capital Research and Management Company
333 South Hope Street
Los Angeles, CA 90071-1406
6455 Irvine Center Drive
Irvine, CA 92618-4518
Transfer agent for shareholder accounts
American Funds Service Company
(Write to the address near you.)
P.O. Box 6007
Indianapolis, IN 46206-6007
P.O. Box 2280
Norfolk, VA 23501-2280
Custodian of assets
State Street Bank and Trust Company
One Lincoln Street
Boston, MA 02111
Counsel
Dechert LLP
One Bush Street, Suite 1600
San Francisco, CA 94104-4446
Independent registered public accounting firm
Deloitte & Touche LLP
695 Town Center Drive
Suite 1200
Costa Mesa, CA 92626-7188
Principal underwriter
American Funds Distributors, Inc.
333 South Hope Street
Los Angeles, CA 90071-1406
| 40 | The Growth Fund of America |
Investors should carefully consider investment objectives, risks, charges and expenses. This and other important information is contained in the fund prospectus and summary prospectus, which can be obtained from your financial professional and should be read carefully before investing. You may also call American Funds Service Company (AFS) at (800) 421-4225 or visit the American Funds website at americanfunds.com.
“American Funds Proxy Voting Procedures and Principles” — which describes how we vote proxies relating to portfolio securities — is available on the American Funds website or upon request by calling AFS. The fund files its proxy voting record with the U.S. Securities and Exchange Commission (SEC) for the 12 months ended June 30 by August 31. The proxy voting record is available free of charge on the SEC website at sec.gov and on the American Funds website.
A complete August 31, 2016, portfolio of The Growth Fund of America’s investments is available free of charge by calling AFS or visiting the SEC website (where it is part of Form N-CSR).
The Growth Fund of America files a complete list of its portfolio holdings with the SEC for the first and third quarters of each fiscal year on Form N-Q. This filing is available free of charge on the SEC website. You may also review or, for a fee, copy this filing at the SEC’s Public Reference Room in Washington, D.C. Additional information regarding the operation of the Public Reference Room may be obtained by calling the SEC’s Office of Investor Education and Advocacy at (800) SEC-0330. Additionally, the list of portfolio holdings is available by calling AFS.
This report is for the information of shareholders of The Growth Fund of America, but it also may be used as sales literature when preceded or accompanied by the current prospectus or summary prospectus, which gives details about charges, expenses, investment objectives and operating policies of the fund. If used as sales material after December 31, 2016, this report must be accompanied by an American Funds statistical update for the most recently completed calendar quarter.
The American Funds Advantage®
Since 1931, American Funds, part of Capital Group, has helped investors pursue long-term investment success. Our consistent approach — in combination with The Capital SystemSM — has resulted in a superior long-term track record.
| | Aligned with investor success |
| | We base our decisions on a long-term perspective, which we believe aligns our goals with the interests of our clients. Our portfolio managers average 27 years of investment experience, including 22 years at our company, reflecting a career commitment to our long-term approach.1 |
| | |
| | The Capital SystemSM |
| | The Capital System combines individual accountability with teamwork. Funds using The Capital System are divided into portions that are managed independently by investment professionals with diverse backgrounds, ages and investment approaches. An extensive global research effort is the backbone of our system. |
| | |
| | Superior long-term track record |
| | Our equity funds have beaten their Lipper peer indexes in 91% of 10-year periods and 95% of 20-year periods. Our fixed income funds have beaten their Lipper indexes in 58% of 10-year periods and 58% of 20-year periods.2 Our fund management fees have been among the lowest in the industry.3 |
| | 1 | Portfolio manager experience as of December 31, 2015. |
| | 2 | Based on Class A share results for rolling periods through December 31, 2015. Periods covered are the shorter of the fund’s lifetime or since the comparable Lipper index inception date (except Capital Income Builder and SMALLCAP World Fund, for which the Lipper average was used). |
| | 3 | On average, our management fees were in the lowest quintile 68% of the time, based on the 20-year period ended December 31, 2015, versus comparable Lipper categories, excluding funds of funds. |

ITEM 2 – Code of Ethics
The Registrant has adopted a Code of Ethics that applies to its Principal Executive Officer and Principal Financial Officer. The Registrant undertakes to provide to any person without charge, upon request, a copy of the Code of Ethics. Such request can be made to American Funds Service Company at 800/421-9225 or to the Secretary of the Registrant, 6455 Irvine Center Drive, Irvine, California 92618.
ITEM 3 – Audit Committee Financial Expert
The Registrant’s board has determined that Ronald P. Badie, a member of the Registrant’s audit committee, is an “audit committee financial expert” and "independent," as such terms are defined in this Item. This designation will not increase the designee’s duties, obligations or liability as compared to his or her duties, obligations and liability as a member of the audit committee and of the board, nor will it reduce the responsibility of the other audit committee members. There may be other individuals who, through education or experience, would qualify as "audit committee financial experts" if the board had designated them as such. Most importantly, the board believes each member of the audit committee contributes significantly to the effective oversight of the Registrant’s financial statements and condition.
ITEM 4 – Principal Accountant Fees and Services
| | Registrant: |
| | | a) Audit Fees: |
| | | | 2015 | $133,000 |
| | | | 2016 | $103,000 |
| | | | |
| | | b) Audit-Related Fees: |
| | | | 2015 | $54,000 |
| | | | 2016 | $24,000 |
| | | | The audit-related fees consist of assurance and related services relating to the examination of the Registrant’s investment adviser conducted in accordance with Statement on Standards for Attestation Engagements Number 16 issued by the American Institute of Certified Public Accountants. |
| | | | |
| | | c) Tax Fees: |
| | | | 2015 | $10,000 |
| | | | 2016 | $12,000 |
| | | | The tax fees consist of professional services relating to the preparation of the Registrant’s tax returns including returns relating to the Registrant’s investments in non-U.S. jurisdictions. |
| | | | |
| | | d) All Other Fees: |
| | | | 2015 | None |
| | | | 2016 | None |
| | | | |
| | Adviser and affiliates (includes only fees for non-audit services billed to the adviser and affiliates for engagements that relate directly to the operations and financial reporting of the Registrant and were subject to the pre-approval policies described below): |
| | | a) Audit Fees: |
| | | | Not Applicable |
| | | | |
| | | b) Audit-Related Fees: |
| | | | 2015 | $1,176,000 |
| | | | 2016 | $1,073,000 |
| | | | The audit-related fees consist of assurance and related services relating to the examination of the Registrant’s transfer agent, principal underwriter and investment adviser conducted in accordance with Statement on Standards for Attestation Engagements Number 16 issued by the American Institute of Certified Public Accountants. |
| | | | |
| | | c) Tax Fees: |
| | | | 2015 | None |
| | | | 2016 | None |
| | | | The tax fees consist of consulting services relating to the Registrant’s investments. |
| | | | |
| | | d) All Other Fees: |
| | | | 2015 | $5,000 |
| | | | 2016 | $3,000 |
| | | | The other fees consist of subscription services related to an accounting research tool. |
| | | | |
All audit and permissible non-audit services that the Registrant’s audit committee considers compatible with maintaining the independent registered public accounting firm’s independence are required to be pre-approved by the committee. The pre-approval requirement will extend to all non-audit services provided to the Registrant, the investment adviser, and any entity controlling, controlled by, or under common control with the investment adviser that provides ongoing services to the Registrant, if the engagement relates directly to the operations and financial reporting of the Registrant. The committee will not delegate its responsibility to pre-approve these services to the investment adviser. The committee may delegate to one or more committee members the authority to review and pre-approve audit and permissible non-audit services. Actions taken under any such delegation will be reported to the full committee at its next meeting. The pre-approval requirement is waived with respect to non-audit services if certain conditions are met. The pre-approval requirement was not waived for any of the non-audit services listed above provided to the Registrant, adviser and affiliates.
Aggregate non-audit fees paid to the Registrant’s auditors, including fees for all services billed to the Registrant, adviser and affiliates that provide ongoing services to the Registrant, were $1,497,000 for fiscal year 2015 and $1,239,000 for fiscal year 2016. The non-audit services represented by these amounts were brought to the attention of the committee and considered to be compatible with maintaining the auditors’ independence.
ITEM 5 – Audit Committee of Listed Registrants
Not applicable to this Registrant, insofar as the Registrant is not a listed issuer as defined in Rule 10A-3 under the Securities Exchange Act of 1934.
ITEM 6 – Schedule of Investments
The Growth Fund of America®
Investment portfolio
August 31, 2016
Common stocks 92.49%
Information technology 22.84% | Shares | Value
(000) |
| Alphabet Inc., Class C1 | 3,002,670 | $2,303,198 |
| Alphabet Inc., Class A1 | 2,205,770 | 1,742,227 |
| Broadcom Ltd.2 | 22,178,905 | 3,912,802 |
| Microsoft Corp. | 52,167,600 | 2,997,550 |
| Oracle Corp. | 50,881,000 | 2,097,315 |
| Facebook, Inc., Class A1 | 15,718,000 | 1,982,354 |
| Alibaba Group Holding Ltd. (ADR)1 | 16,897,100 | 1,642,229 |
| ASML Holding NV (New York registered) | 8,498,941 | 905,562 |
| ASML Holding NV | 6,609,442 | 703,116 |
| Visa Inc., Class A | 17,158,049 | 1,388,086 |
| Taiwan Semiconductor Manufacturing Co., Ltd. | 195,610,000 | 1,084,993 |
| Taiwan Semiconductor Manufacturing Co., Ltd. (ADR) | 9,913,800 | 284,922 |
| Intuit Inc. | 10,795,000 | 1,203,103 |
| Apple Inc. | 10,683,000 | 1,133,466 |
| Texas Instruments Inc. | 12,190,100 | 847,700 |
| Intel Corp. | 20,157,627 | 723,457 |
| salesforce.com, inc.1 | 7,311,000 | 580,640 |
| Nintendo Co., Ltd. | 2,440,000 | 534,741 |
| Skyworks Solutions, Inc. | 7,012,000 | 524,918 |
| Akamai Technologies, Inc.1,2 | 8,750,000 | 480,375 |
| MasterCard Inc., Class A | 4,796,800 | 463,515 |
| Juniper Networks, Inc.2 | 19,827,923 | 457,629 |
| LinkedIn Corp., Class A1 | 2,320,094 | 447,198 |
| Accenture PLC, Class A | 3,650,000 | 419,750 |
| TE Connectivity Ltd. | 6,043,000 | 384,154 |
| Flextronics International Ltd.1,2 | 27,812,000 | 368,231 |
| Hexagon AB, Class B | 8,541,102 | 347,804 |
| Applied Materials, Inc. | 10,950,000 | 326,748 |
| Qorvo, Inc.1 | 5,336,243 | 306,460 |
| Amphenol Corp., Class A | 4,571,500 | 284,850 |
| Arista Networks, Inc.1 | 3,384,222 | 269,655 |
| Baidu, Inc., Class A (ADR)1 | 1,513,800 | 258,966 |
| Xilinx, Inc. | 4,750,000 | 257,498 |
| Murata Manufacturing Co., Ltd. | 1,736,300 | 233,347 |
| First Data Corp., Class A1 | 14,448,227 | 201,119 |
| Yandex NV, Class A1 | 8,623,219 | 190,056 |
| Motorola Solutions, Inc. | 2,080,052 | 160,143 |
| Adobe Systems Inc.1 | 1,300,000 | 133,003 |
| Cloudera, Inc.1,3,4 | 5,402,537 | 120,477 |
| VeriSign, Inc.1 | 1,445,000 | 107,580 |
| Dolby Laboratories, Inc., Class A | 2,063,609 | 100,993 |
| NetSuite Inc.1 | 890,661 | 96,993 |
| FLIR Systems, Inc. | 2,240,866 | 69,086 |
| Yahoo! Inc.1 | 1,302,000 | 55,661 |
| Finisar Corp.1 | 2,068,000 | 43,800 |
The Growth Fund of America — Page 1 of 8
Common stocks
Information technology (continued) | Shares | Value
(000) |
| National Instruments Corp. | 1,418,377 | $39,629 |
| Viavi Solutions Inc.1 | 4,496,600 | 34,984 |
| | | 33,252,083 |
| Consumer discretionary 20.16% | | |
| Amazon.com, Inc.1 | 12,799,496 | 9,844,860 |
| Home Depot, Inc. | 24,887,200 | 3,337,871 |
| Netflix, Inc.1,2 | 23,034,761 | 2,244,738 |
| Comcast Corp., Class A | 29,797,000 | 1,944,552 |
| Priceline Group Inc.1 | 1,196,209 | 1,694,705 |
| Twenty-First Century Fox, Inc., Class A | 36,262,906 | 889,892 |
| Charter Communications, Inc., Class A1 | 3,172,860 | 816,091 |
| Viacom Inc., Class B | 18,198,351 | 734,122 |
| MGM Resorts International1,2 | 30,253,344 | 722,752 |
| Starbucks Corp. | 12,600,000 | 708,498 |
| NIKE, Inc., Class B | 11,030,000 | 635,769 |
| Ulta Salon, Cosmetics & Fragrance, Inc.1 | 2,245,000 | 554,986 |
| lululemon athletica inc.1 | 6,535,000 | 499,993 |
| CBS Corp., Class B | 9,060,000 | 462,332 |
| Liberty Global PLC, Class C1 | 11,476,520 | 353,821 |
| Liberty Global PLC, Class A1 | 2,894,280 | 91,604 |
| BorgWarner Inc.2 | 11,207,259 | 385,418 |
| Time Warner Inc. | 4,910,000 | 384,993 |
| AutoNation, Inc.1,2 | 6,000,000 | 284,100 |
| Expedia, Inc. | 2,361,107 | 257,644 |
| Panera Bread Co., Class A1 | 1,164,040 | 252,771 |
| Naspers Ltd., Class N | 1,464,000 | 239,585 |
| Marriott International, Inc., Class A | 3,304,663 | 235,722 |
| D.R. Horton, Inc. | 6,685,000 | 214,321 |
| Volkswagen AG, non-voting preferred | 1,323,000 | 183,730 |
| Walt Disney Co. | 1,915,000 | 180,891 |
| Domino’s Pizza, Inc. | 1,125,000 | 168,266 |
| Kering SA | 800,000 | 151,657 |
| Tesla Motors, Inc.1 | 580,100 | 122,987 |
| Johnson Controls, Inc. | 2,770,000 | 121,548 |
| Graham Holdings Co., Class B | 243,817 | 119,556 |
| Cable One, Inc. | 206,499 | 111,741 |
| Wyndham Worldwide Corp. | 1,514,700 | 107,226 |
| Luxottica Group SpA | 1,630,000 | 78,636 |
| Liberty Interactive Corp. QVC Group, Series A1 | 3,316,100 | 70,069 |
| Hermès International | 133,000 | 56,167 |
| Toll Brothers, Inc.1 | 1,700,000 | 52,853 |
| Tiffany & Co. | 290,000 | 20,697 |
| Sturm, Ruger & Co., Inc. | 145,232 | 8,901 |
| Lennar Corp., Class A | 100,000 | 4,730 |
| | | 29,350,795 |
| Health care 15.57% | | |
| UnitedHealth Group Inc. | 22,308,505 | 3,035,072 |
| Amgen Inc. | 14,972,709 | 2,546,259 |
| Express Scripts Holding Co.1 | 21,417,793 | 1,557,074 |
| Illumina, Inc.1,2 | 8,315,957 | 1,399,908 |
| Thermo Fisher Scientific Inc. | 8,918,000 | 1,357,230 |
| Gilead Sciences, Inc. | 13,458,198 | 1,054,854 |
| Regeneron Pharmaceuticals, Inc.1 | 2,458,000 | 964,888 |
The Growth Fund of America — Page 2 of 8
Common stocks
Health care (continued) | Shares | Value
(000) |
| Stryker Corp. | 8,278,376 | $957,477 |
| AbbVie Inc. | 12,009,000 | 769,777 |
| AbbVie Inc.4,5 | 2,433,249 | 149,732 |
| BioMarin Pharmaceutical Inc.1 | 8,539,041 | 801,731 |
| Alexion Pharmaceuticals, Inc.1 | 6,289,189 | 791,557 |
| Aetna Inc. | 6,607,800 | 773,906 |
| Boston Scientific Corp.1 | 32,010,000 | 762,478 |
| Humana Inc. | 3,967,000 | 708,943 |
| McKesson Corp. | 3,793,662 | 700,386 |
| Vertex Pharmaceuticals Inc.1 | 6,993,000 | 660,908 |
| Medtronic PLC | 6,290,000 | 547,419 |
| Incyte Corp.1 | 3,882,000 | 314,830 |
| Hologic, Inc.1 | 4,907,318 | 188,539 |
| Teva Pharmaceutical Industries Ltd. (ADR) | 3,661,000 | 184,478 |
| Merck & Co., Inc. | 2,860,000 | 179,579 |
| St. Jude Medical, Inc. | 2,066,266 | 161,003 |
| Edwards Lifesciences Corp.1 | 1,207,800 | 139,090 |
| WellCare Health Plans, Inc.1 | 1,200,000 | 135,240 |
| Novartis AG | 1,666,816 | 131,169 |
| Ultragenyx Pharmaceutical Inc.1 | 1,905,049 | 125,581 |
| athenahealth, Inc.1 | 1,011,284 | 123,812 |
| Grifols, SA, Class B, preferred non-voting, non-registered shares | 7,740,000 | 122,597 |
| Intercept Pharmaceuticals, Inc.1 | 812,700 | 120,532 |
| Quintiles Transnational Holdings Inc.1 | 1,545,000 | 119,428 |
| ResMed Inc. | 1,780,000 | 118,708 |
| Centene Corp.1 | 1,717,400 | 117,281 |
| Kite Pharma, Inc.1 | 2,030,952 | 117,023 |
| Bristol-Myers Squibb Co. | 2,026,000 | 116,272 |
| Endo International PLC1 | 5,258,382 | 108,849 |
| PerkinElmer, Inc. | 1,935,000 | 103,039 |
| Danaher Corp. | 1,200,000 | 97,692 |
| bluebird bio, Inc.1,2 | 1,897,076 | 93,602 |
| ACADIA Pharmaceuticals Inc.1 | 2,210,000 | 71,007 |
| Abbott Laboratories | 1,656,726 | 69,616 |
| Juno Therapeutics, Inc.1 | 1,110,000 | 32,834 |
| Acerta Pharma BV1,3,4 | 273,779,325 | 26,169 |
| Agios Pharmaceuticals, Inc.1 | 237,360 | 8,744 |
| | | 22,666,313 |
| Energy 9.88% | | |
| EOG Resources, Inc. | 26,662,108 | 2,359,330 |
| Schlumberger Ltd. | 21,480,484 | 1,696,958 |
| Concho Resources Inc.1,2 | 9,516,984 | 1,229,594 |
| Pioneer Natural Resources Co. | 6,839,716 | 1,224,651 |
| Halliburton Co. | 28,133,600 | 1,210,026 |
| Canadian Natural Resources, Ltd. | 36,031,310 | 1,119,075 |
| Noble Energy, Inc.2 | 26,435,185 | 911,485 |
| Cabot Oil & Gas Corp. | 21,955,000 | 540,752 |
| Suncor Energy Inc. | 19,845,520 | 538,132 |
| Apache Corp. | 9,789,000 | 486,513 |
| Weatherford International PLC1,2 | 69,950,382 | 382,629 |
| Cimarex Energy Co. | 2,890,100 | 382,013 |
| Range Resources Corp. | 8,435,000 | 325,338 |
| Chevron Corp. | 3,000,000 | 301,740 |
| Southwestern Energy Co.1 | 18,244,432 | 253,780 |
The Growth Fund of America — Page 3 of 8
Common stocks
Energy (continued) | Shares | Value
(000) |
| Seven Generations Energy Ltd., Class A1 | 10,523,200 | $242,337 |
| Enbridge Inc. (CAD denominated) | 4,980,555 | 196,427 |
| Royal Dutch Shell PLC, Class B (ADR) | 2,428,800 | 125,545 |
| Royal Dutch Shell PLC, Class B | 2,535,910 | 64,669 |
| Tourmaline Oil Corp.1 | 6,313,000 | 177,538 |
| Murphy Oil Corp. | 5,974,500 | 159,639 |
| CONSOL Energy Inc. | 6,235,000 | 113,726 |
| Golar LNG Ltd. | 3,731,190 | 77,721 |
| Baker Hughes Inc. | 1,474,769 | 72,455 |
| TOTAL SA | 1,242,086 | 59,230 |
| BP PLC | 7,678,899 | 43,148 |
| BP PLC (ADR) | 284,500 | 9,633 |
| Repsol, SA, non-registered shares | 3,454,887 | 46,399 |
| Tullow Oil PLC | 8,520,262 | 24,380 |
| Denbury Resources Inc.5 | 2,166,280 | 6,672 |
| Denbury Resources Inc.1 | 1,077,880 | 3,320 |
| Chesapeake Energy Corp.1 | 140,000 | 889 |
| | | 14,385,744 |
| Financials 6.98% | | |
| American International Group, Inc. | 33,268,000 | 1,990,424 |
| Berkshire Hathaway Inc., Class A1 | 5,132 | 1,158,600 |
| Berkshire Hathaway Inc., Class B1 | 4,513,508 | 679,238 |
| Goldman Sachs Group, Inc. | 4,769,996 | 808,324 |
| JPMorgan Chase & Co. | 10,400,000 | 702,000 |
| HDFC Bank Ltd.4 | 18,293,408 | 425,853 |
| HDFC Bank Ltd. (ADR) | 1,612,000 | 115,500 |
| American Tower Corp. | 4,556,805 | 516,651 |
| Chubb Ltd. | 3,306,100 | 419,643 |
| CIT Group Inc. | 10,079,000 | 371,714 |
| CME Group Inc., Class A | 3,407,000 | 369,148 |
| AIA Group Ltd. | 52,400,000 | 331,319 |
| Legal & General Group PLC | 111,984,892 | 309,252 |
| Crown Castle International Corp. | 2,737,000 | 259,385 |
| Onex Corp. | 4,200,000 | 256,503 |
| Capital One Financial Corp. | 3,505,000 | 250,958 |
| Bank of America Corp. | 12,200,000 | 196,908 |
| First Republic Bank | 2,145,200 | 165,095 |
| Howard Hughes Corp.1 | 1,391,165 | 164,464 |
| Progressive Corp. | 4,925,000 | 160,358 |
| Equinix, Inc. | 308,139 | 113,595 |
| UBS Group AG | 6,765,666 | 97,817 |
| Bank of Ireland1 | 420,200,000 | 94,914 |
| Wells Fargo & Co. | 1,530,000 | 77,724 |
| Financial Engines, Inc. | 1,952,000 | 62,405 |
| Signature Bank1 | 456,970 | 55,755 |
| Weyerhaeuser Co.1 | 422,321 | 13,451 |
| | | 10,166,998 |
| Consumer staples 6.39% | | |
| Philip Morris International Inc. | 20,316,433 | 2,030,221 |
| Costco Wholesale Corp. | 10,333,183 | 1,674,906 |
| Kroger Co.2 | 48,872,341 | 1,563,426 |
| Coca-Cola Co. | 12,020,400 | 522,046 |
| Kraft Heinz Co. | 5,500,000 | 492,195 |
The Growth Fund of America — Page 4 of 8
Common stocks
Consumer staples (continued) | Shares | Value
(000) |
| Kerry Group PLC, Class A | 5,565,824 | $472,956 |
| Mead Johnson Nutrition Co. | 5,027,600 | 427,698 |
| Constellation Brands, Inc., Class A | 2,235,000 | 366,652 |
| Herbalife Ltd.1 | 4,638,000 | 281,759 |
| Walgreens Boots Alliance, Inc. | 2,950,000 | 238,095 |
| Nestlé SA | 2,387,600 | 190,076 |
| Pinnacle Foods Inc. | 3,225,000 | 163,346 |
| Glanbia PLC | 8,320,000 | 158,419 |
| Pernod Ricard SA | 1,325,000 | 152,083 |
| Avon Products, Inc. | 21,720,000 | 123,804 |
| Coca-Cola Enterprises, Inc. | 3,136,700 | 120,606 |
| Associated British Foods PLC | 2,905,000 | 116,005 |
| Reynolds American Inc. | 2,220,000 | 110,045 |
| Procter & Gamble Co. | 1,000,000 | 87,310 |
| Whole Foods Market, Inc. | 679,700 | 20,649 |
| | | 9,312,297 |
| Industrials 4.46% | | |
| Union Pacific Corp. | 12,088,739 | 1,154,837 |
| Boeing Co. | 3,515,000 | 455,017 |
| TransDigm Group Inc.1 | 1,574,500 | 449,032 |
| Ryanair Holdings PLC (ADR) | 5,399,758 | 392,076 |
| Rockwell Collins, Inc. | 4,645,000 | 388,740 |
| CSX Corp. | 13,523,700 | 382,450 |
| General Dynamics Corp. | 2,314,000 | 352,237 |
| Nielsen Holdings PLC | 6,499,800 | 346,309 |
| Lockheed Martin Corp. | 1,192,000 | 289,620 |
| Cummins Inc. | 2,135,000 | 268,177 |
| Old Dominion Freight Line, Inc.1 | 3,257,254 | 231,689 |
| Delta Air Lines, Inc. | 5,930,000 | 217,928 |
| Oshkosh Corp.2 | 3,685,600 | 198,764 |
| Roper Technologies, Inc. | 1,010,000 | 179,326 |
| MTU Aero Engines AG | 1,569,559 | 159,600 |
| Norfolk Southern Corp. | 1,457,691 | 136,877 |
| Caterpillar Inc. | 1,610,000 | 131,940 |
| Sensata Technologies Holding NV1 | 3,460,000 | 131,757 |
| IDEX Corp. | 1,400,000 | 130,816 |
| J.B. Hunt Transport Services, Inc. | 1,357,396 | 107,764 |
| United Continental Holdings, Inc.1 | 2,062,944 | 103,993 |
| Meggitt PLC | 14,486,455 | 89,084 |
| United Technologies Corp. | 775,000 | 82,483 |
| Northrop Grumman Corp. | 315,000 | 66,802 |
| Fortive Corp. | 854,724 | 45,018 |
| | | 6,492,336 |
| Materials 2.16% | | |
| E.I. du Pont de Nemours and Co. | 11,431,500 | 795,632 |
| Freeport-McMoRan Inc. | 36,533,000 | 375,925 |
| Praxair, Inc. | 2,715,000 | 331,339 |
| Syngenta AG | 703,000 | 306,131 |
| Vale SA, Class A, preferred nominative | 39,098,400 | 175,199 |
| Vale SA, Class A, preferred nominative (ADR) | 21,224,650 | 94,450 |
| First Quantum Minerals Ltd. | 34,450,000 | 261,120 |
| Celanese Corp., Series A | 3,300,000 | 212,619 |
| Albemarle Corp. | 2,337,301 | 186,914 |
The Growth Fund of America — Page 5 of 8
Common stocks
Materials (continued) | Shares | Value
(000) |
| Arkema SA | 1,983,510 | $177,067 |
| Rio Tinto PLC | 4,682,000 | 141,469 |
| Monsanto Co. | 827,182 | 88,095 |
| | | 3,145,960 |
| Telecommunication services 0.47% | | |
| T-Mobile US, Inc.1 | 8,230,205 | 381,388 |
| Zayo Group Holdings, Inc.1 | 10,008,512 | 290,347 |
| NII Holdings, Inc.1 | 2,464,163 | 8,205 |
| | | 679,940 |
| Miscellaneous 3.58% | | |
| Other common stocks in initial period of acquisition | | 5,219,235 |
| Total common stocks (cost: $81,484,321,000) | | 134,671,701 |
Rights & warrants 0.04%
Financials 0.04% | | |
| JP Morgan Chase & Co., warrants, expire 20181 | 2,350,000 | 60,254 |
| Citigroup Inc., Class A, warrants, expire 20191 | 25,500,000 | 1,785 |
| | | 62,039 |
| Telecommunication services 0.00% | | |
| Broadview Networks Holdings, Inc., Series A1, warrants, expire 20201,3,4 | 4,414 | — |
| Broadview Networks Holdings, Inc., Series A2, warrants, expire 20201,3,4 | 1,672 | — |
| | | — |
| Total rights & warrants (cost: $78,883,000) | | 62,039 |
Convertible stocks 0.10%
Consumer discretionary 0.10% | | |
| Uber Technologies, Inc., Series F, convertible preferred1,3,4 | 2,884,815 | 140,699 |
| Total convertible stocks (cost: $114,350,000) | | 140,699 |
Convertible bonds 0.01%
Miscellaneous 0.01% | Principal amount
(000) | |
| Other convertible bonds in initial period of acquisition | | 18,230 |
| Total convertible bonds (cost: $17,300,000) | | 18,230 |
Bonds, notes & other debt instruments 0.75%
U.S. Treasury bonds & notes 0.72%
U.S. Treasury 0.72% | | |
| U.S. Treasury 1.625% 2026 | $ 574,010 | 575,893 |
| U.S. Treasury 1.625% 20266 | 149,700 | 150,141 |
| U.S. Treasury 2.50% 2046 | 308,055 | 325,500 |
| Total U.S. Treasury bonds & notes | | 1,051,534 |
The Growth Fund of America — Page 6 of 8
Bonds, notes & other debt instruments
Corporate bonds & notes 0.03%
Energy 0.03% | Principal amount
(000) | Value
(000) |
| EP Energy Corp. 9.375% 2020 | $57,187 | $37,172 |
| EP Energy Corp. 6.375% 2023 | 10,755 | 5,942 |
| Total corporate bonds & notes | | 43,114 |
| Total bonds, notes & other debt instruments (cost: $1,045,964,000) | | 1,094,648 |
| Short-term securities 6.68% | | |
| Air Products and Chemicals, Inc. 0.53%–0.55% due 11/1/2016–11/3/20165 | 84,515 | 84,444 |
| Apple Inc. 0.44%–0.47% due 10/20/2016–10/24/20165 | 126,193 | 126,123 |
| CAFCO, LLC 0.60%–0.64% due 9/2/2016–9/14/20165 | 100,000 | 99,989 |
| Caterpillar Financial Services Corp. 0.48% due 9/14/2016 | 26,800 | 26,796 |
| Chevron Corp. 0.75%–0.82% due 1/5/2017–1/11/20175 | 90,000 | 89,800 |
| Ciesco LLC 0.88%–1.23% due 12/12/2016–2/23/20175 | 135,000 | 134,564 |
| Coca-Cola Co. 0.46%–0.63% due 10/11/2016–12/9/20165 | 157,100 | 156,951 |
| Emerson Electric Co. 0.42%–0.46% due 9/13/2016–10/17/20165 | 66,000 | 65,981 |
| Estée Lauder Companies Inc. 0.43% due 9/27/20165 | 31,200 | 31,191 |
| ExxonMobil Corp. 0.44%–0.48% due 10/3/2016–11/4/2016 | 145,000 | 144,905 |
| Fannie Mae 0.37%–0.43% due 9/12/2016–10/6/2016 | 525,000 | 524,908 |
| Federal Farm Credit Banks 0.48%–0.61% due 10/18/2016–7/12/2017 | 340,000 | 339,142 |
| Federal Home Loan Bank 0.30%–0.55% due 9/1/2016–5/25/2017 | 4,301,475 | 4,294,566 |
| Freddie Mac 0.37%–0.50% due 11/2/2016–2/1/2017 | 563,200 | 562,528 |
| General Electric 0.40%–0.48% due 9/16/2016–9/29/2016 | 100,000 | 99,977 |
| Honeywell International Inc. 0.55% due 11/9/20165 | 25,000 | 24,975 |
| IBM Corp. 0.45% due 9/26/20165 | 115,600 | 115,572 |
| Intel Corp. 0.48% due 10/25/2016 | 50,000 | 49,964 |
| JPMorgan Chase & Co. 1.03% due 3/13/2017 | 93,500 | 93,543 |
| Jupiter Securitization Co., LLC 0.55%–1.00% due 9/21/2016–1/27/20175 | 100,000 | 99,759 |
| Merck & Co. Inc. 0.39% due 9/19/20165 | 75,000 | 74,987 |
| Microsoft Corp. 0.44%–0.50% due 10/5/2016–11/15/20165 | 225,000 | 224,844 |
| Paccar Financial Corp. 0.40% due 9/16/2016 | 27,200 | 27,195 |
| PepsiCo Inc. 0.38%–0.42% due 9/19/2016–9/22/20165 | 100,000 | 99,980 |
| Pfizer Inc. 0.47%–0.64% due 9/19/2016–12/9/20165 | 108,000 | 107,946 |
| Private Export Funding Corp. 0.64%–0.70% due 11/15/2016–12/2/20165 | 150,000 | 149,802 |
| Qualcomm Inc. 0.48%–0.52% due 10/5/2016–11/17/20165 | 168,500 | 168,376 |
| U.S. Treasury Bills 0.32%–0.50% due 9/1/2016–2/23/2017 | 1,383,900 | 1,382,404 |
| United Parcel Service Inc. 0.60% due 12/1/20165 | 34,300 | 34,261 |
| USAA Capital Corp. 0.37% due 9/15/2016 | 40,000 | 39,994 |
| Wal-Mart Stores, Inc. 0.38%–0.43% due 9/26/2016–10/25/20165 | 98,800 | 98,763 |
| Wells Fargo Bank, N.A. 0.86%–1.02% due 11/15/2016–1/18/2017 | 150,000 | 150,029 |
| Total short-term securities (cost: $9,723,298,000) | | 9,724,259 |
| Total investment securities 100.07% (cost: $92,464,116,000) | | 145,711,576 |
| Other assets less liabilities (0.07)% | | (96,784) |
| Net assets 100.00% | | $145,614,792 |
As permitted by U.S. Securities and Exchange Commission regulations, “Miscellaneous” securities include holdings in their first year of acquisition that have not previously been publicly disclosed.
The Growth Fund of America — Page 7 of 8
Forward currency contracts
The fund has entered into forward currency contracts as shown in the following table. The average month-end notional amount of open forward currency contracts while held was $205,426,000.
| | Settlement
date | Counterparty | Contract amount | Unrealized
(depreciation)
appreciation
at 8/31/2016
(000) |
Receive
(000) | Deliver
(000) |
| Sales: | | | | | |
| British pounds | 9/20/2016 | Barclays Bank PLC | $8,146 | £6,247 | $(61) |
| British pounds | 9/20/2016 | HSBC Bank | $8,144 | £6,258 | (78) |
| British pounds | 9/21/2016 | UBS AG | $8,127 | £6,248 | (81) |
| British pounds | 9/28/2016 | JPMorgan Chase | $8,134 | £6,247 | (75) |
| Euros | 9/14/2016 | JPMorgan Chase | $102,524 | €91,150 | 791 |
| Euros | 10/6/2016 | Barclays Bank PLC | $70,142 | €62,800 | (21) |
| | | | | | $475 |
The following footnotes apply to either the individual securities noted or one or more of the securities aggregated and listed as a single line item.
| 1 | Security did not produce income during the last 12 months. |
| 2 | Represents an affiliated company as defined under the Investment Company Act of 1940. |
| 3 | Acquired through a private placement transaction exempt from registration under the Securities Act of 1933. May be subject to legal or contractual restrictions on resale. Further details on these holdings appear below. |
| 4 | Valued under fair value procedures adopted by authority of the board of trustees. The total value of all such securities was $862,930,000, which represented .59% of the net assets of the fund. |
| 5 | Acquired in a transaction exempt from registration under Rule 144A or Section 4(2) of the Securities Act of 1933. May be resold in the U.S. in transactions exempt from registration, normally to qualified institutional buyers. The total value of all such securities was $2,144,712,000, which represented 1.47% of the net assets of the fund. |
| 6 | A portion of this security was pledged as collateral. The total value of pledged collateral was $1,319,000, which represented less than .01% of the net assets of the fund. |
| Private placement securities | Acquisition
date(s) | Cost
(000) | Value
(000) | Percent
of net
assets |
| Uber Technologies, Inc., Series F, convertible preferred | 5/22/2015 | $114,350 | $140,699 | .10% |
| Cloudera, Inc. | 6/29/2015-8/27/2015 | 174,989 | 120,477 | .08 |
| Acerta Pharma BV | 5/7/2015 | 15,750 | 26,169 | .02 |
| Broadview Networks Holdings, Inc., Series A1, warrants, expire 2020 | 7/7/2000-3/6/2002 | 11,176 | — | .00 |
| Broadview Networks Holdings, Inc., Series A2, warrants, expire 2020 | 7/7/2000-3/6/2002 | 3,626 | — | .00 |
| | | $319,891 | $287,345 | .20% |
| Key to abbreviations and symbols |
| ADR = American Depositary Receipts |
| £ = British pounds |
| CAD = Canadian dollars |
| € = Euros |
Investments are not FDIC-insured, nor are they deposits of or guaranteed by a bank or any other entity, so they may lose value.
Investors should carefully consider investment objectives, risks, charges and expenses. This and other important information is contained in the fund prospectus and summary prospectus, which can be obtained from your financial professional and should be read carefully before investing. You may also call American Funds Service Company (AFS) at (800) 421-4225 or visit the American Funds website at americanfunds.com.
| MFGEFPX-005-1016O-S54082 | The Growth Fund of America — Page 8 of 8 |
REPORT OF INDEPENDENT REGISTERED PUBLIC ACCOUNTING FIRM
To the Shareholders and Board of Trustees of
The Growth Fund of America:
We have audited the accompanying statement of assets and liabilities of The Growth Fund of America (the “Fund”), including the summary schedule of investments, as of August 31, 2016, and the related statements of operations for the year then ended, the statements of changes in net assets for each of the two years in the period then ended (collectively, the “financial statements”), the financial highlights for each of the five years in the period then ended (the financial statements and financial highlights are included in Item 1 of this Form N-CSR), and the schedule of investments in securities as of August 31, 2016 (included in Item 6 of this Form N-CSR). These financial statements, financial highlights, and schedule of investments in securities are the responsibility of the Fund’s management. Our responsibility is to express an opinion on these financial statements, financial highlights, and schedule of investments in securities based on our audits.
We conducted our audits in accordance with the standards of the Public Company Accounting Oversight Board (United States). Those standards require that we plan and perform the audit to obtain reasonable assurance about whether the financial statements, financial highlights, and schedule of investments in securities are free of material misstatement. An audit includes examining, on a test basis, evidence supporting the amounts and disclosures in the financial statements and schedule of investments in securities, assessing the accounting principles used and significant estimates made by management, as well as evaluating the overall financial statement presentation. Our procedures included confirmation of securities owned as of August 31, 2016, by correspondence with the custodian and brokers; where replies were not received from brokers, we performed other auditing procedures. We believe that our audits provide a reasonable basis for our opinion.
In our opinion, the financial statements, financial highlights, and schedule of investments in securities referred to above present fairly, in all material respects, the financial position of The Growth Fund of America as of August 31, 2016, and the results of its operations for the year then ended, the changes in its net assets for each of the two years in the period then ended, and the financial highlights for each of the five years in the period then ended, in conformity with accounting principles generally accepted in the United States of America.
DELOITTE & TOUCHE LLP
Costa Mesa, California
October 10, 2016
ITEM 7 – Disclosure of Proxy Voting Policies and Procedures for Closed-End Management Investment Companies
Not applicable to this Registrant, insofar as the Registrant is not a closed-end management investment company.
ITEM 8 – Portfolio Managers of Closed-End Management Investment Companies
Not applicable to this Registrant, insofar as the Registrant is not a closed-end management investment company.
ITEM 9 – Purchases of Equity Securities by Closed-End Management Investment Company and Affiliated Purchasers
Not applicable to this Registrant, insofar as the Registrant is not a closed-end management investment company.
ITEM 10 – Submission of Matters to a Vote of Security Holders
There have been no material changes to the procedures by which shareholders may recommend nominees to the Registrant’s board of trustees since the Registrant last submitted a proxy statement to its shareholders. The procedures are as follows. The Registrant has a nominating and governance committee comprised solely of persons who are not considered ‘‘interested persons’’ of the Registrant within the meaning of the Investment Company Act of 1940, as amended. The committee periodically reviews such issues as the board’s composition, responsibilities, committees, compensation and other relevant issues, and recommends any appropriate changes to the full board of trustees. While the committee normally is able to identify from its own resources an ample number of qualified candidates, it will consider shareholder suggestions of persons to be considered as nominees to fill future vacancies on the board. Such suggestions must be sent in writing to the nominating and governance committee of the Registrant, c/o the Registrant’s Secretary, and must be accompanied by complete biographical and occupational data on the prospective nominee, along with a written consent of the prospective nominee for consideration of his or her name by the nominating and governance committee.
ITEM 11 – Controls and Procedures
| (a) | The Registrant’s Principal Executive Officer and Principal Financial Officer have concluded, based on their evaluation of the Registrant’s disclosure controls and procedures (as such term is defined in Rule 30a-3 under the Investment Company Act of 1940), that such controls and procedures are adequate and reasonably designed to achieve the purposes described in paragraph (c) of such rule. |
| | |
| (b) | There were no changes in the Registrant’s internal controls over financial reporting (as defined in Rule 30a-3(d) under the Investment Company Act of 1940) that occurred during the Registrant’s second fiscal quarter of the period covered by this report that has materially affected, or is reasonably likely to materially affect, the Registrant’s internal control over financial reporting. |
ITEM 12 – Exhibits
| (a)(1) | The Code of Ethics that is the subject of the disclosure required by Item 2 is attached as an exhibit hereto. |
| | |
| (a)(2) | The certifications required by Rule 30a-2 of the Investment Company Act of 1940 and Sections 302 and 906 of the Sarbanes-Oxley Act of 2002 are attached as exhibits hereto. |
SIGNATURES
Pursuant to the requirements of the Securities Exchange Act of 1934 and the Investment Company Act of 1940, the Registrant has duly caused this report to be signed on its behalf by the undersigned, thereunto duly authorized.
| | THE GROWTH FUND OF AMERICA |
| | |
| | By /s/ Paul F. Roye |
| | Paul F. Roye, Executive Vice President and Principal Executive Officer |
| | |
| | Date: October 31, 2016 |
Pursuant to the requirements of the Securities Exchange Act of 1934 and the Investment Company Act of 1940, this report has been signed below by the following persons on behalf of the Registrant and in the capacities and on the dates indicated.
| By /s/ Paul F. Roye |
Paul F. Roye, Executive Vice President and Principal Executive Officer |
| |
| Date: October 31, 2016 |
| By /s/ Kimberley H. Monasterio |
Kimberley H. Monasterio, Treasurer and Principal Financial Officer |
| |
| Date: October 31, 2016 |